appendix b pumping tests - denrdenr.sd.gov/powertech/gw/appendix_b_pumping_tests.pdftable of...
TRANSCRIPT

APPENDIX B
PUMPING TESTS
Powertech (USA) Inc. Dewey-Burdock Project
2008 Pumping Tests: Results and Analysis
November 2008
Prepared for Powertech (USA) Inc.
5575 DTC Parkway, Suite 140 Greenwood Village, CO 80111
Telephone: (303) 790-7528 Telefax: (303) 790-3885
Prepared by Knight Piésold and Co.
1580 Lincoln Street, Suite 1000 Denver, Colorado 80203
Telephone: (303) 629-8788 Telefax: (303) 629-8789
Project DV102.00279.01
Rev. No. Date Description Knight Piésold Client
0 November 2008 Final to Client Paul Bergstrom Powertech (USA)
Powertech (USA) Inc. Dewey-Burdock Project
2008 Pumping Tests: Results and Analysis
Table of Contents
List of Tables ................................................................................................................................. iv
List of Figures ................................................................................................................................. v
List of Drawings ........................................................................................................................... vii
List of Appendices ....................................................................................................................... viii
1. Introduction.............................................................................................................................. 1-1
1.1. Objectives ................................................................................................................. 1-1
1.2. Report Organization.................................................................................................. 1-2
1.3. Limitations and Disclaimer....................................................................................... 1-3
2. Site Characterization................................................................................................................ 2-1
2.1. Stratigraphy............................................................................................................... 2-1
2.1.1 Overlying Unit: Skull Creek Formation Shales .......................................... 2-1
2.1.2 Inyan Kara Group: Fall River Formation and Lakota Formation Sandstones.............................................................................. 2-2
2.1.3 Underlying Units: Morrison Formation Shale and Unkpapa/Sundance Formation Sandstone ............................................... 2-3
2.2. Hydrogeologic Conditions: Potentiometric Surface and Hydraulic Gradient................................................................................................................ 2-3
2.3. Summary of Previous Aquifer Testing Results ........................................................ 2-5
2.3.1 Dewey Project Area .................................................................................... 2-5
2.3.2 Burdock Project Area.................................................................................. 2-6
3. 2008 Pumping Tests: Design and Procedures.......................................................................... 3-1
3.1. Well Installation, Completion and Mechanical Integrity Testing............................. 3-1
3.2. Pumping Test Equipment and Facilities ................................................................... 3-1
3.3. Background Monitoring and Water Level Corrections ............................................ 3-2
3.4. Test Procedures, Data Collection, Data Processing.................................................. 3-4
4. Dewey Project Area Pumping test ........................................................................................... 4-1
DV102.00279.01 i November 2008 Dewey-Burdock 2008 Pump Test Report Rev 0.doc
Table of Contents (Continued)
DV102.00279.01 ii November 2008 Dewey-Burdock 2008 Pump Test Report Rev 0.doc
4.1. Test Layout and Initial Potentiometric Surface Measurements................................ 4-1
4.2. Pumping Rate and Duration...................................................................................... 4-2
4.3. Responses at Pumping and Observation Wells......................................................... 4-2
4.4. Determination of Aquifer Parameters....................................................................... 4-3
4.4.1 Theis Drawdown and Recovery Analysis................................................... 4-3
4.4.2 Theis-Cooper-Jacob Straight-line Analysis ................................................ 4-4
4.4.3 Distance-Drawdown Analysis .................................................................... 4-5
4.4.4 Summary of Dewey Test – Lower Fall River Formation Aquifer Parameters .................................................................................. 4-5
4.5. Underlying Lakota Aquifer Test Results .................................................................. 4-6
4.6. Underlying Unkpapa Aquifer Test Results............................................................... 4-6
5. Burdock Project Area Pumping test......................................................................................... 5-1
5.1. Test Layout and Initial Potentiometric Surface Measurements................................ 5-1
5.2. Pumping Rate and Duration...................................................................................... 5-2
5.3. Responses at Pumping and Observation Wells......................................................... 5-2
5.4. Determination of Aquifer Parameters....................................................................... 5-3
5.4.1 Theis Drawdown Analysis.......................................................................... 5-3
5.4.2 Hantush-Jacob Drawdown Analysis ........................................................... 5-4
5.4.3 Theis-Cooper-Jacob Straight-line Analysis ................................................ 5-5
5.4.4 Distance-Drawdown Analysis .................................................................... 5-5
5.4.5 Summary of Burdock Test – Lower Lakota (Chilson) Formation Aquifer Parameters................................................................. 5-6
5.5. Overlying Fall River Aquifer Test Results ............................................................... 5-7
5.6. Underlying Unkpapa Aquifer Test Results............................................................... 5-8
6. Laboratory Core Data .............................................................................................................. 6-1
6.1. Background............................................................................................................... 6-1
6.2. Conversion from Intrinsic Permeability to Hydraulic Conductivity......................... 6-1
6.3. Interpretations of the Laboratory Core Data............................................................. 6-2
6.4. Conclusions............................................................................................................... 6-3
7. Summary and Conclusions ...................................................................................................... 7-1

Table of Contents (Continued)
DV102.00279.01 iii November 2008 Dewey-Burdock 2008 Pump Test Report Rev 0.doc
7.1. Burdock Project Area................................................................................................ 7-1
7.1.1 Summary ..................................................................................................... 7-1
7.1.2 Conclusions................................................................................................. 7-2
7.2. Dewey Project Area .................................................................................................. 7-4
7.2.1 Summary ..................................................................................................... 7-4
7.2.2 Conclusions................................................................................................. 7-4
8. Certification ............................................................................................................................. 8-1
9. References................................................................................................................................ 9-1

List of Tables
Table Title
4.1 Dewey Pump Test Completion Information 4.2 Dewey Pump Test Drawdown and Response Summary 4.3 Summary of Aquifer Hydraulic Characteristics for the Dewey Pumping Test 5.1 Burdock Pump Test Completion Information 5.2 Burdock Pump Test, Drawdown and Response Summary 5.3 Summary of Aquifer Hydraulic Characteristics for the Burdock Pumping Test 6.1 Laboratory Core Analyses for Powertech USA, Inc. at Dewey-Burdock Site
DV102.00279.01 iv November 2008 Dewey-Burdock 2008 Pump Test Report Rev 0.doc
List of Figures
Figure Title
1.1 1979-1982 and 2008 Pumping Test Locations 2.1 Site Stratigraphy 2.2 Site Surface Geology 2.3 Potentiometric Surface, Fall River Aquifer, 2008 2.4 Potentiometric Surface, Lakota Aquifer, 2008 2.5 Potentiometric Surface, Unkpapa Aquifer, 2008 3.1 Background Monitoring (April 8 to May 26, 2008) 3.2 Flowmeter Readings (May 9 to May 24, 2008) 4.1 Dewey May 2008 Pumping Test Well Locations 4.2 Transducer Response at Dewey Test Pumping Well 32-3C, Observation Wells
32-5 and 32-4C 4.3 Transducer Response at Dewey Test Observation Wells GW-49, 29-7, and 32-9C 4.4 Non-responding Dewey Test Observation Wells 32-10 (Lakota) and 32-11
(Unkpapa) compared to Pumping Well
4.5 Drawdown and Analysis at Dewey Test Observation Well 32-5 4.6 Theis Recovery Analysis at Dewey Observation Well 32-5
4.7 Straight-line Analyses of Drawdown and Recovery at Dewey Pumping Well
32-3C
4.8 Distance Drawdown Analysis, Dewey Pumping Test 5.1 Burdock May 2008 Pumping Test Well Locations 5.2 Transducer Response at Burdock Test Pumping Well 11-11C, Observation Wells
11-15 and 11-14C 5.3 Transducer Response at Burdock Test Observation Wells 11-2, 11-19 and 11-17
DV102.00279.01 v November 2008 Dewey-Burdock 2008 Pump Test Report Rev 0.doc
List of Figures (Continued)
Figure Title
DV102.00279.01 vi November 2008 Dewey-Burdock 2008 Pump Test Report Rev 0.doc
5.4 Non-responding Burdock Test Observation Well 11-18 (Unkpapa) compared to
Pumping Well and Observation Well 11-17 (Fall River) 5.5 Drawdown and Analysis at Burdock Test Observation Well 11-14C 5.6 Hantush-Jacob Leaky Confined Aquifer Analysis at Burdock Observation Well
11-14C 5.7 Straight-line Analyses of Drawdown and Recovery at Burdock Pumping Well 11-
11C 5.8 Distance-Drawdown Analysis, Burdock Pumping Test

List of Drawings
Drawing Title
4.1 Stratigraphic Cross-Section C-C’, Dewey Pump Test
4.2 Stratigraphic Cross-Section D-D’, Dewey Pump Test 5.1 Stratigraphic Cross-Section C-C’, Burdock Pump Test 5.2 Stratigraphic Cross-Section D-D’, Burdock Pump Test 5.3 Stratigraphic Cross-Section E-E’, Burdock Pump Test
DV102.00279.01 vii November 2008 Dewey-Burdock 2008 Pump Test Report Rev 0.doc

List of Appendices
Appendix Title
A Additional Information and Analysis Procedures A-1 Background Monitoring and Barometric Efficiency Calculations
Figure A.1-1 Background Water Level and Site Barometer Readings, Dewey/Fall River Barometric Efficiency Calculations
Figure A.1-2 Background Water Level and Site Barometer Readings,
Burdock/Lakota Barometric Efficiency Calculations
Figure A.1-3 Time-series from USGS Spreadsheet Method (Halford, 2006) for Dewey, Observation Well 32-4C Background Measurements and Site Barometer Readings
Figure A.1-4 Plotted Time-series Output for Dewey Observation Well 32-4C Background Measurements and Site Barometer Readings
A-2 Overview of Aquifer Test Analysis Procedures and Tools Used B Dewey Test Supplemental Information B-1 Well Completion Diagrams B-2 Time and Water Level Data Values Used in Pumping Test Analysis:
Dewey Test, Drawdown Data B-3 Time and Water Level Data Values Used in Pumping Test Analysis:
Dewey Test, Recovery Data B-4 Additional Aquifer Parameter Determinations
Figure B.4-1 Theis Drawdown Analysis at Dewey Pumping Well 32-3C Figure B.4-2 Theis Drawdown Analysis at Dewey Observation Well 32-5 Figure B.4-3 Theis Drawdown Analysis at Dewey Observation Well 32-4C Figure B.4-4 Theis Drawdown Analysis at Dewey Stock Well GW-49 Figure B.4-5 Theis Drawdown Analysis at Dewey Observation Well 29-7 Figure B.4-6 Theis Drawdown Analysis at Dewey Upper Fall River Observation Well 32-9C
DV102.00279.01 viii November 2008 Dewey-Burdock 2008 Pump Test Report Rev 0.doc
List of Appendices (Continued)
Appendix Title
DV102.00279.01 ix November 2008 Dewey-Burdock 2008 Pump Test Report Rev 0.doc
Figure B.4-7 Theis-Cooper-Jacob Recovery Analyses, Dewey Observation Wells 32-4C and GW-49 Figure B.4-8 Theis-Cooper-Jacob Recovery Analyses, Dewey Observation Wells 32-5 and 32-9C
C Burdock Test Supplemental Information
C-1 Well Completion Diagrams C-2 Time and Water Level Data Values Used in Pumping Test Analysis:
Burdock Test, Drawdown Data C-3 Time and Water Level Data Values Used in Pumping Test Analysis:
Burdock Test, Recovery Data C-4 Additional Aquifer Parameter Determinations Figure C.4-1 Theis Drawdown Analysis at Burdock Pumping Well
11-11C Figure C.4-2 Theis Drawdown Analysis at Burdock Observation Well
11-15 Figure C.4-3 Theis Drawdown Analysis at Burdock Observation Well
11-14C Figure C.4-4 Theis Recovery Analysis at Burdock Observation Well
11-14C Figure C.4-5 Theis Drawdown Analysis at Burdock Observation Well
11-2 Figure C.4-6 Hantush-Jacob Leaky Confined Aquifer Analysis at Burdock
Observation Well 11-2
Figure C.4-7 Drawdown and Analysis at Burdock Test Observation Well 11-19 (Upper Lakota)
Figure C.4-8 Theis-Cooper-Jacob Recovery Analyses at Burdock Observation Wells 11-15 and 11-19
Figure C.4-9 Theis-Cooper-Jacob Recovery at Burdock Observation Wells 11-14C and 11-02

List of Appendices (Continued)
Appendix Title
DV102.00279.01 x November 2008 Dewey-Burdock 2008 Pump Test Report Rev 0.doc
D Laboratory Core Data E CD-ROM: Raw Pressure Transducer Data in WinSituTM Format
Powertech (USA) Inc. Dewey-Burdock Project
2008 Pumping Tests: Results and Analysis
1.0 Introduction Powertech Uranium Corp. (Powertech) is submitting an application to the United States Nuclear Regulatory Commission (USNRC) for the Radioactive Source Materials License to develop and operate the Dewey-Burdock Uranium Project using in-situ recovery (ISR) methods. The project is located near Edgemont, South Dakota in Custer and Fall River Counties and will consist of injection and production well fields and a central processing plant (ion exchange resin columns and yellowcake dryer) to recover the final uranium product.
Figure 1.1 shows the project location and license boundary. The Project is located approximately 12 miles north-northwest of Edgemont, South Dakota and spans northern Fall River and southern Custer Counties. The project boundary encompasses approximately 11,000 acres of private land on either side of County Road 6463. The Dewey-Burdock project will operate uranium ISR production facilities at both the Dewey and Burdock project areas, with a central processing plant located at the Burdock site. It is anticipated that the ISR well fields at each site will operate at an estimated flow rates of between 1500 gallons per minute (gpm) to 2000 gpm. Net withdrawal of groundwater during ISR leaching operations is expected to be 0.5 to 3 percent of total flow, or 10 to 60 gpm at each site. Total production from both sites is expected to produce approximately 1,000,000 pounds of U3O8 per year.
1.1 Objectives USNRC NUREG 1569 Sections 2.7.2 and 2.7.3, Hydrology, Review Procedures (3) and Acceptance Criteria (3), describe the type of information and analyses that can fulfill the requirements for a description of Site hydrogeology. Consistent with the examples provided in the NUREG sections referenced above, the objective of this report is to provide the determinations of aquifer properties obtained with two pumping tests together with the results of laboratory tests Powertech conducted on related core samples. The pumping tests are interpreted in the context of geological and hydrogeological data that are summarized here and presented authoritatively in greater detail in NRC Technical Report Sections 2.6 and 2.7. The more detailed information presented outside this report consists of: (1) geologic cross-sections, including the underlying electric log data from test pumping wells, test observation wells and
DV102.00279.01 1-1 November 2008 Dewey-Burdock 2008 Pump Test Report Rev 0.doc
nearby exploration boreholes; (2) isopach maps of the production zone, overlying confining units and aquifers and underlying confining units and aquifers; and (3) potentiometric surface maps of the major aquifers.
Other information prescribed in NUREG 1569 Section 2.7.1, Hydrology, Areas of Review (3), notably soil survey and baseline groundwater quality information, is presented in separate reports. It is noted that the pumping tests described here are not intended to replace well field-scale pumping tests that are proposed to be conducted prior to startup of each particular mine unit. The following information is included in this report:
• Site location maps
• A summary of previous pumping test results
• A synopsis of geologic and hydrogeologic information for the Project Area relevant to the interpretation of pumping tests, including detailed conceptual stratigraphic cross-sections illustrating the test layouts relative to ore-body features
• Presentation of the pumping test results, including raw test data (drawdown graphs) that provide overall response characteristics for all wells monitored during the tests
• Interpretation of aquifer parameters using type curve matches and other methods of parameter determinations
• Interpretation, based on the communication of pumping and observation wells that it is likely feasible to conduct ISR mining within limited portions of the major aquifers
• Interpretation, based on the pumping test data and laboratory core data, that there is likely additional vertical containment between major aquitards overlying and underlying the major aquifers
1.2 Report Organization This report includes seven sections. Section 1 (this section) is the introduction. Section 2 describes site-specific geologic and hydrogeologic conditions followed by a summary of previous aquifer tests in the period 1979 to 1982. Section 3 describes the general procedures for well installation, test equipment used, background measurements, and data processing procedures for the pumping tests. Details of the background monitoring and analysis are provided in Appendix A-1, and Appendix A-2 provides an overview of pumping test interpretation methods, theoretical considerations, and spreadsheet tools used for test analysis. Section 4 describes the results and analysis of the pumping test at the Dewey test location; Appendix B provides backup data for the Dewey Pumping Test including well completion
DV102.00279.01 1-2 November 2008 Dewey-Burdock 2008 Pump Test Report Rev 0.doc
DV102.00279.01 1-3 November 2008 Dewey-Burdock 2008 Pump Test Report Rev 0.doc
diagrams, processed time-drawdown data used to perform the test analysis, and the determinations of aquifer parameters with graphical methods not directly presented in the text. Similarly, Section 5 describes the results and analysis at the Burdock test location and Appendix C provides the related data for the Burdock test. Section 6 is a summary of laboratory core testing information and Appendix D provides the laboratory data report for the core testing. Section 7 is a summary describing major conclusions from the testing. Appendix E is a CD-ROM that contains the raw digital pressure transducer data in binary files.
1.3 Limitations and Disclaimer This report entitled “Powertech (USA) Inc., Dewey-Burdock Project, 2008 Pumping Tests: Results and Analysis” has been prepared by Knight Piésold and Co. for the exclusive use of Powertech (USA) Inc. No other party is an intended beneficiary of this report or the information, opinions, and conclusions contained herein. Any use by any party other than Powertech (USA) Inc. of any of the information, opinions, or conclusions is the sole responsibility of said party. The use of this report shall be at the sole risk of the user regardless of any fault or negligence of Powertech (USA) Inc. or Knight Piésold and Co.
The information and analyses contained herein have been completed to a level of detail commensurate with the objectives of the assignment. This report and its supporting documentation have been reviewed and/or checked for conformance with industry-accepted norms and applicable government regulations. Calculations and computer simulations have been checked and verified for reasonableness, and the content of the report has been reviewed for completeness, accuracy, and appropriateness of conclusions. To the best of the information and belief of Knight Piésold and Co. the information presented in this report is accurate to within the limitations specified herein.
Any reproductions of this report are uncontrolled and may not be the most recent revision.
2.0 Site Characterization This section presents a synopsis of geologic and hydrogeologic information. Section 2.1 presents geologic information (see Figure 2.2) taken from Section 2.6 of the USNRC Technical Report. Section 2.2 presents hydrogeologic information presented in Section 2.7 of the Technical Report. Section 2.3 describes the history of previous aquifer testing in relation to uranium exploration and development.
2.1 Stratigraphy The sedimentary rocks of interest that underlie the Dewey-Burdock Project range in age from Upper Jurassic to Early Cretaceous. These are the Upper Jurassic Sundance Formation, the Unkpapa Formation, and the Morrison Formation. The Early Cretaceous Lakota Formation, the Fall River Formation, the Skull Creek Shale Formation and the Mowry Shale Formation. Figure 2.1.
Underlying these, are rocks that range in age from Cambrian to Pennsylvanian in age. The sediments exposed at the Dewey-Burdock Project are of Early Cretaceous age.
2.1.1 Overlying Unit: Skull Creek Formation Shales The combined Skull Creek Shale – Mowry Shale reaches a thickness of 400 ft (ft) in the western part of the Dewey-Burdock project.
Mowry Shale
The Mowry Shale consists of light gray marine shale with minor amounts of siltstone, fine grained sandstone, and a few thin beds of bentonite.
Newcastle Sandstone Formation
The Newcastle Sandstone, normally occurring between the Skull Creek Shale and the Mowry Shale, is composed of fine-grained sandstone interbedded with siltstones. This formation is discontinuous across the region and is absent across the project area. At the Dewey-Burdock Project the Skull Creek Shale is directly overlain by the Mowry shale.
Skull Creek Shale Formation
The Skull Creek Shale is a sequence of dark-gray to black marine shales. The Skull Creek shale consists of black shale, organic material, and some silt sized quartz grains. The Skull Creek
DV102.00279.01 2-1 November 2008 Dewey-Burdock 2008 Pump Test Report Rev 0.doc

Shale has a thickness of approximately 200 ft. The Skull Creek Shale is eroded from the eastern parts of the project.
2.1.2 Inyan Kara Group: Fall River Formation and Lakota Formation Sandstones Inyan Kara Group
The Early Cretaceous Inyan Kara Group consists of two formations, the Lakota and the Fall River. The Inyan Kara is composed of interbedded sandstone siltstone and shale. The depositional environment of the Inyan Kara is fluvial to marginal marine.
Fall River Formation
The Fall River formation is composed of carbonaceous interbedded siltstone and sandstone, channel sandstones, and a sequence of interbedded sandstone and shale. The lower part of the Fall River consists of dark carbonaceous siltstone interbedded with thin laminations of fine-grained sandstone. Channels were cut into this interbedded sequence by northwest flowing rivers and fluvial sandstones were deposited. These channel sandstones occur across various parts of the Dewey-Burdock Project and generally contain the uranium deposits. Overlying the channel sandstones is another sequence of alternating sandstone and shales.
Lakota Formation
The Lakota Formation consists of three members, from lower to upper is the Chilson Member, the Minnewasta Limestone Member and the Fuson Member.
The Minnewasta Limestone Member is not present in the Dewey-Burdock Project area.
The Chilson Member is composed largely of fluvial deposits. These deposits consist of sandstone, shale, siltstone, and shale. The unit consists of a complex of channel sandstone deposits and their fine-grained equivalents. The unit contains uranium deposits.
The Fuson Member is the upper most member of the Lakota Formation and the shale-siltstone portion of the Fuson has been used to divide the Lakota Formation from the Fall River Formation.
The Fuson is described as having a lower discontinuous sandstone unit at its’ base and an upper discontinuous sandstone at the top of the member. If present the lower sandstone unit was
DV102.00279.01 2-2 November 2008 Dewey-Burdock 2008 Pump Test Report Rev 0.doc
mapped as a Lakota sandstone. Similarly if the upper sandstone was present it was mapped as a Fall River sandstone. The Lakota was deposited by a northwest flowing river system.
2.1.3 Underlying Units: Morrison Formation Shale and Unkpapa/Sundance Formation Sandstone Morrison Formation
The Upper Jurassic Morrison Formation was deposited as flood plain deposits. It is composed of waxy, unctuous, calcareous, noncarbonaceous massive shale with numerous limestone lenses and a few thin fine grained sandstones.
Unkpapa Formation
Overlying the Sundance Formation is a sandstone unit that has been called the Unkpapa formation. The Unkpapa is a massive fine grained sandstone that was deposited as sand dunes.
Sundance Formation
The Sundance Formation of Upper Jurassic age consists of marine rocks composed of red shales and sandstones. The Sundance has been subdivided into five members. In ascending order they are the Canyon Springs sandstone member, the Stockade Beaver shale member, the Hulett sandstone member, the Lak member, and the Redwater shale member.
2.2 Hydrogeologic Conditions: Potentiometric Surface and Hydraulic Gradient Groundwaters within the Inyan Kara formations are under artesian conditions in much of the Dewey-Burdock area. Some wells are known to have flowed for years. Figure 2.3 is a potentiometric surface map of the Fall River Formation aquifer within the Inyan Kara group. The map is based on measurements made in 2008. Based on Figure 2.3, groundwater flow direction in the Fall River aquifer is generally to the southwest, consistent with the topography of the broad Black Hills domal uplift, with significant components either more southerly or more westerly as reflected by the curvature of the potentiometric surface equipotential lines.
Groundwater gradient in the Fall River aquifer varies significantly throughout the project area. Near the outcrop areas upgradient of both the Dewey and Burdock project portions of the Site, the gradient is about 20 to 25 ft per mile (0.0038 to 0.0047 feet per foot [ft/ft]). At the Burdock portion of the Site, the Fall River aquifer gradient flattens to about 14 ft per mile (0.0026 ft/ft) extending downgradient to the southwestern project boundary. At the Dewey portion of the Site,
DV102.00279.01 2-3 November 2008 Dewey-Burdock 2008 Pump Test Report Rev 0.doc
however, the groundwater gradient in the Fall River aquifer increases sharply to as much as about 52 ft per mile [0.01 ft/ft] within the central portion of the project area.
Figure 2.4 is a potentiometric surface map of the Lakota Formation aquifer below the Fall River aquifer within the Inyan Kara Group, based on measurements made in 2008. Groundwater flow direction is generally to the southwest with locally more southerly component. At the Burdock portion of the site, the groundwater gradient is relatively uniform from the outcrop area to the project boundary, about 18 ft per mile (about 0.0034 ft/ft). At the Dewey portion of the site Figure 2.4 indicates a somewhat flatter overall gradient, about 16 ft per mile (0.003 ft/ft). However, within the central portion of the Dewey project area there a broad area where the potentiometric surface elevations in the Lakota are between 3,680 and 3,690 ft above mean sea level (amsl).
The variations in the potentiometric surfaces in both Inyan Kara formations produce variations in the direction of vertical gradients throughout the project area. At the Burdock portion of the Site, the potentiometric surface in the Fall River aquifer is generally close to that in underlying Lakota (Chilson) aquifer; where there are differences, the Fall River appears to be slightly higher in elevation by a few (less than five) feet. This indicates minimal overall vertical gradients with possible downward flow direction between the two formations through the intervening Fuson Member of the Lakota Formation.
By contrast, at the Dewey portion of the Site there are areas where the potentiometric surface in the Lakota Formation is 20 to 30 ft higher than in the overlying Fall River Formation, indicating a vertically upward gradient. This is consistent with the character of the intervening Fuson Member in previous pumping tests, described in Section 2.6 below, where the Fuson was described as leaky in the Burdock area but a more effective aquitard in the Dewey area. This was also noted in earlier investigations (Keene, 1973, p. 26), which stated that “pressures in the Lakota Formation appear greater than those of the Fall River aquifer in the northwestern townships of the [Fall River] county. This is reasonable when one considers the higher intake elevation of the Lakota Formation, the greater thickness of the Chilson Member than the Fall River sands, and the smaller production from the Lakota aquifer.”
Figure 2.5 is a potentiometric surface map of the Unkpapa aquifer below the Inyan Kara group, based on measurements made in 2008 at four locations. The potentiometric surface in the Unkpapa Formation indicates groundwater flow direction to the southwest with locally more southerly components. Overall gradient is about 100 ft per 3 miles, which corresponds to an
DV102.00279.01 2-4 November 2008 Dewey-Burdock 2008 Pump Test Report Rev 0.doc
DV102.00279.01 2-5 November 2008 Dewey-Burdock 2008 Pump Test Report Rev 0.doc
average gradient of about 0.006 ft/ft. The potentiometric surface elevation is generally about 50 to 100 ft lower in both the overlying Lakota and Fall River Formation aquifers. This indicates vertical upward gradients between the Unkpapa Formation, the intervening Morrison Formation and the Inyan Kara Group. The Morrison Formation thus appears to function as an effective aquitard throughout the project area.
2.3 Summary of Previous Aquifer Testing Results The Tennessee Valley Authority (TVA) conducted groundwater pumping tests from 1977 through 1982 as part of a uranium mine development project near the towns of Edgemont and Dewey, South Dakota. TVA produced two summary pumping test reports, "Analysis of Aquifer Tests Conducted at the Proposed Burdock Uranium Mine Site" (Boggs and Jenkins, 1980) and "Hydrogeologic Investigations at Proposed Uranium Mine Near Dewey, South Dakota" (Boggs, 1983). In addition, TVA prepared a draft Environmental Impact Statement for the proposed Edgemont Uranium Mine in 1979.
TVA first conducted two unsuccessful tests in 1977 at the Burdock test site. The results of the 1977 tests were considered inconclusive because of various problems including questionable discharge measurements, some observation wells improperly constructed, and some pressure gauges malfunctioned. No data from the 1977 tests are currently available.
TVA conducted three successful pumping tests, two in 1979 near the current Burdock Project Area, and one in 1982 about two miles north of the current Dewey Project Area. The results of these successful tests are described in separate sections below. However, no data for these tests, in particular electronic records of drawdown, are available, other than information contained in the reports.
2.3.1 Dewey Project Area The Dewey test was conducted in 1982 northeast of the Dewey Road at the location shown on Figure 1.1. The test consisted of pumping in the Lakota formation for 11 days at an average rate of 495 gpm. The test developed the following information:
• Transmissivity of the Lakota averaged about 4,400 gallons per day per foot (gpd/ft) which is equivalent to 590 ft squared per day (ft2/day).
• Storativity of the Lakota was about 1.0 x 10⁻⁴ (dimensionless).
• There was response between the Fall River and Lakota formations through the intervening Fuson shale-siltstone member that was manifested at relatively late time (3000 to 10000 minutes).
• The vertical hydraulic conductivity of the Fuson aquitard using the Neuman-Witherspoon ratio method (Neuman and Witherspoon, 1973) was 2 x 10⁻⁴ ft/day; storativity of the Fuson Member was not determined and specific storage was about 7 x 10⁻⁷ ft-1.
• A barrier boundary, or a decrease in transmissivity due to lithologic changes with distance from the test site, or both, were observed; a possible geologic feature corresponding to a barrier was noted to be the Dewey Fault Zone, located about 1.5 miles north of the test site, where the Lakota and Fall River formations are structurally offset.
2.3.2 Burdock Project Area The Burdock tests were conducted in 1979 near the Dewey road at the location shown on Figure 1.1. The Burdock tests consisted of separate pumping tests from the Lakota (Chilson) and Fall River Aquifer, respectively in April and July of 1979. The tests used the same pumping well with packers to alternately isolate screens open to the respective formations. Test durations were 73 hours for the Lakota test and 49 hours for the Fall River test. Pumping rates were about 200 gpm from the Lakota aquifer and 8.5 gpm from the Fall River. The reason for the unexpected low pumping rate from the Fall River aquifer was not specified in the TVA report.
The tests developed the following information:
• Interpreted transmissivity of the Lakota was based on analysis of later time data and inferred decreasing transmissivity with distance from the test site due to changes in lithology; overall transmissivity averaged about 1,400 gpd/ft (190 ft2/day) and storativity about 1.8 x 10⁻⁴ (dimensionless); maximum transmissivity from early time data was about 2,300 gpd/ft (310 ft2/day).
• Transmissivity of the Fall River averaged about 400 gpd/ft (54 ft2/day) and storativity about 1.4 x 10⁻⁵ (dimensionless).
• There was communication between the Fall River and Lakota formations through the intervening Fuson shale-siltstone member; leaky behavior was observed in the Fall River Formation and believed to exist in the Lakota although “leakage effects in the Lakota drawdown data are masked by the conflicting effect of a decreasing transmissivity in site vicinity” (p. 16 in Boggs and Jenkins, 1980).
• The vertical hydraulic conductivity of the Fuson aquitard determined with the Neuman-Witherspoon ratio method (Neuman and Witherspoon, 1973) ranged from
DV102.00279.01 2-6 November 2008 Dewey-Burdock 2008 Pump Test Report Rev 0.doc

DV102.00279.01 2-7 November 2008 Dewey-Burdock 2008 Pump Test Report Rev 0.doc
10-3 to 10-4 ft/day; storativity was not determined, and specific storage was assumed to be about 10-6 ft-1.
3.0 2008 Pumping Tests: Design and Procedures In 2008 pumping tests were performed at both the Dewey and Burdock project areas. A work plan (Knight Piésold, 2008) was prepared and distributed to interested representatives of State and Federal agencies, including the South Dakota DENR and the USEPA. Individual production zones within the Inyan Kara Group will likely be on the order of 10 to 15 ft thick to target ore horizons in both the Fall River and Lakota aquifers. Uranium ore is often located at different horizons in both aquifers at the same spatial locations (Drawings 4.1, 4.2, 5.1, 5.2 and 5.3).
Powertech performed geologic interpretations, well design, well installation and mechanical integrity testing. Well completions are described in detail for the test layout at each of the Dewey and Burdock project areas (Sections 4 and 5). Field activities for the Dewey and Burdock pumping tests were jointly performed by Powertech and Knight Piésold personnel. Aquifer test analyses were performed and this aquifer testing report was written by Knight Piésold.
3.1 Well Installation, Completion and Mechanical Integrity Testing Well bores are drilled to diameters specified in SDDENR regulations. New casing is set and 15.2 pounds per gallon (lb/gal) cement is positively displaced into the annulus. After a cement cure time not less than 24 hours, the well is pressured up with air for a minimum of 1 hour. After the mechanical integrity test has passed, the well is developed until the water runs clear, and the screen is then pushed into place. The casing is cut off to 2.5 ft above ground surface and capped. Applicable reports are filed with the State. Wells are not used under conditions that do not meet manufacturer’s recommendations and specifications for its type (SDA74:02:04:42).
3.2 Pumping Test Equipment and Facilities Powertech personnel installed the pumping and monitoring equipment prior to testing. Knight Piésold verified the performance of the pumping test equipment by conducting step-drawdown tests at each site. Thereafter, Knight Piésold performed or supervised pump operations throughout the constant rate tests together with the datalogger programming and day-to-day downloads of data.
The tests were performed using a 5-horsepower (Hp) electrical submersible pump powered by a portable generator. At each site the pump was set at 300 ft with 2-inch diameter drop pipe. Surface flow monitoring equipment were Cameron 1-inch NUFLOTM flowmeters and MP-IIITM digital flow analyzer with readout of instantaneous flow and totalizer of flow. In accordance
DV102.00279.01 3-1 November 2008 Dewey-Burdock 2008 Pump Test Report Rev 0.doc
with the temporary discharge permit received from South Dakota DENR, the pump discharge water was piped to temporary holding ponds via 1 1/4-inch diameter high density polyethylene plastic pipe. Throughout the tests, a portion of the discharge water was routed through a YSITM flow-through cell with multi-parameter probe that read field parameters (temperature, pH, conductivity, dissolved oxygen and turbidity) that were recorded twice daily through pumping phases of the tests.
Water levels in each well were measured and recorded with vented In-SituTM Level TROLLTM pressure transducers with built in data loggers. The pressure ratings for the transducers range from 100 to 300 pounds per square inch (psi). Transducer accuracy (in comparison to known pressure or other pressure reading devices) is stated by the manufacturer to be ±0.1 percent of full-scale reading (i.e., 100 to 300 psi), so the limit of accuracy varies from 0.1 to 0.3 psi, or about 0.2 to 0.7 ft. Transducer sensitivity is stated to be ±0.01 percent of full-scale, resulting in sensitivity limits of about 0.01 to 0.03 psi, or 0.02 to 0.07 ft.
The sequence of events before and during the 2008 pumping tests is summarized in Figures 3.1 and 3.2. Figure 3.1 illustrates background pressure transducer and site barometer measurements that are described in Section 3.3, below. Evaluation of the background monitoring data produced several methods for correcting water levels; however, after these were applied on a test data set it was concluded that necessary corrections to water level data were minimal and that the test interpretations could equally well rely on uncorrected time-drawdown data.
Figure 3.2 displays output from the discharge flow data logger that is described in Section 3.4, below.
3.3 Background Monitoring and Water Level Corrections Pressure transducers were installed in wells at both sites by April 2, 2008 in order to obtain background groundwater level measurements. At the Burdock test site, a transducer was installed in the designated pumping well (DB07-11-11C) in the lower Lakota Formation. At the Dewey test site, a transducer was installed in observation well (DB07-32-4C), screened in the same zone as the pumping well in the lower Fall River Formation. The right hand axis of Figure 3.1 graphs hourly barometric pressure measurements in millibars obtained from the meteorological station installed at the site. The site station is maintained by South Dakota State University (SDSU) and data are available at the following URL: “http://climate.sdstate.edu/ awdn/edgemont/archive3.asp”.
DV102.00279.01 3-2 November 2008 Dewey-Burdock 2008 Pump Test Report Rev 0.doc
One month of background measurements were obtained from April 8 to May 9, 2008 (Figure 3.1). Background measurements shown on Figure 3.1 fluctuate over a range of about 0.4 psi with the expected inverse relationship between site barometer readings and increases/decreases in groundwater levels. There are also smaller cyclic sinusoidal variations that occur twice daily and are attributable to Earth tide cycles. A period of two weeks (April 23 to May 8, 2008) after pump installation and initial testing produced undisturbed background water level data.
Three types of water level correction procedures were evaluated using the background monitoring data. The first procedure was manually correcting the transducer psi values with a constant barometric efficiency (BE) determined for each major aquifer (e.g., Kruseman and de Ridder, 1991). The BE is defined as the change in water level in a well versus a related change in atmospheric pressure. Gontheir (2007) describes the historical methods of determining BE, which by convention is dimensionless and ranges from zero to one.
The second type of correction that was evaluated considers additional factors, chiefly long-term seasonal trends and Earth tides (Gontheir, 2007). A spreadsheet distributed by the USGS as an open-file report (Halford, 2006) has programming that empirically factors the overall water level response into multiple synthetically generated time series with adjustments to both phase and amplitude of each component (see Appendix A.1, Figures A.1-3 and A.1-4). The USGS spreadsheet was used to determine that the Dewey background water level data from April 23 to May 8, 2008, could be closely matched as a series of four components: (1) water level increase at a linear rate [i.e., slope], (2) variation in air pressure measured with the site barometer, (3 and 4) two Earth tide components.
The third type of correction procedure evaluated was a computer method known as BETCO (Sandia Corporation, 2005; Toll and Rasmussen, 2006). This software is available at “http://www.sandia.gov/betco/”. To correct data, water level, time and barometric pressure are input and BETCO calculates corrected water level values. Compared with the manual BE correction, the corrected water levels calculated in BETCO yielded similar results, generally within about ± 0.01 psi.
The manual BE method was judged to be better than the BETCO computer method for the background calibration period examined (Appendix A). Moreover, both the BETCO and USGS methods were difficult to apply with confidence to the drawdown data after the background monitoring period because wells with similar construction to the pumping test wells, but outside
DV102.00279.01 3-3 November 2008 Dewey-Burdock 2008 Pump Test Report Rev 0.doc
the area of test influence, are not available to validate the corrections. A further difficulty with the BETCO and USGS computer methods is that they do not accommodate logarithmic measurement times as input data.
To examine the possible importance of BE corrections on water levels, the drawdown phase of the Dewey test was manually corrected with a BE of 0.48 (see Figure A.1-1 in Appendix A) relative to the site barometer over the test period. The maximum effect of the BE correction was to add about 0.2 ft to the water levels at the end of the drawdown phase due to an overall barometric pressure decline of about 15 millibars (i.e., from about 1,030 to 1,015 millibars, Figure 3.1). Test interpretations (Theis drawdown) were made with and without the BE corrections for the Dewey test. The corrections were found to have no discernable effect on the visual fits to type curves. Because the changes in barometric pressure during the 3-day constant rate tests at Burdock and Dewey were similar (Figure 3.1), the analysis determined that BE corrections would be no greater for the Burdock test compared to the Dewey test. Therefore, corrections to water level data were not further performed and the test interpretations rely on uncorrected time-drawdown data.
3.4 Test Procedures, Data Collection, Data Processing The discharge flow data logger was set to record at hourly intervals and was downloaded at the end of the tests (Figure 3.2). The discharge flow rate was adjusted with a manual gate valve. Step-drawdown tests were performed on May 12 and 13, 2008 (Figures 3.1 and 3.2). The step-drawdown tests consisted of four steps at 10 gpm, 20 gpm, 25 gpm, and 30 gpm for a minimum of 90 minutes at each step. The step-drawdown data indicated successful performance of all equipment at both test sites. Subsequent analysis of the step-drawdown data was not performed due to the better quality (i.e., much longer time) data obtained from the constant rate tests for determining both aquifer parameters and well efficiencies.
Constant rate tests were performed on May 15 to May 18, 2008 at Dewey and from May 18 to May 21, 2008 at Burdock (Figures 3.1 and 3.2) after recovery from the step-rate tests. At both test sites the recorded hourly flow rates during the constant rate tests varied no more than 2 percent (between 30.0 and 30.7 gpm) throughout the tests and the pumping rates for the entire 3-day tests at each site averaged 30.2 gpm.
The data loggers in all wells were synchronized to the same clock-time immediately prior to start-up. To collect closely-spaced measurements during the start-up of the drawdown phase of the test, the transducers were programmed to record temperature and psi measurements at
DV102.00279.01 3-4 November 2008 Dewey-Burdock 2008 Pump Test Report Rev 0.doc

DV102.00279.01 3-5 November 2008 Dewey-Burdock 2008 Pump Test Report Rev 0.doc
one-second intervals for two hours, then at ten second-intervals for 70 to 72 hours. For recovery, the data loggers returned to a measurement frequency of one-second for two hours, during which time the pump was shut off, followed by ten-second measurement intervals thereafter.
The time-drawdown data output from the data loggers consisted of two hours of data at one-second intervals followed by 72 or 74 hours of data collected at ten-second intervals, with the sequence repeated for the recovery phase. The WinSituTM software produced drawdown graphs that are reproduced in Sections 4 and 5. The software exported records to text “.csv” files with approximately 60,000 to 70,000 records for each well. The time-drawdown data were processed using a custom FORTRAN program that wrote data records to an output file based on a template file specifying which date-time records would be written. The template file was prepared to produce logarithmically spaced data with 30 records per log cycle (in seconds). Due to slight variations in transducer output and the precision of the Microsoft Excel date-time format, there are some ± one-second variations in the sequences of records from well to well.
The FORTRAN program also converted transducer psi to drawdown in ft using formulas described in Appendix A. The reference value for zero drawdown was set as the average of psi readings from the start of the data log to the time just prior to test startup. Separate time-drawdown files were prepared for both drawdown and recovery phases of the tests. Tables of the processed time-drawdown data used for test interpretations are provided in Appendices B and C. Complete binary files with the raw data for each well in Win-SituTM format are also provided on a CD-ROM in Appendix E.
4.0 Dewey Project Area Pumping Test 4.1 Test Layout and Initial Potentiometric Surface Measurements The Dewey pumping test well is located in NE ¼ NW ¼ Sec. 32, T.6S, R.1E, Custer County, South Dakota (Figure 4.1, Table 4.1). Powertech completed the pumping well (DB07-32-3C) with a fifteen-ft screen within the lower sandstone layer in the Fall River Formation near the roll front ore zones (Drawings 4.1 and 4.2). Three new observation wells were similarly screened at the same stratigraphic horizon within the lower Fall River Formation, located at radial distances of 265, 467 and 2,400 ft away from the pumped well (Figure 4.1 Table 4.1). A pre-existing stock watering well (GW-49) was also monitored. The stock well is located approximately 1,400 ft west of the pumped well and is believed (based on a recent electric log) to be an open hole for about 70 ft corresponding to about the top half of the Fall River formation.
Additional information on the design of the pumping test well layout and objectives for test analysis are provided in Appendix A.2. Well Construction diagrams and borehole electric logs for the Dewey test wells are provided, respectively, in Appendices B.1 and B.2.
Within a fifty-ft radius around the pumping well, additional observation wells were completed in a vertical nest in order to provide hydraulic data for the degree of confinement of both the test sandstone horizon and the entire Fall River Formation aquifer. Observation well DB-07-32-9C was screened in the upper Fall River aquifer at 41 ft lateral distance and 95 ft vertically above the screen in pumping well 32-3C. Observation well DB-07-32-10 was located within the underlying Lakota Formation 61 ft laterally and 130 ft vertically below the screen in the pumping well. Observation well DB-07-32-11 was located in the underlying Unkpapa Formation aquifer 50 ft laterally and 325 ft vertically below the screen in pumping well 32-3C.
Piezometric measurements (Eric Krantz, RESPEC, personal communication, May 2008) and well survey data provided by Powertech were used to calculate potentiometric surface elevations in ft above mean sea level with an estimated accuracy of ± 3 ft (Table 4.2). The potentiometric surface elevations for the Unkpapa, Lakota, and Fall River aquifers at the wells in the vertical well nest at the Dewey test site indicate artesian conditions. The three major geologic formations appear to be locally hydraulically isolated with upward vertical gradients, as follows:
• nearly 80 ft head difference upward (Table 4.2) between the Unkpapa and lower Lakota aquifers
DV102.00279.01 4-1 November 2008 Dewey-Burdock 2008 Pump Test Report Rev 0.doc
• nearly 40 ft head difference upward between the lower Lakota and lower Fall River aquifers
• nearly 20 ft head difference upward between the wells screened in the lower Fall River and upper Fall River formation
4.2 Pumping Rate and Duration The pumping phase of the constant-rate test at the Dewey area was started at 10:30:09 AM on May 15, 2008 and the pump was shut down at 12:30:59 PM on May 18, 2006, for a total duration of 4,440 minutes or 3.08 days (Figure 3.2). Because of the artesian condition in the pumping zone, the pumping well (32-3C) was shut-in, the pump turned on at 10:29:54 AM and the shut-in valve opened at 10:30:09 AM, the designated starting time of the test. The artesian observation wells had been left open for at least a day prior to startup to test for leakage from gaskets surrounding the transducer cables. Leakage during the constant rate test was not observed at any well except observation well 32-11 in the Unkpapa Formation, as described in Section 4.6, below.
The average pumping rate for the 3.08 day test was 30.2 gpm (Figure 3.2). During drawdown, there was a major flow rate adjustment where the gate valve was opened and throttled back; this occurred from 0.4 to 1.2 minutes and produces a discontinuity on logarithmically displayed time-drawdown data at the pumping well (Figure 4.7). Minor flow rate adjustments were also made at 21, 125, and 2777 minutes into the test that can also be seen on time-drawdown data for the pumping well (Figure 4.7). During recovery, the pumping well was initially left open to discharge water in piping and then shut-in when it was determined that the well was discharging due to artesian flow; this produces a discontinuity shown on the recovery plot for the well (Figure 4.7).
4.3 Responses at Pumping and Observation Wells Table 4.2 summarizes the responses to pumping for the Dewey test. Figures 4.2, 4.3 and 4.4 display the transducer responses. Drawdown throughout the lower Fall River aquifer was 44.8 ft at the pumping well and ranged from 13.0 to 1.5 ft at the observation wells. Response to pumping varied progressively with distance from the pumping well throughout the lower Fall River: within 3 minutes at the two observation wells at 265 and 467 ft, and response was at 140 minutes at 2,400 ft distance. Similarly, the upper Fall River stock well (GW-49) responded at 40 minutes at 1,400 ft distance (Table 4.2).
DV102.00279.01 4-2 November 2008 Dewey-Burdock 2008 Pump Test Report Rev 0.doc
However, it took 10.6 minutes for upper Fall River well (32-9C) to respond at 41 ft radial distance and 95 ft vertical distance (Table 4.2. The delayed response at the upper Fall River well is attributed to vertical anisotropy due to shale interbeds overlying the lower sandstone layer (Drawings 4.1 and 4.2).
The pumping and observation wells generally had symmetrical patterns of drawdown response and recovery response, except at the distant observation well 29-7 (Figure 4.3). There, the drawdown began at 140 minutes into the test, and drawdown continued to a maximum of 2.1 ft at about two days after the pump was shut down (Table 4.2). Therefore, the recovery response at well 29-7 was not further analyzed.
4.4 Determination of Aquifer Parameters Aquifer parameters determined with the Theis drawdown, Theis recovery, Cooper-Jacob drawdown, Theis-Cooper-Jacob recovery, and distance drawdown methods are summarized in Table 4.3. Appendix A provides a definition of the well function parameters (u, u'), a complete description of the methods used, and corresponding assumptions for aquifer parameter determinations. For the straight-line methods, analyses with u or u’ > 0.01 are reported but are not considered acceptable, as indicated in the table. Appendix B provides the graphical analyses that determined aquifer parameters at each well listed in Table 4.3.
The following discussion and Figures 4.5 through 4.8 illustrate the overall analysis of the pumping test and exemplify the determination of aquifer parameters with figures illustrating each of the major graphical analysis methods used. The observation well exhibiting the most diagnostic response is discussed first, followed by the drawdown at all observation wells, the drawdown at the pumping well, and finally the recovery at all wells.
4.4.1 Theis Drawdown and Recovery Analysis Figure 4.5 displays time drawdown data and analysis on the log-log Theis plot for the closest observation well (32-5 at 265 ft distance). The data indicate a confined aquifer response fitting the Theis type curve until latest time, where there is a barrier boundary, where the drawdown increased above the theoretical rate of drawdown. The boundary was encountered at a time of about 0.6 days into the test (Table 4.2). The data at the next closest observation wells (32-4C and the stock well GW-49) also suggest a barrier boundary at times ranging from about 0.7 to 1.9 days into the test (Table 4.2).
DV102.00279.01 4-3 November 2008 Dewey-Burdock 2008 Pump Test Report Rev 0.doc

Drawdown analyses using the Theis method for all applicable wells (i.e., 32-3C, 32-5, 32-4C, 29-7, and GW-49) are given in Appendix B.4 (Figures B.4-1 through Figure B.4-5) and summarized in Table 4.3. The Theis analyses in Appendix B use test analysis software (AquiferWin32TM ESI, 2003). Input data is weighted to ignore the late-time barrier boundary using an automated curve matching procedure. The weighting for all samples is the same, as follows: time-drawdown data before the first response are ignored, and data after the earliest occurrence of the barrier boundary at any of the wells (0.6 days) are ignored. The aquifer parameters transmissivity and storativity determined with Theis analyses are summarized in Table 4.3.
Figure B.4-6 in Appendix B shows the data at observation well 32-9C, completed in the upper Fall River 41 ft radially and 95 ft vertically from the screened interval in the pumping well. Samples are weighted as described above. This data cannot be interpreted successfully with the Theis analysis because only the middle-time portion of the drawdown closely follows the type curve. The poor fit to the Theis curve for well 32-9C yields a transmissivity of 217 ft2/d, a value within the range of other observation wells, but a high storativity value of 0.016, which is inappropriate for a confined aquifer (e.g., Freeze and Cherry, 1979, Halford and Kuniansky, 2002). The artificially high storativity is attributed to the time-delay in response. The time-delay is attributed to vertical anisotropy as described in Section 4.3, above. Therefore, aquifer parameters from this well are reported in Table 4.3 but are not considered reliable determinations and are not used in determining the overall average aquifer parameters for the test.
4.4.2 Theis-Cooper-Jacob Straight-line Analysis Figure 4.6 displays the Theis recovery analysis at the closest observation well 32-5 using automated straight-line fitting in AquiferWin32TM software. Appendix A.2 provides an overview of the theoretical basis for straight-line test analysis and definitions for the terms u', t and t'. Samples are weighted according to (1) the theoretical criterion that u’ be < 0.01, which restricts the data to later-time (to the left on the t/t’ axis); and (2) the portion of the recovery before the change in slope due the barrier boundary. The sample weighting restricts the matched straight-line portion of the recovery plot to the line-segment shown in Figure 4.6 and a value for the transmissivity, but not storativity, is obtained (Table 4.3).
Figure 4.7 (top) shows a Cooper-Jacob straight-line drawdown plot for the Dewey pumping well 32-3C. This USGS graphical-analysis tool is a spreadsheet that allows manual fitting of the straight-line (Halford and Kuniansky, 2002). The portion of the plot corresponding to later time
DV102.00279.01 4-4 November 2008 Dewey-Burdock 2008 Pump Test Report Rev 0.doc
where is indicated, and this slope is used to determine transmissivity of 250 ft2/d and well efficiency of 81 percent (Table 4.3).
The bottom portion of Figure 4.7 shows the USGS spreadsheet implementation of the Theis recovery analysis for the pumping well 32-3C, referred to as the Theis-Cooper-Jacob method (Halford and Kuniansky, 2002). Similar to Figure 4.6, the portion of the plot corresponding to later time is indicated to the left on the t/t’ axis, and this slope is used to determine transmissivity of 270 ft2/d (Table 4.3). The recovery plot at the pumping well also shows the change in slope with an increase in rate of drawdown at the latest times which is ignored in the manual fit of the straight-line.
4.4.3 Distance-Drawdown Analysis Figure 4.8 is distance-drawdown analysis plot that determines transmissivity, storativity, and pumping well efficiency by considering all observation wells at once. The pumping well efficiency of 93 to 95 percent is determined by extending the straight line to the assumed diameter of the pumping well (0.25 ft for the 6-inch diameter well casing or possibly 0.33 ft for the 8-inch diameter borehole) relative to the actual drawdown observed at the pumping well. The aquifer parameters and the high efficiency are somewhat questionable given the relatively poor (r2 = 0.7) straight-line fit through all data points. However, transmissivity and storativity values obtained are reasonable and the distance drawdown results are included in the overall average aquifer parameters for the test (Table 4.3).
The distance-drawdown analysis also gives the maximum radius of influence of the test. Based on Figure 4.8, the radius of influence was about 5,700 ft, about twice the radial distance to the most distant responding well (i.e., 29-7 at 2,400 ft). The radius of influence may be compared to the dimensions of prospective well fields in the area to evaluate whether aquifer parameters have been adequately characterized.
4.4.4 Summary of Dewey Test – Lower Fall River Formation Aquifer Parameters The aquifer parameters determined by the techniques described above are summarized in Table 5.3. Ten accepted determinations of transmissivity (outlined) range from 180 to 330 ft2/day and the mean and median are close at 251 to 255 ft2/day. The five accepted storativity determinations ranged from 2.3 x 10⁻⁵ to 2.0 x 10⁻⁴. The geometric mean and median storativity values are respectively 5.2 to 4.6 x 10⁻⁵. The median transmissivity of 255 ft2/day and median storativity of 4.6 x 10⁻⁵ are considered the best measures of the central tendency of the test results.
DV102.00279.01 4-5 November 2008 Dewey-Burdock 2008 Pump Test Report Rev 0.doc
DV102.00279.01 4-6 November 2008 Dewey-Burdock 2008 Pump Test Report Rev 0.doc
4.5 Underlying Lakota Aquifer Test Results Observation well (DB-07-32-10, Figure 4.1, Drawing 4.2) was located within the underlying Lakota Formation 61 ft laterally and 130 ft vertically below the screen in pumping well 32-3C. Figure 4.4 illustrates that there was no response of observation well 32-10 to the drawdown or recovery phases at the pumping well 32-3C. Therefore, there was no further analysis of this observation well.
4.6 Underlying Unkpapa Aquifer Test Results Observation well DB-07-32-11 is screened in the underlying Unkpapa Formation aquifer 50 ft radially and 325 ft vertically below the screen in pumping well 32-3C (Table 4.1). Figure 4.4 depicts a generally rising trend in transducer response with sinusoidal variations associated with Earth tides indicating the aquifer remained undisturbed when the pump was turned on and turned off. Mid-way through the recovery, a shift in the pressure response on May 20, 2008 was noted similar to when leaks in the gasket-seal were observed previously. The threaded cap and gasket were checked on May 21, 2008 and found to be moist suggesting that a temporary leak may have occurred.
Figure 4.4 illustrates that there was no response of observation well 32-11 to the drawdown or recovery phases at the pumping well 32-3C. Therefore, there was no further analysis of this observation well.
5.0 Burdock Project Area Pumping Test 5.1 Test Layout and Initial Potentiometric Surface Measurements The Burdock pumping test well is located in NE ¼ SW ¼ Sec. 11, T.7S, R.1E, Fall River County, South Dakota (Figure 5.1, Table 5.1). Powertech completed the pumping well (DB07-11-11C) with a ten-ft screen within a lower sandstone layer in the Lakota (Chilson) formation. Hereafter, the term Lakota is used to refer to the Chilson member of the Lakota formation. The ten-ft screen was set near the horizon of the lower Lakota ore zone(s), indicated by the roll fronts on Drawings 5.1 through 5.3. Three new observation wells were similarly screened at the same stratigraphic horizon within the lower Lakota Formation, located at radial distances of 243, 250 and 1,292 ft away from the pumped well (Figure 5.1, Table 5.1).
Additional information on the design of the pumping test well layout and objectives for test analysis are provided in Appendix A.2. Well Construction diagrams and borehole electric logs for the Burdock test pumping and observation wells are provided respectively, in Appendices C.1 and C.2.
Within a fifty-ft radius around the pumping well, additional observation wells were completed in a vertical nest in order to provide hydraulic data for the degree of confinement of both the test sandstone horizon and the entire Lakota formation aquifer. Observation well DB-07-11-19 was screened in the upper Lakota aquifer at 50 ft lateral distance and 100 ft vertical distance above the screen in pumping well 11-11C. Observation well DB-07-11-19 was located within the overlying Fall River Formation 61 ft laterally and 180 ft vertically above the screen in the pumping well. Observation well DB-07-11-18 was located in the underlying Unkpapa Formation aquifer 50 ft radially and 195 ft vertically below the screen in the pumping well.
Piezometric measurements (Eric Krantz, RESPEC, personal communication, May 2008) and well survey data provided by Powertech were used to calculate potentiometric surface elevations in ft msl with an estimated accuracy of ±3 ft (Table 5.2). The potentiometric surfaces of the Lakota and Fall River aquifers at the wells in the vertical well nest at the Burdock site indicate confined and non-artesian conditions. The two major aquifers (Fall River and Lakota) appear to be locally hydraulically connected through the intervening Fuson Member with minimal vertical gradients because the water levels are similar within ± 2-3 ft (Table 5.2).
DV102.00279.01 5-1 November 2008 Dewey-Burdock 2008 Pump Test Report Rev 0.doc
Piezometric surface information for the Unkpapa and Lakota/Fall River aquifers indicate that the Unkpapa formation aquifer is artesian and hydraulically isolated with a nearly 70 ft head difference directed vertically upward (Table 5.2).
5.2 Pumping Rate and Duration The pumping phase of the constant-rate test at the Burdock area was started at 2:20:36 PM on May 18, 2008 and the pump was shut down at 2:30:37 PM on May 21, 2008, for a total duration of 4,320 minutes or 3.0 days. The average pumping rate was 30.2 gpm. A flow rate adjustment was made at 160 minutes into the test that can be seen on logarithmic time-drawdown data for the pumping well (Figure 5.7). The average pumping rate for the 3.0 day test was 30.2 gpm (Figure 3.2).
5.3 Responses at Pumping and Observation Wells Table 5.2 summarizes the responses to pumping for the Burdock test. Figures 5.2, 5.3 and 5.4 display the transducer responses. Drawdown throughout the lower Lakota aquifer was 91.1 ft at the pumping well and ranged from 17.0 to 3.1 ft at the observation wells. Response to pumping varied with distance from the pumping well in the Lakota aquifer in a non-systematic manner indicating significant lateral and vertical anisotropy, as follows:
• Response was within 3.6 minutes at the observation well (11-14C) at 250 ft distance with 17 ft of ultimate drawdown (Table 5.2).
• But the other lower Lakota observation well at 243 ft distance (11-15) took 140 minutes to respond, with 10 ft of ultimate drawdown.
• Upper Lakota observation well 11-19 took 160 minutes to respond with 3.4 ft ultimate drawdown at 50 ft radial distance and 100 ft vertical distance.
• First response was at 280 minutes at the most distant well (11-2) at 1,292 ft distance.
The responses of close-in well 11-14C and the distant well 11-2 are interpreted as a typical sequence of response to pumping well in a confined aquifer with similar transmissivity connecting all three wells. The delayed response at the upper Lakota well 11-19 is attributable to vertical anisotropy due to shale interbeds overlying the lower sandstone layer (Drawings 5.1 through 5.3). The delayed response of the closest observation well 11-15 requires an explanation in addition to lateral anisotropy. Powertech geologists were contacted and have subsequently indicated that there may have been problems with the installation of well 11-15 because it was subjected to intensive efforts during development.
DV102.00279.01 5-2 November 2008 Dewey-Burdock 2008 Pump Test Report Rev 0.doc
Figures 5.2 through 5.4 indicate symmetrical patterns of drawdown response and recovery response, such that if the drawdown response was delayed there was a generally similar time before the recovery response (e.g., wells 11-2, and 11-19 on Figure 5.3). The anomalous recovery response at observation well 11-17, screened in the overlying Fall River aquifer, is discussed in Section 5.5, below.
5.4 Determination of Aquifer Parameters Aquifer parameters determined with the Theis drawdown, Hantush-Jacob drawdown, Cooper-Jacob drawdown, Theis-Cooper-Jacob recovery and distance drawdown methods are summarized in Table 5.3. For the straight-line methods, analyses with u or u’ > 0.01 are reported but are not considered acceptable, as indicated in the table. Appendix A provides a complete description of the methods used and corresponding assumptions for aquifer parameter determinations. Appendix C provides the graphical analyses that determined aquifer parameters at each well listed in Table 5.3.
The following discussion and Figures 5.5 through 5.8 illustrate the overall analysis of the pumping test and exemplify the determination of aquifer parameters with figures illustrating each of the major graphical analysis methods used. The observation well exhibiting the most diagnostic response is discussed first, followed by the drawdown at all observation wells, the drawdown at the pumping well, and finally the recovery at all wells.
5.4.1 Theis Drawdown Analysis Figure 5.5 displays time-drawdown data and analysis on the log-log Theis plot for close-in observation well 11-14C at 250 ft distance. The data indicate confined aquifer response fitting the Theis type curve for the first 1.1 days of the test. After 1.1 days, the drawdown indicates a recharge boundary or vertical leakage from an adjacent confining layer where the actual rate of drawdown is less than the theoretical rate of drawdown. The drawdown at the most distant observation well (11-2 at 1,292 ft distance) also fits the Theis type curve for the first 1.8 days of the test (see Appendix C, Figure C.4-5) at which time a recharge boundary is encountered. Boundary responses are summarized in Table 5.2.
Drawdown analyses using the Theis method for all applicable wells (i.e., 11-11C, 11-15, 11-14C and 11-29) are given in Appendix C.4 (Figures C.4-1 through Figure C.4-5) and summarized in Table 5.3. The Theis analyses in Appendix C use test analysis software (AquiferWin32TM ESI, 2003). Input data is weighted to ignore the late-time recharge boundary using an automated curve matching procedure. The weighting for all samples is the same, as follows:
DV102.00279.01 5-3 November 2008 Dewey-Burdock 2008 Pump Test Report Rev 0.doc

time-drawdown data before the first response are ignored, and data after the earliest occurrence of the recharge boundary at any of the wells (1.1 days) are ignored. The aquifer parameters transmissivity and storativity determined with Theis analyses are summarized in Table 5.3.
The data at the close-in Lakota observation well 11-15 at 243 ft distance are successfully fitted with the Theis curve and recharge boundary (see Appendix C, Figure C.4-2). A trial analysis of the best fit yields a transmissivity value lower than the range of other observation wells and a relatively high storativity value of 0.0013. Because this storativity value is high compared to confined aquifers in general (e.g., Freeze and Cherry, 1979, Halford and Kuniansky, 2002) and also the other Burdock test wells (Table 5.3), aquifer parameters from this well were not further considered. The high storativity is attributable to the delayed response time (140 minutes at 243 ft distance), and the cause of the delay is attributed to problems with well construction.
At observation well 11-19, completed in the upper Lakota 50 ft radially and 130 ft vertically from the screened interval in the pumping well, the drawdown data appear to be interpretable with the Theis analysis and yield a transmissivity value within the range of other observation wells (see Appendix C, Figure C.4-7). However, the very high storativity value of 0.10 is inappropriate for a confined aquifer. As described in Appendix A.2, there are a number of violations of the Theis test conditions when attempting to analyze drawdown due to pumping between partially penetrating well screens set apart 130 ft vertically. The artificially high storativity is attributed to the time-delay in response (160 minutes). The time-delay is attributed to vertical anisotropy as described in Section 5.3, above. Therefore, aquifer parameters from this well were not further considered.
5.4.2 Hantush-Jacob Drawdown Analysis The AquiferWin32TM software implements the Hantush-Jacob (Hantush and Jacob, 1955) analytical model for drawdown analysis that follows the Theis curve in early-time and calculates a flattening recharge boundary due to vertical leakage from an assumed overlying leaky confining layer. The vertical leakage is described in the term r/B, which is implemented in this analysis as follows:
• r/B = r/( (T b’)/K’)0.5
• T transmissivity of confined Lakota aquifer (assume provisional value of 145 ft2/day)
• b’ thickness of Fuson member aquitard/confining layer (35 ft, based on Drawing 5.3)
DV102.00279.01 5-4 November 2008 Dewey-Burdock 2008 Pump Test Report Rev 0.doc

• K’ vertical hydraulic conductivity of Fuson (10-3 ft/day from the TVA test, Section 2.3.2)
• radial distance (r = 250 ft to well 11-14C and 1,292 ft to well 11-2)
• r/B well 11-14C = 0.11; r/b well 11-2 = 0.57
Figure 5.6 shows the Hantush-Jacob analysis at observation well 11-14C where r/B is input as fixed and all data after initial response are equally weighted. It is noted that automated curve-fitting in the AquiferWin32TM software can also be set to optimize to r/B, and a value of 0.11 is also obtained, indicating that this is a good match. For distant observation well 11-2 the software optimized to an r/B value of 0.77, so the calculated value of 0.57 was fixed (see Figure C.4-6 in Appendix C). Transmissivity and storativity values obtained through the curve matching at the two observation wells are entered in Table 5.3.
5.4.3 Theis-Cooper-Jacob Straight-line Analysis Figure 5.7 (top) shows a Cooper-Jacob drawdown plot for the Burdock pumping well 11-11C. This USGS graphical-analysis tool is a spreadsheet that allows manual fitting of the straight-line (Halford and Kuniansky, 2002). Appendix A.2 provides an overview of the theoretical basis for straight-line test analysis and definitions for the terms u, u', t and t'. The portion of the plot corresponding to later time where u < 0.01 is indicated, and this slope is used to determine transmissivity of 150 ft2/day and well efficiency of 65 percent (Table 5.3).
The bottom portion of Figure 5.7 shows the USGS spreadsheet implementation of the Theis recovery analysis for the pumping well 11-11C, referred to as the Theis-Cooper-Jacob method (Halford and Kuniansky, 2002). The portion of the plot corresponding to later time where u’ < 0.01 is indicated to the left on the t/t’ axis, and this slope is used to determine transmissivity of 140 ft2/d (Table 5.3). A definite change in slope indicating a late time leakage/recharge boundary is not apparent at the pumping well, but the late-time data has a slight upward concavity indicating reduction in the rate of drawdown.
The results of Theis recovery analyses for all wells are summarized in Table 5.3, together the u’ criteria on which each transmissivity determination is based. Analyses with u’ > 0.01 are tabulated but are not considered acceptable, as indicated in the table.
5.4.4 Distance-Drawdown Analysis Figure 5.8 is distance-drawdown analysis plot that determines transmissivity, storativity, and pumping well efficiency by considering all observation wells at once. As shown on Figure 5.8,
DV102.00279.01 5-5 November 2008 Dewey-Burdock 2008 Pump Test Report Rev 0.doc
fitting a straight line to incorporate the close-in observation wells 11-14C and 11-15 simultaneously is not ideal because it averages the clearly anisotropic response between the close-in wells. On the other hand, convention (Driscoll, 1986 and numerous other references) dictates that a distance-drawdown analysis should be based on a minimum of three observation wells. It is noted that if a two-well solution is used ignoring the anisotropic response at well 11-14C, transmissivity is 108 ft2/day and storativity is 2.8 x 10⁻⁵. Nevertheless, the three-well solution with greater transmissivity and storativity is accepted as indicated on the figure and in Table 5.3.
The pumping well efficiency of 61 to 63 percent is determined with the three-well distance-drawdown solution by extending the straight line to the assumed diameters of the pumping well. These efficiencies agree with the 65 percent determined in the USGS spreadsheet (Table 5.3). The aquifer parameters are somewhat questionable given the relatively poor (r2 = 0.7) straight-line fit through all data points. Based on the large u criterion (0.08) at one of the wells (11-15), the transmissivity and storativity values obtained are not included in the overall average aquifer parameters for the test (Table 5.3).
The distance-drawdown analysis also gives the maximum radius of influence of the test. Based on Figure 5.8, the radius of influence was about 2,100 ft, somewhat greater than the radial distance to the most distant responding well (i.e., 11-2 at 1,292 ft). The radius of influence may be compared to the dimensions of prospective well fields in the area to evaluate whether aquifer parameters have been adequately characterized.
5.4.5 Summary of Burdock Test – Lower Lakota (Chilson) Formation Aquifer Parameters The aquifer parameters determined by the techniques described above are summarized in Table 5.3. Nine accepted determinations of transmissivity (outlined) range from 120 to 223 ft2/day and the mean and median are close at 150 and 158 ft2/day. Four accepted storativity determinations ranged from 6.8 x 10⁻⁵ to 1.9 x 10⁻⁴. The geometric mean and median storativity values are 1.1 x 10⁻⁴ and 1.2 x 10⁻⁴. The median transmissivity of 150 ft2/day and median storativity of 1.2 x 10⁻⁴ are considered the best measures of the central tendency of the test results.
Only two wells were used to contribute to the overall storativity results because of the large anisotropy in responses exhibited between wells 11-15 and 11-14C and the anomalous results at
DV102.00279.01 5-6 November 2008 Dewey-Burdock 2008 Pump Test Report Rev 0.doc
11-15 described above. Powertech geologists have noted that there were problems with the installation of well 11-15.
5.5 Overlying Fall River Aquifer Test Results Observation well 11-17 is screened in the lower Fall River 50 ft laterally and about 185 ft vertically above the screen in pumping well 11-11C (Table 5.2, Drawing 5.3). Piezometric surface information for the Lakota aquifer indicates the two wells are locally hydraulically connected with similar water levels within ± 2 ft (Table 5.2).
Figure 5.3 illustrates response of observation well 11-17 to the drawdown phase of the Burdock well 11-11C pumping in the Lakota Formation. The first response was a very slight increase in pressure over a period of about 600 minutes, corresponding to a water level increase of about 0.12 ft (3.5 centimeter [cm]). The water level stopped increasing then underwent 1.1 ft of drawdown to time of pump shut-down (2:00 PM) on May 21, 2008. Drawdown continued for about a day to a maximum of 1.4 ft, then remained flat with erratic fluctuations for another 24 hours, until the evening of May 23, 2008 where a partial and sharply “spiked” recovery started.
The response of a “reverse” drawdown monitored in a zone above (or below) the pumping zone is known as the Noordbergum effect (Ohio EPA, 2006). There is uncertainty whether the water level increase at Burdock well 11-17 is the Noordbergum effect or alternatively a barometric response. In any case, the Noordbergum effect was observed in the 1979 TVA Lakota aquifer pumping test at Burdock pumping at 200 gpm where increases in water levels were monitored in the Fall River aquifer and Fuson Member observation wells for 30 to 90 minutes after the start of the test. Judging from the water level plot figures (Boggs and Jenkins, 1980), the increases were a fraction of a ft in the Fall River and up to about 1.5 ft in the Fuson.
In a 1985 pumping test in the Eastern Black Hills near Wall, South Dakota, pumping at 125 gpm, a water level rise of about 1.7 ft just after pumping started, eventually declining in an “erratic manner”, was attributed to the Noordbergum effect (Rahn, 1992). There the well (Kelly Well) with the anomalous response was open to an unknown portion of the Inyan Kara aquifer; however it was considered to be somewhat hydraulically isolated from the pumping and other observation wells based on differing background water levels.
The fact that substantial Noordbergum effects were observed in pumping tests in the Fuson/Fall River and Inyan Kara (undifferentiated) monitoring wells at widely spaced locations in the Black
DV102.00279.01 5-7 November 2008 Dewey-Burdock 2008 Pump Test Report Rev 0.doc
Hills uplift (i.e., the TVA and Wall tests) suggests the effect is a characteristic of the Inyan Kara Group. A small magnitude Noordbergum effect response observed in the 2008 test at Burdock is attributable to the much lower pumping rate and relatively short, 10-ft screened intervals of both pumping and observation wells. The Noordbergum effect of a 10 cm rise in water levels has been simulated with numerical models by the USGS (Hsieh, 1997), where three-dimensional deformation caused by groundwater withdrawal from a confined aquifer can induce positive hydraulic head changes in adjacent aquitards (and presumably in an aquifer overlying an aquitard).
An alternative explanation for the slight rise in water level in the Fall River (Burdock 11-17) is found in similar patterns of water level changes seen in the Unkpapa Formation (Burdock 11-18), underlying the Lakota Formation, at about the same time and magnitude. This will be described further in Section 5.6 below.
Referring again to Figure 5.3, an explanation for the drawdown in the Fall River aquifer at Burdock continuing for about a day past the pump shut-down and then stabilizing for another day is not apparent. It is most similar to the 1.5 days of extended drawdown and poor recovery observed at well 29-7 at the Dewey pumping test. These anomalous responses are attributed to the observation wells having been located away from the sandstone layer with the pumping well; it is possible the observation wells are monitoring localized effects in sedimentary facies separated from the pumping well by numerous shale layers,
5.6 Underlying Unkpapa Aquifer Test Results As discussed in Section 3, observation well 11-18 is screened in the Unkpapa aquifer 35 ft laterally and 195 ft vertically below the screen in pumping well 11-11C (Table 5.1). Piezometric surface information for the Unkpapa and Lakota aquifers indicate the two wells are locally hydraulically isolated, with a nearly 70 ft head difference directed vertically upward (Table 5.1).
Figure 5.4 illustrates that there was no response of observation well 11-18 to the drawdown or recovery phases at the pumping well 11-11C. However, comparison with the Fall River observation well (Burdock 11-17, Figure 5.3) finds a similar pattern, timing and magnitude of several water level changes. In addition to the early time rise in water levels (i.e. possible Noordbergum effect described above) starting at about 2:00 PM on 5/18/08 (i.e., the time of pump shut-down and start of recovery), there are the following similarities:
• the erratic transducer readings starting at about 3:00 PM on 5/22/08
DV102.00279.01 5-8 November 2008 Dewey-Burdock 2008 Pump Test Report Rev 0.doc

DV102.00279.01 5-9 November 2008 Dewey-Burdock 2008 Pump Test Report Rev 0.doc
• the upward spike in transducer readings at about 7:00 PM on 5/23/08
The barometer readings for the site (Figure 3.1) were examined in detail, and there is a possible correlation with barometric fluctuations where the water level increases start at the times of temporary declines (troughs) in barometric pressure throughout an overall period of increasing atmospheric pressure (i.e., going forward in time from the start of Burdock Recovery on Figure 3.1). However, throughout several days there were equally large fluctuations in barometric pressure with no similar corresponding changes in water levels.
An explanation for the water level variations simultaneously in both wells is that the Unkpapa monitoring well 11-18 (Figure 5.4) records a barometric and tidal response while the Fall River monitoring well 11-17 (Figure 5.3) records a combination of both drawdown (without recovery) and barometric response. As noted above, the existence of the Noordbergum effect at the Fall River monitoring well is possible but uncertain.
6.0 Laboratory Core Data 6.1 Background Selected core samples were sent to Core Laboratories by Powertech (Personal Communication, Frank Lichnovsky, February 1, 2008) for measurement of intrinsic permeability to assess the differences in the less permeable Skull Creek shale, Fuson shale, Morrison shale, and interbed units of the Dewey (Fall River) and Burdock (Lakota) sandstone units. The intrinsic permeability data were converted to hydraulic conductivity values as shown in Table 6.1.
6.2 Conversion from Intrinsic Permeability to Hydraulic Conductivity Intrinsic permeability is a property of the core material (rock) only and does not include any fluid properties. The core intrinsic permeability was measured by moving air through the core under confining pressure in the laboratory which resulted in the measurement of both porosity (from the bulk density and particle density of the core) and intrinsic permeability in milliDarcys (mD) as shown in Table 6.1. The footnotes at the bottom of Table 6.1 show the constants assumed for the conversion from intrinsic permeability to hydraulic conductivity at the prevailing temperatures of the laboratory, assumed to be 70 oF, and the site groundwater (average of 52.8 oF from field measurements by RESPEC (Personal Communication, Crystal M. Hocking, February 4, 2008).
It is well known that the units of intrinsic permeability can be changed from mD to cm2 by using equations shown in Table 6.1. The intrinsic permeability is multiplied by the fluid properties of water density times the gravitational constant divided by the dynamic viscosity (both temperature dependent) of the site groundwater to obtain the hydraulic conductivity.
Analyses of core data in Table 6.1 indicate that the horizontal hydraulic conductivity of the Skull Creek shale is approximately 6.0 x 10⁻⁸ centimeters per second (cm/s). The horizontal hydraulic conductivity of the Fuson Shale ranges from 8.0 x 10⁻⁷ to 3.2 x 10⁻⁸ cm/s, and for the Morrison between 7.7 x 10⁻⁷ and 3.1 x 10⁻⁹ cm/s. Vertical hydraulic conductivities of the Skull Creek and Morrison shales, and the Fuson shale from the Dewey project area, are typically one-tenth to one-twentieth the horizontal values. In terms of ft per day (ft/day) vertical hydraulic conductivities for all the above shale units range from about 2 to 6 x 10⁻⁵ ft/day.
The average vertical hydraulic conductivity for the two core samples from the Fuson shale from the Burdock project area is considerably more permeable (9.8 x 10⁻⁸ cm/sec), at roughly 25 percent the horizontal value. In terms of ft/day, vertical hydraulic conductivities for the
DV102.00279.01 6-1 November 2008 Dewey-Burdock 2008 Pump Test Report Rev 0.doc

Burdock Fuson shale units are about 3 x 10⁻⁴ ft/day, about one order of magnitude less than the Fuson shale sample at the Dewey project area (2 x 10⁻⁵ ft/day) and also all the Skull Creek and Morrison shale samples.
In contrast, the core units of the Burdock Lakota sandstone unit have an average horizontal hydraulic conductivity of 2.6 x 10⁻³ cm/s (7.4 ft/day), ranging from 2.1 x 10⁻³ to 3.2 x 10⁻³ cm/s. Core from the Dewey Fall River sandstone unit has a horizontal hydraulic conductivity of 2.2 x 10⁻³ cm/s (6.1 ft/day). The ratio of horizontal to vertical hydraulic conductivity (Kh:Kv) for the Burdock sandstone units is 2.4:1, and for the Dewey sandstone unit it is 4.5:1, based on the core data shown in Table 6.1.
6.3 Interpretations of the Laboratory Core Data Comparison of horizontal hydraulic conductivity of the Dewey and Burdock sandstone samples in Table 6.1 with the conductivity calculated from pumping test transmissivity (Tables 4.3 and 5.3) can be made as follows:
• Dewey Transmissivity 255 ft2/d divided by 15 ft screen length = 17 ft/day
• Dewey Transmissivity 255 ft2/d divided by 165 ft formation thickness = 1.5 ft/day
• Burdock Transmissivity 150 ft2/d divided by 10 ft screen length = 15.0 ft/day
• Burdock Transmissivity 150 ft2/d divided by 170 ft formation thickness = 0.9 ft/day
The most commonly used procedure when converting test results is to use the screen length of the pumping well as the divisor. The above analysis indicates that the pumping test data may be interpreted to yield up to two to three times greater higher hydraulic conductivity than core data.
However, the above analysis also indicates that the hydraulic conductivities calculated from the pumping test transmissivities and the overall formation thicknesses bracket the core data at the lower end of ranges in hydraulic conductivity, with the core falling in the middle of the range. The core data can be considered to be generally consistent with, and therefore independently confirming, the pumping test results. Generally, the above ranges in calculated hydraulic conductivity also indicate order-of-magnitude uncertainty (generally, about one to 17 ft/day),
Powertech reports that the laboratory would not take samples containing uranium, so sandstone core samples from outside of the ore zone were submitted. The electric logs and boring lithologic logs indicate that the core samples were taken from sandstone layers which may have
DV102.00279.01 6-2 November 2008 Dewey-Burdock 2008 Pump Test Report Rev 0.doc
DV102.00279.01 6-3 November 2008 Dewey-Burdock 2008 Pump Test Report Rev 0.doc
had slightly different, possibly less permeable, ideologies than the screened intervals used for the pumping tests in the ore zones.
6.4 Conclusions The first conclusion from the core analyses is that the major shale aquitards (Fuson, Skull Creek, Morrison formations) have hydraulic conductivities several orders of magnitude lower than hydraulic conductivities of either the Fall River or Lakota sandstone units. Using the vertical hydraulic conductivities as a measure of degree of confinement, at the Burdock project area Table 6.1 indicates that the shales in the Fuson overlying the Lakota formation (Kh = 7.4 ft/day) have an average vertical permeability of about 2.7 x 10⁻⁴ ft/day and the underlying Morrison formation 6.0 x 10⁻⁵ ft/day. At the Dewey project area, shales in the Fuson formation underlying the Fall River formation (Kh = 6.6 ft/day) have an average vertical permeability of 1.8 x 10⁻⁵ ft/day, and shale in the single sample of overlying Skull Creek shale has a vertical permeability of 1.5 x 10⁻⁵ ft/day.
The second conclusion is that core data from the sandstones are within the range of hydraulic conductivities determinable from test transmissivities, specifically 1.5 to 17 ft/day at the Dewey project area and 0.9 to 15 ft/day at the Burdock project area. This is also an appropriate range of uncertainty for converting the test results to hydraulic conductivity. Using the usual procedure for determining hydraulic conductivity from pumping test transmissivity, the sandstone core results may have two to three times smaller hydraulic conductivities than those estimated from the pumping tests, perhaps due to slightly different lithologies between the core and screened intervals. Overall, there is reasonable agreement between the laboratory and field hydraulic tests considering typically order-of-magnitude differences in hydraulic conductivity determinations.
7.0 Summary and Conclusions The following sections first summarize new facts about the Dewey and Burdock project areas based on the 2008 tests and related information. A discussion of the results in comparison to the 1979 to 1982 TVA pumping tests follows. The Burdock site is discussed first because comparison with the TVA tests is most straightforward.
7.1 Burdock Project Area 7.1.1 Summary A summary of aquifer parameters for the 2008 Burdock pumping test and related laboratory core testing is as follows:
• Nine determinations of transmissivity (Table 5.3) ranged from 120 to 223 ft2/day with the median value of 150 ft2/day.
• Four storativity determinations (Table 5.3) ranged from 6.8 x 10⁻⁵ to 1.9 x 10⁻⁴ with the median value of 1.2 x 10⁻⁴.
• The radius of influence of the pumping test determined by a distance-drawdown plot was 2,100 ft (Section 5.3.3).
• The pumping well in the lower Lakota formation was determined to be moderately efficient: 80 to 83 percent by the empirical distance-drawdown method and 65 percent the USGS (Halford and Kuniansky, 2002) theoretical method.
• Laboratory measurements of horizontal and vertical hydraulic conductivity (Table 6.1) were made on sandstone layers similar to that tested in the pumping test; measured horizontal hydraulic conductivity ranged from 5.9 to 9.1 ft/day, the mean value was 7.4 ft/day and the mean ratio of horizontal to vertical hydraulic conductivity in Burdock area sandstone was 2.47:1
• Laboratory measurements of horizontal and vertical hydraulic conductivity (Table 6.1) were made on shale layers from the two major confining units for the Lakota formation in the pumping test area with the following results:
– Fuson Shale: the laboratory core data indicate vertical permeabilities of about 2 x 10⁻⁷ to 1 x 10⁻⁸ cm/sec (average 2.7 x 10⁻⁴ ft/day) for shale samples from within the Fuson member overlying the Lakota formation.
– Morrison Shale: the laboratory core data for the shales in the underlying Morrison formation indicate vertical permeabilities of 9 x 10⁻⁹ to 3 x 10⁻⁸ cm/sec (average 6.0 x 10⁻⁵ ft/day).
DV102.00279.01 7-1 November 2008 Dewey-Burdock 2008 Pump Test Report Rev 0.doc

• The range of hydraulic conductivities determinable from test transmissivities (Section 6.3) was 0.9 to 15.0 ft/day, which is considered an appropriate range that is also verified by the sandstone core sample results falling in the middle of the range; it is noted that the lower end of the hydraulic conductivity range is probably appropriate for use with the entire formation thickness (shale layers included) and the upper end represents the most permeable sandstone layers such as the ore zone areas tested in the pumping test.
7.1.2 Conclusions The Burdock pumping test in 2008 may be directly compared to the 1979 TVA test for the Lakota (Chilson) aquifer as the tests were nearly at the same location (Figure 1.1). The average transmissivity and storativity values determined from the TVA tests were 190 ft2/d and 1.8 x 10⁻⁴
(Section 2.3, see p. 17 in Boggs and Jenkins, 1980). Comparing median transmissivity of 150 ft2/d and storativity of 1.2 x 10⁻⁴determined in the 2008 test (Section 5.4.4) to the TVA test, the new aquifer parameters for the lower Lakota are respectively about 80 and 70 percent of the 1979 results. Because transmissivity and storativity depend on aquifer thickness, comparing the results suggests that there may be some scaling effect between the tests due to the differing lengths of screened intervals.
Therefore, the 1979 TVA test is transmissivity of 190 ft2/d is considered representative of the entire Lakota aquifer for a regional application, such as groundwater flow model where an average hydraulic conductivity of about 1 ft/day over a thickness of 170 ft could be specified. The 2008 test provides specific data at the operational-scale of a prospective ISR well field where local hydraulic conductivities of up to 15 ft/day could be specified for the most permeable ore zones horizons.
Within the Lakota formation, vertical communication throughout the entire formation is indicated by the delayed response at the upper Lakota observation well (11-19). The 160-minute delay in response at the upper Lakota observation well 11-19 is attributed to lateral and vertical anisotropy due to the shale interbeds seen on the conceptual stratigraphic cross-sections for the pumping test site (Drawings 5.1, 5.2 and 5.3). The extent and continuity of the shale interbeds are unknown. Whether the shale interbeds in the Lakota aquifer are sufficiently thick and continuous to serve as vertical confinement for ISR operations will probably need to be evaluated by analyzing cores from borings as well fields are drilled.
The 2008 test indicates that the lower and upper portions of the Lakota formation behave as a single, confined, leaky aquifer. Confinement and leakage from the overlying Fuson member is
DV102.00279.01 7-2 November 2008 Dewey-Burdock 2008 Pump Test Report Rev 0.doc
evident in the matches to the Hantush-Jacob type curves seen most clearly at observation wells 11-14C and 11-2. These results are more definitive than the 1979 TVA test where confined, leaky behavior for the Lakota was predicted but not demonstrated with curve match results. Hydraulic communication through the Fuson member between the Lakota and Fall River aquifers is evidenced by the drawdown at the Fall River observation well 11-17, indicating that leakage was established through underlying the Fuson formation.
The laboratory core data indicate an average vertical permeability of 9.3 x 10⁻⁸ (2.7 x 10⁻⁴ ft/day) for shale samples from within the Fuson member. The shale core permeability values are about one to two orders of magnitude less permeable than pumping test values determined in the 1979 TVA test at Burdock, where the vertical hydraulic conductivity of the Fuson aquitard was calculated using the Neuman-Witherspoon ratio method to be about 10-3 ft/day (see page i in Boggs and Jenkins, 1980).
As described in Section 5.1, the potentiometric surface in the Fall River aquifer is close to that in the Lakota aquifer at the Burdock pumping test site, indicating some local connection between the two formations through the intervening Fuson member. In other locations in the Inyan Kara, the Fuson member is known to have sandstone layers that are downcut into the Lakota member (Gott et al., 1974). Therefore, determining the degree of vertical confinement for ISR operations by the Fuson will probably need to be evaluated by analyzing cores from borings as well fields are drilled, and with well field-scale pumping tests that are proposed to be conducted prior to startup of each particular mine unit.
The aquifer tests in 1979 and 2008 indicate that the Lakota Formation is a confined aquifer with a leaky confining layer, which is demonstrably the Fuson member. The laboratory core data for the shales in the underlying Morrison formation indicate an average vertical permeability of 2.1 x 10⁻⁸ cm/sec (6 x 10⁻⁵ ft/day). Together with the pumping test data, the core data indicate that the underlying Morrison formation and overlying Fuson member can serve as aquitards for ISR operations.
For the Lakota sandstone, the laboratory core data indicate an average horizontal hydraulic conductivity of 7 ft/day, and as high as 9.1 ft/day. Interpretation of the test results calculates that horizontal permeability may be as great as 15 ft/day throughout one of the ore zones. Within the lower Lakota formation, the test results indicate transmissive response between pumping and observation wells up to 250 ft apart with 17 ft of drawdown. Response was nearly 3 ft of
DV102.00279.01 7-3 November 2008 Dewey-Burdock 2008 Pump Test Report Rev 0.doc
drawdown at 1,290 ft distance. This indicates the aquifer was stressed to produce good quality analytical results.
7.2 Dewey Project Area 7.2.1 Summary A summary of aquifer parameters for the 2008 Dewey pumping test and related laboratory core testing is as follows:
• Ten determinations of transmissivity (Table 4.3) ranged from 180 to 330 ft2/day with the median value of 255 ft2/day.
• Five storativity determinations (Table 4.3) ranged from 2.3 x 10⁻⁵ to 2.0 x 10⁻⁴ with the median value of 4.6 x 10⁻⁵.
• The radius of influence of the pumping test determined by a distance-drawdown plot was 5,700 ft (Section 4.4.3).
• The pumping well in the Fall River formation was determined to be highly efficient: 93 to 95 percent by the empirical distance-drawdown method and 81 percent the USGS (Halford and Kuniansky, 2002) theoretical method.
• Laboratory measurements of horizontal and vertical hydraulic conductivity (Table 6.1) were made in a core sample from the sandstone layer similar to that tested in the pumping test; measured horizontal hydraulic conductivity was 6.1 ft/day, and the ratio of horizontal to vertical hydraulic conductivity was 4.5:1.
• Laboratory measurements of horizontal and vertical hydraulic conductivity (Table 6.1) were made on shale samples from the two major confining units overlying and underlying the pumping test area with the following results:
– Skull Creek shale: laboratory core data for the shale sample from the overlying Skull Creek formation indicate a vertical permeability of 5.4 x 10⁻⁹ cm/sec (1.5 x 10⁻⁵ ft/day).
– Fuson Formation: laboratory core data for the shale sample from the underlying Fuson formation indicate a vertical permeability of 6.2 x 10⁻⁹ cm/sec (1.8 x 10⁻⁵ ft/day).
7.2.2 Conclusions The Dewey pumping test in 2008 in the Fall River aquifer is not directly comparable to the 1982 TVA test because the underlying Lakota aquifer was tested in 1982. As demonstrated above for the Lakota aquifer (Section 7.1), a scaling effect may be assumed between total formation transmissivity and storativity (i.e., regional-scale) and the 2008 operational-scale test.
DV102.00279.01 7-4 November 2008 Dewey-Burdock 2008 Pump Test Report Rev 0.doc
However, there are several lines of evidence that the 2008 test transmissivity and storativity results are representative of the entire Fall River aquifer at the Dewey test site, as follows:
1. Thickness of the sandstone layer screened by the pumping well is about one-half the total formation thickness as shown in Drawings 4.1 and 4.2.
2. Response at the stock tank well (GW-49 at 1,400 ft distance) was within the acceptable range for a confined aquifer; this is interpreted to indicate that the effects of partial penetration (due to elevation differences between the pumping well screen and the observation well open to the upper half of the aquifer) were diminished at the 1,400 ft distance and 40 minute response time.
3. The delay in response at the upper Fall River observation well 32-9C was a relatively brief 11 minutes (Table 4.2), compared to 160 minutes in the Burdock test; together with (2) above, these responses suggest that the vertical anisotropy due to shale interbeds overlying the lower sandstone layer does not extend laterally for more than about 1,400 ft.
The 2008 test indicates that the lower and upper sandstone portions of the Fall River formation behave as a single, confined, aquifer with some form of lateral barrier due changing lithology, such as a channel boundary. The TVA test in 1982 observed a barrier boundary in the underlying Lakota formation which was attributed to either a change in lithology or the Dewey Fault zone. Apparently, both the Lakota and Fall River formations in the general Dewey project area are highly transmissive and show barrier boundaries. These test results are more definitive than the 1982 TVA test concerning the proximity of the barrier boundary, because the 2008 radius of influence was about one mile compared to greater than two to three miles distance to the fault zone.
Vertical communication throughout the entire Fall River formation is indicated by the delayed response at the upper Fall River observation well (32-9C). Within the Fall River formation, the 11-minute delay in response at the upper observation well is attributed to lateral and vertical anisotropy due to the shale interbeds seen on the conceptual stratigraphic cross-sections for the pumping test site (Drawings 4.1 and 4.2). The extent and continuity of the shale interbeds are not known. Whether the shale interbeds in the Fall River aquifer are sufficiently thick and continuous to serve as vertical confinement for ISR operations will need to be evaluated by analyzing cores from borings as well fields are drilled.
DV102.00279.01 7-5 November 2008 Dewey-Burdock 2008 Pump Test Report Rev 0.doc
DV102.00279.01 7-6 November 2008 Dewey-Burdock 2008 Pump Test Report Rev 0.doc
Leakage from a confining layer, presumably the Fuson member, was observed in the 1982 TVA test of the Lakota formation. However, the leakage was observed only relatively late in the TVA tests, at 3,000 to 10,000 minutes, with a much greater pumping rate (495 gpm) and radius of influence. The large-scale vertical hydraulic conductivity value of 2 x 10⁻⁴ ft/day (7.1 x 10⁻⁸ cm/sec) determined in the 1982 TVA regional test at Dewey using the Neuman-Witherspoon ratio method is sufficiently impermeable to be considered an aquitard or aquiclude.
Hydraulic communication through the Fuson member between the Fall River and underlying Lakota aquifers is not indicated by the 2008 response at observation well 32-10. The 2008 test demonstrates that vertical leakage through the Fuson may not occur over a mile-wide radius. As described in Section 4.1, the Lakota and Fall River aquifers at the Dewey test site appear to be locally hydraulically isolated by the intervening Fuson member with nearly 40 ft head difference. The laboratory core data indicate a very low vertical permeability of 6.2 x 10⁻⁹ cm/sec (1.8 x 10⁻⁵ ft/day) for the shale sample from within the Fuson shale member.
The laboratory core data for the shale sample from the Skull Creek formation, overlying the Fall River formation, indicate a very low vertical permeability of 5.4 x 10⁻⁹ cm/sec (1.5 x 10⁻⁵ ft/day), also appropriate for an aquitard or aquiclude.
For the Fall River sandstone, the laboratory core data indicate a horizontal hydraulic conductivity of 6.1 ft/day, and interpretation of the test results calculates that horizontal permeability may be as great as 17 ft/day throughout one of the ore zones. Within the lower Fall River formation, the test results indicate transmissive, rapid response (two to three minutes) between pumping and observation wells up to 467 ft apart with nearly 10 ft of drawdown. Response was nearly 9 ft of drawdown at 1,400 ft distance. This indicates the aquifer was stressed to produce good quality analytical results.

9.0 References
Boggs, J. M., 1983. “Hydrogeologic Investigations at Proposed Uranium Mine Near Dewey, South Dakota,” Report No. WR28-2-520-109, Norris, Tennessee, October.
Boggs, J. M., and A. M. Jenkins, 1980. “Analysis of Aquifer Tests Conducted at the Proposed Burdock Uranium Mine Site: Burdock, South Dakota,” Report No. WR28-1-520-109, Norris, Tennessee, May.
Driscoll, F. M., 1986. “Groundwater and Wells”, Johnson Filtration Systems, Inc., St. Paul, MN, 1089 pp.
Environmental Simulations, Inc. (ESI), 2003. Software Manual for Aquifer-Win32TM Reinholds, PA. www.groundwatermodels.com
Freeze, R.A. and Cherry, J.A., 1979. Groundwater. Prentice-Hall, Inc., New Jersey, 604 p.
Gontheir, G.J, 2007. “A Graphical Method for Estimation of Barometric Efficiency from Continuous Data – Concepts and Application to a Site in the Piedmont Air Force Plant 6, Marietta, Georgia.” ” U.S. Geological Survey Scientific Investigations Report 2007-5111.
Gott, B.B., Wollcott, D.E., and C. G.Bowles, 1974. “Stratigraphy of the Inyan Kara Group and Localization of Uranium Deposits, Southern Black Hills, South Dakota and Wyoming,” U.S. Geological Survey Professional Paper 763.
Halford, K.J., 2006, “Documentation of a Spreadsheet for Time-Series Analysis and Drawdown Estimation” U.S. Geological Survey Scientific Investigations Report 2006-5024.
Halford, K.J. and E.L. Kuniansky, 2002, “Documentation of Spreadsheets for the Analysis of Aquifer-Test and Slug-Test Data,” U.S. Geological Survey Open File Report 02-197.
Hantush, M.S. and C.E. Jacob, 1955, Non-steady radial flow in an infinite leaky aquifer, Am. Geophys. Union Trans., v. 36, no. 1, p. 95-100.
Hsieh, P. E, 1997. “Poroelasticity Simulation of Ground-water Flow and Subsurface Deformation” U.S. Geological Survey Open File Report 97-47. p 5-9
Keene, J.R., 1973 “Ground-water Resopurces of the Western Half of Fall River County, S.D., Dept. of Natural Resource Development, Geological Survey, Report of Investigations 109.
Knight Piésold, 2008. Pump Test Work Plan, Dewey-Burdock In Situ Uranium Project, April 25.
Kruseman, G. P. and N. A. de Ridder, 1990. “Analysis and Evaluation of Pumping Test Data,” Second Edition International Institute for Land Reclamation and Improvement (ILRI), Publication 47, Wageningen, The Netherlands.
DV102.00279.01 9-1 November 2008 Dewey-Burdock 2008 Pump Test Report Rev 0.doc
DV102.00279.01 9-2 November 2008 Dewey-Burdock 2008 Pump Test Report Rev 0.doc
Neuman, S.P and Witherspoon, P.A., 1973. “Field Determination of the Hydraulic Properties of Leaky Multiple Aquifer Systems”. Water Resources Research, 8. p.1284-1298.
Ohio Environmental Protection Agency, 2006. Technical Guidance for Ground Water Investigations, accessed October 5, 2007, from the
Sandia Corporation, 2005. User Manual for BETCO Version 1.00, October.
Rahn, P., 1992. “Aquifer Hydraulics in a Deep Confined Cretaceous Aquifer at Wall, South Dakota”. Association of Engineering Geologists, Proceedings, October 2 – 9, 1992, Los Angeles, CA, p. 409-418.
Toll, N.J. and Rasmussen, T.C., 2007. Removal of Barometric Pressure Effects and Earth Tides from Observed Water Levels., Ground Water, 45, p. 101-105.

Tables

Table 4.1Powertech (USA) Inc.
Dewey-Burdock Project2008 Pumping Tests: Results and Analysis
Dewey Pumping Test Completion InformationWell ID and
Stratigraphic Interval
Well Type Location Radial Distance from pumping Well
(ft)
Depth to top of Screen
(ft bgs)
Depth to bottom of Screen
(ft bgs)
Note
Ore Zone (lower Fall River Sandstone)
DB 07-32-3C Pumping Well NWQ Sec. 32 0 585 600DB 07-32-05 Obs. Well #1 NWQ Sec. 32 265 593 608DB 07-32-4C Obs. Well #2 NWQ Sec. 32 467 580 595DB 07-29-7 Obs. Well #3 SEQ Sec. 29 2,400 635 650
Upper Fall River Sandstone
DB 08-32-9C Obs. Well NWQ Sec. 32 41 490 505
Lakota Sandstone Layer
DB 08-32-10 Obs. Well NWQ Sec. 32 61 715 730
Unkpapa Formation
DB 07-32-11 Obs Well NWQ Sec. 32 50 910 930
Additional Wells GW-49 Upper Fall River 70 ft NEQ Sec. 29 1,433 475 540 Stock Well
Notes: Screen completion information from diagrams prepared by Powertech, Appendix B Radial distance information provided by Powertech.
DV102.00279.01Table 4_1.xls
1 of 1 November 2008
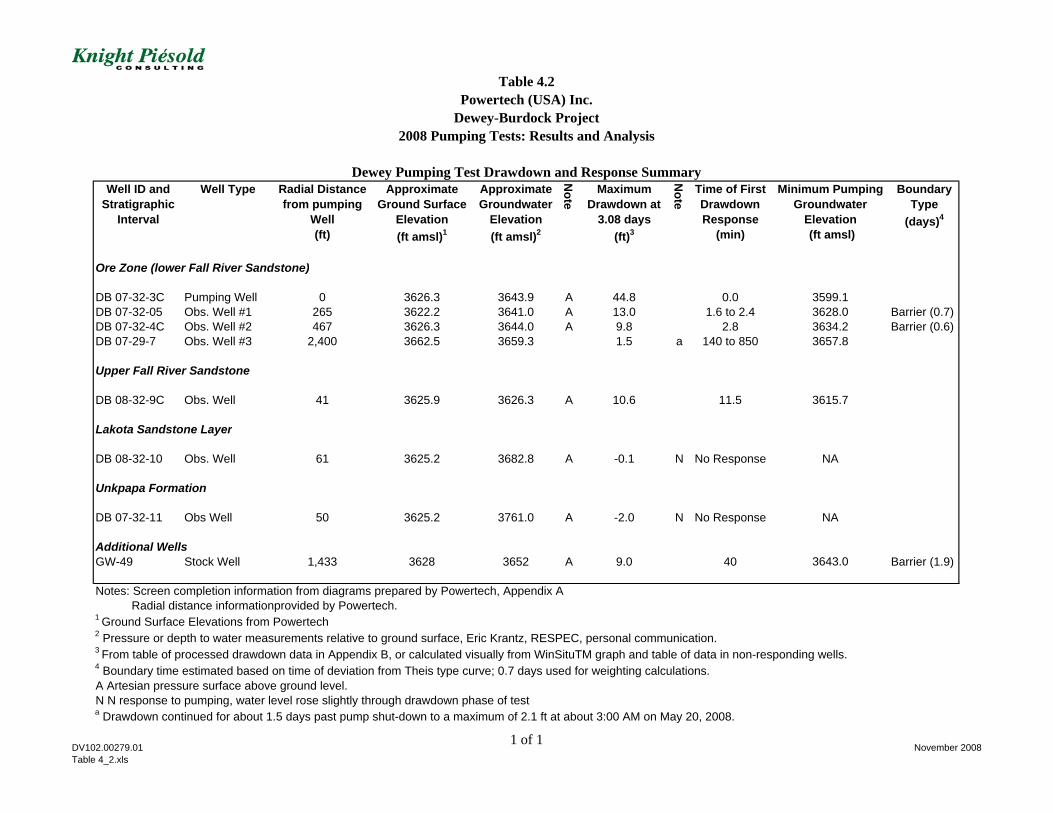
Table 4.2Powertech (USA) Inc.
Dewey-Burdock Project2008 Pumping Tests: Results and Analysis
Dewey Pumping Test Drawdown and Response SummaryWell ID and
Stratigraphic Interval
Well Type Radial Distance from pumping
Well (ft)
Approximate Ground Surface
Elevation (ft amsl)1
Approximate Groundwater
Elevation (ft amsl)2
Note
Maximum Drawdown at
3.08 days (ft)3
Note
Time of First Drawdown Response
(min)
Minimum Pumping Groundwater
Elevation (ft amsl)
BoundaryType
(days)4
Ore Zone (lower Fall River Sandstone)
DB 07-32-3C Pumping Well 0 3626.3 3643.9 A 44.8 0.0 3599.1DB 07-32-05 Obs. Well #1 265 3622.2 3641.0 A 13.0 1.6 to 2.4 3628.0 Barrier (0.7)DB 07-32-4C Obs. Well #2 467 3626.3 3644.0 A 9.8 2.8 3634.2 Barrier (0.6)DB 07-29-7 Obs. Well #3 2,400 3662.5 3659.3 1.5 a 140 to 850 3657.8
Upper Fall River Sandstone
DB 08-32-9C Obs. Well 41 3625.9 3626.3 A 10.6 11.5 3615.7
Lakota Sandstone Layer
DB 08-32-10 Obs. Well 61 3625.2 3682.8 A -0.1 N No Response NA
Unkpapa Formation
DB 07-32-11 Obs Well 50 3625.2 3761.0 A -2.0 N No Response NA
Additional Wells GW-49 Stock Well 1,433 3628 3652 A 9.0 40 3643.0 Barrier (1.9) Notes: Screen completion information from diagrams prepared by Powertech, Appendix A Radial distance informationprovided by Powertech.1 Ground Surface Elevations from Powertech 2 Pressure or depth to water measurements relative to ground surface, Eric Krantz, RESPEC, personal communication.3 From table of processed drawdown data in Appendix B, or calculated visually from WinSituTM graph and table of data in non-responding wells.4 Boundary time estimated based on time of deviation from Theis type curve; 0.7 days used for weighting calculations. A Artesian pressure surface above ground level.N N response to pumping, water level rose slightly through drawdown phase of testa Drawdown continued for about 1.5 days past pump shut-down to a maximum of 2.1 ft at about 3:00 AM on May 20, 2008.
DV102.00279.01Table 4_2.xls
1 of 1November 2008
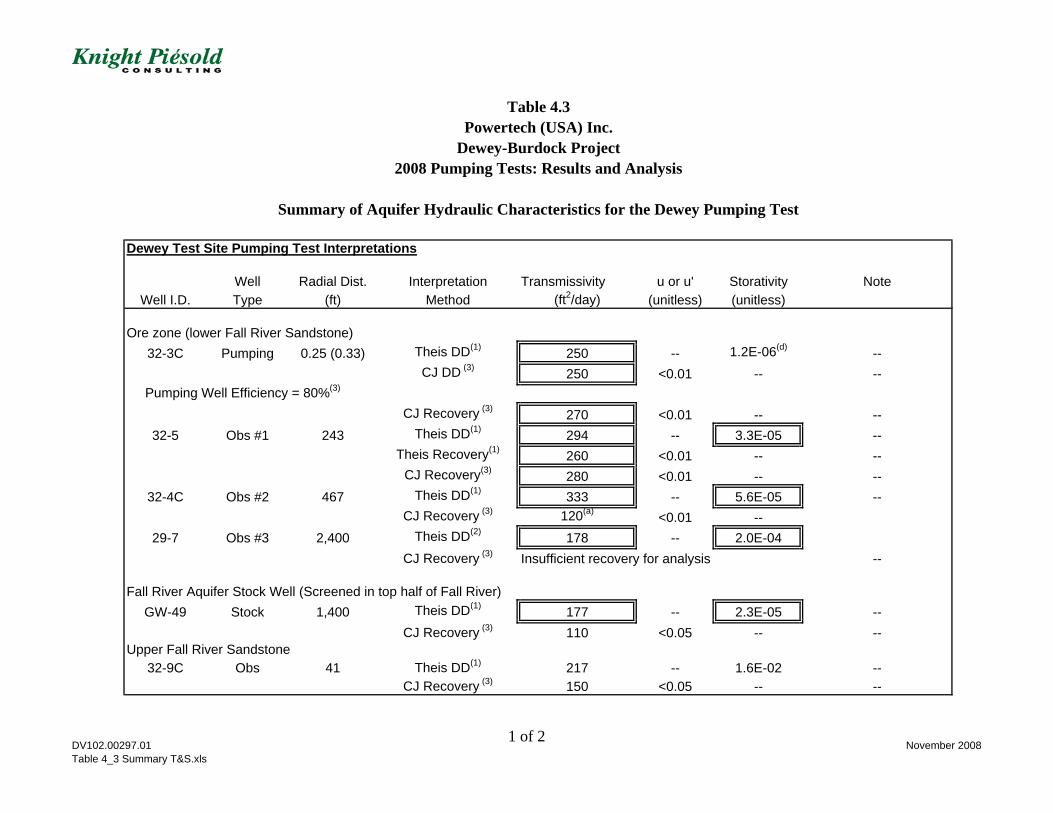
Dewey Test Site Pumping Test Interpretations
Well Radial Dist. Interpretation Transmissivity u or u' Storativity NoteWell I.D. Type (ft) Method (ft2/day) (unitless) (unitless)
Ore zone (lower Fall River Sandstone)32-3C Pumping 0.25 (0.33) Theis DD(1) 250 -- 1.2E-06(d) --
CJ DD (3) 250 <0.01 -- -- Pumping Well Efficiency = 80%(3)
CJ Recovery (3) 270 <0.01 -- --32-5 Obs #1 243 Theis DD(1) 294 -- 3.3E-05 --
Theis Recovery(1) 260 <0.01 -- --CJ Recovery(3) 280 <0.01 -- --
32-4C Obs #2 467 Theis DD(1) 333 -- 5.6E-05 --CJ Recovery (3) 120(a) <0.01 --
29-7 Obs #3 2,400 Theis DD(2) 178 -- 2.0E-04CJ Recovery (3) Insufficient recovery for analysis --
Fall River Aquifer Stock Well (Screened in top half of Fall River)
GW-49 Stock 1,400 Theis DD(1) 177 -- 2.3E-05 --CJ Recovery (3) 110 <0.05 -- --
Upper Fall River Sandstone32-9C Obs 41 Theis DD(1) 217 -- 1.6E-02 --
CJ Recovery (3) 150 <0.05 -- --
Summary of Aquifer Hydraulic Characteristics for the Dewey Pumping Test
2008 Pumping Tests: Results and Analysis
Table 4.3Powertech (USA) Inc.
Dewey-Burdock Project
DV102.00297.01Table 4_3 Summary T&S.xls
1 of 2November 2008

Dewey Test Site Pumping Test Interpretations
Well Radial Dist. Interpretation Transmissivity u or u' Storativity NoteWell I.D. Type (ft) Method (ft2/day) (unitless) (unitless)
Summary of Aquifer Hydraulic Characteristics for the Dewey Pumping Test
2008 Pumping Tests: Results and Analysis
Table 4.3Powertech (USA) Inc.
Dewey-Burdock Project
Lakota Sandstone Layer32-10 Obs 61 No response during pumping test. --
Unkpapa Formation32-11 Obs 50 No response during pumping test. --
Distance Drawdown (32-5, 32-4C, 29-7, GW-49)(2) 218 <0.05 4.6E-05 r2 = 0.78 (4 point line) Pumping Well Efficiency = 93% to 95%
--Summary: Median 255 4.60E-05
Average/Geometric Mean(4) 251 5.23E-05
Notes/References: DD = drawdown, CJ = Cooper -Jacob, Obs = Observation Well(1) Calculated by automated curve fitting in AquiferWin32TM software (ESI, 2003).(2) Knight Piesold spreadsheet after methods in Driscoll (1986).(3) Spreadsheet methods in U.S. Geol. Surv. Open File Rept. 02-197, Halford and Kuniansky (2002).(4) Average value valculated for Transmissivity, Geometric Mean value calculated for Storativity.(a) only slope satisfying u 'critereon occurs after intersection with barrier boundary.(b) not accepted due to anomalous response at well, see text.(d) storativity not valid at pumping well.
= accepted value based on conformance with theory discussed in the text.
DV102.00297.01Table 4_3 Summary T&S.xls
2 of 2November 2008
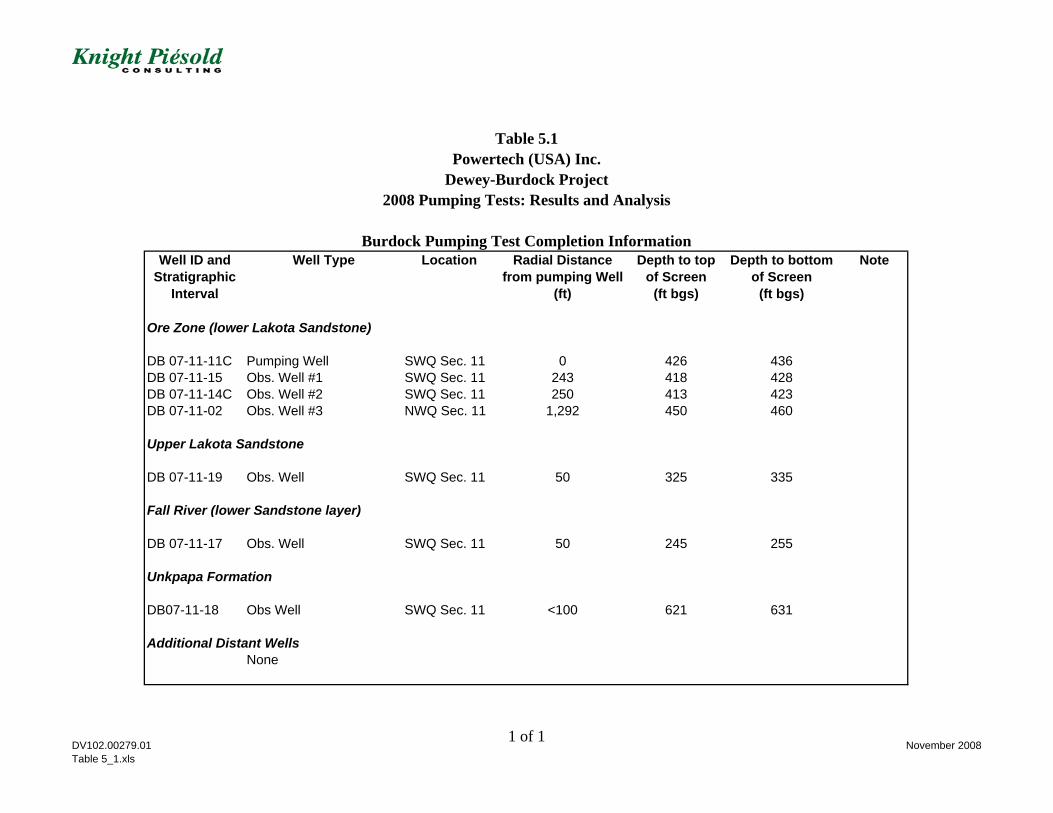
Table 5.1Powertech (USA) Inc.
Dewey-Burdock Project2008 Pumping Tests: Results and Analysis
Burdock Pumping Test Completion InformationWell ID and
Stratigraphic Interval
Well Type Location Radial Distance from pumping Well
(ft)
Depth to top of Screen
(ft bgs)
Depth to bottom of Screen
(ft bgs)
Note
Ore Zone (lower Lakota Sandstone)
DB 07-11-11C Pumping Well SWQ Sec. 11 0 426 436DB 07-11-15 Obs. Well #1 SWQ Sec. 11 243 418 428DB 07-11-14C Obs. Well #2 SWQ Sec. 11 250 413 423DB 07-11-02 Obs. Well #3 NWQ Sec. 11 1,292 450 460
Upper Lakota Sandstone
DB 07-11-19 Obs. Well SWQ Sec. 11 50 325 335
Fall River (lower Sandstone layer)
DB 07-11-17 Obs. Well SWQ Sec. 11 50 245 255
Unkpapa Formation
DB07-11-18 Obs Well SWQ Sec. 11 <100 621 631
Additional Distant WellsNone
DV102.00279.01Table 5_1.xls
1 of 1November 2008
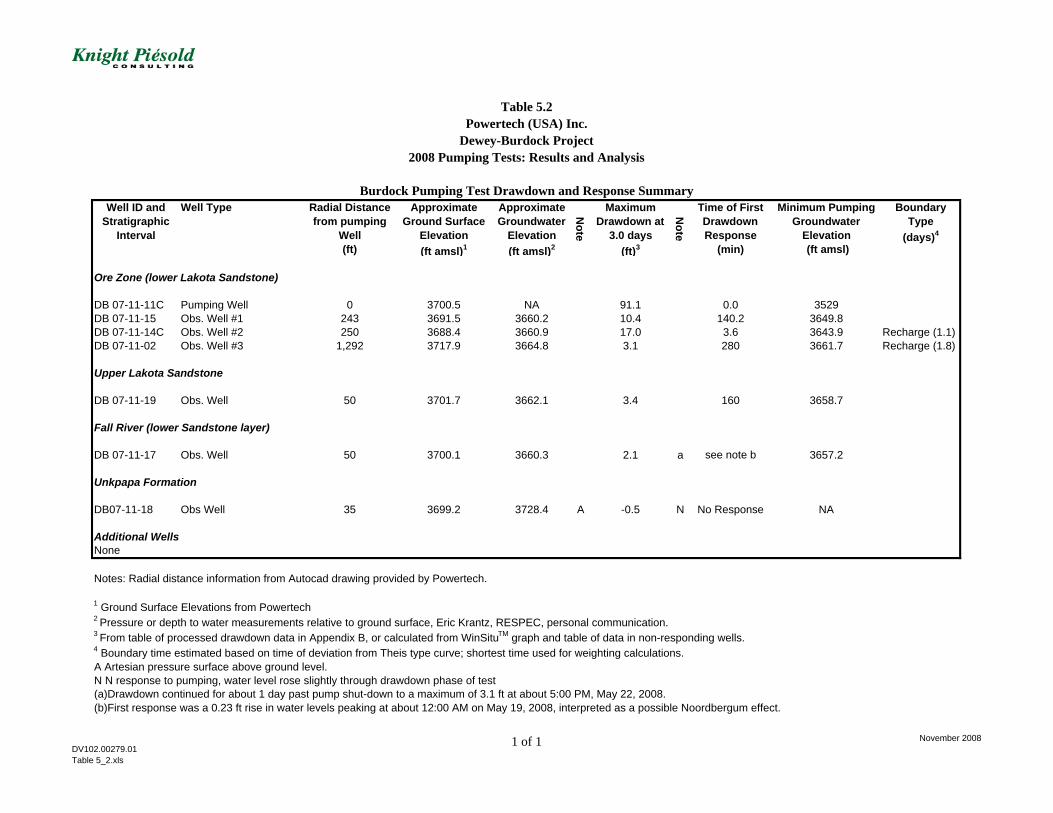
Table 5.2Powertech (USA) Inc.
Dewey-Burdock Project2008 Pumping Tests: Results and Analysis
Burdock Pumping Test Drawdown and Response SummaryWell ID and
Stratigraphic Interval
Well Type Radial Distance from pumping
Well (ft)
Approximate Ground Surface
Elevation (ft amsl)1
Approximate Groundwater
Elevation (ft amsl)2
Note
Maximum Drawdown at
3.0 days (ft)3
Note
Time of First Drawdown Response
(min)
Minimum Pumping Groundwater
Elevation (ft amsl)
BoundaryType
(days)4
Ore Zone (lower Lakota Sandstone)
DB 07-11-11C Pumping Well 0 3700.5 NA 91.1 0.0 3529 DB 07-11-15 Obs. Well #1 243 3691.5 3660.2 10.4 140.2 3649.8DB 07-11-14C Obs. Well #2 250 3688.4 3660.9 17.0 3.6 3643.9 Recharge (1.1)DB 07-11-02 Obs. Well #3 1,292 3717.9 3664.8 3.1 280 3661.7 Recharge (1.8)
Upper Lakota Sandstone
DB 07-11-19 Obs. Well 50 3701.7 3662.1 3.4 160 3658.7
Fall River (lower Sandstone layer)
DB 07-11-17 Obs. Well 50 3700.1 3660.3 2.1 a see note b 3657.2
Unkpapa Formation
DB07-11-18 Obs Well 35 3699.2 3728.4 A -0.5 N No Response NA
Additional Wells None
Notes: Radial distance information from Autocad drawing provided by Powertech. 1 Ground Surface Elevations from Powertech 2 Pressure or depth to water measurements relative to ground surface, Eric Krantz, RESPEC, personal communication.3 From table of processed drawdown data in Appendix B, or calculated from WinSituTM graph and table of data in non-responding wells.4 Boundary time estimated based on time of deviation from Theis type curve; shortest time used for weighting calculations. A Artesian pressure surface above ground level.N N response to pumping, water level rose slightly through drawdown phase of test(a)Drawdown continued for about 1 day past pump shut-down to a maximum of 3.1 ft at about 5:00 PM, May 22, 2008.(b)First response was a 0.23 ft rise in water levels peaking at about 12:00 AM on May 19, 2008, interpreted as a possible Noordbergum effect.
DV102.00279.01Table 5_2.xls
1 of 1 November 2008

Burdock Project Pumping Test Interpretations
Well Radial Dist. Interpretation Transmissivity u or u' Storativity NoteWell I.D. Type (ft) Method (ft2/day) (unitless) (unitless)
Ore zone (lower Lakota Sandstone)11-11C Pumping 0.25 (0.33) Theis DD(1) 145 -- 2.9E-09(a) --
CJ DD (3) 150 <0.01 -- -- Pumping Well Efficiency = 65%(3)
CJ Recovery (3) 140 <0.01 -- --11-15 Obs #1 243 Theis DD(1) 67 -- 1.3E-03 --
CJ Recovery (3) 100 <0.1 -- --11-14C Obs #2 250 Theis DD(1) 128 -- 6.8E-05 --
H-J DD(1) 120 -- 6.9E-05 --Theis Recovery(1) 174 <0.01 -- --CJ Recovery (3) 160 <0.01 -- --
11-02 Obs #3 1,292 Theis DD(1) 223 -- 1.9E-04 --H-J DD(1) 185 -- 1.7E-04 --
CJ Recovery (3) 260 <0.15 -- --
Upper Lakota Sandstone11-19 Obs 50 Theis DD(2) 260 -- 1.0E-01 --
CJ Recovery (3) 190 <0.15 -- --Fall River (lower sandstone layer)
11-17 Obs 50 Noordbergum Effect and response cannot be interpreted analytically
Powertech (USA) Inc.Table 5.3
Summary of Aquifer Hydraulic Characteristics for the Burdock Pumping Test
2008 Pumping Tests: Results and AnalysisDewey-Burdock Project
DV102.00279.01Table 5_3 Summary T&S .xls 1 of 2
November 2008
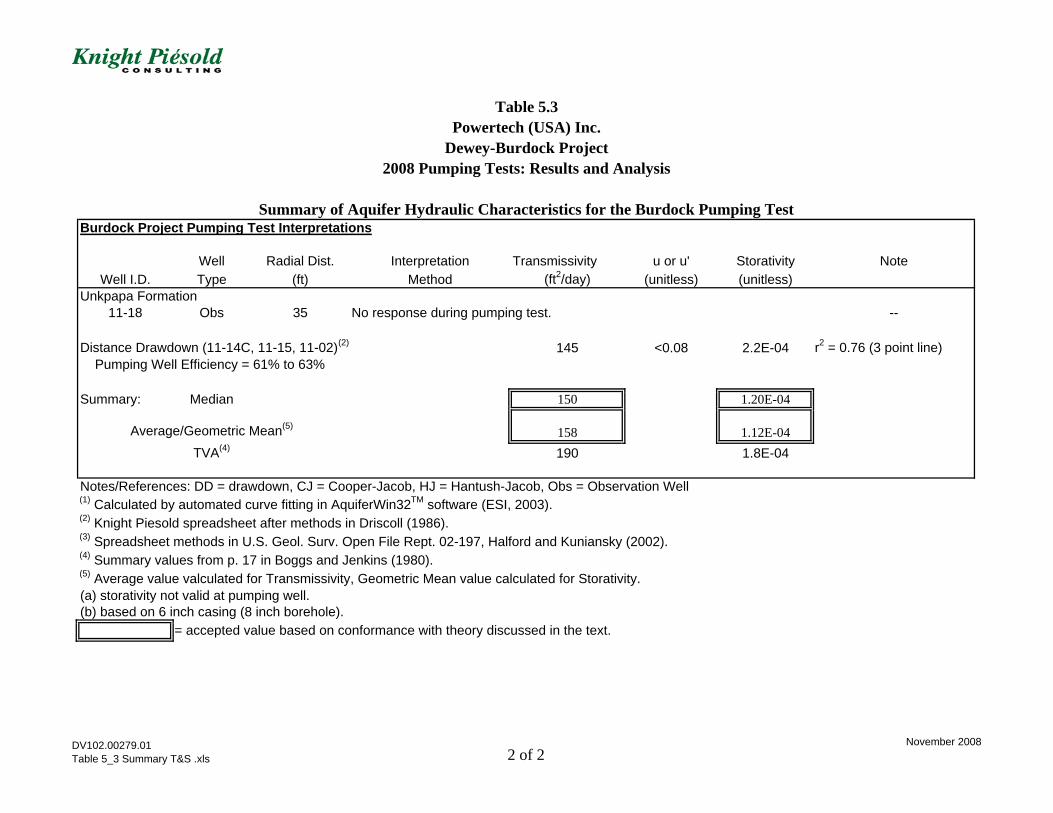
Burdock Project Pumping Test Interpretations
Well Radial Dist. Interpretation Transmissivity u or u' Storativity NoteWell I.D. Type (ft) Method (ft2/day) (unitless) (unitless)
Powertech (USA) Inc.Table 5.3
Summary of Aquifer Hydraulic Characteristics for the Burdock Pumping Test
2008 Pumping Tests: Results and AnalysisDewey-Burdock Project
Unkpapa Formation11-18 Obs 35 No response during pumping test. --
Distance Drawdown (11-14C, 11-15, 11-02)(2) 145 <0.08 2.2E-04 r2 = 0.76 (3 point line) Pumping Well Efficiency = 61% to 63%
Summary: Median 150 1.20E-04
Average/Geometric Mean(5) 158 1.12E-04TVA(4) 190 1.8E-04
Notes/References: DD = drawdown, CJ = Cooper-Jacob, HJ = Hantush-Jacob, Obs = Observation Well(1) Calculated by automated curve fitting in AquiferWin32TM software (ESI, 2003).(2) Knight Piesold spreadsheet after methods in Driscoll (1986).(3) Spreadsheet methods in U.S. Geol. Surv. Open File Rept. 02-197, Halford and Kuniansky (2002).(4) Summary values from p. 17 in Boggs and Jenkins (1980).(5) Average value valculated for Transmissivity, Geometric Mean value calculated for Storativity.(a) storativity not valid at pumping well.(b) based on 6 inch casing (8 inch borehole).
= accepted value based on conformance with theory discussed in the text.
DV102.00279.01Table 5_3 Summary T&S .xls 2 of 2
November 2008
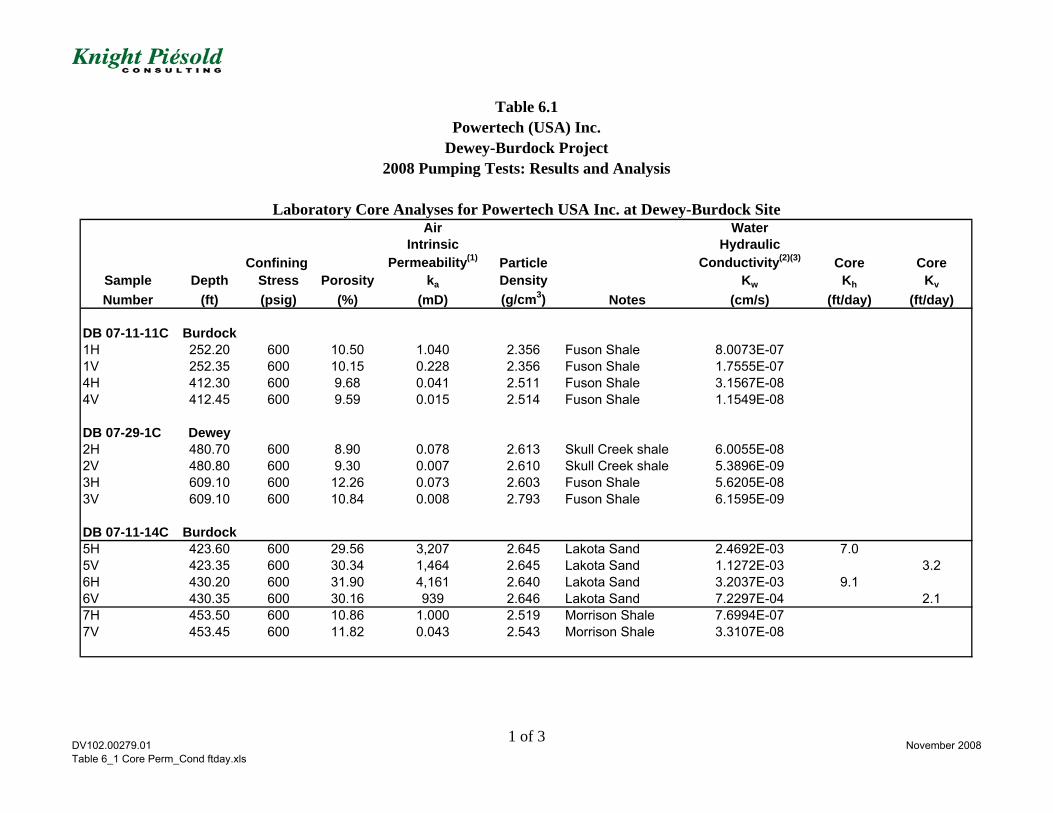
Air WaterIntrinsic Hydraulic
Confining Permeability(1) Particle Conductivity(2)(3) Core CoreSample Depth Stress Porosity ka Density Kw Kh Kv
Number (ft) (psig) (%) (mD) (g/cm3) Notes (cm/s) (ft/day) (ft/day)
DB 07-11-11C Burdock1H 252.20 600 10.50 1.040 2.356 Fuson Shale 8.0073E-07 1V 252.35 600 10.15 0.228 2.356 Fuson Shale 1.7555E-07 4H 412.30 600 9.68 0.041 2.511 Fuson Shale 3.1567E-08 4V 412.45 600 9.59 0.015 2.514 Fuson Shale 1.1549E-08
DB 07-29-1C Dewey2H 480.70 600 8.90 0.078 2.613 Skull Creek shale 6.0055E-08 2V 480.80 600 9.30 0.007 2.610 Skull Creek shale 5.3896E-09 3H 609.10 600 12.26 0.073 2.603 Fuson Shale 5.6205E-08 3V 609.10 600 10.84 0.008 2.793 Fuson Shale 6.1595E-09
DB 07-11-14C Burdock5H 423.60 600 29.56 3,207 2.645 Lakota Sand 2.4692E-03 7.05V 423.35 600 30.34 1,464 2.645 Lakota Sand 1.1272E-03 3.26H 430.20 600 31.90 4,161 2.640 Lakota Sand 3.2037E-03 9.16V 430.35 600 30.16 939 2.646 Lakota Sand 7.2297E-04 2.17H 453.50 600 10.86 1.000 2.519 Morrison Shale 7.6994E-07 7V 453.45 600 11.82 0.043 2.543 Morrison Shale 3.3107E-08
Powertech (USA) Inc.Table 6.1
Laboratory Core Analyses for Powertech USA Inc. at Dewey-Burdock Site
2008 Pumping Tests: Results and AnalysisDewey-Burdock Project
DV102.00279.01Table 6_1 Core Perm_Cond ftday.xls
1 of 3November 2008
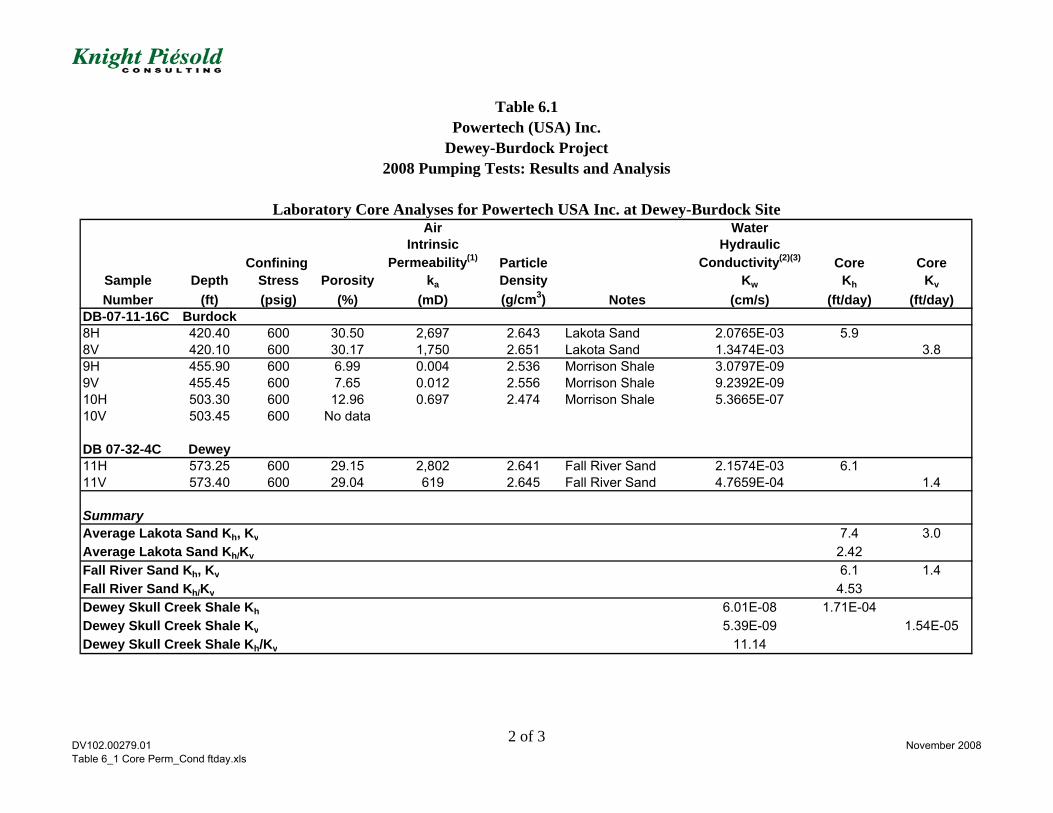
Air WaterIntrinsic Hydraulic
Confining Permeability(1) Particle Conductivity(2)(3) Core CoreSample Depth Stress Porosity ka Density Kw Kh Kv
Number (ft) (psig) (%) (mD) (g/cm3) Notes (cm/s) (ft/day) (ft/day)
Powertech (USA) Inc.Table 6.1
Laboratory Core Analyses for Powertech USA Inc. at Dewey-Burdock Site
2008 Pumping Tests: Results and AnalysisDewey-Burdock Project
DB-07-11-16C Burdock8H 420.40 600 30.50 2,697 2.643 Lakota Sand 2.0765E-03 5.98V 420.10 600 30.17 1,750 2.651 Lakota Sand 1.3474E-03 3.89H 455.90 600 6.99 0.004 2.536 Morrison Shale 3.0797E-09 9V 455.45 600 7.65 0.012 2.556 Morrison Shale 9.2392E-09 10H 503.30 600 12.96 0.697 2.474 Morrison Shale 5.3665E-07 10V 503.45 600 No data
DB 07-32-4C Dewey11H 573.25 600 29.15 2,802 2.641 Fall River Sand 2.1574E-03 6.111V 573.40 600 29.04 619 2.645 Fall River Sand 4.7659E-04 1.4
SummaryAverage Lakota Sand Kh, Kv 7.4 3.0Average Lakota Sand Kh/Kv 2.42Fall River Sand Kh, Kv 6.1 1.4Fall River Sand Kh/Kv 4.53Dewey Skull Creek Shale Kh 6.01E-08 1.71E-04Dewey Skull Creek Shale Kv 5.39E-09 1.54E-05Dewey Skull Creek Shale Kh/Kv 11.14
DV102.00279.01Table 6_1 Core Perm_Cond ftday.xls
2 of 3November 2008
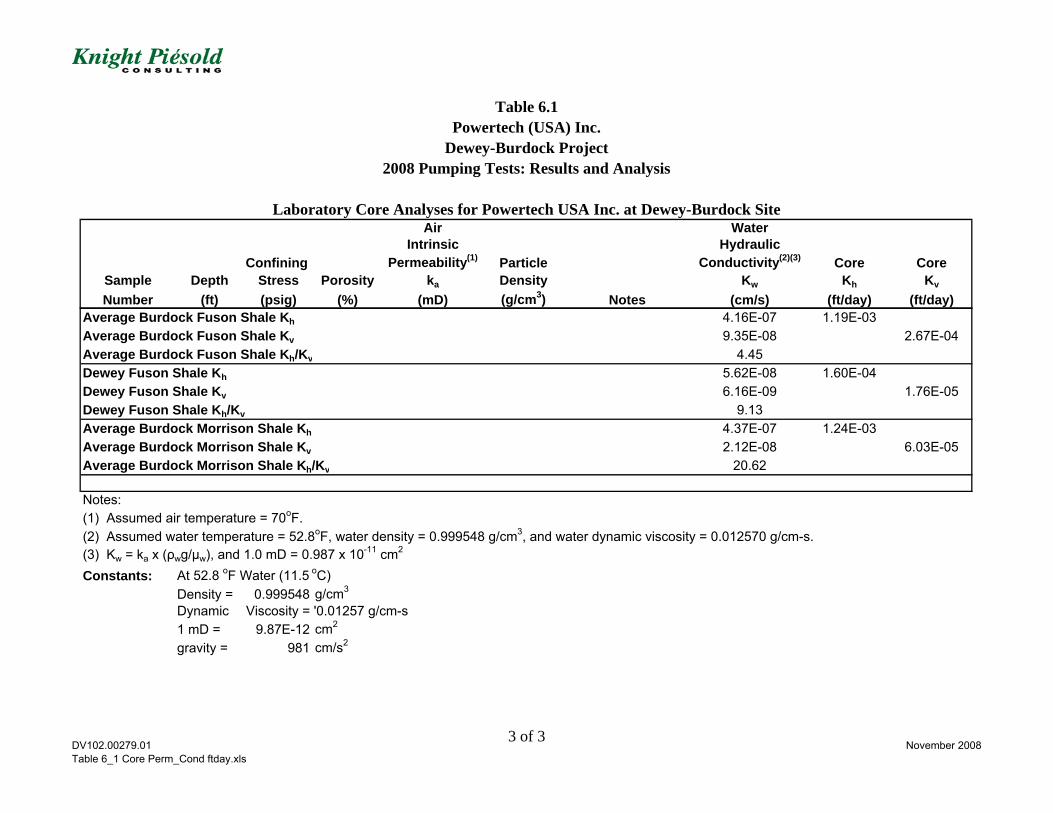
Air WaterIntrinsic Hydraulic
Confining Permeability(1) Particle Conductivity(2)(3) Core CoreSample Depth Stress Porosity ka Density Kw Kh Kv
Number (ft) (psig) (%) (mD) (g/cm3) Notes (cm/s) (ft/day) (ft/day)
Powertech (USA) Inc.Table 6.1
Laboratory Core Analyses for Powertech USA Inc. at Dewey-Burdock Site
2008 Pumping Tests: Results and AnalysisDewey-Burdock Project
Average Burdock Fuson Shale Kh 4.16E-07 1.19E-03Average Burdock Fuson Shale Kv 9.35E-08 2.67E-04Average Burdock Fuson Shale Kh/Kv 4.45Dewey Fuson Shale Kh 5.62E-08 1.60E-04Dewey Fuson Shale Kv 6.16E-09 1.76E-05Dewey Fuson Shale Kh/Kv 9.13Average Burdock Morrison Shale Kh 4.37E-07 1.24E-03Average Burdock Morrison Shale Kv 2.12E-08 6.03E-05Average Burdock Morrison Shale Kh/Kv 20.62
Notes:(1) Assumed air temperature = 70oF.(2) Assumed water temperature = 52.8oF, water density = 0.999548 g/cm3, and water dynamic viscosity = 0.012570 g/cm-s.(3) Kw = ka x (ρwg/μw), and 1.0 mD = 0.987 x 10⁻¹¹ cm2
Constants: At 52.8 oF Water (11.5 oC)Density = 0.999548 g/cm3
Dynamic Viscosity = '0.01257 g/cm-s 1 mD = 9.87E-12 cm2
gravity = 981 cm/s2
DV102.00279.01Table 6_1 Core Perm_Cond ftday.xls
3 of 3November 2008

Figures

_̂Wyoming
South Dakota
Nebraska
±NAD 1983 South Dakota South (ft)
!
!
!
!
6
616
6
3
31
36
36
3131
3
3134
34
103°54'0"W103°56'0"W103°58'0"W104°0'0"W104°2'0"W104°4'0"W
43°32'0"N
43°30'0"N
43°28'0"N
43°26'0"N
43°24'0"N
1979-1982 and 2008 Pumping Test
LocationsDewey-Burdock Project
Created By:Date:Map File:
C. Hocking, RESPEC11/11/08Figure_1_1.mxd
LegendProposed Permit BoundarySectionsRoadsRailroadPerennial StreamsEphemeral Streams
! Pumping Test Wells
0 0.4 0.8 1.2 1.6Miles
Fall River Co.Custer Co.
Niob
rara
Co.
Westo
n Co.TVA 1982 Dewey Pumping Test
Lakota Formation11 days, 495 gpm
TVA 1979 Burdock Pumping TestsLakota Formation3 days, 203 gpm
Fall River Formation49 hours, 8.5 gpm
Beaver Creek
Pass
Creek
Cheyenne River
Figure 1.1
Powertech 2008 Dewey Pumping TestFall River Formation
3 days, 30 gpm
Powertech 2008 Burdock Pumping TestLakota Formation3 days, 30 gpm
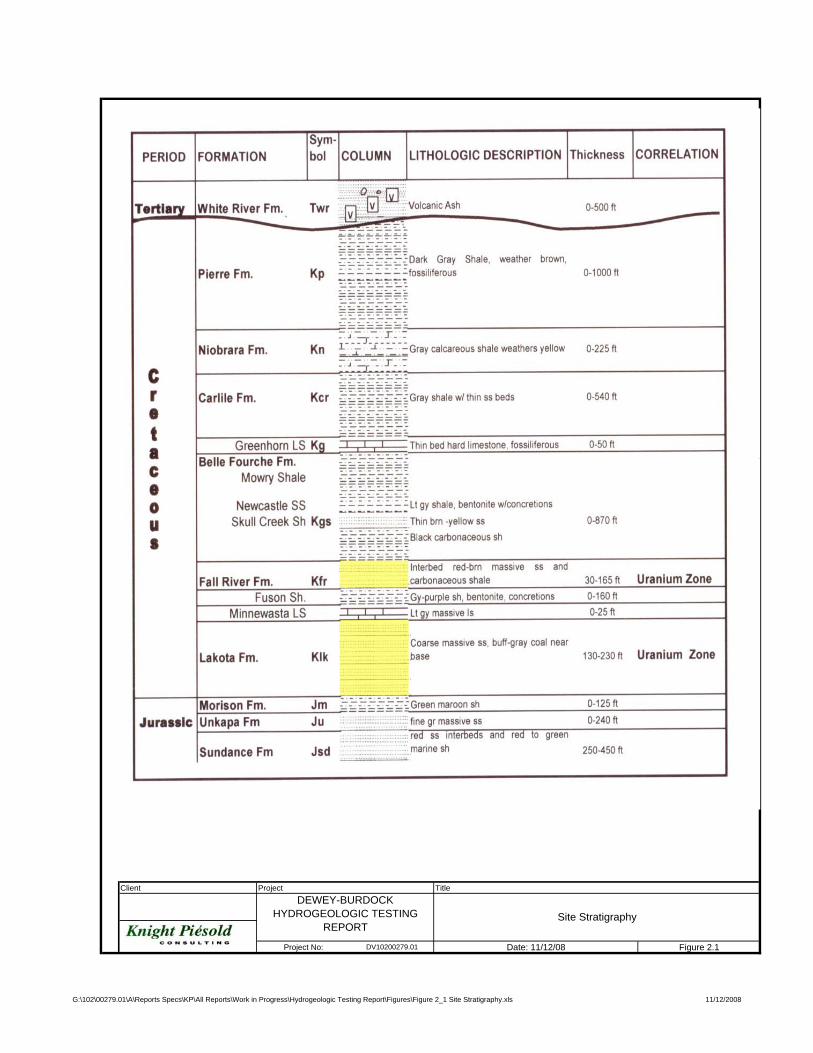
Client Project TitleDEWEY-BURDOCK
HYDROGEOLOGIC TESTINGREPORT
Project No: DV10200279.01 Date: 11/12/08 Figure 2.1
Site Stratigraphy
G:\102\00279.01\A\Reports Specs\KP\All Reports\Work in Progress\Hydrogeologic Testing Report\Figures\Figure 2_1 Site Stratigraphy.xls 11/12/2008

Dewey Fault
Kf
Fall River Co.Custer Co.
Niob
rara
Co.
Westo
n Co.
Kb
Qe
Kc
KfKl
TrPs
Kms
Kb
Kms
Qal
Kl
Qal
Kms
Ql Jms
Qtg
Kg
Pass
Creek
Barker Dome
Anticline
Beaver Creek
Cheyenne River
103°54'W103°56'W103°58'W104°0'W104°2'W104°4'W
43°32'N
43°30'N
43°28'N
43°26'N
43°24'N
_̂Wyoming
South Dakota
Nebraska
±NAD 1983 South Dakota South (ft)
Site Surface GeologyDewey-Burdock Project
Created By:Date:Map File:
C. Hocking11/11/08Figure_2_2.mxd
Alluvium QalEolian Deposits QeGravel Deposits QtLandslide Deposits QlCarlile Shale KcGreenhorn KgBelle Fourche Shale KbMowry and Skull Creek Shale KmsFall River KfLakota KlMorrison, Sundance JmsSpearfish TrPs
1:92,597
Figure 2.2
0 0.4 0.8 1.2 1.6Miles
LegendProposed Permit BoundaryRoadsRailroadPerennial StreamsEphemeral Streams

_̂Wyoming
South Dakota
Nebraska
±NAD 1983 South Dakota South (ft)
6
616
6
3
31
36
36
3131
3
3134
34
3620
3630
3640
3610
3650
3660
3600
3670
3590
3680
3690
3700
3710
3720
3580
3663
36413642
3632
3680
3649
3715
37093701
3693
3585
3660
103°54'0"W103°56'0"W103°58'0"W104°0'0"W104°2'0"W104°4'0"W
43°32'0"N
43°30'0"N
43°28'0"N
43°26'0"N
43°24'0"N
Potentiometric SurfaceFall River Aquifer
2008Dewey-Burdock Project
Created By:Date:Map File:
C. Hocking, RESPEC11/12/08Figure_2_3.mxd
LegendProposed Permit BoundaryFall River OutcropPerennial StreamsEphemeral Streams2008 Potentiometric Surface in FeetFall River Water Elevations in Feet
0 0.4 0.8 1.2 1.6Miles
Fall River Co.Custer Co.
Niob
rara
Co.
Westo
n Co.
Dewey Fault
Barker Dome
Anticline
Beaver Creek
Pass
Creek
Cheyenne River
Figure 2.3
1:89,172
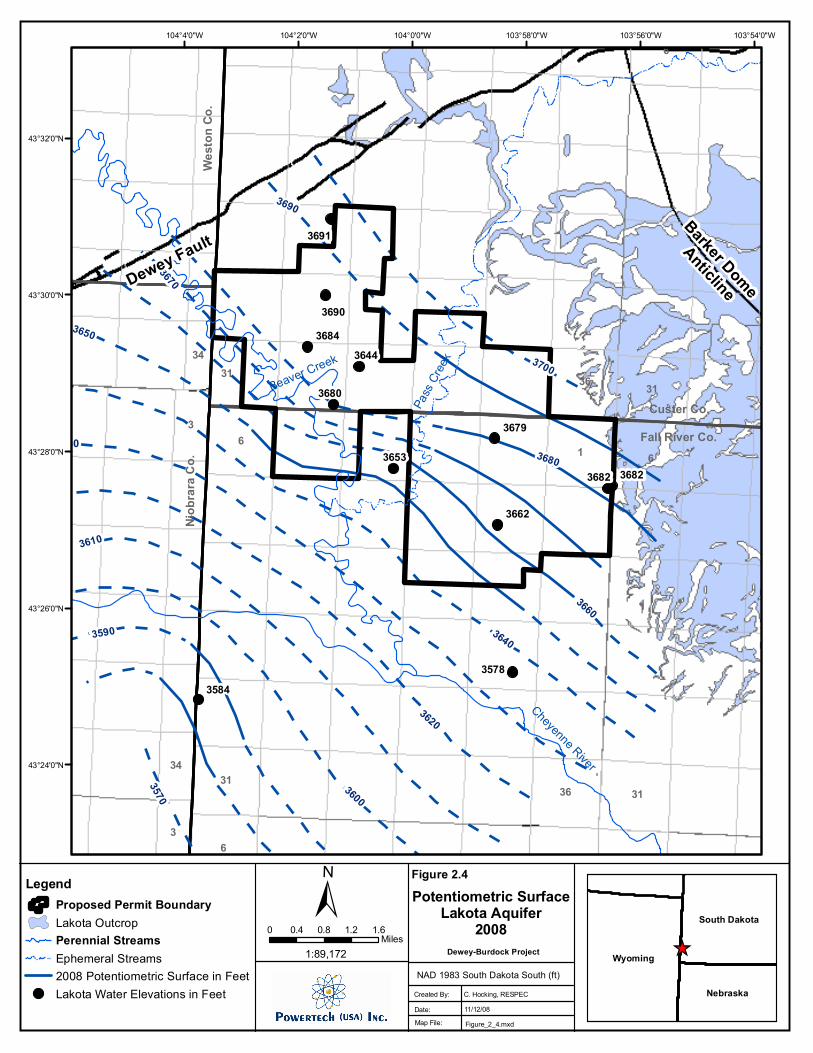
_̂Wyoming
South Dakota
Nebraska
±NAD 1983 South Dakota South (ft)
6
616
6
3
31
36
36
3131
3
3134
34
3640
3650
3630
3620
3680
3610
3670
3690
3600
3590
3580
3700
3570
3660
3662
3684
3680
36823653
3679
3682
3691
3690
3644
35843578
103°54'0"W103°56'0"W103°58'0"W104°0'0"W104°2'0"W104°4'0"W
43°32'0"N
43°30'0"N
43°28'0"N
43°26'0"N
43°24'0"N
Potentiometric SurfaceLakota Aquifer
2008Dewey-Burdock Project
Created By:Date:Map File:
C. Hocking, RESPEC11/12/08Figure_2_4.mxd
LegendProposed Permit BoundaryLakota OutcropPerennial StreamsEphemeral Streams2008 Potentiometric Surface in FeetLakota Water Elevations in Feet
0 0.4 0.8 1.2 1.6Miles
Fall River Co.Custer Co.
Niob
rara
Co.
Westo
n Co.
Dewey Fault
Barker Dome
Anticline
Beaver Creek
Pass
Creek
Cheyenne River
Figure 2.4
1:89,172

_̂Wyoming
South Dakota
Nebraska
±NAD 1983 South Dakota South (ft)
6
616
6
3
31
36
36
3131
3
3134
34
3760
3770
3750
3780
3790
3720
3730
3740
3710
3700
3690
3800
3763
3767
3716
3728
103°54'0"W103°56'0"W103°58'0"W104°0'0"W104°2'0"W104°4'0"W
43°32'0"N
43°30'0"N
43°28'0"N
43°26'0"N
43°24'0"N
Potentiometric SurfaceUnkpapa Aquifer
2008Dewey-Burdock Project
Created By:Date:Map File:
C. Hocking, RESPEC11/12/08Figure_2_5.mxd
LegendProposed Permit BoundarySundance/Unkpapa OutcropPerrenial StreamsEphemeral Streams2008 Potentiometric Surface in FeetUnkpapa Water Elevations in Feet
0 0.4 0.8 1.2 1.6Miles
Fall River Co.Custer Co.
Niob
rara
Co.
Westo
n Co.
Dewey Fault
Barker Dome
Anticline
Beaver Creek
Pass
Creek
Cheyenne River
Figure 2.5
1:89,172

Client Project Title
DEWEY-BURDOCKHYDROGEOLOGIC TESTING
REPORTProject No: DV10200279.01 Date: 11/12/08 Figure 3.1
Background Monitoring(April 8 to May 26, 2008)
Background Water Level and Site Barometer ChangesPump Test Sequence of Events
(April 8 to May 26, 2008)
81.15
81.25
81.35
81.45
81.55
81.65
81.75
81.85
81.95
82.05
82.15
4/8/2008 12AM
4/13/200812 AM
4/18/200812 AM
4/23/200812 AM
4/28/200812 AM
5/3/2008 12AM
5/8/2008 12AM
5/13/200812 AM
5/18/200812 AM
5/23/200812 AM
Date-Time
Adj
uste
d Tr
ansd
ucer
PSI
995
1000
1005
1010
1015
1020
1025
1030
1035
1040
1045
Edge
mon
t Bar
omet
er (m
illib
ars)
Dewey 32-4C (Fall River) Burdock 11-11C (Lakota) Barometer
Background Monitoring and Pump Installation/Testing
Undisturbed Background Barometric Efficiency Calibration
April 23 to May 8, 2008
Step Testing& Recovery
May 9 to May 15, 2008
Dew
ey 3
Day
D
raw
dow
n Te
st
Bur
dock
3 D
ay
Dra
wdo
wn
Test
BurdockRecovery
DeweyRecovery
Pump Installation & Testing
May
15
to
Ma y
18,
200
8
May
18
to
Ma y
21,
200
8G:\102\00279.01\A\Reports Specs\KP\All Reports\Work in Progress\Hydrogeologic Testing Report\Figures\Figure 3_1 Background Water Levels.xls 11/12/2008
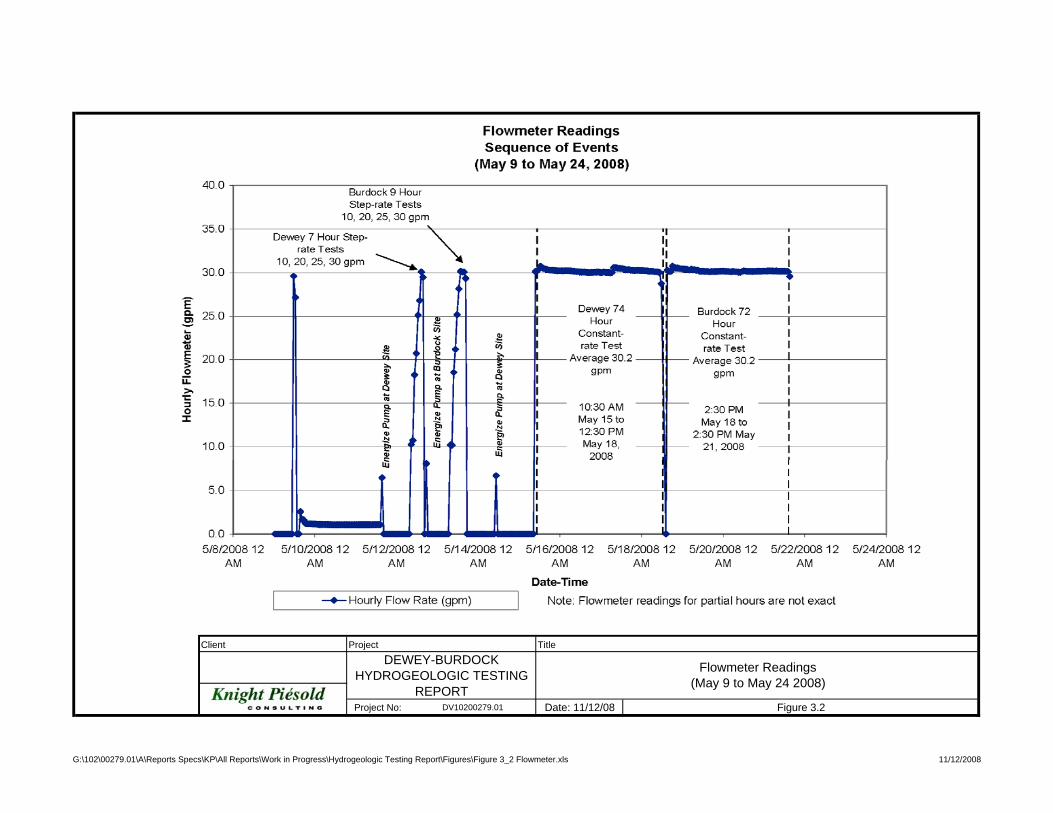
Client Project Title
DEWEY-BURDOCKHYDROGEOLOGIC TESTING
REPORTProject No: DV10200279.01 Date: 11/12/08 Figure 3.2
Flowmeter Readings(May 9 to May 24 2008)
G:\102\00279.01\A\Reports Specs\KP\All Reports\Work in Progress\Hydrogeologic Testing Report\Figures\Figure 3_2 Flowmeter.xls 11/12/2008

_̂±
NAD 1983 South Dakota South (ft)
#*
#*
#*
#*#*
#*#0
XW
#49
#687DB07-32-5
#681DB07-32-3C
#689DB07-32-10
#693DB07-32-11
#691DB07-32-9C
#685DB07-32-4C
#683DB07-29-07
3630
3650
3640
3620
3660
3670
104°1'30"W104°1'40"W104°1'50"W
43°29'50"N
43°29'40"N
43°29'30"N
Dewey May 2008Pumping Test Well
LocationsDewey-Burdock Project
Created By:Date:Map File:
C. Hocking, RESPEC11/11/08Figure_4_1.mxd
Legend#0 Fall River Pump Well#* Fall River Monitor WellXW Fall River Stock Well#* Lakota Monitor Well#* Unkpapa Monitor Well
0 100 200 300 400Feet
10 ft contour interval
Figure 4.1
C
C'
DD'
Cross-section C-C' (Drawing 4.1)Cross-section D-D' (Drawing 4.2)
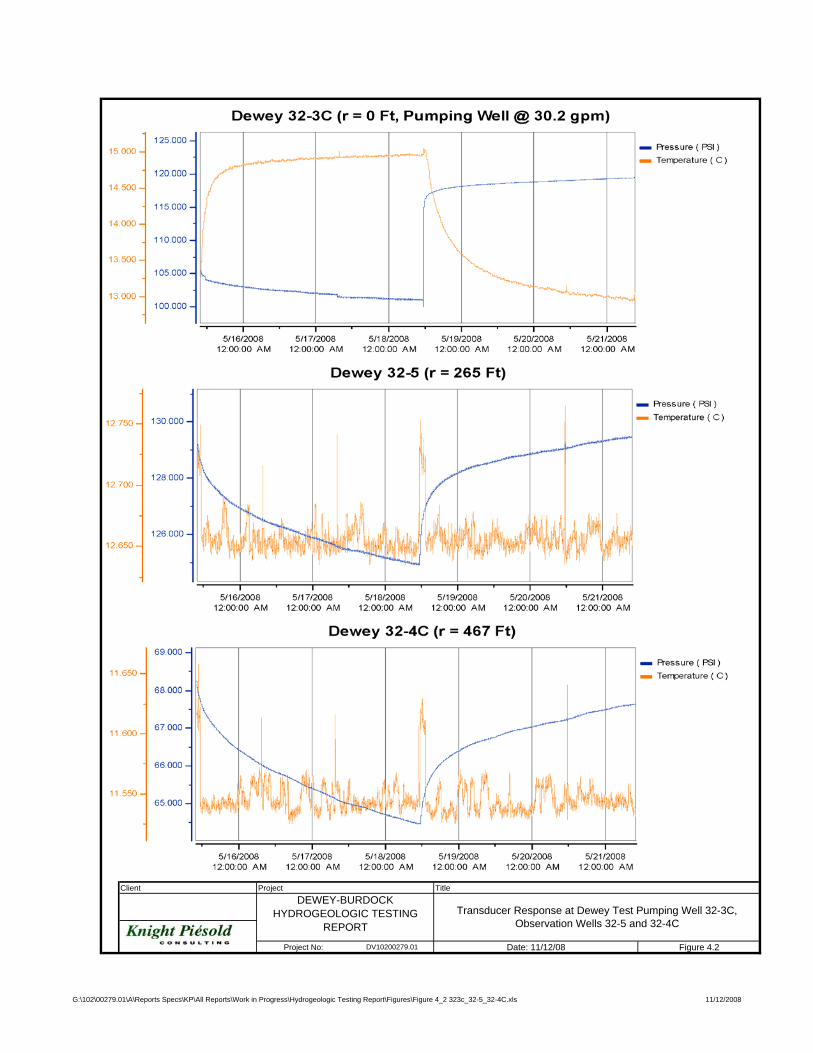
Client Project TitleDEWEY-BURDOCK
HYDROGEOLOGIC TESTINGREPORT
Project No: DV10200279.01 Date: 11/12/08 Figure 4.2
Transducer Response at Dewey Test Pumping Well 32-3C, Observation Wells 32-5 and 32-4C
G:\102\00279.01\A\Reports Specs\KP\All Reports\Work in Progress\Hydrogeologic Testing Report\Figures\Figure 4_2 323c_32-5_32-4C.xls 11/12/2008
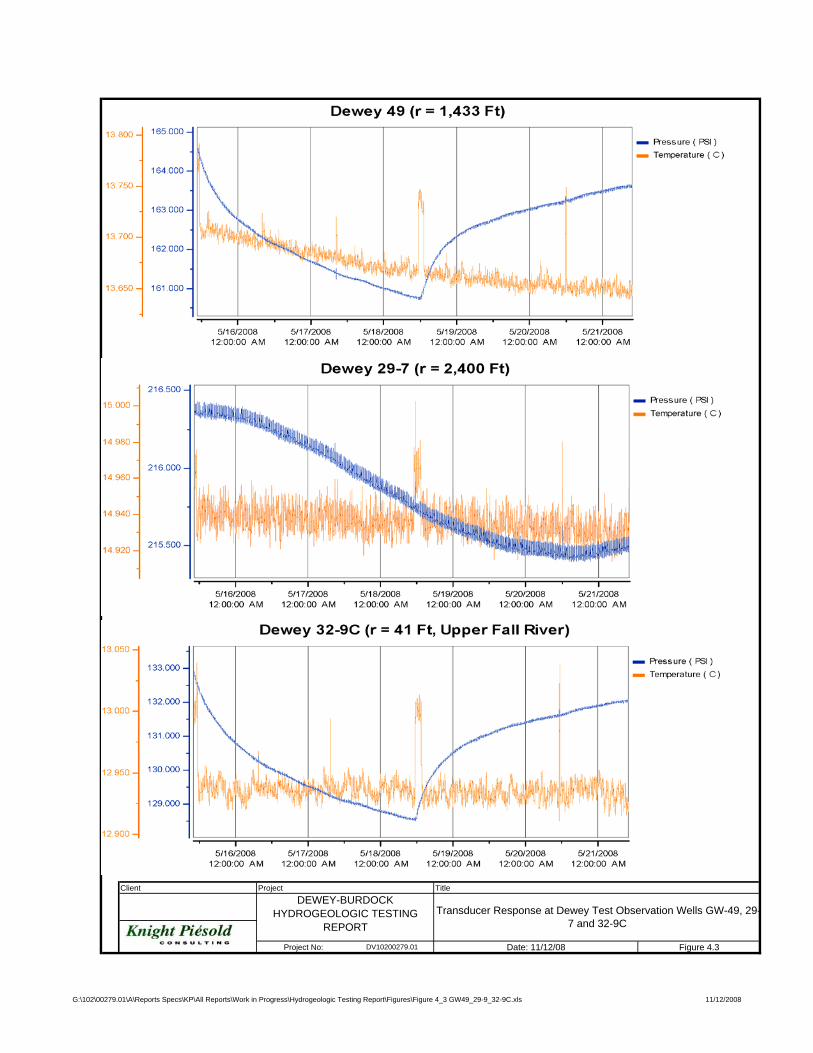
Client Project TitleDEWEY-BURDOCK
HYDROGEOLOGIC TESTINGREPORT
Project No: DV10200279.01 Date: 11/12/08 Figure 4.3
Transducer Response at Dewey Test Observation Wells GW-49, 29-7 and 32-9C
G:\102\00279.01\A\Reports Specs\KP\All Reports\Work in Progress\Hydrogeologic Testing Report\Figures\Figure 4_3 GW49_29-9_32-9C.xls 11/12/2008

Client Project TitleDEWEY-BURDOCK
HYDROGEOLOGIC TESTINGREPORT
Project No: DV10200279.01 Date: 11/12/08 Figure 4.4
Non-responding Dewey Test Observation Wells 32-10 (Lakota) and 32-11 (Unkpapa) compared to Pumping Well
G:\102\00279.01\A\Reports Specs\KP\All Reports\Work in Progress\Hydrogeologic Testing Report\Figures\Figure 4_4 32-23c_32-10 Non Resp.xls 11/12/2008

Client Project TitleDEWEY-BURDOCK
HYDROGEOLOGIC TESTINGREPORT
Project No: DV10200279.01 Date: 11/12/08 Figure 4.5
Drawdown and Analysis at Dewey Test Observation Well 32-5
G:\102\00279.01\A\Reports Specs\KP\All Reports\Work in Progress\Hydrogeologic Testing Report\Figures\Figure 4_5 Theis 32-5.xls 11/12/2008
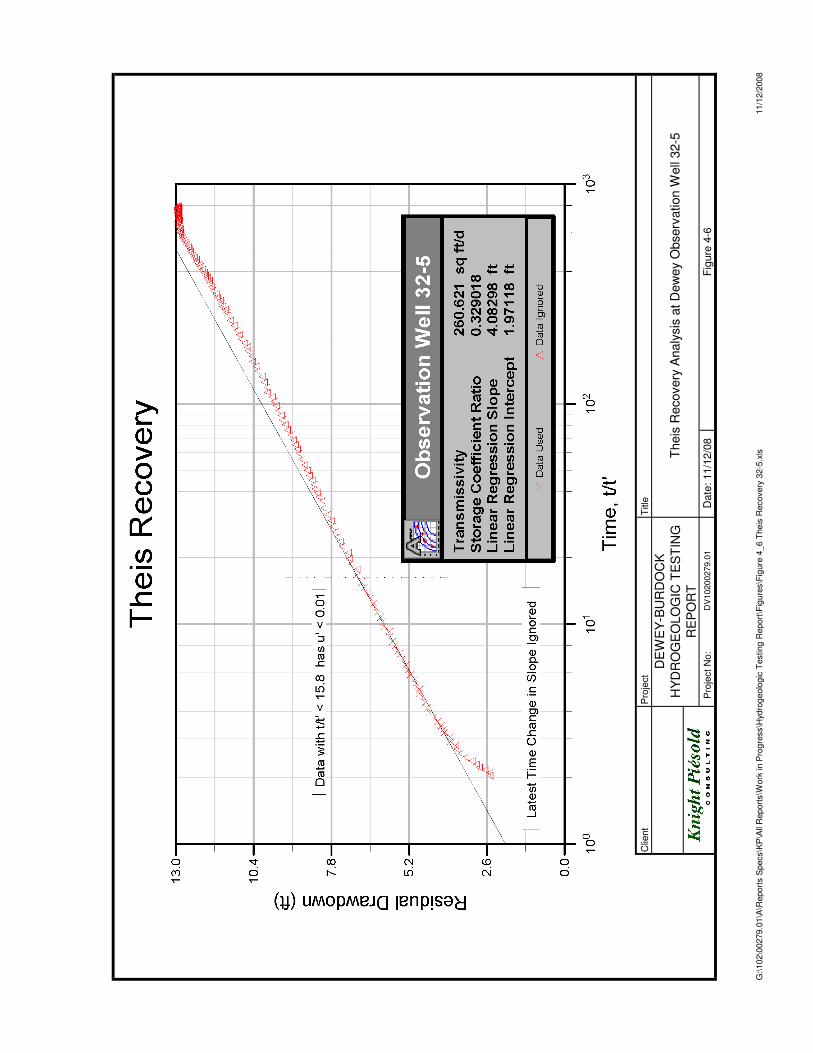
Clie
nt
Pro
ject
Title
D
EW
EY
-BU
RD
OC
K
HY
DR
OG
EO
LO
GIC
TE
ST
ING
RE
PO
RT
Pro
ject
No:
DV
10200279.0
1D
ate
: 11/1
2/0
8F
igure
4-6
Theis
Recovery
Analy
sis
at D
ew
ey O
bserv
ation W
ell
32-5
G:\
102\0
0279.0
1\A
\Report
s S
pecs\K
P\A
ll R
eport
s\W
ork
in P
rog
ress\H
ydro
geolo
gic
Testing
Report
\Fig
ure
s\F
igure
4_6 T
heis
Recovery
32-5
.xls
11/1
2/2
008
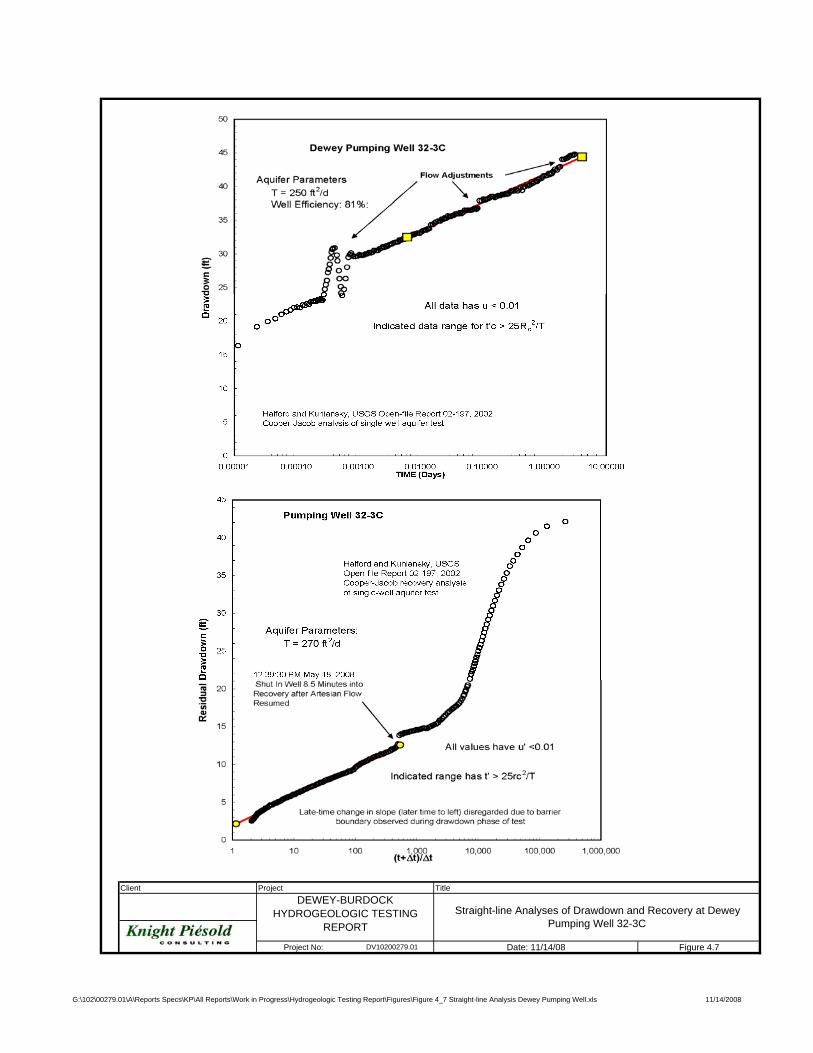
Client Project TitleDEWEY-BURDOCK
HYDROGEOLOGIC TESTINGREPORT
Project No: DV10200279.01 Date: 11/14/08 Figure 4.7
Straight-line Analyses of Drawdown and Recovery at Dewey Pumping Well 32-3C
G:\102\00279.01\A\Reports Specs\KP\All Reports\Work in Progress\Hydrogeologic Testing Report\Figures\Figure 4_7 Straight-line Analysis Dewey Pumping Well.xls 11/14/2008
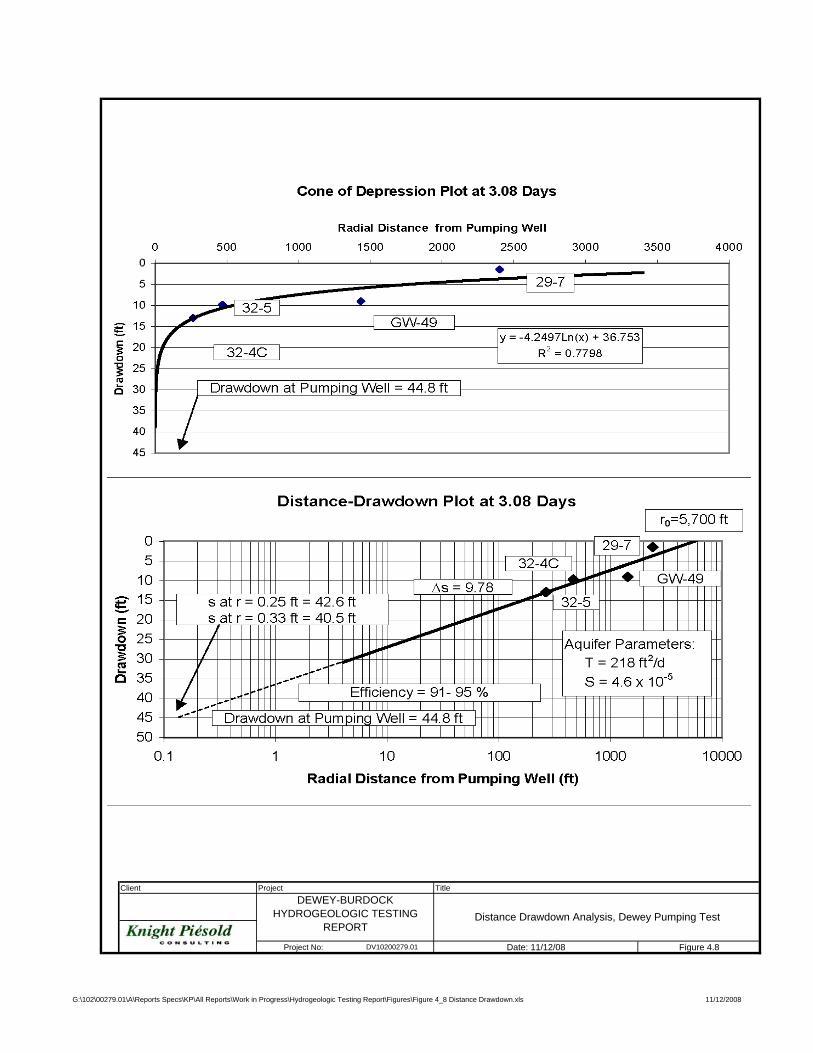
Client Project TitleDEWEY-BURDOCK
HYDROGEOLOGIC TESTINGREPORT
Project No: DV10200279.01 Date: 11/12/08 Figure 4.8
Distance Drawdown Analysis, Dewey Pumping Test
G:\102\00279.01\A\Reports Specs\KP\All Reports\Work in Progress\Hydrogeologic Testing Report\Figures\Figure 4_8 Distance Drawdown.xls 11/12/2008
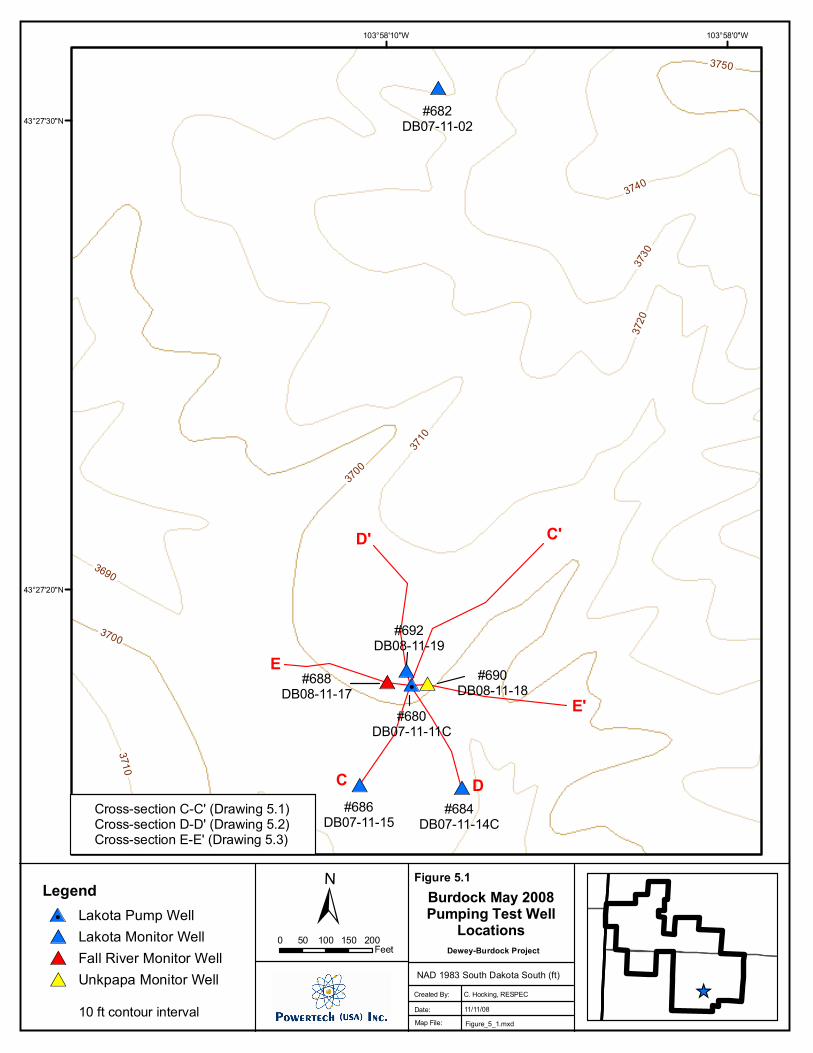
NAD 1983 South Dakota South (ft)
#*
#* #*
#*#*
#* #0#688DB08-11-17
#692DB08-11-19
#690DB08-11-18
#686DB07-11-15
#682DB07-11-02
#680DB07-11-11C
#684DB07-11-14C
3720
3730
3700
3740
3710
3690
3750
3700
3710
103°58'0"W103°58'10"W
43°27'30"N
43°27'20"N
Burdock May 2008Pumping Test Well
LocationsDewey-Burdock Project
Created By:Date:Map File:
C. Hocking, RESPEC11/11/08Figure_5_1.mxd
Legend#0 Lakota Pump Well#* Lakota Monitor Well#* Fall River Monitor Well#* Unkpapa Monitor Well
0 50 100 150 200Feet
10 ft contour interval
Figure 5.1
_̂
±
Cross-section C-C' (Drawing 5.1)Cross-section D-D' (Drawing 5.2)Cross-section E-E' (Drawing 5.3)
C
C'
D
D'
E
E'
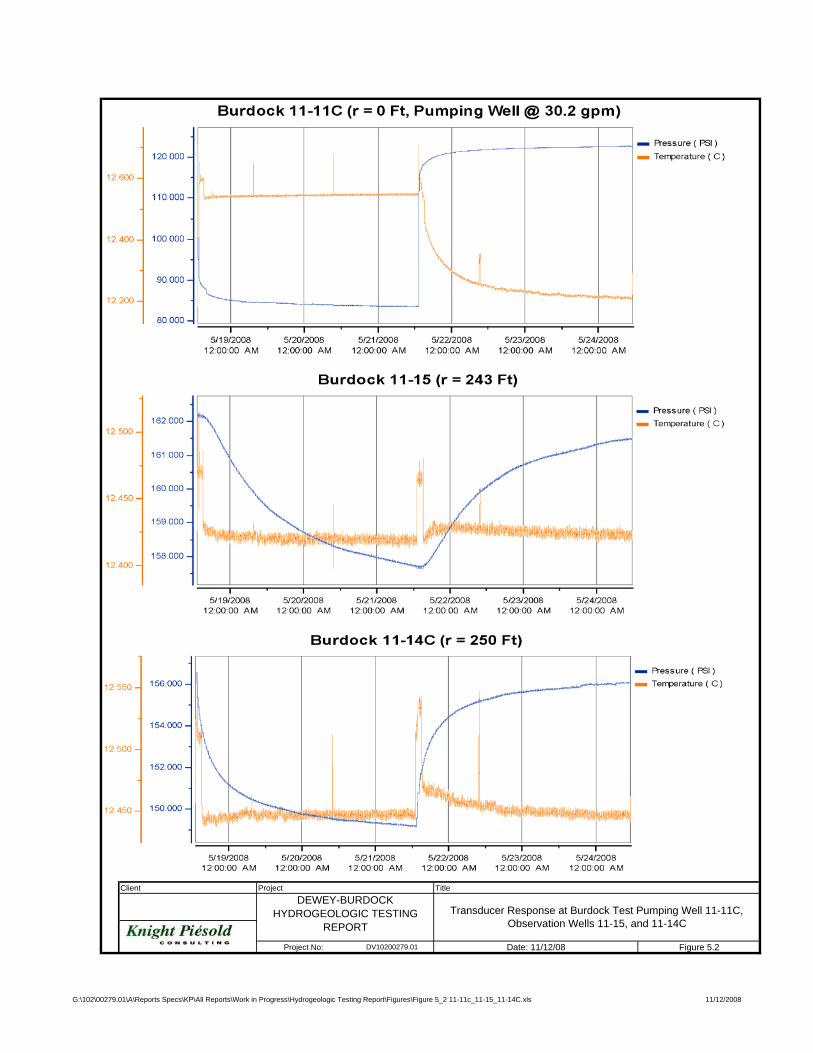
Client Project TitleDEWEY-BURDOCK
HYDROGEOLOGIC TESTINGREPORT
Project No: DV10200279.01 Date: 11/12/08 Figure 5.2
Transducer Response at Burdock Test Pumping Well 11-11C, Observation Wells 11-15, and 11-14C
G:\102\00279.01\A\Reports Specs\KP\All Reports\Work in Progress\Hydrogeologic Testing Report\Figures\Figure 5_2 11-11c_11-15_11-14C.xls 11/12/2008

Client Project TitleDEWEY-BURDOCK
HYDROGEOLOGIC TESTINGREPORT
Project No: DV10200279.01 Date: 11/12/08 Figure 5.3
Transducer Response at Burdock Test Observation Wells 11-2, 11-19 and 11-17
G:\102\00279.01\A\Reports Specs\KP\All Reports\Work in Progress\Hydrogeologic Testing Report\Figures\Figure 5_3 11-2_11-19_11-17.xls 11/12/2008

Client Project TitleDEWEY-BURDOCK
HYDROGEOLOGIC TESTINGREPORT
Project No: DV10200279.01 Date: 11/12/08 Figure 5.4
Non-responding Burdock Test Observation Well 11-18 (Unkpapa) compared to Pumping Well and Observation Well 11-17 (Fall River)
G:\102\00279.01\A\Reports Specs\KP\All Reports\Work in Progress\Hydrogeologic Testing Report\Figures\Figure 5_4 11-11c_11-18 Non Resp.xls 11/12/2008
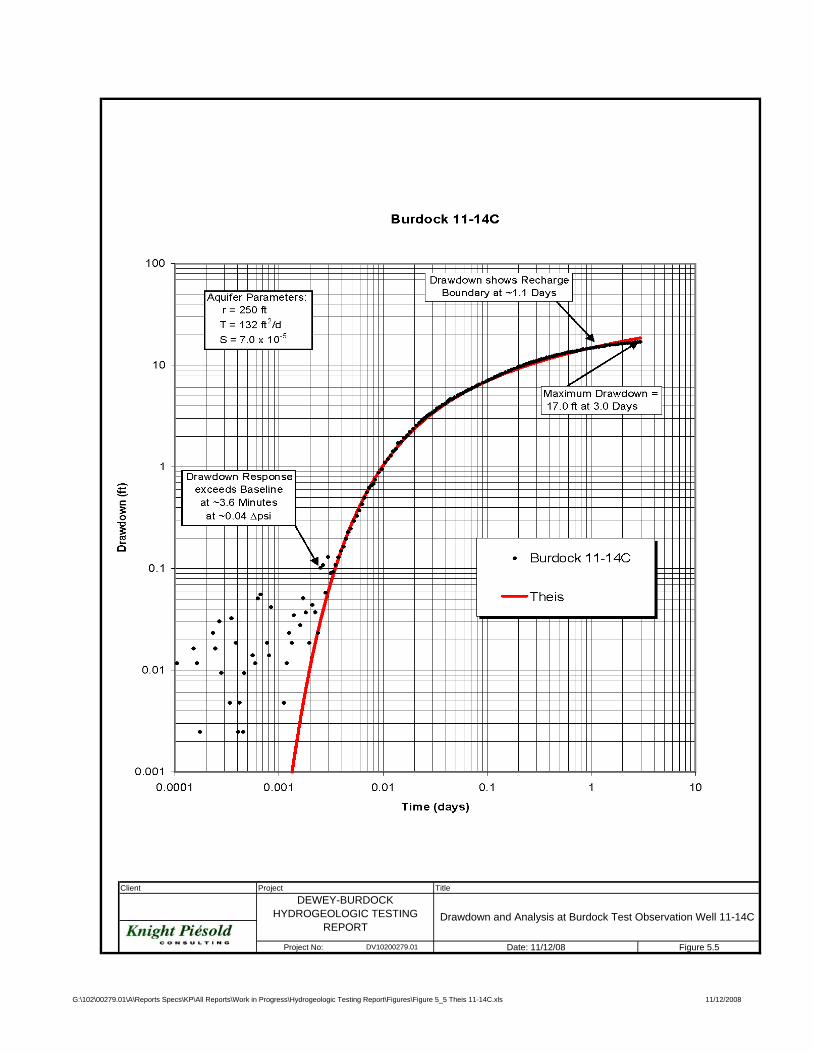
Client Project TitleDEWEY-BURDOCK
HYDROGEOLOGIC TESTINGREPORT
Project No: DV10200279.01 Date: 11/12/08 Figure 5.5
Drawdown and Analysis at Burdock Test Observation Well 11-14C
G:\102\00279.01\A\Reports Specs\KP\All Reports\Work in Progress\Hydrogeologic Testing Report\Figures\Figure 5_5 Theis 11-14C.xls 11/12/2008

Client Project Title
DEWEY-BURDOCKHYDROGEOLOGIC TESTING
REPORTProject No: DV10200279.01 Date: 11/12/08 Figure 5.6
Hantush-Jacob Leaky Confined Aquifer Analysis at Burdock Observation Well11-14C
G:\102\00279.01\A\Reports Specs\KP\All Reports\Work in Progress\Hydrogeologic Testing Report\Figures\Figure 5_6 HJ 11-14C.xls 11/12/2008

Client Project TitleDEWEY-BURDOCK
HYDROGEOLOGIC TESTINGREPORT
Project No: DV10200279.01 Date: 11/12/08 Figure 5.7
Straight-line Analyses of Drawdown and Recovery at Burdock Pumping Well 11-11C
G:\102\00279.01\A\Reports Specs\KP\All Reports\Work in Progress\Hydrogeologic Testing Report\Figures\Figure 5_7 Straight Line Burdock Pump.xls 11/12/2008
Appendix A Additional Information and Analysis Procedures
Appendix A-1: Background Monitoring and
Barometric Efficiency Calculations Appendix A-2 Overview of Aquifer Test Analysis
Procedures and Tools Used

Appendix A-1
Background Monitoring and Barometric Efficiency Calculations
Background Monitoring and Barometric Efficiency Calculations
Pressure transducers were installed in both wells at both sites by April 2, 2008 in order to obtain background ground water level measurements. At the Burdock test site, a transducer was installed in the designated pumping well (DB07-11-11C) in the lower Lakota Formation. At the Dewey test site, a transducer was installed in observation well (DB07-32-4C), screened in the same zone as the pumping well in the lower Fall River Formation.
Figure 3.1 in the text illustrates background measurements before the pumping tests and also the sequence of subsequent test events. The left axis of the figure indicates a narrow range of 1 psi. The background measurements shown on the figure fluctuate over a range of about 0.4 psi.
Converting Pressure Measurements to Head Pressure transducer psi coverts directly to head [feet of water overlying the transducer] according to the relationship:
Head [ft H20] = P [PSI] x 144 in2/ft2 ÷ γH20 [pounds per cubic foot] = P [PSI] x 144/62.48
= P [PSI] x 2.31
Where γ H2O [pounds per cubic foot] is the unit weight of water, ignoring temperature effects.
Therefore, a change in transducer pressure (Δpsi) corresponds to a change in water level of about 2.31 [ft H20] x Δpsi with the same sense of increase or decrease. Total variations in background changes in groundwater levels over the one month period of record on Figure 3.1 (in the text) thus correspond to about 0.9 feet of water, which could be significant, although it will be established that such background variations over the time of a pump test do not significantly affect interpretations of the tests.
As indicated on Figure 3.1 (in the text), more than one month of background measurements were obtained from April 8 to May 9, 2008. However, this was also a period when pump installation and testing produced temporary drawdowns where the psi readings dropped below the scale of the figure.
DV102.00279.01 1 November 12, 2008
App A_1 Background Monitoring_Barometric Efficiency.doc
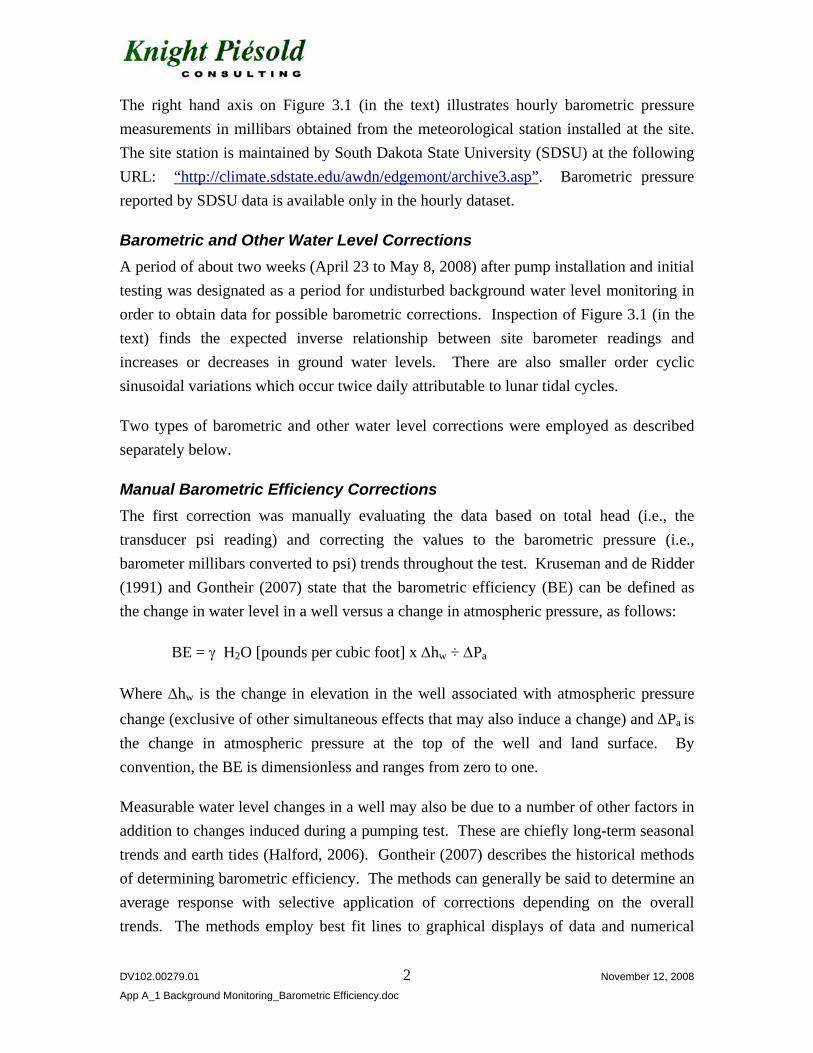
The right hand axis on Figure 3.1 (in the text) illustrates hourly barometric pressure measurements in millibars obtained from the meteorological station installed at the site. The site station is maintained by South Dakota State University (SDSU) at the following URL: “http://climate.sdstate.edu/awdn/edgemont/archive3.asp”. Barometric pressure reported by SDSU data is available only in the hourly dataset.
Barometric and Other Water Level Corrections A period of about two weeks (April 23 to May 8, 2008) after pump installation and initial testing was designated as a period for undisturbed background water level monitoring in order to obtain data for possible barometric corrections. Inspection of Figure 3.1 (in the text) finds the expected inverse relationship between site barometer readings and increases or decreases in ground water levels. There are also smaller order cyclic sinusoidal variations which occur twice daily attributable to lunar tidal cycles.
Two types of barometric and other water level corrections were employed as described separately below.
Manual Barometric Efficiency Corrections The first correction was manually evaluating the data based on total head (i.e., the transducer psi reading) and correcting the values to the barometric pressure (i.e., barometer millibars converted to psi) trends throughout the test. Kruseman and de Ridder (1991) and Gontheir (2007) state that the barometric efficiency (BE) can be defined as the change in water level in a well versus a change in atmospheric pressure, as follows:
BE = γ H2O [pounds per cubic foot] x Δhw ÷ ΔPa
Where Δhw is the change in elevation in the well associated with atmospheric pressure change (exclusive of other simultaneous effects that may also induce a change) and ΔPa is the change in atmospheric pressure at the top of the well and land surface. By convention, the BE is dimensionless and ranges from zero to one.
Measurable water level changes in a well may also be due to a number of other factors in addition to changes induced during a pumping test. These are chiefly long-term seasonal trends and earth tides (Halford, 2006). Gontheir (2007) describes the historical methods of determining barometric efficiency. The methods can generally be said to determine an average response with selective application of corrections depending on the overall trends. The methods employ best fit lines to graphical displays of data and numerical
DV102.00279.01 2 November 12, 2008
App A_1 Background Monitoring_Barometric Efficiency.doc
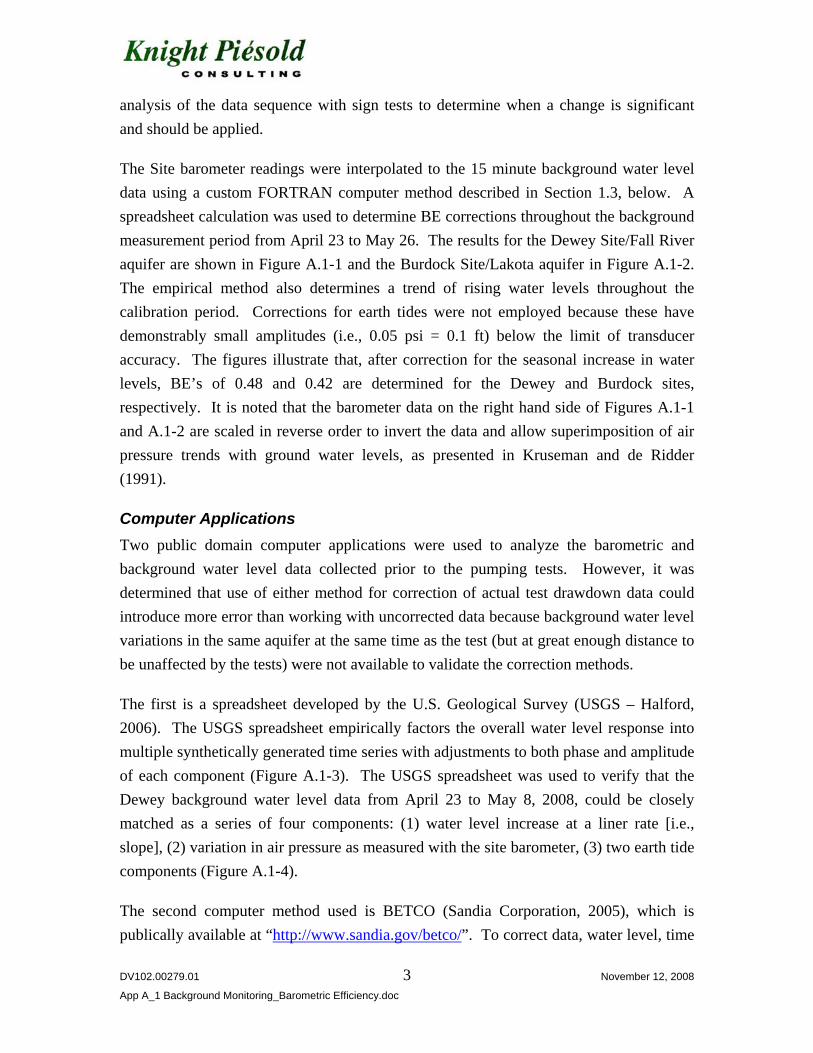
analysis of the data sequence with sign tests to determine when a change is significant and should be applied.
The Site barometer readings were interpolated to the 15 minute background water level data using a custom FORTRAN computer method described in Section 1.3, below. A spreadsheet calculation was used to determine BE corrections throughout the background measurement period from April 23 to May 26. The results for the Dewey Site/Fall River aquifer are shown in Figure A.1-1 and the Burdock Site/Lakota aquifer in Figure A.1-2. The empirical method also determines a trend of rising water levels throughout the calibration period. Corrections for earth tides were not employed because these have demonstrably small amplitudes (i.e., 0.05 psi = 0.1 ft) below the limit of transducer accuracy. The figures illustrate that, after correction for the seasonal increase in water levels, BE’s of 0.48 and 0.42 are determined for the Dewey and Burdock sites, respectively. It is noted that the barometer data on the right hand side of Figures A.1-1 and A.1-2 are scaled in reverse order to invert the data and allow superimposition of air pressure trends with ground water levels, as presented in Kruseman and de Ridder (1991).
Computer Applications Two public domain computer applications were used to analyze the barometric and background water level data collected prior to the pumping tests. However, it was determined that use of either method for correction of actual test drawdown data could introduce more error than working with uncorrected data because background water level variations in the same aquifer at the same time as the test (but at great enough distance to be unaffected by the tests) were not available to validate the correction methods.
The first is a spreadsheet developed by the U.S. Geological Survey (USGS – Halford, 2006). The USGS spreadsheet empirically factors the overall water level response into multiple synthetically generated time series with adjustments to both phase and amplitude of each component (Figure A.1-3). The USGS spreadsheet was used to verify that the Dewey background water level data from April 23 to May 8, 2008, could be closely matched as a series of four components: (1) water level increase at a liner rate [i.e., slope], (2) variation in air pressure as measured with the site barometer, (3) two earth tide components (Figure A.1-4).
The second computer method used is BETCO (Sandia Corporation, 2005), which is publically available at “http://www.sandia.gov/betco/”. To correct data, water level, time
DV102.00279.01 3 November 12, 2008
App A_1 Background Monitoring_Barometric Efficiency.doc
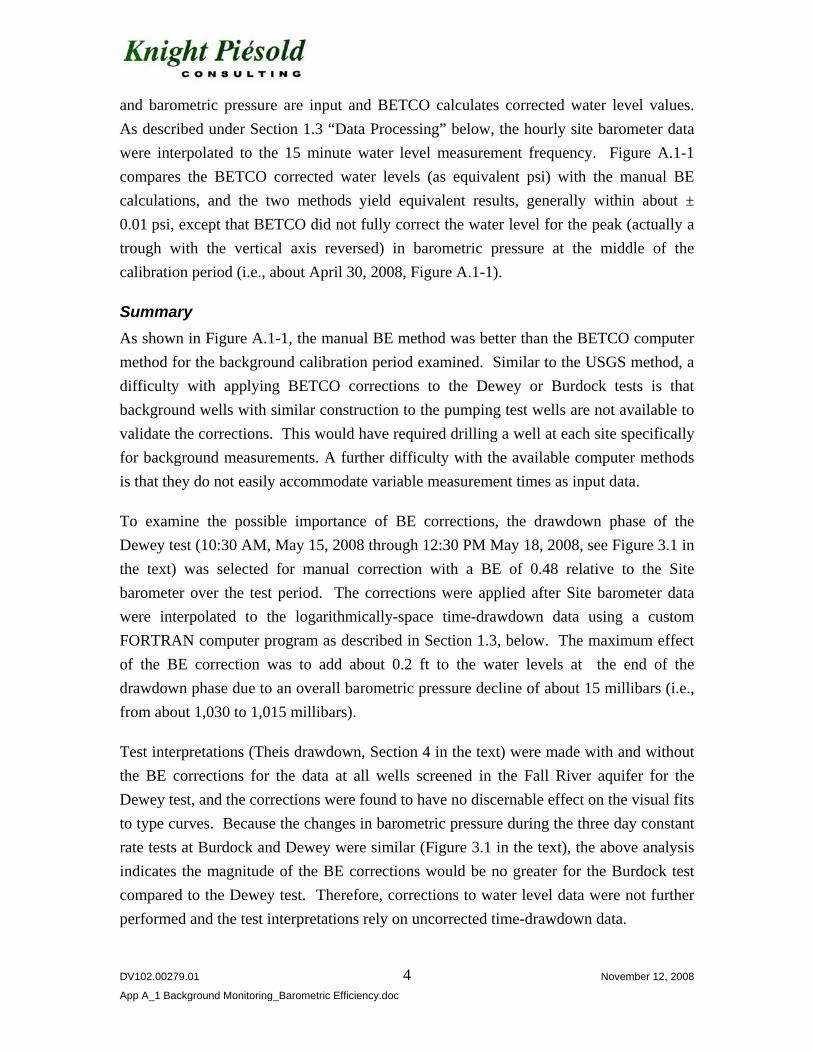
and barometric pressure are input and BETCO calculates corrected water level values. As described under Section 1.3 “Data Processing” below, the hourly site barometer data were interpolated to the 15 minute water level measurement frequency. Figure A.1-1 compares the BETCO corrected water levels (as equivalent psi) with the manual BE calculations, and the two methods yield equivalent results, generally within about ± 0.01 psi, except that BETCO did not fully correct the water level for the peak (actually a trough with the vertical axis reversed) in barometric pressure at the middle of the calibration period (i.e., about April 30, 2008, Figure A.1-1).
Summary As shown in Figure A.1-1, the manual BE method was better than the BETCO computer method for the background calibration period examined. Similar to the USGS method, a difficulty with applying BETCO corrections to the Dewey or Burdock tests is that background wells with similar construction to the pumping test wells are not available to validate the corrections. This would have required drilling a well at each site specifically for background measurements. A further difficulty with the available computer methods is that they do not easily accommodate variable measurement times as input data.
To examine the possible importance of BE corrections, the drawdown phase of the Dewey test (10:30 AM, May 15, 2008 through 12:30 PM May 18, 2008, see Figure 3.1 in the text) was selected for manual correction with a BE of 0.48 relative to the Site barometer over the test period. The corrections were applied after Site barometer data were interpolated to the logarithmically-space time-drawdown data using a custom FORTRAN computer program as described in Section 1.3, below. The maximum effect of the BE correction was to add about 0.2 ft to the water levels at the end of the drawdown phase due to an overall barometric pressure decline of about 15 millibars (i.e., from about 1,030 to 1,015 millibars).
Test interpretations (Theis drawdown, Section 4 in the text) were made with and without the BE corrections for the data at all wells screened in the Fall River aquifer for the Dewey test, and the corrections were found to have no discernable effect on the visual fits to type curves. Because the changes in barometric pressure during the three day constant rate tests at Burdock and Dewey were similar (Figure 3.1 in the text), the above analysis indicates the magnitude of the BE corrections would be no greater for the Burdock test compared to the Dewey test. Therefore, corrections to water level data were not further performed and the test interpretations rely on uncorrected time-drawdown data.
DV102.00279.01 4 November 12, 2008
App A_1 Background Monitoring_Barometric Efficiency.doc

DV102.00279.01 5 November 12, 2008
App A_1 Background Monitoring_Barometric Efficiency.doc
Time-drawdown and Barometer Data Processing The time-drawdown data from the data loggers consisted of two hours of data at one second intervals followed by 72 or 74 hours of data collected at 10-second intervals, with the sequence repeated for the recovery phase. The WinSituTM software exported transducer data logger records to “.csv” files with approximately 60,000 to 70,000 records for each well. The time-drawdown data were processed using a custom FORTRAN program employing a template file specifying which date-time records would be written to an output file. The program cycled through the raw data input file and wrote data records to the output file. The template file was prepared to produce logarithmically spaced data with about 30 records per log cycle (in seconds). Due to slight variations in transducer output and the precision of the Microsoft Excel date-time format, there are some ± 1 second variations in the sequences of records from well to well.
The FORTRAN program for drawdown data also converted transducer psi to drawdown in feet using formulas presented in Section 1.1. The reference value for zero drawdown was set to be the average of all psi readings from the start of the data log to the time just prior to test startup.
Two custom FORTRAN programs were also used to interpolate hourly site barometer readings to (1) the evenly spaced background transducer measurements described in Section 1.2.2 and (2) the logarithmically spaced drawdown data described in Section 1.2.3.
Client Project Title
DEWEY-BURDOCKHYDROGEOLOGIC TESTING
REPORTProject No: DV10200279.01 Date: 10/14/08 Appendix A, Figure A.1-1
Background Water Level and Site Barometer ReadingsDewey/Fall River Barometric Efficiency Calculations
(April 23 to May 8 2008)
Dewey - Fall River Ore Zone Barometric Efficiency Calibration(April 23 to May 8, 2008)
9.8
9.85
9.9
9.95
10
10.05
10.1
10.15
4/22/2008 12AM
4/24/2008 12AM
4/26/2008 12AM
4/28/2008 12AM
4/30/2008 12AM
5/2/2008 12AM
5/4/2008 12AM
5/6/2008 12AM
5/8/2008 12AM
5/10/2008 12AM
Date Time
Wat
er L
evel
(Tra
nsdu
cer)
PSI
6.95
7
7.05
7.1
7.15
7.2
7.25
Adj
uste
d B
arom
etric
Pre
ssur
e (p
si)-R
ever
se S
cale
)
32-4C Uncorrected Transducer PSI 32-4C Corrected to BE = 0.48 and Slope = 0.135 psi 32-4C Corrected with BETCO Software Site Barometric Pressure x BE = 0.48
Barometric Efficiency of 0.48 with 0.135 psi increase
in Water Level over 2 Week Period
G:\102\00279.01\A\Reports Specs\KP\All Reports\Work in Progress\Hydrogeologic Testing Report\Appendices\Appendix A\Figure App A_1-1 Dewey BE.xls 10/14/2008
Client Project Title
DEWEY-BURDOCKHYDROGEOLOGIC TESTING
REPORTProject No: DV10200279.01 Date: 10/14/08 Appendix A, Figure A.1-2
Background Water Level and Site Barometer ReadingsBurdock/Lakota Barometric Efficiency Calculations
(April 23 to May 8 2008)
Burdock - Lakota [Chilson] Barometric Efficiency Calibration(April 23 to May 8, 2008)
81.88
81.9
81.92
81.94
81.96
81.98
82
82.02
82.04
82.06
82.08
82.1
39560 39562 39564 39566 39568 39570 39572 39574 39576 39578Date Time
Wat
er L
evel
(Tra
nsdu
cer)
PSI
6.1
6.15
6.2
6.25
6.3
6.35
Adj
uste
d B
arom
etric
Pre
ssur
e (p
si)-R
ever
se S
cale
11-11C Uncorrected Transducer PSI 11-11C Corrected to BE = 0.42 and Slope = 0.085 psi
Site Barometric Pressure x BE = 0.42
Barometric Efficiency of 0.42 with 0.085 psi increase
in Water Level over 2 Week Period
G:\102\00279.01\A\Reports Specs\KP\All Reports\Work in Progress\Hydrogeologic Testing Report\Appendices\Appendix A\Figure App A_1-2 Burdock BE.xls 10/14/2008
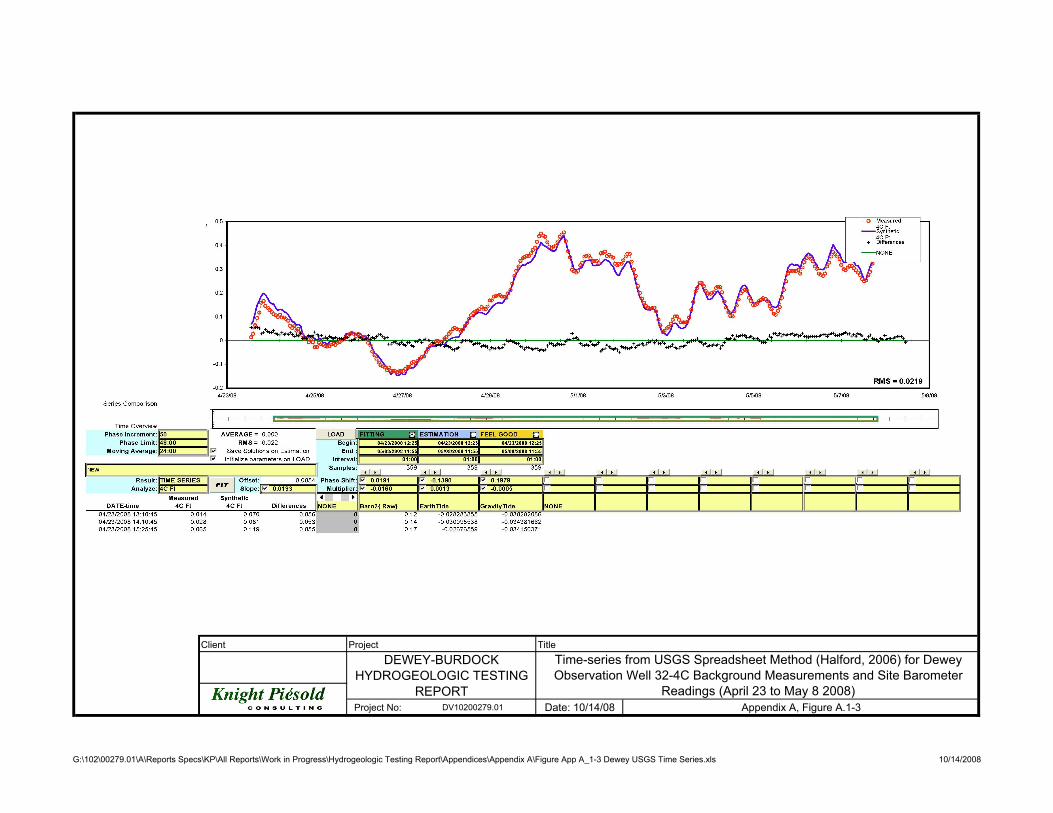
Client Project Title
DEWEY-BURDOCKHYDROGEOLOGIC TESTING
REPORTProject No: DV10200279.01 Date: 10/14/08 Appendix A, Figure A.1-3
Time-series from USGS Spreadsheet Method (Halford, 2006) for Dewey Observation Well 32-4C Background Measurements and Site Barometer
Readings (April 23 to May 8 2008)
G:\102\00279.01\A\Reports Specs\KP\All Reports\Work in Progress\Hydrogeologic Testing Report\Appendices\Appendix A\Figure App A_1-3 Dewey USGS Time Series.xls 10/14/2008
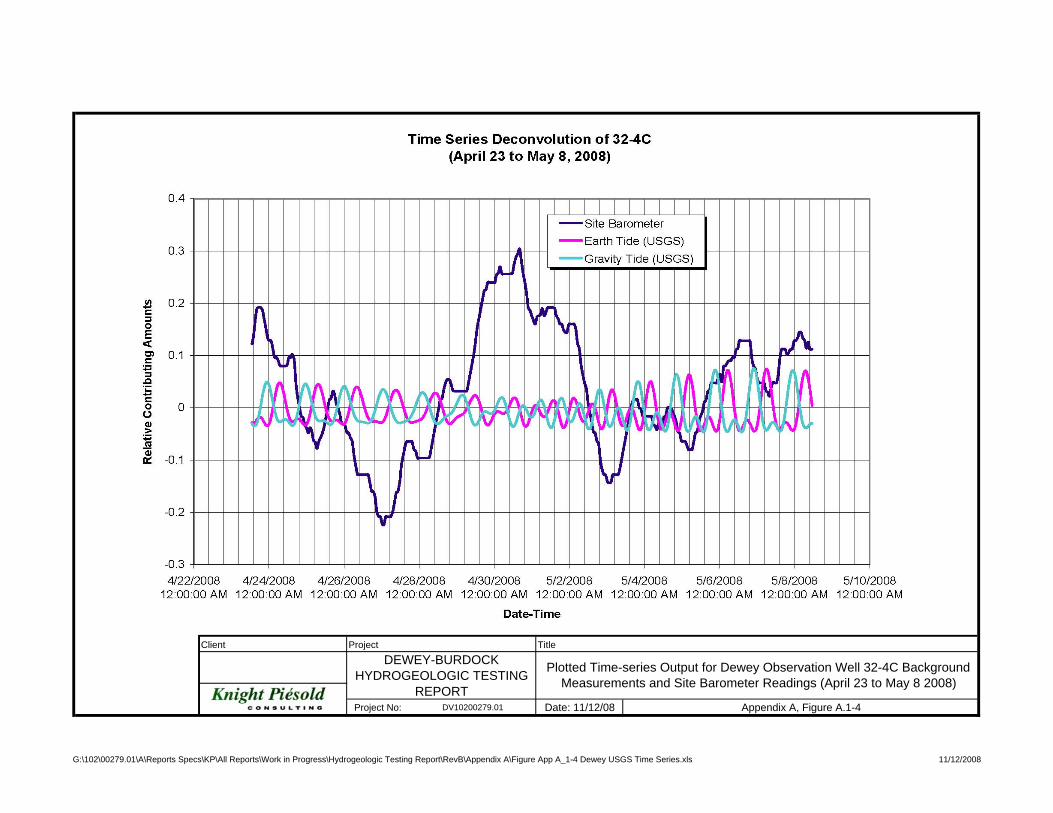
Client Project Title
DEWEY-BURDOCKHYDROGEOLOGIC TESTING
REPORTProject No: DV10200279.01 Date: 11/12/08 Appendix A, Figure A.1-4
Plotted Time-series Output for Dewey Observation Well 32-4C Background Measurements and Site Barometer Readings (April 23 to May 8 2008)
G:\102\00279.01\A\Reports Specs\KP\All Reports\Work in Progress\Hydrogeologic Testing Report\RevB\Appendix A\Figure App A_1-4 Dewey USGS Time Series.xls 11/12/2008

Appendix A-2
Overview of Aquifer Test Analysis Procedures and Tools Used
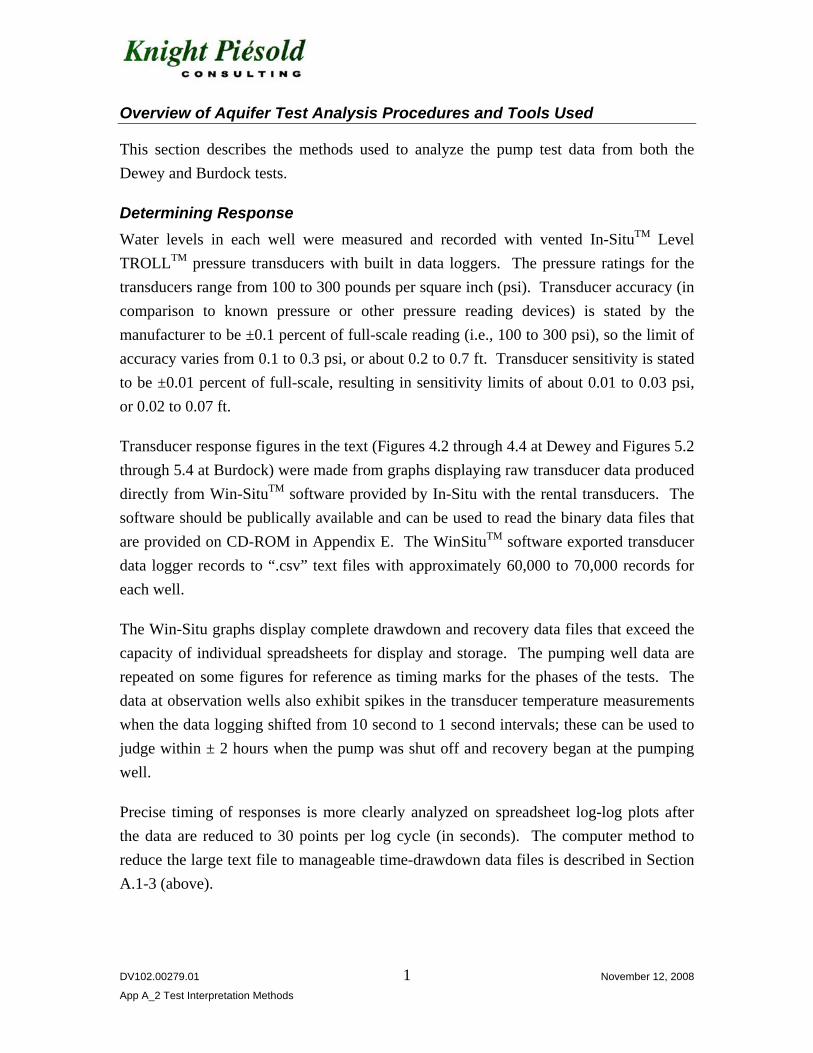
DV102.00279.01 1 November 12, 2008
App A_2 Test Interpretation Methods
Overview of Aquifer Test Analysis Procedures and Tools Used
This section describes the methods used to analyze the pump test data from both the Dewey and Burdock tests.
Determining Response Water levels in each well were measured and recorded with vented In-SituTM Level TROLLTM pressure transducers with built in data loggers. The pressure ratings for the transducers range from 100 to 300 pounds per square inch (psi). Transducer accuracy (in comparison to known pressure or other pressure reading devices) is stated by the manufacturer to be ±0.1 percent of full-scale reading (i.e., 100 to 300 psi), so the limit of accuracy varies from 0.1 to 0.3 psi, or about 0.2 to 0.7 ft. Transducer sensitivity is stated to be ±0.01 percent of full-scale, resulting in sensitivity limits of about 0.01 to 0.03 psi, or 0.02 to 0.07 ft.
Transducer response figures in the text (Figures 4.2 through 4.4 at Dewey and Figures 5.2 through 5.4 at Burdock) were made from graphs displaying raw transducer data produced directly from Win-SituTM software provided by In-Situ with the rental transducers. The software should be publically available and can be used to read the binary data files that are provided on CD-ROM in Appendix E. The WinSituTM software exported transducer data logger records to “.csv” text files with approximately 60,000 to 70,000 records for each well.
The Win-Situ graphs display complete drawdown and recovery data files that exceed the capacity of individual spreadsheets for display and storage. The pumping well data are repeated on some figures for reference as timing marks for the phases of the tests. The data at observation wells also exhibit spikes in the transducer temperature measurements when the data logging shifted from 10 second to 1 second intervals; these can be used to judge within ± 2 hours when the pump was shut off and recovery began at the pumping well.
Precise timing of responses is more clearly analyzed on spreadsheet log-log plots after the data are reduced to 30 points per log cycle (in seconds). The computer method to reduce the large text file to manageable time-drawdown data files is described in Section A.1-3 (above).
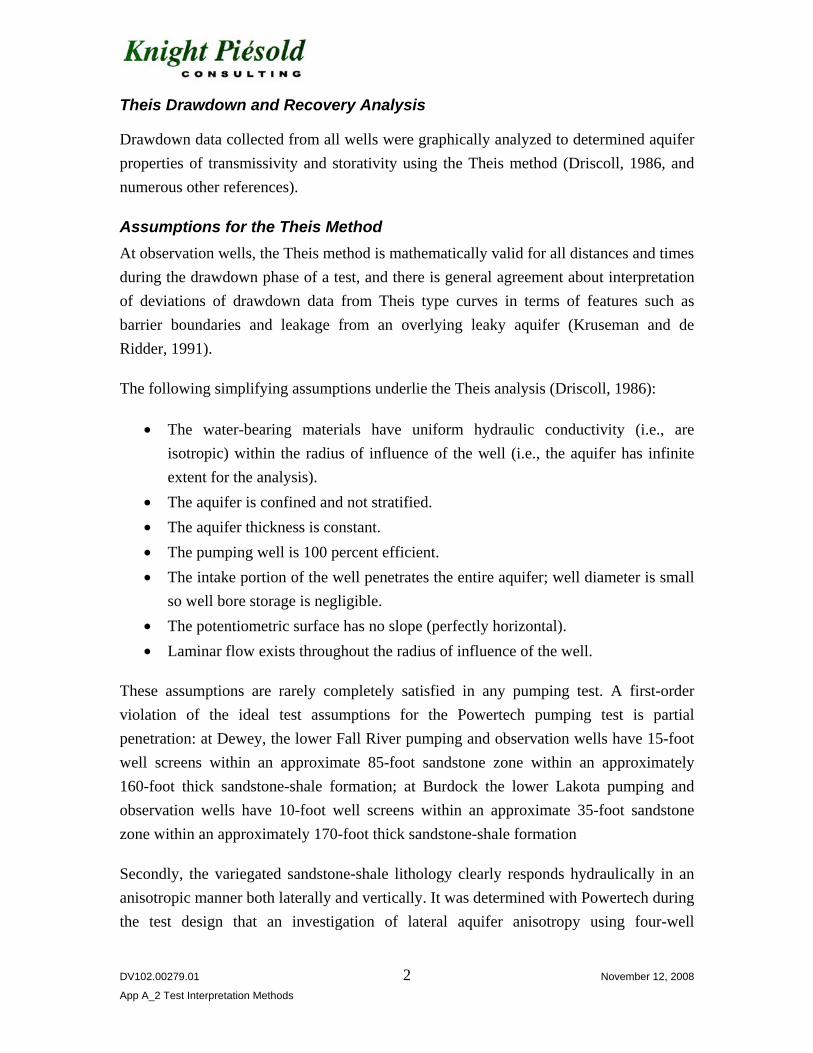
DV102.00279.01 2 November 12, 2008
App A_2 Test Interpretation Methods
Theis Drawdown and Recovery Analysis
Drawdown data collected from all wells were graphically analyzed to determined aquifer properties of transmissivity and storativity using the Theis method (Driscoll, 1986, and numerous other references).
Assumptions for the Theis Method At observation wells, the Theis method is mathematically valid for all distances and times during the drawdown phase of a test, and there is general agreement about interpretation of deviations of drawdown data from Theis type curves in terms of features such as barrier boundaries and leakage from an overlying leaky aquifer (Kruseman and de Ridder, 1991).
The following simplifying assumptions underlie the Theis analysis (Driscoll, 1986):
• The water-bearing materials have uniform hydraulic conductivity (i.e., are isotropic) within the radius of influence of the well (i.e., the aquifer has infinite extent for the analysis).
• The aquifer is confined and not stratified. • The aquifer thickness is constant. • The pumping well is 100 percent efficient. • The intake portion of the well penetrates the entire aquifer; well diameter is small
so well bore storage is negligible. • The potentiometric surface has no slope (perfectly horizontal). • Laminar flow exists throughout the radius of influence of the well.
These assumptions are rarely completely satisfied in any pumping test. A first-order violation of the ideal test assumptions for the Powertech pumping test is partial penetration: at Dewey, the lower Fall River pumping and observation wells have 15-foot well screens within an approximate 85-foot sandstone zone within an approximately 160-foot thick sandstone-shale formation; at Burdock the lower Lakota pumping and observation wells have 10-foot well screens within an approximate 35-foot sandstone zone within an approximately 170-foot thick sandstone-shale formation
Secondly, the variegated sandstone-shale lithology clearly responds hydraulically in an anisotropic manner both laterally and vertically. It was determined with Powertech during the test design that an investigation of lateral aquifer anisotropy using four-well

DV102.00279.01 3 November 12, 2008
App A_2 Test Interpretation Methods
triangulation was not warranted. The test design did investigate vertical anisotropy within each aquifer.
Pumping Test Design and Objectives As noted in the pumping test work plan, (Knight Piesold, 2008), interpretation of test results with the above non-ideal conditions may result in uncertainties in the estimated transmissivity and storativity values. Reasons for conducting the 2008 tests with conditions contrary to the Theis assumptions were as follows:
• Powertech expects that the operational well field screens will be completed in ore, and the thickness of the ore determines the screen interval.
• The pump test was designed to see what flow could be expected in the wellfield. • There are multiple ore zones (e.g., three ore zones in the Fall River at Dewey) and
each one will have its own well screens, so one ore zone was picked to test. • At new mines there are usually two pump tests, one to get regional aquifer
characteristics and a second one to test the ore zone characteristics. • The previous TVA tests constitute regional tests and had already been
successfully conducted using pumping and observation wells more closely fully penetrating the entire aquifer.
• In comparison with the TVA tests, these newer tests would offer valuable differential diagnostic information.
Theis Analysis Methods Theis analysis was initially performed in spreadsheets developed by Knight Piesold that allow interactive entry of transmissivity and storativity to calculate the dimensional version of the type curve that matches time-drawdown data (e.g., Figures 4.5 and 5.5 in the text). Theis analysis was expanded to use using automated curve matching in commercial AquiferWin32TM software (ESI, 2003). The software also performed Hantush-Jacob drawdown analysis as described in the text. In automated drawdown analysis samples are weighted as follows: samples before the first response are ignored, and samples after the first occurrence of the barrier or leakage boundary are ignored.
The AquiferWin32TM software was also used to analyze recovery data with the straight-line Theis recovery procedures, with theoretical considerations described in greater detail below. Samples are weighted according to (1) the theoretical criterion that u’ be < 0.01, which restricts the data to later-time (to the left on the t/t’ axis); and (2) the portion of the recovery before the change in slope due to a barrier or recharge boundary is used. Data
DV102.00279.01 4 November 12, 2008
App A_2 Test Interpretation Methods
not satisfying u’ < 0.01 or obtained after a boundary was encountered were weighted to be ignored.
The analysis of data from the pumping wells is complicated by well losses due to well inefficiency, partial penetration effects, and drawdown modified by borehole storage. This is accounted for in Theis drawdown analyses by fitting just the later time data (at pumping wells) to the type curve. This is done with the AquiferWin32TM software by assigning sample weights to data after the time at which borehole storage becomes negligible.
Driscoll (1986) provides an empirical formula for determining the time at which borehole storage effect become negligible, as follows:
tc = 0.6 (dc2 – dp2) divided by Q/s
Where tc is time in minutes, dc is the inside diameter of the well casing in inches, dp is the outside diameter of the pump column pipe in inches, and Q/s is the specific capacity of the well in gpm per foot of drawdown at time tc. Calculated times were 21 minutes for the pumping well at Dewey and 50 minutes at Burdock.
Theis-Cooper-Jacob Straight-line Analysis Spreadsheets are published by the U.S. Geological Survey (USGS) with sophisticated programming for the analysis of aquifer test data (Halford and Kuniansky, 2002). These were used for most straight-line analyses of the tests.
Straight-line Drawdown Analysis A USGS spreadsheet for drawdown analysis with the Cooper-Jacob straight-line approximation was used for the drawdown phase at the pumping wells. Another USGS spreadsheet programmed for Theis Recovery analysis with the straight-line approximation was used to analyze the recovery data at all wells.
The Theis method is linearized with the Cooper-Jacob straight-line approximation (Halford and Kuniansky, 2002). The approximation is only valid at later times as determined by u or u', the relationship of aquifer parameters with distance from the pumping well (r) and elapsed time t or t' (where t and u refer to the time from the start of pumping and t’ and u’ to the time from the cessation of pumping), as follows:
u or u’ = (r2 x S) ÷ [4 x T x (t or t’ )] and u or u’ < 0.01.

DV102.00279.01 5 November 12, 2008
App A_2 Test Interpretation Methods
For a pumping well the distance becomes the radius of the casing (rc) which is small, and to obtain a time criterion (tc or tc’ where the straight-line approximation is theoretically valid), the above relationship is inverted by setting u or u' <= 0.01 and S = 1 x 10⁻⁴, yielding (Halford and Kuniansky, 2002):
4 x (t or t') x 0.01 >= rc2 x 10-4 ÷ T
tc or tc' >= 100 x rc2 ÷ (4 x T)
tc or tc' >= 25 x rc2 ÷ T
The calculation of tc or tc’ gives a criterion for theoretically valid data at the pumping well in terms of time, and similarly for u or u’ for observation wells. In this report only transmissivity is determined by the straight-line methods. The drawdown phase and Theis or Hantush-Jacob type-curve analysis are used to determine storativity. To calculate u or u’ at observation wells, the storativity result from the drawdown phase is used. At the pumping wells, a storativity of 1 x 10⁻⁴ is assumed.
The USGS spreadsheet allows interactive determination of transmissivity by moving the yellow endpoints of the red line to match the desired slope (see red lines between yellow endpoints on Figures 4.7 and 5.7 in the text). The USGS spreadsheet has been modified to also calculate the value of u or u’ and tc or tc’, and the length of the straight line has been manually set on the figures to approximately correspond to data ranges where the critical values are met. The figures thus indicate the data where the straight-line solutions are theoretically valid, which aids in visually determining which portions of the plots to use for analysis.
The analysis of data from the pumping well is complicated by well losses due to well inefficiency, partial penetration effects, and drawdown modified by borehole storage. The straight-line approximation with the tc criterion described above is used in the USGS spreadsheet to select the late-time data during the drawdown phase at pumping wells. This is because at later times borehole storage and partial penetration effects are eliminated and change in drawdown and the straight-line slope are due to aquifer transmissivity rather than the fixed offset due to well losses (Halford and Kuniansky, 2002). The USGS spreadsheet determines transmissivity and well efficiency, with the efficiency based on the theoretical drawdown with the assumed storativity of 1.0 x 10⁻⁴.

DV102.00279.01 6 November 12, 2008
App A_2 Test Interpretation Methods
Straight-line Recovery Analysis The analysis of recovery data involves the measurement of the rise in water levels referred to as residual drawdown. The method determines the Δs’, the change in residual drawdown over one log cycle of t/t’, where t is the time from the start of pumping and t’ is the time from the cessation of pumping. Figures 4.7 and 5.7 in the text illustrate the Theis recovery analysis at the pumping wells. On each recovery analysis figure the data range where the tc' or u' criteria is satisfied (see red lines between yellow endpoints on Figures 4.7 and 5.7 in the text) are indicated together with the transmissivity reported by the USGS spreadsheet.
Distance Drawdown Analysis Distance-drawdown analysis (Driscoll, 1986) was performed to determine average aquifer parameters using all appropriate observation wells simultaneously and also to determine a pumping well efficiency. The distance drawdown analysis relies on the same Cooper-Jacob straight-line approximation as described above, although according to Driscoll (1986) the value of u can be as great as 0.05. The value of u is calculated using the storativity of the observation wells determined in the Theis drawdown analysis. The aquifer parameters are determined by calculating Δs, the change in drawdown along the straight line over one log cycle, and r0 which is the intercept at zero drawdown.
On a linear graph (see top portions of Figures 4.8 and 5.8 in the text), plotting the maximum drawdown in observation wells at the same time should map a profile of the cone of depression surrounding the pumped well. On a semi-log graph (bottom portions of Figures 4.8 and 5.8 in the text) there should theoretically be a straight line through the data points, except at the greatest distance from the pumping well where u is likely to be > 0.05 (Driscoll, 1986).

Appendix B Dewey Test Supplemental Information
Appendix B-1: Well Completion Diagrams Appendix B-2: Time and Water Level Data Values Used in
Pumping Test Analysis: Dewey Test, Drawdown Data
Appendix B-3: Time and Water Level Data Values Used in
Pumping Test Analysis: Dewey Test, Recover Data
Appendix B-4: Additional Aquifer Parameter
Determinations

Appendix B-1 Well Completion Diagrams

POWERTECH WELL AND PUMP DATA
Location of Well Dewey, SD
Drilling Contractor Davis Drilling Driller
Tony Well Name DB07-32-3C
County Custer Type of Rig
Drilling Fluid mud Well Depth 600'
LAT 4815593N LONG 578732E Elevation 3635'' Screened Monitoring Well Completion Detail
Datum point from which all measurements are taken
Method of Drilling Date: 11/27/07 Cabel Tool Hollow Rod Direct Rotary Air Rotary Bucket Auger Reverse Rotary Flight Auger Jetted Dug Driven Other mud rotary
Use Domestic Public Supply Industrial Irrigation Municipal Commercial Test Well Heating or Cooling Monitoring Other
One well volume (V) = gallons
Initial Development Water Water Level (TIC) Well Depth Color Odor Clarity Developed By Date Well Development Date Description of Development Technique
Pump Date Installed Type Manufacturer Model No. H.P. Volts Capacity Depth of Pump Intake Setting No. of Stages Oil Water Lubrication Power Source Material of drop pipe Bowls Shafting Impellors Bowl Diameter Column Pipe Diameter Length Modification
Screened Well No.
A. Stick-up Length 2.0'
B. Key No. NA
C. Protective Casing Diameter NA Material NA Length NA Depth to Bottom NA
D. Surface Completion Diameter NA Depth NA Material NA
E. Well Casing Data Diameter 6" ID Material PVC Length 587' Weight SCH 40 Depth to Bottom 585'
F. Grout cement Date 11/29/07 Depth to Top 0' Depth to Bottom 587' Material sulfate resis. cement Density 15.1 lb/gal Volume 21.5 bbls % Excess 70 Method of Installation displacement Depth to Cement in Casing 505' Return Constant Yes No Volume of Grout Return 0
G. Borehole Diameter Drilling Dates 8.75" 11/28/07
H. Pack Type/SizeNA Date NA Depth to Top NA Depth to Bottom Material Method of Installation Gradation
I. Screen Date 1/27/08 Depth to Top 585-600'' Depth to Bottom Manufacturer Material PVC Slot .01"
J. Bottom Cap Material PVC Length 1" Driller Tommy
Boring Depth 630''
Additional Information
******Mechanical Integrity Test******
Geophysical Logs Run Gamma, Resistivity, SP, ran 11/27/07
Water Quality Sample taken? Yes No Where analyzed?
PSI Increments Calibration Date of Gage PSI Full Scale Test Run By Stan Davis, Len Eakin Date Test Run 1/25/08 Time Beginning of Test 800 Time End of Test 1000 Initial Pressure 35.0 PSIG Initial Fluid Level 4.0 inches
Final Pressure 35.0 PSIG Final Fluid Level 4.0inches Date well completed 1/27/08
GroundSurface
A
C
D
G
H
I
J
K
B
E
F
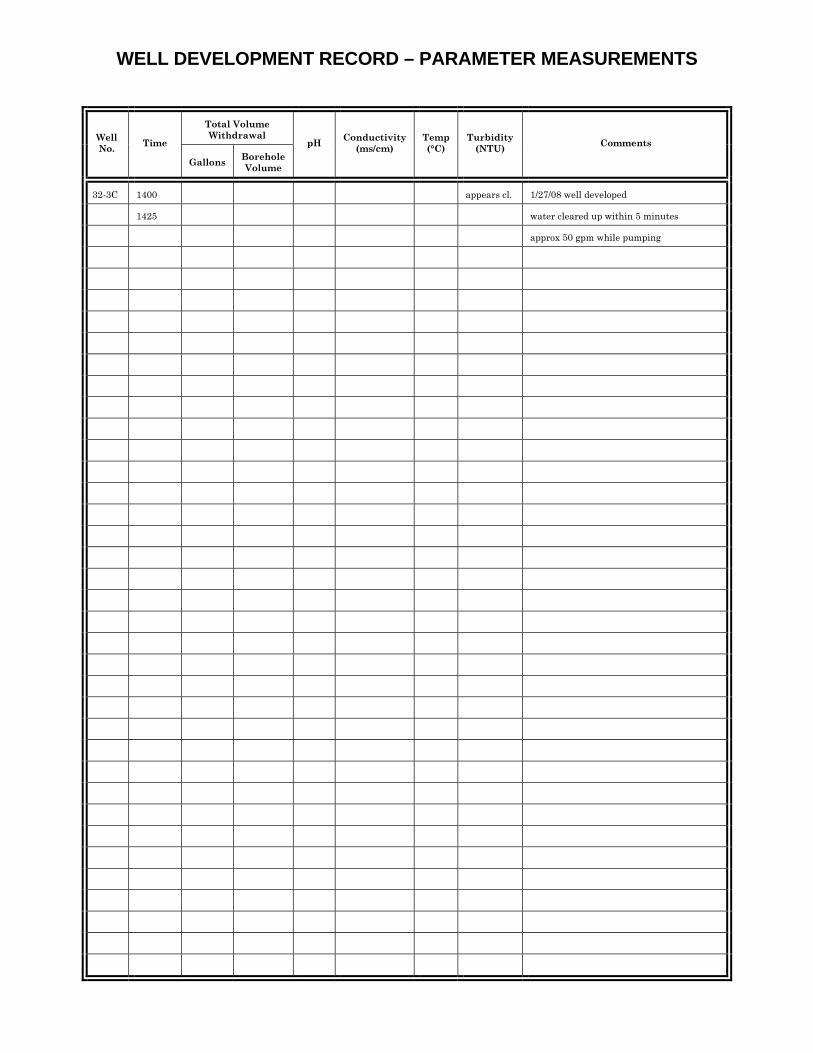
WELL DEVELOPMENT RECORD – PARAMETER MEASUREMENTS
Total Volume Withdrawal Well
No. Time
Gallons Borehole Volume
pH Conductivity (ms/cm)
Temp (°C)
Turbidity (NTU) Comments
32-3C 1400 appears cl. 1/27/08 well developed
1425 water cleared up within 5 minutes
approx 50 gpm while pumping

POWERTECH WELL AND PUMP DATA
Location of Well Dewey, SD
Drilling Contractor Davis Drilling Driller
Tony Well Name DB07-32-5
County Custer Type of Rig
Drilling Fluid mud Well Depth 608'
LAT 4815588N LONG 578650E Elevation 3628' Screened Monitoring Well Completion Detail
Datum point from which all measurements are taken
Method of Drilling Date: 11/17/07 Cabel Tool Hollow Rod Direct Rotary Air Rotary Bucket Auger Reverse Rotary Flight Auger Jetted Dug Driven Other mud rotary
Use Domestic Public Supply Industrial Irrigation Municipal Commercial Test Well Heating or Cooling Monitoring Other
One well volume (V) = gallons
Initial Development Water Water Level (TIC) Well Depth Color Odor Clarity Developed By Date Well Development Date Description of Development Technique
Pump Date Installed Type Manufacturer Model No. H.P. Volts Capacity Depth of Pump Intake Setting No. of Stages Oil Water Lubrication Power Source Material of drop pipe Bowls Shafting Impellors Bowl Diameter Column Pipe Diameter Length Modification
Screened Well No.
A. Stick-up Length 2.0'
B. Key No. NA
C. Protective Casing Diameter NA Material NA Length NA Depth to Bottom NA
D. Surface Completion Diameter NA Depth NA Material NA
E. Well Casing Data Diameter 4" ID Material PVC Length 595' Weight SCH 40 Depth to Bottom 593'
F. Grout cement Date 11/17/07 Depth to Top 0' Depth to Bottom 593' Material sulfate resis. cement Density 15.2b/gal Volume 13.4 bbls % Excess 60 Method of Installation displacement Depth to Cement in Casing 520' Return Constant Yes No Volume of Grout Return 0
G. Borehole Diameter Drilling Dates 6.25" 11/17/07
H. Pack Type/SizeNA Date NA Depth to Top NA Depth to Bottom Material Method of Installation Gradation
I. Screen Date 2/6/08 Depth to Top 593-608' Depth to Bottom Manufacturer Material PVC Slot .01"
J. Bottom Cap Material PVC Length 1" Driller Tommy
Boring Depth 634'
Additional Information
******Mechanical Integrity Test******
Geophysical Logs Run Gamma, Resistivity, SP, ran 11/17/07
Water Quality Sample taken? Yes No Where analyzed?
PSI Increments Calibration Date of Gage PSI Full Scale Test Run By Stan Davis, Len Eakin Date Test Run 2/5/08 Time Beginning of Test 0900 Time End of Test 1100 Initial Pressure 35.0 PSIG Initial Fluid Level 5.0 inches
Final Pressure 35.0 PSIG Final Fluid Level 5.0inches Date well completed 2/6/08
GroundSurface
A
C
D
G
H
I
J
K
B
E
F

WELL DEVELOPMENT RECORD – PARAMETER MEASUREMENTS
Total Volume Withdrawal Well
No. Time
Gallons Borehole Volume
pH Conductivity (ms/cm)
Temp (°C)
Turbidity (NTU) Comments
32-5 1500 appears cl. 2/6/08 well developed
1535 water cleared up within 5 minutes
approx 20 gpm while pumping
220psi kickoff, 130psi sustained
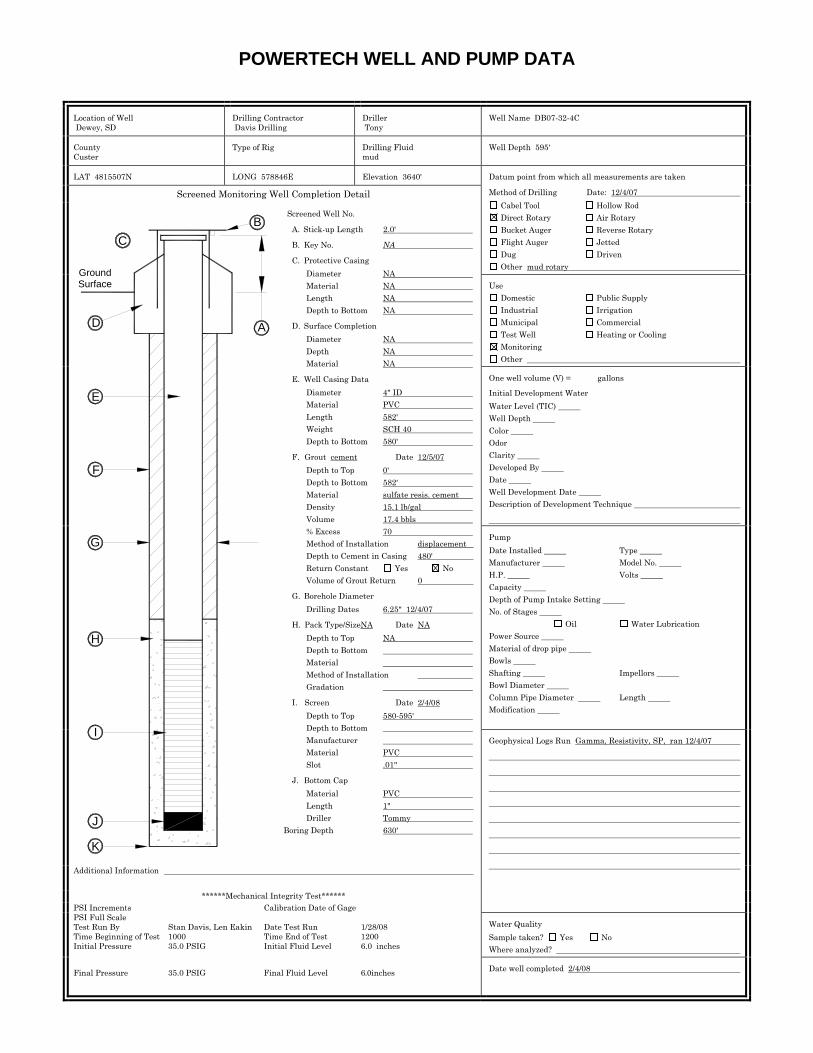
POWERTECH WELL AND PUMP DATA
Location of Well Dewey, SD
Drilling Contractor Davis Drilling Driller
Tony Well Name DB07-32-4C
County Custer Type of Rig
Drilling Fluid mud Well Depth 595'
LAT 4815507N LONG 578846E Elevation 3640' Screened Monitoring Well Completion Detail
Datum point from which all measurements are taken
Method of Drilling Date: 12/4/07 Cabel Tool Hollow Rod Direct Rotary Air Rotary Bucket Auger Reverse Rotary Flight Auger Jetted Dug Driven Other mud rotary
Use Domestic Public Supply Industrial Irrigation Municipal Commercial Test Well Heating or Cooling Monitoring Other
One well volume (V) = gallons
Initial Development Water Water Level (TIC) Well Depth Color Odor Clarity Developed By Date Well Development Date Description of Development Technique
Pump Date Installed Type Manufacturer Model No. H.P. Volts Capacity Depth of Pump Intake Setting No. of Stages Oil Water Lubrication Power Source Material of drop pipe Bowls Shafting Impellors Bowl Diameter Column Pipe Diameter Length Modification
Screened Well No.
A. Stick-up Length 2.0'
B. Key No. NA
C. Protective Casing Diameter NA Material NA Length NA Depth to Bottom NA
D. Surface Completion Diameter NA Depth NA Material NA
E. Well Casing Data Diameter 4" ID Material PVC Length 582' Weight SCH 40 Depth to Bottom 580'
F. Grout cement Date 12/5/07 Depth to Top 0' Depth to Bottom 582' Material sulfate resis. cement Density 15.1 lb/gal Volume 17.4 bbls % Excess 70 Method of Installation displacement Depth to Cement in Casing 480' Return Constant Yes No Volume of Grout Return 0
G. Borehole Diameter Drilling Dates 6.25" 12/4/07
H. Pack Type/SizeNA Date NA Depth to Top NA Depth to Bottom Material Method of Installation Gradation
I. Screen Date 2/4/08 Depth to Top 580-595' Depth to Bottom Manufacturer Material PVC Slot .01"
J. Bottom Cap Material PVC Length 1" Driller Tommy
Boring Depth 630'
Additional Information
******Mechanical Integrity Test******
Geophysical Logs Run Gamma, Resistivity, SP, ran 12/4/07
Water Quality Sample taken? Yes No Where analyzed?
PSI Increments Calibration Date of Gage PSI Full Scale Test Run By Stan Davis, Len Eakin Date Test Run 1/28/08 Time Beginning of Test 1000 Time End of Test 1200 Initial Pressure 35.0 PSIG Initial Fluid Level 6.0 inches
Final Pressure 35.0 PSIG Final Fluid Level 6.0inches Date well completed 2/4/08
GroundSurface
A
C
D
G
H
I
J
K
B
E
F
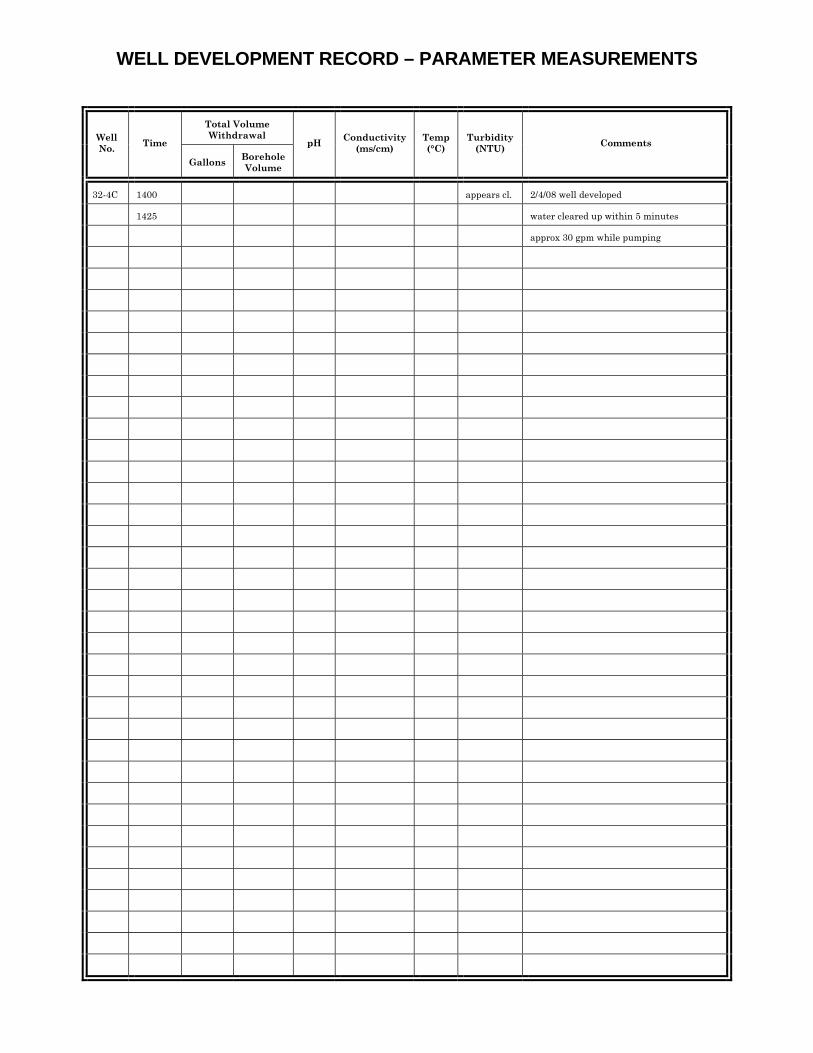
WELL DEVELOPMENT RECORD – PARAMETER MEASUREMENTS
Total Volume Withdrawal Well
No. Time
Gallons Borehole Volume
pH Conductivity (ms/cm)
Temp (°C)
Turbidity (NTU) Comments
32-4C 1400 appears cl. 2/4/08 well developed
1425 water cleared up within 5 minutes
approx 30 gpm while pumping

POWERTECH WELL AND PUMP DATA
Location of Well Dewey, SD
Drilling Contractor Davis Drilling Driller
Tony Well Name DB07-29-7
County Custer Type of Rig
Drilling Fluid mud Well Depth 650'
LAT 4816313N LONG 578652E Elevation 3703' Screened Monitoring Well Completion Detail
Datum point from which all measurements are taken
Method of Drilling Date: 11/20/07 Cabel Tool Hollow Rod Direct Rotary Air Rotary Bucket Auger Reverse Rotary Flight Auger Jetted Dug Driven Other mud rotary
Use Domestic Public Supply Industrial Irrigation Municipal Commercial Test Well Heating or Cooling Monitoring Other
One well volume (V) = gallons
Initial Development Water Water Level (TIC) Well Depth Color Odor Clarity Developed By Date Well Development Date Description of Development Technique
Pump Date Installed Type Manufacturer Model No. H.P. Volts Capacity Depth of Pump Intake Setting No. of Stages Oil Water Lubrication Power Source Material of drop pipe Bowls Shafting Impellors Bowl Diameter Column Pipe Diameter Length Modification
Screened Well No.
A. Stick-up Length 2.0'
B. Key No. NA
C. Protective Casing Diameter NA Material NA Length NA Depth to Bottom NA
D. Surface Completion Diameter NA Depth NA Material NA
E. Well Casing Data Diameter 4" ID Material PVC Length 637' Weight SCH 40 Depth to Bottom 635'
F. Grout cement Date 11/20/07 Depth to Top 0' Depth to Bottom 593' Material sulfate resis. cement Density 15.2b/gal Volume 17.2 bbls % Excess 70 Method of Installation displacement Depth to Cement in Casing 550' Return Constant Yes No Volume of Grout Return 0
G. Borehole Diameter Drilling Dates 6.25" 11/20/07
H. Pack Type/SizeNA Date NA Depth to Top NA Depth to Bottom Material Method of Installation Gradation
I. Screen Date 2/8/08 Depth to Top 635-650' Depth to Bottom Manufacturer Material PVC Slot .01"
J. Bottom Cap Material PVC Length 1" Driller Tony
Boring Depth 660'
Additional Information
******Mechanical Integrity Test******
Geophysical Logs Run Gamma, Resistivity, SP, ran 11/20/07
Water Quality Sample taken? Yes No Where analyzed?
PSI Increments Calibration Date of Gage PSI Full Scale Test Run By Stan Davis, Len Eakin Date Test Run 2/7/08 Time Beginning of Test 0930 Time End of Test 1130 Initial Pressure 35.0 PSIG Initial Fluid Level 5.0 inches
Final Pressure 35.0 PSIG Final Fluid Level 5.0inches Date well completed 2/8/08
GroundSurface
A
C
D
G
H
I
J
K
B
E
F

WELL DEVELOPMENT RECORD – PARAMETER MEASUREMENTS
Total Volume Withdrawal Well
No. Time
Gallons Borehole Volume
pH Conductivity (ms/cm)
Temp (°C)
Turbidity (NTU) Comments
29-7 1500 appears cl. 2/8/08 well developed
1530 water cleared up within 3 minutes
less than 1 gpm while pumping
100psi kickoff, 50psi sustained
v. slow recharge

POWERTECH WELL AND PUMP DATA
Location of Well Dewey, SD
Drilling Contractor Davis Drilling Driller
Tony Well Name DB07-32-9C
County Custer Type of Rig
Drilling Fluid mud Well Depth 505'
LAT 4815586N LONG 578744E Elevation 3683'' Screened Monitoring Well Completion Detail
Datum point from which all measurements are taken
Method of Drilling Date: 1/15/08 Cabel Tool Hollow Rod Direct Rotary Air Rotary Bucket Auger Reverse Rotary Flight Auger Jetted Dug Driven Other mud rotary
Use Domestic Public Supply Industrial Irrigation Municipal Commercial Test Well Heating or Cooling Monitoring Other
One well volume (V) = gallons
Initial Development Water Water Level (TIC) Well Depth Color Odor Clarity Developed By Date Well Development Date Description of Development Technique
Pump Date Installed Type Manufacturer Model No. H.P. Volts Capacity Depth of Pump Intake Setting No. of Stages Oil Water Lubrication Power Source Material of drop pipe Bowls Shafting Impellors Bowl Diameter Column Pipe Diameter Length Modification
Screened Well No.
A. Stick-up Length 2.0'
B. Key No. NA
C. Protective Casing Diameter NA Material NA Length NA Depth to Bottom NA
D. Surface Completion Diameter NA Depth NA Material NA
E. Well Casing Data Diameter 6" ID Material PVC Length 492' Weight SCH 40 Depth to Bottom 490'
F. Grout cement Date 2/20/08 Depth to Top 0' Depth to Bottom 491' Material sulfate resis. cement Density 15.2 lb/gal Volume 24.8 bbls % Excess 50 Method of Installation displacement Depth to Cement in Casing 370' Return Constant Yes No Volume of Grout Return 8 bbls
G. Borehole Diameter Drilling Dates 6.25" 1/15/08
H. Pack Type/SizeNA Date NA Depth to Top NA Depth to Bottom Material Method of Installation Gradation
I. Screen Date 3/10/08 Depth to Top 490-505'' Depth to Bottom Manufacturer Material PVC Slot .01"
J. Bottom Cap Material PVC Length 1" Driller Tommy
Boring Depth ''
Additional Information Dewey pump test site - upper Fall River sand lens (not in pumped lens)
******Mechanical Integrity Test******
Geophysical Logs Run Gamma, Resistivity, SP, ran 1/15/08
Water Quality Sample taken? Yes No Where analyzed?
PSI Increments Calibration Date of Gage PSI Full Scale Test Run By Stan Davis, Len Eakin Date Test Run 3/9/08 Time Beginning of Test 0800 Time End of Test 1000 Initial Pressure 35.0 PSIG Initial Fluid Level 4.0 inches
Final Pressure 35.0 PSIG Final Fluid Level 4.0inches Date well completed 3/10/08
GroundSurface
A
C
D
G
H
I
J
K
B
E
F

WELL DEVELOPMENT RECORD – PARAMETER MEASUREMENTS
Total Volume Withdrawal Well
No. Time
Gallons Borehole Volume
pH Conductivity (ms/cm)
Temp (°C)
Turbidity (NTU) Comments
32-9C 1400 dirty-clear. 3/10/08 well developed
1430 water cleared up after 20 minutes
very black water and sand coming out
approx 40-45 gpm while pumping
220psi kickoff 90psi sustained
6gpm flow by itself
screened interval in Fall River formation

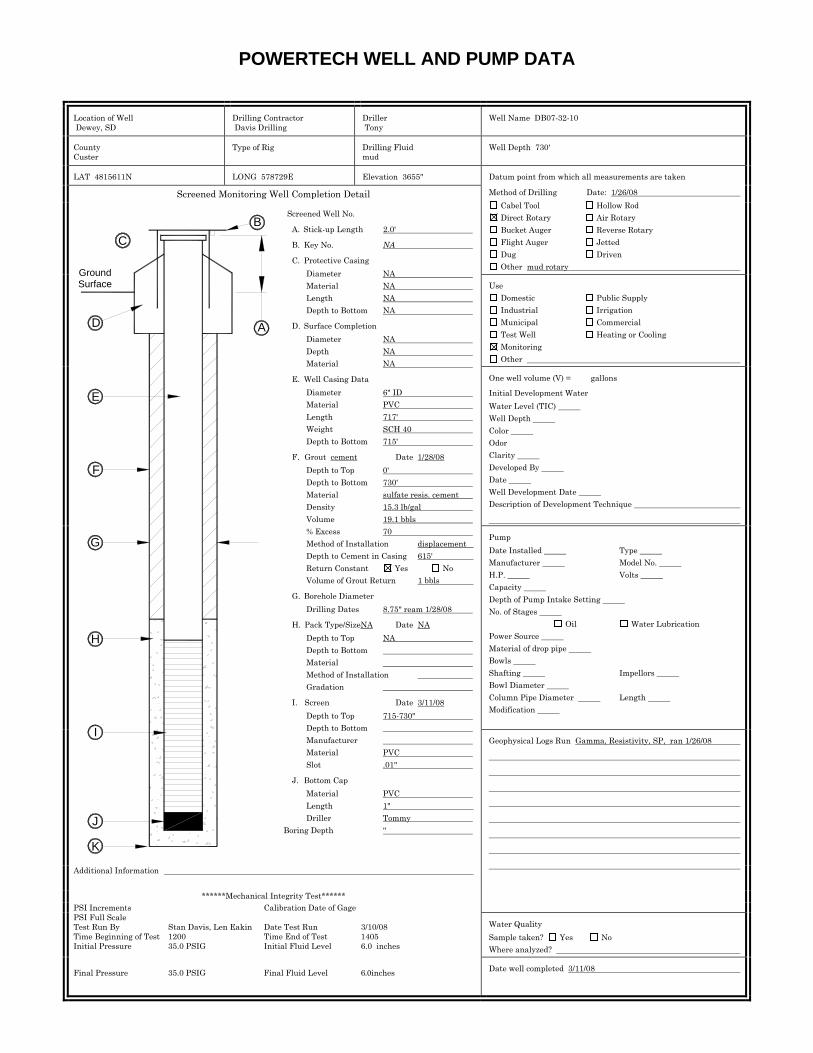
POWERTECH WELL AND PUMP DATA
Location of Well Dewey, SD
Drilling Contractor Davis Drilling Driller
Tony Well Name DB07-32-10
County Custer Type of Rig
Drilling Fluid mud Well Depth 730'
LAT 4815611N LONG 578729E Elevation 3655'' Screened Monitoring Well Completion Detail
Datum point from which all measurements are taken
Method of Drilling Date: 1/26/08 Cabel Tool Hollow Rod Direct Rotary Air Rotary Bucket Auger Reverse Rotary Flight Auger Jetted Dug Driven Other mud rotary
Use Domestic Public Supply Industrial Irrigation Municipal Commercial Test Well Heating or Cooling Monitoring Other
One well volume (V) = gallons
Initial Development Water Water Level (TIC) Well Depth Color Odor Clarity Developed By Date Well Development Date Description of Development Technique
Pump Date Installed Type Manufacturer Model No. H.P. Volts Capacity Depth of Pump Intake Setting No. of Stages Oil Water Lubrication Power Source Material of drop pipe Bowls Shafting Impellors Bowl Diameter Column Pipe Diameter Length Modification
Screened Well No.
A. Stick-up Length 2.0'
B. Key No. NA
C. Protective Casing Diameter NA Material NA Length NA Depth to Bottom NA
D. Surface Completion Diameter NA Depth NA Material NA
E. Well Casing Data Diameter 6" ID Material PVC Length 717' Weight SCH 40 Depth to Bottom 715'
F. Grout cement Date 1/28/08 Depth to Top 0' Depth to Bottom 730' Material sulfate resis. cement Density 15.3 lb/gal Volume 19.1 bbls % Excess 70 Method of Installation displacement Depth to Cement in Casing 615' Return Constant Yes No Volume of Grout Return 1 bbls
G. Borehole Diameter Drilling Dates 8.75" ream 1/28/08
H. Pack Type/SizeNA Date NA Depth to Top NA Depth to Bottom Material Method of Installation Gradation
I. Screen Date 3/11/08 Depth to Top 715-730'' Depth to Bottom Manufacturer Material PVC Slot .01"
J. Bottom Cap Material PVC Length 1" Driller Tommy
Boring Depth ''
Additional Information
******Mechanical Integrity Test******
Geophysical Logs Run Gamma, Resistivity, SP, ran 1/26/08
Water Quality Sample taken? Yes No Where analyzed?
PSI Increments Calibration Date of Gage PSI Full Scale Test Run By Stan Davis, Len Eakin Date Test Run 3/10/08 Time Beginning of Test 1200 Time End of Test 1405 Initial Pressure 35.0 PSIG Initial Fluid Level 6.0 inches
Final Pressure 35.0 PSIG Final Fluid Level 6.0inches Date well completed 3/11/08
GroundSurface
A
C
D
G
H
I
J
K
B
E
F

WELL DEVELOPMENT RECORD – PARAMETER MEASUREMENTS
Total Volume Withdrawal Well
No. Time
Gallons Borehole Volume
pH Conductivity (ms/cm)
Temp (°C)
Turbidity (NTU) Comments
32-10 1600 v. dirty 3/11/08 well developed
1630 water v. sl. dirty at end of test
approx 2 gpm while pumping
110psi kickoff decreases quickly to 2gpm at 50psi
well recharges quickly when pump shut off
screened interval in Lakota formation


POWERTECH WELL AND PUMP DATA
Location of Well Dewey, SD
Drilling Contractor Davis Drilling Driller
Tony Well Name DB07-32-11
County Custer Type of Rig
Drilling Fluid mud Well Depth 930'
LAT 4815572N LONG 578734E Elevation 3664'' Screened Monitoring Well Completion Detail
Datum point from which all measurements are taken
Method of Drilling Date: 2/7/08 Cabel Tool Hollow Rod Direct Rotary Air Rotary Bucket Auger Reverse Rotary Flight Auger Jetted Dug Driven Other mud rotary
Use Domestic Public Supply Industrial Irrigation Municipal Commercial Test Well Heating or Cooling Monitoring Other
One well volume (V) = gallons
Initial Development Water Water Level (TIC) Well Depth Color Odor Clarity Developed By Date Well Development Date Description of Development Technique
Pump Date Installed Type Manufacturer Model No. H.P. Volts Capacity Depth of Pump Intake Setting No. of Stages Oil Water Lubrication Power Source Material of drop pipe Bowls Shafting Impellors Bowl Diameter Column Pipe Diameter Length Modification
Screened Well No.
A. Stick-up Length 2.0'
B. Key No. NA
C. Protective Casing Diameter NA Material NA Length NA Depth to Bottom NA
D. Surface Completion Diameter NA Depth NA Material NA
E. Well Casing Data Diameter 6" ID Material PVC Length 912' Weight SCH 40 Depth to Bottom 910'
F. Grout cement Date 2/12/08 Depth to Top 0' Depth to Bottom 911' Material sulfate resis. cement Density 15.2 lb/gal Volume 55.0 bbls % Excess 70 Method of Installation displacement Depth to Cement in Casing 760' Return Constant Yes No Volume of Grout Return 8 bbls
G. Borehole Diameter Drilling Dates 6.25" 2/7/08
H. Pack Type/SizeNA Date NA Depth to Top NA Depth to Bottom Material Method of Installation Gradation
I. Screen Date 3/8/08 Depth to Top 910-930'' Depth to Bottom Manufacturer Material PVC Slot .01"
J. Bottom Cap Material PVC Length 1" Driller Tommy
Boring Depth ''
Additional Information
******Mechanical Integrity Test******
Geophysical Logs Run Gamma, Resistivity, SP, ran 2/8/08
Water Quality Sample taken? Yes No Where analyzed?
PSI Increments Calibration Date of Gage PSI Full Scale Test Run By Stan Davis, Len Eakin Date Test Run 3/5/08 Time Beginning of Test 0830 Time End of Test 1000 Initial Pressure 35.0 PSIG Initial Fluid Level 4.0 inches
Final Pressure 35.0 PSIG Final Fluid Level 4.0inches Date well completed 3/8/08
GroundSurface
A
C
D
G
H
I
J
K
B
E
F

WELL DEVELOPMENT RECORD – PARAMETER MEASUREMENTS
Total Volume Withdrawal Well
No. Time
Gallons Borehole Volume
pH Conductivity (ms/cm)
Temp (°C)
Turbidity (NTU) Comments
32-11 1200 appears cl. 3/8/08 well developed
1230 water cleared up within 5 minutes
approx 5 gpm while pumping
110psi kickoff slowly decreases to 2gpm at 75psi
well recharges quickly when pump shut off
screened interval in Unkpapa formation


Appendix B-2 Time and Water Level Data Values Used in Pumping Test
Analysis: Dewey Test, Drawdown Data

Table B.2-1:Time and Water Level Data Values Used in Pumping Test Analysis: Dewey Test, Drawdown Data
32-3C GW-49 29-7 32-4C 32-5 32-9CTime (days) Drawdown (ft) Time (days) Drawdown (ft) Time (days) Drawdown (ft) Time (days) Drawdown (ft) Time (days) Drawdown (ft) Time (days) Drawdown (ft)
0.000012 16.362759 0.000012 -0.008329 0.000012 0.045472 0.000012 -0.002208 0.000000 -0.048216 0.000012 -0.0252430.000023 19.161989 0.000023 -0.001406 0.000023 -0.000681 0.000023 0.004715 0.000012 -0.022831 0.000023 0.0278340.000035 19.948912 0.000035 0.007825 0.000035 0.029319 0.000035 0.007023 0.000023 0.000246 0.000035 0.0347570.000046 20.355066 0.000046 -0.001406 0.000046 -0.023758 0.000046 0.009331 0.000035 0.002553 0.000046 -0.0090890.000058 21.017374 0.000058 0.035517 0.000058 0.013165 0.000058 0.007023 0.000046 0.000246 0.000058 0.0116800.000069 21.402758 0.000069 -0.012944 0.000069 -0.012220 0.000069 0.002408 0.000058 0.004861 0.000069 0.0093720.000081 21.651989 0.000081 -0.008329 0.000081 0.052395 0.000081 0.013946 0.000069 -0.011293 0.000081 0.0232190.000093 22.035067 0.000093 -0.036021 0.000093 0.057011 0.000093 0.002408 0.000081 -0.020523 0.000093 0.0139880.000104 22.071989 0.000104 0.007825 0.000104 0.001626 0.000104 0.016254 0.000093 0.004861 0.000104 -0.0021660.000116 22.016603 0.000116 0.014748 0.000116 -0.028374 0.000116 0.000100 0.000104 -0.015908 0.000116 0.0370650.000127 22.381220 0.000127 -0.006021 0.000127 -0.000681 0.000127 0.000100 0.000116 0.000246 0.000127 0.0139880.000139 22.337374 0.000139 -0.001406 0.000139 -0.005297 0.000139 0.009331 0.000127 -0.002062 0.000139 -0.0067810.000150 22.618912 0.000150 -0.008329 0.000150 0.045472 0.000150 0.009331 0.000139 0.002553 0.000150 -0.0044740.000162 22.508142 0.000162 0.005517 0.000162 0.006242 0.000162 0.007023 0.000150 0.021015 0.000162 -0.0183200.000174 22.847374 0.000174 -0.019867 0.000174 -0.021451 0.000174 0.011639 0.000162 -0.008985 0.000174 0.0186030.000185 22.914297 0.000185 -0.008329 0.000185 -0.026066 0.000185 -0.004515 0.000174 0.014092 0.000185 0.0001420.000197 22.999681 0.000197 -0.017559 0.000197 0.024703 0.000197 0.000100 0.000185 -0.018216 0.000197 0.0139880.000208 22.893528 0.000208 -0.029098 0.000208 0.003934 0.000208 0.013946 0.000197 0.016400 0.000208 0.0001420.000220 23.131220 0.000220 -0.003713 0.000220 0.020088 0.000220 0.013946 0.000208 -0.013600 0.000220 0.0024490.000231 23.131220 0.000231 0.010133 0.000231 0.006242 0.000231 0.013946 0.000220 0.018707 0.000231 -0.0137040.000243 23.271988 0.000243 -0.012944 0.000243 -0.014528 0.000243 0.011639 0.000231 0.023323 0.000243 0.0116800.000255 23.121988 0.000255 0.017056 0.000255 0.031626 0.000255 0.004715 0.000243 -0.004370 0.000255 -0.0113970.000266 23.101219 0.000266 0.005517 0.000266 0.038549 0.000266 0.023177 0.000255 -0.002062 0.000266 0.0116800.000278 23.934296 0.000278 -0.022175 0.000278 0.006242 0.000278 0.009331 0.000266 -0.011293 0.000278 -0.0021660.000289 24.737373 0.000289 -0.026790 0.000289 -0.032989 0.000289 0.007023 0.000278 0.009477 0.000289 0.0093720.000301 25.408913 0.000301 0.007825 0.000301 -0.009912 0.000301 0.009331 0.000289 0.057938 0.000301 -0.0090890.000312 26.036604 0.000312 -0.001406 0.000312 0.020088 0.000312 0.002408 0.000301 -0.008985 0.000312 0.0024490.000324 27.222757 0.000324 -0.022175 0.000324 0.020088 0.000324 0.013946 0.000312 -0.018216 0.000324 -0.0137040.000336 27.725836 0.000336 -0.008329 0.000336 -0.021451 0.000336 -0.004515 0.000324 0.009477 0.000336 -0.0160120.000347 28.452759 0.000347 -0.029098 0.000347 0.010857 0.000347 0.007023 0.000336 -0.002062 0.000347 -0.0437040.000359 29.391989 0.000359 0.017056 0.000359 0.006242 0.000359 0.002408 0.000347 -0.011293 0.000359 0.0370650.000370 30.266603 0.000370 -0.017559 0.000370 -0.005297 0.000370 -0.002208 0.000359 0.000246 0.000370 -0.0044740.000382 30.670450 0.000382 -0.012944 0.000382 0.013165 0.000382 0.013946 0.000370 0.000246 0.000382 0.0186030.000394 30.815834 0.000394 -0.038329 0.000394 -0.000681 0.000394 0.004715 0.000382 0.025630 0.000394 0.0024490.000417 30.891989 0.000405 -0.010636 0.000417 0.015472 0.000417 0.009331 0.000394 0.000246 0.000417 -0.0044740.000451 29.811989 0.000417 -0.006021 0.000451 -0.035297 0.000451 0.013946 0.000417 -0.006677 0.000451 0.0301420.000463 28.955835 0.000451 0.000902 0.000463 0.057011 0.000463 0.000100 0.000451 0.048707 0.000463 -0.0229350.000486 27.504297 0.000463 -0.017559 0.000486 -0.014528 0.000486 0.002408 0.000463 0.016400 0.000486 -0.0137040.000498 26.318142 0.000486 0.000902 0.000498 -0.000681 0.000498 -0.002208 0.000486 0.000246 0.000498 -0.0113970.000521 25.127373 0.000498 0.014748 0.000521 0.017780 0.000521 0.007023 0.000498 -0.027447 0.000521 -0.0252430.000532 24.181219 0.000521 0.012441 0.000532 -0.007605 0.000532 0.011639 0.000521 0.016400 0.000532 -0.0044740.000556 23.816605 0.000532 -0.019867 0.000556 0.033934 0.000556 0.013946 0.000532 -0.004370 0.000556 -0.0298580.000590 24.716604 0.000556 0.010133 0.000590 -0.014528 0.000590 -0.002208 0.000556 0.002553 0.000590 -0.0483200.000625 26.325066 0.000590 0.042441 0.000625 0.003934 0.000625 0.011639 0.000590 0.016400 0.000625 -0.0206280.000660 28.007374 0.000625 0.007825 0.000660 0.010857 0.000660 0.007023 0.000625 0.000246 0.000660 0.0139880.000694 29.479681 0.000660 -0.022175 0.000694 -0.019143 0.000694 0.011639 0.000660 -0.002062 0.000694 0.0116800.000729 29.885836 0.000694 -0.017559 0.000729 0.010857 0.000729 0.016254 0.000694 -0.029754 0.000729 0.0232190.000764 30.118912 0.000729 0.005517 0.000764 0.045472 0.000764 0.000100 0.000729 -0.018216 0.000764 0.0001420.000799 29.791220 0.000764 -0.012944 0.000799 0.020088 0.000799 -0.004515 0.000764 0.034861 0.000799 0.0209110.000833 29.622759 0.000799 0.010133 0.000833 -0.012220 0.000833 0.000100 0.000799 0.039477 0.000833 0.025526
G:\102\00279.01\A\Reports Specs\KP\All Reports\Work in Progress\Hydrogeologic Testing Report\RevB\Appendix B\App B_2 Dewey Drawdown Data Tables.xls1 of 4 11/12/2008

Table B.2-1:Time and Water Level Data Values Used in Pumping Test Analysis: Dewey Test, Drawdown Data
32-3C GW-49 29-7 32-4C 32-5 32-9CTime (days) Drawdown (ft) Time (days) Drawdown (ft) Time (days) Drawdown (ft) Time (days) Drawdown (ft) Time (days) Drawdown (ft) Time (days) Drawdown (ft)
0.000903 29.613527 0.000833 -0.008329 0.000903 -0.026066 0.000903 0.007023 0.000833 0.021015 0.000903 -0.0183200.000972 29.675835 0.000903 -0.022175 0.000972 -0.005297 0.000972 0.030100 0.000903 -0.008985 0.000972 0.0209110.001042 29.874296 0.000972 0.021671 0.001042 -0.028374 0.001042 0.004715 0.000972 0.025630 0.001042 -0.0160120.001111 29.814297 0.001042 0.023979 0.001111 -0.014528 0.001111 0.011639 0.001042 0.067169 0.001111 0.0186030.001181 29.823526 0.001111 0.012441 0.001181 -0.005297 0.001181 0.013946 0.001111 0.069477 0.001181 0.0186030.001250 29.851219 0.001181 0.010133 0.001250 -0.030681 0.001250 0.011639 0.001181 0.090246 0.001250 -0.0137040.001319 29.989681 0.001250 -0.015252 0.001319 0.027011 0.001319 0.016254 0.001250 0.076400 0.001319 0.0647570.001389 30.010450 0.001319 -0.040636 0.001389 -0.056066 0.001389 0.002408 0.001319 0.131784 0.001389 -0.0413970.001493 30.190451 0.001389 0.007825 0.001493 0.001626 0.001493 0.016254 0.001389 0.152553 0.001493 -0.0252430.001597 30.144297 0.001493 0.014748 0.001597 -0.032989 0.001597 0.023177 0.001493 0.180246 0.001597 -0.0252430.001701 30.280451 0.001597 -0.019867 0.001701 -0.012220 0.001701 0.016254 0.001597 0.203323 0.001701 -0.0321660.001806 30.506603 0.001701 -0.022175 0.001806 -0.000681 0.001806 0.030100 0.001701 0.274861 0.001806 0.0139880.001944 30.497374 0.001806 -0.026790 0.001944 -0.035297 0.001944 0.041639 0.001806 0.291015 0.001944 -0.0044740.002083 30.527374 0.001944 0.060902 0.002083 -0.014528 0.002083 0.030100 0.001944 0.330246 0.002083 -0.0413970.002222 30.758142 0.002083 0.007825 0.002222 0.031626 0.002222 0.037023 0.002083 0.411015 0.002222 -0.0298580.002361 30.873528 0.002222 -0.029098 0.002361 -0.009912 0.002361 0.039331 0.002222 0.452553 0.002361 -0.0160120.002500 31.071989 0.002361 0.007825 0.002500 0.015472 0.002500 0.055485 0.002361 0.494092 0.002500 -0.0090890.002639 30.954296 0.002500 -0.008329 0.002639 -0.012220 0.002639 0.050869 0.002500 0.512553 0.002639 -0.0229350.002778 31.159681 0.002639 0.014748 0.002778 -0.012220 0.002778 0.048562 0.002639 0.581784 0.002778 -0.0090890.002951 31.143528 0.002778 0.000902 0.002951 0.024703 0.002951 0.067023 0.002778 0.595630 0.002951 -0.0137040.003125 31.323526 0.002951 -0.022175 0.003125 -0.026066 0.003125 0.071639 0.002951 0.713323 0.003125 -0.0252430.003299 31.420450 0.003125 -0.006021 0.003299 0.006242 0.003299 0.080869 0.003125 0.701784 0.003299 -0.0529350.003472 31.475836 0.003299 0.003210 0.003472 -0.005297 0.003472 0.080869 0.003299 0.761784 0.003472 -0.0044740.003704 31.637373 0.003472 -0.006021 0.003704 0.015472 0.003704 0.099331 0.003472 0.791784 0.003704 0.0093720.003935 31.695066 0.003704 0.010133 0.003935 -0.005297 0.003935 0.103946 0.003704 0.872553 0.003935 -0.0460120.004167 31.757374 0.003935 0.007825 0.004167 0.050088 0.004167 0.143177 0.003935 0.916400 0.004167 -0.0137040.004398 31.796604 0.004167 -0.019867 0.004398 -0.000681 0.004398 0.133946 0.004167 0.983323 0.004398 -0.0044740.004630 32.068913 0.004398 0.005517 0.004630 0.010857 0.004630 0.143177 0.004398 1.011015 0.004630 -0.0921660.004861 32.036606 0.004630 0.000902 0.004861 0.010857 0.004861 0.166254 0.004630 1.119477 0.004861 -0.0067810.005208 32.232758 0.004861 0.000902 0.005208 0.017780 0.005208 0.187023 0.004861 1.158707 0.005208 -0.0321660.005556 32.179680 0.005208 -0.008329 0.005556 0.043165 0.005556 0.196254 0.005208 1.204861 0.005556 0.0301420.005903 32.373528 0.005556 -0.006021 0.005903 -0.012220 0.005903 0.221639 0.005556 1.304092 0.005903 0.0416800.006250 32.382759 0.005903 -0.015252 0.006250 -0.014528 0.006250 0.244715 0.005903 1.357169 0.006250 0.0001420.006597 32.398911 0.006250 -0.015252 0.006597 -0.021451 0.006597 0.260869 0.006250 1.421784 0.006597 0.0232190.006944 32.641220 0.006597 0.007825 0.006944 0.008549 0.006944 0.283946 0.006597 1.530246 0.006944 0.0486030.007292 32.781990 0.006944 -0.029098 0.007292 -0.009912 0.007292 0.309331 0.006944 1.534861 0.007292 0.0416800.007639 32.922756 0.007292 -0.033713 0.007639 -0.002989 0.007639 0.309331 0.007292 1.567169 0.007639 0.0809110.007986 32.874298 0.007639 -0.015252 0.007986 -0.000681 0.007986 0.339331 0.007639 1.645630 0.007986 0.0832190.008333 32.980450 0.007986 0.019364 0.008333 -0.026066 0.008333 0.371639 0.007986 1.714861 0.008333 0.0555260.009028 33.077374 0.008333 0.019364 0.009028 0.022395 0.009028 0.401639 0.008333 1.728707 0.009028 0.0901420.009722 33.061218 0.009028 0.030902 0.009722 0.010857 0.009722 0.436254 0.009028 1.876400 0.009722 0.0739880.010417 33.261990 0.009722 -0.006021 0.010417 0.010857 0.010417 0.480100 0.009722 1.954861 0.010417 0.0993720.011111 33.460449 0.010417 -0.012944 0.011111 -0.007605 0.011111 0.521639 0.010417 2.024092 0.011111 0.1339880.011806 33.536606 0.011111 -0.022175 0.011806 0.047780 0.011806 0.558562 0.011111 2.079477 0.011806 0.1455260.012500 33.552757 0.011806 -0.036021 0.012500 0.010857 0.012500 0.581639 0.011806 2.178707 0.012500 0.1316800.013194 33.728142 0.012500 -0.017559 0.013194 0.006242 0.013194 0.611639 0.012500 2.277938 0.013194 0.1662960.013889 33.753529 0.013194 0.000902 0.013889 0.045472 0.013889 0.657792 0.013194 2.317169 0.013889 0.1870650.014931 34.346603 0.013889 -0.015252 0.014931 -0.000681 0.014931 0.699331 0.013889 2.361015 0.014931 0.1962960.015972 34.362759 0.014931 0.007825 0.015972 0.015472 0.015972 0.747792 0.014931 2.499476 0.015972 0.2678340.017014 34.570450 0.015972 -0.012944 0.017014 0.001626 0.017014 0.796254 0.015972 2.568707 0.017014 0.288603
G:\102\00279.01\A\Reports Specs\KP\All Reports\Work in Progress\Hydrogeologic Testing Report\RevB\Appendix B\App B_2 Dewey Drawdown Data Tables.xls2 of 4 11/12/2008
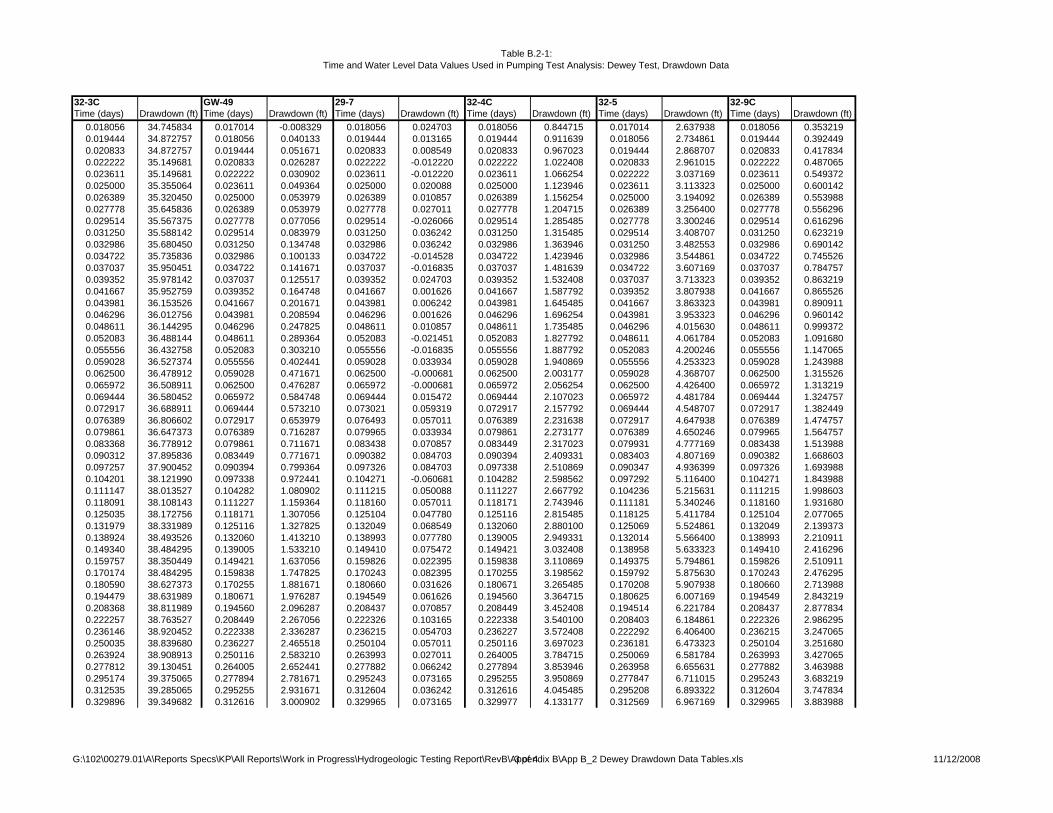
Table B.2-1:Time and Water Level Data Values Used in Pumping Test Analysis: Dewey Test, Drawdown Data
32-3C GW-49 29-7 32-4C 32-5 32-9CTime (days) Drawdown (ft) Time (days) Drawdown (ft) Time (days) Drawdown (ft) Time (days) Drawdown (ft) Time (days) Drawdown (ft) Time (days) Drawdown (ft)
0.018056 34.745834 0.017014 -0.008329 0.018056 0.024703 0.018056 0.844715 0.017014 2.637938 0.018056 0.3532190.019444 34.872757 0.018056 0.040133 0.019444 0.013165 0.019444 0.911639 0.018056 2.734861 0.019444 0.3924490.020833 34.872757 0.019444 0.051671 0.020833 0.008549 0.020833 0.967023 0.019444 2.868707 0.020833 0.4178340.022222 35.149681 0.020833 0.026287 0.022222 -0.012220 0.022222 1.022408 0.020833 2.961015 0.022222 0.4870650.023611 35.149681 0.022222 0.030902 0.023611 -0.012220 0.023611 1.066254 0.022222 3.037169 0.023611 0.5493720.025000 35.355064 0.023611 0.049364 0.025000 0.020088 0.025000 1.123946 0.023611 3.113323 0.025000 0.6001420.026389 35.320450 0.025000 0.053979 0.026389 0.010857 0.026389 1.156254 0.025000 3.194092 0.026389 0.5539880.027778 35.645836 0.026389 0.053979 0.027778 0.027011 0.027778 1.204715 0.026389 3.256400 0.027778 0.5562960.029514 35.567375 0.027778 0.077056 0.029514 -0.026066 0.029514 1.285485 0.027778 3.300246 0.029514 0.6162960.031250 35.588142 0.029514 0.083979 0.031250 0.036242 0.031250 1.315485 0.029514 3.408707 0.031250 0.6232190.032986 35.680450 0.031250 0.134748 0.032986 0.036242 0.032986 1.363946 0.031250 3.482553 0.032986 0.6901420.034722 35.735836 0.032986 0.100133 0.034722 -0.014528 0.034722 1.423946 0.032986 3.544861 0.034722 0.7455260.037037 35.950451 0.034722 0.141671 0.037037 -0.016835 0.037037 1.481639 0.034722 3.607169 0.037037 0.7847570.039352 35.978142 0.037037 0.125517 0.039352 0.024703 0.039352 1.532408 0.037037 3.713323 0.039352 0.8632190.041667 35.952759 0.039352 0.164748 0.041667 0.001626 0.041667 1.587792 0.039352 3.807938 0.041667 0.8655260.043981 36.153526 0.041667 0.201671 0.043981 0.006242 0.043981 1.645485 0.041667 3.863323 0.043981 0.8909110.046296 36.012756 0.043981 0.208594 0.046296 0.001626 0.046296 1.696254 0.043981 3.953323 0.046296 0.9601420.048611 36.144295 0.046296 0.247825 0.048611 0.010857 0.048611 1.735485 0.046296 4.015630 0.048611 0.9993720.052083 36.488144 0.048611 0.289364 0.052083 -0.021451 0.052083 1.827792 0.048611 4.061784 0.052083 1.0916800.055556 36.432758 0.052083 0.303210 0.055556 -0.016835 0.055556 1.887792 0.052083 4.200246 0.055556 1.1470650.059028 36.527374 0.055556 0.402441 0.059028 0.033934 0.059028 1.940869 0.055556 4.253323 0.059028 1.2439880.062500 36.478912 0.059028 0.471671 0.062500 -0.000681 0.062500 2.003177 0.059028 4.368707 0.062500 1.3155260.065972 36.508911 0.062500 0.476287 0.065972 -0.000681 0.065972 2.056254 0.062500 4.426400 0.065972 1.3132190.069444 36.580452 0.065972 0.584748 0.069444 0.015472 0.069444 2.107023 0.065972 4.481784 0.069444 1.3247570.072917 36.688911 0.069444 0.573210 0.073021 0.059319 0.072917 2.157792 0.069444 4.548707 0.072917 1.3824490.076389 36.806602 0.072917 0.653979 0.076493 0.057011 0.076389 2.231638 0.072917 4.647938 0.076389 1.4747570.079861 36.647373 0.076389 0.716287 0.079965 0.033934 0.079861 2.273177 0.076389 4.650246 0.079965 1.5647570.083368 36.778912 0.079861 0.711671 0.083438 0.070857 0.083449 2.317023 0.079931 4.777169 0.083438 1.5139880.090312 37.895836 0.083449 0.771671 0.090382 0.084703 0.090394 2.409331 0.083403 4.807169 0.090382 1.6686030.097257 37.900452 0.090394 0.799364 0.097326 0.084703 0.097338 2.510869 0.090347 4.936399 0.097326 1.6939880.104201 38.121990 0.097338 0.972441 0.104271 -0.060681 0.104282 2.598562 0.097292 5.116400 0.104271 1.8439880.111147 38.013527 0.104282 1.080902 0.111215 0.050088 0.111227 2.667792 0.104236 5.215631 0.111215 1.9986030.118091 38.108143 0.111227 1.159364 0.118160 0.057011 0.118171 2.743946 0.111181 5.340246 0.118160 1.9316800.125035 38.172756 0.118171 1.307056 0.125104 0.047780 0.125116 2.815485 0.118125 5.411784 0.125104 2.0770650.131979 38.331989 0.125116 1.327825 0.132049 0.068549 0.132060 2.880100 0.125069 5.524861 0.132049 2.1393730.138924 38.493526 0.132060 1.413210 0.138993 0.077780 0.139005 2.949331 0.132014 5.566400 0.138993 2.2109110.149340 38.484295 0.139005 1.533210 0.149410 0.075472 0.149421 3.032408 0.138958 5.633323 0.149410 2.4162960.159757 38.350449 0.149421 1.637056 0.159826 0.022395 0.159838 3.110869 0.149375 5.794861 0.159826 2.5109110.170174 38.484295 0.159838 1.747825 0.170243 0.082395 0.170255 3.198562 0.159792 5.875630 0.170243 2.4762950.180590 38.627373 0.170255 1.881671 0.180660 0.031626 0.180671 3.265485 0.170208 5.907938 0.180660 2.7139880.194479 38.631989 0.180671 1.976287 0.194549 0.061626 0.194560 3.364715 0.180625 6.007169 0.194549 2.8432190.208368 38.811989 0.194560 2.096287 0.208437 0.070857 0.208449 3.452408 0.194514 6.221784 0.208437 2.8778340.222257 38.763527 0.208449 2.267056 0.222326 0.103165 0.222338 3.540100 0.208403 6.184861 0.222326 2.9862950.236146 38.920452 0.222338 2.336287 0.236215 0.054703 0.236227 3.572408 0.222292 6.406400 0.236215 3.2470650.250035 38.839680 0.236227 2.465518 0.250104 0.057011 0.250116 3.697023 0.236181 6.473323 0.250104 3.2516800.263924 38.908913 0.250116 2.583210 0.263993 0.027011 0.264005 3.784715 0.250069 6.581784 0.263993 3.4270650.277812 39.130451 0.264005 2.652441 0.277882 0.066242 0.277894 3.853946 0.263958 6.655631 0.277882 3.4639880.295174 39.375065 0.277894 2.781671 0.295243 0.073165 0.295255 3.950869 0.277847 6.711015 0.295243 3.6832190.312535 39.285065 0.295255 2.931671 0.312604 0.036242 0.312616 4.045485 0.295208 6.893322 0.312604 3.7478340.329896 39.349682 0.312616 3.000902 0.329965 0.073165 0.329977 4.133177 0.312569 6.967169 0.329965 3.883988
G:\102\00279.01\A\Reports Specs\KP\All Reports\Work in Progress\Hydrogeologic Testing Report\RevB\Appendix B\App B_2 Dewey Drawdown Data Tables.xls3 of 4 11/12/2008
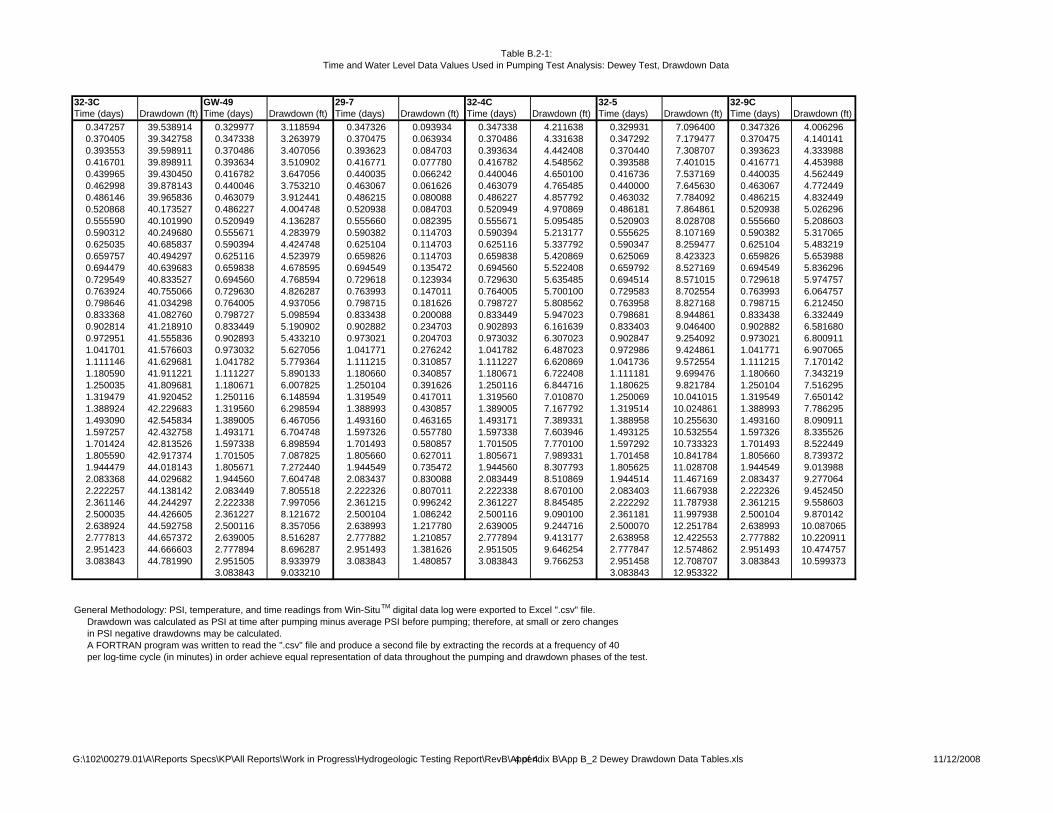
Table B.2-1:Time and Water Level Data Values Used in Pumping Test Analysis: Dewey Test, Drawdown Data
32-3C GW-49 29-7 32-4C 32-5 32-9CTime (days) Drawdown (ft) Time (days) Drawdown (ft) Time (days) Drawdown (ft) Time (days) Drawdown (ft) Time (days) Drawdown (ft) Time (days) Drawdown (ft)
0.347257 39.538914 0.329977 3.118594 0.347326 0.093934 0.347338 4.211638 0.329931 7.096400 0.347326 4.0062960.370405 39.342758 0.347338 3.263979 0.370475 0.063934 0.370486 4.331638 0.347292 7.179477 0.370475 4.1401410.393553 39.598911 0.370486 3.407056 0.393623 0.084703 0.393634 4.442408 0.370440 7.308707 0.393623 4.3339880.416701 39.898911 0.393634 3.510902 0.416771 0.077780 0.416782 4.548562 0.393588 7.401015 0.416771 4.4539880.439965 39.430450 0.416782 3.647056 0.440035 0.066242 0.440046 4.650100 0.416736 7.537169 0.440035 4.5624490.462998 39.878143 0.440046 3.753210 0.463067 0.061626 0.463079 4.765485 0.440000 7.645630 0.463067 4.7724490.486146 39.965836 0.463079 3.912441 0.486215 0.080088 0.486227 4.857792 0.463032 7.784092 0.486215 4.8324490.520868 40.173527 0.486227 4.004748 0.520938 0.084703 0.520949 4.970869 0.486181 7.864861 0.520938 5.0262960.555590 40.101990 0.520949 4.136287 0.555660 0.082395 0.555671 5.095485 0.520903 8.028708 0.555660 5.2086030.590312 40.249680 0.555671 4.283979 0.590382 0.114703 0.590394 5.213177 0.555625 8.107169 0.590382 5.3170650.625035 40.685837 0.590394 4.424748 0.625104 0.114703 0.625116 5.337792 0.590347 8.259477 0.625104 5.4832190.659757 40.494297 0.625116 4.523979 0.659826 0.114703 0.659838 5.420869 0.625069 8.423323 0.659826 5.6539880.694479 40.639683 0.659838 4.678595 0.694549 0.135472 0.694560 5.522408 0.659792 8.527169 0.694549 5.8362960.729549 40.833527 0.694560 4.768594 0.729618 0.123934 0.729630 5.635485 0.694514 8.571015 0.729618 5.9747570.763924 40.755066 0.729630 4.826287 0.763993 0.147011 0.764005 5.700100 0.729583 8.702554 0.763993 6.0647570.798646 41.034298 0.764005 4.937056 0.798715 0.181626 0.798727 5.808562 0.763958 8.827168 0.798715 6.2124500.833368 41.082760 0.798727 5.098594 0.833438 0.200088 0.833449 5.947023 0.798681 8.944861 0.833438 6.3324490.902814 41.218910 0.833449 5.190902 0.902882 0.234703 0.902893 6.161639 0.833403 9.046400 0.902882 6.5816800.972951 41.555836 0.902893 5.433210 0.973021 0.204703 0.973032 6.307023 0.902847 9.254092 0.973021 6.8009111.041701 41.576603 0.973032 5.627056 1.041771 0.276242 1.041782 6.487023 0.972986 9.424861 1.041771 6.9070651.111146 41.629681 1.041782 5.779364 1.111215 0.310857 1.111227 6.620869 1.041736 9.572554 1.111215 7.1701421.180590 41.911221 1.111227 5.890133 1.180660 0.340857 1.180671 6.722408 1.111181 9.699476 1.180660 7.3432191.250035 41.809681 1.180671 6.007825 1.250104 0.391626 1.250116 6.844716 1.180625 9.821784 1.250104 7.5162951.319479 41.920452 1.250116 6.148594 1.319549 0.417011 1.319560 7.010870 1.250069 10.041015 1.319549 7.6501421.388924 42.229683 1.319560 6.298594 1.388993 0.430857 1.389005 7.167792 1.319514 10.024861 1.388993 7.7862951.493090 42.545834 1.389005 6.467056 1.493160 0.463165 1.493171 7.389331 1.388958 10.255630 1.493160 8.0909111.597257 42.432758 1.493171 6.704748 1.597326 0.557780 1.597338 7.603946 1.493125 10.532554 1.597326 8.3355261.701424 42.813526 1.597338 6.898594 1.701493 0.580857 1.701505 7.770100 1.597292 10.733323 1.701493 8.5224491.805590 42.917374 1.701505 7.087825 1.805660 0.627011 1.805671 7.989331 1.701458 10.841784 1.805660 8.7393721.944479 44.018143 1.805671 7.272440 1.944549 0.735472 1.944560 8.307793 1.805625 11.028708 1.944549 9.0139882.083368 44.029682 1.944560 7.604748 2.083437 0.830088 2.083449 8.510869 1.944514 11.467169 2.083437 9.2770642.222257 44.138142 2.083449 7.805518 2.222326 0.807011 2.222338 8.670100 2.083403 11.667938 2.222326 9.4524502.361146 44.244297 2.222338 7.997056 2.361215 0.996242 2.361227 8.845485 2.222292 11.787938 2.361215 9.5586032.500035 44.426605 2.361227 8.121672 2.500104 1.086242 2.500116 9.090100 2.361181 11.997938 2.500104 9.8701422.638924 44.592758 2.500116 8.357056 2.638993 1.217780 2.639005 9.244716 2.500070 12.251784 2.638993 10.0870652.777813 44.657372 2.639005 8.516287 2.777882 1.210857 2.777894 9.413177 2.638958 12.422553 2.777882 10.2209112.951423 44.666603 2.777894 8.696287 2.951493 1.381626 2.951505 9.646254 2.777847 12.574862 2.951493 10.4747573.083843 44.781990 2.951505 8.933979 3.083843 1.480857 3.083843 9.766253 2.951458 12.708707 3.083843 10.599373
3.083843 9.033210 3.083843 12.953322
General Methodology: PSI, temperature, and time readings from Win-SituTM digital data log were exported to Excel ".csv" file. Drawdown was calculated as PSI at time after pumping minus average PSI before pumping; therefore, at small or zero changes in PSI negative drawdowns may be calculated. A FORTRAN program was written to read the ".csv" file and produce a second file by extracting the records at a frequency of 40 per log-time cycle (in minutes) in order achieve equal representation of data throughout the pumping and drawdown phases of the test.
G:\102\00279.01\A\Reports Specs\KP\All Reports\Work in Progress\Hydrogeologic Testing Report\RevB\Appendix B\App B_2 Dewey Drawdown Data Tables.xls4 of 4 11/12/2008
Appendix B-3 Time and Water Level Data Values Used in Pumping Test
Analysis: Dewey Test, Recovery Data

Table B.3-1:Time and Water Level Data Values Used in Pumping Test Analysis: Dewey Test, Recovery Data
32-3C 49 324C 32-5 32-9CTime (days) Drawdown (ft) Time (days) Drawdown (ft) Time (days) Drawdown (ft) Time (days) Drawdown (ft) Time (days) Drawdown (ft)3.083866 42.133311 3.083866 9.035518 3.083889 9.763947 3.083866 12.934861 3.083889 10.6062963.083877 41.493441 3.083877 9.053979 3.083901 9.766253 3.083877 12.930245 3.083901 10.6039883.083889 40.624881 3.083889 9.042440 3.083912 9.775485 3.083889 12.925631 3.083912 10.5578343.083901 39.645441 3.083901 9.063210 3.083924 9.770869 3.083901 12.904861 3.083924 10.5855263.083912 38.712201 3.083912 9.148595 3.083935 9.768561 3.083912 12.907168 3.083935 10.5947573.083924 37.792821 3.083924 9.053979 3.083947 9.759331 3.083924 12.914092 3.083947 10.6155263.083935 36.931191 3.083935 9.058595 3.083958 9.768561 3.083935 12.909476 3.083958 10.5647573.083947 36.228951 3.083947 9.060902 3.083970 9.768561 3.083947 12.946400 3.083970 10.5670653.083958 35.328051 3.083958 9.060902 3.083981 9.773177 3.083958 12.918707 3.083981 10.5624493.083970 34.549581 3.083970 9.028594 3.083993 9.770869 3.083970 12.897938 3.083993 10.6386033.083982 33.812691 3.083981 9.056287 3.084005 9.775485 3.083981 12.895631 3.084005 10.5832193.083993 33.055011 3.083993 9.157825 3.084016 9.766253 3.083993 12.944092 3.084016 10.6409113.084005 32.371251 3.084005 9.042440 3.084028 9.775485 3.084005 12.946400 3.084028 10.5255263.084016 31.673631 3.084016 9.033210 3.084039 9.768561 3.084016 12.914092 3.084039 10.5947573.084028 30.980631 3.084028 9.049364 3.084051 9.759331 3.084028 12.955630 3.084051 10.6178343.084039 30.350001 3.084039 9.051671 3.084062 9.770869 3.084039 12.897938 3.084062 10.6662963.084051 29.723991 3.084051 9.063210 3.084074 9.770869 3.084051 12.914092 3.084074 10.5809113.084063 29.162661 3.084062 9.063210 3.084086 9.766253 3.084062 12.909476 3.084086 10.6016803.084074 28.545891 3.084074 9.051671 3.084097 9.763947 3.084074 12.921015 3.084097 10.5993733.084086 27.984561 3.084086 9.012441 3.084109 9.770869 3.084086 12.964861 3.084109 10.5555273.084097 27.448641 3.084097 9.047056 3.084120 9.770869 3.084097 12.939477 3.084120 10.5832193.084109 26.901171 3.084109 9.028594 3.084132 9.775485 3.084109 12.909476 3.084132 10.5624493.084120 26.367561 3.084120 9.056287 3.084143 9.761639 3.084120 12.930245 3.084143 10.6062963.084132 25.877841 3.084132 9.065517 3.084155 9.773177 3.084132 12.891015 3.084155 10.5993733.084143 25.432011 3.084143 9.051671 3.084167 9.773177 3.084143 12.897938 3.084167 10.5993733.084155 25.004661 3.084155 9.040133 3.084178 9.773177 3.084155 12.934861 3.084178 10.5901413.084167 24.496461 3.084167 9.132441 3.084190 9.761639 3.084167 12.897938 3.084190 10.5832193.084178 24.161511 3.084178 9.012441 3.084201 9.775485 3.084178 12.897938 3.084201 10.5786033.084190 23.711061 3.084190 9.051671 3.084213 9.768561 3.084190 12.951015 3.084213 10.5855263.084201 23.359941 3.084201 9.035518 3.084224 9.757023 3.084201 12.916400 3.084224 10.5855263.084213 22.955691 3.084213 9.063210 3.084236 9.761639 3.084213 12.925631 3.084236 10.6062963.084224 22.567611 3.084224 9.077056 3.084248 9.768561 3.084224 12.930245 3.084248 10.5832193.084236 22.262691 3.084236 9.042440 3.084259 9.754716 3.084236 12.918707 3.084259 10.5832193.084248 21.946221 3.084248 9.047056 3.084282 9.766253 3.084248 12.893323 3.084282 10.5970653.084271 21.320211 3.084259 9.047056 3.084317 9.773177 3.084259 12.893323 3.084317 10.5924493.084305 20.518641 3.084282 9.049364 3.084329 9.766253 3.084282 12.937169 3.084329 10.6016803.084317 20.299191 3.084317 9.067825 3.084352 9.763947 3.084317 12.900246 3.084352 10.6039883.084340 19.844121 3.084329 9.065517 3.084363 9.759331 3.084329 12.886399 3.084363 10.6224493.084352 19.626981 3.084352 9.044748 3.084387 9.766253 3.084352 12.895631 3.084387 10.5947573.084375 19.225041 3.084363 9.035518 3.084398 9.775485 3.084363 12.909476 3.084398 10.564757
G:\102\00279.01\A\Reports Specs\KP\All Reports\Work in Progress\Hydrogeologic Testing Report\RevB\Appendix B\App B_3 Dewey Recovery Data Tables.xls1 of 5 11/12/2008

Table B.3-1:Time and Water Level Data Values Used in Pumping Test Analysis: Dewey Test, Recovery Data
32-3C 49 324C 32-5 32-9CTime (days) Drawdown (ft) Time (days) Drawdown (ft) Time (days) Drawdown (ft) Time (days) Drawdown (ft) Time (days) Drawdown (ft)3.084386 19.079511 3.084387 9.023979 3.084421 9.770869 3.084387 12.930245 3.084421 10.5786033.084410 18.739941 3.084398 9.047056 3.084456 9.766253 3.084398 12.918707 3.084456 10.6062963.084444 18.402681 3.084421 9.141671 3.084491 9.770869 3.084421 12.925631 3.084491 10.5832193.084479 18.125481 3.084456 9.040133 3.084526 9.766253 3.084456 12.930245 3.084526 10.5786033.084514 17.938371 3.084491 9.063210 3.084560 9.780100 3.084491 12.914092 3.084560 10.5993733.084549 17.758191 3.084526 9.063210 3.084595 9.757023 3.084526 12.879477 3.084595 10.5855263.084583 17.649621 3.084560 9.125518 3.084630 9.763947 3.084560 12.932553 3.084630 10.5670653.084618 17.520261 3.084595 9.058595 3.084664 9.761639 3.084595 12.932553 3.084664 10.5970653.084653 17.388591 3.084630 9.033210 3.084699 9.766253 3.084630 12.925631 3.084699 10.6016803.084688 17.256921 3.084664 9.056287 3.084769 9.766253 3.084664 12.867938 3.084769 10.5878343.084757 17.035161 3.084699 9.153210 3.084838 9.770869 3.084699 12.909476 3.084838 10.5924493.084826 16.811091 3.084769 9.077056 3.084907 9.750100 3.084769 12.934861 3.084907 10.5993733.084896 16.531581 3.084838 9.033210 3.084977 9.754716 3.084838 12.902554 3.084977 10.6247573.084965 16.325991 3.084907 9.021671 3.085046 9.768561 3.084907 12.851785 3.085046 10.5901413.085035 16.078821 3.084977 9.042440 3.085116 9.770869 3.084977 12.851785 3.085116 10.5832193.085104 15.880161 3.085046 9.077056 3.085185 9.768561 3.085046 12.886399 3.085185 10.5947573.085173 15.803931 3.085116 9.053979 3.085255 9.770869 3.085116 12.844861 3.085255 10.5947573.085243 15.519801 3.085185 9.074748 3.085359 9.757023 3.085185 12.835630 3.085359 10.6109113.085347 15.348861 3.085255 9.056287 3.085463 9.752408 3.085255 12.807938 3.085463 10.5786033.085452 15.247221 3.085359 9.023979 3.085567 9.770869 3.085359 12.796400 3.085567 10.6062963.085556 15.161751 3.085463 9.033210 3.085671 9.752408 3.085463 12.773323 3.085671 10.6178343.085660 15.032391 3.085567 9.053979 3.085810 9.752408 3.085567 12.731784 3.085810 10.5832193.085798 14.916891 3.085671 9.056287 3.085961 9.747792 3.085671 12.674092 3.085961 10.6086033.085939 14.775981 3.085810 9.040133 3.086088 9.747792 3.085810 12.641785 3.086088 10.6339873.086076 14.782911 3.085961 9.040133 3.086227 9.740870 3.085961 12.584092 3.086227 10.5947573.086215 14.810631 3.086088 9.047056 3.086366 9.736254 3.086088 12.537938 3.086366 10.6155263.086354 14.764431 3.086227 9.021671 3.086505 9.731639 3.086227 12.524092 3.086505 10.6270653.086493 14.688201 3.086366 9.037826 3.086643 9.729331 3.086366 12.475631 3.086643 10.6478343.086632 14.623521 3.086505 9.104749 3.086817 9.715485 3.086505 12.429477 3.086817 10.5924493.086806 14.563461 3.086643 9.042440 3.086991 9.703946 3.086643 12.392553 3.086991 10.5993733.086979 14.586561 3.086817 9.049364 3.087164 9.703946 3.086817 12.314092 3.087164 10.6432193.087153 14.496471 3.086991 9.146287 3.087338 9.687793 3.086991 12.321015 3.087338 10.6547573.087327 14.461821 3.087164 9.058595 3.087570 9.690100 3.087164 12.212553 3.087570 10.6224493.087558 14.415621 3.087338 9.017056 3.087801 9.667023 3.087338 12.175631 3.087801 10.6455263.087789 14.350941 3.087570 9.049364 3.088032 9.662408 3.087570 12.117938 3.088032 10.6224493.088021 14.281641 3.087801 9.060902 3.088264 9.662408 3.087801 12.051015 3.088264 10.6155263.088252 14.244681 3.088032 9.030902 3.088495 9.639331 3.088032 12.014091 3.088495 10.6224493.088484 14.184621 3.088264 9.113979 3.088727 9.630100 3.088264 11.949476 3.088727 10.6224493.088715 14.205411 3.088495 9.044748 3.089074 9.600101 3.088495 11.887169 3.089074 10.5947573.089062 14.032161 3.088727 9.035518 3.089421 9.600101 3.088727 11.864092 3.089421 10.599373
G:\102\00279.01\A\Reports Specs\KP\All Reports\Work in Progress\Hydrogeologic Testing Report\RevB\Appendix B\App B_3 Dewey Recovery Data Tables.xls2 of 5 11/12/2008
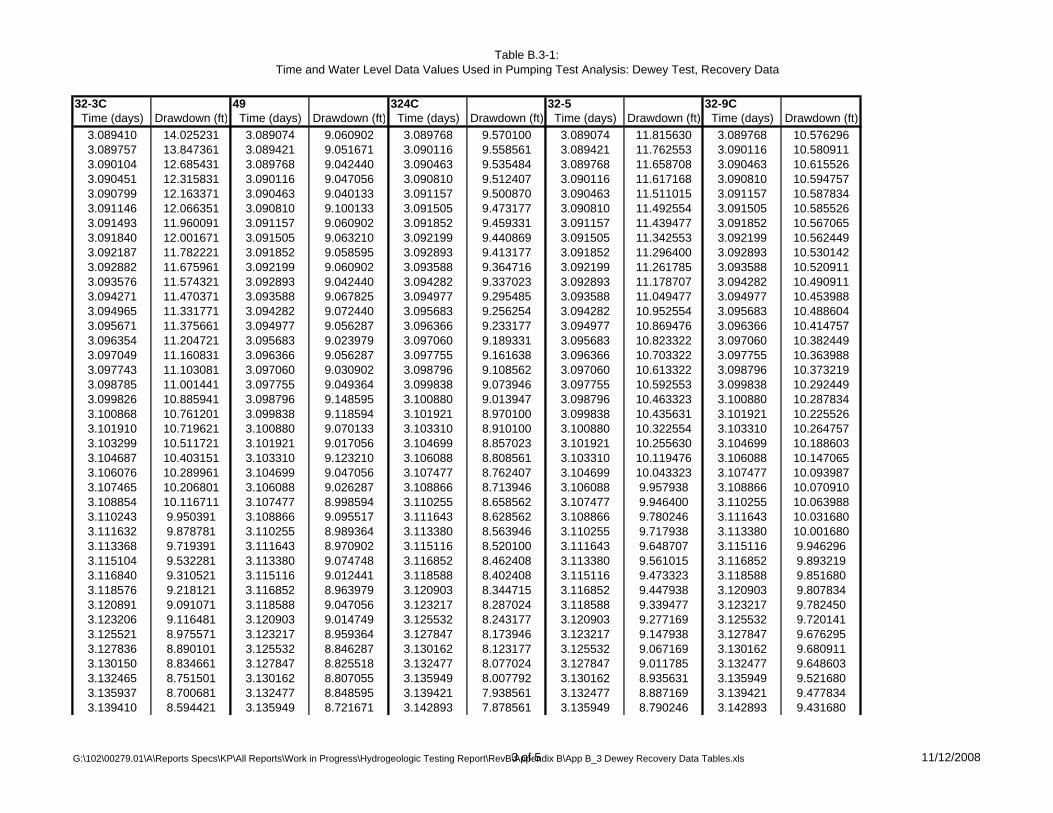
Table B.3-1:Time and Water Level Data Values Used in Pumping Test Analysis: Dewey Test, Recovery Data
32-3C 49 324C 32-5 32-9CTime (days) Drawdown (ft) Time (days) Drawdown (ft) Time (days) Drawdown (ft) Time (days) Drawdown (ft) Time (days) Drawdown (ft)3.089410 14.025231 3.089074 9.060902 3.089768 9.570100 3.089074 11.815630 3.089768 10.5762963.089757 13.847361 3.089421 9.051671 3.090116 9.558561 3.089421 11.762553 3.090116 10.5809113.090104 12.685431 3.089768 9.042440 3.090463 9.535484 3.089768 11.658708 3.090463 10.6155263.090451 12.315831 3.090116 9.047056 3.090810 9.512407 3.090116 11.617168 3.090810 10.5947573.090799 12.163371 3.090463 9.040133 3.091157 9.500870 3.090463 11.511015 3.091157 10.5878343.091146 12.066351 3.090810 9.100133 3.091505 9.473177 3.090810 11.492554 3.091505 10.5855263.091493 11.960091 3.091157 9.060902 3.091852 9.459331 3.091157 11.439477 3.091852 10.5670653.091840 12.001671 3.091505 9.063210 3.092199 9.440869 3.091505 11.342553 3.092199 10.5624493.092187 11.782221 3.091852 9.058595 3.092893 9.413177 3.091852 11.296400 3.092893 10.5301423.092882 11.675961 3.092199 9.060902 3.093588 9.364716 3.092199 11.261785 3.093588 10.5209113.093576 11.574321 3.092893 9.042440 3.094282 9.337023 3.092893 11.178707 3.094282 10.4909113.094271 11.470371 3.093588 9.067825 3.094977 9.295485 3.093588 11.049477 3.094977 10.4539883.094965 11.331771 3.094282 9.072440 3.095683 9.256254 3.094282 10.952554 3.095683 10.4886043.095671 11.375661 3.094977 9.056287 3.096366 9.233177 3.094977 10.869476 3.096366 10.4147573.096354 11.204721 3.095683 9.023979 3.097060 9.189331 3.095683 10.823322 3.097060 10.3824493.097049 11.160831 3.096366 9.056287 3.097755 9.161638 3.096366 10.703322 3.097755 10.3639883.097743 11.103081 3.097060 9.030902 3.098796 9.108562 3.097060 10.613322 3.098796 10.3732193.098785 11.001441 3.097755 9.049364 3.099838 9.073946 3.097755 10.592553 3.099838 10.2924493.099826 10.885941 3.098796 9.148595 3.100880 9.013947 3.098796 10.463323 3.100880 10.2878343.100868 10.761201 3.099838 9.118594 3.101921 8.970100 3.099838 10.435631 3.101921 10.2255263.101910 10.719621 3.100880 9.070133 3.103310 8.910100 3.100880 10.322554 3.103310 10.2647573.103299 10.511721 3.101921 9.017056 3.104699 8.857023 3.101921 10.255630 3.104699 10.1886033.104687 10.403151 3.103310 9.123210 3.106088 8.808561 3.103310 10.119476 3.106088 10.1470653.106076 10.289961 3.104699 9.047056 3.107477 8.762407 3.104699 10.043323 3.107477 10.0939873.107465 10.206801 3.106088 9.026287 3.108866 8.713946 3.106088 9.957938 3.108866 10.0709103.108854 10.116711 3.107477 8.998594 3.110255 8.658562 3.107477 9.946400 3.110255 10.0639883.110243 9.950391 3.108866 9.095517 3.111643 8.628562 3.108866 9.780246 3.111643 10.0316803.111632 9.878781 3.110255 8.989364 3.113380 8.563946 3.110255 9.717938 3.113380 10.0016803.113368 9.719391 3.111643 8.970902 3.115116 8.520100 3.111643 9.648707 3.115116 9.9462963.115104 9.532281 3.113380 9.074748 3.116852 8.462408 3.113380 9.561015 3.116852 9.8932193.116840 9.310521 3.115116 9.012441 3.118588 8.402408 3.115116 9.473323 3.118588 9.8516803.118576 9.218121 3.116852 8.963979 3.120903 8.344715 3.116852 9.447938 3.120903 9.8078343.120891 9.091071 3.118588 9.047056 3.123217 8.287024 3.118588 9.339477 3.123217 9.7824503.123206 9.116481 3.120903 9.014749 3.125532 8.243177 3.120903 9.277169 3.125532 9.7201413.125521 8.975571 3.123217 8.959364 3.127847 8.173946 3.123217 9.147938 3.127847 9.6762953.127836 8.890101 3.125532 8.846287 3.130162 8.123177 3.125532 9.067169 3.130162 9.6809113.130150 8.834661 3.127847 8.825518 3.132477 8.077024 3.127847 9.011785 3.132477 9.6486033.132465 8.751501 3.130162 8.807055 3.135949 8.007792 3.130162 8.935631 3.135949 9.5216803.135937 8.700681 3.132477 8.848595 3.139421 7.938561 3.132477 8.887169 3.139421 9.4778343.139410 8.594421 3.135949 8.721671 3.142893 7.878561 3.135949 8.790246 3.142893 9.431680
G:\102\00279.01\A\Reports Specs\KP\All Reports\Work in Progress\Hydrogeologic Testing Report\RevB\Appendix B\App B_3 Dewey Recovery Data Tables.xls3 of 5 11/12/2008

Table B.3-1:Time and Water Level Data Values Used in Pumping Test Analysis: Dewey Test, Recovery Data
32-3C 49 324C 32-5 32-9CTime (days) Drawdown (ft) Time (days) Drawdown (ft) Time (days) Drawdown (ft) Time (days) Drawdown (ft) Time (days) Drawdown (ft)3.142882 8.522811 3.139421 8.788594 3.146366 7.825485 3.139421 8.695630 3.146366 9.3809113.146354 8.435031 3.142893 8.640903 3.149838 7.765485 3.142893 8.603323 3.149838 9.2909113.149826 8.405001 3.146366 8.564748 3.153310 7.707792 3.146366 8.541015 3.153310 9.2655273.153299 8.287191 3.149838 8.550902 3.156782 7.661639 3.149838 8.448708 3.156782 9.2032183.156771 8.217891 3.153310 8.493210 3.160301 7.615485 3.153310 8.377169 3.160255 9.1316803.160243 8.190171 3.156829 8.467825 3.163773 7.569331 3.156782 8.351784 3.163762 9.1362953.163715 8.109321 3.160301 8.456286 3.167361 7.523177 3.160255 8.268707 3.167350 9.0716803.167268 8.042331 3.163773 8.370902 3.174421 7.435485 3.163727 8.229477 3.174410 8.9470643.174329 7.991511 3.167361 8.366286 3.181250 7.345485 3.167315 8.079476 3.181238 8.8778343.181157 7.859841 3.174421 8.211671 3.188194 7.283177 3.174375 8.051785 3.188183 8.6978343.188102 7.746651 3.181250 8.133210 3.195139 7.202408 3.181204 7.917938 3.195127 8.6862963.195046 7.614981 3.188194 8.057055 3.202083 7.091639 3.188148 7.804861 3.202072 8.6378343.201991 7.612671 3.195139 7.948595 3.209028 7.057023 3.195092 7.744861 3.209016 8.5478343.208935 7.501791 3.202083 7.874748 3.215972 6.999331 3.202037 7.645630 3.215961 8.4739883.215880 7.404771 3.209028 7.752440 3.222917 6.932408 3.208981 7.583323 3.222905 8.3770653.222824 7.360881 3.215972 7.724748 3.233333 6.840100 3.215926 7.502553 3.233322 8.2686033.233241 7.215351 3.222917 7.625517 3.243750 6.773177 3.222870 7.449477 3.243738 8.1716803.243657 7.150671 3.233333 7.526287 3.254167 6.715485 3.233287 7.225630 3.254155 8.0562953.254074 7.060581 3.243750 7.408595 3.264583 6.641639 3.243704 7.188707 3.264572 7.9801423.264491 6.986661 3.254167 7.297825 3.278472 6.540100 3.254120 7.114861 3.278461 7.8278343.278380 6.873471 3.264583 7.189363 3.292361 6.457023 3.264537 6.939476 3.292350 7.7470653.292268 6.755661 3.278472 7.041671 3.306250 6.392408 3.278426 6.918707 3.306238 7.6455263.306157 6.684051 3.292361 6.960902 3.320139 6.270100 3.292315 6.798707 3.320127 7.5093723.320046 6.575481 3.306250 6.866287 3.334028 6.203177 3.306204 6.701784 3.334016 7.4516803.333935 6.462291 3.320139 6.737056 3.347917 6.122408 3.320092 6.600246 3.347905 7.2647573.347824 6.448431 3.334028 6.633210 3.361806 6.062408 3.333981 6.503323 3.361794 7.2347573.361713 6.295971 3.347917 6.524748 3.379167 6.025485 3.347870 6.369476 3.379155 7.1239883.379074 6.265941 3.361806 6.471671 3.396528 5.949331 3.361759 6.327938 3.396516 7.0247573.396435 6.166611 3.379167 6.328594 3.413889 5.889331 3.379120 6.270246 3.413877 6.9255263.413796 6.023391 3.396528 6.284748 3.431250 5.817792 3.396481 6.159477 3.431238 6.7939883.431157 6.060351 3.413889 6.167056 3.454398 5.750869 3.413842 6.083323 3.454387 6.6901423.454306 5.935611 3.431250 6.081671 3.477546 5.667792 3.431204 6.027938 3.477535 6.5932193.477454 5.778531 3.454398 5.966287 3.500694 5.593946 3.454352 5.850246 3.500683 6.4778343.500602 5.746191 3.477546 5.910902 3.523958 5.536254 3.477500 5.861784 3.523947 6.4039883.523866 5.702301 3.500694 5.781672 3.546991 5.471639 3.500648 5.757938 3.546979 6.2470653.546898 5.623761 3.523958 5.774748 3.570139 5.413946 3.523912 5.688707 3.570127 6.1732193.570046 5.556771 3.546991 5.721671 3.604861 5.330869 3.546945 5.568707 3.604850 6.0601423.604768 5.480541 3.570139 5.523210 3.639583 5.240870 3.570092 5.527169 3.639572 5.9101413.639491 5.369661 3.604861 5.433210 3.674306 5.155485 3.604815 5.455630 3.674294 5.7001423.674213 5.231061 3.639583 5.322441 3.709028 5.047023 3.639537 5.310246 3.709016 5.658603
G:\102\00279.01\A\Reports Specs\KP\All Reports\Work in Progress\Hydrogeologic Testing Report\RevB\Appendix B\App B_3 Dewey Recovery Data Tables.xls4 of 5 11/12/2008
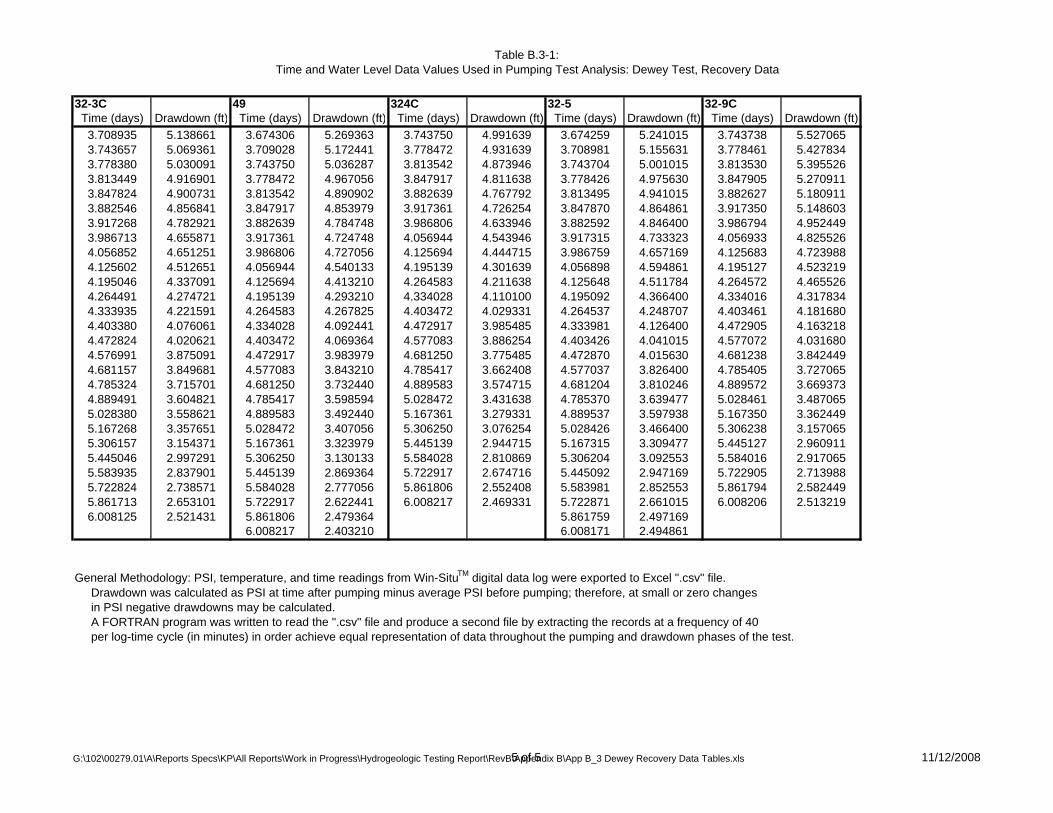
Table B.3-1:Time and Water Level Data Values Used in Pumping Test Analysis: Dewey Test, Recovery Data
32-3C 49 324C 32-5 32-9CTime (days) Drawdown (ft) Time (days) Drawdown (ft) Time (days) Drawdown (ft) Time (days) Drawdown (ft) Time (days) Drawdown (ft)3.708935 5.138661 3.674306 5.269363 3.743750 4.991639 3.674259 5.241015 3.743738 5.5270653.743657 5.069361 3.709028 5.172441 3.778472 4.931639 3.708981 5.155631 3.778461 5.4278343.778380 5.030091 3.743750 5.036287 3.813542 4.873946 3.743704 5.001015 3.813530 5.3955263.813449 4.916901 3.778472 4.967056 3.847917 4.811638 3.778426 4.975630 3.847905 5.2709113.847824 4.900731 3.813542 4.890902 3.882639 4.767792 3.813495 4.941015 3.882627 5.1809113.882546 4.856841 3.847917 4.853979 3.917361 4.726254 3.847870 4.864861 3.917350 5.1486033.917268 4.782921 3.882639 4.784748 3.986806 4.633946 3.882592 4.846400 3.986794 4.9524493.986713 4.655871 3.917361 4.724748 4.056944 4.543946 3.917315 4.733323 4.056933 4.8255264.056852 4.651251 3.986806 4.727056 4.125694 4.444715 3.986759 4.657169 4.125683 4.7239884.125602 4.512651 4.056944 4.540133 4.195139 4.301639 4.056898 4.594861 4.195127 4.5232194.195046 4.337091 4.125694 4.413210 4.264583 4.211638 4.125648 4.511784 4.264572 4.4655264.264491 4.274721 4.195139 4.293210 4.334028 4.110100 4.195092 4.366400 4.334016 4.3178344.333935 4.221591 4.264583 4.267825 4.403472 4.029331 4.264537 4.248707 4.403461 4.1816804.403380 4.076061 4.334028 4.092441 4.472917 3.985485 4.333981 4.126400 4.472905 4.1632184.472824 4.020621 4.403472 4.069364 4.577083 3.886254 4.403426 4.041015 4.577072 4.0316804.576991 3.875091 4.472917 3.983979 4.681250 3.775485 4.472870 4.015630 4.681238 3.8424494.681157 3.849681 4.577083 3.843210 4.785417 3.662408 4.577037 3.826400 4.785405 3.7270654.785324 3.715701 4.681250 3.732440 4.889583 3.574715 4.681204 3.810246 4.889572 3.6693734.889491 3.604821 4.785417 3.598594 5.028472 3.431638 4.785370 3.639477 5.028461 3.4870655.028380 3.558621 4.889583 3.492440 5.167361 3.279331 4.889537 3.597938 5.167350 3.3624495.167268 3.357651 5.028472 3.407056 5.306250 3.076254 5.028426 3.466400 5.306238 3.1570655.306157 3.154371 5.167361 3.323979 5.445139 2.944715 5.167315 3.309477 5.445127 2.9609115.445046 2.997291 5.306250 3.130133 5.584028 2.810869 5.306204 3.092553 5.584016 2.9170655.583935 2.837901 5.445139 2.869364 5.722917 2.674716 5.445092 2.947169 5.722905 2.7139885.722824 2.738571 5.584028 2.777056 5.861806 2.552408 5.583981 2.852553 5.861794 2.5824495.861713 2.653101 5.722917 2.622441 6.008217 2.469331 5.722871 2.661015 6.008206 2.5132196.008125 2.521431 5.861806 2.479364 5.861759 2.497169
6.008217 2.403210 6.008171 2.494861
General Methodology: PSI, temperature, and time readings from Win-SituTM digital data log were exported to Excel ".csv" file. Drawdown was calculated as PSI at time after pumping minus average PSI before pumping; therefore, at small or zero changes in PSI negative drawdowns may be calculated. A FORTRAN program was written to read the ".csv" file and produce a second file by extracting the records at a frequency of 40 per log-time cycle (in minutes) in order achieve equal representation of data throughout the pumping and drawdown phases of the test.
G:\102\00279.01\A\Reports Specs\KP\All Reports\Work in Progress\Hydrogeologic Testing Report\RevB\Appendix B\App B_3 Dewey Recovery Data Tables.xls5 of 5 11/12/2008
Appendix B-4 Additional Aquifer Parameter Determinations

Client Project Title
DEWEY-BURDOCKTheis Drawdown Analysis at Dewey Pumping Well 32-3CHYDROGEOLOGIC TESTING
REPORTProject No: DV10200279.01 Date: 10/16/08 Appendix B, Figure B.4-1
G:\102\00279.01\A\Reports Specs\KP\All Reports\Work in Progress\Hydrogeologic Testing Report\Appendices\Appendix B\Appendix B.4-1 Theis 32-3C.xls 10/16/2008

Client Project Title
DEWEY-BURDOCKTheis Drawdown Analysis at Dewey Observation Well 32-5HYDROGEOLOGIC TESTING
REPORTProject No: DV10200279.01 Date: 10/16/08 Appendix B, Figure B.4-2
G:\102\00279.01\A\Reports Specs\KP\All Reports\Work in Progress\Hydrogeologic Testing Report\Appendices\Appendix B\Appendix B.4-2 Theis 32-5.xls 10/16/2008
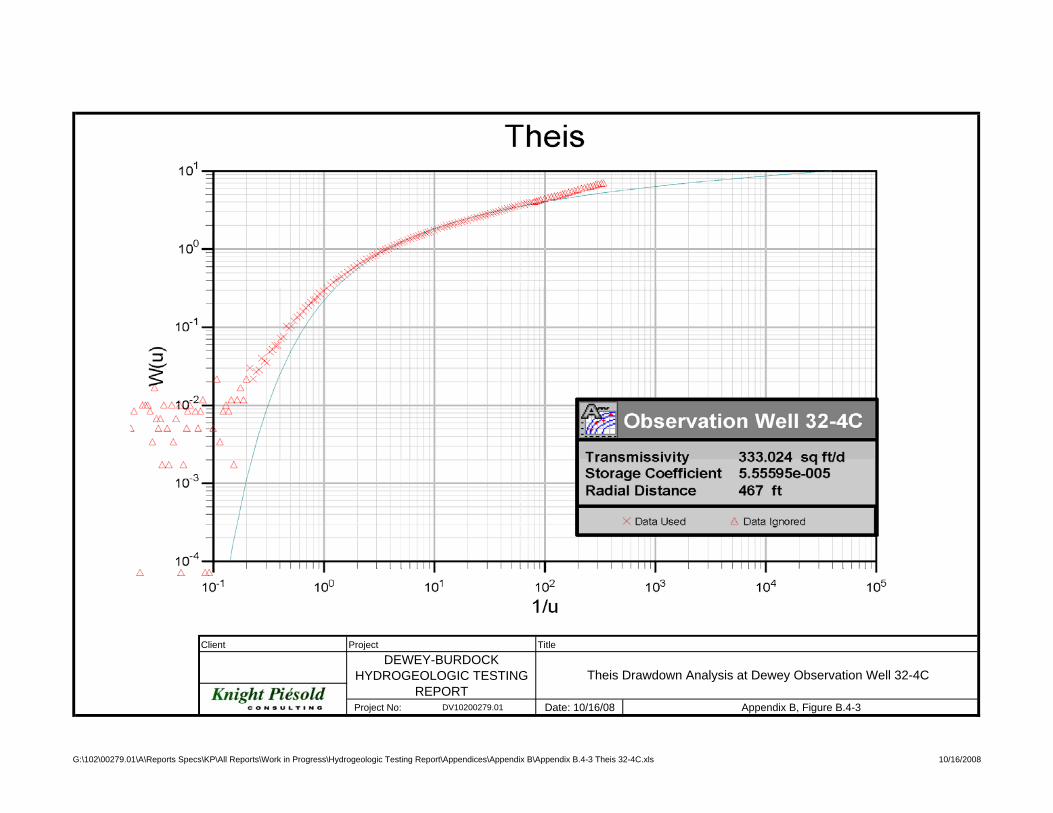
Client Project Title
DEWEY-BURDOCKTheis Drawdown Analysis at Dewey Observation Well 32-4CHYDROGEOLOGIC TESTING
REPORTProject No: DV10200279.01 Date: 10/16/08 Appendix B, Figure B.4-3
G:\102\00279.01\A\Reports Specs\KP\All Reports\Work in Progress\Hydrogeologic Testing Report\Appendices\Appendix B\Appendix B.4-3 Theis 32-4C.xls 10/16/2008
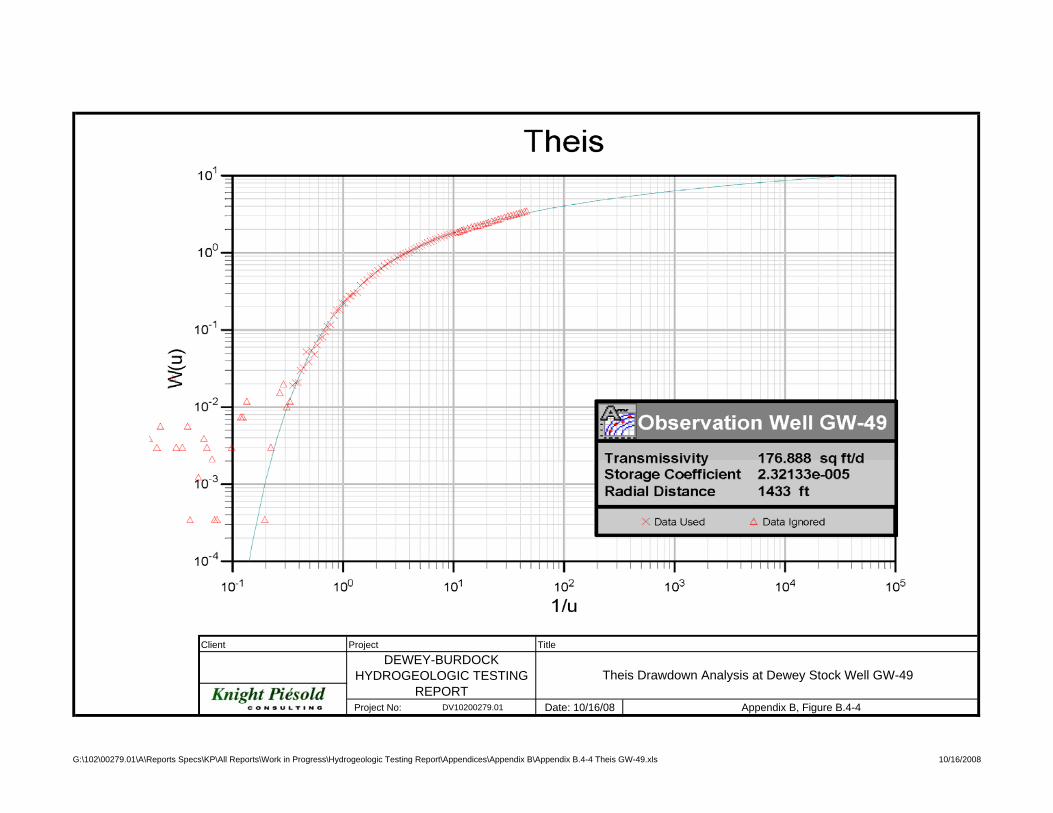
Client Project Title
DEWEY-BURDOCKTheis Drawdown Analysis at Dewey Stock Well GW-49HYDROGEOLOGIC TESTING
REPORTProject No: DV10200279.01 Date: 10/16/08 Appendix B, Figure B.4-4
G:\102\00279.01\A\Reports Specs\KP\All Reports\Work in Progress\Hydrogeologic Testing Report\Appendices\Appendix B\Appendix B.4-4 Theis GW-49.xls 10/16/2008
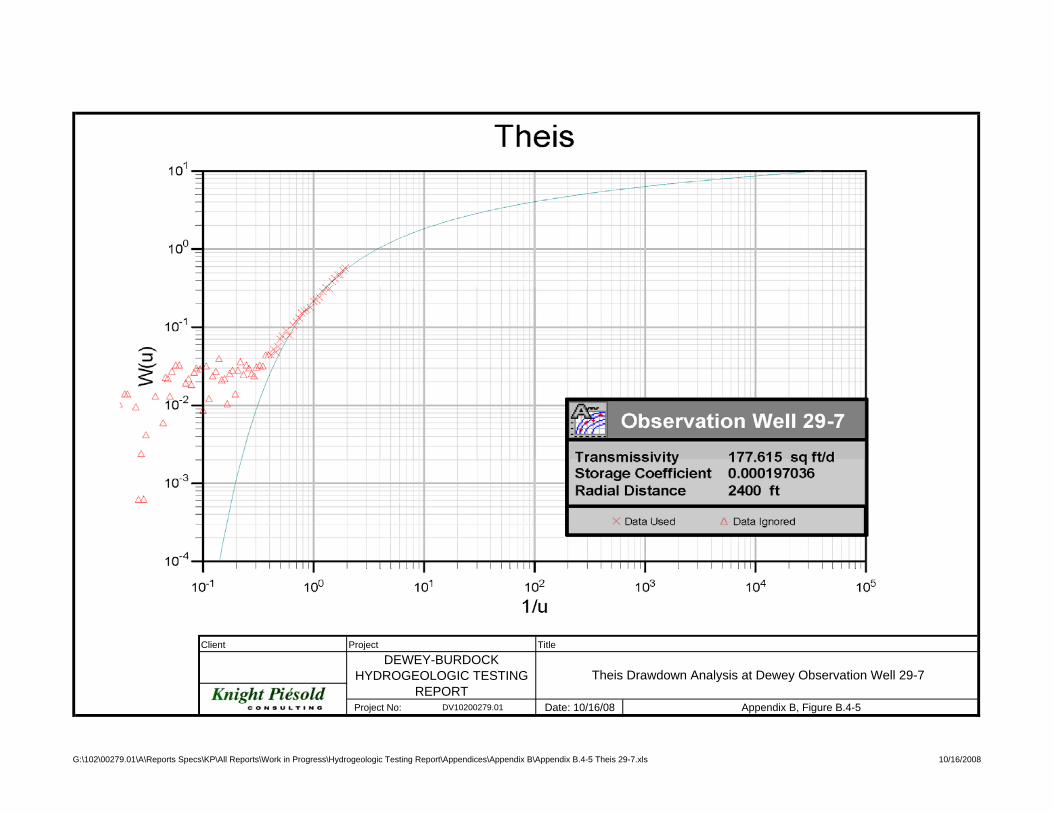
Client Project Title
DEWEY-BURDOCKTheis Drawdown Analysis at Dewey Observation Well 29-7HYDROGEOLOGIC TESTING
REPORTProject No: DV10200279.01 Date: 10/16/08 Appendix B, Figure B.4-5
G:\102\00279.01\A\Reports Specs\KP\All Reports\Work in Progress\Hydrogeologic Testing Report\Appendices\Appendix B\Appendix B.4-5 Theis 29-7.xls 10/16/2008

Client Project Title
DEWEY-BURDOCKTheis Drawdown Analysis at Dewey Upper Fall River Observation Well 32-9CHYDROGEOLOGIC TESTING
REPORTProject No: DV10200279.01 Date: 10/16/08 Appendix B, Figure B.4-6
G:\102\00279.01\A\Reports Specs\KP\All Reports\Work in Progress\Hydrogeologic Testing Report\Appendices\Appendix B\Appendix B.4-6 Theis 32-9C.xls 10/16/2008

Client Project TitleDEWEY-BURDOCK
Theis-Cooper-Jacob Recovery Analyses, Dewey Observation Wells 32-4C and GW-49
HYDROGEOLOGIC TESTINGREPORT
Project No: DV10200279.01 Date: 10/16/08 Appendix B Figure B.4-7
G:\102\00279.01\A\Reports Specs\KP\All Reports\Work in Progress\Hydrogeologic Testing Report\Appendices\Appendix B\Appendix B.4-7 CR 32-4c_GW-49.xls 10/16/2008
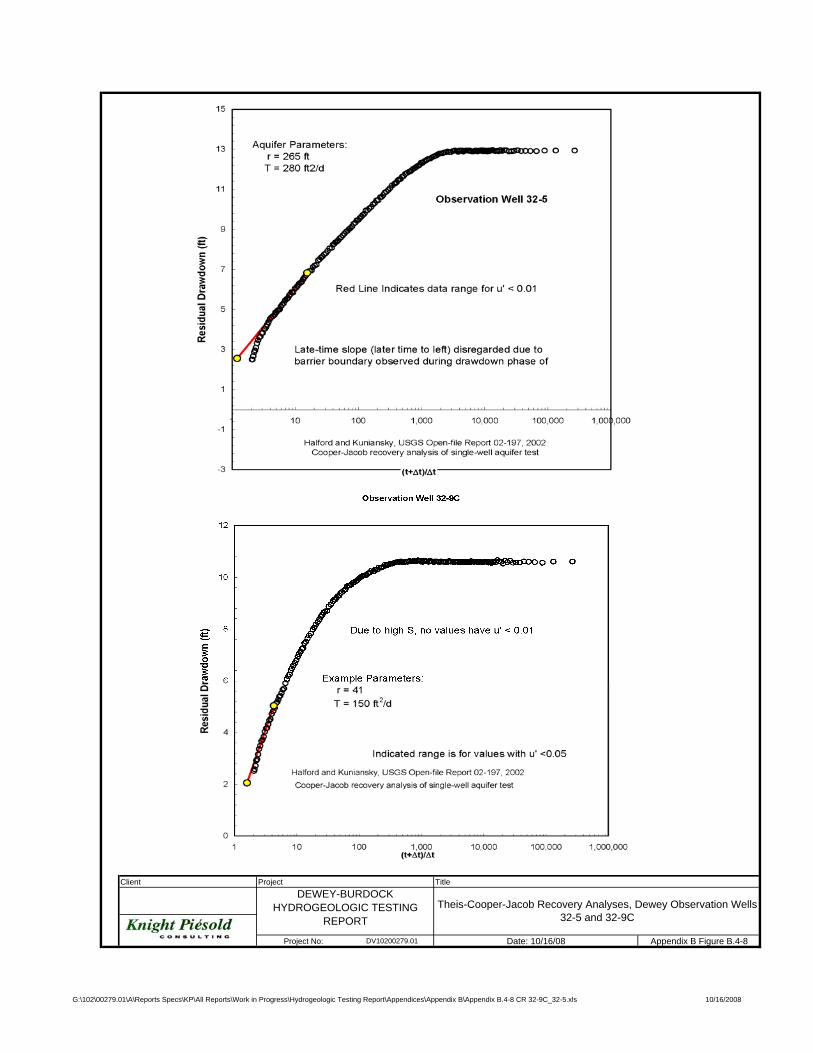
Client Project TitleDEWEY-BURDOCK
Theis-Cooper-Jacob Recovery Analyses, Dewey Observation Wells 32-5 and 32-9C
HYDROGEOLOGIC TESTINGREPORT
Project No: DV10200279.01 Date: 10/16/08 Appendix B Figure B.4-8
G:\102\00279.01\A\Reports Specs\KP\All Reports\Work in Progress\Hydrogeologic Testing Report\Appendices\Appendix B\Appendix B.4-8 CR 32-9C_32-5.xls 10/16/2008
Appendix C Burdock Test Supplemental Information
Appendix C-1: Well Completion Diagrams Appendix C-2: Time and Water Level Data Values Used in
Pumping Test Analysis: Burdock Test, Drawdown Data
Appendix C-3: Time and Water Level Data Values Used in
Pumping Test Analysis: Burdock Test, Recover Data
Appendix C-4: Additional Aquifer Parameter
Determinations

Appendix C-1 Well Completion Diagrams

POWERTECH WELL AND PUMP DATA
Location of Well Burdock, SD
Drilling Contractor Davis Drilling Driller
Tony Well Name DB07-11-11C
County Fall River Type of Rig
Drilling Fluid mud Well Depth 436'
LAT 4811660N LONG 583455E Elevation 4163' Screened Monitoring Well Completion Detail
Datum point from which all measurements are taken
Method of Drilling Date: 10/10/07 Cabel Tool Hollow Rod Direct Rotary Air Rotary Bucket Auger Reverse Rotary Flight Auger Jetted Dug Driven Other mud rotary
Use Domestic Public Supply Industrial Irrigation Municipal Commercial Test Well Heating or Cooling Monitoring Other
One well volume (V) = gallons
Initial Development Water Water Level (TIC) Well Depth Color Odor Clarity Developed By Date Well Development Date Description of Development Technique
Pump Date Installed Type Manufacturer Model No. H.P. Volts Capacity Depth of Pump Intake Setting No. of Stages Oil Water Lubrication Power Source Material of drop pipe Bowls Shafting Impellors Bowl Diameter Column Pipe Diameter Length Modification
Screened Well No.
A. Stick-up Length 2.0'
B. Key No. NA
C. Protective Casing Diameter NA Material NA Length NA Depth to Bottom NA
D. Surface Completion Diameter NA Depth NA Material NA
E. Well Casing Data Diameter 6" ID Material PVC Length 428' Weight SCH 40 Depth to Bottom 426'
F. Grout cement Date 10/30/07 Depth to Top 0' Depth to Bottom 427' Material sulfate resis. cement Density 15.2b/gal Volume 24.1 bbls % Excess 50 Method of Installation displacement Depth to Cement in Casing 396' Return Constant Yes No Volume of Grout Return 0
G. Borehole Diameter Drilling Dates 6.5" 10/10/07
H. Pack Type/SizeNA Date NA Depth to Top NA Depth to Bottom Material Method of Installation Gradation
I. Screen Date 12/18/08 Depth to Top 426-436'' Depth to Bottom Manufacturer Material PVC Slot .01"
J. Bottom Cap Material PVC Length 1" Driller Tony
Boring Depth 495'TD 418' casing'
Additional Information
******Mechanical Integrity Test******
Geophysical Logs Run Gamma, Resistivity, SP, ran 10/10/07
Water Quality Sample taken? Yes No Where analyzed?
PSI Increments Calibration Date of Gage PSI Full Scale Test Run By Stan Davis, Len Eakin Date Test Run 12/13/08 Time Beginning of Test 0900 Time End of Test 1100 Initial Pressure 35.0PSIG Initial Fluid Level 5.0 inches
Final Pressure 35.0PSIG Final Fluid Level 5.0inches Date well completed 12/18/08
GroundSurface
A
C
D
G
H
I
J
K
B
E
F

WELL DEVELOPMENT RECORD – PARAMETER MEASUREMENTS
Total Volume Withdrawal Well
No. Time
Gallons Borehole Volume
pH Conductivity (ms/cm)
Temp (°C)
Turbidity (NTU) Comments
11-11c 1400 appears cl. 12/18/08 well developed
1430 water appeared clear within 5 minutes
approx. 30 gpm while pumping
150psi kickoff, 90psi sustained

POWERTECH WELL AND PUMP DATA
Location of Well Burdock, SD
Drilling Contractor Davis Drilling Driller
Tony Well Name DB07-11-14C
County Fall River Type of Rig
Drilling Fluid mud Well Depth 423'
LAT 4811591N LONG 583496E Elevation 3645' Screened Monitoring Well Completion Detail
Datum point from which all measurements are taken
Method of Drilling Date: 11/2/07 Cabel Tool Hollow Rod Direct Rotary Air Rotary Bucket Auger Reverse Rotary Flight Auger Jetted Dug Driven Other mud rotary
Use Domestic Public Supply Industrial Irrigation Municipal Commercial Test Well Heating or Cooling Monitoring Other
One well volume (V) = gallons
Initial Development Water Water Level (TIC) Well Depth Color Odor Clarity Developed By Date Well Development Date Description of Development Technique
Pump Date Installed Type Manufacturer Model No. H.P. Volts Capacity Depth of Pump Intake Setting No. of Stages Oil Water Lubrication Power Source Material of drop pipe Bowls Shafting Impellors Bowl Diameter Column Pipe Diameter Length Modification
Screened Well No.
A. Stick-up Length 2.0'
B. Key No. NA
C. Protective Casing Diameter NA Material NA Length NA Depth to Bottom NA
D. Surface Completion Diameter NA Depth NA Material NA
E. Well Casing Data Diameter 4" ID Material PVC Length 415' Weight SCH 40 Depth to Bottom 413'
F. Grout cement Date 11/3/07 Depth to Top 0' Depth to Bottom 414' Material sulfate resis. cement Density 15.2b/gal Volume 15.8 bbls % Excess 50 Method of Installation displacement Depth to Cement in Casing 303' Return Constant Yes No Volume of Grout Return 0
G. Borehole Diameter Drilling Dates 6.25" 11/2/07
H. Pack Type/SizeNA Date NA Depth to Top NA Depth to Bottom Material Method of Installation Gradation
I. Screen Date 2/13/08 Depth to Top 413-423' Depth to Bottom Manufacturer Material PVC Slot .01"
J. Bottom Cap Material PVC Length 1" Driller Tony
Boring Depth 460'TD 415' ream'
Additional Information
******Mechanical Integrity Test******
Geophysical Logs Run Gamma, Resistivity, SP, ran 11/2/07
Water Quality Sample taken? Yes No Where analyzed?
PSI Increments Calibration Date of Gage PSI Full Scale Test Run By Stan Davis, Len Eakin Date Test Run 2/12/08 Time Beginning of Test 1400 Time End of Test 1445 Initial Pressure 40.0PSIG Initial Fluid Level 5.0 inches
Final Pressure 40.0PSIG Final Fluid Level 5.0inches Date well completed 2/13/08
GroundSurface
A
C
D
G
H
I
J
K
B
E
F
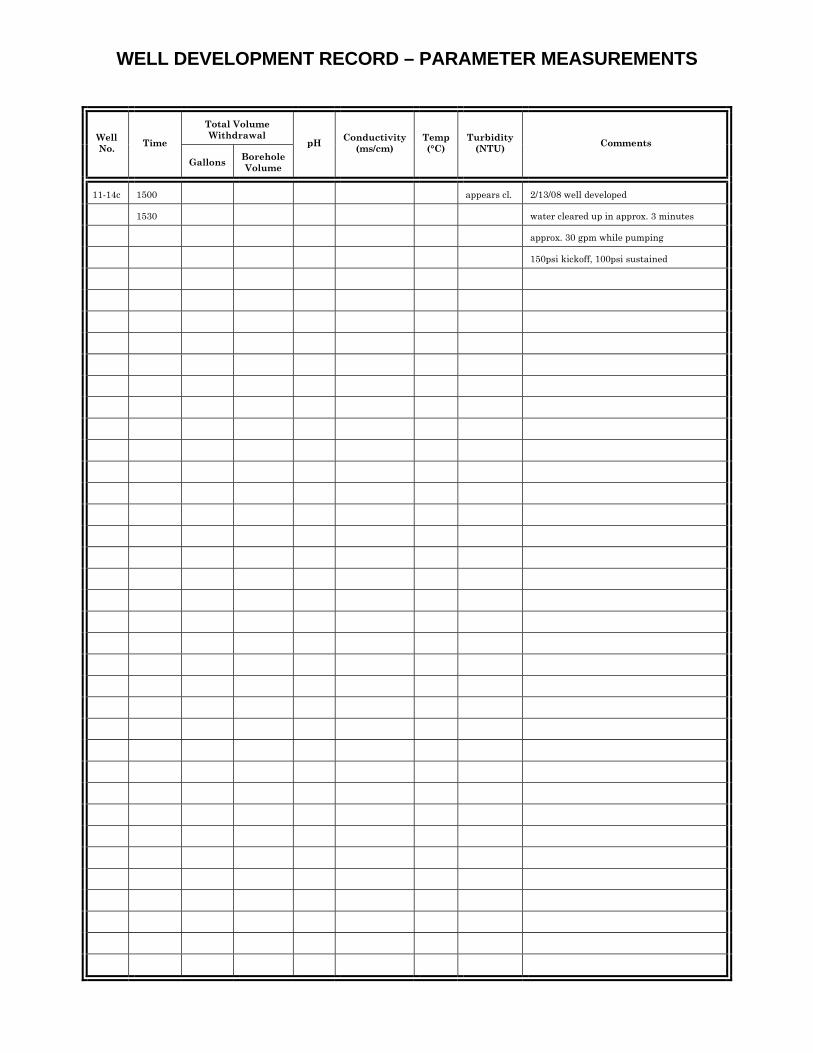
WELL DEVELOPMENT RECORD – PARAMETER MEASUREMENTS
Total Volume Withdrawal Well
No. Time
Gallons Borehole Volume
pH Conductivity (ms/cm)
Temp (°C)
Turbidity (NTU) Comments
11-14c 1500 appears cl. 2/13/08 well developed
1530 water cleared up in approx. 3 minutes
approx. 30 gpm while pumping
150psi kickoff, 100psi sustained

POWERTECH WELL AND PUMP DATA
Location of Well Burdock, SD
Drilling Contractor Davis Drilling Driller
Tony Well Name DB07-11-15
County Fall River Type of Rig
Drilling Fluid mud Well Depth 428'
LAT 4811590N LONG 583428E Elevation 3710' Screened Monitoring Well Completion Detail
Datum point from which all measurements are taken
Method of Drilling Date: 11/4/07 Cabel Tool Hollow Rod Direct Rotary Air Rotary Bucket Auger Reverse Rotary Flight Auger Jetted Dug Driven Other mud rotary
Use Domestic Public Supply Industrial Irrigation Municipal Commercial Test Well Heating or Cooling Monitoring Other
One well volume (V) = gallons
Initial Development Water Water Level (TIC) Well Depth Color Odor Clarity Developed By Date Well Development Date Description of Development Technique
Pump Date Installed Type Manufacturer Model No. H.P. Volts Capacity Depth of Pump Intake Setting No. of Stages Oil Water Lubrication Power Source Material of drop pipe Bowls Shafting Impellors Bowl Diameter Column Pipe Diameter Length Modification
Screened Well No.
A. Stick-up Length 2.0'
B. Key No. NA
C. Protective Casing Diameter NA Material NA Length NA Depth to Bottom NA
D. Surface Completion Diameter NA Depth NA Material NA
E. Well Casing Data Diameter 4" ID Material PVC Length 420' Weight SCH 40 Depth to Bottom 418'
F. Grout cement Date 11/5/07 Depth to Top 0' Depth to Bottom 419' Material sulfate resis. cement Density 15.2b/gal Volume 15.7 bbls % Excess 50 Method of Installation displacement Depth to Cement in Casing 290' Return Constant Yes No Volume of Grout Return 0
G. Borehole Diameter Drilling Dates 6.5" 11/4/07
H. Pack Type/SizeNA Date NA Depth to Top NA Depth to Bottom Material Method of Installation Gradation
I. Screen Date 2/24/08 Depth to Top 418-428' Depth to Bottom Manufacturer Material PVC Slot .01"
J. Bottom Cap Material PVC Length 1" Driller Tony
Boring Depth 495'TD 418' casing'
Additional Information
******Mechanical Integrity Test******
Geophysical Logs Run Gamma, Resistivity, SP, ran 11/4/07
Water Quality Sample taken? Yes No Where analyzed?
PSI Increments Calibration Date of Gage PSI Full Scale Test Run By Stan Davis, Len Eakin Date Test Run 2/9/08 Time Beginning of Test 0930 Time End of Test 1015 Initial Pressure 40.0PSIG Initial Fluid Level 5.0 inches
Final Pressure 40.0PSIG Final Fluid Level 5.0inches Date well completed 2/24/08
GroundSurface
A
C
D
G
H
I
J
K
B
E
F
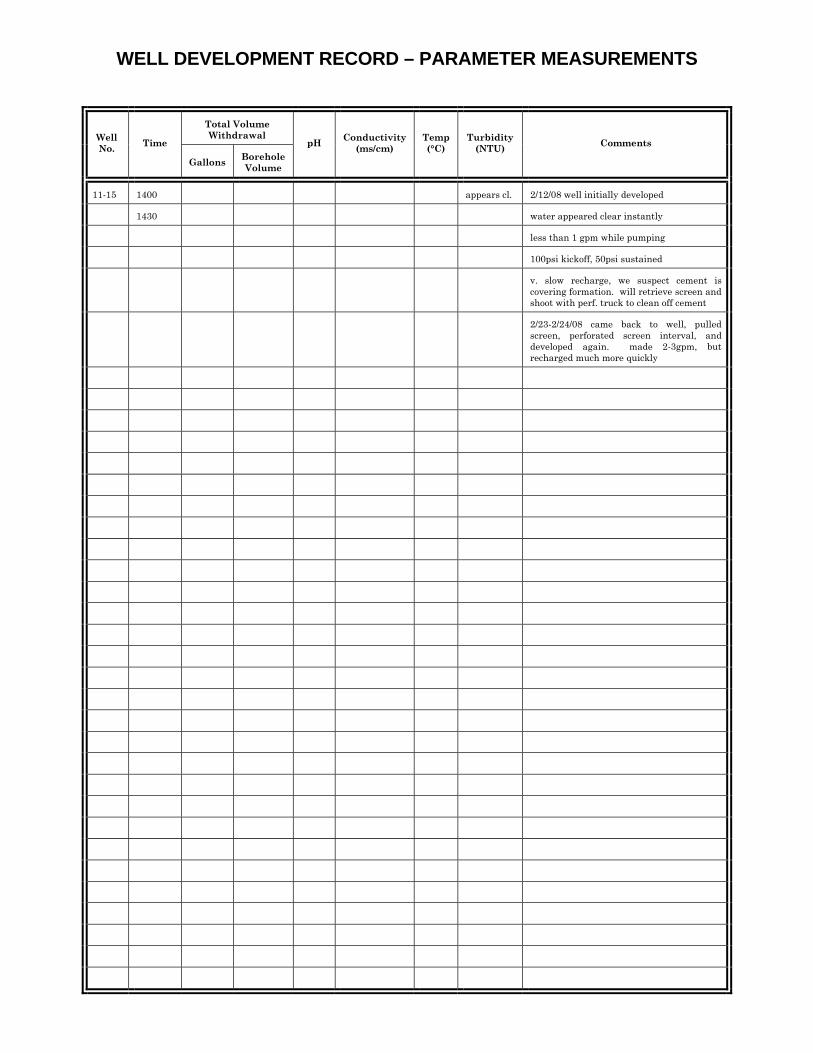
WELL DEVELOPMENT RECORD – PARAMETER MEASUREMENTS
Total Volume Withdrawal Well
No. Time
Gallons Borehole Volume
pH Conductivity (ms/cm)
Temp (°C)
Turbidity (NTU) Comments
11-15 1400 appears cl. 2/12/08 well initially developed
1430 water appeared clear instantly
less than 1 gpm while pumping
100psi kickoff, 50psi sustained
v. slow recharge, we suspect cement is covering formation. will retrieve screen and shoot with perf. truck to clean off cement
2/23-2/24/08 came back to well, pulled screen, perforated screen interval, and developed again. made 2-3gpm, but recharged much more quickly

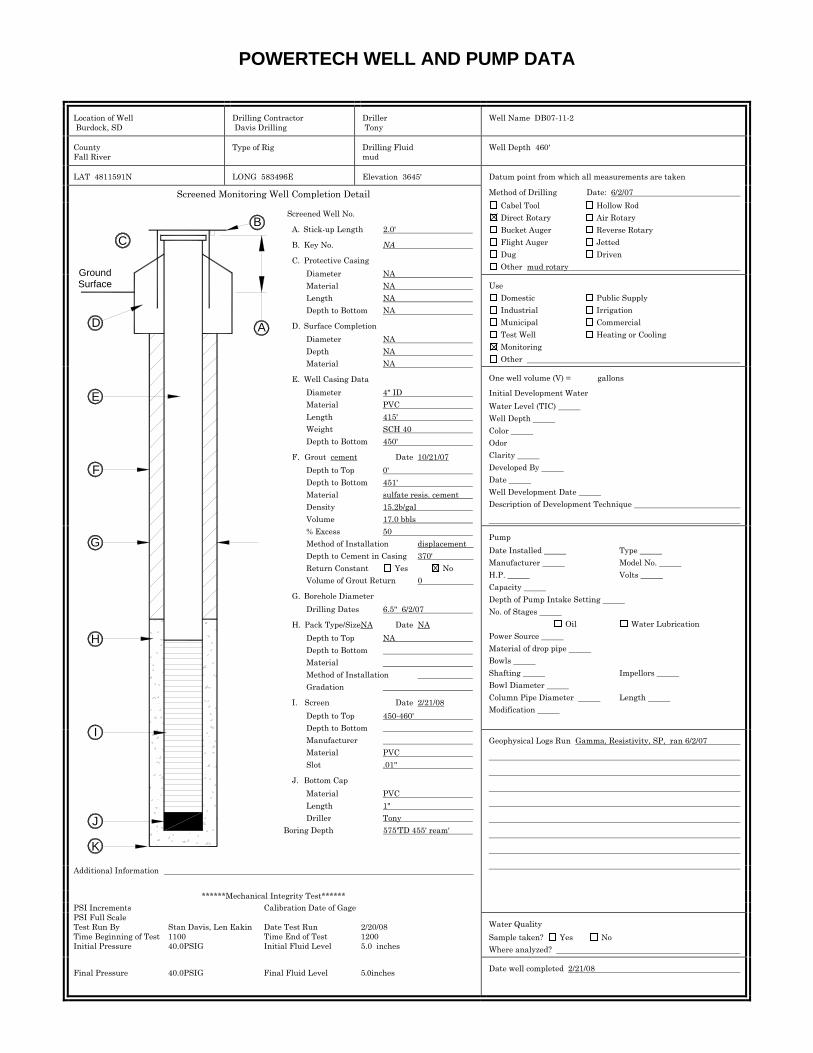
POWERTECH WELL AND PUMP DATA
Location of Well Burdock, SD
Drilling Contractor Davis Drilling Driller
Tony Well Name DB07-11-2
County Fall River Type of Rig
Drilling Fluid mud Well Depth 460'
LAT 4811591N LONG 583496E Elevation 3645' Screened Monitoring Well Completion Detail
Datum point from which all measurements are taken
Method of Drilling Date: 6/2/07 Cabel Tool Hollow Rod Direct Rotary Air Rotary Bucket Auger Reverse Rotary Flight Auger Jetted Dug Driven Other mud rotary
Use Domestic Public Supply Industrial Irrigation Municipal Commercial Test Well Heating or Cooling Monitoring Other
One well volume (V) = gallons
Initial Development Water Water Level (TIC) Well Depth Color Odor Clarity Developed By Date Well Development Date Description of Development Technique
Pump Date Installed Type Manufacturer Model No. H.P. Volts Capacity Depth of Pump Intake Setting No. of Stages Oil Water Lubrication Power Source Material of drop pipe Bowls Shafting Impellors Bowl Diameter Column Pipe Diameter Length Modification
Screened Well No.
A. Stick-up Length 2.0'
B. Key No. NA
C. Protective Casing Diameter NA Material NA Length NA Depth to Bottom NA
D. Surface Completion Diameter NA Depth NA Material NA
E. Well Casing Data Diameter 4" ID Material PVC Length 415' Weight SCH 40 Depth to Bottom 450'
F. Grout cement Date 10/21/07 Depth to Top 0' Depth to Bottom 451' Material sulfate resis. cement Density 15.2b/gal Volume 17.0 bbls % Excess 50 Method of Installation displacement Depth to Cement in Casing 370' Return Constant Yes No Volume of Grout Return 0
G. Borehole Diameter Drilling Dates 6.5" 6/2/07
H. Pack Type/SizeNA Date NA Depth to Top NA Depth to Bottom Material Method of Installation Gradation
I. Screen Date 2/21/08 Depth to Top 450-460' Depth to Bottom Manufacturer Material PVC Slot .01"
J. Bottom Cap Material PVC Length 1" Driller Tony
Boring Depth 575'TD 455' ream'
Additional Information
******Mechanical Integrity Test******
Geophysical Logs Run Gamma, Resistivity, SP, ran 6/2/07
Water Quality Sample taken? Yes No Where analyzed?
PSI Increments Calibration Date of Gage PSI Full Scale Test Run By Stan Davis, Len Eakin Date Test Run 2/20/08 Time Beginning of Test 1100 Time End of Test 1200 Initial Pressure 40.0PSIG Initial Fluid Level 5.0 inches
Final Pressure 40.0PSIG Final Fluid Level 5.0inches Date well completed 2/21/08
GroundSurface
A
C
D
G
H
I
J
K
B
E
F

WELL DEVELOPMENT RECORD – PARAMETER MEASUREMENTS
Total Volume Withdrawal Well
No. Time
Gallons Borehole Volume
pH Conductivity (ms/cm)
Temp (°C)
Turbidity (NTU) Comments
11-2 1300 appears cl. 2/21/08 well developed
1330 water cleared up in approx. 10 minutes
approx. 25-30 gpm while pumping
175psi kickoff, 90psi sustained
we lifted well for 10 minutes before pushing screen to make sure that the formation was not blocked off by cement. appeared to be making good water, so we pushed screened then lifted for another 30 minutes.


POWERTECH WELL AND PUMP DATA
Location of Well Dewey, SD
Drilling Contractor Davis Drilling Driller
Tony Well Name DB08-11-17
County Fall River Type of Rig
Speed Star 1500 Drilling Fluid Mud Well Depth 255'
LAT 4811660N LONG 583440E Elevation ?'
Screened Monitoring Well Completion Detail
Datum point from which all measurements are taken
Method of Drilling Date: 03/25/08 Cabel Tool Hollow Rod Direct Rotary Air Rotary Bucket Auger Reverse Rotary Flight Auger Jetted Dug Driven Other Mud Rotary
Use Domestic Public Supply Industrial Irrigation Municipal Commercial Test Well Heating or Cooling Monitoring Other
One well volume (V) = gallons
Initial Development Water Water Level (TIC) 38.08 ft below ground surface Well Depth Color Odor Clarity Developed By Date Well Development Date Description of Development Technique
Pump Date Installed Type Manufacturer Model No. H.P. Volts Capacity Depth of Pump Intake Setting No. of Stages Oil Water Lubrication Power Source Material of drop pipe Bowls Shafting Impellors Bowl Diameter Column Pipe Diameter Length Modification
Screened Well No.
A. Stick-up Length 2.0'
B. Key No. NA
C. Protective Casing Diameter NA Material NA Length NA Depth to Bottom NA
D. Surface Completion Diameter NA Depth NA Material NA
E. Well Casing Data Diameter 6" ID Material PVC Length 247' Weight SDR17 Depth to Bottom 245'
F. Grout Cement Date 03/26/08 Depth to Top 0' Depth to Bottom 247' Material Type V "LA" Cement Density 15.2 lb/gal Volume 10.05 bbls % Excess 10 Method of Installation Displacement Depth to Cement in Casing ?' Return Constant Yes No Volume of Grout Return 2.5 bbls
G. Borehole Diameter Drilling Dates 8.75" 03/26/08
H. Pack Type/SizeNA Date NA Depth to Top NA Depth to Bottom Material Method of Installation Gradation
I. Screen Date 04/01/08 Depth to Top 245-255' Depth to Bottom Manufacturer Material PVC Slot .01"
J. Bottom Cap Material PVC Length 1" Driller Tommy
Boring Depth 257'
Additional Information
******Mechanical Integrity Test******
Geophysical Logs Run Gamma, Resistivity, SP
Water Quality Sample taken? Yes No Where analyzed?
PSI Increments Calibration Date of Gage PSI Full Scale Test Run By Stan Davis, Dan Tschopp Date Test Run 04/01/08 Time Beginning of Test 0830 Time End of Test 0930 Initial Pressure 35.0 PSIG Initial Fluid Level 4 inches Final Pressure 35.0 PSIG Final Fluid Level 4inches
Date well completed 04/01/08
GroundSurface
A
C
D
G
H
I
J
K
B
E
F

WELL DEVELOPMENT RECORD – PARAMETER MEASUREMENTS
Total Volume Withdrawal Well
No. Time
Gallons Borehole Volume
pH Conductivity (ms/cm)
Temp (°C)
Turbidity (NTU) Comments
Well developed: 04/01/08
Water cleared up within 5 minutes
Unload Pressure: 110psi
Steady Lift Pressure: 10psi
20 minute Recovery Pressure: 15psi
Output: Approximately 1.5 gpm
Screened Interval: Fall River SS Formation
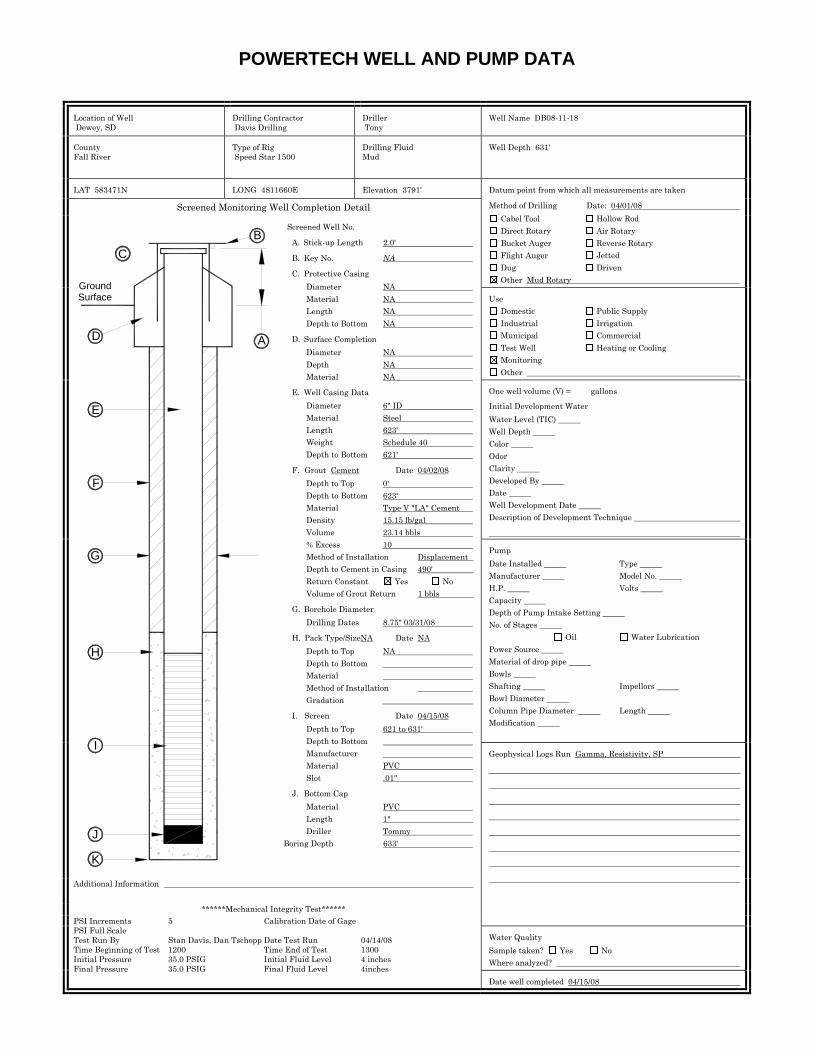
POWERTECH WELL AND PUMP DATA
Location of Well Dewey, SD
Drilling Contractor Davis Drilling Driller
Tony Well Name DB08-11-18
County Fall River Type of Rig
Speed Star 1500 Drilling Fluid Mud Well Depth 631'
LAT 583471N LONG 4811660E Elevation 3791'
Screened Monitoring Well Completion Detail
Datum point from which all measurements are taken
Method of Drilling Date: 04/01/08 Cabel Tool Hollow Rod Direct Rotary Air Rotary Bucket Auger Reverse Rotary Flight Auger Jetted Dug Driven Other Mud Rotary
Use Domestic Public Supply Industrial Irrigation Municipal Commercial Test Well Heating or Cooling Monitoring Other
One well volume (V) = gallons
Initial Development Water Water Level (TIC) Well Depth Color Odor Clarity Developed By Date Well Development Date Description of Development Technique
Pump Date Installed Type Manufacturer Model No. H.P. Volts Capacity Depth of Pump Intake Setting No. of Stages Oil Water Lubrication Power Source Material of drop pipe Bowls Shafting Impellors Bowl Diameter Column Pipe Diameter Length Modification
Screened Well No.
A. Stick-up Length 2.0'
B. Key No. NA
C. Protective Casing Diameter NA Material NA Length NA Depth to Bottom NA
D. Surface Completion Diameter NA Depth NA Material NA
E. Well Casing Data Diameter 6" ID Material Steel Length 623' Weight Schedule 40 Depth to Bottom 621'
F. Grout Cement Date 04/02/08 Depth to Top 0' Depth to Bottom 623' Material Type V "LA" Cement Density 15.15 lb/gal Volume 23.14 bbls % Excess 10 Method of Installation Displacement Depth to Cement in Casing 490' Return Constant Yes No Volume of Grout Return 1 bbls
G. Borehole Diameter Drilling Dates 8.75" 03/31/08
H. Pack Type/SizeNA Date NA Depth to Top NA Depth to Bottom Material Method of Installation Gradation
I. Screen Date 04/15/08 Depth to Top 621 to 631' Depth to Bottom Manufacturer Material PVC Slot .01"
J. Bottom Cap Material PVC Length 1" Driller Tommy
Boring Depth 633'
Additional Information
******Mechanical Integrity Test******
Geophysical Logs Run Gamma, Resistivity, SP
Water Quality Sample taken? Yes No Where analyzed?
PSI Increments 5 Calibration Date of Gage PSI Full Scale Test Run By Stan Davis, Dan Tschopp Date Test Run 04/14/08 Time Beginning of Test 1200 Time End of Test 1300 Initial Pressure 35.0 PSIG Initial Fluid Level 4 inches Final Pressure 35.0 PSIG Final Fluid Level 4inches
Date well completed 04/15/08
GroundSurface
A
C
D
G
H
I
J
K
B
E
F
WELL DEVELOPMENT RECORD – PARAMETER MEASUREMENTS
Total Volume Withdrawal Well
No. Time
Gallons Borehole Volume
pH Conductivity (ms/cm)
Temp (°C)
Turbidity (NTU) Comments
Well developed: 04/15/08
Water cleared up within 5 minutes
Unload Pressure: 245psi
Steady Lift Pressure: 30psi
Output: Approximately <2 gpm
Screened Interval: Unkpapa SS formation
20 min recovery lift: 50 psi

POWERTECH WELL AND PUMP DATA
Location of Well Dewey, SD
Drilling Contractor Davis Drilling Driller
Tony Well Name DB08-11-19
County Fall River Type of Rig
Speed Star 1500 Drilling Fluid Mud Well Depth 335'
LAT 583453N LONG 4811673E Elevation 4029'
Screened Monitoring Well Completion Detail
Datum point from which all measurements are taken
Method of Drilling Date: 04/3/08 Cabel Tool Hollow Rod Direct Rotary Air Rotary Bucket Auger Reverse Rotary Flight Auger Jetted Dug Driven Other Mud Rotary
Use Domestic Public Supply Industrial Irrigation Municipal Commercial Test Well Heating or Cooling Monitoring Other
One well volume (V) = gallons
Initial Development Water Water Level (TIC) Well Depth Color Odor Clarity Developed By Date Well Development Date Description of Development Technique
Pump Date Installed Type Manufacturer Model No. H.P. Volts Capacity Depth of Pump Intake Setting No. of Stages Oil Water Lubrication Power Source Material of drop pipe Bowls Shafting Impellors Bowl Diameter Column Pipe Diameter Length Modification
Screened Well No.
A. Stick-up Length 2.0'
B. Key No. NA
C. Protective Casing Diameter NA Material NA Length NA Depth to Bottom NA
D. Surface Completion Diameter NA Depth NA Material NA
E. Well Casing Data Diameter 6" ID Material PVC Length 327' Weight SDR17 Depth to Bottom 325'
F. Grout Cement Date 04/4/08 Depth to Top 0' Depth to Bottom 327' Material Type V "LA" Cement Density 15.65 lb/gal Volume 12.77 bbls % Excess 10 Method of Installation Displacement Depth to Cement in Casing 223' Return Constant Yes No Volume of Grout Return 2 bbls
G. Borehole Diameter Drilling Dates 8.75" 04/3/08
H. Pack Type/SizeNA Date NA Depth to Top NA Depth to Bottom Material Method of Installation Gradation
I. Screen Date 04/16/08 Depth to Top 325 to335' Depth to Bottom Manufacturer Material PVC Slot .01"
J. Bottom Cap Material PVC Length 1" Driller Tommy
Boring Depth 337'
Additional Information
******Mechanical Integrity Test******
Geophysical Logs Run Gamma, Resistivity, SP
Water Quality Sample taken? Yes No Where analyzed?
PSI Increments 5 Calibration Date of Gage PSI Full Scale Test Run By Stan Davis, Dan Tschopp Date Test Run 04/15/08 Time Beginning of Test 0830 Time End of Test 0930 Initial Pressure 35.0 PSIG Initial Fluid Level 4 inches Final Pressure 35.0 PSIG Final Fluid Level 4inches
Date well completed 04/16/08
GroundSurface
A
C
D
G
H
I
J
K
B
E
F

WELL DEVELOPMENT RECORD – PARAMETER MEASUREMENTS
Total Volume Withdrawal Well
No. Time
Gallons Borehole Volume
pH Conductivity (ms/cm)
Temp (°C)
Turbidity (NTU) Comments
Well developed: 04/16/08
Water cleared up within 5 minutes
Unload Pressure: 150 psi
Steady Lift Pressure: 45 psi
Output: Approximately 30 gpm
Screened Interval: Lakota SS formation
Appendix C-2 Time and Water Level Data Values Used in Pumping Test
Analysis: Burdock Test, Drawdown Data
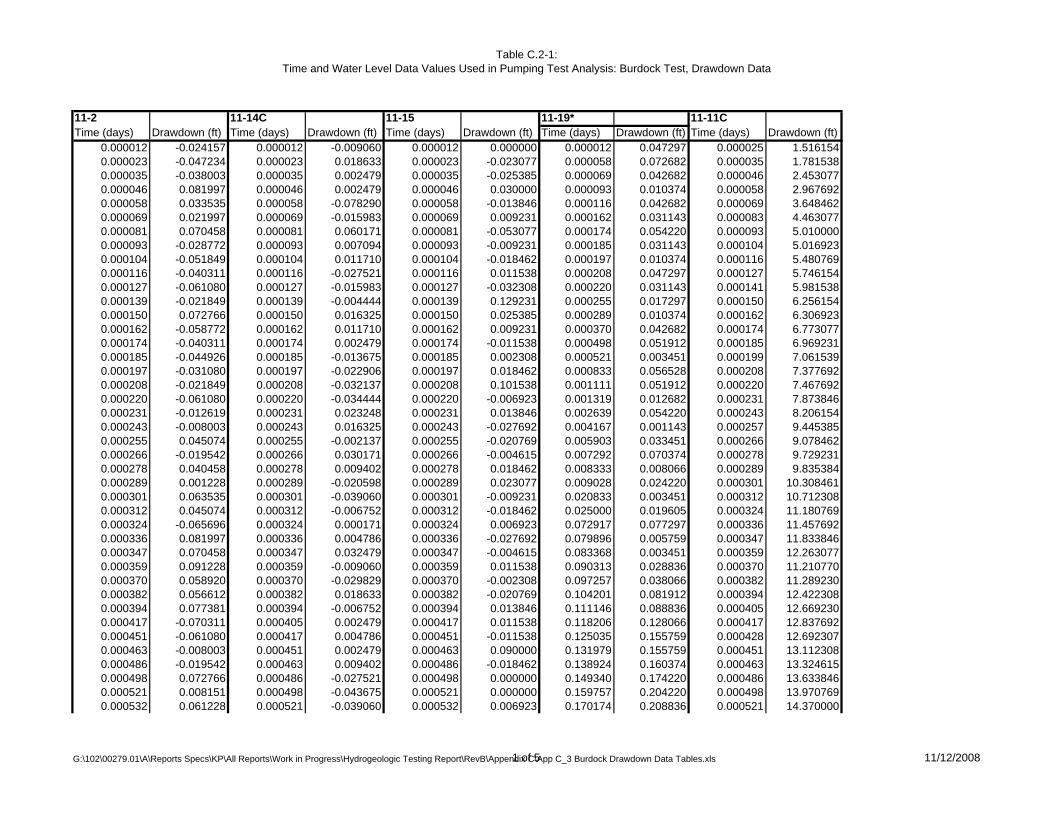
Table C.2-1:Time and Water Level Data Values Used in Pumping Test Analysis: Burdock Test, Drawdown Data
11-2 11-14C 11-15 11-19* 11-11CTime (days) Drawdown (ft) Time (days) Drawdown (ft) Time (days) Drawdown (ft) Time (days) Drawdown (ft) Time (days) Drawdown (ft)
0.000012 -0.024157 0.000012 -0.009060 0.000012 0.000000 0.000012 0.047297 0.000025 1.5161540.000023 -0.047234 0.000023 0.018633 0.000023 -0.023077 0.000058 0.072682 0.000035 1.7815380.000035 -0.038003 0.000035 0.002479 0.000035 -0.025385 0.000069 0.042682 0.000046 2.4530770.000046 0.081997 0.000046 0.002479 0.000046 0.030000 0.000093 0.010374 0.000058 2.9676920.000058 0.033535 0.000058 -0.078290 0.000058 -0.013846 0.000116 0.042682 0.000069 3.6484620.000069 0.021997 0.000069 -0.015983 0.000069 0.009231 0.000162 0.031143 0.000083 4.4630770.000081 0.070458 0.000081 0.060171 0.000081 -0.053077 0.000174 0.054220 0.000093 5.0100000.000093 -0.028772 0.000093 0.007094 0.000093 -0.009231 0.000185 0.031143 0.000104 5.0169230.000104 -0.051849 0.000104 0.011710 0.000104 -0.018462 0.000197 0.010374 0.000116 5.4807690.000116 -0.040311 0.000116 -0.027521 0.000116 0.011538 0.000208 0.047297 0.000127 5.7461540.000127 -0.061080 0.000127 -0.015983 0.000127 -0.032308 0.000220 0.031143 0.000141 5.9815380.000139 -0.021849 0.000139 -0.004444 0.000139 0.129231 0.000255 0.017297 0.000150 6.2561540.000150 0.072766 0.000150 0.016325 0.000150 0.025385 0.000289 0.010374 0.000162 6.3069230.000162 -0.058772 0.000162 0.011710 0.000162 0.009231 0.000370 0.042682 0.000174 6.7730770.000174 -0.040311 0.000174 0.002479 0.000174 -0.011538 0.000498 0.051912 0.000185 6.9692310.000185 -0.044926 0.000185 -0.013675 0.000185 0.002308 0.000521 0.003451 0.000199 7.0615390.000197 -0.031080 0.000197 -0.022906 0.000197 0.018462 0.000833 0.056528 0.000208 7.3776920.000208 -0.021849 0.000208 -0.032137 0.000208 0.101538 0.001111 0.051912 0.000220 7.4676920.000220 -0.061080 0.000220 -0.034444 0.000220 -0.006923 0.001319 0.012682 0.000231 7.8738460.000231 -0.012619 0.000231 0.023248 0.000231 0.013846 0.002639 0.054220 0.000243 8.2061540.000243 -0.008003 0.000243 0.016325 0.000243 -0.027692 0.004167 0.001143 0.000257 9.4453850.000255 0.045074 0.000255 -0.002137 0.000255 -0.020769 0.005903 0.033451 0.000266 9.0784620.000266 -0.019542 0.000266 0.030171 0.000266 -0.004615 0.007292 0.070374 0.000278 9.7292310.000278 0.040458 0.000278 0.009402 0.000278 0.018462 0.008333 0.008066 0.000289 9.8353840.000289 0.001228 0.000289 -0.020598 0.000289 0.023077 0.009028 0.024220 0.000301 10.3084610.000301 0.063535 0.000301 -0.039060 0.000301 -0.009231 0.020833 0.003451 0.000312 10.7123080.000312 0.045074 0.000312 -0.006752 0.000312 -0.018462 0.025000 0.019605 0.000324 11.1807690.000324 -0.065696 0.000324 0.000171 0.000324 0.006923 0.072917 0.077297 0.000336 11.4576920.000336 0.081997 0.000336 0.004786 0.000336 -0.027692 0.079896 0.005759 0.000347 11.8338460.000347 0.070458 0.000347 0.032479 0.000347 -0.004615 0.083368 0.003451 0.000359 12.2630770.000359 0.091228 0.000359 -0.009060 0.000359 0.011538 0.090313 0.028836 0.000370 11.2107700.000370 0.058920 0.000370 -0.029829 0.000370 -0.002308 0.097257 0.038066 0.000382 11.2892300.000382 0.056612 0.000382 0.018633 0.000382 -0.020769 0.104201 0.081912 0.000394 12.4223080.000394 0.077381 0.000394 -0.006752 0.000394 0.013846 0.111146 0.088836 0.000405 12.6692300.000417 -0.070311 0.000405 0.002479 0.000417 0.011538 0.118206 0.128066 0.000417 12.8376920.000451 -0.061080 0.000417 0.004786 0.000451 -0.011538 0.125035 0.155759 0.000428 12.6923070.000463 -0.008003 0.000451 0.002479 0.000463 0.090000 0.131979 0.155759 0.000451 13.1123080.000486 -0.019542 0.000463 0.009402 0.000486 -0.018462 0.138924 0.160374 0.000463 13.3246150.000498 0.072766 0.000486 -0.027521 0.000498 0.000000 0.149340 0.174220 0.000486 13.6338460.000521 0.008151 0.000498 -0.043675 0.000521 0.000000 0.159757 0.204220 0.000498 13.9707690.000532 0.061228 0.000521 -0.039060 0.000532 0.006923 0.170174 0.208836 0.000521 14.370000
G:\102\00279.01\A\Reports Specs\KP\All Reports\Work in Progress\Hydrogeologic Testing Report\RevB\Appendix C\App C_3 Burdock Drawdown Data Tables.xls1 of 5 11/12/2008

Table C.2-1:Time and Water Level Data Values Used in Pumping Test Analysis: Burdock Test, Drawdown Data
11-2 11-14C 11-15 11-19* 11-11CTime (days) Drawdown (ft) Time (days) Drawdown (ft) Time (days) Drawdown (ft) Time (days) Drawdown (ft) Time (days) Drawdown (ft)
0.000556 0.079689 0.000532 -0.006752 0.000556 0.009231 0.180590 0.238836 0.000532 15.9392310.000590 0.035843 0.000556 0.014017 0.000590 0.013846 0.194479 0.275759 0.000556 15.1500000.000625 -0.047234 0.000590 0.011710 0.000625 0.000000 0.208368 0.326528 0.000590 16.0776920.000660 0.045074 0.000625 0.050940 0.000660 -0.025385 0.222257 0.342682 0.000625 17.0238460.000694 -0.049542 0.000660 0.055556 0.000694 -0.009231 0.236146 0.368066 0.000660 17.8200000.000729 0.088920 0.000694 -0.009060 0.000729 0.016154 0.250035 0.398066 0.000694 18.6646160.000764 -0.040311 0.000729 -0.004444 0.000764 -0.027692 0.263924 0.478836 0.000729 19.4261530.000799 0.091228 0.000764 0.018633 0.000799 0.126923 0.277812 0.485759 0.000764 20.3192310.000833 -0.047234 0.000799 0.014017 0.000833 0.122308 0.295174 0.548066 0.000799 20.9723070.000903 0.049689 0.000833 0.041710 0.000903 0.018462 0.312535 0.548066 0.000833 21.8676930.000972 -0.012619 0.000903 -0.004444 0.000972 0.053077 0.329896 0.617297 0.000903 23.3215390.001042 -0.035696 0.000972 -0.015983 0.001042 0.002308 0.347257 0.642682 0.000972 24.6761530.001111 -0.038003 0.001042 -0.004444 0.001111 -0.020769 0.370405 0.753451 0.001042 25.9892310.001181 -0.044926 0.001111 0.004786 0.001181 0.000000 0.393553 0.801912 0.001111 27.4961550.001250 -0.038003 0.001181 0.011710 0.001250 0.032308 0.416701 0.799605 0.001181 28.6869240.001319 -0.077234 0.001250 0.023248 0.001319 -0.041538 0.439965 0.824989 0.001250 30.0369220.001389 -0.019542 0.001319 0.018633 0.001389 -0.032308 0.462998 0.912682 0.001319 31.3107700.001493 -0.058772 0.001389 0.034786 0.001493 0.002308 0.486146 0.947297 0.001389 32.5892300.001597 -0.021849 0.001493 -0.002137 0.001597 -0.046154 0.520868 1.004989 0.001493 34.3615380.001701 -0.061080 0.001597 0.027863 0.001701 0.023077 0.555590 1.060374 0.001597 36.0923080.001806 -0.012619 0.001701 0.050940 0.001806 0.013846 0.590312 1.099605 0.001701 37.6315380.001944 -0.044926 0.001806 0.037094 0.001944 0.006923 0.625035 1.233451 0.001806 39.0830760.002083 -0.019542 0.001944 0.018633 0.002083 -0.020769 0.659757 1.270374 0.001944 41.0261540.002222 -0.077234 0.002083 0.044017 0.002222 0.018462 0.694479 1.332682 0.002083 42.4892310.002361 -0.001080 0.002222 0.037094 0.002361 -0.002308 0.729549 1.408836 0.002222 44.2592320.002500 -0.044926 0.002361 0.023248 0.002500 0.006923 0.763924 1.466528 0.002361 45.6623080.002639 -0.056465 0.002500 0.101710 0.002639 -0.046154 0.798646 1.535759 0.002500 47.1669240.002778 -0.038003 0.002639 0.108633 0.002778 -0.006923 0.833368 1.604989 0.002639 48.6069220.002951 -0.038003 0.002778 0.057863 0.002951 -0.016154 0.902928 1.736528 0.002778 49.8600010.003125 -0.019542 0.002951 0.129402 0.003125 -0.023077 0.972951 1.794220 0.002951 51.3876920.003299 -0.068003 0.003125 0.090171 0.003299 -0.011538 1.041701 1.907297 0.003125 52.7999990.003472 -0.084157 0.003299 0.092479 0.003472 0.041538 1.111146 1.960374 0.003299 54.0807690.003704 -0.040311 0.003472 0.108633 0.003704 0.027692 1.180590 2.094220 0.003472 55.3107680.003935 -0.051849 0.003704 0.129402 0.003935 -0.011538 1.250035 2.101143 0.003704 56.6838460.004167 -0.038003 0.003935 0.150171 0.004167 0.016154 1.319479 2.193451 0.003935 57.8953860.004398 -0.063388 0.004167 0.164017 0.004398 0.013846 1.388924 2.311143 0.004167 59.1807710.004630 -0.058772 0.004398 0.196325 0.004630 0.006923 1.493090 2.396528 0.004398 60.2446140.004861 -0.021849 0.004630 0.228633 0.004861 -0.053077 1.597257 2.504989 0.004630 61.1676940.005208 -0.035696 0.004861 0.247094 0.005208 -0.023077 1.701424 2.620374 0.004861 61.9753840.005556 -0.086465 0.005208 0.295556 0.005556 -0.036923 1.805590 2.756528 0.005208 63.3253860.005903 -0.026465 0.005556 0.330171 0.005903 -0.011538 1.944479 2.848835 0.005556 64.400772
G:\102\00279.01\A\Reports Specs\KP\All Reports\Work in Progress\Hydrogeologic Testing Report\RevB\Appendix C\App C_3 Burdock Drawdown Data Tables.xls2 of 5 11/12/2008

Table C.2-1:Time and Water Level Data Values Used in Pumping Test Analysis: Burdock Test, Drawdown Data
11-2 11-14C 11-15 11-19* 11-11CTime (days) Drawdown (ft) Time (days) Drawdown (ft) Time (days) Drawdown (ft) Time (days) Drawdown (ft) Time (days) Drawdown (ft)
0.006250 -0.028772 0.005903 0.374017 0.006250 0.025385 2.083368 2.890374 0.005903 65.4184650.006597 -0.058772 0.006250 0.429402 0.006597 0.041538 2.222257 2.915759 0.006250 66.3115390.006944 -0.063388 0.006597 0.498633 0.006944 -0.016154 2.361146 2.984989 0.006597 67.1007690.007292 -0.051849 0.006944 0.560940 0.007292 0.011538 2.500035 3.086528 0.006944 67.7284620.007639 -0.070311 0.007292 0.620940 0.007639 -0.023077 2.638924 3.148836 0.007292 68.5523070.007986 -0.086465 0.007639 0.653248 0.007986 0.000000 2.777813 3.222682 0.007639 69.1246190.008333 -0.088772 0.007986 0.678633 0.008333 0.009231 2.951423 3.358835 0.007986 69.7084580.009028 -0.024157 0.008333 0.745556 0.009028 -0.002308 2.999988 3.358835 0.008333 70.4169240.009722 -0.021849 0.009028 0.881710 0.009722 -0.009231 0.009028 71.6423110.010417 -0.033388 0.009722 0.950940 0.010417 0.002308 0.009722 72.4407730.011111 0.075074 0.010417 1.103248 0.011111 -0.016154 0.010417 73.1676940.011806 -0.065696 0.011111 1.193248 0.011806 -0.004615 0.011111 73.6361540.012500 -0.044926 0.011806 1.287863 0.012500 0.025385 0.011806 74.1507720.013194 -0.056465 0.012500 1.424017 0.013194 0.011538 0.012500 74.5453870.013889 -0.031080 0.013194 1.504786 0.013889 -0.046154 0.013194 74.8153840.014931 0.065843 0.013889 1.703248 0.014931 -0.002308 0.013889 74.9953840.015972 -0.047234 0.014931 1.770171 0.015972 -0.023077 0.014931 75.2515410.017014 -0.084157 0.015972 1.934017 0.017014 -0.011538 0.015972 75.5653840.018056 -0.061080 0.017014 2.047094 0.018056 0.000000 0.017014 75.9046170.019444 0.008151 0.018056 2.213248 0.019444 0.011538 0.018056 76.1053850.020833 -0.061080 0.019444 2.377094 0.020833 0.057692 0.019444 76.2992320.022222 -0.049542 0.020833 2.550171 0.022222 -0.018462 0.020833 76.6315380.023611 -0.093388 0.022222 2.727863 0.023611 0.004615 0.022222 76.7469250.025000 -0.042619 0.023611 2.861710 0.025000 0.025385 0.023611 76.9984590.026389 -0.077234 0.025000 3.018633 0.026389 0.020769 0.024990 77.1761550.027778 -0.065696 0.026389 3.168633 0.027778 0.000000 0.026389 77.4115370.029514 -0.068003 0.027778 3.297863 0.029514 -0.034615 0.027778 77.4646150.031250 -0.051849 0.029514 3.415556 0.031250 -0.009231 0.029514 77.7230760.032986 -0.040311 0.031250 3.563248 0.032986 0.000000 0.031250 77.7553860.034722 -0.079542 0.032986 3.766325 0.034722 -0.004615 0.032986 78.0253830.037037 -0.074926 0.034722 3.872479 0.037037 -0.025385 0.034722 78.3023070.039352 -0.077234 0.037037 4.091710 0.039352 0.030000 0.037037 78.2607730.041667 -0.079542 0.039352 4.195556 0.041667 0.090000 0.039352 78.5676960.043981 0.049689 0.041667 4.417094 0.043981 -0.027692 0.041667 78.6784590.046296 0.049689 0.043981 4.640940 0.046296 0.057692 0.043981 78.9599990.048611 -0.047234 0.046296 4.664017 0.048611 0.009231 0.046296 79.0084610.052083 0.084304 0.048611 4.827863 0.052083 0.011538 0.048611 79.1515350.055556 0.051997 0.052083 5.035556 0.055556 -0.009231 0.052083 79.2900010.059028 0.049689 0.055556 5.222479 0.059028 0.000000 0.055556 79.4376910.062500 -0.008003 0.059028 5.358633 0.062500 0.018462 0.059028 79.6661530.065972 0.028920 0.062500 5.568633 0.065972 0.034615 0.062500 79.823074
G:\102\00279.01\A\Reports Specs\KP\All Reports\Work in Progress\Hydrogeologic Testing Report\RevB\Appendix C\App C_3 Burdock Drawdown Data Tables.xls3 of 5 11/12/2008

Table C.2-1:Time and Water Level Data Values Used in Pumping Test Analysis: Burdock Test, Drawdown Data
11-2 11-14C 11-15 11-19* 11-11CTime (days) Drawdown (ft) Time (days) Drawdown (ft) Time (days) Drawdown (ft) Time (days) Drawdown (ft) Time (days) Drawdown (ft)
0.069444 -0.012619 0.065972 5.750940 0.069444 0.036923 0.065972 80.0053860.072917 0.061228 0.069444 5.854786 0.072917 0.027692 0.069444 80.1738430.076470 -0.054157 0.072917 6.044017 0.076389 0.106154 0.072917 80.2661510.079942 -0.003388 0.076389 6.161710 0.079861 0.060000 0.076389 80.4207690.083414 -0.047234 0.079942 6.325556 0.083449 0.057692 0.079861 80.5338440.090359 -0.038003 0.083414 6.470940 0.090394 0.101538 0.083368 80.7023090.097303 -0.005696 0.090359 6.738633 0.097338 0.152308 0.090313 80.9238430.104248 0.035843 0.097303 6.953248 0.104282 0.170769 0.097257 81.2238460.111192 0.003535 0.104248 7.172479 0.111227 0.163846 0.104201 81.3738480.118137 0.021997 0.111192 7.414786 0.118171 0.233077 0.111146 83.3630750.125081 -0.001080 0.118137 7.659402 0.125116 0.267692 0.118206 83.8015370.132025 0.026612 0.125081 7.855556 0.132060 0.306923 0.125035 84.0230790.138970 0.045074 0.132025 8.058633 0.139005 0.346154 0.131979 84.2953870.149387 0.047381 0.138970 8.254786 0.149421 0.433846 0.138924 84.4084630.159803 0.021997 0.149387 8.520171 0.159838 0.450000 0.149340 84.7015380.170220 0.045074 0.159803 8.787864 0.170255 0.567692 0.159757 84.8861540.180637 0.072766 0.170220 9.032478 0.180671 0.634615 0.170174 85.0361560.194525 0.102766 0.180637 9.251710 0.194560 0.745385 0.180590 85.0938490.208414 0.125843 0.194525 9.535556 0.208449 0.860769 0.194481 85.4076920.222303 0.169689 0.208414 9.777864 0.222338 0.960000 0.208368 85.6684650.236192 0.167381 0.222303 10.004017 0.236227 1.112308 0.222257 85.6984630.250081 0.190458 0.236192 10.220941 0.250116 1.174615 0.236146 85.9246140.263970 0.271228 0.250081 10.463248 0.264005 1.359231 0.250035 86.1761550.277859 0.268920 0.263970 10.629402 0.277894 1.467692 0.263924 86.3815380.295220 0.301228 0.277859 10.839402 0.295255 1.615385 0.277812 86.4761510.312581 0.342766 0.295220 11.037864 0.312616 1.804615 0.295174 86.5684590.329942 0.368151 0.312581 11.213248 0.329977 1.929231 0.312535 86.6838460.347303 0.411997 0.329942 11.411710 0.347338 2.118462 0.329896 86.8015370.370451 0.499689 0.347303 11.594017 0.370486 2.303077 0.347257 87.1476900.393600 0.548151 0.370451 11.884787 0.393634 2.524615 0.370405 87.2238460.416748 0.561997 0.393600 12.039402 0.416782 2.764615 0.393553 87.3530730.440012 0.619689 0.416748 12.240171 0.440046 2.933077 0.416701 87.6138460.463044 0.688920 0.440012 12.397094 0.463079 3.168462 0.439965 87.5607680.486192 0.762766 0.463044 12.602479 0.486227 3.297692 0.462998 87.6253810.520914 0.806612 0.486192 12.685555 0.520949 3.620769 0.486146 87.9853820.555637 0.820458 0.520914 12.969402 0.555671 3.913846 0.520868 88.0338440.590359 0.894304 0.555637 13.144787 0.590394 4.144615 0.555590 88.0107730.625081 0.995843 0.590359 13.317863 0.625116 4.352308 0.590312 88.4561540.659803 1.044304 0.625081 13.433248 0.659838 4.668461 0.625035 88.3961560.694525 1.097381 0.659803 13.574018 0.694560 4.846154 0.659757 88.7376940.729595 1.136612 0.694525 13.707864 0.729630 5.088461 0.694479 88.555382
G:\102\00279.01\A\Reports Specs\KP\All Reports\Work in Progress\Hydrogeologic Testing Report\RevB\Appendix C\App C_3 Burdock Drawdown Data Tables.xls4 of 5 11/12/2008
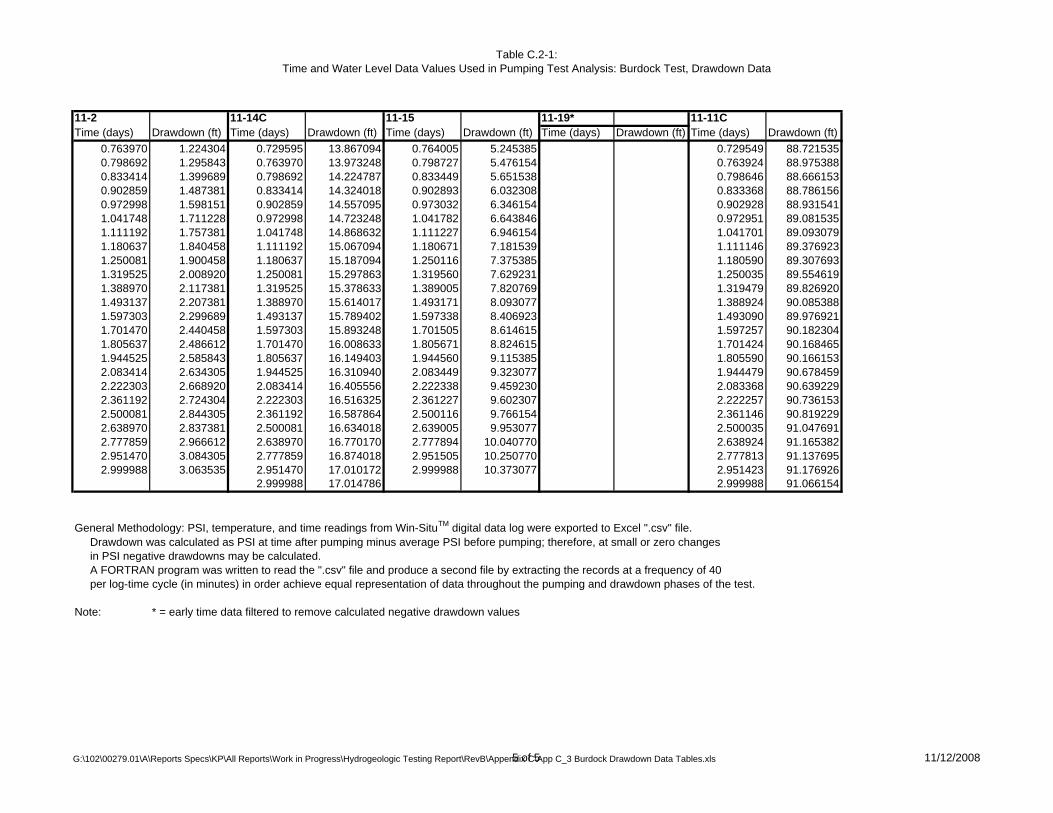
Table C.2-1:Time and Water Level Data Values Used in Pumping Test Analysis: Burdock Test, Drawdown Data
11-2 11-14C 11-15 11-19* 11-11CTime (days) Drawdown (ft) Time (days) Drawdown (ft) Time (days) Drawdown (ft) Time (days) Drawdown (ft) Time (days) Drawdown (ft)
0.763970 1.224304 0.729595 13.867094 0.764005 5.245385 0.729549 88.7215350.798692 1.295843 0.763970 13.973248 0.798727 5.476154 0.763924 88.9753880.833414 1.399689 0.798692 14.224787 0.833449 5.651538 0.798646 88.6661530.902859 1.487381 0.833414 14.324018 0.902893 6.032308 0.833368 88.7861560.972998 1.598151 0.902859 14.557095 0.973032 6.346154 0.902928 88.9315411.041748 1.711228 0.972998 14.723248 1.041782 6.643846 0.972951 89.0815351.111192 1.757381 1.041748 14.868632 1.111227 6.946154 1.041701 89.0930791.180637 1.840458 1.111192 15.067094 1.180671 7.181539 1.111146 89.3769231.250081 1.900458 1.180637 15.187094 1.250116 7.375385 1.180590 89.3076931.319525 2.008920 1.250081 15.297863 1.319560 7.629231 1.250035 89.5546191.388970 2.117381 1.319525 15.378633 1.389005 7.820769 1.319479 89.8269201.493137 2.207381 1.388970 15.614017 1.493171 8.093077 1.388924 90.0853881.597303 2.299689 1.493137 15.789402 1.597338 8.406923 1.493090 89.9769211.701470 2.440458 1.597303 15.893248 1.701505 8.614615 1.597257 90.1823041.805637 2.486612 1.701470 16.008633 1.805671 8.824615 1.701424 90.1684651.944525 2.585843 1.805637 16.149403 1.944560 9.115385 1.805590 90.1661532.083414 2.634305 1.944525 16.310940 2.083449 9.323077 1.944479 90.6784592.222303 2.668920 2.083414 16.405556 2.222338 9.459230 2.083368 90.6392292.361192 2.724304 2.222303 16.516325 2.361227 9.602307 2.222257 90.7361532.500081 2.844305 2.361192 16.587864 2.500116 9.766154 2.361146 90.8192292.638970 2.837381 2.500081 16.634018 2.639005 9.953077 2.500035 91.0476912.777859 2.966612 2.638970 16.770170 2.777894 10.040770 2.638924 91.1653822.951470 3.084305 2.777859 16.874018 2.951505 10.250770 2.777813 91.1376952.999988 3.063535 2.951470 17.010172 2.999988 10.373077 2.951423 91.176926
2.999988 17.014786 2.999988 91.066154
General Methodology: PSI, temperature, and time readings from Win-SituTM digital data log were exported to Excel ".csv" file. Drawdown was calculated as PSI at time after pumping minus average PSI before pumping; therefore, at small or zero changes in PSI negative drawdowns may be calculated. A FORTRAN program was written to read the ".csv" file and produce a second file by extracting the records at a frequency of 40 per log-time cycle (in minutes) in order achieve equal representation of data throughout the pumping and drawdown phases of the test.
Note: * = early time data filtered to remove calculated negative drawdown values
G:\102\00279.01\A\Reports Specs\KP\All Reports\Work in Progress\Hydrogeologic Testing Report\RevB\Appendix C\App C_3 Burdock Drawdown Data Tables.xls5 of 5 11/12/2008

Appendix C-3 Time and Water Level Data Values Used in Pumping Test
Analysis: Burdock Test, Recovery Data
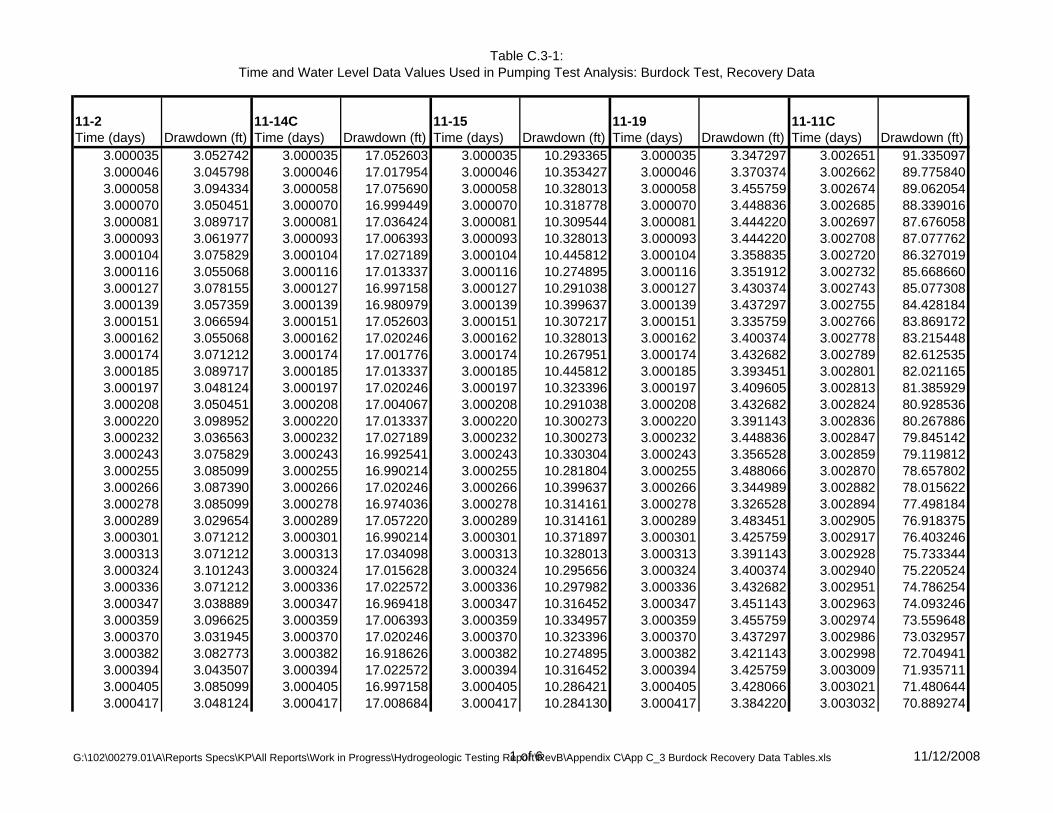
Table C.3-1:Time and Water Level Data Values Used in Pumping Test Analysis: Burdock Test, Recovery Data
11-2 11-14C 11-15 11-19 11-11CTime (days) Drawdown (ft) Time (days) Drawdown (ft) Time (days) Drawdown (ft) Time (days) Drawdown (ft) Time (days) Drawdown (ft)
3.000035 3.052742 3.000035 17.052603 3.000035 10.293365 3.000035 3.347297 3.002651 91.3350973.000046 3.045798 3.000046 17.017954 3.000046 10.353427 3.000046 3.370374 3.002662 89.7758403.000058 3.094334 3.000058 17.075690 3.000058 10.328013 3.000058 3.455759 3.002674 89.0620543.000070 3.050451 3.000070 16.999449 3.000070 10.318778 3.000070 3.448836 3.002685 88.3390163.000081 3.089717 3.000081 17.036424 3.000081 10.309544 3.000081 3.444220 3.002697 87.6760583.000093 3.061977 3.000093 17.006393 3.000093 10.328013 3.000093 3.444220 3.002708 87.0777623.000104 3.075829 3.000104 17.027189 3.000104 10.445812 3.000104 3.358835 3.002720 86.3270193.000116 3.055068 3.000116 17.013337 3.000116 10.274895 3.000116 3.351912 3.002732 85.6686603.000127 3.078155 3.000127 16.997158 3.000127 10.291038 3.000127 3.430374 3.002743 85.0773083.000139 3.057359 3.000139 16.980979 3.000139 10.399637 3.000139 3.437297 3.002755 84.4281843.000151 3.066594 3.000151 17.052603 3.000151 10.307217 3.000151 3.335759 3.002766 83.8691723.000162 3.055068 3.000162 17.020246 3.000162 10.328013 3.000162 3.400374 3.002778 83.2154483.000174 3.071212 3.000174 17.001776 3.000174 10.267951 3.000174 3.432682 3.002789 82.6125353.000185 3.089717 3.000185 17.013337 3.000185 10.445812 3.000185 3.393451 3.002801 82.0211653.000197 3.048124 3.000197 17.020246 3.000197 10.323396 3.000197 3.409605 3.002813 81.3859293.000208 3.050451 3.000208 17.004067 3.000208 10.291038 3.000208 3.432682 3.002824 80.9285363.000220 3.098952 3.000220 17.013337 3.000220 10.300273 3.000220 3.391143 3.002836 80.2678863.000232 3.036563 3.000232 17.027189 3.000232 10.300273 3.000232 3.448836 3.002847 79.8451423.000243 3.075829 3.000243 16.992541 3.000243 10.330304 3.000243 3.356528 3.002859 79.1198123.000255 3.085099 3.000255 16.990214 3.000255 10.281804 3.000255 3.488066 3.002870 78.6578023.000266 3.087390 3.000266 17.020246 3.000266 10.399637 3.000266 3.344989 3.002882 78.0156223.000278 3.085099 3.000278 16.974036 3.000278 10.314161 3.000278 3.326528 3.002894 77.4981843.000289 3.029654 3.000289 17.057220 3.000289 10.314161 3.000289 3.483451 3.002905 76.9183753.000301 3.071212 3.000301 16.990214 3.000301 10.371897 3.000301 3.425759 3.002917 76.4032463.000313 3.071212 3.000313 17.034098 3.000313 10.328013 3.000313 3.391143 3.002928 75.7333443.000324 3.101243 3.000324 17.015628 3.000324 10.295656 3.000324 3.400374 3.002940 75.2205243.000336 3.071212 3.000336 17.022572 3.000336 10.297982 3.000336 3.432682 3.002951 74.7862543.000347 3.038889 3.000347 16.969418 3.000347 10.316452 3.000347 3.451143 3.002963 74.0932463.000359 3.096625 3.000359 17.006393 3.000359 10.334957 3.000359 3.455759 3.002974 73.5596483.000370 3.031945 3.000370 17.020246 3.000370 10.323396 3.000370 3.437297 3.002986 73.0329573.000382 3.082773 3.000382 16.918626 3.000382 10.274895 3.000382 3.421143 3.002998 72.7049413.000394 3.043507 3.000394 17.022572 3.000394 10.316452 3.000394 3.425759 3.003009 71.9357113.000405 3.085099 3.000405 16.997158 3.000405 10.286421 3.000405 3.428066 3.003021 71.4806443.000417 3.048124 3.000417 17.008684 3.000417 10.284130 3.000417 3.384220 3.003032 70.889274
G:\102\00279.01\A\Reports Specs\KP\All Reports\Work in Progress\Hydrogeologic Testing Report\RevB\Appendix C\App C_3 Burdock Recovery Data Tables.xls1 of 6 11/12/2008
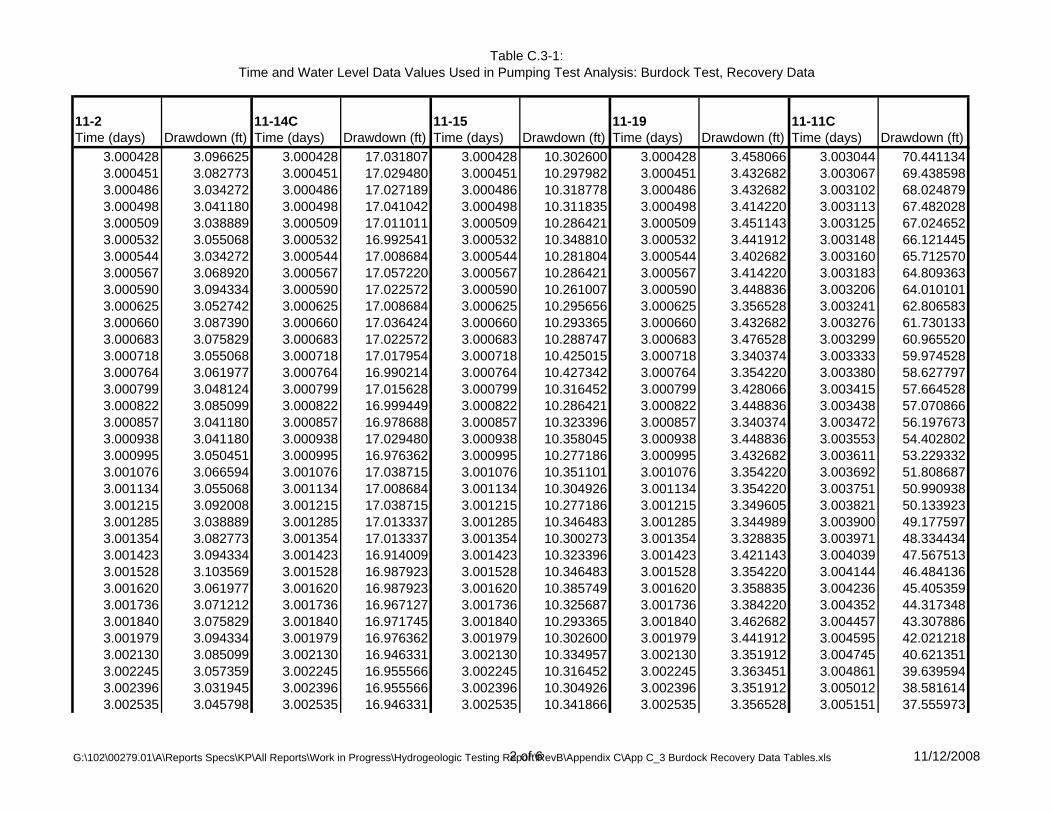
Table C.3-1:Time and Water Level Data Values Used in Pumping Test Analysis: Burdock Test, Recovery Data
11-2 11-14C 11-15 11-19 11-11CTime (days) Drawdown (ft) Time (days) Drawdown (ft) Time (days) Drawdown (ft) Time (days) Drawdown (ft) Time (days) Drawdown (ft)
3.000428 3.096625 3.000428 17.031807 3.000428 10.302600 3.000428 3.458066 3.003044 70.4411343.000451 3.082773 3.000451 17.029480 3.000451 10.297982 3.000451 3.432682 3.003067 69.4385983.000486 3.034272 3.000486 17.027189 3.000486 10.318778 3.000486 3.432682 3.003102 68.0248793.000498 3.041180 3.000498 17.041042 3.000498 10.311835 3.000498 3.414220 3.003113 67.4820283.000509 3.038889 3.000509 17.011011 3.000509 10.286421 3.000509 3.451143 3.003125 67.0246523.000532 3.055068 3.000532 16.992541 3.000532 10.348810 3.000532 3.441912 3.003148 66.1214453.000544 3.034272 3.000544 17.008684 3.000544 10.281804 3.000544 3.402682 3.003160 65.7125703.000567 3.068920 3.000567 17.057220 3.000567 10.286421 3.000567 3.414220 3.003183 64.8093633.000590 3.094334 3.000590 17.022572 3.000590 10.261007 3.000590 3.448836 3.003206 64.0101013.000625 3.052742 3.000625 17.008684 3.000625 10.295656 3.000625 3.356528 3.003241 62.8065833.000660 3.087390 3.000660 17.036424 3.000660 10.293365 3.000660 3.432682 3.003276 61.7301333.000683 3.075829 3.000683 17.022572 3.000683 10.288747 3.000683 3.476528 3.003299 60.9655203.000718 3.055068 3.000718 17.017954 3.000718 10.425015 3.000718 3.340374 3.003333 59.9745283.000764 3.061977 3.000764 16.990214 3.000764 10.427342 3.000764 3.354220 3.003380 58.6277973.000799 3.048124 3.000799 17.015628 3.000799 10.316452 3.000799 3.428066 3.003415 57.6645283.000822 3.085099 3.000822 16.999449 3.000822 10.286421 3.000822 3.448836 3.003438 57.0708663.000857 3.041180 3.000857 16.978688 3.000857 10.323396 3.000857 3.340374 3.003472 56.1976733.000938 3.041180 3.000938 17.029480 3.000938 10.358045 3.000938 3.448836 3.003553 54.4028023.000995 3.050451 3.000995 16.976362 3.000995 10.277186 3.000995 3.432682 3.003611 53.2293323.001076 3.066594 3.001076 17.038715 3.001076 10.351101 3.001076 3.354220 3.003692 51.8086873.001134 3.055068 3.001134 17.008684 3.001134 10.304926 3.001134 3.354220 3.003751 50.9909383.001215 3.092008 3.001215 17.038715 3.001215 10.277186 3.001215 3.349605 3.003821 50.1339233.001285 3.038889 3.001285 17.013337 3.001285 10.346483 3.001285 3.344989 3.003900 49.1775973.001354 3.082773 3.001354 17.013337 3.001354 10.300273 3.001354 3.328835 3.003971 48.3344343.001423 3.094334 3.001423 16.914009 3.001423 10.323396 3.001423 3.421143 3.004039 47.5675133.001528 3.103569 3.001528 16.987923 3.001528 10.346483 3.001528 3.354220 3.004144 46.4841363.001620 3.061977 3.001620 16.987923 3.001620 10.385749 3.001620 3.358835 3.004236 45.4053593.001736 3.071212 3.001736 16.967127 3.001736 10.325687 3.001736 3.384220 3.004352 44.3173483.001840 3.075829 3.001840 16.971745 3.001840 10.293365 3.001840 3.462682 3.004457 43.3078863.001979 3.094334 3.001979 16.976362 3.001979 10.302600 3.001979 3.441912 3.004595 42.0212183.002130 3.085099 3.002130 16.946331 3.002130 10.334957 3.002130 3.351912 3.004745 40.6213513.002245 3.057359 3.002245 16.955566 3.002245 10.316452 3.002245 3.363451 3.004861 39.6395943.002396 3.031945 3.002396 16.955566 3.002396 10.304926 3.002396 3.351912 3.005012 38.5816143.002535 3.045798 3.002535 16.946331 3.002535 10.341866 3.002535 3.356528 3.005151 37.555973
G:\102\00279.01\A\Reports Specs\KP\All Reports\Work in Progress\Hydrogeologic Testing Report\RevB\Appendix C\App C_3 Burdock Recovery Data Tables.xls2 of 6 11/12/2008
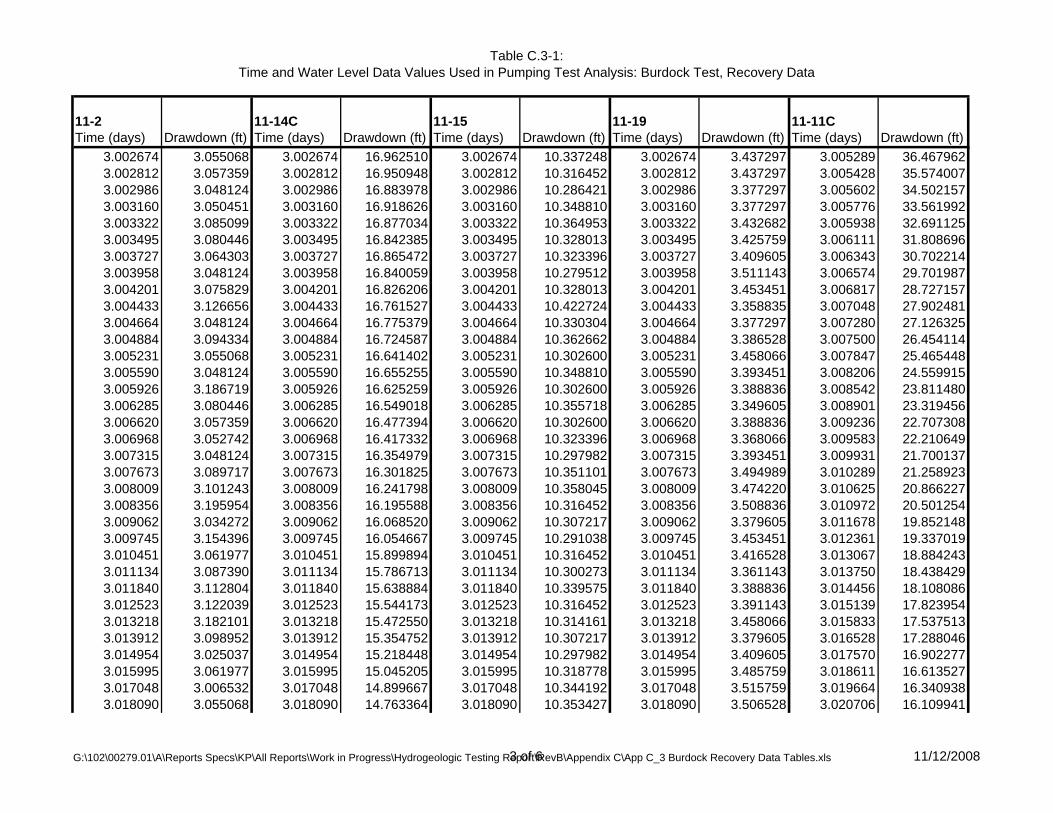
Table C.3-1:Time and Water Level Data Values Used in Pumping Test Analysis: Burdock Test, Recovery Data
11-2 11-14C 11-15 11-19 11-11CTime (days) Drawdown (ft) Time (days) Drawdown (ft) Time (days) Drawdown (ft) Time (days) Drawdown (ft) Time (days) Drawdown (ft)
3.002674 3.055068 3.002674 16.962510 3.002674 10.337248 3.002674 3.437297 3.005289 36.4679623.002812 3.057359 3.002812 16.950948 3.002812 10.316452 3.002812 3.437297 3.005428 35.5740073.002986 3.048124 3.002986 16.883978 3.002986 10.286421 3.002986 3.377297 3.005602 34.5021573.003160 3.050451 3.003160 16.918626 3.003160 10.348810 3.003160 3.377297 3.005776 33.5619923.003322 3.085099 3.003322 16.877034 3.003322 10.364953 3.003322 3.432682 3.005938 32.6911253.003495 3.080446 3.003495 16.842385 3.003495 10.328013 3.003495 3.425759 3.006111 31.8086963.003727 3.064303 3.003727 16.865472 3.003727 10.323396 3.003727 3.409605 3.006343 30.7022143.003958 3.048124 3.003958 16.840059 3.003958 10.279512 3.003958 3.511143 3.006574 29.7019873.004201 3.075829 3.004201 16.826206 3.004201 10.328013 3.004201 3.453451 3.006817 28.7271573.004433 3.126656 3.004433 16.761527 3.004433 10.422724 3.004433 3.358835 3.007048 27.9024813.004664 3.048124 3.004664 16.775379 3.004664 10.330304 3.004664 3.377297 3.007280 27.1263253.004884 3.094334 3.004884 16.724587 3.004884 10.362662 3.004884 3.386528 3.007500 26.4541143.005231 3.055068 3.005231 16.641402 3.005231 10.302600 3.005231 3.458066 3.007847 25.4654483.005590 3.048124 3.005590 16.655255 3.005590 10.348810 3.005590 3.393451 3.008206 24.5599153.005926 3.186719 3.005926 16.625259 3.005926 10.302600 3.005926 3.388836 3.008542 23.8114803.006285 3.080446 3.006285 16.549018 3.006285 10.355718 3.006285 3.349605 3.008901 23.3194563.006620 3.057359 3.006620 16.477394 3.006620 10.302600 3.006620 3.388836 3.009236 22.7073083.006968 3.052742 3.006968 16.417332 3.006968 10.323396 3.006968 3.368066 3.009583 22.2106493.007315 3.048124 3.007315 16.354979 3.007315 10.297982 3.007315 3.393451 3.009931 21.7001373.007673 3.089717 3.007673 16.301825 3.007673 10.351101 3.007673 3.494989 3.010289 21.2589233.008009 3.101243 3.008009 16.241798 3.008009 10.358045 3.008009 3.474220 3.010625 20.8662273.008356 3.195954 3.008356 16.195588 3.008356 10.316452 3.008356 3.508836 3.010972 20.5012543.009062 3.034272 3.009062 16.068520 3.009062 10.307217 3.009062 3.379605 3.011678 19.8521483.009745 3.154396 3.009745 16.054667 3.009745 10.291038 3.009745 3.453451 3.012361 19.3370193.010451 3.061977 3.010451 15.899894 3.010451 10.316452 3.010451 3.416528 3.013067 18.8842433.011134 3.087390 3.011134 15.786713 3.011134 10.300273 3.011134 3.361143 3.013750 18.4384293.011840 3.112804 3.011840 15.638884 3.011840 10.339575 3.011840 3.388836 3.014456 18.1080863.012523 3.122039 3.012523 15.544173 3.012523 10.316452 3.012523 3.391143 3.015139 17.8239543.013218 3.182101 3.013218 15.472550 3.013218 10.314161 3.013218 3.458066 3.015833 17.5375133.013912 3.098952 3.013912 15.354752 3.013912 10.307217 3.013912 3.379605 3.016528 17.2880463.014954 3.025037 3.014954 15.218448 3.014954 10.297982 3.014954 3.409605 3.017570 16.9022773.015995 3.061977 3.015995 15.045205 3.015995 10.318778 3.015995 3.485759 3.018611 16.6135273.017048 3.006532 3.017048 14.899667 3.017048 10.344192 3.017048 3.515759 3.019664 16.3409383.018090 3.055068 3.018090 14.763364 3.018090 10.353427 3.018090 3.506528 3.020706 16.109941
G:\102\00279.01\A\Reports Specs\KP\All Reports\Work in Progress\Hydrogeologic Testing Report\RevB\Appendix C\App C_3 Burdock Recovery Data Tables.xls3 of 6 11/12/2008
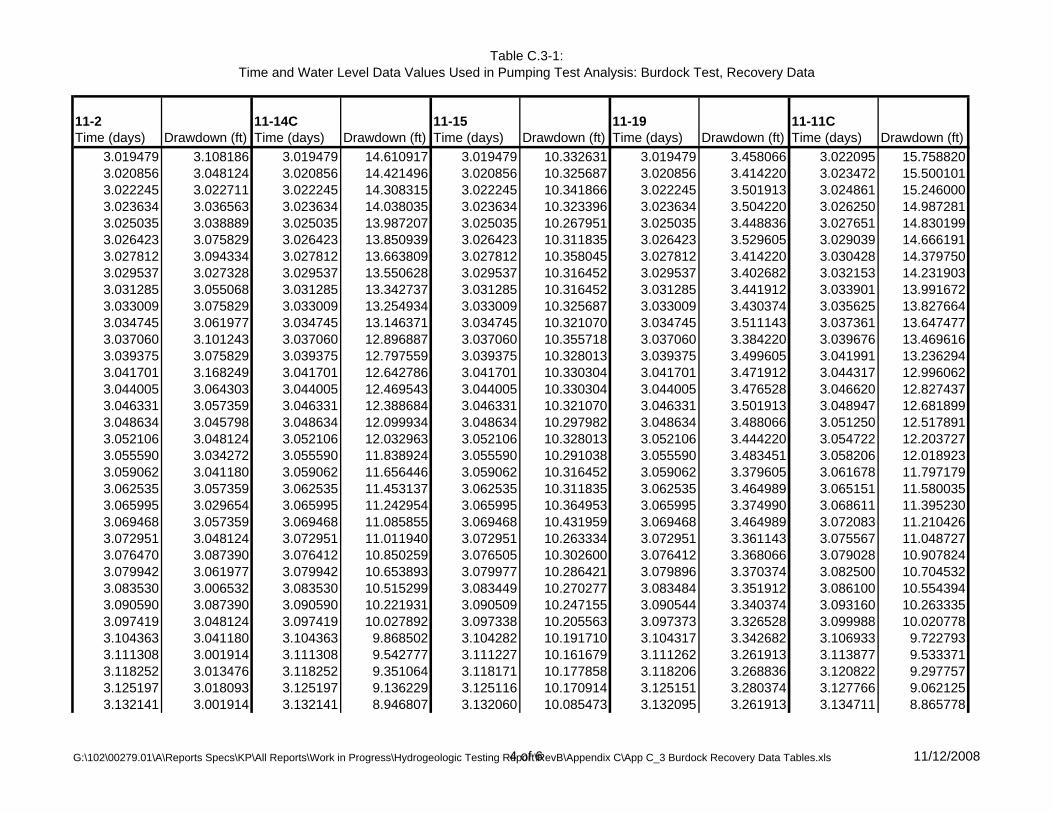
Table C.3-1:Time and Water Level Data Values Used in Pumping Test Analysis: Burdock Test, Recovery Data
11-2 11-14C 11-15 11-19 11-11CTime (days) Drawdown (ft) Time (days) Drawdown (ft) Time (days) Drawdown (ft) Time (days) Drawdown (ft) Time (days) Drawdown (ft)
3.019479 3.108186 3.019479 14.610917 3.019479 10.332631 3.019479 3.458066 3.022095 15.7588203.020856 3.048124 3.020856 14.421496 3.020856 10.325687 3.020856 3.414220 3.023472 15.5001013.022245 3.022711 3.022245 14.308315 3.022245 10.341866 3.022245 3.501913 3.024861 15.2460003.023634 3.036563 3.023634 14.038035 3.023634 10.323396 3.023634 3.504220 3.026250 14.9872813.025035 3.038889 3.025035 13.987207 3.025035 10.267951 3.025035 3.448836 3.027651 14.8301993.026423 3.075829 3.026423 13.850939 3.026423 10.311835 3.026423 3.529605 3.029039 14.6661913.027812 3.094334 3.027812 13.663809 3.027812 10.358045 3.027812 3.414220 3.030428 14.3797503.029537 3.027328 3.029537 13.550628 3.029537 10.316452 3.029537 3.402682 3.032153 14.2319033.031285 3.055068 3.031285 13.342737 3.031285 10.316452 3.031285 3.441912 3.033901 13.9916723.033009 3.075829 3.033009 13.254934 3.033009 10.325687 3.033009 3.430374 3.035625 13.8276643.034745 3.061977 3.034745 13.146371 3.034745 10.321070 3.034745 3.511143 3.037361 13.6474773.037060 3.101243 3.037060 12.896887 3.037060 10.355718 3.037060 3.384220 3.039676 13.4696163.039375 3.075829 3.039375 12.797559 3.039375 10.328013 3.039375 3.499605 3.041991 13.2362943.041701 3.168249 3.041701 12.642786 3.041701 10.330304 3.041701 3.471912 3.044317 12.9960623.044005 3.064303 3.044005 12.469543 3.044005 10.330304 3.044005 3.476528 3.046620 12.8274373.046331 3.057359 3.046331 12.388684 3.046331 10.321070 3.046331 3.501913 3.048947 12.6818993.048634 3.045798 3.048634 12.099934 3.048634 10.297982 3.048634 3.488066 3.051250 12.5178913.052106 3.048124 3.052106 12.032963 3.052106 10.328013 3.052106 3.444220 3.054722 12.2037273.055590 3.034272 3.055590 11.838924 3.055590 10.291038 3.055590 3.483451 3.058206 12.0189233.059062 3.041180 3.059062 11.656446 3.059062 10.316452 3.059062 3.379605 3.061678 11.7971793.062535 3.057359 3.062535 11.453137 3.062535 10.311835 3.062535 3.464989 3.065151 11.5800353.065995 3.029654 3.065995 11.242954 3.065995 10.364953 3.065995 3.374990 3.068611 11.3952303.069468 3.057359 3.069468 11.085855 3.069468 10.431959 3.069468 3.464989 3.072083 11.2104263.072951 3.048124 3.072951 11.011940 3.072951 10.263334 3.072951 3.361143 3.075567 11.0487273.076470 3.087390 3.076412 10.850259 3.076505 10.302600 3.076412 3.368066 3.079028 10.9078243.079942 3.061977 3.079942 10.653893 3.079977 10.286421 3.079896 3.370374 3.082500 10.7045323.083530 3.006532 3.083530 10.515299 3.083449 10.270277 3.083484 3.351912 3.086100 10.5543943.090590 3.087390 3.090590 10.221931 3.090509 10.247155 3.090544 3.340374 3.093160 10.2633353.097419 3.048124 3.097419 10.027892 3.097338 10.205563 3.097373 3.326528 3.099988 10.0207783.104363 3.041180 3.104363 9.868502 3.104282 10.191710 3.104317 3.342682 3.106933 9.7227933.111308 3.001914 3.111308 9.542777 3.111227 10.161679 3.111262 3.261913 3.113877 9.5333713.118252 3.013476 3.118252 9.351064 3.118171 10.177858 3.118206 3.268836 3.120822 9.2977573.125197 3.018093 3.125197 9.136229 3.125116 10.170914 3.125151 3.280374 3.127766 9.0621253.132141 3.001914 3.132141 8.946807 3.132060 10.085473 3.132095 3.261913 3.134711 8.865778
G:\102\00279.01\A\Reports Specs\KP\All Reports\Work in Progress\Hydrogeologic Testing Report\RevB\Appendix C\App C_3 Burdock Recovery Data Tables.xls4 of 6 11/12/2008
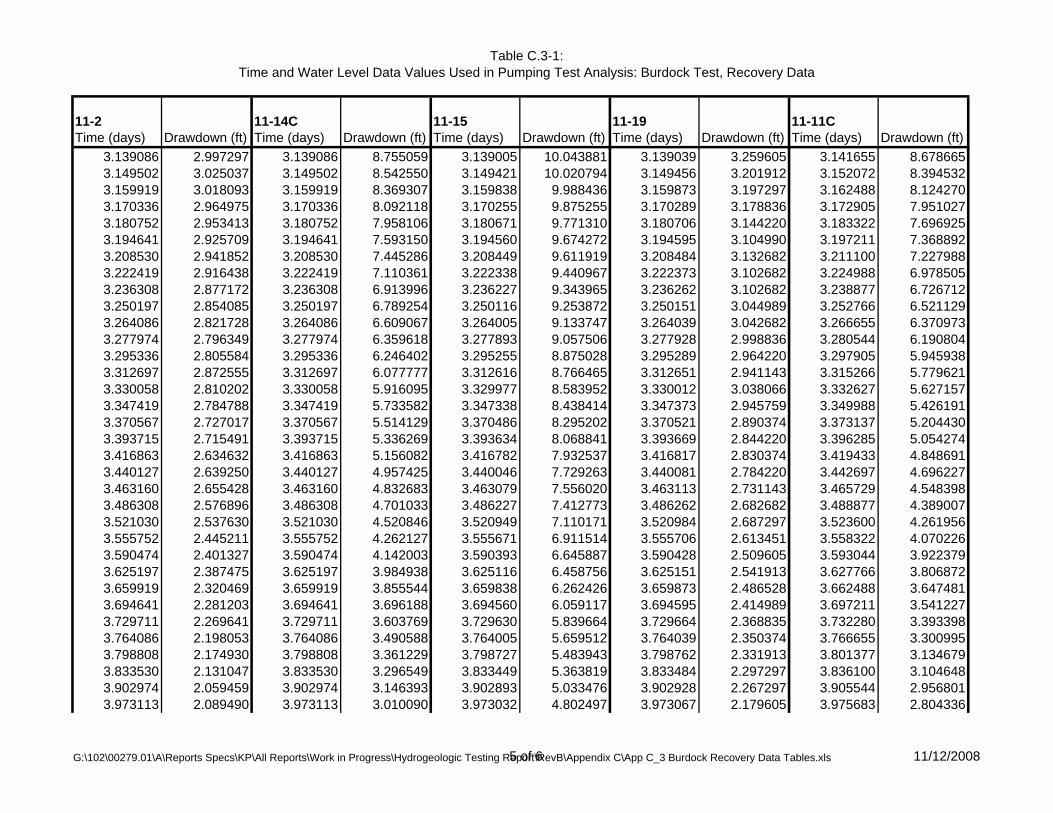
Table C.3-1:Time and Water Level Data Values Used in Pumping Test Analysis: Burdock Test, Recovery Data
11-2 11-14C 11-15 11-19 11-11CTime (days) Drawdown (ft) Time (days) Drawdown (ft) Time (days) Drawdown (ft) Time (days) Drawdown (ft) Time (days) Drawdown (ft)
3.139086 2.997297 3.139086 8.755059 3.139005 10.043881 3.139039 3.259605 3.141655 8.6786653.149502 3.025037 3.149502 8.542550 3.149421 10.020794 3.149456 3.201912 3.152072 8.3945323.159919 3.018093 3.159919 8.369307 3.159838 9.988436 3.159873 3.197297 3.162488 8.1242703.170336 2.964975 3.170336 8.092118 3.170255 9.875255 3.170289 3.178836 3.172905 7.9510273.180752 2.953413 3.180752 7.958106 3.180671 9.771310 3.180706 3.144220 3.183322 7.6969253.194641 2.925709 3.194641 7.593150 3.194560 9.674272 3.194595 3.104990 3.197211 7.3688923.208530 2.941852 3.208530 7.445286 3.208449 9.611919 3.208484 3.132682 3.211100 7.2279883.222419 2.916438 3.222419 7.110361 3.222338 9.440967 3.222373 3.102682 3.224988 6.9785053.236308 2.877172 3.236308 6.913996 3.236227 9.343965 3.236262 3.102682 3.238877 6.7267123.250197 2.854085 3.250197 6.789254 3.250116 9.253872 3.250151 3.044989 3.252766 6.5211293.264086 2.821728 3.264086 6.609067 3.264005 9.133747 3.264039 3.042682 3.266655 6.3709733.277974 2.796349 3.277974 6.359618 3.277893 9.057506 3.277928 2.998836 3.280544 6.1908043.295336 2.805584 3.295336 6.246402 3.295255 8.875028 3.295289 2.964220 3.297905 5.9459383.312697 2.872555 3.312697 6.077777 3.312616 8.766465 3.312651 2.941143 3.315266 5.7796213.330058 2.810202 3.330058 5.916095 3.329977 8.583952 3.330012 3.038066 3.332627 5.6271573.347419 2.784788 3.347419 5.733582 3.347338 8.438414 3.347373 2.945759 3.349988 5.4261913.370567 2.727017 3.370567 5.514129 3.370486 8.295202 3.370521 2.890374 3.373137 5.2044303.393715 2.715491 3.393715 5.336269 3.393634 8.068841 3.393669 2.844220 3.396285 5.0542743.416863 2.634632 3.416863 5.156082 3.416782 7.932537 3.416817 2.830374 3.419433 4.8486913.440127 2.639250 3.440127 4.957425 3.440046 7.729263 3.440081 2.784220 3.442697 4.6962273.463160 2.655428 3.463160 4.832683 3.463079 7.556020 3.463113 2.731143 3.465729 4.5483983.486308 2.576896 3.486308 4.701033 3.486227 7.412773 3.486262 2.682682 3.488877 4.3890073.521030 2.537630 3.521030 4.520846 3.520949 7.110171 3.520984 2.687297 3.523600 4.2619563.555752 2.445211 3.555752 4.262127 3.555671 6.911514 3.555706 2.613451 3.558322 4.0702263.590474 2.401327 3.590474 4.142003 3.590393 6.645887 3.590428 2.509605 3.593044 3.9223793.625197 2.387475 3.625197 3.984938 3.625116 6.458756 3.625151 2.541913 3.627766 3.8068723.659919 2.320469 3.659919 3.855544 3.659838 6.262426 3.659873 2.486528 3.662488 3.6474813.694641 2.281203 3.694641 3.696188 3.694560 6.059117 3.694595 2.414989 3.697211 3.5412273.729711 2.269641 3.729711 3.603769 3.729630 5.839664 3.729664 2.368835 3.732280 3.3933983.764086 2.198053 3.764086 3.490588 3.764005 5.659512 3.764039 2.350374 3.766655 3.3009953.798808 2.174930 3.798808 3.361229 3.798727 5.483943 3.798762 2.331913 3.801377 3.1346793.833530 2.131047 3.833530 3.296549 3.833449 5.363819 3.833484 2.297297 3.836100 3.1046483.902974 2.059459 3.902974 3.146393 3.902893 5.033476 3.902928 2.267297 3.905544 2.9568013.973113 2.089490 3.973113 3.010090 3.973032 4.802497 3.973067 2.179605 3.975683 2.804336
G:\102\00279.01\A\Reports Specs\KP\All Reports\Work in Progress\Hydrogeologic Testing Report\RevB\Appendix C\App C_3 Burdock Recovery Data Tables.xls5 of 6 11/12/2008

Table C.3-1:Time and Water Level Data Values Used in Pumping Test Analysis: Burdock Test, Recovery Data
11-2 11-14C 11-15 11-19 11-11CTime (days) Drawdown (ft) Time (days) Drawdown (ft) Time (days) Drawdown (ft) Time (days) Drawdown (ft) Time (days) Drawdown (ft)
4.041863 1.948569 4.041863 2.797581 4.041782 4.504512 4.041817 2.274220 4.044433 2.6634334.111308 1.927773 4.111308 2.605868 4.111227 4.303529 4.111262 2.031913 4.113877 2.5386914.180752 1.796087 4.180752 2.529627 4.180671 4.035576 4.180706 1.974220 4.183322 2.3400354.250197 1.752204 4.250197 2.402559 4.250116 3.811505 4.250151 1.928066 4.252766 2.2707374.319641 1.708320 4.319641 2.354058 4.319560 3.635936 4.319595 1.907297 4.322211 2.1251994.389086 1.664436 4.389086 2.250112 4.389005 3.476545 4.389039 1.828836 4.391655 2.0720634.493252 1.664436 4.493252 2.160019 4.493171 3.296359 4.493206 1.798836 4.495822 1.9750444.597419 1.560491 4.597419 2.065308 4.597338 3.109263 4.597373 1.734220 4.599988 1.9635004.701586 1.535077 4.701586 1.919770 4.701505 2.919842 4.701539 1.701913 4.704155 1.8202884.805752 1.456545 4.805752 1.910535 4.805671 2.751216 4.805706 1.688066 4.808322 1.7325044.944641 1.433422 4.944641 1.792737 4.944560 2.612622 4.944595 1.618836 4.947211 1.6447195.083530 1.361834 5.083530 1.665668 5.083449 2.460140 5.083368 1.549605 5.086100 1.5546255.222419 1.347946 5.222419 1.540926 5.222338 2.229161 5.222373 1.480374 5.224988 1.4391365.361308 1.165469 5.361308 1.370010 5.361227 2.097475 5.361146 1.436528 5.363877 1.3374815.500197 1.075375 5.500197 1.339979 5.500116 1.917288 5.500150 1.471143 5.502766 1.1919615.639086 1.015313 5.639086 1.268355 5.639005 1.797164 5.633947 1.401912 5.641655 1.0441145.777974 0.971429 5.777974 1.092786 5.777894 1.688601 5.777813 1.187297 5.780544 1.0302625.909340 0.927546 5.909340 1.182879 5.909375 1.612395 5.893901 1.094989 5.911910 1.062601
General Methodology: PSI, temperature, and time readings from Win-SituTM digital data log were exported to Excel ".csv" file. Drawdown was calculated as PSI at time after pumping minus average PSI before pumping; therefore, at small or zero changes in PSI negative drawdowns may be calculated. A FORTRAN program was written to read the ".csv" file and produce a second file by extracting the records at a frequency of 40 per log-time cycle (in minutes) in order achieve equal representation of data throughout the pumping and drawdown phases of the test.
Note Extracted manually from digital data log.
G:\102\00279.01\A\Reports Specs\KP\All Reports\Work in Progress\Hydrogeologic Testing Report\RevB\Appendix C\App C_3 Burdock Recovery Data Tables.xls6 of 6 11/12/2008

Appendix C-4 Additional Aquifer Parameter Determinations
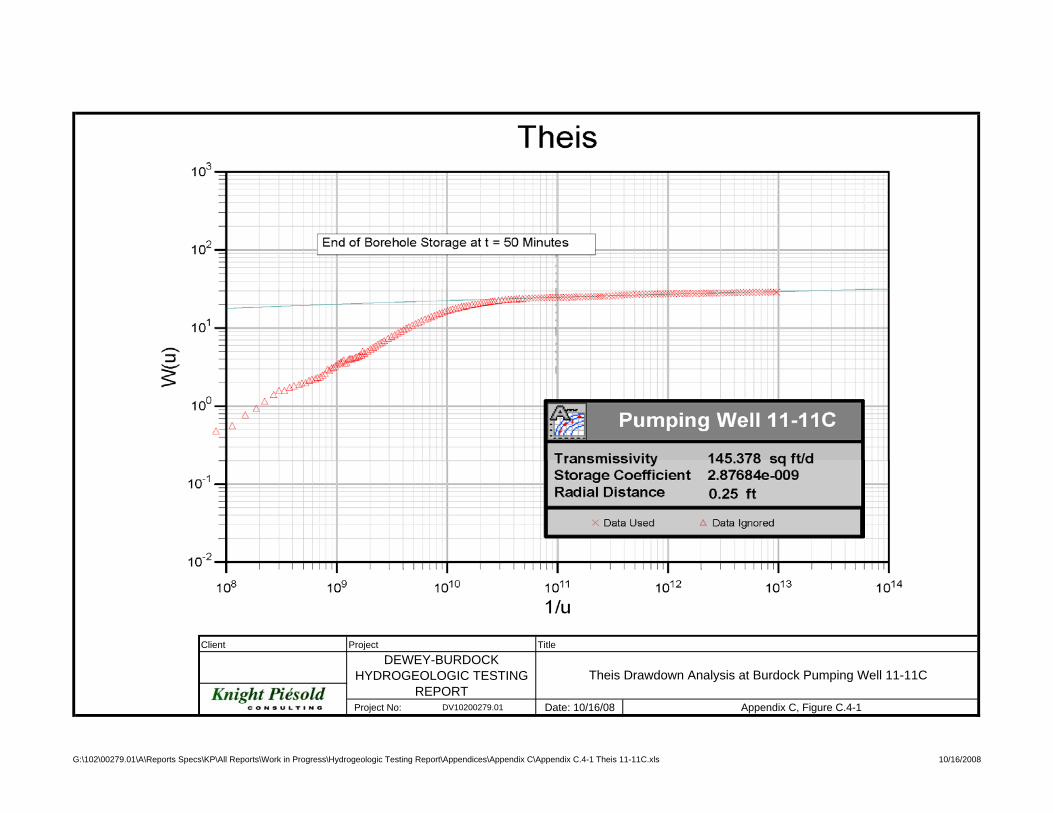
Client Project Title
DEWEY-BURDOCKTheis Drawdown Analysis at Burdock Pumping Well 11-11CHYDROGEOLOGIC TESTING
REPORTProject No: DV10200279.01 Date: 10/16/08 Appendix C, Figure C.4-1
G:\102\00279.01\A\Reports Specs\KP\All Reports\Work in Progress\Hydrogeologic Testing Report\Appendices\Appendix C\Appendix C.4-1 Theis 11-11C.xls 10/16/2008

Client Project Title
DEWEY-BURDOCKTheis Drawdown Analysis at Burdock Observation Well 11-15HYDROGEOLOGIC TESTING
REPORTProject No: DV10200279.01 Date: 10/16/08 Appendix C, Figure C.4-2
G:\102\00279.01\A\Reports Specs\KP\All Reports\Work in Progress\Hydrogeologic Testing Report\Appendices\Appendix C\Appendix C.4-2 Theis 11-15.xls 10/16/2008
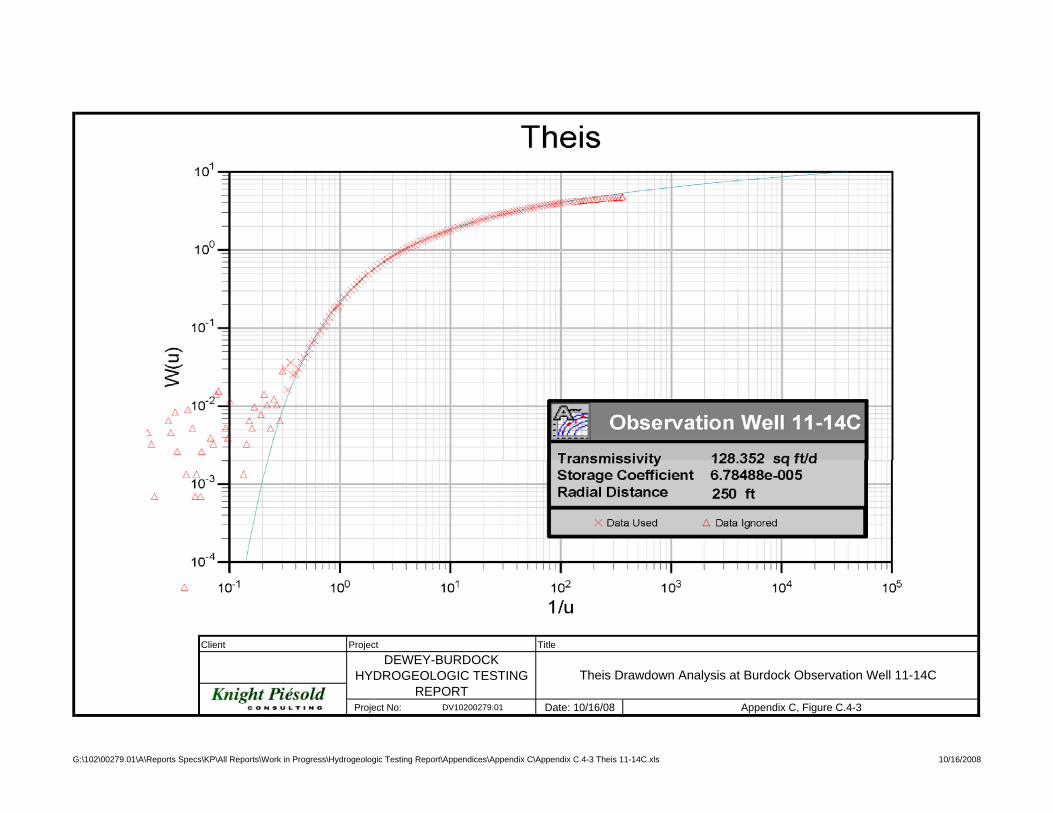
Client Project Title
DEWEY-BURDOCKTheis Drawdown Analysis at Burdock Observation Well 11-14CHYDROGEOLOGIC TESTING
REPORTProject No: DV10200279.01 Date: 10/16/08 Appendix C, Figure C.4-3
G:\102\00279.01\A\Reports Specs\KP\All Reports\Work in Progress\Hydrogeologic Testing Report\Appendices\Appendix C\Appendix C.4-3 Theis 11-14C.xls 10/16/2008

Client Project Title
DEWEY-BURDOCKTheis Recovery Analysis at Burdock Observation Well 11-14CHYDROGEOLOGIC TESTING
REPORTProject No: DV10200279.01 Date: 10/16/08 Appendix C, Figure C.4-4
G:\102\00279.01\A\Reports Specs\KP\All Reports\Work in Progress\Hydrogeologic Testing Report\Appendices\Appendix C\Appendix C.4-4 Theis Recov 11-14c.xls 10/16/2008
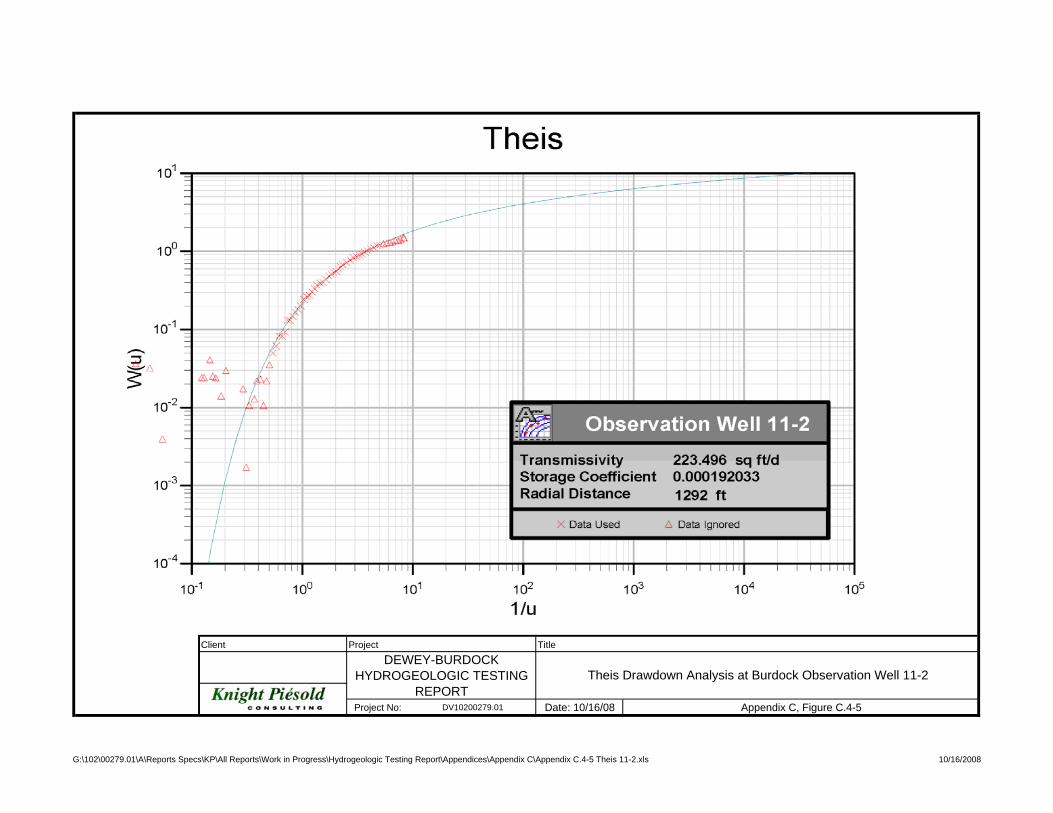
Client Project Title
DEWEY-BURDOCKTheis Drawdown Analysis at Burdock Observation Well 11-2HYDROGEOLOGIC TESTING
REPORTProject No: DV10200279.01 Date: 10/16/08 Appendix C, Figure C.4-5
G:\102\00279.01\A\Reports Specs\KP\All Reports\Work in Progress\Hydrogeologic Testing Report\Appendices\Appendix C\Appendix C.4-5 Theis 11-2.xls 10/16/2008
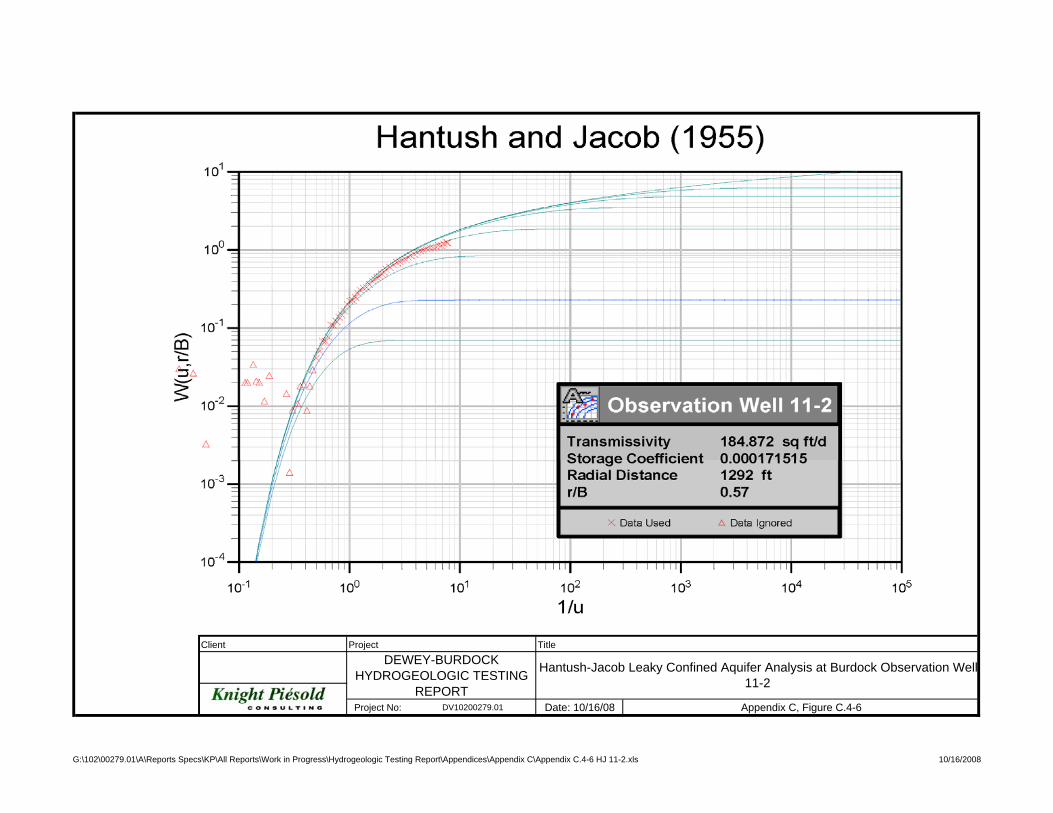
Client Project Title
DEWEY-BURDOCK Hantush-Jacob Leaky Confined Aquifer Analysis at Burdock Observation Well11-2HYDROGEOLOGIC TESTING
REPORTProject No: DV10200279.01 Date: 10/16/08 Appendix C, Figure C.4-6
G:\102\00279.01\A\Reports Specs\KP\All Reports\Work in Progress\Hydrogeologic Testing Report\Appendices\Appendix C\Appendix C.4-6 HJ 11-2.xls 10/16/2008

Client Project TitleDEWEY-BURDOCK
Drawdown and Analysis at Burdock Test Observation Well 11-19(Upper Lakota)
HYDROGEOLOGIC TESTINGREPORT
Project No: DV10200279.01 Date: 10/16/08 Appendix C, Figure C.4-7
G:\102\00279.01\A\Reports Specs\KP\All Reports\Work in Progress\Hydrogeologic Testing Report\Appendices\Appendix C\Appendix C.4-7 KP Theis 11-19.xls 10/16/2008
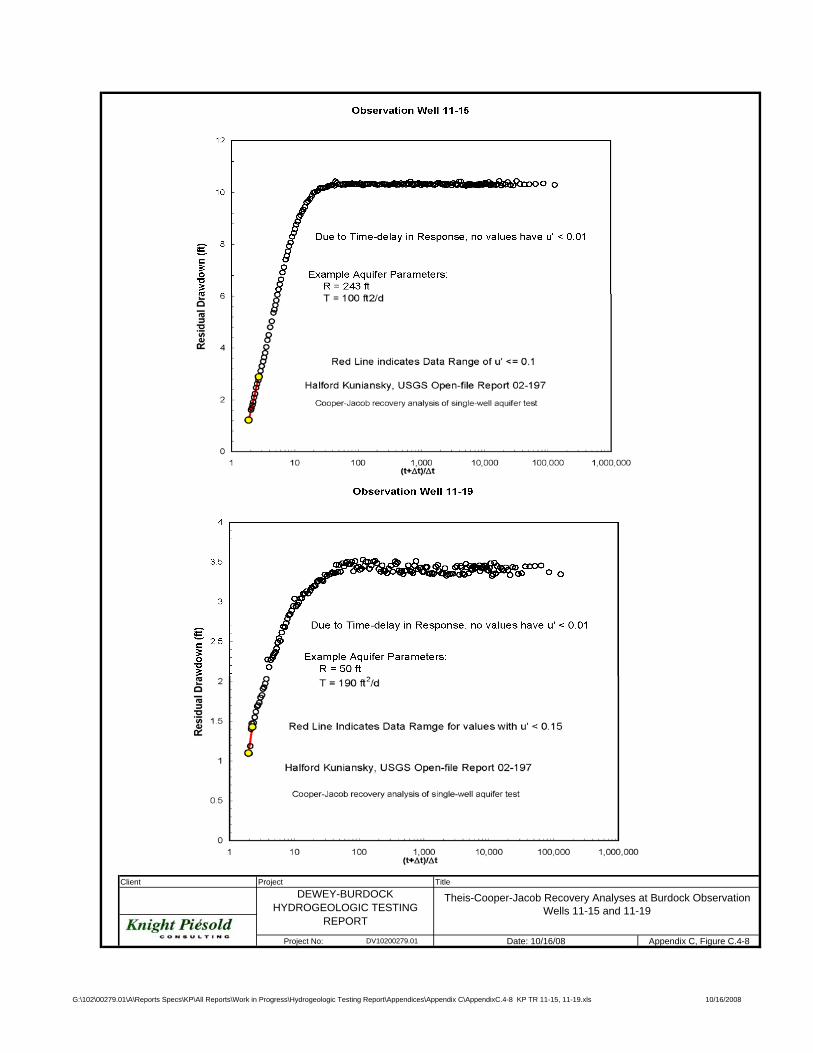
Client Project TitleDEWEY-BURDOCK Theis-Cooper-Jacob Recovery Analyses at Burdock Observation
Wells 11-15 and 11-19HYDROGEOLOGIC TESTINGREPORT
Project No: DV10200279.01 Date: 10/16/08 Appendix C, Figure C.4-8
G:\102\00279.01\A\Reports Specs\KP\All Reports\Work in Progress\Hydrogeologic Testing Report\Appendices\Appendix C\AppendixC.4-8 KP TR 11-15, 11-19.xls 10/16/2008
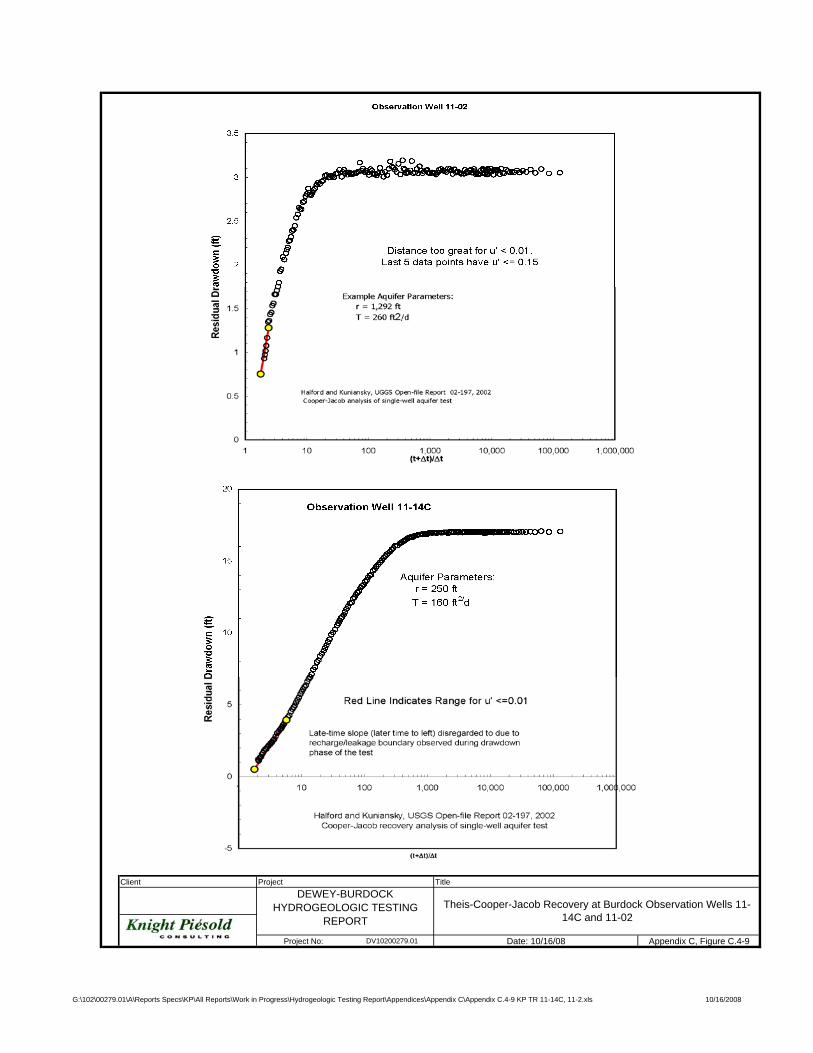
Client Project TitleDEWEY-BURDOCK
Theis-Cooper-Jacob Recovery at Burdock Observation Wells 11-14C and 11-02
HYDROGEOLOGIC TESTINGREPORT
Project No: DV10200279.01 Date: 10/16/08 Appendix C, Figure C.4-9
G:\102\00279.01\A\Reports Specs\KP\All Reports\Work in Progress\Hydrogeologic Testing Report\Appendices\Appendix C\Appendix C.4-9 KP TR 11-14C, 11-2.xls 10/16/2008

Appendix D Laboratory Core Data


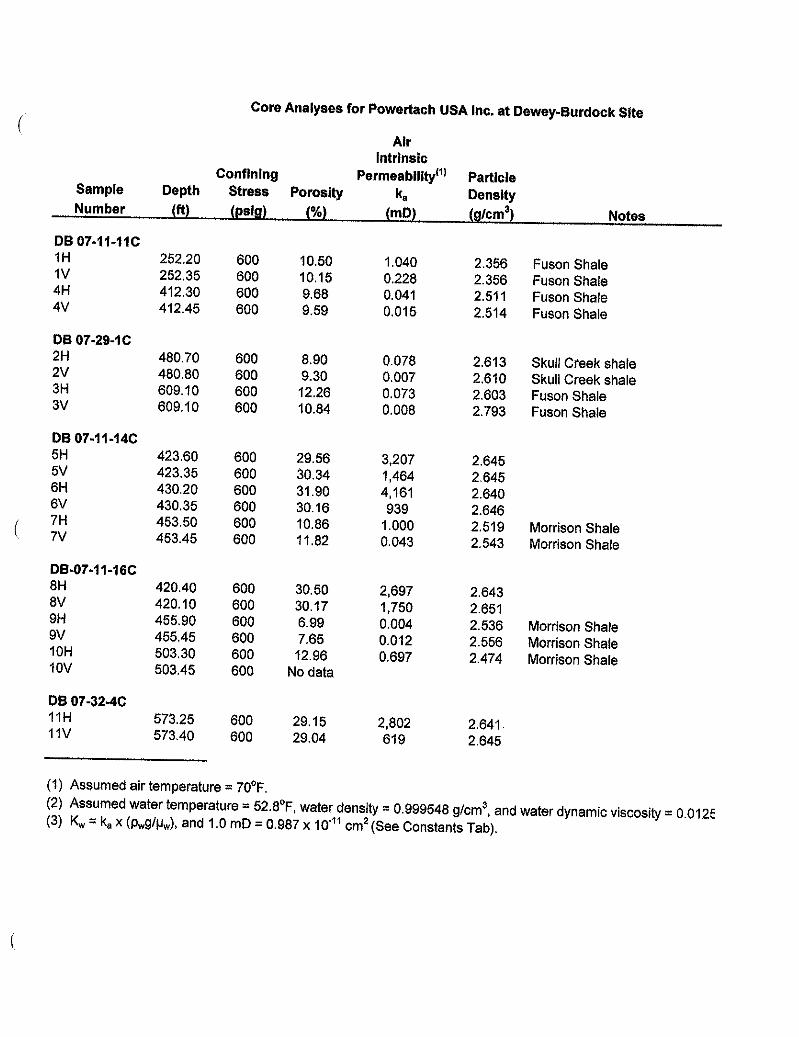
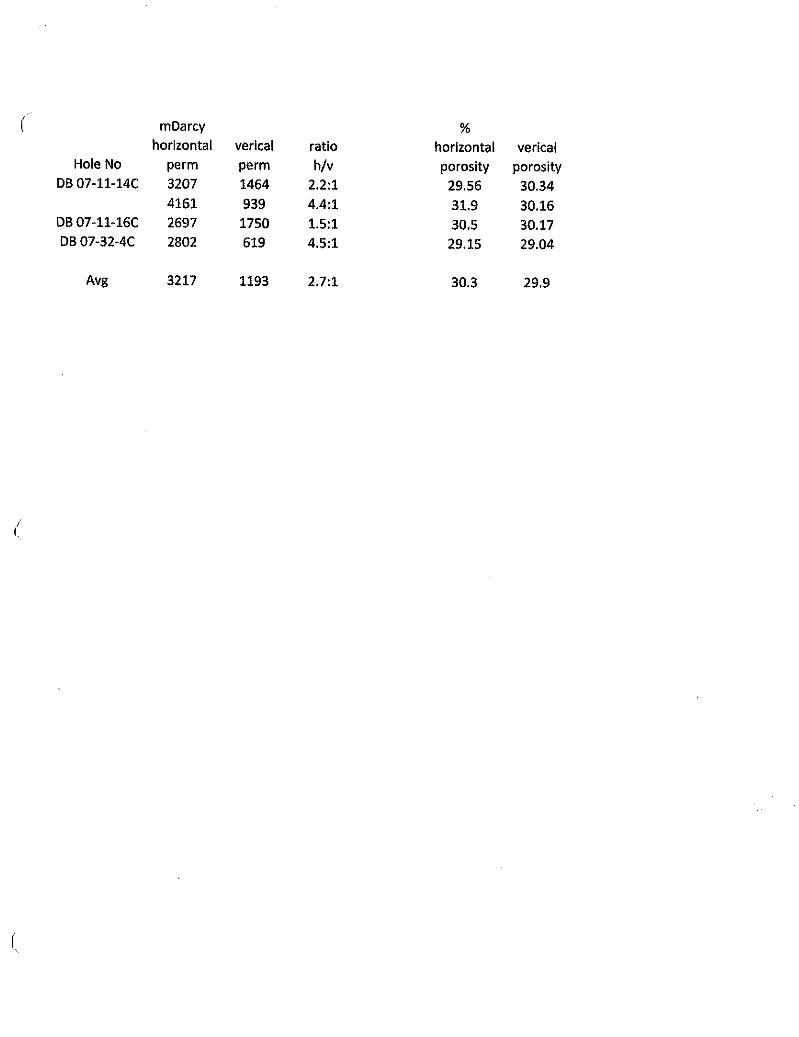

pendix E CD-ROM: Raw Pressure Transducer Data in WinSituTM
Format
Ap