appendix b: lifestyle pie chart - template.net · appendix b: lifestyle pie chart (teacher...
TRANSCRIPT
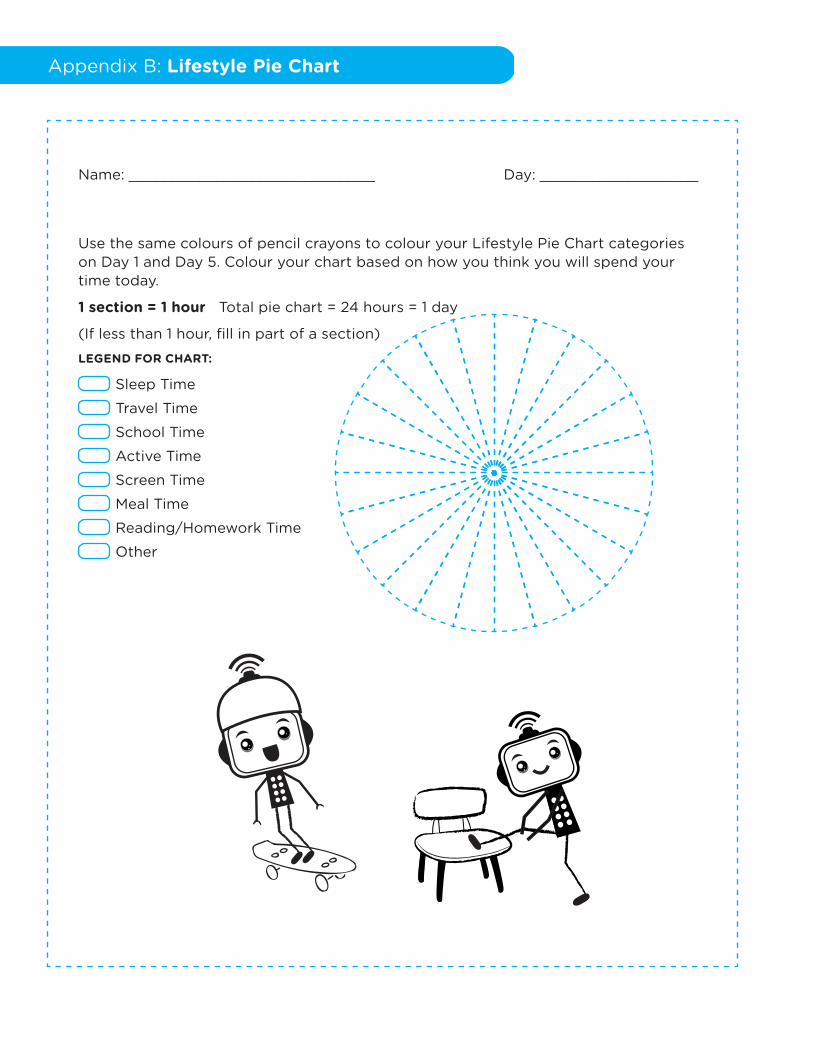
Appendix B: Lifestyle Pie Chart
Use the same colours of pencil crayons to colour your Lifestyle Pie Chart categories on Day 1 and Day 5 Colour your chart based on how you think you will spend your time today
1 section = 1 hour Total pie chart = 24 hours = 1 day
(If less than 1 hour, fill in part of a section)
LEGEnD FOR ChART:
Sleep Time
Travel Time
School Time
Active Time
Screen Time
Meal Time
Reading/Homework Time
Other
Name: ____________________________ Day: __________________
Appendix B: Lifestyle Pie Chart (Teacher Instructions)
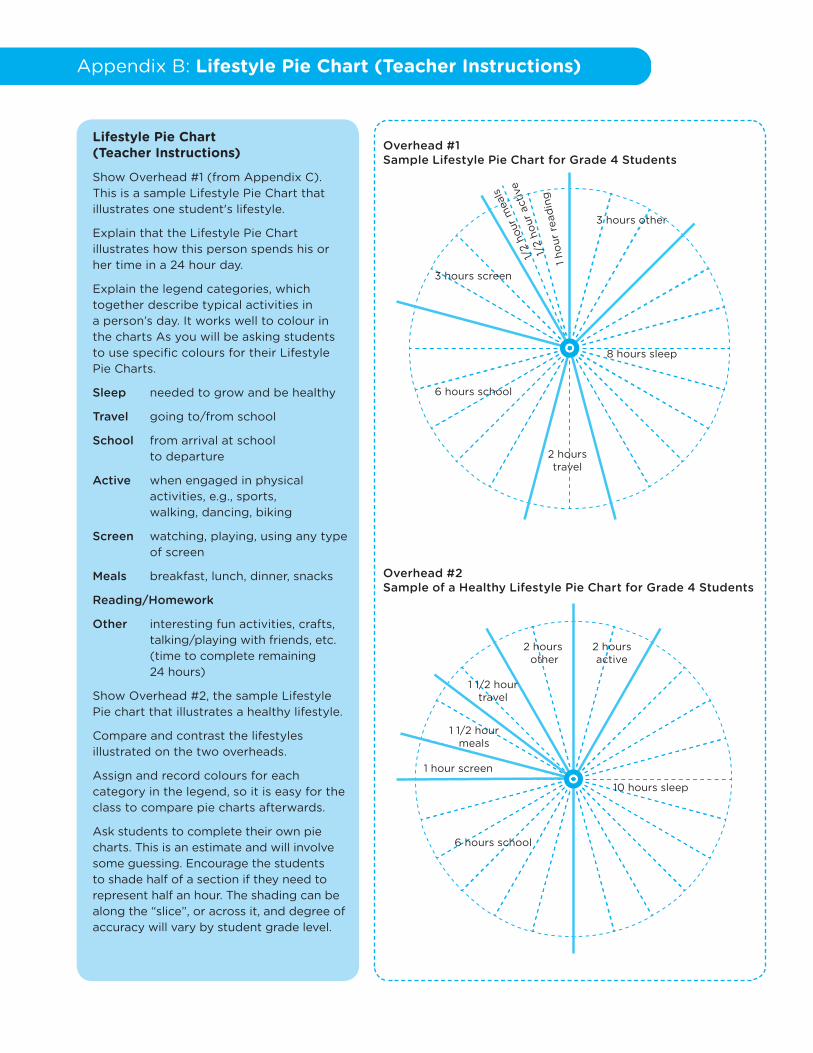
Overhead #1 Sample Lifestyle Pie Chart for Grade 4 Students
Overhead #2 Sample of a Healthy Lifestyle Pie Chart for Grade 4 Students
6 hours school
3 hours screen
1 ho
ur r
ead
ing
3 hours other
1/2
hour
mea
ls
1/2
hour
act
ive
8 hours sleep
2 hours travel
10 hours sleep
6 hours school
1 hour screen
1 1/2 hour meals
1 1/2 hour travel
2 hours other
2 hours active
Lifestyle Pie Chart (Teacher Instructions)
Show Overhead #1 (from Appendix C) This is a sample Lifestyle Pie Chart that illustrates one student's lifestyle
Explain that the Lifestyle Pie Chart illustrates how this person spends his or her time in a 24 hour day
Explain the legend categories, which together describe typical activities in a person’s day It works well to colour in the charts As you will be asking students to use specific colours for their Lifestyle Pie Charts
Sleep needed to grow and be healthy
Travel going to/from school
School from arrival at school to departure
Active when engaged in physical activities, e g , sports, walking, dancing, biking
Screen watching, playing, using any type of screen
Meals breakfast, lunch, dinner, snacks
Reading/Homework
Other interesting fun activities, crafts, talking/playing with friends, etc (time to complete remaining 24 hours)
Show Overhead #2, the sample Lifestyle Pie chart that illustrates a healthy lifestyle
Compare and contrast the lifestyles illustrated on the two overheads
Assign and record colours for each category in the legend, so it is easy for the class to compare pie charts afterwards
Ask students to complete their own pie charts This is an estimate and will involve some guessing Encourage the students to shade half of a section if they need to represent half an hour The shading can be along the “slice”, or across it, and degree of accuracy will vary by student grade level