appendix b asset management plan - richmond valley …€¦ · · 2015-06-25executive summary ......
TRANSCRIPT

2015-2025
Appendix B
Asset
Management
Plan 2015-2025
Buildings and Other Structures

Page 2 of 30 Richmond Valley Council Buildings and Other Structures 2015-2025

Page 3 of 30 Richmond Valley Council Buildings and Other Structures 2015-2025
Contents Executive Summary............................................................................................................................. 4
1. Introduction ................................................................................................................................... 5
1.1 Asset Management Plan .......................................................................................................... 5
1.2 Background ................................................................................................................................ 6
Objectives of Asset Management ................................................................................................. 6
2. Service Levels .............................................................................................................................. 8
2.1 Developing Levels of Service .................................................................................................. 9
Community Levels of Service .................................................................................................... 9
Technical Levels of Service ..................................................................................................... 10
2.2 Customer Research and Expectations ................................................................................ 11
2.3 Key Assumptions made in Financial Forecasts .................................................................. 13
Forecast Reliability and Confidence ....................................................................................... 13
3. Future Demand .......................................................................................................................... 14
3.1 Demand Management Plan ................................................................................................... 14
3.2 Demand Management Plan ................................................................................................... 15
4. Lifecycle Management Plan ..................................................................................................... 16
4.1 Background Data..................................................................................................................... 16
4.2 Physical Parameters ............................................................................................................... 17
Asset Renewals ......................................................................................................................... 18
4.3 Asset Conditions ..................................................................................................................... 22
4.4 Financial Summary ................................................................................................................. 24
4.5 Sustainability of Service Delivery ......................................................................................... 25
Long term - Life Cycle Cost ...................................................................................................... 25
Medium term – 10 year financial planning period ................................................................. 26
Medium Term – 5 year financial planning period .................................................................. 26
Long Term Financial Plan Works Program ............................................................................ 26
5. Risk Management ......................................................................................................................... 27
6. Plan Improvement and Monitoring .......................................................................................... 27
6.1 Accounting Standards and Regulations .............................................................................. 27
6.2 Asset management system ................................................................................................... 28
Required changes to asset management system arising from this AM Plan ................... 28
7. References .................................................................................................................................. 30

Page 4 of 30 Richmond Valley Council Buildings and Other Structures 2015-2025
Executive Summary This Total Asset Management Plan addresses the responsible management of medium term operational and capital works necessary to comply with legal and regulatory frameworks and to achieve agreed Buildings and Other Structures program performance levels. The objective is to provide reliable networks that contribute towards the social, economic and environmental indicators of a regional hub. An asset plan is a crucial element of the strategic planning process providing cascading outcomes that align with strategic plans.
Council’s Buildings and Other Structures program is predicted to perform satisfactorily over the 20 year horizon. Buildings and Other Structures network assets on average have a remaining useful life 50% of their expected lifecycles. Total revenues equal $42.7 million, operating and management expenses equal $22.9 million and capital works equal $19.7 million. The Asset Renewal Funding ratio is a critical indicator of the Buildings and Other Structures programs long term stability, an ideal indicator is 1.0; therefore RVC’s indicator of 0.77 is marginal.
General observations for the local Building and Other Structures unit include: Ø Number of Assets - 2,144. Ø Current Replacement Cost of asset base - $90.4 million. Ø Depreciated Replacement Cost $60 million, 67% of the fair values, reflecting high residual values
and modified depreciation schedules for long lived assets. Ø Annual depreciation - $1.4 million Ø Percentage of assets with condition rating of 1 or 2 is a satisfactory at 58%. Ø Percentage of network assets due for renewal in next 10 years is 21%.
The Buildings and Other Structures program competes with Road and Stormwater assets for funding. The current budget and Long Term Financial Planning process focused attention on roads infrastructure which impacts the resourcing available for Buildings and Other Structures assets.

Page 5 of 30 Richmond Valley Council Buildings and Other Structures 2015-2025
1. Introduction The Richmond Valley is located in the Northern Rivers region of North East NSW, 726 km north of Sydney and 228 km south of Brisbane. Located on the banks of the Richmond River the region supports a variety of agricultural industries, primarily beef, sugar cane and wheat. Richmond Valley Council was formed in February 2000 as the result of amalgamation between Casino Council and Richmond River Shire Council.
Council spreads across 3,050 square kilometres with six townships. Major urban areas are Casino and Evans Head and the villages are Woodburn, Coraki, Broadwater, Rileys Hill and Rappville. As at 2011, the resident population was 22,700 persons with a skew towards blue collar occupations. Richmond Valley is preparing to be one of the fastest growing areas in regional NSW with economic stimulus emerging from natural resource discoveries (uncertainty surrounds coal seam and natural gas developments).
The Region is expected to experience population growth (0.51% pa), decreasing occupancy rates and an ageing population. The number of dwellings in the Council LGA is expected to increase from 9,150 in 2011 to 10,750 in 2031, an increase of 1,600 dwellings at an average growth rate of 0.81% p.a.
Richmond Valley is in a sub-tropical area, characterised by hot humid summers and mild winters. Average rainfall ranges from 1,650 mm along the coast strip, to less than 1,025 mm over inland areas. The LGA is prone to natural disasters having had five Natural Disaster Declarations since 2009. Council is located on a flood plain and heavy rainfall can trigger flood events, while climate change and rising sea levels impact coastal areas and increase unpredictability.
The Richmond Valley is a region of balance where every individual, family and business has the opportunity to be successful.; It is an attractive place to live and play but as with most rural centres struggles to compete with the employment opportunities of the capital cities. This is reflected with a general decline of the working age cohort and professional occupations but does experience a large retiree and tree change population. This is consistent with the ALGA State of the Regions stylised fact number five that applies to the majority of LGA’s.
The major issues facing Council generally include prosperity and economic development for individuals and the region. The community is engaged in the longer term prospects for the region with a focus on financial management and the provision of quality infrastructure networks. Council and the local business chamber are aligned in their purpose to provide employment, opportunities and lifestyle for the people of the Richmond Valley.
Timber and forestry and the associated production and manufacturing industries are creating strong demand for industrial development. A 58 hectare industrial development at North Casino (Intermodal Freight Handling Facility) has been approved by Council. Other major developments include coal seam methane gas fields and reticulation as a “green” energy source and an electrical power plant in the Casino area.
1.1 Asset Management Plan An Asset Management Plan (AMP) provides understanding of the options, risks and consequences associated with managing large scale infrastructure, having an articulated basis for community engagement, expectations, priorities, funding levels and the related trade-offs and a strong understanding of the capital, operating and maintenance expenditures to be incorporated into the long term strategic planning process.

Page 6 of 30 Richmond Valley Council Buildings and Other Structures 2015-2025
Planning assists Council to deliver services derived from a network of infrastructure assets including transport, recreation, stormwater drainage, community buildings, water supply and sewerage. The Local Government Act 1993 requires NSW Councils to prepare asset management plans and annual reports.
1.2 Background This plan demonstrates responsive management of Buildings and Other Structures, associated services, compliance with regulatory requirements, and to communicate the funding needed to provide the required levels of service over a 10 year planning period.
This plan is to be read with the Council’s Strategic Plans, Business Continuity Plan, Risk Management, Long Term Capital Works Plan and Community Strategic Plan.
Objectives of Asset Management Council exists to provide long-term quality services to its community. Some of these services are provided by infrastructure assets. We have acquired infrastructure assets by ‘purchase’, contract, construction by our staff and by donation of assets constructed by developers and others to meet increased levels of service.
Our vision is:
We will ensure the Richmond Valley is well positioned for the future – socially, environmentally and economically, with all the right ingredients to be a primary regional hub in NSW.
Our mission is:
To develop and operate infrastructure networks that supports the fabric of a modern vibrant society. Our aim is to provide reliable networks that build trust and dependency not only within their network, but also between one network and another network.
Our goal is:
In managing infrastructure assets is to meet the defined level of service (as amended from time to time) in the most cost effective manner for present and future consumers. The key elements of infrastructure asset management are:
Ø Providing a defined level of service and monitoring performance; Ø Managing the impact of growth through demand management and infrastructure investment; Ø Taking a lifecycle approach to developing cost-effective management strategies for the long-term
that meet the defined level of service; Ø Identifying, assessing and appropriately controlling risks; and Ø Having a long-term financial plan which identifies required, affordable expenditure and how it will
be financed.

Page 7 of 30 Richmond Valley Council Buildings and Other Structures 2015-2025
Key elements of this plan are: Ø Levels of service – specifies the services and levels of service to be provided by the organisation, Ø Future demand – how this will impact on future service delivery and how this is to be met, Ø Life cycle management – how Council will manage its existing and future assets to provide defined
levels of service, Ø Financial summary – what funds are required to provide the defined services, Ø Asset management practices, Ø Monitoring – how the plan will be monitored to ensure it is meeting organisation’s objectives, and Ø Asset management improvement plan.
Legislation Requirement Local Government Act Sets out role, purpose, responsibilities and powers of local
governments including the preparation of a long term financial plan supported by asset management plans for sustainable service delivery.
Public Works and Procurement Act 1912 Sets out the role of the Department of Water and Energy (DWE) and Department of Commerce in the planning and construction of new assets.
Heritage Act, 1977 An Act to conserve the environmental heritage of the State. Several properties are listed under the terms of the Act and attract a high level of maintenance cost, approval and monitoring.
Environmental Planning and Assessment Act 1979 An Act to institute a system of environmental planning and assessment for the State of New South Wales. Among other requirements the Act outlines the requirement for the preparation of Local Environmental Plans (LEP), Development Control Plans (DCP), Environmental Impact Assessments (EIA) and Environmental Impact Statements.
Work Health and Safety Act 2011 and Workers Compensation Act 1987
Sets out roles and responsibilities to secure the health, safety and welfare of persons at work and covering injury management, emphasising rehabilitation of workers particularly for return to work. Council is to provide a safe working environment and supply equipment to ensure safety.
Public Health Act 2010 An Act relating to the maintenance of proper standards of health for the public. Council operations need to be carried out in a manner that protects public health.
Independent Pricing and Regulatory Tribunal Act 1992
The Act empowers the Independent Pricing and Regulatory Tribunal (IPART) which sets principles and guidelines related to charging for water supply.
Competition Policy including Competition Policy Reform Act 1995
Council is subject to prohibition on anti-competitive behaviour, according to the Trade Practices Act.
Threatened Species Conservation Act 1995 An Act to conserve threatened species, populations and ecological communities of animals and plants.

Page 8 of 30 Richmond Valley Council Buildings and Other Structures 2015-2025
Protection of the Environment Operations Act 1997 Council is required to exercise due diligence to avoid environmental impact and among others are required to develop operations emergency plans and due diligence plans to ensure that procedures are in place to prevent or minimise pollution.
Water Management Act 2000 An Act to provide for the protection, conservation and ecologically sustainable development of the water sources of the State, and for other purposes. Allows Council to levy developer charges and addresses water sharing and environmental flows.
Building Code of Australia The goal of the BCA is to enable the achievement of nationally consistent, minimum necessary standards of relevant, health, safety (including structural safety and safety from fire), amenity and sustainability objectives efficiently.
Building Fire and Safety Regulation 1991 This Act sets out the regulations for things such as means of escape, Limitation of people in buildings, Fire and evacuation plans and testing of special fire services and installations.
Dangerous Goods Safety Management Act 2001 This act sets out the safe use, storage and disposal of dangerous goods
Electrical Safety Act 2002 This act sets out the installation, reporting and safe use with electricity
Environmental Planning and Assessment Act 1979 (POPE)
This act sets out requirements in respect to Planning Legislation
Building Regulation 2003 This act sets out requirements in respect to Building Requirements
Plumbing and Drainage Act 2002 This act sets out requirements in respect to Plumbing Requirements
Plant Protection Act 1989 This act sets out requirements in respect to Flora Protection
Fire and Rescue Service Act 1990 This act sets out requirements in respect to Emergency Services for Fire and Rescue
Valuation of Land Act 1916 This act sets out requirements in respect Land Valuation
Public Records Act 2002 The requirements in respect maintaining Public Records
Table 1.1: Legislative Requirements
2. Service Levels For Council, serving customers and the community is our principal objective. Our first priority is to understand their needs, wants, values, concerns and what aspects of services are important to them.
Page 9 of 30 Richmond Valley Council Buildings and Other Structures 2015-2025
Understanding customer concepts of value is achieved by understanding their expectations and preferences. Typically customers perceive the value provided by a service as the benefits they receive less their contributions in the form of rates and service charges. That is, a customer’s utility or satisfaction level increases when their benefits exceed the costs they pay. Customers want to maximise their utility through saving time, reliability and consistency of service, safety and wellbeing.
Customers want services that are easy to use, that simplify their lives and provide lifestyle satisfaction. However customer value is a compromise between their perceived benefit and their willingness to contribute financially towards these benefits. Asset and service attributes like healthy, timeliness, ‘safe and reliable’, convenience and quality are intrinsic with best practice Asset Management, but they are not always tangible to the consumer. Public organisations need to communicate these attributes and/or the consequences resulting from their removal if the community cannot afford them.
2.1 Developing Levels of Service Levels of Service (LoS) are key business drivers; they influence the range, quality and quantity of assets and services provided. LoS indicators are usually based on the following: Ø Customer expectations and willingness to pay, Ø Legislative and environmental compliance which impose standards of service, and Ø The business context including strategic objectives, available resources and financial constraints.
LoS statements describes local Council’s intention to deliver customer services in terms of quality, reliability, responsiveness, sustainability, timeliness, accessibility and cost. Statements should be written so customers can relate to them. Councils are accountable through a customer satisfaction measure and a technical performance measure.
The relationship between costs and LoS depends on the type of activity. Some infrastructures have a steep initial cost with minimal servicing costs while other services will have higher proportions of operational and maintenance type costs. Costing needs to be meaningful and understandable, the cost per user should represent a tangible benefit or a better LoS.
Community Levels of Service Service levels are defined as either customer LoS or technical LoS. Community LoS measure how the community receives the service and whether the organisation is providing community value.
Community levels of service measures used in the asset management plan are:
Quality How good is the service? Function Does it meet users’ needs? Capacity/Utilisation Is the service over or under used?
The organisation’s current and expected community service levels are detailed in Table 2.1 which shows the agreed expected community levels of service based on resource levels in the current Long Term Financial Plan (LTFP) and community consultation/engagement.

Page 10 of 30 Richmond Valley Council Buildings and Other Structures 2015-2025
Service
Attribute Service Objective Performance
Measure Process Current
Performance Expected position in 10 years based on current
LTFP COMMUNITY OUTCOMES Key findings from a customer satisfaction survey find that largest performance gaps for resident satisfaction were maintaining local roads, economic development and financial management. COMMUNITY LEVELS OF SERVICE Quality Look well maintained
and clean
At a quality or standard suitable for their purpose
Customer surveys
Customer requests
To be provided from the Resident Survey
Requests received should not increase annually
Function Easy to access
Fit for their use
Customer surveys
Customer requests
To be provided from the Resident Survey
Requests received should not increase annually
Safety Free from hazards Number of injury accidents
(Accident History)
Should commence monitoring trend to determine if accidents are increasing
Accidents attributable to building condition should be reduced annually
Table 2.1: Community Level of Service
Technical Levels of Service Supporting the community service levels are operational or technical measures of performance. These technical measures relate to the allocation of resources to service activities that Council undertakes to best achieve the desired community outcomes and demonstrate effective organisational performance.
Technical service measures are linked to annual budgets covering: Ø Operations – the regular activities to provide services such as opening hours, cleansing, mowing
grass, energy, inspections, etc., Ø Maintenance – the activities necessary to retain an asset as near as practicable to an appropriate
service condition (e.g. road patching, unsealed road grading, building and structure repairs), Ø Renewal – the activities that return the service capability of an asset up to that which it had
originally (e.g. frequency and cost of road resurfacing and pavement reconstruction, pipeline replacement and building component replacement), and
Ø Upgrade – the activities to provide a higher level of service (e.g. widening a road, sealing an unsealed road, replacing a pipeline with a larger size) or a new service that did not exist previously (e.g. a new library).
Service and AMPs, implement and control technical service levels to influence the customer service levels.1
1 IPWEA, 2011, IIMM, p 2.22

Page 11 of 30 Richmond Valley Council Buildings and Other Structures 2015-2025
Buildings Levels of Service Technical LoS is a function of ongoing serviceability (Operations, Maintenance and Administration (OMA)) and renewing of depleted assets. Council allocates 54% of budget for OMA or serviceability costs ($22.9 million), 39% for renewing depleted assets ($16.5 million) and 7% for new assets ($3.1 million) over the LTFP.
The LTFP Buildings and Other Structures program allocates $16.7 million for budgeted renewals, $3.1 million for new works with a total program depreciation of $21.6 million and total asset disposals of $9 million. This results in a Buildings and Other Structures Renewals Ratio of 0.76 and a Bring to Satisfactory (BTS) ratio of 0.0. Floor Finish assets have a BTS Ratio of 0.86 and Open Space Recreational assets has a BTS of 0.34 over the LTFP.
Table 2.3 shows the technical level of service expected to be provided under this AMP. The agreed sustainable position in the table documents the position agreed by the Council following community consultation and the trade-off of service levels performance, costs and risk management of resources available in the LTFP.
Table 2.3: Buildings Levels of Service ($000)
2.2 Customer Research and Expectations Council engaged Micromex to conduct the Richmond Valley Council Community Research 20132. The poll from a sample of residents revealed their level of satisfaction with Council’s services. Council sought to examine community attitudes and perceptions towards current and future services and facilities provided by Council. Key objectives of the research included: Ø To assess and establish the community’s priorities and satisfaction in relation to Council activities,
services and facilities, Ø To identify the community’s overall level of satisfaction with Council’s performance, and Ø To identify the community’s level of satisfaction with regards to contact they have had with Council
staff.
2 Micromex Research, 2013, Richmond Valley Council Community Research

Page 12 of 30 Richmond Valley Council Buildings and Other Structures 2015-2025
Overall, the research has found a generally positive result for Council, with 29 of the 32 services/facilities/criteria rated as being of ‘moderate satisfaction’ to ‘very high satisfaction’.
At an overall level, residents expressed a ‘moderate’ level of satisfaction with the performance of Council, with 82% of the respondents giving a rating of ‘somewhat satisfied’ to ‘very satisfied’. Only 4% of residents indicated that they were ‘not at all satisfied’ with Council’s performance.
Compared to an All of NSW measure and Regional Councils, Richmond Valley has performed better than average. The most recent community satisfaction survey reported satisfaction levels for the following services in Table 2.4. The community is generally satisfied with services provided by Council and is very satisfied with the regional water supply service.
Item Importance Performance Gap
General Facilities and Services
Facilities and services for seniors 5.73 3.82 1.91
Facilities and services for the disabled 5.80 3.61 2.18
Youth facilities and events 5.66 3.26 2.40
Library services 5.78 5.28 0.50
Council buildings and resources provided for community use (eg public halls)
5.53 3.96 1.57
Public toilets provided by Council in parks
5.89 3.04 2.84
Playgrounds, playing fields and ovals 5.82 4.02 1.80
Parks and gardens 5.56 3.65 1.91
Swimming pools 5.45 4.20 1.25
Table 2.4: Community Satisfaction Survey Levels
Library services received positive performance ratings from respondents across the board.
Respondents indicated high levels of dissatisfaction with Council’s provision of Public Toilets in Parks (Gap mean of 2.84), Youth facilities and events (2.40), and Facilities and services for the disabled (2.18).
Since this survey was undertaken, Council has provided additional toilets in the CBD of Casino and increased the operational and renewal expenditure through additional income raised in the 2014/14 Special Rates Variation (SRV).

Page 13 of 30 Richmond Valley Council Buildings and Other Structures 2015-2025
2.3 Key Assumptions made in Financial Forecasts
Forecast Reliability and Confidence The expenditure and valuations projections in this AMP are based on best available data. Currency and accuracy of data is critical to effective asset and financial management. Data confidence is classified on a 5 level scale3 in accordance with Table 2.5
Confidence Grade Description A Highly reliable Data based on sound records, procedures, investigations and analysis,
documented properly and recognised as the best method of assessment. Dataset is complete and estimated to be accurate ± 2%
B Reliable Data based on sound records, procedures, investigations and analysis, documented properly but has minor shortcomings, for example some of the data is old, some documentation is missing and/or reliance is placed on unconfirmed reports or some extrapolation. Dataset is complete and estimated to be accurate ± 10%
C Uncertain Data based on sound records, procedures, investigations and analysis which is incomplete or unsupported, or extrapolated from a limited sample for which grade A or B data are available. Dataset is substantially complete but up to 50% is extrapolated data and accuracy estimated ± 25%
D Very Uncertain Data is based on unconfirmed verbal reports and/or cursory inspections and analysis. Dataset may not be fully complete and most data is estimated or extrapolated. Accuracy ± 40%
E Unknown None or very little data held.
Table 2.5: Data Confidence Grading System
Key assumptions made in this AMP and risks that these may change are shown in Table 2.6
Key Assumptions Risks of Change to Assumptions Use of existing inventory data Data set is reliable; monetary movements have a
confidence level of A. Use of existing valuations and useful lives Design lives confidence level A
RUL confidence level B, some slight deviation observed when applying modified pattern asset movements over the LTFP.
Use of current expenditure information as best as this can be determined
Confidence level A. RVC has integrated asset schedule.
Table 2.6: Key Assumptions made in AM Plan and Risks of Change
3 IPWEA, 2011, IIMM, Table 2.4.6, p 2|59.

Page 14 of 30 Richmond Valley Council Buildings and Other Structures 2015-2025
The estimated confidence level for and reliability of data used in this AMP is shown in Table 2.7.
Data Confidence Assessment
Comment
Demand drivers TBD Need calibration Growth projections Highly Reliable ABS and NSW DPI Operations expenditures Highly Reliable Low variations over four years Maintenance expenditures
Highly Reliable Low variations over four years
Projected Renewal exps. - Asset values
Reliable Dataset complete with some expected errors
- Asset residual values Reliable Dataset complete with some expected errors
Table 2.7: Data Confidence Assessment for Data used in AM Plan
3. Future Demand Demand management is an action plan to improve usage and efficiency for buildings and facilities throughout Council. The capacity of an organisation is dependent on quantitative analysis and best judgements across the many factors impacting on service delivery. Issues include asset integrity, preventative maintenance, periodic renewal and network expansion to accommodate community development.
Factors affecting demand include population change, changes in demographics, seasonal factors, vehicle ownership, consumer preferences and expectations, economic factors, agricultural practices, environmental awareness, etc.
Population is expected to increase modestly over the next 25 years, therefore not influencing demand for new assets. A general issue with infrastructure delivery is the increasing costs of doing business. Rising costs are a factor of increased resourcing costs (labour and materials), WHS awareness and a more focused regulatory environment.
Infrastructure assets are subject to increasing environmental affects, resulting in new technologies and improved materials. New construction methods are designed to lessen susceptibility to damage from the environment, as well as to minimise induced impacts on the environment. In combination the cost to provide and care for assets is increasing faster than the community’s ability to fund provision.
3.1 Demand Management Plan Council’s OMA practices continue to advance with improved predictive knowledge from information systems and the adoption of industry best practices. Managing demand for services is a combination of preventative and reactive maintenance practices that maintain asset serviceability and the timely renewal of assets that have reached end of life. Council continues to invest in information systems and evidence based data including conditions ratings, remaining useful life, depreciation patterns which improve the infrastructure and long term financial planning functions.
The potential benefits of demand management programs include sustainable usage patterns, delaying investment in new infrastructure and to reduce the operational costs of reticulated water services.

Page 15 of 30 Richmond Valley Council Buildings and Other Structures 2015-2025
Local Water Utilities (LWUs) can balance demand management initiatives with supply side works and achieve triple bottom line benefits including: lower rates (Typical Residential Bill TRB) for their customers, a more secure water supply and increase residual water for environment uses.
3.2 Demand Management Plan Council’s OMA practices continue to advance with improved predictive knowledge from information systems and the adoption of industry best practices. Managing demand for services is a combination of preventative and reactive maintenance practices that maintain asset serviceability, and the timely renewal of assets that have reached end of life. Council continues to invest in information systems and evidence based data including conditions ratings, remaining useful life, depreciation patterns which improve the infrastructure and long term financial planning functions.
Opportunities identified for demand management include monitoring community expectations to determine LoS and analysing the cost of provision to determine the long term affordability. There is a gap between community aspirations and their willingness to pay for these services. It is the responsibility of Council to articulate the evidence presented in asset and financial planning, therefore narrowing the expectations gap.
Figure 3.2 New Assets from Growth
Financial results from best practices applied to the Buildings and Other Structures program identify that 84% of capital expenditure will be required to maintain the existing network of asset (figure 3.2). A total of $3.1 million has been allocated for new and improved serviceability of buildings and structures. It is important to note that acquiring additional assets from growth or by provision of additional infrastructure services, will ultimately commit Council to fund ongoing operations and maintenance costs. These future costs should be identified and considered in developing forecasts of future operating and maintenance costs.

Page 16 of 30 Richmond Valley Council Buildings and Other Structures 2015-2025
4. Lifecycle Management Plan A Lifecycle Asset Management Plan details how Council plans to manage and operate buildings and structures at the agreed LoS while optimising lifecycle costs. The objective is to look at the lowest long term cost rather than seeking short term savings when making decisions. Sustainable financial management is about managing community outcomes by providing assets and services with the lowest long term cost.
4.1 Background Data The Council Buildings and Other Structures network includes four asset classes consisting of 2,144 unique assets with a Fair Value Current Replacement Cost (CRC) of $90.4 million and a Depreciable Replacement Cost (DRC) $60.3 million. The remaining useful life (RUL) for all buildings and structures as a percentage of total life is 50% (table 4.1). The recent buildings revaluation resulted in a net $0.5 million increase to the fair value of buildings. But interestingly there was a $10.4 million movement from the structural shell component towards other building components.
Table 4.1: Buildings Asset Statistics ($000)
Long lived assets have modified depreciation schedules reflecting reduced consumption patterns in earlier years and increasing consumption as the asset integrity declines towards end of useful life (Figure 4.1). Standard lifecycle asset terms include:
Ø Current Replacement Cost (CRC) - the minimum it would cost, to replace the existing asset with a technologically modern equivalent new asset with the same economic benefits or service potential,
Ø Depreciable Amount (DA) - CRC for depreciable assets less residual value (RV), Ø Depreciated Replacement Cost (DRC) - CRC less accumulated depreciation, and Ø Asset valuations by the valuer employ a modified depreciation pattern which results in asset
valuations as a percentage (DRC/CRC) being higher than the age percentage (RUL/Useful Life).

Page 17 of 30 Richmond Valley Council Buildings and Other Structures 2015-2025
Figure 4.1: Depreciation Profile for Long Lived Assets
Council Buildings and Other Structures position (Table 4.2) shows the fair value of assets (CRC) is $90.4 million and DRC or the Written Down Value (WDV) totalling $72.3 million. Annual depreciation of $1.4 million reflects an asset consumption rate of 1.15%. The asset renewal funding ratio4 is 0.76 which indicates Council plans to renew assets at half the rate they are being consumed, thereby decreasing asset stock by $0.5 million per year.
Table 4.2: Buildings Asset Values ($000)
4.2 Physical Parameters The age profile of infrastructure assets shows that significant construction took place in the post-World War 2 time period. It is likely that much of this infrastructure will be well through its useful life, and will require renewal in the near future. The profile also indicates that the age data on infrastructure requires development.
4 AIFMG, 2012, Version 1.3, Financial Sustainability Indicator 4, Sec 2.6, p 2.16

Page 18 of 30 Richmond Valley Council Buildings and Other Structures 2015-2025
Figure 4.2 examines the data by time periods. This graphic illustrates that the Buildings and Other Structures network is reasonable modern, 17% of assets were constructed pre 1970 and 40% have been constructed this century.
Figure 4.2: Asset Age Profile
Asset Renewals Council’s asset register provides RUL’s for each asset which can be used to predict the capital renewals by decade (Table 4.3). Council’s Buildings and Other Structures network has a current backlog of works ($15.1 million) based on restoring asses with condition ratings 3-5 to a satisfactory level. Council employs professional valuers to provide a risk adjusted fair valuation assessment for each asset class, therefore a more appropriate estimation of backlog or BTS is end of life assets due in year (x) less capital renewals divided by the remaining service potential of the assets in the network. This methodology results in no backlog or a BTS measure of 0.0.
Page 19 of 30 Richmond Valley Council Buildings and Other Structures 2015-2025
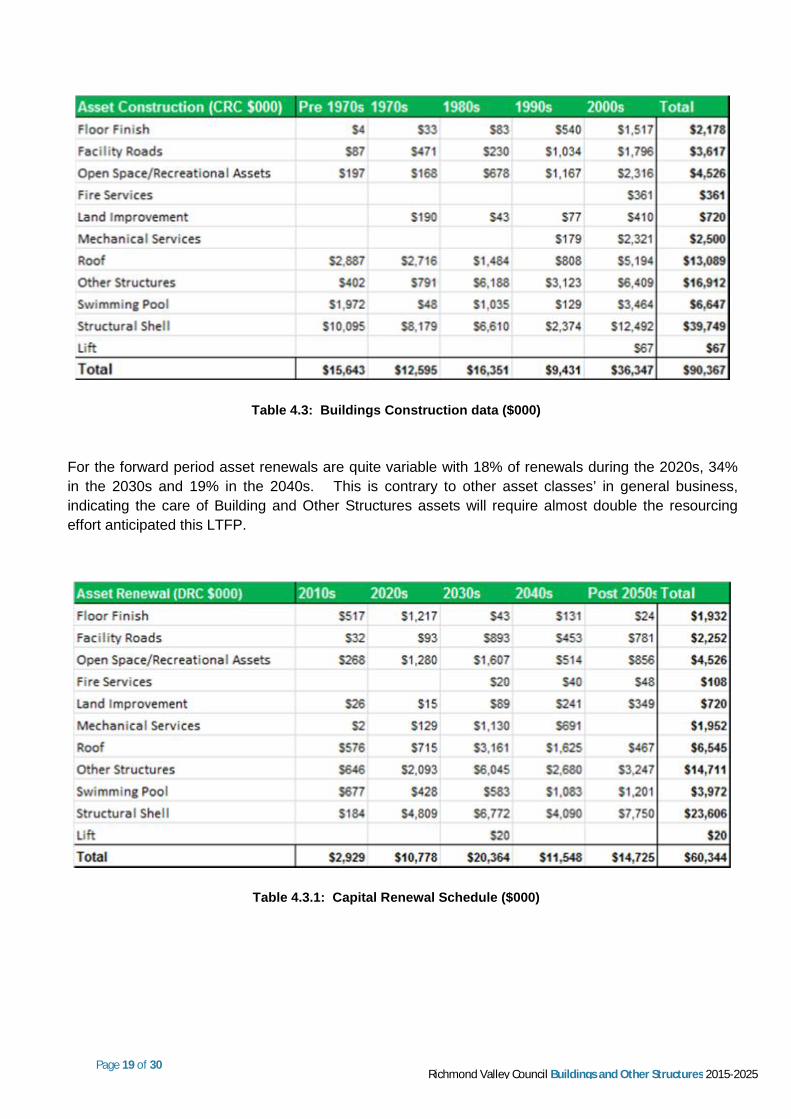
Table 4.3: Buildings Construction data ($000)
For the forward period asset renewals are quite variable with 18% of renewals during the 2020s, 34% in the 2030s and 19% in the 2040s. This is contrary to other asset classes’ in general business, indicating the care of Building and Other Structures assets will require almost double the resourcing effort anticipated this LTFP.
Table 4.3.1: Capital Renewal Schedule ($000)

Page 20 of 30 Richmond Valley Council Buildings and Other Structures 2015-2025
Figure 4.4: Asset Renewals Profile
Planning forward works is a function of renewals due and resourcing capacity. Over the LTFP period Council has $9 million of Buildings and Other Structures assets requiring renewal and has allocated 1.84 times this amount $16.5 million, to preserve the network. The following tables display asset financial movements for EOL Disposals, Renewals and Depreciation values (000s) for each program this current LTFP. These tables produce the key BTS and Renewals Ratios discussed below.
Council demonstrates a mature and integrated approach towards budget development, long term financial planning and capital works planning. This approach is influenced by best practice management and the future sustainability of Council businesses. Asset and financial planning primary considerations include replacement of end of life assets represented as a BTS Ratio BTS and the preservation of assets represented as a Renewals Ratio.
The following tables provide a time series for EOL disposal values, proposed capital renewals, annual depreciation values (which measure the consumption of assets) and WDVs (which measure the remaining service potential of assets). The table with capital renewals presents councils approach to achieving benchmark ratios of less than 0.02 for BTS and 1.0 for asset renewals.

Page 21 of 30 Richmond Valley Council Buildings and Other Structures 2015-2025
Table 4.4.1: Capital End of Life Disposal Values ($000)
Table 4.4.2: Proposed Capital Renewals Values ($000)
BTS communicates the quantum of assets that are at risk or require immediate attention to restore their serviceability. With Council implementing best practice through professional revaluations on a five yearly cycle, Council’s control systems have dependable data on the current state of assets. Therefore calculation of BTS is a simple calculation of the total value of EOL assets in year (x) less the value of renewals in that year compared to the total WDV of the asset class. For the LTFP period the Buildings and Other Structures network has a BTS measure of 0.0.
The Renewables Ratio communicates the preservation of asset integrity. Asset consumption as measured by depreciation reflects the loss of future service potential in infrastructure assets. In accordance with AASB 116 p60, Council estimates asset consumption most closely reflecting their real world deterioration rates. This increases the complexity of financial calculations and will ultimately focus attention on best practice maintenance and renewals programs to preserve asset integrity.
An ideal renewables ratio is 1.0. This simply means that the value of renewables in year (x) matches the consumption of asset in that year. The LTFP process has focused on a sustainable asset position at the end of 10 years across all community assets. This is reflected in improving Renewables Ratios each year. For the LTFP period, the Buildings and Other Structures network has a Renewables Ratio of 0.76, in effecting depleting the remaining service potential of assets by $0.5 mill per year or $5.1 million this LTFP. Council aims to achieve a general fund Renewables Ratio of 1.0 across the combined buildings, roads and stormwater classes. The net result is that Buildings and Other Structures and the Drainage networks’ suffer this LTFP with Roads and Traffic Management assets having higher priorities.

Page 22 of 30 Richmond Valley Council Buildings and Other Structures 2015-2025
Table 4.4.3: Capital Depreciation Values ($000)
Table 4.4.4: Capital Written Down Values ($000)
Buildings and Other Structures Assets Funding Profile The 10 year funding for Buildings and Other Structures capital works totals $19.6 million, $3.1 million or 16% for scheme augmentation and $16.5 million for renewals programs.
4.3 Asset Conditions Asset conditions are monitored on a rotating asset class schedule. This is a recent development at Council and it ensures that all assets will receive an observational rating once every five years. The road network of assets were rated in 2012, stormwater in 2014 and land and building assets in 2015. The condition profile of our Buildings and Other Structures assets is shown in Figure 4.5. 58.3% of Council assets have a current condition rating of 1 or 2 generally reflecting a network in average condition.
Figures 4.5 and 4.5.1 illustrate the current condition profile for each asset type as a percentage with the black diamond showing the average condition (right hand scale) for each asset. Using Structural Shells as an example in 2014, 22% of assets have a condition rating of 1 or 2 and only 6% are rated condition 5, the black diamond indicating an average condition of 3.2. By 2025 21% of assets have a condition rating of 1 or 2 while 28% are rated condition 5, resulting in a weighted average condition of 3.7. This will have an impact on Council’s capacity to adequately fund its renewables ratio.

Page 23 of 30 Richmond Valley Council Buildings and Other Structures 2015-2025
Figure 4.5: Asset Condition Rating Profile
Figure 4.5.1: Asset Condition Rating Profile

Page 24 of 30 Richmond Valley Council Buildings and Other Structures 2015-2025
4.4 Financial Summary Council’s operates the Buildings and Other Structures as a component of the general fund with a restricted reserves fund to meet Capex under and over expenditure requirements. Council revenue streams include access and usage charges, grants revenue, developer service charges and interest on restricted reserves. OpEx include operations, maintenance and management activities. Capex includes renewals program, improved LoS programs and augmentation programs. Table 4.6 provides a summary of cash flows for 20 years.
Table 4.6: Projected Operating and Capital Expenditure ($000)
Cash flow predictions are based on current business expectations with 5% as the indicator for revenue streams and 3% for expense streams. Developer service pricing also provide some uncertainty for revenue flows. The LWU business demonstrates a healthy state over the forward LTFP period.
Funding for Buildings and Other Structures includes operating budgets, capital grants and contributions and internal transfers from the restricted general fund. This means a shortfall is balanced by transfers from restricted assets and a surplus will result in a transfer to restricted assets.
Operating expenditure (OpEx) includes operations, maintenance and management activities (OMA). Capital expenditure (Capex) includes renewals program, improved LOS programs and augmentation programs. Asset Lifecycle profiles for Buildings and Other Structures is shown in Figure 4.7. The balance of funding for Buildings and Other Structures represents transfers from the general reserve fund. Annual consumption of assets (depreciation) is shown on the right axis.
Asset Lifecycle profiles for Buildings and Other Structures are shown in Figure 4.7. This illustrates the flow of funds for operating and capital expenditures over the forward period. Annual consumption of assets (depreciation) is shown on the right axis.

Page 25 of 30 Richmond Valley Council Buildings and Other Structures 2015-2025
Figure 4.7: Projected OpEx and Capex
4.5 Sustainability of Service Delivery There are four key indicators for service delivery sustainability that have been considered in the analysis of the services provided by this asset category, these being the asset renewal funding ratio, long term life cycle costs/expenditures and medium term projected/budgeted expenditures over five and 10 years of the planning period.
Asset Renewal Funding Ratio5 - 0.77 The Asset Renewal Funding Ratio is the most important indicator and reveals that over the next 10 years, Council is forecasting that it will have 77% of the funds required for the optimal renewal and replacement of its assets.
Long term - Life Cycle Cost Life Cycle Costs (or whole of life costs) are the average costs that are required to sustain the service levels over the asset life cycle. Life Cycle Costs include operations and maintenance expenditure and asset consumption (depreciation expense).
Life Cycle Costs can be compared to life cycle expenditure to give an initial indicator of affordability of projected service levels when considered with age profiles. Life cycle expenditure includes operations, maintenance and capital renewal expenditure. Life cycle expenditure will vary depending on the timing of asset renewals. The life cycle expenditure over the 10 year planning period is $3.9 million per year (average operations and maintenance plus capital renewal budgeted expenditure in LTFP over 10 years). The 10 year Average LTCM indicator is $3.9 million per year
5 AIFMG, 2012, Version 1.3, Financial Sustainability Indicator 4, Sec 2.6, p 2.16

Page 26 of 30 Richmond Valley Council Buildings and Other Structures 2015-2025
A shortfall between Life Cycle Costs and life cycle expenditure is the life cycle gap. The life cycle gap for services covered by this asset management plan is $0 per year (negative = gap, positive = surplus).
10 Year AM Financial Indicator - Life cycle expenditure is 100% of life cycle costs. The Life Cycle Costs and life cycle expenditure comparison highlights any difference between present outlays and the average cost of providing the service over the long term. If the life cycle expenditure is less than that Life Cycle Costs, it is most likely that outlays will need to be increased or cuts in services made in the future.
Knowing the extent and timing of any required increase in outlays and the service consequences if funding is not available will assist organisations in providing services to their communities in a financially sustainable manner. This is the purpose of the asset management plans and long term financial plan.
Medium term – 10 year financial planning period This AMP identifies the projected operations, maintenance and capital renewal expenditures required to provide an agreed LoS to the community over a 10 year period. This provides input into 10 year financial and funding plans aimed at providing the required services in a sustainable manner.
These projected expenditures may be compared to budgeted expenditures in the 10 year period to identify any funding shortfall. In a core AMP, a gap is generally due to increasing asset renewals for ageing assets.
Medium Term – 5 year financial planning period The projected operations, maintenance and capital renewal expenditure required over the first five years of the planning period is $4.7 million on average per year.
Estimated (budget) operations, maintenance and capital renewal funding is $4.7 million on average per year giving a five year average funding surplus of $0. This indicates that Council expects to have 100% of projected expenditures required to provide the services shown in this AMP.
Providing services from infrastructure in a sustainable manner requires the matching and managing of service levels, risks, projected expenditures and financing to achieve a financial indicator of approximately 1.0 for the first years of the AMP and ideally over the 10 year life of the LTFP.
Long Term Financial Plan Works Program Council’s LTCW program has an 11 year (current Budget plus LTFP) figure of $42.7 million for the Buildings and Other Structures program. The asset register indicates $16.7 million of assets or 84% of the program will be renewals over the forward planning period. The balance of the program is divided 75% into improved levels of service and 25% for scheme augmentation. Therefore 12% of the program or $2.3 million is for LoS improvements and 4% or $775,000 is for scheme augmentations over the planning period.

Page 27 of 30 Richmond Valley Council Buildings and Other Structures 2015-2025
5. Risk Management Asset management is about managing strategic and operational risks. The greatest strategic risk is whether a Council is sustainable. Efficient asset management contributes to risk minimisation by providing reliable and relevant information to decision makers. Risk management is the demonstrated commitment to understand problems, to classify sensitivities, to prioritise solutions and to contain the adverse consequences of threats to an acceptable level.
A primary consideration when selecting risk protection and practices is to ensure that the costs incurred are not greater than the benefits gained. Factors affecting risk include the consequences of service failure, identification of significant and critical assets, and options to mitigate impact or reduce harm.
Risks are generally identified and classified by the consensus approach through workshops or risk management tools (risk spectrum or risk matrix approach). These tools systematically quantify risk attributes into a risk factor, economic deprival, social disruption or environmental impact. Risk is associated with consequences completely enumerated in terms of probability. The consensus approach seeks answers to the types and source of risk, severity levels, possible outcomes and the scale of impact. Advanced techniques include ‘what if’ scenario type answers that seek to describe varying effects of events affecting a few customers through to widespread and unacceptable community risks.
6. Plan Improvement and Monitoring Asset systems is an outward function which interacts across the organisation and attempts to consolidate operational plans, risk management plans, business continuity planning, emergency response planning with higher level strategic and governance objectives. Overall the function is still developing and seeking regular appropriate input from the various asset delivery areas of Council which remain focused on their primary objectives.
This restricts some asset planning outcomes but will rise in importance when quality AMPs align with higher strategic goals and provide a clear line of sight between operational, maintenance and asset rehabilitation initiatives. It is the intention of Council to ensure that the practices documented within the Asset Plans are a prime focus of culture within the workplace, so that the links from service delivery to long term strategic plans remain strong
6.1 Accounting Standards and Regulations In accounting for Council’s assets, the following statutory requirements shall be adhered to: Ø NSW Local Government Act 1993, Ø NSW Code of Accounting Practice and Financial Reporting (updated annually), Ø Australian Accounting Standards, UIG Consensus Views and other prescribed requirements and
standards, Ø AASB 13 Fair Value Measurement, Ø AASB 116 Property Plant and Equipment, Ø AASB 5 Assets Held for Sale, and Ø AASB 136 Impairment.

Page 28 of 30 Richmond Valley Council Buildings and Other Structures 2015-2025
6.2 Asset management system Council operates an integrated SQL based Asset Management System. The core programs include MapInfo a GIS asset information system and Asset Master, an Asset hierarchy and financial movements register. The programs are supported by MS office programs and information provided by Councils financial management systems. The financial systems are primarily managed by Council’s financial section. It is the responsibility of all persons with expenditure roles to ensure that costing is allocated to the correct account numbers so that financial reporting will be accurate and reliable.
The strength of the Asset Master process is the unique identifiers for each asset, accurate plans for work teams and detailed financial history of individual assets. Council has expanded its asset management and asset data team given the expansive task of data entry and data management. This is a continuing process that will produce more insight and accuracy into asset conditions, predictive strategies and financial observations.
Asset registers Council utilises the Asset Master system from Open Office Australia. This system was deployed in 2012 and is continually being refined to produce quality asset information. Council systems are generally connected through an SQL server but often financial reporting is performed at a higher level. This is accomplished by excel reports exported by the various asset management and financial management systems.
All construction and maintenance costs are recorded in the Technology 1 Financial Management System. Capital costs are generally costed to a series of cost account numbers that can be related to a particular asset construction project. Personnel performing asset management system data functions require a high level of rounded numeracy and literacy skills. Although the functions have a high level of repetitive function primarily due to the scale of asset numbers accuracy is required with each process. Council systems are SQL driven requiring some scripting knowledge and also general abilities with financial data, accounting interpretations and knowledge of Australian Accounting Standards.
Required changes to asset management system arising from this AM Plan Council manages a wide range of physical assets. These assets provide a range of services to the Richmond Valley community. In order to better manage its assets, Council has implemented an Integrated Asset Management System (AMS) namely Asset Master by Open Office. Asset Master enables Council to collect and store asset data and to manage its infrastructure maintenance and replacement programs.
Council’s objectives in the implementation and consequent management of Asset Master are as follows: Ø To have a central repository for all asset data, Ø To undertake life cycle management of all Council asset categories, Ø To facilitate an asset management culture, Ø To reduce the overall costs and risks associated with Council assets, and Ø To provide the ability to add advanced asset management functionality as the Council matures with
respect to asset management.
Page 29 of 30 Richmond Valley Council Buildings and Other Structures 2015-2025
Monitoring and Review Procedures This AMP will be reviewed during annual budget planning processes and amended to recognise any material changes in service levels and/or resources available to provide these services as a result of budget decisions.
The AMP will be updated annually to ensure it represents the current service level, asset values, projected operations, maintenance, capital renewal and replacement, capital upgrade/new and asset disposal expenditures and projected expenditure values incorporated into Council’s LTFP.
The AMP has a life of four years (Council election cycle) and is due for a complete revision and updating within one year of each Council election.
Performance Measures The effectiveness of the asset management plan can be measured in the following ways: Ø The degree to which the required projected expenditures identified in this AMP are incorporated
into Council’s LTFP, Ø The degree to which 1-5 year detailed works programs, budgets, business plans and
organisational structures take into account the ‘global’ works program trends provided by the AMP, Ø The degree to which the existing and projected service levels and service consequences (what we
cannot do), risks and residual risks are incorporated into the Council’s Strategic Plan and associated plans, and
Ø The Asset Renewal Funding Ratio achieving the target of 1.0.

Page 30 of 30 Richmond Valley Council Buildings and Other Structures 2015-2025
7. References
IPWEA, 2006, ‘International Infrastructure Management Manual’, Institute of Public Works Engineering Australia, Sydney, www.ipwea.org/IIMM
IPWEA, 2008, ‘NAMS.PLUS Asset Management’, Institute of Public Works Engineering Australia, Sydney, www.ipwea.org/namsplus.
IPWEA, 2009, ‘Australian Infrastructure Financial Management Guidelines’, Institute of Public Works Engineering Australia, Sydney, www.ipwea.org/AIFMG.
IPWEA, 2011, ‘International Infrastructure Management Manual’, Institute of Public Works Engineering Australia, Sydney, www.ipwea.org/IIMM
Richmond Valley Council, Community Strategic Plan 2013 – 2025’,
Richmond Valley Council Strategic Business Plan for Water Supply and Sewerage Services,
RVC Strategic Planning FINMOD Analysis and Tariff Review – Water Supply Services
Richmond Valley Council - Annual Plan and Budget