appendix a sampling and analysis results report report characterization of the sediment for the...
TRANSCRIPT
APPENDIX A Sampling and Analysis Results Report

1/99

DATA REPORT
Characterization of the Sediment for the Removal of a Wastewater Outfall Pipeline Located in Hercules, CA:
Sampling and Analysis Results
Prepared for
Boudreau Associates LLC 327 Jersey Street
San Francisco, CA 94114
Prepared by
Pacific EcoRisk
2250 Cordelia Road Fairfield, CA 94534
April 2013
2/99
Pacific EcoRisk Environmental Consulting and Testing
i
Table of Contents Page
1. INTRODUCTION ...................................................................................................................... 1 1.1 Objectives of the Sediment Investigation ............................................................................. 1 1.2 Organization of this Document ............................................................................................ 1
2. FIELD SEDIMENT SAMPLE COLLECTION ......................................................................... 6 3. SAMPLE PROCESSING ......................................................................................................... 10
3.1 Homogenization and Compositing of Sediments ............................................................... 10 3.2 Shipping of Sediment Samples to the Analytical Laboratories .......................................... 10
3.2.1 Chain-of-Custody (COC) Protocol .............................................................................. 10 4. ANALYTICAL CHEMISTRY RESULTS .............................................................................. 11
4.1 HP-Comp Composite Analytical Chemistry Results ......................................................... 11 5. BIOLOGICAL TESTING RESULTS ...................................................................................... 17
5.1 Sediment Porewater Characterization ................................................................................ 17 5.2 Water Column (Sediment Elutriate) Toxicity Testing ....................................................... 17
5.2.1 Toxicity of Sediment Elutriates to Americamysis bahia .............................................. 18 5.2.1.1 Reference Toxicant Toxicity to Americamysis bahia ........................................... 18
6. QUALITY CONTROL REVIEW ............................................................................................ 19 6.1 Sediment Conventional and Chemical Analytical QA/QC Summary ................................ 19 6.2 Biological Testing Quality Lab Control Summary ............................................................ 19
7. SUMMARY .............................................................................................................................. 21 8. REFERENCES ......................................................................................................................... 22
3/99

Pacific EcoRisk Environmental Consulting and Testing
ii
Appendices Appendix A Sampling Field Logs and Data Sheets Appendix B Results of the Sediment Conventional and Chemical Analyses: Laboratory
Data Reports Submitted by Calscience Appendix C Test Data and Summary of Statistics for the Evaluation of the Toxicity of the
Hercules Pipeline Sediment Elutriate to Mysids (Americamysis bahia) Appendix D Test Data and Summary of Statistics for the Reference Toxicant Evaluation
of the Mysid, Americamysis bahia Appendix E Bioassay Standard Test Conditions
4/99

Pacific EcoRisk Environmental Consulting and Testing
iii
List of Figures Page
Figure 1-1. Location Map #1: Wastewater Outfall Pipeline Located in Hercules, CA .................. 2 Figure 1-2. Location Map #2: Wastewater Outfall Pipeline Located in Hercules, CA .................. 3 Figure 1-3. Vicinity Map #1: Wastewater Outfall Pipeline Located in Hercules, CA ................... 4 Figure 1-4. Vicinity Map #2: Wastewater Outfall Pipeline Located in Hercules, CA ................... 5 Figure 2-1. Wastewater Outfall Pipeline Sample Locations #1 ...................................................... 8 Figure 2-2. Wastewater Outfall Pipeline Sample Locations #2 ...................................................... 9
List of Tables Page
Table 2-1. Locations of Sampling Stations and Core Depths Achieved ......................................... 7 Table 4-1. Hercules Pipeline Sediment Grain Size, Total Solids, and Total Organic Carbon ..... 12 Table 4-2. Hercules Pipeline Sediment Metals Concentrations .................................................... 12 Table 4-5. Hercules Pipeline Sediment Organotin Concentrations .............................................. 12 Table 4-3. Hercules Pipeline Sediment PAH Concentrations ...................................................... 13 Table 4-6. Hercules Pipeline Sediment Organochlorine Pesticide Concentrations ...................... 14 Table 4-4. Hercules Pipeline Sediment PCB Congener Concentrations ...................................... 15 Table 5-1. Sediment Porewater Initial Water Ammonia Levels ................................................... 17 Table 5-2. Effects of HP-Comp Sediment Elutriate on Americamysis bahia. .............................. 18 Table 5-3. Reference Toxicant Testing: Effects of KCl on Americamysis bahia. ........................ 18
5/99

Pacific EcoRisk Environmental Consulting and Testing
iv
List of Acronyms
ASTM American Society for Testing and Materials Bay San Francisco Bay BCDC Bay Conservation and Development Commission Calscience Calscience Environmental Laboratories, Inc. COC Chain-of-custody CV Coefficient of variation DMMO Dredged Material Management Office DU Dredge unit EC50 50% Effect Concentration ESC Elutriate Suitability Concentrations GPS Global positioning system HLLC Hercules LLC HDPE High density polyethylene ITM Inland Testing Manual LC/LCSD Laboratory Control/Laboratory Control Spike Duplicate LC50 50% Lethality Concentration MET Modified elutriate test MDL Method detection limit mg/Kg Milligram per kilogram mg/L Milligram per liter MLLW Mean lower low water MOT Marine Oil Terminal MRL Method reporting limits PAH Polycyclic aromatic hydrocarbons PCB Polychlorinated biphenyls PER Pacific EcoRisk, Inc. PRC Pacific Refining Co. Prologis Prologis L.P. QA/QC Quality assurance/quality control RL Reporting limit RPD Relative percent difference SFRWQCB San Francisco Regional Water Quality Control Board SLC State Lands Commission
6/99

Pacific EcoRisk Environmental Consulting and Testing
v
SOP Standard operating procedures SUAD Suitable for unconfined aquatic disposal TOC Total organic carbon TSS Total suspended solids USACE U.S. Army Corps of Engineers USEPA U.S. Environmental Protection Agency WQO Water quality objectives
7/99

Pacific EcoRisk Environmental Consulting and Testing
1
1. INTRODUCTION Prologis L.P. (Prologis) seeks authorization to remove an existing 8-inch wastewater outfall pipeline from leased property located in Hercules, CA (Figure 1-1 through 1-4). On behalf of Prologis, Boudreau Associates has contracted Pacific EcoRisk (PER) to perform sediment characterization in the vicinity of the pipeline to support pipeline removal activities. This sampling and testing program was performed in support of CEQA analysis and permitting to assess sediment quality and potential impacts related to removing the pipeline due to sediment resuspension. In order to assess whether resuspended sediments will represent an adverse impact during pipe removal operations and per the approved Sampling and Analysis Plan (PER 2013), field personnel collected sediment cores approximately 1 foot below the estimated pipeline depth or refusal along the length of the buried portion of the pipeline. In areas where the pipeline is exposed, surface samples were collected using a Van-Veen sampler. A composite sample comprising equal portions of the sediment cores and surface sediment samples was then submitted for chemical and biological analysis as per the SAP (PER 2013). The remainder of the composite sample was archived for subsequent analysis, if needed. This Data Report has been prepared to provide the required characterization of these sediments. 1.1 Objectives of the Sediment Investigation The purpose of this sampling and testing was to evaluate sediments in the vicinity of the pipeline (Figure 1-4) to determine whether resuspended sediments will represent an adverse impact during pipe removal operations. The procedures for sediment sample collection, sample processing and preparation, physical and chemical analyses, biological testing and data analyses were presented in a previously approved Sampling and Analysis Plan (PER 2013). The specific objectives of the SAP scope-of-work were as follows:
• Collect sediment core and sediment surface samples from within the designated sampling areas following field protocol detailed in the SAP (PER 2013); and
• Conduct chemical and biological analyses of the collected sediments to determine whether resuspended sediment will represent an adverse impact during pipe removal operations.
1.2 Organization of this Document Sample collection and handling procedures are discussed in Sections 2 and 3. Results of chemical analyses and biological toxicity testing are provided in Sections 4 and 5. Section 6 discusses quality control and Section 7 presents whether resuspended sediments will represent an adverse impact during pipe removal operations.
8/99

Pacific EcoRisk Environmental Consulting and Testing
2
Figure 1-1. Location Map #1: Wastewater Outfall Pipeline Located in
Hercules, CA
9/99

Pacific EcoRisk Environmental Consulting and Testing
3
Figure 1-2. Location Map #2: Wastewater Outfall Pipeline Located in
Hercules, CA
10/99

Pacific EcoRisk Environmental Consulting and Testing
4
Figure 1-3. Vicinity Map #1: Wastewater Outfall Pipeline Located in
Hercules, CA
11/99
Pacific EcoRisk Environmental Consulting and Testing
5
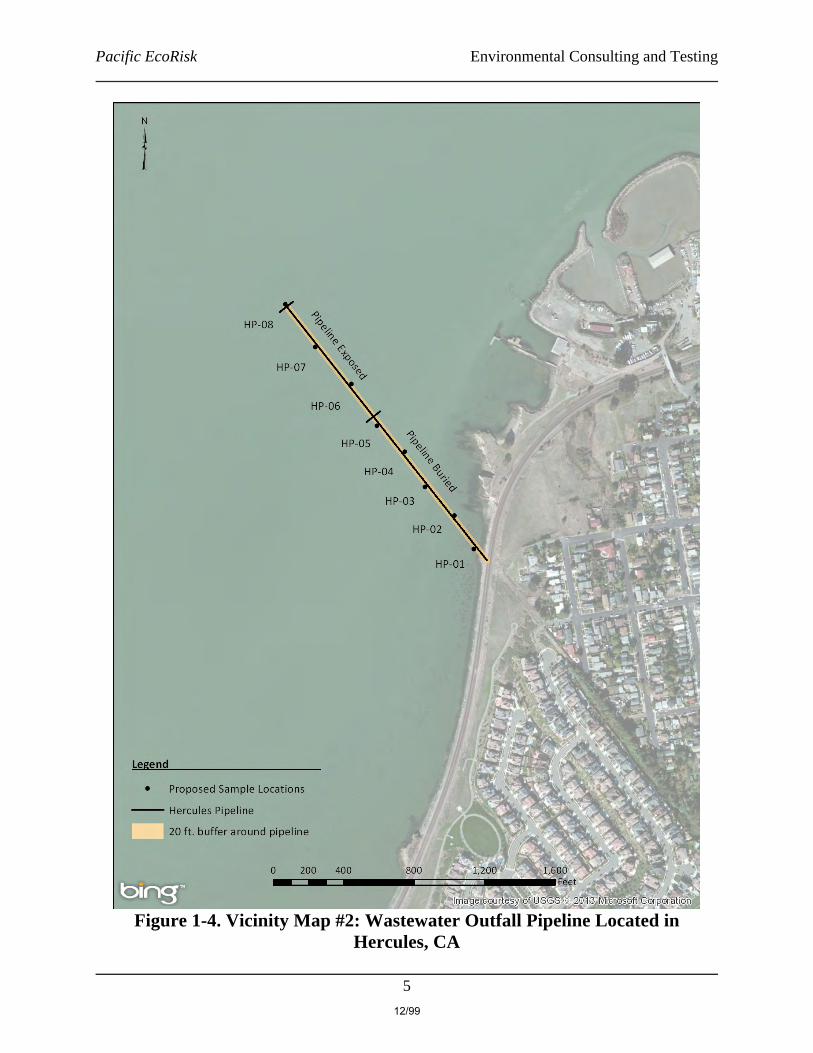
Figure 1-4. Vicinity Map #2: Wastewater Outfall Pipeline Located in
Hercules, CA
12/99
Pacific EcoRisk Environmental Consulting and Testing
6
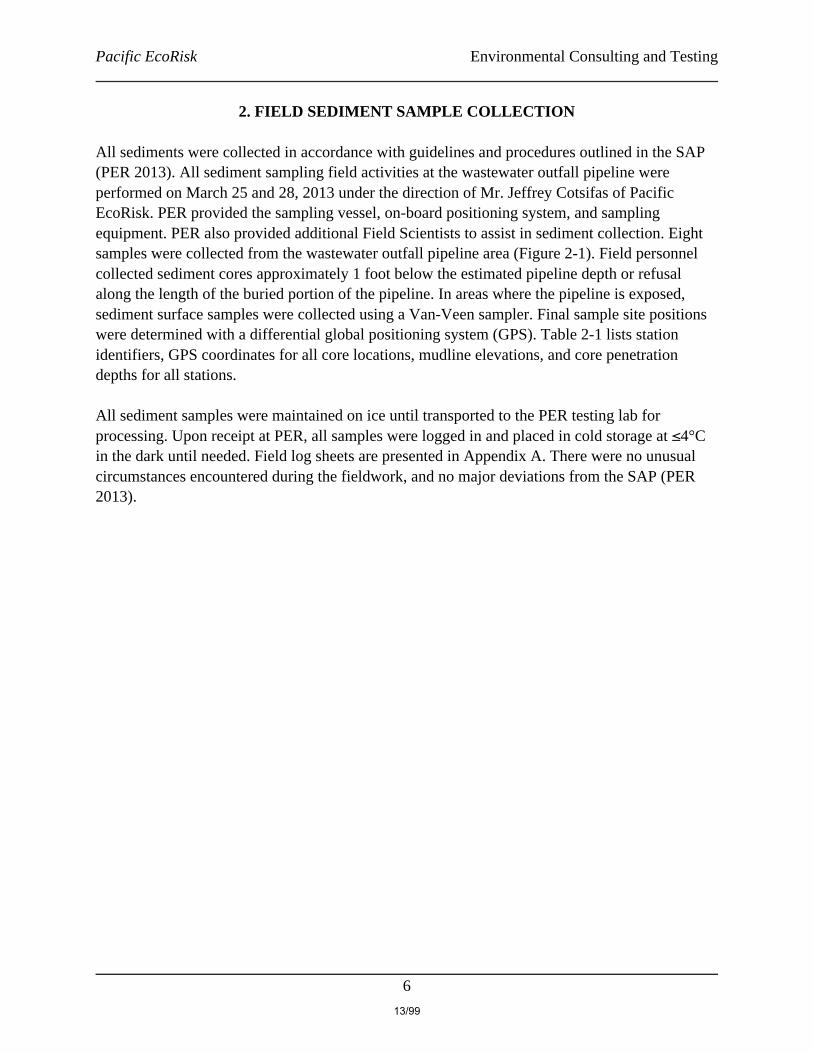
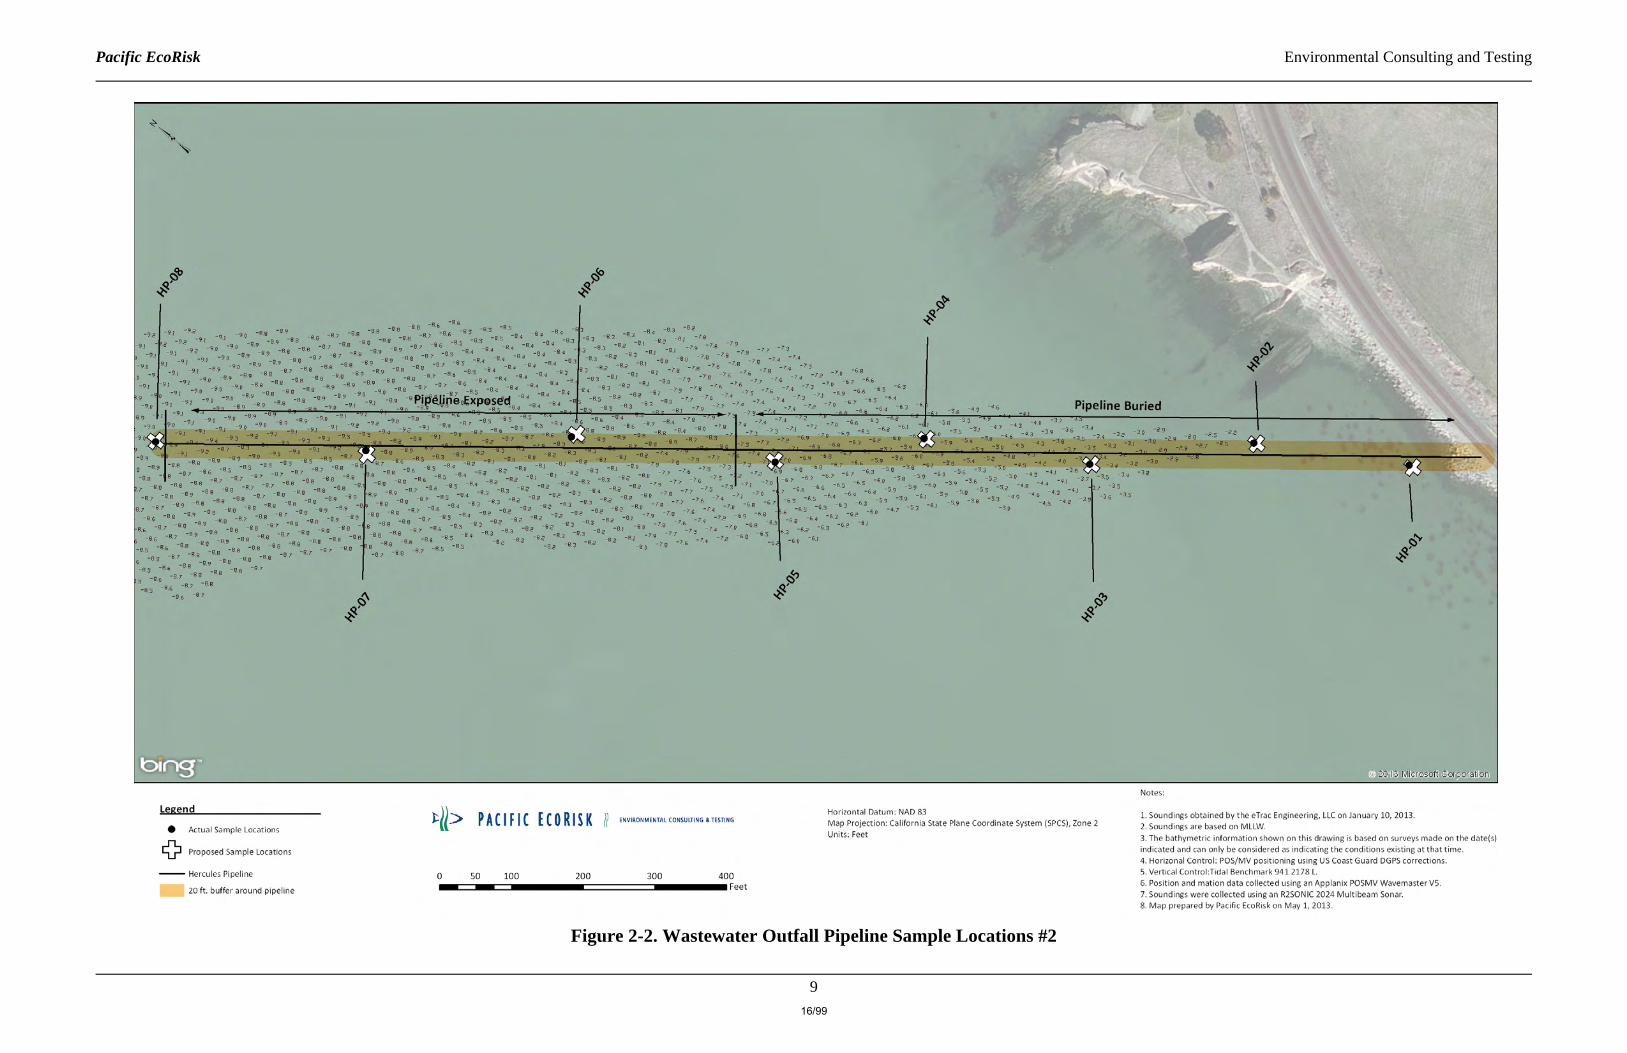
2. FIELD SEDIMENT SAMPLE COLLECTION All sediments were collected in accordance with guidelines and procedures outlined in the SAP (PER 2013). All sediment sampling field activities at the wastewater outfall pipeline were performed on March 25 and 28, 2013 under the direction of Mr. Jeffrey Cotsifas of Pacific EcoRisk. PER provided the sampling vessel, on-board positioning system, and sampling equipment. PER also provided additional Field Scientists to assist in sediment collection. Eight samples were collected from the wastewater outfall pipeline area (Figure 2-1). Field personnel collected sediment cores approximately 1 foot below the estimated pipeline depth or refusal along the length of the buried portion of the pipeline. In areas where the pipeline is exposed, sediment surface samples were collected using a Van-Veen sampler. Final sample site positions were determined with a differential global positioning system (GPS). Table 2-1 lists station identifiers, GPS coordinates for all core locations, mudline elevations, and core penetration depths for all stations. All sediment samples were maintained on ice until transported to the PER testing lab for processing. Upon receipt at PER, all samples were logged in and placed in cold storage at ≤4°C in the dark until needed. Field log sheets are presented in Appendix A. There were no unusual circumstances encountered during the fieldwork, and no major deviations from the SAP (PER 2013).
13/99
Pacific EcoRisk Environmental Consulting and Testing
7
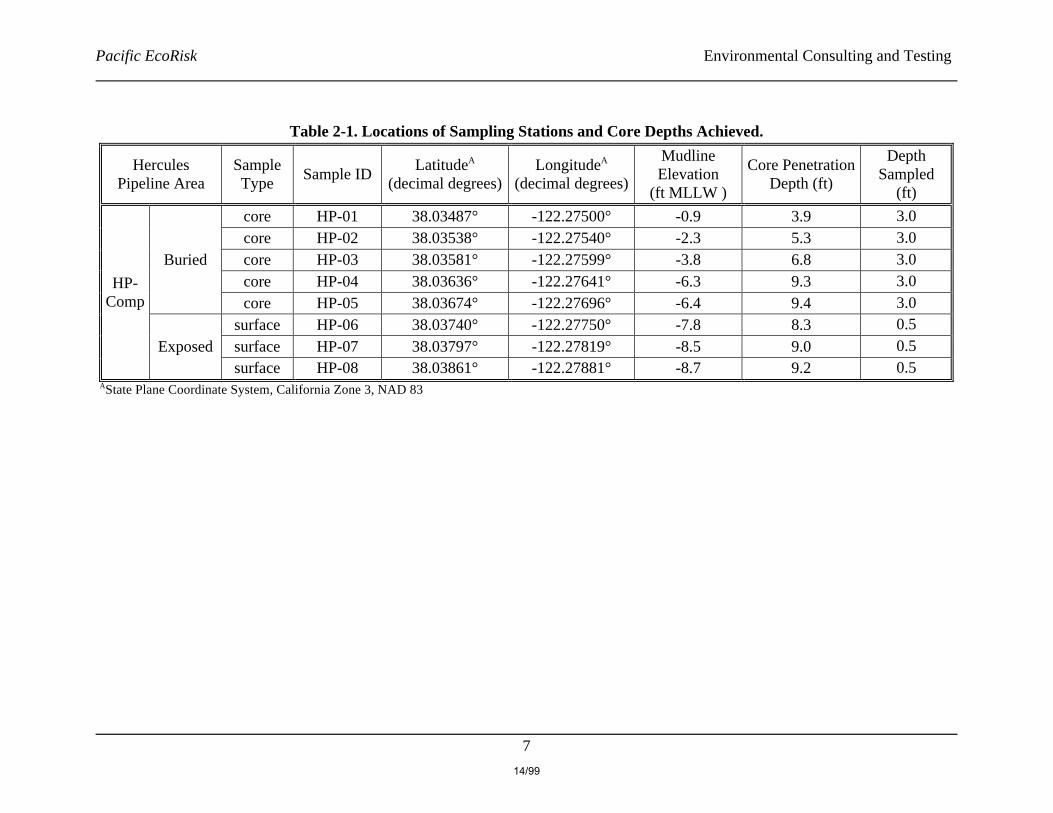
Table 2-1. Locations of Sampling Stations and Core Depths Achieved.
Hercules Pipeline Area
Sample Type Sample ID LatitudeA
(decimal degrees) LongitudeA
(decimal degrees)
Mudline Elevation
(ft MLLW )
Core Penetration Depth (ft)
Depth Sampled
(ft)
HP-Comp
Buried
core HP-01 38.03487° -122.27500° -0.9 3.9 3.0 core HP-02 38.03538° -122.27540° -2.3 5.3 3.0 core HP-03 38.03581° -122.27599° -3.8 6.8 3.0 core HP-04 38.03636° -122.27641° -6.3 9.3 3.0 core HP-05 38.03674° -122.27696° -6.4 9.4 3.0
Exposed surface HP-06 38.03740° -122.27750° -7.8 8.3 0.5 surface HP-07 38.03797° -122.27819° -8.5 9.0 0.5 surface HP-08 38.03861° -122.27881° -8.7 9.2 0.5
AState Plane Coordinate System, California Zone 3, NAD 83
14/99

Pacific EcoRisk Environmental Consulting and Testing
8
Figure 2-1. Wastewater Outfall Pipeline Sample Locations #1
15/99
Pacific EcoRisk Environmental Consulting and Testing
9
Figure 2-2. Wastewater Outfall Pipeline Sample Locations #2
16/99

Pacific EcoRisk Environmental Consulting and Testing
10
3. SAMPLE PROCESSING 3.1 Homogenization and Compositing of Sediments Homogenization and compositing of individual sediment samples were performed at the PER laboratory facility in Fairfield, CA. The sediment from each individual sediment sample was individually homogenized in a stainless-steel bowl. A 500-mL sub-sample of the homogenized sediment from each individual sediment sample was archived to allow for additional chemical analyses, if necessary; archived samples were stored frozen at -20 ± 10˚C for up to one [1] year after sample collection. Proportionate amounts of the homogenized sediment from each of the Hercules pipeline individual sediment samples were composited and homogenized within a stainless steel container to form the “HP-Comp” composite sediment. A sub-sample of the HP-Comp sample was frozen for archival storage as described above. Samples of the composited sediments were submitted for chemical and conventional analyses and toxicity testing. All sediment was processed following procedures outlined in the SAP (PER 2013), with no deviations. 3.2 Shipping of Sediment Samples to the Analytical Laboratories Prior to shipping to the analytical laboratory, sample containers were wrapped in bubble wrap and securely packed inside a cooler with ice packs or crushed ice. A temperature blank was included in each cooler. The original signed chain-of-custody (COC) forms were placed in a sealed plastic bag and taped to the inside lid of the cooler. Appropriate packaging tape was wrapped completely around the cooler. A This Side Up arrow label was attached on each side of the cooler, a Glass-Handle with Care label was attached to the top of the cooler, and the cooler was sealed with custody seals on both the front and the back lid seams. Sediment samples were shipped by overnight delivery. The sub-contracting analytical laboratories are not to dispose of any samples for this project unless notified by PER in writing. 3.2.1 Chain-of-Custody (COC) Protocol COC procedures were followed for all samples throughout the collection, handling, and analyses activities. The Sampling and Analysis Project Manager, or a designee, was responsible for all sample tracking and COC procedures. This person was responsible for final sample inventory, maintenance of sample custody documentation, and completion of COC forms prior to transferring samples to the analytical laboratory. A COC form accompanied each cooler of samples to the respective analytical laboratories. Each custodian of the samples signed the COC form; copies of the COC forms are retained in the project file.
17/99

Pacific EcoRisk Environmental Consulting and Testing
11
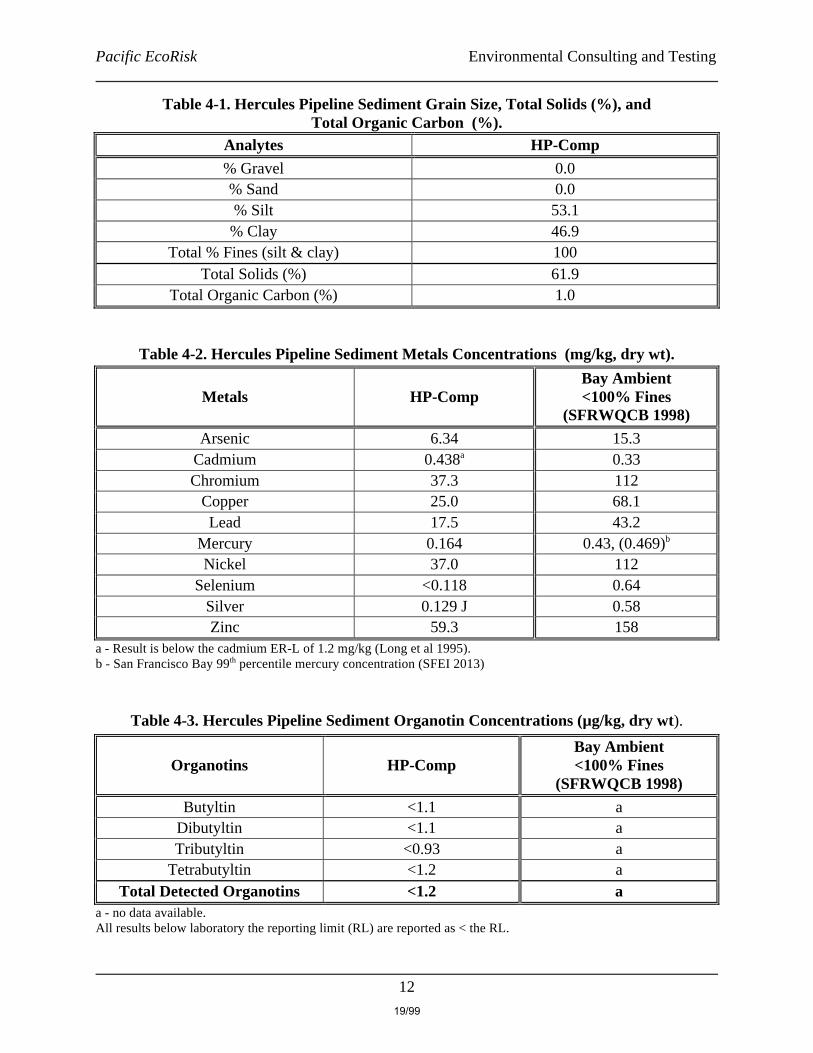
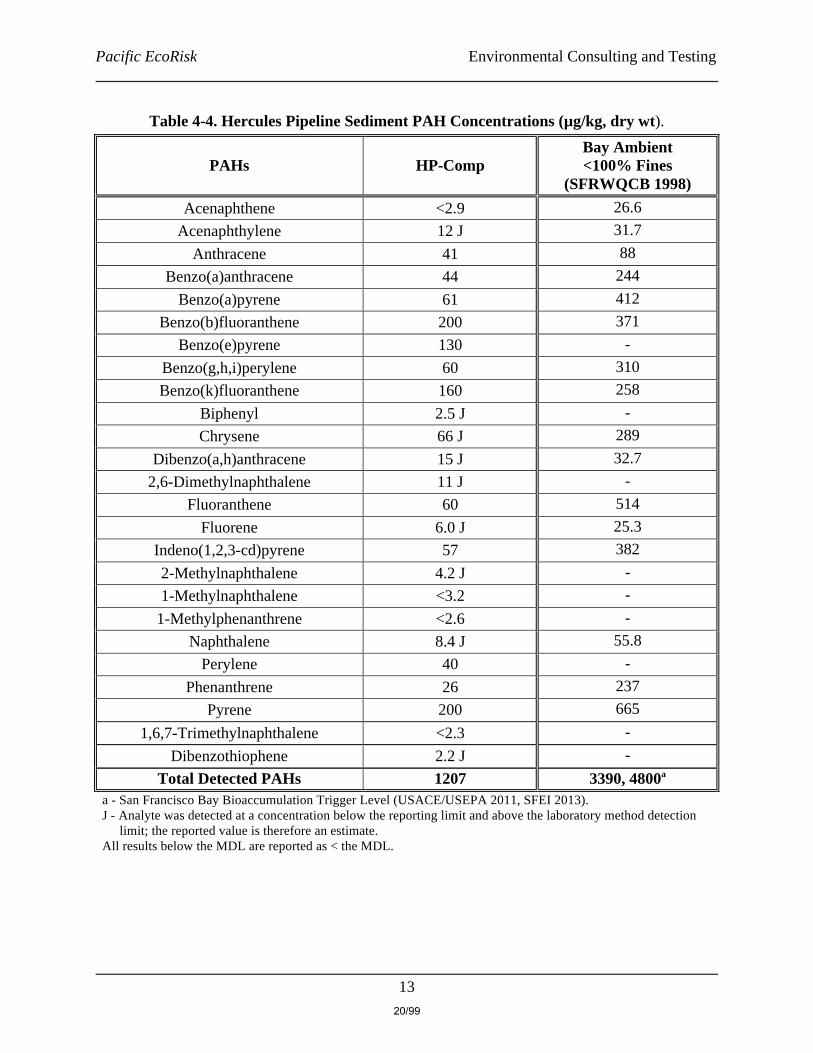
4. ANALYTICAL CHEMISTRY RESULTS The sediment samples were analyzed by Calscience for the conventional and chemical parameters specified in the SAP (PER 2013). Conventional parameters included total organic carbon (TOC), total solids, and grain size. Chemical analyses included trace metals, polychlorinated biphenyls (PCBs), polycyclic aromatic hydrocarbons (PAHs), chlorinated pesticides, and butyltins. The results of these analyses are presented in Section 4.1; the full Data Reports are provided in Appendix B. Sediment physical and chemical characteristics provide information about chemicals of concern present in the sediment and their potential bioavailability, and about non-chemical factors that could affect toxicity. The results of the physical and chemical analyses of the sediments were compared to Bay Ambient sediment concentrations (SFRWQCB 1998). Analytical results are summarized in Tables 4-1 through 4-6. 4.1 HP-Comp Composite Analytical Chemistry Results The “HP-Comp” site sediment was ~61.9% total solids, and was 100% fines (silts and clays). TOC levels were moderate (1.0%). All of the metal analytes for the HP-Comp sediments were generally similar to or below San Francisco Bay (SF Bay) background levels (SFRWQCB 1998). While the cadmium level was slightly above SF Bay background levels, it was below the cadmium Effects Range-Low (ER-L) of 1.2 mg/kg (Long et al 1995) and is unlikely to cause an adverse biological effect. Organotins and organochlorine pesticides were below their respective MDLs. Total PAHs, total PCBs, and total DDTs were reported at 1,207 µg/kg, 19.3 µg/kg and 0 µg/kg, respectively; each was below SF Bay background levels (SFRWQCB 1998).
18/99
Pacific EcoRisk Environmental Consulting and Testing
12
Table 4-1. Hercules Pipeline Sediment Grain Size, Total Solids (%), and Total Organic Carbon (%).
Analytes HP-Comp % Gravel 0.0 % Sand 0.0 % Silt 53.1 % Clay 46.9
Total % Fines (silt & clay) 100 Total Solids (%) 61.9
Total Organic Carbon (%) 1.0
Table 4-2. Hercules Pipeline Sediment Metals Concentrations (mg/kg, dry wt).
Metals HP-Comp Bay Ambient <100% Fines
(SFRWQCB 1998) Arsenic 6.34 15.3
Cadmium 0.438a 0.33 Chromium 37.3 112
Copper 25.0 68.1 Lead 17.5 43.2
Mercury 0.164 0.43, (0.469)b Nickel 37.0 112
Selenium <0.118 0.64 Silver 0.129 J 0.58 Zinc 59.3 158
a - Result is below the cadmium ER-L of 1.2 mg/kg (Long et al 1995). b - San Francisco Bay 99th percentile mercury concentration (SFEI 2013)
Table 4-3. Hercules Pipeline Sediment Organotin Concentrations (µg/kg, dry wt).
Organotins HP-Comp Bay Ambient <100% Fines
(SFRWQCB 1998) Butyltin <1.1 a
Dibutyltin <1.1 a Tributyltin <0.93 a
Tetrabutyltin <1.2 a Total Detected Organotins <1.2 a
a - no data available. All results below laboratory the reporting limit (RL) are reported as < the RL.
19/99
Pacific EcoRisk Environmental Consulting and Testing
13
Table 4-4. Hercules Pipeline Sediment PAH Concentrations (µg/kg, dry wt).
PAHs HP-Comp Bay Ambient <100% Fines
(SFRWQCB 1998) Acenaphthene <2.9 26.6
Acenaphthylene 12 J 31.7 Anthracene 41 88
Benzo(a)anthracene 44 244 Benzo(a)pyrene 61 412
Benzo(b)fluoranthene 200 371 Benzo(e)pyrene 130 -
Benzo(g,h,i)perylene 60 310 Benzo(k)fluoranthene 160 258
Biphenyl 2.5 J - Chrysene 66 J 289
Dibenzo(a,h)anthracene 15 J 32.7 2,6-Dimethylnaphthalene 11 J -
Fluoranthene 60 514 Fluorene 6.0 J 25.3
Indeno(1,2,3-cd)pyrene 57 382 2-Methylnaphthalene 4.2 J - 1-Methylnaphthalene <3.2 -
1-Methylphenanthrene <2.6 - Naphthalene 8.4 J 55.8
Perylene 40 - Phenanthrene 26 237
Pyrene 200 665 1,6,7-Trimethylnaphthalene <2.3 -
Dibenzothiophene 2.2 J - Total Detected PAHs 1207 3390, 4800a
a - San Francisco Bay Bioaccumulation Trigger Level (USACE/USEPA 2011, SFEI 2013). J - Analyte was detected at a concentration below the reporting limit and above the laboratory method detection
limit; the reported value is therefore an estimate. All results below the MDL are reported as < the MDL.
20/99
Pacific EcoRisk Environmental Consulting and Testing
14
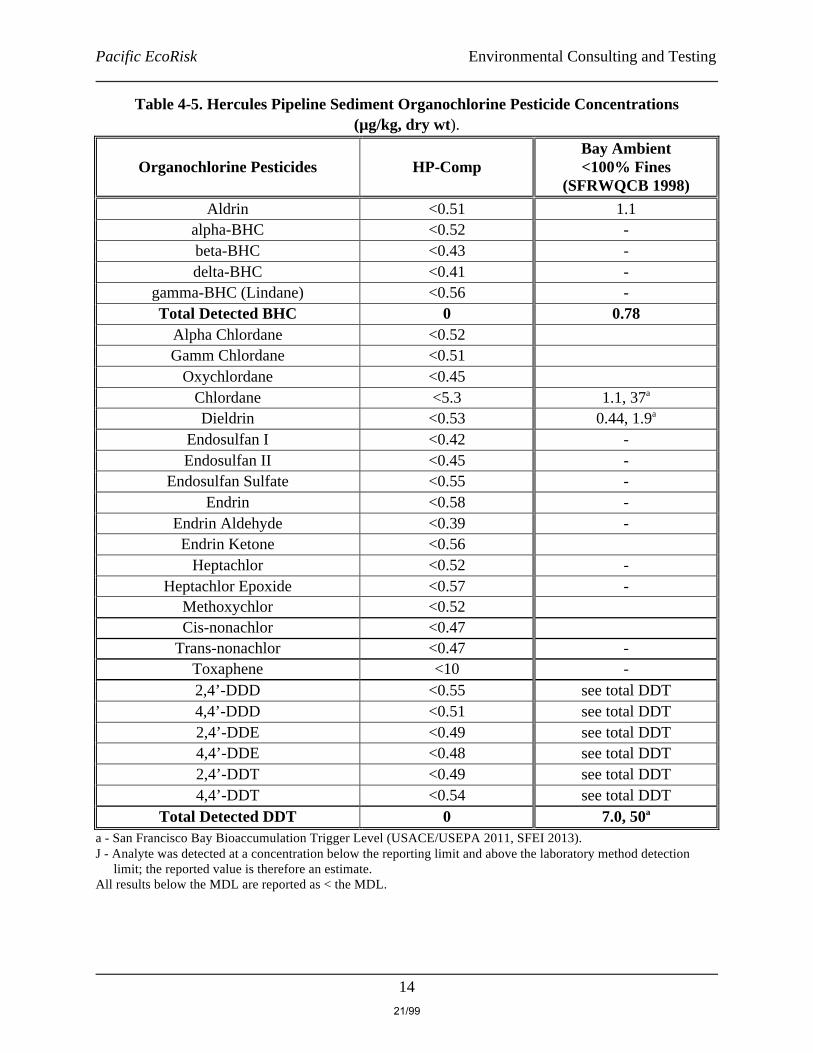
Table 4-5. Hercules Pipeline Sediment Organochlorine Pesticide Concentrations (µg/kg, dry wt).
Organochlorine Pesticides HP-Comp Bay Ambient <100% Fines
(SFRWQCB 1998) Aldrin <0.51 1.1
alpha-BHC <0.52 - beta-BHC <0.43 - delta-BHC <0.41 -
gamma-BHC (Lindane) <0.56 - Total Detected BHC 0 0.78
Alpha Chlordane <0.52 Gamm Chlordane <0.51
Oxychlordane <0.45 Chlordane <5.3 1.1, 37a Dieldrin <0.53 0.44, 1.9a
Endosulfan I <0.42 - Endosulfan II <0.45 -
Endosulfan Sulfate <0.55 - Endrin <0.58 -
Endrin Aldehyde <0.39 - Endrin Ketone <0.56
Heptachlor <0.52 - Heptachlor Epoxide <0.57 -
Methoxychlor <0.52 Cis-nonachlor <0.47
Trans-nonachlor <0.47 - Toxaphene <10 - 2,4’-DDD <0.55 see total DDT 4,4’-DDD <0.51 see total DDT 2,4’-DDE <0.49 see total DDT 4,4’-DDE <0.48 see total DDT 2,4’-DDT <0.49 see total DDT 4,4’-DDT <0.54 see total DDT
Total Detected DDT 0 7.0, 50a a - San Francisco Bay Bioaccumulation Trigger Level (USACE/USEPA 2011, SFEI 2013). J - Analyte was detected at a concentration below the reporting limit and above the laboratory method detection
limit; the reported value is therefore an estimate. All results below the MDL are reported as < the MDL.
21/99
Pacific EcoRisk Environmental Consulting and Testing
15
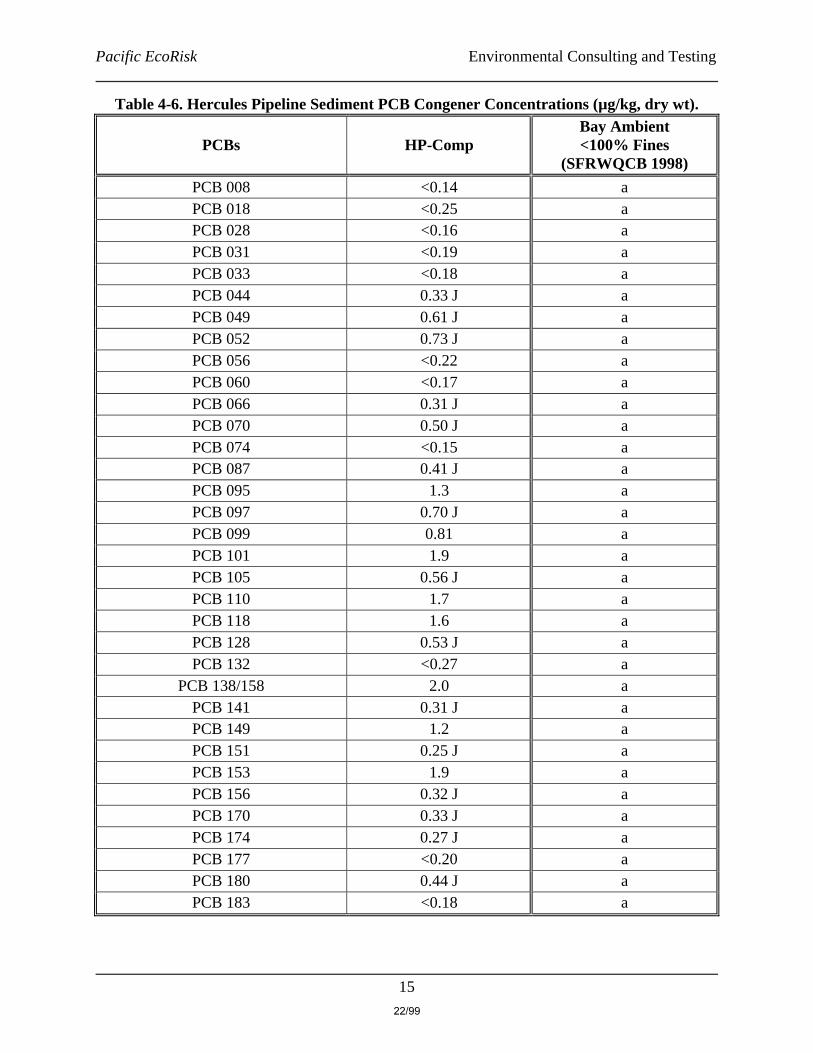
Table 4-6. Hercules Pipeline Sediment PCB Congener Concentrations (µg/kg, dry wt).
PCBs HP-Comp Bay Ambient <100% Fines
(SFRWQCB 1998) PCB 008 <0.14 a PCB 018 <0.25 a PCB 028 <0.16 a PCB 031 <0.19 a PCB 033 <0.18 a PCB 044 0.33 J a PCB 049 0.61 J a PCB 052 0.73 J a PCB 056 <0.22 a PCB 060 <0.17 a PCB 066 0.31 J a PCB 070 0.50 J a PCB 074 <0.15 a PCB 087 0.41 J a PCB 095 1.3 a PCB 097 0.70 J a PCB 099 0.81 a PCB 101 1.9 a PCB 105 0.56 J a PCB 110 1.7 a PCB 118 1.6 a PCB 128 0.53 J a PCB 132 <0.27 a
PCB 138/158 2.0 a PCB 141 0.31 J a PCB 149 1.2 a PCB 151 0.25 J a PCB 153 1.9 a PCB 156 0.32 J a PCB 170 0.33 J a PCB 174 0.27 J a PCB 177 <0.20 a PCB 180 0.44 J a PCB 183 <0.18 a
22/99

Pacific EcoRisk Environmental Consulting and Testing
16
Table 4-6. (continued) Hercules Pipeline Sediment PCB Congener Concentrations (µg/kg, dry wt).
PCBs HP-Comp Bay Ambient <100% Fines
(SFRWQCB 1998) PCB 187 0.25 J a PCB 194 <0.15 a PCB 195 <0.085 a PCB 201 <0.092 a PCB 203 <0.17 a
Total Detected PCBs 19.3d, 12.4e 22.7, 29.3b 17.0c a - No reference value has been established for the individual congeners; the Total Detected PCB congener reference value (SFRWQCB 1998) is used as a default value. b - San Francisco Bay 99th percentile PCB concentration (SFRWQCB 2013). c - San Francisco Bay Bioaccumulation Trigger Level (USACE/USEPA 2011, SFEI 2013). d - Summary includes J flagged data. e - Summary excludes J flagged data. J - Analyte was detected at a concentration below the reporting limit and above the laboratory method detection
limit; the reported value is therefore an estimate. All results below the MDL are reported as < the MDL.
23/99

Pacific EcoRisk Environmental Consulting and Testing
17
5. BIOLOGICAL TESTING RESULTS
A 96-hr mysid survival test with the mysid shrimp Americamysis bahia was performed for the site composite sample. These tests were performed following appropriate protocols as outlined in the SAP (PER 2013). Test data and summaries of the statistical analyses for the bioassay results are provided in Appendices C and D. Summaries of test conditions and test acceptability criteria are provided in Appendix E. 5.1 Sediment Porewater Characterization Prior to the initiation of the sediment tests, the sediments were removed from refrigerated storage, and each sample was re-homogenized in a large stainless steel bowl. Aliquots of the re-homogenized composite sediments were centrifuged at 2,500 g for 15 minutes; the resulting supernatant porewaters were carefully collected and analyzed for ammonia analysis (Table 5-1).
Table 5-1. Sediment Porewater Initial Water Ammonia Levels. Sample ID pH Total Ammonia (mg/L N) Total Sulfide (mg/L) HP-Comp 7.70 4.34 0.103
5.2 Water Column (Sediment Elutriate) Toxicity Testing The 96-hr survival test with A. bahia was performed on the sediment elutriate to determine whether resuspended sediments would represent an adverse impact during pipe removal operations. Positive and negative Lab Control treatments were tested concurrently with the site sediment elutriate. The positive Lab Control consisted of a ‘waterborne’ reference toxicant test; the results of these tests were compared to PER’s reference toxicant test response databases to determine whether these test organisms were responding to toxic stress in a typical fashion. The negative Lab Control (and dilution media) water for this test was prepared by adjustment of Type 1 lab water (reverse-osmosis, de-ionized water) to a salinity of 25 ppt using a commercial artificial sea salt (Crystal Sea Salt®-bioassay grade). As an additional QA measure, the site water that was collected from the same area as the sediment samples, and which was mixed with the sediments to prepare the 100% elutriates, was also tested. The test results for the sediment composite elutriate were compared with the test organism responses at the negative Lab Control treatment to determine the potential impact of suspended sediment resulting from the proposed pipeline removal on pelagic organisms in the near vicinity. The following criteria were used:
1. If the survival response in the 100% sediment elutriate treatment is ≥ the Control (clean seawater) treatment response(s), the sediment is not predicted to be acutely toxic to water column organisms.
2. If the reduction in survival response in the 100% sediment elutriate treatment relative to the Control treatment is ≤10%, there is no need for statistical analyses and no indication of water column toxicity attributable to the test sediments.
24/99

Pacific EcoRisk Environmental Consulting and Testing
18
3. If the reduction in survival response in the 100% sediment elutriate treatment relative to the Control treatment is >10%, then the data must be evaluated statistically to determine the magnitude of toxicity.
5.2.1 Toxicity of Sediment Elutriates to Americamysis bahia The results of this test are summarized below in Table 5-2. There was 100% survival at the Control treatment, indicating an acceptable survival response by the test organisms; there was 98% survival in the Site Water. There were no significant reductions in survival in any of the elutriate treatments; the No Observable Effect Concentratoin (NOEC) was 100% elutriate indicating that the 100% elutriate sample was not toxic to mysids. The test data and summary of statistical analyses for these tests are attached as Appendix C.
Table 5-2. Effects of HP-Comp Sediment Elutriate on Americamysis bahia.
Test Treatment Mean % Survival Lab Control 100
1% 98 10% 100 50% 100 100% 100
Site Water 98 Survival NOEC = 100% elutriatea Survival LC50 = >100% elutriatea
a - Due to the absence of significant impairment, the LC50 could not be calculated but can be determined by inspection to be >100% elutriate.
5.2.1.1 Reference Toxicant Toxicity to Americamysis bahia - The results of this test are presented in Table 5-3. There was 90% survival in the Lab Control treatment; the LC50 value was 0.68 g/L KCl, which is consistent with the typical response range established by the reference toxicant test database for this species, indicating that these test organisms were responding to toxic stress in a typical fashion. The test data and summary of statistical analyses for this test is attached as Appendix D.
Table 5-3. Reference Toxicant Testing: Effects of KCl on Americamysis bahia. KCl Treatment (g/L) Mean % Survival
Lab Control 90 0.125 97.5 0.25 97.5 0.5 90 1 0* 2 0*
LC50 = 0.68 g/L KCl Typical Response Range (mean ± 2 SD) = 0.39 – 0.80 g/L KCl
* The response at this test treatment was significantly less than the Lab Control treatment response at p < 0.05.
25/99

Pacific EcoRisk Environmental Consulting and Testing
19
6. QUALITY CONTROL REVIEW Any analyses that did not comply with the analytical laboratory QA/QC limits are presented below (also, see final analytical report in Appendix B for full case narrative). The QA/QC review entailed reviewing the contract lab Data Report(s) for sample integrity, correct methodology, and compliance with all appropriate Lab QA/QC requirements. The overall data quality assessment found that all data were usable. Appendix B contains the conventional and chemical analyses reports, which includes the contract laboratory QA/QC narrative. 6.1 Sediment Conventional and Chemical Analytical QA/QC Summary Calscience Report 13-04-0291 Metals – A trace level, below the reporting limit (RL) but above the method detection limit (MDL), of arsenic was found in the Method Blank. Also, the matrix spike (MS) recovery for lead and the matrix spike duplicate (MSD) recovery for zinc were outside the established control limits. Since the laboratory control sample (LCS) and laboratory control sample duplicate (LCSD) recoveries were within the control limits, the results were released with no further action. Organochlorine Pesticides – The relative percent differences (RPD) for 4,4’-DDT and methoxychlor and the MS recovery for methoxychlor were out of control. The results were flagged with the appropriate qualifiers and were released with no further action taken. Organotins – The MS recovery for tetrabutyltin was below the control limits. However, the results were released as is since the MSD, LCS, and LCSD recoveries were in control. PAHs – Trace levels, below the RL but above the MDL, of pyrene and 1-methylnaphthalene were found in the method blank. The MS/MSD recoveries for benzo(b)fluoranthene, benzo(k)fluoranthene, and pyrene were below the established control limits due to matrix interference. However, since the associated LCS and LCSD recoveries were in control, the results were released with no further action. The 2-fluorobiphenyl recovery was high in both samples. Since the other surrogate recoveries were in control, matrix interference is probable and so the data was released as is. 6.2 Biological Testing Quality Lab Control Summary The biological testing of the sediments incorporated standard QA/QC procedures to ensure that the test results were valid. Standard QA/QC procedures included the use of negative Lab Controls, positive Lab Controls, test replicates, and measurements of water quality during testing.
26/99

Pacific EcoRisk Environmental Consulting and Testing
20
Quality assurance procedures that were used for sediment testing are consistent with methods described in the U.S.EPA/ACOE (1998). Sediments for the bioassay testing were stored appropriately at ≤4°C and were used within the 8 week holding time period. Sediment interstitial water characteristics were within test acceptability limits at the start of the tests. The sediment elutriate was prepared using site water, Type 1 lab water (reverse-osmosis, de-ionized water) adjusted to a salinity of 25 ppt using a commercial artificial sea salt (Crystal Sea Salt®-bioassay grade) was used as the dilution medium. All measurements of routine water quality characteristics were performed as described in the PER Lab Standard Operating Procedures (SOPs). All biological testing water quality conditions were within the appropriate limits. Laboratory instruments were calibrated daily according to Lab SOPs, and calibration data were logged and initialed. Standard test conditions are presented in Appendix E. Negative Lab Control – The biological responses for all the test organisms at the negative Lab Control treatments were within acceptable limits for the sediment and sediment elutriate tests. Positive Lab Control – The reference toxicant test results were consistent with the “typical response” ranges established by the reference toxicant test database for this species, indicating that these organisms were responding to toxic stress in a typical and consistent fashion. Concentration Response Relationships - The concentration-response relationships for the sediment elutriate test and reference toxicant test was evaluated as per EPA guidelines (EPA-821-B-00-004), and were determined to be acceptable.
27/99

Pacific EcoRisk Environmental Consulting and Testing
21
7. SUMMARY The Hercules Pipeline sediments were analyzed to determine whether resuspended sediments would represent an adverse impact during pipe removal operations. Sediments will be archived for up to a year should additional site-specific analytical chemistry be required. All of the analytes for the HP-Comp sediment were generally similar to or below San Francisco Bay background levels (SFRWQCB 1998). It should be noted that cadmium was measured slightly above SF-Bay background levels; however, this concentration was below the cadmium ER-L (Long 1995) and is unlikely to cause an adverse biological effect. Additionally, the sediment elutriate test indicated that toxicity would not be expected sue to sediment resuspension during pipeline removal. Based on these results, the Hercules pipeline sediments would not represent an adverse impact during pipe removal operations.
28/99

Pacific EcoRisk Environmental Consulting and Testing
22
8. REFERENCES PER (2013) Sediment Characterization Sampling and Analysis Plan (SAP) for the Removal of a Wastewater Outfall Pipeline Located in Hercules, CA. Prepared for Boudreau Associates LLC. Prepared by Pacific EcoRisk, Fairfield, CA. Plumb RH, Jr (1981) Procedure for Handling and Chemical Analysis of Sediment and Water Samples. Technical Report U.S. EPA /CE-81-1, prepared by Great Lakes Laboratory, State University College at Buffalo, Buffalo, NY, for the U.S. Environmental Protection Agency/Corps of Army Engineer Waterways Experiment Station, Vicksburg, MS. Long, E. R., D. D. MacDonald, S. L. Smith, and F. D. Calder. 1995. Incidence of Adverse Biological Effects within Ranges of Chemical Concentrations in Marine and Estuarine Sediments. Environ. Manage. 19(1):81-97. SFRWQCB (1998) Ambient concentrations of toxic chemicals in San Francisco Bay Sediments: Draft Staff Report. San Francisco Regional Water Quality Lab Control Board, Oakland, CA. USACE (1985) Environmental Effects of Dredging: Technical Notes. US Army Engineer Waterways Experiment Station, Environmental Laboratory. Vicksburg, MS. US EPA/USACE (1995) QA/QC Guidance for Sampling and Analysis of Sediments, Water, and Tissues for Dredged Materials Evaluations. U.S. Environmental Protection Agency/U.S. Army Corps of Engineers. EPA/823/B-95/001. Office of Water. Washington, DC. EPA-823-B-95-001. April 1995. US EPA/USACE (1998) Evaluation of Dredged Material Proposed for Discharge in Waters of the U.S. – Testing Manual (Inland Testing Manual). U.S. Environmental Protection Agency/U.S. Army Corps of Engineers. EPA/823/B-94/002. Office of Water. Washington, DC 20460. USEPA/USACE (2011) DMMO Agreement on Programmatic EFH Conservation Measures for Maintenance Dredging Conducted Under LTMS Program (Tracking Number 2009/06769). US EPA (1998a) EPA Requirements for Quality Assurance Project Plans. United States Environmental Protection Agency, Quality Assurance Division, Washington, DC 20460. US EPA (1998b) EPA Guidance for Quality Assurance Project Plans. United States Environmental Protection Agency, Office of Research and Development, Washington, DC 20460. US EPA (2002) Methods for Measuring the Acute Toxicity of Effluent and Receiving Waters to Freshwater and Marine Organisms, Fifth Edition. United States Environmental Protection Agency, Office of Water, Washington, DC 20460.
29/99