appendix a. 2011 annual monitoring report
TRANSCRIPT
Gila National Forest Annual Monitoring Report – FY2011 - 19 -
APPENDIX A
Visitor Use Report
Gila NF
USDA Forest Service
Region 3
National Visitor Use Monitoring
Data collected FY 2011
United StatesDepartment ofAgriculture
Forest Service
Natural Resource Manager
National VisitorUse MonitoringProgram
Last updated:
20 June 2012

National Visitor Use Monitoring Results Gila NF (FY 2011)
CONTENTS
1. Introduction
1.1. Scope and purpose of the National Visitor Use Monitoring program
1.2. Methods
1.3. Definition of Terms
1.4. Limitations of the Results
2. Visitation Estimates
2.1 Forest Definition of Site Days
2.2. Visitation Estimates
3. Description of the Recreation Visit
3.1. Demographics
3.2. Visit Descriptions
3.3. Activities
4. Economic Information
4.1. Spending Segments
4.2. Spending Profiles
4.3. Total Direct Spending
4.4. Other Visit Information
4.5. Household Income
4.6. Substitute Behavior
5. Satisfaction Information
5.1. Crowding
5.2. Disabilities
6. Wilderness Visit Demographics
7. Appendix Tables
National Visitor Use Monitoring Program6/20/2012 2
National Visitor Use Monitoring Results Gila NF (FY 2011)
1. INTRODUCTION
1.1. Scope and purpose of the National Visitor Use Monitoring program
The National Visitor Use Monitoring (NVUM) program provides reliable information about
recreation visitors to national forest system managed lands at the national, regional, and forest
level. Information about the quantity and quality of recreation visits is required for national forest
plans, Executive Order 12862 (Setting Customer Service Standards), and implementation of the
National Recreation Agenda. To improve public service, the agency’s Strategic and Annual
Performance Plans require measuring trends in user satisfaction and use levels. NVUM
information assists Congress, Forest Service leaders, and program managers in making sound
decisions that best serve the public and protect valuable natural resources by providing science
based, reliable information about the type, quantity, quality and location of recreation use on public
lands. The information collected is also important to external customers including state agencies
and private industry. NVUM methodology and analysis is explained in detail in the research paper
entitled: Forest Service National Visitor Use Monitoring Process: Research Method
Documentation; English, Kocis, Zarnoch, and Arnold; Southern Research Station; May 2002
(http://www.fs.fed.us/recreation/programs/nvum).
In 1998 a team of research scientists and forest staff developed a recreation sampling system
(NVUM) that provides statistical recreation use information at the forest, regional, and national level.
Several Forest Service staff areas including Recreation, Wilderness, Ecosystem Management,
Research and Strategic Planning and Resource Assessment were involved in developing the
program. From January 2000 through September 2003 every national forest implemented this
methodology and collected visitor use information. This application served to test the method over
the full range of forest conditions, and to provide a rough national estimate of visitation.
Implementation of the improved method began in October 2004. Once every five years, each
National Forest and Grassland has a year of field data collection.
This NVUM data is useful for forest planning and decision making. The description of visitor
characteristics (age, race, zip code, activity participation) can help forest staff identify their
recreation niche. Satisfaction information can help management decide where best to place
limited resources that would result in improved visitor satisfaction. Economic expenditure
information can help forests show local communities the employment and income effects of tourism
from forest visitors. In addition, the visitation estimates can be helpful in considering visitor
capacity issues.
1.2. Methods
To define the sampling frame, staff on each forest classify all recreation sites and areas into five
basic categories called “site types”: Day Use Developed Sites (DUDS), Overnight Use Developed
Sites (OUDS), Designated Wilderness Areas (Wilderness), General Forest Areas (GFA), and
View Corridors (VC). Only the first four categories are counted as national forest recreation visits
and are included in the visit estimates. The last category is used to track the volume of people who
view national forests from nearby roads; since they do not get onto agency lands, they cannot be
counted as visits. For the entire sampling year, each day on each site was given a rating of very
high, high, medium, low, or no use according to the expected level of recreational visitors who
National Visitor Use Monitoring Program6/20/2012 3
National Visitor Use Monitoring Results Gila NF (FY 2011)
would be observed leaving that location for the last time (last exiting recreation use) on that day.
The combination of a calendar day and a site or area is called a site day. Site days are the basic
sampling unit for the NVUM protocol. Results of this forest categorization are shown in Table 1.
In essence, visitation is estimated through a combination of traffic counts and surveys of exiting
visitors. Both are obtained on a random sample of locations and days distributed over an entire
forest for a year. All of the surveyed recreation visitors are asked about their visit duration,
activities, demographics, travel distance, and annual usage. About one-third were also asked a
series of questions about satisfaction. Another one-third were asked to provide information about
their income, spending while on their trip, and the next best substitute for the visit.
1.3. Definition of Terms
NVUM has standardized measures of visitor use to ensure that all national forest visitor measures
are comparable. These definitions are basically the same as established by the Forest Service in
the 1970’s. Visitors must pursue a recreation activity physically located “on” Forest Service
managed land in order to be counted. They cannot be passing through; viewing from non-Forest
Service managed roads, or just using restroom facilities. The visitation metrics are national forest
visits and site visits. NVUM provides estimates of both and confidence interval statistics
measuring the precision of the estimates. The NVUM methodology categorizes recreation facilities
and areas into specific site types and use levels in order to develop the sampling frame.
Understanding the definitions of the variables used in the sample design and statistical analysis is
important in order to interpret the results.
National forest visit is the entry of one person upon a national forest to participate in recreation
activities for an unspecified period of time. A national forest visit can be composed of multiple site
visits. The visit ends when the person leaves the national forest to spend the night somewhere else.
Site visit is the entry of one person onto a national forest site or area to participate in recreation
activities for an unspecified period of time. The site visit ends when the person leaves the site or
area for the last time on that day.
A confidence interval is a range of values that is likely to include an unknown population value,
where the range is calculated from a given set of sample data. Confidence intervals are always
accompanied by a confidence level, which tells the degree of certainty that the value lies in the
interval. Used together these two terms define the reliability of the estimate, by defining the range
of values that are needed to reach the given confidence level. For example, the 2008 national
visitation estimate is 175.6 million visits, with a 90% confidence interval of 3.2%. In other words,
given the NVUM data, our best estimate is 175.6 million visits, and given the underlying data, we
are 90% certain that the true number is between 170.0 million and 181.2 million.
Recreation trip is the duration of time beginning when the visitor left their home and ending when
they return to their home.
Site day - a day that a recreation site or area is open to the public for recreation purposes.
Proxy - information collected at a recreation site or area that is directly related to the amount of
National Visitor Use Monitoring Program6/20/2012 4
National Visitor Use Monitoring Results Gila NF (FY 2011)
recreation visitation received. The proxy information must pertain to all users of the site and it must
be one of the proxy types allowed in the NVUM pre-work directions (fee receipts, fee envelopes,
mandatory permits, permanent traffic counters, group reservations, ticket sales, and daily use
records).
Nonproxy - a recreation site or area that does not have proxy information. At these sites a 24-hour
traffic count is taken to measure total use for one site day at the sample site.
Use level - for each day of the year for each recreation site or area, the site day was categorized
as very high, high, medium or low last exiting recreation traffic, or no exiting use. No Use could
means either that the location was administratively closed, or it was open but was expected to have
zero last exiting visitors. For example a picnic area may listed as having no use during winter
months (120 days), high last exiting recreation volume on all other weekends (70 days) and medium
last exiting recreation use on the remaining midweek days (175 days). This accounts for all 365
days of the year. This process was repeated for every site and area on the forest.
1.4. Limitations of the Results
The information presented here is valid and applicable at the forest, regional, and national level. It
is not designed to be accurate at the district or site level. The quality of the visitation estimate is
dependent on the sample design development, sampling unit selection, sample size and variability,
and survey implementation. First, preliminary work conducted by forests to identify and consistently
classify sites and access points according to the type and amount of expected exiting visitation is
the key determinant of the validity and magnitude of the visitation estimate. Second, the success of
the forest staff in accomplishing its assigned set of sample days, correctly filling out the interview
forms, and following the field protocols influence the reliability of the results, variability of the
visitation estimate, and validity of the visitation descriptions. Third, the variability of traffic counts
within a sampling stratum affects the reliability of the visitation estimates. Fourth, the range of
visitors sampled must be representative of the population of all visitors. Finally, the number of
visitors sampled must be large enough to adequately control variability. The results and
confidence intervals will reflect all these factors.
Confidence intervals indicate the reliability of the visitation estimate, given the underlying data.
Large confidence intervals indicate high variability in the national forest visit (NFV), site visit (SV)
and Wilderness visit estimates. Variance is caused primarily by a small sample size in number of
days or having a few sampled days where the observed exiting visitation volume was very different
from the normal range. For example, on a particular National Forest in the General Forest Area low
stratum, there were 14 sample days. Of these 14 sample days, 13 days had visitation estimates
between zero and twenty. The remaining day had a visitation estimate of 440. So the stratum
mean was about 37 per day, standard error was about 116, and the 90% confidence interval width
is 400% of the mean. Causes for such outlier observations are not known, but could include a
misclassification of the day (a high use day incorrectly categorized as a low use day), unusual
weather, malfunctioning traffic counter, or reporting errors. Eliminating the unusual observation from
data analysis would reduce the variability. However, unless the NVUM team had reason to suspect
the observation was incorrect they did not eliminate these unusual cases.
The descriptive information about national forest visitors is based upon only those visitors that were
interviewed. Every effort was made to incorporate distinct seasonal use patterns and activities that
National Visitor Use Monitoring Program6/20/2012 5

National Visitor Use Monitoring Results Gila NF (FY 2011)
vary greatly by season into the sampling frame. The sampling plan took into account both the
spatial and seasonal spread of visitation patterns across the forest. Even so, because of the small
sample size of site-days, or because some user groups decline to participate in the survey, it is
possible to under-represent certain user groups, particularly for activities that are quite limited in
where or when they occur.
Note that the results of the NVUM activity analysis DO NOT identify the types of activities visitors
would like to have offered on the national forests. It also does not tell us about displaced forest
visitors, those who no longer visit the forest because the activities they desire are not offered.
Some forest visitors were counted and included in the total forest use estimate but were not
surveyed. This included visitors to recreation special events and organization camps. Their
characteristics are not included in the visit descriptions.
Caution should be used in interpreting any comparisons of these results with those obtained during
the 2000 - 2003 period. Differences cannot be interpreted as a trend. Several method changes
account for the differences, for both visitation estimates and visit characteristics. One key factor is
that the first application of the NVUM process was largely a national beta-test of the method, and
significant improvements occurred following it. The NVUM process entailed a completely new
method and approach to measuring visitation on National Forest lands. Simply going through the
NVUM process for the first time enabled forest staff to do a much better job thereafter in identifying
sites, accurately classifying days into use level strata, and ensuring consistency across all locations
on the forest. These improvements enhanced the validity of all aspects of the NVUM results.
Sampling plans and quality control procedures were also improved.
National Visitor Use Monitoring Program6/20/2012 6
National Visitor Use Monitoring Results Gila NF (FY 2011)
2. VISITATION ESTIMATES
2.1. Forest Definition of Site Days
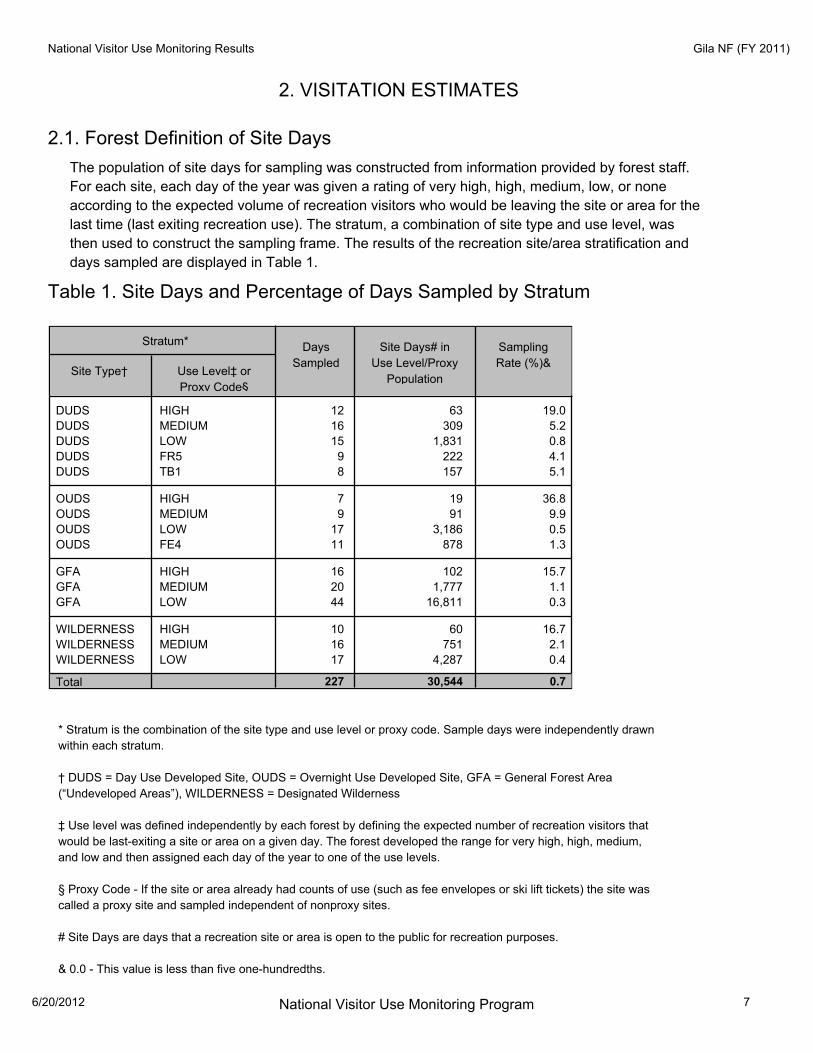
The population of site days for sampling was constructed from information provided by forest staff.
For each site, each day of the year was given a rating of very high, high, medium, low, or none
according to the expected volume of recreation visitors who would be leaving the site or area for the
last time (last exiting recreation use). The stratum, a combination of site type and use level, was
then used to construct the sampling frame. The results of the recreation site/area stratification and
days sampled are displayed in Table 1.
Table 1. Site Days and Percentage of Days Sampled by Stratum
Stratum* Sampling
Rate (%)&
Days
Sampled
Site Days# in
Use Level/Proxy
PopulationUse Level‡ or
Proxy Code§
Site Type†
DUDS 63 12 19.0HIGH
DUDS 309 16 5.2MEDIUM
DUDS 1,831 15 0.8LOW
DUDS 222 9 4.1FR5
DUDS 157 8 5.1TB1
OUDS 19 7 36.8HIGH
OUDS 91 9 9.9MEDIUM
OUDS 3,186 17 0.5LOW
OUDS 878 11 1.3FE4
GFA 102 16 15.7HIGH
GFA 1,777 20 1.1MEDIUM
GFA 16,811 44 0.3LOW
WILDERNESS 60 10 16.7HIGH
WILDERNESS 751 16 2.1MEDIUM
WILDERNESS 4,287 17 0.4LOW
Total 227 30,544 0.7
* Stratum is the combination of the site type and use level or proxy code. Sample days were independently drawn
within each stratum.
† DUDS = Day Use Developed Site, OUDS = Overnight Use Developed Site, GFA = General Forest Area
(“Undeveloped Areas”), WILDERNESS = Designated Wilderness
‡ Use level was defined independently by each forest by defining the expected number of recreation visitors that
would be last-exiting a site or area on a given day. The forest developed the range for very high, high, medium,
and low and then assigned each day of the year to one of the use levels.
§ Proxy Code - If the site or area already had counts of use (such as fee envelopes or ski lift tickets) the site was
called a proxy site and sampled independent of nonproxy sites.
# Site Days are days that a recreation site or area is open to the public for recreation purposes.
& 0.0 - This value is less than five one-hundredths.
National Visitor Use Monitoring Program6/20/2012 7

National Visitor Use Monitoring Results Gila NF (FY 2011)
2.2. Visitation Estimates
Visitation estimates are available at the national, regional, and forest level. This document provides
only National Forest level data. Other documents may be obtained through the National Visitor Use
Monitoring web page: www.fs.fed.us/recreation/programs/nvum.
When reviewing the results, users should discuss with forest staff if this forest experienced any
unusual circumstances such as forest fires, floods, or atypical weather that may have created an
unusual recreation use pattern for the year sampled. Table 2 displays the number of national forest
visits and site visits by site type for this National Forest.
Table 2. Annual Visitation Estimate
90% Confidence Level (%)#Visits (1,000s)Visit Type
699 ±31.7Total Estimated Site Visits*
214 ±25.5→ Day Use Developed Site Visits
62 ±67.2→ Overnight Use Developed Site Visits
402 ±52.4→ General Forest Area Visits
21 ±44.9→ Designated Wilderness Visits†
514 ±40.1Total Estimated National Forest Visits§
0 ±0.0→ Special Events and Organized Camp Use‡
* A Site Visit is the entry of one person onto a National Forest site or area to participate in recreation activities for
an unspecified period of time.
† Designated Wilderness visits are included in the Site Visits estimate.
‡ Special events and organizational camp use are not included in the Site Visit estimate, only in the National Forest
Visits estimate. Forests reported the total number of participants and observers so this number is not estimated; it
is treated as 100% accurate.
§ A National Forest Visit is defined as the entry of one person upon a national forest to participate in recreation
activities for an unspecified period of time. A National Forest Visit can be composed of multiple Site Visits.
# This value defines the upper and lower bounds of the visitation estimate at the 90% confidence level, for example if
the visitation estimate is 100 +/-5%, one would say “at the 90% confidence level visitation is between 95 and 105
visits.”
National Visitor Use Monitoring Program6/20/2012 8
National Visitor Use Monitoring Results Gila NF (FY 2011)
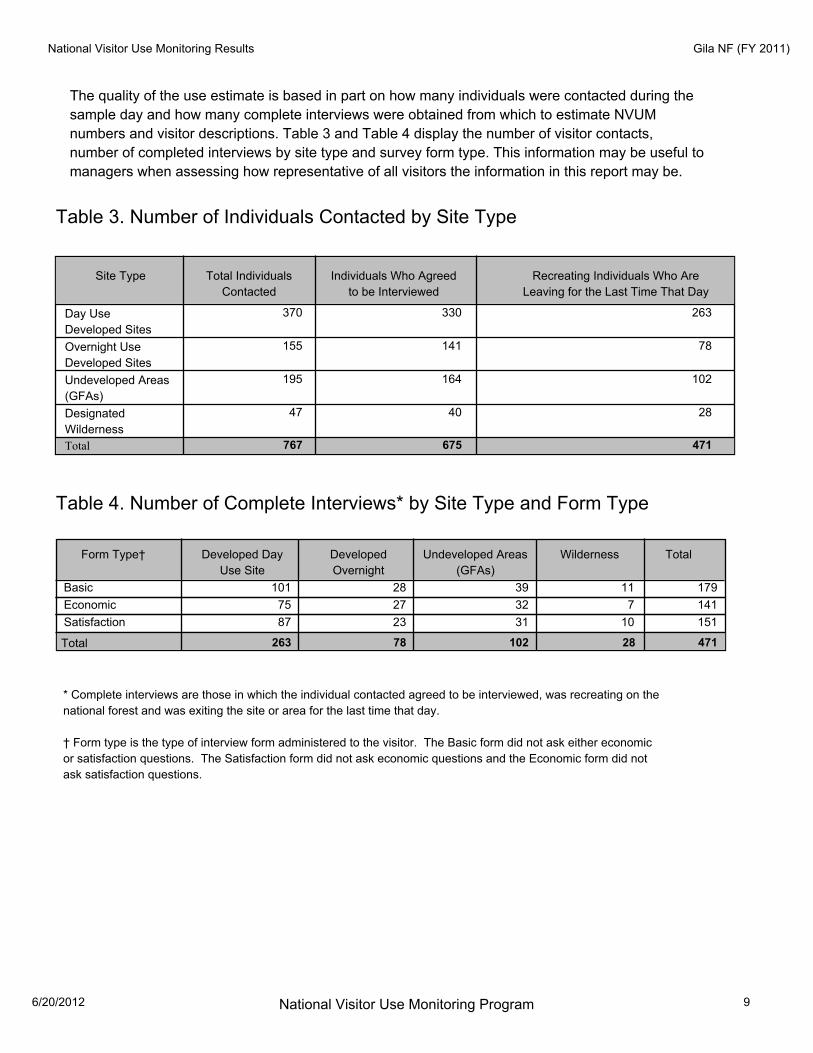
The quality of the use estimate is based in part on how many individuals were contacted during the
sample day and how many complete interviews were obtained from which to estimate NVUM
numbers and visitor descriptions. Table 3 and Table 4 display the number of visitor contacts,
number of completed interviews by site type and survey form type. This information may be useful to
managers when assessing how representative of all visitors the information in this report may be.
Table 3. Number of Individuals Contacted by Site Type
Recreating Individuals Who Are
Leaving for the Last Time That Day
Total Individuals
Contacted
Individuals Who Agreed
to be Interviewed
Site Type
Day Use
Developed Sites
330 370 263
Overnight Use
Developed Sites
141 155 78
Undeveloped Areas
(GFAs)
164 195 102
Designated
Wilderness
40 47 28
Total 767 675 471
Table 4. Number of Complete Interviews* by Site Type and Form Type
TotalWildernessUndeveloped Areas
(GFAs)
Developed
Overnight
Developed Day
Use Site
Form Type†
179Basic 101 28 39 11
141Economic 75 27 32 7
151Satisfaction 87 23 31 10
Total 263 78 102 28 471
* Complete interviews are those in which the individual contacted agreed to be interviewed, was recreating on the
national forest and was exiting the site or area for the last time that day.
† Form type is the type of interview form administered to the visitor. The Basic form did not ask either economic
or satisfaction questions. The Satisfaction form did not ask economic questions and the Economic form did not
ask satisfaction questions.
National Visitor Use Monitoring Program6/20/2012 9

National Visitor Use Monitoring Results Gila NF (FY 2011)
Visitors were interviewed regardless of whether they were recreating at the site or not, however the
interview was discontinued after determining that the reason for visiting the site was not recreation.
Figure 1 displays the various reasons visitors gave as their purpose for stopping at the sample site.
Figure 1. Purpose of Visit by Visitors Who Agreed to be Interviewed
Recreation 79.3%Use Bathroom 3.0%
Work or Commute 3.6%
Passing Through 12.1%Some Other Reason 2.1%
Total: 100.0%
National Visitor Use Monitoring Program6/20/2012 10

National Visitor Use Monitoring Results Gila NF (FY 2011)
3. DESCRIPTION OF THE RECREATION VISIT
3.1. Demographics
Descriptions of forest recreational visits were developed based upon the characteristics of
interviewed visitors (respondents) and expanded to the national forest visitor population. Basic
demographic information helps forest managers identify the profile of the visitors they serve.
Management concerns such as providing recreation opportunities for underserved populations may
be monitored with this information. Table 5, Table 6 and Table 7 provide basic demographic
information about visitors interviewed regarding Gender, Race/Ethnicity, and Age, respectively.
Table 8 shows the 15 most common reported origins for recreation visitors. A complete list of
reported zip codes for respondents is found in Appendix A. Table 9 provides information about self
reported travel distance from home to the interview site.
Demographic results show that over 72 percent of visits are made by males. Hispanics account for
over 35% of all visits to the Gila. Native American visitors account for almost 4 percent. Children
under the age of 16 are only a little more than 10 percent of visits. Over 30 percent of visits are
people age sixty or older. The Gila serves mostly two distance zones. About 55 percent of visits
are from people living within 50 miles of the forest; however, almost30 percent are from 100 to 500
miles away.
National Visitor Use Monitoring Program6/20/2012 11

National Visitor Use Monitoring Results Gila NF (FY 2011)
Table 5. Percent of National Forest Visits* by Gender
Survey
Respondents†
Gender National Forest
Visits (%)‡
Female 27.3 417
Male 72.7 653
Total 1,070 100.0
27.3%
Female
72.7%
Male
† Non-respondents to gender questions were excluded from analysis.
‡ Calculations are computed using weights that expand the sample of individuals to the
population of National Forest Visits.
* A National Forest Visit is defined as the entry of one person upon a national forest to participate
in recreation activities for an unspecified period of time. A National Forest Visit can be composed
of multiple Site Visits.
National Visitor Use Monitoring Program6/20/2012 12

National Visitor Use Monitoring Results Gila NF (FY 2011)
Table 6. Percent of National Forest Visits* by Race/Ethnicity
National Forest Visits
(%)§
Survey
Respondents‡
Race †
3.7American Indian / Alaska Native 29
0.2Asian 2
0.2Black / African American 3
0.1Hawaiian / Pacific Islander 1
96.3White 360
Total
Hispanic / Latino 36.2
Ethnicity† Survey
Respondents‡
National Forest Visits
(%)§
# 395 100.5
110
0%
20%
40%
60%
80%
100%
American
Indian / Alaska
Native
Asian Black / African
American
Haw aiian /
Pacif ic
Islander
White Hispanic /
Latino
3.7%0.2% 0.2% 0.1%
96.3%
36.2%
Race / Ethnicity
Vis
its
(%
)§
# Respondents could choose more than one racial group, so the total may be more than 100%.
† Race and Ethnicity were asked as two separate questions.
‡ Non-respondents to race/ethnicity questions were excluded from analysis.
§ Calculations are computed using weights that expand the sample of individuals to the population
of National Forest Visits.
* A National Forest Visit is defined as the entry of one person upon a national forest to participate
in recreation activities for an unspecified period of time. A National Forest Visit can be composed
of multiple Site Visits.
National Visitor Use Monitoring Program6/20/2012 13

National Visitor Use Monitoring Results Gila NF (FY 2011)
Table 7. Percent of National Forest Visits* by Age
National Forest Visits (%)‡Age Class
Under 16 10.8
16-19 1.2
20-29 10.1
30-39 15.4
40-49 13.9
50-59 16.9
60-69 19.8
70+ 11.9
Total 100.0
0
4
8
12
16
20
Under 16 16-19 20-29 30-39 40-49 50-59 60-69 70+
10.8
1.2
10.1
15.4
13.9
16.9
19.8
11.9
Age
Vis
its
(%
)‡
† Non-respondents to age questions were excluded from analysis.
‡ Calculations are computed using weights that expand the sample of individuals to the
population of National Forest Visits.
* A National Forest Visit is defined as the entry of one person upon a national forest to participate
in recreation activities for an unspecified period of time. A National Forest Visit can be composed
of multiple Site Visits.
National Visitor Use Monitoring Program6/20/2012 14

National Visitor Use Monitoring Results Gila NF (FY 2011)
Table 8. Top 15 Most Commonly Reported ZIP Codes, States and Counties of
National Forest Survey Respondents
Percent of
Respondents
Survey
Respondents (n)
CountyStateZIP Code
88061 New Mexico Grant County 100 48.5
88062 New Mexico Grant County 11 5.3
88030 New Mexico Luna County 11 5.3
87825 New Mexico Socorro County 10 4.9
87031 New Mexico Valencia County 9 4.4
87829 New Mexico Catron County 8 3.9
88039 New Mexico Catron County 7 3.4
87901 New Mexico Sierra County 7 3.4
87020 New Mexico Cibola County 7 3.4
88007 New Mexico Dona Ana County 7 3.4
88011 New Mexico Dona Ana County 6 2.9
Foreign Country 6 2.9
88049 New Mexico Grant County 6 2.9
87830 New Mexico Catron County 6 2.9
88022 New Mexico Grant County 5 2.4
* Includes respondents reporting no ZIP code or an invalid ZIP code.
Table 9. Percent of National Forest Visits* by Distance Traveled
National Forest Visits (%)Miles from Survey Respondent's
Home to Interview Location†
0 - 25 miles 38.3
26 - 50 miles 16.5
51 - 75 miles 5.8
76 - 100 miles 3.2
101 - 200 miles 16.2
201 - 500 miles 12.9
Over 500 miles 7.1
Total 100.0
Note: Blank cells indicate that insufficient data were collected to make inferences.
* National Forest Visits are defined as the entry of one person upon a national forest to
participate in recreation activities for an unspecified period of time. A National Forest Visit
can be composed of multiple Site Visits.
† Travel distance is self-reported.
National Visitor Use Monitoring Program6/20/2012 15
National Visitor Use Monitoring Results Gila NF (FY 2011)
3.2. Visit Descriptions
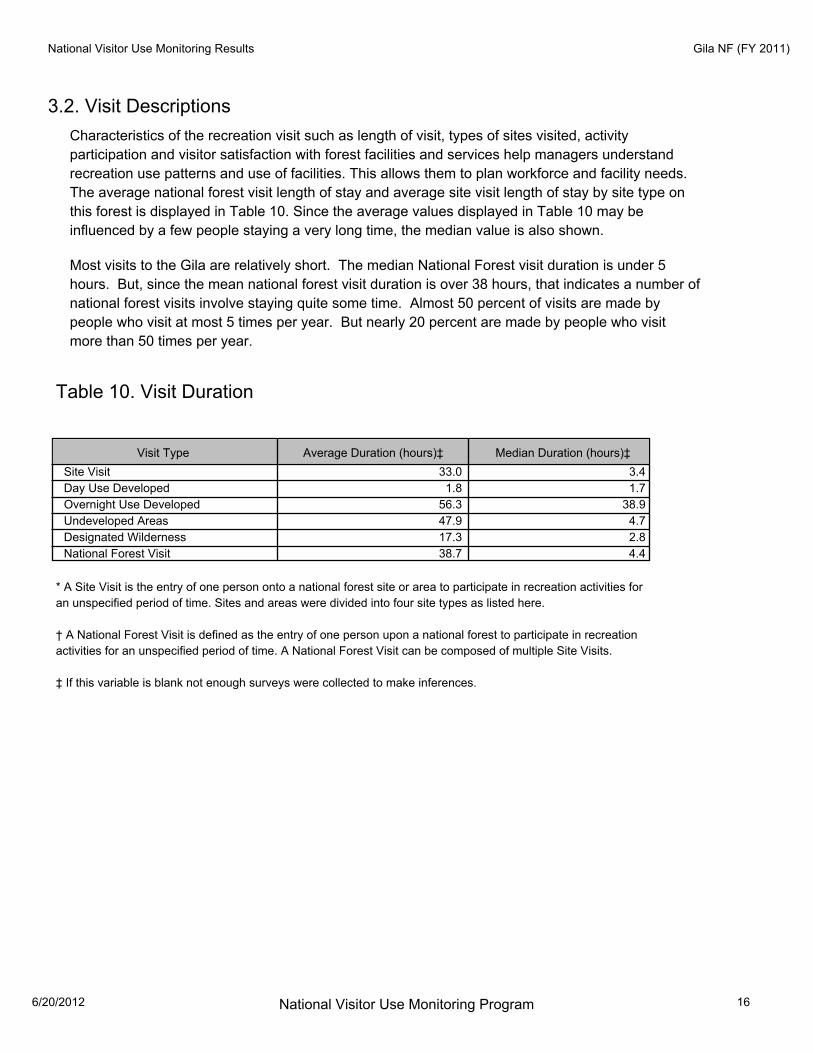
Characteristics of the recreation visit such as length of visit, types of sites visited, activity
participation and visitor satisfaction with forest facilities and services help managers understand
recreation use patterns and use of facilities. This allows them to plan workforce and facility needs.
The average national forest visit length of stay and average site visit length of stay by site type on
this forest is displayed in Table 10. Since the average values displayed in Table 10 may be
influenced by a few people staying a very long time, the median value is also shown.
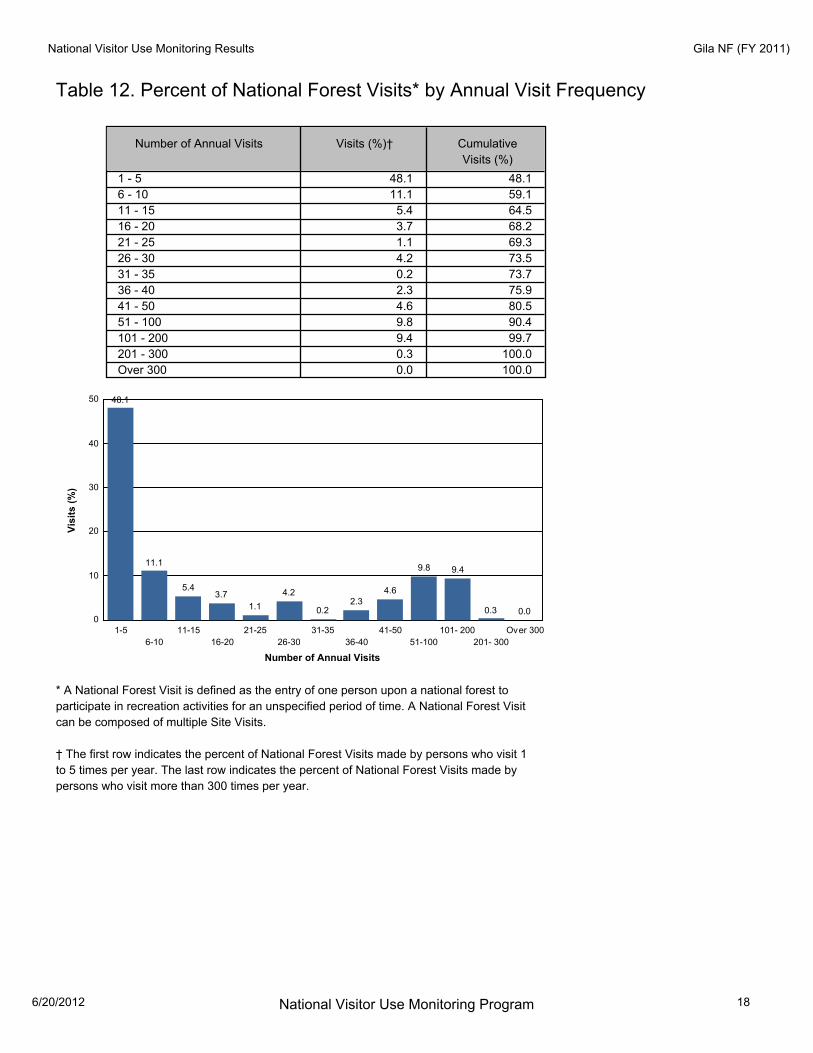
Most visits to the Gila are relatively short. The median National Forest visit duration is under 5
hours. But, since the mean national forest visit duration is over 38 hours, that indicates a number of
national forest visits involve staying quite some time. Almost 50 percent of visits are made by
people who visit at most 5 times per year. But nearly 20 percent are made by people who visit
more than 50 times per year.
Table 10. Visit Duration
Median Duration (hours)‡Average Duration (hours)‡Visit Type
Site Visit 3.4 33.0
Day Use Developed 1.7 1.8
Overnight Use Developed 38.9 56.3
Undeveloped Areas 4.7 47.9
Designated Wilderness 2.8 17.3
National Forest Visit 4.4 38.7
* A Site Visit is the entry of one person onto a national forest site or area to participate in recreation activities for
an unspecified period of time. Sites and areas were divided into four site types as listed here.
† A National Forest Visit is defined as the entry of one person upon a national forest to participate in recreation
activities for an unspecified period of time. A National Forest Visit can be composed of multiple Site Visits.
‡ If this variable is blank not enough surveys were collected to make inferences.
National Visitor Use Monitoring Program6/20/2012 16

National Visitor Use Monitoring Results Gila NF (FY 2011)
Many of the respondents on this National Forest went only to the site at which they were interviewed
(Table 11). Some visitors went to more than one recreation site or area during their national forest
visit and the average site visits per national forest visit is shown below. Also displayed are the
average people per vehicle and average axles per vehicle. This information in conjunction with
traffic counts was used to expand observations from individual interviews to the full forest population
of recreation visitors. This information may be useful to forest engineers and others who use vehicle
counters to conduct traffic studies.
During the interview, visitors were asked how often they visit this national forest for all recreational
activities, and how often for their primary activity. Table 12 summarizes the percent of visits that are
made by those in each frequency category for this National Forest.
Table 11. Group Characteristics
AverageCharacteristic
Percent of visits that were to just one national forest site during the National Forest Visit* 87.1
Number of national forest sites visited on National Forest Visit* 1.2
Group Size 2.3
Axles per Vehicle 2.3
National Visitor Use Monitoring Program6/20/2012 17
National Visitor Use Monitoring Results Gila NF (FY 2011)
Table 12. Percent of National Forest Visits* by Annual Visit Frequency
Cumulative
Visits (%)
Visits (%)†Number of Annual Visits
1 - 5 48.1 48.1
6 - 10 11.1 59.1
11 - 15 5.4 64.5
16 - 20 3.7 68.2
21 - 25 1.1 69.3
26 - 30 4.2 73.5
31 - 35 0.2 73.7
36 - 40 2.3 75.9
41 - 50 4.6 80.5
51 - 100 9.8 90.4
101 - 200 9.4 99.7
201 - 300 0.3 100.0
Over 300 0.0 100.0
0
10
20
30
40
50
1-5
6-10
11-15
16-20
21-25
26-30
31-35
36-40
41-50
51-100
101- 200
201- 300
Over 300
48.1
11.1
5.43.7
1.1
4.2
0.22.3
4.6
9.8 9.4
0.3 0.0
Number of Annual Visits
Vis
its
(%
)
* A National Forest Visit is defined as the entry of one person upon a national forest to
participate in recreation activities for an unspecified period of time. A National Forest Visit
can be composed of multiple Site Visits.
† The first row indicates the percent of National Forest Visits made by persons who visit 1
to 5 times per year. The last row indicates the percent of National Forest Visits made by
persons who visit more than 300 times per year.
National Visitor Use Monitoring Program6/20/2012 18

National Visitor Use Monitoring Results Gila NF (FY 2011)
3.3. Activities
After identifying their main recreational activity, visitors were asked how many hours they spent
participating in that main activity during this national forest visit. Some caution is needed when
using this information. Because most national forest visitors participate in several recreation
activities during each visit, it is more than likely that other visitors also participated in this activity,
but did not identify it as their main activity. For example, on one national forest 63 % of visitors
identified viewing wildlife as a recreational activity that they participated in during this visit, however
only 3% identified that activity as their main recreational activity. The information on average hours
viewing wildlife is only for the 3% who reported it as a main activity.
The four most frequently selected primary activities are hiking/walking (21%), hunting (20%),
viewing natural features (12%) and pleasure driving (12%). Viewing scenery, viewing wildlife, and
hiking are activities that more than half of the visits include. Driving for pleasure (49%) and relaxing
(45%) are also activities that many visits include.
Use of Constructed Facilities and Designated Areas
About one-third of recreation visitors interviewed were asked about whether they made use of a
targeted set of facilities and special designated areas during their visit. These results are displayed
in Table 14.
National Visitor Use Monitoring Program6/20/2012 19

National Visitor Use Monitoring Results Gila NF (FY 2011)
Table 13. Activity Participation
Avg Hours Doing
Main Activity
% Main
Activity‡
%
Participation*
Activity
Viewing Wildlife 57.0 3.9 2.5
Viewing Natural Features 56.8 12.1 2.3
Hiking / Walking 51.9 21.4 2.8
Driving for Pleasure 49.3 12.0 3.5
Relaxing 45.3 7.6 26.9
Hunting 20.2 19.7 50.2
Primitive Camping 17.6 0.1 20.0
OHV Use 17.5 1.8 1.0
Picnicking 14.6 4.1 2.7
Motorized Trail Activity 11.7 0.0 0.0
Fishing 11.2 7.3 7.5
Visiting Historic Sites 11.0 0.8 3.7
Some Other Activity 7.0 6.7 3.1
Developed Camping 6.6 0.8 43.8
Nature Study 6.2 0.0 4.0
Gathering Forest Products 4.4 0.1 3.2
Nature Center Activities 4.1 0.0 0.0
Backpacking 2.9 0.3 28.9
Horseback Riding 2.1 2.0 2.0
Other Non-motorized 1.1 0.3 4.5
Other Motorized Activity 0.9 0.9 15.0
Bicycling 0.9 0.2 5.3
Resort Use 0.1 0.0 0.0
Non-motorized Water 0.1 0.1 10.0
Motorized Water Activities 0.0 0.0 0.0
Snowmobiling 0.0 0.0 0.0
Downhill Skiing 0.0 0.0 0.0
Cross-country Skiing 0.0 0.0 0.0
No Activity Reported 0.0 0.0
0
4
8
12
16
20
24
Hik
ing / W
alking
Hun
ting
Viewing Natur
al F
eature
s
Driv
ing for P
leas
ure
Relax
ing
Fishing
Some Other
Activi ty
Picnick
ing
Viewing W
ildl if
e
Hor
seba
ck R
iding
OHV U
se
Other
Motor
ized
Activity
Visiting
His
toric
Site
s
Dev
elop
ed C
amping
Backp
acki
ng
Other
Non
-motor
ized
Bicyc
ling
Gathe
r ing
Fores
t Pro
ducts
Primitive
Cam
ping
Non
-motor
ized
Water
Nat
ure
Stud
y
Snowm
obilin
g
Res
ort U
se
No
Activ
i ty R
epor
ted
Nat
ure
Cen
ter Ac
tivities
Mot
orized
Water
Acti
vitie
s
Mot
orized
Tra
il Acti
vity
Dow
nhil l S
kiing
Cro
ss-c
ountry
Skiing
ACTIVITY
% V
isit
s
% Main Activity
National Visitor Use Monitoring Program6/20/2012 20

National Visitor Use Monitoring Results Gila NF (FY 2011)
* Survey respondents could select multiple activities so this column may total more than
100%.
‡ Survey respondents were asked to select just one of their activities as their main reason
for the forest visit. Some respondents selected more than one, so this column may total
more than 100%.
Table 14. Percent of National Forest Visits* Indicating Use of
Special Facilities or Areas
% of National Forest Visits†Special Facility or Area
Developed Swimming Site 0.6
Scenic Byway 11.5
Visitor Center or Museum 3.6
Designated ORV Area 22.5
Forest Roads 37.8
Interpretive Displays 7.5
Information Sites 5.4
Developed Fishing Site 5.7
Motorized Single Track Trails 7.3
Motorized Dual Track Trails 37.5
None of these Facilities 22.1
* A National Forest Visit is defined as the entry of one person upon a national forest to
participate in recreation activities for an unspecified period of time. A National Forest Visit can
be composed of multiple Site Visits.
† Survey respondents could select as many or as few special facilities or areas as
appropriate.
National Visitor Use Monitoring Program6/20/2012 21
National Visitor Use Monitoring Results Gila NF (FY 2011)
4. ECONOMIC INFORMATION
Forest managers are usually very interested in the impact of National Forest recreation visits on the
local economy. As commodity production of timber and other resources has declined, local
communities look increasingly to tourism to support their communities. When considering
recreation-related visitor spending managers are often interested both in identifying the average
spending of individual visitors (or types of visitors) and the total spending associated with all
recreation use. Spending averages for visitors or visitor parties can be estimated using data
collected from a statistically valid visitor sampling program such as NVUM. To estimate the total
spending associated with recreation use, three pieces of information are needed: an overall
visitation estimate, the proportion of visits in the visitor types, and the average spending profiles for
each of the visitor types. Multiplying the three gives a total amount of spending by a particular type
of visitor. Summing over all visitor types gives total spending.
About one-third of the NVUM surveys included questions about trip-related spending within 50
miles of the site visited. Spending data collected from 2000 to 2003 were analyzed at Michigan
State University by Dr. Daniel Stynes and Dr. Eric White. A description of that analysis and the
results are in the report “Spending Profiles of National Forest Visitors: NVUM four-year report”,
available at http://www.fs.fed.us/recreation/programs/nvum/NVUM4YrSpending.pdf. Analysis of
spending data for the 2005 - 2009 data collection periods was completed in summer of 2010.
4.1. Spending Segments
The spending that occurs on a recreation trip is greatly influenced by the type of recreation trip
taken. For example, visitors on overnight trips away from home typically have to pay for some form
of lodging (e.g., hotel/motel rooms, fees in a developed campground, etc.) while those on day trips
do not. In addition, visitors on overnight trips will generally have to purchase more food during their
trip (in restaurants or grocery stores) than visitors on day trips. Visitors who have not traveled far
from home to the recreation location usually spend less than visitors traveling longer distances,
especially on items such as fuel and food. Analysis of spending patterns has shown that a good
way to construct segments of the visitor market with consistent spending patterns is the following
seven groupings:
1. local visitors on day trips,
2. local visitors on overnight trips staying in lodging on the national forest,
3. local visitors on overnight trips staying in lodging off the national forest, and
4. non-local visitors on day trips,
5. non-local visitors on overnight trips staying in lodging on the national forest,
6. non-local visitors on overnight trips staying in lodging off the forest,
7. non-primary visitors.
Local visitors are those who travel less than 50 road miles from home to the recreation site visited
and non-local visitors are those who travel greater than 50 road miles to the recreation site visited.
Non-primary visitors are those for whom the primary purpose of their trip is something other than
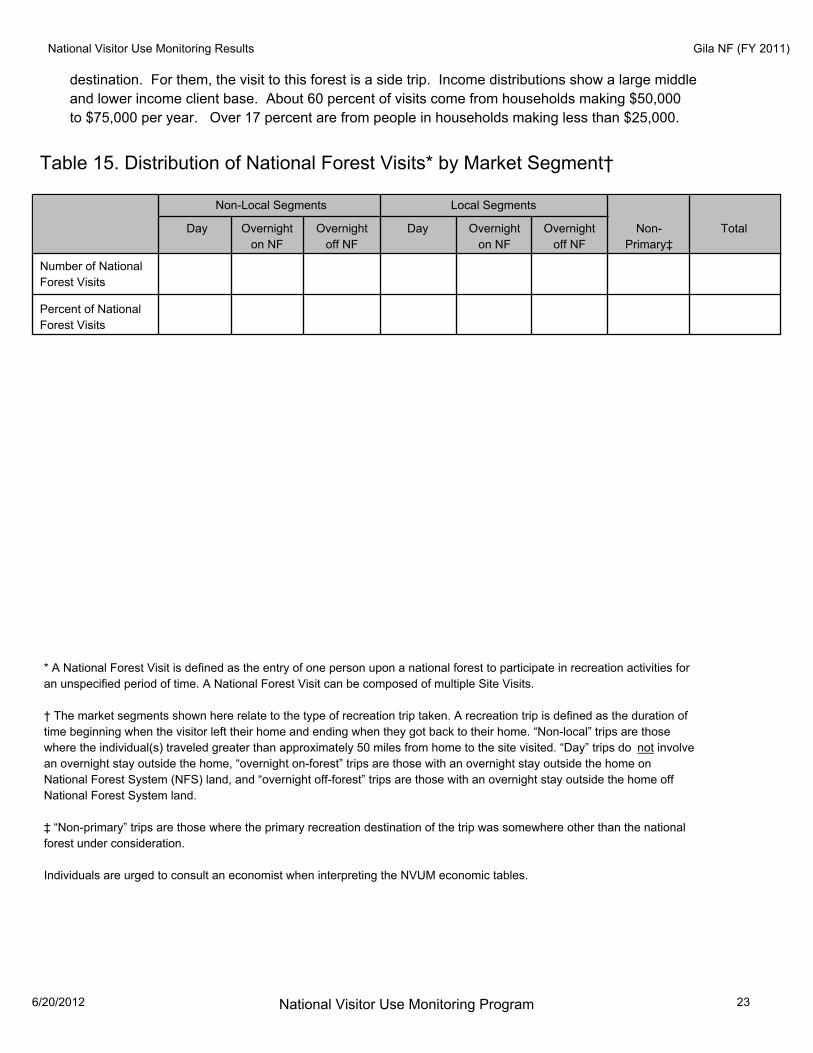
recreating on that national forest. Table 15 shows the distribution of visits by spending segment.
For about one-tenth of the visits to the Gila, that forest is not the individual’s primary recreation
National Visitor Use Monitoring Program6/20/2012 22
National Visitor Use Monitoring Results Gila NF (FY 2011)
destination. For them, the visit to this forest is a side trip. Income distributions show a large middle
and lower income client base. About 60 percent of visits come from households making $50,000
to $75,000 per year. Over 17 percent are from people in households making less than $25,000.
Table 15. Distribution of National Forest Visits* by Market Segment†
Total
Local SegmentsNon-Local Segments
Non-
Primary‡
Overnight
off NF
Overnight
on NF
DayOvernight
off NF
Overnight
on NF
Day
Number of National
Forest Visits
Percent of National
Forest Visits
* A National Forest Visit is defined as the entry of one person upon a national forest to participate in recreation activities for
an unspecified period of time. A National Forest Visit can be composed of multiple Site Visits.
† The market segments shown here relate to the type of recreation trip taken. A recreation trip is defined as the duration of
time beginning when the visitor left their home and ending when they got back to their home. “Non-local” trips are those
where the individual(s) traveled greater than approximately 50 miles from home to the site visited. “Day” trips do not involve
an overnight stay outside the home, “overnight on-forest” trips are those with an overnight stay outside the home on
National Forest System (NFS) land, and “overnight off-forest” trips are those with an overnight stay outside the home off
National Forest System land.
‡ “Non-primary” trips are those where the primary recreation destination of the trip was somewhere other than the national
forest under consideration.
Individuals are urged to consult an economist when interpreting the NVUM economic tables.
National Visitor Use Monitoring Program6/20/2012 23
National Visitor Use Monitoring Results Gila NF (FY 2011)
4.2. Spending Profiles
Spending profiles for each segment for this forest can be found in the Stynes and White report
noted above. Appendix Table A-1 in that report identifies whether the forest has a high-spending
profile (Table 7 of Stynes and White), an average profile (Table 5), or a low-spending profile (Table
8). It is essential to note that these spending profiles are in dollars spent per party. Obtaining
per-visit spending is accomplished by dividing the spending for each segment by the average
people per party for the forest and segment found in Appendix Table A-3 of that report.
4.3. Total Direct Spending
Total direct spending made within 50 miles of the forest and associated with national forest
recreation is calculated by combining estimates of per-visit spending averages from the spending
profiles with estimates of the number of national forest visits in the segment. The number of visits in
the segment equals the percentage in Table 15 times the number of National Forest visits reported
in Table 2.
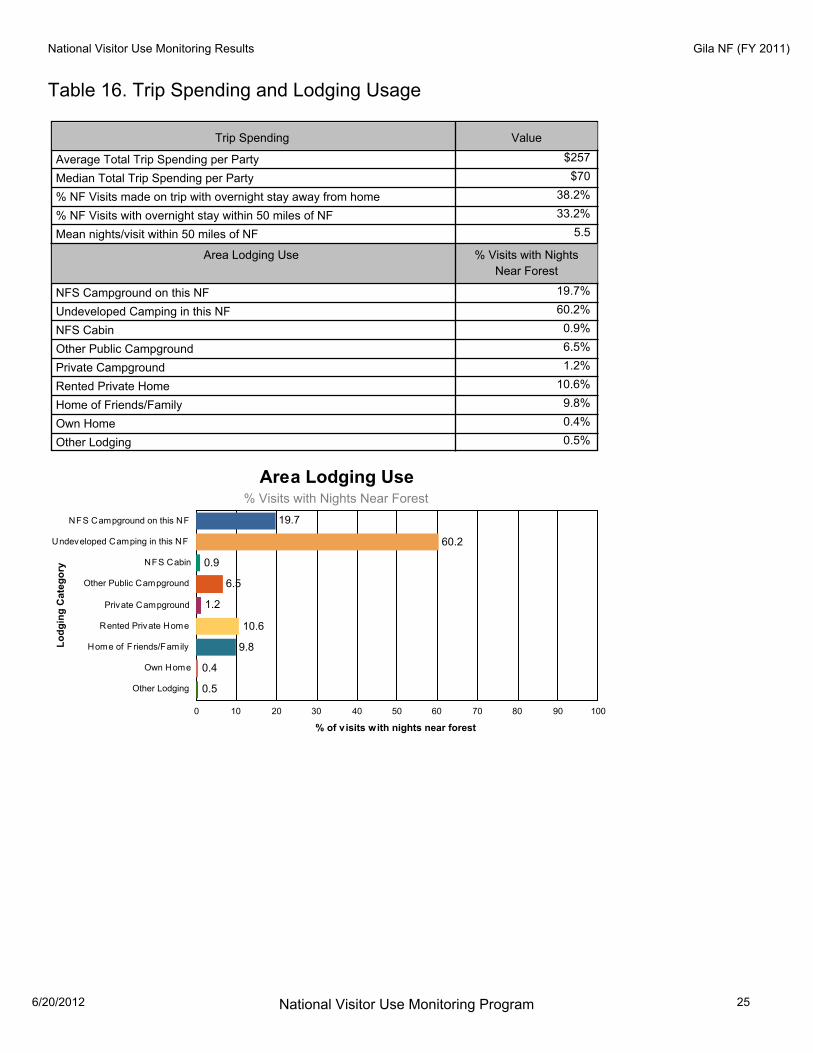
4.4. Other Visit Information
There are several other important aspects of the trips on which the recreation visits to the forest are
made. These are summarized in Table 16. The first aspect relates to total amount spent by the
recreating party on the trip. This includes spending not just within 50 miles of the forest, but
anywhere. The table shows both the average and the median. Another set describes the overall
length of the trips on which the visits are made. The table shows the percent of the visits that were
made on trips where the person stayed away from home overnight (even though the forest visit may
be just a day visit), and the average total nights away from home and nights spent within 50 miles of
the forest. For those spending one or more nights in or near the forest, the table shows the
percentage that selected each of a series of lodging options. Together, these results help show the
context of overall trip length and lodging patterns for visitors to the forest.
National Visitor Use Monitoring Program6/20/2012 24
National Visitor Use Monitoring Results Gila NF (FY 2011)
Table 16. Trip Spending and Lodging Usage
ValueTrip Spending
$257Average Total Trip Spending per Party
$70Median Total Trip Spending per Party
38.2%% NF Visits made on trip with overnight stay away from home
33.2%% NF Visits with overnight stay within 50 miles of NF
5.5Mean nights/visit within 50 miles of NF
Area Lodging Use % Visits with Nights
Near Forest
19.7%NFS Campground on this NF
60.2%Undeveloped Camping in this NF
0.9%NFS Cabin
6.5%Other Public Campground
1.2%Private Campground
10.6%Rented Private Home
9.8%Home of Friends/Family
0.4%Own Home
0.5%Other Lodging
0 10 20 30 40 50 60 70 80 90 100
NFS Campground on this NF
Undeveloped Camping in this NF
NFS Cabin
Other Public Campground
Private Campground
Rented Private Home
Home of Friends/Family
Own Home
Other Lodging
19.7
60.2
0.9
6.5
1.2
10.6
9.8
0.4
0.5
Lo
dg
ing
Ca
teg
ory
% of visits with nights near forest
Area Lodging Use% Visits with Nights Near Forest
National Visitor Use Monitoring Program6/20/2012 25
National Visitor Use Monitoring Results Gila NF (FY 2011)
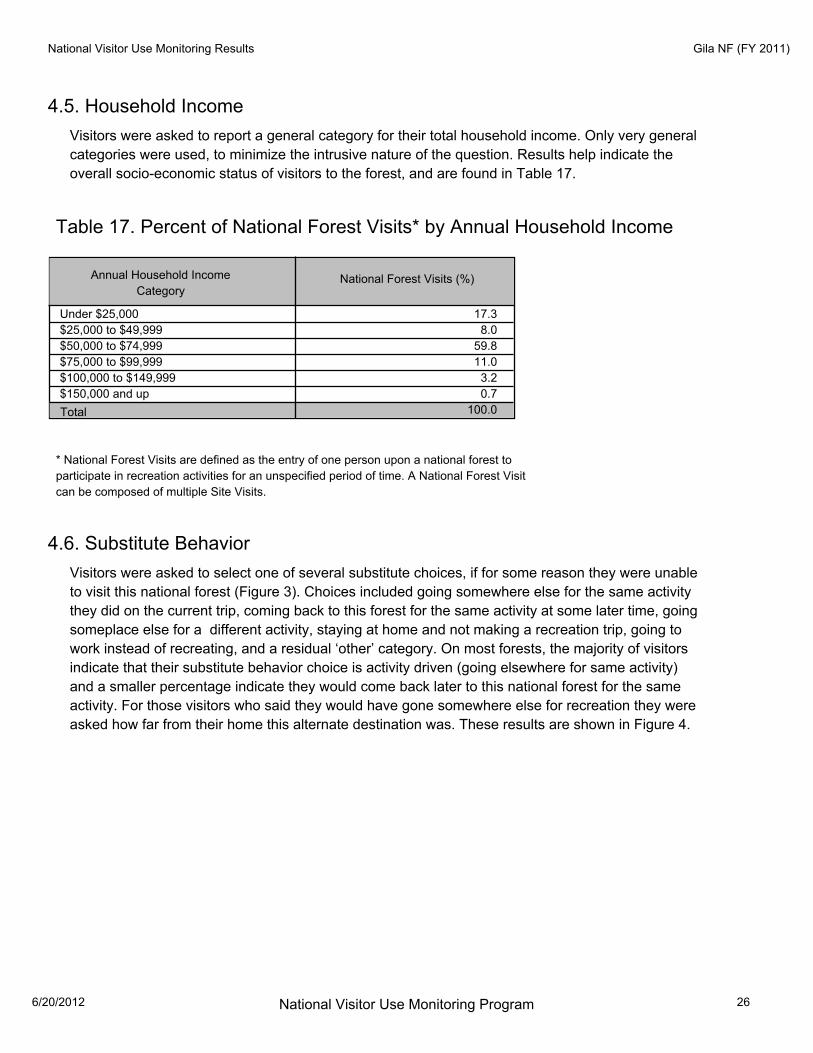
4.5. Household Income
Visitors were asked to report a general category for their total household income. Only very general
categories were used, to minimize the intrusive nature of the question. Results help indicate the
overall socio-economic status of visitors to the forest, and are found in Table 17.
Table 17. Percent of National Forest Visits* by Annual Household Income
National Forest Visits (%)Annual Household Income
Category
Under $25,000 17.3
$25,000 to $49,999 8.0
$50,000 to $74,999 59.8
$75,000 to $99,999 11.0
$100,000 to $149,999 3.2
$150,000 and up 0.7
Total 100.0
* National Forest Visits are defined as the entry of one person upon a national forest to
participate in recreation activities for an unspecified period of time. A National Forest Visit
can be composed of multiple Site Visits.
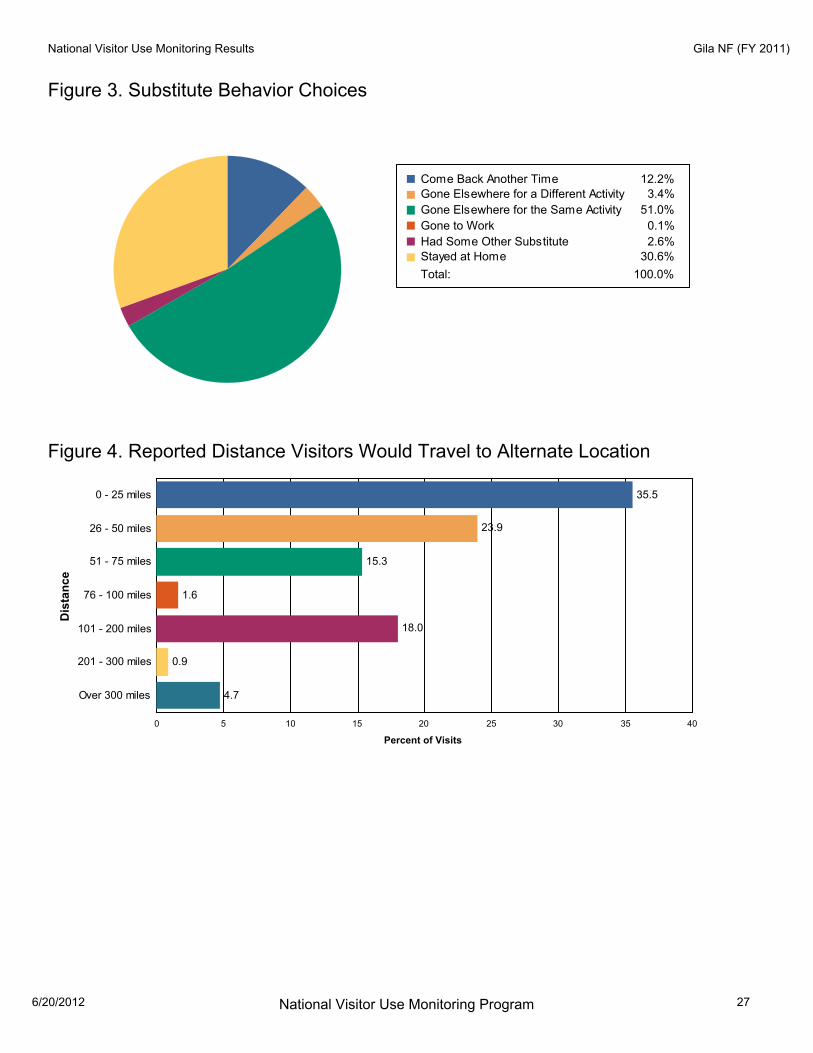
4.6. Substitute Behavior
Visitors were asked to select one of several substitute choices, if for some reason they were unable
to visit this national forest (Figure 3). Choices included going somewhere else for the same activity
they did on the current trip, coming back to this forest for the same activity at some later time, going
someplace else for a different activity, staying at home and not making a recreation trip, going to
work instead of recreating, and a residual ‘other’ category. On most forests, the majority of visitors
indicate that their substitute behavior choice is activity driven (going elsewhere for same activity)
and a smaller percentage indicate they would come back later to this national forest for the same
activity. For those visitors who said they would have gone somewhere else for recreation they were
asked how far from their home this alternate destination was. These results are shown in Figure 4.
National Visitor Use Monitoring Program6/20/2012 26
National Visitor Use Monitoring Results Gila NF (FY 2011)
Figure 3. Substitute Behavior Choices
Come Back Another Time 12.2%Gone Elsewhere for a Different Activity 3.4%
Gone Elsewhere for the Same Activity 51.0%
Gone to Work 0.1%
Had Some Other Substitute 2.6%Stayed at Home 30.6%
Total: 100.0%
Figure 4. Reported Distance Visitors Would Travel to Alternate Location
0 5 10 15 20 25 30 35 40
0 - 25 miles
26 - 50 miles
51 - 75 miles
76 - 100 miles
101 - 200 miles
201 - 300 miles
Over 300 miles
35.5
23.9
15.3
1.6
18.0
0.9
4.7
Dis
tan
ce
Percent of Visits
National Visitor Use Monitoring Program6/20/2012 27

National Visitor Use Monitoring Results Gila NF (FY 2011)
5. SATISFACTION INFORMATION
An important element of outdoor recreation program delivery is evaluating customer satisfaction
with the recreation setting, facilities, and services provided. Satisfaction information helps
managers decide where to invest in resources and to allocate resources more efficiently toward
improving customer satisfaction. Satisfaction is a core piece of data for national- and forest-level
performance measures. To describe customer satisfaction, several different measures are used.
Recreation visitors were asked to provide an overall rating of their visit to the national forest, on a
5-point Likert scale. About one-third of visitors interviewed on the forest rated their satisfaction with
fourteen elements related to recreation facilities and services, and the importance of those
elements to their recreation experience. Visitors were asked to rate the specific site or area at
which they were interviewed. Visitors rated both the importance and performance (satisfaction with)
of these elements using a 5-point scale. The Likert scale for importance ranged from not important
to very important. The Likert scale for performance ranged from very dissatisfied to very satisfied.
Although the satisfaction ratings specifically referenced the area where the visitor was interviewed,
the survey design does not usually have enough responses for any individual site or area on the
forest to present information at a site level. Rather, the information is generalized to overall
satisfaction within the three site types: Day Use Developed (DUDS), Overnight Use Developed
(OUDS), General Forest Areas, and on the forest as a whole.
The satisfaction responses are analyzed in several ways. First, a graph of overall satisfaction is
presented in Figure 5. Next, two aggregate measures were calculated from the set of individual
elements. The satisfaction elements most readily controlled by managers were aggregated into four
categories: developed facilities, access, services, and visitor safety. The site types sampled were
aggregated into three groups: developed sites (includes both day use and overnight developed
sites), dispersed areas, and designated Wilderness. The first aggregate measure is called
“Percent Satisfied Index (PSI)”, which is the proportion of all ratings for the elements in the category
where the satisfaction ratings had a numerical rating of 4 or 5. Conceptually, the PSI indicator
shows the percent of all recreation customers who are satisfied with agency performance. The
agency’s national target for this measure is 85%. It is usually difficult to consistently have a higher
satisfaction score than 85% since given tradeoffs among user groups and other factors. Table 18
displays the aggregate PSI scores for this forest.
Another aggregate measure of satisfaction is called “Percent Meet Expectations (PME)”. This is
the proportion of satisfaction ratings in which the numerical satisfaction rating for a particular
element is equal to or greater than the importance rating for that element. This indicator tracks the
congruence between the agency’s performance and customer evaluations of importance. The idea
behind this measure is that those elements with higher importance levels must have higher
performance levels. Figure 6 displays the PME scores by type of site. Lower scores indicate a gap
between desires and performance.
An Importance-Performance Analysis (IPA) (Hudson, et al, Feb 2004) was calculated for the
importance and satisfaction scores. A target level of importance and performance divides the
possible set of score pairs into four quadrants. For this work, the target level of both was a
numerical score of 4.0. Each quadrant has a title that helps in interpreting responses that fall into it,
and that provides some general guidance for management. These can be described as:
National Visitor Use Monitoring Program6/20/2012 28
National Visitor Use Monitoring Results Gila NF (FY 2011)
1. Importance at or above 4.0, Satisfaction at or above 4.0: Keep up the good work. These are
items that are important to visitors and ones that the forest is performing quite well;
2. Importance at or above 4.0, Satisfaction under 4.0: Concentrate here. These are important
items to the public, but performance is not where it needs to be. Increasing effort here is likely to
have the greatest payoff in overall customer satisfaction;
3. Importance below 4.0, Satisfaction above 4.0: Possible overkill. These are items that are not
highly important to visitors, but the forest’s performance is quite good. It may be possible to
reduce effort here without greatly harming overall satisfaction;
4. Importance below 4.0; Satisfaction below 4.0: Low Priority. These are items where
performance is not very good, but neither are they important to visitors. Focusing effort here is
unlikely to have a great impact.
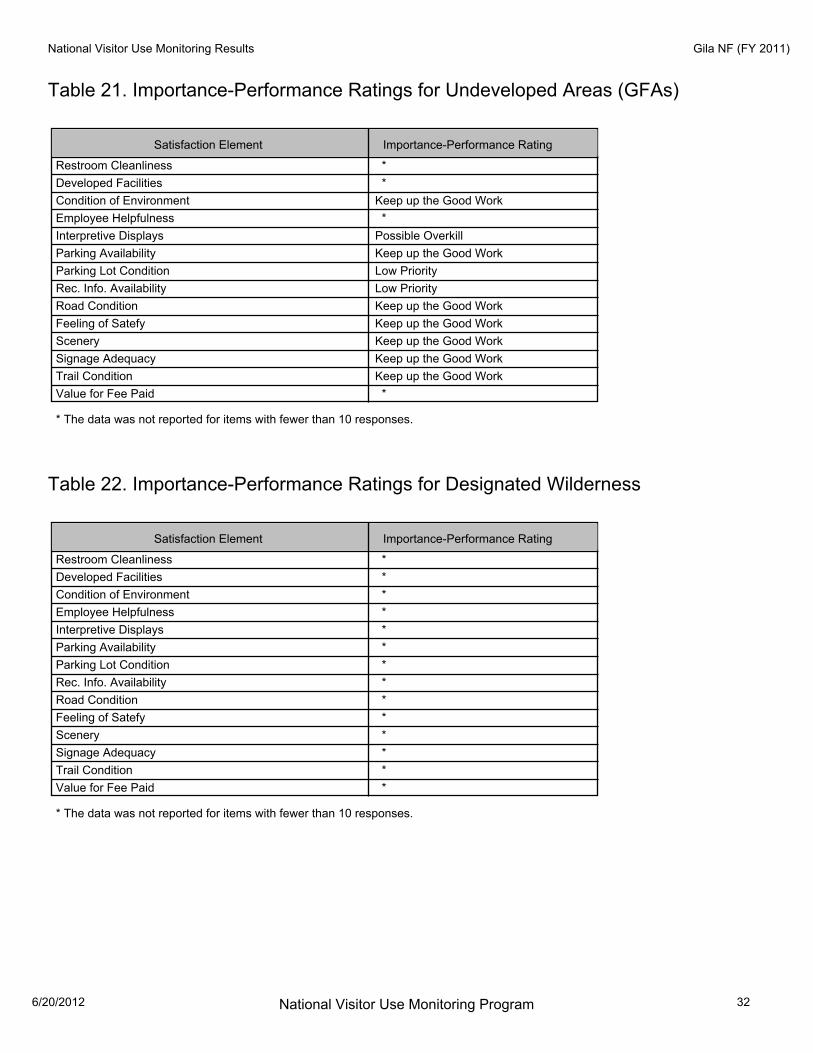
We present tables that show the I-P rating title for each satisfaction element. Each sitetype is
presented in a separate table. Results are presented in Tables 19 - 22.
The numerical scores for visitor satisfaction and importance for each element by site type, and the
sample sizes for each are presented in Appendix B (Tables B1 - B4). Most managers find it difficult
to discern meaning from these raw tables; however they may wish to examine specific elements
once they have reviewed the other satisfaction information presented in this section. Note that if an
element had fewer than 10 responses no analyses are performed, as there are too few responses
to provide reliable information. Finally, visitors were asked about their overall satisfaction with and
the importance of road condition and the adequacy of signage. Figure 7a and Figure 7b show the
results.
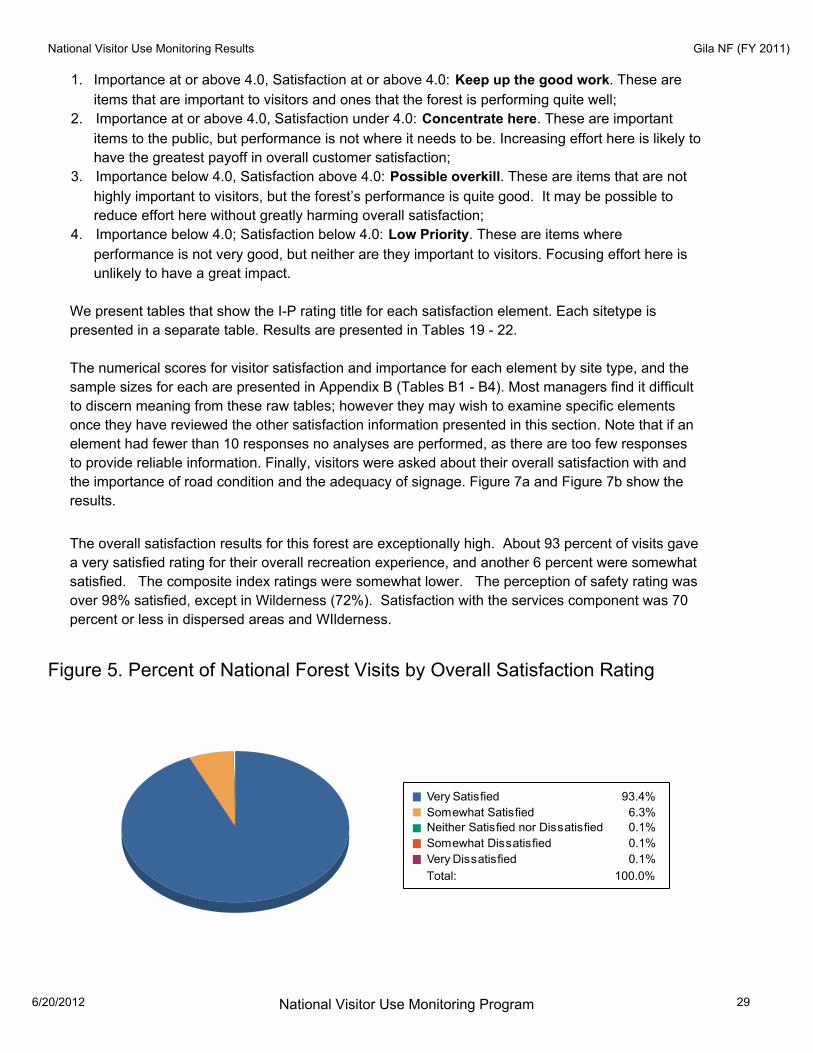
The overall satisfaction results for this forest are exceptionally high. About 93 percent of visits gave
a very satisfied rating for their overall recreation experience, and another 6 percent were somewhat
satisfied. The composite index ratings were somewhat lower. The perception of safety rating was
over 98% satisfied, except in Wilderness (72%). Satisfaction with the services component was 70
percent or less in dispersed areas and WIlderness.
Figure 5. Percent of National Forest Visits by Overall Satisfaction Rating
Very Satisfied 93.4%
Somewhat Satisfied 6.3%Neither Satisfied nor Dissatisfied 0.1%
Somewhat Dissatisfied 0.1%
Very Dissatisfied 0.1%
Total: 100.0%
National Visitor Use Monitoring Program6/20/2012 29

National Visitor Use Monitoring Results Gila NF (FY 2011)
Table 18. Percent Satisfied Index† Scores for Aggregate Categories
Satisfied Survey Respondents (%)
Designated WildernessUndeveloped Areas (GFAs)Developed Sites‡
Satisfaction Element
Developed Facilities 97.1 97.4 60.3
Access 95.0 83.5 62.9
Services 83.8 70.2 65.3
Feeling of Safety 98.4 99.8 71.9
† This is a composite rating. It is the proportion of satisfaction ratings scored by visitors as good (4) or very good (5).
Computed as the percentage of all ratings for the elements within the sub grouping that are at or above the target level,
and indicates the percent of all visitors that are reasonably well satisfied with agency performance.
‡ This category includes both Day Use and Overnight Use Developed Sites.
Figure 6. Percent Meets Expectations Scores*
0
20
40
60
80
100
Developed Facilities Access Services Feeling of Safety
Developed Sites‡
Undeveloped Areas
(GFAs)
Designated Wilderness
‡ This category includes both Day Use and Overnight Use Developed Sites.
* “Percent Meet Expectations (PME)” is the proportion of satisfaction ratings in which the numerical satisfaction rating for
a particular element is equal to or greater than the importance rating for that element. This indicator tracks the
congruence between the agency’s performance and customer evaluations of importance. The idea behind this measure
is that those elements with higher importance levels must have higher performance levels. Lower scores indicate a gap
between desires and performance.
National Visitor Use Monitoring Program6/20/2012 30

National Visitor Use Monitoring Results Gila NF (FY 2011)
Table 19. Importance-Performance Ratings for Day Use Developed Sites
Importance-Performance RatingSatisfaction Element
Restroom Cleanliness Keep up the Good Work
Developed Facilities Keep up the Good Work
Condition of Environment Keep up the Good Work
Employee Helpfulness Keep up the Good Work
Interpretive Displays Keep up the Good Work
Parking Availability Keep up the Good Work
Parking Lot Condition Keep up the Good Work
Rec. Info. Availability Keep up the Good Work
Road Condition Keep up the Good Work
Feeling of Satefy Keep up the Good Work
Scenery Keep up the Good Work
Signage Adequacy Keep up the Good Work
Trail Condition Keep up the Good Work
Value for Fee Paid Keep up the Good Work
Table 20. Importance-Performance Ratings for Overnight Developed Sites
Importance-Performance RatingSatisfaction Element
Restroom Cleanliness Keep up the Good Work
Developed Facilities Keep up the Good Work
Condition of Environment Keep up the Good Work
Employee Helpfulness Keep up the Good Work
Interpretive Displays Keep up the Good Work
Parking Availability Keep up the Good Work
Parking Lot Condition Keep up the Good Work
Rec. Info. Availability Keep up the Good Work
Road Condition Keep up the Good Work
Feeling of Satefy Keep up the Good Work
Scenery Keep up the Good Work
Signage Adequacy Keep up the Good Work
Trail Condition *
Value for Fee Paid *
* The data was not reported for items with fewer than 10 responses.
National Visitor Use Monitoring Program6/20/2012 31
National Visitor Use Monitoring Results Gila NF (FY 2011)
Table 21. Importance-Performance Ratings for Undeveloped Areas (GFAs)
Importance-Performance RatingSatisfaction Element
Restroom Cleanliness *
Developed Facilities *
Condition of Environment Keep up the Good Work
Employee Helpfulness *
Interpretive Displays Possible Overkill
Parking Availability Keep up the Good Work
Parking Lot Condition Low Priority
Rec. Info. Availability Low Priority
Road Condition Keep up the Good Work
Feeling of Satefy Keep up the Good Work
Scenery Keep up the Good Work
Signage Adequacy Keep up the Good Work
Trail Condition Keep up the Good Work
Value for Fee Paid *
* The data was not reported for items with fewer than 10 responses.
Table 22. Importance-Performance Ratings for Designated Wilderness
Importance-Performance RatingSatisfaction Element
Restroom Cleanliness *
Developed Facilities *
Condition of Environment *
Employee Helpfulness *
Interpretive Displays *
Parking Availability *
Parking Lot Condition *
Rec. Info. Availability *
Road Condition *
Feeling of Satefy *
Scenery *
Signage Adequacy *
Trail Condition *
Value for Fee Paid *
* The data was not reported for items with fewer than 10 responses.
National Visitor Use Monitoring Program6/20/2012 32

National Visitor Use Monitoring Results Gila NF (FY 2011)
0%
10%
20%
30%
40%
50%
60%
70%
80%
90%
100%
Roads Signage
Not Applicable
Very Dissatisf ied
Somew hat Dissatisf ied
Neither Satisf ied nor
Dissatisf ied
Somew hat Satisf ied
Very Satisf ied
0%
10%
20%
30%
40%
50%
60%
70%
80%
90%
100%
Roads Signage
1 (Low)2
3
4
5 (High)
Figure 7a. Satisfaction with Forest-wide Road Conditions & Signage Adequacy
Figure 7b. Importance of Forest-wide Road Conditions & Signage Adequacy
National Visitor Use Monitoring Program6/20/2012 33
National Visitor Use Monitoring Results Gila NF (FY 2011)
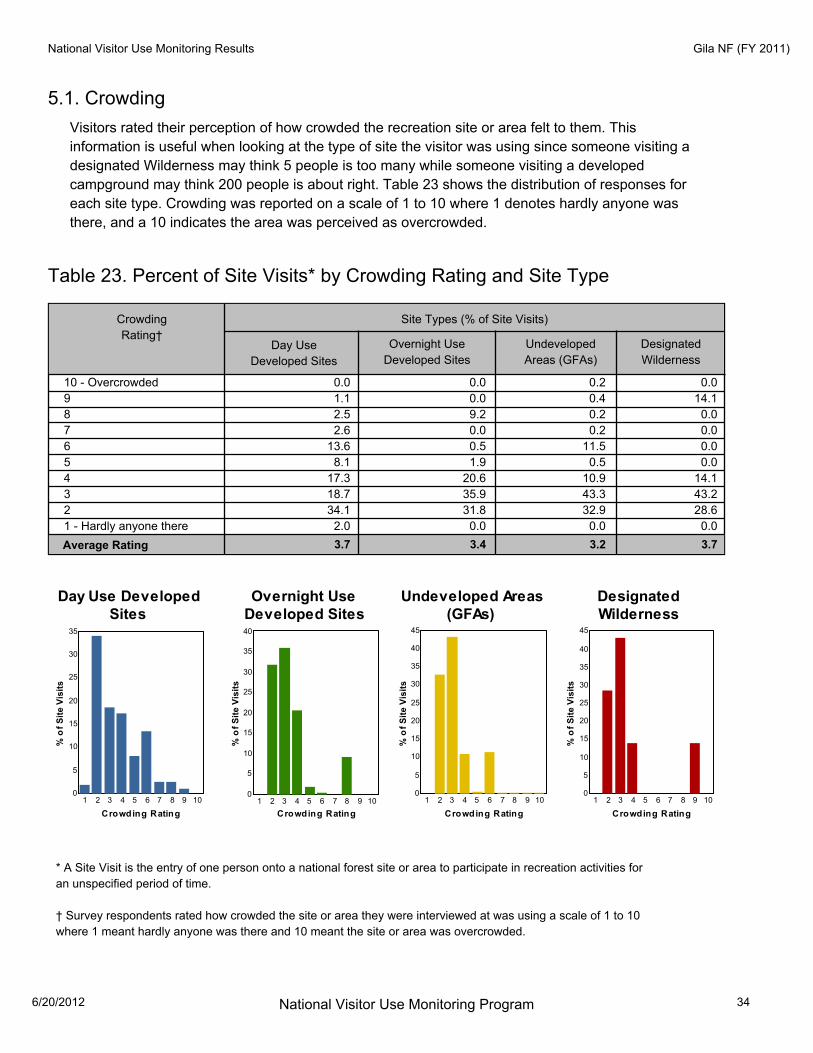
5.1. Crowding
Visitors rated their perception of how crowded the recreation site or area felt to them. This
information is useful when looking at the type of site the visitor was using since someone visiting a
designated Wilderness may think 5 people is too many while someone visiting a developed
campground may think 200 people is about right. Table 23 shows the distribution of responses for
each site type. Crowding was reported on a scale of 1 to 10 where 1 denotes hardly anyone was
there, and a 10 indicates the area was perceived as overcrowded.
Table 23. Percent of Site Visits* by Crowding Rating and Site Type
Site Types (% of Site Visits)
Designated
Wilderness
Undeveloped
Areas (GFAs)
Overnight Use
Developed SitesDay Use
Developed Sites
Crowding
Rating†
10 - Overcrowded 0.0 0.2 0.0 0.0
9 1.1 0.4 0.0 14.1
8 2.5 0.2 9.2 0.0
7 2.6 0.2 0.0 0.0
6 13.6 11.5 0.5 0.0
5 8.1 0.5 1.9 0.0
4 17.3 10.9 20.6 14.1
3 18.7 43.3 35.9 43.2
2 34.1 32.9 31.8 28.6
1 - Hardly anyone there 2.0 0.0 0.0 0.0
Average Rating 3.7 3.4 3.2 3.7
0
5
10
15
20
25
30
35
1 2 3 4 5 6 7 8 9 10
Crowding Rating
% o
f S
ite
Vis
its
Day Use DevelopedSites
0
5
10
15
20
25
30
35
40
1 2 3 4 5 6 7 8 9 10
Crowding Rating
% o
f S
ite
Vis
its
Overnight UseDeveloped Sites
0
5
10
15
20
25
30
35
40
45
1 2 3 4 5 6 7 8 9 10
Crowding Rating
% o
f S
ite
Vis
its
Undeveloped Areas(GFAs)
0
5
10
15
20
25
30
35
40
45
1 2 3 4 5 6 7 8 9 10
Crowding Rating
% o
f S
ite
Vis
its
DesignatedWilderness
* A Site Visit is the entry of one person onto a national forest site or area to participate in recreation activities for
an unspecified period of time.
† Survey respondents rated how crowded the site or area they were interviewed at was using a scale of 1 to 10
where 1 meant hardly anyone was there and 10 meant the site or area was overcrowded.
National Visitor Use Monitoring Program6/20/2012 34
National Visitor Use Monitoring Results Gila NF (FY 2011)
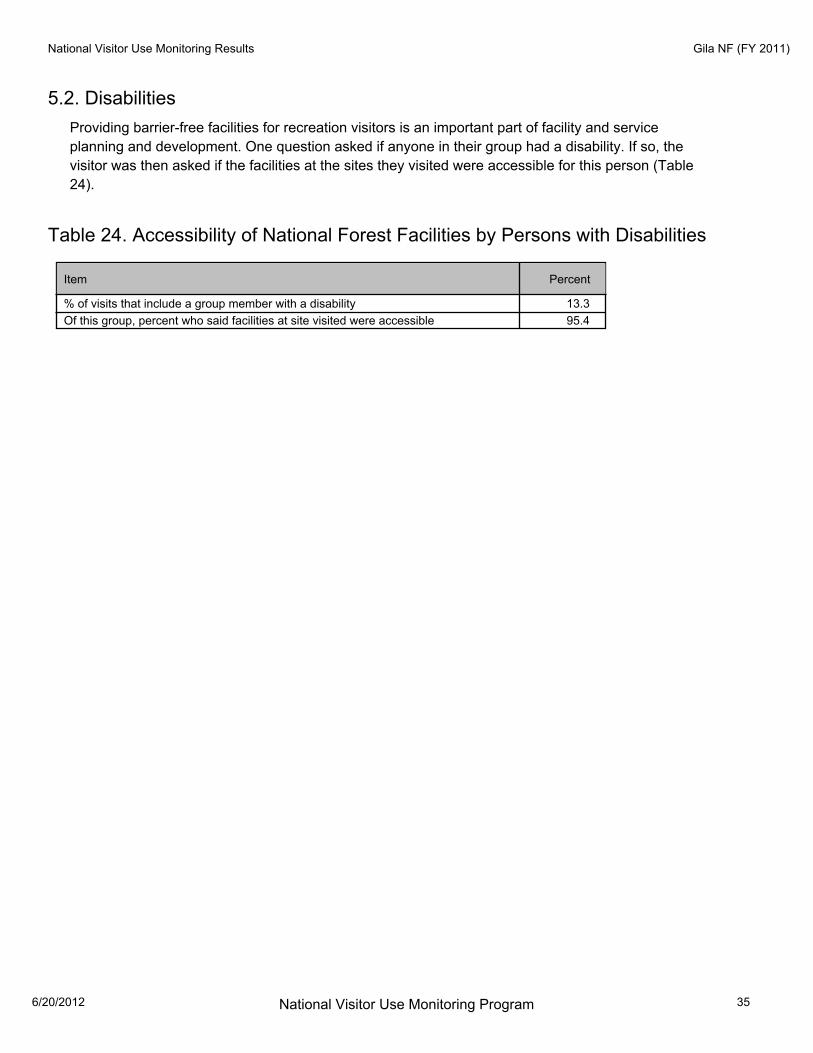
5.2. Disabilities
Providing barrier-free facilities for recreation visitors is an important part of facility and service
planning and development. One question asked if anyone in their group had a disability. If so, the
visitor was then asked if the facilities at the sites they visited were accessible for this person (Table
24).
Table 24. Accessibility of National Forest Facilities by Persons with Disabilities
PercentItem
% of visits that include a group member with a disability 13.3
Of this group, percent who said facilities at site visited were accessible 95.4
National Visitor Use Monitoring Program6/20/2012 35
National Visitor Use Monitoring Results Gila NF (FY 2011)
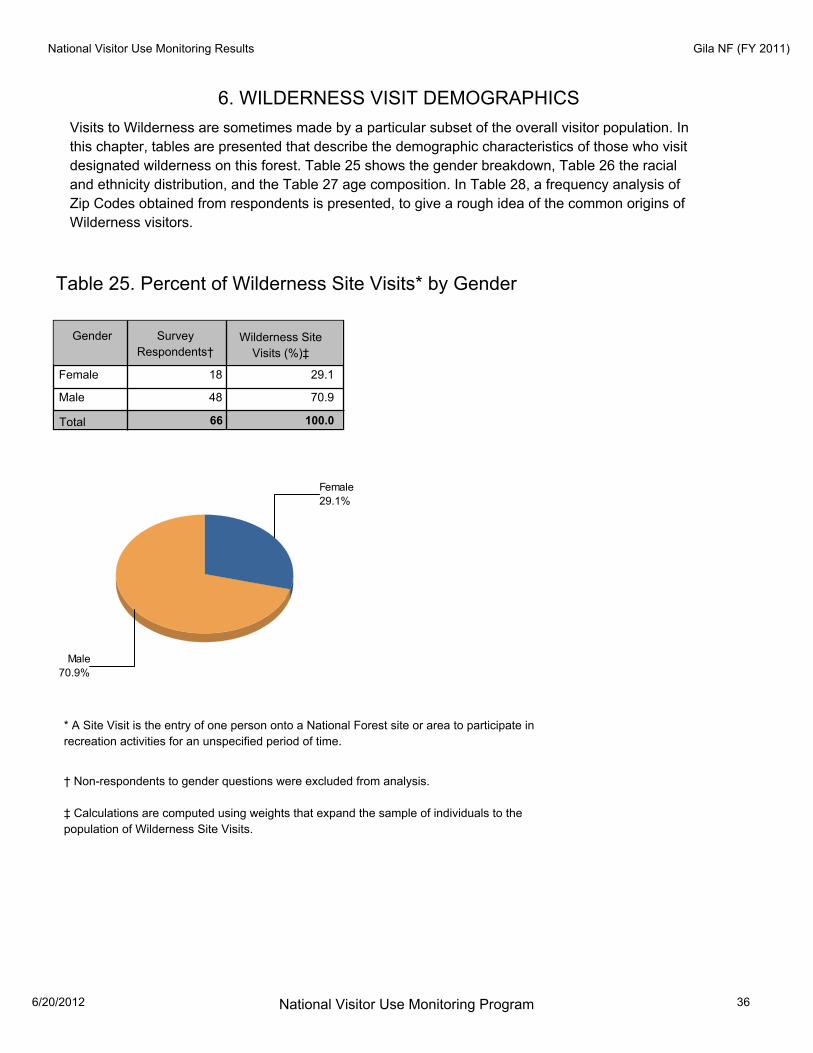
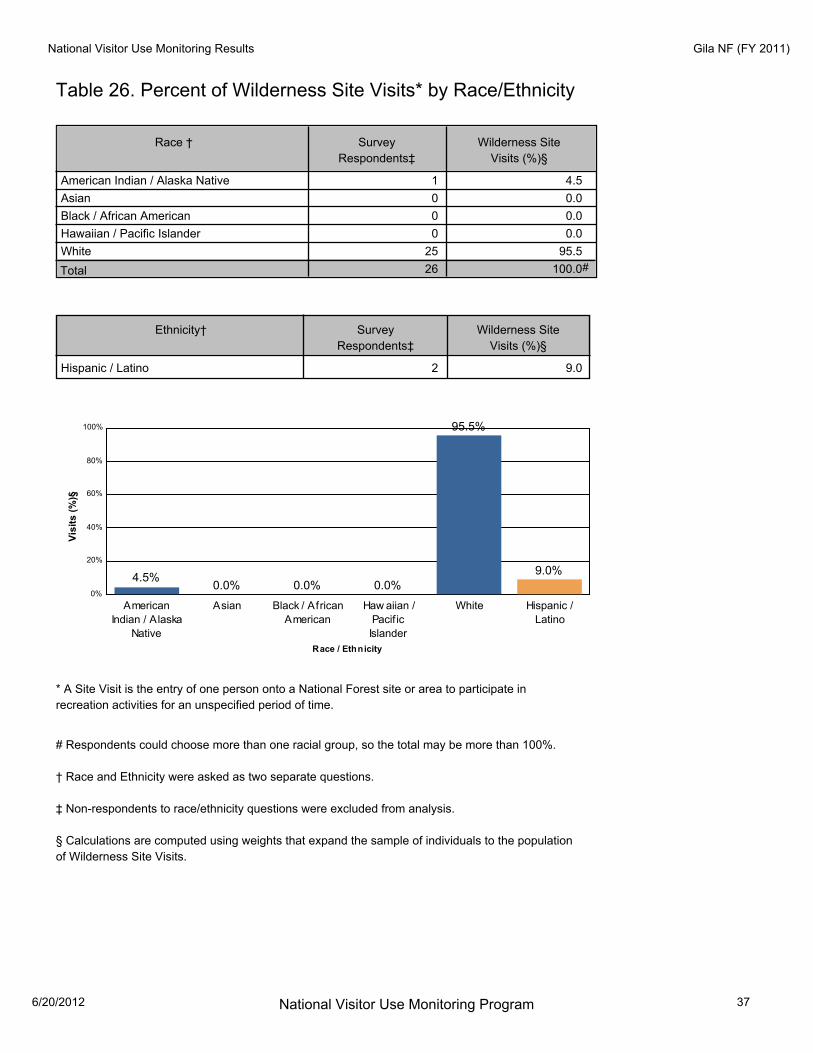
6. WILDERNESS VISIT DEMOGRAPHICS
Visits to Wilderness are sometimes made by a particular subset of the overall visitor population. In
this chapter, tables are presented that describe the demographic characteristics of those who visit
designated wilderness on this forest. Table 25 shows the gender breakdown, Table 26 the racial
and ethnicity distribution, and the Table 27 age composition. In Table 28, a frequency analysis of
Zip Codes obtained from respondents is presented, to give a rough idea of the common origins of
Wilderness visitors.
Table 25. Percent of Wilderness Site Visits* by Gender
Survey
Respondents†
Gender Wilderness Site
Visits (%)‡
Female 29.1 18
Male 70.9 48
Total 66 100.0
29.1%
Female
70.9%
Male
† Non-respondents to gender questions were excluded from analysis.
‡ Calculations are computed using weights that expand the sample of individuals to the
population of Wilderness Site Visits.
* A Site Visit is the entry of one person onto a National Forest site or area to participate in
recreation activities for an unspecified period of time.
National Visitor Use Monitoring Program6/20/2012 36
National Visitor Use Monitoring Results Gila NF (FY 2011)
Table 26. Percent of Wilderness Site Visits* by Race/Ethnicity
Wilderness Site
Visits (%)§
Survey
Respondents‡
Race †
4.5American Indian / Alaska Native 1
0.0Asian 0
0.0Black / African American 0
0.0Hawaiian / Pacific Islander 0
95.5White 25
Total
Hispanic / Latino 9.0
Ethnicity† Survey
Respondents‡
Wilderness Site
Visits (%)§
# 26 100.0
2
0%
20%
40%
60%
80%
100%
American
Indian / Alaska
Native
Asian Black / African
American
Haw aiian /
Pacif ic
Islander
White Hispanic /
Latino
4.5%0.0% 0.0% 0.0%
95.5%
9.0%
Race / Ethnicity
Vis
its
(%
)§
# Respondents could choose more than one racial group, so the total may be more than 100%.
† Race and Ethnicity were asked as two separate questions.
‡ Non-respondents to race/ethnicity questions were excluded from analysis.
§ Calculations are computed using weights that expand the sample of individuals to the population
of Wilderness Site Visits.
* A Site Visit is the entry of one person onto a National Forest site or area to participate in
recreation activities for an unspecified period of time.
National Visitor Use Monitoring Program6/20/2012 37

National Visitor Use Monitoring Results Gila NF (FY 2011)
Table 27. Percent of Wilderness Site Visits* by Age
Wilderness Site Visits (%)‡Age Class
Under 16 7.2
16-19 4.8
20-29 15.4
30-39 15.5
40-49 11.6
50-59 16.4
60-69 27.0
70+ 2.0
Total 99.9
0
4
8
12
16
20
24
28
Under 16 16-19 20-29 30-39 40-49 50-59 60-69 70+
7.2
4.8
15.4 15.5
11.6
16.4
27.0
2.0
Age
Vis
its
(%
)‡
† Non-respondents to age questions were excluded from analysis.
‡ Calculations are computed using weights that expand the sample of individuals to the
population of Wilderness Site Visits.
* A Site Visit is the entry of one person onto a National Forest site or area to participate in
recreation activities for an unspecified period of time.
National Visitor Use Monitoring Program6/20/2012 38

National Visitor Use Monitoring Results Gila NF (FY 2011)
Table 28. Top 15 Most Commonly Reported ZIP Codes, States and Counties
of Wilderness Survey Respondents
Percent of
Respondents
Survey
Respondents (n)
CountyStateZIP Code
88061 New Mexico Grant County 5 21.7
88011 New Mexico Dona Ana County 4 17.4
87110 New Mexico Bernalillo County 2 8.7
88039 New Mexico Catron County 1 4.3
88352 New Mexico Otero County 1 4.3
88042 New Mexico Sierra County 1 4.3
81224 Colorado Gunnison County 1 4.3
88250 New Mexico Eddy County 1 4.3
79424 Texas Lubbock County 1 4.3
85701 Arizona Pima County 1 4.3
85632 Arizona Cochise County 1 4.3
92591 California Riverside County 1 4.3
79912 Texas El Paso County 1 4.3
01027 Massachusetts Hampshire County 1 4.3
88038 New Mexico Grant County 1 4.3
* Includes respondents reporting no ZIP code or an invalid ZIP code.
National Visitor Use Monitoring Program6/20/2012 39
National Visitor Use Monitoring Results Gila NF (FY 2011)
7. APPENDIX TABLES
National Visitor Use Monitoring Program6/20/2012 40
National Visitor Use Monitoring Results Gila NF (FY 2011)
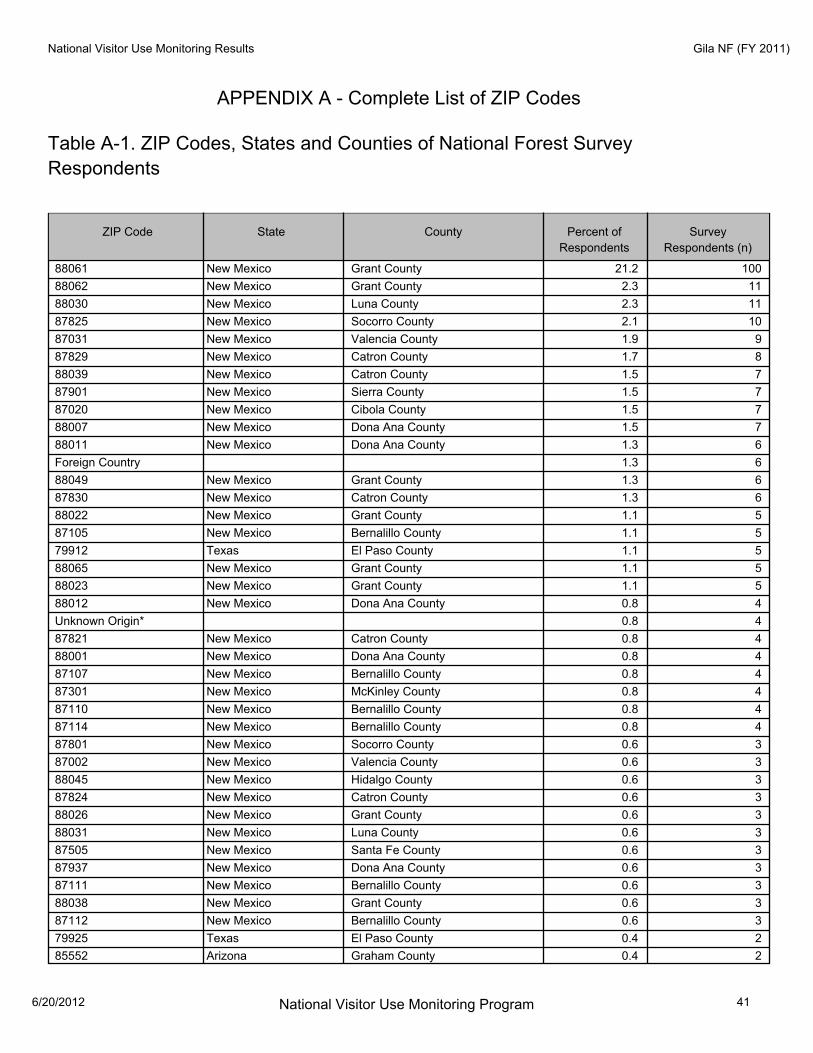
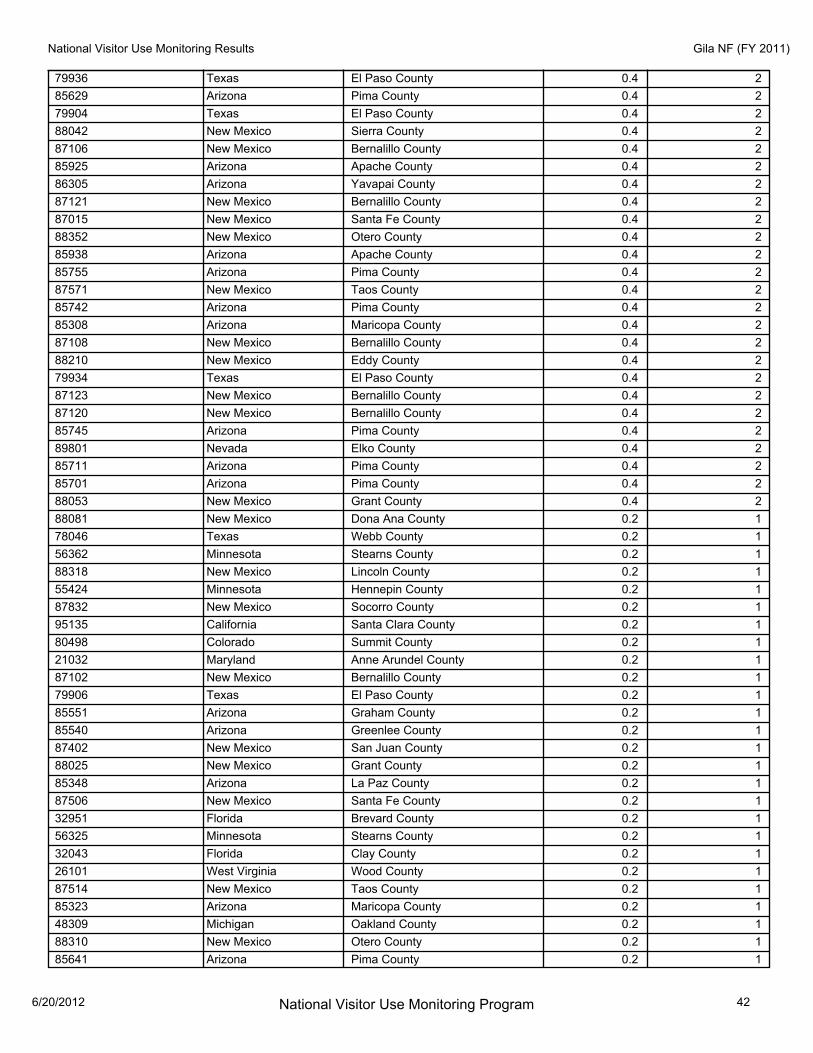
APPENDIX A - Complete List of ZIP Codes
Table A-1. ZIP Codes, States and Counties of National Forest Survey
Respondents
Percent of
Respondents
Survey
Respondents (n)
CountyStateZIP Code
88061 New Mexico Grant County 100 21.2
88062 New Mexico Grant County 11 2.3
88030 New Mexico Luna County 11 2.3
87825 New Mexico Socorro County 10 2.1
87031 New Mexico Valencia County 9 1.9
87829 New Mexico Catron County 8 1.7
88039 New Mexico Catron County 7 1.5
87901 New Mexico Sierra County 7 1.5
87020 New Mexico Cibola County 7 1.5
88007 New Mexico Dona Ana County 7 1.5
88011 New Mexico Dona Ana County 6 1.3
Foreign Country 6 1.3
88049 New Mexico Grant County 6 1.3
87830 New Mexico Catron County 6 1.3
88022 New Mexico Grant County 5 1.1
87105 New Mexico Bernalillo County 5 1.1
79912 Texas El Paso County 5 1.1
88065 New Mexico Grant County 5 1.1
88023 New Mexico Grant County 5 1.1
88012 New Mexico Dona Ana County 4 0.8
Unknown Origin* 4 0.8
87821 New Mexico Catron County 4 0.8
88001 New Mexico Dona Ana County 4 0.8
87107 New Mexico Bernalillo County 4 0.8
87301 New Mexico McKinley County 4 0.8
87110 New Mexico Bernalillo County 4 0.8
87114 New Mexico Bernalillo County 4 0.8
87801 New Mexico Socorro County 3 0.6
87002 New Mexico Valencia County 3 0.6
88045 New Mexico Hidalgo County 3 0.6
87824 New Mexico Catron County 3 0.6
88026 New Mexico Grant County 3 0.6
88031 New Mexico Luna County 3 0.6
87505 New Mexico Santa Fe County 3 0.6
87937 New Mexico Dona Ana County 3 0.6
87111 New Mexico Bernalillo County 3 0.6
88038 New Mexico Grant County 3 0.6
87112 New Mexico Bernalillo County 3 0.6
79925 Texas El Paso County 2 0.4
85552 Arizona Graham County 2 0.4
National Visitor Use Monitoring Program6/20/2012 41
National Visitor Use Monitoring Results Gila NF (FY 2011)
79936 Texas El Paso County 2 0.4
85629 Arizona Pima County 2 0.4
79904 Texas El Paso County 2 0.4
88042 New Mexico Sierra County 2 0.4
87106 New Mexico Bernalillo County 2 0.4
85925 Arizona Apache County 2 0.4
86305 Arizona Yavapai County 2 0.4
87121 New Mexico Bernalillo County 2 0.4
87015 New Mexico Santa Fe County 2 0.4
88352 New Mexico Otero County 2 0.4
85938 Arizona Apache County 2 0.4
85755 Arizona Pima County 2 0.4
87571 New Mexico Taos County 2 0.4
85742 Arizona Pima County 2 0.4
85308 Arizona Maricopa County 2 0.4
87108 New Mexico Bernalillo County 2 0.4
88210 New Mexico Eddy County 2 0.4
79934 Texas El Paso County 2 0.4
87123 New Mexico Bernalillo County 2 0.4
87120 New Mexico Bernalillo County 2 0.4
85745 Arizona Pima County 2 0.4
89801 Nevada Elko County 2 0.4
85711 Arizona Pima County 2 0.4
85701 Arizona Pima County 2 0.4
88053 New Mexico Grant County 2 0.4
88081 New Mexico Dona Ana County 1 0.2
78046 Texas Webb County 1 0.2
56362 Minnesota Stearns County 1 0.2
88318 New Mexico Lincoln County 1 0.2
55424 Minnesota Hennepin County 1 0.2
87832 New Mexico Socorro County 1 0.2
95135 California Santa Clara County 1 0.2
80498 Colorado Summit County 1 0.2
21032 Maryland Anne Arundel County 1 0.2
87102 New Mexico Bernalillo County 1 0.2
79906 Texas El Paso County 1 0.2
85551 Arizona Graham County 1 0.2
85540 Arizona Greenlee County 1 0.2
87402 New Mexico San Juan County 1 0.2
88025 New Mexico Grant County 1 0.2
85348 Arizona La Paz County 1 0.2
87506 New Mexico Santa Fe County 1 0.2
32951 Florida Brevard County 1 0.2
56325 Minnesota Stearns County 1 0.2
32043 Florida Clay County 1 0.2
26101 West Virginia Wood County 1 0.2
87514 New Mexico Taos County 1 0.2
85323 Arizona Maricopa County 1 0.2
48309 Michigan Oakland County 1 0.2
88310 New Mexico Otero County 1 0.2
85641 Arizona Pima County 1 0.2
National Visitor Use Monitoring Program6/20/2012 42

National Visitor Use Monitoring Results Gila NF (FY 2011)
87104 New Mexico Bernalillo County 1 0.2
85548 Arizona Graham County 1 0.2
59457 Montana Fergus County 1 0.2
86025 Arizona Navajo County 1 0.2
94602 California Alameda County 1 0.2
45239 Ohio Hamilton County 1 0.2
19806 Delaware New Castle County 1 0.2
21532 Maryland Allegany County 1 0.2
79902 Texas El Paso County 1 0.2
85936 Arizona Apache County 1 0.2
87823 New Mexico Socorro County 1 0.2
85710 Arizona Pima County 1 0.2
80538 Colorado Larimer County 1 0.2
87124 New Mexico Sandoval County 1 0.2
85748 Arizona Pima County 1 0.2
81224 Colorado Gunnison County 1 0.2
87113 New Mexico Bernalillo County 1 0.2
85364 Arizona Yuma County 1 0.2
81040 Colorado Huerfano County 1 0.2
85705 Arizona Pima County 1 0.2
87035 New Mexico Torrance County 1 0.2
74063 Oklahoma Tulsa County 1 0.2
27817 North Carolina Beaufort County 1 0.2
85713 Arizona Pima County 1 0.2
88250 New Mexico Eddy County 1 0.2
85543 Arizona Graham County 1 0.2
85747 Arizona Pima County 1 0.2
88340 New Mexico Otero County 1 0.2
36507 Alabama Baldwin County 1 0.2
88002 New Mexico Dona Ana County 1 0.2
88047 New Mexico Dona Ana County 1 0.2
99587 Alaska Anchorage Borough 1 0.2
91932 California San Diego County 1 0.2
52244 Iowa Johnson County 1 0.2
56572 Minnesota Otter Tail County 1 0.2
87109 New Mexico Bernalillo County 1 0.2
77304 Texas Montgomery County 1 0.2
94114 California San Francisco County 1 0.2
88043 New Mexico Grant County 1 0.2
76008 Texas Parker County 1 0.2
04092 Maine Cumberland County 1 0.2
79915 Texas El Paso County 1 0.2
79922 Texas El Paso County 1 0.2
85622 Arizona Pima County 1 0.2
55104 Minnesota Ramsey County 1 0.2
79424 Texas Lubbock County 1 0.2
92084 California San Diego County 1 0.2
82070 Wyoming Albany County 1 0.2
05602 Vermont Washington County 1 0.2
04103 Maine Cumberland County 1 0.2
17112 Pennsylvania Dauphin County 1 0.2
National Visitor Use Monitoring Program6/20/2012 43
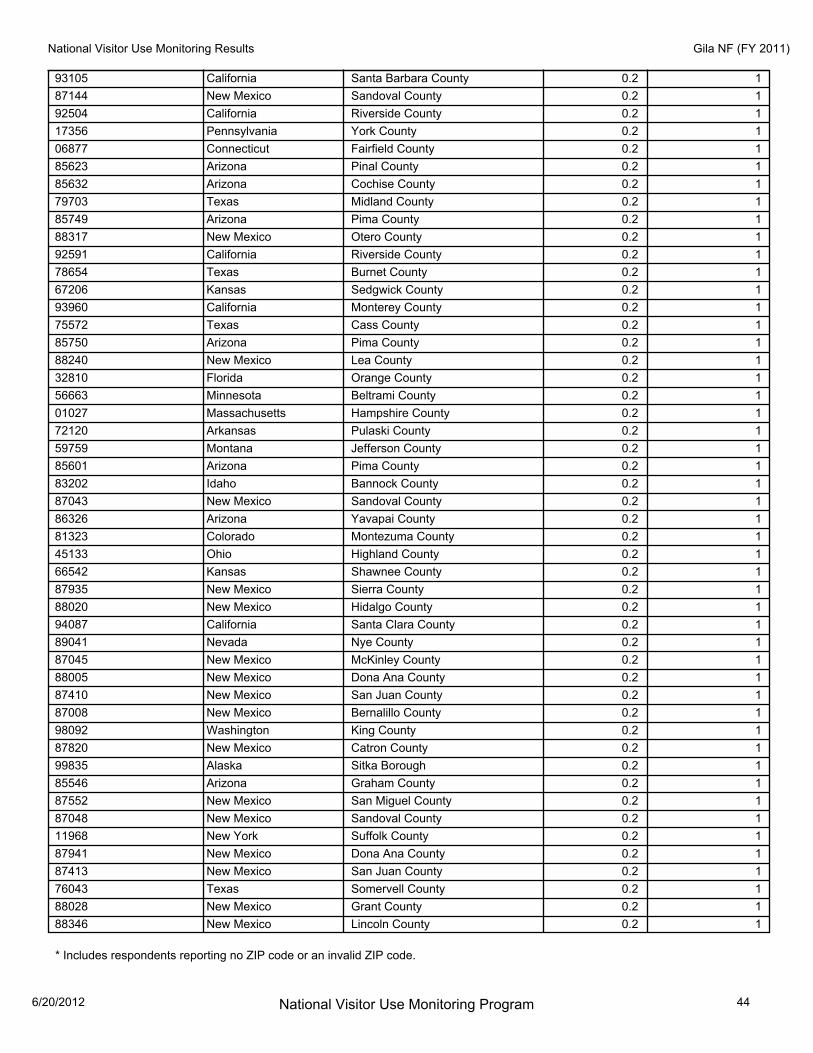
National Visitor Use Monitoring Results Gila NF (FY 2011)
93105 California Santa Barbara County 1 0.2
87144 New Mexico Sandoval County 1 0.2
92504 California Riverside County 1 0.2
17356 Pennsylvania York County 1 0.2
06877 Connecticut Fairfield County 1 0.2
85623 Arizona Pinal County 1 0.2
85632 Arizona Cochise County 1 0.2
79703 Texas Midland County 1 0.2
85749 Arizona Pima County 1 0.2
88317 New Mexico Otero County 1 0.2
92591 California Riverside County 1 0.2
78654 Texas Burnet County 1 0.2
67206 Kansas Sedgwick County 1 0.2
93960 California Monterey County 1 0.2
75572 Texas Cass County 1 0.2
85750 Arizona Pima County 1 0.2
88240 New Mexico Lea County 1 0.2
32810 Florida Orange County 1 0.2
56663 Minnesota Beltrami County 1 0.2
01027 Massachusetts Hampshire County 1 0.2
72120 Arkansas Pulaski County 1 0.2
59759 Montana Jefferson County 1 0.2
85601 Arizona Pima County 1 0.2
83202 Idaho Bannock County 1 0.2
87043 New Mexico Sandoval County 1 0.2
86326 Arizona Yavapai County 1 0.2
81323 Colorado Montezuma County 1 0.2
45133 Ohio Highland County 1 0.2
66542 Kansas Shawnee County 1 0.2
87935 New Mexico Sierra County 1 0.2
88020 New Mexico Hidalgo County 1 0.2
94087 California Santa Clara County 1 0.2
89041 Nevada Nye County 1 0.2
87045 New Mexico McKinley County 1 0.2
88005 New Mexico Dona Ana County 1 0.2
87410 New Mexico San Juan County 1 0.2
87008 New Mexico Bernalillo County 1 0.2
98092 Washington King County 1 0.2
87820 New Mexico Catron County 1 0.2
99835 Alaska Sitka Borough 1 0.2
85546 Arizona Graham County 1 0.2
87552 New Mexico San Miguel County 1 0.2
87048 New Mexico Sandoval County 1 0.2
11968 New York Suffolk County 1 0.2
87941 New Mexico Dona Ana County 1 0.2
87413 New Mexico San Juan County 1 0.2
76043 Texas Somervell County 1 0.2
88028 New Mexico Grant County 1 0.2
88346 New Mexico Lincoln County 1 0.2
* Includes respondents reporting no ZIP code or an invalid ZIP code.
National Visitor Use Monitoring Program6/20/2012 44

National Visitor Use Monitoring Results Gila NF (FY 2011)
APPENDIX B - Detailed Satisfaction Results
Table B-1. Satisfaction for Visits to Day Use Developed Sites
Percent Rating Satisfaction as:
Mean
Importance†
No.
Obs‡
Mean
Rating§
Very
Satisfied
Somewhat
Satisfied
Neither
Satisfied nor
Dissatisfied
Somewhat
Dissatisfied
Very
Dissatisfied
Satisfaction Element
0.0 4.7 2.3 8.0 85.0 4.7 4.8 76Restroom Cleanliness
0.0 0.0 0.0 9.6 90.4 4.9 4.6 81Developed Facilities
0.3 0.0 0.4 11.2 88.0 4.9 4.9 86Condition of Environment
0.0 0.0 3.3 3.3 93.3 4.9 4.5 58Employee Helpfulness
6.4 2.1 6.7 24.8 59.9 4.3 4.4 77Interpretive Displays
0.0 0.0 0.0 8.1 91.9 4.9 4.4 87Parking Availability
0.0 2.1 2.1 14.1 81.7 4.8 4.1 81Parking Lot Condition
3.2 4.9 15.8 16.5 59.6 4.2 4.5 81Rec. Info. Availability
0.0 0.0 8.6 33.0 58.4 4.5 4.6 73Road Condition
0.0 0.0 2.0 5.3 92.7 4.9 4.7 87Feeling of Satefy
0.0 0.0 0.4 10.2 89.4 4.9 4.8 87Scenery
0.9 8.6 12.4 5.0 73.1 4.4 4.6 84Signage Adequacy
0.0 0.0 3.3 17.9 78.7 4.8 4.5 57Trail Condition
0.5 0.0 3.6 3.9 92.1 4.9 4.5 56Value for Fee Paid
NOTE: The data was not reported for items with fewer than 10 responses. Satisfaction and
Importance were asked as two separate questions so one of these may have 10 responses even
though the other does not.
§ Scale: Very Dissatisfied = 1, Somewhat Dissatisfied = 2, Neither Satisfied nor Dissatisfied =
3, Somewhat Satisfied = 4, Very Satisfied = 5
† Scale: Not Important = 1, Somewhat Important = 2, Moderately Important = 3, Important = 4,
Very Important = 5
‡ No. Obs is the number of survey respondents who responded to this item.
National Visitor Use Monitoring Program6/20/2012 45

National Visitor Use Monitoring Results Gila NF (FY 2011)
Table B-2. Satisfaction for Visits to Overnight Developed Sites
Percent Rating Satisfaction as:
Mean
Importance†
No.
Obs‡
Mean
Rating§
Very
Satisfied
Somewhat
Satisfied
Neither
Satisfied nor
Dissatisfied
Somewhat
Dissatisfied
Very
Dissatisfied
Satisfaction Element
0.3 0.0 0.0 10.5 89.3 4.9 5.0 21Restroom Cleanliness
0.0 1.9 0.0 28.0 70.1 4.7 5.0 22Developed Facilities
0.0 0.0 0.0 13.1 86.9 4.9 4.9 23Condition of Environment
0.0 0.0 0.0 0.0 100.0 5.0 5.0 14Employee Helpfulness
0.0 0.0 12.4 20.5 67.2 4.5 4.7 20Interpretive Displays
0.0 0.0 0.0 0.0 100.0 5.0 5.0 23Parking Availability
0.0 0.0 14.0 0.0 86.0 4.7 4.7 14Parking Lot Condition
0.0 1.9 27.7 2.2 68.2 4.4 4.8 23Rec. Info. Availability
0.0 0.0 20.6 51.0 28.4 4.1 4.8 23Road Condition
0.0 0.0 0.0 9.5 90.5 4.9 5.0 23Feeling of Satefy
0.0 0.0 0.0 9.2 90.8 4.9 4.9 23Scenery
0.0 0.0 0.0 9.2 90.8 4.9 4.9 23Signage Adequacy
0.0 0.0 7.6 0.9 91.5 4.8 10Trail Condition
9Value for Fee Paid
NOTE: The data was not reported for items with fewer than 10 responses. Satisfaction and
Importance were asked as two separate questions so one of these may have 10 responses even
though the other does not.
§ Scale: Very Dissatisfied = 1, Somewhat Dissatisfied = 2, Neither Satisfied nor Dissatisfied =
3, Somewhat Satisfied = 4, Very Satisfied = 5
† Scale: Not Important = 1, Somewhat Important = 2, Moderately Important = 3, Important = 4,
Very Important = 5
‡ No. Obs is the number of survey respondents who responded to this item.
National Visitor Use Monitoring Program6/20/2012 46

National Visitor Use Monitoring Results Gila NF (FY 2011)
Table B-3. Satisfaction for Visits to Undeveloped Areas (GFAs)
Percent Rating Satisfaction as:
Mean
Importance†
No.
Obs‡
Mean
Rating§
Very
Satisfied
Somewhat
Satisfied
Neither
Satisfied nor
Dissatisfied
Somewhat
Dissatisfied
Very
Dissatisfied
Satisfaction Element
4.5 8Restroom Cleanliness
3.2 9Developed Facilities
10.8 0.0 0.2 12.2 76.9 4.4 4.9 27Condition of Environment
4Employee Helpfulness
0.0 0.0 30.0 10.0 60.0 4.3 3.9 10Interpretive Displays
0.0 0.0 32.1 1.1 66.8 4.3 4.3 13Parking Availability
0.0 1.5 86.9 1.5 10.2 3.2 3.2 10Parking Lot Condition
0.0 0.4 71.5 24.5 3.6 3.3 3.8 17Rec. Info. Availability
0.0 0.2 11.0 33.1 55.8 4.4 4.3 25Road Condition
0.0 0.0 0.2 0.2 99.6 5.0 5.0 27Feeling of Satefy
0.0 0.0 0.0 11.1 88.9 4.9 4.8 27Scenery
0.0 0.0 11.0 22.1 67.0 4.6 4.7 26Signage Adequacy
0.0 0.3 0.6 20.3 78.8 4.8 4.6 21Trail Condition
8Value for Fee Paid
NOTE: The data was not reported for items with fewer than 10 responses. Satisfaction and
Importance were asked as two separate questions so one of these may have 10 responses even
though the other does not.
§ Scale: Very Dissatisfied = 1, Somewhat Dissatisfied = 2, Neither Satisfied nor Dissatisfied =
3, Somewhat Satisfied = 4, Very Satisfied = 5
† Scale: Not Important = 1, Somewhat Important = 2, Moderately Important = 3, Important = 4,
Very Important = 5
‡ No. Obs is the number of survey respondents who responded to this item.
National Visitor Use Monitoring Program6/20/2012 47

National Visitor Use Monitoring Results Gila NF (FY 2011)
Table B-4. Satisfaction for Visits to Designated Wilderness*
Percent Rating Satisfaction as:
Mean
Importance†
No.
Obs‡
Mean
Rating§
Very
Satisfied
Somewhat
Satisfied
Neither
Satisfied nor
Dissatisfied
Somewhat
Dissatisfied
Very
Dissatisfied
Satisfaction Element
2Restroom Cleanliness
4Developed Facilities
0.0 0.0 0.0 28.1 71.9 4.7 10Condition of Environment
4Employee Helpfulness
4Interpretive Displays
9Parking Availability
8Parking Lot Condition
7Rec. Info. Availability
9Road Condition
0.0 0.0 28.1 0.0 71.9 4.4 10Feeling of Satefy
0.0 0.0 0.0 14.1 85.9 4.9 10Scenery
0.0 0.0 28.1 28.6 43.2 4.2 10Signage Adequacy
0.0 14.1 14.1 42.7 29.2 3.9 10Trail Condition
1Value for Fee Paid
NOTE: The data was not reported for items with fewer than 10 responses. Satisfaction and
Importance were asked as two separate questions so one of these may have 10 responses even
though the other does not.
§ Scale: Very Dissatisfied = 1, Somewhat Dissatisfied = 2, Neither Satisfied nor Dissatisfied =
3, Somewhat Satisfied = 4, Very Satisfied = 5
† Scale: Not Important = 1, Somewhat Important = 2, Moderately Important = 3, Important = 4,
Very Important = 5
‡ No. Obs is the number of survey respondents who responded to this item.
* Data supplied is for all Designated Wilderness on the forest combined. Data was not
collected for satisfaction for each individual Wilderness on the forest.
National Visitor Use Monitoring Program6/20/2012 48