appendix 14 air quality impact assessment
TRANSCRIPT

Appendix 14
Air Quality Impact Assessment
HODGSON QUARRY PRODUCTS
SAND EXTRACTION
ROBERTS ROAD, MAROOTA AIR QUALITY IMPACT ASSESSMENT
REPORT NO. 14229
VERSION B
JUNE 2015
PREPARED FOR
HODGSON QUARRY PRODUCTS PTY LTD
PO BOX 1778
GOSFORD NSW 2250

HODGSON QUARRY PRODUCTS
SAND EXTRACTION
ROBERTS ROAD, MAROOTA
AIR QUALITY IMPACT ASSESSMENT REPORT NO. 14229 VERSION B
DOCUMENT CONTROL
Version Status Date Prepared By Reviewed By
A Draft 25 October 2014 John Wassermann Brian Clarke
B Draft 13 June 2015 Nic Hall John Wassermann
Note
All materials specified by Wilkinson Murray Pty Limited have been selected solely on the basis of acoustic performance.
Any other properties of these materials, such as fire rating, chemical properties etc. should be checked with the suppliers
or other specialised bodies for fitness for a given purpose. The information contained in this document produced
by Wilkinson Murray is solely for the use of the client identified on the front page of this report. Our client becomes the
owner of this document upon full payment of our Tax Invoice for its provision. This document must not be used for any
purposes other than those of the document’s owner. Wilkinson Murray undertakes no duty to or accepts any responsibility
to any third party who may rely upon this document.
Quality Assurance
We are committed to and have implemented AS/NZS ISO 9001:2008 “Quality Management Systems –
Requirements”. This management system has been externally certified and Licence No. QEC 13457 has
been issued.
AAAC
This firm is a member firm of the Association of Australian Acoustical Consultants and the work here
reported has been carried out in accordance with the terms of that membership.
Celebrating 50 Years in 2012
Wilkinson Murray is an independent firm established in 1962, originally as Carr & Wilkinson.
In 1976 Barry Murray joined founding partner Roger Wilkinson and the firm adopted the name which
remains today. From a successful operation in Australia, Wilkinson Murray expanded its reach into Asia
by opening a Hong Kong office early in 2006. 2010 saw the introduction of our Queensland office and
2011 the introduction of our Orange office to service a growing client base in these regions. From these
offices, Wilkinson Murray services the entire Asia-Pacific region.

HODGSON QUARRY PRODUCTS
SAND EXTRACTION
ROBERTS ROAD, MAROOTA
AIR QUALITY IMPACT ASSESSMENT REPORT NO. 14229 VERSION B
TABLE OF CONTENTS
Page
GLOSSARY OF AIR QUALITY TERMS
1 INTRODUCTION 1
2 SITE DESCRIPTION, CURRENT & PROPOSED OPERATION 2
2.1 The Existing Site 2
2.2 Surrounding Land Use and Sensitive Receptors 2
2.3 Future Operations 3
3 AIR QUALITY ASSESSMENT CRITERIA 5
3.1 NSW Air Quality Criteria 5
3.2 Existing Consent 5
4 LOCAL AIR QUALITY & CURRENT AIR QUALITY IMPACTS 7
5 LOCAL CLIMATE & DISPERSION METEOROLOGY & POTENTIAL DUST
IMPACTS 10
6 MODELLING METHODOLOGY 15
6.1 Meteorological Modelling 15 6.1.1 TAPM 15 6.1.2 AERMET 15
6.2 Dispersion Modelling 15 6.2.1 AERMOD 15 6.2.2 Building Wake Effects 15
7 EMISSIONS TO AIR 16
7.1 North West Extraction 16
7.2 North East Processing 18
7.3 South East Extraction 19
8 ASSESSMENT OF IMPACTS 20
8.1 PM10 Impact Assessment 20
8.2 TSP Impact Assessment 22
8.3 Deposited Dust 23
9 CONCLUSIONS 24

HODGSON QUARRY PRODUCTS
SAND EXTRACTION
ROBERTS ROAD, MAROOTA
AIR QUALITY IMPACT ASSESSMENT REPORT NO. 14229 VERSION B
APPENDIX A – Air Quality Management Plan
APPENDIX B – Emissions Inventory
APPENDIX C – PM10 Contour Plots

HODGSON QUARRY PRODUCTS
SAND EXTRACTION
ROBERTS ROAD, MAROOTA
AIR QUALITY IMPACT ASSESSMENT REPORT NO. 14229 VERSION B
GLOSSARY OF AIR QUALITY TERMS
Air Pollution – The presence of contaminants or pollutant substances in the air that interfere with human
health or welfare, or produce other harmful environmental effects.
Air Quality Standards – The level of pollutants prescribed by regulations that are not to be exceeded
during a given time in a defined area.
Air Toxics – Any air pollutant for which a national ambient air quality standard (NAAQS) does not exist (i.e.
excluding ozone, carbon monoxide, PM-10, sulphur dioxide, nitrogen oxide) that may reasonably be
anticipated to cause cancer; respiratory, cardiovascular, or developmental effects; reproductive
dysfunctions, neurological disorders, heritable gene mutations, or other serious or irreversible chronic or
acute health effects in humans.
Airborne Particulates – Total suspended particulate matter found in the atmosphere as solid particles or
liquid droplets. Chemical composition of particulates varies widely, depending on location and time of year.
Sources of airborne particulates include dust, emissions from industrial processes, combustion products from
the burning of wood and coal, combustion products associated with motor vehicle or non-road engine
exhausts, and reactions to gases in the atmosphere.
Area Source – Any source of air pollution that is released over a relatively small area, but which cannot be
classified as a point source. Such sources may include vehicles and other small engines, small businesses
and household activities, or biogenic sources, such as a forest that releases hydrocarbons, may be referred
to as nonpoint source.
Concentration – The relative amount of a substance mixed with another substance. Examples are 5 ppm
of carbon monoxide in air and 1 mg/l of iron in water.
Emission – Release of pollutants into the air from a source. We say sources emit pollutants.
Emission Factor – The relationship between the amount of pollution produced and the amount of raw material processed. For example, an emission factor for a blast furnace making iron would be the number of pounds of particulates per ton of raw materials.
Emission Inventory – A listing, by source, of the amount of air pollutants discharged into the atmosphere of a community; used to establish emission standards.
Flow Rate – The rate, expressed in gallons -or litres-per-hour, at which a fluid escapes from a hole or
fissure in a tank. Such measurements are also made of liquid waste, effluent, and surface water movement.
Fugitive Emissions – Emissions not caught by a capture system.
Hydrocarbons (HC) – Chemical compounds that consist entirely of carbon and hydrogen.
Hydrogen Sulphide (H2S) – Gas emitted during organic decomposition. Also, a by-product of oil refining
and burning. Smells like rotten eggs and, in heavy concentration, can kill or cause illness.
Inhalable Particles – All dust capable of entering the human respiratory tract.
Nitric Oxide (NO) – A gas formed by combustion under high temperature and high pressure in an internal combustion engine. NO is converted by sunlight and photochemical processes in ambient air to nitrogen oxide. NO is a precursor of ground-level ozone pollution, or smog.

HODGSON QUARRY PRODUCTS
SAND EXTRACTION
ROBERTS ROAD, MAROOTA
AIR QUALITY IMPACT ASSESSMENT REPORT NO. 14229 VERSION B
Nitrogen Dioxide (NO2) – The result of nitric oxide combining with oxygen in the atmosphere; major component of photochemical smog.
Nitrogen Oxides (NOx) – A criteria air polluant. Nitrogen oxides are produced from burning fuels, including gasoline and coal. Nitrogen oxides are smog formers, which react with volatile organic compounds to form smog. Nitrogen oxides are also major components of acid rain.
Mobile Sources – Moving objects that release pollution; mobile sources include cars, trucks, buses, planes,
trains, motorcycles and gasoline-powered lawn mowers.
Particulates; Particulate Matter (PM-10) – A criteria air pollutant. Particulate matter includes dust, soot
and other tiny bits of solid materials that are released into and move around in the air. Particulates are
produced by many sources, including burning of diesel fuels by trucks and buses, incineration of garbage,
mixing and application of fertilizers and pesticides, road construction, industrial processes such as steel
making, mining operations, agricultural burning (field and slash burning), and operation of fireplaces and
woodstoves. Particulate pollution can cause eye, nose and throat irritation and other health problems.
Parts Per Billion (ppb)/Parts Per Million (ppm) – Units commonly used to express contamination
ratios, as in establishing the maximum permissible amount of a contaminant in water, land, or air.
PM10/PM2.5 – PM10 is measure of particles in the atmosphere with a diameter of less than 10 or equal to a nominal 10 micrometres. PM2.5 is a measure of smaller particles in the air.
Point Source – A stationary location or fixed facility from which pollutants are discharged; any single identifiable source of pollution; e.g. a pipe, ditch, ship, ore pit, factory smokestack.
Scrubber – An air pollution device that uses a spray of water or reactant or a dry process to trap pollutants
in emissions.
Source – Any place or object from which pollutants are released.
Stack – A chimney, smokestack, or vertical pipe that discharges used air.
Stationary Source – A place or object from which pollutants are released and which does not move around.
Stationary sources include power plants, gas stations, incinerators, houses etc.
Total suspended particulates – TSP is the measure of all particles that are suspended in air.
Temperature Inversion – One of the weather conditions that are often associated with serious smog
episodes in some portions of the country. In a temperature inversion, air does not rise because it is trapped
near the ground by a layer of warmer air above it. Pollutants, especially smog and smog-forming chemicals,
including volatile organic compounds, are trapped close to the ground. As people continue driving and
sources other than motor vehicles continue to release smog-forming pollutants into the air, the smog level
keeps getting worse.

HODGSON QUARRY PRODUCTS
SAND EXTRACTION
ROBERTS ROAD, MAROOTA PAGE 1
AIR QUALITY IMPACT ASSESSMENT REPORT NO. 14229 VERSION B
1 INTRODUCTION
Hodgson Quarry Products Pty Ltd have operated a sand extraction facility at Roberts Road,
Maroota since approval was granted in May 2000. The approval is due to expire in May 2015;
however, the resource has not been completely mined. This report provides a quantitative
assessment of potential dust impacts of the proposed continuation of current operations at the
existing facility until 2025, based on air quality monitoring results and dispersion modelling
predictions. There is no proposed change in the approved extraction quantities.
The facility is located adjacent to the Old Northern Road at Maroota in Figure 1-1.
Consideration has been given to the previous air quality assessments and Conditions of Approval.
Figure 1-1 Locality Map
N

HODGSON QUARRY PRODUCTS
SAND EXTRACTION
ROBERTS ROAD, MAROOTA PAGE 2
AIR QUALITY IMPACT ASSESSMENT REPORT NO. 14229 VERSION B
2 SITE DESCRIPTION, CURRENT & PROPOSED OPERATION
2.1 The Existing Site
The existing consent allows 50 laden truck movement per day. The approved hours are 6.00am
to 6.00pm, Monday to Friday and 6.00am to 1.00pm on Saturday with the extraction and
processing commencing at 7.00am. Loading of trucks is only permitted in the period 6.00am to
7.00am on all days. Figure 2-2 shows the site truck route in blue.
The present operation involves extraction of material, stockpiling and processing (screening).
Figure 2-1 shows the existing processing plant. Figure 2-2 shows the current location of the
processing plant in green. The extraction on site is conducted with an excavator to win material
and two dump trucks to transport to the processing plant. The processing plant includes pumps,
screens, conveyers, cyclones.
There is intermittent need to use a dozer to rip the friable sandstone which generally occurs at
lower levels within the quarry (RL195 with the exception of the north-western corner where it
occurs up to RL205) and also an additional excavator to build mounds, remove topsoil and
construct the final landform.
Figure 2-1 Existing Processing Plant
2.2 Surrounding Land Use and Sensitive Receptors
The land surrounding the site is rural, although there are a number of other sand quarries in the
area. The nearest existing residences are shown in Figure 2-2. Residences are located to the
east and south on the corner of Roberts Road and Old Telegraph Road (R1) and on the opposite
side of Roberts Road (R2 & R3). One residence (R4) is located near the corner of Old Northern
Road and Roberts Road. Residences are also located to the north on either side of Old Northern
Road, one on the eastern side (R6) and one on the western side (R5).
Maroota Public School is located approximately 750 metres north of the mine site on Old Northern
Road.

HODGSON QUARRY PRODUCTS
SAND EXTRACTION
ROBERTS ROAD, MAROOTA PAGE 3
AIR QUALITY IMPACT ASSESSMENT REPORT NO. 14229 VERSION B
Figure 2-2 Sensitive Receptors
2.3 Future Operations
For future operations the extraction plan and excavation process is split into six stages as shown
in Figure 2-3. The facility will develop further to the west and north for Stages 1-5 over a period
of approximately 8 years, at which time the processing plant would be relocated to allow for the
extraction of Stage 6 to include a cell near the northern boundary and the material beneath where
the existing processing plant is located. It is noted that the lateral extent of the extraction will
not exceed that of the approved development.
Operations also require further excavation and the emplacement of material to create the final
landform. This would occur intermittently on a campaign basis, typically 2 weeks at a time,
possibly once or twice per year, such that equipment / staff not needed to meet the supply of
raw material would be utilised to haul material to the emplacement areas and an excavator to
form the final landform.

HODGSON QUARRY PRODUCTS
SAND EXTRACTION
ROBERTS ROAD, MAROOTA PAGE 4
AIR QUALITY IMPACT ASSESSMENT REPORT NO. 14229 VERSION B
Figure 2-3 Future Stages
The proposed extraction process requires an excavator and truck at surface level to remove the
topsoil and overburden which is initially formed into perimeter bunds and remaining material is
stockpiled. From this point onwards, the excavator works occur from below the surface and is
able to pull material down from above.
The excavator and truck are therefore only at surface level for a small proportion of time (less
than 10%) and most of this time it is operating behind a 5m bund wall relative to the nearest
boundary.
With the exception of cells with suffix A, there is a need to rip Hawkesbury sandstone in the cells.
The extraction operation includes the use of a dozer to rip. This occurs at RL195, with the
exception of cells 4C and 6B where it will occur as high as RL205.
The extracted material then gets transported using a dump truck to the processing feed area,
where a front end loader manages a few stockpiles to blend the different grades of sand as
required before tipping into the power screen. Depending on the haul distance, either one or two
dump trucks return to and from the processing plant area.

HODGSON QUARRY PRODUCTS
SAND EXTRACTION
ROBERTS ROAD, MAROOTA PAGE 5
AIR QUALITY IMPACT ASSESSMENT REPORT NO. 14229 VERSION B
3 AIR QUALITY ASSESSMENT CRITERIA
3.1 NSW Air Quality Criteria
Air quality criteria are benchmarks set to protect the general health and amenity of the community
in relation to air quality. The following section identifies the applicable air quality criteria for the
potential air emissions that would be generated by the project.
Air quality goals relevant to this study relate to particulate matter and are sourced from the NSW
EPA document Approved Methods for the Modelling and Assessment of Air Pollutants in New
South Wales (NSW DEC, 2005).
The air quality goals for the relevant particulate matter pollutants relate to the total pollutant
burden in the air and not just the pollutant from the project. As such, consideration of background
pollutant levels is required when using these goals to assess potential impacts.
Table 3-1 shows the criteria for each of the relevant dust metrics considered in this assessment.
Table 3-1 NSW EPA Air Quality Impact Assessment Criteria
Pollutant Averaging Period Impact Criterion
Total suspended particulates (TSP) Annual Total 90 μg/m3
Particulate matter ≤ 10μm (PM10) Annual Total 30 μg/m3
24-hour Incremental 50 μg/m3
Deposited dust (DD) Annual Incremental 2 g/m2/month
Annual Total 4 g/m2/month
There are currently no air quality goals for particulate matter ≤ 2.5 μm (PM2.5) for projects within
NSW. However, the National Environmental Protection Council (NEPC) has developed an advisory
National Environmental Protection Measure (NEPM) for PM2.5, as follows:
A maximum 24 hour average concentration of 25 μg/m3; and,
An annual average concentration of 8 μg/m3.
The above goals for PM2.5 concentrations are considered advisory only.
3.2 Existing Consent
The existing Development Consent has the following conditions that deal with air quality:
Air Quality Criteria
28. The Applicant shall take all practical steps to manage the development so that the
ambient air quality goals for total suspended particulates (TSP) of 90 ug/m3 (annual
average) and the dust deposition goal of 4g/m2 (annual average) are not exceeded as a
result of the development, when measured at any monitoring location specified in the Air
Quality Management Plan.

HODGSON QUARRY PRODUCTS
SAND EXTRACTION
ROBERTS ROAD, MAROOTA PAGE 6
AIR QUALITY IMPACT ASSESSMENT REPORT NO. 14229 VERSION B
Air Quality Management Plan
29. The Applicant shall prepare and implement an Air Quality Management Plan as part of
the EMP.
The Air Quality Management Plan shall:
(a) identify existing and potential sources of dust deposition, TSP and fine particulates
(PM10 and PM2.5) and specify appropriate monitoring intervals and locations. The
purpose of the monitoring is to evaluate, assess and report on these emissions and
the ambient impacts with the objective of understanding the development’s
contribution to levels of dust deposition, TSP and fine particulates in ambient air
around the site;
(b) provide a monitoring plan having regard to local meteorology and relevant Australian
Standards, identifying the methodologies to be used, including justification for
monitoring intervals, weather conditions, seasonal variations, selecting locations,
periods and times of measurements;
(c) provide details of dust suppression measures for all sources of dust from the
development, including a planting and watering regime to ensure that no more than
3 hectares of the site are exposed and active at any one time. The use of a polymer
in the water to minimise dust impacts shall be investigated as part of this Plan;
(d) provide details of actions to ameliorate impacts if they exceed the relevant criteria;
and
(e) provide the design of the reactive management system intended to reduce the day
to day impacts of dust and fine particulates due to the development.
30. Activities occurring at the premises must be carried out in a manner that will minimise
emissions of dust from the premises.
31. The Applicant shall cease offending work at such times when the operations are resulting
in visible dust emissions blowing in a direction as to cross onto public roads or lands not
owned by the Applicant.
32. The Applicant shall install, operate and maintain a sprinkler system to adequately water
all cleared areas and stockpiles so as to minimise dust emissions to acceptable levels.
33. The Applicant shall ensure that all vehicular movements on unsealed areas are restricted
to specific routes and that all vehicles within the subject site keep to a speed limit of
30km/h.
34. The Applicant shall ensure that trucks are covered when entering and leaving the
premises carrying loads of potentially dust generating material.
The existing Air Quality Management Plan that deals with the Conditions of Consent is presented
in Appendix A.

HODGSON QUARRY PRODUCTS
SAND EXTRACTION
ROBERTS ROAD, MAROOTA PAGE 7
AIR QUALITY IMPACT ASSESSMENT REPORT NO. 14229 VERSION B
4 LOCAL AIR QUALITY & CURRENT AIR QUALITY IMPACTS
Air quality standards and goals refer to pollutant levels which include the contribution from
specific projects and existing sources.
The Development Consent conditions and Air Quality Management Plan required that PM10 and
dust deposition be monitored to manage dust from the site. PM10 and dust deposition has been
monitored since sand extraction began on the site. The monitoring locations are shown in
Figure 4-1.
Figure 4-1 Dust Deposition & High Volume Air Sampler Monitoring Locations
The Project area is predominantly agricultural and mining land, although areas to the east of the
site and the National Park are well vegetated. Sources of particulate matter in the area would
include traffic on unsealed roads, mining activities, local building and construction activities,
animal grazing activities and to a lesser extent traffic on roads.

HODGSON QUARRY PRODUCTS
SAND EXTRACTION
ROBERTS ROAD, MAROOTA PAGE 8
AIR QUALITY IMPACT ASSESSMENT REPORT NO. 14229 VERSION B
The PM10 and dust deposition levels measured around the mine are summarised in Table 4-1
and Table 4-2, respectively.
Table 4-1 PM10 Monitoring Results for the Hodgson Quarry Products Pty Ltd Sand
Extraction Facility at Roberts Road
Year Month
PM10 monthly averages
24 hour maximum
(µg/m3)
NW HVAS SE HVAS
2002
January - 12
February - 12
March - 15
April - 16
May - 5
2008 April 18 33
May 32 32
2011 November 14 14
December 12 16
2012
January 4- 5
February < 2 < 2
March 4 4
April < 2 4
May 4 11
June 11 7
July 9 7
August 8 11
September 17 7
October 15 16
November 15 11
December 6 6
2013 January 13 12
February 22 17
HODGSON QUARRY PRODUCTS
SAND EXTRACTION
ROBERTS ROAD, MAROOTA PAGE 9
AIR QUALITY IMPACT ASSESSMENT REPORT NO. 14229 VERSION B
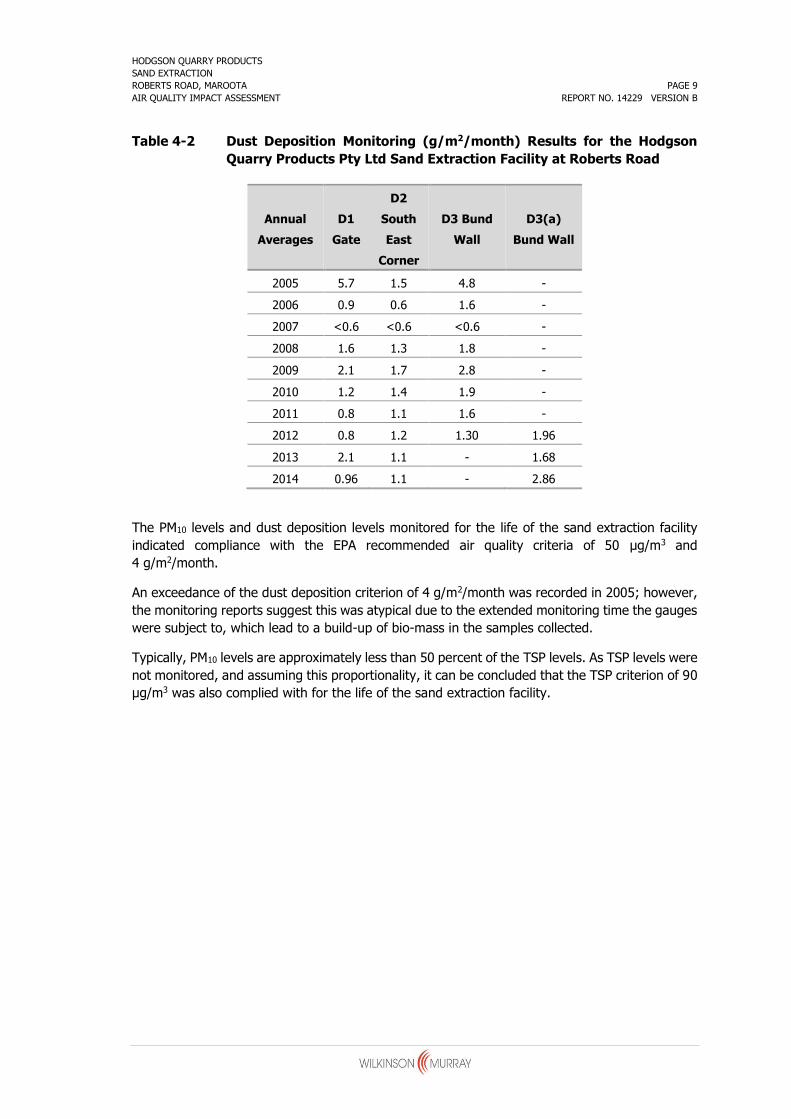
Table 4-2 Dust Deposition Monitoring (g/m2/month) Results for the Hodgson
Quarry Products Pty Ltd Sand Extraction Facility at Roberts Road
Annual
Averages
D1
Gate
D2
South
East
Corner
D3 Bund
Wall
D3(a)
Bund Wall
2005 5.7 1.5 4.8 -
2006 0.9 0.6 1.6 -
2007 <0.6 <0.6 <0.6 -
2008 1.6 1.3 1.8 -
2009 2.1 1.7 2.8 -
2010 1.2 1.4 1.9 -
2011 0.8 1.1 1.6 -
2012 0.8 1.2 1.30 1.96
2013 2.1 1.1 - 1.68
2014 0.96 1.1 - 2.86
The PM10 levels and dust deposition levels monitored for the life of the sand extraction facility
indicated compliance with the EPA recommended air quality criteria of 50 μg/m3 and
4 g/m2/month.
An exceedance of the dust deposition criterion of 4 g/m2/month was recorded in 2005; however,
the monitoring reports suggest this was atypical due to the extended monitoring time the gauges
were subject to, which lead to a build-up of bio-mass in the samples collected.
Typically, PM10 levels are approximately less than 50 percent of the TSP levels. As TSP levels were
not monitored, and assuming this proportionality, it can be concluded that the TSP criterion of 90
μg/m3 was also complied with for the life of the sand extraction facility.

HODGSON QUARRY PRODUCTS
SAND EXTRACTION
ROBERTS ROAD, MAROOTA PAGE 10
AIR QUALITY IMPACT ASSESSMENT REPORT NO. 14229 VERSION B
5 LOCAL CLIMATE & DISPERSION METEOROLOGY & POTENTIAL
DUST IMPACTS
Long-term climatic data from the Bureau of Meteorology weather station at Richmond RAAF were
analysed to characterise the local climate in the proximity of the Project. The Richmond RAAF
station is located approximately 20km south-west of the Project.
Table 5-1 presents a summary of data from the Richmond RAAF weather station collected over
an approximate 30-year period.
The data indicates that January is the hottest month with a mean maximum temperature of 30ºC
and July is the coldest month with mean minimum temperature of 3.6ºC.
Humidity levels exhibit variability over the day and seasonal fluctuations. Mean 9.00am humidity
levels range from 58 per cent in October to 82 per cent in May. Mean 3.00pm humidity levels
vary from 39 per cent in August to 53 per cent in June. Rainfall peaks during the summer months
and declines during winter. The data shows February is the wettest month with an average rainfall
of 122.9 mm over 8.4 days and July is the driest month with an average rainfall of 28.5 mm over
3.9 days.
Table 5-1 Monthly Climate Statistics Summary – Richmond RAAF
Parameter Jan Feb Mar Apr May Jun Jul Aug Sep Oct Nov Dec
Temperature
Mean max. temperature (ºC) 30.0 29.0 26.8 23.9 20.7 17.9 17.6 19.8 22.9 25.1 26.7 28.5
Mean min. temperature (ºC) 17.6 17.7 15.6 11.5 7.5 5.1 3.6 4.4 8.0 10.9 14.1 15.9
Rainfall
Rainfall (mm) 75.7 122.9 75.8 48.6 48.9 47.5 28.5 33.2 47.0 50.6 82.7 59.8
Mean No. of rain days (≥1mm) 7.5 8.4 7.9 5.9 5.5 5.6 3.9 3.5 4.5 5.7 7.9 6.4
9am Conditions
Mean temperature (ºC) 22.1 21.3 19.1 17.0 13.1 10.0 8.9 11.4 15.4 18.3 19.2 20.9
Mean relative humidity (%) 72 78 80 76 82 83 80 69 63 58 68 68
Mean wind speed (km/h) 9.1 8.1 6.6 6.9 5.7 6.3 5.9 8.1 9.9 10.3 9.9 8.9
3pm Conditions
Mean temperature (ºC) 28.5 27.4 25.8 23.0 19.7 17.0 16.5 18.7 21.5 23.5 25.2 27.5
Mean relative humidity (%) 47 52 52 49 53 53 48 39 39 40 46 44
Mean wind speed (km/h) 16.6 15.6 14.7 14.4 12.6 13.5 14.3 17.7 19.4 19.1 19.0 17.7
Source: Bureau of Meteorology, 2013
HODGSON QUARRY PRODUCTS
SAND EXTRACTION
ROBERTS ROAD, MAROOTA PAGE 11
AIR QUALITY IMPACT ASSESSMENT REPORT NO. 14229 VERSION B
As the closest BOM metrological station is at Richmond RAAF, approximately 20km from the site,
prognostic meteorological data was generated using The Air Pollution Model (TAPM), developed
by the CSIRO to investigate site-specific wind conditions.
The site has a meteorological station; however, this is only used as a reactive dust management
tool.
The prognostic modelling domain was centred at 33° 27’ S, 151° 0’ E and involved four nesting
grids of 30 km, 10 km, 3 km and 1km with 25 vertical levels.
Observations of wind speed and direction from the BoM AWS at Richmond RAAF were assimilated
into the TAPM model to refine details of local winds.
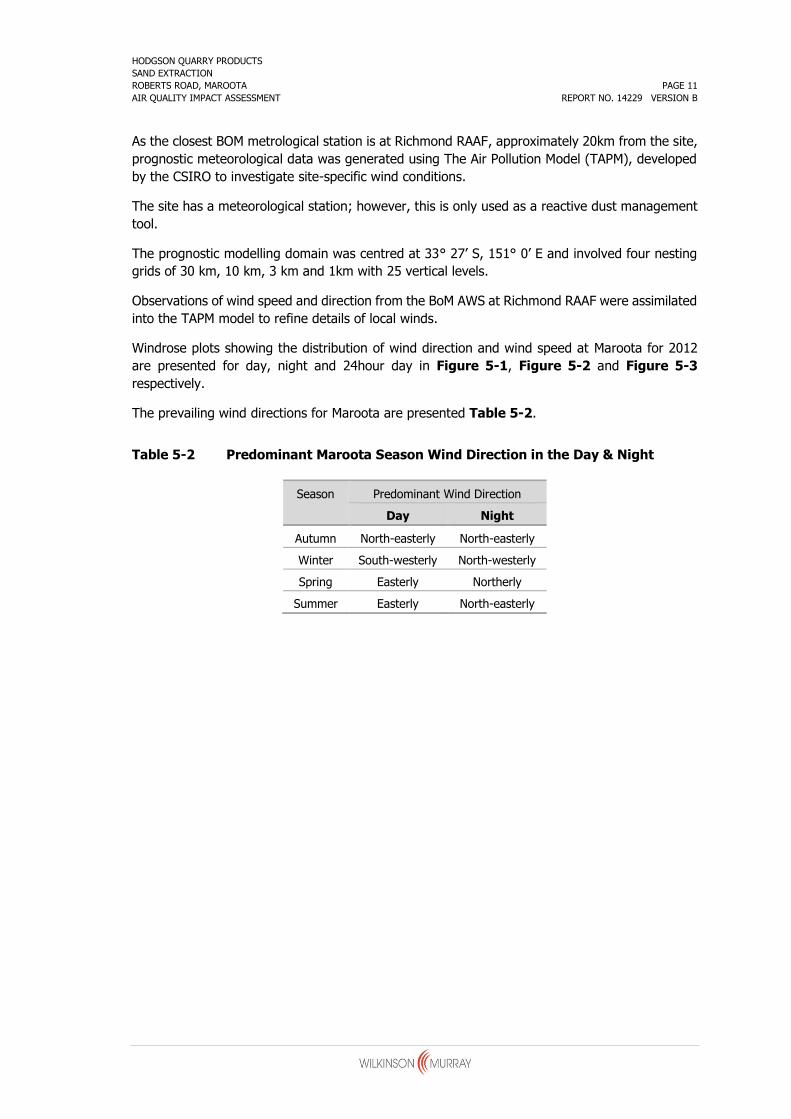
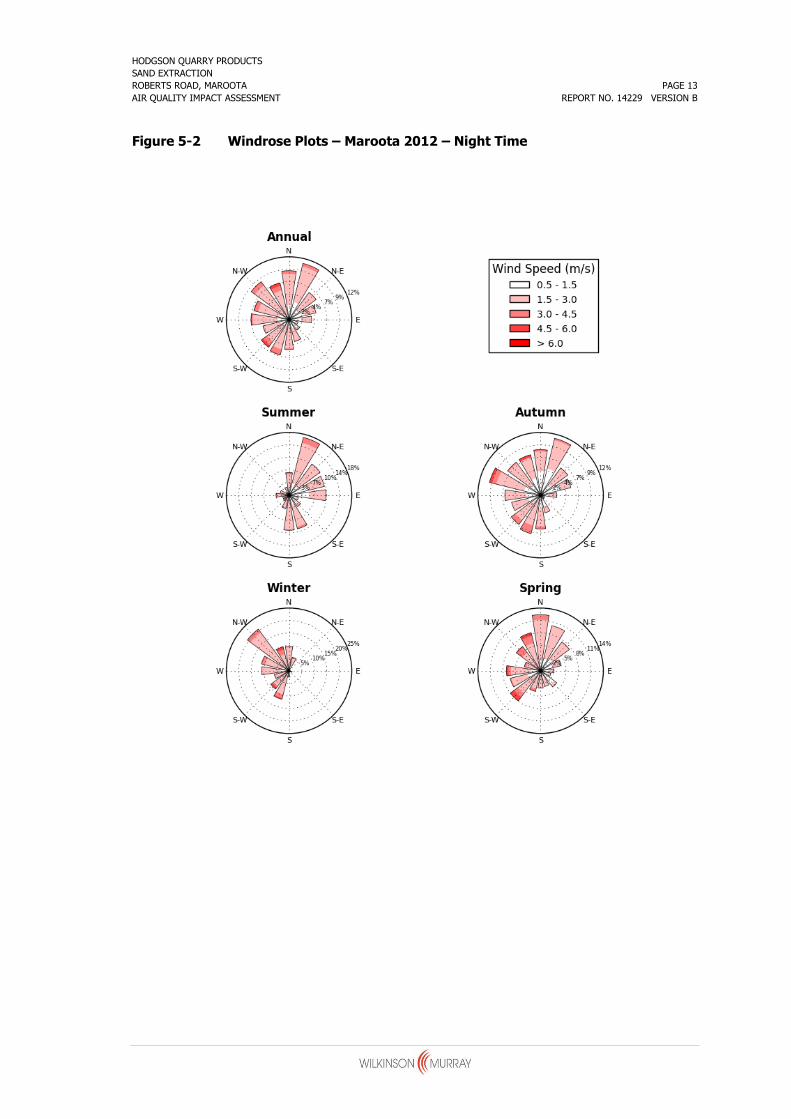
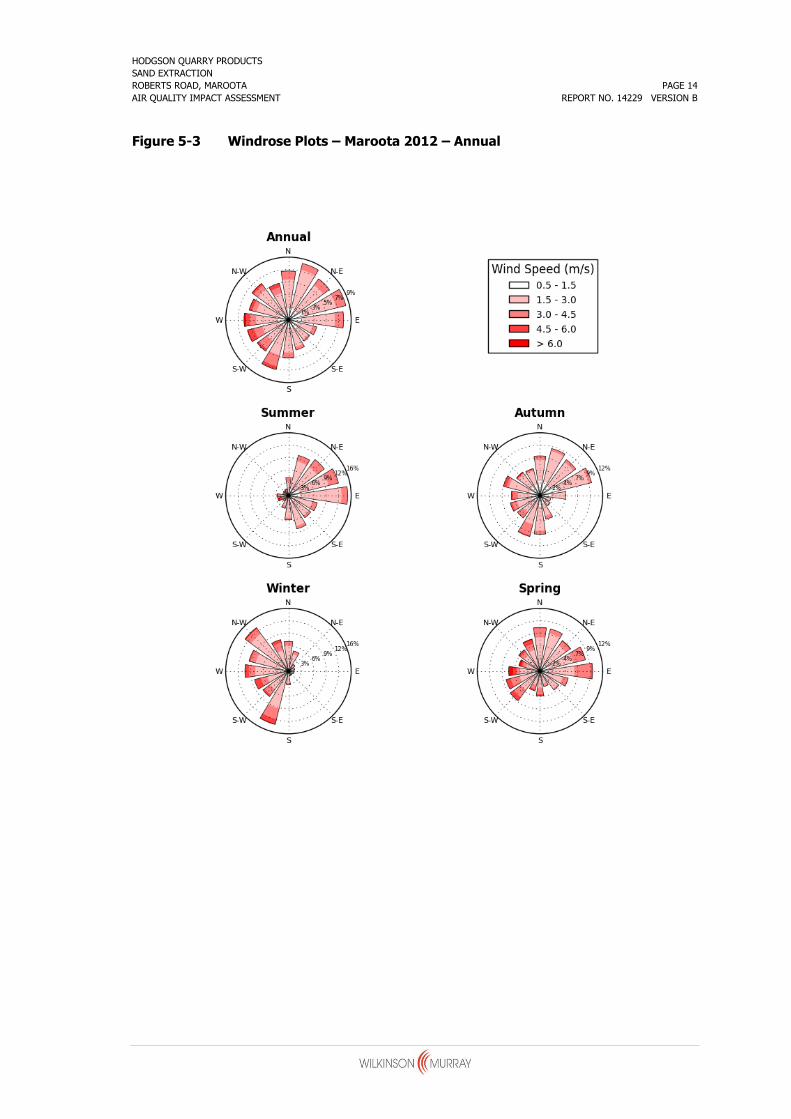
Windrose plots showing the distribution of wind direction and wind speed at Maroota for 2012
are presented for day, night and 24hour day in Figure 5-1, Figure 5-2 and Figure 5-3
respectively.
The prevailing wind directions for Maroota are presented Table 5-2.
Table 5-2 Predominant Maroota Season Wind Direction in the Day & Night
Season Predominant Wind Direction
Day Night
Autumn North-easterly North-easterly
Winter South-westerly North-westerly
Spring Easterly Northerly
Summer Easterly North-easterly

HODGSON QUARRY PRODUCTS
SAND EXTRACTION
ROBERTS ROAD, MAROOTA PAGE 12
AIR QUALITY IMPACT ASSESSMENT REPORT NO. 14229 VERSION B
Figure 5-1 Windrose Plots – Maroota 2012 - Daytime
HODGSON QUARRY PRODUCTS
SAND EXTRACTION
ROBERTS ROAD, MAROOTA PAGE 13
AIR QUALITY IMPACT ASSESSMENT REPORT NO. 14229 VERSION B
Figure 5-2 Windrose Plots – Maroota 2012 – Night Time
HODGSON QUARRY PRODUCTS
SAND EXTRACTION
ROBERTS ROAD, MAROOTA PAGE 14
AIR QUALITY IMPACT ASSESSMENT REPORT NO. 14229 VERSION B
Figure 5-3 Windrose Plots – Maroota 2012 – Annual

HODGSON QUARRY PRODUCTS
SAND EXTRACTION
ROBERTS ROAD, MAROOTA PAGE 15
AIR QUALITY IMPACT ASSESSMENT REPORT NO. 14229 VERSION B
6 MODELLING METHODOLOGY
6.1 Meteorological Modelling
6.1.1 TAPM
No meteorological observation data is available for the site. Therefore, site-specific meteorological
data was generated through the use of a prognostic model. The prognostic model used was The
Air Pollution Model (TAPM), developed and distributed by the Commonwealth Scientific and
industrial Research Organisation (CSIRO).
TAPM is an incompressible, non-hydrostatic, primitive equations prognostic model with a terrain-
following vertical coordinate for three-dimensional simulations. It predicts the flows important to
local scale air pollution, such as sea breezes and terrain induced flows, against a background of
large scale meteorology provided by synoptic analyses. TAPM benefits from having access to
databases of terrain, vegetation and soil type, leaf area index, sea-surface temperature, and
synoptic scale meteorological analyses for various regions around the world.
The prognostic modelling domain was centred at 33° 27’ S, 151° 0’ E and involved four nesting
grids of 30 km, 10 km, 3 km and 1km with 25 vertical levels.
The TAPM model included assimilation of data collected at the Richmond RAAF AWS during the
year 2012.
6.1.2 AERMET
The TAPM results, including predictions of wind speed, wind direction, temperature, humidity,
cloud cover, solar radiation and rainfall, were used as inputs to AERMET – AERMOD’s
meteorological pre-processor. AERMET uses the TAPM data, along with land use data, to calculate
mixing heights and velocity scaling parameters.
6.2 Dispersion Modelling
6.2.1 AERMOD
The dispersion model chosen for this assessment was AERMOD – the US EPA regulatory Gaussian
plume air dispersion model.
AERMOD is a steady state plume model that incorporates air dispersion based on planetary
boundary layer turbulence structure and scaling concepts. It includes treatment of both surface
and elevated sources, and both simple and complex terrain.
6.2.2 Building Wake Effects
All emissions associated with this development were modelled using volume sources, which are
not affected by building wakes.

HODGSON QUARRY PRODUCTS
SAND EXTRACTION
ROBERTS ROAD, MAROOTA PAGE 16
AIR QUALITY IMPACT ASSESSMENT REPORT NO. 14229 VERSION B
7 EMISSIONS TO AIR
Dust emissions from the proposed Project have been estimated for all significant dust generating
activities based on information provided by the client, using emission factors sourced from both
locally developed and US EPA developed documentation. Total dust emissions from all significant
dust generating activities for the Project are presented below. Detailed emission inventory and
emission estimation calculations are presented in Appendix B.
Three extraction scenarios have been identified for assessment purposes. These scenarios are
considered to represent the range of worst case future site operations. Extraction in the North
West and South East corners of the site will bring activities closest to sensitive receptors in those
areas, while moving the material processing area to the North East corner of the site will represent
the worst case scenario for receptors in that vicinity.
7.1 North West Extraction
Estimated TSP and PM10 emissions during the North West extraction scenario are presented below
in Table 7-1. The source locations adopted in the dispersion modelling for this scenario are
shown in Figure 7-1.
Table 7-1 Emissions estimation – North West extraction
Activity Emissions (kg/day)
TSP PM10
Dozer ripping face 13.34 1.99
Loading raw material into dump trucks 0.77 0.36
Dump truck unloading 1.15 0.55
Loading hopper 1.54 0.73
Screening 16.25 5.59
Unloading to stockpile 0.25 0.12
Loading processed material into trucks 1.18 0.56
Haul road - Outgoing 9.38 2.01
Haul road - Raw Material 7.65 1.64
Wind erosion - Extraction Area 2.40 1.20
Wind erosion - Processing Area 4.80 2.40
Total
58.73 17.14

HODGSON QUARRY PRODUCTS
SAND EXTRACTION
ROBERTS ROAD, MAROOTA PAGE 17
AIR QUALITY IMPACT ASSESSMENT REPORT NO. 14229 VERSION B
Figure 7-1 Source locations - North West extraction

HODGSON QUARRY PRODUCTS
SAND EXTRACTION
ROBERTS ROAD, MAROOTA PAGE 18
AIR QUALITY IMPACT ASSESSMENT REPORT NO. 14229 VERSION B
7.2 North East Processing
Estimated TSP and PM10 emissions during the North East processing scenario are presented below
in Table 7-2. The source locations adopted in the dispersion modelling for this scenario are
shown in Figure 7-2.
Table 7-2 Emissions estimation – North East processing
Activity Emissions (kg/day)
TSP PM10
Dozer ripping face 13.34 1.99
Loading raw material into dump trucks 0.77 0.36
Dump truck unloading 1.15 0.55
Loading hopper 1.54 0.73
Screening 16.25 5.59
Unloading to stockpile 0.25 0.12
Loading processed material into trucks 1.18 0.56
Haul road - Outgoing 7.21 1.54
Haul road - Raw Material 5.89 1.26
Wind erosion - Extraction Area 2.40 1.20
Wind erosion - Processing Area 4.80 2.40
Total
54.80 16.30
Figure 7-2 Source locations - North East processing

HODGSON QUARRY PRODUCTS
SAND EXTRACTION
ROBERTS ROAD, MAROOTA PAGE 19
AIR QUALITY IMPACT ASSESSMENT REPORT NO. 14229 VERSION B
7.3 South East Extraction
Estimated TSP and PM10 emissions during the North East extraction scenario are presented below
in Table 7-3. The source locations adopted in the dispersion modelling for this scenario are
shown in Figure 7-3.
Table 7-3 Emissions estimation – South East extraction
Activity Emissions (kg/day)
TSP PM10
Dozer ripping face 13.34 1.99
Loading raw material into dump trucks 0.77 0.36
Dump truck unloading 1.15 0.55
Loading hopper 1.54 0.73
Screening 16.25 5.59
Unloading to stockpile 0.25 0.12
Loading processed material into trucks 1.18 0.56
Haul road - Outgoing 11.90 2.55
Haul road - Raw Material 9.72 2.08
Wind erosion - Extraction Area 2.40 1.20
Wind erosion - Processing Area 4.80 2.40
Total
63.31 18.12
Figure 7-3 Source locations - South East extraction
HODGSON QUARRY PRODUCTS
SAND EXTRACTION
ROBERTS ROAD, MAROOTA PAGE 20
AIR QUALITY IMPACT ASSESSMENT REPORT NO. 14229 VERSION B
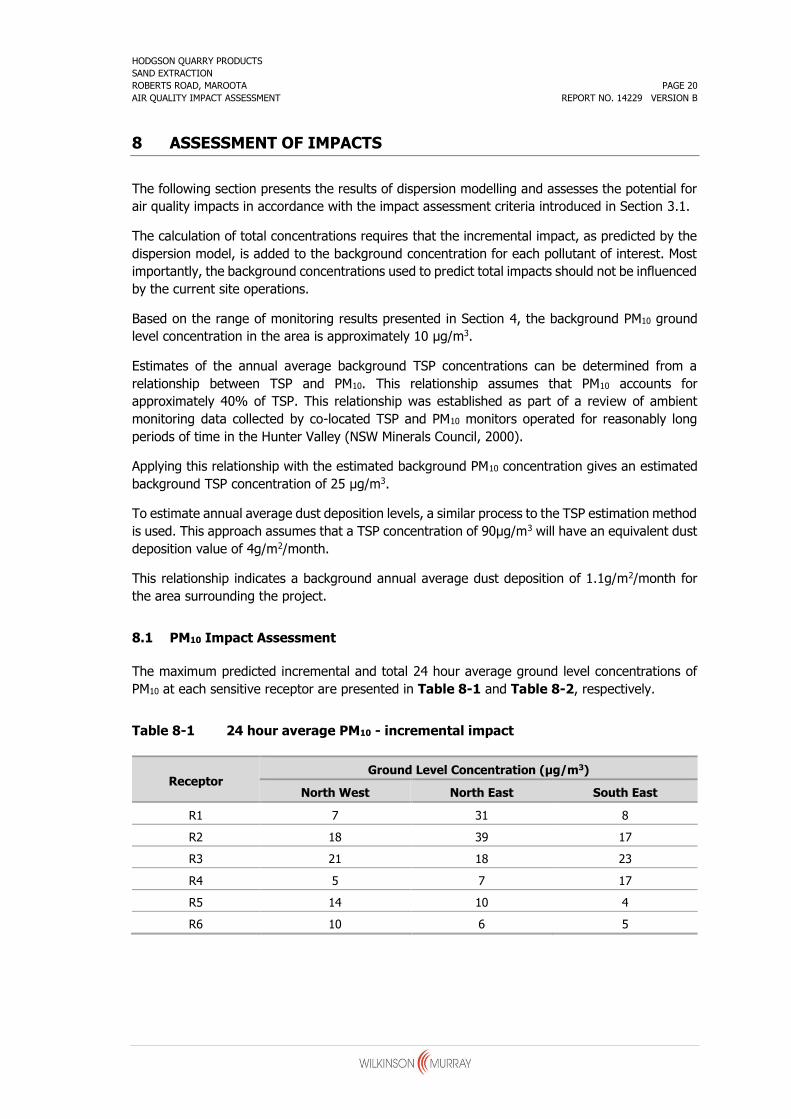
8 ASSESSMENT OF IMPACTS
The following section presents the results of dispersion modelling and assesses the potential for
air quality impacts in accordance with the impact assessment criteria introduced in Section 3.1.
The calculation of total concentrations requires that the incremental impact, as predicted by the
dispersion model, is added to the background concentration for each pollutant of interest. Most
importantly, the background concentrations used to predict total impacts should not be influenced
by the current site operations.
Based on the range of monitoring results presented in Section 4, the background PM10 ground
level concentration in the area is approximately 10 μg/m3.
Estimates of the annual average background TSP concentrations can be determined from a
relationship between TSP and PM10. This relationship assumes that PM10 accounts for
approximately 40% of TSP. This relationship was established as part of a review of ambient
monitoring data collected by co-located TSP and PM10 monitors operated for reasonably long
periods of time in the Hunter Valley (NSW Minerals Council, 2000).
Applying this relationship with the estimated background PM10 concentration gives an estimated
background TSP concentration of 25 μg/m3.
To estimate annual average dust deposition levels, a similar process to the TSP estimation method
is used. This approach assumes that a TSP concentration of 90μg/m3 will have an equivalent dust
deposition value of 4g/m2/month.
This relationship indicates a background annual average dust deposition of 1.1g/m2/month for
the area surrounding the project.
8.1 PM10 Impact Assessment
The maximum predicted incremental and total 24 hour average ground level concentrations of
PM10 at each sensitive receptor are presented in Table 8-1 and Table 8-2, respectively.
Table 8-1 24 hour average PM10 - incremental impact
Receptor Ground Level Concentration (μg/m3)
North West North East South East
R1 7 31 8
R2 18 39 17
R3 21 18 23
R4 5 7 17
R5 14 10 4
R6 10 6 5
HODGSON QUARRY PRODUCTS
SAND EXTRACTION
ROBERTS ROAD, MAROOTA PAGE 21
AIR QUALITY IMPACT ASSESSMENT REPORT NO. 14229 VERSION B
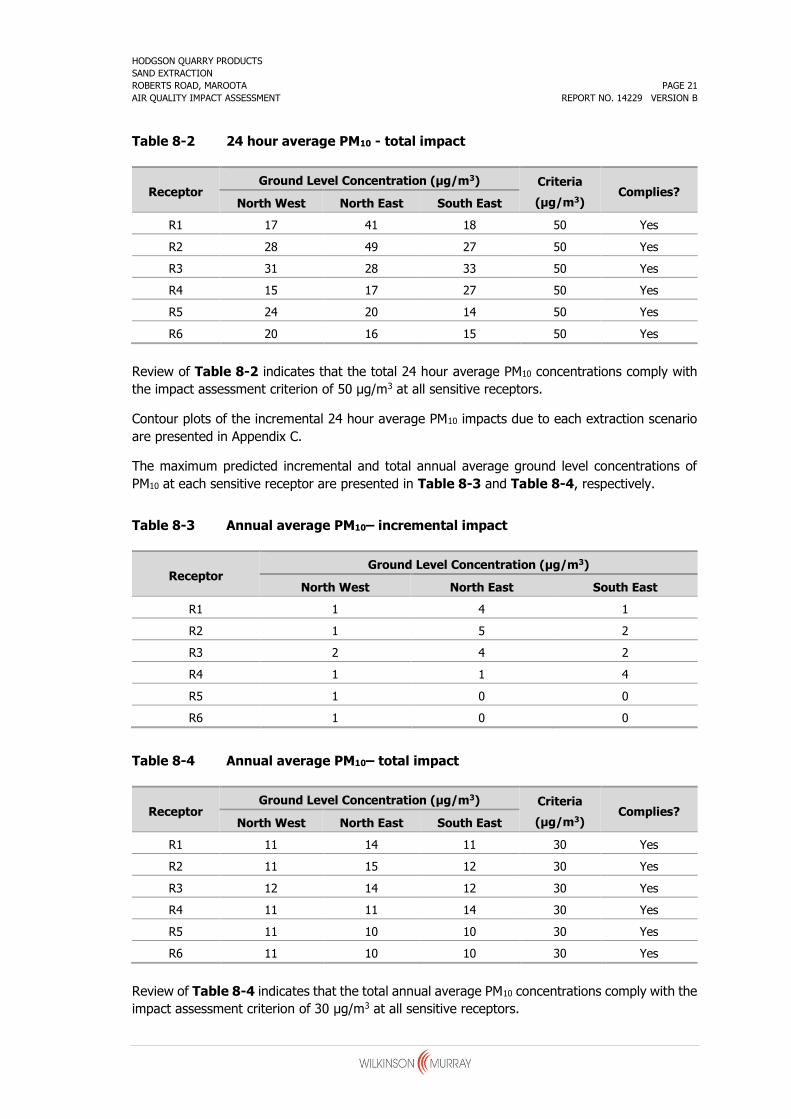
Table 8-2 24 hour average PM10 - total impact
Receptor Ground Level Concentration (μg/m3) Criteria
(μg/m3) Complies?
North West North East South East
R1 17 41 18 50 Yes
R2 28 49 27 50 Yes
R3 31 28 33 50 Yes
R4 15 17 27 50 Yes
R5 24 20 14 50 Yes
R6 20 16 15 50 Yes
Review of Table 8-2 indicates that the total 24 hour average PM10 concentrations comply with
the impact assessment criterion of 50 μg/m3 at all sensitive receptors.
Contour plots of the incremental 24 hour average PM10 impacts due to each extraction scenario
are presented in Appendix C.
The maximum predicted incremental and total annual average ground level concentrations of
PM10 at each sensitive receptor are presented in Table 8-3 and Table 8-4, respectively.
Table 8-3 Annual average PM10– incremental impact
Receptor Ground Level Concentration (μg/m3)
North West North East South East
R1 1 4 1
R2 1 5 2
R3 2 4 2
R4 1 1 4
R5 1 0 0
R6 1 0 0
Table 8-4 Annual average PM10– total impact
Receptor Ground Level Concentration (μg/m3) Criteria
(μg/m3) Complies?
North West North East South East
R1 11 14 11 30 Yes
R2 11 15 12 30 Yes
R3 12 14 12 30 Yes
R4 11 11 14 30 Yes
R5 11 10 10 30 Yes
R6 11 10 10 30 Yes
Review of Table 8-4 indicates that the total annual average PM10 concentrations comply with the
impact assessment criterion of 30 μg/m3 at all sensitive receptors.
HODGSON QUARRY PRODUCTS
SAND EXTRACTION
ROBERTS ROAD, MAROOTA PAGE 22
AIR QUALITY IMPACT ASSESSMENT REPORT NO. 14229 VERSION B
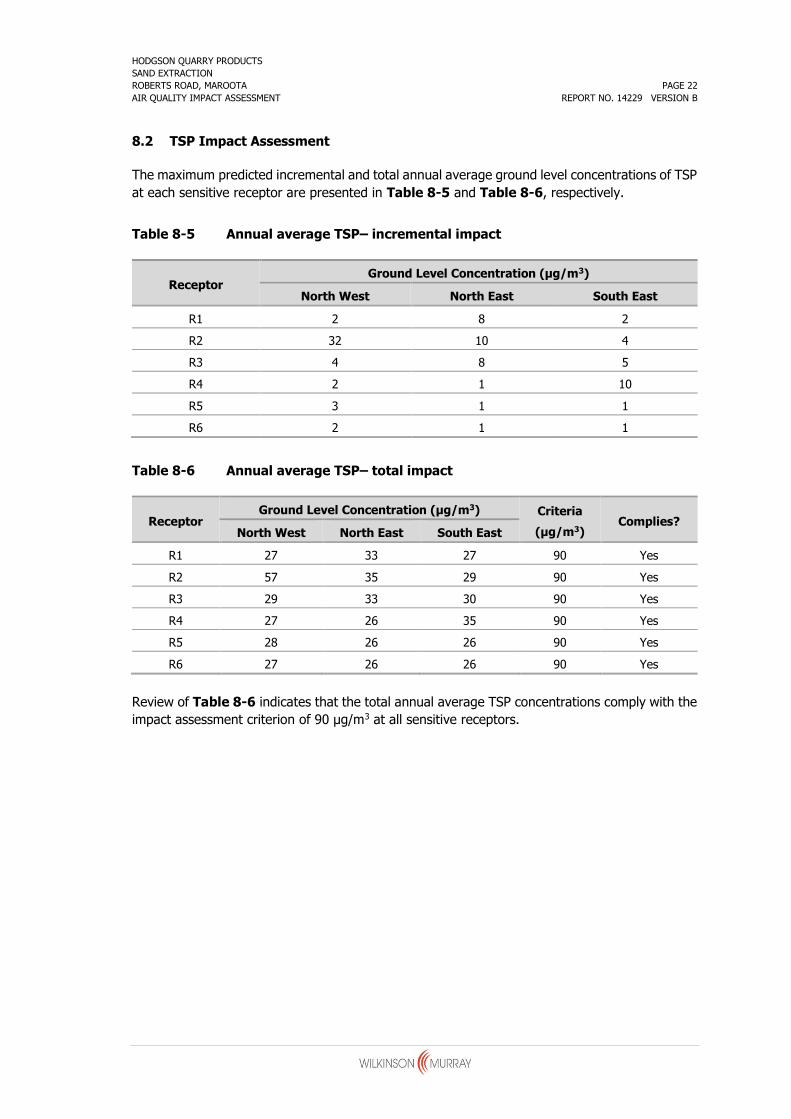
8.2 TSP Impact Assessment
The maximum predicted incremental and total annual average ground level concentrations of TSP
at each sensitive receptor are presented in Table 8-5 and Table 8-6, respectively.
Table 8-5 Annual average TSP– incremental impact
Receptor Ground Level Concentration (μg/m3)
North West North East South East
R1 2 8 2
R2 32 10 4
R3 4 8 5
R4 2 1 10
R5 3 1 1
R6 2 1 1
Table 8-6 Annual average TSP– total impact
Receptor Ground Level Concentration (μg/m3) Criteria
(μg/m3) Complies?
North West North East South East
R1 27 33 27 90 Yes
R2 57 35 29 90 Yes
R3 29 33 30 90 Yes
R4 27 26 35 90 Yes
R5 28 26 26 90 Yes
R6 27 26 26 90 Yes
Review of Table 8-6 indicates that the total annual average TSP concentrations comply with the
impact assessment criterion of 90 μg/m3 at all sensitive receptors.

HODGSON QUARRY PRODUCTS
SAND EXTRACTION
ROBERTS ROAD, MAROOTA PAGE 23
AIR QUALITY IMPACT ASSESSMENT REPORT NO. 14229 VERSION B
8.3 Deposited Dust
The maximum predicted incremental and total annual average dust deposition levels at each
sensitive receptor are presented in Table 8-7 and Table 8-8, respectively.
Table 8-7 Annual average deposited dust– incremental impact
Receptor Ground Level Concentration (g/m2/month) Criteria
(g/m2/month) Complies?
North West North East South East
R1 0.1 0.6 0.1 2 Yes
R2 0.1 0.6 0.2 2 Yes
R3 0.2 0.4 0.3 2 Yes
R4 0.1 0.1 0.5 2 Yes
R5 0.2 0.0 0.1 2 Yes
R6 0.1 0.0 0.0 2 Yes
Review of Table 8-7 indicates that the annual average incremental dust deposition levels comply
with the impact assessment criterion of 2 g/m2/month at all sensitive receptors.
Table 8-8 Annual average deposited dust– total impact
Receptor Ground Level Concentration (g/m2/month) Criteria
(g/m2/month) Complies?
North West North East South East
R1 1.2 1.7 1.2 4 Yes
R2 1.2 1.7 1.3 4 Yes
R3 1.3 1.5 1.4 4 Yes
R4 1.2 1.2 1.6 4 Yes
R5 1.3 1.1 1.2 4 Yes
R6 1.2 1.1 1.1 4 Yes
Review of Table 8-8 indicates that the annual average total dust deposition levels comply with
the impact assessment criterion of 4 g/m2/month at all sensitive receptors.

HODGSON QUARRY PRODUCTS
SAND EXTRACTION
ROBERTS ROAD, MAROOTA PAGE 24
AIR QUALITY IMPACT ASSESSMENT REPORT NO. 14229 VERSION B
9 CONCLUSIONS
This study has assessed the potential dust impacts associated with the proposed continuation of
the Hodgson Quarry Products Pty Ltd sand extraction facility at Roberts Road, Maroota.
For existing sand extraction operations, PM10 and dust deposition levels recorded from
approximately 2002 have been reviewed. It was found that the TSP, PM10 and dust deposition
levels monitored for the life of the sand extraction facility indicated compliance with the EPA
recommended air quality criteria of 50 μg/m3 and 4 g/m2/month.
Dispersion modelling results for the three worst case future extraction scenarios indicated that
the continued operation of the site is unlikely to impact on sensitive receptors providing that the
application of dust mitigation measures identified in the existing air quality management plan
continues.

APPENDIX A
AIR QUALITY MANAGEMENT PLAN

Z:\Jobs\_HB Maroota\2011\OEMP 2011\OEMP Collated\OEMP 2011.docx
28/11/2011 AppendicesPage 1 of 6
Air Quality Management Plan1. Objectives
· To minimise and manage dust generated from the operation and maintain dustlevels below EPA criteria.
2. Targets
· No complaints received, with monitoring showing that criteria are being met.
3. Air Quality Goals
· Total suspended particulates (TSP) not to exceed 90 µg/m3 (annual average).
· Fine particulates (PM10) not to exceed 50 µg/m3 (24 hour).
· Dust deposition not to exceed 4 g/m2/mth (annual average).
4. Licences/ Permits
· Development consent issued by Minister for Urban Affairs and Planning (Ref598/00772) issued 31 May, 2000.
· Modification to development consent 598/00772 issued by the Minister for UrbanAffairs and Planning on 29 November, 2000.
· EPA Licence 6535 - expiring 12 March 2012.
5. References
· Consent conditions 28, 29, 30, 31, 32, 33, 34, 35, 36, 37;
· EIS (1999) Sections 3.4, 6.2, 7.6, 8.2 and Appendix 10.
6. Existing Environment and Background
Examination of aerial photography from 1998 indicates approximately 7 to 8 hectares ofarea was exposed at this site at this time. At present approximately 2.6 Ha are regularlytrafficked as the remainder is either not in use or inaccessible. Consent conditionsgranted in the year 2000 stipulate that no more than 3 hectares of area is to be exposed.Clearly the site was never compliant with this condition but the intention of the conditionwas to ensure dust levels remained below guideline levels.
HB Maroota is required under the Conditions of Consent to manage dust emissions suchthat they do not exceed 90 µg/m3 (annual average) for TSP and dust deposition is not toexceed 4 g/m2/mth (annual average). There are no specific limits set under the EPAlicence.
It has been past practice to monitor the site for fine particulates (PM10) by High VolumeAir Sampling (HVAS) however HVAS’s have not been monitored regularly to assess theeffectiveness of control measures and seasonal variations. This has been noted in themost recent site Audit undertaken by Umwelt Pty Ltd in 2011. At the time of this reportwriting further testing is underway and results to date are attached. Results indicate thequarry is compliant with the limits set.
Regular depositional dust monitoring has been undertaken monthly.
There have been no dust complaints received by the quarry. Both the Depositional DustGauge monitoring and High Volume Air Sampling indicate that although the areaexposed is greater than 3 hectares the dust mitigation measure are working.

Z:\Jobs\_HB Maroota\2011\OEMP 2011\OEMP Collated\OEMP 2011.docx
28/11/2011 AppendicesPage 2 of 6
The compliance of the depositional dust monitoring gauges with the AustralianStandards was reviewed in the Umwelt 2011 Audit and several issues must beaddressed. It was noted that some gauges do not have a 120 degree clear sky angleand that a review of the dust gauge locations should be undertaken. In Addition some ofthe gauges pose a safety risk to personnel due to their accessibility. In this regard newlocations will be implemented as soon as practicable and are shown on Figure Thirteen.
A new metrological station measuring wind speed and direction is in the process ofbeing installed on the site as previous instruments have malfunctioned. The OEH hasbeen informed of the position of the station (see Figure Four) via correspondence datethe 28th of July 2011. The letter stated that if no response was received within 14 daysthat it would be assumed that the matter is acceptable to the Office. Since no responsewas forthcoming the proposed site has now been deemed acceptable to the Office.
7. Dust Sources
· Bulldozer on the clay extraction areas and front-end loader on the quarry floor;
· Front-end loader loading product sand into trucks;
· Trucks transporting product sand off site;
· wind erosion from exposed clay drying areas, clay and sand stockpiles.
· Dry stockpiles.
8. Proposed Activities and Procedures
8.1.Extraction and Processing
· No more than 3 hectares is to be exposed and active at any one time.
· Progressively rehabilitate the site, where possible, to minimise the area exposedto wind erosion (Refer to Appendix J Rehabilitation Plan)
· Potential dust generating material is to be processed and stored in a dampcondition.
· A water cart is to be used to water internal roads, stockpiles and cleared areas toreduce dust generating potential.
· If monitoring finds that criteria are not being met, installation of a fixed sprinklersystem to water cleared areas and stockpiles will be investigated.
· A polymer in the water to assist in minimising dust impacts will be used if dustmonitoring indicates that targets are not being met.
8.2.Transportation
· All vehicle movements on unsealed areas are to be restricted to internal haulroads and working areas.
· Vehicle speeds on the quarry site are to be restricted to 20 km/hr.
· All trucks entering and leaving quarry which are carrying loads to be covered.
8.3.Wind Breaks and Bunds
· Wind breaks of natural vegetation around the boundary of the site are to beestablished and maintained in accordance with the Rehabilitation Plan.
· Bund walls are to be constructed at the corner of Roberts Road and Old NorthernRoad.

Z:\Jobs\_HB Maroota\2011\OEMP 2011\OEMP Collated\OEMP 2011.docx
28/11/2011 AppendicesPage 3 of 6
9. Summary of Progress
Table 1. Progress to Date
Item Activity Completed
Extraction andProcessing
· No more than 3 hectares is to be exposedand active at any one time
Incomplete
· Progressively rehabilitate the site tominimise the area exposed to wind erosion
Ongoing
· Potential dust generating material is to beprocessed and stored in a damp condition
Ongoing
· A water cart is to be used to water internalroads, stockpiles and cleared areas toreduce dust generating potential
Ongoing
· If monitoring finds that criteria are notbeing met, installation of a fixed sprinklersystem to water cleared areas andstockpiles will be investigated.
Not required asyet
· A polymer in the water to assist inminimising dust impacts will be used ifdust monitoring indicates that targets arenot being met.
Not required asyet
Transportation · All vehicle movements on unsealed areasare to be restricted to internal haul roadsand working areas.
Ongoing
· Vehicle speeds on the quarry site are tobe restricted to 20 km/hr.
Ongoing
· All trucks entering and leaving quarrywhich are carrying loads to be covered
Ongoing
Windbreaks andBunds
· Wind breaks of natural vegetation aroundthe boundary of the site are to beestablished and maintained in accordancewith the Rehabilitation Plan.
Incomplete
· Bund walls are to be constructed at thecorner of Roberts Road and Old NorthernRoad.
Completed2001
Monitoring · Monthly independent Depositional Dustmonitoring
Ongoing
· Monitoring of HVAS to determinecompliance with predictions from EIS.Discuss results with OEH and DPI.
Ongoing
· A weather station measuring wind speedand direction is to be installed andoperated continuously.
Ongoing

Z:\Jobs\_HB Maroota\2011\OEMP 2011\OEMP Collated\OEMP 2011.docx
28/11/2011 AppendicesPage 4 of 6
Item Activity Completed
· location will be discussed with the OEH toconfirm appropriateness prior toinstallation
Completed14/8/2011
· A flashing light or similar notification will beinstalled on the station to show when windspeeds are above 10 metres/second
Incomplete
10. Monitoring
· Dust deposition is to monitored monthly at the gauge locations shown on FigureTwelve.
· Indicative positions of relocated dust deposition gauges are shown in FigureThirteen. Exact positions will be recorded by GPS Co-ordinates when positionsare finalised.
· High volume air samplers (TSP, PM10) are to be installed for a period of threemonths (commencing in October 2011) to determine compliance with predictionsfrom EIS (that predicted operations would be below criteria). TSP and PM10 areto be monitored for a period of 24 hours every six days. At the end of the threemonth period results will be discussed with the OEH and DPI to determine theneed for ongoing monitoring.
· A weather station measuring wind speed and direction is to be installed andoperated continuously at the location shown on the Figure Four. This location willbe discussed with the OEH to confirm appropriateness prior to installation.Information from this station will be used in the assessment of HVAS results, toensure that a variety of representative wind conditions was experienced duringthe trial period. A flashing light or similar notification will be installed on thestation to show when wind speeds are above 10 metres/second. This will alertoperators to consider more frequent use of the water truck or a reduction in dustgenerating activities.
· All staff are to be trained in methods to reduce dust and to notify the PlantManager or delegate of activities generating excessive dust.
· Any complaints regarding dust are to be recorded in the complaints logbook(refer Section 6.5).
11. Reporting
· Conditions Compliance Report to the DPI annually for 2001, 2001, 2003 to reportmonthly dust deposition results, HVAS results and interpretation and discussionof results and any complaints received relating to dust and actions taken tomitigate complaints.
· Annual Return to the EPA to be submitted 11 May each year (60 days afterlicence renewal date of 12 March), including monitoring and complaints summaryand Statement of Compliance.
12. Emergency Response
· Works to cease when the operation is resulting in visible dust blowing acrosspublic roads or lands not owned by Dr L.S.Martin.

Z:\Jobs\_HB Maroota\2011\OEMP 2011\OEMP Collated\OEMP 2011.docx
28/11/2011 AppendicesPage 5 of 6
· Operating procedures to be reviewed after works ceased to minimise dustgeneration - e.g.: extraction or processing to cease.
13. Responsibility
· Plant Manager - for monitoring dust and implementing measures to reduce dust,e.g.: deploying water truck.
· Truck drivers on site - for adhering to speed restrictions and covering loads.
· All staff - for identifying excessive dust generating activities and reducing dustaccordingly.

APPENDIX B
EMISSIONS INVENTORY

HODGSON QUARRY PRODUCTS
SAND EXTRACTION
ROBERTS ROAD, MAROOTA APPENDIX B-1
AIR QUALITY IMPACT ASSESSMENT REPORT NO. 14229 VERSION B
B.1 Particulate Emission Factor Equations
Haul roads
Wheel generated particulate emissions associated with material haulage are estimated using the
following US EPA emission factors (US EPA, 1985 and updates):
𝐸[𝑘𝑔/𝑉𝐾𝑇] = 0.2819 × 𝑎 × (𝑠
12)
𝑏
× (1.1023 × 𝑊
3)
0.45
Where:
𝑎 = 4.9 for TSP, 1.5 for PM10 and 0.15 for PM2.5
𝑏 = 0.7 for TSP and 0.9 for PM10 and PM2.5
𝑠 = silt content [%] of road surface
𝑊 = weight of vehicle [t]
Particulate emissions from vehicles travelling along sealed haul roads have been estimated using the above equations, and including a control factor of 90%.
Loading / unloading / transferring material
Each tonne of material handles will generate quantities of particulate matter that will depend on
the wind speed and the moisture content of the material according to the US EPA emission factor
(US EPA, 1985 and updates) shown below:
𝐸[𝑘𝑔/𝑡] = 𝑘 × 0.0016 × ((
𝑈2.2
)1.3
(𝑀2.0
)1.4)
Where:
𝑘 = 0.74 for TSP, 0.35 for PM10 and 0.053 for PM2.5
𝑈 = wind speed [ms-1]
𝑀 = moisture content [%]
The wind speed is taken as the average wind speed from the TAPM dataset.

HODGSON QUARRY PRODUCTS
SAND EXTRACTION
ROBERTS ROAD, MAROOTA APPENDIX B-2
AIR QUALITY IMPACT ASSESSMENT REPORT NO. 14229 VERSION B
Dozers shaping fill material
Particulate emissions for dozers have been estimated using US EPA emission factor equations (US
EPA, 1985 and updates) for dozers on overburden as follows:
𝐸[𝑘𝑔/ℎ] = 𝑎 × (𝑠𝑏
𝑀𝑐)
Where:
𝑎 = 2.6 for TSP, 0.8775 for PM10 and 0.273 for PM2.5
𝑏 = 1.2 for TSP, 1.5 for PM10 and 1.2 for PM2.5
𝑐 = 1.3 for TSP, 1.4 for PM10 and 1.3 for PM2.5
𝑠 = silt content [%]
𝑀 = moisture content [%]
Wind erosion
Particulate emission factors for wind erosion, taken from the NPI (NPI, 2012), are 0.4 kg/ha/h
for TSP and 0.2 kg/ha/h for PM10
Screening
Particulate emission factors for screening concrete have been taken from the US EPA (US EPA,
1985 and updates) and are summarised below:
Activity Emission Factor [kg/t]
TSP PM10 PM2.5
Screening (uncontrolled) 0.0125 0.0043 *
* No emissions data available

HODGSON QUARRY PRODUCTS
SAND EXTRACTION
ROBERTS ROAD, MAROOTA APPENDIX B-3
AIR QUALITY IMPACT ASSESSMENT REPORT NO. 14229 VERSION B
B.2 Emission Estimates
Table B-1 Summary of TSP Emissions – North West extraction
Activity Emission
[kg/day] Intensity Units
Emission
Factor Units
Variable
1 Units
Variable
2 Units
Variable
3 Units
Variable
4 Units
Control
[%]
dozer ripping face 13.34 11 hours/day 2.426 kg/hr 1.0 machines 2.425885778 kg/hr 2.00 silt content [%] 2 moisture content [%] 50
loading dump truck 0.77 1300 t/day 0.001184 kg/t 2.2 wind speed [m/s] 2.00 moisture content [%] 50
dump truck hauling to washery 4.68 24 trucks/day 0.396 kg/truck 0.3 km/trip (one way) 1.524329448 kg/VKT 55 vehicle mass [t] 2 silt content [%] 50
dump truck unloading 1.15 1300 t/day 0.001184 kg/t 2.2 wind speed [m/s] 2.00 moisture content [%] 25
dump truck returning to face 2.97 24 trucks/day 0.251 kg/truck 0.3 km/trip (one way) 0.966894584 kg/VKT 20 vehicle mass [t] 2 silt content [%] 50
loading washery hopper 1.54 1300 t/day 0.001184 kg/t 2.2 wind speed [m/s] 2.00 moisture content [%]
screening 16.25 1300 t/day 0.0125 kg/t
unloading to stockpile 0.25 1000 t/day 0.000254321 kg/t 2.2 wind speed [m/s] 6.00 moisture content [%]
empty trucks entering site 3.55 31 trucks/day 0.227 kg/truck 0.3 km/trip (one way) 0.874519749 kg/VKT 16 vehicle mass [t] 2 silt content [%] 50
loading trucks 1.18 1000 t/day 0.001184 kg/t 2.2 wind speed [m/s] 2.00 moisture content [%]
loaded trucks leaving site 5.82 31 trucks/day 0.373 kg/truck 0.3 km/trip (one way) 1.433752493 kg/VKT 48 vehicle mass [t] 2 silt content [%] 50
Wind Erosion - Washery 4.80 24 hours/day 0.200 kg/h 0.5 area [ha] 0.4 kg/ha/h
Wind Erosion - Pit 2.40 24 hours/day 0.200 kg/h 0.5 area [ha] 0.4 kg/ha/h 50
TOTAL 58.73
Table B-2 Summary of PM10 Emissions – North West extraction
Activity Emission
[kg/day] Intensity Units
Emission
Factor Units
Variable
1 Units
Variable
2 Units
Variable
3 Units
Variable
4 Units
Control
[%]
dozer ripping face 1.99 11 hours/day 0.362 kg/hr 1.0 machines 0.361723544 kg/hr 2.00 silt content [%] 2 moisture content [%] 50
loading dump truck 0.36 1300 t/day 0.00056 kg/t 2.2 wind speed [m/s] 2.00 moisture content [%] 50
dump truck hauling to washery 1.00 24 trucks/day 0.085 kg/truck 0.3 km/trip (one way) 0.33 kg/VKT 55 vehicle mass [t] 2 silt content [%] 50
dump truck unloading 0.55 1300 t/day 0.00056 kg/t 2.2 wind speed [m/s] 2.00 moisture content [%] 25
dump truck returning to face 0.64 24 trucks/day 0.054 kg/truck 0.3 km/trip (one way) 0.21 kg/VKT 20 vehicle mass [t] 2 silt content [%] 50
loading washery hopper 0.73 1300 t/day 0.00056 kg/t 2.2 wind speed [m/s] 2.00 moisture content [%]
screening 5.59 1300 t/day 0.0043 kg/t
unloading to stockpile 0.12 1000 t/day 0.000120287 kg/t 2.2 wind speed [m/s] 6.00 moisture content [%]
empty trucks entering site 0.76 31 trucks/day 0.049 kg/truck 0.3 km/trip (one way) 0.19 kg/VKT 16 vehicle mass [t] 2 silt content [%] 50
loading trucks 0.56 1000 t/day 0.00056 kg/t 2.2 wind speed [m/s] 2.00 moisture content [%]
loaded trucks leaving site 1.25 31 trucks/day 0.080 kg/truck 0.3 km/trip (one way) 0.31 kg/VKT 48 vehicle mass [t] 2 silt content [%] 50
Wind Erosion - Washery 2.40 24 hours/day 0.100 kg/h 0.5 area [ha] 0.20 kg/ha/h
Wind Erosion - Pit 1.20 24 hours/day 0.100 kg/h 0.5 area [ha] 0.20 kg/ha/h 50
TOTAL 17.14

HODGSON QUARRY PRODUCTS
SAND EXTRACTION
ROBERTS ROAD, MAROOTA APPENDIX B-4
AIR QUALITY IMPACT ASSESSMENT REPORT NO. 14229 VERSION B
Table B-3 Summary of TSP Emissions – North East processing
Activity Emission
[kg/day] Intensity Units
Emission
Factor Units
Variable
1 Units
Variable
2 Units
Variable
3 Units
Variable
4 Units
Control
[%]
dozer ripping face 13.34 11 hours/day 2.426 kg/hr 1.0 machines 2.425885778 kg/hr 2.00 silt content [%] 2 moisture content [%] 50
loading dump truck 0.77 1300 t/day 0.001184 kg/t 2.2 wind speed [m/s] 2.00 moisture content [%] 50
dump truck hauling to washery 3.60 24 trucks/day 0.305 kg/truck 0.2 km/trip (one way) 1.524329448 kg/VKT 55 vehicle mass [t] 2 silt content [%] 50
dump truck unloading 1.15 1300 t/day 0.001184 kg/t 2.2 wind speed [m/s] 2.00 moisture content [%] 25
dump truck returning to face 2.29 24 trucks/day 0.193 kg/truck 0.2 km/trip (one way) 0.966894584 kg/VKT 20 vehicle mass [t] 2 silt content [%] 50
loading washery hopper 1.54 1300 t/day 0.001184 kg/t 2.2 wind speed [m/s] 2.00 moisture content [%]
screening 16.25 1300 t/day 0.0125 kg/t
unloading to stockpile 0.25 1000 t/day 0.000254321 kg/t 2.2 wind speed [m/s] 6.00 moisture content [%]
empty trucks entering site 2.73 31 trucks/day 0.175 kg/truck 0.2 km/trip (one way) 0.874519749 kg/VKT 16 vehicle mass [t] 2 silt content [%] 50
loading trucks 1.18 1000 t/day 0.001184 kg/t 2.2 wind speed [m/s] 2.00 moisture content [%]
loaded trucks leaving site 4.48 31 trucks/day 0.287 kg/truck 0.2 km/trip (one way) 1.433752493 kg/VKT 48 vehicle mass [t] 2 silt content [%] 50
Wind Erosion - Washery 4.80 24 hours/day 0.200 kg/h 0.5 area [ha] 0.4 kg/ha/h
Wind Erosion - Pit 2.40 24 hours/day 0.200 kg/h 0.5 area [ha] 0.4 kg/ha/h 50
TOTAL 54.80
Table B-4 Summary of PM10 Emissions – North East processing
Activity Emission
[kg/day] Intensity Units
Emission
Factor Units
Variable
1 Units
Variable
2 Units
Variable
3 Units
Variable
4 Units
Control
[%]
dozer ripping face 1.99 11 hours/day 0.362 kg/hr 1.0 machines 0.361723544 kg/hr 2.00 silt content [%] 2 moisture content [%] 50
loading dump truck 0.36 1300 t/day 0.00056 kg/t 2.2 wind speed [m/s] 2.00 moisture content [%] 50
dump truck hauling to washery 0.77 24 trucks/day 0.065 kg/truck 0.2 km/trip (one way) 0.33 kg/VKT 55 vehicle mass [t] 2 silt content [%] 50
dump truck unloading 0.55 1300 t/day 0.00056 kg/t 2.2 wind speed [m/s] 2.00 moisture content [%] 25
dump truck returning to face 0.49 24 trucks/day 0.041 kg/truck 0.2 km/trip (one way) 0.21 kg/VKT 20 vehicle mass [t] 2 silt content [%] 50
loading washery hopper 0.73 1300 t/day 0.00056 kg/t 2.2 wind speed [m/s] 2.00 moisture content [%]
screening 5.59 1300 t/day 0.0043 kg/t
unloading to stockpile 0.12 1000 t/day 0.000120287 kg/t 2.2 wind speed [m/s] 6.00 moisture content [%]
empty trucks entering site 0.58 31 trucks/day 0.037 kg/truck 0.2 km/trip (one way) 0.19 kg/VKT 16 vehicle mass [t] 2 silt content [%] 50
loading trucks 0.56 1000 t/day 0.00056 kg/t 2.2 wind speed [m/s] 2.00 moisture content [%]
loaded trucks leaving site 0.96 31 trucks/day 0.061 kg/truck 0.2 km/trip (one way) 0.31 kg/VKT 48 vehicle mass [t] 2 silt content [%] 50
Wind Erosion - Washery 2.40 24 hours/day 0.100 kg/h 0.5 area [ha] 0.20 kg/ha/h
Wind Erosion - Pit 1.20 24 hours/day 0.100 kg/h 0.5 area [ha] 0.20 kg/ha/h 50
TOTAL 16.30

HODGSON QUARRY PRODUCTS
SAND EXTRACTION
ROBERTS ROAD, MAROOTA APPENDIX B-5
AIR QUALITY IMPACT ASSESSMENT REPORT NO. 14229 VERSION B
Table B-5 Summary of TSP Emissions – South East extraction
Activity Emission
[kg/day] Intensity Units
Emission
Factor Units
Variable
1 Units
Variable
2 Units
Variable
3 Units
Variable
4 Units
Control
[%]
dozer ripping face 13.34 11 hours/day 2.426 kg/hr 1.0 machines 2.425885778 kg/hr 2.00 silt content [%] 2 moisture content [%] 50
loading dump truck 0.77 1300 t/day 0.001184 kg/t 2.2 wind speed [m/s] 2.00 moisture content [%] 50
dump truck hauling to washery 5.94 24 trucks/day 0.503 kg/truck 0.3 km/trip (one way) 1.524329448 kg/VKT 55 vehicle mass [t] 2 silt content [%] 50
dump truck unloading 1.15 1300 t/day 0.001184 kg/t 2.2 wind speed [m/s] 2.00 moisture content [%] 25
dump truck returning to face 3.77 24 trucks/day 0.319 kg/truck 0.3 km/trip (one way) 0.966894584 kg/VKT 20 vehicle mass [t] 2 silt content [%] 50
loading washery hopper 1.54 1300 t/day 0.001184 kg/t 2.2 wind speed [m/s] 2.00 moisture content [%]
screening 16.25 1300 t/day 0.0125 kg/t
unloading to stockpile 0.25 1000 t/day 0.000254321 kg/t 2.2 wind speed [m/s] 6.00 moisture content [%]
empty trucks entering site 4.51 31 trucks/day 0.289 kg/truck 0.3 km/trip (one way) 0.874519749 kg/VKT 16 vehicle mass [t] 2 silt content [%] 50
loading trucks 1.18 1000 t/day 0.001184 kg/t 2.2 wind speed [m/s] 2.00 moisture content [%]
loaded trucks leaving site 7.39 31 trucks/day 0.473 kg/truck 0.3 km/trip (one way) 1.433752493 kg/VKT 48 vehicle mass [t] 2 silt content [%] 50
Wind Erosion - Washery 4.80 24 hours/day 0.200 kg/h 0.5 area [ha] 0.4 kg/ha/h
Wind Erosion - Pit 2.40 24 hours/day 0.200 kg/h 0.5 area [ha] 0.4 kg/ha/h 50
TOTAL 63.31
Table B-6 Summary of PM10 Emissions – South East extraction
Activity Emission
[kg/day] Intensity Units
Emission
Factor Units
Variable
1 Units
Variable
2 Units
Variable
3 Units
Variable
4 Units
Control
[%]
dozer ripping face 1.99 11 hours/day 0.362 kg/hr 1.0 machines 0.361723544 kg/hr 2.00 silt content [%] 2 moisture content [%] 50
loading dump truck 0.36 1300 t/day 0.00056 kg/t 2.2 wind speed [m/s] 2.00 moisture content [%] 50
dump truck hauling to washery 1.27 24 trucks/day 0.108 kg/truck 0.3 km/trip (one way) 0.33 kg/VKT 55 vehicle mass [t] 2 silt content [%] 50
dump truck unloading 0.55 1300 t/day 0.00056 kg/t 2.2 wind speed [m/s] 2.00 moisture content [%] 25
dump truck returning to face 0.81 24 trucks/day 0.068 kg/truck 0.3 km/trip (one way) 0.21 kg/VKT 20 vehicle mass [t] 2 silt content [%] 50
loading washery hopper 0.73 1300 t/day 0.00056 kg/t 2.2 wind speed [m/s] 2.00 moisture content [%]
screening 5.59 1300 t/day 0.0043 kg/t
unloading to stockpile 0.12 1000 t/day 0.000120287 kg/t 2.2 wind speed [m/s] 6.00 moisture content [%]
empty trucks entering site 0.96 31 trucks/day 0.062 kg/truck 0.3 km/trip (one way) 0.19 kg/VKT 16 vehicle mass [t] 2 silt content [%] 50
loading trucks 0.56 1000 t/day 0.00056 kg/t 2.2 wind speed [m/s] 2.00 moisture content [%]
loaded trucks leaving site 1.58 31 trucks/day 0.101 kg/truck 0.3 km/trip (one way) 0.31 kg/VKT 48 vehicle mass [t] 2 silt content [%] 50
Wind Erosion - Washery 2.40 24 hours/day 0.100 kg/h 0.5 area [ha] 0.20 kg/ha/h
Wind Erosion - Pit 1.20 24 hours/day 0.100 kg/h 0.5 area [ha] 0.20 kg/ha/h 50
TOTAL 18.12

APPENDIX C
CONTOUR PLOTS

HODGSON QUARRY PRODUCTS
SAND EXTRACTION
ROBERTS ROAD, MAROOTA APPENDIX C-1
AIR QUALITY IMPACT ASSESSMENT REPORT NO. 14229 VERSION B
Figure C-1 24 hour PM10 Concentration [μg/m3] – North West extraction
Figure C-2 24 hour PM10 Concentration [μg/m3] – North East processing

HODGSON QUARRY PRODUCTS
SAND EXTRACTION
ROBERTS ROAD, MAROOTA APPENDIX C-2
AIR QUALITY IMPACT ASSESSMENT REPORT NO. 14229 VERSION B
Figure C-3 24 hour PM10 Concentration [μg/m3] – South East extraction