appendix 1: tauranga centre detailed...
TRANSCRIPT
10.
APPENDIX 1: TAURANGA CENTRE DETAILED ANALYSIS Tauranga - economic vibrancy outcomes
1) Indicators of prosperity
a) GDP per capita Gross domestic product (GDP) per capita is often used as a proxy for standard of living. A higher GDP per capita is generally associated with a higher standard of living. New Zealand's GDP per capita is low relative to many wealthy countnes, currently at similar levels to Spain and Korea. GDP per capita in the Tauranga city territonal authority area was $37,042 in 2013. This was lower than GDP per capita for New Zealand of $47,443, and the lowest of the comparator cities.
b) Estimated Productivity (GDP/FTE) GDP per filled job is a proxy for output per worker, and is influenced by a city's industnal structure and specialisations, and by the levels of capital and labour required.
The Ministry of Business, Innovation and Employment (MBIE) New Zealand Sectors Report 2014 identifies above average productivity sectors (i.e. higher output per worker) including: mining and petroleum extraction; utilities; rental hiring and property services; chemicals, plastics and refining; finance and insurance; media and telecommunications; food and beverage (manufacturing); wholesale trade; transport and logistics; art and recreation services; and professional services.
The MBIE report also highlights lower productivity sectors which include: accommodation and restaurants, retail trade, administration and other services; education; and construction.
Estimates using Statistics New Zealand and Infometrics data suggest that GDP per filled job in Tauranga city was $64,515, and in the centre $67,805. This compares to a New Zeaiand average of $80,640 GDP per filled job. Productivity in Tauranga and its centre is low relative to New Zealand, and comparator cities. This is likely partly due to the absence of some of the highest productivity sectors in Tauranga, but estimated productivity levels across all of Tauranga's industries are lower than nationally. A lack of scale, distance from markets, older population and lower educational profile are likely to be important.
c) Median household incomes Median household income levels are an indicator of economic prosperity, and are measured through the Census and the New Zealand Income Survey. Household income levels are a function of skills and employment levels and the breadth and depth of labour markets. Incomes influence housing affordabiiity and discretionary spending.
34
Commercial In Confidence
106
The 2013 Census shows that the nominal median household income in Tauranga city was lower than the national median, at $55,800 (compared to $63,800). The city's median income was also below the household median income in the comparator cities (Hutt City, $69,500, and Hamilton $64,000). The median household income in the Tauranga central CAU was $51,900 in 2013.
The Census shows that median household income in Tauranga has increased at a similar pace to the median household income nationally since 2001. Tauranga's median household income remains higher than for the Bay of Plenty region ($54,600 in 2013).
In 2010, fewer people in Tauranga felt they had enough money to meet every day needs than nationally, with a very small proportion (9 percent) indicating they had more than enough money (compared to 14 percent across the eight cities) (Quality of Life Survey, 2010).
d) Median earnings In line with income and productivity, median earnings in Tauranga city is relatively low relative to many other cities. Median earnings for Tauranga were $48,370, compared to Hutt City ($52,120), Hamilton ($52,840) and New Plymouth ($54,270) in 2013.
e) Quality of life New Zealand is internationally regarded as offering a high quality of life. The Big Cities Quality of Life survey (2010) found that 89 percent of Tauranga residents believed their overall quality of life was good or extremely good. This is slightly below the eight city average of 92 percent for 2010. Tauranga residents cited family, health, environment, and location and climate as the most important elements of quality of life. When cross-tabulated with incomes, there is a correlation between incomes and perceived of quality of life, indicating that lifting incomes should be a priority for the city.
2) Indicators of economic activity Employment and GDP data for key sectors in Tauranga centre shows that it fared relatively better over the period 2001-2013 when compared to other New Zealand city centres.
a) Growth in business numbers There were 1,582 businesses in Tauranga centre in 2013. This was a similar number to 2006, and an increase from 1,420 in 2001. Annual average growth in business counts in the centre between 2001 and 2013 was 2.8 percent, compared to 0.9 percent across the wider TA area.
Sectors in Tauranga centre that experienced consistent growth in business numbers (2006 and 2013) were financial and insurance services, rental hiring and real estate, professional, scientific and technical services, healthcare and social services, and administrative and support services.
It is possible that changes to the District Plan (operative December 2013) designed to encourage small businesses into the city centre will further support this trend. This growth masks decreasing numbers of retail businesses located in Tauranga centre over the same penod.
35
Commercial In Confidence
10 V
b) Growth in employment Tauranga centre was more resilient following the 2007 global financial ensis than many other New Zealand cities, according to employment data from 2006 to 2013. During this period, many city centres - including Hamilton and Hutt City - saw city centre employment contract by between 5-10 percent. Employment in Tauranga's city centre only decreased slightly (1.5 percent) and appears to have been less affected and more resilient than other cities.
Underlying this overall trend have been changes in the sector employment composition in the city centre. The sector composition of employment in Tauranga's centre changed significantly between 2001-2013, with a decrease in retail employment, and increases in commercial services sectors, notably health and social services, and public administration.
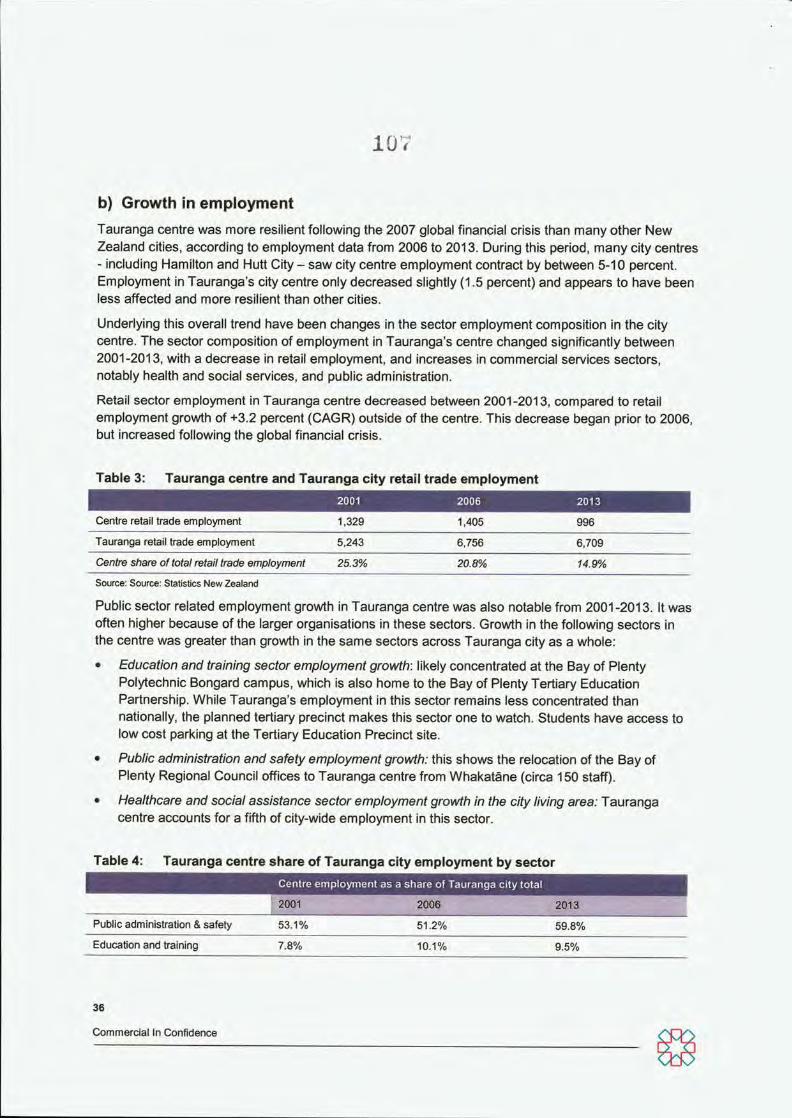
Retail sector employment in Tauranga centre decreased between 2001-2013, compared to retail employment growth of +3.2 percent (CAGR) outside of the centre. This decrease began prior to 2006, but increased following the global financial crisis.
Table 3: Tauranga centre and Tauranga city retail trade employment
Centre retail trade employment 1,329 1,405 996
Tauranga retail trade employment 5,243 6,756 6,709
Centre share of total retail trade employment 25.3% 20.8% 14.9%
Source: Source: Statistics New Zealand
Public sector related employment growth in Tauranga centre was also notable from 2001-2013. It was often higher because ofthe larger organisations in these sectors. Growth in the following sectors in the centre was greater than growrth in the same sectors across Tauranga city as a whole:
• Education and training sector employment growth: likely concentrated at the Bay of Plenty Polytechnic Bongard campus, which is also home to the Bay of Plenty Tertiary Education Partnership. While Tauranga's employment in this sector remains less concentrated than nationally, the planned tertiary precinct makes this sector one to watch. Students have access to low cost parking at the Tertiary Education Precinct site.
• Public administration and safety employment growth: this shows the relocation of the Bay of Plenty Regional Council offices to Tauranga centre from Whakatane (circa 150 staff).
• Healthcare and social assistance sector employment growth in the city living area: Tauranga centre accounts for a fifth of city-wide employment in this sector.
Table 4: Tauranga centre share of Tauranga city employment by sector Centre employment as a share of Tauranga city total
2001 2006 2013
Public administration & safety 53.1% 51.2% 59.8%
Education and training 7.8% 10.1% 9.5%
36
Commercial In Confidence
loa Centre employment as a share of Tauranga city total
Health care and social 23.7% 13.7% 20.0% assistance
c) Growth in labour force participation Labour force participation rates illustrate the proportion of the working age (15 years or older) population who are in the labour force (employed in full- or part-time work, or unemployed and looking for work). Labour force participation is an indicator of the utilisation of an important resource.
New Zealand has a generally higher labour force participation rate than most OECD countnes as a result of higher proportions of women and older people in the workforce. The labour force participation rate for New Zealand is 67.1 percent, 64.5 percent for the Bay of Plenty region, and 63.0 percent for Tauranga city (Census 2013).
Tauranga city's slightly lower labour force participation rate is related to its the older (retired) population profile and slightly lower than average proportions of people aged 17-25 years. The Tauranga central CAU area had a lower labour force participation rate than the city as a whole (52.6 percent).
d) Growth in population As highlighted in the section providing context, Tauranga is expenencing strong population growth relative to New Zealand as a whole, and relative to many other cities, including comparators.
The recorded 2013 Census Tauranga city population was 114,789. This represented compound annual growth ofThe population grew by 1.4 percent per annum on average from 2006, compared to growth of 1.9 percent per annum between 2003 and 2006. The city's population is anticipated to continue to grow, reaching 195,852 people by 2063.
The median age in the Tauranga central CAU was significantly older at 50.8 years, with people 65 years and over representing a third of the Tauranga central population. This is likely to reflect the established nature of the central area suburbs and the presence of a number of retirement /eldedy care homes in the area.
Population growth between 2006 and 2013 in Tauranga centre was modest, at 0.3 percent per annum on average. Higher population growth in the centre between 2001 and 2006 coincided with several apartment block developments in the central area (CAGR of 1.2 percent). SmartGrowth projections suggest that an additional 628 people will be living in Tauranga central area (compared to 32,884 across the TA) in 2028.
The Tauranga City Plan allows for further higher density development in the centre. To date, developers have not taken advantage of these provisions. There has been interest in the potential need for student accommodation (Tertiary Education Precinct) requirements, ranging from student accommodation to apartments.
Melbourne is a comparable example. Researchers in Melbourne - where growth in the city centre is strong - surveyed residential developers and residents to identify the barriers to development, and the types of housing that would attract residents back into the centre (Grattan Institute, 2011). They found
37
Commercial In Confidence
109
that the convenience of the city centre was attractive - but that people had different housing preferences to the existing options.
This research has supported a better understanding of development in Melbourne's centre and housing provision in line with these preferences. While Melbourne's housing is still unaffordable, residents have returned to the city centre, increasing economic vibrancy. CBD residents grew by 5,000 people in the year ended June 2013 (an increase of 23 percent) according to a report in The Age newspaper eadier this year.
e) Growth in visitor numbers Tauranga city remains an attractive destination for domestic visitors and increasing numbers of cruise ship passengers are dnving an increase in international visitors:. 84 cruise ships will visit Tauranga in the 2014/15 season, carrying 168,000 passengers and 30,000 0 crew. Many of the cruise ship passengers are from Australia and are attracted to cruises because they are a good "value" holiday option.
While Although data shows that cruise passengers do not spend as much as other international visitors, new evidence also suggests that a good expenence can influence return visits.
Understanding and developing the activities and retail offerings that are attractive to these passengers will see the centrewill help the centre to make the most of this growing market. Downtown Tauranga has established a City Centre Express shuttle and a retail voucher system to encourage passengers into the centre. Eight thousand passengers use this service in the 2013-14 season, and this number is expected to rise as services are made half-houdy in 2014/15. Shuttles no longer run on Sundays as many shops are closed. Marketview data suggests that this service has increased international visitor spend in the city centre, particularly in bars, cafes and restaurants.
The majority of visitors to Tauranga city are still from elsewhere in New Zealand, especially neighbounng regions. Like cruises, domestic tounsm is seasonal and concentrated in the summer months.
f) Growth in visitor expenditure Visitor spending in Tauranga city has increased since the global financial crisis, with most of the growth from expenditure by domestic visitors, given their greater numbers. Spending by international visitors has also grown. Electronic transaction data specifically on visitor spending in Tauranga centre is not readily available, although Marketview data can provide information on this expenditure in the centre and across the city.
Marketview data shows that Tauranga city increased its market share of non-local New Zealand and international visitor spend in the year ended September 2014. Growth was slightly higher for international cardholder spending in the centre (2.8 percent compared to 1.8 across the city), likely as a result of Tauranga City Council and Bay of Plenty Tourism supported initiatives, i.e. express bus and arts attractions. Growth in international spending was highest in Mount Maunganui at 3.8 percent.
38
Commercial In Confidence
110
Features of an economically vibrant city centre
3) Business environment
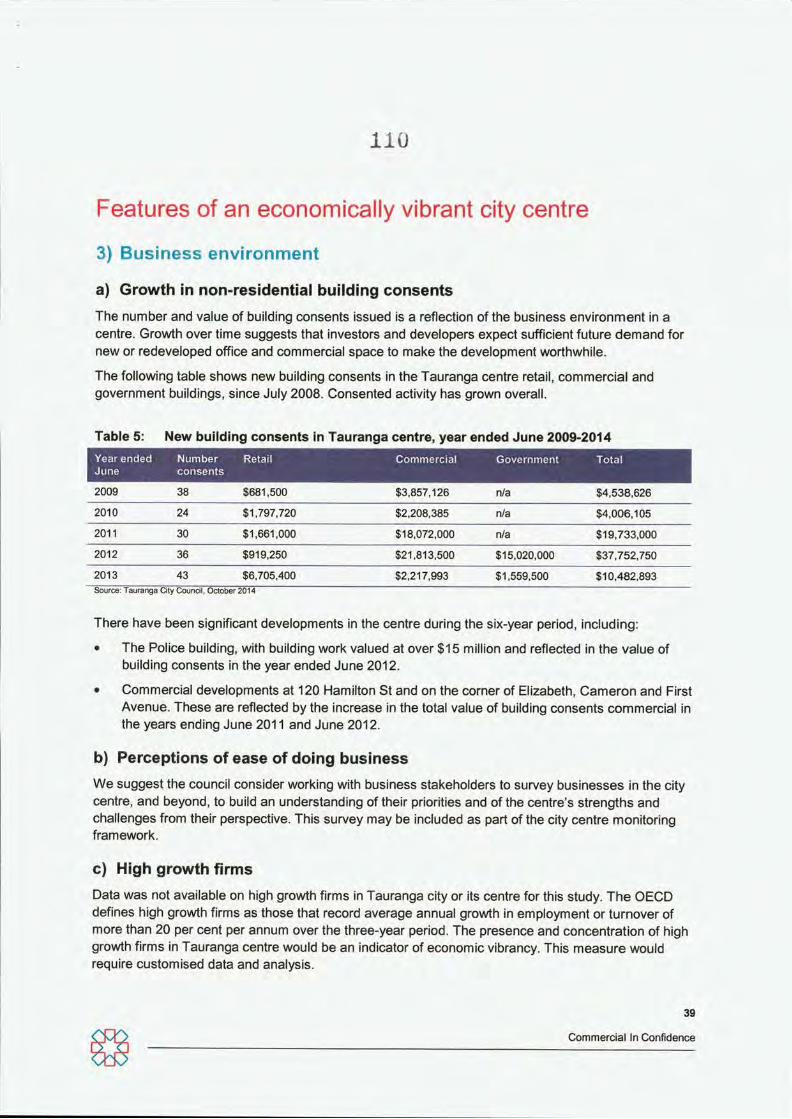
a) Growth in non-residential building consents The number and value of building consents issued is a reflection of the business environment in a centre. Growth over time suggests that investors and developers expect sufficient future demand for new or redeveloped office and commercial space to make the development worthwhile.
The following table shows new building consents in the Tauranga centre retail, commercial and government buildings, since July 2008. Consented activity has grown overall.
Table 5: New building consents in Tauranga centre, year ended June 2009-2014 Year ended June
2009
Number consents
38 $681,500
Commercial
$3,857,126
Government
n/a $4,538,626 2010 24 $1,797,720 $2,208,385 n/a $4,006,105 2011 30 $1,661,000 $18,072,000 n/a $19,733,000 2012 36 $919,250 $21,813,500 $15,020,000 $37,752,750 2013 43 $6,705,400 $2,217,993 $1,559,500 $10,482,893 Source: Tauranga City Council, October 2014
There have been significant developments in the centre during the six-year period, including:
• The Police buiiding, with building work valued at over $15 million and reflected in the value of building consents in the year ended June 2012.
• Commercial developments at 120 Hamilton St and on the corner of Elizabeth, Cameron and First Avenue. These are reflected by the increase in the total value of building consents commercial in the years ending June 2011 and June 2012.
b) Perceptions of ease of doing business We suggest the council consider working with business stakeholders to survey businesses in the city centre, and beyond, to build an understanding of their priorities and ofthe centre's strengths and challenges from their perspective. This survey may be included as part of the city centre monitoring framework.
c) High growth firms Data was not available on high growth firms in Tauranga city or its centre for this study. The OECD defines high growth firms as those that record average annual growth in employment or turnover of more than 20 per cent per annum over the three-year period. The presence and concentration of high growth firms in Tauranga centre would be an indicator of economic vibrancy. This measure would require customised data and analysis.
39
Commercial In Confidence
I l l
4) Diversity and specialisation
a) Employment in high value sectors High value sector employment growth in Tauranga centre was notable from 2001-2013. The observable trends are slightly different between the city centre and city living areas, which we examined separately given their possible implications for parking/transport. Key service sectors where service sector employment grew over the period were:
• Professional, scientific and technical services growth: the data shows increased economic activity since 2001 in service sectors such as professional, scientific and technical services and administrative and support sectors. The data shows that business counts outpaced employment growth, suggesting that more zero-employee businesses have located in the central zone, particulady since 2006.
• Information media and telecommunications employment increasing: In 2013, four-fifths of Tauranga city employment in the information, media and telecommunications sector was in the city centre area and there is growth in employment in this sector in the city centre (the CAGR of employment in this sector in the city centre was 0.8 percent). Limited increases in business counts suggest that employment in larger firms is likely to be growing, e.g. Datacom (formedy Origen).
While employment across high value sectors has grown in the Tauranga centre during the penod from 2001-2013, employment in these sectors grew at higher rates across the rest ofthe city.
b) Economic diversity - Tress index The right balance between diversity of industry and specialisation of sectors supports city centre economic vibrancy. Specialisation in particular areas will encourage the economic benefits that result from the encourages agglomeration effects.
While specialisation is required to maximise the economic benefit of a city centre, diversification is also required. Diversification within sectors across sectors is important to ensure economic resilience. Diversification is also needed to ensure the high value sectors are supported with appropriate support areas like retail and food and beverage.
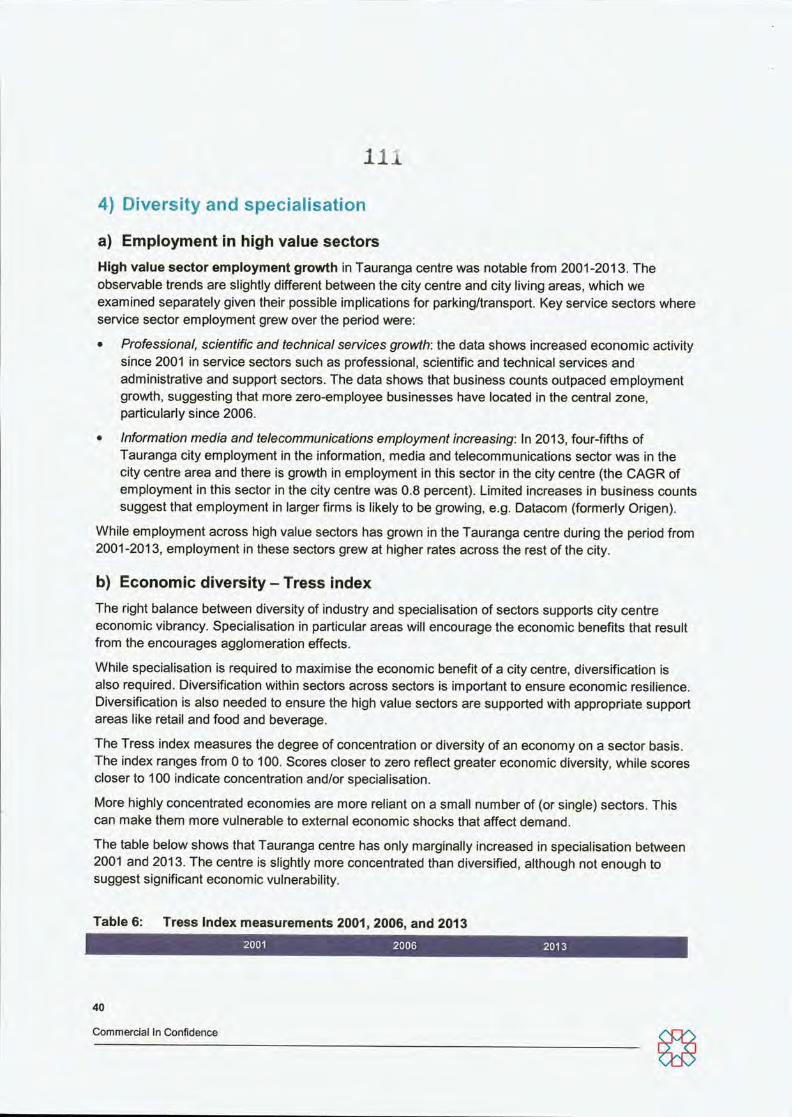
The Tress index measures the degree of concentration or diversity of an economy on a sector basis. The index ranges from 0 to 100. Scores closer to zero reflect greater economic diversity, while scores closer to 100 indicate concentration and/or specialisation.
More highly concentrated economies are more reliant on a small number of (or single) sectors. This can make them more vulnerable to external economic shocks that affect demand.
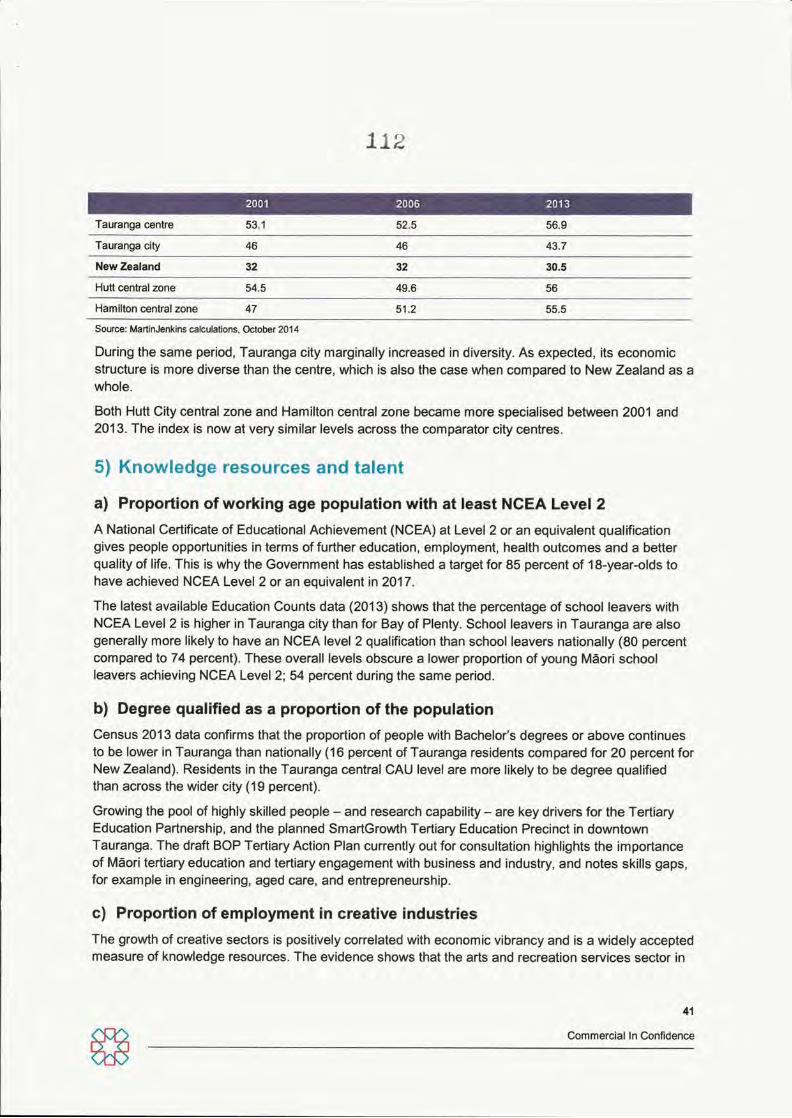
The table below shows that Tauranga centre has only marginally increased in specialisation between 2001 and 2013. The centre is slightly more concentrated than diversified, although not enough to suggest significant economic vulnerability.
Table 6: Tress Index measurements 2001, 2006, and 2013
40
Commercial In Confidence
112
Tauranga centre 53.1 52.5 56.9
Tauranga city 46 46 43.7
NewZealand 32 32 30.5
Hutt central zone 54.5 49.6 56
Hamilton central zone 47 51.2 55.5
Source: MartinJenl<ins calculations, October 2014
Dunng the same period, Tauranga city marginally increased in diversity. As expected, its economic structure is more diverse than the centre, which is also the case when compared to New Zealand as a whole.
Both Hutt City central zone and Hamilton central zone became more specialised between 2001 and 2013. The index is now at very similar levels across the comparator city centres.
5) Knowledge resources and talent
a) Proportion of working age population with at least NCEA Level 2 A National Certificate of Educational Achievement (NCEA) at Level 2 or an equivalent qualification gives people opportunities in terms of further education, employment, health outcomes and a better quality of life. This is why the Government has established a target for 85 percent of 18-year-olds to have achieved NCEA Level 2 or an equivalent in 2017.
The latest available Education Counts data (2013) shows that the percentage of school leavers with NCEA Level 2 is higher in Tauranga city than for Bay of Plenty. School leavers in Tauranga are also generally more likely to have an NCEA level 2 qualification than school leavers nationally (80 percent compared to 74 percent). These overall levels obscure a lower proportion of young Maon school leavers achieving NCEA Level 2; 54 percent dunng the same period.
b) Degree qualified as a proportion of the population Census 2013 data confirms that the proportion of people with Bachelor's degrees or above continues to be lower in Tauranga than nationally (16 percent of Tauranga residents compared for 20 percent for New Zealand). Residents in the Tauranga central CAU level are more likely to be degree qualified than across the wider city (19 percent).
Growing the pool of highly skilled people - and research capability - are key drivers for the Tertiary Education Partnership, and the planned SmartGrowth Tertiary Education Precinct in downtown Tauranga. The draft BOP Tertiary Action Plan currently out for consultation highlights the importance of Maori tertiary education and tertiary engagement with business and industry, and notes skills gaps, for example in engineenng, aged care, and entrepreneurship.
c) Proportion of employment in creative industries The growth of creative sectors is positively correlated with economic vibrancy and is a widely accepted measure of knowledge resources. The evidence shows that the arts and recreation services sector in
41
Commercial In Confidence
11
Tauranga centre is growing, albeit off a small base, with compound annual growth of 4.8 percent in the city centre meshblock area from 2001-2013. This is a positive trend for Tauranga centre, and the wider TA territonal authority, which also experienced growth over this penod.
d) Number of skilled migrants Skilled migrants are international migrants that come to New Zealand for employment that requires specialist, technical or management expertise. Skilled migrants are globally mobile and there is strong competition for the skills they bnng. The evidence suggests that New Zealand's quality of life is attractive to skilled migrants.
The majority of skilled migrants that come to New Zealand (roughly a third) live in Auckland. This reflects its labour market thickness and existing migrant communities. An increasing proportion of skilled migrants live in Christchurch. Auckland, Chnstchurch, Wellington, and Otago accounted for neady three-quarters ofall skilled migrants in 2013 (MBIE Essential Skills data).
Tauranga has a smaller proportion of overseas-born residents than New Zealand as a whole (19 percent compared with 24 percent. Census 2013). Tauranga residents born overseas are more likely to be from Australia, the UK or Ireland. 13 percent of overseas-born residents hold a Bachelor's degree or higher (Census 2013).
Tauranga's planned Tertiary Education Precinct is anticipated to bring more international students to the city centre. Retaining qualified students could also lift Tauranga's future skills levels. A higher proportion of Tauranga residents born overseas currently live in the Tauranga central CAU than in Tauranga city overall (37 percent compared to 23 percent. Census 2013).
e) Growth in knowledge intensive industries Available data shows that employment in knowledge-intensive (Kl) industries in Tauranga is increasing, albeit off a smaller base than larger cities such as Wellington, Auckland and Chnstchurch. Growth over the last five years has slowed, but during the last decade, employment growth in these industnes in Tauranga was amongst the top ten territonal authorities in New Zealand.
Employment in these industries has increased by 1.5 percent across the city over the past five years, a similar rate to Hamilton and Hutt City. Overall employment levels in Kl industries in Tauranga are similar to Hutt City (around 16,000), and twice as large in volume terms in Hamilton. As expected employment in these industnes in New Plymouth is lower at around 10,000 and have experienced similar growth levels over the past five years.
f) Level of core human resources in science and technology Obtaining this data would require additional analysis using international definitions for the city and centre. We would expect relatively limited employment in this sector in the centre at present, with the exception of staff at the Bay of Plenty Bongard campus.
6) Amenities Tauranga centre is well regarded by residents and experts for the quality of its environment and amenity. Even residents who shop at sub-regional centres such as Bayfair, highlight the attractiveness
42
Commercial In Confidence
11'
of the centre as a preferred feature. Perceptions about safety (particularly for restaurant and bar patrons) and parking availability for shoppers, will continue to be important considerations for the development of the city centre.
a) Urban open area space The availability of public outdoor space is one aspect of the amenity of the area, and was investigated in the Neilson Quality of Life Survey, 2010, when Tauranga residents were asked how easily they could get to a local park or other green space. 95 percent of Tauranga respondents indicated that they found it very easy or easy to access a local park of a green space. This finding is supported by available data on public green space per person (Quality of Life report 2008).
Tauranga centre has a growing range of public spaces that support users to appreciate the local climate and waterfront location, and which contribute to its atmosphere and amenity. These include the waterfront, the city square and Masonic Park, the Domain, and Cliff Road, as well as a variety of plaza spaces and streetscapes.
There is ongoing redevelopment and investment in these public spaces, notably the Tauranga Waterfront Project where the council is redeveloping the waterfront area to increase its attractiveness to businesses and individuals.
b) Crime per 10,000 population Cnme and public perceptions of safety are another aspect of the amenity of the city centre. Police data for 2013/14 shows that recorded crime in the Western Bay of Plenty, which includes Tauranga city, is decreasing and below wider Bay of Plenty region and national levels.
Crime figures from June 2013 show that levels in the Western Bay of Plenty (756 offences per 10,000 people) are lower than the Bay of Plenty (1005 offences per 10,000 people) and national rates (821 offences per 10,000 people).
c) Perceptions of safety Perceptions of safety are important, and safety is typically an area where small cities out-perform larger cities. The perceived safety of a city centre is an important element when seeking to increase mixed use in a city centre.
Surveys suggest that Tauranga residents are more concerned about crime than the national average (Quality of Life survey 2010, Southern Cross Healthcare survey). While the majority of Tauranga residents reported feeling very safe in the city centre (75 percent) during the day, 45 percent felt a bit unsafe or very unsafe in the city centre after dark. Of the respondents who felt unsafe, 43 percent cited drug and alcohol abuse issues in the area.
In 2013, Tauranga City Council and partners including the New Zealand Police, Mainstreet, Priority One, and others including CBD licensees, refreshed the Tauranga City Centre Night Management Plan. This provides a platform for proactive cooperation towards public and personal safety; safe and successful premises and precincts; successful education, marketing and promotion; a safe and clean environment; and a supportive monitoring, management and regulation regime.
43
Commercial In Confidence
I l d
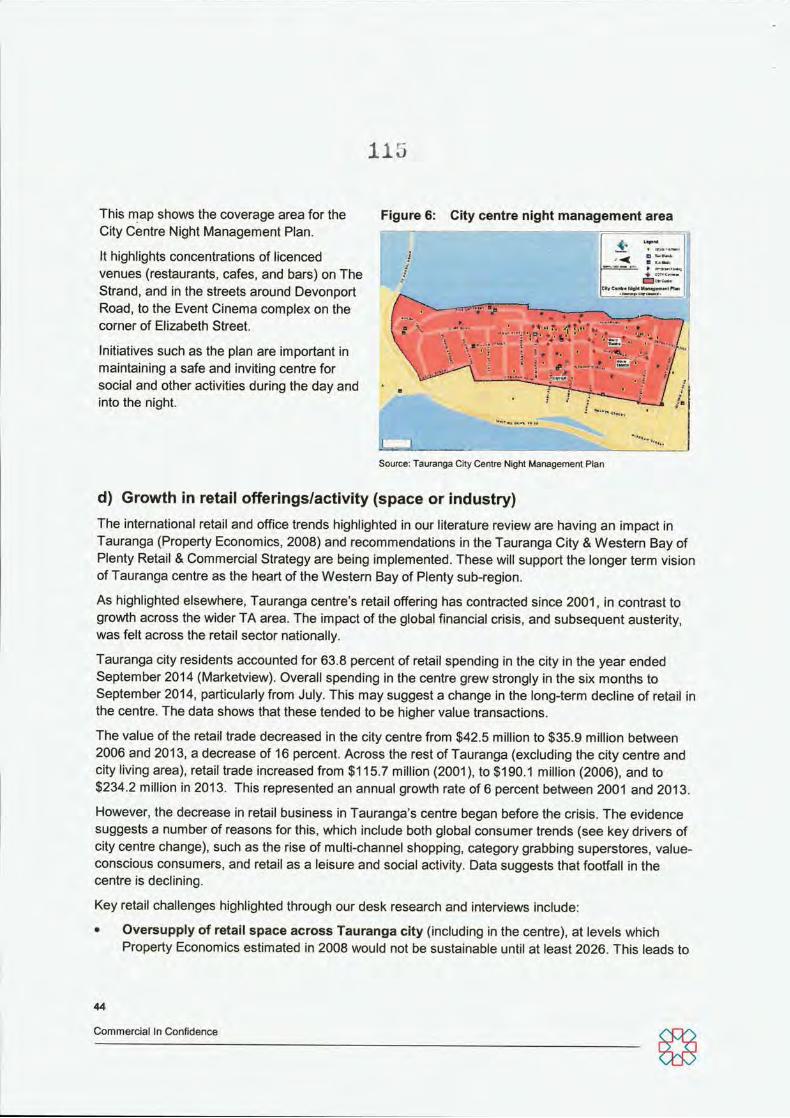
Figure 6: City centre night management area
Cll/ CtnO* fiow MiinM»m«il Hn
I
This map shows the coverage area for the City Centre Night Management Plan.
It highlights concentrations of licenced venues (restaurants, cafes, and bars) on The Strand, and in the streets around Devonport Road, to the Event Cinema complex on the corner of Elizabeth Street.
Initiatives such as the plan are important in maintaining a safe and inviting centre for social and other activities during the day and into the night.
Source: Tauranga City Centre Nigtit Management Plan
d) Growth in retail offerings/activity (space or industry) The international retail and office trends highlighted in our literature review are having an impact in Tauranga (Property Economics, 2008) and recommendations in the Tauranga City & Western Bay of Plenty Retail & Commercial Strategy are being implemented. These will support the longer term vision of Tauranga centre as the heart of the Western Bay of Plenty sub-region.
As highlighted elsewhere, Tauranga centre's retail offering has contracted since 2001, in contrast to growth across the wider TA area. The impact of the global financial crisis, and subsequent austerity, was felt across the retail sector nationally.
Tauranga city residents accounted for 63.8 percent of retail spending in the city in the year ended September 2014 (Marketview). Overall spending in the centre grew strongly in the six months to September 2014, particulady from July. This may suggest a change in the long-term decline of retail in the centre. The data shows that these tended to be higher value transactions.
The value of the retail trade decreased in the city centre from $42.5 million to $35.9 million between 2006 and 2013, a decrease of 16 percent. Across the rest of Tauranga (excluding the city centre and city living area), retail trade increased from $115.7 million (2001), to $190.1 million (2006), and to $234.2 million in 2013. This represented an annual growth rate of 6 percent between 2001 and 2013.
However, the decrease in retail business in Tauranga's centre began before the ensis. The evidence suggests a number of reasons for this, which include both global consumer trends (see key drivers of city centre change), such as the nse of multi-channel shopping, category grabbing superstores, value-conscious consumers, and retail as a leisure and social activity. Data suggests that footfall in the centre is declining.
Key retail challenges highlighted through our desk research and interviews include:
• Oversupply of retail space across Tauranga city (including in the centre), at levels which Property Economics estimated in 2008 would not be sustainable until at least 2026. This leads to
44
Commercial In Confidence
I l u
vacancies and depresses retail rents, particulady in secondary retail space, which is confirmed by analysis of the retail property market.
• Misalignment of retail offering with centre users: a number of key informants noted that the current city centre retail offering is not well aligned to the needs of people employed in the city centre. Areas where the offering is misaligned included:
o Opening hours: many retailers in the centre are closed outside of working hours, reflecting the challenges facing small owner-operated business.
o Undifferentiated retail product offering not tailored to centre users: international experience suggests that city centre retailing is successful when it provides a differentiated offering to what is available in out of town centres, and when it is marketed to city centre users. Barkers (part ofthe retail group) has recently opened a menswear clothing store on Devonport Road, with the intention of catering to the office workers in the centre.
• Limited profile and number of anchor retailers: as noted in the Tauranga City Centre Strategy there are few anchor retailers in the core retail precinct. Additionally, current population projections make it unlikely that supermarkets will consider establishing metro branches, which are often important destination shops.
• Buiiding seismic strengthening is a concern for retailers when looking for premises, particulady for national tenants. The space that has low National Building Standards (NBS) ratings is more likely to be vacant for longer, impacting on the amenity of the city centre. Despite reported demand for pnme retail space (including Devonport Road) there are vacant premises in these areas, partly as a result of seismic strengthening requirements.
City centre retailers and Mainstreet Tauranga are working with the council to address these challenges, but experience elsewhere suggests that the retail core will expenence ongoing challenges. Initiatives include improving the attractiveness of storefronts, improving the streetscape, and improving the vibrancy of the waterfront through activities that would attract shoppers.
In spite of these changes, international experience suggests that shoppers will continue to go to out of town locations which are now being designed to improve their amenity. Auckland's Botany and Sylvia Park malls are examples of New Zealand open-air malls offenng the higher amenity that shoppers value - alongside the convenience, range and accessibility associated with malls. Both are ranked as amongst New Zealand's leading shopping malls by the industry.
Entertainment, restaurants, and bars and cafes are also important attractors for residents into the city centre (Key Research, 2014). These offenngs in particular are important for attracting a wide range of age groups into the centre. The centre's food and beverage offering is significant, with over 70 restaurants, bars and cafes, and is an important attractor to the city centre. The accommodation and food services sector in Tauranga's city centre is recovering following the global financial ensis, and represents around 40 percent of the total value of the sector across the city.
Growth in this sector remains below growth across the wider city. This sector is important for the future of the centre because it provides amenity for business users and visitors, encourages day to night centre use, and can support and attract cruise ship visitors and the wider visitor market. Spending at bars, cafes and restaurants in the centre increased strongly over the past year according to Marketview data.
45
Commercial In Confidence
l i v
e) Growth in cultural offerings or industry Tauranga city centre is home to a number of regionally important cultural and performing arts facilities and heritage offerings. These include Baycourt Community Theatre and Arts Centre, Creative Tauranga, Tauranga Art Gallery, Bnan-Watkins House, and the historic Elms Mission Station.
The City Art Gallery, which opened in 2007, reported in December 2013 that visitor numbers had increased 20 percent versus the six months previously.
Tauranga has five events which have flagship status: Tauranga Arts Festival, National Jazz Festival, Garden & ArtsFest, AIMS Games and Port of Tauranga Half Ironman. These events draw people from around the country, and some internationally, and all are important for the centre (both as a location for venues, and as a location for accommodation and wider visitor spending etc.). The first Waterfront Festival which attracted 5,000 people took place in late 2012.
Council support and corporate sponsorship is important for the sustainability of many of these facilities and events. Developing and maintaining these funding and sponsorship relationships will be important for the future of the arts and creative sector. In 2010, only half of residents reported that they agreed there was a culturally rich and diverse arts scene in the city (Quality of Life Survey), so there is scope to increase this amenity for users of the centre (residents and visitors alike).
f) Proportion of the population that engage with the arts No information is currently available on this measures. The Quality of Life Survey does measure perceptions of the arts scene, but not participation. There is evidence that patronage is increasing at the Tauranga City Art Gallery, but this information is currently limited.
g) Parking availability Over two thirds of Tauranga households own at least one motor vehicle, and Census data shows that most residents travel to work using pnvate motor vehicles. Parking availability is therefore a key consideration for Tauranga to meet the needs of different centre users, ranging from businesses and commuters, to shoppers and others coming into the centre for entertainment (often outside working hours).
Historical data and information on planned activity suggest that the number of commuters into the city centre is likely to increase. The council is considenng how to meet the parking needs of future centre users including future staff and students at the Durham Street Trustpower office and tertiary campus. Stage One of the tertiary campus could be complete in 2015, with an initial capacity of 500 students. The Trustpower building will have 65 leased carparks for a workforce of up to 450 people.
Minimum parking requirements for developments in the centre were removed in 2012 by the council, in response to business and developer demand. Parking development options range from increasing the occupancy of existing parking (for example through a smart parking initiative), increasing the capacity of existing parking stock, or construction of a new parking building.
There is no specific evidence of whether commercial business or commuter needs are currently being met. Long-term off-street carpark areas likely used by commuters currently have some spare capacity, suggesting that commuter's needs are currently probably being met (Harnson, 2014).
46
Commercial In Confidence
l i o
Perceptions of parking ease and availability have been assessed through surveys commissioned by the council and retailers. These surveys suggest parking costs and ease are a key concern for residents for whom these are barriers to visiting the centre for shopping or entertainment.
Tauranga City Council has undertaken parking studies to determine the vacancy rates of different types of car parking provided in the city. From those studies, it can be concluded that there are car parks available for most types of visits to the city. However, some streets are expenencing occupancy rates of over 85% for some time penods and at these times finding convenient parking may be difficult.
The surveys highlight that for mid-week parking:
• The demand for car parking space in the $1 zone is not greater than the supply.
• There is significant variation in demand for $2 parking spaces. In the core of the central area Devonport Road (north of First Avenue), Grey Street and Willow Street (south of Hamilton Street) all have a peak parking occupancy within the optimum maximum of 85% to 90%. Other areas further away from the centre have occupancies of less than 50% indicating that there is plenty of supply of car parks.
• For short-term off-street parking the average occupancy was 51%, with a maximum occupancy of 66%. This shows that these spaces are moderately well utilised, but have vacant spaces available, even dunng the peak times.
• For long-term car parks the average occupancy was 71 %, with a peak occupancy of 89%. These spaces are generally well utilised, with the highest occupancy of any parking zone - potentially commuter parking areas.
The findings of the surveys are slightly surprising for weekend parking:
• The demand for car parking space in the $1 zone is lower than for mid-week, but there is still demand for paid parking, despite the free parking in the centre's parking buildings.
• For the $2 zone, as with occupancy rate during the week, there is significant variation in the occupancy rates. However, the average occupancy rates are slightly less than those seen during the week.
• For the off-street short-term car parks, on Saturdays, the occupancy is higher than dunng the week, with an average occupancy of 79% and a maximum occupancy of 96%.
• The average occupancy for the long-term off-street car parks was very low at 20%, with a maximum occupancy of 31 %. This shows that these areas were not well utilised, with relatively few cars parked in these parking areas despite these being free.
7) Built environment New Zealand has lower population densities than many other countries given its relatively small population base. Tauranga is one of the smallest New Zealand local authorities by area. Census 2013 figures show that it has a relatively low population density (854 people per square kilometre) compared to cities in many other OECD countnes (New Zealand's population density is less than half the OECD average). Tauranga centre (including the city centre and city living meshblocks) is home to
47
Commercial In Confidence
llJ
around 1,359 people, suggesting that population density in the centre is unlikely to be much higher (Census 2013).
a) Housing affordabiiity relative to other cities Housing affordabiiity - or lack of - is both an indicator and outcome of a city's attractiveness. Economically vibrant cities typically have more unaffordable housing reflecting higher demand. Auckland is consistently ranked as one of the 10 most unaffordable markets of the 85 that Demographia has surveyed internationally over the past decade.
Evidence from the Demographia International Housing Survey finds that Tauranga has "severely unaffordable" housing based on a city median multiple of 6.6 (housing divided by income, at a median house price of $364,800 in 2013). This makes Tauranga-Western Bay of Plenty New Zealand's most unaffordable housing market.
Home ownership in Tauranga is below the national average - 51.1 percent compared with 54.5 percent (Census 2013). Average weekly rents in Tauranga are also higher than the national average, at $300 compared with $280 nationally (Department of Building and Housing).
b) Vacancy rates - office and retail Vacancy rates are an indicator of demand for office and retail space, based on considerations such as quality, size, and location. There is limited publicly available information on city centre vacancy rates for Tauranga or comparator cities; however, the Bayley's reports suggest that cities across New Zealand are facing some similar challenges:
• "Polarised" demand for retail space where prime locations - typically out of the city centre -expenence low vacancies and low tenancy turnover, while demand for secondary retail space in established city centres remains weak or continues to decline.
• Seismic strengthening that requires landlords to upgrade existing office and retail space in the city centres but that is unlikely to be covered through increased rental returns. As in other city centres, seismic strengthening is underway across Tauranga. While this attracts tenants (both office and retail), rental levels typically do not increase to cover the costs of these upgrades for landlords in the near term. A number of building owners are also constrained by negative equity.
The Tauranga City Council and Priority One completed an assessment and stocktake of earthquake prone buildings dunng 2013. This highlighted the impacts on building owners, and flow on impacts to tenant businesses (devaluation in value; disruption dunng redevelopment), and included five recommendations aimed at supporting seismic redevelopment.
• New office space developments in the city centre (and on city centre fringes) grow the availability of pnme office space (including through redevelopment) and reduce demand for secondary space. Early indications in some city centres that smaller firms - typically service providers - will consider or are already returning to the city centre from home-based offices.
Notable insights from Bayley's market summanes with regard to Tauranga centre are:
48
Commercial In Confidence
120
• Weaker demand for secondary retail space in the centre in contrast to strong demand for prime retail areas (for example along Devonport Road, the Strand, and Grey Street.
• New city centre prime space office developments (and redevelopments) are being delivered and attracting tenants (e.g. Trustpower) but are leaving vacancies in secondary space. These include the movement of CLM to a new building, Westpac's planned move to new offices on Cameron Road (June 2015), and ASB's new regional branch.
c) Average office and retail rents Average office rents are determined by demand, and by the quality and appropriateness of office space. There is limited information available on office rents in Tauranga's centre. Bayleys Marketbeat report provides the best publicly available data at the Tauranga city level.
The March 2014 Marketbeat report highlights a positive outlook for Tauranga city, based on port activity, and the kiwifruit and housing sectors. It notes that industrial activity is leading the market recovery, followed by office and then retail.
The report describes the different scenarios for office and retail prime and secondary stock, and descnbes the secondary market as "struggling". It notes low vacancy rates and good investment yields in prime office and retail spaces. 56 Elizabeth Street, in the city centre, is an example of the yields prime office space can offer. The development of prime offices currently underway is welcomed, including the new Trustpower head office, a new mixed use development on the corner of Harnngton Street and the Strand, and the upgrade of currently vacant space at 35 Grey Street, including seismic strengthening.
While publicly available information on rents is not easily accessible, the 2008 Property Economics report highlighted that at that time Bayfair achieved the highest retail rents in Tauranga at $500-$1300/sqm. This report noted that this was significantly above the city centre retail which achieved rents of $240-$600/sqm. The Property Economics report also noted that the city centre had the highest office rents ($150-$270/sqm), followed by Mount Maunganui ($130-$220/sqm), with city centre office rents typically between $200-$230/sqm.
Table 7: Tauranga office and rental rents by grade Category Rents $/m2
Office Prime 220-320 Secondary 100-180
Retail Prime 300-400
Secondary 150-250
Source: Bayley's Marketbeat reports, various, latest available as at 10 October 2014
8) Connectivity and infrastructure Tauranga centre remains well positioned as the central area within the wider TA, despite the TA's growing population and evolving spatial footprint. Investment in the city's road networks and public and active transport modes has ensured that the centre is easy to access, and safe to get around.
49
Commercial In Confidence
This is in iine with the vision for the wider city and with SmartGrowth transport plans, including Smart Corridors, and the Bay of Plenty Regional Land Transport Strategy 2001-2041.
Traffic calming measures including paving and streetscapes in the city centre support shared use and pedestrian safety. Parking is available in parking buildings at either end of the CBD (Durham Street and Elizabeth Street), as well as on the street.
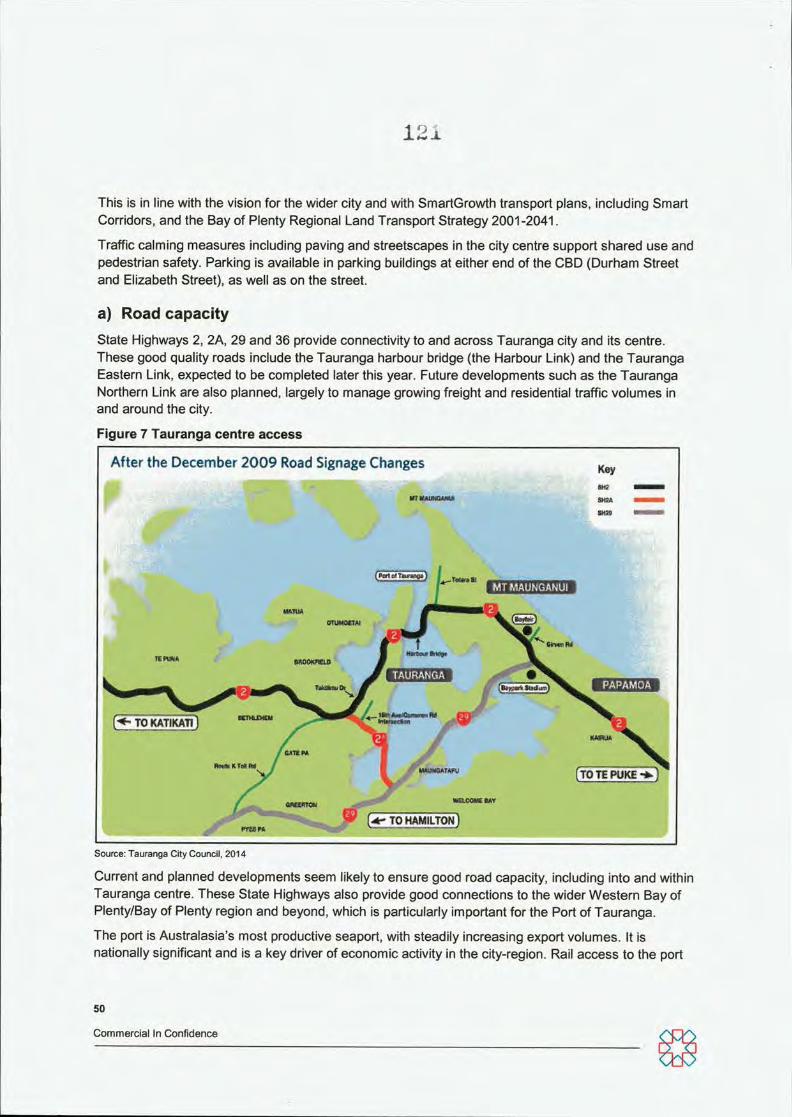
a) Road capacity state Highways 2, 2A, 29 and 36 provide connectivity to and across Tauranga city and its centre. These good quality roads include the Tauranga harbour bridge (the Harbour Link) and the Tauranga Eastern Link, expected to be completed later this year. Future developments such as the Tauranga Northern Link are also planned, largely to manage growing freight and residential traffic volumes in and around the city.
Figure 7 Tauranga centre access
After the December 2009 Road Signage Changes Key
(Pert tti Tiuficaa)
MTMAUNGANUI
mnu
TAURANGA PAPAMOA
[•^ TOKATIKATij KMRO*
k i j i , j « « r t f , i [TOTE PUKE • » ]
TO HAMILTON)
Source: Tauranga City Council, 2014
Current and planned developments seem likely to ensure good road capacity, including into and within Tauranga centre. These State Highways also provide good connections to the wider Western Bay of Plenty/Bay of Plenty region and beyond, which is particulady important for the Port of Tauranga.
The port is Australasia's most productive seaport, with steadily increasing export volumes. It is nationally significant and is a key dnver of economic activity in the city-region. Rail access to the port
50
Commercial In Confidence
•2.(^
is via the East Coast Main Trunk Line, which crosses Tauranga Harbour to join downtown Tauranga to the Matapihi Peninsula and includes a pathway for pedestrians and cyclists.
Cycle and walkways support active transport into the city, and include the Tauranga CBD historic walkway which takes in heritage building and other points of interest, such as the Post Office and Mission cemetery.
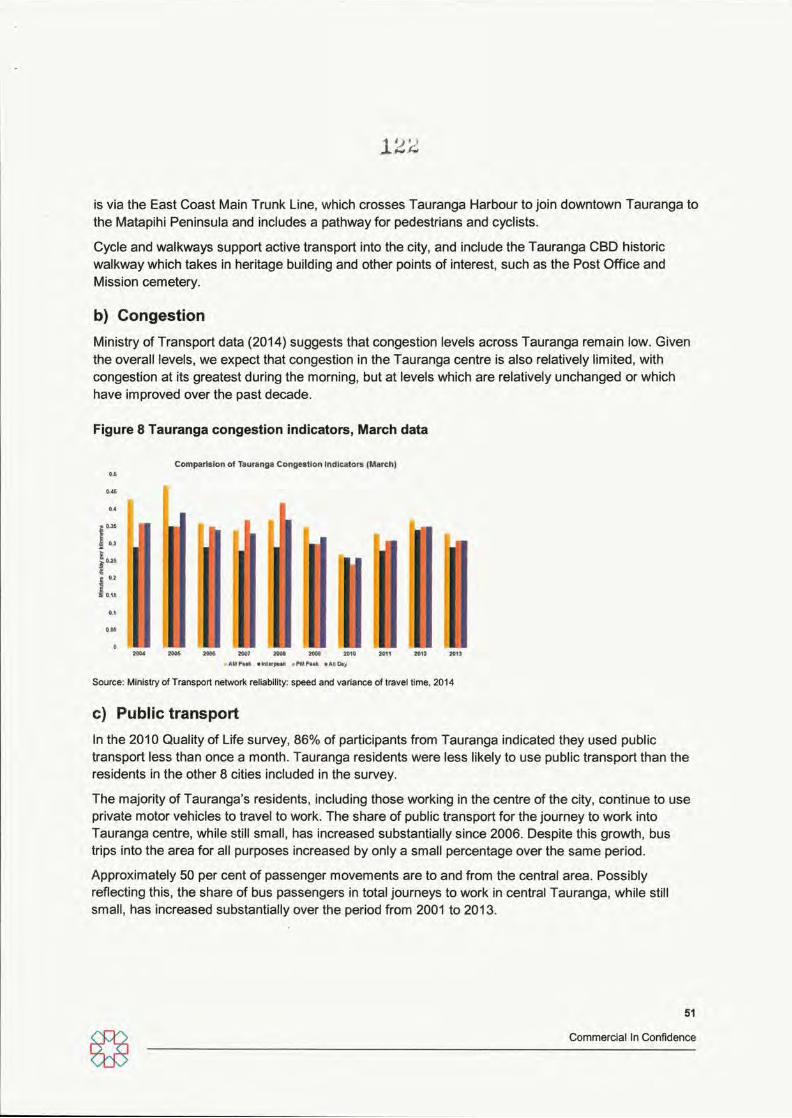
b) Congestion Ministry of Transport data (2014) suggests that congestion levels across Tauranga remain low. Given the overall levels, we expect that congestion in the Tauranga centre is also relatively limited, with congestion at its greatest during the morning, but at levels which are relatively unchanged or which have improved over the past decade.
Figure 8 Tauranga congestion indicators, March data
Comparision of Tauranga Congestion Indicators (March)
0.1
OOS
I
V M 2&0G 2000 2007 2008 2O0S 2010 AMPMk «lnlifp*ik kPMPaak »All Oay
Source: Ministry of Transport networl< reliability: speed and variance of travel time, 2014
c) Public transport In the 2010 Quality of Life survey, 86% of participants from Tauranga indicated they used public transport less than once a month. Tauranga residents were less likely to use public transport than the residents in the other 8 cities included in the survey.
The majonty of Tauranga's residents, including those working in the centre of the city, continue to use pnvate motor vehicles to travel to work. The share of public transport for the journey to work into Tauranga centre, while still small, has increased substantially since 2006. Despite this growth, bus trips into the area for all purposes increased by only a small percentage over the same period.
Approximately 50 per cent of passenger movements are to and from the central area. Possibly reflecting this, the share of bus passengers in total journeys to work in central Tauranga, while still small, has increased substantially over the period from 2001 to 2013.
51
Commercial In Confidence
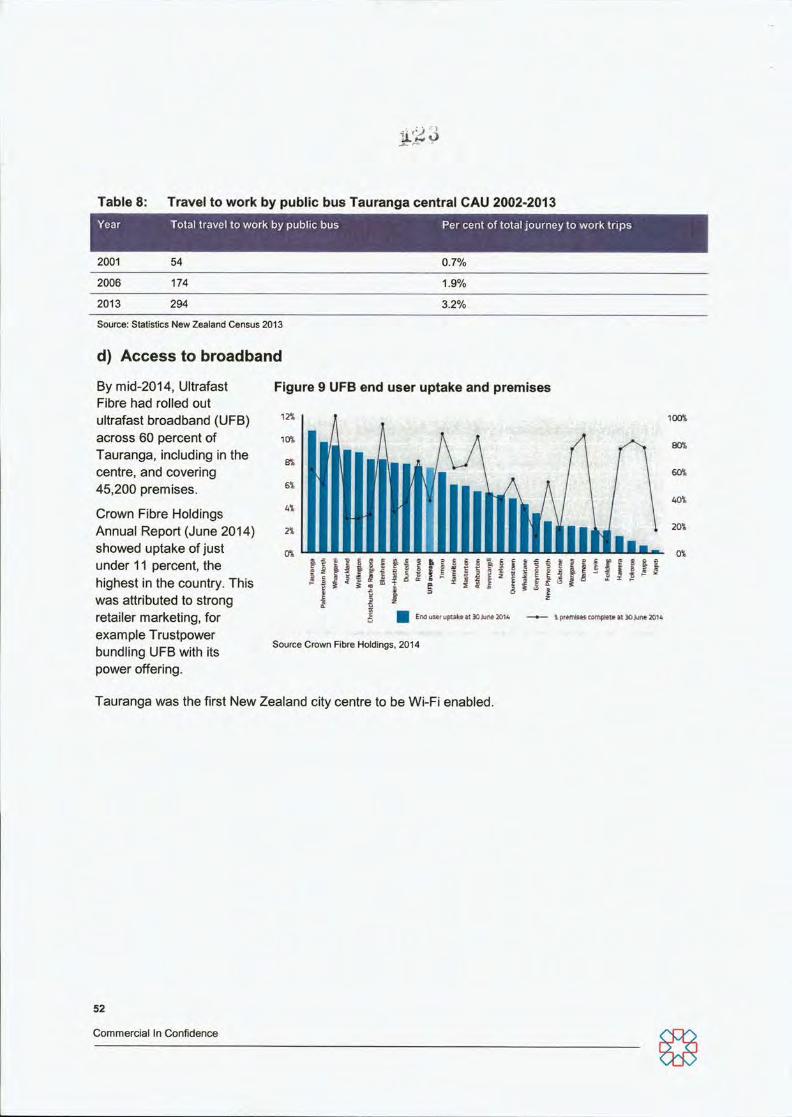
Table 8: Travel to work by public bus Tauranga central CAU 2002-2013 Total travel to work by public bus Per cent of total journey to work tr ips
2001 54 0.7% 2006 174 1.9% 2013 294 3.2% Source: Statistics New Zealand Census 2013
d) Access to broadband
By mid-2014, Ultrafast Fibre had rolled out ultrafast broadband (UFB) across 60 percent of Tauranga, including in the centre, and covering 45,200 premises.
Crown Fibre Holdings Annual Report (June 2014) showed uptake of just under 11 percent, the highest in the country. This was attributed to strong retailer marketing, for example Trustpower bundling UFB with its power offering.
Figure 9 UFB end user uptake and premises
12%
10%
100%
60-.
20-.
u = - = 5 I t
End user uptake at 30 June 20U \ premises cofripleie at 30 June 20U
Source Crown Fibre Holdings, 2014
Tauranga was the first New Zealand city centre to be Wi-Fi enabled.
52
Commercial In Confidence
APPENDIX 2: OVERVIEW OF TAURANGA AND COMPARATOR CITIES
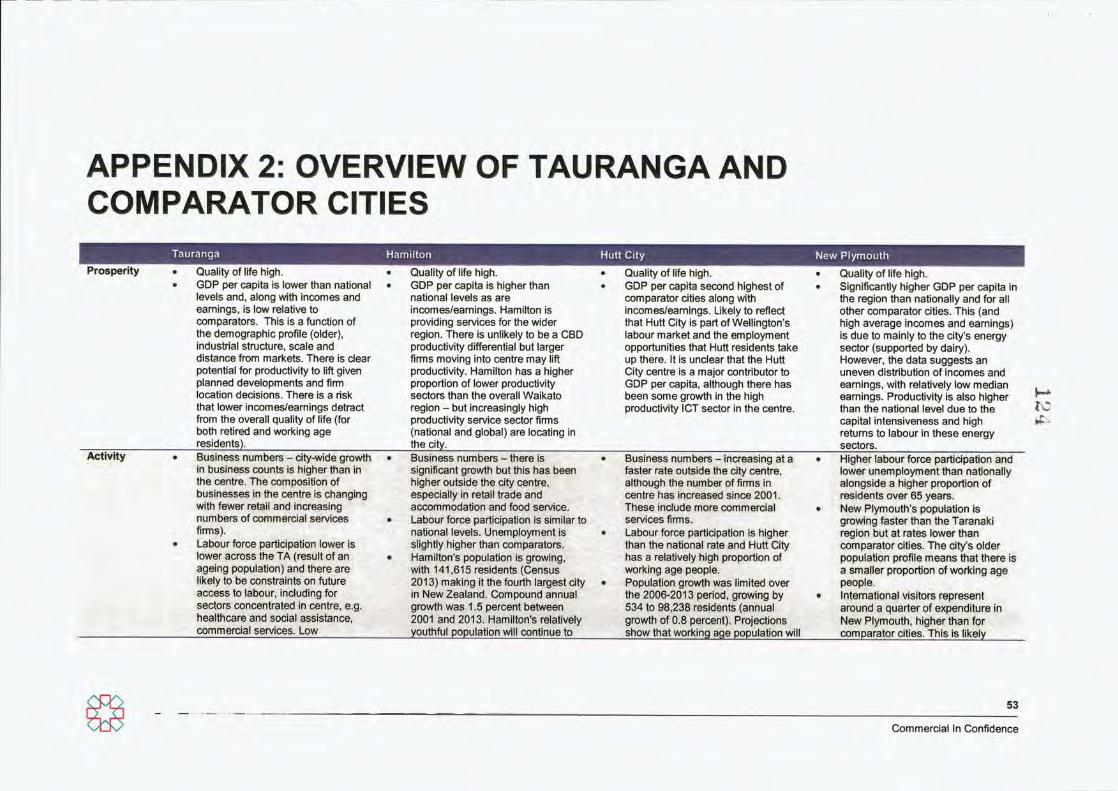
Tauranga Prosperity • Quality of life high.
• GDP per capita is lower than national levels and, along with incomes and earnings, is low relative to comparators. This Is a function of the demographic profile (older), industrial structure, scale and distance from markets. There is clear potential for productivity to lift given planned developments and firm location decisions. There is a risk that lower Incomes/earnings detract from the overall quality of life (for both retired and working age residents).
Hamilton Hutt City Quality of life high. GDP per capita is higher than national levels as are incomes/earnings. Hamilton is providing services for the wider region. There is unlikely to be a CBD productivity differential but larger finms moving Into centre may lift productivity. Hamilton has a higher proportion of lower productivity sectors than the overall Waikato region - but increasingly high productivity service sector firms (national and global) are locating In the city.
Quality of life high. GDP per capita second highest of comparator cities along with incomes/earnings. Likely to reflect that Hutt City Is part of Wellington's labour market and the employment opportunities that Hutt residents take up there. It is unclear that the Hutt City centre is a major contributor to GDP per capita, although there has been some growth in the high productivity ICT sector in the centre.
New Plymouth
Quality of life high. Significantly higher GDP per capita in the region than nationally and for all other comparator cities. This (and high average incomes and earnings) is due to mainly to the city's energy sector (supported by dairy). However, the data suggests an uneven distribution of incomes and earnings, with relatively low median . earnings. Productivity is also higher than the national level due to the capital intenslveness and high if -returns to labour in these energy sectors.
Activity Business numbers - city-wide growth in business counts Is higher than in the centre. The composition of businesses In the centre is changing with fewer retail and Increasing numbers of commercial services flmris). Labour force participation lower is lower across the TA (result of an ageing population) and there are likely to be constraints on future access to labour, including for sectors concentrated In centre, e.g. healthcare and social assistance, commercial services. Low
Business numbers - there is significant growth but this has been higher outside the city centre, especially In retail trade and accommodation and food service. Labour force participation is similar to national levels. Unemployment is slightly higher than comparators. Hamilton's population is growing, with 141,615 residents (Census 2013) making it the fourth largest city In New Zealand. Compound annual growrth was 1.5 percent between 2001 and 2013. Hamilton's relatively youthful population will continue to
Business numbers - Increasing at a faster rate outside the city centre, although the number of firms In centre has increased since 2001. These include more commercial services finms. Labour force participation is higher than the national rate and Hutt City has a relatively high proportion of working age people. Population growth was limited over the 2006-2013 period, growing by 534 to 98,238 residents (annual growth of 0.8 percent). Projections show that working age population will
Higher labour force participation and lower unemployment than nationally alongside a higher proportion of residents over 65 years. New Plymouth's population is growing faster than the Taranaki region but at rates lower than comparator cities. The city's older population profile means that there is a smaller proportion of working age people. Internafional visitors represent around a quarter of expenditure in New Plymouth, higher than for comparator cities. This Is likely
53
Commercial In Confidence
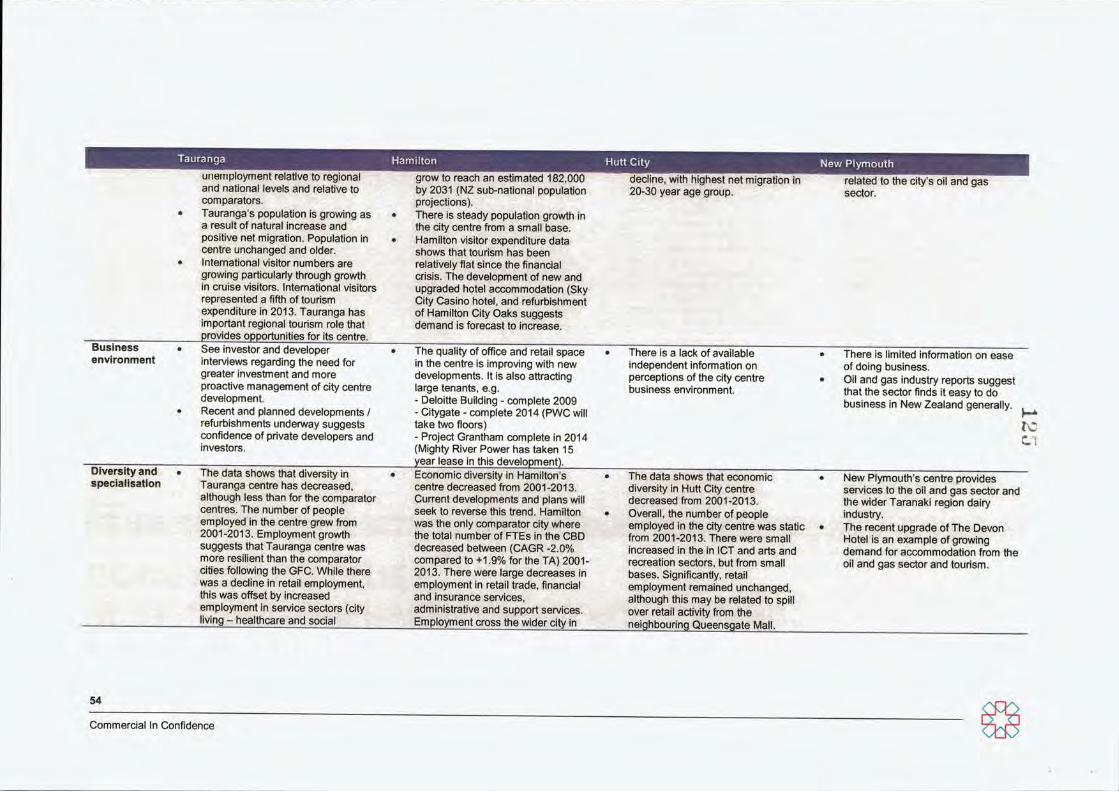
Tauranga Hamilton Hutt City unemployment relative to regional and national levels and relative to comparators. Tauranga's population is growing as a result of natural Increase and positive net migration. Population in centre unchanged and older. International visitor numbers are growing particularly through growth in cruise visitors. Internafional visitors represented a fifth of tourism expenditure In 2013. Tauranga has important regional tourism role that provides opportunities for its centre.
Business • See investor and developer environment Interviews regarding the need for
greater investment and more proactive management of city centre development.
• Recent and planned developments / refurbishments underway suggests confidence of private developers and investors.
Diversity and « The data shows that diversity in specialisation Tauranga centre has decreased,
although less than for the comparator centres. The number of people employed In the centre grew from 2001-2013. Employment growth suggests that Tauranga centre was more resilient than the comparator cities following the GFC. While there was a decline in retail employment, this was offset by increased employment in service sectors (city
. living - healthcare and social
grow to reach an estimated 182,000 by 2031 (NZ sub-national population projections). There is steady populafion growth in the city centre from a small base. Hamilton visitor expenditure data shows that tourism has been relafively fiat since the financial crisis. The development of new and upgraded hotel accommodation (Sky City Casino hotel, and refurbishment of Hamilton City Oaks suggests demand is forecast to increase.
decline, with highest net migration in 20-30 year age group.
New Plymouth related to the city's oil and gas sector.
The quality of office and retail space In the centre is improving with new developments. It is also attracting large tenants, e.g. - Deloitte Building - complete 2009 - Citygate - complete 2014 (PWC will take two fioors) - Project Grantham complete in 2014 (Mighty River Power has taken 15 year lease in this development). Economic diversity in Hamilton's centre decreased from 2001-2013. Current developments and plans will seek to reverse this trend. Hamilton was the only comparator city where the total number of FTEs In the CBD decreased between (CAGR -2.0% compared to +1.9% for the TA) 2001-2013. There were large decreases in employment in retail trade, financial and insurance services, administrative and support services. Employment cross the wider city in
There is a lack of available independent infomiation on perceptions of the city centre business environment
There is limited informafion on ease of doing business. Oil and gas Industry reports suggest that the sector finds it easy to do business in New Zealand generally.
rc
The data shows that economic diversity in Hutt City centre decreased from 2001-2013. Overall, the number of people employed in the city centre was static from 2001-2013. There were small increased in the In ICT and arts and recreation sectors, but from small bases. Significantiy, retail employment remained unchanged, although this may be related to spill over retail activity from the neighbouring Queensgate Mall.
New Plymouth's centre provides services to the oil and gas sector and the wider Taranaki region dairy industry. The recent upgrade of The Devon Hotel is an example of growing demand for accommodation from the oil and gas sector and tourism.
54
Commercial In Confidence
Tauranga Hamilton Hutt City New Plymouth
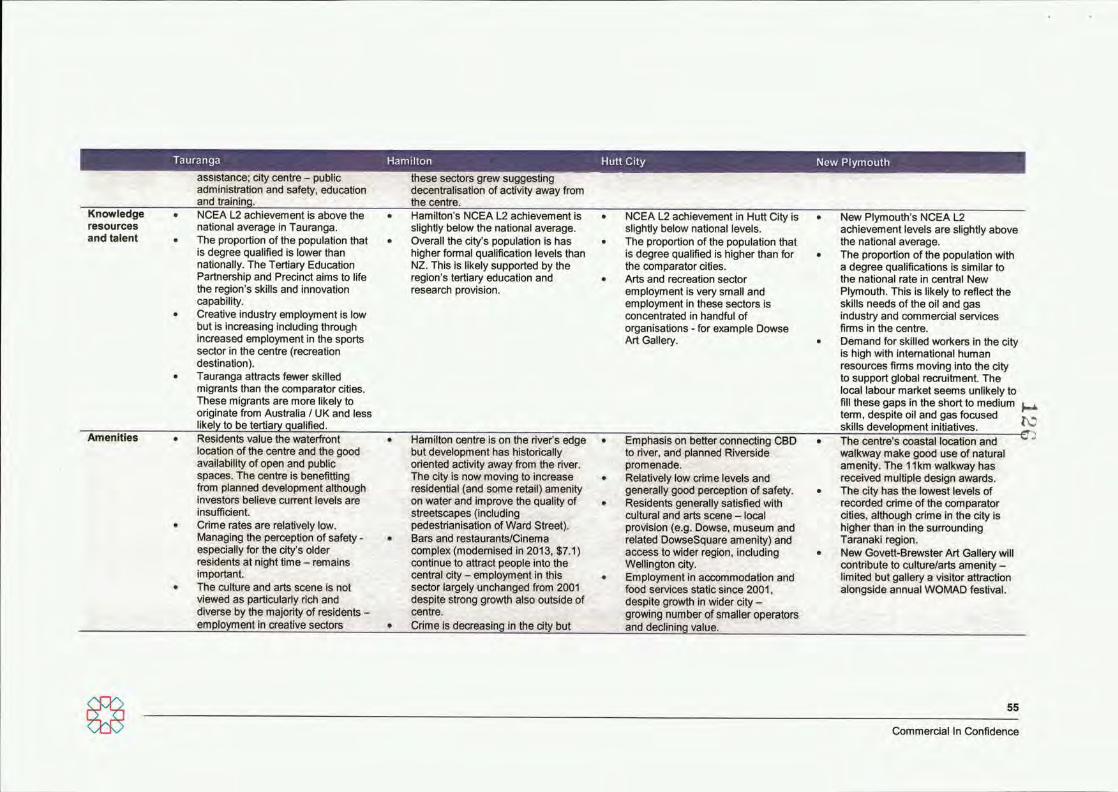
Knowledge resources and talent
assistance; city centre - public administration and safety, education and training.
these sectors grew suggesting decentralisation of activity away from the centre.
NCEA L2 achievement Is above the national average in Tauranga. The proportion of the population that Is degree qualified Is lower than nationally. The Tertiary Education Partnership and Precinct aims to life the region's skills and Innovation capability. Creative Industry employment is low but is Increasing including through increased employment in the sports sector in the centre (recreation destination). Tauranga attracts fewer skilled migrants than the comparator cities. These migrants are more likely to originate from Australia / UK and less likely to be tertiary qualified.
Hamilton's NCEA L2 achievement is slightiy below the national average. Overall the city's population is has higher fomial qualification levels than NZ. This is likely supported by the region's tertiary education and research provision.
NCEA L2 achievement in Hutt City Is slighfly below naflonal levels. The proportion of the population that is degree qualified is higher than for the comparator cities. Arts and recreation sector employment is very small and employment in these sectors Is concentrated in handful of organisations - for example Dowse Art Gallery.
New Plymouth's NCEA L2 achievement levels are slighUy above the naflonal average. The proportion of the population with a degree qualifications Is similar to the national rate in central New Plymouth. This is likely to reflect the skills needs of the oil and gas industry and commercial services firms in the centre. Demand for skilled workers in the city is high with International human resources fimns moving Into the city to support global recruitment. The local labour market seems unlikely to fill these gaps in the short to medium term, despite oil and gas focused skills development Initiatives. \^
Amenities Residents value the waterfront location of the centre and the good availability of open and public spaces. The centre is benefitting from planned development although Investors believe current levels are Insufficient. Crime rates are relatively low. Managing the perception of safety -especially for the city's older residents at night flme - remains important. The culture and arts scene is not viewed as particularly rich and diverse by the majority of residents -employment in creative sectors
Hamilton centre is on the river's edge but development has historically oriented activity away from the river. The city is now moving to increase residenflal (and some retail) amenity on water and improve the quality of streetscapes (including pedestrianisation of Ward Street). Bars and restaurants/Cinema complex (modernised in 2013, $7.1) continue to attract people Into the central city - employment in this sector largely unchanged from 2001 despite strong growth also outside of centre. Crime is decreasing in the city but
Emphasis on better connecting CBD to river, and planned Riverside promenade. Relaflvely low crime levels and generally good perception of safety. Residents generally satisfied with cultural and arts scene - local provision (e.g. Dowse, museum and related DowseSquare amenity) and access to wider region, including Wellington city. Employment In accommodation and food services static since 2001, despite growth in wider city -growing number of smaller operators and declining value.
The centre's coastal location and walkway make good use of natural amenity. The 11km walkway has received multiple design awards. The city has the lowest levels of recorded crime ofthe comparator cities, although crime in the city Is higher than In the surrounding Taranaki region. New Govett-Brewster Art Gallery will contribute to culture/arts amenity -limited but gallery a visitor attraction alongside annual WOMAD festival.
55
Commercial In Confidence
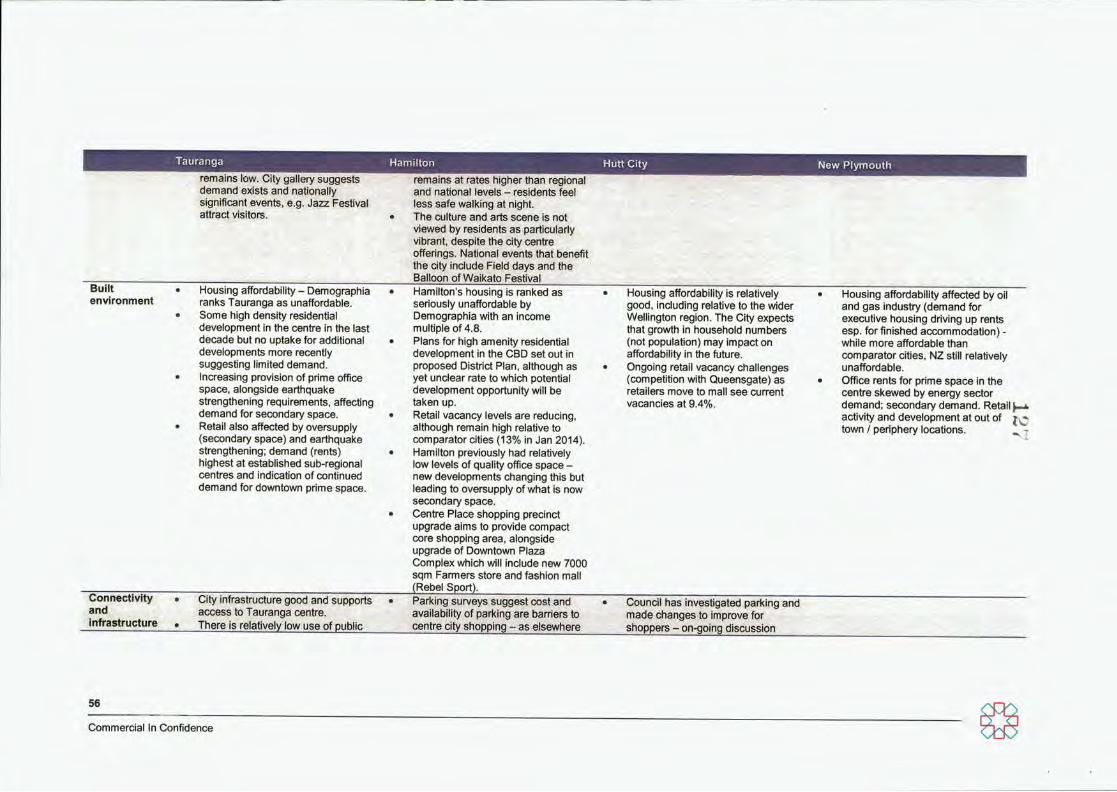
Tauranga Hamilton Hutt City remains low. Clly gallery suggests demand exists and nationally significant events, e.g. Jazz Fesflval attract visitors.
New Plymouth
Built • Housing affordabiiity - Demographia environment ranks Tauranga as unaffordable.
• Some high density residential development in the centre In the last decade but no uptake for additional developments more recentiy suggesting limited demand.
• Increasing provision of prime office space, alongside earthquake strengthening requirements, affecting demand for secondary space.
• Retail also affected by oversupply (secondary space) and earthquake strengthening; demand (rents) highest at established sub-regional centres and indication of conflnued demand for downtown prime space.
remains at rates higher than regional and national levels - residents feel less safe walking at night The culture and arts scene is not viewed by residents as particularly vibrant, despite the city centre offerings. Naflonal events that benefit the city include Field days and the Balloon of Waikato Festival Hamilton's housing is ranked as seriously unaffordable by Demographia with an Income mulflple of 4.8. Plans for high amenity residenflal development in the CBD set out in proposed District Plan, although as yet unclear rate to which potenflal development opportunity will be taken up. Retail vacancy levels are reducing, although remain high relative to comparator cities (13% In Jan 2014). Hamilton previously had relatively low levels of quality office space - new developments changing this but leading to oversupply of what is now secondary space. Centre Place shopping precinct upgrade aims to provide compact core shopping area, alongside upgrade of Downtown Plaza Complex which will include new 7000 sqm Fanners store and fashion mall (Rebel Sport).
Housing affordabiiity is relatively good. Including relative to the wider Wellington region. The City expects that growth in household numbers (not population) may Impact on affordabiiity in the future. Ongoing retail vacancy challenges (competition with Queensgate) as retailers move to mall see current vacancies at 9.4%.
Housing affordabiiity affected by oil and gas industry (demand for executive housing driving up rents esp. forfinished accommodaflon) -while more affordable than comparator cifles, NZ sflll relatively unaffordable. Office rents for prime space in the centre skewed by energy sector demand; secondary demand. Retail) activity and development at out of j town / periphery locations.
Connectivity and infrastructure
City infrastructure good and supports access to Tauranga centre. There is relatively low use of public
Parking surveys suggest cost and availability of parking are barriers to centre city shopping - as elsewhere
Council has investigated parking and made changes to improve for shoppers - on-going discussion
56
Commercial In Confidence
Tauranga Hamilton Hutt City New Plymouth transport although this is growing. Journeys to work are predominantiy made in private vehicles There is very little congestion and it Is limited to the morning peak.
residents prefer amenity of centre but convenience. Public transport use higher but journey to work predominantiy by private motor vehicle.
about the role and contribution of parking to retail vibrancy.
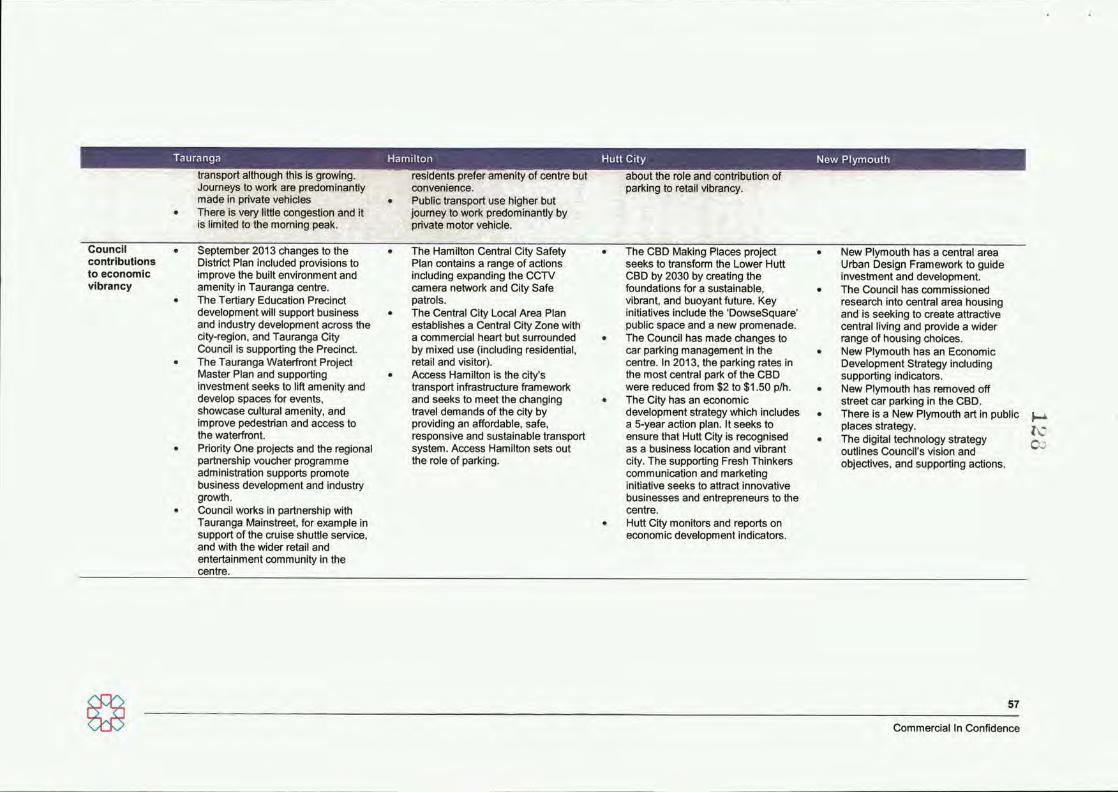
Council • September 2013 changes to the contributions District Plan included provisions to to economic Improve the built environment and vibrancy amenity In Tauranga centre.
• The Tertiary Educaflon Precinct development will support business and industry development across the city-region, and Tauranga City Council is supporting the Precinct.
• The Tauranga Waterfront Project Master Plan and supporting investment seeks to lift amenity and develop spaces for events, showcase cultural amenity, and improve pedestrian and access to the waterfront.
• Priority One projects and the regional partnership voucher programme adminlstraflon supports promote business development and industry growth.
• Council works In partnership with Tauranga Mainstreet, for example in support of the cruise shuttle service, and with the wider retail and entertainment community In the centre.
The Hamilton Central City Safety Plan contains a range of actions Including expanding the CCTV camera network and City Safe patrols. The Central City Local Area Plan establishes a Central City Zone with a commercial heart but surrounded by mixed use (including residential, retail and visitor). Access Hamilton Is the city's transport infrastructure framework and seeks to meet the changing travel demands of the city by providing an affordable, safe, responsive and sustainable transport system. Access Hamilton sets out the role of parking.
The CBD Making Places project seeks to transform the Lower Hutt CBD by 2030 by creating the foundations for a sustainable, vibrant, and buoyant future. Key initiatives include the 'DowseSquare' public space and a new promenade. The Council has made changes to car parking management in the centre. In 2013, the parking rates In the most central park of the CBD were reduced from $2 to $1.50 p/h. The City has an economic development strategy which Includes a 5-year action plan. It seeks to ensure that Hutt City Is recognised as a business location and vibrant city. The supporting Fresh Thinkers communicaflon and markeflng initiative seeks to attract innovative businesses and entrepreneurs to the centre. Hutt City monitors and reports on economic development Indicators.
New Plymouth has a central area Urban Design Framework to guide investment and development. The Council has commissioned research into central area housing and is seeking to create attractive central living and provide a wider range of housing choices. New Plymouth has an Economic Development Strategy Including supporting Indicators. New Plymouth has removed off street car parking in the CBD. There Is a New Plymouth art In public places strategy. The digital technology strategy ^ , ouflines Council's vision and objectives, and supporting actions.
57
Commercial In Confidence
I2d
APPENDIX 3: CITY CENTRE GEOGRAPHIES We have used the following geographies in this report.
Tauranga centre The Tauranga city centre includes the SmartGrowth "Tauranga City Centre" and "Tauranga City Living" meshblocks. We have used a combination of geographies, to make the most of available data and to inform our analysis of Tauranga centre. In some places, we have analysed the Tauranga City Centre" and "Tauranga City Living" meshblock areas separately. This has been to make the most of available data when considering parking. These geographies are:
• City centre and city living meshblock areas - to examine the city centre and city living areas independently, where this information may be used when considering parking
• Tauranga central area census area unit (CAU) - to consider the central area and compare with central areas in the comparator cities
• Tauranga city / Western Bay of Plenty / Bay of Plenty region - where this is the geographic information available or to compare with the Tauranga city centre.
Tauranga centre
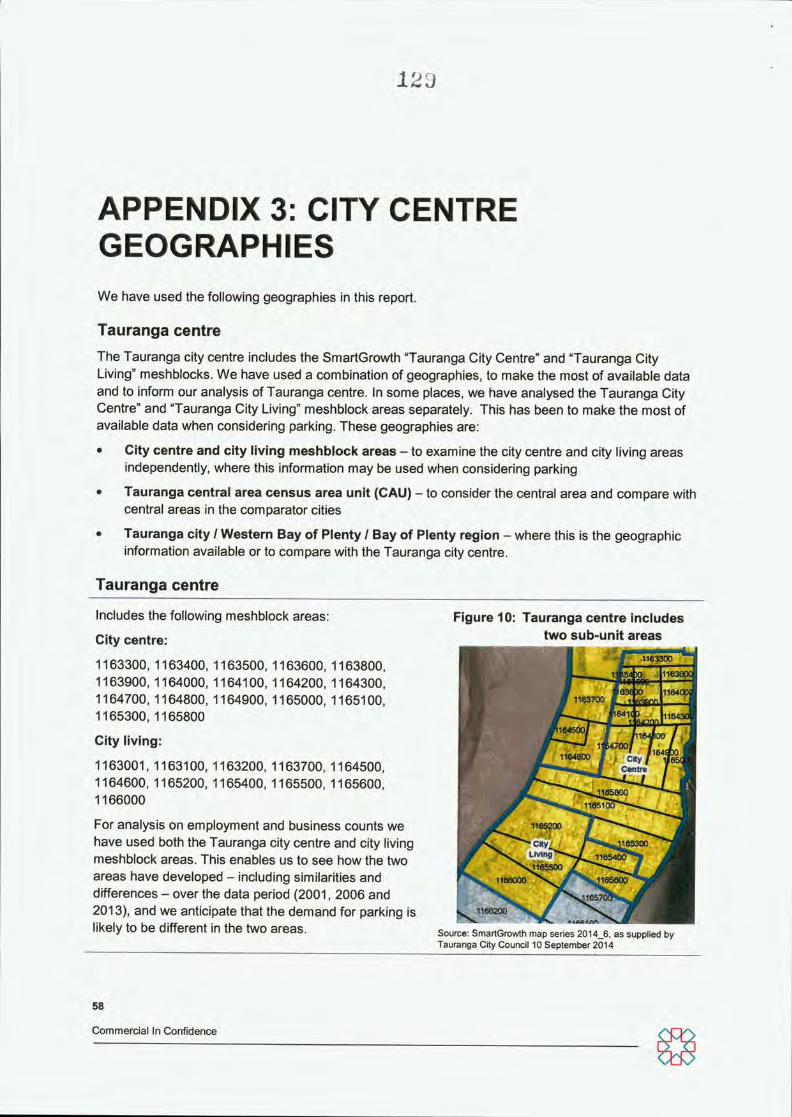
Includes the following meshblock areas:
City centre:
1163300, 1163400, 1163500, 1163600, 1163800, 1163900, 1164000, 1164100, 1164200, 1164300, 1164700, 1164800, 1164900, 1165000, 1165100, 1165300, 1165800
City living:
1163001, 1163100, 1163200, 1163700, 1164500, 1164600, 1165200, 1165400, 1165500, 1165600, 1166000
For analysis on employment and business counts we have used both the Tauranga city centre and city living meshblock areas. This enables us to see how the two areas have developed - including similarities and differences - over the data period (2001, 2006 and 2013), and we anticipate that the demand for parking is likely to be different in the two areas.
Figure 10: Tauranga centre includes two sub-unit areas
1163300
116
11M 163700 1 am
6411 3 -4—1 sooa
I city f
1645-30
1164800 Centre
1165200
11654M*** City/^
Living?* .1165500
tiaeooQ J 1^600
116-ji'OO
Source: SmartGrowth map series 2014_6, as supplied by Tauranga City Council 10 September 2014
58
Commercial In Confidence
loO
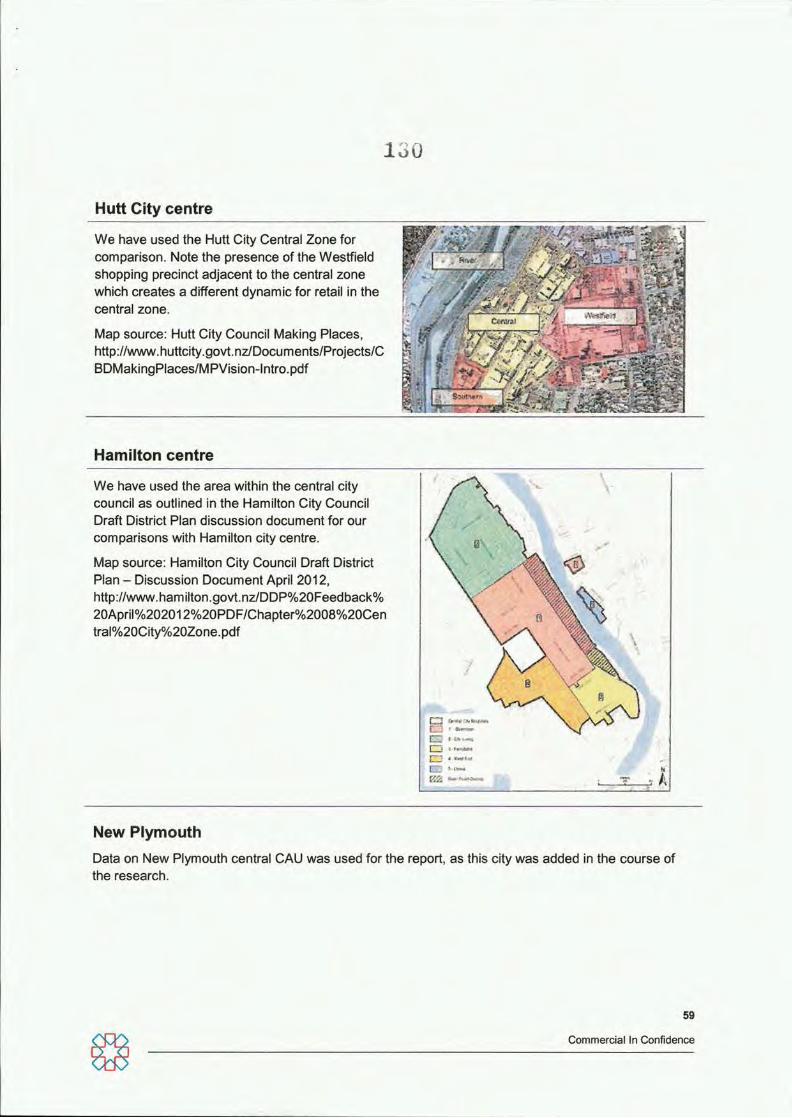
Hutt City centre
We have used the Hutt City Central Zone for comparison. Note the presence of the Westfield shopping precinct adjacent to the central zone which creates a different dynamic for retail in the central zone.
Map source: Hutt City Council Making Places, http ://www. h uttcity. go vt. nz/Docu m ents/Projects/C BDMakingPlaces/MPVision-lntro.pdf
-ri ••Mra
Hamilton centre
We have used the area within the central city council as outlined in the Hamilton City Council Draft District Plan discussion document for our comparisons with Hamilton city centre.
Map source: Hamilton City Council Draft Distnct Plan - Discussion Document Apnl 2012, http://www.hamilton.govt.nz/DDP%20Feedback% 20Apnl%202012%20PDF/Chapter%2008%20Cen tral%20City%20Zone.pdf
L_
New Plymouth Data on New Plymouth central CAU was used for the report, as this city was added in the course of the research.
59
Commercial In Confldence
13x
APPENDIX 4: SELECTED BIBLIOGRAPHY Experian Marketing Services. Town Centre Futures 2020: an Expenan Marketing Services White Paper in partnership with ATCM. London, 2012.
Global Cities Institute. Global City Indicators Facility, Toronto, 2012.
Grattan Institute Productive cities: Opportunity in a changing economy. Melbourne, 2013.
Grattan Institute. What Matters Most? Housing Preferences Across the Australian population. Melbourne 2013.
Kenyon, D et al. Rethinking Property Tax Incentives for Business. Massachusetts, 2012.
Mare, D and D Graham. NZTA Research Report: Agglomeration elasticity's in NewZealand, Wellington, 2009.
Mckinsey and Co. How to make a city great: a review of the steps city leaders around the wodd take to transform their cities into great places to live and work. Europe, 2013.
Moonen T, and G Clark. The Business of Cities 2013: what do 150 city indexes and benchmarking studies tell us about the urban wodd in 2013? London, 2013.
Portas, M. The Portas Review: an independent review into the future of our high streets. London, 2011.
Power, A, J Ploger, and A Winkler. Transforming Cities Across Europe: an interim report on problems and progress, CASE (Centre for Analysis of Social Exclusion) report 49, London 2008.
PnceWaterhouseCoopers. Cities ofthe future: global competition, local leadership. 2005.
PricewaterhouseCoopers. Cities of Opportunity 6. 2014.
Swinney, P & D Sivaev. Beyond the High Street: why our city centres really matter. London, Centre for Cities, 2013.
Wodd Bank. Wodd Development Report 2009: Reshaping Economic Geography, Washington, 2009.
New Zealand
Bayleys. Market Beat reports, various.
Big Cities project. Quality of Life Survey. Wellington, 2010.
Gnmes, A, P, McCann, and J Le Valliant, Auckland's Knowledge Economy: Australasian and European Comparisons, Wellington, 2011.
Local Government NewZealand. Business Friendly Councils: guidelines and case studies from New Zealand's Core Cities. Wellington, 2014.
60
Commercial In Confidence
±'62
Local Government NewZealand. Local Government's Contnbution to Economic Growth, 2010.
Local Government NewZealand and the Ministry of Business, Innovation and Employment. Core Cities Research Summary, Wellington, 2011.
Market Economics. Auckland's Comparative Advantages and Distinctiveness, Auckland, 2011.
Ministry of Business Innovation and Employment. New Zealand Sectors Report 2014. Wellington 2014.
New Zealand Retailers Association. The Online Retail Market in New Zealand (update). Wellington, 2013.
RCG Limited. Retail Examiner: New Zealand's Leading Shopping Centres, Auckland, 2012.
Williamson, J, R Paling, and D Waite. Assessing Agglomeration Impacts in Auckland: Phase 1. Ministry of Economic Development Occasional Paper 08/05. Wellington 2008.
Tauranga and related
Harnson Transportation. Tauranga City Council Parking Surveys: summary report. Tauranga, 2014.
Key Research. Tauranga City Council City Centre Car Parking Study 2014. Tauranga, 2014.
Property Economics. Tauranga City & Western Bay of Plenty Retail & Commercial Strategy, Tauranga, 2008.
Tauranga City Council. Tauranga City Centre Strategy 2012. Tauranga, 2012.
Tauranga City Council. Tauranga City Plan. Tauranga, 2013.
Hutt City
Hutt City Council. Consideration of Parking Fee Changes in the CBD. Wellington, 2013
Hutt City Council. Fresh Thinkers: success stories from our community. Wellington, 2014
Hutt City Council. Hutt City Economic Development Strategy 2009-2014. Wellington, 2009
Hutt City Council. Urban Growth Strategy, 2012-2032. Hutt City, 2014
Hamilton
Hamilton City Proposed District Plan
Hamilton City Council. Economic Development Agenda. Hamilton, 2012
Pdest Mansergh Graham Landscape Architects. Hamilton CBD Future Vision 2020. Hamilton, 2004.
61
Commercial In Confidence
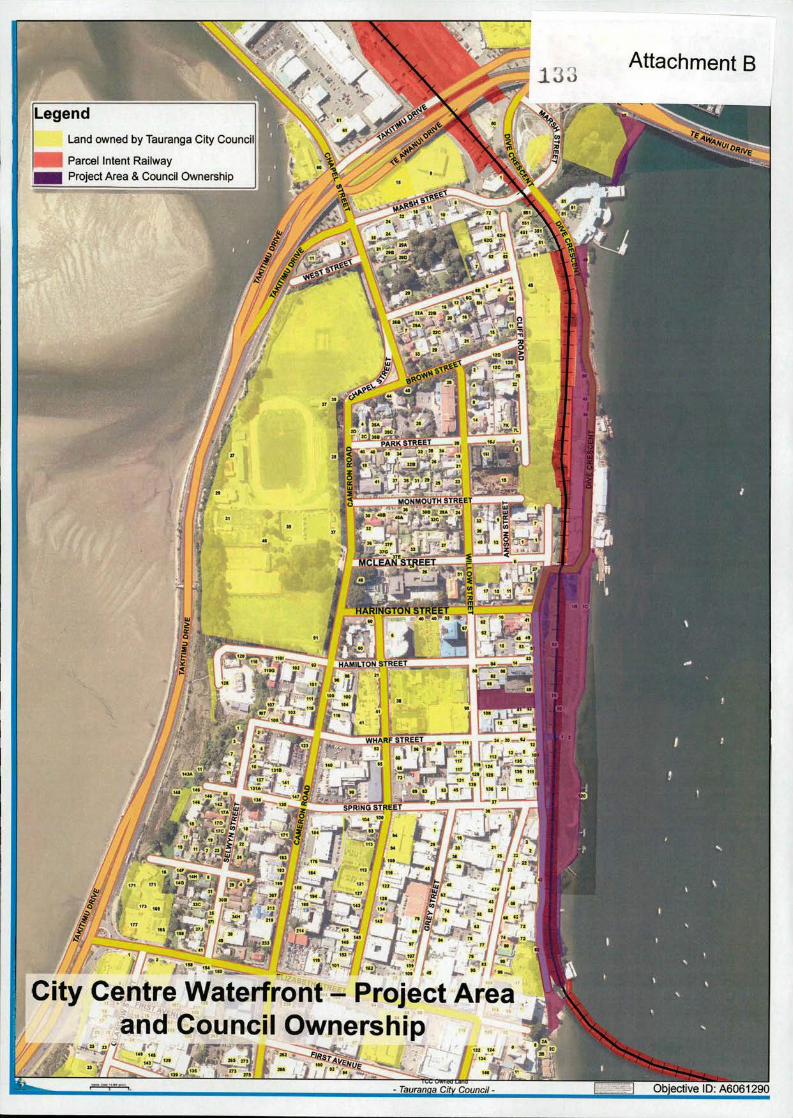
Legend Land owned by Tauranga City Council
Parcel Intent Railway • • I Project Area & Council Ownership
13
4-
4
i . '
Attachment B
-llv.
11 ^9.0-
EET PARK STREET 32 M I*
MONMOUTH STREET * JOB IBA M
SI MCLEAN SXflEET
HAMILTON S
WHAR
SPRING STREET mm . IXJ
City Centre Waterfront - Project Area and Council Ownership
I
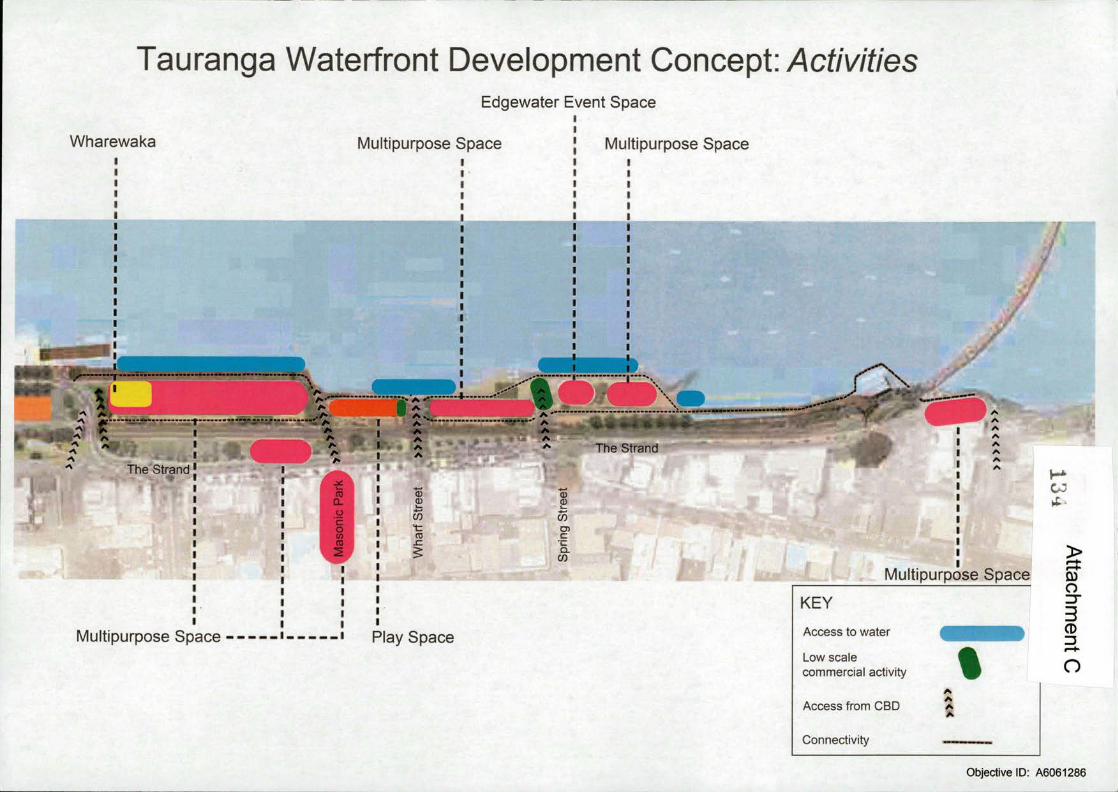
Tauranga Waterfront Development Concept: y^cf/V/f/es Edgewater Event Space
Wharewaka Multipurpose Space Multipurpose Space
1 --+
Trie Strand
Trie Strand
> Multipurpose Space
Multipurpose Space Play Space
KEY
Access to water
Low scale commercial activity
Access from CBD
Connectivity
O I" CD
I—K
o A
Objective ID: A6061286
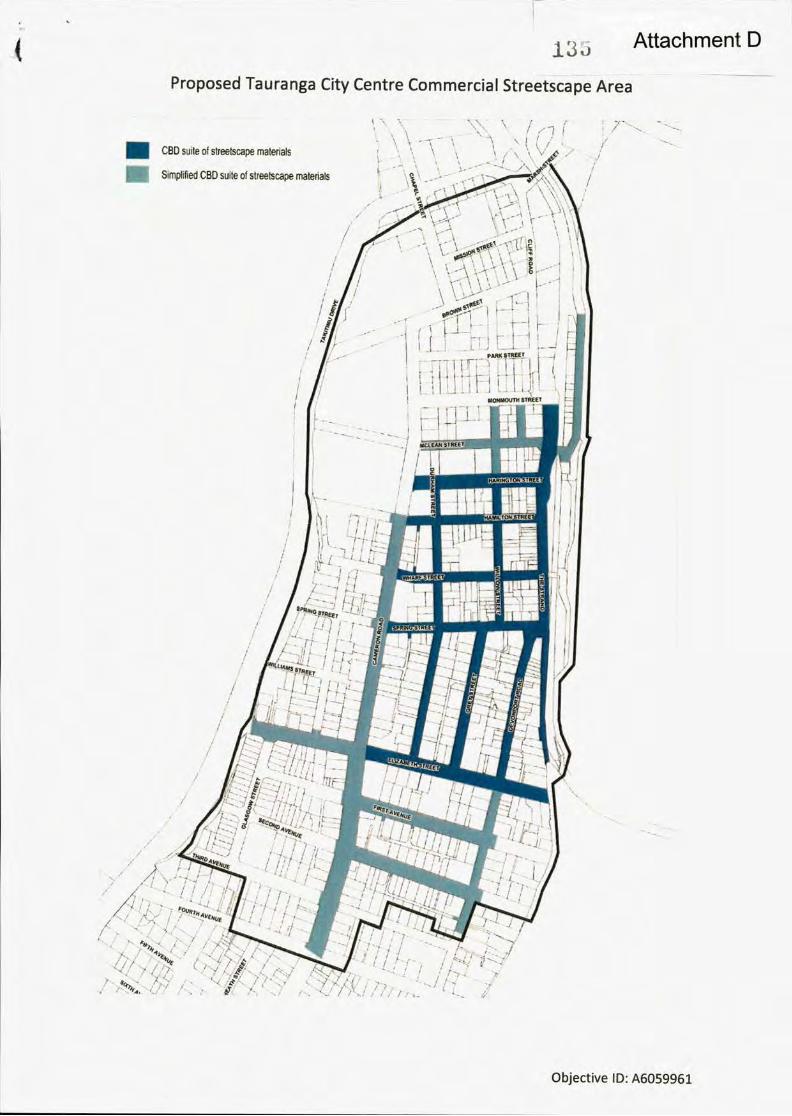
135 Proposed Tauranga City Centre Commercial Streetscape Area
Attachment D
CBD sjile of streetscape materials
Simplified CBD suite of streetscape materials
ll
•\<W"^:'\ .
1'"'
JL1:1LJ • 1
IKJNJ*OUTW STREET
I - .
' r-J/Jp ll-'-'-^il..
SEC 0 * 0
/ ^
lr/..
Objective ID: A6059961
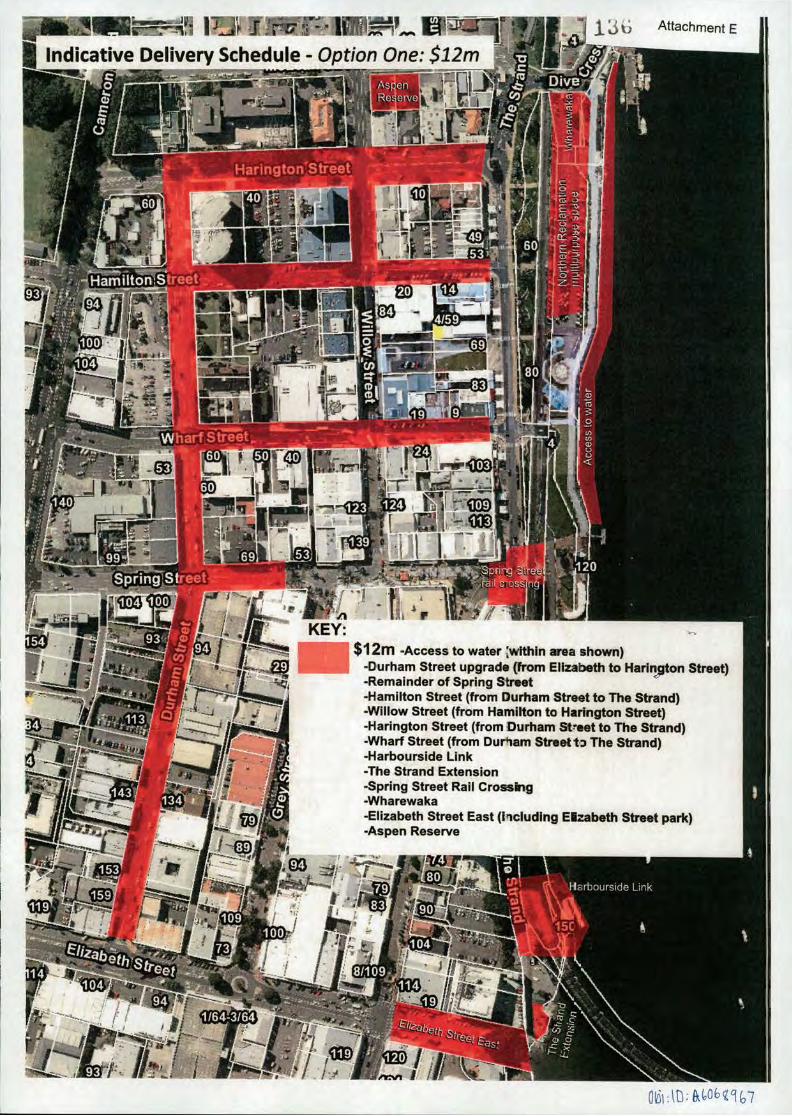
I Indicative Delivery Scliedule - Opt^ 1 3 b Attachment E
Harington st ree ' 1
I — w
I . i lr-—if>>. si 'i\ m SIP®,
• fli'p IB W7.
IL /
,03
$ 1 2 m -Access to water [within area shown) -Durham Street upgrade (from Elizabeth to Hariripton Street) -Remainder of Spring Street -i-lamiiton Street (from Durham Street to The Strand) -Wiiiow Street (from Hamilton to Harington Street) -Harington Street (from Durham Street to The Strand) -Wharf Street (from Durham Street ta The Strand) -Harbourside Linit -The Strand Extension -Spring Street Rail Cro^nig -Wharewaka -Elizabeth Street East (including Eizabeth Street park) -Aspen Reserve
nr. 1/64=3/64
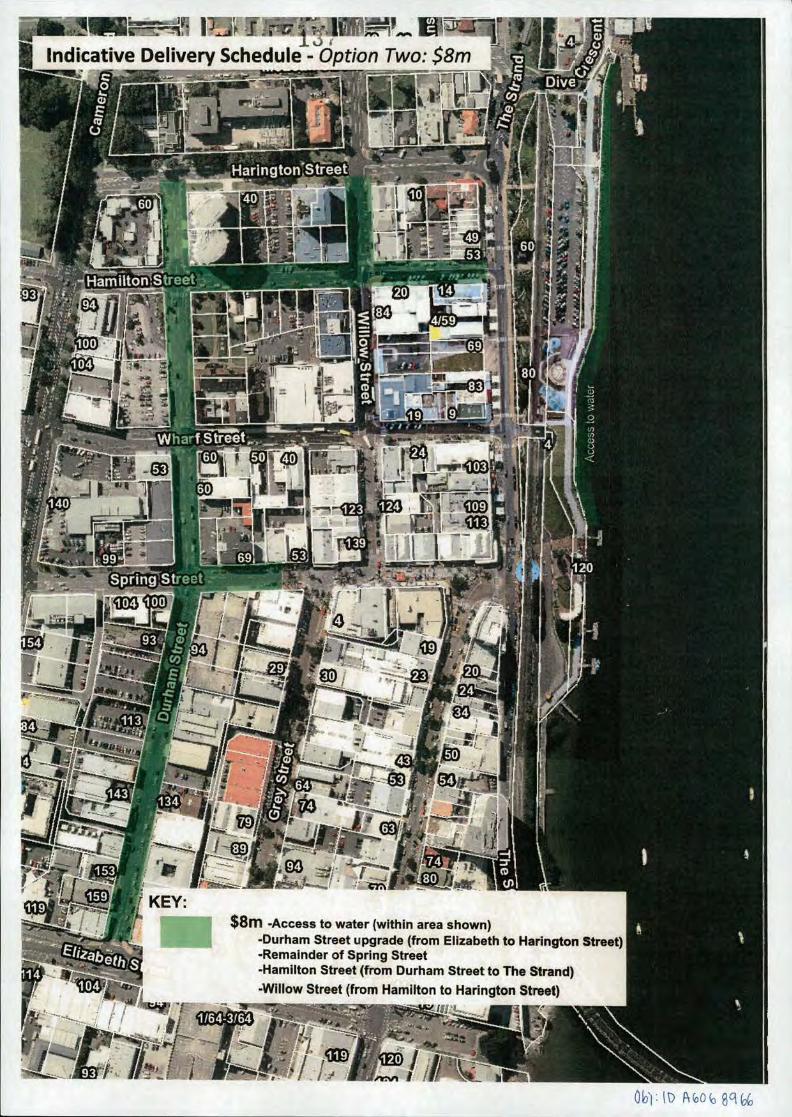
Indicative Deli Schedule
HaringtonlStreet
$8 Opt Two ivery ion m •III
J
is.
SD
i -
•(ED 33 IJI €5©
©3
"7:
i •I mm,
tE9 KEY $8m -Access to water (within area shown)
-Durham Street upgrade (from Elizabeth to Harington Street) -Remainder of Spring Street -Hamilton Street (from Durham Street to The Strand) -Willow Street (fnom Hamilton to Harington Street)
1/64:3/64
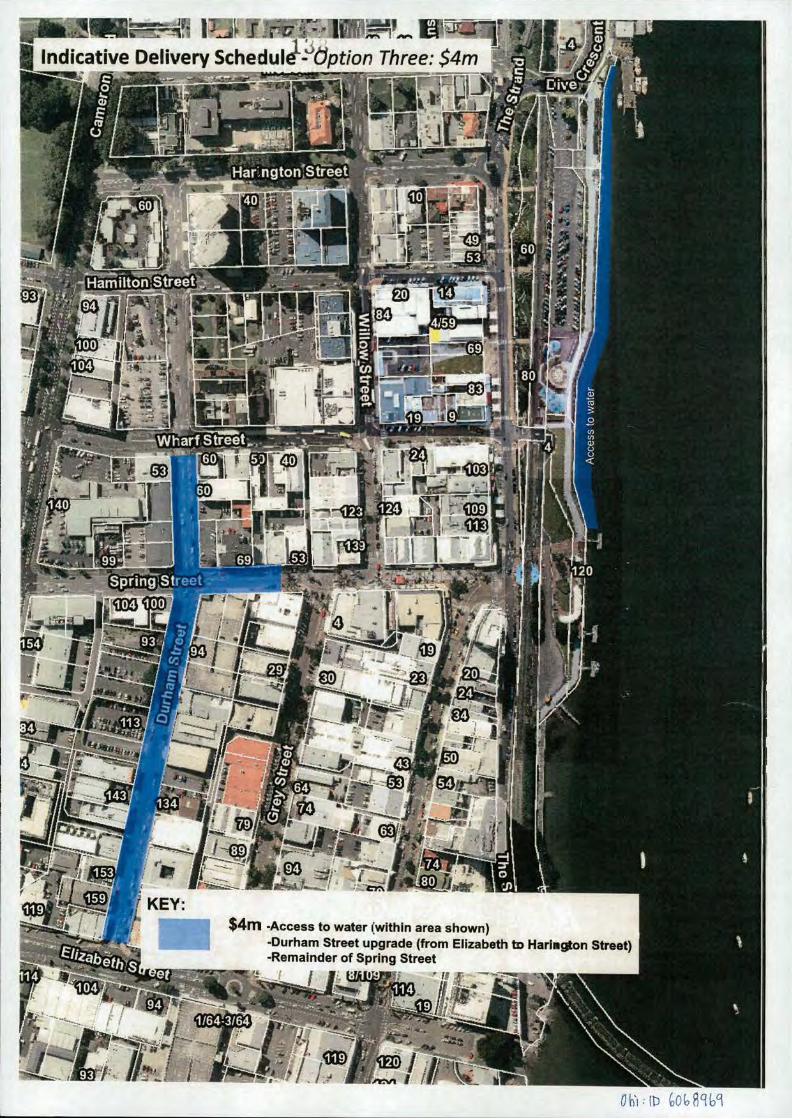
I Indicative Delivery Schedul 1
J3» Opt $4 Three ion m r
SD
— I
<1E9 1?^
s n
rf'.
>3i
r .
KEY: $4m -Access to water iwithin area shown)
-Durham Street upgrade (from Elizabeth to Har in^on Street) -Remainder of Spring Street