appendix 1 – high speed railway madrid
TRANSCRIPT
March 2011 | Frontier Economics, Atkins, ITS 1
Appendix 1 – High speed railway Madrid –
Barcelona in Spain
Appendix 1 – High speed railway Madrid –
Barcelona in Spain
This chapter presents the results of the ex post cost-benefit analysis of the high
speed railway line between Madrid and Barcelona.
1.1 Introduction
1.1.1 Project overview
Location & Description
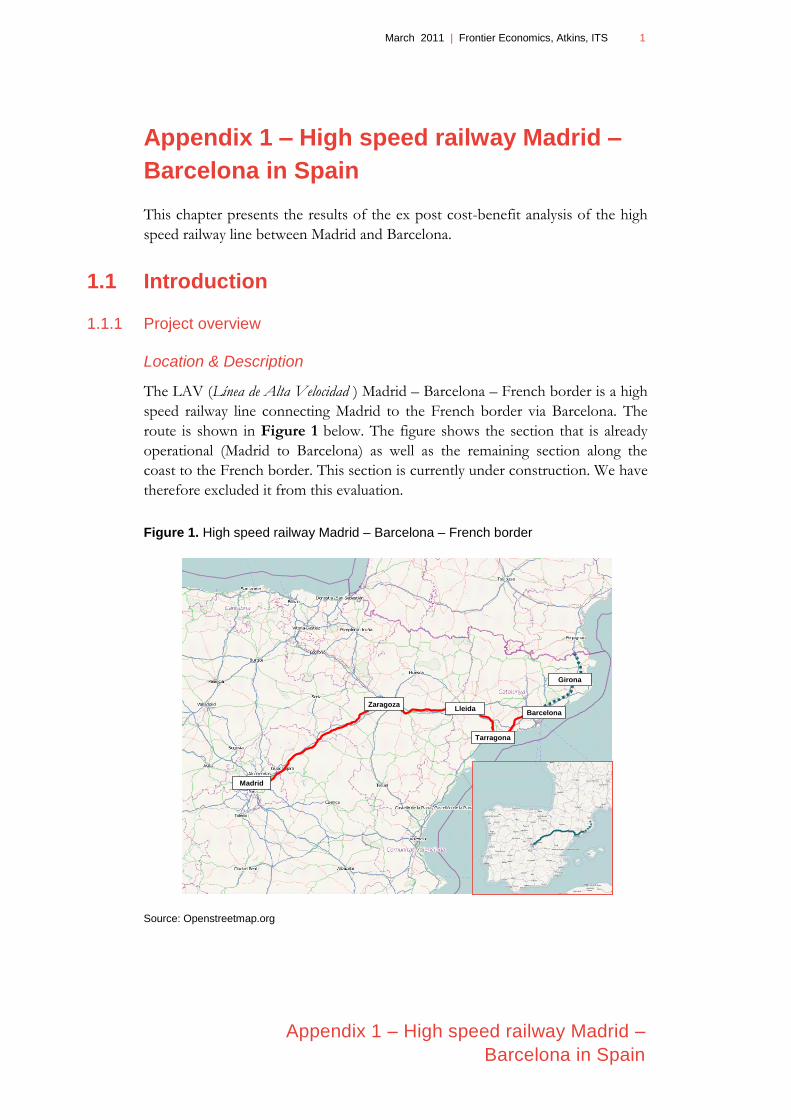
The LAV (Línea de Alta Velocidad ) Madrid – Barcelona – French border is a high
speed railway line connecting Madrid to the French border via Barcelona. The
route is shown in Figure 1 below. The figure shows the section that is already
operational (Madrid to Barcelona) as well as the remaining section along the
coast to the French border. This section is currently under construction. We have
therefore excluded it from this evaluation.
Figure 1. High speed railway Madrid – Barcelona – French border
Source: Openstreetmap.org
Madrid
ZaragozaLleida
Tarragona
Barcelona
Girona
Madrid
ZaragozaLleida
Tarragona
Barcelona
Girona
Madrid
ZaragozaLleida
Tarragona
Barcelona
Girona
2 Frontier Economics, Atkins, ITS | March 2011
Appendix 1 – High speed railway Madrid –
Barcelona in Spain
The line connects the two most densely populated urban areas in Spain, Madrid
and Barcelona, with intermediate connections in Guadalajara, Calatayud
Zaragoza, Lleida, Tarragona (station in Camp de Tarragona, between Tarragona
and Reus).
The LAV is part of the TEN-T Priority Project 3 (high-speed railway axis of
south-west Europe), whose main objective is to provide high-speed rail
connections between the Iberian Peninsula (Portugal and Spain) and the rest of
Europe.
The LAV between Madrid and Barcelona covers 621 kilometres, and it was
developed in three stages:
Section Madrid – Lleida: opened in October 2003, and covering around
442 km of high speed rail.
Section Lleida – Tarragona: in operation since December 2006, adding
78 km of railway line to the previous section.
Section Tarragona – Barcelona (Sants station): operational since
February 2008, with an additional length of 100 km.
The LAV is still under construction in the section Barcelona to Figueres in Spain,
with 132 km expected to be completed in 2012. The section between Figueres
and Perpignan in France was completed in 2008.
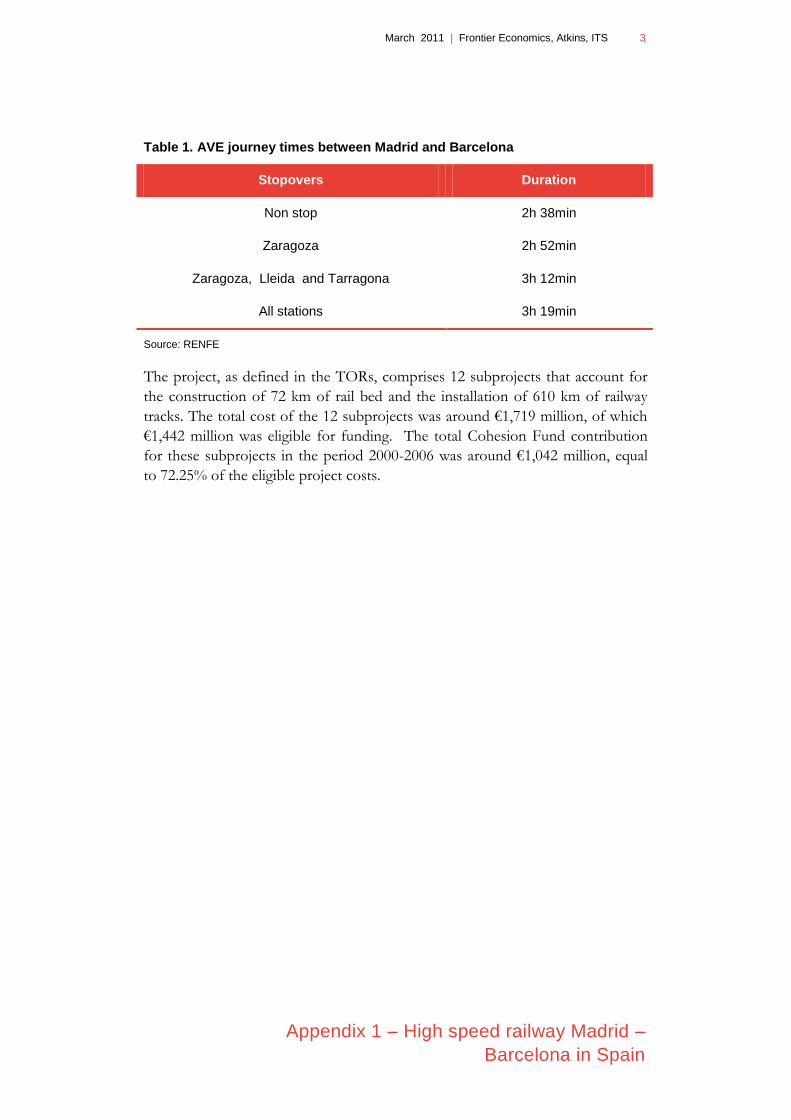
Currently, the new railway line allows speeds up to 300 km/h, with future
improvements increasing the maximum commercial speed up to 350 km/h. This
implies current journey times for the commercial AVE service (Alta Velocidad
Española) between Madrid and Barcelona of between 2h 38min and 3h 19min,
depending on the number intermediate stations. The AVE service, operated by
RENFE is the fastest railway service offered on the LAV. RENFE is the unique
railway operator offering railway services on the LAV. Current journey times for
the AVE are shown in Table 1.
March 2011 | Frontier Economics, Atkins, ITS 3
Appendix 1 – High speed railway Madrid –
Barcelona in Spain
Table 1. AVE journey times between Madrid and Barcelona
Stopovers Duration
Non stop 2h 38min
Zaragoza 2h 52min
Zaragoza, Lleida and Tarragona 3h 12min
All stations 3h 19min
Source: RENFE
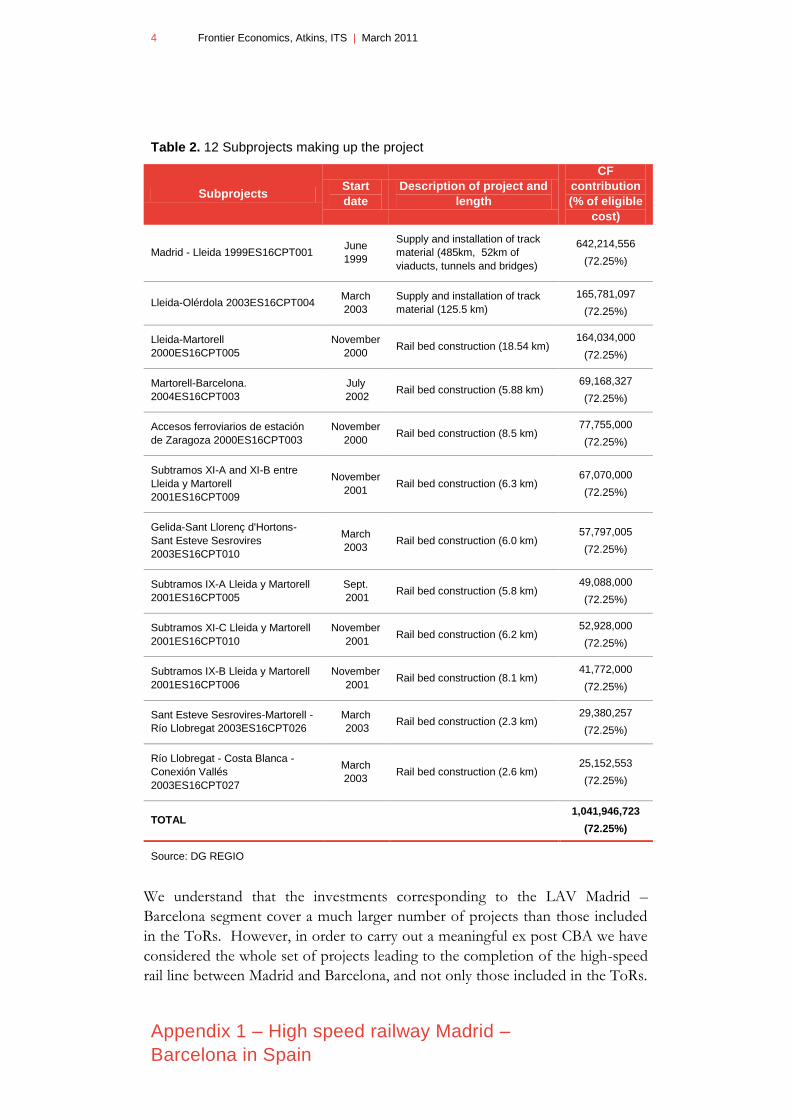
The project, as defined in the TORs, comprises 12 subprojects that account for
the construction of 72 km of rail bed and the installation of 610 km of railway
tracks. The total cost of the 12 subprojects was around €1,719 million, of which
€1,442 million was eligible for funding. The total Cohesion Fund contribution
for these subprojects in the period 2000-2006 was around €1,042 million, equal
to 72.25% of the eligible project costs.
4 Frontier Economics, Atkins, ITS | March 2011
Appendix 1 – High speed railway Madrid –
Barcelona in Spain
Table 2. 12 Subprojects making up the project
Subprojects Start
date
Description of project and
length
CF
contribution
(% of eligible
cost)
Madrid - Lleida 1999ES16CPT001 June
1999
Supply and installation of track
material (485km, 52km of
viaducts, tunnels and bridges)
642,214,556
(72.25%)
Lleida-Olérdola 2003ES16CPT004 March
2003
Supply and installation of track
material (125.5 km)
165,781,097
(72.25%)
Lleida-Martorell
2000ES16CPT005
November
2000 Rail bed construction (18.54 km)
164,034,000
(72.25%)
Martorell-Barcelona.
2004ES16CPT003
July
2002 Rail bed construction (5.88 km)
69,168,327
(72.25%)
Accesos ferroviarios de estación
de Zaragoza 2000ES16CPT003
November
2000 Rail bed construction (8.5 km)
77,755,000
(72.25%)
Subtramos XI-A and XI-B entre
Lleida y Martorell
2001ES16CPT009
November
2001 Rail bed construction (6.3 km)
67,070,000
(72.25%)
Gelida-Sant Llorenç d'Hortons-
Sant Esteve Sesrovires
2003ES16CPT010
March
2003 Rail bed construction (6.0 km)
57,797,005
(72.25%)
Subtramos IX-A Lleida y Martorell
2001ES16CPT005
Sept.
2001 Rail bed construction (5.8 km)
49,088,000
(72.25%)
Subtramos XI-C Lleida y Martorell
2001ES16CPT010
November
2001 Rail bed construction (6.2 km)
52,928,000
(72.25%)
Subtramos IX-B Lleida y Martorell
2001ES16CPT006
November
2001 Rail bed construction (8.1 km)
41,772,000
(72.25%)
Sant Esteve Sesrovires-Martorell -
Río Llobregat 2003ES16CPT026
March
2003 Rail bed construction (2.3 km)
29,380,257
(72.25%)
Río Llobregat - Costa Blanca -
Conexión Vallés
2003ES16CPT027
March
2003 Rail bed construction (2.6 km)
25,152,553
(72.25%)
TOTAL 1,041,946,723
(72.25%)
Source: DG REGIO
We understand that the investments corresponding to the LAV Madrid –
Barcelona segment cover a much larger number of projects than those included
in the ToRs. However, in order to carry out a meaningful ex post CBA we have
considered the whole set of projects leading to the completion of the high-speed
rail line between Madrid and Barcelona, and not only those included in the ToRs.
March 2011 | Frontier Economics, Atkins, ITS 5
Appendix 1 – High speed railway Madrid –
Barcelona in Spain
Without all these projects, most of the services currently offered on the line
would not be operational.
Capital investments corresponding to the LAV between Madrid and Barcelona
amount to €7,336 million, with total Cohesion Fund contributions around €3,389
million during the period 2000 – 2006.
Socio-economic context
The LAV goes through the Spanish regions (Comunidades Autónomas) of Madrid,
Castilla la Mancha, Aragón and Cataluña. In order to describe the socio-
economic context of the project we focus on the regions of Madrid, Aragón and
Cataluña and the cities of Madrid, Zaragoza, Lleida and Barcelona.1
Even though, anecdotally, it is believed that the LAV has had a significant socio-
economic effect on these regions, we can not conclude that changes in
population, employment and GDP per capita are a direct and only consequence
of the LAV. Moreover, regional figures might also include the impact of other
infrastructure projects being developed contemporaneously, for example the A23
motorway through in Aragón.2
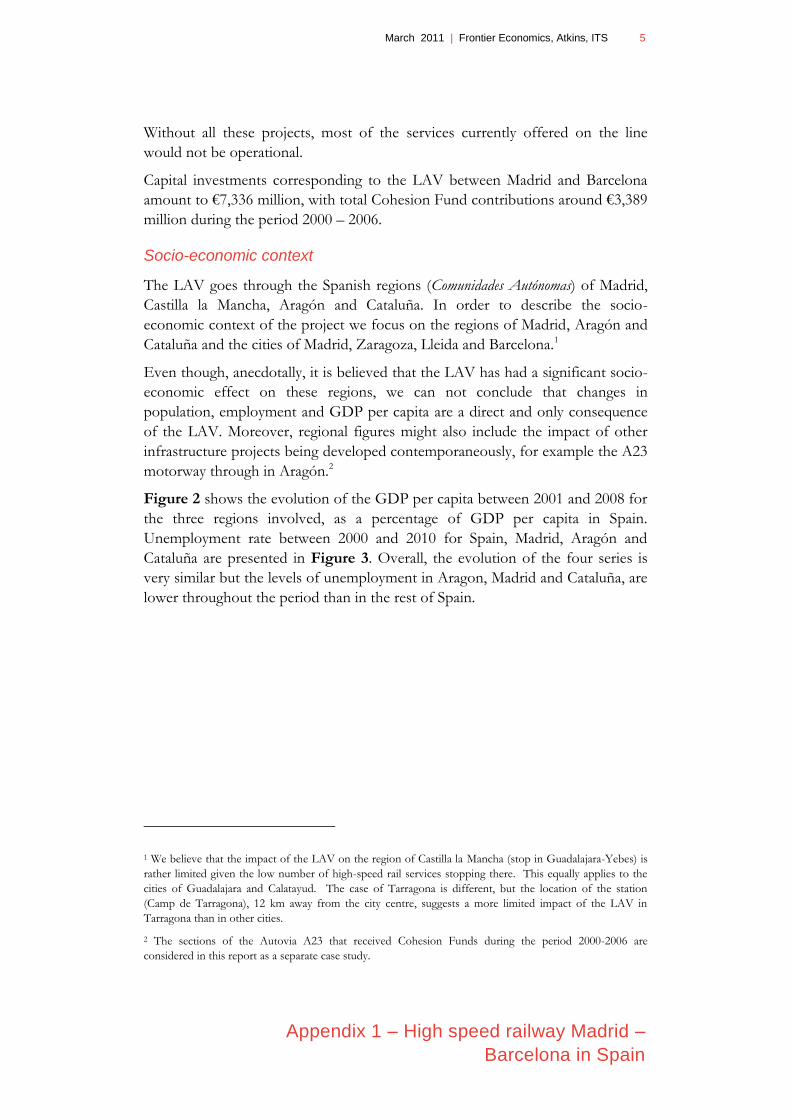
Figure 2 shows the evolution of the GDP per capita between 2001 and 2008 for
the three regions involved, as a percentage of GDP per capita in Spain.
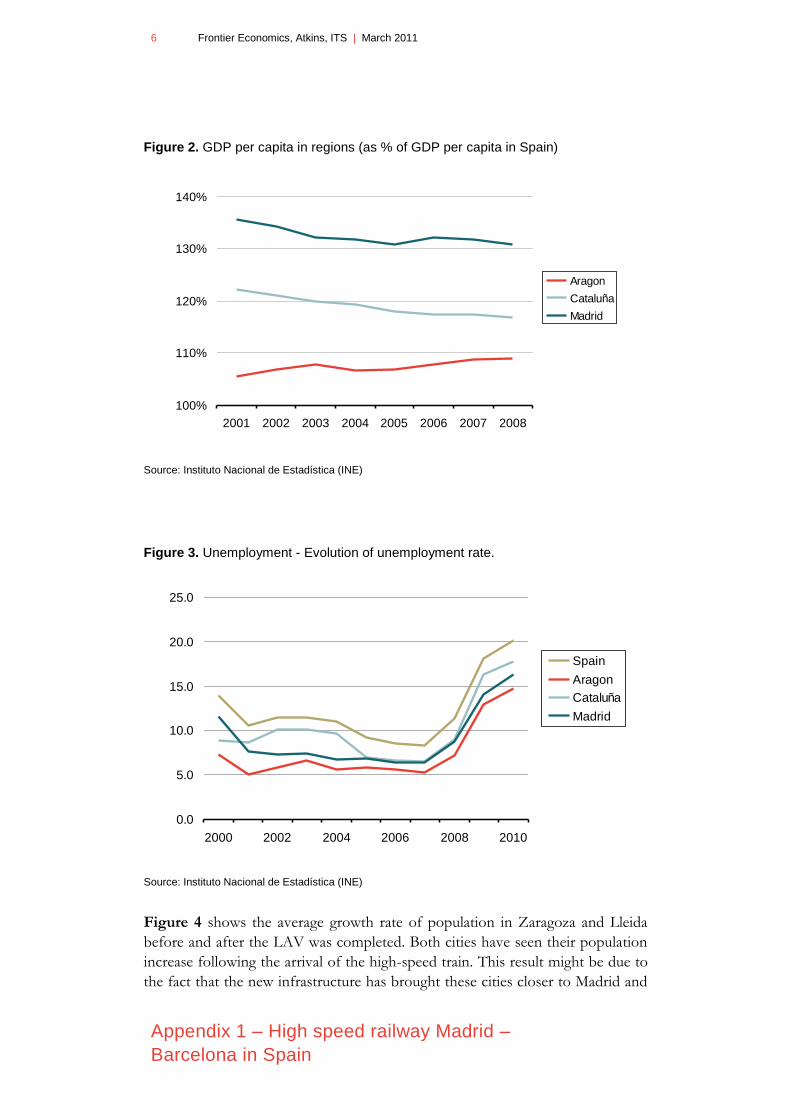
Unemployment rate between 2000 and 2010 for Spain, Madrid, Aragón and
Cataluña are presented in Figure 3. Overall, the evolution of the four series is
very similar but the levels of unemployment in Aragon, Madrid and Cataluña, are
lower throughout the period than in the rest of Spain.
1 We believe that the impact of the LAV on the region of Castilla la Mancha (stop in Guadalajara-Yebes) is
rather limited given the low number of high-speed rail services stopping there. This equally applies to the
cities of Guadalajara and Calatayud. The case of Tarragona is different, but the location of the station
(Camp de Tarragona), 12 km away from the city centre, suggests a more limited impact of the LAV in
Tarragona than in other cities.
2 The sections of the Autovia A23 that received Cohesion Funds during the period 2000-2006 are
considered in this report as a separate case study.
6 Frontier Economics, Atkins, ITS | March 2011
Appendix 1 – High speed railway Madrid –
Barcelona in Spain
Figure 2. GDP per capita in regions (as % of GDP per capita in Spain)
Source: Instituto Nacional de Estadística (INE)
Figure 3. Unemployment - Evolution of unemployment rate.
Source: Instituto Nacional de Estadística (INE)
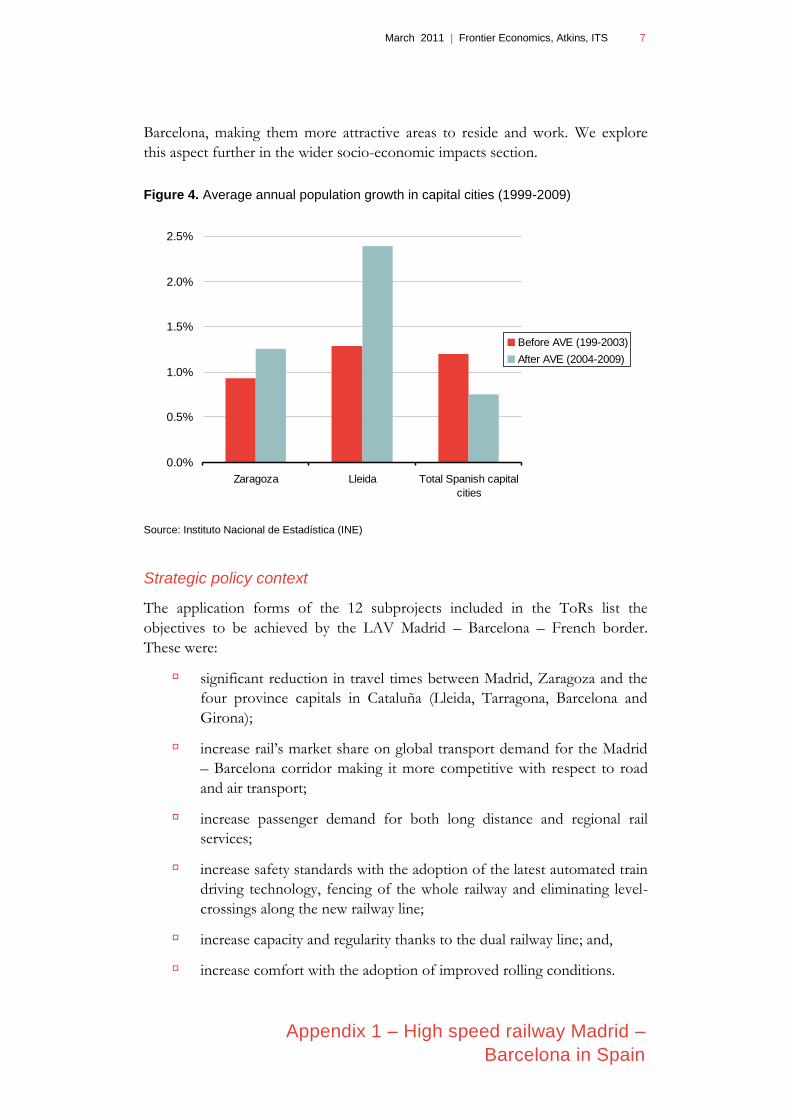
Figure 4 shows the average growth rate of population in Zaragoza and Lleida
before and after the LAV was completed. Both cities have seen their population
increase following the arrival of the high-speed train. This result might be due to
the fact that the new infrastructure has brought these cities closer to Madrid and
100%
110%
120%
130%
140%
2001 2002 2003 2004 2005 2006 2007 2008
Aragon
Cataluña
Madrid
0.0
5.0
10.0
15.0
20.0
25.0
2000 2002 2004 2006 2008 2010
Spain
Aragon
Cataluña
Madrid
March 2011 | Frontier Economics, Atkins, ITS 7
Appendix 1 – High speed railway Madrid –
Barcelona in Spain
Barcelona, making them more attractive areas to reside and work. We explore
this aspect further in the wider socio-economic impacts section.
Figure 4. Average annual population growth in capital cities (1999-2009)
Source: Instituto Nacional de Estadística (INE)
Strategic policy context
The application forms of the 12 subprojects included in the ToRs list the
objectives to be achieved by the LAV Madrid – Barcelona – French border.
These were:
significant reduction in travel times between Madrid, Zaragoza and the
four province capitals in Cataluña (Lleida, Tarragona, Barcelona and
Girona);
increase rail‟s market share on global transport demand for the Madrid
– Barcelona corridor making it more competitive with respect to road
and air transport;
increase passenger demand for both long distance and regional rail
services;
increase safety standards with the adoption of the latest automated train
driving technology, fencing of the whole railway and eliminating level-
crossings along the new railway line;
increase capacity and regularity thanks to the dual railway line; and,
increase comfort with the adoption of improved rolling conditions.
0.0%
0.5%
1.0%
1.5%
2.0%
2.5%
Zaragoza Lleida Total Spanish capital
cities
Before AVE (199-2003)
After AVE (2004-2009)
8 Frontier Economics, Atkins, ITS | March 2011
Appendix 1 – High speed railway Madrid –
Barcelona in Spain
As mentioned above, the project is part of the TEN-T Priority Project 3 (high-
speed railway axis of south-west Europe). This axis is expected to enable rail
connections between the Iberian Peninsula (Portugal and Spain) and the rest of
Europe without the need for reloading as a result of the gauge difference
between the rail networks in Spain/Portugal and the rest of Europe. The Madrid
– Barcelona – French borer high-speed railway line represents a decisive step for
the interoperability of Spain‟s high-speed network, as well as the improvement of
connectivity within different regions of the Spanish territory and between Spain
and the rest of Europe. The railway connection between Madrid and Barcelona
means that the two biggest cities in Spain are linked by train in two hours and a
half.
1.1.2 Sources
We have relied on a variety of different sources of information provided by DG
REGIO and by stakeholders in Spain. This allowed us to review the ex ante
analysis used in the applications for EU funding. We have obtained the funding
applications and the funding decisions for each of the 12 subprojects listed above
from DG REGIO. Each application provided a detailed description of the
respective subproject, its objectives and the expected costs. DG REGIO also
provided us with additional supporting documentation, such as the initial overall
cost-benefit analysis and the final reports for each of the 12 subprojects. We also
contacted the Transport Documentation Centre (Centro de Documenatación del
Transporte) from Ministerio de Fomento which provided us with the methodology
used in the economic analysis of railway projects.
The complete list of documents obtained, mainly related with the review of the
ex ante analysis, is provided in Table 3.
March 2011 | Frontier Economics, Atkins, ITS 9
Appendix 1 – High speed railway Madrid –
Barcelona in Spain
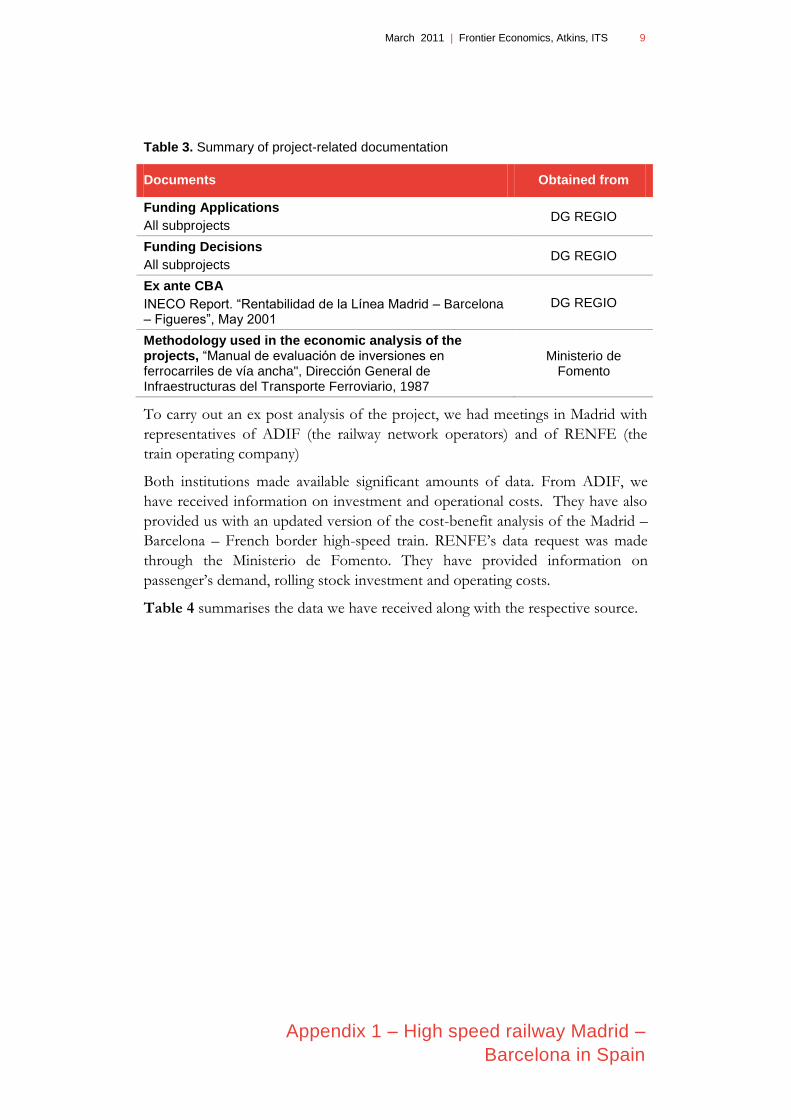
Table 3. Summary of project-related documentation
Documents Obtained from
Funding Applications
All subprojects DG REGIO
Funding Decisions
All subprojects DG REGIO
Ex ante CBA
INECO Report. “Rentabilidad de la Línea Madrid – Barcelona – Figueres”, May 2001
DG REGIO
Methodology used in the economic analysis of the projects, “Manual de evaluación de inversiones en ferrocarriles de vía ancha", Dirección General de Infraestructuras del Transporte Ferroviario, 1987
Ministerio de Fomento
To carry out an ex post analysis of the project, we had meetings in Madrid with
representatives of ADIF (the railway network operators) and of RENFE (the
train operating company)
Both institutions made available significant amounts of data. From ADIF, we
have received information on investment and operational costs. They have also
provided us with an updated version of the cost-benefit analysis of the Madrid –
Barcelona – French border high-speed train. RENFE‟s data request was made
through the Ministerio de Fomento. They have provided information on
passenger‟s demand, rolling stock investment and operating costs.
Table 4 summarises the data we have received along with the respective source.
10 Frontier Economics, Atkins, ITS | March 2011
Appendix 1 – High speed railway Madrid –
Barcelona in Spain
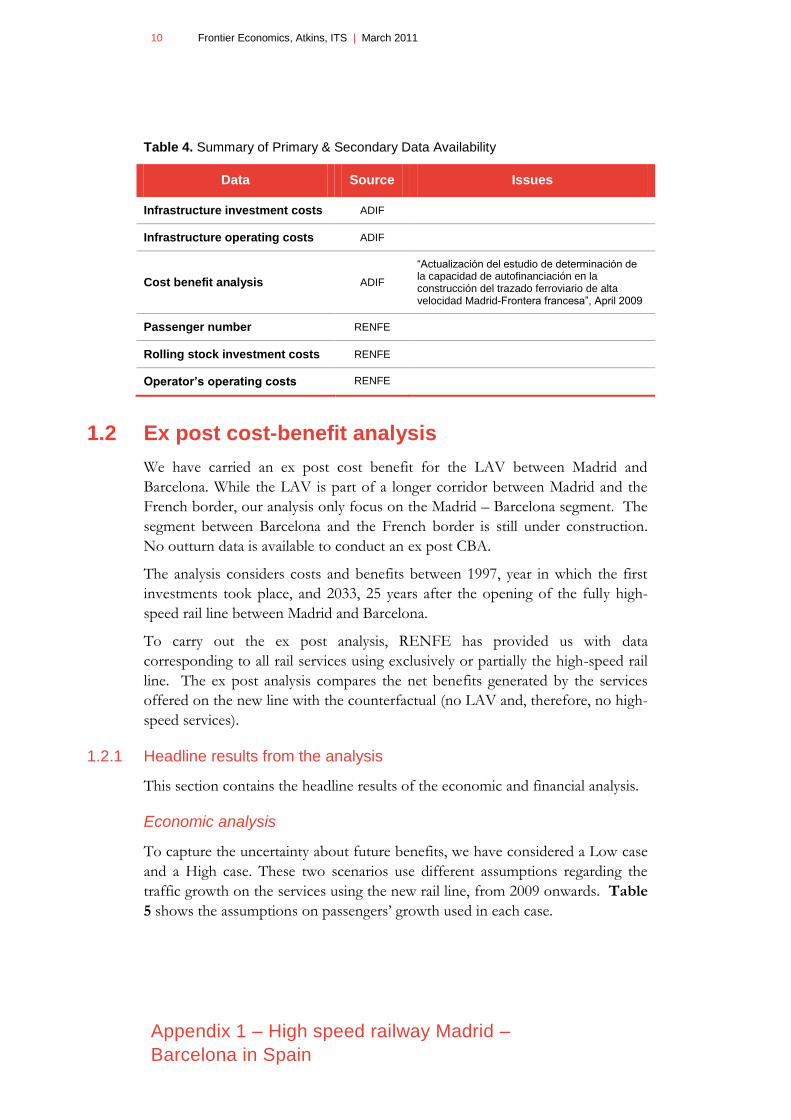
Table 4. Summary of Primary & Secondary Data Availability
Data Source Issues
Infrastructure investment costs ADIF
Infrastructure operating costs ADIF
Cost benefit analysis ADIF
“Actualización del estudio de determinación de la capacidad de autofinanciación en la construcción del trazado ferroviario de alta velocidad Madrid-Frontera francesa”, April 2009
Passenger number RENFE
Rolling stock investment costs RENFE
Operator’s operating costs RENFE
1.2 Ex post cost-benefit analysis
We have carried an ex post cost benefit for the LAV between Madrid and
Barcelona. While the LAV is part of a longer corridor between Madrid and the
French border, our analysis only focus on the Madrid – Barcelona segment. The
segment between Barcelona and the French border is still under construction.
No outturn data is available to conduct an ex post CBA.
The analysis considers costs and benefits between 1997, year in which the first
investments took place, and 2033, 25 years after the opening of the fully high-
speed rail line between Madrid and Barcelona.
To carry out the ex post analysis, RENFE has provided us with data
corresponding to all rail services using exclusively or partially the high-speed rail
line. The ex post analysis compares the net benefits generated by the services
offered on the new line with the counterfactual (no LAV and, therefore, no high-
speed services).
1.2.1 Headline results from the analysis
This section contains the headline results of the economic and financial analysis.
Economic analysis
To capture the uncertainty about future benefits, we have considered a Low case
and a High case. These two scenarios use different assumptions regarding the
traffic growth on the services using the new rail line, from 2009 onwards. Table
5 shows the assumptions on passengers‟ growth used in each case.
March 2011 | Frontier Economics, Atkins, ITS 11
Appendix 1 – High speed railway Madrid –
Barcelona in Spain
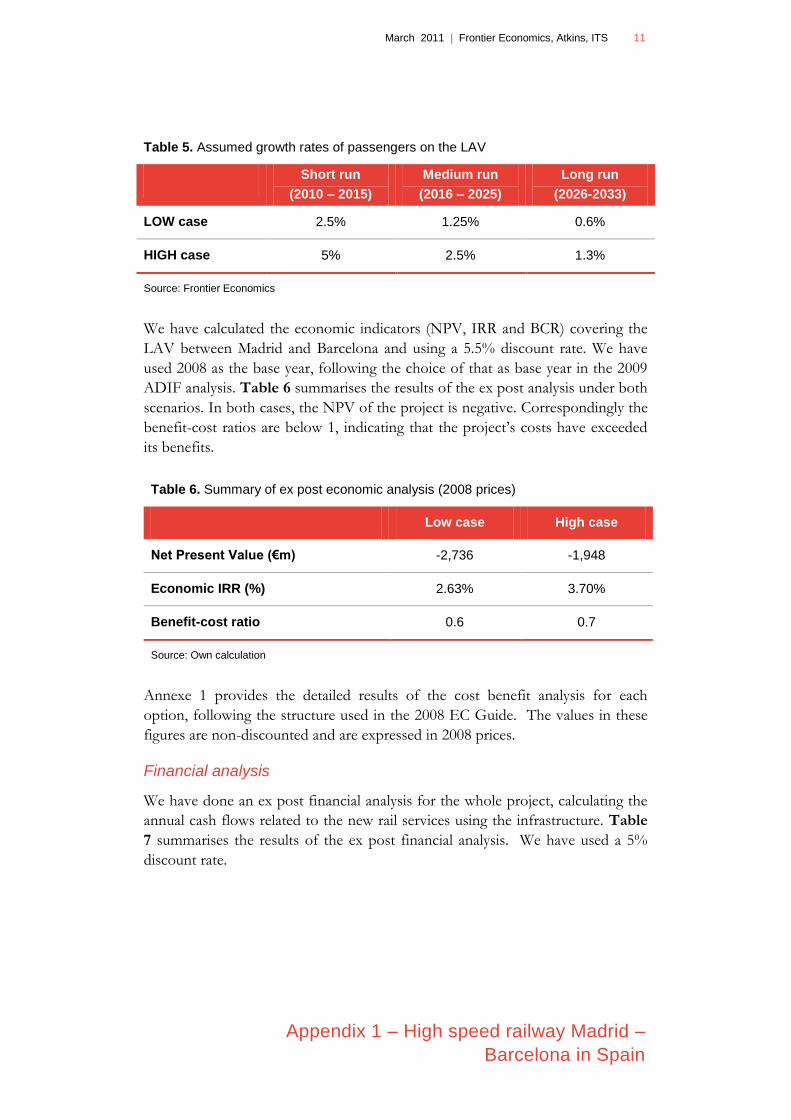
Table 5. Assumed growth rates of passengers on the LAV
Short run
(2010 – 2015)
Medium run
(2016 – 2025)
Long run
(2026-2033)
LOW case 2.5% 1.25% 0.6%
HIGH case 5% 2.5% 1.3%
Source: Frontier Economics
We have calculated the economic indicators (NPV, IRR and BCR) covering the
LAV between Madrid and Barcelona and using a 5.5% discount rate. We have
used 2008 as the base year, following the choice of that as base year in the 2009
ADIF analysis. Table 6 summarises the results of the ex post analysis under both
scenarios. In both cases, the NPV of the project is negative. Correspondingly the
benefit-cost ratios are below 1, indicating that the project‟s costs have exceeded
its benefits.
Table 6. Summary of ex post economic analysis (2008 prices)
Low case High case
Net Present Value (€m) -2,736 -1,948
Economic IRR (%) 2.63% 3.70%
Benefit-cost ratio 0.6 0.7
Source: Own calculation
Annexe 1 provides the detailed results of the cost benefit analysis for each
option, following the structure used in the 2008 EC Guide. The values in these
figures are non-discounted and are expressed in 2008 prices.
Financial analysis
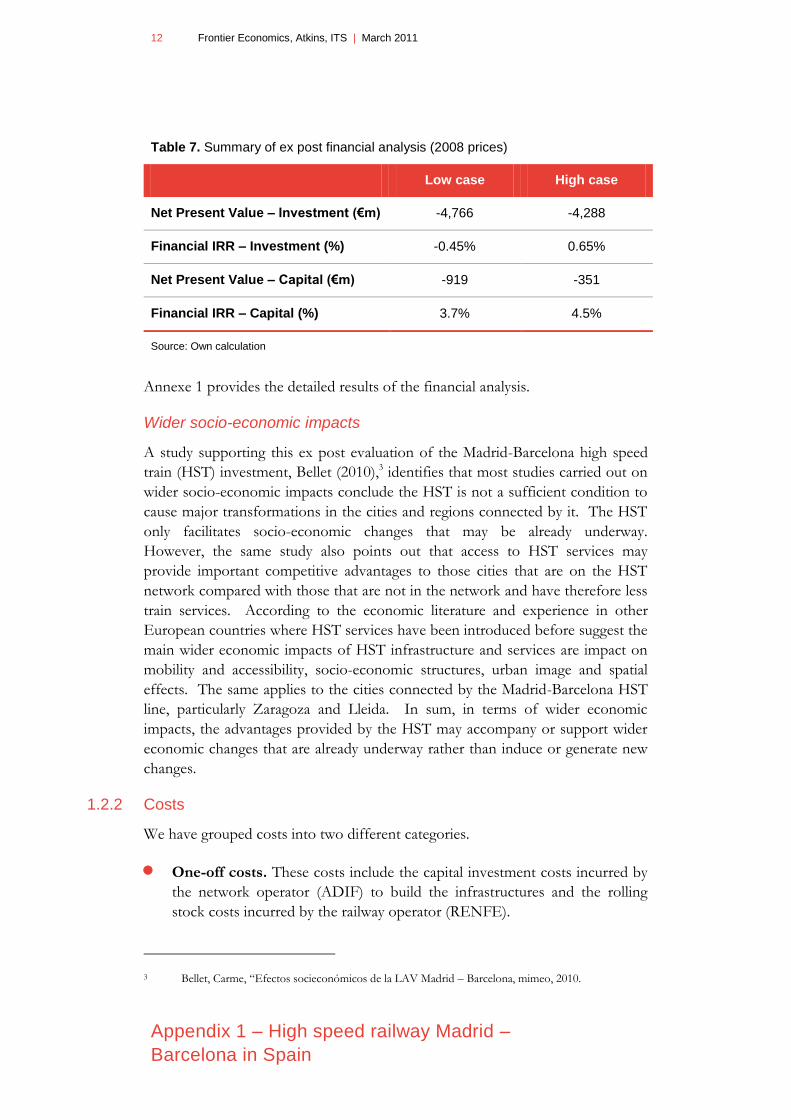
We have done an ex post financial analysis for the whole project, calculating the
annual cash flows related to the new rail services using the infrastructure. Table
7 summarises the results of the ex post financial analysis. We have used a 5%
discount rate.
12 Frontier Economics, Atkins, ITS | March 2011
Appendix 1 – High speed railway Madrid –
Barcelona in Spain
Table 7. Summary of ex post financial analysis (2008 prices)
Low case High case
Net Present Value – Investment (€m) -4,766 -4,288
Financial IRR – Investment (%) -0.45% 0.65%
Net Present Value – Capital (€m) -919 -351
Financial IRR – Capital (%) 3.7% 4.5%
Source: Own calculation
Annexe 1 provides the detailed results of the financial analysis.
Wider socio-economic impacts
A study supporting this ex post evaluation of the Madrid-Barcelona high speed
train (HST) investment, Bellet (2010),3 identifies that most studies carried out on
wider socio-economic impacts conclude the HST is not a sufficient condition to
cause major transformations in the cities and regions connected by it. The HST
only facilitates socio-economic changes that may be already underway.
However, the same study also points out that access to HST services may
provide important competitive advantages to those cities that are on the HST
network compared with those that are not in the network and have therefore less
train services. According to the economic literature and experience in other
European countries where HST services have been introduced before suggest the
main wider economic impacts of HST infrastructure and services are impact on
mobility and accessibility, socio-economic structures, urban image and spatial
effects. The same applies to the cities connected by the Madrid-Barcelona HST
line, particularly Zaragoza and Lleida. In sum, in terms of wider economic
impacts, the advantages provided by the HST may accompany or support wider
economic changes that are already underway rather than induce or generate new
changes.
1.2.2 Costs
We have grouped costs into two different categories.
One-off costs. These costs include the capital investment costs incurred by
the network operator (ADIF) to build the infrastructures and the rolling
stock costs incurred by the railway operator (RENFE).
3 Bellet, Carme, “Efectos socieconómicos de la LAV Madrid – Barcelona, mimeo, 2010.
March 2011 | Frontier Economics, Atkins, ITS 13
Appendix 1 – High speed railway Madrid –
Barcelona in Spain
Ongoing costs. The costs including the operational and maintenance costs
incurred by ADIF and RENFE on annual basis.
One-off costs
ADIF provided us with the nominal value of the capital investments for the LAV
Madrid – Barcelona. We have used IMF inflation and exchange rate data to
convert these nominal figures into figures into 2008 Euros.
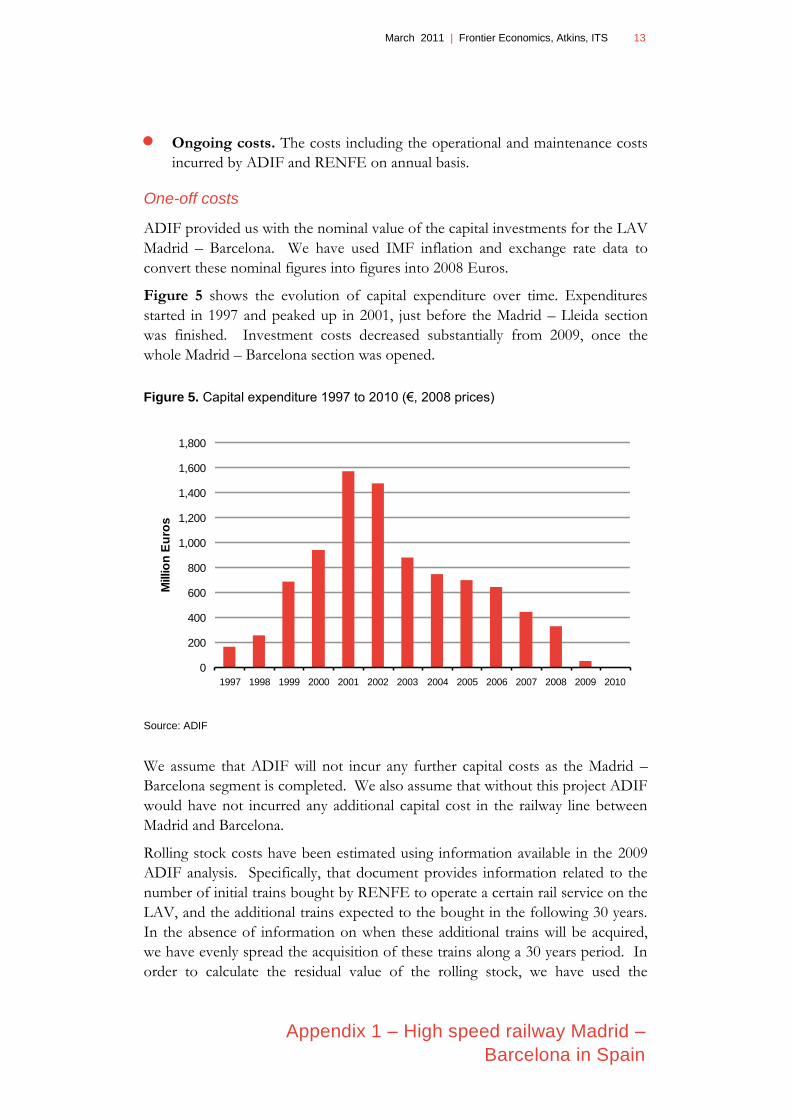
Figure 5 shows the evolution of capital expenditure over time. Expenditures
started in 1997 and peaked up in 2001, just before the Madrid – Lleida section
was finished. Investment costs decreased substantially from 2009, once the
whole Madrid – Barcelona section was opened.
Figure 5. Capital expenditure 1997 to 2010 (€, 2008 prices)
Source: ADIF
We assume that ADIF will not incur any further capital costs as the Madrid –
Barcelona segment is completed. We also assume that without this project ADIF
would have not incurred any additional capital cost in the railway line between
Madrid and Barcelona.
Rolling stock costs have been estimated using information available in the 2009
ADIF analysis. Specifically, that document provides information related to the
number of initial trains bought by RENFE to operate a certain rail service on the
LAV, and the additional trains expected to the bought in the following 30 years.
In the absence of information on when these additional trains will be acquired,
we have evenly spread the acquisition of these trains along a 30 years period. In
order to calculate the residual value of the rolling stock, we have used the
0
200
400
600
800
1,000
1,200
1,400
1,600
1,800
1997 1998 1999 2000 2001 2002 2003 2004 2005 2006 2007 2008 2009 2010
Millio
n E
uro
s
14 Frontier Economics, Atkins, ITS | March 2011
Appendix 1 – High speed railway Madrid –
Barcelona in Spain
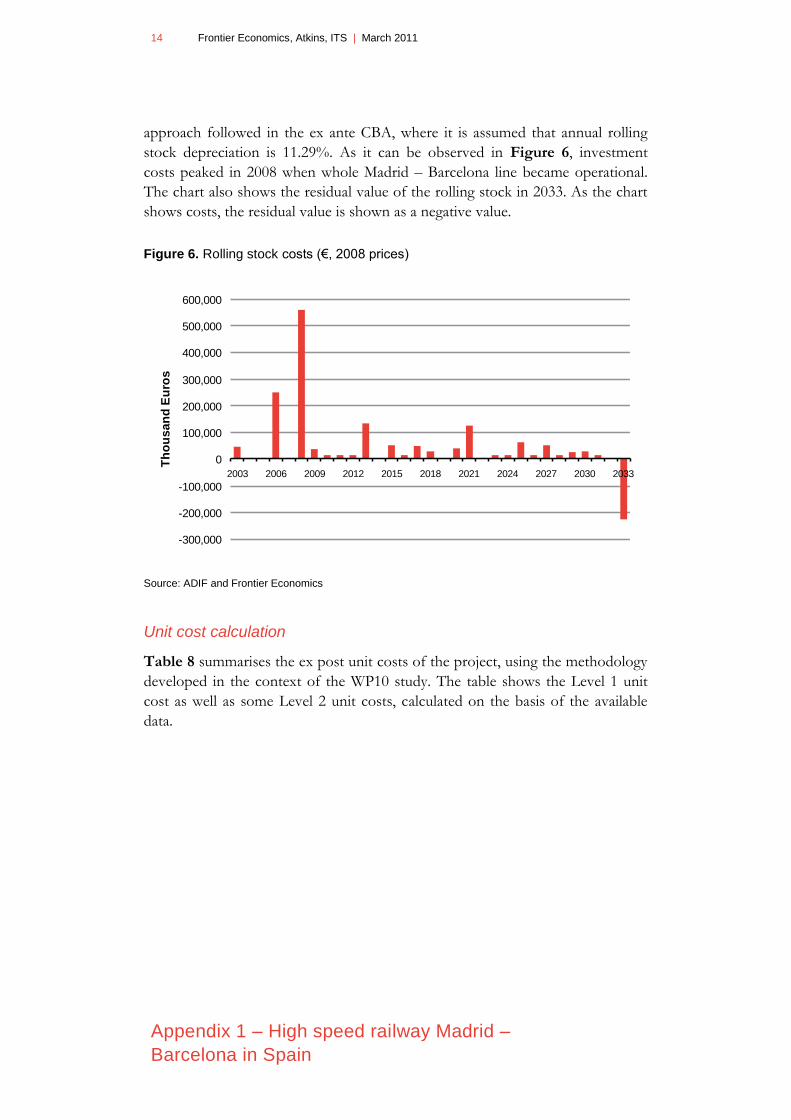
approach followed in the ex ante CBA, where it is assumed that annual rolling
stock depreciation is 11.29%. As it can be observed in Figure 6, investment
costs peaked in 2008 when whole Madrid – Barcelona line became operational.
The chart also shows the residual value of the rolling stock in 2033. As the chart
shows costs, the residual value is shown as a negative value.
Figure 6. Rolling stock costs (€, 2008 prices)
Source: ADIF and Frontier Economics
Unit cost calculation
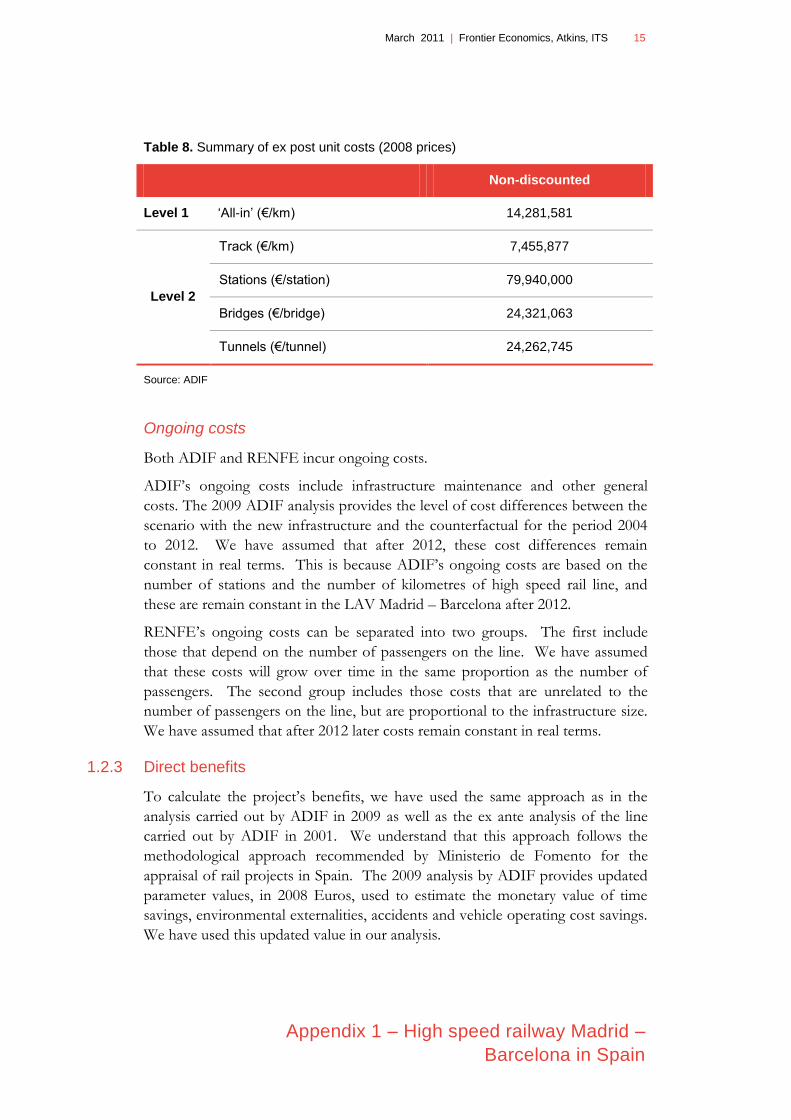
Table 8 summarises the ex post unit costs of the project, using the methodology
developed in the context of the WP10 study. The table shows the Level 1 unit
cost as well as some Level 2 unit costs, calculated on the basis of the available
data.
-300,000
-200,000
-100,000
0
100,000
200,000
300,000
400,000
500,000
600,000
2003 2006 2009 2012 2015 2018 2021 2024 2027 2030 2033
Th
ou
sa
nd
Eu
ros
March 2011 | Frontier Economics, Atkins, ITS 15
Appendix 1 – High speed railway Madrid –
Barcelona in Spain
Table 8. Summary of ex post unit costs (2008 prices)
Non-discounted
Level 1 „All-in‟ (€/km) 14,281,581
Level 2
Track (€/km) 7,455,877
Stations (€/station) 79,940,000
Bridges (€/bridge) 24,321,063
Tunnels (€/tunnel) 24,262,745
Source: ADIF
Ongoing costs
Both ADIF and RENFE incur ongoing costs.
ADIF‟s ongoing costs include infrastructure maintenance and other general
costs. The 2009 ADIF analysis provides the level of cost differences between the
scenario with the new infrastructure and the counterfactual for the period 2004
to 2012. We have assumed that after 2012, these cost differences remain
constant in real terms. This is because ADIF‟s ongoing costs are based on the
number of stations and the number of kilometres of high speed rail line, and
these are remain constant in the LAV Madrid – Barcelona after 2012.
RENFE‟s ongoing costs can be separated into two groups. The first include
those that depend on the number of passengers on the line. We have assumed
that these costs will grow over time in the same proportion as the number of
passengers. The second group includes those costs that are unrelated to the
number of passengers on the line, but are proportional to the infrastructure size.
We have assumed that after 2012 later costs remain constant in real terms.
1.2.3 Direct benefits
To calculate the project‟s benefits, we have used the same approach as in the
analysis carried out by ADIF in 2009 as well as the ex ante analysis of the line
carried out by ADIF in 2001. We understand that this approach follows the
methodological approach recommended by Ministerio de Fomento for the
appraisal of rail projects in Spain. The 2009 analysis by ADIF provides updated
parameter values, in 2008 Euros, used to estimate the monetary value of time
savings, environmental externalities, accidents and vehicle operating cost savings.
We have used this updated value in our analysis.
16 Frontier Economics, Atkins, ITS | March 2011
Appendix 1 – High speed railway Madrid –
Barcelona in Spain
Traffic volumes
RENFE provided us with passenger data related to all rail services using the LAV
Madrid – Barcelona and corresponding to years 2008 and 2009. These services
use the LAV Madrid – Barcelona either exclusively or partially. Rail services that
use the LAV exclusively are those between two destinations located along the
LAV. Services in this category include the AVE Madrid – Zaragoza/Barcelona
and the regional service AVMD Lleida – Barcelona. Rail services that use the
LAV partially are those that combine segments of the LAV and other rail
segments. Services in this category include, among others, the AVE Barcelona –
Málaga or the ALVIA Madrid – Pamplona. We obtained passenger data for 19
different rail services using the new high speed line, with the AVE Madrid –
Zaragoza/Barcelona service accounting for around two thirds of the total
number of passengers.
For the rail services that use the LAV Madrid – Barcelona partially, we have
obtained passenger data corresponding to the high speed segment of the service.
For these rail services, we use distance and time parameters corresponding to the
LAV segment. For example the rail service between Barcelona and Bilbao, we
only consider the distance and travel times corresponding to the Zaragoza –
Barcelona segment. We assume that travel times outside the LAV are unchanged.
The 2009 ADIF analysis provides information regarding the origins and
destinations of passengers using the new or improved services on the LAV. For
example, it reports that just over 50% of the passengers going from Madrid to
Barcelona, and vice versa, on the new AVE service used the plane before the
AVE service became operational; 18% used the train, 18% used the car and 4%
used the bus. The remaining 10% of current AVE passengers in this segment are
new passengers that were not travelling before.
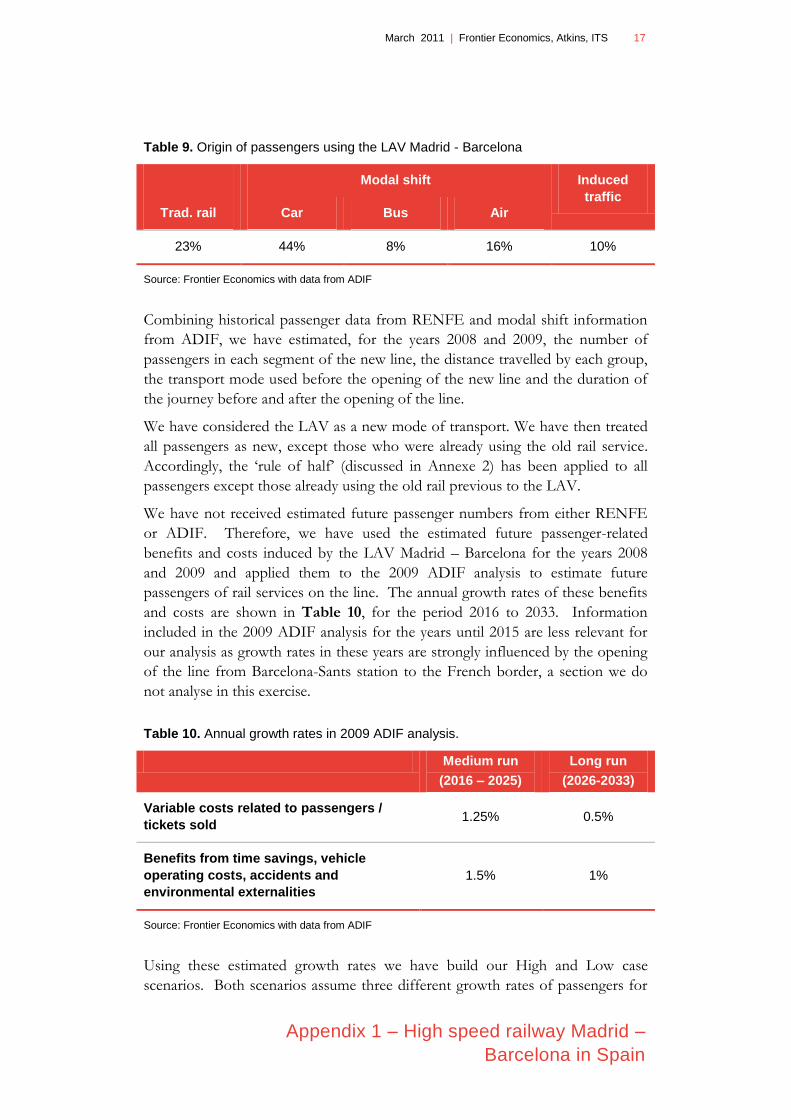
ADIF provides this information for all geographical segments covering the
services that use the new rail line. Taking this modal shift information for all
services using the new rail line, we have calculated the average modal shift of
each transport mode and the percentage of induced passengers on the line.
Table 9 shows this average modal shift for all the services operating on the LAV
Madrid - Barcelona
March 2011 | Frontier Economics, Atkins, ITS 17
Appendix 1 – High speed railway Madrid –
Barcelona in Spain
Table 9. Origin of passengers using the LAV Madrid - Barcelona
Modal shift Induced
traffic
Trad. rail Car Bus Air
23% 44% 8% 16% 10%
Source: Frontier Economics with data from ADIF
Combining historical passenger data from RENFE and modal shift information
from ADIF, we have estimated, for the years 2008 and 2009, the number of
passengers in each segment of the new line, the distance travelled by each group,
the transport mode used before the opening of the new line and the duration of
the journey before and after the opening of the line.
We have considered the LAV as a new mode of transport. We have then treated
all passengers as new, except those who were already using the old rail service.
Accordingly, the „rule of half‟ (discussed in Annexe 2) has been applied to all
passengers except those already using the old rail previous to the LAV.
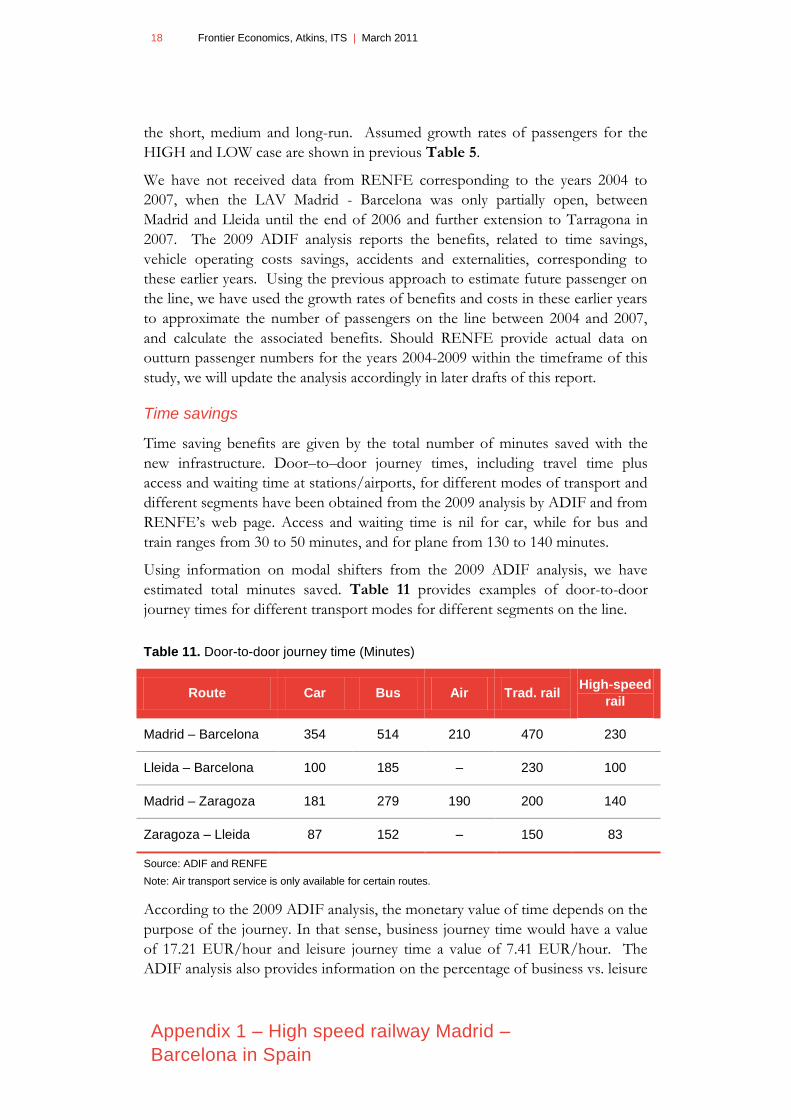
We have not received estimated future passenger numbers from either RENFE
or ADIF. Therefore, we have used the estimated future passenger-related
benefits and costs induced by the LAV Madrid – Barcelona for the years 2008
and 2009 and applied them to the 2009 ADIF analysis to estimate future
passengers of rail services on the line. The annual growth rates of these benefits
and costs are shown in Table 10, for the period 2016 to 2033. Information
included in the 2009 ADIF analysis for the years until 2015 are less relevant for
our analysis as growth rates in these years are strongly influenced by the opening
of the line from Barcelona-Sants station to the French border, a section we do
not analyse in this exercise.
Table 10. Annual growth rates in 2009 ADIF analysis.
Medium run
(2016 – 2025)
Long run
(2026-2033)
Variable costs related to passengers /
tickets sold 1.25% 0.5%
Benefits from time savings, vehicle
operating costs, accidents and
environmental externalities
1.5% 1%
Source: Frontier Economics with data from ADIF
Using these estimated growth rates we have build our High and Low case
scenarios. Both scenarios assume three different growth rates of passengers for
18 Frontier Economics, Atkins, ITS | March 2011
Appendix 1 – High speed railway Madrid –
Barcelona in Spain
the short, medium and long-run. Assumed growth rates of passengers for the
HIGH and LOW case are shown in previous Table 5.
We have not received data from RENFE corresponding to the years 2004 to
2007, when the LAV Madrid - Barcelona was only partially open, between
Madrid and Lleida until the end of 2006 and further extension to Tarragona in
2007. The 2009 ADIF analysis reports the benefits, related to time savings,
vehicle operating costs savings, accidents and externalities, corresponding to
these earlier years. Using the previous approach to estimate future passenger on
the line, we have used the growth rates of benefits and costs in these earlier years
to approximate the number of passengers on the line between 2004 and 2007,
and calculate the associated benefits. Should RENFE provide actual data on
outturn passenger numbers for the years 2004-2009 within the timeframe of this
study, we will update the analysis accordingly in later drafts of this report.
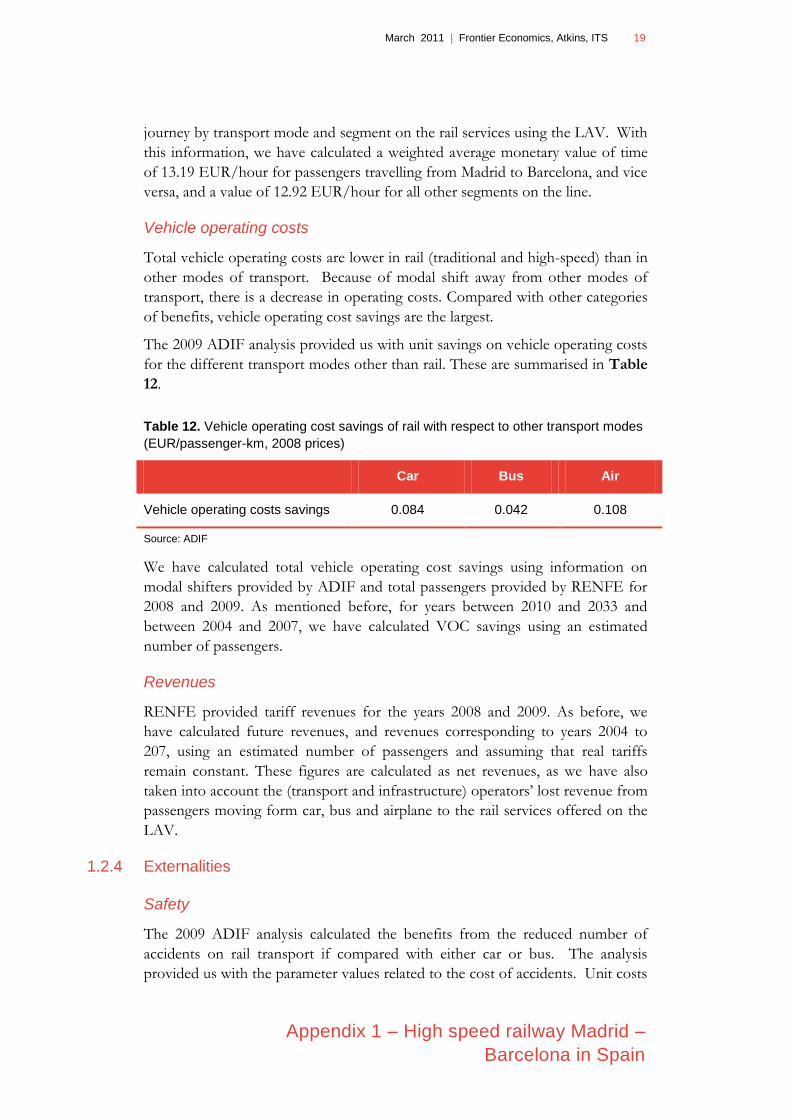
Time savings
Time saving benefits are given by the total number of minutes saved with the
new infrastructure. Door–to–door journey times, including travel time plus
access and waiting time at stations/airports, for different modes of transport and
different segments have been obtained from the 2009 analysis by ADIF and from
RENFE‟s web page. Access and waiting time is nil for car, while for bus and
train ranges from 30 to 50 minutes, and for plane from 130 to 140 minutes.
Using information on modal shifters from the 2009 ADIF analysis, we have
estimated total minutes saved. Table 11 provides examples of door-to-door
journey times for different transport modes for different segments on the line.
Table 11. Door-to-door journey time (Minutes)
Route Car Bus Air Trad. rail High-speed
rail
Madrid – Barcelona 354 514 210 470 230
Lleida – Barcelona 100 185 – 230 100
Madrid – Zaragoza 181 279 190 200 140
Zaragoza – Lleida 87 152 – 150 83
Source: ADIF and RENFE
Note: Air transport service is only available for certain routes.
According to the 2009 ADIF analysis, the monetary value of time depends on the
purpose of the journey. In that sense, business journey time would have a value
of 17.21 EUR/hour and leisure journey time a value of 7.41 EUR/hour. The
ADIF analysis also provides information on the percentage of business vs. leisure
March 2011 | Frontier Economics, Atkins, ITS 19
Appendix 1 – High speed railway Madrid –
Barcelona in Spain
journey by transport mode and segment on the rail services using the LAV. With
this information, we have calculated a weighted average monetary value of time
of 13.19 EUR/hour for passengers travelling from Madrid to Barcelona, and vice
versa, and a value of 12.92 EUR/hour for all other segments on the line.
Vehicle operating costs
Total vehicle operating costs are lower in rail (traditional and high-speed) than in
other modes of transport. Because of modal shift away from other modes of
transport, there is a decrease in operating costs. Compared with other categories
of benefits, vehicle operating cost savings are the largest.
The 2009 ADIF analysis provided us with unit savings on vehicle operating costs
for the different transport modes other than rail. These are summarised in Table
12.
Table 12. Vehicle operating cost savings of rail with respect to other transport modes
(EUR/passenger-km, 2008 prices)
Car Bus Air
Vehicle operating costs savings 0.084 0.042 0.108
Source: ADIF
We have calculated total vehicle operating cost savings using information on
modal shifters provided by ADIF and total passengers provided by RENFE for
2008 and 2009. As mentioned before, for years between 2010 and 2033 and
between 2004 and 2007, we have calculated VOC savings using an estimated
number of passengers.
Revenues
RENFE provided tariff revenues for the years 2008 and 2009. As before, we
have calculated future revenues, and revenues corresponding to years 2004 to
207, using an estimated number of passengers and assuming that real tariffs
remain constant. These figures are calculated as net revenues, as we have also
taken into account the (transport and infrastructure) operators‟ lost revenue from
passengers moving form car, bus and airplane to the rail services offered on the
LAV.
1.2.4 Externalities
Safety
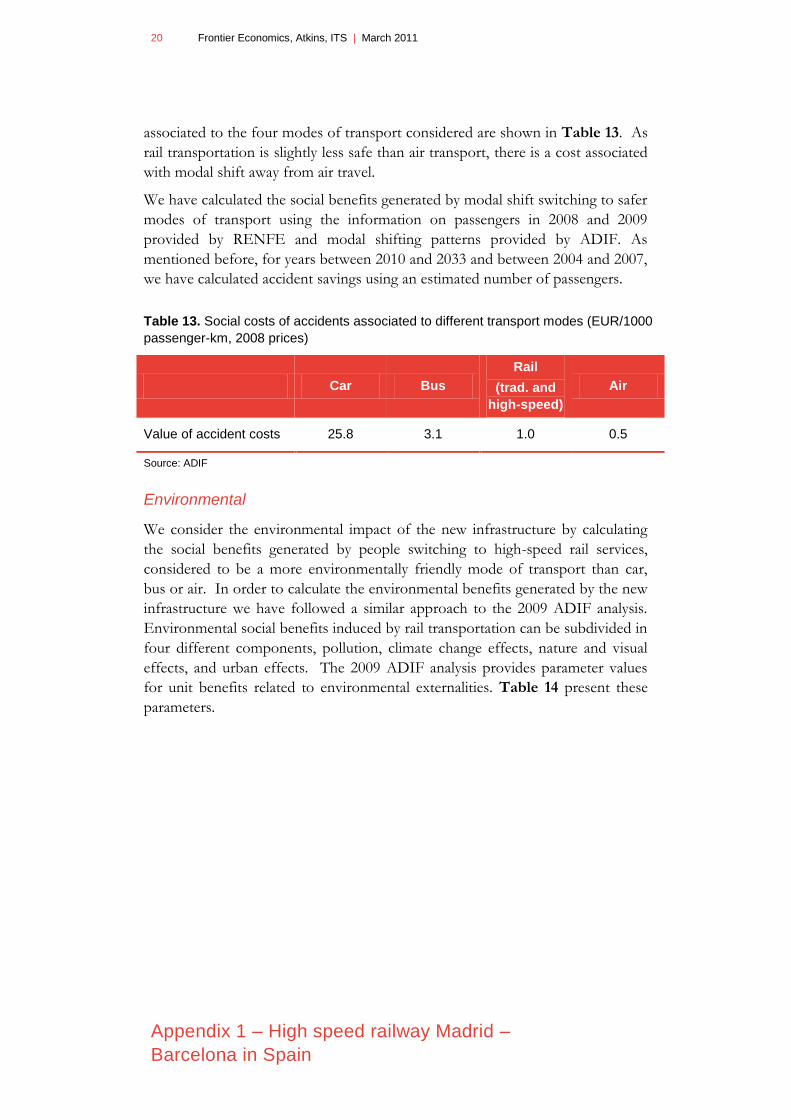
The 2009 ADIF analysis calculated the benefits from the reduced number of
accidents on rail transport if compared with either car or bus. The analysis
provided us with the parameter values related to the cost of accidents. Unit costs
20 Frontier Economics, Atkins, ITS | March 2011
Appendix 1 – High speed railway Madrid –
Barcelona in Spain
associated to the four modes of transport considered are shown in Table 13. As
rail transportation is slightly less safe than air transport, there is a cost associated
with modal shift away from air travel.
We have calculated the social benefits generated by modal shift switching to safer
modes of transport using the information on passengers in 2008 and 2009
provided by RENFE and modal shifting patterns provided by ADIF. As
mentioned before, for years between 2010 and 2033 and between 2004 and 2007,
we have calculated accident savings using an estimated number of passengers.
Table 13. Social costs of accidents associated to different transport modes (EUR/1000
passenger-km, 2008 prices)
Car Bus
Rail
(trad. and
high-speed)
Air
Value of accident costs 25.8 3.1 1.0 0.5
Source: ADIF
Environmental
We consider the environmental impact of the new infrastructure by calculating
the social benefits generated by people switching to high-speed rail services,
considered to be a more environmentally friendly mode of transport than car,
bus or air. In order to calculate the environmental benefits generated by the new
infrastructure we have followed a similar approach to the 2009 ADIF analysis.
Environmental social benefits induced by rail transportation can be subdivided in
four different components, pollution, climate change effects, nature and visual
effects, and urban effects. The 2009 ADIF analysis provides parameter values
for unit benefits related to environmental externalities. Table 14 present these
parameters.

March 2011 | Frontier Economics, Atkins, ITS 21
Appendix 1 – High speed railway Madrid –
Barcelona in Spain
Table 14. Environmental cost savings of rail with respect to other transport modes
(EUR/1000 passenger-km, 2008 prices)
Car Bus Air
Pollution 7.5 17.8 -5.8
Climate change 8.4 1.6 29.5
Nature and Visual 2.9 0.1 0.2
Urban effects 0.4 -1.1 -1.6
Total 19.2 18.4 22.3
Source: ADIF
We have calculated the social benefits generated by modal shifters switching to
high-speed rail services using the information on passengers in 2008 and 2009
provided by RENFE and modal shifting patterns provided by ADIF. As
mentioned before, for years between 2010 and 2033 and between 2004 and 2007,
we have calculated the total environmental externality using an estimated number
of passengers.
1.2.5 Wider socio-economic impacts
The high speed train (HST) can have a set of wider socio-economic and land use
qualitative impacts which go beyond the more immediate quantitative costs and
benefits. The two main characteristics that need attention to understand the
wider socio-economic effects of HST are (i) the channels through which HST can
have wider impacts and (ii) the time it takes those impacts to take effect
Impact channels
The build up of HST infrastructure and start of rail service operations can
influence the local socio-economic structures through different channels. Table
15 summarises what is known in the literature about the main wider socio-
economic effects of the HST. The HST can influence mobility and accessibility,
socio-economic structures (especially tourism and market expansion), the image
of urban centres and spatial changes, both urban transformation and urban
planning.
22 Frontier Economics, Atkins, ITS | March 2011
Appendix 1 – High speed railway Madrid –
Barcelona in Spain
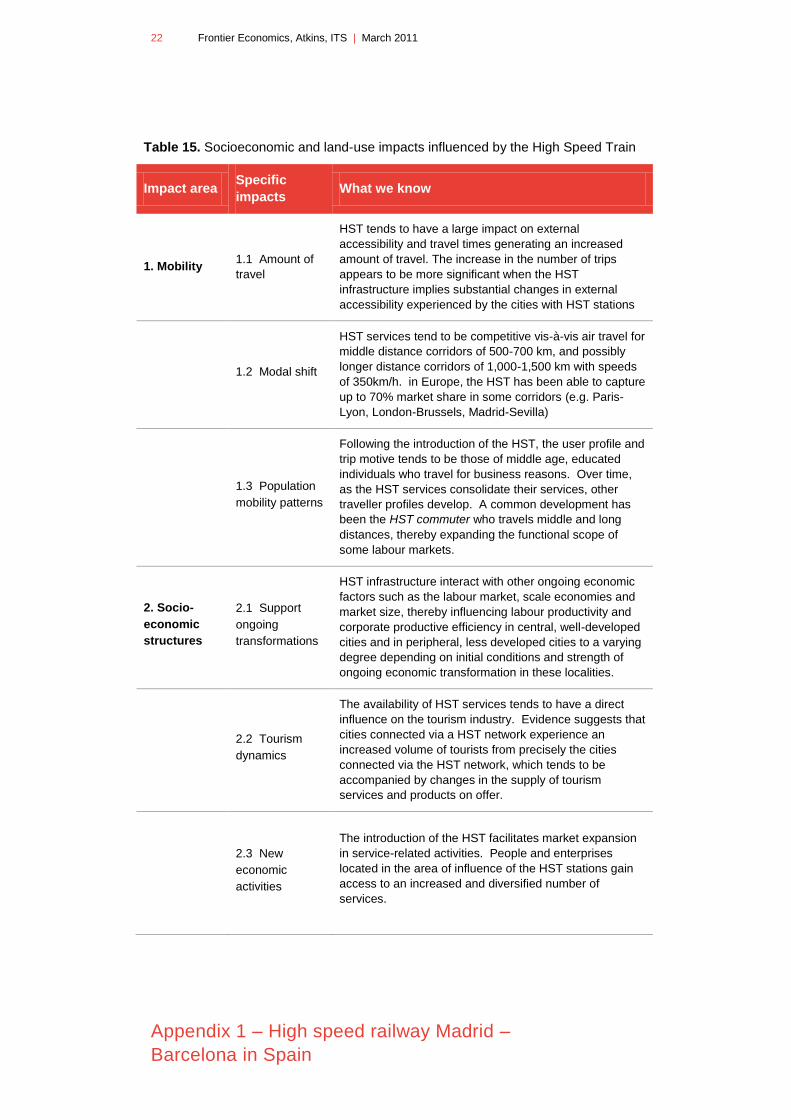
Table 15. Socioeconomic and land-use impacts influenced by the High Speed Train
Impact area Specific
impacts What we know
1. Mobility 1.1 Amount of
travel
HST tends to have a large impact on external
accessibility and travel times generating an increased
amount of travel. The increase in the number of trips
appears to be more significant when the HST
infrastructure implies substantial changes in external
accessibility experienced by the cities with HST stations
1.2 Modal shift
HST services tend to be competitive vis-à-vis air travel for
middle distance corridors of 500-700 km, and possibly
longer distance corridors of 1,000-1,500 km with speeds
of 350km/h. in Europe, the HST has been able to capture
up to 70% market share in some corridors (e.g. Paris-
Lyon, London-Brussels, Madrid-Sevilla)
1.3 Population
mobility patterns
Following the introduction of the HST, the user profile and
trip motive tends to be those of middle age, educated
individuals who travel for business reasons. Over time,
as the HST services consolidate their services, other
traveller profiles develop. A common development has
been the HST commuter who travels middle and long
distances, thereby expanding the functional scope of
some labour markets.
2. Socio-
economic
structures
2.1 Support
ongoing
transformations
HST infrastructure interact with other ongoing economic
factors such as the labour market, scale economies and
market size, thereby influencing labour productivity and
corporate productive efficiency in central, well-developed
cities and in peripheral, less developed cities to a varying
degree depending on initial conditions and strength of
ongoing economic transformation in these localities.
2.2 Tourism
dynamics
The availability of HST services tends to have a direct
influence on the tourism industry. Evidence suggests that
cities connected via a HST network experience an
increased volume of tourists from precisely the cities
connected via the HST network, which tends to be
accompanied by changes in the supply of tourism
services and products on offer.
2.3 New
economic
activities
The introduction of the HST facilitates market expansion
in service-related activities. People and enterprises
located in the area of influence of the HST stations gain
access to an increased and diversified number of
services.
March 2011 | Frontier Economics, Atkins, ITS 23
Appendix 1 – High speed railway Madrid –
Barcelona in Spain
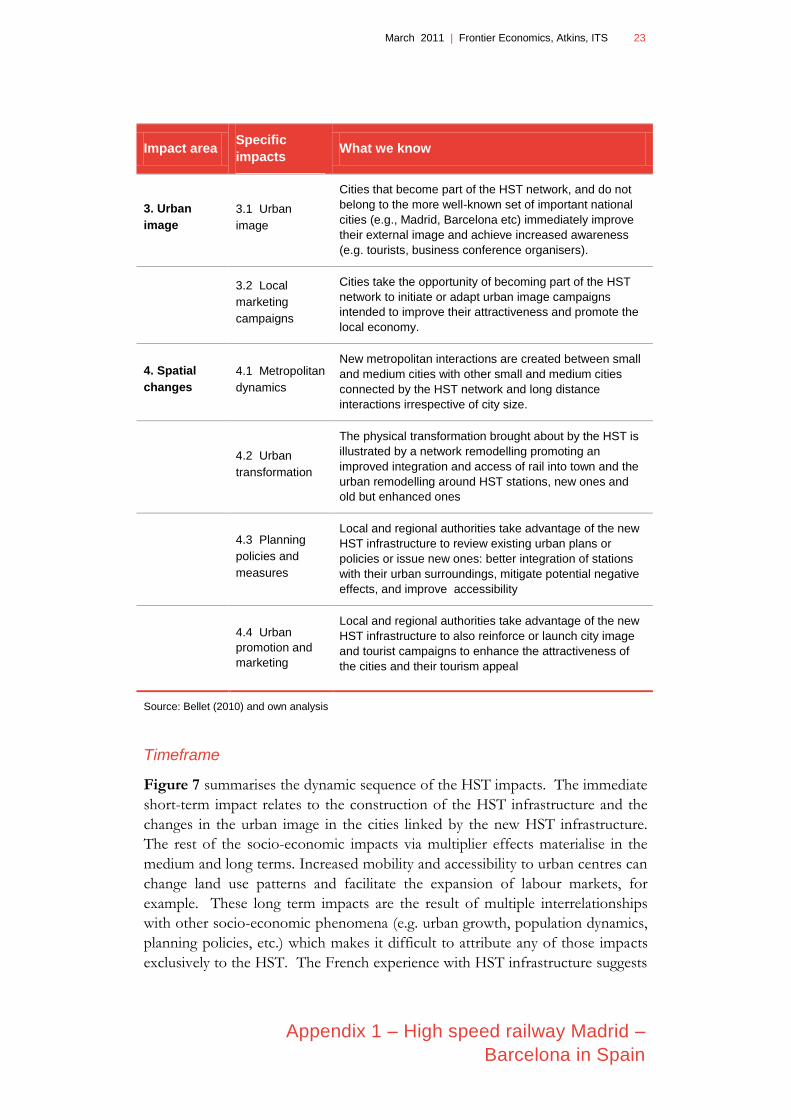
Impact area Specific
impacts What we know
3. Urban
image
3.1 Urban
image
Cities that become part of the HST network, and do not
belong to the more well-known set of important national
cities (e.g., Madrid, Barcelona etc) immediately improve
their external image and achieve increased awareness
(e.g. tourists, business conference organisers).
3.2 Local
marketing
campaigns
Cities take the opportunity of becoming part of the HST
network to initiate or adapt urban image campaigns
intended to improve their attractiveness and promote the
local economy.
4. Spatial
changes
4.1 Metropolitan
dynamics
New metropolitan interactions are created between small
and medium cities with other small and medium cities
connected by the HST network and long distance
interactions irrespective of city size.
4.2 Urban
transformation
The physical transformation brought about by the HST is
illustrated by a network remodelling promoting an
improved integration and access of rail into town and the
urban remodelling around HST stations, new ones and
old but enhanced ones
4.3 Planning
policies and
measures
Local and regional authorities take advantage of the new
HST infrastructure to review existing urban plans or
policies or issue new ones: better integration of stations
with their urban surroundings, mitigate potential negative
effects, and improve accessibility
4.4 Urban
promotion and
marketing
Local and regional authorities take advantage of the new
HST infrastructure to also reinforce or launch city image
and tourist campaigns to enhance the attractiveness of
the cities and their tourism appeal
Source: Bellet (2010) and own analysis
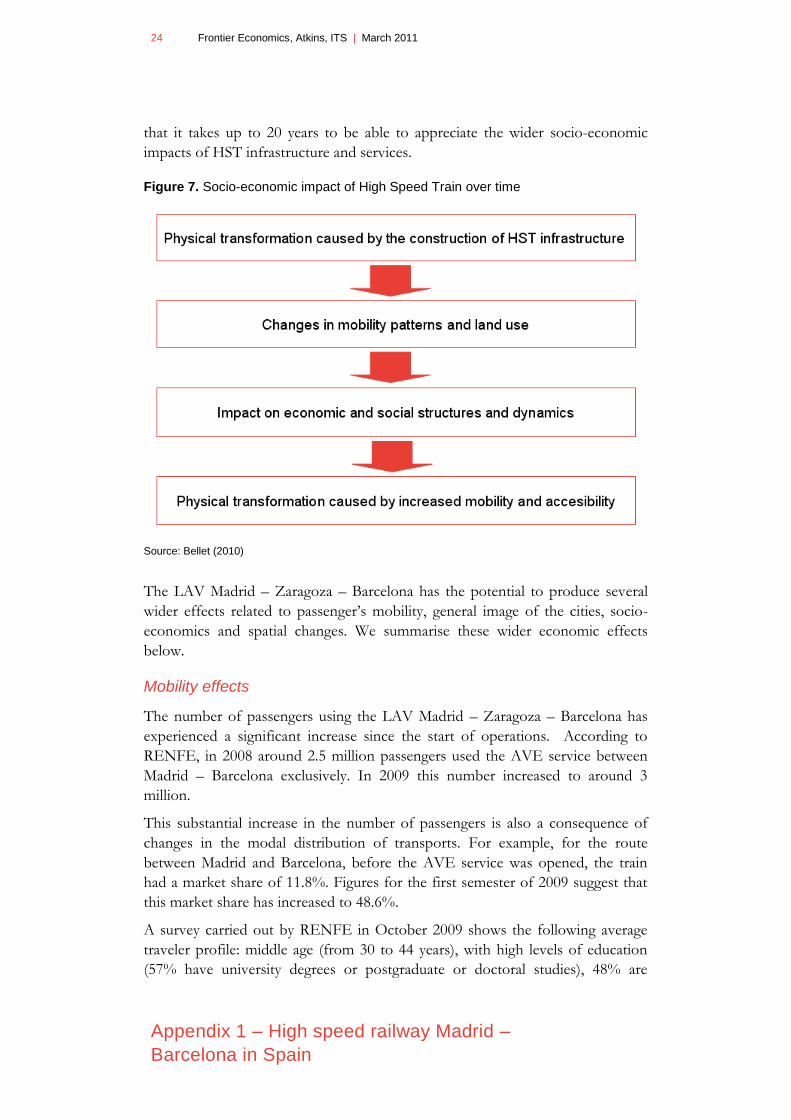
Timeframe
Figure 7 summarises the dynamic sequence of the HST impacts. The immediate
short-term impact relates to the construction of the HST infrastructure and the
changes in the urban image in the cities linked by the new HST infrastructure.
The rest of the socio-economic impacts via multiplier effects materialise in the
medium and long terms. Increased mobility and accessibility to urban centres can
change land use patterns and facilitate the expansion of labour markets, for
example. These long term impacts are the result of multiple interrelationships
with other socio-economic phenomena (e.g. urban growth, population dynamics,
planning policies, etc.) which makes it difficult to attribute any of those impacts
exclusively to the HST. The French experience with HST infrastructure suggests
24 Frontier Economics, Atkins, ITS | March 2011
Appendix 1 – High speed railway Madrid –
Barcelona in Spain
that it takes up to 20 years to be able to appreciate the wider socio-economic
impacts of HST infrastructure and services.
Figure 7. Socio-economic impact of High Speed Train over time
Source: Bellet (2010)
The LAV Madrid – Zaragoza – Barcelona has the potential to produce several
wider effects related to passenger‟s mobility, general image of the cities, socio-
economics and spatial changes. We summarise these wider economic effects
below.
Mobility effects
The number of passengers using the LAV Madrid – Zaragoza – Barcelona has
experienced a significant increase since the start of operations. According to
RENFE, in 2008 around 2.5 million passengers used the AVE service between
Madrid – Barcelona exclusively. In 2009 this number increased to around 3
million.
This substantial increase in the number of passengers is also a consequence of
changes in the modal distribution of transports. For example, for the route
between Madrid and Barcelona, before the AVE service was opened, the train
had a market share of 11.8%. Figures for the first semester of 2009 suggest that
this market share has increased to 48.6%.
A survey carried out by RENFE in October 2009 shows the following average
traveler profile: middle age (from 30 to 44 years), with high levels of education
(57% have university degrees or postgraduate or doctoral studies), 48% are
March 2011 | Frontier Economics, Atkins, ITS 25
Appendix 1 – High speed railway Madrid –
Barcelona in Spain
private employees performing management or administration functions,
entrepreneur or self-employed, and 48% travel for business or professional
reasons.
The survey results also suggest that leisure/tourism is the reason for travelling in
29.2% of the responses. Previous studies of the Spanish southern HST corridor
Madrid-Sevilla show that leisure/tourism trips increases over time and that the
passenger profile also becomes more diversified over the years.
Finally, a new type of traveller has appeared as a consequence of the LAV
Madrid – Barcelona: the commuters. The frequency of trips between cities
separated by less than 60 minutes (Zaragoza – Madrid, Zaragoza – Barcelona,
and especially Lleida – Barcelona and Lleida – Camp de Tarragona) is very high.
According to RENFE‟s survey, 21% of passengers in the Zaragoza – Madrid
service were commuters. This percentage is much higher for the Catalan services
(53.4%) given that since the introduction in April 2008 of the AVANT services,
high-speed train services for short distances at competitive prices between
Barcelona – Camps de Tarragona – Lleida.
Socio-economic effects
The HST is seen as an instrument to improve the accessibility of cities and
regions connected to the network. Several studies suggest that accessibility gains
would be higher for medium and small cities (Zaragoza and Lleida) than for
bigger cities (Madrid and Barcelona) because some activities would be reallocated
to these smaller cities. These activities would include activities related to urban
tourism, conference tourism, scientific meetings, and business meeting; and the
relocation of specialized businesses and technical consultancy firms to take
advantage of lower labour costs and availability of skilled labour while keeping
good accessibility to Madrid and/or Barcelona.
Change in tourism dynamics
As discussed above, one of the sectors that is most influenced by the arrival of
the LAV, is the tourism. Overall, the number of visitors grows, especially from
large cities and towns near the corridor or high-speed network. These dynamics
appear to have been particularly intense in the cities of Zaragoza and Lleida. The
reasons are:
The train incorporates or strengthens the position of these cities as
tourist destinations;
With the new train infrastructure, these cities become closer and
reinforces the role of these cities and their territories in the national
tourism market;
It tends to increase the number of congressional and business meetings
that take place in medium and large cities;
26 Frontier Economics, Atkins, ITS | March 2011
Appendix 1 – High speed railway Madrid –
Barcelona in Spain
Increased tourism causes a significant economic impact on local
services, with or without overnight stays, such as catering, commerce,
urban transport, travel agencies, etc.
The HST can also work as a channel to publicize campaigns and local
events, for example the 2008 International Exhibition in Zaragoza.
New activities
The TAV Madrid – Zaragoza - Barcelona has been running since February 2008.
Thus, it is too early to assess any lasting economic impact caused by the HST on
the two major cities. However, in the case of Zaragoza and Lleida, which have
had HST services since 2003, it is possible to establish a relationship between
some local economic revitalization projects and the HST.
1. Zaragoza: logistics, international events and business land. The arrival of the
LAV was exploited as a tool to develop local socio-economic plans (Plan estratégico
de la ciudad y su entorno –Ebropolis, 1998). The objective was to carry out a thorough
urban and socio-economic transformation of the city of Zaragoza. The
implementation of the infrastructure was accompanied by other important
projects: the 2008 International Exhibition about Water and the consolidation of
PLAZA, a logistics platform.
2. Lleida: the LAV and the technology park. The Agribusiness Science and
Technology Park (Parque Científico y Tecnológico Agroalimentario de Lleida – PCiTAL)
was created in 2005 as a consortium between the University of Lleida and the
Lleida City Council. It was established with the intention of becoming a major
scientific and technological platform in the agribusiness industry in Spain.
Image effects
In terms of image transformation as a consequence of the LAV Madrid –
Barcelona, Zaragoza and Lleida are probably the two Spanish cities that have
benefited the most, even more than Madrid and Barcelona.
In the case of Zaragoza, the arrival of the LAV was used as an instrument
(together with the Expo in 2008 and the logistic platform, PLAZA) to promote
an ambitious urban and socio-economic transformation of the city. According to
a survey by the Employer‟s Confederation of Zaragoza, 91.2% of respondents
believe that the image of the city has improved with the LAV.
In the case of Lleida, a year before the arrival of the LAV, the local Chamber of
Commerce and Lleida City Council released a strategic plan, Plan de Dinamización
del tren de alta velocidad, intended to promote the city as a touristic gateway. Some
of the measures considered in the plan are currently being developed. Also a
marketing campaign was released to reinforce the image of the city of Lleida.
March 2011 | Frontier Economics, Atkins, ITS 27
Appendix 1 – High speed railway Madrid –
Barcelona in Spain
Spatial effects
In Madrid and Barcelona, the implementation of the LAV will have the effect of
converting high-speed train stations into intermodal hubs. For example, the
future Sagrera project will mean an intense process of renewal of the Sant Andreu
district in the north of the city of Barcelona. The Barcelona-Sagrera or Sagrera-
TAV will probably become the most important railway station of Catalonia, the
largest in Spain to international destinations, and the second largets in terms of
national routes.
In Madrid, the project called Operación Chamartin, can easily become one of the
largest urban renewal operations in Europe. It was approved in late 2009 and will
impact over 3 million square meters to be completed in 2023.
The LAV Madrid – Zaragoza – Barcelona has produced the following spatial
effects:
Reinforcement of the two national metropolises, Madrid and Barcelona.
Strengthening Madrid – Barcelona metropolitan dynamics through a
high-speed corridor:
Intensification of the metropolitan dynamics with nearby cities (30
minutes travel time) as Madrid – Guadalajara and Barcelona –
Camps de Tarragona
Inclusion to the metropolitan dynamics of close cities (60 minutes
travel time) as Barcelona – Lleida
Repositioning of large and medium size cities: Zaragoza and Lleida.
Utilisation rates
As requested by the TORs, we have considered the evolution of the utilisation
rates of this project. We have calculated these rates for the last two years, using
the passenger data related to the rail services using the LAV Madrid – Barcelona
provided by RENFE.
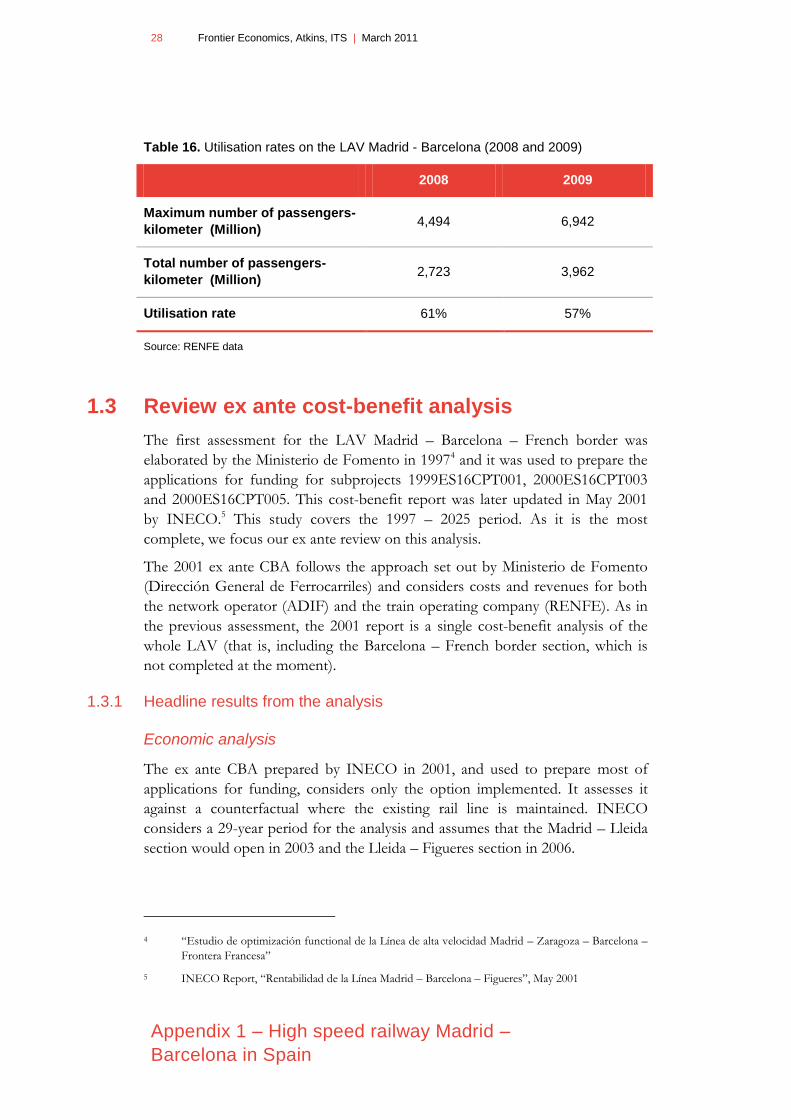
Table 16 shows for the years 2008 and 2009 the maximum capacity available in
passenger-kilometre on the services being provided, the total amount of
passenger-kilometre and the resulting capacity utilisation, equal to 61% in 2008
and 57% in 2009. The contribution to this indicator by the high-speed rail
services using exclusively the LAV Madrid-Barcelona, for example the AVE
Madrid – Barcelona, is equal to 79% in 2008 and 67% in 2009. As mentioned
before, there are other rail services using the LAV Madrid-Barcelona. These
correspond to (i) high-speed rail services using the LAV Madrid-Barcelona and
other LAVs, for example the AVE services between Barcelona and Sevilla; and
(ii) rail services using the LAV and other Iberian standard rail segments, for
example the ALVIA service between Barcelona and Bilbao.
28 Frontier Economics, Atkins, ITS | March 2011
Appendix 1 – High speed railway Madrid –
Barcelona in Spain
Table 16. Utilisation rates on the LAV Madrid - Barcelona (2008 and 2009)
2008 2009
Maximum number of passengers-
kilometer (Million) 4,494 6,942
Total number of passengers-
kilometer (Million) 2,723 3,962
Utilisation rate 61% 57%
Source: RENFE data
1.3 Review ex ante cost-benefit analysis
The first assessment for the LAV Madrid – Barcelona – French border was
elaborated by the Ministerio de Fomento in 19974 and it was used to prepare the
applications for funding for subprojects 1999ES16CPT001, 2000ES16CPT003
and 2000ES16CPT005. This cost-benefit report was later updated in May 2001
by INECO.5 This study covers the 1997 – 2025 period. As it is the most
complete, we focus our ex ante review on this analysis.
The 2001 ex ante CBA follows the approach set out by Ministerio de Fomento
(Dirección General de Ferrocarriles) and considers costs and revenues for both
the network operator (ADIF) and the train operating company (RENFE). As in
the previous assessment, the 2001 report is a single cost-benefit analysis of the
whole LAV (that is, including the Barcelona – French border section, which is
not completed at the moment).
1.3.1 Headline results from the analysis
Economic analysis
The ex ante CBA prepared by INECO in 2001, and used to prepare most of
applications for funding, considers only the option implemented. It assesses it
against a counterfactual where the existing rail line is maintained. INECO
considers a 29-year period for the analysis and assumes that the Madrid – Lleida
section would open in 2003 and the Lleida – Figueres section in 2006.
4 “Estudio de optimización functional de la Línea de alta velocidad Madrid – Zaragoza – Barcelona –
Frontera Francesa”
5 INECO Report, “Rentabilidad de la Línea Madrid – Barcelona – Figueres”, May 2001
March 2011 | Frontier Economics, Atkins, ITS 29
Appendix 1 – High speed railway Madrid –
Barcelona in Spain
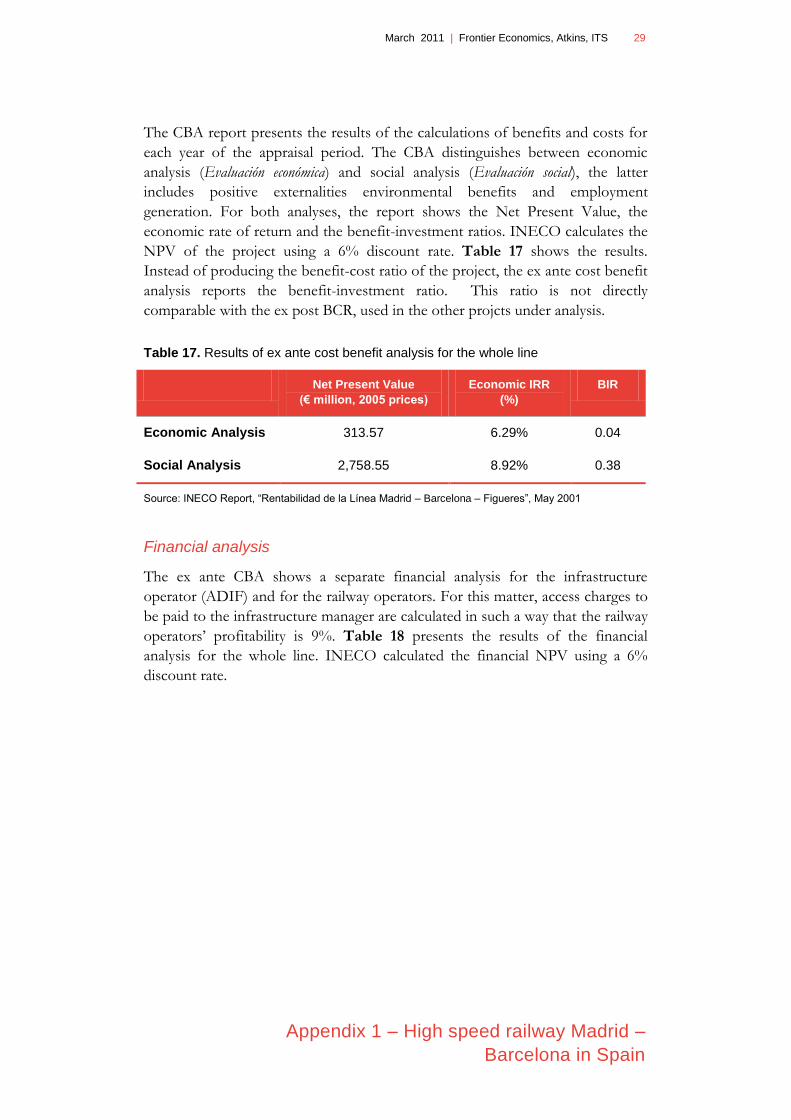
The CBA report presents the results of the calculations of benefits and costs for
each year of the appraisal period. The CBA distinguishes between economic
analysis (Evaluación económica) and social analysis (Evaluación social), the latter
includes positive externalities environmental benefits and employment
generation. For both analyses, the report shows the Net Present Value, the
economic rate of return and the benefit-investment ratios. INECO calculates the
NPV of the project using a 6% discount rate. Table 17 shows the results.
Instead of producing the benefit-cost ratio of the project, the ex ante cost benefit
analysis reports the benefit-investment ratio. This ratio is not directly
comparable with the ex post BCR, used in the other projcts under analysis.
Table 17. Results of ex ante cost benefit analysis for the whole line
Net Present Value
(€ million, 2005 prices)
Economic IRR
(%)
BIR
Economic Analysis 313.57 6.29% 0.04
Social Analysis 2,758.55 8.92% 0.38
Source: INECO Report, “Rentabilidad de la Línea Madrid – Barcelona – Figueres”, May 2001
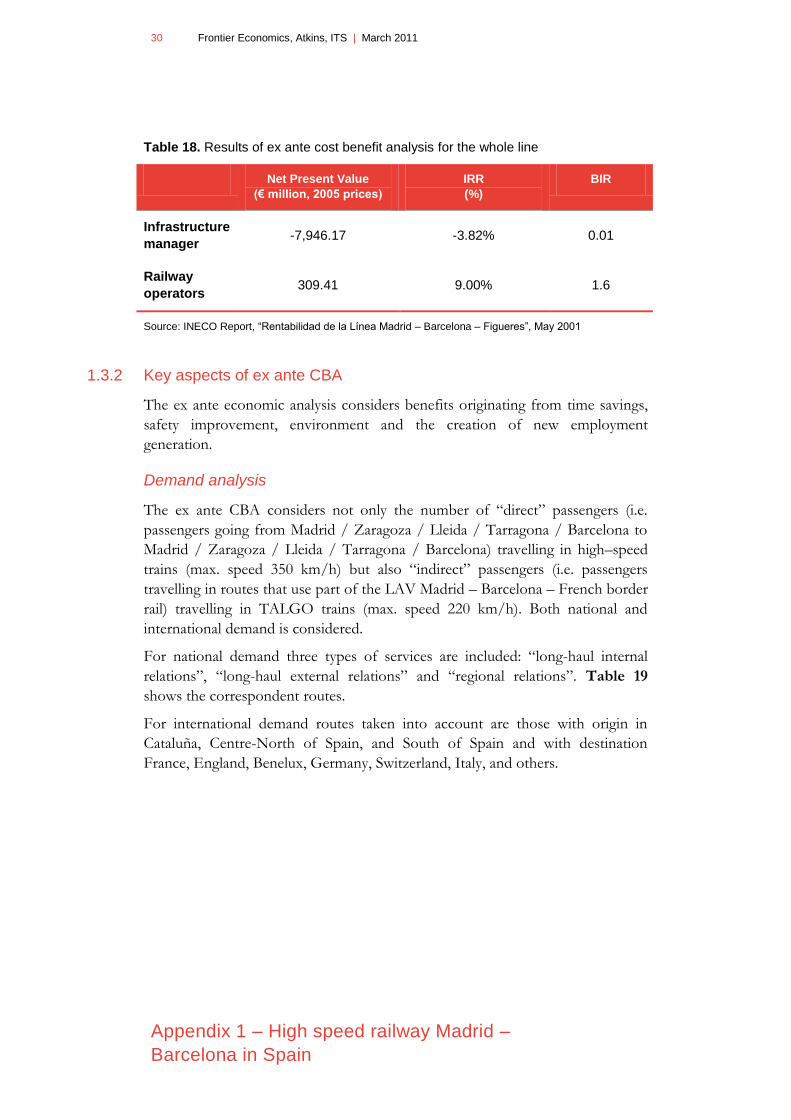
Financial analysis
The ex ante CBA shows a separate financial analysis for the infrastructure
operator (ADIF) and for the railway operators. For this matter, access charges to
be paid to the infrastructure manager are calculated in such a way that the railway
operators‟ profitability is 9%. Table 18 presents the results of the financial
analysis for the whole line. INECO calculated the financial NPV using a 6%
discount rate.
30 Frontier Economics, Atkins, ITS | March 2011
Appendix 1 – High speed railway Madrid –
Barcelona in Spain
Table 18. Results of ex ante cost benefit analysis for the whole line
Net Present Value
(€ million, 2005 prices)
IRR
(%)
BIR
Infrastructure
manager -7,946.17 -3.82% 0.01
Railway
operators 309.41 9.00% 1.6
Source: INECO Report, “Rentabilidad de la Línea Madrid – Barcelona – Figueres”, May 2001
1.3.2 Key aspects of ex ante CBA
The ex ante economic analysis considers benefits originating from time savings,
safety improvement, environment and the creation of new employment
generation.
Demand analysis
The ex ante CBA considers not only the number of “direct” passengers (i.e.
passengers going from Madrid / Zaragoza / Lleida / Tarragona / Barcelona to
Madrid / Zaragoza / Lleida / Tarragona / Barcelona) travelling in high–speed
trains (max. speed 350 km/h) but also “indirect” passengers (i.e. passengers
travelling in routes that use part of the LAV Madrid – Barcelona – French border
rail) travelling in TALGO trains (max. speed 220 km/h). Both national and
international demand is considered.
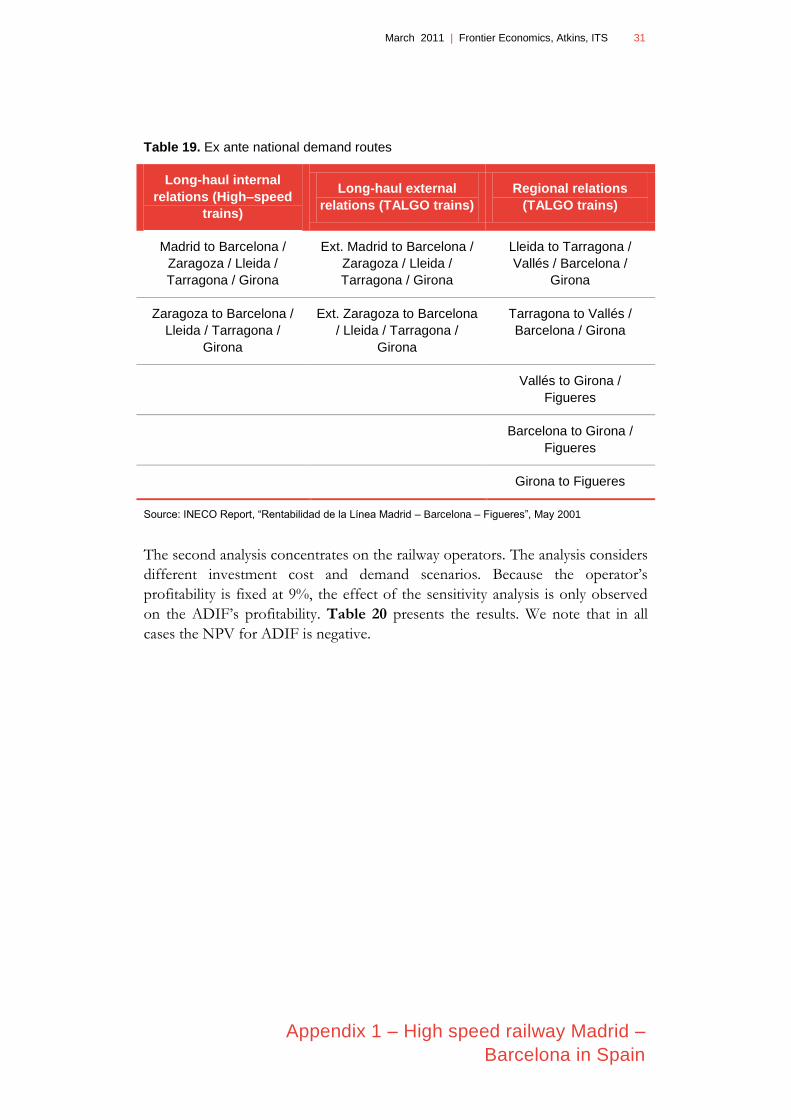
For national demand three types of services are included: “long-haul internal
relations”, “long-haul external relations” and “regional relations”. Table 19
shows the correspondent routes.
For international demand routes taken into account are those with origin in
Cataluña, Centre-North of Spain, and South of Spain and with destination
France, England, Benelux, Germany, Switzerland, Italy, and others.
March 2011 | Frontier Economics, Atkins, ITS 31
Appendix 1 – High speed railway Madrid –
Barcelona in Spain
Table 19. Ex ante national demand routes
Long-haul internal
relations (High–speed
trains)
Long-haul external
relations (TALGO trains)
Regional relations
(TALGO trains)
Madrid to Barcelona /
Zaragoza / Lleida /
Tarragona / Girona
Ext. Madrid to Barcelona /
Zaragoza / Lleida /
Tarragona / Girona
Lleida to Tarragona /
Vallés / Barcelona /
Girona
Zaragoza to Barcelona /
Lleida / Tarragona /
Girona
Ext. Zaragoza to Barcelona
/ Lleida / Tarragona /
Girona
Tarragona to Vallés /
Barcelona / Girona
Vallés to Girona /
Figueres
Barcelona to Girona /
Figueres
Girona to Figueres
Source: INECO Report, “Rentabilidad de la Línea Madrid – Barcelona – Figueres”, May 2001
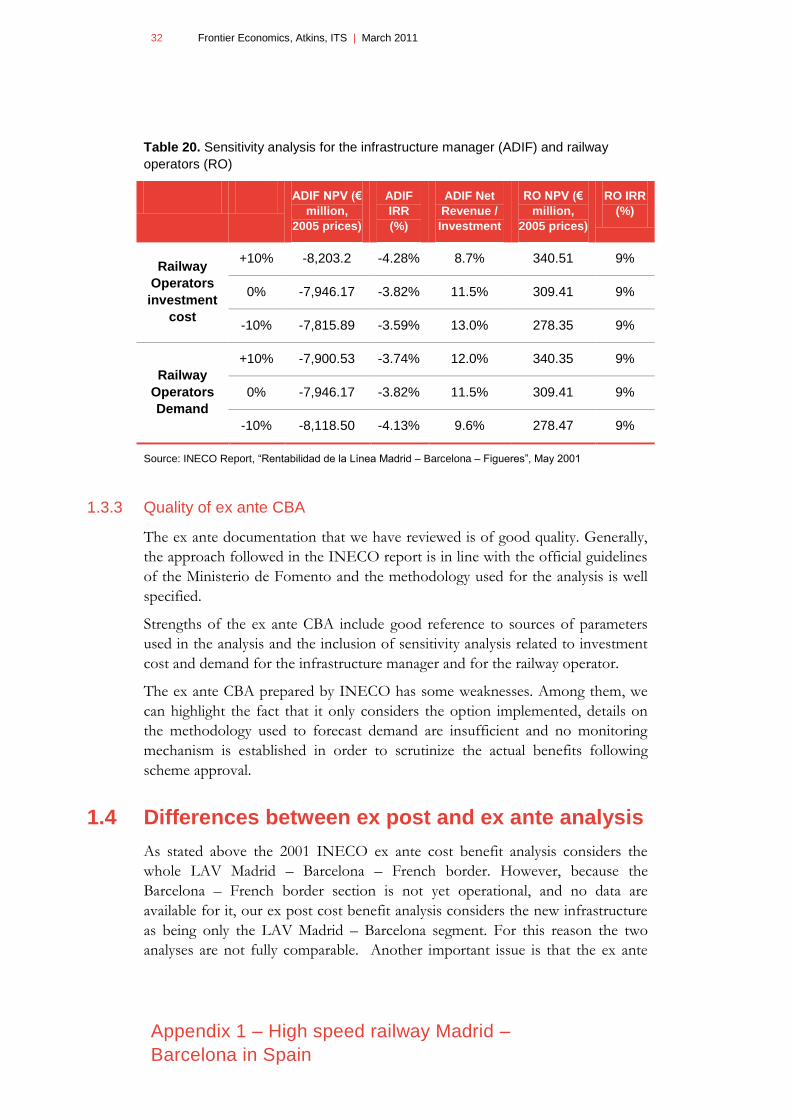
The second analysis concentrates on the railway operators. The analysis considers
different investment cost and demand scenarios. Because the operator‟s
profitability is fixed at 9%, the effect of the sensitivity analysis is only observed
on the ADIF‟s profitability. Table 20 presents the results. We note that in all
cases the NPV for ADIF is negative.
32 Frontier Economics, Atkins, ITS | March 2011
Appendix 1 – High speed railway Madrid –
Barcelona in Spain
Table 20. Sensitivity analysis for the infrastructure manager (ADIF) and railway
operators (RO)
ADIF NPV (€
million,
2005 prices)
ADIF
IRR
(%)
ADIF Net
Revenue /
Investment
RO NPV (€
million,
2005 prices)
RO IRR
(%)
Railway
Operators
investment
cost
+10% -8,203.2 -4.28% 8.7% 340.51 9%
0% -7,946.17 -3.82% 11.5% 309.41 9%
-10% -7,815.89 -3.59% 13.0% 278.35 9%
Railway
Operators
Demand
+10% -7,900.53 -3.74% 12.0% 340.35 9%
0% -7,946.17 -3.82% 11.5% 309.41 9%
-10% -8,118.50 -4.13% 9.6% 278.47 9%
Source: INECO Report, “Rentabilidad de la Línea Madrid – Barcelona – Figueres”, May 2001
1.3.3 Quality of ex ante CBA
The ex ante documentation that we have reviewed is of good quality. Generally,
the approach followed in the INECO report is in line with the official guidelines
of the Ministerio de Fomento and the methodology used for the analysis is well
specified.
Strengths of the ex ante CBA include good reference to sources of parameters
used in the analysis and the inclusion of sensitivity analysis related to investment
cost and demand for the infrastructure manager and for the railway operator.
The ex ante CBA prepared by INECO has some weaknesses. Among them, we
can highlight the fact that it only considers the option implemented, details on
the methodology used to forecast demand are insufficient and no monitoring
mechanism is established in order to scrutinize the actual benefits following
scheme approval.
1.4 Differences between ex post and ex ante analysis
As stated above the 2001 INECO ex ante cost benefit analysis considers the
whole LAV Madrid – Barcelona – French border. However, because the
Barcelona – French border section is not yet operational, and no data are
available for it, our ex post cost benefit analysis considers the new infrastructure
as being only the LAV Madrid – Barcelona segment. For this reason the two
analyses are not fully comparable. Another important issue is that the ex ante
March 2011 | Frontier Economics, Atkins, ITS 33
Appendix 1 – High speed railway Madrid –
Barcelona in Spain
results are obtained considering the 1997–2024 period for the analysis while we
consider the 1997-2033 period.
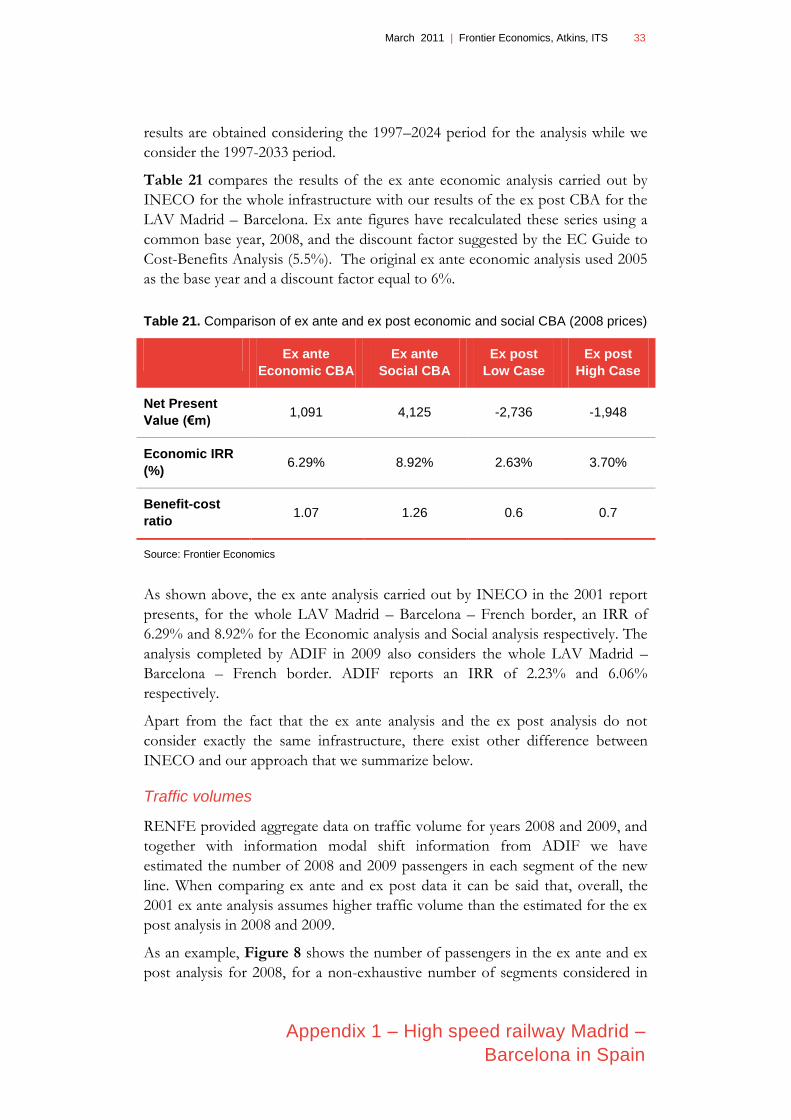
Table 21 compares the results of the ex ante economic analysis carried out by
INECO for the whole infrastructure with our results of the ex post CBA for the
LAV Madrid – Barcelona. Ex ante figures have recalculated these series using a
common base year, 2008, and the discount factor suggested by the EC Guide to
Cost-Benefits Analysis (5.5%). The original ex ante economic analysis used 2005
as the base year and a discount factor equal to 6%.
Table 21. Comparison of ex ante and ex post economic and social CBA (2008 prices)
Ex ante
Economic CBA
Ex ante
Social CBA
Ex post
Low Case
Ex post
High Case
Net Present
Value (€m) 1,091 4,125 -2,736 -1,948
Economic IRR
(%) 6.29% 8.92% 2.63% 3.70%
Benefit-cost
ratio 1.07 1.26 0.6 0.7
Source: Frontier Economics
As shown above, the ex ante analysis carried out by INECO in the 2001 report
presents, for the whole LAV Madrid – Barcelona – French border, an IRR of
6.29% and 8.92% for the Economic analysis and Social analysis respectively. The
analysis completed by ADIF in 2009 also considers the whole LAV Madrid –
Barcelona – French border. ADIF reports an IRR of 2.23% and 6.06%
respectively.
Apart from the fact that the ex ante analysis and the ex post analysis do not
consider exactly the same infrastructure, there exist other difference between
INECO and our approach that we summarize below.
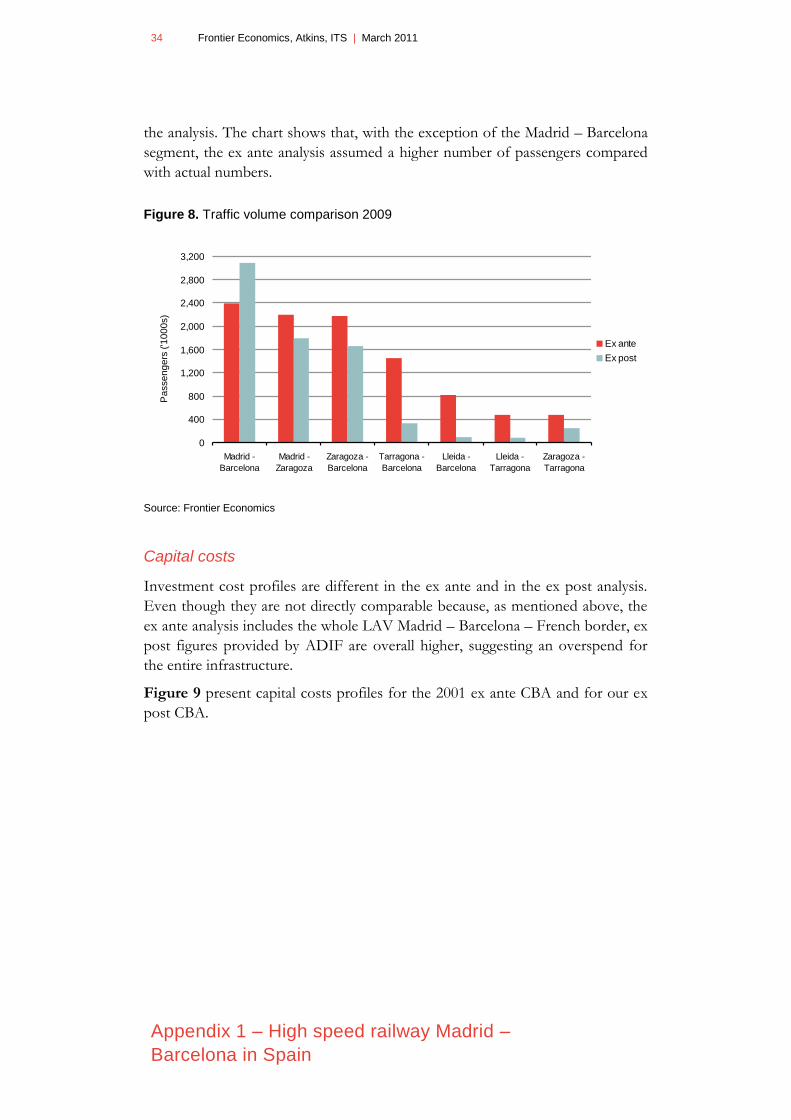
Traffic volumes
RENFE provided aggregate data on traffic volume for years 2008 and 2009, and
together with information modal shift information from ADIF we have
estimated the number of 2008 and 2009 passengers in each segment of the new
line. When comparing ex ante and ex post data it can be said that, overall, the
2001 ex ante analysis assumes higher traffic volume than the estimated for the ex
post analysis in 2008 and 2009.
As an example, Figure 8 shows the number of passengers in the ex ante and ex
post analysis for 2008, for a non-exhaustive number of segments considered in
34 Frontier Economics, Atkins, ITS | March 2011
Appendix 1 – High speed railway Madrid –
Barcelona in Spain
the analysis. The chart shows that, with the exception of the Madrid – Barcelona
segment, the ex ante analysis assumed a higher number of passengers compared
with actual numbers.
Figure 8. Traffic volume comparison 2009
Source: Frontier Economics
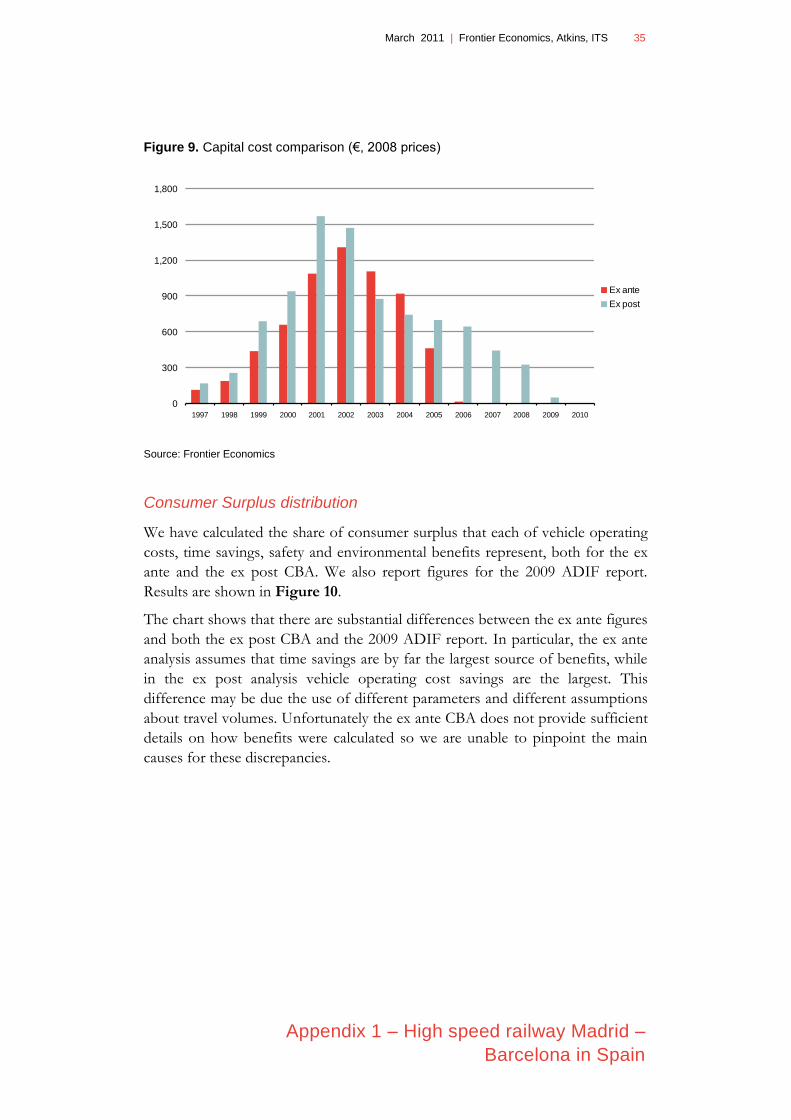
Capital costs
Investment cost profiles are different in the ex ante and in the ex post analysis.
Even though they are not directly comparable because, as mentioned above, the
ex ante analysis includes the whole LAV Madrid – Barcelona – French border, ex
post figures provided by ADIF are overall higher, suggesting an overspend for
the entire infrastructure.
Figure 9 present capital costs profiles for the 2001 ex ante CBA and for our ex
post CBA.
0
400
800
1,200
1,600
2,000
2,400
2,800
3,200
Madrid -
Barcelona
Madrid -
Zaragoza
Zaragoza -
Barcelona
Tarragona -
Barcelona
Lleida -
Barcelona
Lleida -
Tarragona
Zaragoza -
Tarragona
Pa
sse
ng
ers
('1
00
0s)
Ex ante
Ex post
March 2011 | Frontier Economics, Atkins, ITS 35
Appendix 1 – High speed railway Madrid –
Barcelona in Spain
Figure 9. Capital cost comparison (€, 2008 prices)
Source: Frontier Economics
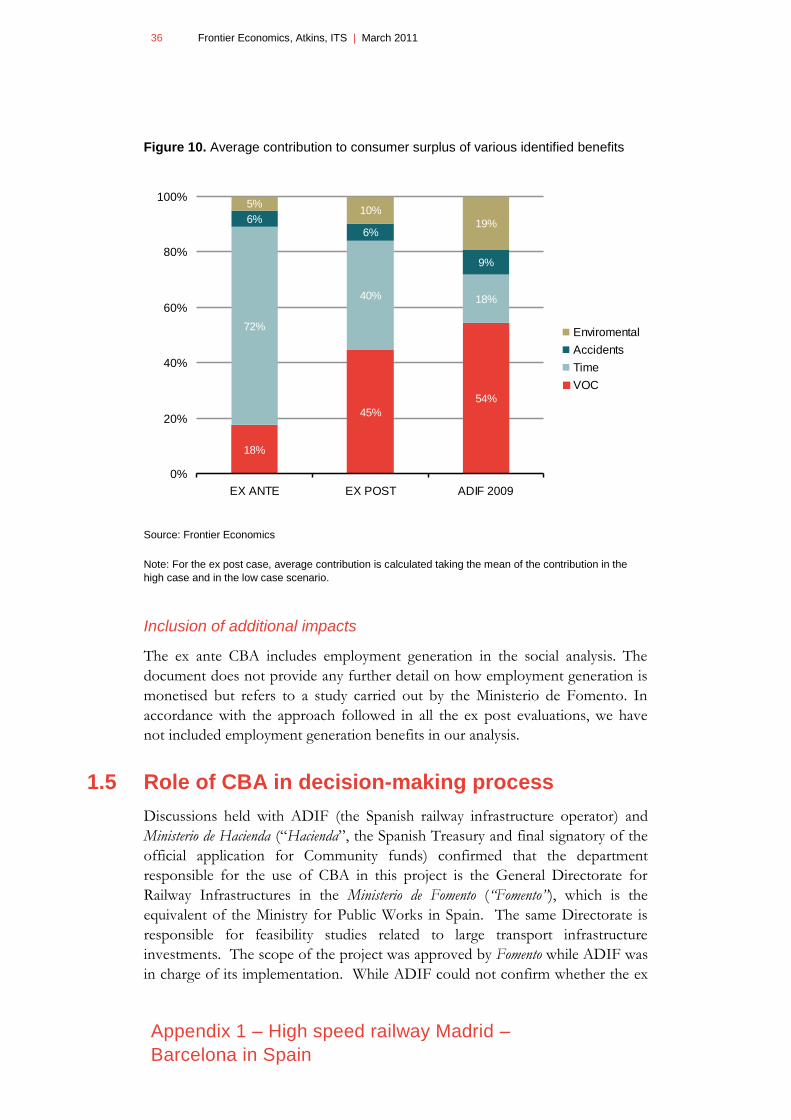
Consumer Surplus distribution
We have calculated the share of consumer surplus that each of vehicle operating
costs, time savings, safety and environmental benefits represent, both for the ex
ante and the ex post CBA. We also report figures for the 2009 ADIF report.
Results are shown in Figure 10.
The chart shows that there are substantial differences between the ex ante figures
and both the ex post CBA and the 2009 ADIF report. In particular, the ex ante
analysis assumes that time savings are by far the largest source of benefits, while
in the ex post analysis vehicle operating cost savings are the largest. This
difference may be due the use of different parameters and different assumptions
about travel volumes. Unfortunately the ex ante CBA does not provide sufficient
details on how benefits were calculated so we are unable to pinpoint the main
causes for these discrepancies.
0
300
600
900
1,200
1,500
1,800
1997 1998 1999 2000 2001 2002 2003 2004 2005 2006 2007 2008 2009 2010
Ex ante
Ex post
36 Frontier Economics, Atkins, ITS | March 2011
Appendix 1 – High speed railway Madrid –
Barcelona in Spain
Figure 10. Average contribution to consumer surplus of various identified benefits
Source: Frontier Economics
Note: For the ex post case, average contribution is calculated taking the mean of the contribution in the
high case and in the low case scenario.
Inclusion of additional impacts
The ex ante CBA includes employment generation in the social analysis. The
document does not provide any further detail on how employment generation is
monetised but refers to a study carried out by the Ministerio de Fomento. In
accordance with the approach followed in all the ex post evaluations, we have
not included employment generation benefits in our analysis.
1.5 Role of CBA in decision-making process
Discussions held with ADIF (the Spanish railway infrastructure operator) and
Ministerio de Hacienda (“Hacienda”, the Spanish Treasury and final signatory of the
official application for Community funds) confirmed that the department
responsible for the use of CBA in this project is the General Directorate for
Railway Infrastructures in the Ministerio de Fomento (“Fomento”), which is the
equivalent of the Ministry for Public Works in Spain. The same Directorate is
responsible for feasibility studies related to large transport infrastructure
investments. The scope of the project was approved by Fomento while ADIF was
in charge of its implementation. While ADIF could not confirm whether the ex
18%
45%
54%
72%
40% 18%
6%
6%
9%
5%10%
19%
0%
20%
40%
60%
80%
100%
EX ANTE EX POST ADIF 2009
Enviromental
Accidents
Time
VOC
March 2011 | Frontier Economics, Atkins, ITS 37
Appendix 1 – High speed railway Madrid –
Barcelona in Spain
ante CBA of the AVE Madrid-Barcelona investment was audited, Hacienda
confirmed that the European Investment Bank (EIB) were a co-financing party
of the AVE Madrid-Barcelona high speed infrastructure. EIB reviewed and
audited the CBA of the project as part of their standard project appraisal due
diligence.
The preparation of the business case for the project, including the ex ante CBA,
largely followed the CBA technical methodologies developed by Fomento,
including an Investment Manual (2000, 2009). Hacienda played a special role in
estimating the funding gap in the business case taking account of the availability
of financing sources (Community funds and expected commercial revenues) and
the budgetary limits imposed by the state of Spanish public finance management.
Hacienda also acted as a quality filter in the project preparation ensuring
compliance of the project proposal with the relevant Community funding criteria.
ADIF confirmed that the 2009 version of the Investment Manual adopts the
recommendations of the Commission, in particular those in DG Regio‟s 2008
CBA Guidelines. The Investment Manual also benefits from the experience
gathered over recent years; for example, it includes benefit and cost parameters
and unit cost estimates. Both ADIF and Hacienda mentioned that the only
difference they noticed was the value of the discount rate, which has decreased to
5.5% for the economic analysis and to 5% for the financial analysis.
ADIF works with the ex ante CBA model prepared by Fomento and is in charge of
reviewing the demand and cost estimates as the project gets implemented.
Hacienda confirmed the existence of a Project Monitoring Committee (including
as members relevant Commission officials and Spanish civil servants) for all large
transport and environmental projects co-financed with Community funding,
which met twice a year at the beginning of the AVE project implementation and
annually afterwards. This Committee oversaw project implementation and
discussed critical issues (e.g., environmental impact in the case of the AVE
Madrid-Barcelona project)
ADIF claimed that the updating of the financial and economic model translates
into reduced uncertainty regarding demand figures and total costs. Both ADIF
and Hacienda did not provide details abut acknowledged that unforeseen events
related to the technical complexities of the project (e.g. geological risks related to
soil conditions or access to Barcelona Sants railway station) resulted in some
differences between projected and out-turn costs and forecasts.
Finally, while ADIF could not comment on the uses of ex ante CBA by Fomento,
they confirmed that, in addition to ex ante CBA, Fomento also commissions
studies which us a multi-criteria methodology. Hacienda, on the other hand,
confirmed that CBA was used in the AVE Madrid-Barcelona project to assess
alternative route alignments in relation to the mitigation of environmental
impacts. Hacienda confirmed that project selection follows project size and

38 Frontier Economics, Atkins, ITS | March 2011
Appendix 1 – High speed railway Madrid –
Barcelona in Spain
political criteria after which CBA is used to inform the economic feasibility
studies and to identify critical issues such as environmental impacts.
March 2011 | Frontier Economics, Atkins, ITS 39
Annexe 1: Detailed results
Annexe 1: Detailed results
High speed railway Madrid–Barcelona in Spain
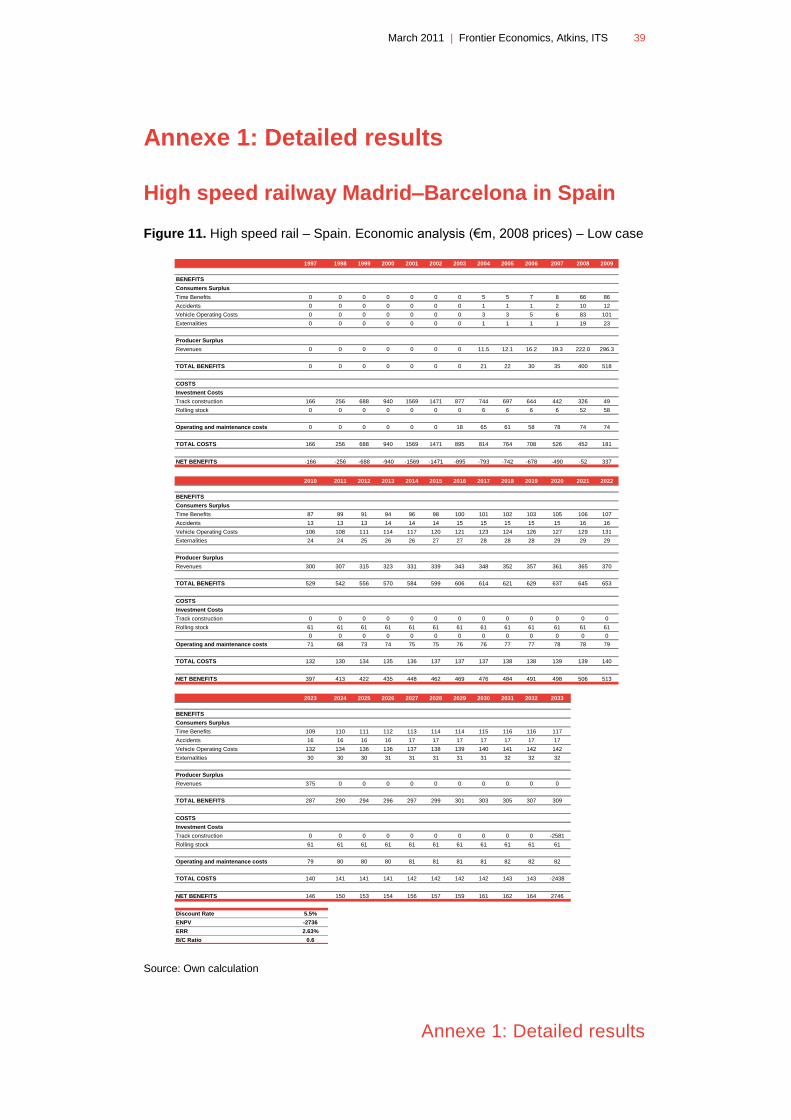
Figure 11. High speed rail – Spain. Economic analysis (€m, 2008 prices) – Low case
Source: Own calculation
1997 1998 1999 2000 2001 2002 2003 2004 2005 2006 2007 2008 2009
BENEFITS
Consumers Surplus
Time Benefits 0 0 0 0 0 0 0 5 5 7 8 66 86
Accidents 0 0 0 0 0 0 0 1 1 1 2 10 12
Vehicle Operating Costs 0 0 0 0 0 0 0 3 3 5 6 83 101
Externalities 0 0 0 0 0 0 0 1 1 1 1 19 23
Producer Surplus
Revenues 0 0 0 0 0 0 0 11.5 12.1 16.2 19.3 222.0 296.3
TOTAL BENEFITS 0 0 0 0 0 0 0 21 22 30 35 400 518
COSTS
Investment Costs
Track construction 166 256 688 940 1569 1471 877 744 697 644 442 326 49
Rolling stock 0 0 0 0 0 0 0 6 6 6 6 52 58
Operating and maintenance costs 0 0 0 0 0 0 18 65 61 58 78 74 74
TOTAL COSTS 166 256 688 940 1569 1471 895 814 764 708 526 452 181
NET BENEFITS -166 -256 -688 -940 -1569 -1471 -895 -793 -742 -678 -490 -52 337
2010 2011 2012 2013 2014 2015 2016 2017 2018 2019 2020 2021 2022
BENEFITS
Consumers Surplus
Time Benefits 87 89 91 94 96 98 100 101 102 103 105 106 107
Accidents 13 13 13 14 14 14 15 15 15 15 15 16 16
Vehicle Operating Costs 106 108 111 114 117 120 121 123 124 126 127 129 131
Externalities 24 24 25 26 26 27 27 28 28 28 29 29 29
Producer Surplus
Revenues 300 307 315 323 331 339 343 348 352 357 361 365 370
TOTAL BENEFITS 529 542 556 570 584 599 606 614 621 629 637 645 653
COSTS
Investment Costs
Track construction 0 0 0 0 0 0 0 0 0 0 0 0 0
Rolling stock 61 61 61 61 61 61 61 61 61 61 61 61 61
0 0 0 0 0 0 0 0 0 0 0 0 0
Operating and maintenance costs 71 68 73 74 75 75 76 76 77 77 78 78 79
TOTAL COSTS 132 130 134 135 136 137 137 137 138 138 139 139 140
NET BENEFITS 397 413 422 435 448 462 469 476 484 491 498 506 513
2023 2024 2025 2026 2027 2028 2029 2030 2031 2032 2033
BENEFITS
Consumers Surplus
Time Benefits 109 110 111 112 113 114 114 115 116 116 117
Accidents 16 16 16 16 17 17 17 17 17 17 17
Vehicle Operating Costs 132 134 136 136 137 138 139 140 141 142 142
Externalities 30 30 30 31 31 31 31 31 32 32 32
Producer Surplus
Revenues 375 0 0 0 0 0 0 0 0 0 0
TOTAL BENEFITS 287 290 294 296 297 299 301 303 305 307 309
COSTS
Investment Costs
Track construction 0 0 0 0 0 0 0 0 0 0 -2581
Rolling stock 61 61 61 61 61 61 61 61 61 61 61
Operating and maintenance costs 79 80 80 80 81 81 81 81 82 82 82
TOTAL COSTS 140 141 141 141 142 142 142 142 143 143 -2438
NET BENEFITS 146 150 153 154 156 157 159 161 162 164 2746
Discount Rate 5.5%
ENPV -2736
ERR 2.63%
B/C Ratio 0.6
40 Frontier Economics, Atkins, ITS | March 2011
Annexe 1: Detailed results
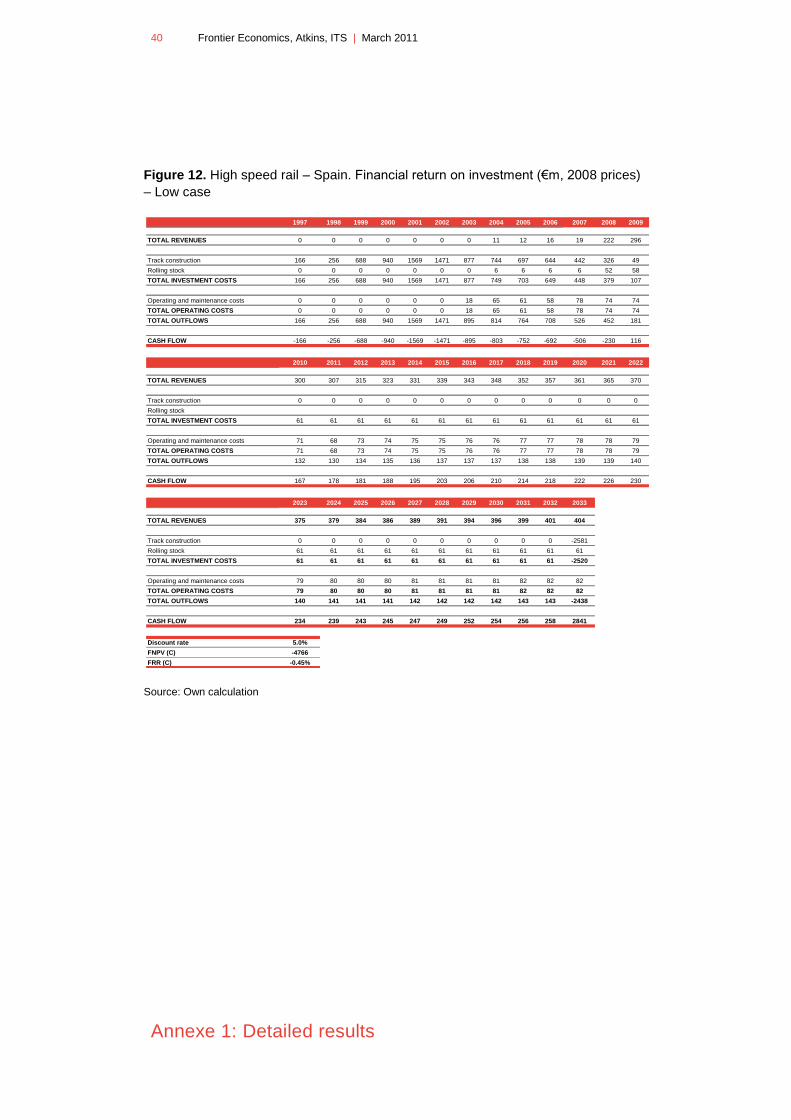
Figure 12. High speed rail – Spain. Financial return on investment (€m, 2008 prices)
– Low case
Source: Own calculation
1997 1998 1999 2000 2001 2002 2003 2004 2005 2006 2007 2008 2009
TOTAL REVENUES 0 0 0 0 0 0 0 11 12 16 19 222 296
Track construction 166 256 688 940 1569 1471 877 744 697 644 442 326 49
Rolling stock 0 0 0 0 0 0 0 6 6 6 6 52 58
TOTAL INVESTMENT COSTS 166 256 688 940 1569 1471 877 749 703 649 448 379 107
Operating and maintenance costs 0 0 0 0 0 0 18 65 61 58 78 74 74
TOTAL OPERATING COSTS 0 0 0 0 0 0 18 65 61 58 78 74 74
TOTAL OUTFLOWS 166 256 688 940 1569 1471 895 814 764 708 526 452 181
CASH FLOW -166 -256 -688 -940 -1569 -1471 -895 -803 -752 -692 -506 -230 116
2010 2011 2012 2013 2014 2015 2016 2017 2018 2019 2020 2021 2022
TOTAL REVENUES 300 307 315 323 331 339 343 348 352 357 361 365 370
Track construction 0 0 0 0 0 0 0 0 0 0 0 0 0
Rolling stock
TOTAL INVESTMENT COSTS 61 61 61 61 61 61 61 61 61 61 61 61 61
Operating and maintenance costs 71 68 73 74 75 75 76 76 77 77 78 78 79
TOTAL OPERATING COSTS 71 68 73 74 75 75 76 76 77 77 78 78 79
TOTAL OUTFLOWS 132 130 134 135 136 137 137 137 138 138 139 139 140
CASH FLOW 167 178 181 188 195 203 206 210 214 218 222 226 230
2023 2024 2025 2026 2027 2028 2029 2030 2031 2032 2033
TOTAL REVENUES 375 379 384 386 389 391 394 396 399 401 404
Track construction 0 0 0 0 0 0 0 0 0 0 -2581
Rolling stock 61 61 61 61 61 61 61 61 61 61 61
TOTAL INVESTMENT COSTS 61 61 61 61 61 61 61 61 61 61 -2520
Operating and maintenance costs 79 80 80 80 81 81 81 81 82 82 82
TOTAL OPERATING COSTS 79 80 80 80 81 81 81 81 82 82 82
TOTAL OUTFLOWS 140 141 141 141 142 142 142 142 143 143 -2438
CASH FLOW 234 239 243 245 247 249 252 254 256 258 2841
Discount rate 5.0%
FNPV (C) -4766
FRR (C) -0.45%
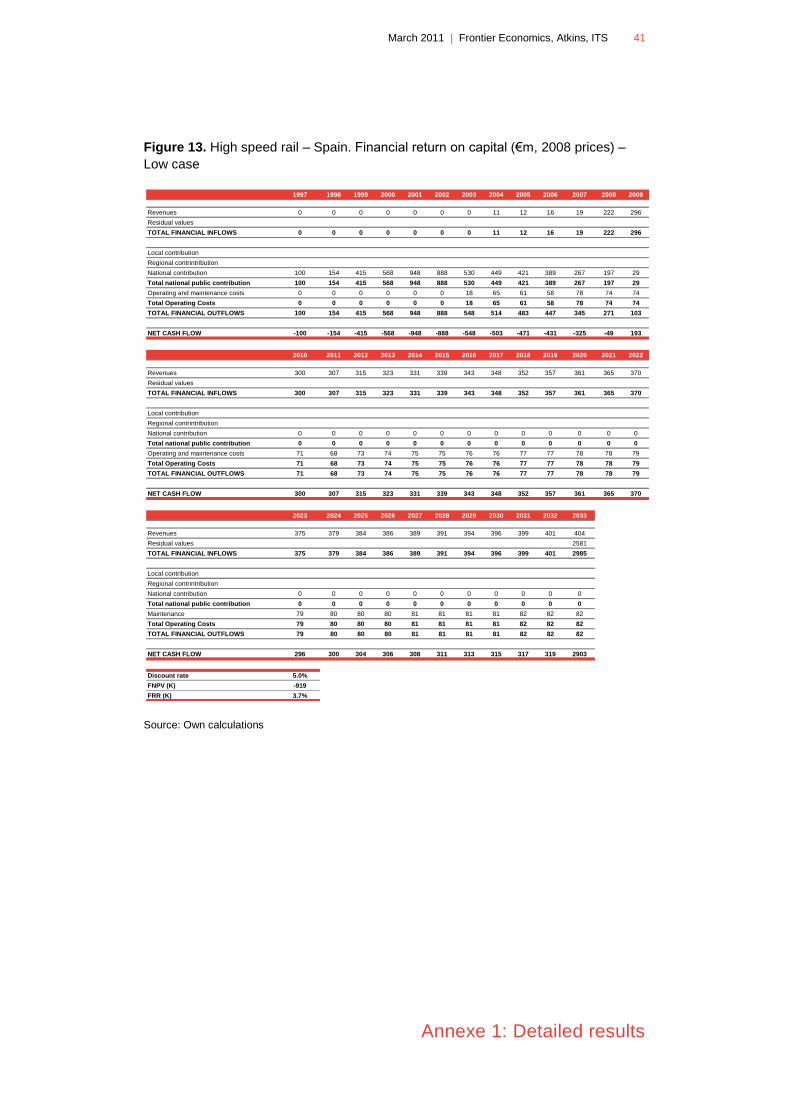
March 2011 | Frontier Economics, Atkins, ITS 41
Annexe 1: Detailed results
Figure 13. High speed rail – Spain. Financial return on capital (€m, 2008 prices) –
Low case
Source: Own calculations
1997 1998 1999 2000 2001 2002 2003 2004 2005 2006 2007 2008 2009
Revenues 0 0 0 0 0 0 0 11 12 16 19 222 296
Residual values
TOTAL FINANCIAL INFLOWS 0 0 0 0 0 0 0 11 12 16 19 222 296
Local contribution
Regional contrintribution
National contribution 100 154 415 568 948 888 530 449 421 389 267 197 29
Total national public contribution 100 154 415 568 948 888 530 449 421 389 267 197 29
Operating and maintenance costs 0 0 0 0 0 0 18 65 61 58 78 74 74
Total Operating Costs 0 0 0 0 0 0 18 65 61 58 78 74 74
TOTAL FINANCIAL OUTFLOWS 100 154 415 568 948 888 548 514 483 447 345 271 103
NET CASH FLOW -100 -154 -415 -568 -948 -888 -548 -503 -471 -431 -325 -49 193
2010 2011 2012 2013 2014 2015 2016 2017 2018 2019 2020 2021 2022
Revenues 300 307 315 323 331 339 343 348 352 357 361 365 370
Residual values
TOTAL FINANCIAL INFLOWS 300 307 315 323 331 339 343 348 352 357 361 365 370
Local contribution
Regional contrintribution
National contribution 0 0 0 0 0 0 0 0 0 0 0 0 0
Total national public contribution 0 0 0 0 0 0 0 0 0 0 0 0 0
Operating and maintenance costs 71 68 73 74 75 75 76 76 77 77 78 78 79
Total Operating Costs 71 68 73 74 75 75 76 76 77 77 78 78 79
TOTAL FINANCIAL OUTFLOWS 71 68 73 74 75 75 76 76 77 77 78 78 79
NET CASH FLOW 300 307 315 323 331 339 343 348 352 357 361 365 370
2023 2024 2025 2026 2027 2028 2029 2030 2031 2032 2033
Revenues 375 379 384 386 389 391 394 396 399 401 404
Residual values 2581
TOTAL FINANCIAL INFLOWS 375 379 384 386 389 391 394 396 399 401 2985
Local contribution
Regional contrintribution
National contribution 0 0 0 0 0 0 0 0 0 0 0
Total national public contribution 0 0 0 0 0 0 0 0 0 0 0
Maintenance 79 80 80 80 81 81 81 81 82 82 82
Total Operating Costs 79 80 80 80 81 81 81 81 82 82 82
TOTAL FINANCIAL OUTFLOWS 79 80 80 80 81 81 81 81 82 82 82
NET CASH FLOW 296 300 304 306 308 311 313 315 317 319 2903
Discount rate 5.0%
FNPV (K) -919
FRR (K) 3.7%
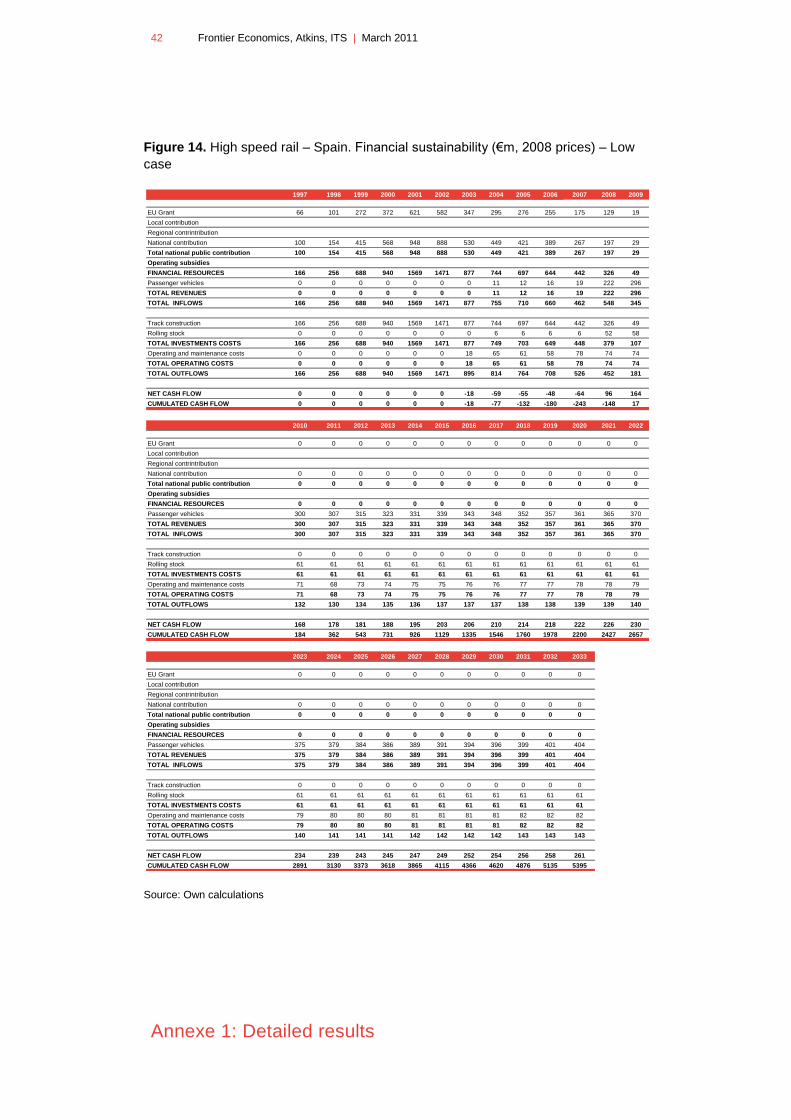
42 Frontier Economics, Atkins, ITS | March 2011
Annexe 1: Detailed results
Figure 14. High speed rail – Spain. Financial sustainability (€m, 2008 prices) – Low
case
Source: Own calculations
1997 1998 1999 2000 2001 2002 2003 2004 2005 2006 2007 2008 2009
EU Grant 66 101 272 372 621 582 347 295 276 255 175 129 19
Local contribution
Regional contrintribution
National contribution 100 154 415 568 948 888 530 449 421 389 267 197 29
Total national public contribution 100 154 415 568 948 888 530 449 421 389 267 197 29
Operating subsidies
FINANCIAL RESOURCES 166 256 688 940 1569 1471 877 744 697 644 442 326 49
Passenger vehicles 0 0 0 0 0 0 0 11 12 16 19 222 296
TOTAL REVENUES 0 0 0 0 0 0 0 11 12 16 19 222 296
TOTAL INFLOWS 166 256 688 940 1569 1471 877 755 710 660 462 548 345
Track construction 166 256 688 940 1569 1471 877 744 697 644 442 326 49
Rolling stock 0 0 0 0 0 0 0 6 6 6 6 52 58
TOTAL INVESTMENTS COSTS 166 256 688 940 1569 1471 877 749 703 649 448 379 107
Operating and maintenance costs 0 0 0 0 0 0 18 65 61 58 78 74 74
TOTAL OPERATING COSTS 0 0 0 0 0 0 18 65 61 58 78 74 74
TOTAL OUTFLOWS 166 256 688 940 1569 1471 895 814 764 708 526 452 181
NET CASH FLOW 0 0 0 0 0 0 -18 -59 -55 -48 -64 96 164
CUMULATED CASH FLOW 0 0 0 0 0 0 -18 -77 -132 -180 -243 -148 17
2010 2011 2012 2013 2014 2015 2016 2017 2018 2019 2020 2021 2022
EU Grant 0 0 0 0 0 0 0 0 0 0 0 0 0
Local contribution
Regional contrintribution
National contribution 0 0 0 0 0 0 0 0 0 0 0 0 0
Total national public contribution 0 0 0 0 0 0 0 0 0 0 0 0 0
Operating subsidies
FINANCIAL RESOURCES 0 0 0 0 0 0 0 0 0 0 0 0 0
Passenger vehicles 300 307 315 323 331 339 343 348 352 357 361 365 370
TOTAL REVENUES 300 307 315 323 331 339 343 348 352 357 361 365 370
TOTAL INFLOWS 300 307 315 323 331 339 343 348 352 357 361 365 370
Track construction 0 0 0 0 0 0 0 0 0 0 0 0 0
Rolling stock 61 61 61 61 61 61 61 61 61 61 61 61 61
TOTAL INVESTMENTS COSTS 61 61 61 61 61 61 61 61 61 61 61 61 61
Operating and maintenance costs 71 68 73 74 75 75 76 76 77 77 78 78 79
TOTAL OPERATING COSTS 71 68 73 74 75 75 76 76 77 77 78 78 79
TOTAL OUTFLOWS 132 130 134 135 136 137 137 137 138 138 139 139 140
NET CASH FLOW 168 178 181 188 195 203 206 210 214 218 222 226 230
CUMULATED CASH FLOW 184 362 543 731 926 1129 1335 1546 1760 1978 2200 2427 2657
2023 2024 2025 2026 2027 2028 2029 2030 2031 2032 2033
EU Grant 0 0 0 0 0 0 0 0 0 0 0
Local contribution
Regional contrintribution
National contribution 0 0 0 0 0 0 0 0 0 0 0
Total national public contribution 0 0 0 0 0 0 0 0 0 0 0
Operating subsidies
FINANCIAL RESOURCES 0 0 0 0 0 0 0 0 0 0 0
Passenger vehicles 375 379 384 386 389 391 394 396 399 401 404
TOTAL REVENUES 375 379 384 386 389 391 394 396 399 401 404
TOTAL INFLOWS 375 379 384 386 389 391 394 396 399 401 404
Track construction 0 0 0 0 0 0 0 0 0 0 0
Rolling stock 61 61 61 61 61 61 61 61 61 61 61
TOTAL INVESTMENTS COSTS 61 61 61 61 61 61 61 61 61 61 61
Operating and maintenance costs 79 80 80 80 81 81 81 81 82 82 82
TOTAL OPERATING COSTS 79 80 80 80 81 81 81 81 82 82 82
TOTAL OUTFLOWS 140 141 141 141 142 142 142 142 143 143 143
NET CASH FLOW 234 239 243 245 247 249 252 254 256 258 261
CUMULATED CASH FLOW 2891 3130 3373 3618 3865 4115 4366 4620 4876 5135 5395
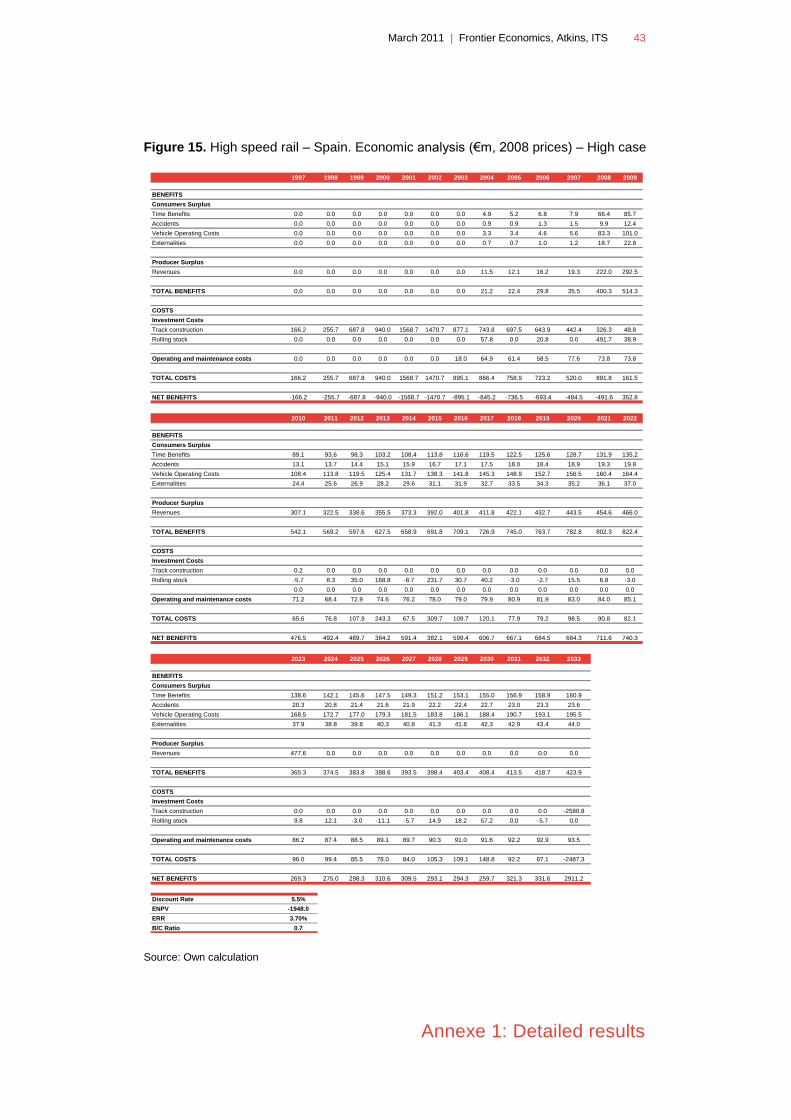
March 2011 | Frontier Economics, Atkins, ITS 43
Annexe 1: Detailed results
Figure 15. High speed rail – Spain. Economic analysis (€m, 2008 prices) – High case
Source: Own calculation
1997 1998 1999 2000 2001 2002 2003 2004 2005 2006 2007 2008 2009
BENEFITS
Consumers Surplus
Time Benefits 0.0 0.0 0.0 0.0 0.0 0.0 0.0 4.9 5.2 6.8 7.9 66.4 85.7
Accidents 0.0 0.0 0.0 0.0 0.0 0.0 0.0 0.9 0.9 1.3 1.5 9.9 12.4
Vehicle Operating Costs 0.0 0.0 0.0 0.0 0.0 0.0 0.0 3.3 3.4 4.6 5.6 83.3 101.0
Externalities 0.0 0.0 0.0 0.0 0.0 0.0 0.0 0.7 0.7 1.0 1.2 18.7 22.8
Producer Surplus
Revenues 0.0 0.0 0.0 0.0 0.0 0.0 0.0 11.5 12.1 16.2 19.3 222.0 292.5
TOTAL BENEFITS 0.0 0.0 0.0 0.0 0.0 0.0 0.0 21.2 22.4 29.8 35.5 400.3 514.3
COSTS
Investment Costs
Track construction 166.2 255.7 687.8 940.0 1568.7 1470.7 877.1 743.8 697.5 643.9 442.4 326.3 48.8
Rolling stock 0.0 0.0 0.0 0.0 0.0 0.0 0.0 57.8 0.0 20.8 0.0 491.7 38.9
Operating and maintenance costs 0.0 0.0 0.0 0.0 0.0 0.0 18.0 64.9 61.4 58.5 77.6 73.8 73.8
TOTAL COSTS 166.2 255.7 687.8 940.0 1568.7 1470.7 895.1 866.4 758.9 723.2 520.0 891.8 161.5
NET BENEFITS -166.2 -255.7 -687.8 -940.0 -1568.7 -1470.7 -895.1 -845.2 -736.5 -693.4 -484.5 -491.6 352.8
2010 2011 2012 2013 2014 2015 2016 2017 2018 2019 2020 2021 2022
BENEFITS
Consumers Surplus
Time Benefits 89.1 93.6 98.3 103.2 108.4 113.8 116.6 119.5 122.5 125.6 128.7 131.9 135.2
Accidents 13.1 13.7 14.4 15.1 15.9 16.7 17.1 17.5 18.0 18.4 18.9 19.3 19.8
Vehicle Operating Costs 108.4 113.8 119.5 125.4 131.7 138.3 141.8 145.3 148.9 152.7 156.5 160.4 164.4
Externalities 24.4 25.6 26.9 28.2 29.6 31.1 31.9 32.7 33.5 34.3 35.2 36.1 37.0
Producer Surplus
Revenues 307.1 322.5 338.6 355.5 373.3 392.0 401.8 411.8 422.1 432.7 443.5 454.6 466.0
TOTAL BENEFITS 542.1 569.2 597.6 627.5 658.9 691.8 709.1 726.9 745.0 763.7 782.8 802.3 822.4
COSTS
Investment Costs
Track construction 0.2 0.0 0.0 0.0 0.0 0.0 0.0 0.0 0.0 0.0 0.0 0.0 0.0
Rolling stock -5.7 8.3 35.0 168.8 -8.7 231.7 30.7 40.2 -3.0 -2.7 15.5 6.8 -3.0
0.0 0.0 0.0 0.0 0.0 0.0 0.0 0.0 0.0 0.0 0.0 0.0 0.0
Operating and maintenance costs 71.2 68.4 72.9 74.6 76.2 78.0 79.0 79.9 80.9 81.9 83.0 84.0 85.1
TOTAL COSTS 65.6 76.8 107.9 243.3 67.5 309.7 109.7 120.1 77.9 79.2 98.5 90.8 82.1
NET BENEFITS 476.5 492.4 489.7 384.2 591.4 382.1 599.4 606.7 667.1 684.5 684.3 711.6 740.3
2023 2024 2025 2026 2027 2028 2029 2030 2031 2032 2033
BENEFITS
Consumers Surplus
Time Benefits 138.6 142.1 145.6 147.5 149.3 151.2 153.1 155.0 156.9 158.9 160.9
Accidents 20.3 20.8 21.4 21.6 21.9 22.2 22.4 22.7 23.0 23.3 23.6
Vehicle Operating Costs 168.5 172.7 177.0 179.3 181.5 183.8 186.1 188.4 190.7 193.1 195.5
Externalities 37.9 38.8 39.8 40.3 40.8 41.3 41.8 42.3 42.9 43.4 44.0
Producer Surplus
Revenues 477.6 0.0 0.0 0.0 0.0 0.0 0.0 0.0 0.0 0.0 0.0
TOTAL BENEFITS 365.3 374.5 383.8 388.6 393.5 398.4 403.4 408.4 413.5 418.7 423.9
COSTS
Investment Costs
Track construction 0.0 0.0 0.0 0.0 0.0 0.0 0.0 0.0 0.0 0.0 -2580.8
Rolling stock 9.8 12.1 -3.0 -11.1 -5.7 14.9 18.2 57.2 0.0 -5.7 0.0
Operating and maintenance costs 86.2 87.4 88.5 89.1 89.7 90.3 91.0 91.6 92.2 92.9 93.5
TOTAL COSTS 96.0 99.4 85.5 78.0 84.0 105.3 109.1 148.8 92.2 87.1 -2487.3
NET BENEFITS 269.3 275.0 298.3 310.6 309.5 293.1 294.3 259.7 321.3 331.6 2911.2
Discount Rate 5.5%
ENPV -1948.0
ERR 3.70%
B/C Ratio 0.7
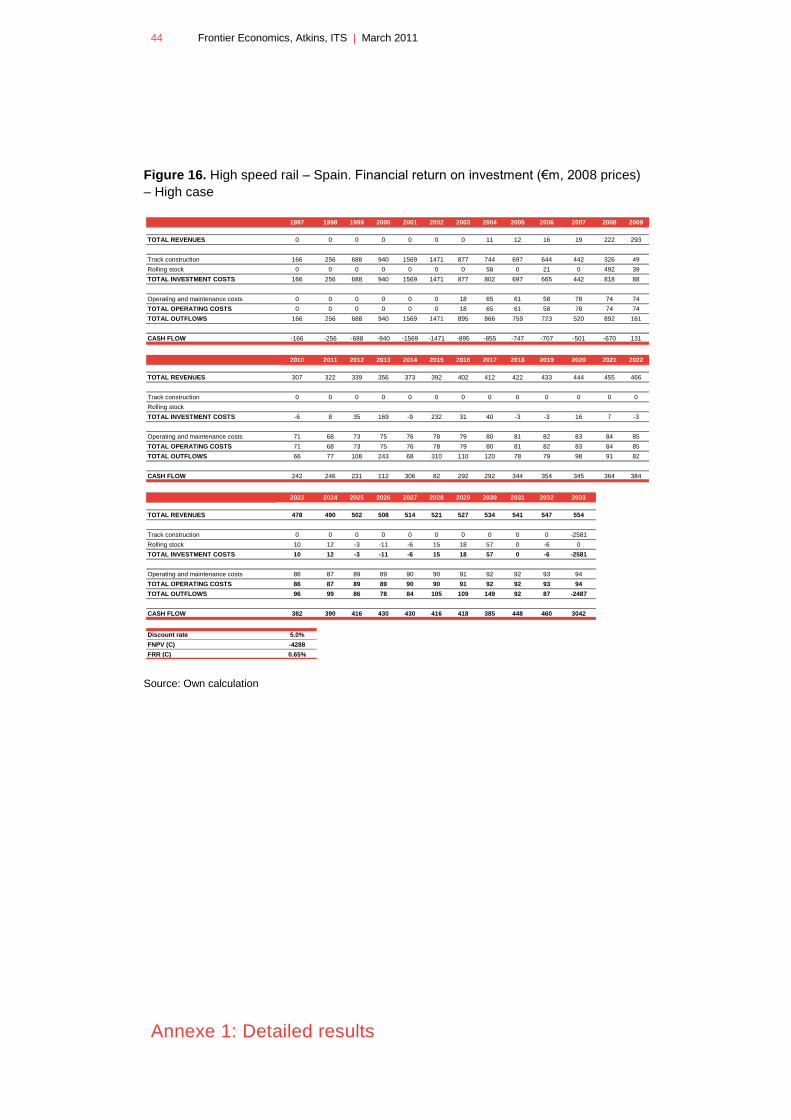
44 Frontier Economics, Atkins, ITS | March 2011
Annexe 1: Detailed results
Figure 16. High speed rail – Spain. Financial return on investment (€m, 2008 prices)
– High case
Source: Own calculation
1997 1998 1999 2000 2001 2002 2003 2004 2005 2006 2007 2008 2009
TOTAL REVENUES 0 0 0 0 0 0 0 11 12 16 19 222 293
Track construction 166 256 688 940 1569 1471 877 744 697 644 442 326 49
Rolling stock 0 0 0 0 0 0 0 58 0 21 0 492 39
TOTAL INVESTMENT COSTS 166 256 688 940 1569 1471 877 802 697 665 442 818 88
Operating and maintenance costs 0 0 0 0 0 0 18 65 61 58 78 74 74
TOTAL OPERATING COSTS 0 0 0 0 0 0 18 65 61 58 78 74 74
TOTAL OUTFLOWS 166 256 688 940 1569 1471 895 866 759 723 520 892 161
CASH FLOW -166 -256 -688 -940 -1569 -1471 -895 -855 -747 -707 -501 -670 131
2010 2011 2012 2013 2014 2015 2016 2017 2018 2019 2020 2021 2022
TOTAL REVENUES 307 322 339 356 373 392 402 412 422 433 444 455 466
Track construction 0 0 0 0 0 0 0 0 0 0 0 0 0
Rolling stock
TOTAL INVESTMENT COSTS -6 8 35 169 -9 232 31 40 -3 -3 16 7 -3
Operating and maintenance costs 71 68 73 75 76 78 79 80 81 82 83 84 85
TOTAL OPERATING COSTS 71 68 73 75 76 78 79 80 81 82 83 84 85
TOTAL OUTFLOWS 66 77 108 243 68 310 110 120 78 79 98 91 82
CASH FLOW 242 246 231 112 306 82 292 292 344 354 345 364 384
2023 2024 2025 2026 2027 2028 2029 2030 2031 2032 2033
TOTAL REVENUES 478 490 502 508 514 521 527 534 541 547 554
Track construction 0 0 0 0 0 0 0 0 0 0 -2581
Rolling stock 10 12 -3 -11 -6 15 18 57 0 -6 0
TOTAL INVESTMENT COSTS 10 12 -3 -11 -6 15 18 57 0 -6 -2581
Operating and maintenance costs 86 87 89 89 90 90 91 92 92 93 94
TOTAL OPERATING COSTS 86 87 89 89 90 90 91 92 92 93 94
TOTAL OUTFLOWS 96 99 86 78 84 105 109 149 92 87 -2487
CASH FLOW 382 390 416 430 430 416 418 385 448 460 3042
Discount rate 5.0%
FNPV (C) -4288
FRR (C) 0.65%
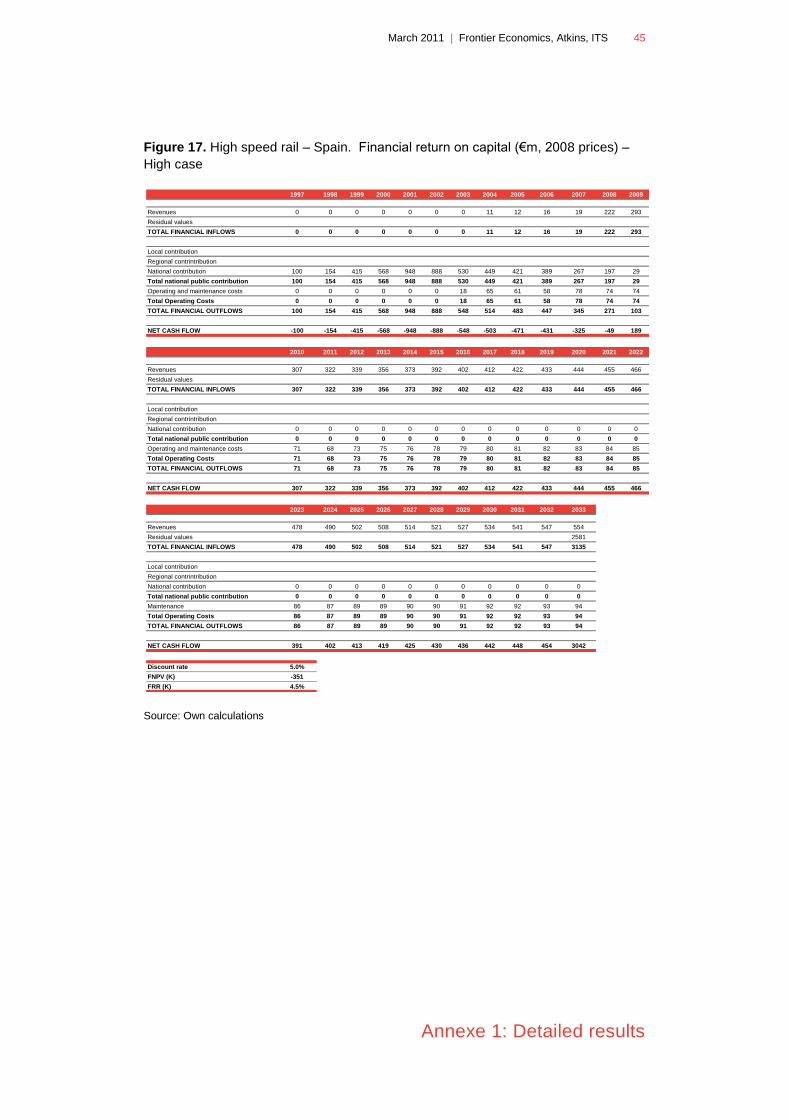
March 2011 | Frontier Economics, Atkins, ITS 45
Annexe 1: Detailed results
Figure 17. High speed rail – Spain. Financial return on capital (€m, 2008 prices) –
High case
Source: Own calculations
1997 1998 1999 2000 2001 2002 2003 2004 2005 2006 2007 2008 2009
Revenues 0 0 0 0 0 0 0 11 12 16 19 222 293
Residual values
TOTAL FINANCIAL INFLOWS 0 0 0 0 0 0 0 11 12 16 19 222 293
Local contribution
Regional contrintribution
National contribution 100 154 415 568 948 888 530 449 421 389 267 197 29
Total national public contribution 100 154 415 568 948 888 530 449 421 389 267 197 29
Operating and maintenance costs 0 0 0 0 0 0 18 65 61 58 78 74 74
Total Operating Costs 0 0 0 0 0 0 18 65 61 58 78 74 74
TOTAL FINANCIAL OUTFLOWS 100 154 415 568 948 888 548 514 483 447 345 271 103
NET CASH FLOW -100 -154 -415 -568 -948 -888 -548 -503 -471 -431 -325 -49 189
2010 2011 2012 2013 2014 2015 2016 2017 2018 2019 2020 2021 2022
Revenues 307 322 339 356 373 392 402 412 422 433 444 455 466
Residual values
TOTAL FINANCIAL INFLOWS 307 322 339 356 373 392 402 412 422 433 444 455 466
Local contribution
Regional contrintribution
National contribution 0 0 0 0 0 0 0 0 0 0 0 0 0
Total national public contribution 0 0 0 0 0 0 0 0 0 0 0 0 0
Operating and maintenance costs 71 68 73 75 76 78 79 80 81 82 83 84 85
Total Operating Costs 71 68 73 75 76 78 79 80 81 82 83 84 85
TOTAL FINANCIAL OUTFLOWS 71 68 73 75 76 78 79 80 81 82 83 84 85
NET CASH FLOW 307 322 339 356 373 392 402 412 422 433 444 455 466
2023 2024 2025 2026 2027 2028 2029 2030 2031 2032 2033
Revenues 478 490 502 508 514 521 527 534 541 547 554
Residual values 2581
TOTAL FINANCIAL INFLOWS 478 490 502 508 514 521 527 534 541 547 3135
Local contribution
Regional contrintribution
National contribution 0 0 0 0 0 0 0 0 0 0 0
Total national public contribution 0 0 0 0 0 0 0 0 0 0 0
Maintenance 86 87 89 89 90 90 91 92 92 93 94
Total Operating Costs 86 87 89 89 90 90 91 92 92 93 94
TOTAL FINANCIAL OUTFLOWS 86 87 89 89 90 90 91 92 92 93 94
NET CASH FLOW 391 402 413 419 425 430 436 442 448 454 3042
Discount rate 5.0%
FNPV (K) -351
FRR (K) 4.5%
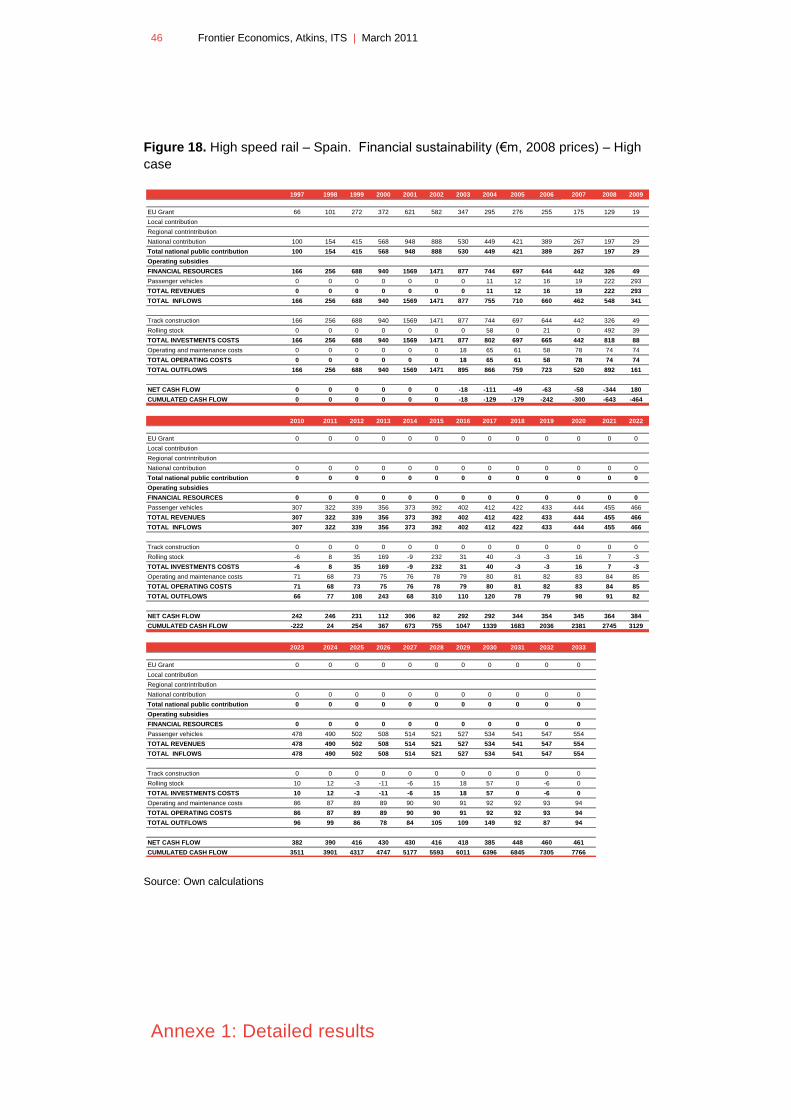
46 Frontier Economics, Atkins, ITS | March 2011
Annexe 1: Detailed results
Figure 18. High speed rail – Spain. Financial sustainability (€m, 2008 prices) – High
case
Source: Own calculations
1997 1998 1999 2000 2001 2002 2003 2004 2005 2006 2007 2008 2009
EU Grant 66 101 272 372 621 582 347 295 276 255 175 129 19
Local contribution
Regional contrintribution
National contribution 100 154 415 568 948 888 530 449 421 389 267 197 29
Total national public contribution 100 154 415 568 948 888 530 449 421 389 267 197 29
Operating subsidies
FINANCIAL RESOURCES 166 256 688 940 1569 1471 877 744 697 644 442 326 49
Passenger vehicles 0 0 0 0 0 0 0 11 12 16 19 222 293
TOTAL REVENUES 0 0 0 0 0 0 0 11 12 16 19 222 293
TOTAL INFLOWS 166 256 688 940 1569 1471 877 755 710 660 462 548 341
Track construction 166 256 688 940 1569 1471 877 744 697 644 442 326 49
Rolling stock 0 0 0 0 0 0 0 58 0 21 0 492 39
TOTAL INVESTMENTS COSTS 166 256 688 940 1569 1471 877 802 697 665 442 818 88
Operating and maintenance costs 0 0 0 0 0 0 18 65 61 58 78 74 74
TOTAL OPERATING COSTS 0 0 0 0 0 0 18 65 61 58 78 74 74
TOTAL OUTFLOWS 166 256 688 940 1569 1471 895 866 759 723 520 892 161
NET CASH FLOW 0 0 0 0 0 0 -18 -111 -49 -63 -58 -344 180
CUMULATED CASH FLOW 0 0 0 0 0 0 -18 -129 -179 -242 -300 -643 -464
2010 2011 2012 2013 2014 2015 2016 2017 2018 2019 2020 2021 2022
EU Grant 0 0 0 0 0 0 0 0 0 0 0 0 0
Local contribution
Regional contrintribution
National contribution 0 0 0 0 0 0 0 0 0 0 0 0 0
Total national public contribution 0 0 0 0 0 0 0 0 0 0 0 0 0
Operating subsidies
FINANCIAL RESOURCES 0 0 0 0 0 0 0 0 0 0 0 0 0
Passenger vehicles 307 322 339 356 373 392 402 412 422 433 444 455 466
TOTAL REVENUES 307 322 339 356 373 392 402 412 422 433 444 455 466
TOTAL INFLOWS 307 322 339 356 373 392 402 412 422 433 444 455 466
Track construction 0 0 0 0 0 0 0 0 0 0 0 0 0
Rolling stock -6 8 35 169 -9 232 31 40 -3 -3 16 7 -3
TOTAL INVESTMENTS COSTS -6 8 35 169 -9 232 31 40 -3 -3 16 7 -3
Operating and maintenance costs 71 68 73 75 76 78 79 80 81 82 83 84 85
TOTAL OPERATING COSTS 71 68 73 75 76 78 79 80 81 82 83 84 85
TOTAL OUTFLOWS 66 77 108 243 68 310 110 120 78 79 98 91 82
NET CASH FLOW 242 246 231 112 306 82 292 292 344 354 345 364 384
CUMULATED CASH FLOW -222 24 254 367 673 755 1047 1339 1683 2036 2381 2745 3129
2023 2024 2025 2026 2027 2028 2029 2030 2031 2032 2033
EU Grant 0 0 0 0 0 0 0 0 0 0 0
Local contribution
Regional contrintribution
National contribution 0 0 0 0 0 0 0 0 0 0 0
Total national public contribution 0 0 0 0 0 0 0 0 0 0 0
Operating subsidies
FINANCIAL RESOURCES 0 0 0 0 0 0 0 0 0 0 0
Passenger vehicles 478 490 502 508 514 521 527 534 541 547 554
TOTAL REVENUES 478 490 502 508 514 521 527 534 541 547 554
TOTAL INFLOWS 478 490 502 508 514 521 527 534 541 547 554
Track construction 0 0 0 0 0 0 0 0 0 0 0
Rolling stock 10 12 -3 -11 -6 15 18 57 0 -6 0
TOTAL INVESTMENTS COSTS 10 12 -3 -11 -6 15 18 57 0 -6 0
Operating and maintenance costs 86 87 89 89 90 90 91 92 92 93 94
TOTAL OPERATING COSTS 86 87 89 89 90 90 91 92 92 93 94
TOTAL OUTFLOWS 96 99 86 78 84 105 109 149 92 87 94
NET CASH FLOW 382 390 416 430 430 416 418 385 448 460 461
CUMULATED CASH FLOW 3511 3901 4317 4747 5177 5593 6011 6396 6845 7305 7766

Frontier Economics Limited in Europe is a member of the Frontier Economics network, which
consists of separate companies based in Europe (Brussels, Cologne, London & Madrid) and Australia
(Brisbane, Melbourne & Sydney). The companies are independently owned, and legal commitments
entered into by any one company do not impose any obligations on other companies in the network.
All views expressed in this document are the views of Frontier Economics Limited.

FRONTIER ECONOMICS Europe
BRUSSELS | COLOGNE | LONDON | MADRID
Frontier Economics Ltd 71 High Holborn London WC1V 6DA
Tel. +44 (0)20 7031 7000 Fax. +44 (0)20 7031 7001 www.frontier-economics.com