appendices to mpca long prairie river watershed tmdl … · appendix a table a- 2 mpca long prairie...
TRANSCRIPT

Appendix A Table A-1
Minnesota Pollution Control Agency Long Prairie River Watershed TMDL Project: Final Project Report
Land Use SummarySource: Todd County GIS Department
Upper Reach Area Middle Reach Area Lower Reach Area Watershed TotalLand Use acres % acres % acres % acres %
Urban & Rural Dev. 8,674 4% 4,992 3% 2,078 2% 15,744 3%Agriculture 94,231 43% 91,685 48% 34,685 28% 220,601 41%Grassland 42,085 19% 53,119 28% 31,886 26% 127,090 24%Forest 35,455 16% 35,281 18% 43,102 35% 113,838 21%Water & Wetlands 38,349 17% 6,823 4% 10,456 8% 55,628 10%Other 380 0% 352 0% 833 1% 1,655 0%Total 219,173 192,252 123,040 534,556
835 sq miles
Notes:
1. Land use is further broken down in Appendix A.
2. Omits portion of watershed in Wadena County and eastern portion of watershed in Morrison County (48 square miles total).
T:/0147/51/Phase III/Appendices/Appendix A_Tab1-3.XLS/Appendix A Table 1 Page 1 of 1 Wenck Associates, Inc.

Appendix A Table A- 2
MPCA Long Prairie River Watershed TMDL Final Project Report
Subwatershed AreaSource: Todd SWCD
ID Number Watershed Major Name Watershed Minor NameWatershed
Area (acres)Lower Reach
14031 LONG PRAIRIE RIVER Moran Cr 1365914032 LONG PRAIRIE RIVER Unknown Watershed Name 526814031 LONG PRAIRIE RIVER Moran Cr 298514027 LONG PRAIRIE RIVER Long Prairie R 631814034 LONG PRAIRIE RIVER Long Prairie R 746014033 LONG PRAIRIE RIVER Stony Bk 960214027 LONG PRAIRIE RIVER Long Prairie R 243814035 LONG PRAIRIE RIVER Unknown Watershed Name 1876314028 LONG PRAIRIE RIVER Fish Trap Cr 1426614036 LONG PRAIRIE RIVER Moran Cr 342014037 LONG PRAIRIE RIVER Long Prairie R 125414029 LONG PRAIRIE RIVER Unknown Watershed Name 102714037 LONG PRAIRIE RIVER Long Prairie R 705814030 LONG PRAIRIE RIVER Fish Trap Cr 92014027 LONG PRAIRIE RIVER Long Prairie R 25814027 LONG PRAIRIE RIVER Long Prairie R 606914027 LONG PRAIRIE RIVER Long Prairie R 6114063 LONG PRAIRIE RIVER 1897414028 LONG PRAIRIE RIVER Fish Trap Cr 57314029 LONG PRAIRIE RIVER Unknown Watershed Name 1094014030 LONG PRAIRIE RIVER Fish Trap Cr 613814031 LONG PRAIRIE RIVER Moran Cr 1609
Middle Reach14038 LONG PRAIRIE RIVER Turtle Cr 2539714043 LONG PRAIRIE RIVER Co Ditch #31 349214061 LONG PRAIRIE RIVER Unknown Watershed Name 491514044 LONG PRAIRIE RIVER Eagle Cr 745214047 LONG PRAIRIE RIVER Eagle Cr 513214062 LONG PRAIRIE RIVER Unknown Watershed Name 344114037 LONG PRAIRIE RIVER Long Prairie R 38514060 LONG PRAIRIE RIVER Long Prairie R 300314060 LONG PRAIRIE RIVER Long Prairie R 641514045 LONG PRAIRIE RIVER Unknown Watershed Name 743014039 LONG PRAIRIE RIVER Unknown Watershed Name 567814046 LONG PRAIRIE RIVER Eagle Cr 906614060 LONG PRAIRIE RIVER Long Prairie R 224214048 LONG PRAIRIE RIVER Freemans Cr 641714015 LONG PRAIRIE RIVER Eagle Cr 644614049 LONG PRAIRIE RIVER Harris Cr 1204414050 LONG PRAIRIE RIVER Drayer Cr 524214047 LONG PRAIRIE RIVER Eagle Cr 1614041 LONG PRAIRIE RIVER Unknown Watershed Name 440614051 LONG PRAIRIE RIVER Long Prairie R 1120114052 LONG PRAIRIE RIVER Unknown Watershed Name 4558
T:/0147/36/Phase I/Tables/Appendix A_Tab1-3/Appendix A Table 2 Page 1 of 3 Wenck Associates, Inc.
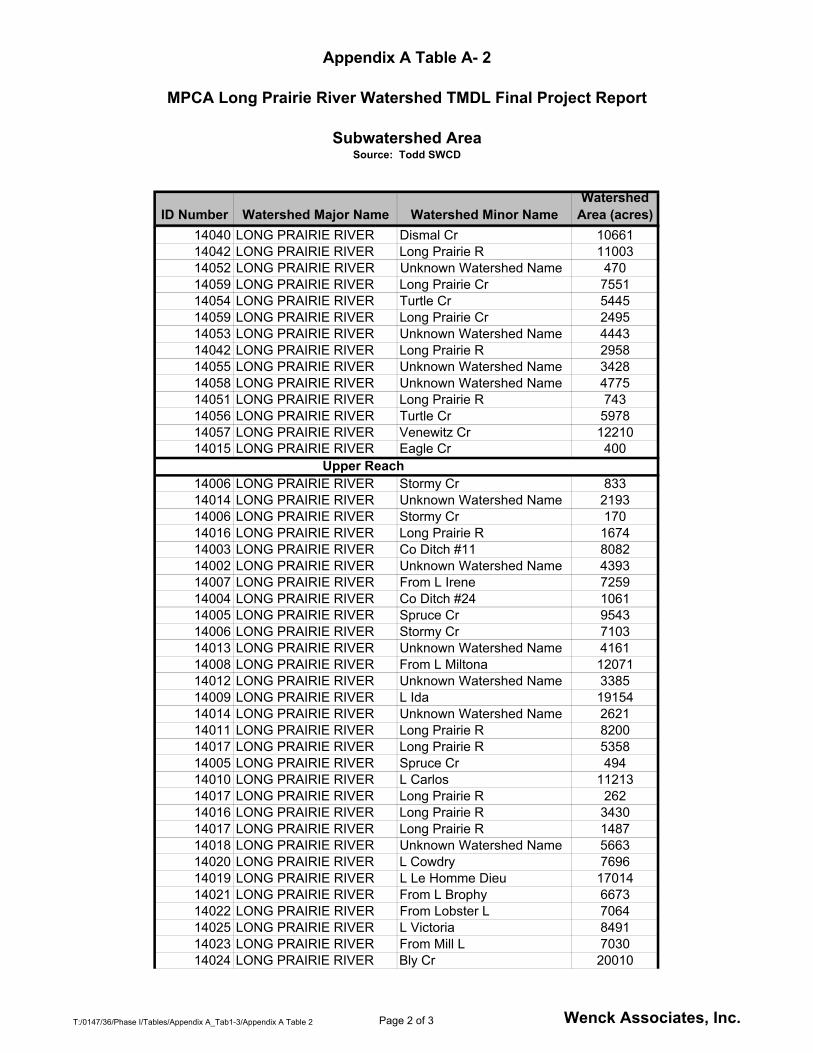
Appendix A Table A- 2
MPCA Long Prairie River Watershed TMDL Final Project Report
Subwatershed AreaSource: Todd SWCD
ID Number Watershed Major Name Watershed Minor NameWatershed
Area (acres)14040 LONG PRAIRIE RIVER Dismal Cr 1066114042 LONG PRAIRIE RIVER Long Prairie R 1100314052 LONG PRAIRIE RIVER Unknown Watershed Name 47014059 LONG PRAIRIE RIVER Long Prairie Cr 755114054 LONG PRAIRIE RIVER Turtle Cr 544514059 LONG PRAIRIE RIVER Long Prairie Cr 249514053 LONG PRAIRIE RIVER Unknown Watershed Name 444314042 LONG PRAIRIE RIVER Long Prairie R 295814055 LONG PRAIRIE RIVER Unknown Watershed Name 342814058 LONG PRAIRIE RIVER Unknown Watershed Name 477514051 LONG PRAIRIE RIVER Long Prairie R 74314056 LONG PRAIRIE RIVER Turtle Cr 597814057 LONG PRAIRIE RIVER Venewitz Cr 1221014015 LONG PRAIRIE RIVER Eagle Cr 400
Upper Reach14006 LONG PRAIRIE RIVER Stormy Cr 83314014 LONG PRAIRIE RIVER Unknown Watershed Name 219314006 LONG PRAIRIE RIVER Stormy Cr 17014016 LONG PRAIRIE RIVER Long Prairie R 167414003 LONG PRAIRIE RIVER Co Ditch #11 808214002 LONG PRAIRIE RIVER Unknown Watershed Name 439314007 LONG PRAIRIE RIVER From L Irene 725914004 LONG PRAIRIE RIVER Co Ditch #24 106114005 LONG PRAIRIE RIVER Spruce Cr 954314006 LONG PRAIRIE RIVER Stormy Cr 710314013 LONG PRAIRIE RIVER Unknown Watershed Name 416114008 LONG PRAIRIE RIVER From L Miltona 1207114012 LONG PRAIRIE RIVER Unknown Watershed Name 338514009 LONG PRAIRIE RIVER L Ida 1915414014 LONG PRAIRIE RIVER Unknown Watershed Name 262114011 LONG PRAIRIE RIVER Long Prairie R 820014017 LONG PRAIRIE RIVER Long Prairie R 535814005 LONG PRAIRIE RIVER Spruce Cr 49414010 LONG PRAIRIE RIVER L Carlos 1121314017 LONG PRAIRIE RIVER Long Prairie R 26214016 LONG PRAIRIE RIVER Long Prairie R 343014017 LONG PRAIRIE RIVER Long Prairie R 148714018 LONG PRAIRIE RIVER Unknown Watershed Name 566314020 LONG PRAIRIE RIVER L Cowdry 769614019 LONG PRAIRIE RIVER L Le Homme Dieu 1701414021 LONG PRAIRIE RIVER From L Brophy 667314022 LONG PRAIRIE RIVER From Lobster L 706414025 LONG PRAIRIE RIVER L Victoria 849114023 LONG PRAIRIE RIVER From Mill L 703014024 LONG PRAIRIE RIVER Bly Cr 20010
T:/0147/36/Phase I/Tables/Appendix A_Tab1-3/Appendix A Table 2 Page 2 of 3 Wenck Associates, Inc.

Appendix A Table A- 2
MPCA Long Prairie River Watershed TMDL Final Project Report
Subwatershed AreaSource: Todd SWCD
ID Number Watershed Major Name Watershed Minor NameWatershed
Area (acres)14026 LONG PRAIRIE RIVER Unknown Watershed Name 784314001 LONG PRAIRIE RIVER 478414005 LONG PRAIRIE RIVER Spruce Cr 226414004 LONG PRAIRIE RIVER Co Ditch #24 369814005 LONG PRAIRIE RIVER Spruce Cr 394214003 LONG PRAIRIE RIVER Co Ditch #11 217014006 LONG PRAIRIE RIVER Stormy Cr 39314007 LONG PRAIRIE RIVER From L Irene 28314002 LONG PRAIRIE RIVER Unknown Watershed Name 71
Lower Reach Area 139,058 acresMiddle Reach Area 206,939 acresUpper Reach Area 219,236 acres
Total Watershed Area 565,234 acres883 square miles
T:/0147/36/Phase I/Tables/Appendix A_Tab1-3/Appendix A Table 2 Page 3 of 3 Wenck Associates, Inc.

#
#
#
#
#
#
#
#
#
#
#
###
##
##
#
#
#
#
#
#
#
# #
#2
7
LPR 89.9
LPR 85.5
LPR 83.1
T LPR 80.9
LPR 79.4
#
LPR 76.7
#
LPR 72.6
T LPR 73.3
#
LPR 67.0
#
LPR 56.0
#
LPR 49.3
#
LPR 47.8
#
LPR 47.2
#
LPR 42.2
#
LPR 38.5
#
LPR 34.2
#
T LPR 33.6
#
LPR 30.8
#
LPR 26.1
#
LPR 21.1
#
T LPR 20.8
#
LPR 18.2
T LPR 15.8
##
LPR 15.8
LPR 11.8
T LPR 10.3
LPR 9.2
#
LPR 3.2
1800 Pioneer Creek CenterMaple Plain, MN 55359-0249C
OP
YR
IGH
T
Appendix A Figure A-1
Wenck Associates, Inc.Environmental Engineers
MPCA - LONG PRAIRIE RIVER WATERSHED TMDL FINAL PROJECT REPORT
Land Use & Sub-Watersheds
JULY 2003
Urban & RuralAgricultureGrasslandForestWater & WetlandOther
2 0 2 4 Miles
N
Cass County
Mor
rison
Cou
nty
Wadena County
Todd County
Ottertail County
Douglas County
L:\0147\0147-36\apr file\finalreport_Fig_A1_A2.apr\LandUse Appendix A Figure A-1
Sub-Watershed Boundary (source: Todd County GIS Department)
# Monitoring Station Locations
Land Use Classifications(source: 1989 Land Coalition Data)
Legend

#
#
#
#
#
#
#
#
#
#
#
###
##
##
#
#
#
#
#
#
#
# #
#
#
LPR 3.2
LPR 9.2
T LPR 10.3
LPR 11.8
#
LPR 15.8
#
T LPR 15.8
#
LPR 18.2
#
T LPR 20.8
#
LPR 21.1#
LPR 26.1#
LPR 30.8#
T LPR 33.6
#
LPR 34.2
#
LPR 38.5
#
LPR 42.2
#
LPR 47.2
#
LPR 47.8
#
LPR 49.3
#
LPR 56.0
#
LPR 67.0
T LPR 73.3
#
LPR 72.6
#
LPR 76.7
LPR 79.4
T LPR 80.9
LPR 83.1
LPR 85.5
LPR 89.9
1800 Pioneer Creek CenterMaple Plain, MN 55359-0249C
OP
YR
IGH
T
Appendix A Figure A-2
Wenck Associates, Inc.Environmental Engineers
MPCA - LONG PRAIRIE RIVER WATERSHED TMDL FINAL PROJECT REPORT
Soils & Sub-Watersheds
JULY 2003
N
Cass County
Mor
rison
Cou
nty
Wadena County
Todd County
Ottertail County
Douglas County
L:\0147\0147-36\apr file\finalreport_fig_a1_a2.apr\Soils Appendix A Figure A-2
Sub-Watershed Boundary (source: Todd County GIS Department)
# Monitoring Station Locations
Soil Classifications(source: 1989 Land Coalition Data)
Legend
Clay over clayClay over loamClay over sandClay over bedrockLoam over clayLoam over loamLoam over sandLoam over bedrockSand over claySand over loamSand over sandSand over bedrockWater/wetlands/marsh/peat/alluvialMine dumps
4 0 4 Miles

Appendix B Table B-1
MPCA Long Prairie River Watershed TMDL Final Project Report
Summary of Monthly Average Long Prairie River Flows at LPR 47.8 October 1971 to February 2002
(all data is in cfs)
January February March April May June July August September October November December1971 145.6 425.1 147.81972 100.9 85.9 393.3 602.4 409.3 256.5 777.3 715.1 324.8 243.6 226.9 133.51973 109.9 81.0 409.2 273.5 226.3 127.9 63.0 75.0 67.5 92.2 78.5 54.31974 46.3 46.8 59.7 350.2 255.2 171.7 59.0 51.3 37.2 29.9 38.9 24.71975 10.5 8.3 33.6 457.6 359.2 281.0 256.6 85.0 80.7 55.5 44.8 41.11976 43.1 48.2 137.3 274.7 85.2 37.3 25.9 10.2 5.3 13.4 8.7 3.21977 1.1 1.6 50.6 71.8 45.5 37.5 18.9 17.9 32.2 76.1 88.2 79.91978 51.2 40.1 121.9 422.4 148.4 97.5 181.3 99.0 74.5 55.9 40.3 19.01979 18.0 22.1 73.6 554.6 316.5 412.7 350.6 156.4 136.8 90.8 172.6 92.71980 75.4 64.6 62.1 373.1 126.6 311.7 118.2 172.2 215.5 142.7 85.2 44.11981 43.4 60.0 84.7 132.7 148.1 179.7 114.0 98.8 80.4 105.6 67.3 39.01982 34.0 40.1 56.0 611.4 353.4 213.1 188.4 85.5 80.1 204.6 123.7 102.41983 75.8 73.2 283.2 219.8 147.3 155.8 138.4 90.2 67.7 58.5 71.8 53.31984 50.0 80.0 147.3 267.0 260.5 383.5 217.4 145.2 98.9 399.0 279.3 181.91985 143.1 136.0 440.6 414.1 467.1 421.6 203.2 197.5 213.0 168.3 93.8 93.01986 91.4 87.2 185.6 747.7 652.7 380.9 395.1 362.8 607.1 512.0 373.1 270.21987 216.8 207.9 343.1 288.3 274.1 192.6 100.4 66.6 56.6 41.5 40.2 25.71988 14.7 14.0 118.7 175.2 71.6 27.5 4.7 20.3 21.9 28.9 26.7 15.01989 11.2 11.2 19.8 335.0 165.3 73.1 24.1 10.0 40.6 25.6 37.3 13.01990 4.2 3.0 146.7 136.3 125.6 164.4 87.5 49.6 49.1 64.9 39.2 23.21991 12.1 23.0 96.4 250.2 253.0 197.6 259.7 147.3 124.4 83.0 81.4 66.91992 64.7 71.8 265.1 241.4 187.4 105.3 112.7 52.7 48.4 34.9 42.8 26.91993 25.2 26.5 40.9 242.9 261.0 350.6 397.9 275.1 213.4 157.9 104.8 113.91994 98.7 94.1 333.1 459.3 403.3 160.1 136.2 89.0 80.7 116.7 85.7 63.41995 53.7 51.3 382.0 330.5 346.6 259.5 250.4 255.7 168.2 390.8 243.5 129.71996 120.7 122.4 140.2 584.6 431.7 269.8 145.9 103.1 84.8 119.5 170.7 117.11997 105.7 137.9 146.8 826.7 321.5 195.0 207.1 172.8 129.2 102.5 78.3 64.71998 61.6 123.1 175.2 239.7 183.2 191.5 345.2 129.5 68.3 164.8 177.1 123.41999 98.8 102.1 224.6 427.0 597.5 317.4 216.4 191.7 197.9 137.7 94.6 64.52000 52.2 76.3 198.8 156.6 223.1 151.5 135.7 91.8 61.8 54.7 142.5
1971- 2000 Average Flow 63.3 66.9 178.3 360.9 270.6 211.2 190.7 138.5 119.6 130.6 119.1 76.82001 49.6 52.5 54.4 1062.4 607.8 773.9 306.2 188.2 159.2 130.7 102.1 143.92002 122.3 112.3Note: February 2002 average flow is calculated through February 7, 2002.
T:/0147/51/PhaseIII Rpt/Appendix/Appendix B_2.xls/Appendic B_table 1 Page 1 of 1 Wenck Associates, Inc.

Appendix B Figure B-1a
Minnesota Pollution Control AgencyLong Prairie River Watershed TMDL Final Project Report
Long Prairie River Average Daily Flow and Precipitation at LPR 47.8(1996)
T:/0147/51/Phase III Repor/Appendices/Appendix B_1/Appendix B Figure 1a Page 1 of 1 Wenck Associates, Inc.
0.0
0.5
1.0
1.5
2.0
2.5
3.0
3.5
4.0
Jan-96 Feb-96 Mar-96 Apr-96 May-96 Jun-96 Jul-96 Aug-96 Sep-96 Oct-96 Nov-96 Dec-96 Jan-97Date
Prec
ipita
tion
(inch
es)
0
375
750
1,125
1,500
1,875
2,250
2,625
3,000
Flow
(cfs
)
Precipitation(inches)Flow (cfs)

Appendix B Figure B-1b
Minnesota Pollution Control AgencyLong Prairie River Watershed TMDL Final Project Report
Long Prairie River Average Daily Flow and Precipitation at LPR 47.8(1997)
T:/0147/51/Phase III Repor/Appendices/Appendix B_1/Appendix B Figure 1b Page 1 of 1 Wenck Associates, Inc.
0.0
0.5
1.0
1.5
2.0
2.5
3.0
3.5
4.0
Jan-97 Feb-97 Mar-97 Apr-97 May-97 Jun-97 Jul-97 Aug-97 Sep-97 Oct-97 Nov-97 Dec-97 Jan-98
Date
Prec
ipita
tion
(inch
es)
0
375
750
1,125
1,500
1,875
2,250
2,625
3,000
Flow
(cfs
)Precipitation(inches)Flow (cfs)

Appendix B Figure B-1c
Minnesota Pollution Control AgencyLong Prairie River Watershed TMDL Final Project Report
Long Prairie River Average Daily Flow and Precipitation at LPR 47.8(1998)
T:/0147/51/Phase III Repor/Appendices/Appendix B_1/Appendix B Figure 1c Page 1 of 1 Wenck Associates, Inc.
0.0
0.5
1.0
1.5
2.0
2.5
3.0
3.5
4.0
Jan-98 Feb-98 Mar-98 Apr-98 May-98 Jun-98 Jul-98 Aug-98 Sep-98 Oct-98 Nov-98 Dec-98 Jan-99Date
Prec
ipita
tion
(inch
es)
0
375
750
1,125
1,500
1,875
2,250
2,625
3,000
Flow
(cfs
)
Precipitation(inches)Flow (cfs)

Appendix B Figure B-1d
Minnesota Pollution Control AgencyLong Prairie River Watershed TMDL Final Project Report
Long Prairie River Average Daily Flow and Precipitation at LPR 47.8(1999)
T:/0147/51/Phase III Repor/Appendices/Appendix B_1/Appendix B Figure 1d Page 1 of 1 Wenck Associates, Inc.
0.0
0.5
1.0
1.5
2.0
2.5
3.0
3.5
4.0
Jan-99 Feb-99 Mar-99 Apr-99 May-99 Jun-99 Jul-99 Aug-99 Sep-99 Oct-99 Nov-99 Dec-99 Jan-00Date
Prec
ipita
tion
(inch
es)
0
375
750
1,125
1,500
1,875
2,250
2,625
3,000
Flow
(cfs
)
Precipitation(inches)Flow (cfs)

Appendix B Figure B-1e
Minnesota Pollution Control AgencyLong Prairie River Watershed TMDL Final Project Report
Long Prairie River Average Daily Flow and Precipitation at LPR 47.8(2000)
T:/0147/51/Phase III Repor/Appendices/Appendix B_1/Appendix B Figure 1e Page 1 of 1 Wenck Associates, Inc.
0.0
0.5
1.0
1.5
2.0
2.5
3.0
3.5
4.0
Jan-00 Feb-00 Mar-00 Apr-00 May-00 Jun-00 Jul-00 Aug-00 Sep-00 Oct-00 Nov-00 Dec-00 Jan-01Date
Prec
ipita
tion
(inch
es)
0
375
750
1,125
1,500
1,875
2,250
2,625
3,000
Flow
(cfs
)
Precipitation(inches)Flow (cfs)

Appendix B Figure B-1f
Minnesota Pollution Control AgencyLong Prairie River Watershed TMDL Final Project Report
Long Prairie River Average Daily Flow and Precipitation at LPR 47.8(2001)
T:/0147/51/Phase III Repor/Appendices/Appendix B_1/Appendix B Figure 1f Page 1 of 1 Wenck Associates, Inc.
0.0
0.5
1.0
1.5
2.0
2.5
3.0
3.5
4.0
Jan-01 Feb-01 Mar-01 Apr-01 May-01 Jun-01 Jul-01 Aug-01 Sep-01 Oct-01 Nov-01 Dec-01 Jan-02Date
Prec
ipita
tion
(inch
es)
0
375
750
1,125
1,500
1,875
2,250
2,625
3,000
Flow
(cfs
)
Precipitation(inches)Flow (cfs)

Appendix B Figure B-1g
Minnesota Pollution Control AgencyLong Prairie River Watershed TMDL Final Project Report
Long Prairie River Average Daily Flow and Precipitation at LPR 47.8(2002- Through September 30)
T:/0147/51/Phase III Repor/Appendices/Appendix B_1.XLS/Appendix B Figure 1g Page 1 of 1 Wenck Associates, Inc.
0.0
0.5
1.0
1.5
2.0
2.5
3.0
3.5
4.0
Jan-02 Feb-02 Mar-02 Apr-02 May-02 Jun-02 Jul-02 Aug-02 Sep-02 Oct-02 Nov-02 Dec-02 Jan-03Date
Prec
ipita
tion
(inch
es)
0
375
750
1,125
1,500
1,875
2,250
2,625
3,000
Flow
(cfs
)
Precipitation(inches)Flow (cfs)

Appendix B Figure B-2
MPCALong Prairie River Watershed TMDL Project: Final Project Report
Long Prairie River Average Daily Flow and Precipitation at LPR 47.8(January 1996-September 2002)
T:/0147/36/Phase I/Figures/Appendix B_1.XLS/Appendix B Figure 2 Page 1 of 1 Wenck Associates, Inc.
0.0
0.5
1.0
1.5
2.0
2.5
3.0
3.5
4.0
4.5
January-96 January-97 January-98 January-99 January-00 January-01 January-02 January-03Date
Prec
ipita
tion
(inch
es)
0
375
750
1,125
1,500
1,875
2,250
2,625
3,000
Flow
(cfs
)
Precipitation(inches)Flow (cfs)

Appendix B Figure B-3
MPCA Long Prairie River Watershed TMDL Final Project Report
Long Prairie River Average Daily Flow at LPR 47.8(October 1971- September 2002)
T:/0147/51/Phase III Rpt/Appendices/Appendix B_2.xls/Appendix B_fig 3 Page 1 of 1 Wenck Associates, Inc.
0
500
1,000
1,500
2,000
2,500
3,000
3,500
71 72 73 74 75 76 77 78 79 80 81 82 83 84 85 86 87 88 89 90 91 92 93 94 95 96 97 98 99 00 01 02 03
Flow
(cfs
)

Appendix B Figure B-4
MPCA Long Prairie River Watershed TMDL Final Project Report
Long Prairie River Average Monthly Flow at LPR47.8 (1971-2000)
T:/0147/51/Phase IIIRpt/Appendices/Appendix B_2/Appendix B fig 4 Page 1 of 1 Wenck Associates, Inc.
0
200
400
600
800
1,000
1,200
January
February
March
April
May
June
July
August
Septem
ber
October
November
Decem
ber
Flow
(CFS
)
1971 1972 1973 1974 19751976 1977 1978 1979 19801981 1982 1983 1984 19851986 1987 1988 1989 19901991 1992 1993 1994 19951996 1997 1998 1999 2000 1971- 2000 Average Flow

Appendix B Figure B-5
MPCA Long Prairie River Watershed TMDL Final Project Report
Long Prairie River Average Monthly Flow at LPR47.8 (January 1996-February 2002)
T:/0147/51/Phase IIIRpt/Appendices/Appendix B_2/Appendix B fig 5 Page 1 of 1 Wenck Associates, Inc.
0
200
400
600
800
1,000
1,200
January
February
March
April
May
June
July
August
Septem
ber
October
November
Decem
ber
Flow
(CFS
)
1996 1997 1998 1999 2000 1971- 2000 Average Flow 2001 2002
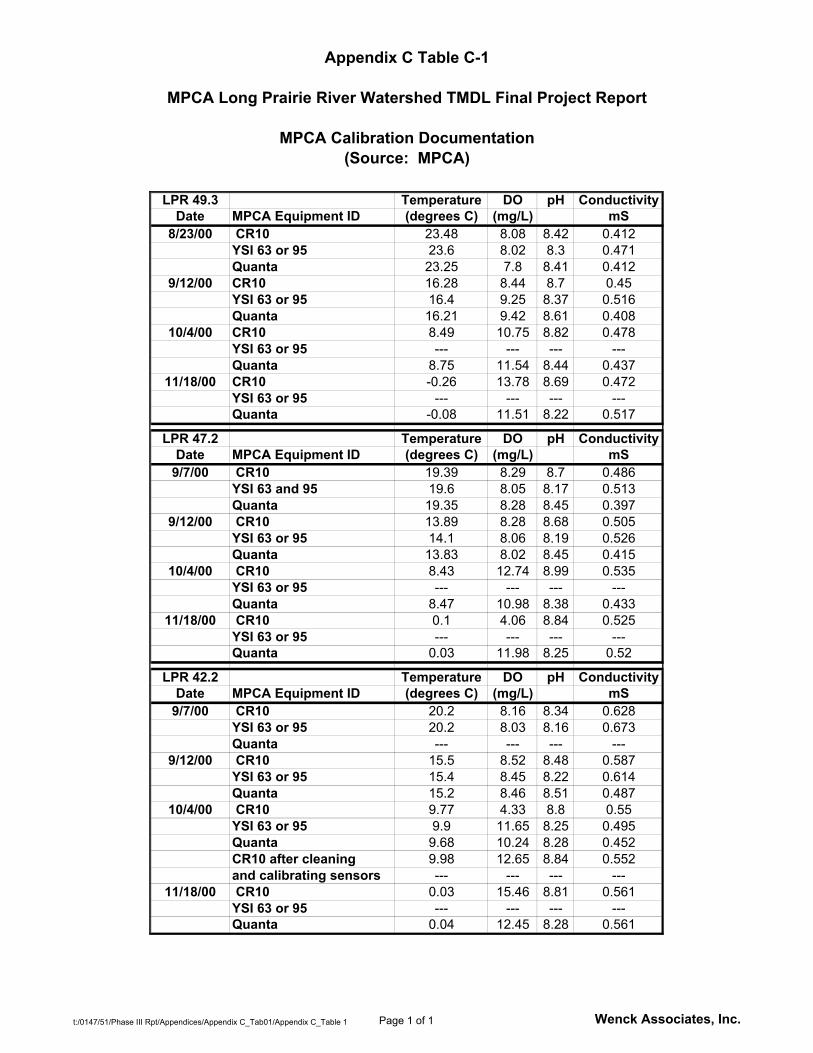
Appendix C Table C-1
MPCA Long Prairie River Watershed TMDL Final Project Report
MPCA Calibration Documentation (Source: MPCA)
LPR 49.3 Temperature DO pH ConductivityDate MPCA Equipment ID (degrees C) (mg/L) mS
8/23/00 CR10 23.48 8.08 8.42 0.412YSI 63 or 95 23.6 8.02 8.3 0.471Quanta 23.25 7.8 8.41 0.412
9/12/00 CR10 16.28 8.44 8.7 0.45YSI 63 or 95 16.4 9.25 8.37 0.516Quanta 16.21 9.42 8.61 0.408
10/4/00 CR10 8.49 10.75 8.82 0.478YSI 63 or 95 --- --- --- ---Quanta 8.75 11.54 8.44 0.437
11/18/00 CR10 -0.26 13.78 8.69 0.472YSI 63 or 95 --- --- --- ---Quanta -0.08 11.51 8.22 0.517
LPR 47.2 Temperature DO pH ConductivityDate MPCA Equipment ID (degrees C) (mg/L) mS
9/7/00 CR10 19.39 8.29 8.7 0.486YSI 63 and 95 19.6 8.05 8.17 0.513Quanta 19.35 8.28 8.45 0.397
9/12/00 CR10 13.89 8.28 8.68 0.505YSI 63 or 95 14.1 8.06 8.19 0.526Quanta 13.83 8.02 8.45 0.415
10/4/00 CR10 8.43 12.74 8.99 0.535YSI 63 or 95 --- --- --- ---Quanta 8.47 10.98 8.38 0.433
11/18/00 CR10 0.1 4.06 8.84 0.525YSI 63 or 95 --- --- --- ---Quanta 0.03 11.98 8.25 0.52
LPR 42.2 Temperature DO pH ConductivityDate MPCA Equipment ID (degrees C) (mg/L) mS
9/7/00 CR10 20.2 8.16 8.34 0.628YSI 63 or 95 20.2 8.03 8.16 0.673Quanta --- --- --- ---
9/12/00 CR10 15.5 8.52 8.48 0.587YSI 63 or 95 15.4 8.45 8.22 0.614Quanta 15.2 8.46 8.51 0.487
10/4/00 CR10 9.77 4.33 8.8 0.55YSI 63 or 95 9.9 11.65 8.25 0.495Quanta 9.68 10.24 8.28 0.452CR10 after cleaning 9.98 12.65 8.84 0.552and calibrating sensors --- --- --- ---
11/18/00 CR10 0.03 15.46 8.81 0.561YSI 63 or 95 --- --- --- ---Quanta 0.04 12.45 8.28 0.561
t:/0147/51/Phase III Rpt/Appendices/Appendix C_Tab01/Appendix C_Table 1 Page 1 of 1 Wenck Associates, Inc.

Appendix C Table C-2
MPCA Long Prairie River Watershed TMDL Final Project Report
Summary of Continuous DO and Temperature Data Recorded at LPR 49.3, LPR 47.2, and LPR 42.2(Data from September- November 2000)
Dissolved Oxygen Range (mg/L)
Average Daily Maximum Dissolved Oxygen
Concentration (mg/L)
Maximum Dissolved Oxygen
Concentrations Generally Occur
Between
Average Daily Minimum Dissolved Oxygen
Concentration (mg/L)
Minimum Dissolved Oxygen
Concentrations Generally Occur
Between
Temperature Range
(degrees C)
Maximum Temperatures
Generally Occur
Between
Minimum Temperatures
Generally Occur
Between
LPR 49.3 4.8 to 15.9 --- --- --- --- -0.3 to 20.1 --- ---
LPR 47.2 1.3 to 15.8 10.8 2pm and 6pm 8.5 2am and 8am -0.2 to 20.3 6pm and 10pm 10am to 2pm
LPR 42.2 8.0 to 16.2 13.5 2pm and 6pm 12.2 2am and 8am -0.2 to 15.6 6pm and 10pm 10am to 2pm
Source: Raw data collected September to November 2000 by MPCA Brainerd staff. (1) Four readings per day were collected at LRP 49.3 at 10am, 2pm, 4pm, and 6pm. Readings were collected at LPR 47.2 and LPR 42.2 every two hours. This difference in data collection frequency complicates comparison of summary data between LRP 49.3 versus LPR 42.2 and LPR 47.2.(2) Data collected at LPR 42.2 prior to October 5 is suspected to be inaccurate.
T:/0147/51/Phase III Rpt/Appendices/Appendix C_Tab02.xlsAppendix C_Table 2 Page 1 of 1 Wenck Associates, Inc.
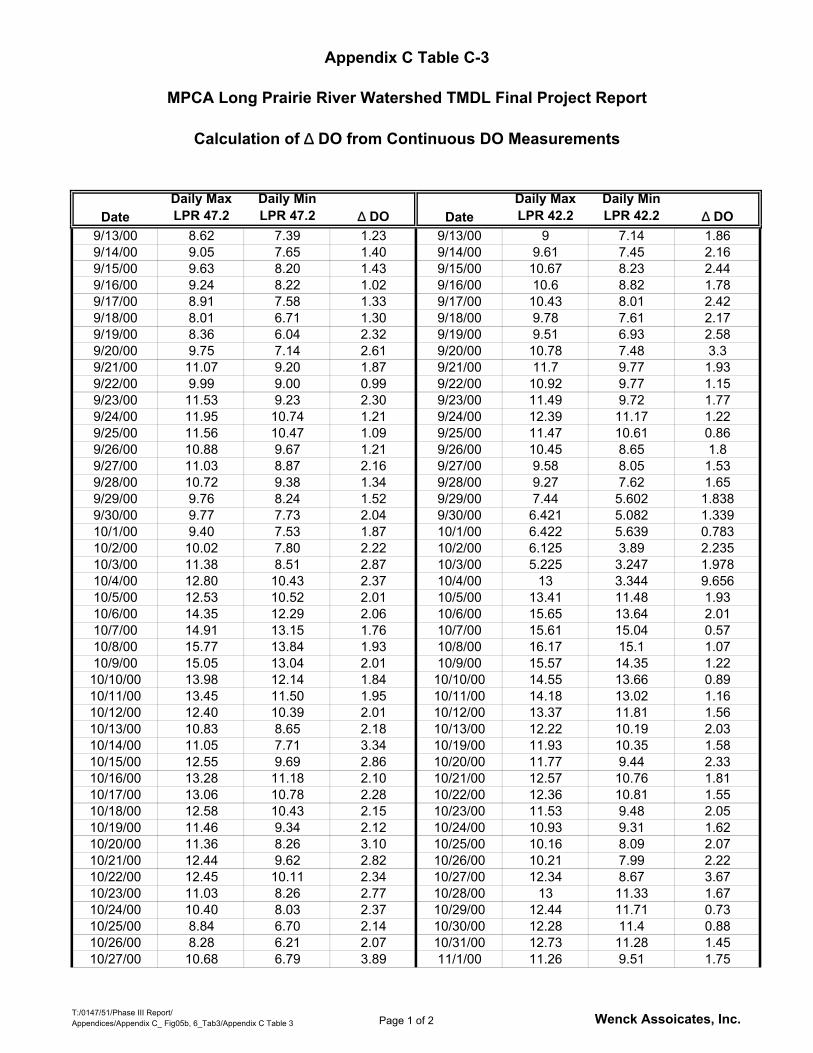
Appendix C Table C-3
MPCA Long Prairie River Watershed TMDL Final Project Report
Calculation of ∆ DO from Continuous DO Measurements
DateDaily Max LPR 47.2
Daily Min LPR 47.2 ∆ DO Date
Daily Max LPR 42.2
Daily Min LPR 42.2 ∆ DO
9/13/00 8.62 7.39 1.23 9/13/00 9 7.14 1.869/14/00 9.05 7.65 1.40 9/14/00 9.61 7.45 2.169/15/00 9.63 8.20 1.43 9/15/00 10.67 8.23 2.449/16/00 9.24 8.22 1.02 9/16/00 10.6 8.82 1.789/17/00 8.91 7.58 1.33 9/17/00 10.43 8.01 2.429/18/00 8.01 6.71 1.30 9/18/00 9.78 7.61 2.179/19/00 8.36 6.04 2.32 9/19/00 9.51 6.93 2.589/20/00 9.75 7.14 2.61 9/20/00 10.78 7.48 3.39/21/00 11.07 9.20 1.87 9/21/00 11.7 9.77 1.939/22/00 9.99 9.00 0.99 9/22/00 10.92 9.77 1.159/23/00 11.53 9.23 2.30 9/23/00 11.49 9.72 1.779/24/00 11.95 10.74 1.21 9/24/00 12.39 11.17 1.229/25/00 11.56 10.47 1.09 9/25/00 11.47 10.61 0.869/26/00 10.88 9.67 1.21 9/26/00 10.45 8.65 1.89/27/00 11.03 8.87 2.16 9/27/00 9.58 8.05 1.539/28/00 10.72 9.38 1.34 9/28/00 9.27 7.62 1.659/29/00 9.76 8.24 1.52 9/29/00 7.44 5.602 1.8389/30/00 9.77 7.73 2.04 9/30/00 6.421 5.082 1.33910/1/00 9.40 7.53 1.87 10/1/00 6.422 5.639 0.78310/2/00 10.02 7.80 2.22 10/2/00 6.125 3.89 2.23510/3/00 11.38 8.51 2.87 10/3/00 5.225 3.247 1.97810/4/00 12.80 10.43 2.37 10/4/00 13 3.344 9.65610/5/00 12.53 10.52 2.01 10/5/00 13.41 11.48 1.9310/6/00 14.35 12.29 2.06 10/6/00 15.65 13.64 2.0110/7/00 14.91 13.15 1.76 10/7/00 15.61 15.04 0.5710/8/00 15.77 13.84 1.93 10/8/00 16.17 15.1 1.0710/9/00 15.05 13.04 2.01 10/9/00 15.57 14.35 1.2210/10/00 13.98 12.14 1.84 10/10/00 14.55 13.66 0.8910/11/00 13.45 11.50 1.95 10/11/00 14.18 13.02 1.1610/12/00 12.40 10.39 2.01 10/12/00 13.37 11.81 1.5610/13/00 10.83 8.65 2.18 10/13/00 12.22 10.19 2.0310/14/00 11.05 7.71 3.34 10/19/00 11.93 10.35 1.5810/15/00 12.55 9.69 2.86 10/20/00 11.77 9.44 2.3310/16/00 13.28 11.18 2.10 10/21/00 12.57 10.76 1.8110/17/00 13.06 10.78 2.28 10/22/00 12.36 10.81 1.5510/18/00 12.58 10.43 2.15 10/23/00 11.53 9.48 2.0510/19/00 11.46 9.34 2.12 10/24/00 10.93 9.31 1.6210/20/00 11.36 8.26 3.10 10/25/00 10.16 8.09 2.0710/21/00 12.44 9.62 2.82 10/26/00 10.21 7.99 2.2210/22/00 12.45 10.11 2.34 10/27/00 12.34 8.67 3.6710/23/00 11.03 8.26 2.77 10/28/00 13 11.33 1.6710/24/00 10.40 8.03 2.37 10/29/00 12.44 11.71 0.7310/25/00 8.84 6.70 2.14 10/30/00 12.28 11.4 0.8810/26/00 8.28 6.21 2.07 10/31/00 12.73 11.28 1.4510/27/00 10.68 6.79 3.89 11/1/00 11.26 9.51 1.75
T:/0147/51/Phase III Report/Appendices/Appendix C_ Fig05b, 6_Tab3/Appendix C Table 3 Page 1 of 2 Wenck Assoicates, Inc.

Appendix C Table C-3
MPCA Long Prairie River Watershed TMDL Final Project Report
Calculation of ∆ DO from Continuous DO Measurements
DateDaily Max LPR 47.2
Daily Min LPR 47.2 ∆ DO Date
Daily Max LPR 42.2
Daily Min LPR 42.2 ∆ DO
���������������������������������������������������������������������������������������������������������������������������������������������������������������������������������������������������������������������������������������������������������������������������������������������������������������������������������������������������������������������������������������������������������������������������������������������������������������������������������������������������������������������������������������������������������������������������������������������������������������������������������������������������������������������������������������������������������������������������������������������������������������������������������������������������������������������������������������������������������������������������������������������������������������������������������������������������������������������������������������������������������������������������������������������������������������������������������������������������������������������������������������������������������������������������������������������������������������������������������������������������������������������������������������������������������������������������������������������������������������������������������������������������������������������������������������������������������������������������������������������������������������������������������������������������������������������������������������������������������������������������������������������������������������������������������������������������������������������������������������������������������������������������������������������������������������������������������������������������������������������������������������������������������������������������������������������������������������������������������������������������������������������������������������������������������������������������������������������������������������������������������������������������������������������������������������������������������������������������������������������������������������������������������������������������������������������������������������������������������������������������������������������������������������������������������������������������������������������������������������������������������������������������������������������������������������������������������������������������������������������������������������������������������������������
��������������������������������������������������������������������
10/28/00 12.77 9.65 3.12 11/2/00 11.68 9.17 2.5110/29/00 11.71 10.53 1.18 11/3/00 12.81 11.6 1.2110/30/00 11.66 10.06 1.60 11/4/00 14.15 12.61 1.5410/31/00 11.64 9.80 1.84 11/5/00 13.67 13.12 0.5511/1/00 9.22 7.14 2.08 11/6/00 12.99 12.11 0.8811/2/00 9.84 6.69 3.15 11/7/00 12.04 11.74 0.311/3/00 11.83 9.65 2.18 11/8/00 13.61 12.13 1.4811/4/00 12.34 11.59 0.75 11/9/00 14.1 13.58 0.5211/5/00 11.78 10.58 1.20 11/10/00 14.97 14.13 0.8411/6/00 9.92 8.78 1.14 11/11/00 15.37 14.72 0.6511/7/00 9.27 8.37 0.90 11/12/00 15.28 14.92 0.3611/8/00 10.01 6.93 3.08 11/13/00 15.72 14.93 0.7911/9/00 7.94 1.25 6.69 11/14/00 15.64 15.1 0.5411/10/00 8.76 1.34 7.43 11/15/00 15.74 15.46 0.2811/11/00 6.79 4.50 2.29 11/16/00 15.76 15.6 0.1611/12/00 9.04 3.71 5.34 11/17/00 15.83 15.59 0.2411/13/00 10.56 8.47 2.09 Statistics for LPR 42.211/14/00 14.11 11.05 3.06 ∆ DO Mean= 1.611/15/00 14.40 1.39 13.01 ∆ DO Max= 9.711/16/00 5.76 2.81 2.95 ∆ DO Min= 0.211/17/00 3.90 2.26 1.64 ∆ DO Standard Deviation= 1.3
Statistics for LPR 47.2 ∆ DO n= 61∆ DO Mean= 2.0
∆ DO Max= 3.89∆ DO Min= 0.99
∆ DO Standard Deviation= 0.6∆ DO n= 49
Notes:shaded cells not used to caluculate statistics due to questionable meter functionality
T:/0147/51/Phase III Report/Appendices/Appendix C_ Fig05b, 6_Tab3/Appendix C Table 3 Page 2 of 2 Wenck Assoicates, Inc.

Appendix C, Table C-4
MPCA Long Prairie River Watershed TMDL Final Project Report
DO Violations Observed by Todd SWCD in and Near Reaches -503 and -505
DateTMDL Study Name
Long Prairie
R M Sampled by
Flow at USGS Gage (cfs)
DO (mg/L)
Reach Number
7/27/2000 LPR 83.1 83.1 Todd SWCD 117 4.84 5068/8/2000 LPR 83.1 83.1 Todd SWCD 102 4.52 5066/19/2001 LPR 83.1 83.1 Todd SWCD 1590 4.84 5067/25/2001 LPR 83.1 83.1 Todd SWCD 246 2.01 5068/6/2001 LPR 83.1 83.1 Todd SWCD 226 3.06 5068/15/2001 LPR 83.1 83.1 Todd SWCD 179 3.27 5068/28/2001 LPR 83.1 83.1 Todd SWCD 148 4.66 5068/26/2002 LPR 83.1 83.1 Todd SWCD 131 4.70 506
80.9 Reach 505 upstream end8/6/2001 LPR 79.4 79.4 Todd SWCD 226 4.55 505
8/6/2001 LPR 76.7 76.7 Todd SWCD 226 3.87 505
7/25/2001 LPR 72.6 72.6 Todd SWCD 246 4.50 5058/6/2001 LPR 72.6 72.6 Todd SWCD 226 4.70 505
7/1/1998 LPR 67.0 67.0 Todd SWCD 328 2.51 5058/6/2001 LPR 67.0 67.0 Todd SWCD 226 1.84 5058/15/2001 LPR 67.0 67.0 Todd SWCD 179 3.89 505
6/19/2001 LPR 64.4 64.4 Todd SWCD 1590 4.07 5057/25/2001 LPR 64.4 64.4 Todd SWCD 246 3.88 5058/6/2001 LPR 64.4 64.4 Todd SWCD 226 3.65 505
7/1/1998 LPR 56.0 56.0 Todd SWCD 328 3.76 5056/12/2001 LPR 56.0 56.0 Todd SWCD 440 4.32 5056/19/2001 LPR 56.0 56.0 Todd SWCD 1590 4.26 505
7/1/1998 LPR 47.8 47.8 Todd SWCD 328 4.71 5056/12/2001 LPR 47.8 47.8 Todd SWCD 440 4.98 5056/19/2001 LPR 47.8 47.8 Todd SWCD 1590 4.19 505
7/1/1998 LPR 38.5 38.5 Todd SWCD 328 2.85 5057/29/1998 LPR 38.5 38.5 Todd SWCD 202 4.52 5056/5/2001 LPR 38.5 38.5 Todd SWCD 404 3.85 505
T:0147/51/Phase III Report/Appendix C_Tab04.xls/Appendix C, Table C-4 Page 1 of 2 Wenck Associates, Inc.

Appendix C, Table C-4
MPCA Long Prairie River Watershed TMDL Final Project Report
DO Violations Observed by Todd SWCD in and Near Reaches -503 and -505
DateTMDL Study Name
Long Prairie
R M Sampled by
Flow at USGS Gage (cfs)
DO (mg/L)
Reach Number
7/1/1998 LPR 34.2 34.2 Todd SWCD 328 2.35 5057/7/1998 LPR 34.2 34.2 Todd SWCD 235 3.54 5057/28/1998 LPR 34.2 34.2 Todd SWCD 227 1.52 5057/29/1998 LPR 34.2 34.2 Todd SWCD 202 2.61 5056/15/1999 LPR 34.2 34.2 Todd SWCD 410 4.98 5056/5/2001 LPR 34.2 34.2 Todd SWCD 404 3.65 5056/5/2001 LPR 34.2 34.2 Todd SWCD 404 4.33 5056/12/2001 LPR 34.2 34.2 Todd SWCD 440 3.28 5056/19/2001 LPR 34.2 34.2 Todd SWCD 1590 3.72 5057/3/2001 LPR 34.2 34.2 Todd SWCD 466 3.46 505
33.6 Reach 505 downstream end7/1/1998 LPR 21.1 21.1 Todd SWCD 328 2.30 5047/29/1998 LPR 21.1 21.1 Todd SWCD 202 0.94 5046/24/1999 LPR 21.1 21.1 Todd SWCD 257 4.96 5048/17/1999 LPR 21.1 21.1 Todd SWCD 197 4.85 5046/12/2001 LPR 21.1 21.1 Todd SWCD 440 3.62 5047/3/2001 LPR 21.1 21.1 Todd SWCD 466 3.66 5046/19/2001 LPR 21.1 21.1 Todd SWCD 1590 3.42 504
7/24/2002 T LPR 20.8 20.8 Todd SWCD 243 1.92 Turtle Ck7/7/1998 T LPR 20.8 20.8 Todd SWCD 235 2.45 Turtle Ck7/28/1998 T LPR 20.8 20.8 Todd SWCD 227 2.94 Turtle Ck8/6/1998 T LPR 20.8 20.8 Todd SWCD 154 4.75 Turtle Ck6/19/2001 T LPR 20.8 20.8 Todd SWCD 1590 4.64 Turtle Ck7/3/2001 T LPR 20.8 20.8 Todd SWCD 466 3.63 Turtle Ck
20.8 Reach 503 upstream end7/1/1998 LPR 18.2 18.2 Todd SWCD 328 3.19 5037/29/1998 LPR 18.2 18.2 Todd SWCD 202 1.17 5038/6/1998 LPR 18.2 18.2 Todd SWCD 154 4.63 503
15.8 Reach 503 downstream end7/1/1998 LPR 15.3 15.3 Todd SWCD 328 3.93 5027/29/1998 LPR 15.3 15.3 Todd SWCD 202 2.25 502
Count 55 55Minimum 102 0.94Maximum 1590 4.98Median 246 3.76
T:0147/51/Phase III Report/Appendix C_Tab04.xls/Appendix C, Table C-4 Page 2 of 2 Wenck Associates, Inc.

Appendix C Figure C-1
Minnesota Pollution Control AgencyLong Prairie River Watershed TMDL Project: Phase II
Average* Monthly Dissolved Oxygen and Percent Saturation at CWP Sites (On-going Monitoring by Todd SWCD)
*Averages typically represent between one and four data points.
LPR 89.9 (CWP Site 9)Model Reach 1
0
5
10
15
20
25
30
35
Jan Feb Mar Apr May Jun Jul Aug Sep Oct Nov Dec
DO
Con
cent
ratio
n (m
g/L)
0
20
40
60
80
100
120
140
% S
atur
ated
, DO
1999 2000 2001 20025 mg/L DO 1999 1998 20002001 100 % Saturation, DO 2002
LPR 85.5 (CWP Site 10)Model Reach 3/4 Break
0
5
10
15
20
25
30
35
Jan Feb Mar Apr May Jun Jul Aug Sep Oct Nov Dec
DO
Con
cent
ratio
n (m
g/L)
0
20
40
60
80
100
120
140
% S
atur
ated
, DO
2000 1998 1999 20002001 2002 5 mg/L DO 19992000 1998 2000 20012002 100 % Saturation, DO
T:/0147/51/Phase III Report/Appendices/Appendix C_Fig01/App D Figure 1 Page 1 of 4 Wenck Associates, Inc.

Appendix C Figure C-1
Minnesota Pollution Control AgencyLong Prairie River Watershed TMDL Project: Phase II
Average* Monthly Dissolved Oxygen and Percent Saturation at CWP Sites (On-going Monitoring by Todd SWCD)
*Averages typically represent between one and four data points.
LPR 56.0 (CWP Site 6)Model Reach 9/10 Break
0
5
10
15
20
25
30
35
Jan Feb Mar Apr May Jun Jul Aug Sep Oct Nov Dec
DO
Con
cent
ratio
n (m
g/L)
0
20
40
60
80
100
120
140
% S
atur
ated
, DO
1998 1999 2000 5 mg/L DO2001 2002 1999 19982000 100 % Saturation, DO 2001 2002
LPR 47.8 (CWP Site 7- USGS Station) Model Reach 10
0
5
10
15
20
25
30
35
Jan Feb Mar Apr May Jun Jul Aug Sep Oct Nov Dec
DO
Con
cent
ratio
n (m
g/L)
0
20
40
60
80
100
120
140
% S
atur
ated
, DO
1998 1999 2000 20012002 5 mg/L DO 1999 19982000 2001 2002 100 % Saturation, DO
T:/0147/51/Phase III Report/Appendices/Appendix C_Fig01/App D Figure 1 Page 2 of 4 Wenck Associates, Inc.

Appendix C Figure C-1
Minnesota Pollution Control AgencyLong Prairie River Watershed TMDL Project: Phase II
Average* Monthly Dissolved Oxygen and Percent Saturation at CWP Sites (On-going Monitoring by Todd SWCD)
*Averages typically represent between one and four data points.
LPR 38.5 (CWP Site 11) Model Reach 11/12 Break
0
5
10
15
20
25
30
35
Jan Feb Mar Apr May Jun Jul Aug Sep Oct Nov Dec
DO
Con
cent
ratio
n (m
g/L)
0
20
40
60
80
100
120
140
% S
atur
ated
, DO
1999 2000 5 mg/L DO 1998
2001 1999 1998 100 % Saturation, DO
2000 2001
LPR 34.2 (CWP Site 5) Model Reach 12/13 Break
0
5
10
15
20
25
30
35
Jan Feb Mar Apr May Jun Jul Aug Sep Oct Nov Dec
DO
Con
cent
ratio
n (m
g/L)
0
20
40
60
80
100
120
140
% S
atur
ated
, DO
1998 1999 2000 20012002 5 mg/L DO 1999 19982000 2001 2002 100 % Saturation, DO
T:/0147/51/Phase III Report/Appendices/Appendix C_Fig01/App D Figure 1 Page 3 of 4 Wenck Associates, Inc.

Appendix C Figure C-1
Minnesota Pollution Control AgencyLong Prairie River Watershed TMDL Project: Phase II
Average* Monthly Dissolved Oxygen and Percent Saturation at CWP Sites (On-going Monitoring by Todd SWCD)
*Averages typically represent between one and four data points.
LPR 9.2 (CWP Site 2) Model Reach 23/24 Break
0
5
10
15
20
25
30
35
Jan Feb Mar Apr May Jun Jul Aug Sep Oct Nov Dec
DO
Con
cent
ratio
n (m
g/L)
0
20
40
60
80
100
120
140
% S
atur
ated
, DO
1999 2000 2001 20025 mg/L DO 1999 1998 20002001 2002 100 % Saturation, DO
LPR 21.1 (CWP Site 15) Model Reach 17/18 Break
0
5
10
15
20
25
30
35
Jan Feb Mar Apr May Jun Jul Aug Sep Oct Nov Dec
DO
Con
cent
ratio
n (m
g/L)
0
20
40
60
80
100
120
140
% S
atur
ated
, DO
1998 2000 5 mg/L DO 19992001 2002 1999 1998100 % Saturation, DO 2000 2001 2002
T:/0147/51/Phase III Report/Appendices/Appendix C_Fig01/App D Figure 1 Page 4 of 4 Wenck Associates, Inc.

Appendix C Figure C-2
MPCA Long Prairie River Watershed TMDL Project: Final Project Report
Dissolved Oxygen and Percent Saturation at LPR 3.2 in Motley 1974-1998
T:/0147/51/Phase III Report/Appendices/Appendix C_Figs02_04/Appendix C Figure 2 Page 1 of 1 Wenck Associates, Inc.
0
10
20
30
40
50
60
70
80
90
100
74 75 76 77 78 79 80 81 82 83 84 85 86 87 88 89 90 91 92 93 94 95 96 97 98
Year
DO
Con
cent
ratio
n (m
g/L)
0%
20%
40%
60%
80%
100%
120%
140%
DO
Pe
rcen
t Sat
urat
ion
DO (mg/L) DO Standard, 5 mg/L DO % Saturation (assumes 1 atm and 0 salinity) 100 % Saturation

Appendix C Figure C-3
MPCA Long Prairie River Watershed TMDL Project: Final Project Report
Monthly Dissolved Oxygen and Percent Saturation at LPR 3.2 in Motley 1974-1998
T:/0147/51/Phase III Report/Appendices/Appendix C_Figs02_04/Appendix C Figure 3 Page 1 of 1 Wenck Associates, Inc.
0
5
10
15
20
25
30
35
40
45
50
January February March April May June July August September October November December
DO
(mg/
L)
0%
20%
40%
60%
80%
100%
120%
140%
DO
Per
cent
Sat
urat
ion
1974 1975 1976 1977 1978 1979 1981 1982 1986 1988 1990 1991 1993 1994 1976 1977
1978 1979 1983 1984 1985 1987 1989 1992 1995 1996 1997 1998 1980 1981 1982 1983
1984 1985 1986 1987 1988 1989 1990 1991 1992 1993 1994 1995 1996 1997 1998
Blue values represent DO saturation, Red values represent DO Concentration in mg/L.
Note: DO and percent saturation values were recorded once per month at various times of day at LPR-3 in Motley. Diurnal fluctuations in DO and percent saturation are not accounted for in this data set.

Appendix C Figure C-4
MPCA Long Prairie River Watershed TMDL Project: Final Project Report
Monthly Temperature Summary for LPR 3.2 in Motley 1976-1998
T:/0147/51/Phase III Report/Appendices/Appendix C_Figs02_04/Appendix C Figure 4 Page 1 of 1 Wenck Associates, Inc.
0
5
10
15
20
25
30
January February March April May June July August September October November December
Tem
pera
ture
(deg
rees
C)
1976 1977 1978 1979 1980 1981 1982 1983 19841985 1986 1987 1988 1989 1990 1991 1992 19931994 1995 1996 1997 1998 Average
Note: Temperature values were recorded once per month at various times of day at LPR-3 in Motley. Diurnal fluctuations in temperature are not accounted for in this data set.

Appendix C Figure C-5a
MPCA Long Prairie River Watershed TMDL Final Project Report
Diurnal DO Concentrations, pH, and Temperature at LPR 49.3 by MPCA September to November 2000
Note: Between one and five readings were recorded daily at irregular intervals.
0
5
10
15
20
12-Sep 14-Sep 16-Sep 18-Sep 20-Sep 22-Sep
DO
(mg/
L)
0.0
7.5
15.0
22.5
30.0
pH, T
emp
DO (mg/L) Temperature (degrees C) pH (SU)
0
5
10
15
20
22-Sep 24-Sep 26-Sep 28-Sep 30-Sep 2-Oct
DO
(mg/
L)
0.0
7.5
15.0
22.5
30.0
pH, T
emp
DO (mg/L) Temperature (degrees C) pH (SU)
0
5
10
15
20
2-Oct 4-Oct 6-Oct 8-Oct 10-Oct 12-Oct
DO
(mg/
L)
0.0
7.5
15.0
22.5
30.0
pH, T
emp
DO (mg/L) Temperature (degrees C) pH (SU)
T:/0146/51/PhaseIII Report/Appendices/Appendix C_Fig05aAppendix C Fig 5a Page 1 of 3 Wenck Associates, Inc.

Appendix C Figure C-5a
MPCA Long Prairie River Watershed TMDL Final Project Report
Diurnal DO Concentrations, pH, and Temperature at LPR 49.3 by MPCA September to November 2000
Note: Between one and five readings were recorded daily at irregular intervals.
0
5
10
15
20
12-Oct 14-Oct 16-Oct 18-Oct 20-Oct 22-Oct
DO
(mg/
L)
0.0
7.5
15.0
22.5
30.0
pH, T
emp
DO (mg/L) Temperature (degrees C) pH (SU)
0
5
10
15
20
22-Oct 24-Oct 26-Oct 28-Oct 30-Oct 1-Nov
DO
(mg/
L)
0.0
7.5
15.0
22.5
30.0
pH, T
emp
DO (mg/L) Temperature (degrees C) pH (SU)
0
5
10
15
20
1-Nov 3-Nov 5-Nov 7-Nov 9-Nov 11-Nov
DO
(mg/
L)
0.0
7.5
15.0
22.5
30.0
pH, T
emp
DO (mg/L) Temperature (degrees C) pH (SU)
T:/0146/51/PhaseIII Report/Appendices/Appendix C_Fig05aAppendix C Fig 5a Page 2 of 3 Wenck Associates, Inc.

Appendix C Figure C-5a
MPCA Long Prairie River Watershed TMDL Final Project Report
Diurnal DO Concentrations, pH, and Temperature at LPR 49.3 by MPCA September to November 2000
Note: Between one and five readings were recorded daily at irregular intervals.
0
5
10
15
20
11-Nov 13-Nov 15-Nov 17-Nov 19-Nov 21-Nov
DO
(mg/
L)
0.0
7.5
15.0
22.5
30.0
pH, T
emp
DO (mg/L) Temperature (degrees C) pH (SU)
T:/0146/51/PhaseIII Report/Appendices/Appendix C_Fig05aAppendix C Fig 5a Page 3 of 3 Wenck Associates, Inc.

Appendix C Figure C-5b
MPCALong Prairie River Watershed TMDL Final Project Report
Diurnal DO Concentrations, pH, and Temperature at LPR 47.2 September to November 2000
Note: Readings recorded every two hours.
0
5
10
15
20
12-Sep 14-Sep 16-Sep 18-Sep 20-Sep 22-Sep
DO
(mg/
L)
0.0
7.5
15.0
22.5
30.0
pH
, Tem
p
DO (mg/L) Temp (degrees C) pH (SU)
0
5
10
15
20
22-Sep 24-Sep 26-Sep 28-Sep 30-Sep 2-Oct
DO
(mg/
L)
0.0
7.5
15.0
22.5
30.0
pH, T
emp
DO (mg/L) Temp (degrees C) pH (SU)
0
5
10
15
20
2-Oct 4-Oct 6-Oct 8-Oct 10-Oct 12-Oct
DO
(mg/
L)
0.0
7.5
15.0
22.5
30.0pH
, Tem
pDO (mg/L) Temp (degrees C) pH (SU)
T:/0146/51/Phase III Rep/Apps/Appendix C_ Fig05b, 6_Tab3Appendix C_Fig 5b Page 1 of 3 Wenck Associates, Inc.
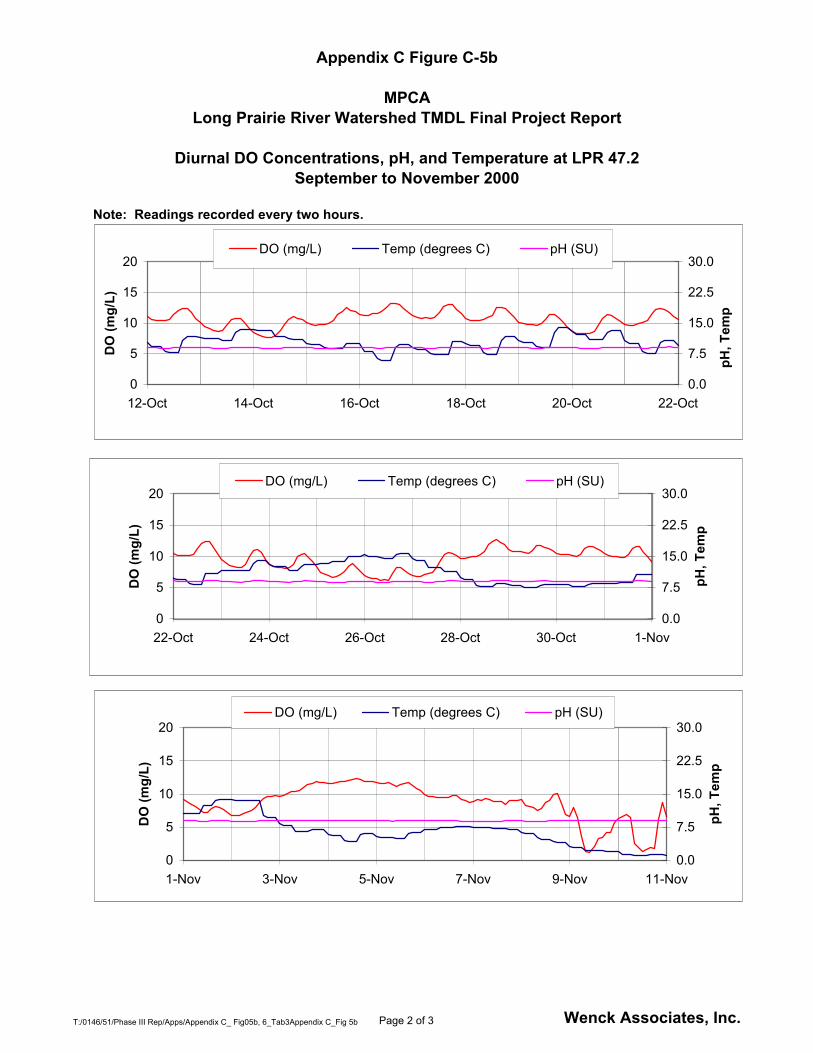
Appendix C Figure C-5b
MPCALong Prairie River Watershed TMDL Final Project Report
Diurnal DO Concentrations, pH, and Temperature at LPR 47.2 September to November 2000
Note: Readings recorded every two hours.
0
5
10
15
20
12-Oct 14-Oct 16-Oct 18-Oct 20-Oct 22-Oct
DO
(mg/
L)
0.0
7.5
15.0
22.5
30.0
pH, T
emp
DO (mg/L) Temp (degrees C) pH (SU)
0
5
10
15
20
22-Oct 24-Oct 26-Oct 28-Oct 30-Oct 1-Nov
DO
(mg/
L)
0.0
7.5
15.0
22.5
30.0
pH, T
emp
DO (mg/L) Temp (degrees C) pH (SU)
0
5
10
15
20
1-Nov 3-Nov 5-Nov 7-Nov 9-Nov 11-Nov
DO
(mg/
L)
0.0
7.5
15.0
22.5
30.0pH
, Tem
pDO (mg/L) Temp (degrees C) pH (SU)
T:/0146/51/Phase III Rep/Apps/Appendix C_ Fig05b, 6_Tab3Appendix C_Fig 5b Page 2 of 3 Wenck Associates, Inc.

Appendix C Figure C-5b
MPCALong Prairie River Watershed TMDL Final Project Report
Diurnal DO Concentrations, pH, and Temperature at LPR 47.2 September to November 2000
Note: Readings recorded every two hours.
0
5
10
15
20
11-Nov 13-Nov 15-Nov 17-Nov 19-Nov 21-Nov
DO
(mg/
L)
0.0
7.5
15.0
22.5
30.0
pH, T
emp
DO (mg/L) Temp (degrees C) pH (SU)
T:/0146/51/Phase III Rep/Apps/Appendix C_ Fig05b, 6_Tab3Appendix C_Fig 5b Page 3 of 3 Wenck Associates, Inc.

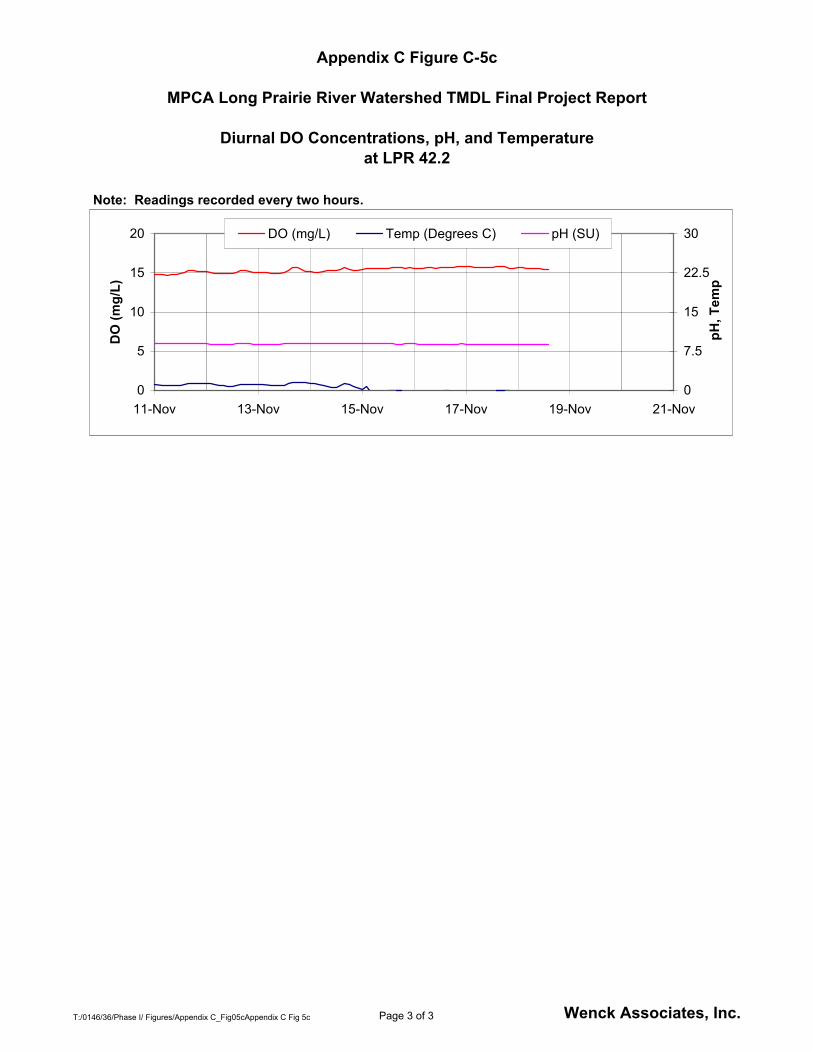
Appendix C Figure C-5c
MPCA Long Prairie River Watershed TMDL Final Project Report
Diurnal DO Concentrations, pH, and Temperatureat LPR 42.2
Note: Readings recorded every two hours.
0
5
10
15
20
12-Sep 14-Sep 16-Sep 18-Sep 20-Sep 22-Sep
DO
(mg/
L)
0.0
7.5
15.0
22.5
30.0
pH, T
emp
DO (mg/L) Temp (Degrees C) pH (SU)
Data prior to 10/4/00 potentially bad.
0
5
10
15
20
22-Sep 24-Sep 26-Sep 28-Sep 30-Sep 2-Oct
DO
(mg/
L)
0.0
7.5
15.0
22.5
30.0
pH, T
emp
DO (mg/L) Temp (Degrees C) pH (SU)
Data prior to 10/4/00 potentially bad.
0
5
10
15
20
2-Oct 4-Oct 6-Oct 8-Oct 10-Oct 12-Oct
DO
(mg/
L)
0.0
7.5
15.0
22.5
30.0pH
, Tem
pDO (mg/L) Temp (Degrees C) pH (SU)
Data prior to 10/4/00 potentially bad.
T:/0146/36/Phase I/ Figures/Appendix C_Fig05cAppendix C Fig 5c Page 1 of 3 Wenck Associates, Inc.

Appendix C Figure C-5c
MPCA Long Prairie River Watershed TMDL Final Project Report
Diurnal DO Concentrations, pH, and Temperatureat LPR 42.2
Note: Readings recorded every two hours.
0
5
10
15
20
12-Oct 14-Oct 16-Oct 18-Oct 20-Oct 22-Oct
DO
(mg/
L)
0.0
7.5
15.0
22.5
30.0
pH, T
emp
DO (mg/L) Temp (Degrees C) pH (SU)
0
5
10
15
20
22-Oct 24-Oct 26-Oct 28-Oct 30-Oct 1-Nov
DO
(mg/
L)
0.0
7.5
15.0
22.5
30.0
pH, T
emp
DO (mg/L) Temp (Degrees C) pH (SU)
0
5
10
15
20
1-Nov 3-Nov 5-Nov 7-Nov 9-Nov 11-Nov
DO
(mg/
L)
0.0
7.5
15.0
22.5
30.0
pH, T
emp
DO (mg/L) Temp (Degrees C) pH (SU)
T:/0146/36/Phase I/ Figures/Appendix C_Fig05cAppendix C Fig 5c Page 2 of 3 Wenck Associates, Inc.
Appendix C Figure C-5c
MPCA Long Prairie River Watershed TMDL Final Project Report
Diurnal DO Concentrations, pH, and Temperatureat LPR 42.2
Note: Readings recorded every two hours.
0
5
10
15
20
11-Nov 13-Nov 15-Nov 17-Nov 19-Nov 21-Nov
DO
(mg/
L)
0
7.5
15
22.5
30
pH
, Tem
p
DO (mg/L) Temp (Degrees C) pH (SU)
T:/0146/36/Phase I/ Figures/Appendix C_Fig05cAppendix C Fig 5c Page 3 of 3 Wenck Associates, Inc.

Appendix C Figure C-6
MPCA Long Prairie River Watershed TMDL Final Project Report
Daily Maximum and Minimum DO Concentrations at LPR 47.2 and LPR 42.2
T:/0147/36/Phase 1/ Figures/Appendix C_ Fig05b, 6_Tab3/Appendix C Fig 6 Page 1 of 1 Wenck Associates, Inc.
0.00
2.00
4.00
6.00
8.00
10.00
12.00
14.00
16.00
13-Sep 18-Sep 23-Sep 28-Sep 3-Oct 8-Oct 13-Oct 18-Oct 23-Oct 28-Oct 2-Nov 7-Nov 12-Nov 17-Nov
Dis
solv
ed O
xyge
n (m
g/L)
Daily Max LPR 47.2 Daily Min LPR 47.2 Daily Max LPR 42.2 Daily Min LPR 42.2
Notes: 1. Data recorded for LPR 42.2 prior to October 5, 2000 is reportedly subject to equipment problems. 2. Irregular sample intervals atLPR 49.3 prevent accurate daily maximum and minimum values from being calculated.

Appendix C Figure C-7
MPCA Long Prairie River Watershed TMDL Final Project Report
Comparison of Continuous DO Concentrations at LPR 49.3, LPR 47.2, and LPR 42.2
T:/0147/51/Phase III Rpt Appendices/Appendix C_Fig07/Appendix C Figure 7 Page 1 of 1 Wenck Associates, Inc.
0
2
4
6
8
10
12
14
16
11-Sep-00 21-Sep-00 1-Oct-00 11-Oct-00 21-Oct-00 31-Oct-00 10-Nov-00 20-Nov-00
DO
(mg/
L)
LPR 49.3 LPR 47.2 LPR 42.2
Notes:1. Equipment difficulties were reported at LPR 42.2 prior to October 5, 2000. 2. Irregular sample interval at LPR 49.3 complicates a comparison of these data.

Appendix C Figure C-8
MPCA Long Prairie River Watershed TMDL Final Project Report
Average* Monthly Total Phosphorus and Total Nitrogen Concentrations at CWP Sites
(On-going Monitoring by Todd SWCD)
* Averages typically represent one to four data points.
LPR 89.9
0.0
0.5
1.0
1.5
2.0
Jan Feb Mar Apr May Jun Jul Aug Sep Oct Nov Dec
Tota
l Nitr
ogen
(mg/
L)
0.00
0.05
0.10
0.15
0.20
Tota
l Pho
spho
rus
(mg/
L)
1998 1999 2000 2001 2002 1998 1999 2000 2001 2002
LPR 85.5
0.0
0.5
1.0
1.5
2.0
Jan Feb Mar Apr May Jun Jul Aug Sep Oct Nov Dec
Tota
l Nitr
ogen
(mg/
L)
0.00
0.05
0.10
0.15
0.20
Tota
l Pho
spho
rus
(mg/
L)
1998 1999 2000 2001 2002 1999 2000 19982001 2002 2002
Total phosphorus values are represented in green. Total nitrogen values are represented in blue.
T:/0147/51/Phase III Rpt/Appendices/Appendix C_Fig08/Appendix C Figure 8 Page 1 of 5 Wenck Associates, Inc.

Appendix C Figure C-8
MPCA Long Prairie River Watershed TMDL Final Project Report
Average* Monthly Total Phosphorus and Total Nitrogen Concentrations at CWP Sites
(On-going Monitoring by Todd SWCD)
* Averages typically represent one to four data points.
LPR 67.0
0.0
0.5
1.0
1.5
2.0
Jan Feb Mar Apr May Jun Jul Aug Sep Oct Nov Dec
Tota
l Nitr
ogen
(mg/
L)
0.00
0.05
0.10
0.15
0.20
Tota
l Pho
spho
rus
(mg/
L)
1996 2997 1998 1996 2997 1998
LPR 56.0
0.0
0.5
1.0
1.5
2.0
Jan Feb Mar Apr May Jun Jul Aug Sep Oct Nov Dec
Tota
l Nitr
ogen
(mg/
L)
0.00
0.05
0.10
0.15
0.20
Tota
l Pho
spho
rus
(mg/
L)
1997 1998 1999 2000 2001 1997 1998 1999 2000 2001
Total phosphorus values are represented in green. Total nitrogen values are represented in blue.
T:/0147/51/Phase III Rpt/Appendices/Appendix C_Fig08/Appendix C Figure 8 Page 2 of 5 Wenck Associates, Inc.

Appendix C Figure C-8
MPCA Long Prairie River Watershed TMDL Final Project Report
Average* Monthly Total Phosphorus and Total Nitrogen Concentrations at CWP Sites
(On-going Monitoring by Todd SWCD)
* Averages typically represent one to four data points.
LPR 47.8
0.0
0.5
1.0
1.5
2.0
Jan Feb Mar Apr May Jun Jul Aug Sep Oct Nov Dec
Tota
l Nitr
ogen
(m
g/L)
0.00
0.05
0.10
0.15
0.20
Tota
l Pho
spho
rus
(mg/
L)
1997 1998 1999 2000 2001 1997 1998 1999 2000 2001
Total phosphorus values are represented in green. Total nitrogen values are represented in blue.
LPR 38.5
0.0
0.5
1.0
1.5
2.0
Jan Feb Mar Apr May Jun Jul Aug Sep Oct Nov Dec
Tota
l Nitr
ogen
(mg/
L)
0.00
0.05
0.10
0.15
0.20
Tota
l Pho
spho
rus
(mg/
L)
1998 1999 2000 2001 1999 2000 1998 2001
Note: Graph does not show September 1998 value for TN, 2.36 mg/L.
T:/0147/51/Phase III Rpt/Appendices/Appendix C_Fig08/Appendix C Figure 8 Page 3 of 5 Wenck Associates, Inc.

Appendix C Figure C-8
MPCA Long Prairie River Watershed TMDL Final Project Report
Average* Monthly Total Phosphorus and Total Nitrogen Concentrations at CWP Sites
(On-going Monitoring by Todd SWCD)
* Averages typically represent one to four data points.
LPR 34.2
0.0
0.5
1.0
1.5
2.0
Jan Feb Mar Apr May Jun Jul Aug Sep Oct Nov DecTota
l Nitr
ogen
(mg/
L)
0.00
0.05
0.10
0.15
0.20
Tota
l Pho
spho
rus
(mg/
L)
1997 1998 1999 2000 2001 1997 1998 1999 2000 2001
NOTE: Did not graph the TP values recorded at this station April 2000: 0.234 mg/L and July 1998, 0.259 mg/L or June 1997 TN value of 2.21 mg/L
LPR 21.1
0.0
0.5
1.0
1.5
2.0
Jan Feb Mar Apr May Jun Jul Aug Sep Oct Nov Dec
Tota
l Nitr
ogen
(mg/
L)
0.00
0.05
0.10
0.15
0.20
Tota
l Pho
spho
rus
(mg/
L)
2000 1999 2001 1999 2000 2001
Total phosphorus values are represented in green. Total nitrogen values are represented in blue.
T:/0147/51/Phase III Rpt/Appendices/Appendix C_Fig08/Appendix C Figure 8 Page 4 of 5 Wenck Associates, Inc.

Appendix C Figure C-8
MPCA Long Prairie River Watershed TMDL Final Project Report
Average* Monthly Total Phosphorus and Total Nitrogen Concentrations at CWP Sites
(On-going Monitoring by Todd SWCD)
* Averages typically represent one to four data points.
LPR 9.2
0.0
0.5
1.0
1.5
2.0
Jan Feb Mar Apr May Jun Jul Aug Sep Oct Nov Dec
Tota
l Nitr
ogen
(mg/
L)
0.00
0.05
0.10
0.15
0.20
Tota
l Pho
spho
rus
(mg/
L)
1996 1997 1998 1999 2000 2001 1996 1997 1998 1999 2000 2001
Total phosphorus values are represented in green. Total nitrogen values are represented in blue.
T:/0147/51/Phase III Rpt/Appendices/Appendix C_Fig08/Appendix C Figure 8 Page 5 of 5 Wenck Associates, Inc.

Appendix C Figure C-9
MPCA Long Prairie River Watershed TMDL Final Project Report
Total Phosphorus and Total Nitrogen Concentrations in the Long Prairie River LPR 3.2
T:/0147/51/Phase III Rpt/Appendices/Appendix C_Figs09_10/Appendix C Fig 9 Page 1 of 1 Wenck Associates, Inc.
0
0.1
0.2
0.3
0.4
0.5
0.6
0.7
0.8
74 76 78 80 82 84 86 88 90 92 94 96
Year
Tota
l Pho
spho
rus
(mg/
L)
0.0
0.5
1.0
1.5
2.0
2.5
3.0
3.5
4.0
Tota
l Nitr
ogen
(mg/
L)
Total Phosphorus Total Nitrogen
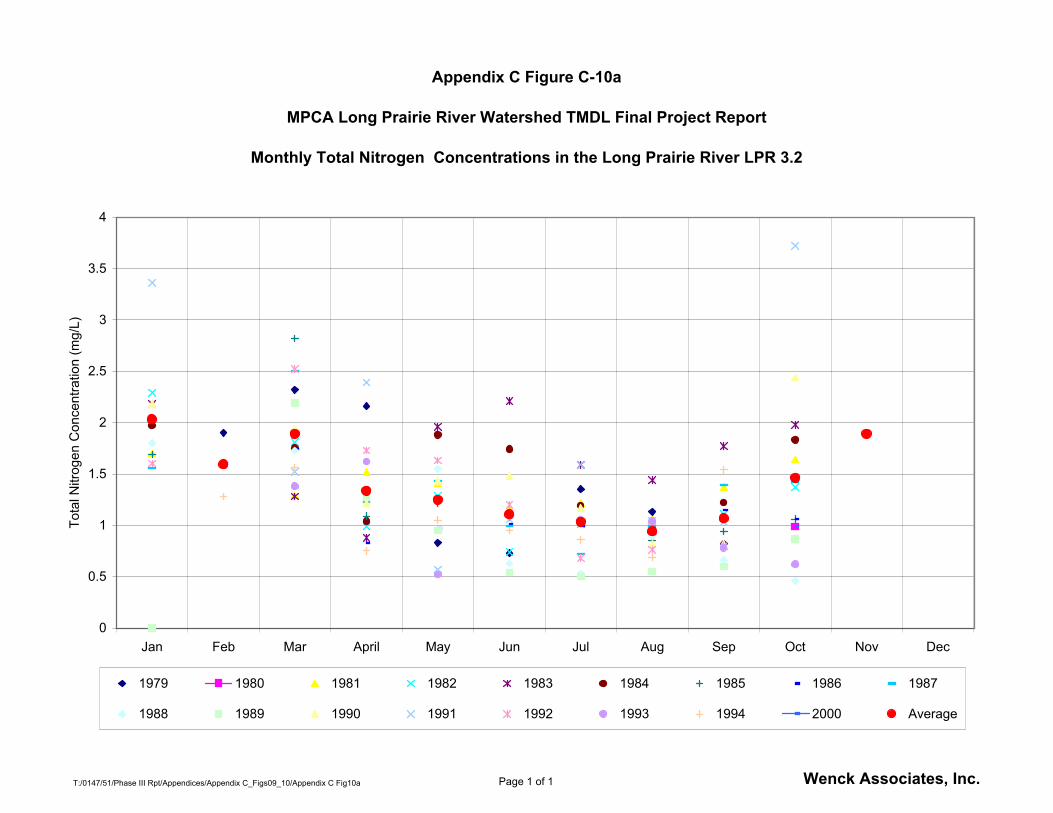
Appendix C Figure C-10a
MPCA Long Prairie River Watershed TMDL Final Project Report
Monthly Total Nitrogen Concentrations in the Long Prairie River LPR 3.2
T:/0147/51/Phase III Rpt/Appendices/Appendix C_Figs09_10/Appendix C Fig10a Page 1 of 1 Wenck Associates, Inc.
0
0.5
1
1.5
2
2.5
3
3.5
4
Jan Feb Mar April May Jun Jul Aug Sep Oct Nov Dec
Tota
l Nitr
ogen
Con
cent
ratio
n (m
g/L)
1979 1980 1981 1982 1983 1984 1985 1986 1987
1988 1989 1990 1991 1992 1993 1994 2000 Average
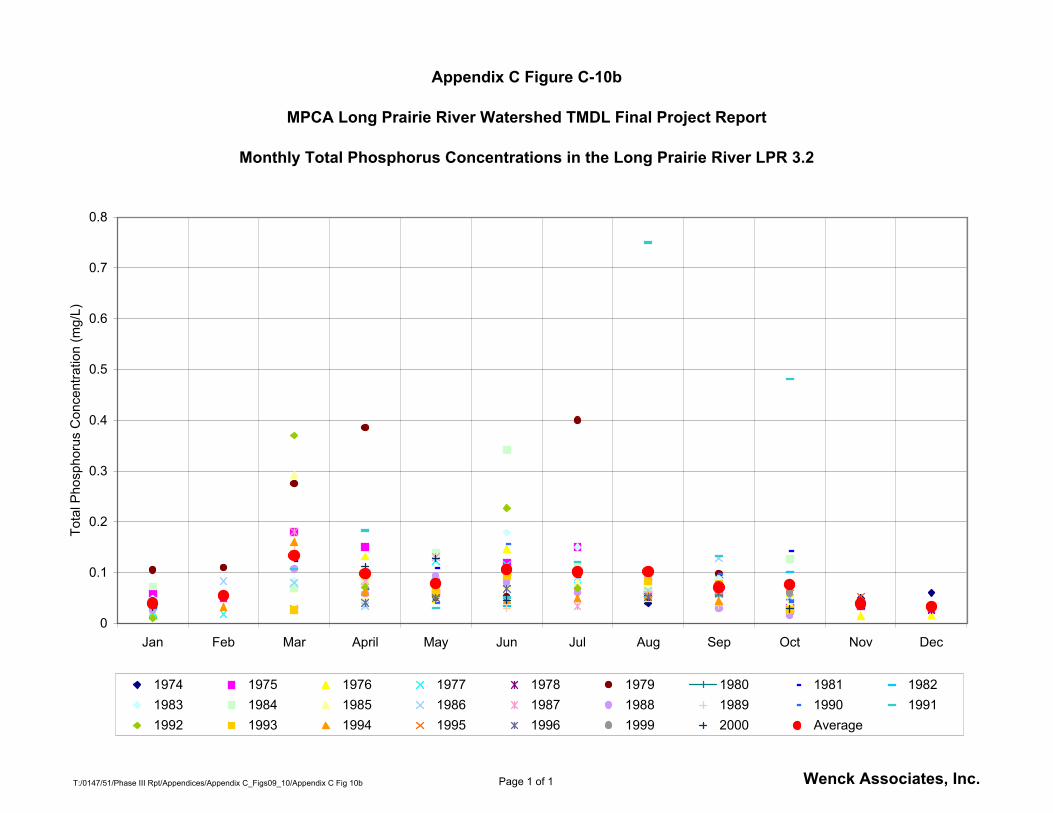
Appendix C Figure C-10b
MPCA Long Prairie River Watershed TMDL Final Project Report
Monthly Total Phosphorus Concentrations in the Long Prairie River LPR 3.2
T:/0147/51/Phase III Rpt/Appendices/Appendix C_Figs09_10/Appendix C Fig 10b Page 1 of 1 Wenck Associates, Inc.
0
0.1
0.2
0.3
0.4
0.5
0.6
0.7
0.8
Jan Feb Mar April May Jun Jul Aug Sep Oct Nov Dec
Tota
l Pho
spho
rus
Con
cent
ratio
n (m
g/L)
1974 1975 1976 1977 1978 1979 1980 1981 19821983 1984 1985 1986 1987 1988 1989 1990 19911992 1993 1994 1995 1996 1999 2000 Average

Appendix C Figure C-11a
MPCA Long Prairie River Watershed TMDL Final Project Report
Long Prairie River Profile Graphs for Selected Water Quality Parameters June 1996- 2002
*Averages typically represent one to four data points.
Ammonia Nitrogen Profile
0.000.050.100.150.200.25
0102030405060708090River Mile
NH
3 -N
Con
cent
ratio
n (m
g/L)
1996 1997 1998 1999 2000 2001 2002
NO2 /NO3 Nitrogen Profile
0.00.20.40.60.81.0
0102030405060708090
River Mile
NO
2 /N
O3-N
C
once
ntra
tion
(mg/
L)
1996 1997 1998 1999 2000 2001 2002
MotleyHeadwaters
Total Phosphorus Profile
0.000
0.100
0.200
0.300
0102030405060708090
River Mile
TP
Con
cent
ratio
n (m
g/L)
1996 1997 1998 1999 2000 2001 2002
MotleyHeadwaters
T:/0147/51/Phase II/Figures/Appendix C_Fig11/App C Fig 11a Page 1 of 2 Wenck Associates, Inc.
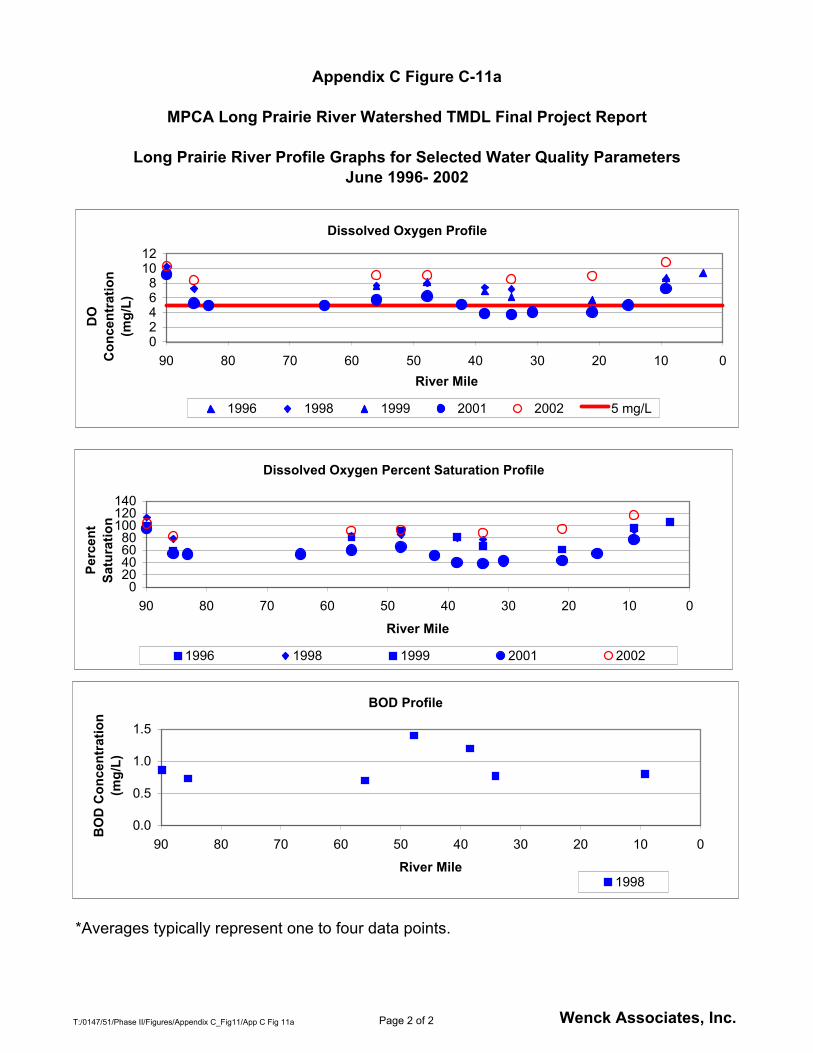
Appendix C Figure C-11a
MPCA Long Prairie River Watershed TMDL Final Project Report
Long Prairie River Profile Graphs for Selected Water Quality Parameters June 1996- 2002
*Averages typically represent one to four data points.
Dissolved Oxygen Profile
02468
1012
0102030405060708090River Mile
DO
C
once
ntra
tion
(mg/
L)
1996 1998 1999 2001 2002 5 mg/L
BOD Profile
0.0
0.5
1.0
1.5
0102030405060708090
River Mile
BO
D C
once
ntra
tion
(mg/
L)
1998
Dissolved Oxygen Percent Saturation Profile
020406080
100120140
0102030405060708090
River Mile
Perc
ent
Satu
ratio
n
1996 1998 1999 2001 2002
T:/0147/51/Phase II/Figures/Appendix C_Fig11/App C Fig 11a Page 2 of 2 Wenck Associates, Inc.

Appendix C Figure C-11b
MPCA Long Prairie River Watershed TMDL Final Project Report
Long Prairie River Profile Graphs for Selected Water Quality Parameters July 1996- 2002
*Averages typically represent one to four data points.
Ammonia Nitrogen Profile
0.000.050.100.150.200.25
0102030405060708090
River Mile
NH
3 -N
C
once
ntra
tion
(mg/
L)
1997 1998 1999 2000 2001 2002
July 1999 Value at LPR 47.7= 0.4 mg/L
NO2 /NO3 Nitrogen Profile
00.10.20.30.40.50.6
0102030405060708090
River Mile
NO
2 /N
O3 -
N
Con
cent
ratio
n (m
g/L)
1996 1997 1998 1999 2000 2001 2002
MotleyHeadwaters
Total Phosphorus Profile
0.00
0.10
0.20
0.30
0102030405060708090
River Mile
TP
Con
cent
ratio
n (m
g/L)
1997 1998 1999 2000 2001 2002
MotleyHeadwaters
T:/0147/51/Phase II/Figures/Appendix C_Fig11/App C Fig 11b Page 1 of 2 Wenck Associates, Inc.

Appendix C Figure C-11b
MPCA Long Prairie River Watershed TMDL Final Project Report
Long Prairie River Profile Graphs for Selected Water Quality Parameters July 1996- 2002
*Averages typically represent one to four data points.
Dissolved Oxygen Profile
02468
1012
0102030405060708090River Mile
DO
Con
cent
ratio
n (m
g/L)
1996 1998 1999 2000 2001 2002 5 mg/L DO Standard
Dissolved Oxygen Percent Saturation
020406080
100120140
0102030405060708090
River Mile
Perc
ent S
atur
atio
n
1996 1998 1999 2000 2001 2002
MotleyHeadwaters
T:/0147/51/Phase II/Figures/Appendix C_Fig11/App C Fig 11b Page 2 of 2 Wenck Associates, Inc.
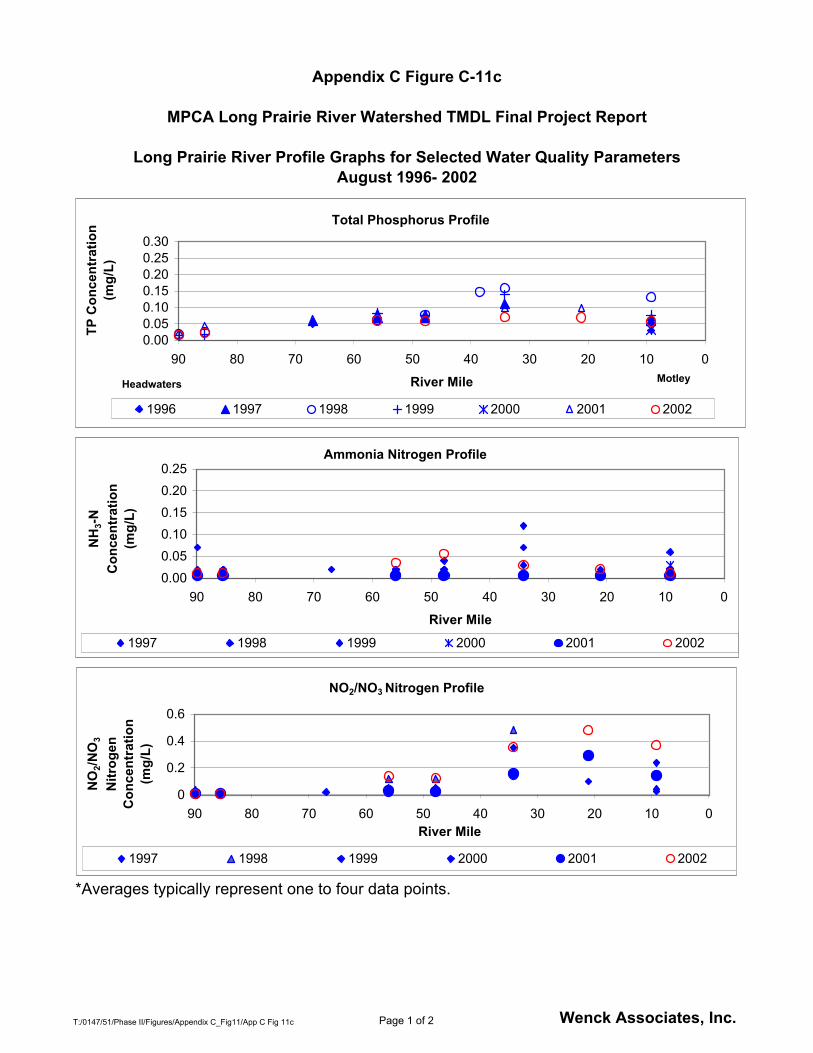
Appendix C Figure C-11c
MPCA Long Prairie River Watershed TMDL Final Project Report
Long Prairie River Profile Graphs for Selected Water Quality Parameters August 1996- 2002
*Averages typically represent one to four data points.
Ammonia Nitrogen Profile
0.000.050.100.150.200.25
0102030405060708090
River Mile
NH
3-N
Con
cent
ratio
n (m
g/L)
1997 1998 1999 2000 2001 2002
NO2/NO3 Nitrogen Profile
0
0.2
0.4
0.6
0102030405060708090River Mile
NO
2/NO
3
Nitr
ogen
C
once
ntra
tion
(mg/
L)
1997 1998 1999 2000 2001 2002
Total Phosphorus Profile
0.000.050.100.150.200.250.30
0102030405060708090
River Mile
TP C
once
ntra
tion
(mg/
L)
1996 1997 1998 1999 2000 2001 2002
MotleyHeadwaters
T:/0147/51/Phase II/Figures/Appendix C_Fig11/App C Fig 11c Page 1 of 2 Wenck Associates, Inc.

Appendix C Figure C-11c
MPCA Long Prairie River Watershed TMDL Final Project Report
Long Prairie River Profile Graphs for Selected Water Quality Parameters August 1996- 2002
*Averages typically represent one to four data points.
Dissolved Oxygen Profile
0102030405060708090River Mile
DO
C
once
ntra
tion
(mg/
L)
1996 1998 1999 2000 2001 2002 5 mg/L DO Standard
Dissolved Oxygen Percent Saturation Profile
020406080
100120140
0102030405060708090
River Mile
Perc
ent S
atur
atio
n
1996 1998 1999 2000 2001 2002
MotleyHeadwaters
T:/0147/51/Phase II/Figures/Appendix C_Fig11/App C Fig 11c Page 2 of 2 Wenck Associates, Inc.

Appendix D Table D-1
MPCA Long Prairie River Watershed TMDL Final Project Report
Laboratory Sampling Parameters and Methods
Parameter
EPA Analytical Method* Preservation
Holding Times Recommended
/Regulatory Maximum
Detection Limits
Carbonaceous BOD (20 day time series) 405.1 Refrigerate at 4 degrees C 6 hours/48 hours 2 mg/LCarbonaceous BOD (5 day time series) Refrigerate at 4 degrees C 2 mg/L
Carbonaceous BOD (Ultimate) Refrigerate at 4 degrees C
Ammonia, Nitrogen 350.1
Analyze immediately, or add H2SO4 to pH < 2 and refrigerate
at 4 degrees C 7 days/28 days 0.05 mg/L
Total Kjeldahl Nitrogen (TKN) 351.3Add H2SO4 to pH < 2 and refrigerate at 4 degrees C 7 days/28 days 0.05 mg/L
Nitrite-Nitrate, Nitrogen 353.4Add H2SO4 to pH < 2 and refrigerate at 4 degrees C None/28 days 0.05 mg/L
Total Phosphorus (TP) 365.4 Refrigerate 28 days 0.01 mg/L
Orthophosphate, Phosphorus 365.4Filter as soon as possible. Refrigerate at 4 degrees C 6 hours/48 hours 0.01 mg/L
Chloride 300 Refrigerate 30 days 1 mg/L
Total Suspended Solids (TSS) 160.2 Refrigerate 7 days 1 mg/L
Algae Idendification and Enumeration --- Lugels Iodine, Refrigerate ---
variable (organisms
/L)Chlorophyll a AOAC 3.10 Refrigerate 30 days 0.001 mg/L
T:/0147/51/Phase III Rpt/Appendices/Appendix D_Tab1_3/Appendix D Table 1 Page 1 of 1 Wenck Associates, Inc.

Appendix D Table D-2
MPCA Long Prairie River Watershed TMDL Final Project Report
Blind Duplicate Water Quality Sample Results
DATE
TMDL STUDY NAME CWP Site Name
Chloride (mg/L) TSS (mg/L)
Ammonia- N (mg/L)
Kjeldahl Nitrogen (mg/L)
NO2- NO3/N (mg/L) OP (mg/L) TP (mg/L)
CBOD 5-Day (mg/L)
CBOD 20-Day (mg/L)
Chloro-A (ug/L)
08/21/01 LPR 47.8 Site 07- Dup 25.3 6 <0.02 0.4 <0.2 0.031 0.047 <2 4 1.108/21/01 LPR 47.8 Site 07 24.9 7 <0.02 0.4 <0.2 0.028 0.06 <2 <2 1.6
Relative Percent Difference 2% 15% 0% 10% 24% 37%
08/21/01 LPR 89.9 Site 09- Dup 28.1 9 <0.02 0.7 <0.2 <0.005 <0.005 <2 4 2.108/21/01 LPR 89.9 Site 09 27.9 10 <0.02 0.9 <0.2 <0.005 <0.005 <6 7 2.9
Relative Percent Difference 1% 11% 25% 55% 32%
09/25/01 LPR 47.8 Site 07 -Dup -- 4 <0.02 0.9 <0.2 -- 0.020 <2 5.00 1.109/25/01 LPR 47.8 Site 07 20.8 5 <0.02 0.3 <0.2 0.024 0.028 <2 <2 1.4
Relative Percent Difference 22% 100% 33% 24%
09/25/01 LPR 67.0 Site 01- Dup 21.2 2 <0.02 0.6 <0.2 0.019 0.024 <2 10 <109/25/01 LPR 67.0 Site 01 21.0 3 <0.02 0.4 <0.2 0.021 0.024 <2 10 <1
Relative Percent Difference 1% 40% 40% 10% 0% 0%run at 4 degrees C
02/07/02 LPR 89.9 Site 09- Dup 30.6 2 0.05 0.6 <0.2 <0.005 <0.005 <2 3 --02/07/02 LPR 89.9 30.2 4 0.03 0.8 <0.2 <0.005 <0.005 <2 3 --
Relative Percent Difference 1% 67% 50% 29% 0%run at 4 degrees C
02/08/02 T LPR 15.8 Site 08- Moran Creek 8 3 0.24 0.1 0.24 0.008 0.008 <2 <2 --02/08/02 T LPR 15.8 Site 08- Moran Creek_Dup 7.4 3 0.23 <0.1 0.23 0.008 0.011 <2 <2 --
Relative Percent Difference 8% 0% 4% 4% 0% 32%
T:\0147\51\Phase III Rpt\Appendices\Appendix D_Tab1_3\Appendix D Table 2 Page 1 of 1 Wenck Associates, Inc.

Appendix D Table D-3
MPCA Long Prairie River Watershed TMDL Final Project Report
Data Quality for Measurement Data
������������������������������������������������������������������������������������������������������������������������������������������������������������������������������������������������������������������������������������������������������������������������������������������������������������������������������������������������������
������������������������������������������������������������������������������������������������������������������������������������������������������������������������������������������������������������������������������������������������������������������������������������������������������������������������������������������������������
������������������������������������������������������������������������������������������������������������������������������������������������������������������������������������������������������������������������������������������������������������������������������������������������������������������������������������������������������
������������������������������������������������������������������������������������������������������������������������������������������������������������������������������������������������������������������������������������������������������������������������������������������������������������������������������������������������������
������������������������������������������������������������������������������������������������������������������������������������������������������������������������������������������������������������������������������������������������������������������������������������������������������������������������������������������������������
PARAMETER UNITSMETHOD
TYPE METHODMETHOD DESCRIP. STORET CODE
Min. Anal. Level
PRECISION of duplicates
ACCURACY of matrix spikes
ACCURACY (Certified Reference Material)
PERCENT COMPLETE
(RPD) % recovery
Field MeasurementsPH std units EPA 150.1 and
MPCA SOP400 NA 10% NA NA 90%
DO mg/L EPA 360.1 and MPCA SOP
300 NA 10% NA NA 90%
Conductivity uS/cm EPA 120.1 and MPCA SOP
94 NA 10% NA NA 90%
Temperature °C EPA170.1 and MPCA SOP
10 NA 10% NA NA 90%
Flow cfs USGS* and MPCA SOP
61 NA NA NA NA 90%
Laboratory AnalysesTSS mg/L gravimetric EPA 160.2 530 2 20% NA NA 90%
Chloride mg/L titrimetric EPA 325.2 940 1 20% 80-120% NA 90%Ammonia N mg/L electrode EPA 350.3 Total 610 0.05 20% 80-120% NA 90%
Nitrate + Nitrite N mg/L EPA 353.2 Total 630 0.1 20% 80-120% NA 90%TKN mg/L titrimetric EPA 351.3 Total 625 0.3 20% 80-120% NA 90%
Total Phosphorus mg/L colorimetric EPA 365.3 Total 665 0.01 20% 80-120% NA 90%Chlorophyll-A mg/L colorimetric Std.Method
10200-H32211 0.01 20% NA NA 90%
Carbonaceous BOD (20 day time series)
mg/L Std.Method 5210-C
80082 (Reading on day 5)
2 NA NA NA 90%
*Note: USGS procedures are found in “Measurement and Computation of Streamflow: Volume 1. Measurement of Stage and Discharge” (1982).
T:/0147/51/Phase III RPT/Appendices/Appendix D_Tab1_3/Appendix D Table 3 Page 1 of 1 Wenck Associates, Inc.

Appendix D Table D-4a
Minnesota Pollution Control AgencyLong Prairie River Watershed TMDL Final Project Report
Calculation of ∆DO from Continuous DO Measurements at LPR 88.3 and LPR 85.5
LPR 88.3
Date Daily MaxTime of Daily
Max Daily MinTime of
Daily Min ∆DO8/5-6/2002 10.13 5:35 PM 5.23 7:05 AM 4.9
LPR 85.5
Date Daily MaxTime of Daily
Max Daily MinTime of
Daily Min ∆DO8/23/01 3.56 3:30 PM 0.77 7:30 AM 2.799/13/01 5.69 5:01 PM 3.02 10:01 AM 2.679/14/01 4.22 5:01 PM 3.04 9:01 AM 1.189/15/01 4.33 5:01 PM 2.78 9:01 AM 1.559/16/01 4.11 4:01 PM 3.08 9:01 AM 1.039/17/01 4.23 6:01 PM 2.87 8:01 AM 1.369/18/01 4.28 3:01 PM 2.97 9:01 AM 1.319/19/01 5.28 5:01 PM 2.87 9:01 AM 2.419/20/01 4.52 6:01 PM 3.4 9:01 AM 1.129/21/01 5.79 5:01 PM 3.13 8:01 AM 2.669/22/01 5.18 4:01 PM 3.86 8:01 AM 1.329/23/01 6.57 6:01 PM 3.89 8:01 AM 2.68
8/5-6/2002 6.38 5:15 PM 2.63 7:15 AM 3.75Statistics for LPR 85.5
∆DO Mean= 1.99 ∆DO Standard Dev.= 0.87
∆DO n= 13 ∆DO min= 1.03 ∆DO max= 3.75
T:/0147/51/Phase III Rpt/Figures/Appendix D_Fig 08_Tab4a/Appendix D Table D-4a4/23/03; 10:55 AM Page 1 of 1 Wenck Associates, Inc.

Appendix D Table D-4b
Minnesota Pollution Control AgencyLong Prairie River Watershed TMDL Final Project Report
Calculation of ∆DO from Continuous DO Measurements at LPR 21.1 and LPR 18.2
LPR 21.1
Date Daily MaxTime of
Daily Max Daily MinTime of
Daily Min ∆DO8/24/01 7.99 3:00 PM 5.03 8:00 AM 2.96
LPR 18.2
Date Daily MaxTime of
Daily Max Daily MinTime of
Daily Min ∆DO9/12/01 9.95 3:01 PM 7.32 7:01 AM 2.639/13/01 10.66 4:01 PM 7.48 7:01 AM 3.189/14/01 9.29 5:01 PM 7.68 8:01 AM 1.619/15/01 9.87 4:01 PM 7.94 8:01 AM 1.939/16/01 9.63 4:01 PM 7.98 8:01 AM 1.659/17/01 9.7 5:01 PM 7.95 8:01 AM 1.759/18/01 9.48 3:01 PM 7.87 8:01 AM 1.619/19/01 10.04 5:01 PM 7.8 8:01 AM 2.249/20/01 9.45 5:01 PM 7.76 8:01 AM 1.699/21/01 10.36 3:01 PM 7.85 7:01 AM 2.519/22/01 9.39 4:01 PM 8.03 7:01 AM 1.369/23/01 11.18 4:01 PM 8.43 8:01 AM 2.759/24/01 11.62 4:01 PM 9.08 6:01 AM 2.54
Statistics for LPR 18.2 ∆DO Mean= 2.1115
∆DO Standard Dev.= 0.56 ∆DO n= 13
∆DO min= 1.36 ∆DO max= 3.18
T:/0185/04/51/Phase III Report/Appendices/Appendix D_Fig 07_Tab4bAppendix D Table D-4b 4/23/03; 10:57 AM Page 1 of 1 Wenck Associates, Inc.

T:\0147\51\Phase III Rpt\Appendices/Appendix D_Fig 01_2a-d/Appendix D Figure 14/23/03; 10:59 AM Page 1 of 1 Wenck Associates, Inc.
Appendix D Figure D-1
Minnesota Pollution Control AgencyLong Prairie River Watershed TMDL Final Project Report
Comparison of Long Prairie River Flow Profiles for Each Synoptic Survey
0
50
100
150
200
250
300
0102030405060708090River Mile
Gau
ged
Flow
(cfs
)
Survey 1
Survey 2
Survey 3

Appendix D Figure D-2a
Minnesota Pollution Control AgencyLong Prairie River Watershed TMDL Final Project Report
Long Prairie River Profile Graphs:Synoptic Survey #1
August 20 to 24, 2001
Not all tributaries contributed flow during this survey, see Table 9a for flow & loading data.
0
2
4
6
8
10
12
14
16
0102030405060708090River Mile
Con
cent
ratio
n (m
g/L)
20%
40%
60%
80%
100%
120%
140%
DO
Per
cent
Sa
tura
tion
DO Concentration- Main Stem DO Concentration-Tributaries 5 mg/L DO StandardDO Percent Saturation- Main Stem DO Percent Saturation- Tributaries
02468
101214161820
0102030405060708090River Mile
Con
cent
ratio
n (m
g/L)
CBOD 5- Main Stem
CBOD 5- Tributaries
CBOD 20- Main Stem
CBOD 20- Tributaries
0
5
10
15
20
25
0102030405060708090
River Mile
Tem
pera
ture
(deg
rees
C)
Main Stem TemperaturesTributary Temperatures
T:\0147\51\Phase III Rpt\Appendices/Appendix D_Fig 01_2a-d/Appendix D Figure D-2a4/23/03; 10:59 AM Page 1 of 3 Wenck Associates, Inc.

Appendix D Figure D-2a
Minnesota Pollution Control AgencyLong Prairie River Watershed TMDL Final Project Report
Long Prairie River Profile Graphs:Synoptic Survey #1
August 20 to 24, 2001
0.00
0.25
0.50
0.75
1.00
1.25
1.50
0102030405060708090River Mile
Con
cent
ratio
n (m
g/L)
NO2/NO3- Main Stem
NO2/NO3- Tributaries
Ammonia- Main Stem
Ammonia- Tributaries
Kjeldahl- Main Stem
Kjeldahl- Tributaries
0.00
0.05
0.10
0.15
0.20
0.25
0102030405060708090
River Mile
Con
cent
ratio
n (m
g/L)
Total Phosphorus- Main Stem Total Phosphorus- TributariesOrtho Phosphorus- Main StemOrtho Phosphorus- Tributaries
6.0
6.5
7.0
7.5
8.0
8.5
9.0
0102030405060708090River Mile
pH (S
tand
ard
Uni
ts)
pH- Main StempH- Tributaries
T:\0147\51\Phase III Rpt\Appendices/Appendix D_Fig 01_2a-d/Appendix D Figure D-2a4/23/03; 10:59 AM Page 2 of 3 Wenck Associates, Inc.

Appendix D Figure D-2a
Minnesota Pollution Control AgencyLong Prairie River Watershed TMDL Final Project Report
Long Prairie River Profile Graphs:Synoptic Survey #1
August 20 to 24, 2001
250300350400450500550600650700
0102030405060708090
River Mile
Con
duct
ivity
(um
hos)
Conductivity- Main StemConductivity- Tributaries
0
2
4
6
8
10
12
0102030405060708090
River Mile
Con
cent
ratio
n (m
g/L)
Total Suspended Solids- Main Stem
Total Suspended Solids- Tributaries
05
10152025303540
0102030405060708090
River Mile
Con
cent
ratio
n (m
g/L)
Chloride- Main StemChloride- Tributaries
T:\0147\51\Phase III Rpt\Appendices/Appendix D_Fig 01_2a-d/Appendix D Figure D-2a4/23/03; 10:59 AM Page 3 of 3 Wenck Associates, Inc.

Appendix D Figure D-2b
Minnesota Pollution Control AgencyLong Prairie River Watershed TMDL Final Project Report
Long Prairie River Profile Graphs:Synoptic Survey #2
September 24 and 25, 2001
Not all tributaries contributed flow during this survey, see Table 9a for flow & loading data.
0
2
4
6
8
10
12
14
16
0102030405060708090 River Mile
Con
cent
ratio
n (m
g/L)
20%
40%
60%
80%
100%
120%
140%
DO
Per
cent
Sa
tura
tion
DO Concentration- Main Stem DO Concentration-Tributaries 5 mg/L DO StandardDO Percent Saturation- Main Stem DO Percent Saturation- Tributaries
02468
101214161820
0102030405060708090River Mile
Con
cent
ratio
n (m
g/L)
CBOD 5- Main Stem CBOD 5- Tributaries
CBOD 20- Main Stem CBOD 20- Tributaries
0
5
10
15
20
25
0102030405060708090
River Mile
Tem
pera
ture
(deg
rees
C)
Main Stem TemperaturesTributary Temperatures
T:\0147\51\Phase III Rpt\Appendices/Appendix D_Fig 01_2a-d/Appendix D Figure D-2b4/23/03; 11:00 AM Page 1 of 3 Wenck Associates, Inc.

Appendix D Figure D-2b
Minnesota Pollution Control AgencyLong Prairie River Watershed TMDL Final Project Report
Long Prairie River Profile Graphs:Synoptic Survey #2
September 24 and 25, 2001
0.00
0.25
0.50
0.75
1.00
1.25
1.50
0102030405060708090River Mile
Con
cent
ratio
n (m
g/L)
NO2/NO3- Main Stem NO2/NO3- TributariesAmmonia- Main StemAmmonia- TributariesKjeldahl- Main StemKjeldahl- Tributaries
0.00
0.05
0.10
0.15
0.20
0.25
0102030405060708090
River Mile
Con
cent
ratio
n (m
g/L)
Total Phosphorus- Main Stem Total Phosphorus- TributariesOrtho Phosphorus- Main StemOrtho Phosphorus- Tributaries
6.0
6.5
7.0
7.5
8.0
8.5
9.0
0102030405060708090River Mile
pH (S
tand
ard
Uni
ts)
pH- Main StempH- Tributaries
pH Meter Malfunction in Upper Watershed
T:\0147\51\Phase III Rpt\Appendices/Appendix D_Fig 01_2a-d/Appendix D Figure D-2b4/23/03; 11:00 AM Page 2 of 3 Wenck Associates, Inc.

Appendix D Figure D-2b
Minnesota Pollution Control AgencyLong Prairie River Watershed TMDL Final Project Report
Long Prairie River Profile Graphs:Synoptic Survey #2
September 24 and 25, 2001
250300350400450500550600650700
0102030405060708090
River Mile
Con
duct
ivity
(um
hos)
Conductivity- Main StemConductivity- Tributaries
0
2
4
6
8
10
12
0102030405060708090
River Mile
Con
cent
ratio
n (m
g/L)
Total Suspended Solids- Main Stem
Total Suspended Solids- Tributaries
05
10152025303540
0102030405060708090
River Mile
Con
cent
ratio
n (m
g/L)
Chloride- Main StemChloride- Tributaries
T:\0147\51\Phase III Rpt\Appendices/Appendix D_Fig 01_2a-d/Appendix D Figure D-2b4/23/03; 11:00 AM Page 3 of 3 Wenck Associates, Inc.

Appendix D Figure D-2c
Minnesota Pollution Control AgencyLong Prairie River Watershed TMDL Final Project Report
Long Prairie River Profile Graphs:Synoptic Survey #3
February 7 and 8, 2002
Not all tributaries contributed flow during this survey, see Table 9a for flow & loading data.
0
2
4
6
8
10
12
14
16
0102030405060708090River Mile
Con
cent
ratio
n (m
g/L)
20%
40%
60%
80%
100%
120%
140%
DO
Per
cent
Sat
urat
ion
DO Concentration- Main Stem DO Concentration-Tributaries 5 mg/L DO StandardDO Percent Saturation- Main Stem DO Percent Saturation- Tributaries
02468
101214161820
0102030405060708090River Mile
Con
cent
ratio
n (m
g/L)
CBOD 5- Main Stem
CBOD 5- Tributaries
CBOD 20- Main Stem
CBOD 20- Tributaries
0
5
10
15
20
25
0102030405060708090
River Mile
Tem
pera
ture
(deg
rees
C)
Tributary TemperaturesMain Stem Temperatures
T:\0147\51\Phase III Rpt\Appendices/Appendix D_Fig 01_2a-d/Appendix D Figure D-2c4/23/03; 11:01 AM Page 1 of 3 Wenck Associates, Inc.

Appendix D Figure D-2c
Minnesota Pollution Control AgencyLong Prairie River Watershed TMDL Final Project Report
Long Prairie River Profile Graphs:Synoptic Survey #3
February 7 and 8, 2002
0.00
0.25
0.50
0.75
1.00
1.25
1.50
0102030405060708090River Mile
Con
cent
ratio
n (m
g/L)
NO2/NO3- Main Stem
NO2/NO3- Tributaries
Ammonia- Main Stem
Ammonia- Tributaries
Kjeldahl- Main Stem
Kjeldahl- Tributaries
0.00
0.05
0.10
0.15
0.20
0.25
0102030405060708090
River Mile
Con
cent
ratio
n (m
g/L)
Total Phosphorus- Main Stem Total Phosphorus- TributariesOrtho Phosphorus- Main StemOrtho Phosphorus- Tributaries
6.0
6.5
7.0
7.5
8.0
8.5
9.0
0102030405060708090River Mile
pH (S
tand
ard
Uni
ts)
pH- Main StempH- Tributaries
T:\0147\51\Phase III Rpt\Appendices/Appendix D_Fig 01_2a-d/Appendix D Figure D-2c4/23/03; 11:01 AM Page 2 of 3 Wenck Associates, Inc.

Appendix D Figure D-2c
Minnesota Pollution Control AgencyLong Prairie River Watershed TMDL Final Project Report
Long Prairie River Profile Graphs:Synoptic Survey #3
February 7 and 8, 2002
250300350400450500550600650700
0102030405060708090River Mile
Con
duct
ivity
(um
hos)
Conductivity- Main StemConductivity- Tributaries
0
2
4
6
8
10
12
0102030405060708090
River Mile
Con
cent
ratio
n (m
g/L)
Total Suspended Solids- Main Stem
Total Suspended Solids- Tributaries
05
10152025303540
0102030405060708090
River Mile
Con
cent
ratio
n (m
g/L) Chloride- Main Stem
Chloride- Tributaries
T:\0147\51\Phase III Rpt\Appendices/Appendix D_Fig 01_2a-d/Appendix D Figure D-2c4/23/03; 11:01 AM Page 3 of 3 Wenck Associates, Inc.

Appendix D Figure D-2d
Minnesota Pollution Control AgencyLong Prairie River Watershed TMDL Final Project Report
Long Prairie River Profile Graphs:Special Survey #1
August 2, 2001
0
2
4
6
8
10
12
14
16
85.085.586.086.587.087.588.088.589.089.590.0River Mile
Con
cent
ratio
n (m
g/L)
20%
40%
60%
80%
100%
120%
140%
DO
Per
cent
Sa
tura
tion
DO Concentration- Main Stem 5 mg/L DO Standard DO Percent Saturation- Main Stem
02468
101214161820
85.085.586.086.587.087.588.088.589.089.590.0River Mile
Con
cent
ratio
n (m
g/L) CBOD 5- Main Stem
0
5
10
15
20
25
30
85.085.586.086.587.087.588.088.589.089.590.0
River Mile
Tem
pera
ture
(deg
rees
C)
Main Stem Temperatures
T:\0147\51\Phase III Rpt\Appendices/Appendix D_Fig 01_2a-d/Appendix D Figure D-2d4/23/03; 11:02 AM Page 1 of 3 Wenck Associates, Inc.
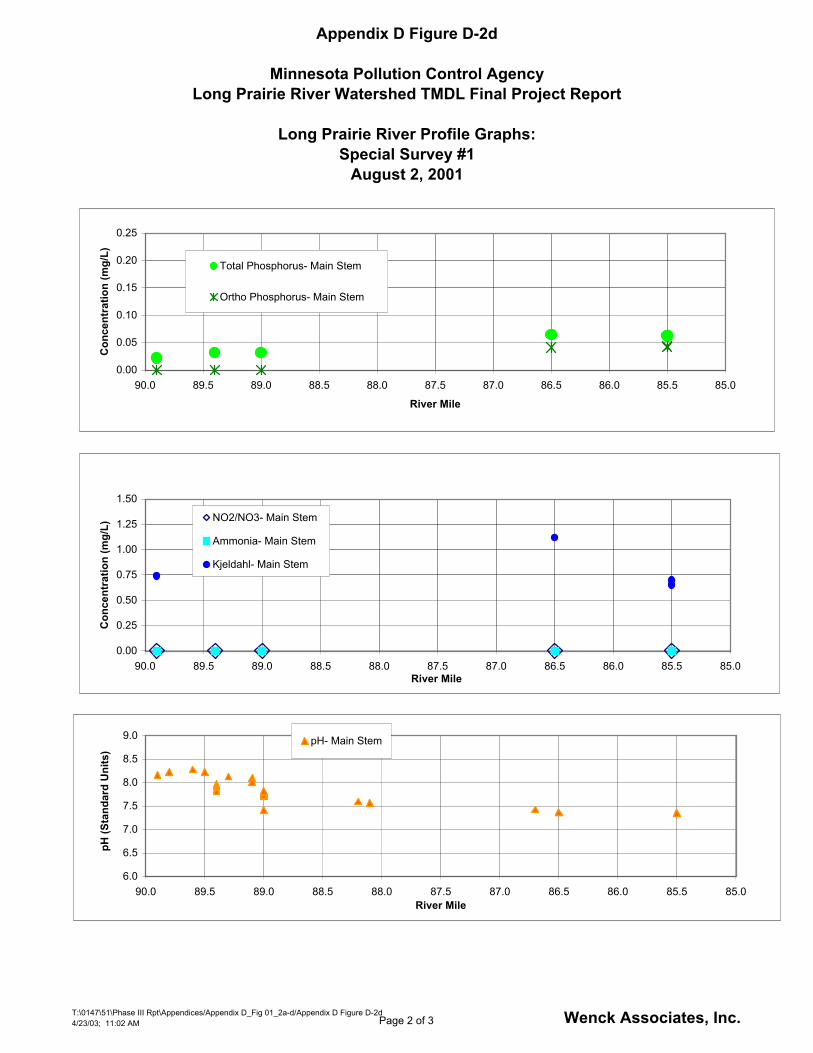
Appendix D Figure D-2d
Minnesota Pollution Control AgencyLong Prairie River Watershed TMDL Final Project Report
Long Prairie River Profile Graphs:Special Survey #1
August 2, 2001
0.00
0.25
0.50
0.75
1.00
1.25
1.50
85.085.586.086.587.087.588.088.589.089.590.0River Mile
Con
cent
ratio
n (m
g/L)
NO2/NO3- Main Stem
Ammonia- Main Stem
Kjeldahl- Main Stem
0.00
0.05
0.10
0.15
0.20
0.25
85.085.586.086.587.087.588.088.589.089.590.0
River Mile
Con
cent
ratio
n (m
g/L)
Total Phosphorus- Main Stem
Ortho Phosphorus- Main Stem
6.0
6.5
7.0
7.5
8.0
8.5
9.0
85.085.586.086.587.087.588.088.589.089.590.0River Mile
pH (S
tand
ard
Uni
ts)
pH- Main Stem
T:\0147\51\Phase III Rpt\Appendices/Appendix D_Fig 01_2a-d/Appendix D Figure D-2d4/23/03; 11:02 AM Page 2 of 3 Wenck Associates, Inc.

Appendix D Figure D-2d
Minnesota Pollution Control AgencyLong Prairie River Watershed TMDL Final Project Report
Long Prairie River Profile Graphs:Special Survey #1
August 2, 2001
250
300
350
400
450
500
550
600
650
700
85.085.586.086.587.087.588.088.589.089.590.0
River Mile
Con
duct
ivity
(um
hos)
Conductivity- Main Stem
0
2
4
6
8
10
12
85.085.586.086.587.087.588.088.589.089.590.0
River Mile
Con
cent
ratio
n (m
g/L)
Total Suspended Solids- Main Stem
05
10152025303540
85.085.586.086.587.087.588.088.589.089.590.0
River Mile
Con
cent
ratio
n (m
g/L)
Chloride- Main Stem
T:\0147\51\Phase III Rpt\Appendices/Appendix D_Fig 01_2a-d/Appendix D Figure D-2d4/23/03; 11:02 AM Page 3 of 3 Wenck Associates, Inc.

Appendix D Figure D-2e
Minnesota Pollution Control AgencyLong Prairie River Watershed TMDL Final Project Report
Long Prairie River Profile Graphs:Special Survey #2
August 5, 2002
0
2
4
6
8
10
12
14
16
8384858687888990919293River Mile
Con
cent
ratio
n (m
g/L)
20%30%40%50%60%70%80%90%100%110%
DO
Per
cent
Sa
tura
tion
DO Concentration- Main Stem 5 mg/L DO Standard DO Percent Saturation- Main Stem
0
0.5
1
1.5
2
2.5
8384858687888990919293River Mile
Con
cent
ratio
n (m
g/L) CBOD 5- Main Stem
0
5
10
15
20
25
30
8384858687888990919293
River Mile
Tem
pera
ture
(deg
rees
C)
Main Stem Temperatures
T:\0147\51\Phase III Rpt\Appendices\Appendix D_Fig 02e/Appendix D Figure D-2e4/23/03; 11:09 AM Page 1 of 3 Wenck Associates, Inc.

Appendix D Figure D-2e
Minnesota Pollution Control AgencyLong Prairie River Watershed TMDL Final Project Report
Long Prairie River Profile Graphs:Special Survey #2
August 5, 2002
0.00
0.25
0.50
0.75
1.00
1.25
1.50
8384858687888990919293River Mile
Con
cent
ratio
n (m
g/L)
NO2/NO3- Main Stem
Ammonia- Main Stem
Kjeldahl- Main Stem
02468
101214161820
8384858687888990919293
River Mile
Con
cent
ratio
n (m
g/L)
Total Phosphorus- Main Stem
6.0
6.5
7.0
7.5
8.0
8.5
9.0
8384858687888990919293River Mile
pH (S
tand
ard
Uni
ts)
pH- Main Stem
T:\0147\51\Phase III Rpt\Appendices\Appendix D_Fig 02e/Appendix D Figure D-2e4/23/03; 11:09 AM Page 2 of 3 Wenck Associates, Inc.

Appendix D Figure D-2e
Minnesota Pollution Control AgencyLong Prairie River Watershed TMDL Final Project Report
Long Prairie River Profile Graphs:Special Survey #2
August 5, 2002
250
300
350
400
450
8384858687888990919293
River Mile
Con
duct
ivity
(um
hos)
Conductivity- Main Stem
0
1
2
3
4
5
6
7
8
8384858687888990919293
River Mile
Con
cent
ratio
n (m
g/L)
Total Suspended Solids- Main Stem
05
10152025303540
8384858687888990919293
River Mile
Con
cent
ratio
n (m
g/L) Chloride- Main Stem
T:\0147\51\Phase III Rpt\Appendices\Appendix D_Fig 02e/Appendix D Figure D-2e4/23/03; 11:09 AM Page 3 of 3 Wenck Associates, Inc.

Appendix D Figure D-3
Minnesota Pollution Control AgencyLong Prairie Rive Watershed TMDL Final Project Report
Long Prairie River Profile Graphs: Algae ID, Enumeration Data and Chlorophyll-a
(Special Survey 1, Synoptic Surveys 1 and 2)
0
20,000
40,000
60,000
80,000
100,000
120,000
0102030405060708090
River Mile
Alg
ae (o
rgan
ism
s pe
r lite
r)
Total Algae Survey #1
Total Algae Survey #2
0%
20%
40%
60%
80%
100%
0102030405060708090
Rive Mile
Perc
ent C
yano
bact
eria
Cyanobacteria Survey #1Cyanobacteria Survey #2Cyanobacteria Special Survey
0
1
2
3
4
5
6
0.010.020.030.040.050.060.070.080.090.0
River Mile
Alg
ae (o
rgan
ism
s pe
r lite
r)
Chlorophyll-a Special SurveyChlorophyll-a Survey #1Chlorophyll-a Survey #2
T:\0147\51\Phase III Rpt\Appendices/Appendix D_Fig 03/Appendix D Figure D-34/23/03; 11:11 AM Page 1 of1 Wenck Associates, Inc.

Appendix D Figure D-4a
Minnesota Pollution Control Agency Long Prairie River Watershed TMDL Project: Final Project Report
9/12/01 Dye Study ResultsLPR 85.5 to 83.1
Injection Date & Time 9/13/2001 8:57Injection Location (River Mile) 85.5
Sampling Location (River Mile) 83.1Q (cfs) at LPR 89.9 93.54Q (cfs) at LPR 83.1 104.22
Gallons of Dye Injected 0.5Total Travel Dist (miles) 2.4Total Travel Dist (feet) 12,672
Rhotamine Dye Concentrations at LPR 83.1 8:57 am 9/13/01 Injection at LPR 85.5
0
5
10
15
20
0 1 2 3 4 5 6 7 8 9 10Hours from Injection
Rho
tam
ine
Dye
C
once
ntra
tion
(rel
ativ
e)
T:\0147\51\Phase III Rpt\Appendices/ Appendix D_Fig 4a-f.xls/Appendix D Figure D-4a4/23/2003 Page 1 of 1 Wenck Associates, Inc.

Appendix D Figure D-4b
Minnesota Pollution Control Agency Long Prairie River Watershed TMDL Project: Final Project Report
9/12/01 Dye StudyLPR 38.5 to 34.29/12/01 Dye Test, LPR 38.5 to LPR 34.2
Injection Date & Time 9/12/01 9:08
Q at Injection (cfs) 170.26
Injection Location (river
mile) 38.5Sampling
Location (River Mile)
Total Travel Dist (miles) Q (cfs)
34.2 4.3 223.38
Rhotamine Dye Concentrations at LPR 34.2 9:08 am 9/12/01 Injection at LPR 38.5
0
20
40
60
80
100
0 1 2 3 4 5 6 7 8 9 10Hours from Injection
Rho
tam
ine
Dye
C
once
ntra
tion
(rel
ativ
e)
T:\0147\51\Phase III Rpt\Appendices/Appendix D_Fig 4a-f/Appendix D Figure D-4b4/23/03; 11:18 AM Page 1 of 1 Wenck Associates, Inc.

Appendix D Figure D-4c
Minnesota Pollution Control Agency Long Prairie River Watershed TMDL Project: Final Project Report
9/12/01 Dye StudyLPR 30.8 to 21.19/11/01- 9/12/01 Dye Study LPR 30.8
Injection Date & Time 9/11/01 23:37Q at Injection (cfs) 220.25Injection Location
(river mile) 30.8
Sampling Locations (River Mile)
Total Travel Dist (miles)
Distance Between Sites
(miles) Q (cfs)26.1 4.7 4.7 204.3021.1 9.7 5.018.2 --- --- 230.63
Rhotamine Dye Concentrations at LPR 26.1 11:37 pm Injection at LPR 30.8
0
50
100
150
0 5 10 15 20 25 30Hours from Injection
Rho
tam
ine
Dye
C
once
ntra
tion
(rel
ativ
e)
LPR 26.1
LPR 21.1
T:\0147\51\Phase III Rpt\Appendices/Appendix D_Fig 4a-f/Appendix D Figure D-4c4/23/03; 11:19 AM Page 1 of 1 Wenck Associates, Inc.

Appendix D Figure D-4d
Minnesota Pollution Control Agency Long Prairie River Watershed TMDL Project: Final Project Report
9/26-27/01 Dye StudyLPR 83.1 to 70.79/26/01- 9/27/01 Dye Study LPR 83.1
Injection Date & Time 9/26/2001 1:15
Pounds of Dye Injected 25
Q at Injection (cfs) 94.79
Injection Location (river
mile) 83.1Sampling
Locations (River Mile)
Total Travel Dist (miles)
Distance Between
Sites (miles) Q (cfs)79.4 3.7 3.776.7 6.4 2.7 115.3673.4 9.7 3.370.7 12.4 2.767.0 --- --- 139.6
Travel Times9/26/01 Dye Study
1:15 am Injection at LPR 83.1
0
20
40
60
80
100
120
140
0 5 10 15 20 25 30 35 40
Hours from Injection
Rh
ota
min
e D
ye
Co
nce
ntr
atio
n (
rela
tive
)
LPR 79.4 (Grab) LPR 76.7 (Grab)LPR 76.7 (ISCO) LPR 73.4 (ISCO)LPR 70.7 (Grab)
T:\0147\51\Phase III Rpt\Appendices/Appendix D_Fig 4a-f.xls/Appendix D Figure D-4d4/23/2003; 2:23 PM Page 1 of 1 Wenck Associates, Inc.

Appendix D Figure D-4e
Minnesota Pollution Control Agency Long Prairie River Watershed TMDL Project: Final Project Report
9/26-27/01 Dye StudyLPR 47.8 to 30.8
9/26/01- 9/27/01 Dye Study LPR 47.8 Injection Date &
Time 9/26/01 0:00Pounds of Dye
Injected 13
Q at Injection (cfs) 147.86
Injection Location (river mile) 47.8
Sampling Locations (River Mile) Total Travel Dist (miles)
Distance Between Sites
(miles) Q (cfs)42.2 5.6 5.638.5 9.3 3.7 203.6134.2 13.6 4.3 158.9230.8 17.0 3.4 196.95
Rhotamine Dye Concentrations 12:00 am Injection at LPR47.8
0
10
20
30
40
50
60
70
80
0 2 4 6 8 10 12 14 16 18 20 22 24 26 28 30 32Hours from Injection
Rho
tam
ine
Dye
Con
cent
ratio
n (r
elat
ive)
LPR 42.2 (Grab)LPR 38.5LPR 34.2LPR 30.8
T:\0147\51\Phase III Rpt\Appendices/Appendix D_Fig 4a-f/Appendix D Figure D-4eAppendix D_Fig 4a-f; Appendix D Figure D-4e Page 1 of 1 Wenck Associates, Inc.

Appendix D Figure D-4f
Minnesota Pollution Control Agency Long Prairie River Watershed TMDL Project: Final Project Report
8/5-6/02 Dye StudyLPR 89.9 to 85.58/5-6/2002 Dye Study LPR 85.5
Injection Date & Time 8/5/02 11:46Q at Injection (cfs) 111.9
Injection Location (river mile) 89.9
Sampling Locations (River Mile)
Total Travel Dist (miles)
Distance Between
Sites (miles) Q (cfs)
85.5 4.4 4.483.1 6.8 2.4 105.3
Dye Concentrations at LPR 85.5
0
1
2
3
4
5
6
7
8
0 5 10 15 20 25 30Hours from Injection
Rho
tam
ine
Dye
Con
cent
ratio
n (r
elat
ive)
T:\0147\51\Phase III Rpt\Appendices/Appendix D_Fig 4a-f/Appendix D Figure D-4fAppendix D_Fig 4a-f; Appendix D Figure D-4f Page 1 of 1 Wenck Associates, Inc.
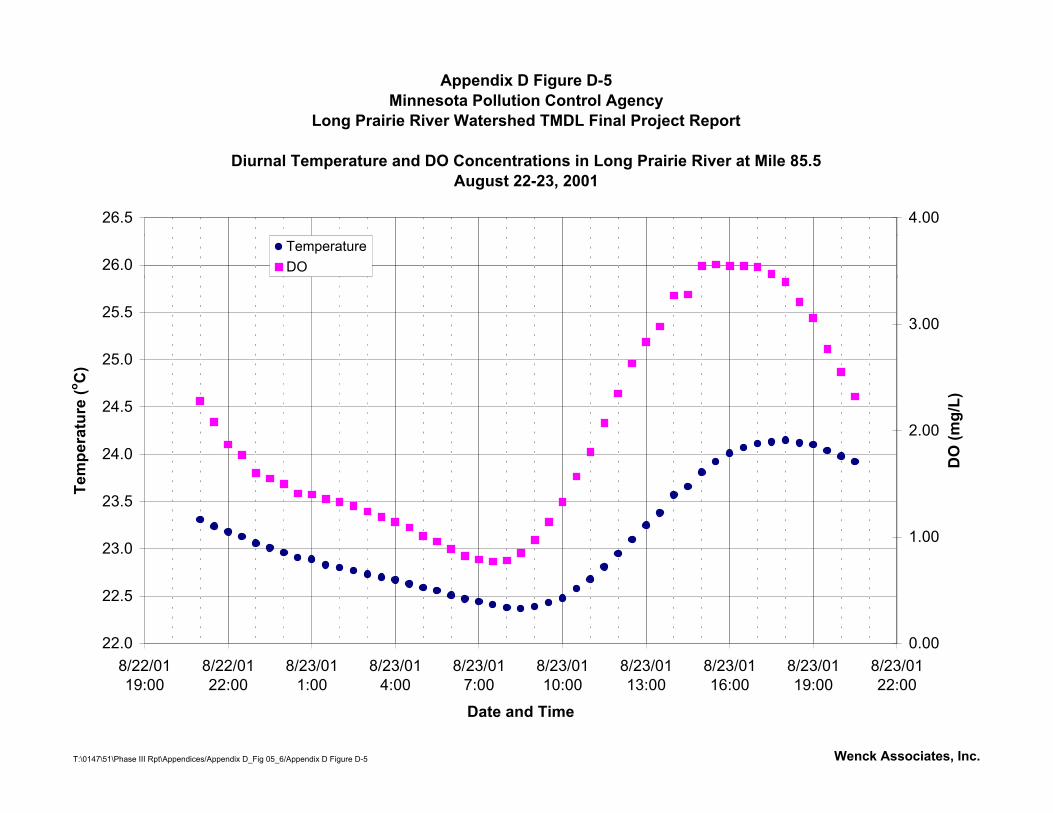
T:\0147\51\Phase III Rpt\Appendices/Appendix D_Fig 05_6/Appendix D Figure D-5 Wenck Associates, Inc.
Appendix D Figure D-5Minnesota Pollution Control Agency
Long Prairie River Watershed TMDL Final Project Report
Diurnal Temperature and DO Concentrations in Long Prairie River at Mile 85.5August 22-23, 2001
22.0
22.5
23.0
23.5
24.0
24.5
25.0
25.5
26.0
26.5
8/22/0119:00
8/22/0122:00
8/23/011:00
8/23/014:00
8/23/017:00
8/23/0110:00
8/23/0113:00
8/23/0116:00
8/23/0119:00
8/23/0122:00
Date and Time
Tem
pera
ture
(o C)
0.00
1.00
2.00
3.00
4.00
DO
(mg/
L)
TemperatureDO

T:\0147\51\Phase III Rpt\Appendices/Appendix D_Fig 05_6/Appendix D Figure D-6 Wenck Associates, Inc.
Appendix D Figure D-6Minnesota Pollution Control Agency
Long Prairie River Watershed TMDL Final Project Report
Diurnal Temperature and DO Concentrations in Long Prairie River at Mile 21.1August 22-23, 2001
22.0
22.5
23.0
23.5
24.0
24.5
25.0
25.5
26.0
26.5
8/22/0119:00
8/22/0122:00
8/23/011:00
8/23/014:00
8/23/017:00
8/23/0110:00
8/23/0113:00
8/23/0116:00
8/23/0119:00
8/23/0122:00
Date and Time
Tem
pera
ture
(o C)
0.00
1.00
2.00
3.00
4.00
5.00
6.00
7.00
8.00
9.00
DO
(mg/
L)
TemperatureDO

T:\0147\51\Phase III Rpt\Appendices/Appendix D_Fig 07_Tab4b/Appendix D Figure D-74/23/03; 11:47 AM Page 1 of 1 Wenck Associates, Inc.
Appendix D Figure D-7
Minnesota Pollution Control AgencyLong Prairie River Watershed TMDL Final Project Report
Continuous In-situ Parameters at LPR 18.2 September 12-24, 2001
0
2
4
6
8
10
12
14
16
18
20
9/11/010:00
9/12/010:00
9/13/010:00
9/14/010:00
9/15/010:00
9/16/010:00
9/17/010:00
9/18/010:00
9/19/010:00
9/20/010:00
9/21/010:00
9/22/010:00
9/23/010:00
9/24/010:00
9/25/010:00
DO
(mg/
L), T
empe
ratu
re (d
egre
es C
)
0
1
2
3
4
5
6
7
8
9
pH (S
tand
ard
Uni
ts),
Con
duct
ivity
(mS/
cm)
TemperatureDOConductivitypH

T:\0147\51\Phase III Rpt\Appendices/Appendix D_Fig 08_Tab4a/Appendix D Figure D-84/23/03; 11:48 AM Page 1 of 1 Wenck Associates, Inc.
Appendix D Figure D-8
Minnesota Pollution Control AgencyLong Prairie River Watershed TMDL Final Project Report
Continuous In-situ Parameters Recorded at LPR 85.5 September 12-24, 2001
0
2
4
6
8
10
12
14
16
18
20
9/11/010:00
9/12/010:00
9/13/010:00
9/14/010:00
9/15/010:00
9/16/010:00
9/17/010:00
9/18/010:00
9/19/010:00
9/20/010:00
9/21/010:00
9/22/010:00
9/23/010:00
9/24/010:00
9/25/010:00
Tem
pera
ture
(deg
rees
C),
DO
(mg/
L), p
H (s
tand
ard
units
)
0
50
100
150
200
250
300
OR
P (m
V)
TemperatureDOpHORP

Appendix D Figure D-9Minnesota Pollution Control Agency
Long Prairie River Watershed TMDL Final Project Report
Diurnal Temperature and DO Concentrations in Long Prairie River at Mile 88.3August 5-6, 2002
T:\0147\51\Phase III Rpt\Appendices/Appendix D_Fig 09_10.xls/Appendix D Figure D-94/29/2003; 3:45 PM Wenck Associates, Inc.
4.0
5.0
6.0
7.0
8.0
9.0
10.0
11.0
8/5/200212:00
8/5/200216:00
8/5/200220:00
8/6/20020:00
8/6/20024:00
8/6/20028:00
8/6/200212:00
8/6/200216:00
8/6/200220:00
8/7/20020:00
Date and Time
DO
(m
g/L
)
20.5
21.0
21.5
22.0
22.5
23.0
23.5
24.0
24.5
25.0
Tem
peratu
re (oC
)
DO SAT DO Temperature

Appendix D Figure D-10Minnesota Pollution Control Agency
Long Prairie River Watershed TMDL Final Project Report
Diurnal Temperature and DO Concentrations in Long Prairie River at Mile 85.5August 5-6, 2002
T:\0147\51\Phase III Rpt\Appendices/Appendix D_Fig 09_10/Appendix D Figure D-104/23/03; 11:50 AM Wenck Associates, Inc.
0.0
1.0
2.0
3.0
4.0
5.0
6.0
7.0
8.0
9.0
10.0
8/5/02 12:00 8/5/02 16:00 8/5/02 20:00 8/6/02 0:00 8/6/02 4:00 8/6/02 8:00 8/6/02 12:00 8/6/02 16:00 8/6/02 20:00 8/7/02 0:00Date and Time
DO
(mg/
L)
21.0
21.5
22.0
22.5
23.0
23.5
Temperature (oC
)
DO SAT DO Temperature

Appendix E
Laboratory Data and QA QC Data, and Field Data Sheets
from Synoptic Surveys
(this appendix is included only in the master copy)

Appendix F, Table F-1
MPCA Long Prairie River Watershed TMDL Final Project Report
QUAL-TX Model Configuration Summary
Model Reach
Number Water Body Point Source or Tributary InflowReach
Start (RM)Reach End
(RM)Length
(mi)
Computational Element Length
(mi)1998 TMDL
Reach NumberCWP Reach
Divisions2002 TMDL
Reach Number1 Long Prairie River --- 89.9 89.5 0.4 0.2 07010108-010 Upper Reach 07010108-5062 Long Prairie River Carlos WWTP 89.5 87.5 2 0.2 07010108-010 Upper Reach 07010108-5063 Long Prairie River --- 87.5 85.5 2 0.2 07010108-010 Upper Reach 07010108-5064 Long Prairie River --- 85.5 83.1 2.4 0.2 07010108-010 Upper Reach 07010108-5065 Long Prairie River --- 83.1 80.9 2.2 0.2 07010108-010 Upper Reach 07010108-5066 Long Prairie River Spruce Creek 80.9 76.7 4.2 0.3 --- Upper Reach 07010108-5057 Long Prairie River --- 76.7 73.3 3.4 0.2 --- Upper Reach 07010108-5058 Long Prairie River Dismal Creek 73.3 67 6.3 0.3 --- Middle Reach 07010108-5059 Long Prairie River --- 67 56 11 0.5 --- Middle Reach 07010108-505
10 Long Prairie River --- 56 47.6 8.4 0.4 --- Middle Reach 07010108-50511 Long Prairie River LP Superfund, WWTP 47.6 38.5 9.1 0.1 --- Middle Reach 07010108-50512 Long Prairie River Browerville WWTP 38.5 34.2 4.3 0.1 --- Middle Reach 07010108-50513 Long Prairie River --- 34.2 33.6 0.6 0.3 --- Middle Reach 07010108-50514 Eagle Creek Eagle Bend WWTP & Clarissa WWTP 12.5 0 12.5 0.5 --- Middle Reach 07010108-50715 Long Prairie River Eagle Creek 33.6 30.8 2.8 0.4 --- Middle Reach 07010108-50416 Long Prairie River --- 30.8 26.1 4.7 0.1 07010108-005 Middle Reach 07010108-50417 Long Prairie River --- 26.1 21.1 5 0.2 07010108-005 Middle Reach 07010108-50418 Long Prairie River --- 21.1 20.8 0.3 0.3 07010108-005 Middle Reach 07010108-50419 Long Prairie River Turtle Creek 20.8 18.2 2.6 0.2 07010108-004 Lower Reach 07010108-50320 Long Prairie River --- 18.2 15.8 2.4 0.3 07010108-004 Lower Reach 07010108-50321 Long Prairie River Moran Creek 15.8 15.3 0.5 0.1 07010108-002 Lower Reach 07010108-50222 Long Prairie River --- 15.3 10.3 5 0.5 07010108-002 Lower Reach 07010108-50223 Long Prairie River Fish Trap Creek 10.3 9.2 1.1 0.1 07010108-001 Lower Reach 07010108-50124 Long Prairie River --- 9.2 3.2 6 0.3 07010108-001 Lower Reach 07010108-50125 Long Prairie River --- 3.2 0 3.2 0.4 07010108-001 Lower Reach 07010108-501
T:/0147/51/Phase III Rpt/Appendices/Appendix F_Tab01-17_21.xls/Table F-1 Page 1 of 1 Wenck Associates, Inc.

Appendix F, Table F-2
MPCA Long Prairie River Watershed TMDL Final Project Report
QUAL-TX Model Point Source and Tributary Configuration Summary
Tributary Name Inflow at TMDL Site ID Point Source Inflow Count JunctionSpruce Creek LPR 80.9 --- ---Dismal Creek LPR 73.3 --- ---Eagle Creek LPR 33.6 2 1Turtle Creek LPR 20.8 --- ---Moran Creek LPR 15.8 --- ---Fish Trap Creek LPR 10.3 --- ---Long Prairie River --- 6 ---
Point Source ID Inflow at TMDL Site ID Point Source Name Tributary NameEB_SD-002 EC 12.2 City of Eagle Bend WWTP Eagle CreekClarissa_SD-001 EC 7.0 City of Clarissa WWTP Eagle CreekCarlos_SD-001 LPR 89.4 City of Carlos WWTP Long Prairie RiverSuperfund_Site LPR 47.3 Long Prairie Superfund Site Discharges Continuously Long Prairie RiverLP_SD-002 LPR 46.6 City of Long Prairie WWTP (SD-002) Long Prairie RiverLP_SD-001 LPR 44.9 City of Long Prairie WWTP (SD-001) Long Prairie RiverLP_SD-003 LPR 44.9 City of Long Prairie WWTP (SD-003) Long Prairie RiverB_SD-001 LPR 36.1 City of Browerville WWTP Long Prairie River
T:/0147/51/Phase III Rpt/Appendices/Appendix F_Tab01-17_21.xls/Table F-2 Page 1 of 1 Wenck Associates, Inc.
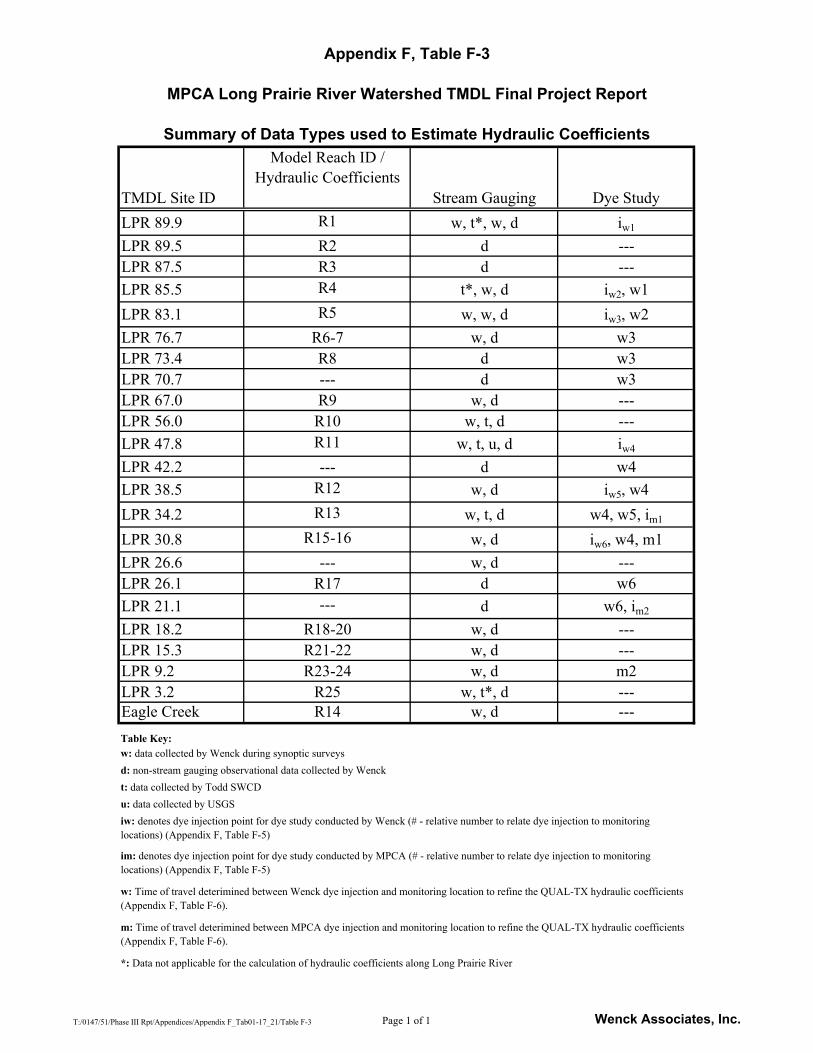
Appendix F, Table F-3
MPCA Long Prairie River Watershed TMDL Final Project Report
Summary of Data Types used to Estimate Hydraulic Coefficients
*: Data not applicable for the calculation of hydraulic coefficients along Long Prairie River
Table Key:
iw: denotes dye injection point for dye study conducted by Wenck (# - relative number to relate dye injection to monitoring locations) (Appendix F, Table F-5)
im: denotes dye injection point for dye study conducted by MPCA (# - relative number to relate dye injection to monitoring locations) (Appendix F, Table F-5)
w: Time of travel deterimined between Wenck dye injection and monitoring location to refine the QUAL-TX hydraulic coefficients (Appendix F, Table F-6).
m: Time of travel deterimined between MPCA dye injection and monitoring location to refine the QUAL-TX hydraulic coefficients (Appendix F, Table F-6).
w: data collected by Wenck during synoptic surveysd: non-stream gauging observational data collected by Wenckt: data collected by Todd SWCDu: data collected by USGS
Eagle Creek R14 w, d ---LPR 3.2 R25 w, t*, d ---LPR 9.2 R23-24 w, d m2LPR 15.3 R21-22 w, d ---LPR 18.2 R18-20 w, d ---LPR 21.1 --- d w6, im2
LPR 26.1 R17 d w6LPR 26.6 --- w, d ---LPR 30.8 R15-16 w, d iw6, w4, m1LPR 34.2 R13 w, t, d w4, w5, im1
LPR 38.5 R12 w, d iw5, w4LPR 42.2 --- d w4LPR 47.8 R11 w, t, u, d iw4
LPR 56.0 R10 w, t, d ---LPR 67.0 R9 w, d ---LPR 70.7 --- d w3LPR 73.4 R8 d w3LPR 76.7 R6-7 w, d w3LPR 83.1 R5 w, w, d iw3, w2LPR 85.5 R4 t*, w, d iw2, w1LPR 87.5 R3 d ---LPR 89.5 R2 d ---LPR 89.9 R1 w, t*, w, d iw1
TMDL Site ID
Model Reach ID / Hydraulic Coefficients
Stream Gauging Dye Study
T:/0147/51/Phase III Rpt/Appendices/Appendix F_Tab01-17_21/Table F-3 Page 1 of 1 Wenck Associates, Inc.

Appendix F, Table F-4
MPCA Long Prairie River Watershed TMDL Final Project Report
Channel Slopes used by Reaeration Equations
Model Reach
Slope (ft/ft) Slope *10
1-2 0.00025 0.00253 0.00022 0.00224 0.00020 0.0025 0.00036 0.00366 0.00033 0.00337 0.00031 0.00318-9 0.00028 0.002810 0.00025 0.002511 0.00022 0.002212 0.00019 0.001913 0.00020 0.00214-17 0.00026 0.002618 0.00032 0.003219 0.00033 0.003320 0.00045 0.004521-25 0.00093 0.0093
T:/0147/51/Phase III Rpt/Appendices/Appendix F_Tab01-17_21/Table F-4 Page 1 of 1 Wenck Associates, Inc.

Appendix F, Table F-5
MPCA Long Prairie River Watershed TMDL Final Project Report
Dye Studies
Date of Dye Study River Mile Start River Mile End Study Conducted byAugust 5-6, 2002 89.9 85.5 Wenck (w1)September 13, 2001 85.5 83.1 Wenck (w2)September 26-27, 2001 83.1 70.7 Wenck (w3)September 26-27, 2001 47.8 30.8 Wenck (w4)September 12, 2001 38.5 34.2 Wenck (w5)September 11-12, 2001 30.8 21.1 Wenck (w6)October 3-5, 2000 34.2 30.8 MPCA (m1)October 3-5, 2000 21.1 9.2 MPCA (m2)
T:/0147/51/Phase III Rpt/Appendices/Appendix F_Tab01-17_21/Table F-5 Page 1 of 1 Wenck Associates, Inc.

Appendix F, Table F-6
MPCA Long Prairie River Watershed TMDL Final Project Report
TMDL Site ID Flow (cfs)
Hydraulic Coefficient Calculated Time of Travel from Dye
injection (hrs)
Monitored Travel Time of Peak from Dye injection
(hrs)Percent
Difference
LPR 89.9 110a 0LPR 89.5 110 a 0.59
LPR 87.5 110 a 6.78
LPR 85.5 110 a 17.37 17.4 0%
LPR 85.5 103.78 c 0LPR 83.1 104.22 4.99 5 0%
LPR 83.1 94.79 0LPR 76.7 115.36 14.83 14.83 0%LPR 73.4 123.51 c 25.75 25.75 0%LPR 70.7 128.61 c 31.46 33.00b
LPR 47.8 147.86 0LPR42.2 175.74 7.53 7.00b
LPR 38.5 203.61 12 12 0%LPR 34.2 158.92 17.58 17.67 -1%LPR 30.8 196.95 22.56 22.5 0%
LPR 38.5 170.26 0LPR 34.2 223.38 5.45 5.37 2%
LPR 30.8 220.25 0LPR 26.1 204.3 4.56 3.38b
LPR 21.1 217.05 8.8 9.72 -10%
LPR 34.2 57.5 0LPR 30.8 62.5 6.89 6.67 3%
LPR 21.1 65.4 0LPR 18.2 72.1 3.7 naLPR 15.3 78.9 8.68 na
LPR 9.2 87.6 25.67 25.67 0%a)b)c)
Estimate of peak arrival, data collection ended before peak was achieved.Flow rate not available for dye study measurement, estimated as distance-weighted average
Wenck (w5) September 12, 2001 RM 38.5 to 34.2
Wenck (w6) September 11-12, 2001 RM 30.8 to 21.1
MPCA (m1) October 3, 2000 RM 34.2 to 30.8
MPCA (m2) October 3, 2000 RM 21.1 to 9.2
Wenck (w3) September 26-27, 2001 RM 83.1 to 70.7
Wenck (w4) September 26-27, 2001 RM 47.8 to 30.8
Dye Study Comparison using Final Hydraulic Coefficients
Average main channel flow rate through the Carlos reach for dye study
Wenck (w1) August 5-6, 2002 RM 89.9 to 85.5
Wenck (w2) September 13, 2001 RM 85.5 to 83.1
T:/0147/51/Phase III Rpt/Appendices/Appendix F_Tab01-17_21/Table F-6 Page 1 of 1 Wenck Associates, Inc.

Appendix F, Table F-7
MPCA Long Prairie River Watershed TMDL Final Project Report
Summary of Final QUAL-TX Hydraulic Coefficients
TMDL Site ID River Mile Model Reach Number a b c d eLPR 89.9* 89.9 1 0.2511 0.292 0.1395 0.6061 0LPR 89.5 89.5 2 0.1202 0.292 0.2651 0.6061 0LPR 87.5 87.5 3 0.0703 0.292 0.3642 0.6061 0LPR 85.5 85.5 4 0.0819 0.292 0.1526 0.6061 0LPR 83.1* 83.1 5 0.3618 0.238 0.3927 0.4019 0LPR 76.7* 76.7 6-7 0.0452 0.3102 0.2697 0.516 0LPR 73.4 73.4 8 0.1547 0.3102 0.2457 0.5009 0LPR 67* 67 9 0.179 0.2854 0.2457 0.5009 0LPR 56* 56 10 0.4359 0.2004 0.2796 0.3855 0LPR 47.8* 47.8 11 0.2389 0.2987 0.133 0.55 0LPR 38.5* 38.5 12 0.2739 0.2943 0.2302 0.5113 0LPR 34.2* 34.2 13 0.1644 0.3463 0.1154 0.5959 0LPR 30.8* 30.8 15-16 0.2638 0.262 0.2251 0.5007 0LPR 26.1* 26.1 17 0.2922 0.3556 0.128 0.5866 0LPR 21.1 21.1 18 0.4054 0.2465 0.185 0.5042 0LPR 18.2* 18.2 19-20 0.4054 0.2465 0.185 0.5042 0LPR 15.3* 15.3 21-22 0.2249 0.2018 0.3039 0.4334 0LPR 9.2* 9.2 23-24 0.1349 0.2975 0.2183 0.488 0LPR 3.2* 3.2 25 0.2511 0.1973 0.2388 0.452 0Eagle Creek* 0.66 14 0.0729 0.3013 0.5537 0.6393 0* Hydraulic Coefficients plotted in Appendix F, Figure F-1
T:/0147/51/Phase III Rpt/Appendices/Appendix F_Tab01-17_21/Table F-7 Page 1 of 1 Wenck Associates, Inc.

Appendix F, Table F-8
MPCA Long Prairie River Watershed TMDL Final Project Report
Modeled Percent Ice CoverEstimated from Synoptic Survey 3
Model Reach Number Model Reach Start (mi) Percent Ice Cover (%)1 89.9 02 89.5 803 87.5 804 85.5 1005 83.1 1006 80.9 1007 76.7 1008 73.3 1009 67 100
10 56 10011 47.6 10012 38.5 10013 34.2 10014 Eagle Creek 9015 33.6 10016 30.8 9017 26.1 10018 21.1 10019 20.8 10020 18.2 9021 15.8 10022 15.3 10023 10.3 10024 9.2 10025 3.2 100
T:/0147/51/Phase III Rpt/AppendicesAppendix F_Tab01-17_21/Table F-8 Page 1 of 1 Wenck Associates, Inc.

Appendix F, Table F-9a
MPCA Long Prairie River Watershed TMDL Final Project Report
Diurnal DO, Average Temperature, and Photoperiod during Synoptic Surveys
Erdmann (1979b) Simplified Diurnal Curve Analysis
Continuous DO Measurments Taken During
Survey: Photoperiod (hrs)
Upstream diurnal DO range (daily max
minus minimum DO) (mg/L)
Upstream Average Temperature (C) (average of all
readings during 24-hr period)
Downstream diurnal DO range (daily max minus minimum DO)
(mg/L)
Downstream Average Temperature (C) (average of all
readings during 24-hr period)
∆ C u Tave (C) ∆ C d Tave (C)RM 85.5 RM 85.5 RM 21.1 RM 21.1
22-Aug-01 13.8023-Aug-01 13.75
13.78 2.79 23.13 2.50 * 23.69
RM 88.3 rr RM 88.3 rr RM 85.5 RM 85.55-Aug-02 14.606-Aug-02 14.57
14.58 4.90 22.69 3.75 21.97
RM 85.5 RM 85.5 RM 18.2 RM 18.211-Sep-01 12.75 1.66 18.7112-Sep-01 12.70 2.63 17.8713-Sep-01 12.65 2.67 16.81 3.18 17.2914-Sep-01 12.58 1.18 16.20 1.61 15.7215-Sep-01 12.53 1.55 15.19 1.93 14.5516-Sep-01 12.48 1.03 15.17 1.65 14.5617-Sep-01 12.45 1.36 15.52 1.75 14.6818-Sep-01 12.38 1.31 15.91 1.61 15.0319-Sep-01 12.33 2.41 16.38 2.24 15.3820-Sep-01 12.28 1.12 16.20 1.69 15.1021-Sep-01 12.23 2.66 15.95 2.51 15.1522-Sep-01 12.17 1.32 15.01 1.36 13.9023-Sep-01 12.12 2.68 14.35 2.75 13.3324-Sep-01 12.07 6.79 14.02 4.21 13.2125-Sep-01 12.02 2.36 3.41 1.95 5.76
Bold Values used for Delta Method CalculationsShaded Cells indicate DO range reported is estimated based on less than 24-hours of continuous monitoring* denotes DO range is best-estimate from suspect data
T:\0147\51\Phase III Rpt\Appendices\\Appendix F_Tab01-17_21 Table F-9a
Wenck Associates, Inc.

Appendix F, Table F-9b
MPCA Long Prairie River Watershed TMDL Final Project Report
Summary of Productivity during Synoptic Surveys
88.3 85.5 21.1 18.2August 23, 2001 1 --- 5.69 6.25 ---
September 25, 2001 2 --- 4.87 --- 5.39August 6, 2002 4 10.89 8.15 --- ---
DiToro and Chapra (1991) Delta Method Calculation
Continuous DO Measurments Taken
During Survey:synoptic survey
Upstream River Mile Downstream River MilePav = Average Plant Production Rate (mg/L - day)
T:\0147\51\Phase III Rpt\Appendices\\Appendix F_Tab01-17_21 Table F-9b
Wenck Associates, Inc.
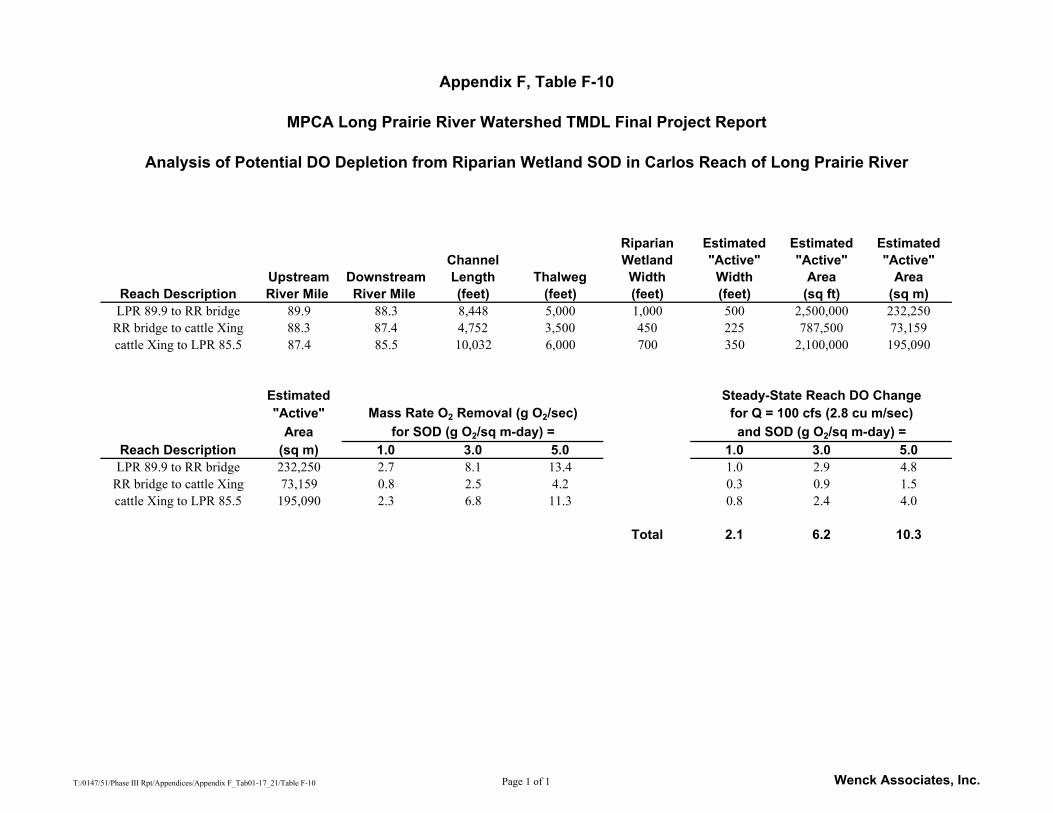
Appendix F, Table F-10
MPCA Long Prairie River Watershed TMDL Final Project Report
Analysis of Potential DO Depletion from Riparian Wetland SOD in Carlos Reach of Long Prairie River
Riparian Estimated Estimated EstimatedChannel Wetland "Active" "Active" "Active"
Upstream Downstream Length Thalweg Width Width Area AreaReach Description River Mile River Mile (feet) (feet) (feet) (feet) (sq ft) (sq m)
LPR 89.9 to RR bridge 89.9 88.3 8,448 5,000 1,000 500 2,500,000 232,250RR bridge to cattle Xing 88.3 87.4 4,752 3,500 450 225 787,500 73,159cattle Xing to LPR 85.5 87.4 85.5 10,032 6,000 700 350 2,100,000 195,090
Estimated"Active"
AreaReach Description (sq m) 1.0 3.0 5.0 1.0 3.0 5.0
LPR 89.9 to RR bridge 232,250 2.7 8.1 13.4 1.0 2.9 4.8RR bridge to cattle Xing 73,159 0.8 2.5 4.2 0.3 0.9 1.5cattle Xing to LPR 85.5 195,090 2.3 6.8 11.3 0.8 2.4 4.0
Total 2.1 6.2 10.3
for SOD (g O2/sq m-day) = and SOD (g O2/sq m-day) =
Steady-State Reach DO ChangeMass Rate O2 Removal (g O2/sec) for Q = 100 cfs (2.8 cu m/sec)
T:/0147/51/Phase III Rpt/Appendices/Appendix F_Tab01-17_21/Table F-10 Page 1 of 1 Wenck Associates, Inc.

Appendix F, Table F-11
MPCA Long Prairie River Watershed TMDL Final Project Report
August 2001 and September 2001 CBODu used in QUAL-TX for CalibrationRatio of 5-day to 20-day CBOD, Synoptic Surveys of Long Prairie River
Date Station R.M. NoteCBOD 5-
Dayy(20) = CBOD 20-
DayDetect. Limit y(5)* y5* / y(20)
tL = Lag Time
kd = Decay Rate
Estimated C-BOD ultimate
Observed C-BOD ultimate
mg/L mg/L mg/L mg/L days 1/day mg/L
August 2001:
08/21/01 LPR 89.9 a < 6 7 6 3 0.429 1 0.104 8.12
08/21/01 LPR 89.9 a < 2 4 2 1 0.250 1 0.104 4.64
08/21/01 LPR 85.5 < 2 4 2 1 0.250 1 0.104 4.64 8.73
08/21/01 LPR 76.7 < 2 5 2 1 0.200 1 0.104 5.80
08/21/01 LPR 67.0 2 2 2 2 1.000 1 0.104 2.32
08/21/01 LPR 56.0 < 2 2 2 1 0.500 1 0.104 2.32
08/21/01 LPR 47.8 b < 2 4 2 1 0.250 1 0.104 4.64
08/22/01 LPR 34.2 < 2 5 2 1 0.200 1 0.104 5.80
08/22/01 LPR 30.8 < 2 2 2 1 0.500 1 0.104 2.32
08/21/01 LPR 21.1 < 2 3 2 1 0.333 1 0.104 3.48 4.5
08/21/01 LPR 15.3 < 2 6 2 1 0.167 1 0.104 6.96
08/21/01 LPR 11.8 < 2 2 2 1 0.500 1 0.104 2.32
08/21/01 LPR 3.2 < 6 4 6 3 0.750 1 0.104 4.64
08/21/01 T LPR 73.3 < 2 2 2 1 0.500 1 0.104 2.32
08/21/01 T LPR 15.8 < 6 8 6 3 0.375 1 0.104 9.28
08/21/01 T LPR 80.9 < 2 4 2 1 0.250 1 0.104 4.64
08/21/01 T LPR 20.8 < 2 5 2 1 0.200 1 0.104 5.80
Average 0.391 4.71
Standard Deviation 0.222 2.11
Count 17 17
September 2001:
09/25/01 LPR 89.9 < 2 6 2 1 0.167 4 0.104 7.38
09/25/01 LPR 85.5 < 2 9 2 1 0.111 4 0.104 11.07 4.03
09/25/01 LPR 83.1 < 2 2 2 1 0.500 4 0.104 2.46
09/25/01 LPR 76.7 < 2 15 2 1 0.067 4 0.104 18.45
09/25/01 LPR 67.0 c < 2 10 2 1 0.100 4 0.104 12.30
09/25/01 LPR 56.0 < 2 11 2 1 0.091 4 0.104 13.53
09/25/01 LPR 38.5 < 2 5 2 1 0.200 4 0.104 6.15 4.67
09/25/01 LPR 34.2 < 2 10 2 1 0.100 4 0.104 12.30
09/25/01 LPR 30.8 < 2 10 2 1 0.100 4 0.104 12.30
09/25/01 LPR 21.1 < 2 13 2 1 0.077 4 0.104 15.99 4.97
09/25/01 LPR 15.3 < 2 10 2 1 0.100 4 0.104 12.30
09/25/01 LPR 9.2 < 2 13 2 1 0.077 4 0.104 15.99
09/25/01 LPR 3.2 < 2 12 2 1 0.083 4 0.104 14.76
09/25/01 T LPR 33.6 < 2 12 2 1 0.083 4 0.104 14.76
09/25/01 T LPR 15.8 < 2 12 2 1 0.083 4 0.104 14.76
09/25/01 T LPR 10.3 < 2 12 2 1 0.083 4 0.104 14.76
09/25/01 T LPR 80.9 < 2 9 2 1 0.111 4 0.104 11.07
09/25/01 T LPR 20.8 < 2 12 2 1 0.083 4 0.104 14.76
Average 0.123 12.51
Standard Deviation 0.100 3.90
Count 18 18
February 2002 Main Stem:
02/07/02 LPR 89.9 d 3 12 3 3 0.250
February 2002 Tributaries:
02/08/02 T LPR 20.8 d < 2 10 2 1 0.100
Key:
LPR 9.2 Long Prairie river mile
T LPR 20.8 Tributary confluence river mile
Notes:
a Second results are for blind dup
b Blind dup retained; other results both < 2mg/L
c Blind dup with identical results omitted
d Test at 4 degrees C
Results with detected C-BOD5 are bolded
* y5* = C-BOD5 if detected, or 0.5*Detection Limit otherwise
Source: filtered from T:\0147\51\Database\Appendix D.xls
T:/0147/51/Phase III Rpt/Appendices/Appendix F_Tab01-17_21/Table F-11 Page 1 of 1 Wenck Associates, Inc.

Appendix F, Table F-12a
MPCA Long Prairie River Watershed TMDL Final Project Report
Calibration Event Tributary Summary
August 2001 Calibration Event
Tributary Names Inflow at TMDL
Site IDInflow
Rate (cfs)Temperature
(C)Chloride (mg/L)
DO (mg/L)
CBODu (mg/L)
ON (mg/L)
NH3-N (mg/L)
NO2/ NO3-N (mg/L)
TP (mg/L)
Chlorophyll-a (ug/L)
Turtle Creek LPR 20.8 10.09 23.5 5.1 8.93 5.8 1.29 0.01 0.1 0.084 15Moran Creek LPR 15.8 4.65 22.3 6.4 9.12 9.28 0.69 0.01 0.1 0.009 1.1Fish Trap Creek LPR 10.3 8 23.6 5 10 3.48 0.69 0.01 0.1 0.041 2
September 2001 Calibration Event
Tributary Names Inflow at TMDL
Site IDInflow
Rate (cfs)Temperature
(C)Chloride (mg/L)
DO (mg/L)
CBODu (mg/L)
ON (mg/L)
NH3-N (mg/L)
NO2/ NO3-N (mg/L)
TP (mg/L)
Chlorophyll-a (ug/L)
Spruce Creek LPR 80.9 15.73 10.09 6.7 10.68 11.07 0.59 0.01 0.55 0.032 3.1Turtle Creek LPR 20.8 6.18 9.81 7.2 11.42 14.76 0.89 0.01 0.1 0.014 0.5Moran Creek LPR 15.8 10.09 8.64 6.2 11.43 14.76 0.89 0.01 0.1 0.014 1.7Fish Trap Creek LPR 10.3 8.97 12.18 4.1 12.13 14.76 0.89 0.01 0.1 0.022 2.2
February 2002 Calibration Event---
T:/0147/51/Phase III Rpt/Appendices/Appendix F_Tab01-17_21/Table F-12a Page 1 of 1 Wenck Associates, Inc.

Appendix F, Table F-12b
MPCA Long Prairie River Watershed TMDL Final Project Report
7Q10 Event Tributary Summary
Summer 7Q10 Event*
Tributary Names Inflow at TMDL
Site IDInflow
Rate (cfs)Temperature
(C)Chloride (mg/L)
DO (mg/L)
CBODu (mg/L)
ON (mg/L)
NH3-N (mg/L)
NO2/ NO3-N (mg/L)
TP (mg/L)
Chlorophyll-a (ug/L)
Spruce Creek LPR 80.9 0.67 23 --- 8.58 7.86 0.51 0.065 0.107 0.066 ---Dismal Creek LPR 73.3 0.44 23 --- 8.58 2.32 0.923 0.018 0.313 0.046 ---Turtle Creek LPR 20.8 1.52 23 --- 8.58 8.59 1.027 0.029 0.077 0.077 ---Moran Creek LPR 15.8 0.89 23 --- 8.58 5.7 0.792 0.04 0.046 0.046 ---Fish Trap Creek LPR 10.3 0.9 23 --- 8.58 14.76 0.69 0.1 0.041 0.041 ---
Spring 7Q10 Event*
Tributary Names Inflow at TMDL
Site IDInflow
Rate (cfs)Temperature
(C)Chloride (mg/L)
DO (mg/L)
CBODu (mg/L)
ON (mg/L)
NH3-N (mg/L)
NO2/ NO3-N (mg/L)
TP (mg/L)
Chlorophyll-a (ug/L)
Spruce Creek LPR 80.9 2.26 21 --- 8.91 7.86 0.579 0.024 0.154 0.067 ---Dismal Creek LPR 73.3 1.49 21 --- 8.91 2.32 0.94 0.02 0.09 0.043 ---Turtle Creek LPR 20.8 5.13 21 --- 8.91 8.59 0.905 0.175 0.175 0.058 ---Moran Creek LPR 15.8 3.02 21 --- 8.91 5.7 0.851 0.034 0.034 0.047 ---Fish Trap Creek LPR 10.3 3.05 21 --- 8.91 14.76 0.64 0.03 0.1 0.027 ---
Winter 7Q10 Event*---
* CBODu, ON, NH3-N, NO2/NO3-N, and TP values from Appendix F, Table F-22
T:/0147/51/Phase III Rpt/Appendices/Appendix F_Tab01-17_21/Table F-12b Page 1 of 1 Wenck Associates, Inc.

Appendix F, Table F-13a
MPCA Long Prairie River Watershed TMDL Final Project Report
Calibration Event Point Source Summary
August 2001 Calibration Event---
September 2001 Calibration Event
Point Source SitesInflow at TMDL
Site IDInflow
Rate (cfs)Temperature
(C)Chloride (mg/L)
DO (mg/L)
CBODu (mg/L)
ON (mg/L)
NH3-N (mg/L)
NO2/ NO3-N (mg/L)
TP (mg/L)
Chlorophyll-a (ug/L)
LP SUPERFUND SITE LPR 47.3 0.67 13.52 58.4 8.58 13.38 1.02 0.04 0.88 0.1 0LPRAIRIE WWTF SD002 LPR 46.6 2.71 15.35 434 8.98 30.28 3.73 9.67 0.1 3.67 0LPRAIRIE WWTF SD 001 & 003 LPR 44.9 3.47 16.16 251 4.82 31.43 2.6 11.3 0.43 5.86 0EAGLE BEND WWTF 010 EC 12.0 1.01 15.76 185 6 11.36 1.7 0.6 0.27 4.77 0
February 2002 Calibration Event---
T:/0147/51/Phase III Rpt/Appendices/Appendix F_Tab01-17_21.xls/Table F-13a Page 1 of 2 Wenck Associates, Inc.

Appendix F, Table F-13b
MPCA Long Prairie River Watershed TMDL Final Project Report
7Q10 Event Point Source Summary
Summer 7Q10 Event*
Point Source SitesInflow at TMDL
Site IDInflow
Rate (cfs)Temperature
(C)Chloride (mg/L)
DO (mg/L)
CBODu (mg/L)
ON (mg/L)
NH3-N (mg/L)
NO2/ NO3-N (mg/L)
TP (mg/L)
Chlorophyll-a (ug/L)
CARLOS WWTF 1 LPR 89.4 1.21 23 --- 8.58 35.7 4.43 0.07 0.008 2.11 ---LP SUPERFUND SITE LPR 47.3 0.67 13.52 --- 8.58 13.38 1.02 0.04 0.88 0.1 ---LPRAIRIE WWTF SD002 LPR 46.6 2.70 23 --- 4.83 30 5.5 14.2 0.1 5.9 ---LPRAIRIE WWTF SD001 LPR 44.9 1.43 23 --- 4.54 66 19 60.8 0.43 17.3 ---LPRAIRIE WWTF SD003 LPR 44.9 0.88 23 --- 6 31.7 2.4 10.3 0.43 1 ---BROWERVILLE WWTF 010 LPR 36.1 6.16 23 --- 8.58 16.3 4.43 0.07 0.008 2.43 ---EAGLE BEND WWTF 010 EC 6.1 1.01 23 --- 8.58 16.1 4.43 0.07 0.008 0.79 ---CLARISSA WWTF EC 6.1 1.42 23 --- 8.58 28.6 4.43 0.07 0.008 1.49 ---
Spring 7Q10 Event*
Point Source SitesInflow at TMDL
Site IDInflow
Rate (cfs)Temperature
(C)Chloride (mg/L)
DO (mg/L)
CBODu (mg/L)
ON (mg/L)
NH3-N (mg/L)
NO2/ NO3-N (mg/L)
TP (mg/L)
Chlorophyll-a (ug/L)
CARLOS WWTF 1 LPR 89.4 1.21 21 --- 8.91 35.7 3.2 5.8 0.05 2.11 ---LP SUPERFUND SITE LPR 47.3 0.67 13.52 --- 8.58 13.38 1.02 0.04 0.88 0.1 ---LPRAIRIE WWTF SD002 LPR 46.6 2.70 21 --- 4.83 53 5.5 14.2 0.1 5.9 ---LPRAIRIE WWTF SD001 LPR 44.9 1.43 21 --- 4.54 66 77 249.5 0.43 17.3 ---LPRAIRIE WWTF SD003 LPR 44.9 0.88 21 --- 6 31.7 3.7 16.0 0.43 1 ---BROWERVILLE WWTF 010 LPR 36.1 6.16 21 --- 8.91 16.3 3.2 5.8 0.05 2.43 ---EAGLE BEND WWTF 010 EC 6.1 1.01 21 --- 8.91 16.1 3.2 5.8 0.05 2.7 ---CLARISSA WWTF EC 6.1 1.42 21 --- 8.91 28.6 3.2 5.8 0.05 1.49 ---
Winter 7Q10 Event*---
* Values from DMR Summary for WWTFs summarized in Appendix F, Table F-19b
T:/0147/51/Phase III Rpt/Appendices/Appendix F_Tab01-17_21.xls/Table F-13b Page 2 of 2 Wenck Associates, Inc.

Appendix F, Table F-14
MPCA Long Prairie River Watershed TMDL Final Project Report
Data from State Climatology Working Group Web Page(www.climate.umn.edu)
Preceding 21-Aug 25-Sep 7-Feb 7-Feb 7-FebDays P P P Tmx Tmn
(in) (in) (in) (F) (F)0 0 0 0 48 191 0 0 0 49 202 0 0.47 0 35 113 0.07 0.47 0 27 -84 0.07 0.74 0.01 25 95 0.19 0.74 0.01 31 126 0.19 0.75 0.01 27 57 0.19 0.75 0.01 24 58 0.19 0.75 0.05 22 -49 0.19 0.76 0.05 12 2
10 0.19 1.16 0.05 21 711 0.19 1.16 0.05 39 2112 0.19 1.16 0.05 46 2213 0.19 1.16 0.05 50 2314 0.19 1.16 0.05 33 115 0.19 1.16 0.05 43 716 0.19 1.16 0.05 45 1617 0.19 1.84 0.05 29 1318 0.19 2.27 0.05 26 719 0.19 2.27 0.05 27 320 0.22 2.27 0.05 15 -8
Note: Temperature at or above 32 degrees are bolded
Preceding Air TemperaturePreceding Cumulative Precipitation
T:/0147/51/Phase III Rpt/Appendices/Appendix F_Tab01-17_21/Table F-14 Page 1 of 1 Wenck Associates, Inc.

Appendix F, Table F-15
MPCA Long Prairie River Watershed TMDL Final Project Report
Incremental Inflows by Model Run
Model Run:
Flow at Long Prairie River
USGS station (cfs)
Total Incremental
Inflow (cfs/RM)
Groundwater Inflow
(cfs/RM)
Runoff Inflow
(cfs/RM)August 2001 Calibration Event ( AUG ) 162 0.64 0.64 0September 2001 Calibration Event ( SEP ) 154 1.18 0.64 0.54February 2002 Calibration Event ( FEB ) 118 1.59 0.64 0.95Summer 7Q10 Event ( SUM ) 11.4 0.23 0.23 0Spring 7Q10 Event ( SPR ) 38.6 0.78 0.23 0.55Winter 7Q10 Event ( WIN ) 6.9 0.16 0.16 0
Published gains in stream flow (cfs/RM)Myette (1984)Myette (1984)McBride (1975)
0.851.30.6
T:/0147/51/Phase III Rpt/Appendices/Appendix F_Tab01-17_21/Table F-15 Page 1 of 1 Wenck Associates, Inc.

Appendix F, Table F-16
MPCA Long Prairie River Watershed TMDL Final Project Report
Groundwater Quality Monitoring Data
ID Agency Unique Well IDdepth of Well (ft) Source of Water
Date of Collection Time of Collection
NO2 + NO3 as Nitrogen (mg/L)
Phosphorus, dissolved
(mg/L)
1 SWCD T129 R37 Sec 1 SE 1/4 NE 1/4 70 Dean Yohnke 08/13/02 10:152 SWCD T129 R37 Sec 1 SW 1/4 NE 1/4 60 Charles Yohnke 08/13/02 11:053 SWCD T129 R37 Sec 12 SE 1/4 NW 1/4 30 Martin Tonn 08/13/02 10:454 SWCD T129 R35 Sec 16 NW 1/4 SW 1/4 104 Tim Bruder 08/13/02 11:305 SWCD T130 R33 Sec 9 N 1/2 SW 1/4 NW 1/4 150 Joe Myres 08/13/02 01:306 SWCD T132 R33 Sec 14 SW 1/4 SE 1/4 30 Jim Olson 08/13/02 03:107 MN040 455349095220501 128N37W18ADDC 01 08/27/96 10:00:00 AM8 USGS 460041094595101 T129NR34W05CBAB 07/27/94 12:45:00 PM 0.0669 USGS 460624094473501 130N33WS02AAA 01 07/27/94 11:15:00 AM 11
10 USGS 455647094515401 T129NR33W32ABBC 07/26/94 12:15:00 PM 1911 USGS 460412094515301 T130NR33WS17DBB 07/26/94 4:00:00 PM 2.312 USGS 454831094462601 T127NR33WS13DBA 07/22/94 12:05:00 PM 1313 USGS 455049094503001 T128NR33WS33CCC 05/04/94 8:45:00 AM 3.214 USGS 455951094562501 T129NR34WS10DA 05/04/94 12:00:00 PM 0.0515 USGS 455958094395501 T129NR32WS12BCD 05/04/94 1:15:00 PM 1216 USGS 454641094584701 127N34W29DAC 05/03/94 10:40:00 AM 0.0517 USGS 454744094464701 T127NR33WS24DBB 05/03/94 2:20:00 PM 0.0518 USGS 454744094464701 T127NR33WS24DBB 05/03/94 2:25:00 PM 0.0519 USGS 454755095003201 T127NR34WS19BDB 05/03/94 12:20:00 PM 0.0520 USGS 455321094535701 T128NR34WS24ABB 05/03/94 4:25:00 PM 0.0521 USGS 445614093215301 117N21W17DDB02 DES MOINES OUTWASH (112DSMO) 12/16/83 12:00:00 PM 0.1 0.1722 USGS 455900095162001 129N36W18CBB01 19.4 OUTWASH DEPOSITS (112OTSH) 11/15/83 2:00:00 PM 2223 USGS 455926095122901 129N36W15BBB01 18 OUTWASH DEPOSITS (112OTSH) 11/15/83 11:30:00 AM 1024 USGS 455900095162001 129N36W18CBB01 19.4 OUTWASH DEPOSITS (112OTSH) 07/27/83 2:30:00 PM 1925 USGS 455926095122901 129N36W15BBB01 18 OUTWASH DEPOSITS (112OTSH) 07/26/83 6:00:00 PM 1426 USGS 455926095122901 129N36W15BBB01 18 OUTWASH DEPOSITS (112OTSH) 05/19/83 12:15:00 PM 1127 USGS 455900095162001 129N36W18CBB01 19.4 OUTWASH DEPOSITS (112OTSH) 05/18/83 12:30:00 PM 1728 USGS 455900095162001 129N36W18CBB01 19.4 OUTWASH DEPOSITS (112OTSH) 02/23/83 12:45:00 PM 1329 USGS 455926095122901 129N36W15BBB01 18 OUTWASH DEPOSITS (112OTSH) 02/23/83 5:30:00 PM 3.930 USGS 455926095122901 129N36W15BBB01 18 OUTWASH DEPOSITS (112OTSH) 08/24/82 1:00:00 PM 5.731 USGS 445614093215301 117N21W17DDB02 23 DES MOINES OUTWASH (112DSMO) 06/02/80 3:30:00 PM32 USGS 445614093215301 117N21W17DDB02 DES MOINES OUTWASH (112DSMO) 06/02/80 3:35:00 PM33 USGS Average of several wellsAverage of several wells Viking Basin (sand plain area) 01/01/89 13 0.0334 USGS Median of several wells Median of several wells Viking Basin (sand plain area) 01/01/89 10 0.0235 129N33W21bbd 83 Surface outwash aquifer 11/28/79 0.21 0.0536 130N33W8bdd 60 Surface outwash aquifer 11/28/79 0.03 0.0637 131N34W27abb 40 Surface outwash aquifer 11/28/79 4.50 0.0538 128N33W17ccb 62 Surface outwash aquifer 09/18/79 0.09 0.00539 129N33W5ccb 27 Surface outwash aquifer 09/18/79 0.24 0.0140 130N33W4dbd 46 Surface outwash aquifer 09/18/79 0.09 0.005
T:/0147/51/Phase III Rpt/Appendices/Appendix F_Tab01-17_21.xls/Table F-16 Page 1 of 4 Wenck Associates, Inc.

Appendix F, Table F-16
MPCA Long Prairie River Watershed TMDL Final Project Report
Groundwater Quality Monitoring Data
ID123456789
10111213141516171819202122232425262728293031323334353637383940
Water Temperature
(C) Chloride (mg/L)
Organic carbon,
dissolved (mg/L)
Theoretical BOD ultimate (mg/L)
based on stoichiometry A
Theoretical BOD ultimate (mg/L)
based on stoichiometry B
SPECIFIC CONDUCTANCE (MICROSIEMENS/CM AT 25 DEG. C)
OXYGEN DISSOLVED (MG/L)
NITROGEN ORGANIC DISSOLVED (MG/L AS N)
NITROGEN AMMONIA DISSOLVED (MG/L AS N) Source of Data
11.81 439 2.14 Todd SWCD10.19 325 2.05 Todd SWCD12.97 520 1.9 Todd SWCD9.17 447 1.64 Todd SWCD
12.35 425 0.78 Todd SWCD10.88 413 1.04 Todd SWCD10.9 92 868 0.7 USGS (web site)
9.9 0.5 563 0.1 1.5 USGS (web site)
10.7 14 375 2.7 0.03 USGS (web site)
10.5 13 384 6.6 0.01 USGS (web site)
12.4 28 669 5.4 0.2 USGS (web site)
10.9 26 641 2.2 0.12 USGS (web site)
9.4 14 634 0.1 0.04 USGS (web site)
9 1.1 738 0.1 1.4 USGS (web site)
9.1 7.5 414 3.7 0.02 USGS (web site)
8.8 1.3 694 0.1 0.48 USGS (web site)
8.9 2.4 519 0.1 0.06 USGS (web site)
2.3 0.07 USGS (web site)
7.2 1.1 964 0.2 0.72 USGS (web site)
8.7 1.8 510 0.1 0.44 USGS (web site)
12 39 10 26.70 34.70 1080 0 1.1 USGS (web site)
9.5 660 USGS (web site)
10.5 480 USGS (web site)
9 620 USGS (web site)
8.5 530 USGS (web site)
7 520 USGS (web site)
8 650 USGS (web site)
9 560 USGS (web site)
7.5 550 USGS (web site)
9.5 4.1 1.7 4.54 5.90 515 0.180 0.02 USGS (web site)
9.5 9 24.03 31.23 1020 USGS (web site)
61 USGS (web site)
9.3 2 5.34 6.94 633 0.3 0.15 (Anderson, 1989)
9 1.9 5.07 6.59 575 0.18 0.08 (Anderson, 1989)
8.0 15 (Myette, 1984)
8.0 12 (Myette, 1984)
8.0 92 (Myette, 1984)
10.0 9.6 (Myette, 1984)
11.5 9.4 (Myette, 1984)
10.0 9.6 (Myette, 1984)
T:/0147/51/Phase III Rpt/Appendices/Appendix F_Tab01-17_21.xls/Table F-16 Page 2 of 4 Wenck Associates, Inc.

Appendix F, Table F-16
MPCA Long Prairie River Watershed TMDL Final Project Report
Groundwater Quality Monitoring Data
ID Agency Unique Well IDdepth of Well (ft) Source of Water
Date of Collection Time of Collection
NO2 + NO3 as Nitrogen (mg/L)
Phosphorus, dissolved
(mg/L)
41 130N33W17dbb 27 Surface outwash aquifer 09/18/79 5.30 0.00542 132N33W26dcc 31 Surface outwash aquifer 09/18/79 0.01 0.0143 133N32W14ccd 24 Surface outwash aquifer 09/18/79 0.01 0.2044 USGS 455337094521001 128N33W17CCB01 WADENA OUTWASH (112WDNO) 09/18/79 8:30:00 AM 4 0.0145 131N32W18bcc 27 Surface outwash aquifer 09/11/79 0.01 0.00546 131N32W18bcc 27 Surface outwash aquifer 05/01/79 0.03 0.0147 132N33W26dcc 31 Surface outwash aquifer 05/01/79 0.02 0.0148 133N32W14ccd 24 Surface outwash aquifer 05/01/79 0.01 0.1849 128N33W17ccb 62 Surface outwash aquifer 04/30/79 6.40 0.0150 129N33W5ccb 27 Surface outwash aquifer 04/30/79 0.005 0.0151 130N33W4dbd 46 Surface outwash aquifer 04/30/79 0.01 0.0152 130N33W17dbb 27 Surface outwash aquifer 04/30/79 4.50 0.0353 USGS 455337094521001 128N33W17CCB01 WADENA OUTWASH (112WDNO) 04/30/79 2:42:00 PM 6.4 0.0154 USGS 445614093215301 117N21W17DDB02 23 DES MOINES OUTWASH (112DSMO) 04/03/79 11:30:00 AM55 USGS 445614093215301 117N21W17DDB02 DES MOINES OUTWASH (112DSMO) 04/03/79 11:35:00 AM 0.0156 128N33W5cac 58 Surface outwash aquifer 03/08/79 0.005 0.0457 131N32W18bbc 27 Surface outwash aquifer 03/07/79 0.005 0.0958 133N32W14ccd 24 Surface outwash aquifer 03/06/79 0.005 0.1959 129N36W15bbb Surface outwash aquifer 11/13/73 0.160 129N36W18cbb 29 Surface outwash aquifer 11/13/73 8.661 USGS 455900095162001 129N36W18CBB01 OUTWASH DEPOSITS (112OTSH) 11/13/73 3:00:00 PM62 129N37W13aac Surface outwash aquifer 10/26/72 2763 129N33W21bbd 83 Surface outwash aquifer 03/08/6764 131N34W27abb 40 Surface outwash aquifer 03/08/6765 USGS 460427095380301 130N39W18ACB 08/28/65 (blank)66 USGS 454716095383801 127N40W25ABB 178 08/27/65 (blank)67 130N33W8bdd 60 Surface outwash aquifer 06/22/64
min 18 0.005 0.0050max 178 27.0 0.200average 44 5.238 0.049Count 42 51 25
T:/0147/51/Phase III Rpt/Appendices/Appendix F_Tab01-17_21.xls/Table F-16 Page 3 of 4 Wenck Associates, Inc.

Appendix F, Table F-16
MPCA Long Prairie River Watershed TMDL Final Project Report
Groundwater Quality Monitoring Data
ID141
4243444546474849505152535455565758596061626364656667
Water Temperature
(C) Chloride (mg/L)
Organic carbon,
dissolved (mg/L)
Theoretical BOD ultimate (mg/L)
based on stoichiometry A
Theoretical BOD ultimate (mg/L)
based on stoichiometry B
SPECIFIC CONDUCTANCE (MICROSIEMENS/CM AT 25 DEG. C)
OXYGEN DISSOLVED (MG/L)
NITROGEN ORGANIC DISSOLVED (MG/L AS N)
NITROGEN AMMONIA DISSOLVED (MG/L AS N) Source of Data
9.0 7.7 (Myette, 1984)
9.0 5.8 (Myette, 1984)
7.0 2.1 (Myette, 1984)
11 2.8 420 USGS (web site)
10.0 1 (Myette, 1984)
9.0 1.5 4.6 12.28 15.96 (Myette, 1984)
7.5 32 1.4 3.74 4.86 (Myette, 1984)
6.0 1.2 8.4 22.43 29.15 (Myette, 1984)
7.2 2.1 1.6 4.27 5.55 (Myette, 1984)
7.2 22 6.4 17.09 22.21 (Myette, 1984)
8.2 23 6.9 18.42 23.94 (Myette, 1984)
8.0 8.7 2.7 7.21 9.37 (Myette, 1984)
7.2 2.1 510 USGS (web site)
9 8 21.36 27.76 890 USGS (web site)
81 9.2 24.56 31.92 USGS (web site)
6.5 1.7 2.9 7.74 10.06 (Myette, 1984)
6.0 1.1 4.7 12.55 16.31 (Myette, 1984)
6.0 1.3 7.1 18.96 24.64 (Myette, 1984)
11 4.410 1210 12 603 USGS (web site)
7.5 525.8 (Myette, 1984)
9.4 (Myette, 1984)
13 USGS (web site)
7.5 1580 USGS (web site)
9.4 2 (Myette, 1984)
6.0 0.5 1.4 3.74 4.86 325 0.0 0.1800 0.010013.0 92.0 10 26.70 34.70 1580 6.6 0.3000 1.50009.15 15.49 5.21 13.90 18.06 620 1.583 0.220 0.379
58 51 17 17 17 37 20 3 17Theoretical BOD ultimate notes: A) Assumes complete stabilization of the organic carbon requires 2.67 mg of oxygen for every mg of carbon that is oxidized.B) Assumes complete stabilization of the organic carbon (for Algae) requires 3.47 mg of oxygen for every mg of carbon that is oxidized
T:/0147/51/Phase III Rpt/Appendices/Appendix F_Tab01-17_21.xls/Table F-16 Page 4 of 4 Wenck Associates, Inc.

Appendix F, Table F-17
MPCA Long Prairie River Watershed TMDL Final Project Report
Incremental Inflow Water Quality Parameters
Model Event CBODu (mg/L) ON (mg/L)NH3-N (mg/L)
NO2/ NO3-N (mg/L)
TP (mg/L) CBODu (mg/L) ON (mg/L)
NH3-N (mg/L)
NO2/ NO3-N (mg/L)
TP (mg/L)
August, 2001 17 0.3(a), 1.2(b) 0.19 0.8(c), 1.8(d) 0.08 --- --- --- --- ---September, 2001 17 0.3(a), 1.2(b) 0.19 0.8(c), 1.8(d) 0.08 246.4(e), 34.5(f) 0.3(a), 1.64(b) 0.19 0.8(c), 1.8(d) 0.08
February, 2002 17 0.3 0.19 0.8(c), 1.8(d) 0.08 7.8 0.3 0.19 0.8(c), 3.0(d) 0Summer 7Q10 17 0.3(a), 1.2(b) 0.19 0.8(c), 1.8(d) 0.08 --- --- --- --- ---Winter 7Q10 17 0.3(a), 1.2(b) 0.19 0.8(c), 1.8(d) 0.08 --- --- --- --- ---Spring 7Q10 17 0.3(a), 1.2(b) 0.19 0.8(c), 1.8(d) 0.08 34.5 0.3(a), 1.64(b) 0.19 0.8(c), 1.8(d) 0.08
Multiple values in cells denote reach variable parameters.(a) Value used in Model Reaches 1-11; 14(b) Value used in Model Reaches 12-13; 15-25 (Browerville (LPR 38.5) downstream (LPR 0.0))(c) Value used in Model Reaches 1-10; 20-25(d) Value used in Model Reaches 11-19 (between LPR 47.6 (upstream of superfund discharge) to LPR 18.2 (Bridge downstream of turtle creek inflow, after 15, 400th Street))(e) Value used in Model Reaches 1-3 (Carlos Reach)(f) Value used in Model Reaches 4-25
August, Summer, and Winter model runs do not have a runoff flow component.
Groundwater Runoff
T:/0147/51/Phase III Rpt/Appendices/Appendix F_Tab01-17_21/Table F-17 Page 1 of 1 Wenck Associates, Inc.

Appendix F, Table F-18
MPCA Long Prairie River Watershed TMDL Final Project Report
Modeled vs Monitored Water Quality Calibration Summary
DO CalibrationAugust 20, 22-24 2001 September 24-25 2001 February 7-8 2002
River Mile
Monitored Average DO
(mg/L)Modeled DO
(mg/L)Percent
Difference
Monitored Average DO
(mg/L)Modeled DO
(mg/L)Percent
Difference
Monitored Average DO
(mg/L)Modeled DO
(mg/L)Percent
Difference89.9 9.66 9.7 0% 8.40 8.4 0% 15.23 15.2 0%85.5 3.06 2.8 -8% 6.13 6.1 0% 12.81 14.1 10%83.1 6.21 4.5 -28% 8.79 7.5 -15% --- 13 ---79.4 9.24 7 -24% --- 8.9 --- --- 12.3 ---76.7 6.88 7.1 3% 9.45 9.5 1% 11.03 11.7 6%67 5.92 6.8 15% 9.48 9.4 -1% 11.13 10.8 -3%56 8.06 6.8 -16% 9.59 9 -6% 9.58 9.9 3%
49.3 --- 7.3 --- 10.15 9.2 -9% --- 9.8 ---47.8 7.29 7.4 2% 10.34 9.2 -11% 10.98 9 -18%47.2 --- 7.4 --- 9.93 9.2 -7% --- 8 ---42.2 --- 7.6 --- 9.35 9 -4% --- 7.8 ---38.5 7.57 7.7 2% 9.71 9 -7% 8.37 7.7 -8%34.2 7.41 7.8 5% 9.64 9 -7% 8.22 7.6 -8%30.8 7.49 7.9 6% 9.89 9.1 -8% 7.27 7.4 2%21.1 7.81 8.1 4% 9.83 9.5 -3% 7.09 6.7 -6%18.2 8.50 8.2 -4% 10.35 9.6 -7% 8.24 7.4 -10%15.3 9.55 8.4 -12% 11.30 9.9 -12% 7.60 7.3 -4%11.8 10.70 8.6 -20% 12.23 10.2 -17% --- 7.3 ---9.2 10.27 8.7 -15% 13.13 10.3 -22% 7.60 7.2 -5%3.2 10.21 8.8 -14% 13.38 10.4 -22% 7.25 7.2 -1%
Average Percent Difference -6% -8% -3%
CBODu CalibrationAugust 20, 22-24 2001 September 24-25 2001 February 7-8 2002
River Mile
Monitored Average
CBOD 20-day(mg/L)
Modeled BOD (mg/L)
Percent Difference
Monitored Average
CBOD 20-day(mg/L)
Modeled BOD (mg/L)
Percent Difference
Monitored Average
CBOD 20-day(mg/L)
Modeled BOD (mg/L)
Percent Difference
89.9 6.4 6.38 0% 7.4 7.66 4% 12.0 11.99 0%85.5 4.6 6.11 32% 11.1 12.84 16% --- 11.52 ---83.1 2.3 5.94 --- 2.5 12.77 --- --- 11.27 ---79.4 --- 5.75 --- --- 12.51 --- --- 10.98 ---76.7 5.8 5.38 -7% 18.5 12.15 -34% --- 10.58 ---
67 2.3 4.98 --- 12.3 12.02 -2% --- 10.05 ---56 2.3 5.01 --- 13.5 12.38 -8% --- 9.9 ---
49.3 --- 5.14 --- --- 12.72 --- --- 9.9 ---47.8 4.6 5.17 11% 2.5 12.78 --- --- 9.9 ---47.2 --- 5.18 --- --- 12.8 --- --- 9.9 ---42.2 --- 5.26 --- --- 13.6 --- --- 9.87 ---38.5 2.3 5.31 --- 6.2 13.69 123% --- 9.86 ---34.2 5.8 5.37 -7% 12.3 13.81 12% --- 9.85 ---30.8 2.3 5.42 --- 12.3 14.29 16% --- 9.82 ---21.1 3.5 5.56 60% 16.0 14.46 -10% --- 9.8 ---18.2 --- 5.61 --- --- 14.51 --- --- 9.8 ---15.3 7.0 5.71 -18% 12.3 14.54 18% --- 9.78 ---11.8 2.3 5.62 --- --- 14.4 --- --- 9.7 ---
9.2 2.3 5.48 --- 16.0 14.31 -11% --- 9.64 ---3.2 4.6 5.35 15% 14.8 14.07 -5% --- 9.51 ---
NOTE: gray shaded cells are non detect shown as half the detection limit. "< DL" in the Percent Difference Column denotes when the Model is predicting below the Detection Limit.Average Percent Difference 11% 10% 0%
T:\0147\51\Phase III Rpt\Appendices\Appendix F_tab18_fig06 Table F-18 1 of 3 Wenck Associates, Inc.

Appendix F, Table F-18
MPCA Long Prairie River Watershed TMDL Final Project Report
Modeled vs Monitored Water Quality Calibration Summary
TP CalibrationAugust 20, 22-24 2001 September 24-25 2001 February 7-8 2002
River Mile
Monitored Average TP
(mg/L)Modeled TP
(mg/L)Percent
Difference
Monitored Average TP
(mg/L)Modeled TP
(mg/L)Percent
Difference
Monitored Average TP
(mg/L)Modeled TP
(mg/L)Percent
Difference89.9 0.003 0 -100% 0.003 0 -100% 0.003 0.000 -100%85.5 0.016 0.01 -38% 0.010 0.01 0% 0.006 0.010 67%83.1 0.026 0.02 -23% 0.009 0.02 122% --- 0.010 ---79.4 --- 0.03 --- --- 0.03 --- --- 0.010 ---76.7 0.037 0.04 8% 0.061 0.04 -34% 0.008 0.010 25%67 0.060 0.06 0% 0.024 0.06 150% 0.008 0.010 25%56 0.047 0.06 28% 0.023 0.06 161% 0.011 0.020 82%
49.3 --- 0.06 --- --- 0.06 --- --- 0.020 ---47.8 0.052 0.05 -4% 0.028 0.06 114% 0.008 0.020 150%47.2 --- 0.05 --- --- 0.06 --- --- 0.020 ---42.2 --- 0.05 --- --- 0.23 --- --- 0.020 ---38.5 0.064 0.05 -22% 0.192 0.22 15% 0.016 0.020 25%34.2 0.067 0.05 -25% 0.176 0.22 25% 0.016 0.020 25%30.8 0.072 0.05 -31% 0.156 0.23 47% 0.031 0.020 -35%21.1 0.055 0.05 -9% 0.140 0.22 57% --- 0.020 ---18.2 --- 0.05 --- --- 0.21 --- 0.011 0.020 82%15.3 0.052 0.05 -4% 0.108 0.2 85% 0.018 0.020 11%11.8 0.063 0.04 -37% --- 0.19 --- --- 0.020 ---9.2 0.049 0.04 -18% 0.078 0.18 131% --- 0.020 ---3.2 0.043 0.04 -7% 0.079 0.18 128% 0.017 0.020 18%
Average Percent Difference -19% 64% 31%
NH3-N CalibrationAugust 20, 22-24 2001 September 24-25 2001 February 7-8 2002
River Mile
Monitored Average Ammonia
(mg/L)
Modeled Ammonia
(mg/L)Percent
Difference
Monitored Average Ammonia
(mg/L)
Modeled Ammonia
(mg/L)Percent
Difference
Monitored Average Ammonia
(mg/L)
Modeled Ammonia
(mg/L)Percent
Difference89.9 0.01 0.01 < DL 0.01 0.01 < DL 0.04 0.04 0%85.5 0.01 0.01 < DL 0.01 0.02 < DL 0.06 0.06 0%83.1 0.01 0.02 < DL 0.01 0.02 < DL --- 0.06 ---79.4 --- 0.02 --- --- 0.03 --- --- 0.07 ---76.7 0.01 0.02 < DL 0.01 0.03 --- 0.09 0.07 -22%67 0.01 0.02 < DL 0.01 0.03 --- 0.09 0.08 -11%56 0.01 0.02 < DL 0.01 0.03 --- 0.07 0.09 29%
49.3 --- 0.02 --- --- 0.04 --- --- 0.1 ---47.8 0.01 0.02 < DL 0.01 0.04 --- 0.15 0.1 -33%47.2 --- 0.02 --- --- 0.04 --- --- 0.1 ---42.2 --- 0.01 --- --- 0.38 --- --- 0.11 ---38.5 0.01 0.01 < DL 0.23 0.34 48% 0.10 0.12 20%34.2 0.03 0.01 -67% 0.19 0.3 58% 0.14 0.12 -14%30.8 0.02 0.01 -50% 0.14 0.25 79% 0.14 0.13 -7%21.1 0.01 0.01 < DL 0.08 0.2 150% --- 0.14 ---18.2 --- 0.01 --- --- 0.19 --- 0.11 0.14 27%15.3 0.01 0.01 < DL 0.01 0.17 --- 0.16 0.14 -13%11.8 0.01 0.01 < DL --- 0.14 --- --- 0.13 ---9.2 0.01 0.01 < DL 0.01 0.12 --- --- 0.13 ---3.2 0.01 0 < DL 0.01 0.09 --- 0.07 0.12 71%
NOTE: gray shaded cells are non detect shown as half the detection limit. "< DL" in the Percent Difference Column denotes when the Model is predicting below the Detection Limit.Average Percent Difference -58% 84% 4%
T:\0147\51\Phase III Rpt\Appendices\Appendix F_tab18_fig06 Table F-18 2 of 3 Wenck Associates, Inc.

Appendix F, Table F-18
MPCA Long Prairie River Watershed TMDL Final Project Report
Modeled vs Monitored Water Quality Calibration Summary
NO2/ NO3-N CalibrationAugust 20, 22-24 2001 September 24-25 2001 February 7-8 2002
River Mile
Monitored Average
NO2+NO3 (mg/L)
Modeled NO2+NO3
(mg/L)Percent
Difference
Monitored Average
NO2+NO3 (mg/L)
Modeled NO2+NO3
(mg/L)Percent
Difference
Monitored Average
NO2+NO3 (mg/L)
Modeled NO2+NO3
(mg/L)Percent
Difference89.9 0.10 0.10 < DL 0.10 0.10 < DL 0.10 0.10 < DL85.5 0.10 0.09 < DL 0.10 0.11 < DL 0.10 0.19 < DL83.1 0.10 0.09 < DL 0.10 0.12 < DL --- 0.23 ---79.4 --- 0.09 --- --- 0.19 --- --- 0.29 ---76.7 0.10 0.08 < DL 0.10 0.18 < DL 0.43 0.33 -23%67 0.10 0.08 < DL 0.10 0.21 --- 0.41 0.44 7%56 0.10 0.10 < DL 0.10 0.24 --- 0.56 0.51 -9%
49.3 --- 0.11 --- --- 0.26 --- --- 0.54 ---47.8 0.10 0.11 < DL 0.10 0.27 --- 0.49 0.55 12%47.2 --- 0.12 --- --- 0.27 --- --- 0.56 ---42.2 --- 0.14 --- --- 0.36 --- --- 0.72 ---38.5 0.10 0.16 < DL 0.35 0.43 23% 0.76 0.83 9%34.2 0.10 0.19 < DL 0.41 0.49 20% 0.90 0.94 4%30.8 0.27 0.21 -22% 0.56 0.62 11% 1.19 1.02 -14%21.1 0.33 0.25 -24% 0.68 0.72 6% --- 1.22 ---18.2 --- 0.26 --- --- 0.73 --- 1.46 1.28 -12%15.3 0.30 0.25 -17% 0.76 0.71 -7% 0.87 1.27 46%11.8 0.22 0.24 9% --- 0.72 --- --- 1.26 ---9.2 0.10 0.23 --- 0.62 0.71 15% --- 1.26 ---3.2 0.10 0.21 --- 0.57 0.72 26% 1.14 1.25 10%
NOTE: gray shaded cells are non detect shown as half the detection limit. "< DL" in the Percent Difference Column denotes when the Model is predicting below the Detection Limit.Average Percent Difference -4% 7% 3%
Chlorophyll-a CalibrationAugust 20, 22-24 2001 September 24-25 2001 February 7-8 2002
River Mile
Monitored Average
Chlorophyll-a (mg/L)
Modeled Chlorophyll-a
(mg/L)Percent
Difference
Monitored Average
Chlorophyll-a (mg/L)
Modeled Chlorophyll-a
(mg/L)Percent
Difference
Monitored Average
Chlorophyll-a (mg/L)
Modeled Chlorophyll-a
(mg/L)Percent
Difference89.9 2.50 2.5 0% 1.70 1.6 -6% --- 0 ---85.5 2.60 2.6 0% 0.50 0.5 < DL --- 0 ---83.1 2.20 2.2 0% 5.00 5 0% --- 0 ---79.4 --- 0.9 --- --- 2.2 --- --- 0 ---76.7 0.50 0.5 < DL 0.50 0.5 < DL --- 0 ---67 0.50 0.5 < DL 0.50 0.5 < DL --- 0 ---56 1.10 1.1 0% 0.50 0.5 < DL --- 0 ---
49.3 --- 1.1 --- --- 1.2 --- --- 0 ---47.8 1.07 1.1 3% 1.40 1.4 0% --- 0 ---47.2 --- 1 --- --- 1.5 --- --- 0 ---42.2 --- 0.7 --- --- 2.5 --- --- 0 ---38.5 0.50 0.5 < DL 3.20 3.2 0% --- 0 ---34.2 1.00 1 0% 1.90 1.9 0% --- 0 ---30.8 1.20 1.2 0% 2.40 2.4 0% --- 0 ---21.1 2.50 2.5 0% 3.10 3.1 0% --- 0 ---18.2 --- 1.9 --- --- 1.6 --- --- 0 ---15.3 1.90 1.9 0% 1.60 1.6 0% --- 0 ---11.8 2.80 2.8 0% --- 1.6 --- --- 0 ---9.2 1.90 1.9 0% 1.60 1.6 0% --- 0 ---3.2 4.50 4.5 0% 1.70 1.7 0% --- 0 ---
NOTE: gray shaded cells are non detect shown as half the detection limit. "< DL" in the Percent Difference Column denotes when the Model is predicting below the Detection Limit.Average Percent Difference 0% 0%
T:\0147\51\Phase III Rpt\Appendices\Appendix F_tab18_fig06 Table F-18 3 of 3 Wenck Associates, Inc.

Appendix F Table F-19a
MPCA Long Prairie River Watershed TMDL Final Project Report
Discharge Monitoring Report Summaries for WWTFs Discharging within the Long Prairie River Watershed
Browerville SD-001 Eagle Bend (SD-010) Eagle Bend (SD002)
Discharge Period
Average Daily Flow
(mgd) DaysCBOD5
(mg/L)TSS
(mg/L)TP
(mg/L)DO
(mg/L)
Total Flow (MG) Days
CBOD5
(mg/L)TSS
(mg/L)TP
(mg/L)DO
(mg/L)
Average Daily Flow
(mgd) DaysCBOD5
(mg/L)TSS
(mg/L)TP
(mg/L)DO
(mg/L)Jul-98 ---
Aug-98 ---Oct-98 fall discharge 0.624 8 5 5 --- 12Nov-98 fall discharge 0.04 --- --- --- --- ---Dec-98 fall dischargeJan-99 ---Feb-99 ---Mar-99 ---Apr-99 spring discharge 0.06 --- 10 16 --- --- 0.624 8 8 22 --- 13
May-99 spring discharge 0.062 --- 108 302 --- --- 0.86 10 7.5 15.12 --- 7Jun-99 spring discharge 0.07 --- 24 46 --- --- 1.608 7 4 9.5 --- 6Jul-99 --- 0.062 --- 13 17 --- ---
Aug-99 --- 0.018 --- 13 17 --- ---Sep-99 fall discharge 0.651 7 20.9 43.06 --- 9Oct-99 fall discharge 1.035 14 3.8 15.8 --- 8Nov-99 fall discharge 4.18 2 9 25 1.7 11Dec-99 fall discharge 3.73 5 10 29 --- 12.5Jan-00 ---Feb-00 ---Mar-00 ---Apr-00 spring discharge 0.614 8 9 18 --- 11
May-00 spring dischargeJun-00 spring dischargeJul-00 ---
Aug-00 ---Sep-00 fall discharge 0.623 8 1.5 12.5 --- 8Oct-00 fall discharge 0.62 7 2 5.5 --- 12Nov-00 fall dischargeDec-00 fall dischargeJan-01 ---Feb-01 ---Mar-01 ---Apr-01 spring discharge 1.28 15 11 --- --- --- 1.602 7 10.8 --- --- 8
May-01 spring discharge 0.911 11 3.34 --- --- 8Jun-01 spring discharge 0.308 5 14.7 --- --- --- 1.127 5 7.405 --- --- 7.67Jul-01 --- 1.006 6 1.25 --- --- 9
Aug-01 ---Sep-01 fall discharge 0.651 7 4 --- --- 6Oct-01 fall discharge 3.76 7 2 --- 2.8 11.93 0.651 9 1.325 --- --- 12.5Nov-01 fall discharge 2.06 3 2 --- 2.8 11.93 0.651 2 1 --- --- 13.5Dec-01 fall dischargeSep-02 fall discharge 0.624 8 4.33 5.7 --- ---
Notes:Shaded cells indicate days determined by Total Discharge (MG) divided by Average Daily Discharge (mgd)Bolded numbers indicate sample below detections limit, reported as half the detection limitDMRs requested for July-August 1998 and September 2001 to better understand Validataion Data Set
t:/0147/36/Phase I/ Appendices/Appendix F_Tab19ab.xls/Appendix F Table F-19a Page 1 of 3 Wenck Associates, Inc.

Appendix F Table F-19a
MPCA Long Prairie River Watershed TMDL Final Project Report
Discharge Monitoring Report Summaries for WWTFs Discharging within the Long Prairie River Watershed
Discharge PeriodJul-98 ---
Aug-98 ---Oct-98 fall dischargeNov-98 fall dischargeDec-98 fall dischargeJan-99 ---Feb-99 ---Mar-99 ---Apr-99 spring discharge
May-99 spring dischargeJun-99 spring dischargeJul-99 ---
Aug-99 ---Sep-99 fall dischargeOct-99 fall dischargeNov-99 fall dischargeDec-99 fall dischargeJan-00 ---Feb-00 ---Mar-00 ---Apr-00 spring discharge
May-00 spring dischargeJun-00 spring dischargeJul-00 ---
Aug-00 ---Sep-00 fall dischargeOct-00 fall dischargeNov-00 fall dischargeDec-00 fall dischargeJan-01 ---Feb-01 ---Mar-01 ---Apr-01 spring discharge
May-01 spring dischargeJun-01 spring dischargeJul-01 ---
Aug-01 ---Sep-01 fall dischargeOct-01 fall dischargeNov-01 fall dischargeDec-01 fall dischargeSep-02 fall discharge
Carlos (SD001) Clarissa (SD001)
Average Daily Flow
(mgd) DaysCBOD5
(mg/L)TSS
(mg/L)TP
(mg/L)DO
(mg/L)
Average Daily Flow
(mgd) DaysCBOD5
(mg/L)TSS
(mg/L)TP
(mg/L)DO
(mg/L)
0.044 31 5 5 --- 9.80.61 4 7.30 22 0.410 9.00
0.76 7 17 --- 2.26 12.2 0.57 7 8.75 29.5 0.91 13.000.68 6 13 18 0.97 10.6 0.70 11 16.33 37.66 0.75 11.67
0.87 9 3.00 10 1.94 8.000.61 7 3 4.33 2.125 9.7 0.92 8 3.50 10 0.66 9.00
0.61 4 7.30 10 0.41 9.00
0.68 7 5.66 --- 1.22 12.33 0.09 2 2.60 3.5 0.21 9.000.10 8 4.00 12 2.60 9.00
0.68 7 2 5.3 1.745 9 0.92 4 3.94 --- 0.50 7.96
0.655 9 14 3.26 13 0.92 6 11.30 --- 0.85 10.000.605 6 13.5 --- 1.26 10.3 0.91 14 10.63 --- 1.90 8.20
0.91 5 13.90 --- 1.55 9.000.91 6 42.85 --- 3.08 6.00
0.928 7 40 --- 4 9.8 0.91 9 7.33 --- 2.94 11.000.91 2 8.50 --- 3.62 12.00
0.92 10 3.60 6.5 3.25 ---Notes:Shaded cells indicate days determined by Total Discharge (MG) divided by Average Daily Discharge (mgd)Bolded numbers indicate sample below detections limit, reported as half the detection limit
t:/0147/36/Phase I/ Appendices/Appendix F_Tab19ab.xls/Appendix F Table F-19a Page 2 of 3 Wenck Associates, Inc.

Appendix F Table F-19a
MPCA Long Prairie River Watershed TMDL Final Project Report
Discharge Monitoring Report Summaries for WWTFs Discharging within the Long Prairie River Watershed
Discharge PeriodJul-98 ---
Aug-98 ---Oct-98 fall dischargeNov-98 fall dischargeDec-98 fall dischargeJan-99 ---Feb-99 ---Mar-99 ---Apr-99 spring discharge
May-99 spring dischargeJun-99 spring dischargeJul-99 ---
Aug-99 ---Sep-99 fall dischargeOct-99 fall dischargeNov-99 fall dischargeDec-99 fall dischargeJan-00 ---Feb-00 ---Mar-00 ---Apr-00 spring discharge
May-00 spring dischargeJun-00 spring dischargeJul-00 ---
Aug-00 ---Sep-00 fall dischargeOct-00 fall dischargeNov-00 fall dischargeDec-00 fall dischargeJan-01 ---Feb-01 ---Mar-01 ---Apr-01 spring discharge
May-01 spring dischargeJun-01 spring dischargeJul-01 ---
Aug-01 ---Sep-01 fall dischargeOct-01 fall dischargeNov-01 fall dischargeDec-01 fall dischargeSep-02 fall discharge
Long Prairie (SD001) Long Prairie (SD002) Long Prairie (SD003)
Average Daily Flow
(mgd) DaysCBOD5
(mg/L)TSS
(mg/L)TP ave (mg/L)
NH3-N Ave
(mg/L)DO
(mg/L)
Average Daily Flow
(mgd) DaysCBOD5
(mg/L)TSS
(mg/L)TP ave (mg/L)
NH3-N Ave
(mg/L)DO
(mg/L)
Average Daily Flow
(mgd) DaysCBOD5
(mg/L)TSS
(mg/L)TP ave (mg/L)
NH3-N Ave
(mg/L)DO
(mg/L)
1.22 16 7.00 237 13.89 --- 14.69 2.04 12 10.29 183 5.05 --- 16.361.75 7 8.00 61 4.60 --- 10.24 2.63 12 13.67 203 12.2 --- 15.371.75 19 16.44 406 3.86 --- 4.19 2.24 10 12.00 --- 10.7 --- 4.95
2.00 14 3.00 41 4.00 1.0 3.240.75 11 7.00 14.5 18.33 68.3 3.52 1.75 8 8.75 33 10.78 0.50 11.91 2.43 14 7.00 22.4 30.1 10.30 5.770.83 14 1.60 3.71 4.01 7.83 4.83 1.15 13 2.20 7.4 3.14 3.10 5.66
1.79 6 10.00 40.5 4.60 0.85 10.76
1.12 14 7.50 45.75 12.03 244.0 6.69 2.21 7 9.50 23 27.75 26.4 7.091.68 14 3.29 8.3 1.49 2.88 1.66 2.13 14 10.14 21 7.43 21.0 1.721.84 15 5.60 18 4.64 9.73 0.90 1.79 7 12.00 41 14.9 30.1 0.39
0.93 10 14.00 43.5 20.40 66.8 0.55 1.63 21 2.60 11.3 3.16 4.50 0.55 1.53 21 6.50 34.4 5.73 12.0 0.471.47 17 1.70 4.3 2.11 0.14 0.38 2.24 9 14.00 41.7 5.30 6.00 0.461.61 9 6.75 25.3 5.90 0.59 0.42
0.80 10 5.40 30.2 53.22 14.6 0.62
0.93 6 5.33 --- 15.77 270.7 2.92 1.75 29 9.63 --- 6.04 44.9 3.19 2.24 8 18.30 --- 10.10 30.1 0.870.93 9 11.20 --- 14.57 233.7 1.61 1.75 11 7.00 --- 3.27 13.2 2.21 2.24 9 6.50 --- 6.55 21.58 2.48
1.75 17 8.25 --- 8.37 25.2 0.81 1.79 26 9.82 --- 19.4 29.7 1.50
0.86 7 15.25 --- 13.25 117.8 5.35 1.75 19 1.58 --- 4.97 89.8 2.24 2.24 19 5.67 --- 2.95 8.15 3.511.41 6 4.00 --- 4.03 4.05 5.72
1.25 10 4.75 --- 7.50 89.8 4.67 1.19 11 9.25 --- 4.43 0.25 4.23 1.46 12 18.50 --- 3.55 14.8 3.30
0.093 14 13.50 33.25 14.58 48.880 --- 1.750 19 2.80 7.5 4.10 4.700 --- 2.24 19 5.80 17.8 56.800 11.300 ---Notes:Shaded cells indicate days determined by Total Discharge (MG) divided by Average Daily Discharge (mgd)Bolded numbers indicate sample below detections limit, reported as half the detection limit
t:/0147/36/Phase I/ Appendices/Appendix F_Tab19ab.xls/Appendix F Table F-19a Page 3 of 3 Wenck Associates, Inc.

Appendix F Table F-19b
MPCA Long Prairie River Watershed TMDL Final Project Report
Discharge Monitoring Report Summary Statistics for Municipal Dischargeswithin the Long Prairie River Watershed between October 1998 and December 2001
Browerville SD-001 Eagle Bend (SD-010) Eagle Bend (SD002)Flow (mgd)
CBOD5
(mg/L)TP
(mg/L)DO
(mg/L)Flow (MG)
CBOD5
(mg/L)TP
(mg/L)DO
(mg/L)Flow (mgd)
CBOD5
(mg/L)TP
(mg/L)DO
(mg/L)Average 3.43 5.75 2.43 11.84 0.24 27.67 no data no data 0.87 5.68 no data 9.42
count 4 4 3 4 8 7 0 0 16 16 0 16
spring discharge Average no data no data no data no data 0.36 33.54 no data no data 1.05 7.15 no data 8.67count 0 0 0 0 5 5 0 0 7 7 0 7
fall discharge Average 3.43 5.75 2.43 11.84 0.04 no data no data no data 0.69 4.94 no data 10.13count 4 4 3 4 1 0 0 0 8 8 0 8
t' --- --- --- --- --- --- --- --- 2.18 0.87 --- 1.09t(0.05) --- --- --- --- --- --- --- --- 2.365 2.262 --- 2.179
Signif. Diff. --- --- --- --- --- --- --- --- no no --- no
Carlos (SD001) Clarissa (SD001)Flow (mgd)
CBOD5
(mg/L)TP
(mg/L)DO
(mg/L)Flow (mgd)
CBOD5
(mg/L)TP
(mg/L)DO
(mg/L)Average 0.63 12.57 2.11 10.75 0.72 10.08 1.49 9.46
count 9 9 8 9 15 15 15 15
spring discharge Average 0.68 12.63 1.79 11.69 0.60 9.64 1.25 9.98count 5 5 5 5 7 7 7 7
fall discharge Average 0.56 12.50 2.62 9.58 0.82 5.84 1.50 9.42count 4 4 3 4 7 7 7 7
t' 0.59 0.01 1.01 3.78 1.48 1.84 0.41 0.64t(0.05) 3.182 3.182 3.182 2.571 2.365 2.306 2.262 2.201
Signif. Diff. no no no yes no no no no
Long Prairie (SD001) Long Prairie (SD002) Long Prairie (SD003)
Flow (mgd)
CBOD5
(mg/L)TP ave (mg/L)
Ammonia Ave (mg/L)
DO (mg/L)
Flow (mgd)
CBOD5
(mg/L)TP ave (mg/L)
Ammonia Ave
(mg/L)DO
(mg/L)Flow (mgd)
CBOD5
(mg/L)TP ave (mg/L)
Ammonia Ave (mg/L)
DO (mg/L)
Average 0.96 7.90 17.30 123.71 4.54 1.70 6.73 5.90 14.19 4.83 2.08 11.17 10.74 18.37 3.40count 10 10 10 9 10 19 19 19 16 19 12 12 12 10 12
spring discharge Average 1.05 7.76 14.06 249.45 6.48 1.84 8.67 7.23 20.38 5.18 2.15 11.78 11.61 26.50 3.90count 4 4 4 3 4 9 9 9 6 9 7 7 7 5 7
fall discharge Average 0.90 8.00 19.45 60.84 3.26 1.58 4.98 4.71 10.48 4.51 1.98 10.33 9.53 10.25 2.70count 6 6 6 6 6 10 10 10 10 10 5 5 5 5 5
t' 1.43 0.10 0.74 9.14 1.05 2.52 2.28 0.92 0.92 0.31 0.74 0.50 0.38 6.22 0.54t(0.05) 2.365 2.365 2.571 2.447 3.182 2.131 2.120 2.262 2.160 2.131 2.447 2.447 2.776 2.365 2.306
Signif. Diff. no no no yes no yes yes no no no no no no yes no
Statistics for DMR Summary Data from Oct-98 through Dec-01
By Discharge Period:
Statistics for DMR Summary Data from Oct-98 through Dec-01
By Discharge Period:
Statistics for DMR Summary Data from Oct-98 through Dec-01
By Discharge Period:
t:/0147/36/Phase I/ Appendices/Appendix F_Tab19ab.xls/Appendix F Table F-19b Page 1 of 1 Wenck Associates, Inc.

Appendix F, Table F-20
MPCA Long Prairie River Watershed TMDL Final Project Report
Detailed Summary of Model Senstivity
QUAL-TXCODE
QUAL-TX CODE Word Description Word 0% -25% 25% 0% -25% 25% 0% -25% 25%Stream Velocity VELOCITY 7.31 7.39 7.25 5.41 4.79 5.85 0.56 0.53 0.58Stream Depth DEPTH 7.02 7.48 5.41 5.41 0.56 0.56Stream Reaeration REAERATI 6.87 7.58 5.41 5.41 0.56 0.56BOD Aerobic Decay Rate BOD DECA 7.39 7.24 5.96 4.93 0.56 0.56Ammonia Decay Rate NH3 DECA 7.31 7.31 5.41 5.41 0.56 0.56Background Ammonia Benthos Source Rate NH3 SRCE 7.32 7.31 5.41 5.41 0.56 0.56Organic Nitrogen Decay Rate ORGN DEC 7.32 7.30 5.41 5.41 0.58 0.54Background Sediment Oxygen Demand BENTHAL 7.52 7.10 5.41 5.41 0.56 0.56Initial Chloryphyll a CHLOR A 7.30 7.32 5.41 5.41 0.56 0.56Initial Macrophytes MACRO 7.09 7.53 5.41 5.41 0.56 0.56Incremental Inflow INC INFL 7.37 7.25 5.03 5.76 0.56 0.55Incremental BOD INC BOD 7.35 7.27 4.82 6.00 0.56 0.56Incremental Ammonia INC NH3 7.32 7.30 5.41 5.41 0.56 0.56Incremental Nitrate + Nitrite INC NO3 7.31 7.31 5.41 5.41 0.56 0.56Incremental Organic Nitrogen INC ORGN 7.31 7.31 5.41 5.41 0.54 0.58
QUAL-TX CODE Word
Change [%] in DO
when CODE Word is
changed by -25%
Change [%] in DO
when CODE Word is
changed by +25%
Average Percent Change
Change [%] in
CBODu when
CODE Word is
changed by -25%
Change [%] in
CBODu when
CODE Word is
changed by +25%
Average Percent Change
Change [%] in ON
when CODE Word is
changed by -25%
Change [%] in ON
when CODE Word is
changed by +25%
Average Percent Change
VELOCITY 1% -1% -1% -12% 8% 10% -5% 3% 4%DEPTH -4% 2% 3% 0% 0% 0% 0% 0% 0%REAERATI -6% 4% 5% 0% 0% 0% 0% 0% 0%BOD DECA 1% -1% -1% 10% -9% -10% 0% 0% 0%NH3 DECA 0% 0% 0% 0% 0% 0% 0% 0% 0%NH3 SRCE 0% 0% 0% 0% 0% 0% 0% 0% 0%ORGN DEC 0% 0% 0% 0% 0% 0% 4% -3% -4%BENTHAL 3% -3% -3% 0% 0% 0% 0% 0% 0%CHLOR A 0% 0% 0% 0% 0% 0% 0% 0% 0%MACRO -3% 3% 3% 0% 0% 0% 0% 0% 0%INC INFL 1% -1% -1% -7% 6% 7% 1% -1% -1%INC BOD 1% -1% -1% -11% 11% 11% 0% 0% 0%INC NH3 0% 0% 0% 0% 0% 0% 0% 0% 0%INC NO3 0% 0% 0% 0% 0% 0% 0% 0% 0%INC ORGN 0% 0% 0% 0% 0% 0% -3% 3% 3%
DO [mg/L] CBODu [mg/L] Organic Nitrogen [mg/L]
T:/0147/51/Phase III Rpt/Appendices/Appendix F_Tab20/Table F-20 Page 1 of 2 Wenck Associates, Inc.

Appendix F, Table F-20
MPCA Long Prairie River Watershed TMDL Final Project Report
Detailed Summary of Model Senstivity
QUAL-TXCODE Word
VELOCITYDEPTHREAERATIBOD DECANH3 DECANH3 SRCEORGN DECBENTHALCHLOR AMACROINC INFLINC BODINC NH3INC NO3INC ORGN
QUAL-TX CODE Word
VELOCITYDEPTHREAERATIBOD DECANH3 DECANH3 SRCEORGN DECBENTHALCHLOR AMACROINC INFLINC BODINC NH3INC NO3INC ORGN
0% -25% 25% 0% -25% 25% 0% -25% 25%0.013 0.01 0.02 0.159 0.115 0.184 0.045 0.06 0.04
0.01 0.01 0.169 0.152 0.07 0.030.01 0.01 0.158 0.159 0.04 0.040.01 0.01 0.159 0.159 0.04 0.040.02 0.01 0.154 0.161 0.03 0.060.01 0.01 0.151 0.167 0.04 0.040.01 0.02 0.142 0.175 0.04 0.040.01 0.01 0.159 0.158 0.04 0.040.01 0.01 0.162 0.155 0.04 0.040.02 0.01 0.216 0.102 0.05 0.040.01 0.02 0.116 0.196 0.04 0.050.01 0.01 0.159 0.159 0.04 0.040.01 0.02 0.152 0.165 0.04 0.040.01 0.01 0.114 0.204 0.04 0.040.01 0.01 0.158 0.159 0.04 0.04
Change [%] in NH3-N when
CODE Word is
changed by -25%
Change [%] in NH3-N when
CODE Word is
changed by +25%
Average Percent Change
Change [%] in ON
when CODE Word is
changed by -25%
Change [%] in ON
when CODE Word is
changed by +25%
Average Percent Change
Change [%] in NH3-N when
CODE Word is
changed by -25%
Change [%] in NH3-N when
CODE Word is
changed by +25%
Average Percent Change
-17% 36% 27% -28% 16% 22% 23% -11% -17%11% -9% -10% 7% -4% -5% 48% -25% -37%2% -1% -2% 0% 0% 0% 0% 0% 0%0% 0% 0% 0% 0% 0% 0% 0% 0%48% -18% -33% -3% 2% 2% -35% 36% 36%-10% 7% 8% -5% 5% 5% 0% 0% 0%-20% 43% 31% -11% 10% 11% 0% 0% 0%-1% 1% 1% 0% 0% 0% 0% 0% 0%2% -2% -2% 2% -2% -2% 0% 0% 0%42% -19% -30% 36% -36% -36% 19% -18% -19%-15% 19% 17% -27% 24% 25% -1% 2% 1%0% 0% 0% 0% 0% 0% 0% 0% 0%
-16% 32% 24% -4% 4% 4% 0% 0% 0%0% 0% 0% -28% 28% 28% 0% 0% 0%-3% 4% 3% 0% 0% 0% 0% 0% 0%
NO2 / NO3 - Nitrogen [mg/L] Total Phosphorus [mg/L]Ammonia Nitrogen [mg/L]
T:/0147/51/Phase III Rpt/Appendices/Appendix F_Tab20/Table F-20 Page 2 of 2 Wenck Associates, Inc.

Appendix F, Table F-21
MPCA Long Prairie River Watershed TMDL Final Project Report
Distribution of 7Q10 Flows to the Tributaries by Acreages
Summer 7Q10 Event
Spring 7Q10 Event
Winter 7Q10 Event
(SUM) (SPR) (WIN)
0.23 0.23 0.1611.4 38.6 6.9
SUM SPR WINUS of USGS LPR 47.8 276,928 4.1E-05 1.4E-04 2.5E-05
Tributary Name SUM SPR WIN*Spruce Creek LPR 80.9 16243 0.67 2.26 0.00Dismal Creek LPR 73.3 10661 0.44 1.49 0.00Eagle Creek LPR 33.6 35942 1.48 5.01 0.00Turtle Creek LPR 20.8 36820 1.52 5.13 0.00Moran Creek LPR 15.8 21673 0.89 3.02 0.00Fish Trap Creek LPR 10.3 21897 0.90 3.05 0.00* Assume that Tributarys are frozen under Winter 7Q10 Event
Flow @ USGS (cfs)
Groundwater Inflow (cfs/RM)
Flow entering Long Prairie River at TMDL Site
Incremental Inflow (cfs) per acreage
Inflow at TMDL Site
NameTributary Acreage
Inflow at TMDL Site
NameTributary Acreage
T:/0147/51/Phase III Rpt/Appendices/Appendix F_Tab01-17_21/Table F-21 Page 1 of 1 Wenck Associates, Inc.

Appendix F, Table F-22
MPCA Long Prairie River Watershed TMDL Final Project Report
Tributary Water Quality Monitoring Data Collected During Phase II by Wenck and Todd SWCD
DATE Year Day Month Trib ID Sampled by Ammonia NO2+3 ON TP CBODu ON Ammonia NO2+3 TP ON Ammonia NO2+3 TP(mg/L) (mg/L) (mg/L) (mg/L) (mg/L) (mg/L) (mg/L) (mg/L) (mg/L) (mg/L) (mg/L) (mg/L) (mg/L)
4/21/99 1999 21 4 spruce Creek Todd SWCD 0.02 0.25 0.29 0.04 0.29 0.02 0.25 0.044/27/99 1999 27 4 spruce Creek Todd SWCD 0.02 0.21 0.36 0.05 0.36 0.02 0.21 0.055/11/99 1999 11 5 spruce Creek Todd SWCD 0.02 0.18 1.28 0.09 1.28 0.02 0.18 0.095/26/99 1999 26 5 spruce Creek Todd SWCD 0.03 0.14 0.43 0.06 0.43 0.03 0.14 0.06
6/2/99 1999 2 6 spruce Creek Todd SWCD 0.02 0.18 0.41 0.07 0.41 0.02 0.18 0.07 0.41 0.02 0.18 0.076/15/99 1999 15 6 spruce Creek Todd SWCD 0.03 0.04 0.73 0.09 0.73 0.03 0.04 0.09 0.73 0.03 0.04 0.096/29/99 1999 29 6 spruce Creek Todd SWCD 0.03 0.08 0.55 0.066 0.55 0.03 0.08 0.07 0.55 0.03 0.08 0.077/20/99 1999 20 7 spruce Creek Todd SWCD 0.28 0.08 0.11 0.058 0.11 0.28 0.08 0.06
8/3/99 1999 3 8 spruce Creek Todd SWCD 0.02 0.16 0.47 0.063 0.47 0.02 0.16 0.068/21/01 2001 21 8 spruce Creek Wenck 0.01 0.1 0.79 0.048 4.64 0.79 0.01 0.10 0.059/25/01 2001 25 9 spruce Creek Wenck 0.01 0.55 0.59 0.032 11.07average 0.045 0.18 0.55 0.061 7.86 0.510 0.065 0.107 0.066 0.579 0.024 0.154 0.067
count 11 11 11 11 2 6 6 6 6 7 7 7 76/15/99 1999 15 6 dismal Creek Todd SWCD 0.02 0.09 0.94 0.043 0.94 0.02 0.09 0.04 0.94 0.02 0.09 0.047/20/99 1999 20 7 dismal Creek Todd SWCD 0.02 0.14 1.08 0.066 1.08 0.02 0.14 0.07
8/3/99 1999 3 8 dismal Creek Todd SWCD 0.02 0.47 1.18 0.054 1.18 0.02 0.47 0.058/21/01 2001 21 8 dismal Creek Wenck 0.01 0.55 0.49 0.02 2.32 0.49 0.01 0.55 0.02average 0.018 0.31 0.92 0.046 2.32 0.923 0.018 0.313 0.046 0.940 0.020 0.090 0.043
count 4 4 4 4 1 4 4 4 4 1 1 1 14/11/02 2002 11 4 Eagle creek Todd SWCD 0.320 0.74 1.68 0.225 1.68 0.32 0.74 0.234/23/02 2002 23 4 Eagle creek Todd SWCD 0.011 0.35 1.089 0.063 1.09 0.01 0.35 0.065/21/02 2002 21 5 Eagle creek Todd SWCD 0.050 0.45 0.81 0.067 0.81 0.05 0.45 0.07
6/4/02 2002 4 6 Eagle creek Todd SWCD 0.060 0.71 0.6 0.085 0.60 0.06 0.71 0.09 0.60 0.06 0.71 0.096/17/02 2002 17 6 Eagle creek Todd SWCD 0.011 0.78 0.529 0.048 0.53 0.01 0.78 0.05 0.53 0.01 0.78 0.05
7/9/02 2002 9 7 Eagle creek Todd SWCD 0.011 0.41 1.089 0.097 1.09 0.01 0.41 0.107/24/02 2002 24 7 Eagle creek Todd SWCD 0.030 0.53 0.6 0.077 0.60 0.03 0.53 0.087/30/02 2002 30 7 Eagle creek Todd SWCD 0.011 0.71 0.759 0.060 0.76 0.01 0.71 0.068/13/02 2002 13 8 Eagle creek Todd SWCD 0.030 0.65 0.56 0.048 0.56 0.03 0.65 0.058/26/02 2002 26 8 Eagle creek Todd SWCD 0.011 0.75 0.479 0.055 0.48 0.01 0.75 0.069/11/02 2002 11 9 Eagle creek Todd SWCD 0.011 0.82 0.199 0.0719/24/02 2002 24 9 Eagle creek Todd SWCD 0.150 0.85 0.8 0.14310/8/02 2002 8 10 Eagle creek Todd SWCD 0.011 0.33 0.859 0.0944/10/97 1997 10 4 Eagle creek Todd SWCD 0.01 0.60 0.99 0.080 0.99 0.01 0.60 0.084/15/97 1997 15 4 Eagle creek Todd SWCD 0.01 0.26 0.67 0.050 0.67 0.01 0.26 0.054/22/97 1997 22 4 Eagle creek Todd SWCD 0.02 0.15 0.98 0.030 0.98 0.02 0.15 0.034/30/97 1997 30 4 Eagle creek Todd SWCD 0.02 0.28 0.87 0.020 0.87 0.02 0.28 0.02
5/6/97 1997 6 5 Eagle creek Todd SWCD 0.02 0.28 0.63 0.050 0.63 0.02 0.28 0.055/13/97 1997 13 5 Eagle creek Todd SWCD 0.02 0.40 0.51 0.040 0.51 0.02 0.40 0.045/21/97 1997 21 5 Eagle creek Todd SWCD 0.02 0.29 0.65 0.050 0.65 0.02 0.29 0.055/28/97 1997 28 5 Eagle creek Todd SWCD 0.02 0.22 0.66 0.030 0.66 0.02 0.22 0.03
6/3/97 1997 3 6 Eagle creek Todd SWCD 0.02 0.25 0.58 0.040 0.58 0.02 0.25 0.04 0.58 0.02 0.25 0.046/24/97 1997 24 6 Eagle creek Todd SWCD 0.02 0.19 0.49 0.050 0.49 0.02 0.19 0.05 0.49 0.02 0.19 0.056/30/97 1997 30 6 Eagle creek Todd SWCD 0.05 0.27 0.5 0.080 0.50 0.05 0.27 0.08 0.50 0.05 0.27 0.08
7/8/97 1997 8 7 Eagle creek Todd SWCD 0.03 0.24 0.51 0.050 0.51 0.03 0.24 0.057/15/97 1997 15 7 Eagle creek Todd SWCD 0.02 0.19 0.67 0.080 0.67 0.02 0.19 0.087/22/97 1997 22 7 Eagle creek Todd SWCD 0.02 0.25 0.75 0.080 0.75 0.02 0.25 0.088/12/97 1997 12 8 Eagle creek Todd SWCD 0.03 0.29 0.43 0.060 0.43 0.03 0.29 0.06
9/9/97 1997 9 9 Eagle creek Todd SWCD 0.25 0.19 0.19 0.0509/23/97 1997 23 9 Eagle creek Todd SWCD 0.07 0.26 0.37 0.030 14.103/31/98 1998 31 3 Eagle creek Todd SWCD 0.08 0.67 1.27 0.120
4/6/98 1998 6 4 Eagle creek Todd SWCD 0.02 0.25 0.804 0.080 0.80 0.02 0.25 0.084/14/98 1998 14 4 Eagle creek Todd SWCD 0.02 0.210 0.908 0.055 0.91 0.02 0.21 0.064/21/98 1998 21 4 Eagle creek Todd SWCD 0.02 0.341 0.859 0.037 0.86 0.02 0.34 0.044/22/98 1998 22 4 Eagle creek Todd SWCD 0.05 0.340 0.69 0.058 0.69 0.05 0.34 0.064/28/98 1998 28 4 Eagle creek Todd SWCD 0.04 0.448 0.58 0.050 0.58 0.04 0.45 0.055/12/98 1998 12 5 Eagle creek Todd SWCD 0.02 0.310 0.85 0.093 1.45 0.85 0.02 0.31 0.095/19/98 1998 19 5 Eagle creek Todd SWCD 0.02 0.110 1.41 0.133 1.41 0.02 0.11 0.135/26/98 1998 26 5 Eagle creek Todd SWCD 0.08 0.550 0.69 0.130 0.69 0.08 0.55 0.13
6/2/98 1998 2 6 Eagle creek Todd SWCD 0.03 0.370 0.66 0.078 0.66 0.03 0.37 0.08 0.66 0.03 0.37 0.086/25/98 1998 25 6 Eagle creek Todd SWCD 0.05 0.200 1.17 0.110 2.61 1.17 0.05 0.20 0.11 1.17 0.05 0.20 0.117/28/98 1998 28 7 Eagle creek Todd SWCD 0.020 0.420 0.86 0.050 0.86 0.02 0.42 0.058/11/98 1998 11 8 Eagle creek Todd SWCD 0.03 0.41 0.46 0.040 0.46 0.03 0.41 0.048/25/98 1998 25 8 Eagle creek Todd SWCD 0.05 0.52 0.4 0.070 0.40 0.05 0.52 0.074/13/99 1999 13 4 Eagle creek Todd SWCD 0.02 0.16 0.78 0.05 0.78 0.02 0.16 0.054/21/99 1999 21 4 Eagle creek Todd SWCD 0.02 0.23 0.51 0.04 0.51 0.02 0.23 0.044/27/99 1999 27 4 Eagle creek Todd SWCD 0.02 0.26 0.49 0.05 0.49 0.02 0.26 0.055/11/99 1999 11 5 Eagle creek Todd SWCD 0.05 0.23 1.35 0.10 1.35 0.05 0.23 0.105/26/99 1999 26 5 Eagle creek Todd SWCD 0.03 0.26 0.91 0.08 0.91 0.03 0.26 0.08
All Data Summer Data Spring Data
T:0147/51/Phase III Report/Appendices/Appendix F_Tab22.xls/Sheet1 (a) Page 1 of 1 Wenck Associates, Inc.

Appendix F, Table F-22
MPCA Long Prairie River Watershed TMDL Final Project Report
Tributary Water Quality Monitoring Data Collected During Phase II by Wenck and Todd SWCD
DATE Year Day Month Trib ID Sampled by Ammonia NO2+3 ON TP CBODu ON Ammonia NO2+3 TP ON Ammonia NO2+3 TP(mg/L) (mg/L) (mg/L) (mg/L) (mg/L) (mg/L) (mg/L) (mg/L) (mg/L) (mg/L) (mg/L) (mg/L) (mg/L)
6/2/99 1999 2 6 Eagle creek Todd SWCD 0.02 0.69 0.49 0.07 0.49 0.02 0.69 0.07 0.49 0.02 0.69 0.076/15/99 1999 15 6 Eagle creek Todd SWCD 0.02 0.05 0.84 0.096 0.84 0.02 0.05 0.10 0.84 0.02 0.05 0.106/29/99 1999 29 6 Eagle creek Todd SWCD 0.65 0.21 0.13 0.091 0.13 0.65 0.21 0.09 0.13 0.65 0.21 0.097/20/99 1999 20 7 Eagle creek Todd SWCD 0.24 0.11 0.56 0.097 0.56 0.24 0.11 0.10
8/3/99 1999 3 8 Eagle creek Todd SWCD 0.04 0.43 0.37 0.062 0.37 0.04 0.43 0.066/6/00 2000 6 6 Eagle creek Todd SWCD 0.02 0.17 0.7 0.039 0.70 0.02 0.17 0.04 0.70 0.02 0.17 0.04
4/10/01 2001 10 4 Eagle creek Todd SWCD 0.08 1.00 1.02 0.196 1.02 0.08 1.00 0.204/18/01 2001 18 4 Eagle creek Todd SWCD 0.10 0.52 0.84 0.076 0.84 0.10 0.52 0.084/24/01 2001 24 4 Eagle creek Todd SWCD 0.09 1.10 0.88 0.112 0.88 0.09 1.10 0.11
5/8/01 2001 8 5 Eagle creek Todd SWCD 0.02 0.17 0.52 0.045 0.52 0.02 0.17 0.055/23/01 2001 23 5 Eagle creek Todd SWCD 0.0500 0.29 0.66 0.074 0.66 0.05 0.29 0.07
6/5/01 2001 5 6 Eagle creek Todd SWCD 0.0500 0.55 0.45 0.068 0.45 0.05 0.55 0.07 0.45 0.05 0.55 0.076/19/01 2001 19 6 Eagle creek Todd SWCD 0.0067 0.01 1.0933 0.135 1.09 0.01 0.01 0.14 1.09 0.01 0.01 0.14
7/3/01 2001 3 7 Eagle creek Todd SWCD 0.0500 0.48 1.05 0.151 1.05 0.05 0.48 0.158/15/01 2001 15 8 Eagle creek Todd SWCD 0.0067 0.73 0.3733 0.021 0.37 0.01 0.73 0.028/22/01 2001 22 8 Eagle creek Wenck 0.01 0.77 0.69 0.033 (a) 0.69 0.01 0.77 0.039/25/01 2001 25 9 Eagle creek Wenck 0.01 0.85 0.49 0.032 14.76
2/8/02 2002 8 2 Eagle creek Wenck 0.08 1.39 0.02 0.057 1average 0.053 0.43 0.71 0.073 6.78 0.628 0.055 0.411 0.071 0.756 0.054 0.363 0.075
count 67 67 67 67 5 30 30 30 30 43 42 42 424/11/02 2002 11 4 turtle creek Todd SWCD 0.300 0.13 1.3 0.134 1.30 0.30 0.13 0.134/23/02 2002 23 4 turtle creek Todd SWCD 0.040 0.04 0.86 0.052 0.86 0.04 0.04 0.05
5/7/02 2002 7 5 turtle creek Todd SWCD 0.020 0.03 0.97 0.033 0.97 0.02 0.03 0.035/21/02 2002 21 5 turtle creek Todd SWCD 0.011 0.0067 0.929 0.045 0.93 0.01 0.01 0.05
6/4/02 2002 4 6 turtle creek Todd SWCD 0.020 0.0067 0.85 0.052 0.85 0.02 0.01 0.05 0.85 0.02 0.01 0.056/17/02 2002 17 6 turtle creek Todd SWCD 0.011 0.03 1.089 0.071 1.09 0.01 0.03 0.07 1.09 0.01 0.03 0.07
7/9/02 2002 9 7 turtle creek Todd SWCD 0.011 0.01 1.489 0.074 1.49 0.01 0.01 0.077/24/02 2002 24 7 turtle creek Todd SWCD 0.240 0.01 1.16 0.231 1.16 0.24 0.01 0.237/30/02 2002 30 7 turtle creek Todd SWCD 0.011 0.01 1.389 0.112 1.39 0.01 0.01 0.118/13/02 2002 13 8 turtle creek Todd SWCD 0.120 0.01 1.48 0.089 1.48 0.12 0.01 0.098/26/02 2002 26 8 turtle creek Todd SWCD 0.011 0.03 1.189 0.057 1.19 0.01 0.03 0.069/11/02 2002 11 9 turtle creek Todd SWCD 0.030 0.06 0.58 0.0629/24/02 2002 24 9 turtle creek Todd SWCD 0.030 0.03 1.57 0.03010/8/02 2002 8 10 turtle creek Todd SWCD 0.011 0.01 0.619 0.035
4/9/97 1997 9 4 turtle creek Todd SWCD 0.06 0.33 0.89 0.090 0.89 0.06 0.33 0.094/15/97 1997 15 4 turtle creek Todd SWCD 0.01 0.09 0.68 0.050 0.68 0.01 0.09 0.054/22/97 1997 22 4 turtle creek Todd SWCD 0.02 0.02 1.08 0.040 1.08 0.02 0.02 0.04
5/1/97 1997 1 5 turtle creek Todd SWCD 0.06 0.02 1.14 0.010 1.14 0.06 0.02 0.015/7/97 1997 7 5 turtle creek Todd SWCD 0.02 0.02 1.08 0.030 1.08 0.02 0.02 0.03
5/13/97 1997 13 5 turtle creek Todd SWCD 0.03 0.02 0.86 0.040 0.86 0.03 0.02 0.045/21/97 1997 21 5 turtle creek Todd SWCD 0.02 0.02 1.08 0.060 1.08 0.02 0.02 0.065/28/97 1997 28 5 turtle creek Todd SWCD 0.02 0.02 1.08 0.050 1.08 0.02 0.02 0.05
6/3/97 1997 3 6 turtle creek Todd SWCD 0.02 0.04 0.98 0.050 0.98 0.02 0.04 0.05 0.98 0.02 0.04 0.056/24/97 1997 24 6 turtle creek Todd SWCD 0.02 0.13 0.76 0.060 0.76 0.02 0.13 0.06 0.76 0.02 0.13 0.066/30/97 1997 30 6 turtle creek Todd SWCD 0.02 0.02 0.62 0.070 0.62 0.02 0.02 0.07 0.62 0.02 0.02 0.07
7/8/97 1997 8 7 turtle creek Todd SWCD 0.04 0.04 0.67 0.040 0.67 0.04 0.04 0.047/15/97 1997 15 7 turtle creek Todd SWCD 0.02 0.02 0.98 0.060 0.98 0.02 0.02 0.067/22/97 1997 22 7 turtle creek Todd SWCD 0.02 0.02 0.98 0.060 0.98 0.02 0.02 0.068/12/97 1997 12 8 turtle creek Todd SWCD 0.02 0.02 1.08 0.040 1.08 0.02 0.02 0.04
9/9/97 1997 9 9 turtle creek Todd SWCD 0.08 0.02 0.92 0.0309/23/97 1997 23 9 turtle creek Todd SWCD 0.04 0.02 0.85 0.0203/31/98 1998 31 3 turtle creek Todd SWCD 0.15 0.32 0.97 0.120 19.86
4/6/98 1998 6 4 turtle creek Todd SWCD 0.02 0.02 0.806 0.040 0.81 0.02 0.02 0.044/14/98 1998 14 4 turtle creek Todd SWCD 0.02 0.020 0.875 0.040 0.88 0.02 0.02 0.044/21/98 1998 21 4 turtle creek Todd SWCD 0.02 0.028 0.815 0.012 0.82 0.02 0.03 0.014/28/98 1998 28 4 turtle creek Todd SWCD 0.02 0.028 0.87 0.050 0.87 0.02 0.03 0.055/12/98 1998 12 5 turtle creek Todd SWCD 0.02 0.050 0.97 0.063 4.64 0.97 0.02 0.05 0.065/19/98 1998 19 5 turtle creek Todd SWCD 0.02 0.050 1.04 0.076 16.66 1.04 0.02 0.05 0.085/26/98 1998 26 5 turtle creek Todd SWCD 0.02 0.020 1.18 0.100 1.18 0.02 0.02 0.10
6/2/98 1998 2 6 turtle creek Todd SWCD 0.02 0.050 0.9 0.058 1.45 0.90 0.02 0.05 0.06 0.90 0.02 0.05 0.066/9/98 1998 9 6 turtle creek Todd SWCD 0.02 0.050 0.81 0.047 2.61 0.81 0.02 0.05 0.05 0.81 0.02 0.05 0.05
6/25/98 1998 25 6 turtle creek Todd SWCD 0.02 0.050 1.17 0.064 2.9 1.17 0.02 0.05 0.06 1.17 0.02 0.05 0.067/7/98 1998 7 7 turtle creek Todd SWCD 0.03 0.020 1.25 0.118 1.25 0.03 0.02 0.12
7/28/98 1998 28 7 turtle creek Todd SWCD 0.020 0.020 1.08 0.090 1.08 0.02 0.02 0.098/11/98 1998 11 8 turtle creek Todd SWCD 0.02 0.02 0.98 0.060 0.98 0.02 0.02 0.068/25/98 1998 25 8 turtle creek Todd SWCD 0.05 0.02 0.91 0.100 0.91 0.05 0.02 0.108/27/98 1998 27 8 turtle creek Todd SWCD 0.099 0.10
9/9/98 1998 9 9 turtle creek Todd SWCD 0.02 0.02 1.08 0.0604/13/99 1999 13 4 turtle creek Todd SWCD 0.02 0.02 0.98 0.03 0.98 0.02 0.02 0.03
All Data Summer Data Spring Data
T:0147/51/Phase III Report/Appendices/junkF22.xls/Sheet1 (3) Page 1 of 1 Wenck Associates, Inc.

Appendix F, Table F-22
MPCA Long Prairie River Watershed TMDL Final Project Report
Tributary Water Quality Monitoring Data Collected During Phase II by Wenck and Todd SWCD
DATE Year Day Month Trib ID Sampled by Ammonia NO2+3 ON TP CBODu ON Ammonia NO2+3 TP ON Ammonia NO2+3 TP(mg/L) (mg/L) (mg/L) (mg/L) (mg/L) (mg/L) (mg/L) (mg/L) (mg/L) (mg/L) (mg/L) (mg/L) (mg/L)
4/21/99 1999 21 4 turtle creek Todd SWCD 0.02 0.02 0.56 0.03 0.56 0.02 0.02 0.034/27/99 1999 27 4 turtle creek Todd SWCD 0.02 0.02 0.66 0.04 0.66 0.02 0.02 0.045/11/99 1999 11 5 turtle creek Todd SWCD 0.02 4.90 1.68 0.08 1.68 0.02 4.90 0.085/26/99 1999 26 5 turtle creek Todd SWCD 0.10 0.04 1.1 0.05 1.10 0.10 0.04 0.05
6/2/99 1999 2 6 turtle creek Todd SWCD 0.02 0.02 0.9 0.05 0.90 0.02 0.02 0.05 0.90 0.02 0.02 0.056/29/99 1999 29 6 turtle creek Todd SWCD 0.55 0.02 0.29 0.056 0.29 0.55 0.02 0.06 0.29 0.55 0.02 0.067/20/99 1999 20 7 turtle creek Todd SWCD 0.02 0.02 0.83 0.068 0.83 0.02 0.02 0.07
8/3/99 1999 3 8 turtle creek Todd SWCD 0.02 0.02 0.82 0.049 0.82 0.02 0.02 0.056/19/00 2000 19 6 turtle creek Todd SWCD 0.02 0.02 1.08 0.057 1.08 0.02 0.02 0.06 1.08 0.02 0.02 0.067/12/00 2000 12 7 turtle creek Todd SWCD 0.02 0.02 1.08 0.058 1.08 0.02 0.02 0.064/10/01 2001 10 4 turtle creek Todd SWCD 0.18 0.50 0.82 0.198 0.82 0.18 0.50 0.204/18/01 2001 18 4 turtle creek Todd SWCD 0.13 0.23 0.51 0.068 0.51 0.13 0.23 0.074/24/01 2001 24 4 turtle creek Todd SWCD 0.16 0.15 0.4 0.047 0.40 0.16 0.15 0.05
5/8/01 2001 8 5 turtle creek Todd SWCD 0.06 0.02 0.73 0.046 0.73 0.06 0.02 0.055/23/01 2001 23 5 turtle creek Todd SWCD 0.0067 0.01 0.8733 0.049 0.87 0.01 0.01 0.05
6/5/01 2001 5 6 turtle creek Todd SWCD 0.0067 0.01 0.8333 0.052 0.83 0.01 0.01 0.05 0.83 0.01 0.01 0.056/19/01 2001 19 6 turtle creek Todd SWCD 0.0067 0.01 0.9233 0.099 0.92 0.01 0.01 0.10 0.92 0.01 0.01 0.10
7/3/01 2001 3 7 turtle creek Todd SWCD 0.1500 0.01 1.15 0.158 1.15 0.15 0.01 0.168/15/01 2001 15 8 turtle creek Todd SWCD 0.0067 0.01 1.6933 0.126 1.69 0.01 0.01 0.138/21/01 2001 21 8 turtle creek Wenck 0.01 0.1 1.29 0.084 5.8 1.29 0.01 0.10 0.088/28/01 2001 28 8 turtle creek Todd SWCD 0.0067 0.08 1.1933 0.063 1.19 0.01 0.08 0.069/25/01 2001 25 9 turtle creek Wenck 0.01 0.1 0.89 0.014 14.7610/2/01 2001 2 10 turtle creek Todd SWCD 0.0067 0.01 0.7933 0.026
2/8/02 2002 8 2 turtle creek Wenck 0.15 0.1 0.55 0.021 (a)average 0.050 0.12 0.97 0.064 8.59 1.027 0.049 0.029 0.077 0.905 0.053 0.175 0.058
count 72 72 72 73 8 33 33 33 34 42 42 42 424/6/98 1998 6 4 moran creek Todd SWCD 0.03 0.02 0.76 0.030 0.76 0.03 0.02 0.03
4/14/98 1998 14 4 moran creek Todd SWCD 0.02 0.020 0.83 0.064 0.83 0.02 0.02 0.064/21/98 1998 21 4 moran creek Todd SWCD 0.02 0.020 1.13 0.028 1.13 0.02 0.02 0.034/28/98 1998 28 4 moran creek Todd SWCD 0.02 0.033 0.73 0.010 0.73 0.02 0.03 0.015/12/98 1998 12 5 moran creek Todd SWCD 0.02 0.050 0.88 0.062 3.19 0.88 0.02 0.05 0.065/19/98 1998 19 5 moran creek Todd SWCD 0.02 0.050 1.25 0.071 1.25 0.02 0.05 0.075/26/98 1998 26 5 moran creek Todd SWCD 0.04 0.040 0.96 0.090 0.96 0.04 0.04 0.09
6/2/98 1998 2 6 moran creek Todd SWCD 0.02 0.050 0.78 0.057 2.03 0.78 0.02 0.05 0.06 0.78 0.02 0.05 0.066/9/98 1998 9 6 moran creek Todd SWCD 0.02 0.050 0.68 0.042 2.03 0.68 0.02 0.05 0.04 0.68 0.02 0.05 0.04
6/25/98 1998 25 6 moran creek Todd SWCD 0.05 0.050 0.89 0.046 2.9 0.89 0.05 0.05 0.05 0.89 0.05 0.05 0.057/7/98 1998 7 7 moran creek Todd SWCD 0.05 0.020 1.12 0.050 1.12 0.05 0.02 0.05
7/28/98 1998 28 7 moran creek Todd SWCD 0.020 0.030 0.98 0.040 0.98 0.02 0.03 0.048/11/98 1998 11 8 moran creek Todd SWCD 0.02 0.03 0.7 0.050 0.70 0.02 0.03 0.058/25/98 1998 25 8 moran creek Todd SWCD 0.02 0.06 0.45 0.060 0.45 0.02 0.06 0.068/27/98 1998 27 8 moran creek Todd SWCD 0.048 0.05
9/9/98 1998 9 9 moran creek Todd SWCD 0.02 0.04 3.88 0.0704/21/99 1999 21 4 moran creek Todd SWCD 0.02 0.02 0.6 0.03 0.60 0.02 0.02 0.034/27/99 1999 27 4 moran creek Todd SWCD 0.02 0.02 0.54 0.04 0.54 0.02 0.02 0.045/11/99 1999 11 5 moran creek Todd SWCD 0.02 0.05 1.18 0.06 1.18 0.02 0.05 0.065/26/99 1999 26 5 moran creek Todd SWCD 0.03 0.02 0.97 0.04 0.97 0.03 0.02 0.04
6/2/99 1999 2 6 moran creek Todd SWCD 0.02 0.05 0.73 0.04 0.73 0.02 0.05 0.04 0.73 0.02 0.05 0.046/15/99 1999 15 6 moran creek Todd SWCD 0.02 0.02 0.94 0.043 0.94 0.02 0.02 0.04 0.94 0.02 0.02 0.046/29/99 1999 29 6 moran creek Todd SWCD 0.3 0.02 0.61 0.044 0.61 0.30 0.02 0.04 0.61 0.30 0.02 0.047/20/99 1999 20 7 moran creek Todd SWCD 0.02 0.02 0.75 0.066 0.75 0.02 0.02 0.07
8/3/99 1999 3 8 moran creek Todd SWCD 0.02 0.02 0.98 0.045 0.98 0.02 0.02 0.058/21/01 2001 21 8 moran creek Wenck 0.01 0.1 0.69 0.009 9.28 0.69 0.01 0.10 0.019/25/01 2001 25 9 moran creek Wenck 0.01 0.1 0.89 0.014 14.76
2/8/02 2002 8 2 moran creek Wenck 0.24 0.24 w detection 0.008 (a)2/8/02 2002 8 2 moran creek Wenck 0.23 0.23 w detection 0.011 (a)
average 0.048 0.05 0.96 0.044 5.70 0.792 0.045 0.040 0.046 0.851 0.041 0.034 0.047count 28 28 26 29 6 13 13 13 14 17 17 17 17
8/21/01 2001 21 8 fish trap creek Wenck 0.01 0.1 0.69 0.041 (a) 0.69 0.01 0.10 0.049/25/01 2001 25 9 fish trap creek Wenck 0.01 0.1 0.89 0.022 14.76
2/8/02 2002 8 2 fish trap creek Wenck 0.07 0.1 0.33 0.017 (a)average 0.030 0.10 0.64 0.027 14.76 0.690 0.010 0.100 0.041 no data no data no data no data
count 3 3 3 3 1 1 1 1 1 0 0 0 0(a) indeterminate, observed value below detection limit
All Data Summer Data Spring Data
T:0147/51/Phase III Report/Appendices/junkF22.xls/Sheet1 (4) Page 1 of 1 Wenck Associates, Inc.

Appendix F, Table F-23
MPCA Long Prairie River Watershed TMDL Final Project Report
Point Source Summary for TMDL Projection Simulation
Modified Spring 7Q10Long Prairie River headwater flow increased from 1.88 to 3.87 cfs, and Eagle Creek headwater flow increased from 0.01 to 2.75 cfs.
Point Source Sites
Inflow at TMDL Site
IDInflow Rate
(cfs) Temperature (C)Chloride (mg/L) DO (mg/L)
CBODu (mg/L) ON (mg/L)
NH3-N (mg/L)
NO2/ NO3-N (mg/L) TP (mg/L)
Chlorophyll-a (ug/L)
CARLOS WWTF LPR 89.4 1.21 21 --- 8.91 35.7 3.2 5.8 0.05 2.11 ---LP SUPERFUND SITE LPR 47.3 0.67 13.52 --- 8.58 13.38 1.02 0.04 0.88 0.1 ---LPRAIRIE WWTF SD004 LPR 46.6 0.77 21 --- 6 30 2 22.1 100 5.9 ---LPRAIRIE WWTF SD003 LPR 44.9 0.88 21 --- 6 31.7 3.7 16.0 0.43 1 ---BROWERVILLE WWTF LPR 36.1 6.16 21 --- 8.91 16.3 3.2 0.3 0.05 2.43 ---
EAGLE BEND WWTF* EC 12.0 1.01 21 --- 8.91 16.1 3.2 5.8 0.05 2.7 ---CLARISSA WWTF* EC 7.0 1.42 21 --- 8.91 28.6 3.2 5.8 0.05 1.49 ---
QUAL-TX Input File: pps137.in
* See Section 9.8.3 for discussion of Eagle Bend and Clarissa WWTFs.
Summer 7Q10
Point Source Sites
Inflow at TMDL Site
IDInflow Rate
(cfs) Temperature (C)Chloride (mg/L) DO (mg/L)
CBODu (mg/L) ON (mg/L)
NH3-N (mg/L)
NO2/ NO3-N (mg/L) TP (mg/L)
Chlorophyll-a (ug/L)
CARLOS WWTF LPR 89.4 1.21 23 --- 8.58 35.7 4.43 0.07 0.008 2.11 ---LP SUPERFUND SITE LPR 47.3 0.67 13.52 --- 8.58 13.38 1.02 0.04 0.88 0.1 ---LPRAIRIE WWTF SD004 LPR 46.6 0.77 23 --- 6 30 2 22.1 100 5.9 ---LPRAIRIE WWTF SD003 LPR 44.9 0.88 23 --- 6 31.7 2.4 10.3 0.43 1 ---BROWERVILLE WWTF LPR 36.1 6.16 23 --- 8.58 16.3 4.43 0.07 0.008 2.43 ---EAGLE BEND WWTF EC 12.0 1.01 23 --- 8.58 16.1 4.43 0.07 0.008 0.79 ---CLARISSA WWTF EC 7.0 1.42 23 --- 8.58 28.6 4.43 0.07 0.008 1.49 ---
QUAL-TX Input File: sps137.in
Winter 7Q10
Point Source Sites
Inflow at TMDL Site
IDInflow Rate
(cfs) Temperature (C)Chloride (mg/L) DO (mg/L)
CBODu (mg/L) ON (mg/L)
NH3-N (mg/L)
NO2/ NO3-N (mg/L) TP (mg/L)
Chlorophyll-a (ug/L)
LP SUPERFUND SITE LPR 47.3 0.67 13.52 --- 14.62 13.38 1.02 0.04 0.88 0.1 ---LPRAIRIE WWTF SD004 LPR 46.6 0.77 0 --- 6 30 2 22.1 100 5.9 ---LPRAIRIE WWTF SD003 LPR 44.9 0.88 0 --- 6 31.7 2.4 10.3 0.43 1 ---
QUAL-TX Input File: wps137.in
NOTE: Browerville's spring NH3-N loading rate under this scenario is the same as for an effluent concentration of 5.8 mg/L and a flow rate of 0.335 cfs, equal to half of Browerville's1999-2001 maximum annual wastewater volume discharged at a constant rate over 75 days. The Browerville WWTF actually does not discharge in the spring but discharges in the fall only.
T:\0147\51\Phase III Final Report/Appendix F_Tab23_Jul04/Table F-23 Page 1 of 1 Wenck Associates, Inc.

Appendix F, Figure F-1
Hydraulic Coefficient Plots for LPR 89.9MPCA Long Prairie River Watershed TMDL Final Project Report
Velocity and Depth as a Function of Flow (Q)
T:\0147\51\Phase III Rpt\Appendices\\Appendix F FIG 01/LPR 89.9 1 of 1 Wenck Associates, Inc.
0.0
0.5
1.0
1.5
2.0
2.5
3.0
3.5
4.0
0 20 40 60 80 100 120 140 160Flow [cfs]
(Dep
th [f
t] - e
); Ve
loci
ty [f
t/s]
Flow vs Vel Flow vs (Depth - e) Flow vs Vel Flow vs (Depth - e) depth LPR 89.9 velocity LPR 89.9
Depth = 0.1395 * Q0.6061
Velocity = 0.2511 * Q0.2920
Velocity = a Q^b; (Depth - e) = c Q^d; e=0

Appendix F, Figure F-1
Hydraulic Coefficient Plots for LPR 83.1MPCA Long Prairie River Watershed TMDL Final Project Report
Velocity and Depth as a Function of Flow (Q)
T:\0147\51\Phase III Rpt\Appendices\\Appendix F FIG 01/LPR 83.1 1 of 1 Wenck Associates, Inc.
0.0
0.5
1.0
1.5
2.0
2.5
3.0
3.5
4.0
0 20 40 60 80 100 120 140Flow [cfs]
(Dep
th [f
t] - e
); Ve
loci
ty [f
t/s]
Flow vs Vel Flow vs Depth Flow vs Vel Flow vs (Depth - e) depth LPR 83.1 velocity LPR 83.1
Depth = 0.3927 * Q0.4019
Velocity = 0.3618 * Q0.2380
Velocity = a Q^b; (Depth - e) = c Q^d; e=0

Appendix F, Figure F-1
Hydraulic Coefficient Plots for LPR 76.7MPCA Long Prairie River Watershed TMDL Final Project Report
Velocity and Depth as a Function of Flow (Q)
T:\0147\51\Phase III Rpt\Appendices\\Appendix F FIG 01/LPR 76.7 1 of 1 Wenck Associates, Inc.
0.0
0.5
1.0
1.5
2.0
2.5
3.0
3.5
4.0
0 20 40 60 80 100 120 140 160 180Flow [cfs]
(Dep
th [f
t] - e
); Ve
loci
ty [f
t/s]
Flow vs Vel Flow vs Depth Flow vs Vel Flow vs (Depth - e) depth LPR 76.7 velocity LPR 76.7
Depth = 0.2697 * Q0.5160
Velocity = 0.0452 * Q0.3102
Velocity = a Q^b; (Depth - e) = c Q^d; e=0

Appendix F, Figure F-1
Hydraulic Coefficient Plots for LPR 67.0MPCA Long Prairie River Watershed TMDL Final Project Report
Velocity and Depth as a Function of Flow (Q)
T:\0147\51\Phase III Rpt\Appendices\\Appendix F FIG 01/LPR 67.0 1 of 1 Wenck Associates, Inc.
0.0
0.5
1.0
1.5
2.0
2.5
3.0
3.5
4.0
0 20 40 60 80 100 120 140 160 180Flow [cfs]
(Dep
th [f
t] - e
); Ve
loci
ty [f
t/s]
Flow vs Vel Flow vs Depth Flow vs (Depth - e) Flow vs Vel depth LPR 67 velocity LPR 67
Depth = 0.2457 * Q0.5009
Velocity = 0.1790 * Q0.2854
Velocity = a Q^b; (Depth - e) = c Q^d; e=0

Appendix F, Figure F-1
Hydraulic Coefficient Plots for LPR 56.0MPCA Long Prairie River Watershed TMDL Final Project Report
Velocity and Depth as a Function of Flow (Q)
T:\0147\51\Phase III Rpt\Appendices\\Appendix F FIG 01/LPR 56.0 1 of 1 Wenck Associates, Inc.
0.0
0.5
1.0
1.5
2.0
2.5
3.0
3.5
4.0
0 20 40 60 80 100 120 140 160 180Flow [cfs]
(Dep
th [f
t] - e
); Ve
loci
ty [f
t/s]
Flow vs Depth Flow vs VelFlow vs (Depth - e) Flow vs VelTodd SWCD - Gauged Flow vs (Depth - e) depth LPR 56velocity LPR 56
Depth = 0.2796 * Q0.3855
Velocity = 0.4359 * Q0.2004
Velocity = a Q^b; (Depth - e) = c Q^d; e=0

Appendix F, Figure F-1
Hydraulic Coefficient Plots for LPR 47.8MPCA Long Prairie River Watershed TMDL Final Project Report
Velocity and Depth as a Function of Flow (Q)
T:\0147\51\Phase III Rpt\Appendices\\Appendix F FIG 01/LPR 47.8 1 of 1 Wenck Associates, Inc.
0.0
0.5
1.0
1.5
2.0
2.5
3.0
3.5
4.0
0 20 40 60 80 100 120 140 160 180Flow [cfs]
(Dep
th [f
t] - e
); Ve
loci
ty [f
t/s]
Flow vs Depth Flow vs Vel Flow vs (Depth - e)Flow vs Vel depth LPR 47.8 velocity LPR 47.8Todd SWCD - Gauged Flow vs (Depth - e) USGS - Gauged Flow vs (Depth - e)
Depth = 0.1330 * Q0.5500
Velocity = 0.2389 * Q0.2987
Velocity = a Q^b; (Depth - e) = c Q^d; e=0

Appendix F, Figure F-1
Hydraulic Coefficient Plots for LPR 38.5MPCA Long Prairie River Watershed TMDL Final Project Report
Velocity and Depth as a Function of Flow (Q)
T:\0147\51\Phase III Rpt\Appendices\\Appendix F FIG 01/LPR 38.5 1 of 1 Wenck Associates, Inc.
0.0
0.5
1.0
1.5
2.0
2.5
3.0
3.5
4.0
0 20 40 60 80 100 120 140 160 180 200Flow [cfs]
(Dep
th [f
t] - e
); Ve
loci
ty [f
t/s]
Flow vs Depth Flow vs Vel Flow vs (Depth - e) Flow vs Vel depth LPR 38.5 velocity LPR 38.5
Depth = 0.2302 * Q0.5113
Velocity = 0.2739 * Q0.2943
Velocity = a Q^b; (Depth - e) = c Q^d; e=0

Appendix F, Figure F-1
Hydraulic Coefficient Plots for LPR 34.2MPCA Long Prairie River Watershed TMDL Final Project Report
Velocity and Depth as a Function of Flow (Q)
T:\0147\51\Phase III Rpt\Appendices\\Appendix F FIG 01/LPR 34.2 1 of 1 Wenck Associates, Inc.
0.0
0.5
1.0
1.5
2.0
2.5
3.0
3.5
4.0
0 20 40 60 80 100 120 140 160 180 200 220Flow [cfs]
(Dep
th [f
t] - e
); Ve
loci
ty [f
t/s]
Flow vs Depth Flow vs Vel Flow vs (Depth - e)Flow vs Vel depth LPR 34.2 Todd SWCD - Flow vs (Depth - e)velocity LPR 34.2
Depth = 0.1154 * Q0.5959
Velocity = 0.1644 * Q0.3463
Velocity = a Q^b; (Depth - e) = c Q^d; e=0

Appendix F, Figure F-1
Hydraulic Coefficient Plots for LPR 30.8MPCA Long Prairie River Watershed TMDL Final Project Report
Velocity and Depth as a Function of Flow (Q)
T:\0147\51\Phase III Rpt\Appendices\\Appendix F FIG 01/LPR 30.8 1 of 1 Wenck Associates, Inc.
0.0
0.5
1.0
1.5
2.0
2.5
3.0
3.5
4.0
0 40 80 120 160 200Flow [cfs]
(Dep
th [f
t] - e
); Ve
loci
ty [f
t/s]
Flow vs Depth Flow vs Vel Flow vs (Depth - e) Flow vs Vel depth LPR 30.8 velocity LPR 30.8
Depth = 0.2251 * Q0.5007
Velocity = 0.2638 * Q0.2620
Velocity = a Q^b; (Depth - e) = c Q^d; e=0

Appendix F, Figure F-1
Hydraulic Coefficient Plots for LPR 26.1MPCA Long Prairie River Watershed TMDL Final Project Report
Velocity and Depth as a Function of Flow (Q)
T:\0147\51\Phase III Rpt\Appendices\\Appendix F FIG 01/LPR 26.1 1 of 1 Wenck Associates, Inc.
0.0
0.5
1.0
1.5
2.0
2.5
3.0
3.5
4.0
0 20 40 60 80 100 120 140 160 180 200 220Flow [cfs]
Dep
th [f
t]; V
eloc
ity [f
t/s]
Flow vs Vel Flow vs Depth Flow vs (Depth - e) Flow vs Vel depth LPR 26.1 velocity LPR 26.1
Depth = 0.1280 * Q0.5866
Velocity = 0.2922 * Q0.3556
Velocity = a Q^b; (Depth - e) = c Q^d; e=0

Appendix F, Figure F-1
Hydraulic Coefficient Plots for LPR 18.2MPCA Long Prairie River Watershed TMDL Final Project Report
Velocity and Depth as a Function of Flow (Q)
T:\0147\51\Phase III Rpt\Appendices\\Appendix F FIG 01/LPR 18.2 1 of 1 Wenck Associates, Inc.
0.0
0.5
1.0
1.5
2.0
2.5
3.0
3.5
4.0
0 20 40 60 80 100 120 140 160 180 200 220 240Flow [cfs]
(Dep
th [f
t] - e
); Ve
loci
ty [f
t/s]
Flow vs Depth Flow vs Vel Flow vs (Depth - e) Flow vs Vel depth LPR 18.2 velocity LPR 18.2
Depth = 0.1850 * Q0.5042
Velocity = 0.4054 * Q0.2465
Velocity = a Q^b; (Depth - e) = c Q^d; e=0

Appendix F, Figure F-1
Hydraulic Coefficient Plots for LPR 15.3MPCA Long Prairie River Watershed TMDL Final Project Report
Velocity and Depth as a Function of Flow (Q)
T:\0147\51\Phase III Rpt\Appendices\\Appendix F FIG 01/LPR 15.3 1 of 1 Wenck Associates, Inc.
0.0
0.5
1.0
1.5
2.0
2.5
3.0
3.5
4.0
0 20 40 60 80 100 120 140 160 180 200 220 240 260Flow [cfs]
(Dep
th [f
t] - e
); Ve
loci
ty [f
t/s]
Flow vs Depth Flow vs Vel Flow vs (Depth - e) Flow vs Vel depth LPR 15.3 velocity LPR 15.3
Depth = 0.3039 * Q0.4334
Velocity = 0.2249 * Q0.2018
Velocity = a Q^b; (Depth - e) = c Q^d; e=0

Appendix F, Figure F-1
Hydraulic Coefficient Plots for LPR 9.2MPCA Long Prairie River Watershed TMDL Final Project Report
Velocity and Depth as a Function of Flow (Q)
T:\0147\51\Phase III Rpt\Appendices\\Appendix F FIG 01/LPR 9.2 1 of 1 Wenck Associates, Inc.
0.0
0.5
1.0
1.5
2.0
2.5
3.0
3.5
4.0
0 20 40 60 80 100 120 140 160 180 200 220 240 260Flow [cfs]
(Dep
th [f
t] - e
); Ve
loci
ty [f
t/s]
Flow vs Depth Flow vs Vel Flow vs (Depth - e) Flow vs Vel depth LPR 9.2 velocity LPR 9.2
Depth = 0.2183 * Q0.4880
Velocity = 0.1349 * Q0.2975
Velocity = a Q^b; (Depth - e) = c Q^d; e=0

Appendix F, Figure F-1
Hydraulic Coefficient Plots for LPR 3.2MPCA Long Prairie River Watershed TMDL Final Project Report
Velocity and Depth as a Function of Flow (Q)
T:\0147\51\Phase III Rpt\Appendices\\Appendix F FIG 01.xls/LPR 3.2 1 of 1 Wenck Associates, Inc.
0.0
0.5
1.0
1.5
2.0
2.5
3.0
3.5
4.0
0 20 40 60 80 100 120 140 160 180 200 220 240 260
Flow [cfs]
(Dep
th [
ft]
- e)
; V
elo
city
[ft
/s]
Flow vs Depth Flow vs Vel Flow vs (Depth - e) Flow vs Vel depth LPR 3.2 velocity LPR 3.2
Depth = 0.2388 * Q0.4520
Velocity = 0.2511 * Q0.1973
Velocity = a Q^b; (Depth - e) = c Q^d; e=0

Appendix F, Figure F-1
Hydraulic Coefficient Plots for Eagle CreekMPCA Long Prairie River Watershed TMDL Final Project Report
Velocity and Depth as a Function of Flow (Q)
T:\0147\51\Phase III Rpt\Appendices\\Appendix F FIG 01/Eagle Creek 1 of 1 Wenck Associates, Inc.
0.0
1.0
2.0
3.0
4.0
0 2 4 6 8 10 12 14 16 18 20Flow [cfs]
(Dep
th [f
t] - e
); V
eloc
ity [f
t/s]
Flow vs Depth Flow vs Vel Flow vs (Depth - e)Flow vs Vel depth Eagle Creek velocity Eagle Creek
Depth = 0.5537 * Q0.6393
Velocity = 0.0729 * Q0.3013
Velocity = a Q^b; (Depth - e) = c Q^d; e=0

Appendix F, Figure F-2
MPCA Long Prairie River Watershed TMDL Final Project Report
T:/0147/51/Phase III Rpt/Appendices/Appendix F Fig 02_aug/Mass load CBODu vs RM 1 of 1 Wenck Associates, Inc.
August 21 - 22, 2001: Mass LoadingCBOD Ultimate (CBODu) by Long Prairie River Mile
0.00.0 0.0 0.0 0.00.00.0 0.00.9272.2 200.7
43.2 0
1000
2000
3000
4000
5000
6000
7000
0.010.020.030.040.050.060.070.080.090.0
River Miles from Confluence with Crow Wing River
Mass Load C
BO
Du [LB
/ day]
US Instream plus Point Source Loads Instream Load Tributary & Point Source Load

Appendix F, Figure F-2
MPCA Long Prairie River Watershed TMDL Final Project Report
T:/0147/51/Phase III Rpt/Appendices/Appendix F Fig 02_aug/Mass load TN vs RM 1 of 1 Wenck Associates, Inc.
August 21 - 22, 2001: Mass LoadingTotal Nitrogen (TN) by Long Prairie River Mile
0.00.0 0.0 0.0 0.00.00.0 0.01.3
76.220.1 34.5
0
200
400
600
800
1000
1200
1400
0.010.020.030.040.050.060.070.080.090.0
River Miles from Confluence with Crow Wing River
Mass Load TN
[LB / day]
Instream Load US Instream plus Point Source Loads Tributary & Point Source Load

Appendix F, Figure F-2
MPCA Long Prairie River Watershed TMDL Final Project Report
T:/0147/51/Phase III Rpt/Appendices/Appendix F Fig 02_aug/Mass load TON vs RM 1 of 1 Wenck Associates, Inc.
August 21 - 22, 2001: Mass LoadingTotal Organic Nitrogen (TON) by Long Prairie River Mile
0.00.0 0.0 0.0 0.00.00.0 0.00.6
70.2
17.3 29.80
100
200
300
400
500
600
700
800
900
1000
0.010.020.030.040.050.060.070.080.090.0
River Miles from Confluence with Crow Wing River
Mass Load TO
N [LB
/ day]
Instream Load US Instream plus Point Source Loads Tributary & Point Source Load

Appendix F, Figure F-2
MPCA Long Prairie River Watershed TMDL Final Project Report
T:/0147/51/Phase III Rpt/Appendices/Appendix F Fig 02_aug/Mass load NH3 vs RM 1 of 1 Wenck Associates, Inc.
August 21 - 22, 2001: Mass LoadingAmmonia by Long Prairie River Mile
0.00.0 0.0 0.0 0.00.00.0 0.0 0.0 0.5 0.3 0.4 0
5
10
15
20
25
30
0.010.020.030.040.050.060.070.080.090.0
River Miles from Confluence with Crow Wing River
Mass Load A
mm
onia [LB / day]
Instream Load US Instream plus Point Source Loads Tributary & Point Source Load

Appendix F, Figure F-2
MPCA Long Prairie River Watershed TMDL Final Project Report
T:/0147/51/Phase III Rpt/Appendices/Appendix F Fig 02_aug/Mass load no23 vs RM 1 of 1 Wenck Associates, Inc.
August 21 - 22, 2001: Mass LoadingNitrite and Nitirate Nitrogen (NO2+NO3) by Long Prairie River Mile
0.00.0 0.0 0.0 0.00.00.0 0.00.7 5.4 2.5 4.3 0
50
100
150
200
250
300
350
0.010.020.030.040.050.060.070.080.090.0
River Miles from Confluence with Crow Wing River
Mass Load N
O2 N
O3 [LB
/ day]
US Instream plus Point Source Loads Tributary & Point Source Load Instream Load

Appendix F, Figure F-2
MPCA Long Prairie River Watershed TMDL Final Project Report
T:/0147/51/Phase III Rpt/Appendices/Appendix F Fig 02_aug/Mass load TP vs RM 1 of 1 Wenck Associates, Inc.
August 21 - 22, 2001: Mass LoadingTotal Phosphorus (TP) by Long Prairie River Mile
0.00.0 0.0 0.0 0.00.00.0 0.0 0.0
4.6
0.21.8
0
10
20
30
40
50
60
70
0.010.020.030.040.050.060.070.080.090.0
River Miles from Confluence with Crow Wing River
Mass Load TP [LB
/ day]
Instream Load US Instream plus Point Source Loads Tributary & Point Source Load

Appendix F, Figure F-2
MPCA Long Prairie River Watershed TMDL Final Project Report
T:/0147/51/Phase III Rpt/Appendices/Appendix F Fig 02_sept/Mass load CBODu vs RM 1 of 1 Wenck Associates, Inc.
September 24-25, 2001: Mass LoadingCBOD Ultimate (CBODu) by Long Prairie River Mile
0
5000
10000
15000
20000
25000
0.010.020.030.040.050.060.070.080.090.0
River Miles from Confluence with Crow Wing River
Mass Load C
BO
Du [LB
/ day]
US Instream plus Point Source Loads Tributary & Point Source Load Instream Load

Appendix F, Figure F-2
MPCA Long Prairie River Watershed TMDL Final Project Report
T:/0147/51/Phase III Rpt/Appendices/Appendix F Fig 02_sept/Mass load TN vs RM 1 of 1 Wenck Associates, Inc.
September 24-25, 2001: Mass LoadingTotal Nitrogen (TN) by Long Prairie River Mile
798
785
33 54 48
287261
0
500
1000
1500
2000
2500
0.010.020.030.040.050.060.070.080.090.0
River Miles from Confluence with Crow Wing River
Mass Load TN
[LB / day]
US Instream plus Point Source Loads TN: Point Source Load TN: Instream Load

Appendix F, Figure F-2
MPCA Long Prairie River Watershed TMDL Final Project Report
T:/0147/51/Phase III Rpt/Appendices/Appendix F Fig 02_sept/Mass load TON vs RM 1 of 1 Wenck Associates, Inc.
September 24-25, 2001: Mass LoadingTotal Organic Nitrogen (TON) by Long Prairie River Mile
750 49 57 30 48 434
55
0
200
400
600
800
1000
1200
1400
1600
0.010.020.030.040.050.060.070.080.090.0
River Miles from Confluence with Crow Wing River
Mass Load TO
N [LB
/ day]
US Instream plus Point Source Loads Tributary & Point Source Load Instream Load

Appendix F, Figure F-2
MPCA Long Prairie River Watershed TMDL Final Project Report
T:/0147/51/Phase III Rpt/Appendices/Appendix F Fig 02_sept/Mass load NH3 vs RM 1 of 1 Wenck Associates, Inc.
September 24-25, 2001: Mass LoadingAmmonia by Long Prairie River Mile
0 1 0.14
205
230
0 0 1 0 0
50
100
150
200
250
300
350
400
450
500
0.010.020.030.040.050.060.070.080.090.0
River Miles from Confluence with Crow Wing River
Mass Load A
mm
onia [LB / day]
US Instream plus Point Source Loads Tributary & Point Source Load Instream Load

Appendix F, Figure F-2
MPCA Long Prairie River Watershed TMDL Final Project Report
T:/0147/51/Phase III Rpt/Appendices/Appendix F Fig 02_sept/Mass load no23 vs RM 1 of 1 Wenck Associates, Inc.
September 24-25, 2001: Mass LoadingNitrite and Nitirate Nitrogen (NO2+NO3) by Long Prairie River Mile
047 28
3 5 5
1 83
0
200
400
600
800
1000
1200
0.010.020.030.040.050.060.070.080.090.0
River Miles from Confluence with Crow Wing River
Mass Load N
O2 N
O3 [LB
/ day]
US Instream plus Point Source Loads Tributary & Point Source Load Instream Load

Appendix F, Figure F-2
MPCA Long Prairie River Watershed TMDL Final Project Report
T:/0147/51/Phase III Rpt/Appendices/Appendix F Fig 02_sept/Mass load TP vs RM 1 of 1 Wenck Associates, Inc.
September 24-25, 2001: Mass LoadingTotal Phosphorus (TP) by Long Prairie River Mile
0 3 0
92
110
1 0 1 1 0
50
100
150
200
250
0.010.020.030.040.050.060.070.080.090.0
River Miles from Confluence with Crow Wing River
Mass Load TP [LB
/ day]
US Instream plus Point Source Loads Tributary & Point Source Load Instream Load

Appendix F, Figure F-3
MPCA Long Prairie River Watershed TMDL Final Project Report
T:/0147/51/Phase III Rpt/Appendices/Appendix F Fig 02_sept/Nitrification plot 1 of 1 Wenck Associates, Inc.
Nitrification
y = -1.0201x + 6.1767R2 = 0.964
0.0
1.0
2.0
3.0
4.0
5.0
6.0
7.0
0.00 0.20 0.40 0.60 0.80 1.00 1.20 1.40 1.60 1.80
Time of Travel from LP WWTP inflow [days]
LN (M
ass
Load
of A
mm
onia
[LB
/day
])

T:\0147\51\Phase III Rpt\Appendices\/Appendix F Fig 04/Aug Q (Interpolated Averages) 1 of 1 Wenck Associates, Inc.
�����������������������������
����������������������������������������
���������������
������������������
��������������������������
������������������������������������������������������������������
��������������������������������������������������������������������
����������������
��������
��
����������
����������������������������������������������
��������������������
�������������
������������
������������
��������������������������������
��������������������
�����������������������
��������������
�����������
����������������������
��������
����������������������
�������������
�������������������������
�������������������������
Appendix F, Figure F-4
MPCA Long Prairie River Watershed TMDL Final Project Report
Discharge ProfileModel vs Monitored
Average Interpolated Flows (cfs)August 20, 22-24, 2001
0.0
50.0
100.0
150.0
200.0
250.0
0.010.020.030.040.050.060.070.080.090.0
Long Prairie River Mile
Flow
(cfs
)
������������������
QUAL-TX Modeled Flow with Groundwater inflow at 0.64 (cfs/RM)Monitored Average FlowAverage Interpolated Flow08/20/01 Flow08/22/01 Flow08/23/01 Flow08/24/01 Flow
USGS Station #05245100 (LONG PRAIRIE RIVER AT LONG PRAIRIE, MN)

T:\0147\51\Phase III Rpt\Appendices\/Appendix F Fig 04/Sept Q (Interpolated) 1 of 1 Wenck Associates, Inc.
���������
�������������������
�������������������������������
��������������
�������������������
��������������������������
������������������
�����������������������
�����������������������������������������������������������������
��������������������������������������������������������������������
����������������������������������������
��������
���������
��������������������
���������������������������
�����������
��������������������
�������������
������������
������������
������������
�������������������������������
����������������������������������������
������������������������
�����������
����������������������
���������������
��������
����������������������
�������������
������������������������
������������������������
Appendix F, Figure F-4
MPCA Long Prairie River Watershed TMDL Final Project Report
Discharge ProfileModel vs Monitored
Interpolated Flow (cfs)September 24-25, 2001
0.0
50.0
100.0
150.0
200.0
250.0
300.0
0.010.020.030.040.050.060.070.080.090.0
Long Prairie River Mile
Flow
(cfs
)
������������������
QUAL-TX Modeled Flow with Groundwater inflow at 1.18 (cfs/RM)
Monitored Flow
Interpolated Flow
USGS Station #05245100 (LONG PRAIRIE RIVER AT LONG PRAIRIE, MN)

T:\0147\51\Phase III Rpt\Appendices\/Appendix F Fig 04/Feb Q (Interpolated) 1 of 1 Wenck Associates, Inc.
���������
�������������������
��������������������
���������������������
������������������
������������
��������������������������
������������������
�����������������������
�����������������������������������������������������������������
������������������������������������������
������������������������������������������
��������������������������������������������������������������������
��������������������������
��������������������������������������������
���������
��������������������
���������������������������
����������������
���������������������������
��������������������
�������������
����������������
�������������������������������
�������������������
����������������������������������������
������������������������
�����������
��������������������������
���������������
����������������������
�������������
������������������������
������������������������
������������������������
Appendix F, Figure F-4
MPCA Long Prairie River Watershed TMDL Final Project Report
Discharge ProfileModel vs Monitored
Interpolated Flow (cfs)February 7-8, 2002
0.0
20.0
40.0
60.0
80.0
100.0
120.0
140.0
160.0
180.0
200.0
0.010.020.030.040.050.060.070.080.090.0
Long Prairie River Mile
Flow
(cfs
)
������������������QUAL-TX Modeled Flow with Groundwater inflow at 1.59 (cfs/RM)
Monitored Flow
Interpolated Flow
USGS Station #05245100 (LONG PRAIRIE RIVER AT LONG PRAIRIE, MN)

Appendix F, Figure F-5a
MPCA Long Prairie River Watershed TMDL Final Project Report
Long Prairie River Daily Flow and Precipitation at Long PrairieSurvey 1
T:/0147/51/Phase III Report/Appendices/ QUALTX/Appendix_F Fig 05/Figure F-5a Page 1 of 1 Wenck Associates, Inc.
0.0
0.5
1.0
1.5
2.0
2.5
20-Jul-01 27-Jul-01 3-Aug-01 10-Aug-01 17-Aug-01 24-Aug-01Date
Prec
ipita
tion
(inch
es)
100
140
180
220
260
300
Flow
(cfs
)
Precipitation (inches)
Flow (cfs)
Synoptic Survey 1, August 20-24, 2001

Appendix F, Figure F-5b
MPCA Long Prairie River Watershed TMDL Final Project Report
Long Prairie River Daily Flow and Precipitation at Long PrairieSurvey 2
T:/0147/51/Phase III Report/Appendices/QUALTX/Appendix_F Fig 05/Figure F-5b Page 1 of 1 Wenck Associates, Inc.
0.0
0.5
1.0
1.5
2.0
2.5
20-Aug-01 27-Aug-01 3-Sep-01 10-Sep-01 17-Sep-01 24-Sep-01Date
Prec
ipita
tion
(inch
es)
100
140
180
220
260
300
Flow
(cfs
)
Precipitation (inches)
Flow (cfs)
Synoptic Survey 2,September 24-25, 2001

Appendix F, Figure F-5c
MPCA Long Prairie River Watershed TMDL Final Project Report
Long Prairie River Daily Flow and Precipitation at Long PrairieSurvey 3
T:/0147/51/Phase III Report/ Appendices/QUALTX/Appendix_F Fig 05/Figure F-5c Page 1 of 1 Wenck Associates, Inc.
0.0
0.5
1.0
1.5
2.0
2.5
1-Jan-02 8-Jan-02 15-Jan-02 22-Jan-02 29-Jan-02 5-Feb-02Date
Prec
ipita
tion
(inch
es)
100
140
180
220
260
300
Flow
(cfs
)
Precipitation (inches)
Flow (cfs)
Synoptic Survey 3, February 7-8,2002

Appendix F, Figure F-6
MPCA Long Prairie River Watershed TMDL Final Project Report
T:\0147\51\Phase III Rpt\Appendices\/Appendix F_tab18_fig06 Aug DO 1 of 1 Wenck Associates, Inc.
Dissolved Oxygen ProfileModel vs Monitored
August 20, 22-24, 2001
0.0
2.0
4.0
6.0
8.0
10.0
12.0
0.010.020.030.040.050.060.070.080.090.0
River Mile
DO
[mg/
L]
MIN DO MAX DO QUAL-TX Modeled MonitoredMonitored Average Model Point & Trib Inflows QUAL-TX Modeled Min QUAL-TX Modeled Max

Appendix F, Figure F-6
MPCA Long Prairie River Watershed TMDL Final Project Report
T:\0147\51\Phase III Rpt\Appendices\Appendix F_tab18_fig06 Sept DO
1 of 1 Wenck Associates, Inc.
Dissolved Oxygen ProfileModel vs Monitored
September 24-25, 2001
0.0
2.0
4.0
6.0
8.0
10.0
12.0
14.0
16.0
0.010.020.030.040.050.060.070.080.090.0
River Mile
DO
[mg/
L]
QUAL-TX Modeled Min QUAL-TX Modeled Max QUAL-TX Modeled Model Point & Trib InflowsMIN DO MAX DO Monitored Monitored Average

Appendix F, Figure F-6
MPCA Long Prairie River Watershed TMDL Final Project Report
T:\0147\51\Phase III Rpt\Appendices\Appendix F_tab18_fig06 Feb DO
1 of 1 Wenck Associates, Inc.
Dissolved Oxygen ProfileModel vs MonitoredFebruary 7-8, 2002
0.0
2.0
4.0
6.0
8.0
10.0
12.0
14.0
16.0
18.0
0.010.020.030.040.050.060.070.080.090.0
River Mile
DO
[mg/
L]
QUAL-TX Modeled Monitored Monitored Average

Appendix F, Figure F-6
MPCA Long Prairie River Watershed TMDL Final Project Report
Long Prairie River Profile Graphs:QUAL-TX Calibration to Synoptic Survey #1
August 20 to 24, 2001
0
2
4
6
8
10
12
14
16
0102030405060708090100 River Mile
Con
cent
ratio
n (m
g/L)
QUAL-TX Modeled DO Concentration- Main Stem 5 mg/L DO Standard
0.00
1.00
2.00
3.00
4.00
5.00
6.00
7.00
8.00
9.00
0102030405060708090100 River Mile
Con
cent
ratio
n (m
g/L)
CBOD ultimate Model Result Detection Limit
0
5
10
15
20
25
30
0102030405060708090100
River Mile
Tem
pera
ture
(deg
rees
C)
Main Stem Temperatures Model Result
T:\0147\51\Phase III Rpt\Appendices\Appendix F_tab18_fig06/MvM LPR Aug
Page 1 of 3 Wenck Associates, Inc.

Appendix F, Figure F-6
MPCA Long Prairie River Watershed TMDL Final Project Report
Long Prairie River Profile Graphs:QUAL-TX Calibration to Synoptic Survey #1
August 20 to 24, 2001
0.00
0.10
0.20
0.30
0.40
0.50
0.60
0.70
0.80
0102030405060708090100River Mile
Con
cent
ratio
n (m
g/L)
NO2/NO3- Main Stem Model Result Detection Limit
0.00
0.01
0.02
0.03
0.04
0.05
0.06
0.07
0.08
0102030405060708090100
River Mile
Con
cent
ratio
n (m
g/L)
Total Phosphorus- Main Stem Model Result Detection Limit
0
5
10
15
20
25
30
35
40
0102030405060708090100
River Mile
Con
cent
ratio
n (m
g/L)
Chloride- Main Stem Model Results
T:\0147\51\Phase III Rpt\Appendices\Appendix F_tab18_fig06/MvM LPR Aug
Page 2 of 3 Wenck Associates, Inc.

Appendix F, Figure F-6
MPCA Long Prairie River Watershed TMDL Final Project Report
Long Prairie River Profile Graphs:QUAL-TX Calibration to Synoptic Survey #1
August 20 to 24, 2001
0
0.5
1
1.5
2
2.5
3
3.5
4
4.5
5
0102030405060708090100
River Mile
Con
cent
ratio
n (m
g/m
3 )
Chlorophyll-a, Main Stem Model Result
0.000
0.005
0.010
0.015
0.020
0.025
0.030
0.035
0102030405060708090100River Mile
Con
cent
ratio
n (m
g/L)
Ammonia- Main Stem Ammonia Model Result Detection Limit
0.00
0.10
0.20
0.30
0.40
0.50
0.60
0.70
0.80
0.90
1.00
0102030405060708090100River Mile
Con
cent
ratio
n (m
g/L)
Organic Nitrogen [mg/L] { Total Kjeldahl Nitrogen [mg/L] - Ammonia [mg/L} Organic Nitrogen Model Results
T:\0147\51\Phase III Rpt\Appendices\Appendix F_tab18_fig06/MvM LPR Aug
Page 3 of 3 Wenck Associates, Inc.

Appendix F, Figure F-6
MPCA Long Prairie River Watershed TMDL Final Project Report
Eagle Creek Profile Graphs:QUAL-TX Calibration to Synoptic Survey #1
August 20 to 24, 2001
0
2
4
6
8
10
12
14
16
0.00.10.20.30.40.50.60.70.80.91.0 River Mile
Con
cent
ratio
n (m
g/L)
Model Result Eagle Creek D.O. [mg/L]
0.00
0.05
0.10
0.15
0.20
0.25
0.00.10.20.30.40.50.60.70.80.91.0
River Mile
Con
cent
ratio
n (m
g/L)
Eagle Creek Total Phosphorus [mg/L] Model Results
0.00
2.00
4.00
6.00
8.00
10.00
12.00
14.00
0.00.10.20.30.40.50.60.70.80.91.0River Mile
Con
cent
ratio
n (m
g/L)
C-BOD ultimate mg/L Model Result
191920202121222223
0.00.10.20.30.40.50.60.70.80.91.0
River Mile
Tem
pera
ture
(deg
rees
C)
Eagle Creek Temperature [C] Model Result
0
5
10
15
20
25
30
35
40
0.00.10.20.30.40.50.60.70.80.91.0
River Mile
Con
cent
ratio
n (m
g/L)
Eagle Creek Chloride [mg/L] Model Results
T:\0147\51\Phase III Rpt\Appendices\/Appendix F_tab18_fig06/MvM EC Aug
Page 1 of 2 Wenck Associates, Inc.

Appendix F, Figure F-6
MPCA Long Prairie River Watershed TMDL Final Project Report
Eagle Creek Profile Graphs:QUAL-TX Calibration to Synoptic Survey #1
August 20 to 24, 2001
0.000.200.400.600.801.001.201.401.60
0.00.10.20.30.40.50.60.70.80.91.0
River Mile
Con
cent
ratio
n (m
g/L)
Eagle Creek NO2+3 [mg/L] Model Results
00.20.40.60.8
11.21.41.6
0.00.10.20.30.40.50.60.70.80.91.0
River Mile
Con
cent
ratio
n (m
g/m
3 )
Eagle Creek Chloro-A [mg/L] Model Results
0.000.020.040.060.080.10
0.00.10.20.30.40.50.60.70.80.91.0
River Mile
Con
cent
ratio
n (m
g/L)
Eagle Creek Ammonia [mg/L] Model Results Detection Limit
0.00
0.20
0.40
0.60
0.80
0.00.10.20.30.40.50.60.70.80.91.0River Mile
Con
cent
ratio
n (m
g/L)
Eagle Creek Organic Nitrogen [mg/L] { Total Kjeldahl Nitrogen [mg/L] - Ammonia [mg/L} Organic Nitrogen Model Results
T:\0147\51\Phase III Rpt\Appendices\/Appendix F_tab18_fig06/MvM EC Aug
Page 2 of 2 Wenck Associates, Inc.

Appendix F, Figure F-6
MPCA Long Prairie River Watershed TMDL Final Project Report
Long Prairie River Profile Graphs:QUAL-TX Calibration to Synoptic Survey #2
September 24 and 25, 2001
0
2
4
6
8
10
12
14
16
0102030405060708090 River Mile
Con
cent
ratio
n (m
g/L)
QUAL-TX Modeled DO Concentration- Main Stem 5 mg/L DO Standard
0.00
2.00
4.00
6.00
8.00
10.00
12.00
14.00
16.00
18.00
20.00
0102030405060708090
River Mile
Con
cent
ratio
n (m
g/L)
CBOD ultimate Model Result Detection Limit
0
2
4
6
8
10
12
14
16
0102030405060708090
River Mile
Tem
pera
ture
(deg
rees
C)
Main Stem Temperatures Model Results
T:\0147\51\Phase III Rpt\Appendices\Appendix F_tab18_fig06/MvM LPR Sept
Page 1 of 3 Wenck Associates, Inc.
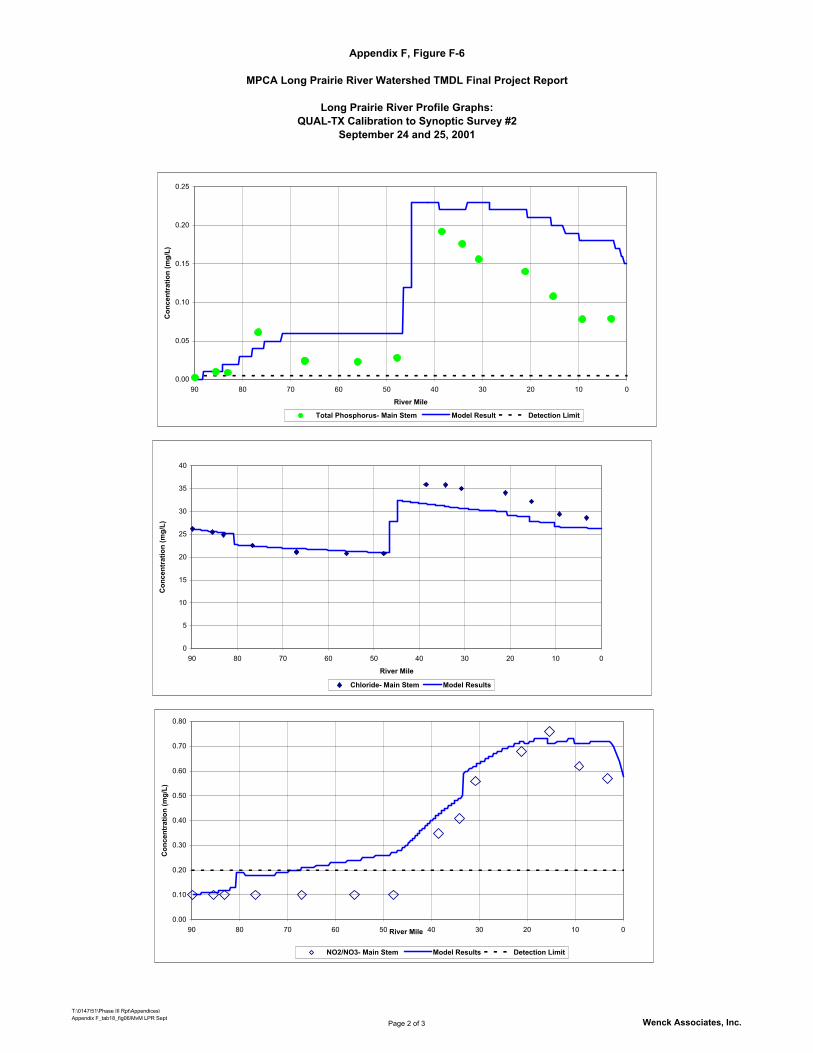
Appendix F, Figure F-6
MPCA Long Prairie River Watershed TMDL Final Project Report
Long Prairie River Profile Graphs:QUAL-TX Calibration to Synoptic Survey #2
September 24 and 25, 2001
0.00
0.10
0.20
0.30
0.40
0.50
0.60
0.70
0.80
0102030405060708090 River Mile
Con
cent
ratio
n (m
g/L)
NO2/NO3- Main Stem Model Results Detection Limit
0.00
0.05
0.10
0.15
0.20
0.25
0102030405060708090
River Mile
Con
cent
ratio
n (m
g/L)
Total Phosphorus- Main Stem Model Result Detection Limit
0
5
10
15
20
25
30
35
40
0102030405060708090
River Mile
Con
cent
ratio
n (m
g/L)
Chloride- Main Stem Model Results
T:\0147\51\Phase III Rpt\Appendices\Appendix F_tab18_fig06/MvM LPR Sept
Page 2 of 3 Wenck Associates, Inc.

Appendix F, Figure F-6
MPCA Long Prairie River Watershed TMDL Final Project Report
Long Prairie River Profile Graphs:QUAL-TX Calibration to Synoptic Survey #2
September 24 and 25, 2001
0
1
2
3
4
5
6
0102030405060708090
River Mile
Con
cent
ratio
n (m
g/m
3 )
Model Result Chlorophyll-a, Main Stem
0.00
0.05
0.10
0.15
0.20
0.25
0.30
0.35
0.40
0.45
0102030405060708090
River Mile
Con
cent
ratio
n (m
g/L)
Ammonia- Main Stem Ammonia Model Result Detection Limit
0.00
0.20
0.40
0.60
0.80
1.00
1.20
0102030405060708090
River Mile
Con
cent
ratio
n (m
g/L)
Organic Nitrogen [mg/L] { Total Kjeldahl Nitrogen [mg/L] - Ammonia [mg/L} Organic Nitrogen Model Results
T:\0147\51\Phase III Rpt\Appendices\Appendix F_tab18_fig06/MvM LPR Sept
Page 3 of 3 Wenck Associates, Inc.

Appendix F, Figure F-6
MPCA Long Prairie River Watershed TMDL Final Project Report
Eagle Creek Profile Graphs:QUAL-TX Calibration to Synoptic Survey #2
September 24 and 25, 2001
0
2
4
6
8
10
12
14
16
024681012River Mile
Con
cent
ratio
n (m
g/L)
Model Result Eagle Creek D.O. [mg/L]
0.00
0.50
1.00
1.50
2.00
2.50
024681012
River Mile
Con
cent
ratio
n (m
g/L)
Eagle Creek Total Phosphorus [mg/L] Model Results
0.00
5.00
10.00
15.00
20.00
25.00
30.00
024681012River Mile
Con
cent
ratio
n (m
g/L)
C-BOD ultimate mg/L Model Result
0
2
4
6
8
10
12
024681012
River Mile
Tem
pera
ture
(deg
rees
C)
Eagle Creek Temperature [C] Model Result
0
20
40
60
80
100
120
024681012
River Mile
Con
cent
ratio
n (m
g/L)
Eagle Creek Chloride [mg/L] Model Results
T:\0147\51\Phase III Rpt\Appendices\Appendix F_tab18_fig06/MvM EC Sept
Page 1 of 2 Wenck Associates, Inc.

Appendix F, Figure F-6
MPCA Long Prairie River Watershed TMDL Final Project Report
Eagle Creek Profile Graphs:QUAL-TX Calibration to Synoptic Survey #2
September 24 and 25, 2001
0.00
0.50
1.00
1.50
2.00
024681012
River Mile
Con
cent
ratio
n (m
g/L)
Eagle Creek NO2+3 [mg/L] Model Results
0
0.5
1
1.5
2
024681012
River Mile
Con
cent
ratio
n (m
g/m
3 )
Eagle Creek Chloro-A [mg/L] Model Results
0.00
0.10
0.20
0.30
0.40
024681012
River Mile
Con
cent
ratio
n (m
g/L)
Eagle Creek Ammonia [mg/L] Model Results Detection Limit
0.00
0.50
1.00
1.50
024681012
River Mile
Con
cent
ratio
n (m
g/L)
Eagle Creek Organic Nitrogen [mg/L] { Total Kjeldahl Nitrogen [mg/L] - Ammonia [mg/L} Organic Nitrogen Model Results
T:\0147\51\Phase III Rpt\Appendices\Appendix F_tab18_fig06/MvM EC Sept
Page 2 of 2 Wenck Associates, Inc.

Appendix F, Figure F-6
MPCA Long Prairie River Watershed TMDL Final Project Report
Long Prairie River Profile Graphs:QUAL-TX Calibration to Synoptic Survey #3
February 7 and 8, 2002
0
2
4
6
8
10
12
14
16
0102030405060708090100 River Mile
Con
cent
ratio
n (m
g/L)
DO Concentration- Main Stem 5 mg/L DO Standard Model Result Series9
0
2
4
6
8
10
12
14
0102030405060708090100 River Mile
Con
cent
ratio
n (m
g/L)
Model Result y(20) = CBOD 20-Day mg/L
0.0
0.2
0.4
0.6
0.8
1.0
1.2
1.4
0102030405060708090100
River Mile
Tem
pera
ture
(deg
rees
C)
Main Stem Temperatures Model Result
T:\0147\51\Phase III Rpt\Appendices\Appendix F_tab18_fig06/MvM LPR Feb
Page 1 of 3 Wenck Associates, Inc.

Appendix F, Figure F-6
MPCA Long Prairie River Watershed TMDL Final Project Report
Long Prairie River Profile Graphs:QUAL-TX Calibration to Synoptic Survey #3
February 7 and 8, 2002
0.00
0.20
0.40
0.60
0.80
1.00
1.20
1.40
1.60
0102030405060708090100 River Mile
Con
cent
ratio
n (m
g/L)
NO2/NO3- Main Stem Model Result Detection Limit
0.00
0.01
0.01
0.02
0.02
0.03
0.03
0.04
0102030405060708090100River Mile
Con
cent
ratio
n (m
g/L)
Total Phosphorus- Main Stem Model Result Detection Limit
0
5
10
15
20
25
30
35
40
0102030405060708090100
River Mile
Con
cent
ratio
n (m
g/L)
Chloride- Main Stem Model Results
T:\0147\51\Phase III Rpt\Appendices\Appendix F_tab18_fig06/MvM LPR Feb
Page 2 of 3 Wenck Associates, Inc.
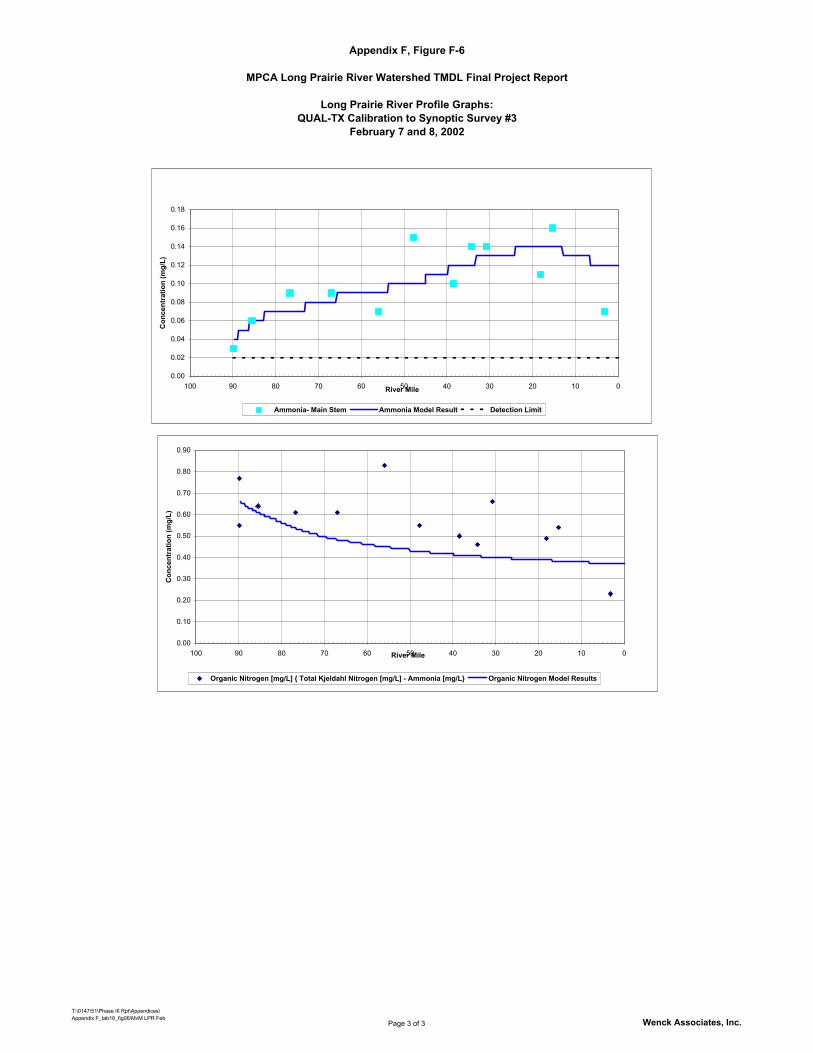
Appendix F, Figure F-6
MPCA Long Prairie River Watershed TMDL Final Project Report
Long Prairie River Profile Graphs:QUAL-TX Calibration to Synoptic Survey #3
February 7 and 8, 2002
0.00
0.02
0.04
0.06
0.08
0.10
0.12
0.14
0.16
0.18
0102030405060708090100 River Mile
Con
cent
ratio
n (m
g/L)
Ammonia- Main Stem Ammonia Model Result Detection Limit
0.00
0.10
0.20
0.30
0.40
0.50
0.60
0.70
0.80
0.90
0102030405060708090100 River Mile
Con
cent
ratio
n (m
g/L)
Organic Nitrogen [mg/L] { Total Kjeldahl Nitrogen [mg/L] - Ammonia [mg/L} Organic Nitrogen Model Results
T:\0147\51\Phase III Rpt\Appendices\Appendix F_tab18_fig06/MvM LPR Feb
Page 3 of 3 Wenck Associates, Inc.

Appendix F, Figure F-7
MPCA Long Prairie River Watershed TMDL Final Project Report
T:\0147\51\Phase III Rpt\Appendices\Appendix_F Fig 07 Aug Q 1 of 1 Wenck Associates, Inc.
Discharge ProfileAugust Model vs Monitored outside of Permitted Discharge Period
(Todd SWCD data collected between 1996-2002)
0.0
50.0
100.0
150.0
200.0
250.0
300.0
350.0
400.0
450.0
0.010.020.030.040.050.060.070.080.090.0
River Mile
Flow
[cfs
]
AUG QUAL-TX Modeled Todd SWCD Flow AUG Wenck Monitored

Appendix F, Figure F-7
MPCA Long Prairie River Watershed TMDL Final Project Report
T:\0147\51\Phase III Rpt\Appendices\Appendix_F Fig 07 Temp 1 of 1 Wenck Associates, Inc.
Temperature Profile August Model vs Monitored outside of Permitted Discharge Period
(Todd SWCD data collected between 1996-2002)
0
5
10
15
20
25
30
0102030405060708090
River Mile
Tem
pera
ture
(deg
rees
C)
Todd SWCD Temp AUG Wenck Temp AUG Model Result

Appendix F, Figure F-7
MPCA Long Prairie River Watershed TMDL Final Project Report
T:\0147\51\Phase III Rpt\Appendices\Appendix_F Fig 07 DO 1 of 1 Wenck Associates, Inc.
Dissolved Oxygen ProfileAugust Model vs Monitored outside of Permitted Discharge Period
(Todd SWCD data collected between 1996-2002)
0.0
2.0
4.0
6.0
8.0
10.0
12.0
14.0
16.0
0.010.020.030.040.050.060.070.080.090.0 River Mile
DO
[mg/
L]
AUG MIN DO Todd SWCD DO AUG MAX DO AUG Modeled Min
AUG Modeled Max AUG Ave Modeled AUG Wenck Monitored Model Point Inflows

Appendix F, Figure F-7
MPCA Long Prairie River Watershed TMDL Final Project Report
T:\0147\51\Phase III Rpt\Appendices\Appendix_F Fig 07 CBODu 1 of 1 Wenck Associates, Inc.
CBODu Profile August Model vs Monitored outside of Permitted Discharge Period
(No Todd SWCD data collected between 1996-2002)
0.00
1.00
2.00
3.00
4.00
5.00
6.00
7.00
8.00
9.00
0102030405060708090
River Mile
Con
cent
ratio
n (m
g/L)
AUG Wenck CBOD ultimate Todd SWCD CBODu AUG Model Result AUG Survey Detection Limit

Appendix F, Figure F-7
MPCA Long Prairie River Watershed TMDL Final Project Report
T:\0147\51\Phase III Rpt\Appendices\Appendix_F Fig 07 TP 1 of 1 Wenck Associates, Inc.
TP Profile August Model vs Monitored outside of Permitted Discharge Period
(Todd SWCD data collected between 1996-2002)
0.00
0.05
0.10
0.15
0.20
0.25
0.30
0.35
0.40
0102030405060708090
River Mile
Con
cent
ratio
n (m
g/L)
AUG Wenck TP Todd SWCD TP AUG Model Result Survey Detection Limit

Appendix F, Figure F-7
MPCA Long Prairie River Watershed TMDL Final Project Report
T:\0147\51\Phase III Rpt\Appendices\Appendix_F Fig 07 NO23 1 of 1 Wenck Associates, Inc.
NO2+3 Profile August Model vs Monitored outside of Permitted Discharge Period
(Todd SWCD data collected between 1996-2002)
0.00
0.10
0.20
0.30
0.40
0.50
0.60
0102030405060708090River Mile
Con
cent
ratio
n (m
g/L)
Todd SWCD NO2/3 AUG Wenck NO2/NO3 AUG Model Result Survey Detection Limit

Appendix F, Figure F-7
MPCA Long Prairie River Watershed TMDL Final Project Report
T:\0147\51\Phase III Rpt\Appendices\Appendix_F Fig 07 NH3-N 1 of 1 Wenck Associates, Inc.
Ammonia - N Profile August Model vs Monitored outside of Permitted Discharge Period
(Todd SWCD data collected between 1996-2002)
0.00
0.10
0.20
0.30
0.40
0.50
0.60
0102030405060708090River Mile
Con
cent
ratio
n (m
g/L)
AUG Wenck Ammonia Todd SWCD Ammonia AUG Ammonia Model Result Survey Detection Limit

Appendix F, Figure F-7
MPCA Long Prairie River Watershed TMDL Final Project Report
T:\0147\51\Phase III Rpt\Appendices\Appendix_F Fig 07 ON 1 of 1 Wenck Associates, Inc.
ON Profile August Model vs Monitored outside of Permitted Discharge Period
(Todd SWCD data collected between 1996-2002)
0.00
0.50
1.00
1.50
2.00
2.50
0102030405060708090River Mile
Con
cent
ratio
n (m
g/L)
Todd SWCD ON AUG Wenck ON AUG ON Model Results

Appendix F, Figure F-7
MPCA Long Prairie River Watershed TMDL Final Project Report
T:\0147\51\Phase III Rpt\Appendices\Appendix_F Fig 07 Chl-a 1 of 1 Wenck Associates, Inc.
Chlorophyll-a Profile August Model vs Monitored outside of Permitted Discharge Period
(Todd SWCD data collected between 1996-2002)
0
0.5
1
1.5
2
2.5
3
3.5
4
4.5
5
0102030405060708090
River Mile
Con
cent
ratio
n (m
g/m
3 )
AUG Wenck Chlorophyll-a AUG Model Result Todd SWCD chla

Appendix F, Figure F-8
MPCA Long Prairie River Watershed TMDL Final Project Report
T:\0147\51\Phase III Rpt\Appendices\Appendix_F Fig 08 Sept Q 1 of 1 Wenck Associates, Inc.
Discharge ProfileSeptember Model vs Monitored during Permitted Discharge Period
(Todd SWCD data collected between 1996-2002)
0.0
50.0
100.0
150.0
200.0
250.0
300.0
350.0
400.0
0.010.020.030.040.050.060.070.080.090.0
River Mile
Flow
[cfs
]
SEPT QUAL-TX Modeled Todd SWCD Flow SEPT Wenck Monitored

Appendix F, Figure F-8
MPCA Long Prairie River Watershed TMDL Final Project Report
T:\0147\51\Phase III Rpt\Appendices\Appendix_F Fig 08 Temp 1 of 1 Wenck Associates, Inc.
Temperature Profile September Model vs Monitored during Permitted Discharge Period
(Todd SWCD data collected between 1996-2002)
0
5
10
15
20
25
30
0102030405060708090
River Mile
Tem
pera
ture
(deg
rees
C)
SEPT Model Results SEPT Wenck Temp Todd SWCD Temp

Appendix F, Figure F-8
MPCA Long Prairie River Watershed TMDL Final Project Report
T:\0147\51\Phase III Rpt\Appendices\Appendix_F Fig 08 DO 1 of 1 Wenck Associates, Inc.
Dissolved Oxygen ProfileSeptember Model vs Monitored during Permitted Discharge Period
(Todd SWCD data collected between 1996-2002)
0.0
2.0
4.0
6.0
8.0
10.0
12.0
14.0
16.0
18.0
20.0
0.010.020.030.040.050.060.070.080.090.0 River Mile
DO
[mg/
L]
QUAL-TX Modeled Min Todd SWCD DO QUAL-TX Modeled Max QUAL-TX Modeled
SEPT MAX DO SEPT MIN DO SEPT Wenck Monitored Model Point Inflows

Appendix F, Figure F-8
MPCA Long Prairie River Watershed TMDL Final Project Report
T:\0147\51\Phase III Rpt\Appendices\Appendix_F Fig 08 CBODu 1 of 1 Wenck Associates, Inc.
CBODu Profile September Model vs Monitored during Permitted Discharge Period
(Todd SWCD data collected between 1996-2002)
0.00
2.00
4.00
6.00
8.00
10.00
12.00
14.00
16.00
18.00
20.00
0102030405060708090
River Mile
Con
cent
ratio
n (m
g/L)
SEPT Wenck CBOD ultimate SEPT Model Result Todd SWCD CBODu SEPT Survey Detection Limit

Appendix F, Figure F-8
MPCA Long Prairie River Watershed TMDL Final Project Report
T:\0147\51\Phase III Rpt\Appendices\Appendix_F Fig 08 TP 1 of 1 Wenck Associates, Inc.
TP Profile September Model vs Monitored during Permitted Discharge Period
(Todd SWCD data collected between 1996-2002)
0.00
0.05
0.10
0.15
0.20
0.25
0.30
0.35
0.40
0102030405060708090
River Mile
Con
cent
ratio
n (m
g/L)
SEPT Wenck TP Todd SWCD TP SEPT Model Result Survey Detection Limit

Appendix F, Figure F-8
MPCA Long Prairie River Watershed TMDL Final Project Report
T:\0147\51\Phase III Rpt\Appendices\Appendix_F Fig 08 NO23 1 of 1 Wenck Associates, Inc.
NO2+3 Profile September Model vs Monitored during Permitted Discharge Period
(Todd SWCD data collected between 1996-2002)
0.00
0.20
0.40
0.60
0.80
1.00
1.20
1.40
1.60
0102030405060708090River Mile
Con
cent
ratio
n (m
g/L)
SEPT Wenck NO2/NO3 SEPT Model Results Todd SWCD NO2/3 Survey Detection Limit

Appendix F, Figure F-8
MPCA Long Prairie River Watershed TMDL Final Project Report
T:\0147\51\Phase III Rpt\Appendices\Appendix_F Fig 08 NH3-N 1 of 1 Wenck Associates, Inc.
Ammonia-N Profile September Model vs Monitored during Permitted Discharge Period
(Todd SWCD data collected between 1996-2002)
0.00
0.20
0.40
0.60
0.80
1.00
1.20
0102030405060708090River Mile
Con
cent
ratio
n (m
g/L)
SEPT Wenck Ammonia Todd SWCD Ammonia SEPT Ammonia Model Result Survey Detection Limit

Appendix F, Figure F-8
MPCA Long Prairie River Watershed TMDL Final Project Report
T:\0147\51\Phase III Rpt\Appendices\Appendix_F Fig 08 ON 1 of 1 Wenck Associates, Inc.
ON Profile September Model vs Monitored during Permitted Discharge Period
(Todd SWCD data collected between 1996-2002)
0.00
0.50
1.00
1.50
2.00
2.50
0102030405060708090River Mile
Con
cent
ratio
n (m
g/L)
SEPT Wenck ON SEPT ON Model Results Todd SWCD ON

Appendix F, Figure F-8
MPCA Long Prairie River Watershed TMDL Final Project Report
T:\0147\51\Phase III Rpt\Appendices\Appendix_F Fig 08 Chl-a 1 of 1 Wenck Associates, Inc.
Chlorophyll-a Profile September Model vs Monitored during Permitted Discharge Period
(Todd SWCD data collected between 1996-2002)
0
2
4
6
8
10
12
0102030405060708090
River Mile
Con
cent
ratio
n (m
g/m
3 )
SEPT Model Result SEPT Wenck Chlorophyll-a Todd SWCD chla

Appendix F, Figure F-9
MPCA Long Prairie River Watershed TMDL Final Project Report
Long Prairie River Profile Graphs:QUAL-TX Summer 7Q10 DO
Critical Conditions without Point Sources
T:\0147\51\Phase III Rpt\Appendices\Appendix_F Fig 09 Summer 7Q10 DO 1 of 1 Wenck Associates, Inc.
���������������������������������������������������������������������������������������������������������������������������������������������������������������������������������������������������������������������������������������������������������������������������������������������������������������������������������������������������������������������������������������������������������������������������������������������������������������������������������������������������������������������������������������������������������������������������������������������������������������������������������������������������������������������������������������������������������������������������������������������������������������������������������������������������������������������������������������������������������������������������������������������������������������������������������������������������������������������������������������������������������������������������������������������������������������������������������������������������������������������������������������������������������������������������������������������
0.0
2.0
4.0
6.0
8.0
10.0
12.0
14.0
16.0
0.010.020.030.040.050.060.070.080.090.0
River Mile
DO
[mg/
L]
Model Point Inflows 5 mg/L DO Standard QUAL-TX Modeled Min
������������������QUAL-TX Modeled sat QUAL-TX Modeled Max QUAL-TX Modeled

Appendix F, Figure F-9
MPCA Long Prairie River Watershed TMDL Final Project Report
Long Prairie River Profile Graphs:QUAL-TX Spring 7Q10 DO
Critical Conditions without Point Sources
T:\0147\51\Phase III Rpt\Appendices\Appendix_F Fig 09 Spring 7Q10 DO 1 of 1 Wenck Associates, Inc.
����������������������������������������������������������������������������������������������������������������������������������������������������������������������������������������������������������������������������������������������������������������������������������������������������������������������������������������������������������������������������������������������������������������������������������������������������������������������������������������������������������������������������������������������������������������������������������������������������������������������������������������������������������������������������������������������������������������������������������������������������������������������������������������������������������������������������������������������������������������������������������������������������������������������������������������������������������������������������������������������������������������������������������������������������������������������������������������������������������������������������������������������
0.0
2.0
4.0
6.0
8.0
10.0
12.0
0.010.020.030.040.050.060.070.080.090.0
River Mile
DO
[mg/
L]
QUAL-TX Modeled Min
������������������
QUAL-TX Modeled Sat QUAL-TX Modeled MaxQUAL-TX Modeled 5 mg/L DO Standard Model Point Inflows

Appendix F, Figure F-9
MPCA Long Prairie River Watershed TMDL Final Project Report
Long Prairie River Profile Graphs:QUAL-TX Winter 7Q10 DO
Critical Conditions without Point Sources
T:\0147\51\Phase III Rpt\Appendices\Appendix_F Fig 09 Winter 7Q10 DO 1 of 1 Wenck Associates, Inc.
������
������
����
������
������
����
������
������
����
����
������
������
����
������
������
����
������
������
����
����
������
������
����
������
������
����
������
������
������
����
������
������
����
������
������
����
����
������
������
����
������
������
����
������
������
������
������
������
������
������
������
������
������
������
������
������
������
������
������
����
������
������
����
������
������
����
����
������
������
����
������
������
����
������
������
����
������
������
������
������
������
������
������
������
������
������
������
������
������
������
������
������
������
������
������
������
������
������
��������
��������
��������
������
��������
��������
��������
������
��������
��������
��������
������
������
��������
��������
������
������
��������
��������
��������
������
��������
������
������
������
������
��������
������
��������
������
������
��������
������
��������
������
������
��������
������
��������
������
������
��������
����
������
����
����
������
����
����
������
����
����
������
����
����
������
����
����
������
����
����
����
����
������
����
����
������
����
����
������
����
����
������
����
����
������
����
����
����
����
������
����
����
������
����
����
������
����
����
������
����
����
������
����
����
������
����
����
����
����
������
����
����
������
����
����
������
����
����
������
����
����
������
����
����
����
����
������
����
����
������
����
����
������
����
����
������
����
����
������
����
����
������
����
����
����
����
������
����
����
������
����
����
������
����
����
������
����
����
������
����
����
����
����
������
����
����
������
����
����
������
����
����
������
����
����
������
����
����
������
����
����
����
����
������
����
������
������
������
��������
������
��������
������
������
������
����
������
����
����
������
����
����
������
����
����
������
����
����
������
����
����
����
����
������
����
����
������
����
����
������
����
����
������
����
����
������
����
����
����
����
����
����
����
������
����
����
������
����
����
������
����
����
������
������
����
����
������
������
����
������
������
����
������
������
������
����
������
������
����
������
������
����
������
������
������
����
������
������
������
����
������
������
������
����
������
������
����
������
������
����
������
������
������
������
������
������
������
������
������
����
����
������
����
����
��������
��������
��������
������
��������
��������
��������
������
��������
��������
����
������
����
����
������
����
����
������
����
����
������
������
������
������
������
������
������
������
������
������
������
������
������
������
������
������
0.0
2.0
4.0
6.0
8.0
10.0
12.0
14.0
16.0
0.010.020.030.040.050.060.070.080.090.0
River Mile
DO
[mg/
L]
������������������
QUAL-TX Modeled Sat QUAL-TX Modeled 5 mg/L DO Standard

Appendix F, Figure F-9
MPCA Long Prairie River Watershed TMDL Final Project Report
Long Prairie River Profile Graphs:QUAL-TX Summer 7Q10
Critical Conditions without Point Sources
���������������������������������������������������������������������������������������������������������������������������������������������������������������������������������������������������������������������������������������������������������������������������������������������������������������������������������������������������������������������������������������������������������������������������������������������������������������������������������������������������������������������������������������������������������������������������������������������������������������������������������������������������������������������������������������������������������������������������������������������������������������������������������������������������������������������������������������������������������������������������������������������������������������������������������������������������������������������������������������������������������������������������������������������������������������������������������������������������������������������������������������������������������������������������
0
2
4
6
8
10
12
14
16
0102030405060708090River Mile
Con
cent
ratio
n (m
g/L)
DO QUAL-TX Modeled 5 mg/L DO Standard QUAL-TX Max QUAL-TX Min�������������������
QUAL-TX Sat
0
2
4
6
8
10
12
14
0102030405060708090River Mile
Con
cent
ratio
n (m
g/L)
CBOD QUAL-TX Modeled
0
5
10
15
20
25
0102030405060708090
River Mile
Tem
pera
ture
(deg
rees
C)
Temperature Temp QUAL-TX Modeled
T:/0147/51/Phase III Report/Appendices/Appendix_F Fig 09/Summer 7Q10 Page 1 of 2 Wenck Associates, Inc.
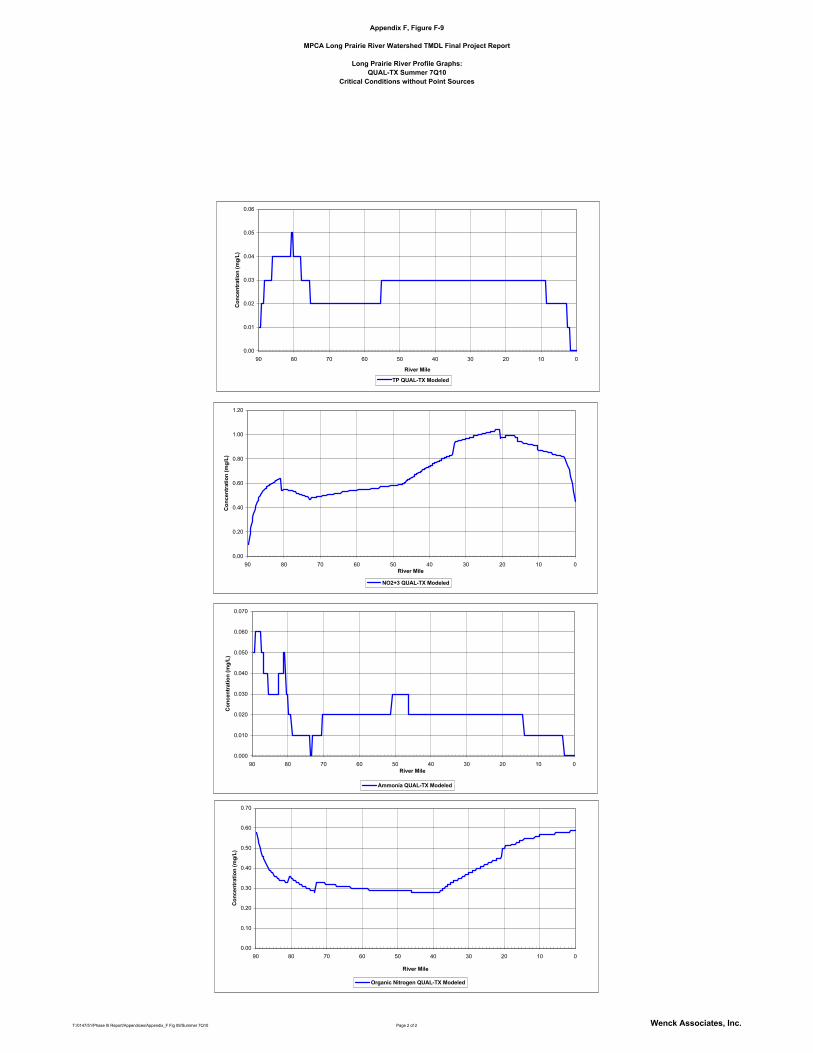
Appendix F, Figure F-9
MPCA Long Prairie River Watershed TMDL Final Project Report
Long Prairie River Profile Graphs:QUAL-TX Summer 7Q10
Critical Conditions without Point Sources
0.00
0.20
0.40
0.60
0.80
1.00
1.20
0102030405060708090River Mile
Con
cent
ratio
n (m
g/L)
NO2+3 QUAL-TX Modeled
0.00
0.01
0.02
0.03
0.04
0.05
0.06
0102030405060708090
River Mile
Con
cent
ratio
n (m
g/L)
TP QUAL-TX Modeled
0.000
0.010
0.020
0.030
0.040
0.050
0.060
0.070
0102030405060708090River Mile
Con
cent
ratio
n (m
g/L)
Ammonia QUAL-TX Modeled
0.00
0.10
0.20
0.30
0.40
0.50
0.60
0.70
0102030405060708090
River Mile
Con
cent
ratio
n (m
g/L)
Organic Nitrogen QUAL-TX Modeled
T:/0147/51/Phase III Report/Appendices/Appendix_F Fig 09/Summer 7Q10 Page 2 of 2 Wenck Associates, Inc.

Appendix F, Figure F-9
MPCA Long Prairie River Watershed TMDL Final Project Report
Long Prairie River Profile Graphs:QUAL-TX Spring 7Q10
Critical Conditions without Point Sources
������������������������������������������������������������������������������������������������������������������������������������������������������������������������������������������������������������������������������������������������������������������������������������������������������������������������������������������������������������������������������������������������������������������������������������������������������������������������������������������������������������������������������������������������������������������������������������������������������������������������������������������������������������������������������������������������������������������������������������������������������������������������������������������������������������������������������������������������������������������������������������������������������������������������������������������������������������������������������������������������������������������������������������������������������������������������������������������������������������������������
0
2
4
6
8
10
12
14
16
0102030405060708090River Mile
Con
cent
ratio
n (m
g/L)
DO QUAL-TX Modeled QUAL-TX Min������������������
QUAL-TX Sat QUAL-TX Max 5 mg/L DO Standard
0
5
10
15
20
25
0102030405060708090River Mile
Con
cent
ratio
n (m
g/L)
CBOD QUAL-TX Modeled
0
5
10
15
20
25
0102030405060708090River Mile
Tem
pera
ture
(deg
rees
C)
Temperature Temp QUAL-TX Modeled
T:/0147/51/Phase III Report/Appendices/Appendix_F Fig 09/Spring 7Q10 Page 1 of 2 Wenck Associates, Inc.

Appendix F, Figure F-9
MPCA Long Prairie River Watershed TMDL Final Project Report
Long Prairie River Profile Graphs:QUAL-TX Spring 7Q10
Critical Conditions without Point Sources
0.00
0.20
0.40
0.60
0.80
1.00
1.20
0102030405060708090River Mile
Con
cent
ratio
n (m
g/L)
NO2+3 QUAL-TX Modeled
0.00
0.01
0.02
0.03
0.04
0.05
0.06
0102030405060708090River Mile
Con
cent
ratio
n (m
g/L)
TP QUAL-TX Modeled
0.00
0.01
0.02
0.03
0.04
0.05
0.06
0.07
0.08
0102030405060708090River Mile
Con
cent
ratio
n (m
g/L)
Ammonia QUAL-TX Modeled
0.00
0.10
0.20
0.30
0.40
0.50
0.60
0.70
0.80
0102030405060708090River Mile
Con
cent
ratio
n (m
g/L)
Organic Nitrogen QUAL-TX Modeled
T:/0147/51/Phase III Report/Appendices/Appendix_F Fig 09/Spring 7Q10 Page 2 of 2 Wenck Associates, Inc.

Appendix F, Figure F-9
MPCA Long Prairie River Watershed TMDL Final Project Report
Long Prairie River Profile Graphs:QUAL-TX Winter 7Q10
Critical Conditions without Point Sources
0
2
4
6
8
10
12
14
16
0102030405060708090
River Mile
Co
nce
ntr
atio
n (m
g/L
)
DO QUAL-TX Modeled QUAL-TX Sat 5 mg/L DO Standard
0
2
4
6
8
10
12
14
16
0102030405060708090River Mile
Co
nce
ntr
atio
n (m
g/L
)
CBOD QUAL-TX Modeled
0.0
0.1
0.2
0.3
0.4
0.5
0.6
0.7
0.8
0.9
1.0
0102030405060708090
River Mile
Tem
per
atu
re (d
egre
es C
)
Temperature Temp QUAL-TX Modeled
T:/0147/51/Phase III Report/Appendices/Appendix_F Fig 09.xls/Winter 7Q10 Page 1 of 2 Wenck Associates, Inc.

Appendix F, Figure F-9
MPCA Long Prairie River Watershed TMDL Final Project Report
Long Prairie River Profile Graphs:QUAL-TX Winter 7Q10
Critical Conditions without Point Sources
0.00
0.20
0.40
0.60
0.80
1.00
1.20
1.40
0102030405060708090River Mile
Co
nce
ntr
atio
n (m
g/L
)
NO2+3 QUAL-TX Modeled
0.00
0.01
0.02
0.03
0.04
0.05
0.06
0.07
0.08
0.09
0102030405060708090
River Mile
Co
nce
ntr
atio
n (m
g/L
)
TP QUAL-TX Modeled
0.00
0.02
0.04
0.06
0.08
0.10
0.12
0.14
0102030405060708090River Mile
Co
nce
ntr
atio
n (m
g/L
)
Ammonia QUAL-TX Modeled
0.00
0.10
0.20
0.30
0.40
0.50
0.60
0.70
0102030405060708090River Mile
Co
nce
ntr
atio
n (m
g/L
)
Organic Nitrogen QUAL-TX Modeled
T:/0147/51/Phase III Report/Appendices/Appendix_F Fig 09.xls/Winter 7Q10 Page 2 of 2 Wenck Associates, Inc.

Appendix F, Figure F-10
MPCA Long Prairie River Watershed TMDL Final Project Report
Long Prairie River Profile Graphs:QUAL-TX Summer 7Q10 DO
Critical Conditions with Point Sources and no Load Reductions
T:\0147\51\Phase III Rpt\Appendices\Appendix_F Fig 10 Summer 7Q10 DO 1 of 1 Wenck Associates, Inc.
�������������������������������������������������������������������������������������������������������������������������������������������������������������������������������������������������������������������������������������������������������������������������������������������������������������������������������������������������������������������������������������������������������������������������������������������������������������������������������������������������������������������������������������������������������������������������������������������������������������������������������������������������������������������������������������������������������������������������������������������������������������������������������������������������������������������������������������������������������������������������������������������������������������������������������������������������������������������������������������������������������������������������������������������������������������������������������������������������������������������������������������������������������������������������������������������������
0.0
2.0
4.0
6.0
8.0
10.0
12.0
0.010.020.030.040.050.060.070.080.090.0
River Mile
DO
[mg/
L]
Model Point Inflows 5 mg/L DO Standard QUAL-TX Modeled Min
������������������QUAL-TX Modeled sat QUAL-TX Modeled Max QUAL-TX Modeled

Appendix F, Figure F-10
MPCA Long Prairie River Watershed TMDL Final Project Report
Long Prairie River Profile Graphs:QUAL-TX Spring 7Q10 DO
Critical Conditions with Point Sources and no Load Reductions
T:\0147\51\Phase III Rpt\Appendices\Appendix_F Fig 10 Spring 7Q10 DO 1 of 1 Wenck Associates, Inc.
�����������������������������������������������������������������������������������������������������������������������������������������������������������������������������������������������������������������������������������������������������������������������������������������������������������������������������������������������������������������������������������������������������������������������������������������������������������������������������������������������������������������������������������������������������������������������������������������������������������������������������������������������������������������������������������������������������������������������������������������������������������������������������������������������������������������������������������������������������������������������������������������������������������������������������������������������������������������������������������������������������������������������������������������������������������������������������������������������������������������������������������������������
0.0
2.0
4.0
6.0
8.0
10.0
12.0
0.010.020.030.040.050.060.070.080.090.0
River Mile
DO
[mg/
L]
QUAL-TX Modeled Min
������������������
������������������QUAL-TX Modeled Sat QUAL-TX Modeled MaxQUAL-TX Modeled 5 mg/L DO Standard Model Point Inflows

Appendix F, Figure F-10
MPCA Long Prairie River Watershed TMDL Final Project Report
Long Prairie River Profile Graphs:QUAL-TX Summer 7Q10
Critical Conditions with Point Sources and no Load Reductions
������������������������������������������������������������������������������������������������������������������������������������������������������������������������������������������������������������������������������������������������������������������������������������������������������������������������������������������������������������������������������������������������������������������������������������������������������������������������������������������������������������������������
������������������
������������������
��������������������������
��������������������
��������������������
��������������������
������������������������������������������������������������������������������
��������������������������������������������������������������������������������������������������������������������������������������������������������������������������������������������������������������������������������������������������������������������������������������������������������������������������������������������������������������������������������������������������������������������������������������������������������������������������������������������������������������������������������������������������������������������������������������������������������������������������������������������������������������������������������������������������
����������������������������������������������������������������������������������������������������������������������������������������������������������������������������������������������������������������������������������������������������������������������������������������������������������������������������������������������������������������������������������������������������������������������������������������������������������������������������������������
������������������
��������������������������
��������������������������������������������������������������������������������������������������������������������������������������������������������������������������������������������������������������
0
2
4
6
8
10
12
14
16
0102030405060708090
River Mile
Con
cent
ratio
n (m
g/L)
DO QUAL-TX Modeled 5 mg/L DO Standard QUAL-TX Max QUAL-TX Min�����������������
QUAL-TX Sat
0
5
10
15
20
25
30
0102030405060708090River Mile
Con
cent
ratio
n (m
g/L)
CBOD QUAL-TX Modeled
0
5
10
15
20
25
0102030405060708090
River Mile
Tem
pera
ture
(deg
rees
C)
Temperature Temp QUAL-TX Modeled
T:/0147/51/Phase III Report/Appendices/Appendix_F Fig 10/Summer 7Q10 Page 1 of 2 Wenck Associates, Inc.

Appendix F, Figure F-10
MPCA Long Prairie River Watershed TMDL Final Project Report
Long Prairie River Profile Graphs:QUAL-TX Summer 7Q10
Critical Conditions with Point Sources and no Load Reductions
0.00
1.00
2.00
3.00
4.00
5.00
6.00
0102030405060708090River Mile
Con
cent
ratio
n (m
g/L)
NO2+3 QUAL-TX Modeled
0.00
0.50
1.00
1.50
2.00
2.50
0102030405060708090
River Mile
Con
cent
ratio
n (m
g/L)
TP QUAL-TX Modeled
0.000
1.000
2.000
3.000
4.000
5.000
6.000
7.000
0102030405060708090
River Mile
Con
cent
ratio
n (m
g/L)
Ammonia QUAL-TX Modeled
0.00
2.00
4.00
6.00
8.00
10.00
12.00
0102030405060708090River Mile
Con
cent
ratio
n (m
g/L)
Organic Nitrogen QUAL-TX Modeled
T:/0147/51/Phase III Report/Appendices/Appendix_F Fig 10/Summer 7Q10 Page 2 of 2 Wenck Associates, Inc.

Appendix F, Figure F-10
MPCA Long Prairie River Watershed TMDL Final Project Report
Long Prairie River Profile Graphs:QUAL-TX Spring 7Q10
Critical Conditions with Point Sources and no Load Reductions
������������������������������������������������������������������������������������������������������������������������������������������������������������������������������������������������������������������������������������������������������������������������������������������������������������������������������������������������������������������������������������������������������������������������������������������������������������������������������������������������������������������������������������������������������������������������������������������������������������������������������������������������������������������������������������������������������������������������������������������������������������������������������������������������������������������������������������������������������������������������������������������������������������������������������������������������������������������������������������������������������������������������������������������������������������������������������������������������������������������������
0
2
4
6
8
10
12
14
16
0102030405060708090River Mile
Con
cent
ratio
n (m
g/L)
DO QUAL-TX Modeled QUAL-TX Min�������������������
QUAL-TX Sat QUAL-TX Max 5 mg/L DO Standard
0
5
10
15
20
25
0102030405060708090River Mile
Con
cent
ratio
n (m
g/L)
CBOD QUAL-TX Modeled
0
5
10
15
20
25
0102030405060708090
River Mile
Tem
pera
ture
(deg
rees
C)
Temperature Temp QUAL-TX Modeled
T:/0147/51/Phase III Report/Appendices/Appendix_F Fig 10/Spring 7Q10 Page 1 of 2 Wenck Associates, Inc.

Appendix F, Figure F-10
MPCA Long Prairie River Watershed TMDL Final Project Report
Long Prairie River Profile Graphs:QUAL-TX Spring 7Q10
Critical Conditions with Point Sources and no Load Reductions
0.00
1.00
2.00
3.00
4.00
5.00
6.00
0102030405060708090River Mile
Con
cent
ratio
n (m
g/L)
NO2+3 QUAL-TX Modeled
0.00
0.20
0.40
0.60
0.80
1.00
1.20
0102030405060708090
River Mile
Con
cent
ratio
n (m
g/L)
TP QUAL-TX Modeled
0.00
1.00
2.00
3.00
4.00
5.00
6.00
7.00
8.00
9.00
0102030405060708090River Mile
Con
cent
ratio
n (m
g/L)
Ammonia QUAL-TX Modeled
0.00
2.00
4.00
6.00
8.00
10.00
12.00
14.00
0102030405060708090River Mile
Con
cent
ratio
n (m
g/L)
Organic Nitrogen QUAL-TX Modeled
T:/0147/51/Phase III Report/Appendices/Appendix_F Fig 10/Spring 7Q10 Page 2 of 2 Wenck Associates, Inc.

Appendix F, Figure F-11
MPCA Long Prairie River Watershed TMDL Final Project Report
Long Prairie River Profiles: Modified Spring 7Q10 for TMDL Projection Simulation
T:\0147\51\Phase III Final Report \Appendix_F Figs F-11_F-12_Jul04 Spring DO 1 of 1 Wenck Associates, Inc.
0.0
2.0
4.0
6.0
8.0
10.0
12.0
0.010.020.030.040.050.060.070.080.090.0
River Mile
DO
[m
g/L
]
QUAL-TX Modeled Sat 5 mg/L DO Standard QUAL-TX Modeled Max QUAL-TX Modeled MinQUAL-TX Modeled TMDLReachBreaks Model Point Inflows

Appendix F, Figure F-11
MPCA Long Prairie River Watershed TMDL Final Project Report
Long Prairie River Profiles: Modified Spring 7Q10 for TMDL Projection Simulation
0.00
0.50
1.00
1.50
2.00
2.50
3.00
0102030405060708090
River Mile
Co
nce
ntr
atio
n (m
g/L
)
NO2+3 QUAL-TX Modeled
0.00
0.05
0.10
0.15
0.20
0.25
0.30
0.35
0.40
0.45
0.50
0102030405060708090
River Mile
Co
nce
ntr
atio
n (m
g/L
)
TP QUAL-TX Modeled
0.000
0.200
0.400
0.600
0.800
1.000
1.200
1.400
0102030405060708090
River Mile
Co
nce
ntr
atio
n (m
g/L
)
Ammonia QUAL-TX Modeled
0.00
0.50
1.00
1.50
2.00
2.50
3.00
3.50
4.00
0102030405060708090
River Mile
Co
nce
ntr
atio
n (m
g/L
)
Organic Nitrogen QUAL-TX Modeled
T:\0147\51\Phase III Final Report /Appendix_F Figs F-11_F-12_Jul04/Spring 7Q10 Page 1 of 2 Wenck Associates, Inc.

Appendix F, Figure F-11
MPCA Long Prairie River Watershed TMDL Final Project Report
Long Prairie River Profiles: Modified Spring 7Q10 for TMDL Projection Simulation
0
2
4
6
8
10
12
14
16
0102030405060708090
River Mile
Co
nce
ntr
atio
n (m
g/L
)
DO QUAL-TX Modeled QUAL-TX Min QUAL-TX Sat 5 mg/L DO Standard QUAL-TX Max
0
5
10
15
20
25
0102030405060708090River Mile
Co
nce
ntr
atio
n (m
g/L
)
CBOD QUAL-TX Modeled
0
5
10
15
20
25
0102030405060708090
River Mile
Tem
per
atu
re (
deg
rees
C)
Temp QUAL-TX Modeled
T:\0147\51\Phase III Final Report /Appendix_F Figs F-11_F-12_Jul04/Spring 7Q10 Page 2 of 2 Wenck Associates, Inc.
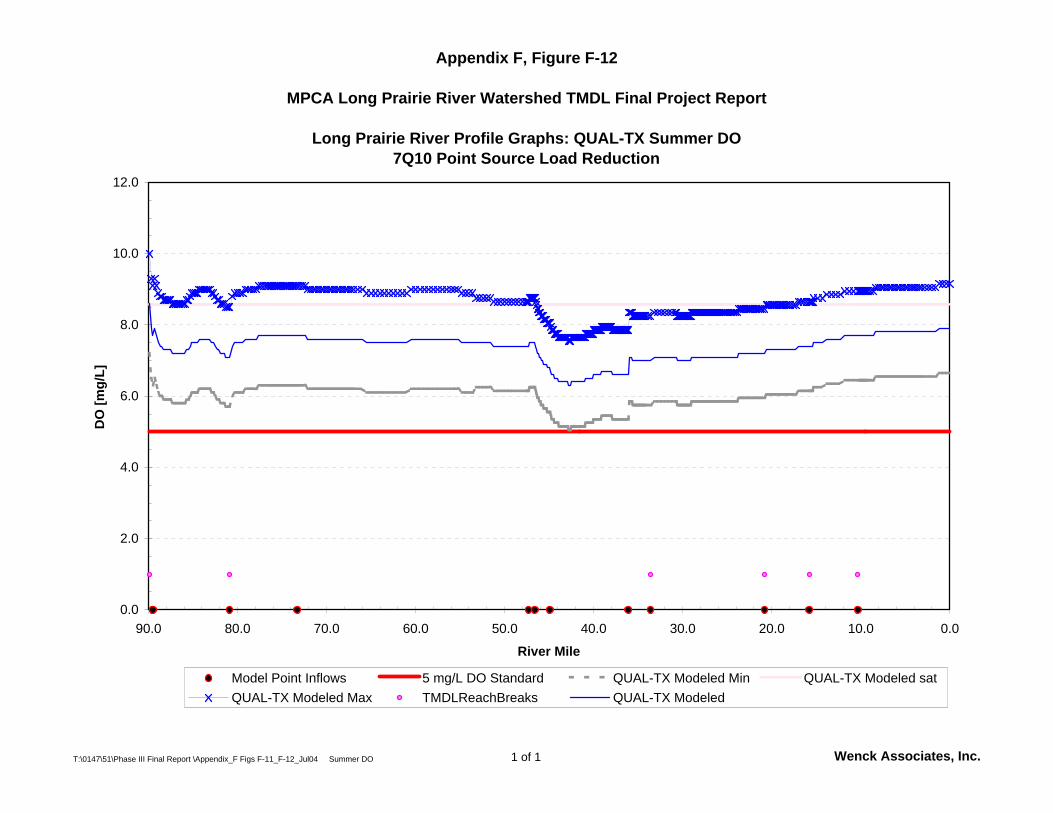
Appendix F, Figure F-12
MPCA Long Prairie River Watershed TMDL Final Project Report
Long Prairie River Profile Graphs: QUAL-TX Summer DO7Q10 Point Source Load Reduction
T:\0147\51\Phase III Final Report \Appendix_F Figs F-11_F-12_Jul04 Summer DO 1 of 1 Wenck Associates, Inc.
0.0
2.0
4.0
6.0
8.0
10.0
12.0
0.010.020.030.040.050.060.070.080.090.0
River Mile
DO
[m
g/L
]
Model Point Inflows 5 mg/L DO Standard QUAL-TX Modeled Min QUAL-TX Modeled satQUAL-TX Modeled Max TMDLReachBreaks QUAL-TX Modeled

Appendix F, Figure F-12
MPCA Long Prairie River Watershed TMDL Final Project Report
Long Prairie River Profile Graphs: QUAL-TX Summer DO7Q10 Point Source Load Reduction
0.00
1.00
2.00
3.00
4.00
5.00
6.00
7.00
0102030405060708090
River Mile
Co
nce
ntr
atio
n (m
g/L
)
NO2+3 QUAL-TX Modeled
0.00
0.20
0.40
0.60
0.80
1.00
1.20
1.40
1.60
0102030405060708090
River Mile
Co
nce
ntr
atio
n (m
g/L
)
TP QUAL-TX Modeled
0.000
0.200
0.400
0.600
0.800
1.000
1.200
1.400
1.600
0102030405060708090
River Mile
Co
nce
ntr
atio
n (m
g/L
)
Ammonia QUAL-TX Modeled
0.00
1.00
2.00
3.00
4.00
5.00
6.00
7.00
8.00
9.00
0102030405060708090
River Mile
Co
nce
ntr
atio
n (m
g/L
)
Organic Nitrogen QUAL-TX Modeled
T:\0147\51\Phase III Final Report /Appendix_F Figs F-11_F-12_Jul04/Summer 7Q10 Page 1 of 2 Wenck Associates, Inc.

Appendix F, Figure F-12
MPCA Long Prairie River Watershed TMDL Final Project Report
Long Prairie River Profile Graphs: QUAL-TX Summer DO7Q10 Point Source Load Reduction
0
2
4
6
8
10
12
14
16
0102030405060708090
River Mile
Co
nce
ntr
atio
n (m
g/L
)
DO QUAL-TX Modeled 5 mg/L DO Standard QUAL-TX Max QUAL-TX Min QUAL-TX Sat
0
5
10
15
20
25
30
0102030405060708090River Mile
Co
nce
ntr
atio
n (m
g/L
)
CBOD QUAL-TX Modeled
0
5
10
15
20
25
0102030405060708090
River Mile
Tem
per
atu
re (
deg
rees
C)
Temp QUAL-TX Modeled
T:\0147\51\Phase III Final Report /Appendix_F Figs F-11_F-12_Jul04/Summer 7Q10 Page 2 of 2 Wenck Associates, Inc.

Appendix F, Figure F-13
MPCA Long Prairie River Watershed TMDL Final Project Report
Long Prairie River Profile Graphs: QUAL-TX Winter DO7Q10 Point Source Load Reduction
T:\0147\51\Phase III Final Report \Appendix_F Figs F-13_Jul04 Winter DO1 1 of 1 Wenck Associates, Inc.
0.0
2.0
4.0
6.0
8.0
10.0
12.0
14.0
16.0
0.010.020.030.040.050.060.070.080.090.0
River Mile
DO
[m
g/L
]
QUAL-TX Modeled Sat QUAL-TX Modeled 5 mg/L DO Standard

Appendix F, Figure F-13
MPCA Long Prairie River Watershed TMDL Final Project Report
Long Prairie River Profile Graphs:QUAL-TX Winter 7Q10
7Q10 Point Source Load Reduction
0
2
4
6
8
10
12
14
16
0102030405060708090
River Mile
Con
cent
ratio
n (m
g/L)
DO QUAL-TX Modeled QUAL-TX Sat 5 mg/L DO Standard
0
2
4
6
8
10
12
14
16
18
0102030405060708090River Mile
Con
cent
ratio
n (m
g/L)
CBOD QUAL-TX Modeled
0.0
0.1
0.2
0.3
0.4
0.5
0.6
0.7
0.8
0.9
1.0
0102030405060708090
River Mile
Tem
pera
ture
(deg
rees
C)
Temp QUAL-TX Modeled
T:/0147/51/Phase III Report/Appendicies/Appendix_F Fig 13.xls/Winter 7Q10 Page 1 of 2 Wenck Associates, Inc.
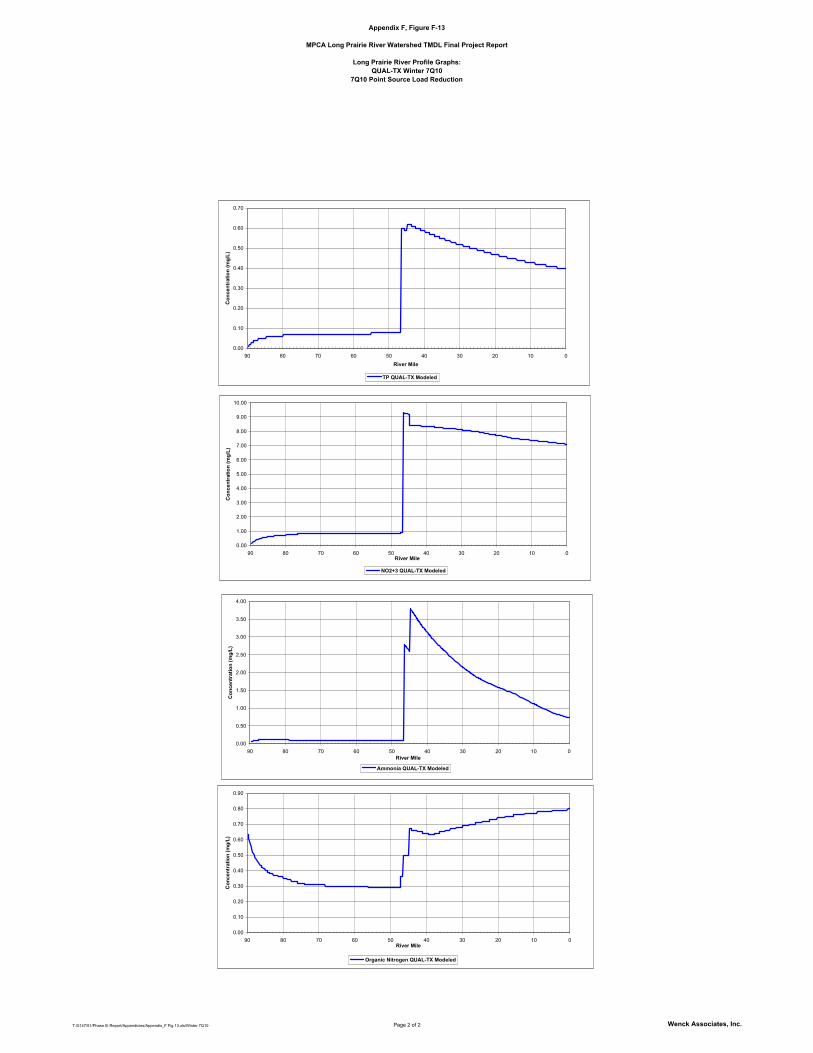
Appendix F, Figure F-13
MPCA Long Prairie River Watershed TMDL Final Project Report
Long Prairie River Profile Graphs:QUAL-TX Winter 7Q10
7Q10 Point Source Load Reduction
0.00
1.00
2.00
3.00
4.00
5.00
6.00
7.00
8.00
9.00
10.00
0102030405060708090River Mile
Con
cent
ratio
n (m
g/L)
NO2+3 QUAL-TX Modeled
0.00
0.10
0.20
0.30
0.40
0.50
0.60
0.70
0102030405060708090River Mile
Con
cent
ratio
n (m
g/L)
TP QUAL-TX Modeled
0.00
0.50
1.00
1.50
2.00
2.50
3.00
3.50
4.00
0102030405060708090River Mile
Con
cent
ratio
n (m
g/L)
Ammonia QUAL-TX Modeled
0.00
0.10
0.20
0.30
0.40
0.50
0.60
0.70
0.80
0.90
0102030405060708090River Mile
Con
cent
ratio
n (m
g/L)
Organic Nitrogen QUAL-TX Modeled
T:/0147/51/Phase III Report/Appendicies/Appendix_F Fig 13.xls/Winter 7Q10 Page 2 of 2 Wenck Associates, Inc.

Appendix F, Figure F-14a
MPCA Long Prairie River Watershed TMDL Final Project Report
Long Prairie River Profiles: Winter TMDL Demonstration (Modified Spring)
T:\0147\51\Phase III Final Report \Appendix_F Figs F-14a_b_Jul04 Spring DO 1 of 1 Wenck Associates, Inc.
0.0
2.0
4.0
6.0
8.0
10.0
12.0
0.010.020.030.040.050.060.070.080.090.0
River Mile
DO
[m
g/L
]
QUAL-TX Modeled Sat 5 mg/L DO Standard QUAL-TX Modeled Max QUAL-TX Modeled MinQUAL-TX Modeled TMDLReachBreaks Model Point Inflows

Appendix F, Figure F-14a
MPCA Long Prairie River Watershed TMDL Final Project Report
Long Prairie River Profiles: TMDL Demonstration (Modified Spring)
0
2
4
6
8
10
12
14
16
0102030405060708090
River Mile
Co
nce
ntr
atio
n (m
g/L
)
DO QUAL-TX Modeled QUAL-TX Min QUAL-TX Sat 5 mg/L DO Standard QUAL-TX Max
0
5
10
15
20
25
30
0102030405060708090River Mile
Co
nce
ntr
atio
n (m
g/L
)
CBOD QUAL-TX Modeled
0
5
10
15
20
25
0102030405060708090
River Mile
Tem
per
atu
re (
deg
rees
C)
Temp QUAL-TX Modeled
T:\0147\51\Phase III Final Report /Appendix_F Figs F-14a_b_Jul04/Spring 7Q10 Page 1 of 2 Wenck Associates, Inc.

Appendix F, Figure F-14a
MPCA Long Prairie River Watershed TMDL Final Project Report
Long Prairie River Profiles: TMDL Demonstration (Modified Spring)
0.00
0.50
1.00
1.50
2.00
2.50
3.00
0102030405060708090
River Mile
Co
nce
ntr
atio
n (m
g/L
)
NO2+3 QUAL-TX Modeled
0.00
0.05
0.10
0.15
0.20
0.25
0.30
0.35
0.40
0.45
0.50
0102030405060708090
River Mile
Co
nce
ntr
atio
n (m
g/L
)
TP QUAL-TX Modeled
0.000
0.200
0.400
0.600
0.800
1.000
1.200
1.400
1.600
0102030405060708090
River Mile
Co
nce
ntr
atio
n (m
g/L
)
Ammonia QUAL-TX Modeled
0.00
0.50
1.00
1.50
2.00
2.50
3.00
3.50
4.00
0102030405060708090
River Mile
Co
nce
ntr
atio
n (m
g/L
)
Organic Nitrogen QUAL-TX Modeled
T:\0147\51\Phase III Final Report /Appendix_F Figs F-14a_b_Jul04/Spring 7Q10 Page 2 of 2 Wenck Associates, Inc.
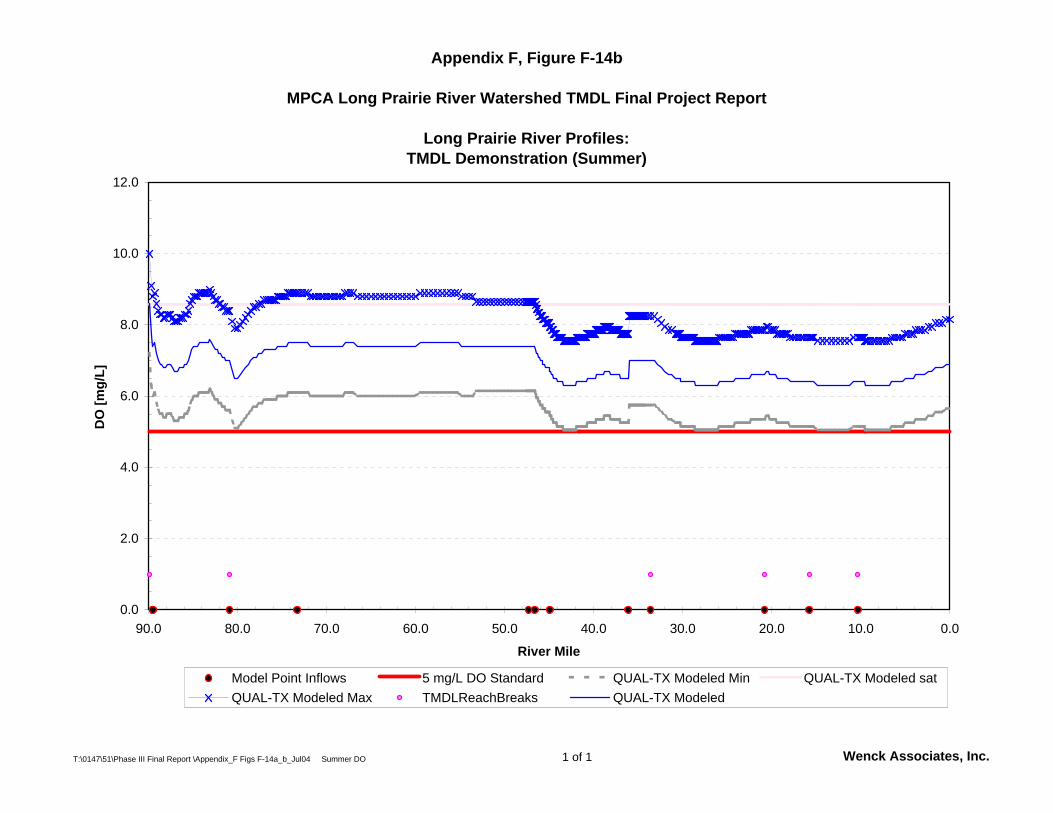
Appendix F, Figure F-14b
MPCA Long Prairie River Watershed TMDL Final Project Report
Long Prairie River Profiles: TMDL Demonstration (Summer)
T:\0147\51\Phase III Final Report \Appendix_F Figs F-14a_b_Jul04 Summer DO 1 of 1 Wenck Associates, Inc.
0.0
2.0
4.0
6.0
8.0
10.0
12.0
0.010.020.030.040.050.060.070.080.090.0
River Mile
DO
[m
g/L
]
Model Point Inflows 5 mg/L DO Standard QUAL-TX Modeled Min QUAL-TX Modeled satQUAL-TX Modeled Max TMDLReachBreaks QUAL-TX Modeled

Appendix F, Figure F-14b
MPCA Long Prairie River Watershed TMDL Final Project Report
Long Prairie River Profiles: TMDL Demonstration (Summer)
0
2
4
6
8
10
12
14
16
0102030405060708090
River Mile
Co
nce
ntr
atio
n (m
g/L
)
DO QUAL-TX Modeled 5 mg/L DO Standard QUAL-TX Max QUAL-TX Min QUAL-TX Sat
0
10
20
30
40
50
60
0102030405060708090River Mile
Co
nce
ntr
atio
n (m
g/L
)
CBOD QUAL-TX Modeled
0
5
10
15
20
25
0102030405060708090
River Mile
Tem
per
atu
re (
deg
rees
C)
Temp QUAL-TX Modeled
T:\0147\51\Phase III Final Report /Appendix_F Figs F-14a_b_Jul04/Summer 7Q10 Page 1 of 2 Wenck Associates, Inc.

Appendix F, Figure F-14b
MPCA Long Prairie River Watershed TMDL Final Project Report
Long Prairie River Profiles: TMDL Demonstration (Summer)
0.00
1.00
2.00
3.00
4.00
5.00
6.00
7.00
0102030405060708090
River Mile
Co
nce
ntr
atio
n (m
g/L
)
NO2+3 QUAL-TX Modeled
0.00
0.20
0.40
0.60
0.80
1.00
1.20
1.40
0102030405060708090
River Mile
Co
nce
ntr
atio
n (m
g/L
)
TP QUAL-TX Modeled
0.000
0.500
1.000
1.500
2.000
2.500
3.000
0102030405060708090
River Mile
Co
nce
ntr
atio
n (m
g/L
)
Ammonia QUAL-TX Modeled
0.00
1.00
2.00
3.00
4.00
5.00
6.00
7.00
8.00
9.00
0102030405060708090
River Mile
Co
nce
ntr
atio
n (m
g/L
)
Organic Nitrogen QUAL-TX Modeled
T:\0147\51\Phase III Final Report /Appendix_F Figs F-14a_b_Jul04/Summer 7Q10 Page 2 of 2 Wenck Associates, Inc.

Appendix F, Figure F-14c
MPCA Long Prairie River Watershed TMDL Final Project Report
Long Prairie River Profiles: Winter TMDL Demonstration (Winter)
T:\0147\51\Phase III Final Report \Appendix_F Figs F-14c_Jul04 Winter DO1 1 of 1 Wenck Associates, Inc.
0.0
2.0
4.0
6.0
8.0
10.0
12.0
14.0
16.0
0.010.020.030.040.050.060.070.080.090.0
River Mile
DO
[m
g/L
]
QUAL-TX Modeled Sat QUAL-TX Modeled 5 mg/L DO Standard

Appendix F, Figure F-14c
MPCA Long Prairie River Watershed TMDL Final Project Report
Long Prairie River Profiles: Winter TMDL Demonstration (Winter)
0
2
4
6
8
10
12
14
16
0102030405060708090
River Mile
Co
nce
ntr
atio
n (m
g/L
)
DO QUAL-TX Modeled QUAL-TX Sat 5 mg/L DO Standard
0
10
20
30
40
50
60
70
80
0102030405060708090River Mile
Co
nce
ntr
atio
n (m
g/L
)
CBOD QUAL-TX Modeled
0
0
0
0
0
1
1
1
1
1
1
0102030405060708090
River Mile
Tem
per
atu
re (
deg
rees
C)
Temp QUAL-TX Modeled
T:\0147\51\Phase III Final Report /Appendix_F Figs F-14c_Jul04/Winter 7Q10 Page 1 of 2 Wenck Associates, Inc.

Appendix F, Figure F-14c
MPCA Long Prairie River Watershed TMDL Final Project Report
Long Prairie River Profiles: Winter TMDL Demonstration (Winter)
0.00
2.00
4.00
6.00
8.00
10.00
12.00
0102030405060708090
River Mile
Co
nce
ntr
atio
n (m
g/L
)
NO2+3 QUAL-TX Modeled
0.00
0.10
0.20
0.30
0.40
0.50
0.60
0.70
0102030405060708090
River Mile
Co
nce
ntr
atio
n (m
g/L
)
TP QUAL-TX Modeled
0.000
0.500
1.000
1.500
2.000
2.500
3.000
3.500
4.000
0102030405060708090
River Mile
Co
nce
ntr
atio
n (m
g/L
)
Ammonia QUAL-TX Modeled
0.00
0.10
0.20
0.30
0.40
0.50
0.60
0.70
0.80
0.90
0102030405060708090
River Mile
Co
nce
ntr
atio
n (m
g/L
)
Organic Nitrogen QUAL-TX Modeled
T:\0147\51\Phase III Final Report /Appendix_F Figs F-14c_Jul04/Winter 7Q10 Page 2 of 2 Wenck Associates, Inc.

Appendix F, Figure F-14d
Minnesota Pollution Control AgencyLong Prairie River Watershed TMDL Final Project Report
DO TMDLs for Long Prairie River by Reach and Category
Non-point Source: TMDL Allocation
0
1,000
2,000
3,000
4,000
5,000
6,000
7,000
8,000
9,000
506 505 504 503 502 5012002 TMDL Reach Number
Oxy
gen
Dem
and
(lbs/
day)
NBOD CBOD SOD
Point Source: TMDL Allocation
0
1,000
2,000
3,000
4,000
5,000
6,000
7,000
8,000
9,000
506 505 504 503 502 5012002 TMDL Reach Number
Oxy
gen
Dem
and
(lbs/
day)
NBOD CBOD SOD
Unallocated Capacity
0
1,000
2,000
3,000
4,000
5,000
6,000
7,000
8,000
9,000
506 505 504 503 502 5012002 TMDL Reach Number
Oxy
gen
Dem
and
(lbs/
day)
NBOD CBOD SOD
T:/0147/51/Phase III Final Report/Appendix_F Figs F-14d-j_Jul04/Appendix F, Figure F-14d Page 1 of 7 Wenck Associates, Inc.

Appendix F, Figure F-14e
Minnesota Pollution Control AgencyLong Prairie River Watershed TMDL Final Project Report
Total Capacity: DO TMDLs for Long Prairie River by Reach
T:\0147\51\Phase III Final Report\Appendix_F Figs F-14d-j_Jul04 Appendix F, Figure F-14e 2 of 7 Wenck Associates, Inc.
Reach 07010108-506: Long Prairie River Headwaters (Lake Carlos) to Spruce Creek
Unallocated Capacity8%
WLA + MOS for Carlos WWTF20%
LA for LPR Headwaters @ RM89.9
9%LA for other Nonpoint Sources
58%
MOS for all Nonpoint Sources5%
2,380
Total Oxygen Demand (lbs/day)
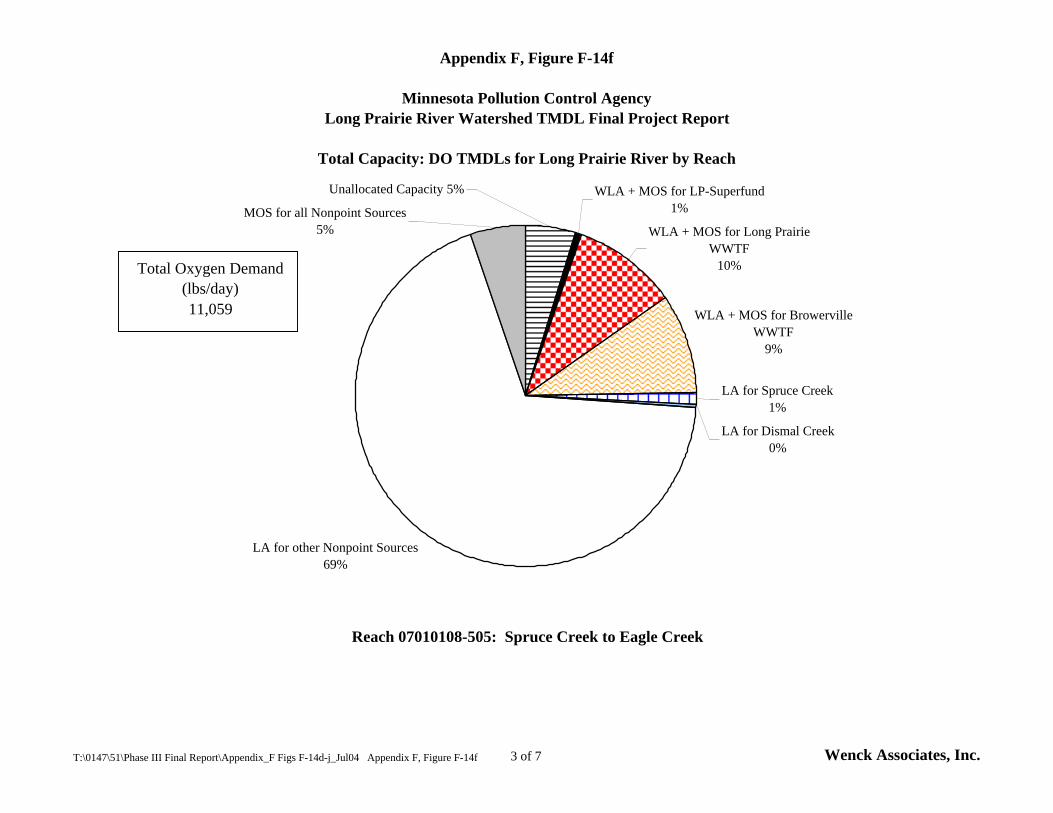
Appendix F, Figure F-14f
Minnesota Pollution Control AgencyLong Prairie River Watershed TMDL Final Project Report
Total Capacity: DO TMDLs for Long Prairie River by Reach
T:\0147\51\Phase III Final Report\Appendix_F Figs F-14d-j_Jul04 Appendix F, Figure F-14f 3 of 7 Wenck Associates, Inc.
Reach 07010108-505: Spruce Creek to Eagle Creek
WLA + MOS for LP-Superfund1%
WLA + MOS for Long Prairie WWTF
10%
WLA + MOS for Browerville WWTF
9%
LA for Spruce Creek1%
LA for Dismal Creek0%
LA for other Nonpoint Sources69%
MOS for all Nonpoint Sources5%
Unallocated Capacity 5%
11,059
Total Oxygen Demand (lbs/day)

Appendix F, Figure F-14g
Minnesota Pollution Control AgencyLong Prairie River Watershed TMDL Final Project Report
Total Capacity: DO TMDLs for Long Prairie River by Reach
T:\0147\51\Phase III Final Report\Appendix_F Figs F-14d-j_Jul04 Appendix F, Figure F-14g 4 of 7 Wenck Associates, Inc.
Reach 07010108-504: Eagle Creek to Turtle Creek
Unallocated Capacity27%
Eagle Creek Residual Point Source Loads
9%
LA for Eagle Creek13%
LA for other Nonpoint Sources46%
MOS for all Nonpoint Sources5%
4,649
Total Oxygen Demand (lbs/day)

Appendix F, Figure F-14h
Minnesota Pollution Control AgencyLong Prairie River Watershed TMDL Final Project Report
Total Capacity: DO TMDLs for Long Prairie River by Reach
T:\0147\51\Phase III Final Report\Appendix_F Figs F-14d-j_Jul04 Appendix F, Figure F-14h 5 of 7 Wenck Associates, Inc.
Reach 07010108-503: Turtle Creek To Moran Creek
Unallocated Capacity47%
LA for other Nonpoint Sources35%
MOS for all Nonpoint Sources4%
LA for Turtle Creek14%
2,587
Total Oxygen Demand (lbs/day)

Appendix F, Figure F-14i
Minnesota Pollution Control AgencyLong Prairie River Watershed TMDL Final Project Report
Total Capacity: DO TMDLs for Long Prairie River by Reach
T:\0147\51\Phase III Final Report\Appendix_F Figs F-14d-j_Jul04 Appendix F, Figure F-14i 6 of 7 Wenck Associates, Inc.
Reach 07010108-502: Moran Creek To Fish Trap Creek
LA for Moran Creek8%
LA for other Nonpoint Sources55%
MOS for all Nonpoint Sources5%
Unallocated Capacity32%
2,008
Total Oxygen Demand (lbs/day)

Appendix F, Figure F-14j
Minnesota Pollution Control AgencyLong Prairie River Watershed TMDL Final Project Report
Total Capacity: DO TMDLs for Long Prairie River by Reach
T:\0147\51\Phase III Final Report\Appendix_F Figs F-14d-j_Jul04 Appendix F, Figure F-14j 7 of 7 Wenck Associates, Inc.
Reach 07010108-501: Fish Trap Creek to Crow Wing River
LA for Fish Trap Creek12%
LA for other Nonpoint Sources60%
MOS for all Nonpoint Sources7%
Unallocated Capacity21%
2,106
Total Oxygen Demand (lbs/day)

������������� �������������������������������������������������������������
�
��
�
�
�
�!
""
#� $
"$
�
�
!
"
$$
!
�%&
�"
"�
"
$
!�
%
!"
"!
"&
"
�%
!
!
�!$
$"
!%
$&
"%
"�
$#
�&
$�
�$��
��
$%
$
�
"#
!#
"$
$�
�#
!�
& #
$!
!!
!&
���������'(������(������

� ���������
��������
� � � � ����
�
��
�
������� ���������������������������������������������������
�������������������� �������� ������������� ���� ���!��"��!������������#������� �
���� $�!�������%$������$

� ���������
��������
� � � � ����
�
��
�
������� ���������������������������������������������
������������������ ������� ��������������������������� ������� �� ���� �!� "����������� �� ���� �� ���������� �����#$����� �������%������%������&'"���&����(��������)%������&'"���&��(����*����)������������� ����*��������� � �� ����%����+� ����� ������,�����-.! ����'���� "�
���� /�,�������0/�����$/

������������� ��������������������������������������������������������������������
�
��
�
�
�
�
�
�
�
�
�
�
�
��
�
�
������� �������
���!������
������������
"���
#�����
������
�����
�������
�����$%
��� ���
&�������������%�'
�������������
��((�����)*������*
� ���������� ��� ������������
������

������
��������� �������������������������� ��� ����� ��� ��������
�������
��
�
�������� ����������������������� �����!"�#����������������$%&����������������'�����()��������
�
��
�
������
��������� ���������������������������� ��� �����*���*���� ���
������

�������
��
�
�������� �������������������������������������� ���� ���������
������
����������������� �!"��"����#�$��%&��!'"�(��#������� �����)*+�����$� ��������!�����,-�������$
�
��
������� � ���� ��� ������ �� ������� ��� �������������������
������������
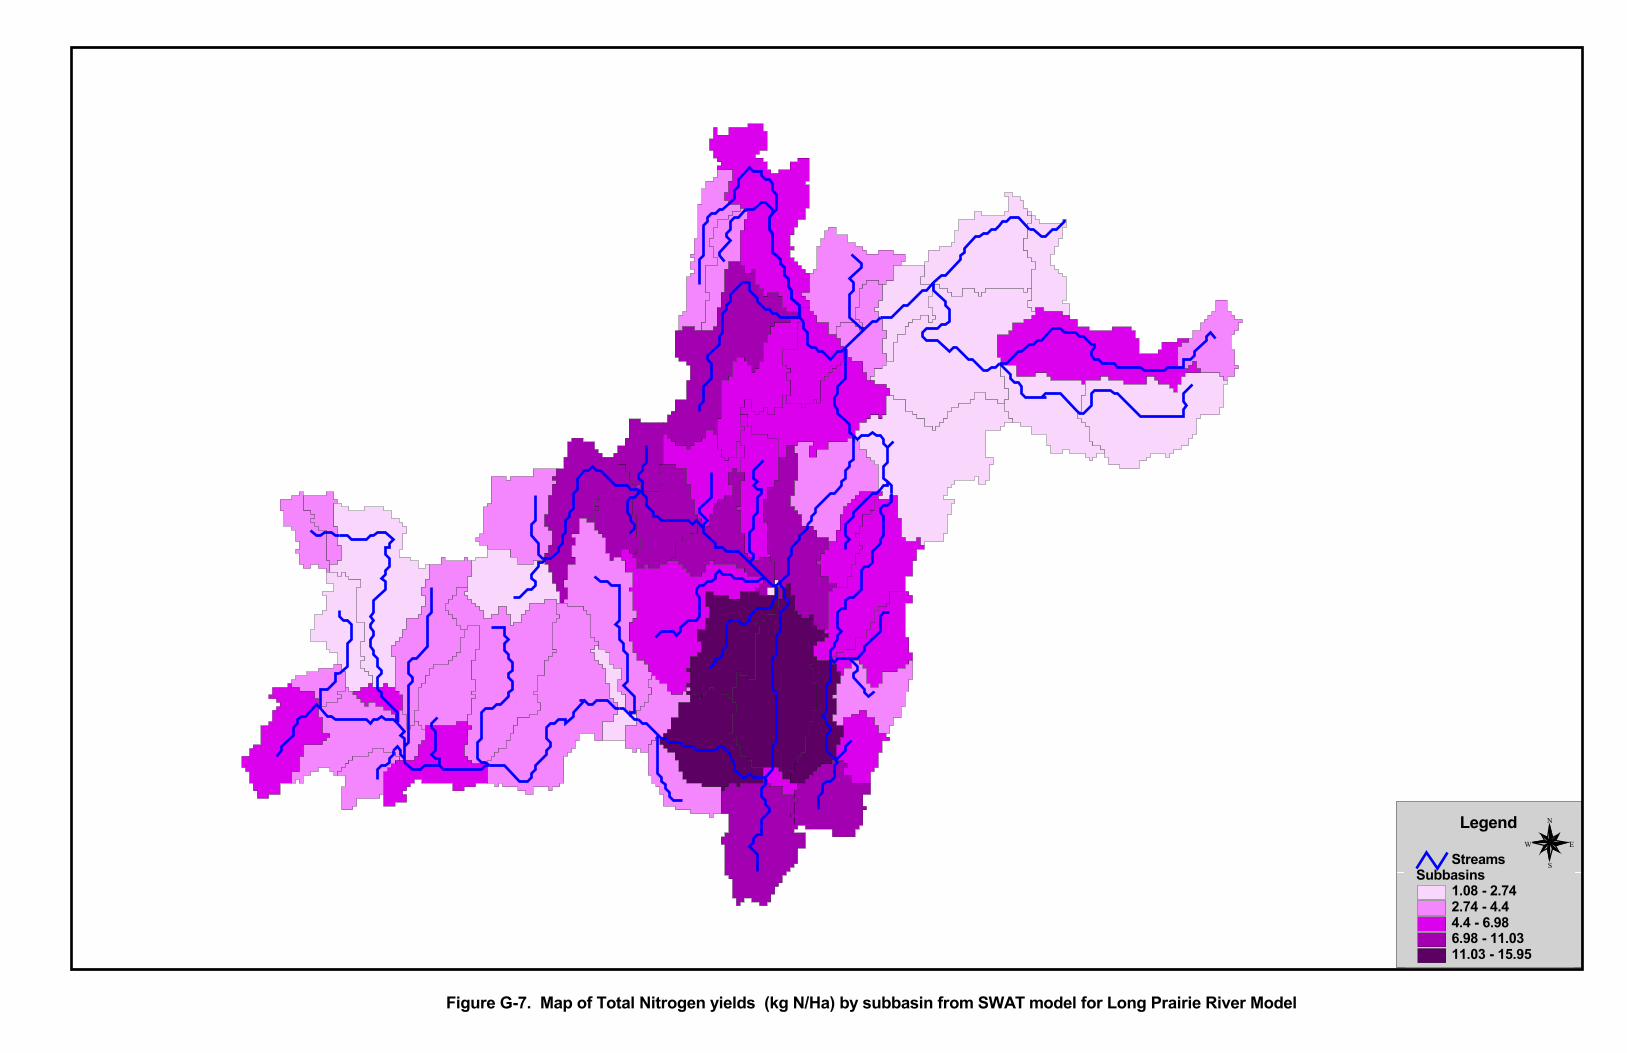
������������� ������������������������������������������������������� !������������"����#�������$�%��������
���������&'(���)*)*���****���+,(+,(���&&'-&&'-���&.,.
�������
"����� �
��
�

Appendix G, Figure G-8
Minnesota Pollution Control AgencyLong Prairie River Watershed TMDL Final Project Report
Comparison of simulated sediment loads per unit area from different land uses.
T:\0147\51\Phase III Rpt\Appendices\Appendix_G Fig 08_13.xls Sediment Bar Chart 1 of 1 Wenck Associates, Inc.
0.00
0.50
1.00
1.50
2.00
2.50
Cropland Forest Grassland
Land Use
Sedi
men
t Loa
ding
s (to
ns/h
a)
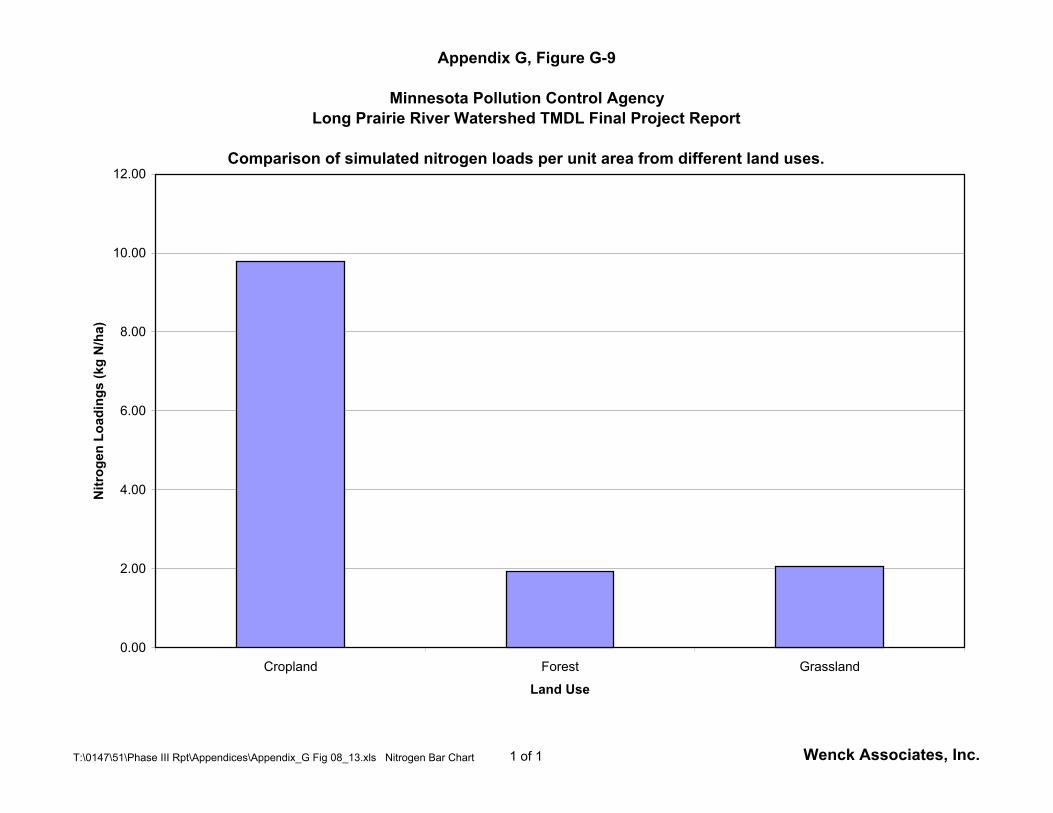
Appendix G, Figure G-9
Minnesota Pollution Control AgencyLong Prairie River Watershed TMDL Final Project Report
Comparison of simulated nitrogen loads per unit area from different land uses.
T:\0147\51\Phase III Rpt\Appendices\Appendix_G Fig 08_13.xls Nitrogen Bar Chart 1 of 1 Wenck Associates, Inc.
0.00
2.00
4.00
6.00
8.00
10.00
12.00
Cropland Forest Grassland
Land Use
Nitr
ogen
Loa
ding
s (k
g N
/ha)

Appendix G, Figure G-10
Minnesota Pollution Control AgencyLong Prairie River Watershed TMDL Final Project Report
Comparison of simulated phosphorus loads per unit area from different land uses.
T:\0147\51\Phase III Rpt\Appendices\Appendix_G Fig 08_13.xls Phosphorus Bar Chart 1 of 1 Wenck Associates, Inc.
0.00
0.20
0.40
0.60
0.80
1.00
1.20
1.40
Cropland Forest Grassland
Land Use
Phos
phor
us L
oadi
ngs
(kg
P/ha
)

Appendix G, Figure G-11
Minnesota Pollution Control AgencyLong Prairie River Watershed TMDL Final Project Report
Percentage of total sediment load contributed by each land use.
T:\0147\51\Phase III Rpt\Appendices\Appendix_G Fig 08_13.xls Sediment Pie Chart 1 of 1 Wenck Associates, Inc.
Cropland72%
Forest16%
Grassland11%
Other1%

Appendix G, Figure G-12
Minnesota Pollution Control AgencyLong Prairie River Watershed TMDL Final Project Report
Percentage of total nitrogen load contributed by each land use.
T:\0147\51\Phase III Rpt\Appendices\Appendix_G Fig 08_13.xls Nitrogen Pie Chart 1 of 1 Wenck Associates, Inc.
Forest10%
Grassland11%
Other1%
Cropland78%
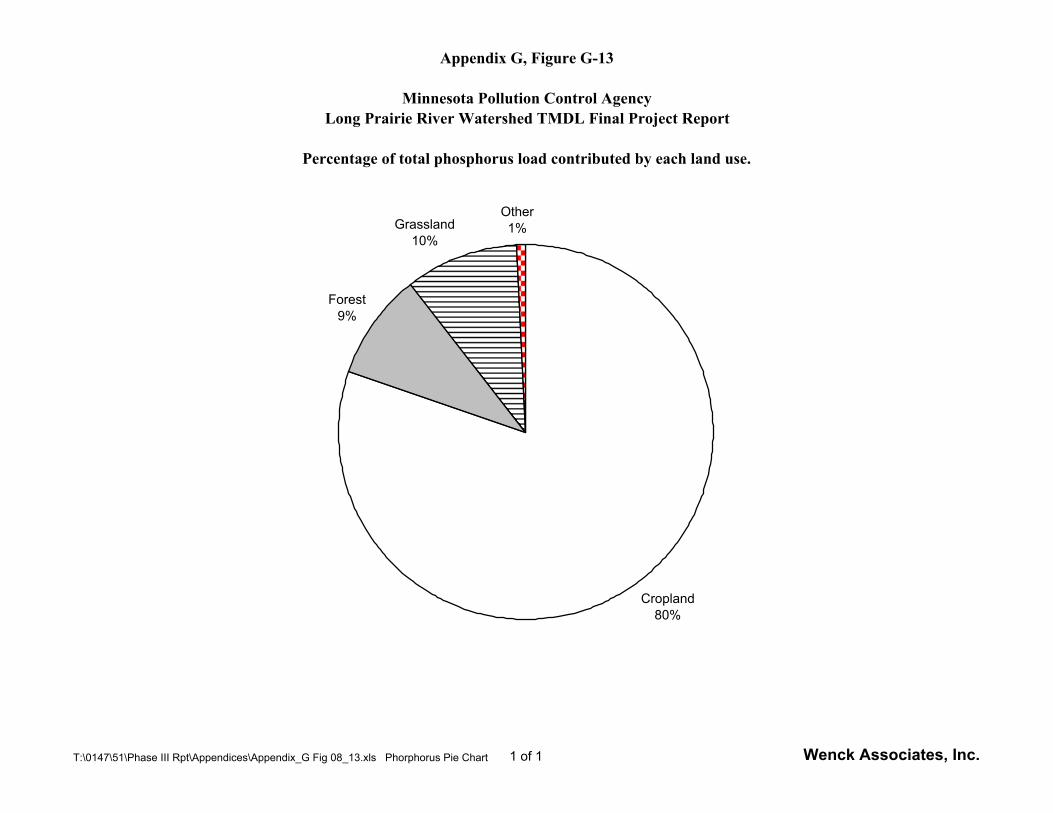
Appendix G, Figure G-13
Minnesota Pollution Control AgencyLong Prairie River Watershed TMDL Final Project Report
Percentage of total phosphorus load contributed by each land use.
T:\0147\51\Phase III Rpt\Appendices\Appendix_G Fig 08_13.xls Phorphorus Pie Chart 1 of 1 Wenck Associates, Inc.
Cropland80%
Forest9%
Grassland10%
Other1%