apmp.qm-k111 propane in nitrogen - kcdb.bipm.org · newly prepared psms against existing ones, and...
TRANSCRIPT

1
APMP.QM-K111 – Propane in nitrogen
Shinji Uehara1, Tomoe Nishino1, Dai Akima1, Tsai-Yin Lin2, Hsin-Wang Liu2, Chiung-Kun Huang2, Namgoo
Kang3, Hyun Kil Bae3, Jin Chun Woo3, Zhe Bi4, Zeyi Zhou4, Ratirat Sinweeruthai5, Arnuttachai Wongjuk5, Hou
Li6, Teo Beng Keat6, Liu Hui6, Thomas Wu6, Chua Hock Ann6, Damian Smeulders7, John Briton McCallum7,
Raymond Tendai Satumba7, Takuya Shimosaka8, Nobuhiro Matsumoto8, Haslina Abdul Kadir9, Mohamad Fauzi
Ahmad9, Noor Hidaya Abdul Nasir9
1 Chemicals Evaluation and Research Institute, Japan (CERI), 1600, Shimo-Takano, Sugito-machi,
Kitakatsushika-gun, Saitama 345-0043, Japan 2 Center For Measurement Standards/Industrial Technology Research Institute (CMS/ITRI), CMS/ITRI,
Rm.216, Bldg. 17, 2F, No.321, Sec.2, Kuang Fu Rd., Hsinchu, 30011, Taiwan, R.O.C 3 Korea Research Institute of Standards and Science (KRISS), Division of Metrology for Quality Life, P.O.Box
102, Yusong, Taejon, Republic of Korea
4National Institute of Metrology (NIM), Beijing Beisanhuan East road Nop.18, Beijing 100029, China 5National Institute of Metrology (Thailand) (NIMT), 3/4-5 Moo 3, Klong 5, Klong Luang, Pathumthani 12120,
Thailand 6National Metrology Centre, Agency for Science, Technology and Research (NMC, A*STAR) , Singapore#02-
27, TUV SUD PSB building, 1 Science Park Drive, Singapore 118221 7 National Measurement Institute, Australia (NMIA), 36 Bradfield road, Lindfield NSW 2070 Australia 8 National Metrology Institute of Japan (NMIJ), 1-1-1 Umezono, Tsukuba, Ibaraki, 305-8563, Japan 9 National Metrology Laboratory SIRIM Berhad (NML-SIRIM), LOT PT4803, Bandar Baru Salak
Tinggi,43900, Sepang, Selangor, Malaysia.
Field
Amount of substance
Subject
Comparison of propane in nitrogen (track A – core competences)
Table of contents
Field ........................................................................................................................................................ 1
Subject .................................................................................................................................................... 1
Table of contents ..................................................................................................................................... 1
1 Introduction ................................................................................................................................ 2
2 Design and organisation of the APMP key comparison ............................................................ 2
2.1 Participants ................................................................................................................................. 2 2.2 Measurement standards .............................................................................................................. 2 2.3 Measurement protocol ................................................................................................................ 3 2.4 Schedule ..................................................................................................................................... 3 2.5 Measurement equation ............................................................................................................... 3 2.6 Measurement methods ............................................................................................................... 5 2.7 Degrees of equivalence .............................................................................................................. 5
3 Results ........................................................................................................................................ 5
4 Supported CMC claims .............................................................................................................. 7
5 Discussion and conclusions ........................................................................................................ 7
References ............................................................................................................................................... 7
Coordinator ............................................................................................................................................. 7
Project reference ..................................................................................................................................... 7
Completion date ...................................................................................................................................... 7
Annex A : Measurement reports ............................................................................................................. 8

2
Measurement report CERI .................................................................................................................. 8 Measurement report CMS/ITRI ........................................................................................................ 12 Measurement report KRISS .............................................................................................................. 15 Measurement report NIM ................................................................................................................. 19 Measurement report NIMT ............................................................................................................... 24
Measurement report NMC A*STAR ................................................................................................ 27 Measurement report NMIA ............................................................................................................... 30 Measurement report NMIJ ................................................................................................................ 36 Measurement report NML SIRIM .................................................................................................... 40
1 Introduction
This APMP key comparison is one of a series of key comparisons in the gas analysis area assessing
core competences (track A key comparisons). Such competences include, among others, the
capabilities to prepare Primary Standard gas Mixtures (PSMs) [5], perform the necessary purity
analysis on the materials used in the gas mixture preparation, the verification of the composition of
newly prepared PSMs against existing ones, and the capability of calibrating a gas mixture.
For this key comparison, a binary mixture of propane in nitrogen has been chosen at an amount-of-
substance fraction level of 1000 µmol/mol [2]. The key comparison design follows that of the key
comparisons for gas mixture that are prepared gravimetrically [3].
KRISS and CERI participated in the key comparison, CCQM- K111 (1000 µmol/mol propane in
nitrogen). Therefore, the results of APMP.QM-K111 are related with CCQM-K111 through the
results of KRISS and CERI. CERI used the same calibration standards in CCQM-K111 and
APMP.QM-K111.
2 Design and organisation of the APMP key comparison
2.1 Participants
Table 1 lists the participants in this key comparison.
Table 1: List of participants
Acronym Country Institute
CMS/ITRI TW Center For Measurement Standards/Industrial Technology
Research Institute
KRISS KR Korea Research Institute of Standards and Science,
Deajeon, Republic of Korea
NIM CN National Institute of Metrology
NIMT TH National Institute of Metrology (Thailand)
NMC, A*STAR SG National Metrology Centre, Agency for Science, Technology
and Research, Singapore
NMIA AU National Measurement Institute, Australia
NMIJ JP National Metrology Institute of Japan
NML-SIRIM MY National Metrology Laboratory SIRIM Berhad
CERI JP Chemical Evaluation and Research Institute,
Saitama, Japan
2.2 Measurement standards
A set of mixtures were prepared gravimetrically by CERI. For the preparation, NMIJ-CRM was used
for high purity propane and special grade nitrogen was used from Takachiho Chemical industrial co.,
3
Ltd. The mixtures were verified against a set of CERI PSMs. The PSMs were used for the evaluation
of CCQM-K111 sample for CERI.
The filling pressure in the cylinders was approximately 10 MPa. Aluminium alloy cylinders from
Luxfer Australia of which volume were 9.6 dm3, were used. The mixture composition and its
associated uncertainty was calculated in accordance with ISO 6142 [4]. The amount-of-substance
fractions as obtained from gravimetry and purity verification of the parent gases were used as key
comparison reference values (KCRVs). Each cylinder had its own reference value.
The nominal amount-of-substance fraction of propane was 1000 µmol/mol.
2.3 Measurement protocol
The measurement protocol requested each laboratory to perform at least 3 measurements, with
independent calibrations. The replicates, leading to a measurement, were to be carried out under
repeatability conditions. The protocol informed the participants about the nominal amount-of-
substance fraction ranges. The laboratories were also requested to submit a summary of their
uncertainty evaluation used for estimating the uncertainty of their result.
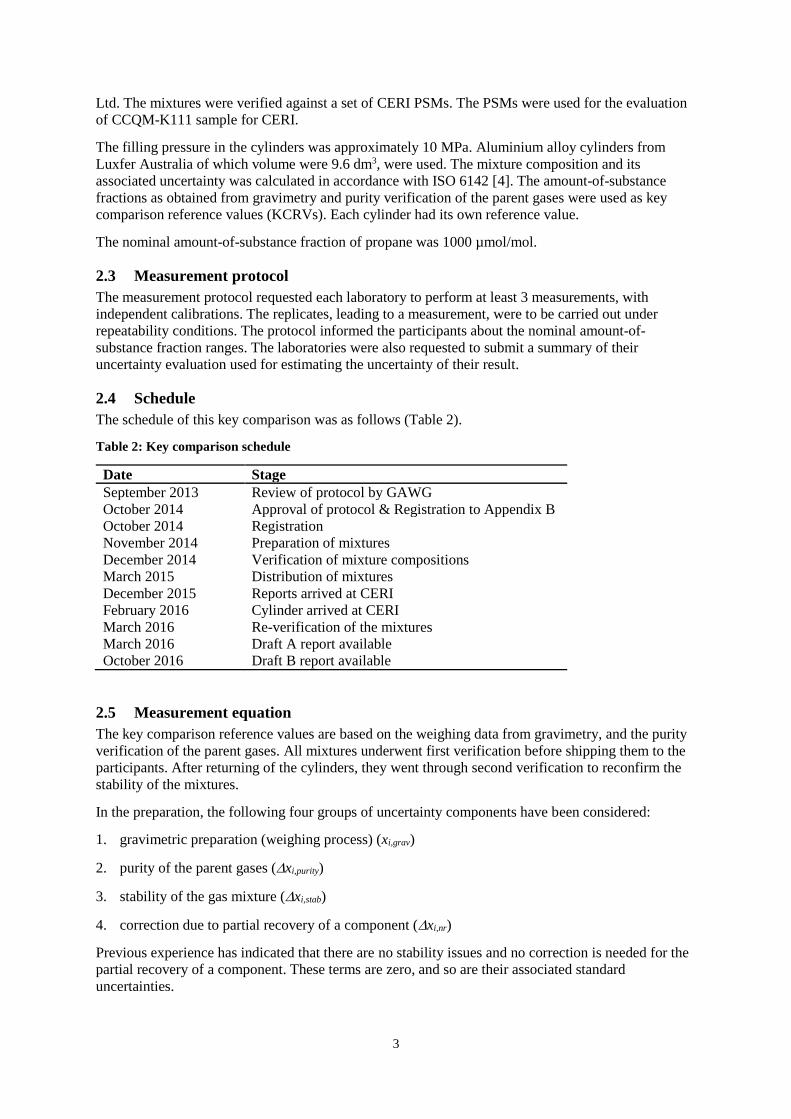
2.4 Schedule
The schedule of this key comparison was as follows (Table 2).
Table 2: Key comparison schedule
Date Stage
September 2013 Review of protocol by GAWG
October 2014 Approval of protocol & Registration to Appendix B
October 2014 Registration
November 2014 Preparation of mixtures
December 2014 Verification of mixture compositions
March 2015 Distribution of mixtures
December 2015 Reports arrived at CERI
February 2016 Cylinder arrived at CERI
March 2016 Re-verification of the mixtures
March 2016 Draft A report available
October 2016 Draft B report available
2.5 Measurement equation
The key comparison reference values are based on the weighing data from gravimetry, and the purity
verification of the parent gases. All mixtures underwent first verification before shipping them to the
participants. After returning of the cylinders, they went through second verification to reconfirm the
stability of the mixtures.
In the preparation, the following four groups of uncertainty components have been considered:
1. gravimetric preparation (weighing process) (xi,grav)
2. purity of the parent gases (xi,purity)
3. stability of the gas mixture (xi,stab)
4. correction due to partial recovery of a component (xi,nr)
Previous experience has indicated that there are no stability issues and no correction is needed for the
partial recovery of a component. These terms are zero, and so are their associated standard
uncertainties.
4
The amount-of-substance fraction, xi,prep, of a particular component in mixture i, as it appears during
use of the cylinder, can now be expressed as
,,,, purityigraviprepi xxx (1)
The equation for calculating the associated standard uncertainty reads as
.,
2
,
2
,
2
purityigraviprepi xuxuxu (2)
The validity of the mixtures has been demonstrated by verifying the composition as calculated from
the preparation data with that obtained from (analytical chemical) measurement. In order to have a
positive demonstration of the preparation data (including uncertainty, the following condition should
be met [3]
.2 2
,
2
,,, veriprepiveriprepi uuxx (3)
The factor 2 is a coverage factor (normal distribution, 95% level of confidence). The assumption must
be made that both preparation and verification are unbiased. Such bias has never been observed. The
uncertainty associated with the verification highly depends on the experimental design followed. In
this particular key comparison, an approach has been chosen which is consistent with CCQM-K3 [4]
and takes advantage of the work done in the gravimetry study CCQM-P41 [5].
The expression for the standard uncertainty of the key comparison reference value is
veriprepirefi xuxuxu ,
2
,
2
,
2 . (4)
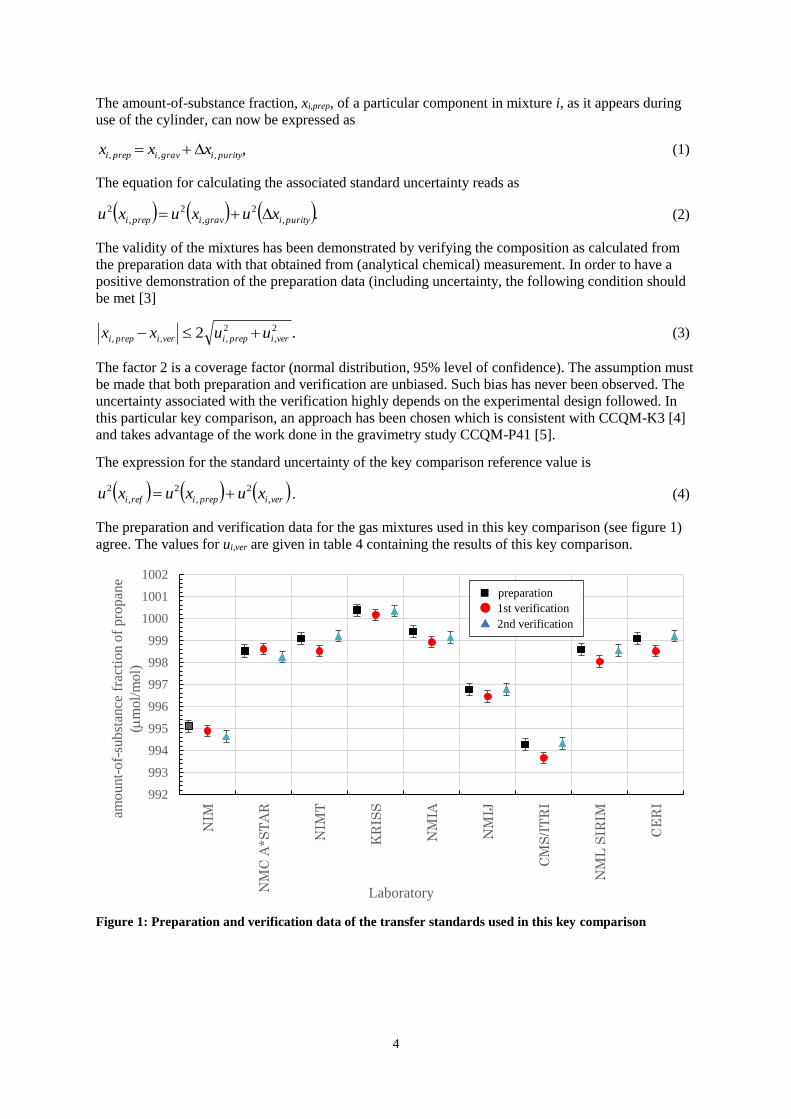
The preparation and verification data for the gas mixtures used in this key comparison (see figure 1)
agree. The values for ui,ver are given in table 4 containing the results of this key comparison.
Figure 1: Preparation and verification data of the transfer standards used in this key comparison
992
993
994
995
996
997
998
999
1000
1001
1002
NIM
NM
C A
*S
TA
R
NIM
T
KR
ISS
NM
IA
NM
IJ
CM
S/I
TR
I
NM
L S
IRIM
CE
RI
amo
un
t-of-
sub
stan
ce f
ract
ion
of
pro
pan
e
(mm
ol/
mol)
Laboratory
■ preparation
● 1st verification
▲ 2nd verification
5
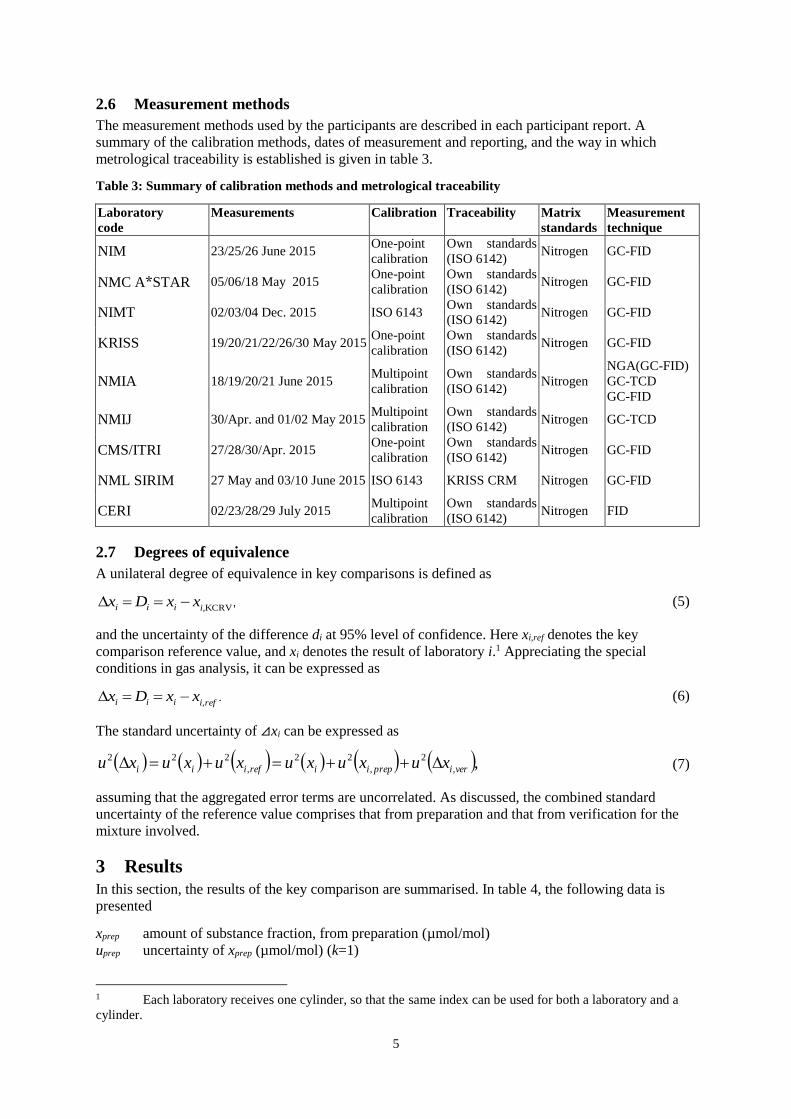
2.6 Measurement methods
The measurement methods used by the participants are described in each participant report. A
summary of the calibration methods, dates of measurement and reporting, and the way in which
metrological traceability is established is given in table 3.
Table 3: Summary of calibration methods and metrological traceability
Laboratory
code
Measurements Calibration Traceability Matrix
standards
Measurement
technique
NIM 23/25/26 June 2015 One-point
calibration
Own standards
(ISO 6142) Nitrogen GC-FID
NMC A*STAR 05/06/18 May 2015 One-point
calibration
Own standards
(ISO 6142) Nitrogen GC-FID
NIMT 02/03/04 Dec. 2015 ISO 6143 Own standards
(ISO 6142) Nitrogen GC-FID
KRISS 19/20/21/22/26/30 May 2015 One-point
calibration
Own standards
(ISO 6142) Nitrogen GC-FID
NMIA 18/19/20/21 June 2015 Multipoint
calibration
Own standards
(ISO 6142) Nitrogen
NGA(GC-FID)
GC-TCD
GC-FID
NMIJ 30/Apr. and 01/02 May 2015 Multipoint
calibration
Own standards
(ISO 6142) Nitrogen GC-TCD
CMS/ITRI 27/28/30/Apr. 2015 One-point
calibration
Own standards
(ISO 6142) Nitrogen GC-FID
NML SIRIM 27 May and 03/10 June 2015 ISO 6143 KRISS CRM Nitrogen GC-FID
CERI 02/23/28/29 July 2015 Multipoint
calibration
Own standards
(ISO 6142) Nitrogen FID
2.7 Degrees of equivalence
A unilateral degree of equivalence in key comparisons is defined as
,KCRVi,iii xxDx (5)
and the uncertainty of the difference di at 95% level of confidence. Here xi,ref denotes the key
comparison reference value, and xi denotes the result of laboratory i.1 Appreciating the special
conditions in gas analysis, it can be expressed as
.i,refiii xxDx (6)
The standard uncertainty of ⊿xi can be expressed as
,,
2
,
22
,
222
veriprepiirefiii xuxuxuxuxuxu (7)
assuming that the aggregated error terms are uncorrelated. As discussed, the combined standard
uncertainty of the reference value comprises that from preparation and that from verification for the
mixture involved.
3 Results
In this section, the results of the key comparison are summarised. In table 4, the following data is
presented
xprep amount of substance fraction, from preparation (µmol/mol)
uprep uncertainty of xprep (µmol/mol) (k=1)
1 Each laboratory receives one cylinder, so that the same index can be used for both a laboratory and a
cylinder.

6
uver uncertainty from verification (µmol/mol) (k=1)
uref uncertainty of reference value (µmol/mol) (k=1)
xlab result of laboratory (µmol/mol)
Ulab stated uncertainty of laboratory, at 95 % level of confidence (µmol/mol)
klab stated coverage factor
x difference between laboratory result and reference value (µmol/mol)
k assigned coverage factor for degree of equivalence
U(x) Expanded uncertainty of difference x, at 95 % level of confidence2 (µmol/mol)
Table 4: Results of APMP.QM-K111
Laboratory Cylinder xprep
/μmol/mol
uprep
/μmol/mol
uver
/μmol/mol
uref
/μmol/mol
xlab
/μmol/mol
Ulab
/μmol/mol klab Δx k
U(Δx)
/μmol/mol
NIM CPB20810 995.10 0.28 0.26 0.38 993.81 0.99 2 -1.3 2 1.3
NMC A*STAR CPB21192 998.52 0.28 0.26 0.38 1000.6 4.5 2 2.1 2 4.6
NIMT CPB25989 999.09 0.28 0.26 0.38 1001.0 3.5 2 1.9 2 3.6
KRISS CPB25963 1000.38 0.28 0.26 0.38 1001.1 1.0 2 0.7 2 1.3
NMIA CPB25966 999.41 0.28 0.26 0.38 1000.0 1.5 2 0.6 2 1.7
NMIJ CPB25981 996.77 0.28 0.26 0.38 996.5 1.1 2 -0.3 2 1.3
CMS/ITRI CPB25984 994.27 0.28 0.26 0.38 994.9 2.0 2 0.6 2 2.1
NML SIRIM CPB25987 998.59 0.28 0.26 0.38 960.41 1.5 2 -38.2 2 1.7
CERI CPB25989 999.09 0.28 0.26 0.38 999.84 0.76 2 0.8 2 1.1
In figure 2, the degrees of equivalence for all participating laboratories are given relative to the
gravimetric value. The uncertainties are, as required by the MRA [6], given as 95% confidence
intervals. For the evaluation of uncertainty of the degrees of equivalence, the normal distribution has
been assumed, and a coverage factor k = 2 was used. For obtaining the standard uncertainty of the
laboratory results, the expanded uncertainty (stated at a confidence level of 95%) from the laboratory
was divided by the reported coverage factor.
Figure 2: Degrees of equivalence
2 As defined in the MRA [6], a degree of equivalence is given by x and U(x).
-40
-35
-30
-25
-20
-15
-10
-5
0
5
10
NIM
NM
C A
*S
TA
R
NIM
T
KR
ISS
NM
IA
NM
IJ
CM
S/I
TR
I
NM
L S
IRIM
CE
RI
dif
fere
nce(
μm
ol/
mol)
Laboratory

7
4 Supported CMC claims
The results of this key comparison can be used to support CMC claims as described in the final report
of CCQM-K111 [1].
5 Discussion and conclusions
The results in this Track A key comparison on 1000 µmol/mol propane in nitrogen are generally good.
All but one result are within ± 0.25 % of the KCRV.
References
[1] Van der Veen A.M.H., Van der Hout J.W., Ziel P.R., Oudwater R.J., Fioravante A.L.,
Augusto C.R., Brum M.C., Uehara S., Akima D., Bae H.K., Kang N., Woo J.C., Liaskos C.E.,
Roderick G.C., Brewer P.H., Brown A.S., Bartlett S., Downey M.L., Konopelko L.A.,
Kolobova A.V., Pankov A.A., Orshanskaya A.A., Efremova O.V., “International Comparison
CCQM-K111 – Propane in nitrogen”, Final Report, Metrologia Technical Supplement, to be
published
[2] Alink A., “The first key comparison on Primary Standard gas Mixtures”, Metrologia 37
(2000), pp. 35-49
[3] International Organization for Standardization, ISO 6142:2001 Gas analysis - Preparation of
calibration gas mixtures - Gravimetric methods, 2nd edition
[4] Alink A., Van der Veen A.M.H., “Uncertainty calculations for the preparation of primary gas
mixtures. 1. Gravimetry”, Metrologia 37 (2000), pp 641-650
[5] Van der Veen A.M.H, De Leer E.W.B., Perrochet J.-F., Wang Lin Zhen, Heine H.-J., Knopf
D., Richter W., Barbe J., Marschal A., Vargha G., Deák E., Takahashi C., Kim J.S., Kim
Y.D., Kim B.M., Kustikov Y.A., Khatskevitch E.A., Pankratov V.V., Popova T.A.,
Konopelko L., Musil S., Holland P., Milton M.J.T., Miller W.R., Guenther F.R., International
Comparison CCQM-K3, Final Report, 2000
[6] Van der Veen A.M.H., Brinkmann F.N.C., Arnautovic M., Besley L., Heine H.-J., Lopez
Esteban T., Sega M., Kato K., Kim J.S., Perez Castorena A., Rakowska A., Milton M.J.T.,
Guenther F.R., Francy R., Dlugokencky E., “International comparison CCQM-P41
Greenhouse gases. 2. Direct comparison of primary standard gas mixtures”, Metrologia 44
(2007), Techn. Suppl. 08003
[7] CIPM, “Mutual recognition of national measurement standards and of calibration and
measurement certificates issued by national metrology institutes”, Sèvres (F), October 1999
Coordinator
CERI
Gas Standards area, Chemical Standards Department
Shinji UEHARA
1600 Shimotakano, Sugito-machi, Kitakatsushika-gun, Saitama 345-0043, Japan
Phone +81-480-37-2601
E-mail [email protected]
Project reference
APMP.QM-K111
Completion date
April 2017

8
Annex A : Measurement reports
Measurement report CERI
Laboratory name: Chemicals Evaluation and Research Institute, Japan (CERI)
Cylinder number: CPB25989
Measurement #1
Component Date
(dd/mm/yy)
Result
(μmol/mol)
Standard deviation
(% relative)
number of replicates
Propane 02/07/2015 1000.15 0.0291 4
Measurement #2
Component Date
(dd/mm/yy)
Result
(μmol/mol)
Standard deviation
(% relative)
number of replicates
Propane 23/07/2015 999.78 0.0197 4
Measurement #3
Component Date
(dd/mm/yy)
Result
(μmol/mol)
Standard deviation
(% relative)
number of replicates
Propane 28/07/2015 999.76 0.0074 4
Measurement #4
Component Date
(dd/mm/yy)
Result
(μmol/mol)
Standard deviation
(% relative)
number of replicates
Propane 29/07/2015 999.67 0.0096 4
Results
Component Date
(dd/mm/yy)
Result
(μmol/mol)
Expanded Uncertainty
(μmol/mol)
Coverage factor
Propane 999.84 0.76 2
9
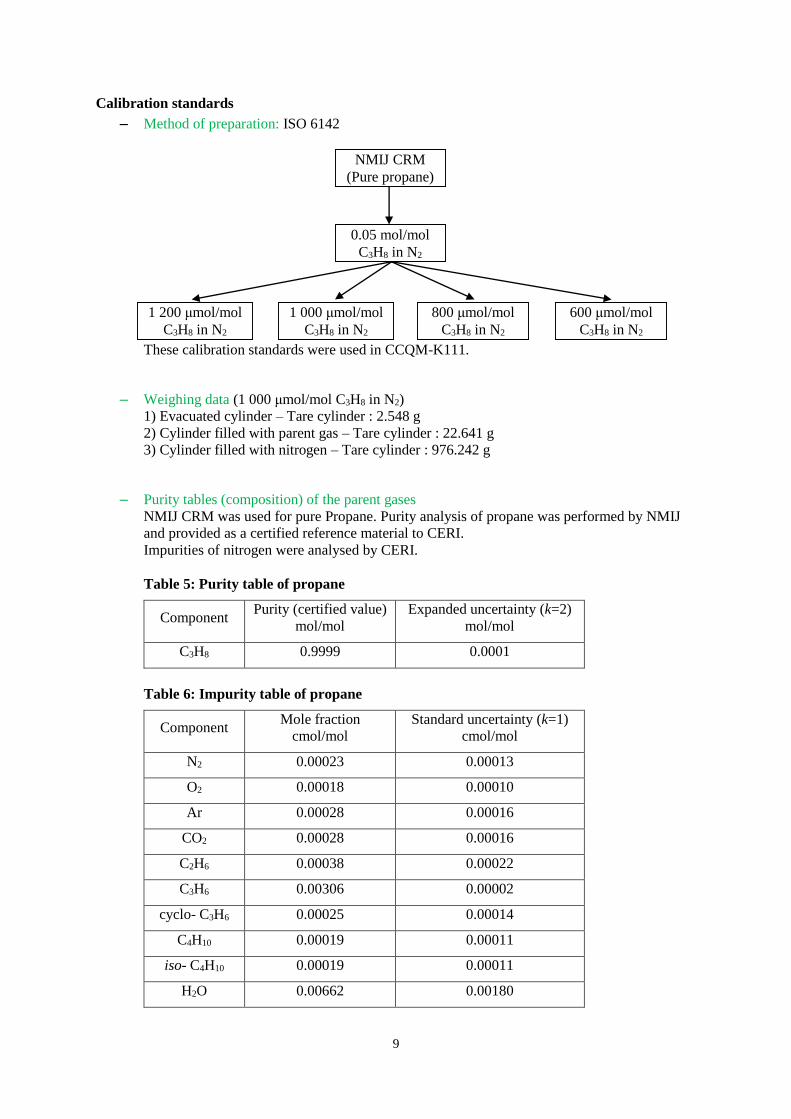
Calibration standards
‒ Method of preparation: ISO 6142
These calibration standards were used in CCQM-K111.
‒ Weighing data (1 000 μmol/mol C3H8 in N2)
1) Evacuated cylinder – Tare cylinder : 2.548 g
2) Cylinder filled with parent gas – Tare cylinder : 22.641 g
3) Cylinder filled with nitrogen – Tare cylinder : 976.242 g
‒ Purity tables (composition) of the parent gases
NMIJ CRM was used for pure Propane. Purity analysis of propane was performed by NMIJ
and provided as a certified reference material to CERI.
Impurities of nitrogen were analysed by CERI.
Table 5: Purity table of propane
Component Purity (certified value)
mol/mol
Expanded uncertainty (k=2)
mol/mol
C3H8 0.9999 0.0001
Table 6: Impurity table of propane
Component Mole fraction
cmol/mol
Standard uncertainty (k=1)
cmol/mol
N2 0.00023 0.00013
O2 0.00018 0.00010
Ar 0.00028 0.00016
CO2 0.00028 0.00016
C2H6 0.00038 0.00022
C3H6 0.00306 0.00002
cyclo- C3H6 0.00025 0.00014
C4H10 0.00019 0.00011
iso- C4H10 0.00019 0.00011
H2O 0.00662 0.00180
NMIJ CRM
(Pure propane)
0.05 mol/mol
C3H8 in N2
1 200 μmol/mol
C3H8 in N2
1 000 μmol/mol
C3H8 in N2
800 μmol/mol
C3H8 in N2
600 μmol/mol
C3H8 in N2

10
Table 7: Purity table of nitrogen
Component Analytical
value
μmol/mol
Distribution Mole
fraction
μmol/mol
Uncertainty
μmol/mol
(k=1)
Verification
measures
O2 ≤ 0.1 Rectangular 0.05 0.02887 GC-MS
Ar ≤ 1 Rectangular 0.5 0.2887 GC-MS
CO ≤ 0.01 Rectangular 0.005 0.002887 GC-FID with
methanizer
CO2 ≤ 0.01 Rectangular 0.005 0.002887 GC-FID with
methanizer
Total hydro
carbon
(THC)
≤ 0.01 Rectangular 0.005 0.002887 GC-FID
SO2 ≤ 0.005 Rectangular 0.0025 0.001443 Chemiluminescent
gas analyzer
NOx ≤ 0.005 Rectangular 0.0025 0.001443 Pulsed fluorescence gas analyzer
N2 - - 999 999.43 0.2902 -
Each mole fraction of impurity in nitrogen is adequately low. Therefore, the average molar
mass of dilution gas wasn’t affected from the impurities.
Instrumentation
Flame ionization detector, Rosemount Analytical Inc. Model 400A
Calibration method and value assignment
The instrument was calibrated using four gravimetrically prepared PRMs ranging in concentration
from 1 200 μmol/mol to 600 μmol/mol. Analytical scheme was, Std. A – Std. B – CCQM Sample –
Std. C – Std. D. This scheme was repeated 4-times in a day. These measurements were carried out for
4-days.
Each calibration curve was linear given by :
y = a1xs + b1
where,
y: CCQM sample concentration
n: Gas standards number
xS: Indicated value of sample
xi: Indicated value of standard material i
yi: Concentration of standard material i
)xx(S
xySa 1
n
xayb ii
1
1
n
xxxxS i
i
22
n
yxyxxyS ii
ii
11
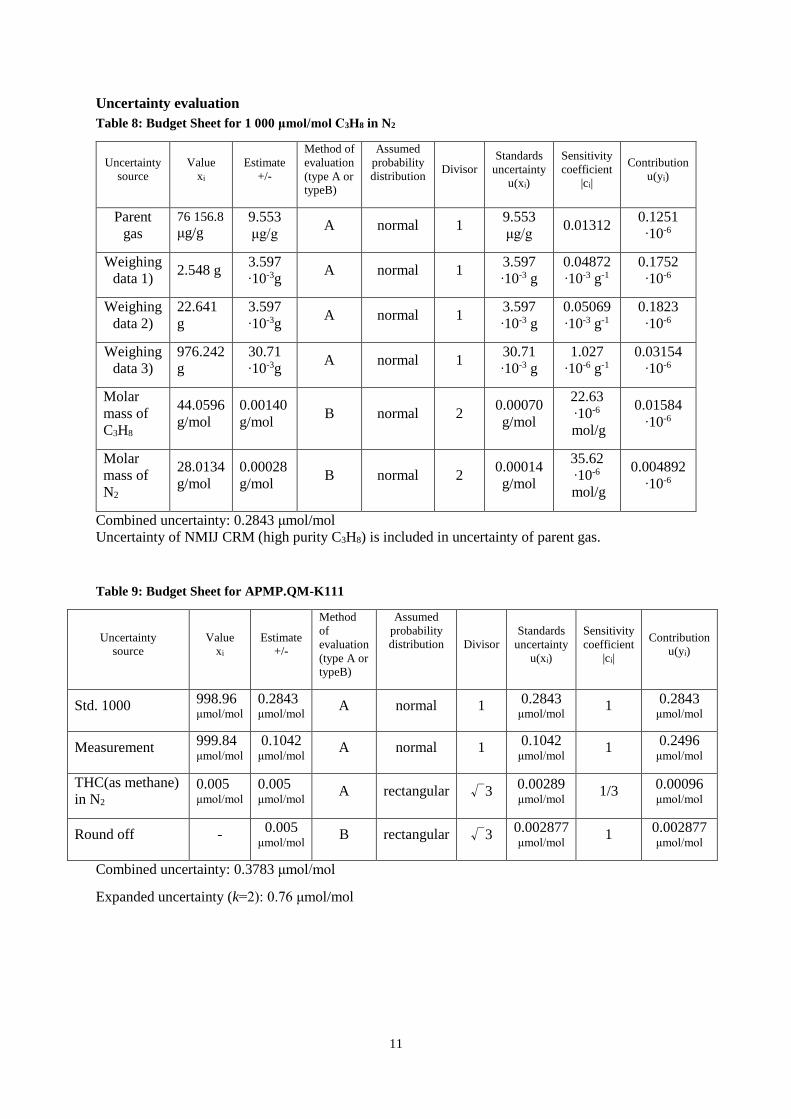
Uncertainty evaluation
Table 8: Budget Sheet for 1 000 μmol/mol C3H8 in N2
Uncertainty
source
Value
xi
Estimate
+/-
Method of
evaluation
(type A or typeB)
Assumed
probability
distribution Divisor
Standards
uncertainty
u(xi)
Sensitivity
coefficient
|ci|
Contribution
u(yi)
Parent
gas
76 156.8 μg/g
9.553
μg/g A normal 1
9.553
μg/g 0.01312
0.1251
∙10-6
Weighing
data 1) 2.548 g
3.597
∙10-3g A normal 1
3.597
∙10-3 g
0.04872
∙10-3 g-1
0.1752
∙10-6
Weighing
data 2)
22.641
g
3.597
∙10-3g A normal 1
3.597
∙10-3 g
0.05069
∙10-3 g-1
0.1823
∙10-6
Weighing
data 3)
976.242
g
30.71
∙10-3g A normal 1
30.71
∙10-3 g
1.027
∙10-6 g-1
0.03154
∙10-6
Molar
mass of
C3H8
44.0596
g/mol
0.00140
g/mol B normal 2
0.00070
g/mol
22.63
∙10-6
mol/g
0.01584
∙10-6
Molar
mass of
N2
28.0134
g/mol
0.00028
g/mol B normal 2
0.00014
g/mol
35.62
∙10-6
mol/g
0.004892
∙10-6
Combined uncertainty: 0.2843 μmol/mol
Uncertainty of NMIJ CRM (high purity C3H8) is included in uncertainty of parent gas.
Table 9: Budget Sheet for APMP.QM-K111
Uncertainty source
Value xi
Estimate +/-
Method
of
evaluation
(type A or typeB)
Assumed
probability distribution Divisor
Standards
uncertainty
u(xi)
Sensitivity
coefficient
|ci|
Contribution u(yi)
Std. 1000 998.96 μmol/mol
0.2843 μmol/mol
A normal 1 0.2843
μmol/mol 1
0.2843
μmol/mol
Measurement 999.84 μmol/mol
0.1042 μmol/mol
A normal 1 0.1042
μmol/mol 1
0.2496 μmol/mol
THC(as methane)
in N2 0.005 μmol/mol
0.005 μmol/mol
A rectangular √3 0.00289
μmol/mol 1/3
0.00096 μmol/mol
Round off - 0.005
μmol/mol B rectangular √3
0.002877 μmol/mol
1 0.002877 μmol/mol
Combined uncertainty: 0.3783 μmol/mol
Expanded uncertainty (k=2): 0.76 μmol/mol
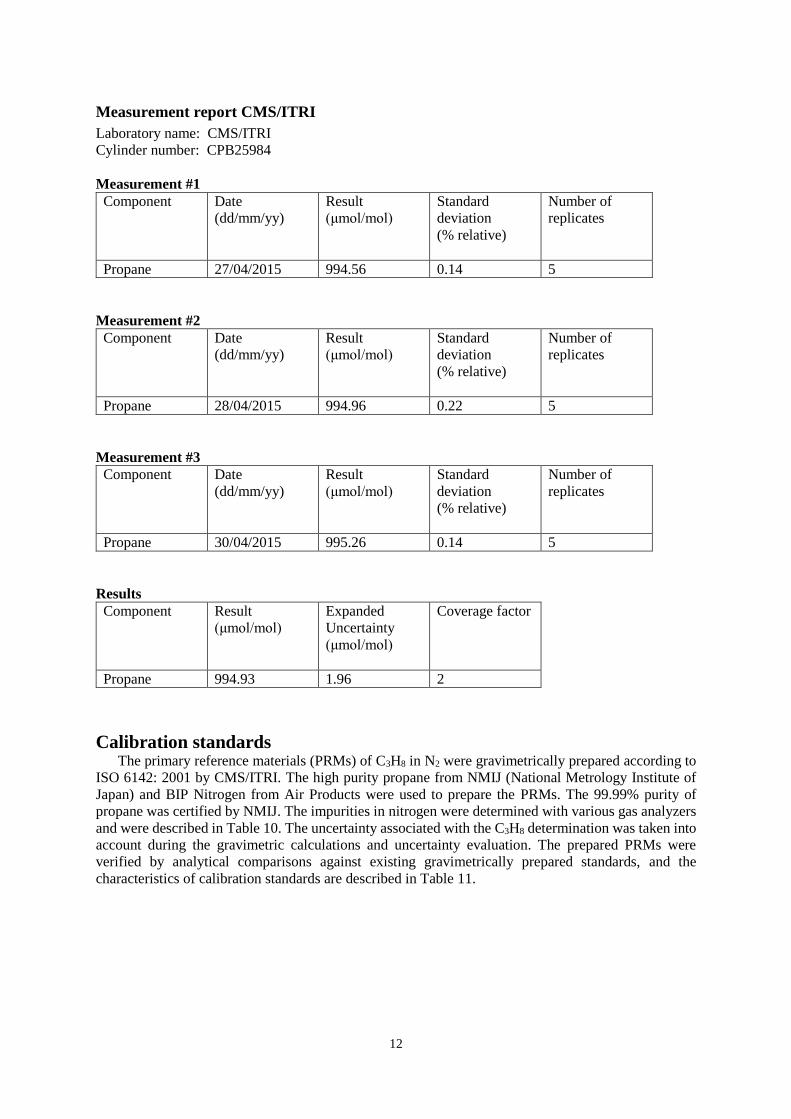
12
Measurement report CMS/ITRI
Laboratory name: CMS/ITRI
Cylinder number: CPB25984
Measurement #1
Component Date
(dd/mm/yy)
Result
(μmol/mol)
Standard
deviation
(% relative)
Number of
replicates
Propane 27/04/2015 994.56 0.14 5
Measurement #2
Component Date
(dd/mm/yy)
Result
(μmol/mol)
Standard
deviation
(% relative)
Number of
replicates
Propane 28/04/2015 994.96 0.22 5
Measurement #3
Component Date
(dd/mm/yy)
Result
(μmol/mol)
Standard
deviation
(% relative)
Number of
replicates
Propane 30/04/2015 995.26 0.14 5
Results
Component Result
(μmol/mol)
Expanded
Uncertainty
(μmol/mol)
Coverage factor
Propane 994.93 1.96 2
Calibration standards The primary reference materials (PRMs) of C3H8 in N2 were gravimetrically prepared according to
ISO 6142: 2001 by CMS/ITRI. The high purity propane from NMIJ (National Metrology Institute of
Japan) and BIP Nitrogen from Air Products were used to prepare the PRMs. The 99.99% purity of
propane was certified by NMIJ. The impurities in nitrogen were determined with various gas analyzers
and were described in Table 10. The uncertainty associated with the C3H8 determination was taken into
account during the gravimetric calculations and uncertainty evaluation. The prepared PRMs were
verified by analytical comparisons against existing gravimetrically prepared standards, and the
characteristics of calibration standards are described in Table 11.

13
Table 10 : Purity table for nitrogen
Component Mole fraction
(μmol/mol)
Standard uncertainty
(μmol/mol)
Method
O2 0.005 0.0029 Trace oxygen analyzer
CO 0.005 0.0029 GC-FID
CO2 0.025 0.015 GC-FID
CH4 0.0025 0.0015 GC-FID
C3H8 0.025 0.015 GC-FID
SO2 0.025 0.015 GC-MS
NO 0.005 0.0029 NOx analyzer
N2 999999.9075 0.026 -
Table 11 : Propane concentration of primary reference materials (PRMs)
Instrumentation A GC specifically set up for C3H8 in N2 analysis was described in Table 12.
Table 12 : Analytical conditions
Body Agilent GC-7890A
Software for data collection Agilent ChemStation
Column HP-PLOT/Q column (30 m × 0.53 mm, 40.0 mm)
Oven temp. 160°C isothermal
Detector FID (Flame gases flows: air = 400 ml/min, H2 = 40
ml/min)
Detector temp. 250°C
Carrier gas He: 2 ml/min
Analytical time for one injection 6.5 min
Calibration method and value assignment
GC-FID was used to determine C3H8 concentration in the sample cylinder. Five standards were used
to construct a calibration curve for the preliminary evaluation of C3H8 concentration in sample cylinder
CPB25984. After that, standard with concentration close to that of the sample cylinder was chosen for
single-point calibration to determine the concentration of C3H8 in sample cylinder. The sample cylinder
was analyzed with a reference cylinder in the following order.
Reference – Sample – Reference – Sample – Reference – Sample – Reference – Sample – Reference –
Sample – Reference
The mathematical model shown below was used to calculate the concentration of C3H8 in sample
cylinder:
1,,
5
1
3
1 2;
5;;
3
isis
ii
i
i
isiii
i
RR
Rr
r
rCrC
C
C
C =the reported concentration, CPB25984
Ci = the ith measured concentration of sample, CPB25984
Cs = concentration of standard, CAL013019
Cylinder number Assigned value
(μmol/mol)
Expanded uncertainty
(μmol/mol) (k=2)
5603591 500.15 0.58
D247796 699.88 0.49
CAL013019 999.76 0.78
CAL013006 1500.56 0.71
FF19460 1999.80 0.90

14
ir = the average ratio of GC-FID response of sample to standard
ri = the ith calculated ratio of response of sample to standard
Ri = the ith response of GC-FID for sample, CPB25984
Rs,i = the ith response of GC-FID for reference standard, CAL013019
Uncertainty evaluation
The final uncertainty was estimated by combining two uncertainty components (i.e., PRM and
analysis).
- total standard uncertainty of C3H8 mole fraction in PRMs (including uncertainty of weighing of
parent gases and pre-mixture, uncertainty in the purity of the parent gas and balance gas);
- standard uncertainty of the measurement result of C3H8 mole fraction in cylinder number
CPB25984 (including uncertainties of repeatability and reproducibility)
The equations described below were used to evaluate the uncertainty for C3H8 measurement.
1,,
5
1
3
1 2;
5;;
3
isis
ii
i
i
isiii
i
RR
Rr
r
rCrC
C
C
issii ruCCurCu 2222
2
3
3
1
2
i
i
p
ss
)5
(
222
22 p
ssi
SCCurCu
ir = the average of calculated mean ratios, ir , for the five sets of measurements
sp = pooled standard deviation of the five sets of measurements
si = standard deviation of each set of measurements The uncertainty budget for C3H8 measurement in the cylinder number CPB25984 is shown in Table
13.
Table 13 : Uncertainty budget for C3H8 measurement
Uncertainty source
Xi
Estimate
xi
Evaluation
type
Distribution Standard
uncertainty
u(xi)
Sensitivity
coefficient
ci
Contribution
to standard
uncertainty
ui(y)
Repeatability and
reproducibility of ratio of
signal, r
ir ;0.9952 A Normal 8.96×10⁻⁴ 999.76×10⁻⁶ 8.95×10⁻⁷
Uncertainty of calibration
standard
Cs ;
999.76×10⁻⁶ A Normal 0.39×10⁻⁶ 0.9952 3.88×10⁻⁷
Combined Uncertainty, (μmol/mol) 0.98
Expanded Uncertainty, (k=2) , (μmol/mol) 1.96
Expanded Uncertainty, (k=2) , (% relative) 0.19
15
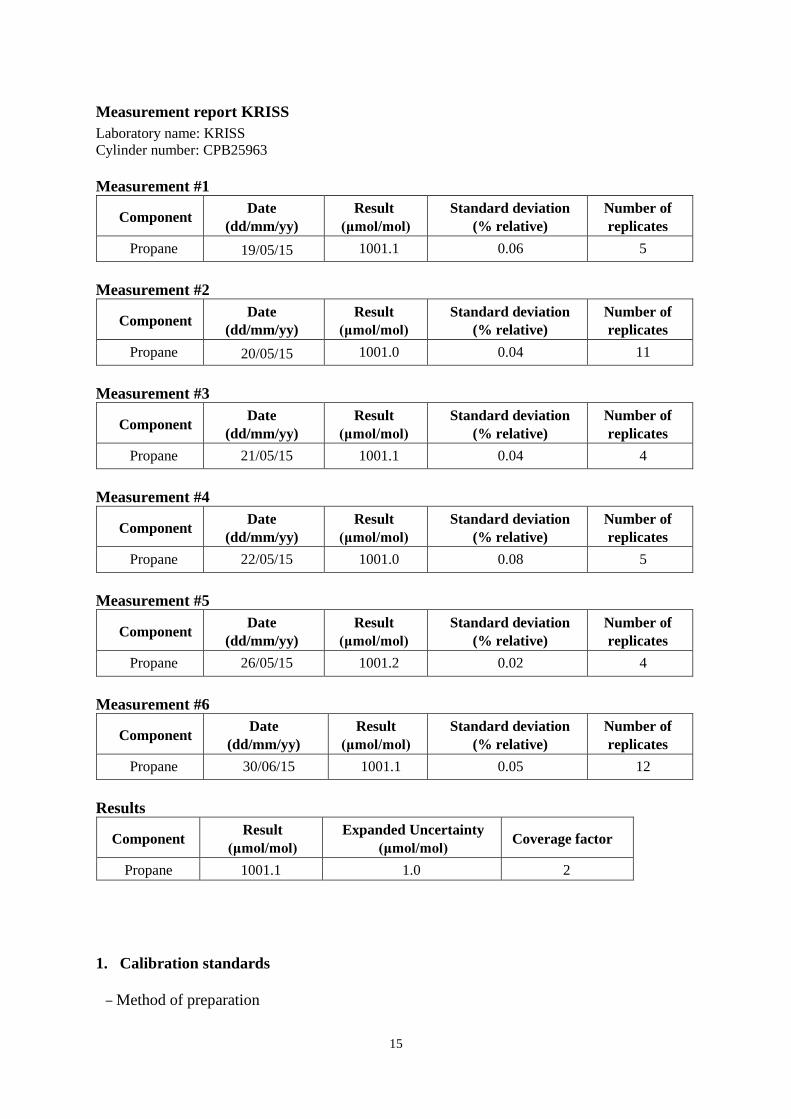
Measurement report KRISS
Laboratory name: KRISS
Cylinder number: CPB25963
Measurement #1
Component Date
(dd/mm/yy)
Result
(μmol/mol)
Standard deviation
(% relative)
Number of
replicates
Propane 19/05/15 1001.1 0.06 5
Measurement #2
Component Date
(dd/mm/yy)
Result
(μmol/mol)
Standard deviation
(% relative)
Number of
replicates
Propane 20/05/15 1001.0 0.04 11
Measurement #3
Component Date
(dd/mm/yy)
Result
(μmol/mol)
Standard deviation
(% relative)
Number of
replicates
Propane 21/05/15 1001.1 0.04 4
Measurement #4
Component Date
(dd/mm/yy)
Result
(μmol/mol)
Standard deviation
(% relative)
Number of
replicates
Propane 22/05/15 1001.0 0.08 5
Measurement #5
Component Date
(dd/mm/yy)
Result
(μmol/mol)
Standard deviation
(% relative)
Number of
replicates
Propane 26/05/15 1001.2 0.02 4
Measurement #6
Component Date
(dd/mm/yy)
Result
(μmol/mol)
Standard deviation
(% relative)
Number of
replicates
Propane 30/06/15 1001.1 0.05 12
Results
Component Result
(μmol/mol)
Expanded Uncertainty
(μmol/mol) Coverage factor
Propane 1001.1 1.0 2
1. Calibration standards
‒ Method of preparation

16
Several cylinders of primary standard mixtures (PSM) for propane in nitrogen were
prepared by KRISS using a gravimetric technique based on the KRISS Standard
Procedure (R-112-001-2012).
‒ Weighing data
A 2-step dilution process was adopted. For example, the weighing data of a KRISS PSM
(D233583) was summarized as follows: Parent gases of nitrogen (616.446 g) and propane
(29.847 g) were mixed into the 1st diluted gas mixture (KRISS PSM L1268). The 1st
diluted gas mixture (38.125 g) and additional nitrogen (1078.0 g) were mixed into the 2nd diluted gas mixture (KRISS PSM D233583).
‒ Purity tables (composition) of the parent gases
Table 14 : Purity table of high-purity nitrogen gas
Serial No. Impurity Component Mole Fraction (μmol/mol)
1
2
3
4
5
6
H2
O2+Ar
CO
CO2
CH4
H2O
<0.07
9.18
0.01
0.16
<0.05
1.2
Purity N2 999 989
Table 15 : Purity table of high-purity propane gas
Serial No. Impurity Component Mole Fraction (μmol/mol)
1
2
3
4
5
6
7
8
9
10
11
12
13
14
15
CH4
C2H6
C2H4
C2H2
C3H6
i-C4H10
n-C4H10
C4H8
C5H12
N2
CO2
CO
H2
Ar and O2
H2O
< 0.1
< 0.1
< 0.1
< 0.1
< 0.1
9.7
4.4
< 0.1
< 0.1
1.5
0.7
0.03
0.05
0.7
0.3
Purity Propane 999 982
‒ Verification measures
1) Verification of internal consistency between the KRISS PSMs
Gravimetric results of the primary gas mixtures were compared by GC analysis and
differences were tested by the KRISS Standard Procedures (R-112-001-2012 and R112-
004-2012).The uncertainty of gravimetric preparation was included in the final result.
17
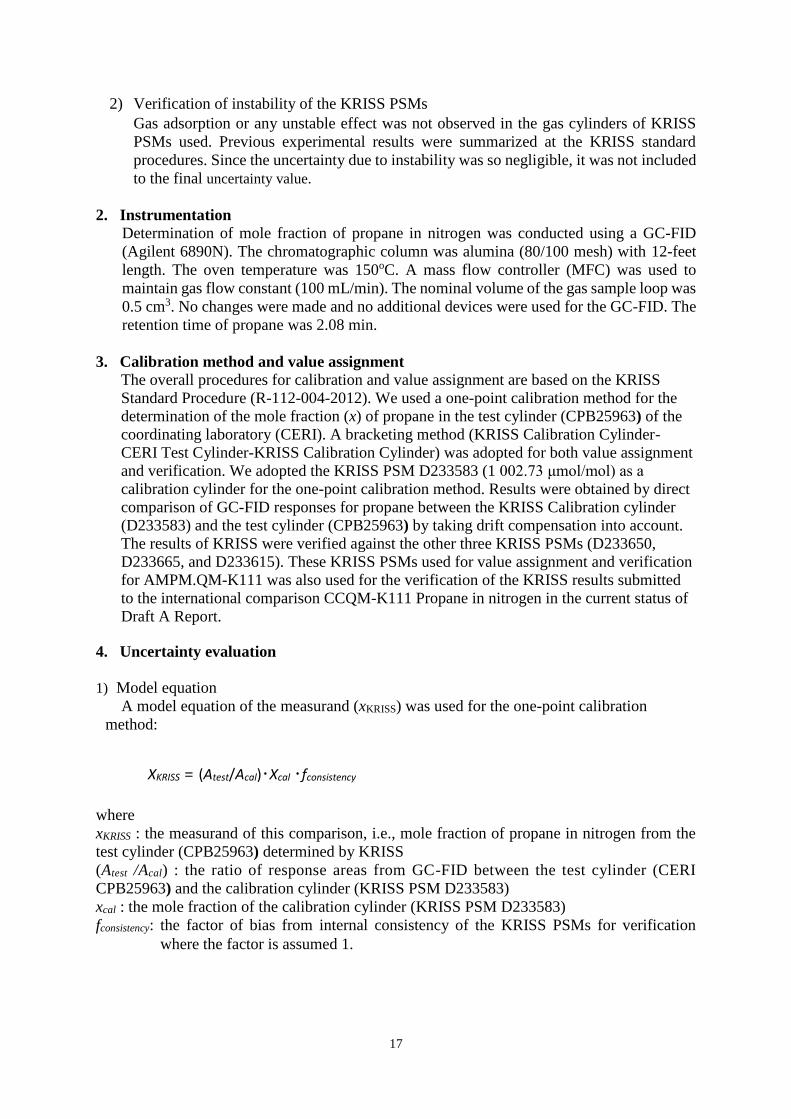
2) Verification of instability of the KRISS PSMs
Gas adsorption or any unstable effect was not observed in the gas cylinders of KRISS
PSMs used. Previous experimental results were summarized at the KRISS standard
procedures. Since the uncertainty due to instability was so negligible, it was not included
to the final uncertainty value.
2. Instrumentation
Determination of mole fraction of propane in nitrogen was conducted using a GC-FID
(Agilent 6890N). The chromatographic column was alumina (80/100 mesh) with 12-feet
length. The oven temperature was 150oC. A mass flow controller (MFC) was used to
maintain gas flow constant (100 mL/min). The nominal volume of the gas sample loop was
0.5 cm3. No changes were made and no additional devices were used for the GC-FID. The
retention time of propane was 2.08 min.
3. Calibration method and value assignment
The overall procedures for calibration and value assignment are based on the KRISS
Standard Procedure (R-112-004-2012). We used a one-point calibration method for the
determination of the mole fraction (x) of propane in the test cylinder (CPB25963) of the
coordinating laboratory (CERI). A bracketing method (KRISS Calibration Cylinder-
CERI Test Cylinder-KRISS Calibration Cylinder) was adopted for both value assignment
and verification. We adopted the KRISS PSM D233583 (1 002.73 μmol/mol) as a
calibration cylinder for the one-point calibration method. Results were obtained by direct
comparison of GC-FID responses for propane between the KRISS Calibration cylinder
(D233583) and the test cylinder (CPB25963) by taking drift compensation into account.
The results of KRISS were verified against the other three KRISS PSMs (D233650,
D233665, and D233615). These KRISS PSMs used for value assignment and verification
for AMPM.QM-K111 was also used for the verification of the KRISS results submitted
to the international comparison CCQM-K111 Propane in nitrogen in the current status of
Draft A Report.
4. Uncertainty evaluation
1) Model equation
A model equation of the measurand (xKRISS) was used for the one-point calibration
method:
XKRISS = (Atest/Acal)・Xcal ・fconsistency
where
xKRISS : the measurand of this comparison, i.e., mole fraction of propane in nitrogen from the
test cylinder (CPB25963) determined by KRISS
(Atest /Acal) : the ratio of response areas from GC-FID between the test cylinder (CERI
CPB25963) and the calibration cylinder (KRISS PSM D233583)
xcal : the mole fraction of the calibration cylinder (KRISS PSM D233583)
fconsistency: the factor of bias from internal consistency of the KRISS PSMs for verification
where the factor is assumed 1.

18
Uncertainties due to impurities of all parent gases used for gravimetric preparation were
combined into the preparation uncertainty of the KRISS PSMs.
2) Combined standard uncertainty
(𝑢(𝑋𝐾𝑅𝐼𝑆𝑆)
𝑋𝐾𝑅𝐼𝑆𝑆)
2
= (𝑢(𝐴𝑡𝑒𝑠𝑡 𝐴𝑐𝑎𝑙⁄ )
𝐴𝑡𝑒𝑠𝑡 𝐴𝑐𝑎𝑙⁄)
2
+ (𝑢(𝑋𝑐𝑎𝑙)
𝑋𝑐𝑎𝑙)
2
+ (𝑢(𝑓𝑐𝑜𝑛𝑠𝑖𝑠𝑡𝑒𝑛𝑐𝑦)
𝑓𝑐𝑜𝑛𝑠𝑖𝑠𝑡𝑒𝑛𝑐𝑦)
2
3) Uncertainty budget
We used the GUM Workbench Pro (Version 2.3.6.141, Metrodata Gmbh) for
uncertainty analysis.
Table 16 : Uncertainty budget
No.
Estimate Uncertainty Analysis
Variable Value Uncertainty
Source
Type
Assumed Distribution
Standard Uncertainty
u(xi)
Contribution to total
variance(%)
1 Atest /Acal 0.9984 Repeatability A t 0.00003 1
2 Xcal 1002.73
μmol/mol Gravimetric
preparation B Normal 0.2 4
3 fconsistency 1 Internal
consistency B Rectangle 0.00049 95
4 XKRISS 1001. 1
μmol/mol Combined - Normal 0.50 100
4) Measurand and expanded uncertainty
xKRISS ± UKRISS = (1001.1 ± 1.0) μmol/mol (Confidence level of about 95%, coverage
factor of 2)

19
Measurement report NIM
Laboratory name: National Institute of Metrology, China (NIM)
Cylinder number: CPB20810
Measurement #1
Component Date
(dd/mm/yy)
Result
(μmol/mol)
Standard deviation
(% relative)
Number of replicates
Propane 23/06/2015 993.74 0.061% 6
Measurement #2
Component Date
(dd/mm/yy)
Result
(μmol/mol)
Standard deviation
(% relative)
Number of replicates
Propane 25/06/2015 993.54 0.061% 6
Measurement #3
Results
Component Result
(μmol/mol)
Expanded Uncertainty
(μmol/mol)
Coverage factor
Propane 993.81 0.99 2
Calibration standards
Please provide a brief description of the calibration standards used, including
‒ Method of preparation
‒ Weighing data
‒ Purity tables (composition) of the parent gases
‒ Verification measures
Component Date
(dd/mm/yy)
Result
(μmol/mol)
Standard deviation
(% relative)
Number of replicates
Propane 26/06/2015 994.15 0.061% 6

20
-Method of preparation
The standard gas mixtures were prepared gravimetrically through a two step dilution according to
ISO6142. The parent gas mixtures of 0.0147734 (cylinder # 813455) mol/mol and 0.0149844
(Cylinder # 813472) mol/mol (propane in nitrogen) were prepared in the first step of dilution,
and four reference gas mixtures were prepared at the second step of dilution which were used
as the calibration gas mixtures. Table 17 listed the results of the calibration gas mixtures
preparation by gravimetric method.
Table 17 : Preparation of the calibration gas mixtures
Cylinder Number
Assigned value
(μmol/mol)
Standard uncertainty
(μmol/mol)
L51010161 1000.11 0.19
L33913032 1008.78 0.19
813865 1000.77 0.19
813941 1003.40 0.19
After verification of the calibration gas mixtures each other, one cylinder (L51010161) was
selected as calibration standard to measure the comparison cylinder.
-Weighing data
Cylinders (L51010161) preparation results listed in table 18:
Table 18 : weigh of components for the gravimetric method
Components Weigh (g) Standard uncertainty(g)
Parent gas mixtures1 24.6760 0.0023
Dilution gas (N2) 336.9773 0.0053
1The parent gas mixture (cylinder # 813455):14773.4 µmol/mol
21
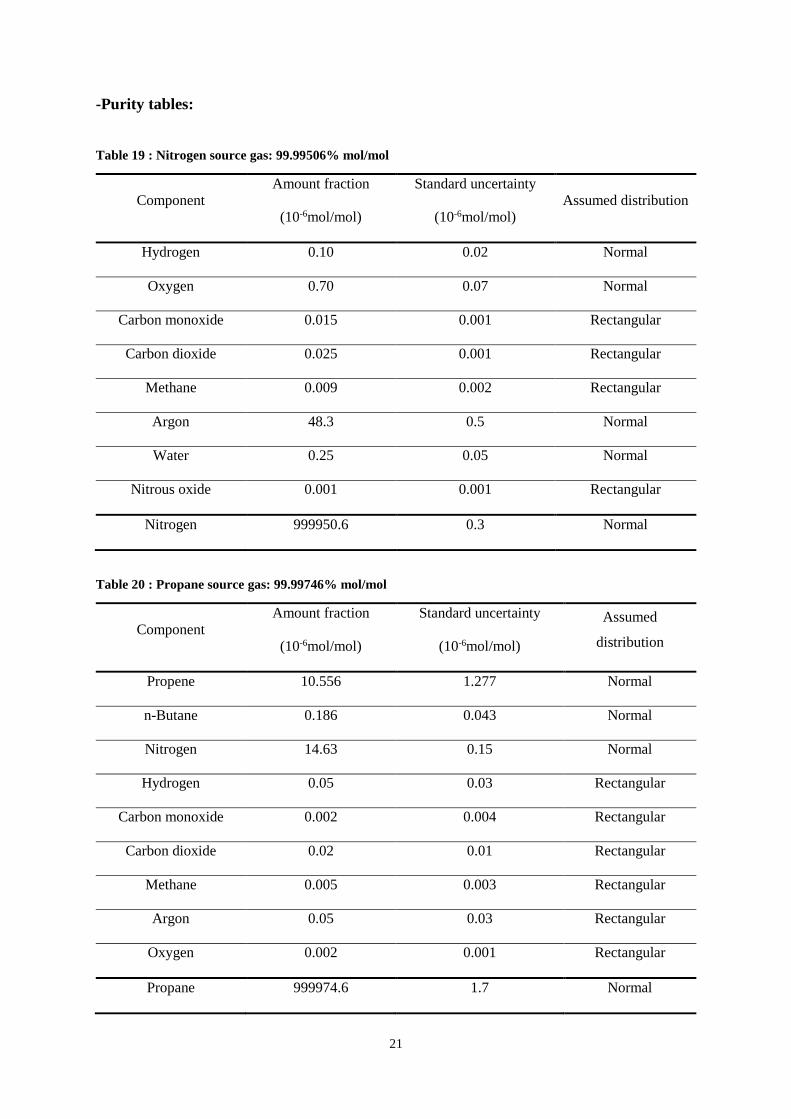
-Purity tables:
Table 19 : Nitrogen source gas: 99.99506% mol/mol
Component Amount fraction
(10-6mol/mol)
Standard uncertainty
(10-6mol/mol) Assumed distribution
Hydrogen 0.10 0.02 Normal
Oxygen 0.70 0.07 Normal
Carbon monoxide 0.015 0.001 Rectangular
Carbon dioxide 0.025 0.001 Rectangular
Methane 0.009 0.002 Rectangular
Argon 48.3 0.5 Normal
Water 0.25 0.05 Normal
Nitrous oxide 0.001 0.001 Rectangular
Nitrogen 999950.6 0.3 Normal
Table 20 : Propane source gas: 99.99746% mol/mol
Component Amount fraction
(10-6mol/mol)
Standard uncertainty
(10-6mol/mol)
Assumed
distribution
Propene 10.556 1.277 Normal
n-Butane 0.186 0.043 Normal
Nitrogen 14.63 0.15 Normal
Hydrogen 0.05 0.03 Rectangular
Carbon monoxide 0.002 0.004 Rectangular
Carbon dioxide 0.02 0.01 Rectangular
Methane 0.005 0.003 Rectangular
Argon 0.05 0.03 Rectangular
Oxygen 0.002 0.001 Rectangular
Propane 999974.6 1.7 Normal

22
Instrumentation
Please provide a brief description of the particulars of the instrument used in this key comparison
(principle, make, type, configuration, data collection, and etc.).
Table 21 : Analytical Instrument: HP7890A GC analyzer equipped with a FID detector and auto
sampling valve
Agilent 7890A Condition
Detector Flame Ionization Detector (FID)
Detector Temperature 300°C
Column HP-Plot Al2O3/KCl, 50m×0.32μm×8μm
Oven Temperature 100°C for 10min
Sample Flow rate 100 mL/min
Specification of a balance:
Model No.: Mettler-Toledo
Resolution: 1 mg, Capacity: 26 kg
Weighing method: A-B-A, substitution method.
Calibration method and value assignment
Please provide a brief description how the equipment was calibrated and how the assigned value was
calculated (including the necessary formulae).
(mathematical model or calibration curve, number and concentration of standards, measurements
sequence, etc.)
Cylinder L51010161 calibration gas mixture was used for the measurement.
Single point calibration was used to calculate the mole fraction of the target compound in a comparison
cylinder CPB20810 provided by CERI.
When analyzing the sample gas mixture, “A-B-A” type calibration procedure was used. It means that
the sample and calibration gases were measured in the order of Calibration-Sample-Calibration. This
procedure was carried out 3 times on different days.
The calibration and sample gas mixtures were directly introduced to the GC through a three-way valve
and a mass flow controller.
Uncertainty evaluation
Please provide a brief description of the evaluation of measurement uncertainty, including the
expressions used.
The uncertainty of calibration standard (L51010161) was evaluated according to ISO6142.

23
“A-B-A” type calibration procedure was used. The calibration uncertainty was evaluated based on the
equation (1):
( / ) res s r r proC C fA A
(1)
Cs - the mole fraction of sample gas mixture;
As - the peak area of sample cylinder in GC-FID;
Cr- the mole fraction of calibration gas mixtures;
Ar - the peak area of calibration gas mixtures in GC-FID.
frepro - the reproducibility of the measurement for different days
The uncertainty budget for this measurement is given in Table 22:
Table 22 : Uncertainty budget for the sample cylinder measurement
Component distribution Sensitivity
coefficient
Relative standard
uncertainty, ui
As Normal 1 0.025%
Ar Normal 1 0.025%
Cr Normal 1 0.019%
frepro Normal 1 0.030%
2 2 2 2
s A r r reprosC A c fu u u u u (2)
sCu - the combined relative standard uncertainty of the measurement;
2 2 2 20.025% 0.025% 0.019% 0.030% 0.050%sCu
The expanded relative uncertainty with 95% confidence and a coverage factor k=2 is:
0.10%s sC cU k u
For the sample cylinder, the measurement result with an absolute uncertainty is:
993.81±0.99 μmol/mol

24
Measurement report NIMT
Laboratory name: National Institute of Metrology (Thailand)
Cylinder number: CPB25989
Measurement #1
Component Date
(dd/mm/yy)
Result
(μmol/mol)
Standard deviation
(% relative)
Number of replicates
Propane 02/12/2015 1001.2 0.045 3
Measurement #2
Component Date
(dd/mm/yy)
Result
(μmol/mol)
Standard deviation
(% relative)
Number of replicates
Propane 03/12/2015 1001.1 0.026 3
Measurement #3
Component Date
(dd/mm/yy)
Result
(μmol/mol)
Standard deviation
(% relative)
Number of replicates
Propane 04/12/2015 1000.7 0.010 3
Results
Component Result
(μmol/mol)
Expanded
Uncertainty
(μmol/mol)
Coverage factor
Propane 1001.0 3.5 2
25
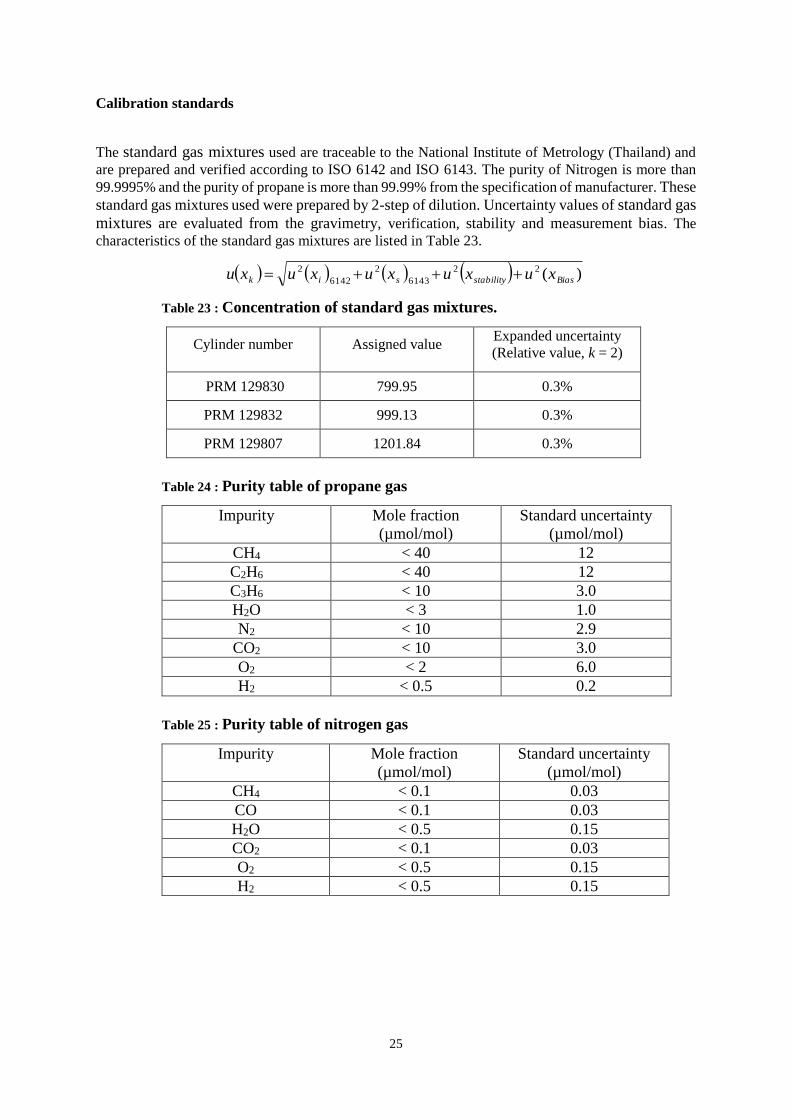
Calibration standards
The standard gas mixtures used are traceable to the National Institute of Metrology (Thailand) and
are prepared and verified according to ISO 6142 and ISO 6143. The purity of Nitrogen is more than
99.9995% and the purity of propane is more than 99.99% from the specification of manufacturer. These
standard gas mixtures used were prepared by 2-step of dilution. Uncertainty values of standard gas
mixtures are evaluated from the gravimetry, verification, stability and measurement bias. The
characteristics of the standard gas mixtures are listed in Table 23.
Table 23 : Concentration of standard gas mixtures.
Cylinder number Assigned value Expanded uncertainty
(Relative value, k = 2)
PRM 129830 799.95 0.3%
PRM 129832 999.13 0.3%
PRM 129807 1201.84 0.3%
Table 24 : Purity table of propane gas
Impurity Mole fraction
(µmol/mol)
Standard uncertainty
(µmol/mol)
CH4 < 40 12
C2H6 < 40 12
C3H6 < 10 3.0
H2O < 3 1.0
N2 < 10 2.9
CO2 < 10 3.0
O2 < 2 6.0
H2 < 0.5 0.2
Table 25 : Purity table of nitrogen gas
Impurity Mole fraction
(µmol/mol)
Standard uncertainty
(µmol/mol)
CH4 < 0.1 0.03
CO < 0.1 0.03
H2O < 0.5 0.15
CO2 < 0.1 0.03
O2 < 0.5 0.15
H2 < 0.5 0.15
)(22
6143
2
6142
2
Biasstabilitysik xuxuxuxuxu

26
Instrumentation
The measurements were performed using a 6890 Gas Chromatograph with flame ionization detector
(FID). The GC column used was Porapak Q, 6 ft and mesh 80/100, and with nitrogen as carrier gas.
The measured condition was sample loop 0.5 ml, temperature of oven 80oC, temperature of detector
250oC, hydrogen flow 30 ml/min and air flow 400 ml/min. The flow rate of propane gas mixtures was
controlled by using a mass flow controller at 20 ml/min. The GC-FID was calibrated with three
standard gas mixtures in range 800 to 1200 µmol/mol.
Calibration method and value assignment
The measurement procedure is shown as follow; “Calibration 1 – Sample – Calibration 2 – Sample
–Calibration 3 – Sample” The linear function was used for determining the sample content including
the quality control gas (QC) is used for correction of a drift of analysis instruments. It acts as the
blank when doing the analysis of sample. A QC gas was injected into GC-FID before and after the
measurement reference gases and sample gas. The standard, sample and QC gases were injected into
the ten-port gas sampling valves of GC-FID. The average response was calculated by using the last
three of six times for each cylinder.
Uncertainty evaluation
The procedure for the estimation of measurement uncertainty is following a 3-point calibration and
according to ISO 6143 using B_least software for selecting the analytical function and JCGM
100:2008 “Evaluation of Measurement Data-Guide to The Expression of Uncertainty in
Measurement". The standard uncertainty u(xs) of the sample gas mixture is calculated from the following equations;
BsAksA XuxuXuxu 2
6143,
22
,
2 .)(
where
u(Xk) is the standard uncertainty of standard gas mixtures,
u(xA,s)6143 is the standard uncertainty of the sample content from analytical equation,
u(XB) is the standard uncertainty due to the measurement bias.
Table 26 : Uncertainty Budget for of C3H8 measurement
Quantity
(Uncertainty source),
Xi
Estimate
xi
(µmol/mol)
Evaluation
type
(A or B)
Distribution
Standard
uncertainty
u(xi)
Sensitivity
coefficient
ci
Contribution
u(yi)
(µmol/mol)
The standard gas
mixture 999.13 B Rectangular 1.5 1.0 1.5
Analytical content of
sample gas mixture, 1001.0 A Normal 0.9 1.0 0.9
Measurement Bias, 0.01 B Rectangular 0.01 1.0 0.01
Combined Uncertainty, (µmol/mol) 1.75
Expanded Uncertainty, (k=2) , (µmol/mol) 3.5
Expanded Uncertainty, (k=2) , (%relative) 0.35

27
Measurement report NMC A*STAR
Laboratory name: National Metrology Centre, A*STAR, Singapore
Cylinder number: CPB21192
Measurement #1
Component Date
(dd/mm/yy) Result
(µmol/mol)
Standard deviation
(% relative)
Number of replicates
Propane 05/05/15 999.7 0.104 3
Propane 05/05/15 999.4 0.044 3
Propane 05/05/15 1002.2 0.041 3
Measurement #2
Component Date
(dd/mm/yy) Measured Result
(µmol/mol)
Standard Deviation
(% relative)
Number of Replicates
Propane 06/05/15 998.6 0.115 3
Propane 06/05/15 1002.2 0.118 3
Propane 06/05/15 1002.1 0.103 3
Measurement #3
Component Date
(dd/mm/yy) Measured Result
(µmol/mol)
Standard Deviation
(% relative)
Number of Replicates
Propane 18/05/15 998.5 0.076 3
Propane 18/05/15 1000.6 0.062 3
Propane 18/05/15 1001.8 0.115 3
Results:
Component Result
(µmol/mol) Expanded uncertainty
(µmol/mol) Coverage Factor
Propane 1000.6 4.5 2
28
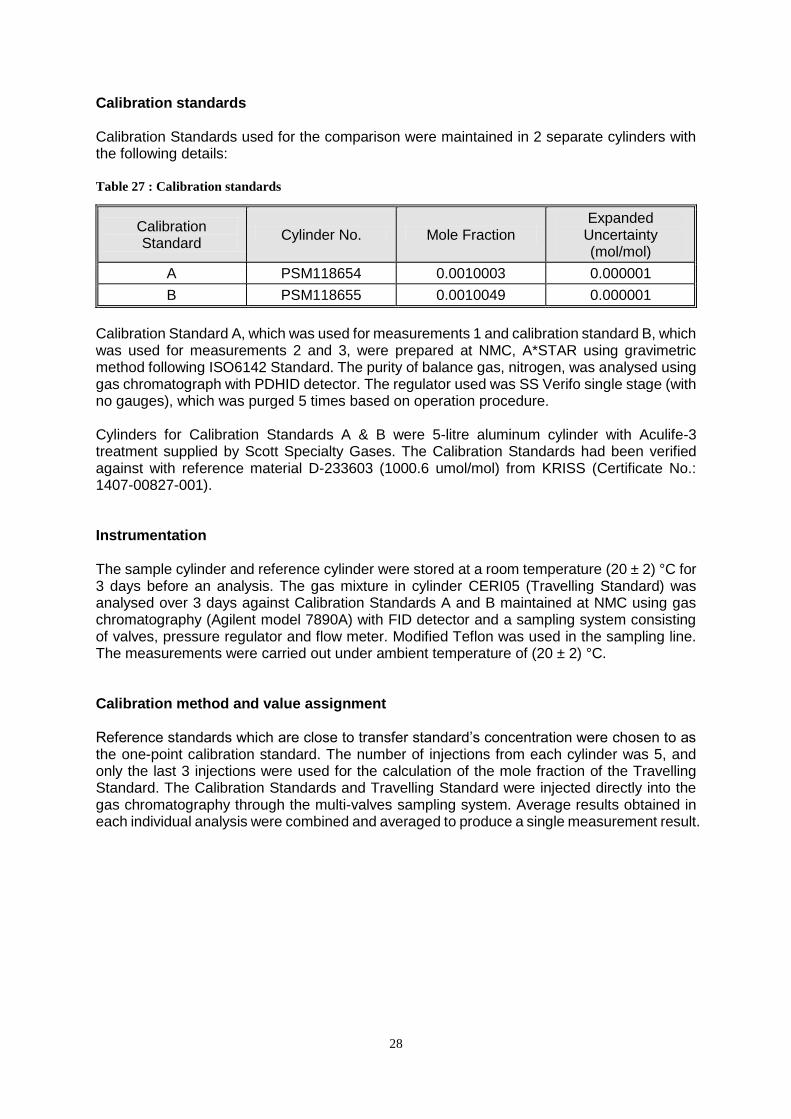
Calibration standards Calibration Standards used for the comparison were maintained in 2 separate cylinders with the following details: Table 27 : Calibration standards
Calibration Standard
Cylinder No. Mole Fraction Expanded
Uncertainty (mol/mol)
A PSM118654 0.0010003 0.000001
B PSM118655 0.0010049 0.000001
Calibration Standard A, which was used for measurements 1 and calibration standard B, which was used for measurements 2 and 3, were prepared at NMC, A*STAR using gravimetric method following ISO6142 Standard. The purity of balance gas, nitrogen, was analysed using gas chromatograph with PDHID detector. The regulator used was SS Verifo single stage (with no gauges), which was purged 5 times based on operation procedure. Cylinders for Calibration Standards A & B were 5-litre aluminum cylinder with Aculife-3 treatment supplied by Scott Specialty Gases. The Calibration Standards had been verified against with reference material D-233603 (1000.6 umol/mol) from KRISS (Certificate No.: 1407-00827-001). Instrumentation The sample cylinder and reference cylinder were stored at a room temperature (20 ± 2) °C for 3 days before an analysis. The gas mixture in cylinder CERI05 (Travelling Standard) was analysed over 3 days against Calibration Standards A and B maintained at NMC using gas chromatography (Agilent model 7890A) with FID detector and a sampling system consisting of valves, pressure regulator and flow meter. Modified Teflon was used in the sampling line. The measurements were carried out under ambient temperature of (20 ± 2) °C. Calibration method and value assignment Reference standards which are close to transfer standard’s concentration were chosen to as the one-point calibration standard. The number of injections from each cylinder was 5, and only the last 3 injections were used for the calculation of the mole fraction of the Travelling Standard. The Calibration Standards and Travelling Standard were injected directly into the gas chromatography through the multi-valves sampling system. Average results obtained in each individual analysis were combined and averaged to produce a single measurement result.

29
Uncertainty evaluation Table 28 : Uncertainty evaluation
Uncertainty
source, Xi
Evaluation type
(A or B)
Standard uncertainty,
u(xi) (mol/mol)
Sensitivity coefficient,
ci Distribution
Contribution, ui(y)
(µmol/mol)
Gas standard
uncertainty
-Purity analysis
-Gravimetric
method
-Molar mass
-Consistency
Type B 0.0000005 1 Normal 0.6
Linearity Type B 0.0000003 1 Rectangular 0.3
Analytical
uncertainty
-Repeatability
Type A 0.0000012 1 Normal 1.9
Combined
uncertainty, uc
Normal 2.04
Expanded
uncertainty
(k = 2), U
Normal 4.5
30
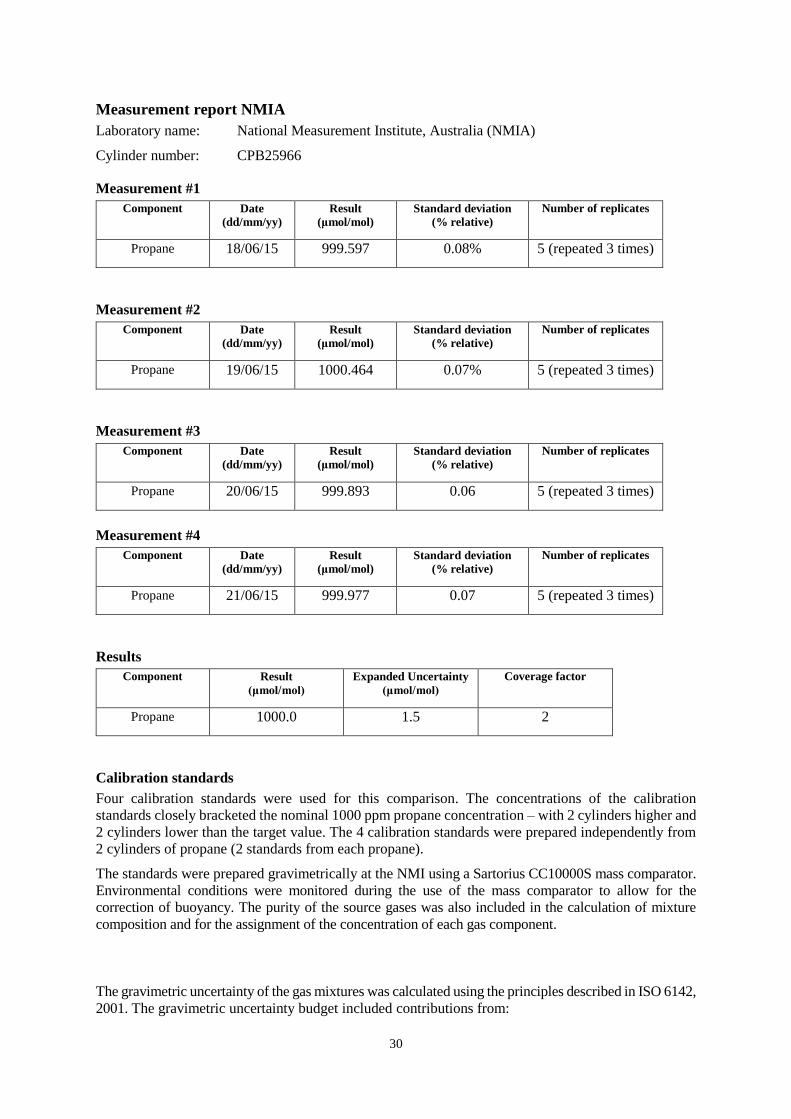
Measurement report NMIA
Laboratory name: National Measurement Institute, Australia (NMIA)
Cylinder number: CPB25966
Measurement #1
Component Date
(dd/mm/yy)
Result
(μmol/mol)
Standard deviation
(% relative)
Number of replicates
Propane 18/06/15 999.597 0.08% 5 (repeated 3 times)
Measurement #2
Component Date
(dd/mm/yy)
Result
(μmol/mol)
Standard deviation
(% relative)
Number of replicates
Propane 19/06/15 1000.464 0.07% 5 (repeated 3 times)
Measurement #3
Component Date
(dd/mm/yy)
Result
(μmol/mol)
Standard deviation
(% relative)
Number of replicates
Propane 20/06/15 999.893 0.06 5 (repeated 3 times)
Measurement #4
Component Date
(dd/mm/yy)
Result
(μmol/mol)
Standard deviation
(% relative)
Number of replicates
Propane 21/06/15 999.977 0.07 5 (repeated 3 times)
Results
Component Result
(μmol/mol)
Expanded Uncertainty
(μmol/mol)
Coverage factor
Propane 1000.0 1.5 2
Calibration standards
Four calibration standards were used for this comparison. The concentrations of the calibration
standards closely bracketed the nominal 1000 ppm propane concentration – with 2 cylinders higher and
2 cylinders lower than the target value. The 4 calibration standards were prepared independently from
2 cylinders of propane (2 standards from each propane).
The standards were prepared gravimetrically at the NMI using a Sartorius CC10000S mass comparator.
Environmental conditions were monitored during the use of the mass comparator to allow for the
correction of buoyancy. The purity of the source gases was also included in the calculation of mixture
composition and for the assignment of the concentration of each gas component.
The gravimetric uncertainty of the gas mixtures was calculated using the principles described in ISO 6142,
2001. The gravimetric uncertainty budget included contributions from:
31
Balance uncertainty
Buoyancy of cylinders
Expansion of cylinders
Tare mass uncertainty
Tare mass buoyancy
Purity of gases
Molar mass
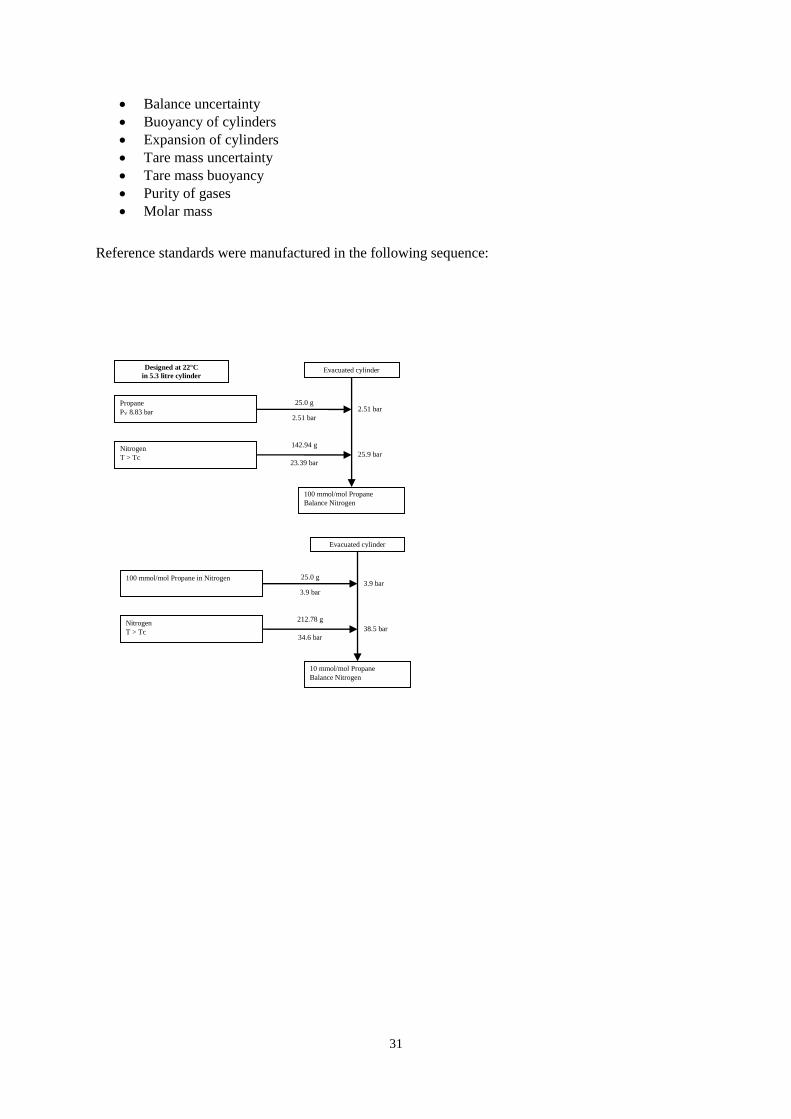
Reference standards were manufactured in the following sequence:
2.51 bar
Evacuated cylinder
100 mmol/mol Propane
Balance Nitrogen
25.0 g
2.51 bar
Propane
PV 8.83 bar
25.9 bar
142.94 g
23.39 bar
Nitrogen
T > Tc
Designed at 22°C
in 5.3 litre cylinder
3.9 bar
Evacuated cylinder
10 mmol/mol Propane
Balance Nitrogen
25.0 g
3.9 bar
100 mmol/mol Propane in Nitrogen
38.5 bar
212.78 g
34.6 bar
Nitrogen
T > Tc
32
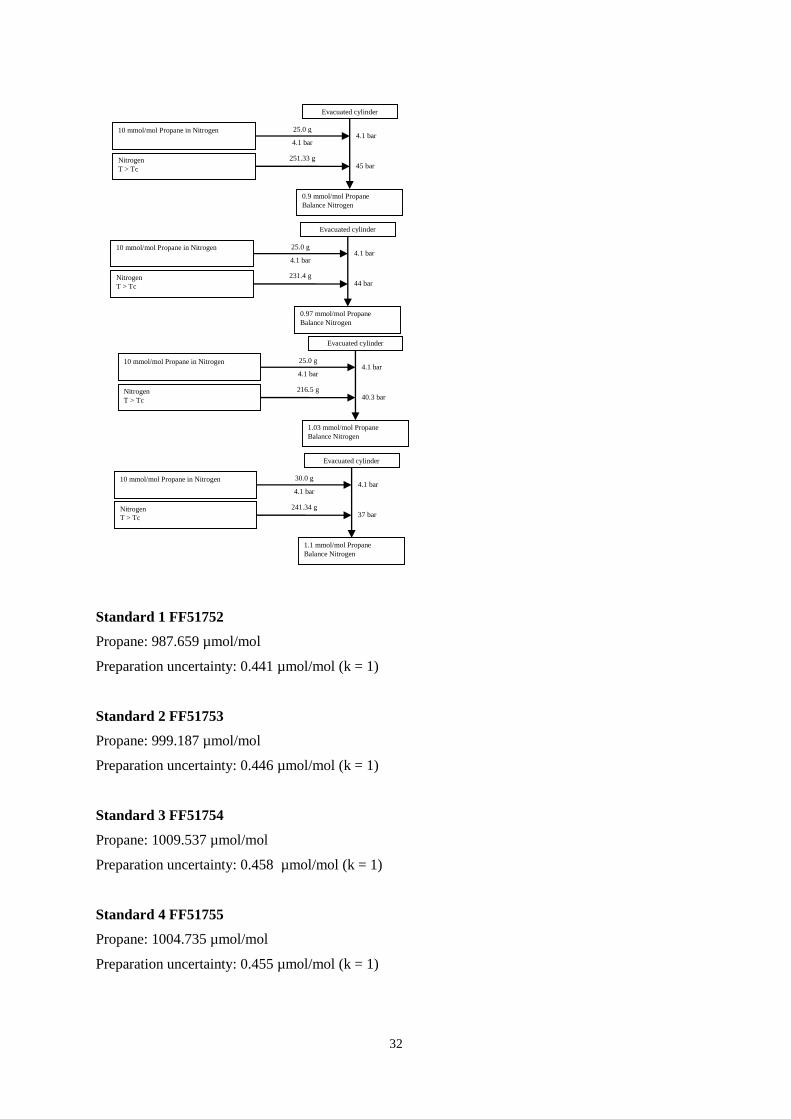
Standard 1 FF51752
Propane: 987.659 µmol/mol
Preparation uncertainty: 0.441 µmol/mol (k = 1)
Standard 2 FF51753
Propane: 999.187 µmol/mol
Preparation uncertainty: 0.446 µmol/mol (k = 1)
Standard 3 FF51754
Propane: 1009.537 µmol/mol
Preparation uncertainty: 0.458 µmol/mol (k = 1)
Standard 4 FF51755
Propane: 1004.735 µmol/mol
Preparation uncertainty: 0.455 µmol/mol (k = 1)
4.1 bar
Evacuated cylinder
0.9 mmol/mol Propane
Balance Nitrogen
25.0 g
4.1 bar
10 mmol/mol Propane in Nitrogen
45 bar 251.33 g Nitrogen
T > Tc
4.1 bar
Evacuated cylinder
0.97 mmol/mol Propane
Balance Nitrogen
25.0 g
4.1 bar
10 mmol/mol Propane in Nitrogen
44 bar 231.4 g Nitrogen
T > Tc
4.1 bar
Evacuated cylinder
1.03 mmol/mol Propane
Balance Nitrogen
25.0 g
4.1 bar
10 mmol/mol Propane in Nitrogen
40.3 bar 216.5 g Nitrogen
T > Tc
4.1 bar
Evacuated cylinder
1.1 mmol/mol Propane
Balance Nitrogen
30.0 g
4.1 bar
10 mmol/mol Propane in Nitrogen
37 bar 241.34 g Nitrogen
T > Tc

33
Prior to the gravimetric preparation of the standards, the purity of the propane cylinders and nitrogen
were determined. Several GCs were used to determine the impurity concentrations in each gas (GC
detectors included PDHID, FID and TCD).
Purity tables:
Table 29 : Propane 1 (C3H8-01A)
Table 30 : Propane 2 (C3H8-14A)
Table 31 : Nitrogen
Verification: Mixtures were verified through comparison with 5 other gas standards containing
propane in nitrogen. 4 mixtures were manufactured covering the range 900 – 1100 µmol/mol range,
plus a historical cylinder (MD8874) from 2011 containing 994.7 µmol/mol propane in nitrogen was
also used. These cylinders were in good agreement with the standards used in this comparison.
Instrumentation
Two GCs were used for the analysis of the propane. GCs were run simultaneously with the same
sequence. The results from the 2 GCs agreed to within 0.1 ppm.
Bruker 456GC Natural gas analyser (configuration C). Column: 60m x 0.25 mm CP-Sil 5 CB, df =
1µm to FID. Data collection was handled by Compass CDS software.
Varian 3800 gas chromatograph with a 6’ x 1/8” Hayesep R column with TCD and FID in series. Data
collection was handled by Star WS software.
Results from both GCs were processed off-line using MS Excel to calculate propane concentration
and measurement uncertainty.
Calibration method and value assignment
The sample cylinder was run with the four calibration standards (detailed previously). A sequence of
runs ABCADEA (repeated three times in each analysis) was used to determine the concentration of
components in the sample cylinder:
- A was the APMP sample cylinder.
- B was the first reference standard.
Nitrogen N2 24 3 μmol/mol Normal NMI analysis GC8 cryo 2/02/15, Log book 32 page 10
Oxygen O2 1.5 0.6 μmol/mol Normal NMI analysis GC8 cryo 2/02/15, Log book 32 page 10
Ethane C2H6 17 2 μmol/mol Normal NMI analysis GC7 methanizer 25-26/02/15, Log book 31 page 91
Propane C3H8 0.9999575 3.66E-06 mol/mol Normal Nominally pure component
Notes (lab book details, certificate details, etc)C3H8_01A Concentration U(Concentration)Composition
RangeUncertainty Type Justification of Value
Nitrogen N2 90 30 μmol/mol Normal NMI analysis GC8 cryo, 03/02/15 Lab book 32 page10
Oxygen O2 50 20 μmol/mol Normal NMI analysis GC8 cryo, 03/02/15 Lab book 32 page10
Ethane C2H6 52 4 μmol/mol Normal NMI analysis GC7 methanizer, 25-26/02/15 Lab book31 page91
Propane C3H8 0.999808 3.63E-05 mol/mol Normal Nominally pure component
Notes (lab book details, certificate details, etc)C3H8_14A Concentration U(Concentration)Composition
RangeUncertainty Type Justification of Value
Argon Ar 222.7 1.7 μmol/mol Normal NMI analysis 2/06/16 Log Book 32 p19
Nitrogen N2 0.999775852 1.70098E-06 mol/mol Normal Nominally pure component
Oxygen O2 1.373 0.029 μmol/mol Normal NMI analysis 2/06/16 Log Book 32 p19
Carbon Monoxide CO 0.025 0.025 μmol/mol Rectangular Below NMI detection limit 13/05/16 Log Book 31 p102
Carbon Dioxide CO2 0.025 0.025 μmol/mol Rectangular Below NMI detection limit 13/05/16 Log Book 31 p102
Methane CH4 0.025 0.025 μmol/mol Rectangular Below NMI detection limit 13/05/16 Log Book 31 p102
Notes (lab book details, certificate details, etc)Concentration U(Concentration)Composition
RangeUncertainty Type Justification of Value

34
- C was the second reference standard.
- D was the third reference standard.
- E was the fourth reference standard.
Each stage of the measurement sequence represents 5 repeat analyses of a cylinder. Each run took 10
minutes under isothermal conditions. Stream selection was controlled with an electric actuated 10-
position VICI valve. Sequences were left to run unattended overnight.
Concentrations were calculated using the mathematical model for 2-point bracketed standards.
Cx = (C2-C1)*(Rx-R1)/(R2-R1)+C1
Where:
- Cx = concentration of sample
- C1 = concentration of first standard
- C2 = concentration of second standard
- Rx = average response of GC for sample
- R1 = average response of GC for first standard
- R2 = average response of GC for second standard
The 4 reference standards were used in the model by grouping the 2 standards closest in concentration
to the sample cylinder (FF51753 and 55) and grouping the 2 standards furthest away from the sample
concentration of the sample cylinder (FF51752 and 54).
The measurement results for each sequence were combined and averaged to produce a single
measurement result for each gas cylinder with the purpose of averaging out any instrumental drift.
The 2 GCs produced results that agreed to within 0.1 ppm for each analysis.
The entire sequence of runs was repeated four times from the 18th to 21st of June 2015. Four tables of
measurement results are included in this report containing average values from the 2 GCs for the
concentrations calculated from the 4 reference standards.
Sample flow was controlled with a MFC and the gas flowed continuously while being analysed. The
analysis results were not corrected for variations in laboratory air pressure or temperature.
Uncertainty evaluation
The uncertainty budget had 2 main components:
- Gravimetric uncertainty, and
- Analytical uncertainty
The Gravimetric uncertainty contributions included:
- Balance uncertainty
- Buoyancy of cylinders
- Expansion of cylinders
- Tare mass uncertainty
- Tare mass buoyancy
- Impurity of gases
The analytical uncertainty contributions included:
- Uncertainty of sample measurement
- Uncertainty of measurement of reference gases
35
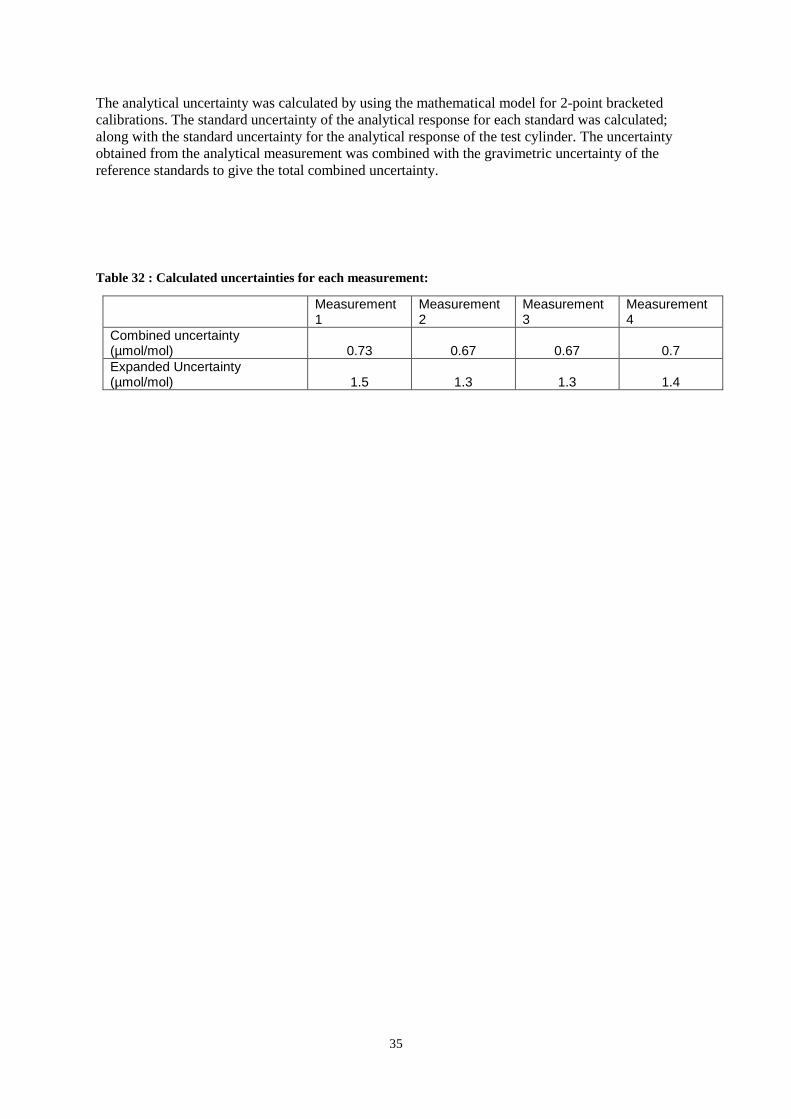
The analytical uncertainty was calculated by using the mathematical model for 2-point bracketed
calibrations. The standard uncertainty of the analytical response for each standard was calculated;
along with the standard uncertainty for the analytical response of the test cylinder. The uncertainty
obtained from the analytical measurement was combined with the gravimetric uncertainty of the
reference standards to give the total combined uncertainty.
Table 32 : Calculated uncertainties for each measurement:
Measurement 1
Measurement 2
Measurement 3
Measurement 4
Combined uncertainty (µmol/mol) 0.73 0.67 0.67 0.7
Expanded Uncertainty (µmol/mol) 1.5 1.3 1.3 1.4
36
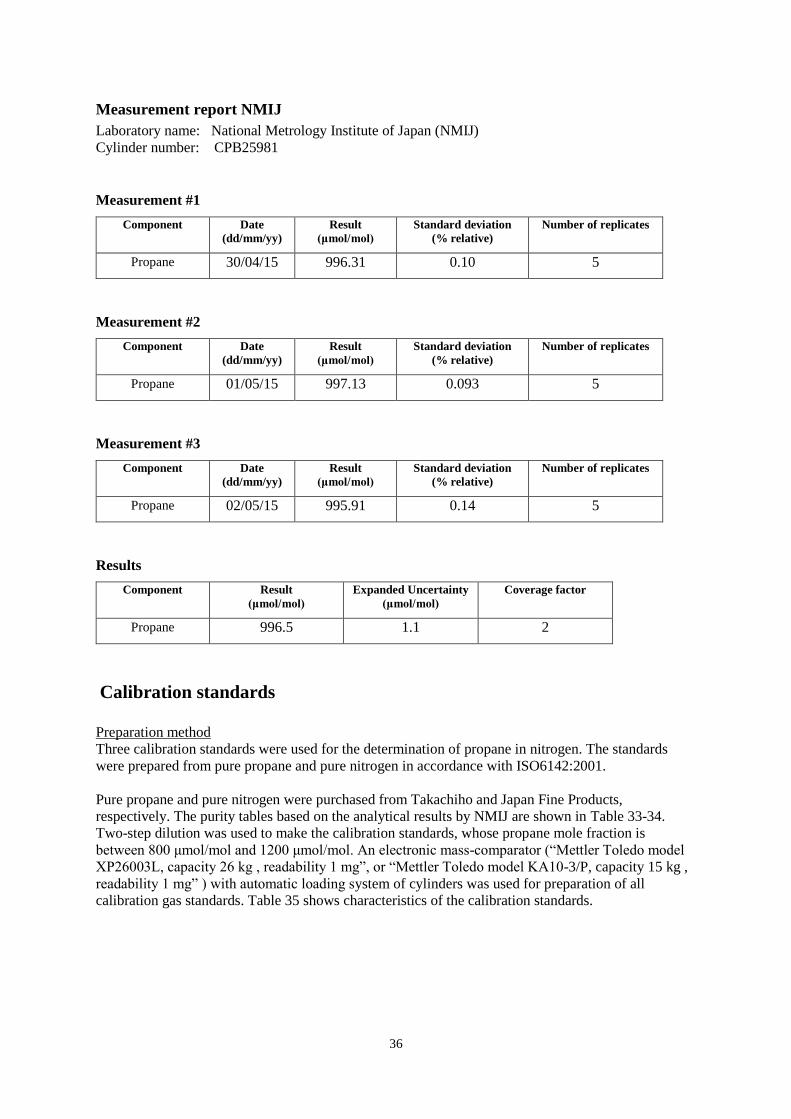
Measurement report NMIJ
Laboratory name: National Metrology Institute of Japan (NMIJ)
Cylinder number: CPB25981
Measurement #1
Component Date
(dd/mm/yy)
Result
(μmol/mol)
Standard deviation
(% relative)
Number of replicates
Propane 30/04/15 996.31 0.10 5
Measurement #2
Component Date
(dd/mm/yy)
Result
(μmol/mol)
Standard deviation
(% relative)
Number of replicates
Propane 01/05/15 997.13 0.093 5
Measurement #3
Component Date
(dd/mm/yy)
Result
(μmol/mol)
Standard deviation
(% relative)
Number of replicates
Propane 02/05/15 995.91 0.14 5
Results
Component Result
(μmol/mol)
Expanded Uncertainty
(μmol/mol)
Coverage factor
Propane 996.5 1.1 2
Calibration standards
Preparation method
Three calibration standards were used for the determination of propane in nitrogen. The standards
were prepared from pure propane and pure nitrogen in accordance with ISO6142:2001.
Pure propane and pure nitrogen were purchased from Takachiho and Japan Fine Products,
respectively. The purity tables based on the analytical results by NMIJ are shown in Table 33-34.
Two-step dilution was used to make the calibration standards, whose propane mole fraction is
between 800 μmol/mol and 1200 μmol/mol. An electronic mass-comparator (“Mettler Toledo model
XP26003L, capacity 26 kg , readability 1 mg”, or “Mettler Toledo model KA10-3/P, capacity 15 kg ,
readability 1 mg” ) with automatic loading system of cylinders was used for preparation of all
calibration gas standards. Table 35 shows characteristics of the calibration standards.

37
Table 33 : Purity table for propane gas used as parent gas.
Component Mole fraction
(μmol/mol)
Standard uncertainty
(μmol/mol)
C3H8 999900 50
N2 0.78 0.02
O2 0.55 0.04
C2H6 2.2 0.4
C3H6 27.68 0.28
H2O 47.3 13.0
Ar 0.06 0.03
n-C4H10 0.50 0.29
i-C4H10 0.50 0.29
C3H6 30.0 1.2
Table 34 : Purity table for nitrogen gas used as parent gas.
Component Mole fraction
(μmol/mol)
Standard uncertainty
(μmol/mol)
N2 999999.996 0.0022
C3H8 0.0039 0.0022
Table 35 : Gravimetric mole fractions of propane in calibration gas standards. The balance gas of all
calibration standards is nitrogen.
Calibration standard, r Gravimetric mole fraction, Xr
μmol/mol
Expanded uncertainty [k=2], U(Xr)
μmol/mol
1 787.89 0.23
2 1205.88 0.35
3 997.64 0.31
38
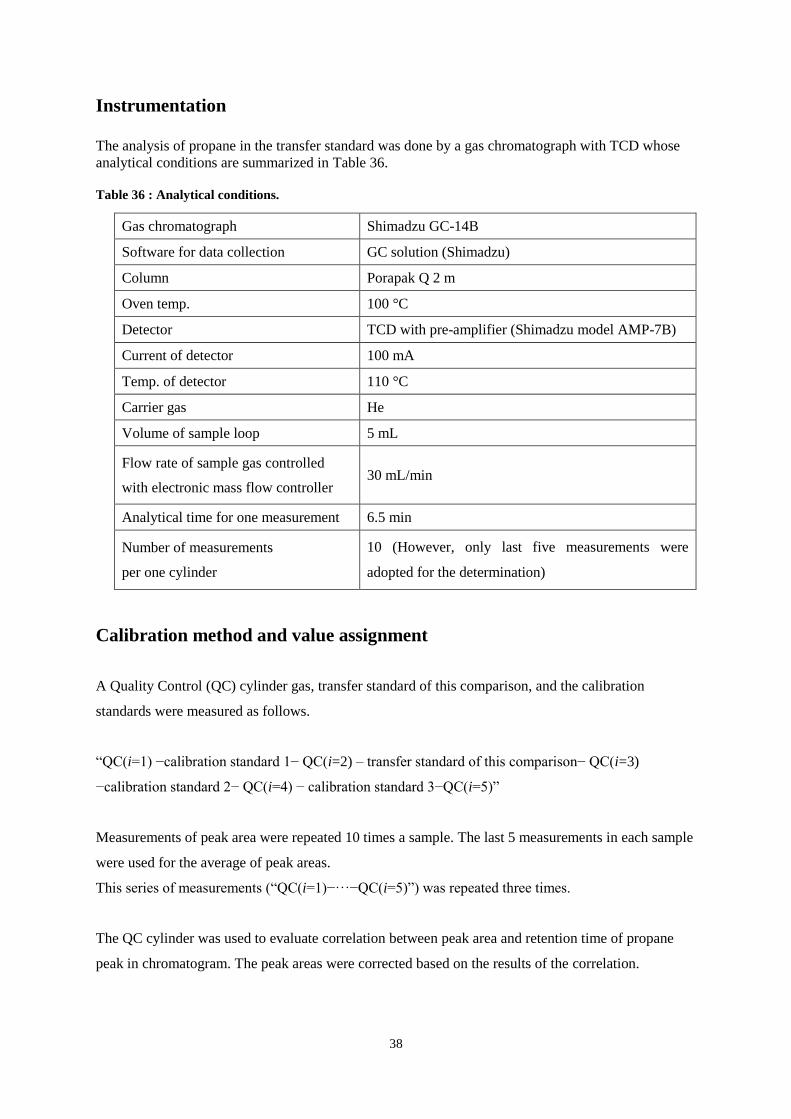
Instrumentation
The analysis of propane in the transfer standard was done by a gas chromatograph with TCD whose
analytical conditions are summarized in Table 36.
Table 36 : Analytical conditions.
Gas chromatograph Shimadzu GC-14B
Software for data collection GC solution (Shimadzu)
Column Porapak Q 2 m
Oven temp. 100 °C
Detector TCD with pre-amplifier (Shimadzu model AMP-7B)
Current of detector 100 mA
Temp. of detector 110 °C
Carrier gas He
Volume of sample loop 5 mL
Flow rate of sample gas controlled
with electronic mass flow controller 30 mL/min
Analytical time for one measurement 6.5 min
Number of measurements
per one cylinder
10 (However, only last five measurements were
adopted for the determination)
Calibration method and value assignment
A Quality Control (QC) cylinder gas, transfer standard of this comparison, and the calibration
standards were measured as follows.
“QC(i=1) −calibration standard 1− QC(i=2) – transfer standard of this comparison− QC(i=3)
−calibration standard 2− QC(i=4) − calibration standard 3−QC(i=5)”
Measurements of peak area were repeated 10 times a sample. The last 5 measurements in each sample
were used for the average of peak areas.
This series of measurements (“QC(i=1)−···−QC(i=5)”) was repeated three times.
The QC cylinder was used to evaluate correlation between peak area and retention time of propane
peak in chromatogram. The peak areas were corrected based on the results of the correlation.

39
We defined
Xr : the gravimetric mole fraction of calibration standard r,
Yr, j : corrected peak area for calibration standard r at j th series is Yr, j ,
u(Z) : standard uncertainty of Z.
From the data set of (X1, X2, X3, Yr, j), parameters and their uncertainty of the analytical function, X =
b0 + b1 ·Y, were calculated by the Deming’s least squared method. The analytical content Xs,j and its
standard uncertainty u(Xs,j) of the transfer standard were calculated from the peak area, Ys,j , and its
uncertainty, u(Ys,j) by the analytical function.
The measurements of Xs,j were repeated three times. Final mole fraction of the sample gas in the table
of “Results” in page 1, Xs, was derived from
𝑋𝑠 = ∑ 𝑋𝑠,𝑗
3
𝑗=1
3⁄ . (1)
The standard uncertainty of Xs was given as
𝑢2(𝑋𝑠) = ∑ (𝑋𝑠,𝑗 − 𝑋𝑠)2
3(3 − 1) + ∑ 𝑢2(𝑋𝑠,𝑗) 32⁄ (2)
3
𝑗=1
⁄
3
𝑗=1
Uncertainty evaluation
Please see the above section.

40
Measurement report NML SIRIM
Laboratory name: National Metrology Laboratory, SIRIM Berhad, MALAYSIA.
Cylinder number: CPB- 25987
Measurement #1
Component Date
(dd/mm/yy)
Result
(μmol/mol)
Standard deviation
(% relative)
Number of replicates
Propane 27/05/15 960.36 0.33 7
Measurement #2
Component Date
(dd/mm/yy)
Result
(μmol/mol)
Standard deviation
(% relative)
Number of replicates
Propane 03/06/15 960.45 0.51 7
Measurement #3
Component Date
(dd/mm/yy)
Result
(μmol/mol)
Standard deviation
(% relative)
Number of replicates
Propane 10/06/15 960.43 0.10 7
Results
Component Result
(μmol/mol)
Expanded Uncertainty
(μmol/mol)
Coverage factor
Propane 960.41 1.5 2
41
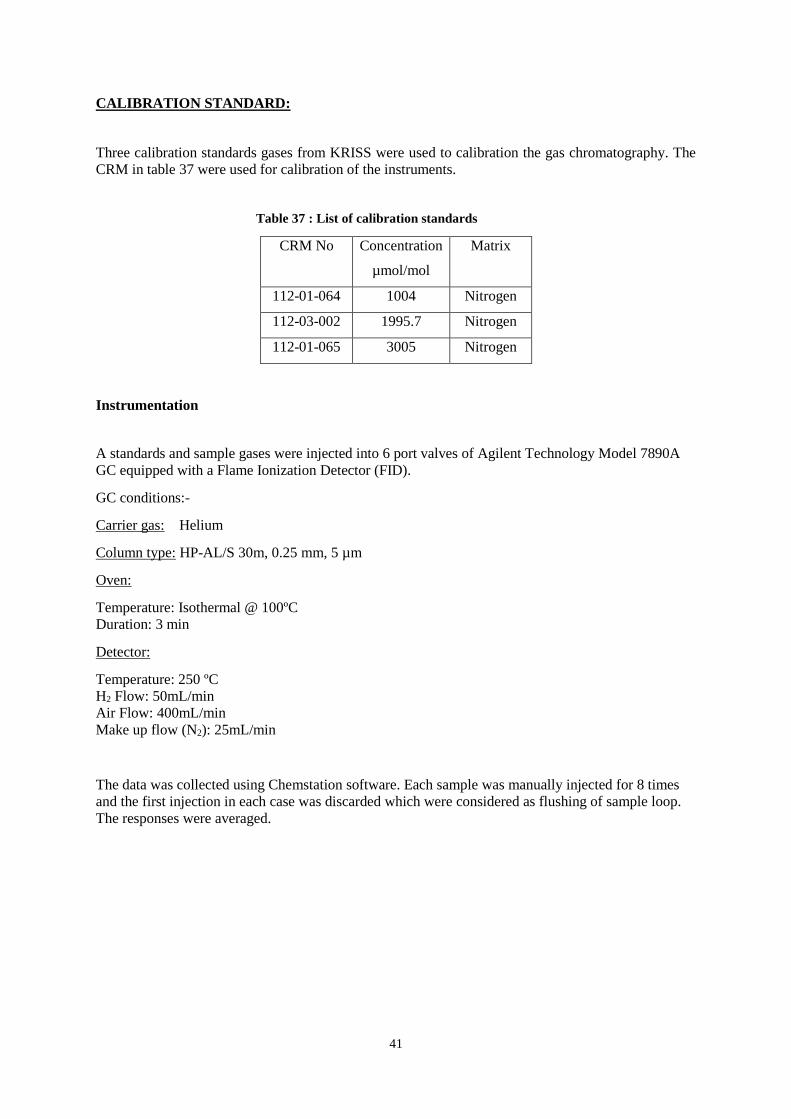
CALIBRATION STANDARD:
Three calibration standards gases from KRISS were used to calibration the gas chromatography. The
CRM in table 37 were used for calibration of the instruments.
Table 37 : List of calibration standards
CRM No Concentration
µmol/mol
Matrix
112-01-064 1004 Nitrogen
112-03-002 1995.7 Nitrogen
112-01-065 3005 Nitrogen
Instrumentation
A standards and sample gases were injected into 6 port valves of Agilent Technology Model 7890A
GC equipped with a Flame Ionization Detector (FID).
GC conditions:-
Carrier gas: Helium
Column type: HP-AL/S 30m, 0.25 mm, 5 µm
Oven:
Temperature: Isothermal @ 100ºC
Duration: 3 min
Detector:
Temperature: 250 ºC
H2 Flow: 50mL/min
Air Flow: 400mL/min
Make up flow (N2): 25mL/min
The data was collected using Chemstation software. Each sample was manually injected for 8 times
and the first injection in each case was discarded which were considered as flushing of sample loop.
The responses were averaged.

42
Calibration method and value assignment
Calibration Method
The calibration of the instruments has carried out according ISO 6143. The standards used were listed
in table 37. The standards were injected before the sample. Sample flow of each cylinder was
constantly at 40ml/min by a mass flow controller.
Sample Handling
During the measurement, the cylinders of standards and sample were stabilized at room temperature.
Uncertainty evaluation
The uncertainty of the unknown sample was calculated according to ISO 6143. The combined
uncertainty was multiplied by a coverage factor of 2 with a confidence interval of 95%. Two sources of
uncertainty were considered:
Table 38 : Source of uncertainty
Source of uncertainty
Symbol Type Distribution Std
Uncertainty (%)
Precision up A Normal 0.31
Calibration standard
ustd B Normal 0.25
Combined uncertainty, uc 0.56
Expanded uncertainty,U 1.12