apmp.qm-s5 essential and toxic elements in … the supplementary comparison apmp.qm-s5 was...
TRANSCRIPT

APMP.QM-S5
Essential and Toxic Elements in Seafood
Final Report
Authors:
Liliana Valiente (INTI)1, John W. Bennett (ANSTO)
2, Rodrigo Caciano de Sena
(INMETRO)3, Boriana Kotzeva (BIM)
4, Gabriela Massiff (CMQ)
5, Jingbo Chao and Jun
Wang (NIM)6, Randa Nasr (NIS)
7, Guillaume Labarraque (LNE)
8, Elias Kakoulidis Eugenia
Lampi (EIM)9, Della Wai-mei Sin, Chuen-shing Mok, Siu-kay Wong and Yiu-chung Yip
(GLHK)10
, Shankar Gopala Aggarwal Prabhat K. Gupta (NPLI)11
, Yanbei Zhu and Shin-ichi Miyashita (NMIJ)
12, Yong-Hyeon Yim (KRISS)
13, Osman Zakaria (SIRIM)
14, Judith Velina
Lara Manzano (CENAM)15
, Richard Shin (HSA)16
, Milena Horvat (JSI)17
, Charun Yafa (NIMT)
18
1 Instituto Nacional de technologia Industrial/Quimica, Argentina
2 Australian Nuclear Science and Technology Organisation, Australia
3 Instituto Nacional de Metrologia, Normalizacaoe Qualidade Industrial, Brazil
4 Bulgarian Institute of Metrology, National Centre of Metrology, Bulgaria
5 Chemical Metrology Center, Fundacion Chile
6 National Institute of Metrology, China
7 National Institute for Standards, Egypt
8 Laboratorie national de metrologie et d’essais, France
9 Hellenic Metrology Institute, EXHM, Greece
10 Government Laboratory, Hong Kong, China
11 CSIR-National Physical Laboratory, India
12 National Metrology Institute of Japan, Japan
13 Korean Research Institute of Standards & Science, Korea
14 National Metrology Laboratory, SIRIM BERHAD, Malaysia
15 Centro Nacional de Metrologia, Mexico
16 Health Sciences Authority, Singapore
17 Jozef Stefan Institute, Department of Environmental Sciences, Slovenia
18 National Institute of Metrology, Thailand
Abstract
The Supplementary Comparison APMP.QM-S5 was undertaken to demonstrate the
capability of participating national metrology institutes (NMIs) and designated institutes
(DIs) in measuring the contents of the incurred essential elements (iron and zinc) and toxic
elements (total arsenic and cadmium) at g/g levels in a test sample of dried shrimp by
various analytical techniques.
At the APMP TCQM Meeting held in Pattaya, Thailand in November 2010, Government
Laboratory of the Government of the Hong Kong Special Administrative Region (GLHK)
proposed this APMP supplementary comparison. The proposal was further discussed and
agreed upon at the CCQM Inorganic Analysis Working Group Meeting held in Paris in April
2011. GLHK was the coordinating laboratory for the supplementary comparison. For
enhancing the collaboration amongst specialized regional bodies in Asia-Pacific and to help
build the laboratory capacity of NMIs/DIs from developing economies, the reference values
of the supplementary comparison are used for evaluation of performance of participants of
an APMP proficiency testing programme (APMP PT 11-01), an Asia-Pacific Laboratory
Accreditation Cooperation proficiency testing programme (APLAC T082) and an
Asia-Pacific Economic Co-operation proficiency testing programme (APEC PT), which
were concurrently run using the same testing material as in APMP.QM-S5.
The supplementary comparison serves to facilitate claims by participants on the Calibration
and Measurement Capabilities (CMCs) as listed in Appendix C of the Key Comparison
Database (KCDB) under the Mutual Recognition Arrangement of the International
Committee for Weights and Measures (CIPM MRA).
Totally 18 institutes registered for the supplementary comparison and all of them submitted
their results. Most of the participants used microwave acid digestion methods for sample
dissolution. For the instrumental determination, a variety of techniques like ICP-MS,
ICP-OES, INAA and AAS were employed by the participants. For this supplementary
comparison, inorganic core capabilities have been demonstrated by concerned participants
with respect to methods including ICP-MS (without isotope dilution), ID-ICP-MS, ICP-OES,
INAA and AAS on the determination of total arsenic, cadmium, iron and zinc in a matrix of
seafood.

Page 1 of 47
Table of Content
Page
1 Introduction 2
2 Participating Institutes 3
3 Samples and Instructions to Participants 4
3.1 Materials 4
3.2 Homogeneity and Stability Study 4
3.3 Instructions to Participants 6
4 Methods of Measurement 7
5 Results and Discussion 11
5.1 General 11
5.2 Calculation of reference mass fraction values and associated
uncertainties
16
5.3 Equivalence statements 23
6 Demonstration of Core Capabilities 32
7 Conclusion 32
Acknowledgement 33
References 33
Appendix 34

Page 2 of 47
1. Introduction
Food contamination with toxic elements is one of the major food safety issues in the
Asia-Pacific region. Most economies have laboratories that carry out routine analyses of
toxic elements in seafood for regulatory compliance and surveillance purposes.
Examinations of essential elements are performed for nutritional studies and quality
assurance.
The Asia-Pacific Metrology Programme (APMP) has been organizing inter-comparisons for
the purpose of establishing the technical basis for mutual recognition of measurement
capabilities among national metrology institutes (NMIs)/designated institutes (DIs) in the
Asia-Pacific region and worldwide. At the APMP TCQM Meeting held in Pattaya,
Thailand in November 2010, Government Laboratory of the Government of the Hong Kong
Special Administrative Region (GLHK) proposed an APMP supplementary comparison
(APMP.QM-S5) on the determination of essential elements (iron and zinc) and toxic
elements (total arsenic and cadmium) in a dried shrimp material. The proposal was further
discussed and agreed upon at the CCQM Inorganic Analysis Working Group Meeting held in
Paris in April 2011. For enhancing the collaboration amongst specialized regional bodies in
Asia-Pacific and to help build the laboratory capacity of NMIs/DIs from developing
economies, the reference values of the supplementary comparison would be used for
evaluation of performance of participants of an APMP proficiency testing programme
(APMP PT 11-01), an Asia-Pacific Laboratory Accreditation Cooperation proficiency testing
programme (APLAC T082) and an Asia-Pacific Economic Co-operation proficiency testing
programme (APEC PT), which are concurrently run using the same testing material as in
APMP.QM-S5. Dried shrimps are prepared by drying of seawater shrimps under the sun and
are commonly consumed to impart a characteristic flavour to many Asian cuisines. The
study is based on the analysis of naturally incurred materials. Its aim is to demonstrate the
capability of participating NMIs and DIs in measuring the contents of the incurred analytes
(iron, zinc, total arsenic and cadmium) at g/g levels in a test sample of dried shrimp by
various analytical techniques.
The supplementary comparison serves to facilitate claims by participants on the Calibration
and Measurement Capabilities (CMCs) as listed in Appendix C of the Key Comparison
Database (KCDB) under the Mutual Recognition Arrangement of the International
Committee for Weights and Measures (CIPM MRA). Participants are requested to complete
the Inorganic Core Capabilities Tables as a means of providing evidence for their CMC
claims.

Page 3 of 47
2. Participating Institutes
Totally 18 institutes registered for the Supplementary Comparison APMP.QM-S5. The list
showing the countries’ names of the participating NMIs/DIs in alphabetical order is given in
Table 1.
Table 1. List of participating NMIs/DIs for APMP.QM-S5
No. Institute Country Contact person
Results
submitted for
measurand
1
INTI
Instituto Nacional de technologia
Industrial/Quimica
Argentina Liliana Valiente As, Cd, Fe, Zn
2
ANSTO
Australian Nuclear Science and Technology
Organisation
Australia John W. Bennett As, Fe, Zn
3
INMETRO
Instituto Nacional de Metrologia,
Normalizacaoe Qualidade Industrial
Brazil Rodrigo Caciano
de Sena As, Cd, Fe, Zn
4
BIM
Bulgarian Institute of Metrology, National
Centre of Metrology
Bulgaria Boriana Kotzeva Zn
5 CMQ
Chemical Metrology Center, Fundacion Chile Chile Gabriela Massiff As, Cd, Fe, Zn
6 NIM
National Institute of Metrology, P.R. China China
Jingbo Chao
Jun Wang As, Cd, Fe, Zn
7 NIS
National Institute for Standards Egypt Randa Nasr As, Cd, Fe, Zn
8 LNE
Laboratorie national de metrologie et d’essais France
Guillaume
Labarraque As, Cd, Fe
9 EIM
Hellenic Metrology Institute, EXHM Greece
Elias Kakoulidis
Eugenia Lampi As, Cd, Fe, Zn
10 GLHK
Government Laboratory, Hong Kong, China
Hong Kong,
China Yiu-chung Yip As, Cd, Fe, Zn
11 NPLI
CSIR-National Physical Laboratory India
Shankar Gopala
Aggarwal
Prabhat K. Gupta
As, Cd, Fe, Zn
12 NMIJ
National Metrology Institute of Japan Japan
Yanbei Zhu,
Shin-ichi Miyashita As, Cd, Fe, Zn
13
KRISS
Korean Research Institute of Standards &
Science
Korea,
Republic of Yong-Hyeon Yim As, Cd, Fe, Zn
14
SIRIM
National Metrology Laboratory, SIRIM
BERHAD
Malaysia Osman Zakaria As, Cd, Fe, Zn
15 CENAM
Centro Nacional de Metrologia Mexico
Judith Velina Lara
Manzano As, Cd, Fe, Zn
16 HSA
Health Sciences Authority Singapore Richard Shin Fe
17
JSI
Jozef Stefan Institute, Department of
Environmental Sciences
Slovenia Milena Horvat As, Cd, Fe, Zn
18 NIMT Thailand Charun Yafa As, Cd, Fe, Zn

Page 4 of 47
No. Institute Country Contact person
Results
submitted for
measurand
National Institute of Metrology (Thailand)
Remarks: (i) KRISS did not submit results for Fe due to contamination problems found by the institute.
(ii) Both NMIJ and JSI submitted two sets of results using different determination techniques.
3. Samples and Instructions to Participants
3.1. Materials
About 13 kg of dried shrimps was purchased from the local market in Hong Kong. The dried
shrimps were confirmed to contain quantities of incurred iron, zinc, arsenic and cadmium.
The dried shrimps were rinsed with anhydrous methanol to remove dirt and foreign matter
and air-dried in a Class 1000 cleanroom. The air-dried shrimps were blended in a high-speed
blender (25000 revolutions per minute), then de-fatted with n-hexane and air-dried in the
cleanroom. The air-dried sample was further blended and ground to powder using a
high-speed blender (25000 revolutions per minute). The powder was subject to a sieving
process through 200 m calibrated sieves. The sieved powder was thoroughly homogenized
in a 3-dimensional mixer for 5 days. The powdered material was irradiated using a 137
Cs
gamma source at a dose of about 10 kGy for disinfection. The irradiated material was
packed into pre-cleaned and nitrogen-flushed amber glass bottles. About 300 bottles, each
containing about 25 g of powered sample, were prepared. Finally, each bottled sample was
vacuum-sealed in a polypropylene bag and stored at room temperature (20 ± 5 C) prior to
distribution or use.
3.2. Homogeneity and Stability Study
The homogeneity study was conducted after the testing material was bottled and irradiated.
10 bottles of the test material (conditioned at 20 ± 5 C) were randomly selected from the
whole lot of bottles prepared. Two test portions of 0.5 g were taken from each bottle for
analysis.
The test portions were digested using microwave-assisted digestion. Following validated
procedures, the digested samples and method blanks were analysed using standard additions
with high resolution ICP-MS for the analysis of As, Cd and Zn, and using standard additions
with ICP-AES for the analysis of Fe.
ANOVA technique was applied to assess the between-bottle heterogeneity and the standard
uncertainty originated from the between-bottle heterogeneity was calculated using the
equation (1) given below in accordance with ISO Guide 35:2006 [1]. The results are
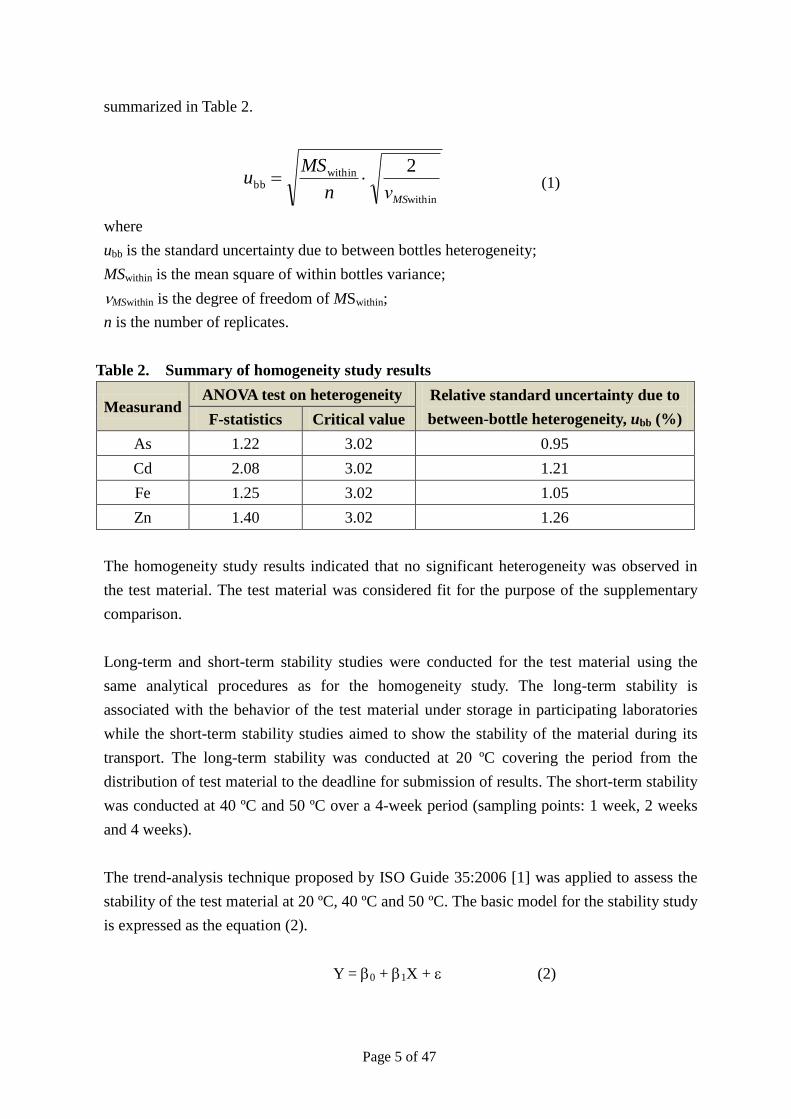
Page 5 of 47
summarized in Table 2.
within
withinbb
2
MSνn
MSu (1)
where
ubb is the standard uncertainty due to between bottles heterogeneity;
MSwithin is the mean square of within bottles variance;
MSwithin is the degree of freedom of MSwithin;
n is the number of replicates.
Table 2. Summary of homogeneity study results
Measurand ANOVA test on heterogeneity Relative standard uncertainty due to
between-bottle heterogeneity, ubb (%) F-statistics Critical value
As 1.22 3.02 0.95
Cd 2.08 3.02 1.21
Fe 1.25 3.02 1.05
Zn 1.40 3.02 1.26
The homogeneity study results indicated that no significant heterogeneity was observed in
the test material. The test material was considered fit for the purpose of the supplementary
comparison.
Long-term and short-term stability studies were conducted for the test material using the
same analytical procedures as for the homogeneity study. The long-term stability is
associated with the behavior of the test material under storage in participating laboratories
while the short-term stability studies aimed to show the stability of the material during its
transport. The long-term stability was conducted at 20 ºC covering the period from the
distribution of test material to the deadline for submission of results. The short-term stability
was conducted at 40 ºC and 50 ºC over a 4-week period (sampling points: 1 week, 2 weeks
and 4 weeks).
The trend-analysis technique proposed by ISO Guide 35:2006 [1] was applied to assess the
stability of the test material at 20 ºC, 40 ºC and 50 ºC. The basic model for the stability study
is expressed as the equation (2).
Y = 0 + 1X + (2)

Page 6 of 47
where 0 and 1 are the regression coefficients; and denotes the random error component.
With appropriate t-factors, 1 can be tested for significance of deviation from zero. Table 3
summarizes the results of the stability tests at 20 ºC, 40 ºC and 50 ºC respectively.
Table 3. Summary of stability study results
Measurand p-value for significance test for 1
20 ºC 40 ºC 50 ºC
As 0.267 0.583 0.931
Cd 0.173 0.649 0.640
Fe 0.142 0.378 0.570
Zn 0.668 0.569 0.173
As all p-values were greater than 0.05, it was concluded that the corresponding 1 value was
not significantly deviated from zero at 95% level of confidence. In other words, no
instability was observed for the test material at 20 ºC, 40 ºC and 50 ºC during the testing
period. The test material was considered fit for the purpose of the supplementary
comparison.
To monitor the highest temperature that the test material would be exposed to during the
transportation, temperature recording strips were sent along with the test material to the
participating institutes. According to the information provided by the participants in the
Sample Receipt Forms, the maximum temperatures that the test material experienced were
all below 40 ºC.
3.3. Instructions to Participants
Participants were free to choose the analytes and any analytical methods for examination.
They were advised to mix the sample thoroughly before processing. A sample size of at least
0.5 g was recommended for testing. Participants were requested to perform at least three
independent measurements on three separate portions of the sample and to determine the
mass fractions of the analytes of interest. For determination of dry mass correction, a
minimum of three separate portions (recommended size to be about 1 g each) of the sample
was recommended to be placed over anhydrous calcium sulphate (DRIERITE®) in a
desiccator at room temperature for a minimum of 10 days until reaching a constant mass.
Participants were also advised to carry out dry mass correction and analysis of the test
material at the same time.
Participants were asked to report the mean value of at least 3 independent measurements of
the mass fractions of measurands in g/g for arsenic (total), cadmium, iron and zinc on a dry
Page 7 of 47
mass basis and its associated uncertainty (combined standard uncertainty at 1 sigma level).
Participants were requested to provide (i) description of analytical methods (including
sample dissolution procedures if any); (ii) details of the uncertainty estimation (including
complete specification of the measurement equations and description of all uncertainty
sources and their typical values); and (iii) sources and purity of any reference materials used
for calibration purposes.
4. Methods of Measurement
ICP-MS, AAS and INAA were widely used by the participants. The dissolution method
mostly used was microwave assisted digestion. A summary of the methods of measurement
used by the participants is given in Table 4. The information about dry mass correction is
shown in Table 5.
Table 4. Summary of methods of measurement used by the participants
Institute Analyte Dissolution method Calibration
method
Analytical
instrument
Reference material
used for calibration
(Traceability)
INTI Fe, Zn,
As, Cd
Microwave-assisted
digestion with
closed vessel
(HNO3 + H2O2)
Fe, Zn, Cd:
External
Calibration
Curve. Linear
Regression
As: Standard
Addition
Technique
Fe, Zn: Flame AAS
As, Cd: GF-AAS
Transversal Heated
Atomizer, with
Zeeman
Background Corr.
Fe: NIST SRM 3126a
Zn: NIST SRM 3168a
As: NIST SRM 3103a
Cd: NIST SRM 3108
ANSTO Fe, Zn,
As
Not applicable k0- NAA HPGe gamma
spectrometry
IRMM-530r
INMETRO Fe, Zn,
As, Cd
Microwave-assisted
digestion
(HNO3/H2O2)
External
Calibration
Fe: ICP-AES
Zn, As, Cd:
ICP-MS
Fe: NIST SRM 3126a
Zn: NIST SRM 3168a
As: NIST SRM 3103a
Cd: NIST SRM 3108
BIM Zn Microwave-assisted
digestion (HNO3);
Thermal digestion
(HNO3/HF)
External linear
calibration
method
ICP-quadrupole
MS
170369 Zn ICP
standard traceable to
SRM from NIST
Zn(NO3)2 in HNO3
2-3%, CertiPUR
CMQ Fe, Zn,
As, Cd
Microwave-assisted
digestion
(HNO3/H2O2/HF)
Fe: Bracketing
Zn, As, Cd:
Known Addition
ICP-MS Fe: NIST SRM 3126a
(Lot 51031)
Zn: NIST SRM 3168a
(Lot 80123)
As: NIST SRM 3103a
(Lot 10713)
Cd: NIST SRM 3108
(Lot 60531)
NIM Fe, Zn,
As, Cd
Microwave-assisted
digestion
(HNO3/H2O2/HF)
Fe, Zn, Cd:
Double IDMS
As: Standard
addition method
Q-ICP-MS Fe: GBW 08616
Zn: GBW 08620
As: GBW 08667
Cd: GBW 08612
NIS Fe, Zn, Fe, Zn, Cd: 1- Dry Fe, Zn, As: Fe, Zn: Flame Fe: NIS iron certified

Page 8 of 47
Institute Analyte Dissolution method Calibration
method
Analytical
instrument
Reference material
used for calibration
(Traceability)
As, Cd ashing; 2- Digestion
by perchloric acid
and nitric acid
As: Digestion by
perchloric acid and
nitric acid
External
calibration
Cd: 1-External
calibration;
2-standard
addition
calibration
atomic absorption
spectrometer
As, Cd:
Electrothermal
atomic absorption
spectrometer
reference material
Zn: NIS Zinc certified
reference material
As: NIS Arsenic
certified reference
material
Cd: NIS Cadmium
certified reference
material
LNE Fe, As,
Cd
Microwave-assisted
digestion
(HNO3/H2O2/HF)
Fe, Cd: Double
IDMS
As: Standard
addition
Fe, As: Quad
ICP/MS + CCT
Cd: Quad ICP/MS
Fe: High purity Iron
BNM 001
As: High purity As2O5
(Alfa Aesar 99.9%)
Cd: High purity
Cadmium (Prolabo
99.9999%)
EIM Fe, Zn,
As, Cd
Microwave-assisted
digestion
(HNO3/H2O2)
Standard
additions with
internal standard
High resolution
ICP-MS
Fe: NIST SRM 3126a
Zn: NIST SRM 3168a
As: NIST SRM 3103a
Cd: NIST SRM 3108
GLHK Fe, Zn,
As, Cd
Microwave-assisted
digestion
(HNO3/H2O2/HF)
Fe, Zn, Cd:
Double IDMS
As: Gravimetric
standard addition
High resolution
ICP-MS
Fe: NIST SRM 3126a
Zn: NIST SRM 3168a
As: NIST SRM 3103a
Cd: NIST SRM 3108
NPLI Fe, Zn,
As, Cd
Microwave-assisted
digestion (HNO3 +
H2O2)
Fe, Zn, As:
Absorbance
versus
concentration of
standards
Cd: Counts per
sec. versus
concentration of
standards
Fe, Zn: F-AAS
As: GF-AAS
Cd: High Resolution
ICP-MS
Fe: NIST SRM 3126a
Zn: NIST SRM 3168a
As: NIST SRM 3103a
Cd: NIST SRM 1643e
NMIJ (1) Fe, Zn,
As, Cd
Microwave-assisted
digestion
(HNO3/H2O2/HF)
Standard addition
ICP-MS
ICP-Q-MS JCSS standard
solution
NMIJ (2) Fe, Zn,
Cd
Microwave-assisted
digestion (HNO3/
HClO4)
Double IDMS ICP-Q-MS JCSS standard
solution
KRISS Zn, As,
Cd
Zn, Cd:
Microwave-assisted
digestion
(HNO3/H2O2)
As: Not applicable
Zn, Cd: Double
IDMS
As: INAA
Zn: Magnetic
sector ICP-MS
(medium
resolution)
As: Highly pure Ge
detector
Zn: KRISS Zn
primary standard
solution
As: KRISS As
primary standard
solution

Page 9 of 47
Institute Analyte Dissolution method Calibration
method
Analytical
instrument
Reference material
used for calibration
(Traceability)
Cd: Magnetic
sector ICP-MS
(low resolution)
Cd: KRISS Cd
primary standard
solution
SIRIM Fe, Zn,
As, Cd
Microwave-assisted
digestion
(6 mL HNO3 + 1
mL HCl)
External
calibration
ICP-MS (without
isotope dilution)
Fe: NIST SRM 728
Zn: NIST SRM 728
As: NIST SRM 83
Cd: NIST SRM 728
CENAM Fe, Zn,
As, Cd
Microwave-assisted
digestion
(HNO3/H2O2/HF)
Fe, Zn, Cd: Exact
matching double
ID-ICP-SFMS
As: Internal
standard with
standard
addition-ICP-SF
MS
High resolution
ICP-SFMS
Fe: Primary reference
material: DMR-86c
iron monoelemental
aqueous solution
Zn: Primary reference
material: DMR-441
zinc monoelemental
aqueous solution
As: Reference
material used for
calibration
DMR-312b arsenic;
for internal standard
SRM-3167 yttrium
monoelemental
aqueous solution
Cd: Primary reference
material: DMR-461a
Cadmium
monoelemental
aqueous solution
HSA Fe Microwave-assisted
digestion
(HNO3/H2O2/HF)
Double IDMS ICP-MS NIST SRM 3126a
JSI (1) Fe, Zn,
As, Cd
Closed vessel
microwave-assisted
digestion
(HNO3/H2O2/HF)
External
calibration
ICP-MS Fe: NIST SRM 3126a
Zn: NIST SRM 3168a
As: NIST SRM 3103a
Cd: NIST SRM 3108
JSI (2) Fe, Zn,
As
No digestion k0-method of
INAA
TRIGA Mark II
research reactor,
absolutely
calibrated HPGe
detector
IRMM-530R
NIMT Fe, Zn,
As, Cd
Microwave-assisted
digestion
(HNO3/H2O2/HF)
Fe, Zn, Cd:
IDMS
As: Standard
Addition with Rh
as an internal
standard
ICP-QMS Fe: NIST SRM 3126a
Zn: NIST SRM 3168a
As: NIST SRM 3103a
Cd: NIST SRM 3108

Page 10 of 47
Table 5. Information reported by the participants for dry mass correction
Institute Amount and number of
sample aliquots taken for
dry mass correction
Correction for dry mass (%) Uncertainty for dry mass
correction
INTI Number of sample aliquots
taken for dry mass correction:
3
Correction for dry mass (% of
weighted sample): 84.9%
Dry Mass Factor
correction:1.1779
Uncertainty for dry mass
correction, %Urel: 2.2 (k = 2)
ANSTO 3 aliquots, from 0.99 g to 1.06
g
Moisture content 14.76 (% of
weighted sample)
Standard deviation of mean
moisture content 0.025 (% of
weighted sample)
INMETRO Amount of sample aliquots
taken for dry mass correction
= 1.45 g
Correction for dry mass (% of
weighted sample) = 0.90
(correction factor)
Uncertainty for dry mass
correction = 0.01 (k = 2)
BIM Dry mass correction was made
based on 3 samples (every
sample is about 1.0000 g).
The following results were
obtained: 86.63, 86.85 and
86.65 % of weighted sample.
Standard uncertainty = 0.002
CMQ Three portions of
approximately 0.8 grams of
sample were weighed and then
dried in a desiccator with
anhydrous calcium sulphate
(DRIERITE®) at the room
temperature for a minimum of
10 days and this procedure
was repeated until constant
weight was obtained.
Moisture (%) = 14.96 u std = 0.00009
NIM 1 g/aliquot and 3 aliquots The dry mass was the 85.2%
of the weighted sample.
The relative uncertainty was
0.1% for dry mass correction.
NIS No. of sample = 3
Weight taken = 1.01705 g,
1.00294 g, 1.00257 g
Weight loss% = 13.623,
13.842, 13.665
Uexp = 0.009864g
LNE Three aliquots of around 1g
had been taken.
Mean of the 3 aliquots:
12.75%
Standard deviation of the
mean: 0.3%
EIM Five samples (1 g portions) of
the material were dried over
DRIERITE for 30 days and
subsequently introduced in a
vacuum oven at room
temperature for 24 h.
The dry mass fraction of the
material was calculated as
0.84810.
The dry mass fraction of the
material was calculated as
0.84810 with a combined
standard uncertainty of
0.00054 and an expanded
uncertainty of 0.00108 (k = 2).
GLHK Amount: 1 g/aliquot
Number of sample aliquots: 3
Analysis of cadmium: 84.88%
of weighted sample
Analysis of iron: 84.74% of
weighted sample
Analysis of zinc: 84.74% of
weighted sample
Analysis of arsenic: 85.07%
of weighted sample
Analysis of cadmium: 0.08%
of the combined standard
uncertainty
Analysis of iron: 0.08% of the
combined standard uncertainty
Analysis of zinc: 0.25% of the
combined standard uncertainty
Analysis of arsenic: 0.02% of
the combined standard
uncertainty
NPLI Information not provided Information not provided Information not provided
NMIJ (1) 0.5 g to 1.0 g for each of the 6
sub-samples
Correction for dry mass (% of
weighted sample) = 85.13%
Uncertainty for dry mass
correction = 0.05%
NMIJ (2) 1.0 g for each of the three
sub-samples
Correction for dry mass (% of
weighted sample) = 85.78%
Uncertainty for dry mass
correction = 0.05%

Page 11 of 47
Institute Amount and number of
sample aliquots taken for
dry mass correction
Correction for dry mass (%) Uncertainty for dry mass
correction
KRISS Mass of sample taken: 1.0 g,
number of sample taken: 3
Dry mass: 84.74 % of
weighted sample
Uncertainty for dry mass
correction: 0.07%
SIRIM Three replicate of 1.0 gram of
sample was taken and placed
over anhydrous calcium
sulphate (DRIERITE®) in a
desiccator at room
temperature for a minimum of
10 days until a constant mass
is reached.
Moisture (%) = 0.59 Relative Standard uncertainty,
U(MC)/Ms = 0.0001325
CENAM Three samples of
approximately 1 g were taken.
A mean value of 15.1% of
moisture in the sample
Relative standard uncertainty
for dry mass correction:
0.073%
HSA The moisture content in the
shrimp sample was
determined from three
separate sub-samples. The
bottle was thoroughly shaken
before three sub-samples of
approximately 1.0 g each were
taken and placed over
anhydrous calcium sulphate
(DRIERITE®). The first
weighing was done after 10
days and subsequently at 7
days interval. Constant mass
was reached after 31days.
The average loss in moisture
was found to be 15.17%.
Estimate derived from drying
experiment over anhydrous
calcium sulphate
(DRIERITE®), u(FMCF) =
0.00031
JSI (1) An aliquot varied from 1.06 to
1.18 g. 4 aliquots were taken
in this study.
The dry mass obtained for
APMP.QM-S5 Seafood was
84.8228% (15.1772%
moisture content).
Expanded combined
uncertainty of the dry mass
correction = 0.15%
JSI (2) An aliquot varied from 1.06 to
1.18 g. 4 aliquots were taken
in this study.
The dry mass obtained for
APMP.QM-S5 Seafood was
84.8228% (15.1772%
moisture content).
Expanded combined
uncertainty of the dry mass
correction = 0.15%
NIMT Amount and number of
sample aliquots taken for dry
mass correction ~0.5 g
Moisture content 14.48% Taken from standard deviation
of 20 measurements divided
by √n
5. Results and Discussion
5.1. General
A total of 69 measurement results were reported for APMP.QM-S5 from 18 NMIs/DIs. The
reported results sorted in an ascending order are presented in Tables 6-9. All measurement
results were reported on a dry mass basis for comparability purposes.

Page 12 of 47
Table 6. Reported results for Arsenic (total)
Institute Reported
value (g/g)
Reported
standard
uncertainty
(g/g)
Coverage
factor k
(95% level of
confidence)
Expanded
uncertainty
(g/g)
Analytical
instrument /
Method
NIS 37.2175 1.0764 2 2.1527 Electrothermal AAS
ANSTO 41.72* 0.92 2 1.84 k0-NAA
JSI (1) 42.8 0.9 2 1.8 ICP-MS
SIRIM 43.49 1.80 2 3.60 ICP-MS
INMETRO 43.9 0.45 2 0.9 ICP-MS
LNE 44 1 2 2 ICP-Q-MS + CCT
NIMT 44.6 1.1 2 2.2 ICP-Q-MS
NMIJ (1) 44.7 0.5 2 0.9 ICP-Q-MS
(standard addition)
NIM 44.7 0.7 2 1.4 ICP-Q-MS
CMQ 45.32 0.38 2 0.76 ICP-MS
CENAM 45.6 1.4 2 2.8
Internal standard +
Standard
addition-ICP-SFMS
GLHK 46.1 0.9 2 1.8 High resolution
ICP-MS
JSI (2) 47.5** 1.7 2 3.4 k0-INAA
KRISS 47.9 0.5 2.57 1.3 INAA
EIM 48.14 0.70 2 1.41 High resolution
ICP-MS
INTI 48.2 0.87 2 1.7 GF-AAS
NPLI 49.94 2.10 2.12 4.45 GF-AAS
Note:
* The result submitted by ANSTO was not included in the calculation of the supplementary
comparison reference value (SCRV). Please refer to Section 5.2 for details.
** It was agreed in the CCQM IAWG November 2011 Meeting that when more than one
value was provided by an NMI/DI, the value with the smallest uncertainty should normally
be used for the calculation of SCRV. As such, the result submitted by JSI (2) was not
included in the calculation of SCRV. Please refer to Section 5.2 for details.

Page 13 of 47
Table 7. Reported results for Cadmium
Institute Reported
value (g/g)
Reported
standard
uncertainty
(g/g)
Coverage
factor k
(95% level of
confidence)
Expanded
uncertainty
(g/g)
Analytical
instrument /
Method
JSI 0.121* 0.002 2 0.004 ICP-MS
NPLI 0.129 0.0015 2.37 0.0035 High resolution
ICP-MS
SIRIM 0.185 0.003 2 0.006 ICP-MS
LNE 0.193 0.003 2 0.006 ICP-Q-MS
INMETRO 0.200 0.004 2 0.008 ICP-MS
GLHK 0.220 0.006 2 0.013 High resolution
ICP-MS
CMQ 0.223 0.003 2 0.005 ICP-MS
NMIJ (1) 0.223 0.002 2 0.004 ICP-Q-MS
(standard addition)
NMIJ (2) 0.224** 0.002 2 0.004 ICP-Q-MS
(double IDMS)
CENAM 0.2252 0.0014 2 0.0028
IE-double
ID-ICP-SFMS (low
resolution mode)
KRISS 0.227 0.006 1.96 0.011
Magnetic sector
ICP-MS
(low resolution)
INTI 0.23 0.016 2 0.03 GF-AAS
EIM 0.234 0.005 2 0.010 High resolution
ICP-MS
NIM 0.236 0.003 2 0.006 ICP-Q-MS
NIMT 0.255 0.005 2 0.010 ICP-Q-MS
NIS 0.7061 0.0208 2 0.0415 Electrothermal AAS
Note:
* The result submitted by JSI was not included in the calculation of the supplementary
comparison reference value (SCRV). Please refer to Section 5.2 for details.
** It was agreed in the CCQM IAWG November 2011 Meeting that when more than one
value was provided by an NMI/DI, the value with the smallest uncertainty should normally
be used for the calculation of SCRV. As such, the result submitted by NMIJ (2) was not
included in the calculation of SCRV. Please refer to Section 5.2 for details.

Page 14 of 47
Table 8. Reported results for Iron
Institute Reported value
(g/g)
Reported
standard
uncertainty
(g/g)
Coverage
factor k (95%
level of
confidence)
Expanded
uncertainty
(g/g)
Analytical
instrument /
Method
SIRIM 155.98 4.80 2 9.61 ICP-MS
ANSTO 159.9* 2.8 2 5.6 k0-NAA
NIS 169.0934 4.8060 2 9.6120 Flame AAS
EIM 169.84 3.19 2 6.38 High resolution
ICP-MS
CMQ 175.1 1.6 2 3.2 ICP-MS
NIMT 176 3 2 6 ICP-Q-MS
JSI (2) 177** 6 2 12 k0-INAA
JSI (1) 179 2 2 4 ICP-MS
INMETRO 179.4 3.75 2 7.5 ICP-AES
NMIJ (2) 180.2** 4.5 2 9.0 ICP-Q-MS
(double IDMS)
NMIJ (1) 183.5 1.8 2 3.5
ICP-Q-MS
(standard
addition)
NIM 183.8 2.2 2 4.4 ICP-Q-MS
HSA 184.96 4.88 2 9.76 ICP-MS
LNE 185 3.5 2 7 Quard ICP/MS
+ CCT
NPLI 186.58 2.73 2.45 6.70 Flame AAS
GLHK 186.9 5.5 2 11.0 High resolution
ICP-MS
CENAM 189 5.5 2 11
Double
ID-ICP-SFMS
(medium
resolution mode)
INTI 194 7.3 2 15 Flame AAS
Note:
* The result submitted by ANSTO was not included in the calculation of the supplementary
comparison reference value (SCRV). Please refer to Section 5.2 for details.
** It was agreed in the CCQM IAWG November 2011 Meeting that when more than one
value was provided by an NMI/DI, the value with the smallest uncertainty should normally
be used for the calculation of SCRV. As such, the results submitted by JSI (2) and NMIJ (2)
were not included in the calculation of SCRV. Please refer to Section 5.2 for details.

Page 15 of 47
Table 9. Reported results for Zinc
Institute Reported
value (g/g)
Reported
standard
uncertainty
(g/g)
Coverage
factor k
(95% level
of
confidence)
Expanded
uncertainty
(g/g)
Analytical instrument
/ Method
SIRIM 48.53 0.66 2 1.33 ICP-MS
ANSTO 51.47* 0.90 2 1.80 k0-NAA
NIS 54.9669 1.4142 2 2.8285 Flame AAS
INMETRO 56.8 1.2 2 2.4 ICP-MS
BIM 57.9* 1.7 2 3.4 ICP-Q-MS
INTI 58.5 1.6 2 3.3 Flame AAS
NIMT 58.6 0.9 2 1.8 ICP-Q-MS
JSI (2) 58.9** 1.6 2 3.2 k0-INAA
NMIJ (1) 59.5 0.8 2 1.5 ICP-Q-MS (standard
addition)
NMIJ (2) 59.8** 1.7 2 3.4 ICP-Q-MS
(double IDMS)
JSI (1) 59.9 0.9 2 1.8 ICP-MS
GLHK 60.0 1.0 2 2.0 High resolution
ICP-MS
CMQ 60.22 0.74 2 1.48 ICP-MS
CENAM 60.3 2.0 2 4.1
IE-double
ID-ICP-SFMS (medium
resolution mode)
KRISS 60.30 0.86 1.97 1.68
Magnetic sector
ICP-MS
(medium resolution)
NIM 60.8 0.5 2 1.0 ICP-Q-MS
EIM 61.72 1.11 2 2.22
High resolution
ICP-MS
NPLI 73.13 1.57 2.45 3.85 Flame AAS
Note:
* The results submitted by ANSTO and BIM were not included in the calculation of the
supplementary comparison reference value (SCRV). Please refer to Section 5.2 for details.
** It was agreed in the CCQM IAWG November 2011 Meeting that when more than one
value was provided by an NMI/DI, the value with the smallest uncertainty should normally
be used for the calculation of SCRV. As such, the results submitted by JSI (2) and NMIJ (2)
were not included in the calculation of SCRV. Please refer to Section 5.2 for details.
Page 16 of 47
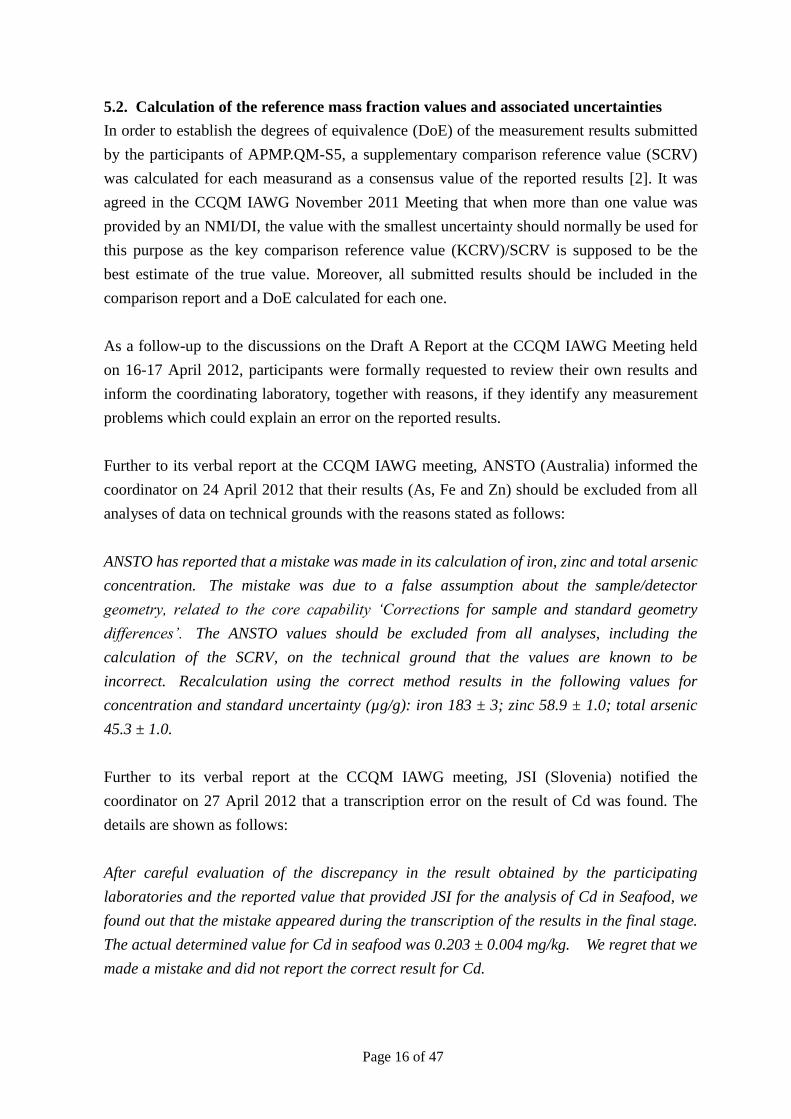
5.2. Calculation of the reference mass fraction values and associated uncertainties
In order to establish the degrees of equivalence (DoE) of the measurement results submitted
by the participants of APMP.QM-S5, a supplementary comparison reference value (SCRV)
was calculated for each measurand as a consensus value of the reported results [2]. It was
agreed in the CCQM IAWG November 2011 Meeting that when more than one value was
provided by an NMI/DI, the value with the smallest uncertainty should normally be used for
this purpose as the key comparison reference value (KCRV)/SCRV is supposed to be the
best estimate of the true value. Moreover, all submitted results should be included in the
comparison report and a DoE calculated for each one.
As a follow-up to the discussions on the Draft A Report at the CCQM IAWG Meeting held
on 16-17 April 2012, participants were formally requested to review their own results and
inform the coordinating laboratory, together with reasons, if they identify any measurement
problems which could explain an error on the reported results.
Further to its verbal report at the CCQM IAWG meeting, ANSTO (Australia) informed the
coordinator on 24 April 2012 that their results (As, Fe and Zn) should be excluded from all
analyses of data on technical grounds with the reasons stated as follows:
ANSTO has reported that a mistake was made in its calculation of iron, zinc and total arsenic
concentration. The mistake was due to a false assumption about the sample/detector
geometry, related to the core capability ‘Corrections for sample and standard geometry
differences’. The ANSTO values should be excluded from all analyses, including the
calculation of the SCRV, on the technical ground that the values are known to be
incorrect. Recalculation using the correct method results in the following values for
concentration and standard uncertainty (µg/g): iron 183 ± 3; zinc 58.9 ± 1.0; total arsenic
45.3 ± 1.0.
Further to its verbal report at the CCQM IAWG meeting, JSI (Slovenia) notified the
coordinator on 27 April 2012 that a transcription error on the result of Cd was found. The
details are shown as follows:
After careful evaluation of the discrepancy in the result obtained by the participating
laboratories and the reported value that provided JSI for the analysis of Cd in Seafood, we
found out that the mistake appeared during the transcription of the results in the final stage.
The actual determined value for Cd in seafood was 0.203 ± 0.004 mg/kg. We regret that we
made a mistake and did not report the correct result for Cd.

Page 17 of 47
On 7 June 2012, BIM (Bulgaria) reported to the coordinator that the Zn standard solution
(1000 mg/L) which used was used directly for calibration purpose was purchased from a
commercial supplier. The traceability of the Zn standard solution did not comply with the
requirements as stated in the CIPM MRA document “Traceability in CIPM MRA” [3]. The
details are shown as follows:
Our results were not obtained against a SRM issued by an NMI, but with the aid of the Zinc
standard mentioned.
In this regard, the measurement results reported by ANSTO (As, Fe and Zn), JSI (Cd) and
BIM (Zn) were excluded on technical grounds in the calculation of SCRV.
The measurement results that were included in the calculation of SCRV are shown in Tables
6-9. The measurement results there were excluded with technical reasons in the calculation
of SCRV are also provided in the same tables. The consensus values and their dispersion of
the valid participants’ results using the following three different statistical quantifiers are
shown in Table 10.
Arithmetic mean and standard deviation
Median and MADe [median absolute deviation (MAD) multiplied by 1.483]
Mixture model median (MM-median) and standard deviation of MM-median [4]
Table 10. Results of various consensus values and their dispersion (unit: g/g)
Measurand Arithmetic
mean
Standard
deviation Median MADe
MM-
median
S(MM-
median)
As 45.1 3.0 44.7 1.8 45.1 2.6
Cd 0.249 0.135 0.224 0.016 0.224 0.026
Fe 179.9 9.6 183.5 6.7 181.4 8.4
Zn 59.5 5.1 60.0 1.6 59.7 2.2
As depicted in Table 10, the following findings were observed:
A good agreement was observed among the consensus values calculated as the
arithmetic mean, median and MM-median for As, Fe and Zn.
For the measurand of Cd, there was a good agreement between the consensus values
calculated as the median and MM-median.
It is noted that the arithmetic mean is not robust to the presence of extreme values. As such,
this statistical quantifier is not recommended to be used as the estimation of SCRV. Given
that each of the participants gives a reliable estimate of measurement uncertainty, the

Page 18 of 47
MM-median is a robust estimator of SCRV and accounts for the reported uncertainty of each
participant. On the other hand, the median is a simple and robust estimator of SCRV and
does not require the participants’ uncertainties for calculation.
GLHK, as the coordinating laboratory of APMP.QM-S5, presented the results and their
dispersion as shown in Table 10 at the CCQM IAWG Meeting held on 9-11 October 2012.
For APMP.QM-S5, the two statistical approaches, MM-median and median, gave similar
values for SCRV. To this end, the median and the standard uncertainty derived from MADe
were recommended to be the SCRV and u(SCRV) resepectively. The standard uncertainty
derived from MADe was calculated using the equation (3), where n is the number of
participants’ results included in the calculation. Following the CCQM Guidance Note [2],
the supplementary comparison expanded uncertainty was calculated as U(SCRV) = 2
u(SCRV). The calculated SCRV, u(SCRV) and U(SCRV) are summarized in Table 11.
nu
MADe25.1(SCRV) (3)
Table 11. Calculated SCRV, u(SCRV) and U(SCRV)
Measurand SCRV u(SCRV) U(SCRV) U(SCRV)
As 44.7 g/g 0.58 g/g 1.2 g/g 2.6%
Cd 0.224 g/g 0.0054 g/g 0.011 g/g 4.8%
Fe 183.5 g/g 2.15 g/g 4.3 g/g 2.3%
Zn 60.0 g/g 0.54 g/g 1.1 g/g 1.8%
For ease of reference, the measurement results of the APMP.QM-S5 are presented in Figures
1-4 with the respective proposed SCRV (as median) and u(SCRV). The solid horizontal line
in red is the proposed SCRV and the dashed lines show the standard uncertainty of the
proposed reference value, u(SCRV). The error bar line of an individual participant’s result
covers the reported result standard uncertainty.

Page 19 of 47
Figure 1. APMP.QM-S5: Participants’ reported results and measurement uncertainties
for Arsenic (total) (unit: g/g)
■ AAS ▲ NAA ♦ ICP-MS ● HR-ICP-MS
Note: Participants' results are displayed with error bars representing reported standard
uncertainties. The solid horizontal line in red is the proposed SCRV (as median) and the
dashed lines show the standard uncertainty of the proposed reference value, u(SCRV). The
results submitted by ANSTO and JSI (2) were not included in the calculation of SCRV.
Please refer to Section 5.2 for details.

Page 20 of 47
Figure 2. APMP.QM-S5: Participants reported results and measurement uncertainties
for Cadmium (unit: g/g)
■ AAS ♦ ICP-MS ● HR-ICP-MS
IDMS
Note: Participants' results are displayed with error bars representing reported standard
uncertainties. The solid horizontal line in red is the proposed SCRV (as median) and the
dashed lines show the standard uncertainty of the proposed reference value, u(SCRV). The
results submitted by JSI and NMIJ (2) were not included in the calculation of SCRV. Please
refer to Section 5.2 for details.
0.7061

Page 21 of 47
Figure 3. APMP.QM-S5: Participants reported results and measurement uncertainties
for Iron (unit: g/g)
■ AAS ▲ NAA ♦ ICP-MS ICP-AES ● HR-ICP-MS
IDMS
Note: Participants' results are displayed with error bars representing reported standard
uncertainties. The solid horizontal line in red is the proposed SCRV (as median) and the
dashed lines show the standard uncertainty of the proposed reference value, u(SCRV). The
results submitted by ANSTO, JSI (2) and NMIJ (2) were not included in the calculation of
SCRV. Please refer to Section 5.2 for details.

Page 22 of 47
Figure 4. APMP.QM-S5: Participants reported results and measurement uncertainties
for Zinc (unit: g/g)
■ AAS ▲ NAA ♦ ICP-MS ● HR-ICP-MS
IDMS
Note: Participants' results are displayed with error bars representing reported standard
uncertainties. The solid horizontal line in red is the proposed SCRV (as median) and the
dashed lines show the standard uncertainty of the proposed reference value, u(SCRV). The
results submitted by ANSTO, BIM, JSI (2) and NMIJ (2) were not included in the
calculation of SCRV. Please refer to Section 5.2 for details.

Page 23 of 47
5.3. Equivalence statements
According to the CCQM Guidance Note [2], the degree of equivalence (DoE) and its
uncertainty of a measurement result reported by a participating NMI/DI with respect to the
SCRV can be calculated using the following equations (4)-(5):
) SCRV( ii xd (4)
22 )SCRV()(2)( uxudU ii (5)
where
xi is the reported value from the ith
participant (i = 1 to n);
di is the difference between the reported value and the SCRV; and
U(di) is the expanded uncertainty (k = 2) of the difference di at a 95% level of confidence.
It is possible for the values of di and U(di) published in this report to differ slightly from the
values of di and U(di) that can be calculated using the equations given in (4)-(5). These
differences arise from the necessary rounding of the SCRV and u(SCRV) prior to their
publication in Tables 12 to 15. The relative values of di and U(di) are expressed as percent of
SCRV. The equivalence statements for APMP.QM-S5 based on the proposed SCRV are
given in Tables 12-15 and are shown graphically in Figures 5-8.

Page 24 of 47
Table 12. APMP.QM-S5: Equivalence Statement for Arsenic (total) based on the use
of median as the robust estimation of SCRV
Institute
Reported
value, xi
(g/g)
Reported
standard
uncertainty,
u(xi)
(g/g)
Difference
from SCRV, di
(g/g)
U(di)
(g/g) )( i
i
dU
d
di
relative
value
(%)
U(di)
relative
value
(%)
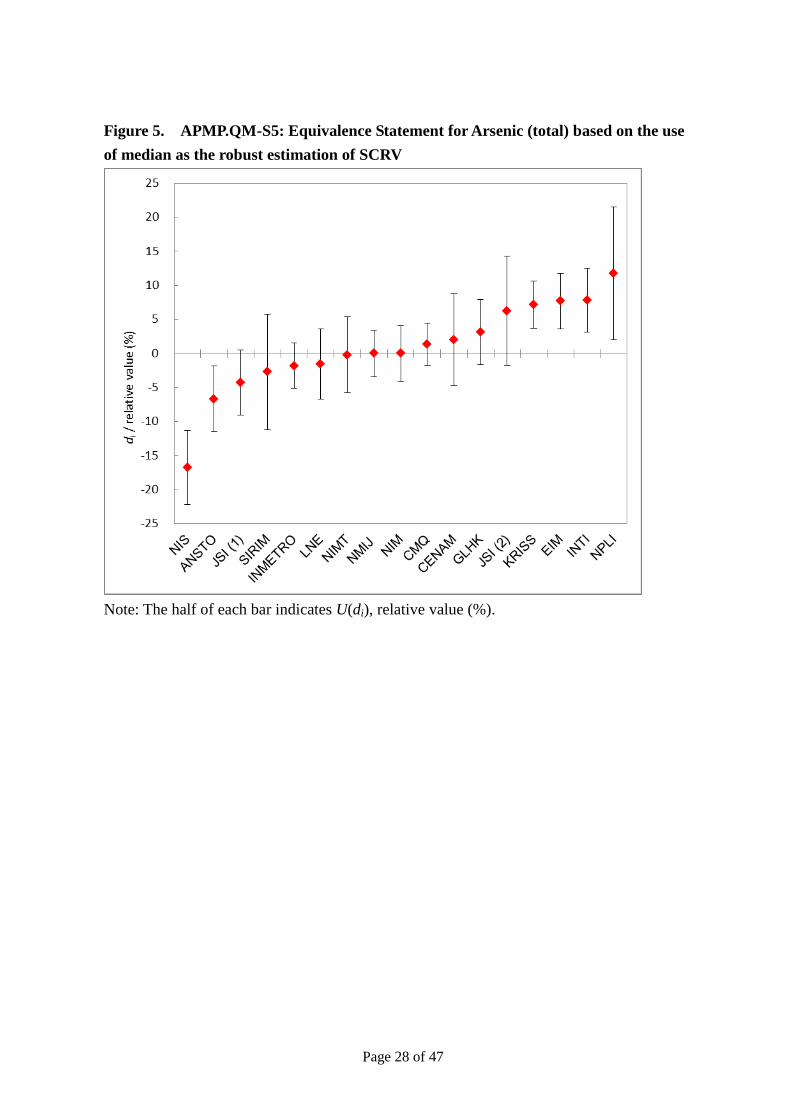
NIS 37.2175 1.0764 -7.48 2.44 -3.06 -16.74 5.47
ANSTO 41.72* 0.92 -2.98 2.17 -1.37 -6.67 4.86
JSI (1) 42.8 0.9 -1.90 2.14 -0.89 -4.25 4.79
SIRIM 43.49 1.80 -1.21 3.78 -0.32 -2.71 8.46
INMETRO 43.9 0.45 -0.80 1.47 -0.55 -1.79 3.28
LNE 44 1 -0.70 2.31 -0.30 -1.57 5.17
NIMT 44.6 1.1 -0.10 2.49 -0.04 -0.22 5.56
NMIJ 44.7 0.5 0.00 1.53 0.00 0.00 3.42
NIM 44.7 0.7 0.00 1.82 0.00 0.00 4.06
CMQ 45.32 0.38 0.62 1.39 0.45 1.39 3.10
CENAM 45.6 1.4 0.90 3.03 0.30 2.01 6.78
GLHK 46.1 0.9 1.40 2.14 0.65 3.13 4.79
JSI (2) 47.5** 1.7 2.80 3.59 0.78 6.26 8.04
KRISS 47.9 0.5 3.20 1.53 2.09 7.16 3.42
EIM 48.14 0.70 3.44 1.82 1.89 7.70 4.06
INTI 48.2 0.87 3.50 2.09 1.67 7.83 4.68
NPLI 49.94 2.10 5.24 4.36 1.20 11.72 9.75
Note:
* The result submitted by ANSTO was not included in the calculation of the supplementary
comparison reference value (SCRV). Please refer to Section 5.2 for details.
** It was agreed in the CCQM IAWG November 2011 Meeting that when more than one
value was provided by an NMI/DI, the value with the smallest uncertainty should normally
be used for the calculation of SCRV. As such, the result submitted by JSI (2) was not
included in the calculation of SCRV. Please refer to Section 5.2 for details.

Page 25 of 47
Table 13. APMP.QM-S5: Equivalence Statement for Cadmium based on the use of
median as the robust estimation of SCRV
Institute
Reported
value, xi
(g/g)
Reported
standard
uncertainty,
u(xi)
(g/g)
Difference
from SCRV, di
(g/g)
U(di)
(g/g) )( i
i
dU
d
di
relative
value
(%)
U(di)
relative
value
(%)
JSI 0.121* 0.002 -0.103 0.012 -8.954 -46.01 5.14
NPLI 0.129 0.0015 -0.095 0.011 -8.486 -42.44 5.00
SIRIM 0.185 0.003 -0.039 0.012 -3.165 -17.45 5.51
LNE 0.193 0.003 -0.031 0.012 -2.518 -13.88 5.51
INMETRO 0.200 0.004 -0.024 0.013 -1.793 -10.75 6.00
GLHK 0.220 0.006 -0.004 0.016 -0.254 -1.83 7.20
CMQ 0.223 0.003 -0.001 0.012 -0.089 -0.49 5.51
NMIJ (1) 0.223 0.002 -0.001 0.012 -0.096 -0.49 5.14
NMIJ (2) 0.224** 0.002 0.000 0.012 -0.009 -0.04 5.14
CENAM 0.2252 0.0014 0.001 0.011 0.099 0.49 4.98
KRISS 0.227 0.006 0.003 0.016 0.180 1.29 7.20
INTI 0.23 0.016 0.006 0.034 0.175 2.63 15.07
EIM 0.234 0.005 0.010 0.015 0.673 4.42 6.57
NIM 0.236 0.003 0.012 0.012 0.963 5.31 5.51
NIMT 0.255 0.005 0.031 0.015 2.100 13.79 6.57
NIS 0.7061 0.0208 0.482 0.043 11.215 215.08 19.18
Note:
* The result submitted by JSI was not included in the calculation of the supplementary
comparison reference value (SCRV). Please refer to Section 5.2 for details.
** It was agreed in the CCQM IAWG November 2011 Meeting that when more than one
value was provided by an NMI/DI, the value with the smallest uncertainty should normally
be used for the calculation of SCRV. As such, the result submitted by NMIJ (2) was not
included in the calculation of SCRV. Please refer to Section 5.2 for details.

Page 26 of 47
Table 14. APMP.QM-S5: Equivalence Statement for Iron based on the use of median
as the robust estimation of SCRV
Institute
Reported
value, xi
(g/g)
Reported
standard
uncertainty,
u(xi)
(g/g)
Difference
from SCRV, di
(g/g)
U(di)
(g/g) )( i
i
dU
d
di
relative
value
(%)
U(di)
relative
value
(%)
SIRIM 155.98 4.80 -27.52 10.52 -2.62 -15.00 5.73
ANSTO 159.9* 2.8 -23.60 7.06 -3.34 -12.86 3.85
NIS 169.0934 4.8060 -14.41 10.53 -1.37 -7.85 5.74
EIM 169.84 3.19 -13.66 7.70 -1.77 -7.44 4.19
CMQ 175.1 1.6 -8.40 5.37 -1.57 -4.58 2.92
NIMT 176 3 -7.50 7.39 -1.02 -4.09 4.02
JSI (2) 177** 6 -6.50 12.75 -0.51 -3.54 6.95
JSI (1) 179 2 -4.50 5.88 -0.77 -2.45 3.20
INMETRO 179.4 3.75 -4.10 8.65 -0.47 -2.23 4.71
NMIJ (2) 180.2** 4.5 -3.30 9.98 -0.33 -1.80 5.44
NMIJ (1) 183.5 1.8 0.00 5.61 0.00 0.00 3.06
NIM 183.8 2.2 0.30 6.16 0.05 0.16 3.36
HSA 184.96 4.88 1.46 10.67 0.14 0.80 5.81
LNE 185 3.5 1.50 8.22 0.18 0.82 4.48
NPLI 186.58 2.73 3.08 6.95 0.44 1.68 3.79
GLHK 186.9 5.5 3.40 11.81 0.29 1.85 6.44
CENAM 189 5.5 5.50 11.81 0.47 3.00 6.44
INTI 194 7.3 10.50 15.22 0.69 5.72 8.30
Note:
* The result submitted by ANSTO was not included in the calculation of the supplementary
comparison reference value (SCRV). Please refer to Section 5.2 for details.
** It was agreed in the CCQM IAWG November 2011 Meeting that when more than one
value was provided by an NMI/DI, the value with the smallest uncertainty should normally
be used for the calculation of SCRV. As such, the results submitted by JSI (2) and NMIJ (2)
were not included in the calculation of SCRV. Please refer to Section 5.2 for details.

Page 27 of 47
Table 15. APMP.QM-S5: Equivalence Statement for Zinc based on the use of median
as the robust estimation of SCRV
Institute
Reported
value, xi
(g/g)
Reported
standard
uncertainty,
u(xi)
(g/g)
Difference
from SCRV, di
(g/g)
U(di)
(g/g) )( i
i
dU
d
di
relative
value
(%)
U(di)
relative
value
(%)
SIRIM 48.53 0.66 -11.42 1.71 -6.67 -19.05 2.86
ANSTO 51.47* 0.90 -8.48 2.10 -4.03 -14.15 3.51
NIS 54.9669 1.4142 -4.98 3.03 -1.64 -8.31 5.06
INMETRO 56.8 1.2 -3.15 2.64 -1.20 -5.25 4.40
BIM 57.9* 1.7 -2.05 3.57 -0.57 -3.42 5.96
INTI 58.5 1.6 -1.45 3.38 -0.43 -2.42 5.64
NIMT 58.6 0.9 -1.35 2.10 -0.64 -2.25 3.51
JSI (2) 58.9** 1.6 -1.05 3.38 -0.31 -1.75 5.64
NMIJ (1) 59.5 0.8 -0.45 1.94 -0.23 -0.75 3.23
NMIJ (2) 59.8** 1.7 -0.15 3.57 -0.04 -0.25 5.96
JSI (1) 59.9 0.9 -0.05 2.10 -0.02 -0.08 3.51
GLHK 60.0 1.0 0.05 2.28 0.02 0.08 3.80
CMQ 60.22 0.74 0.27 1.84 0.15 0.45 3.07
CENAM 60.3 2.0 0.35 4.15 0.08 0.58 3.40
KRISS 60.30 0.86 0.35 2.04 0.17 0.58 6.92
NIM 60.8 0.5 0.85 1.48 0.57 1.42 2.47
EIM 61.72 1.11 1.77 2.47 0.72 2.95 4.13
NPLI 73.13 1.57 13.18 3.32 3.97 21.98 5.54
Note:
* The results submitted by ANSTO and BIM were not included in the calculation of the
supplementary comparison reference value (SCRV). Please refer to Section 5.2 for details.
** It was agreed in the CCQM IAWG November 2011 Meeting that when more than one
value was provided by an NMI/DI, the value with the smallest uncertainty should normally
be used for the calculation of SCRV. As such, the results submitted by JSI (2) and NMIJ (2)
were not included in the calculation of SCRV. Please refer to Section 5.2 for details.
Page 28 of 47
Figure 5. APMP.QM-S5: Equivalence Statement for Arsenic (total) based on the use
of median as the robust estimation of SCRV
Note: The half of each bar indicates U(di), relative value (%).

Page 29 of 47
Figure 6. APMP.QM-S5: Equivalence Statement for Cadmium based on the use of
median as the robust estimation of SCRV
Note: The half of each bar indicates U(di), relative value (%).

Page 30 of 47
Figure 7. APMP.QM-S5: Equivalence Statement for Iron based on the use of median
as the robust estimation of SCRV
Note: The half of each bar indicates U(di), relative value (%).

Page 31 of 47
Figure 8. APMP.QM-S5: Equivalence Statement for Zinc based on the use of median
as the robust estimation of SCRV
Note: The half of each bar indicates U(di), relative value (%).

Page 32 of 47
6. Demonstration of Core Capabilities
As agreed in previous CCQM IAWG meetings, a system of Core-Capabilities for inorganic
analysis will be employed in key/supplementary comparisons starting from CCQM-K75
onward. This strategy is to improve the efficiency and effectiveness of key/supplementary
comparisons to support CMC claims. With the use of the system, new CMC claims can be
supported by describing core capabilities that are required to deliver the claimed
measurement service and by referencing core capabilities that were successfully
demonstrated by participation in relevant key/supplementary comparisons. In this
connection, all participants were requested to submit their Inorganic Core Capabilities (CCs)
Tables to the coordinator for compilation. The returns are summarized in the Appendix.
7. Conclusion
Generally, the participants’ results of APMP.QM-S5 were found consistent for all
measurands according to their equivalence statements. Except with some extreme values,
most of the participants obtained the values of di/U(di) within 1 for the measurands.
For sample dissolution, except those participants using INAA as the measurement technique,
most of the participants used microwave acid digestion methods. For the instrumental
determination, a variety of techniques like ICP-MS, ICP-OES, INAA and AAS were
employed by the participants.

Page 33 of 47
Acknowledgement
The contributions from the contract persons and/or analysts of participating NMIs/DIs, as
listed below, are highly appreciated and acknowledged.
Institute Contact person and/or analysts
INTI Liliana Valiente ANSTO John W. Bennett INMETRO Rodrigo Caciano de Sena BIM Boriana Kotzeva CMQ Gabriela Massiff NIM Jingbo Chao, Jun Wang
NIS Randa Nasr Ahmed Yamani LNE Guillaume Labarraque EIM Elias Kakoulidis, Eugenia Lampi GLHK Yiu-chung Yip NPLI Shankar Gopala Aggarwal, Prabhat K. Gupta NMIJ Yanbei Zhu, Shin-ichi Miyashita
KRISS Yong-Hyeon Yim SIRIM Osman Zakaria, Norliza Baharom
CENAM Francisco Javier Matehuala Sánchez, EdithValle Moya, Maria del Rocio Arvizu Torres, Judith Velina Lara Manzano
HSA Richard Shin JSI Milena Horvat, Tea Zuliani, Radmila Milacic, Radojko Jacimovic
NIMT Charun Yafa, Pranee Phukphatthanachai, Sutthinun Taebunpakul, Nattikarn Kaewkhomdee
The coordinating laboratory would like to thank Dr. Mike Sargent for providing guidance
throughout the course of this study.
References
1. International Standards Organization, ISO Guide 35: Reference materials – General and
statistical principles for certification, Geneva, Switzerland, 2006.
2. CCQM Guidance Note: Estimation of a consensus KCRV and associated degrees of
equivalence, Version 6, 2010.
3. CIPM MRA Document: Traceability in CIPM MRA, Document No.: CIPM 2009-24,
Latest update: Revised 13 October 2009.
4. D. Duewer: A Robust Approach for the Determination of CCQM Key Comparison
Reference Values and Uncertainties.

Page 34 of 47
Appendix Inorganic Core Capabilities Table
APMP Supplementary Comparison: APMP.QM-S5 Institutes: BIM, CENAM, CMQ, EIM, GLHK, INMETRO, JSI, LNE, NIM, NIMT,
NMIJ, NPLI, SIRIM Method: ICP-MS (without isotope dilution) Analytes: As, Cd, Fe, Zn
Capabilities/Challenges Not tested Tested Specific challenges
encountered
Contamination control and correction
All techniques and procedures employed to reduce
potential contamination of samples as well as blank
correction procedures. The level of difficulty is greatest
for analytes that are environmentally ubiquitous and also
present at very low concentrations in the sample.
BIM, CENAM,
CMQ, EIM,
GLHK,
INMETRO, JSI,
LNE, NIM,
NIMT, NMIJ,
NPLI, SIRIM
BIM: For every experiment, two
or three separated blank samples
were measured. The blank
samples were undergone
through all analytical procedure
stages and contain all reagents,
without a sample itself.
NIM: The blank of As is low, the
contamination of sample
preparation is ignorable.
SIRIM: Preparation of sample
was handling in clean room.
Mineral acid used was Trace
selects type, it used for
digestion.
Digestion/dissolution of organic matrices
All techniques and procedures used to bring a sample
that is primarily organic in nature into solution suitable
for liquid sample introduction to the ICP.
BIM, CENAM,
CMQ, EIM,
GLHK,
INMETRO, JSI,
LNE, NIM,
NIMT, NMIJ,
NPLI, SIRIM
BIM:
1. Weighing of about 0.5 g
sample into a microwave vessel.
2. Addition of 10 ml nitric acid.
Preparation of procedural
blanks.
3. Cold predigesting for 4 hours.
4. Microwave digestion under
operating conditions
(temperature program and
pressure control).
5. Sample and standards
dilution; all solutions are
gravimetrically prepared.
CENAM: Pre-digestion and
digestion procedure were
applied to avoid high pressure in
the vessels due the biological
sample, also it is necessary to
use HF which was added during
an additional open digestion in
order to remove the silicon.
NIM: The sample was
completely digested with
Page 35 of 47
Capabilities/Challenges Not tested Tested Specific challenges
encountered
HNO3/H2O2/HF in PTFE vessel.
SIRIM: Used microwave
digestion method and samples
completely dissolve. Used
HNO3, HCL, and H2O2.
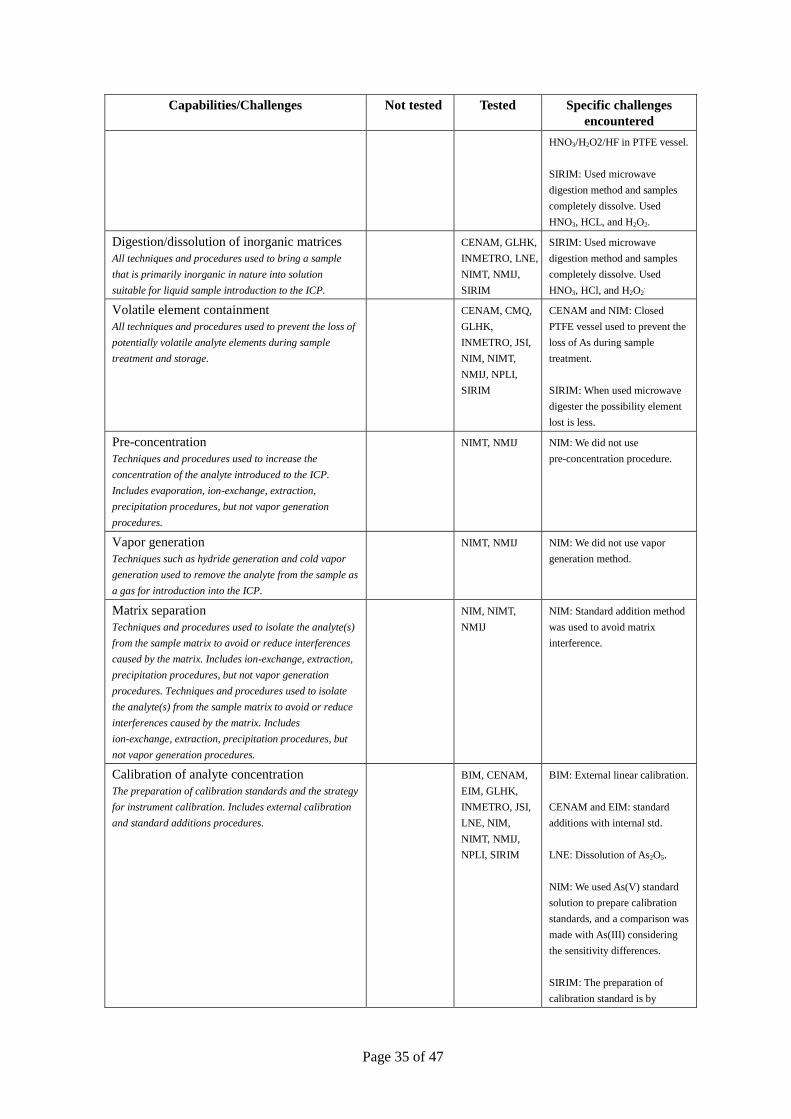
Digestion/dissolution of inorganic matrices
All techniques and procedures used to bring a sample
that is primarily inorganic in nature into solution
suitable for liquid sample introduction to the ICP.
CENAM, GLHK,
INMETRO, LNE,
NIMT, NMIJ,
SIRIM
SIRIM: Used microwave
digestion method and samples
completely dissolve. Used
HNO3, HCl, and H2O2.
Volatile element containment
All techniques and procedures used to prevent the loss of
potentially volatile analyte elements during sample
treatment and storage.
CENAM, CMQ,
GLHK,
INMETRO, JSI,
NIM, NIMT,
NMIJ, NPLI,
SIRIM
CENAM and NIM: Closed
PTFE vessel used to prevent the
loss of As during sample
treatment.
SIRIM: When used microwave
digester the possibility element
lost is less.
Pre-concentration
Techniques and procedures used to increase the
concentration of the analyte introduced to the ICP.
Includes evaporation, ion-exchange, extraction,
precipitation procedures, but not vapor generation
procedures.
NIMT, NMIJ NIM: We did not use
pre-concentration procedure.
Vapor generation
Techniques such as hydride generation and cold vapor
generation used to remove the analyte from the sample as
a gas for introduction into the ICP.
NIMT, NMIJ NIM: We did not use vapor
generation method.
Matrix separation
Techniques and procedures used to isolate the analyte(s)
from the sample matrix to avoid or reduce interferences
caused by the matrix. Includes ion-exchange, extraction,
precipitation procedures, but not vapor generation
procedures. Techniques and procedures used to isolate
the analyte(s) from the sample matrix to avoid or reduce
interferences caused by the matrix. Includes
ion-exchange, extraction, precipitation procedures, but
not vapor generation procedures.
NIM, NIMT,
NMIJ
NIM: Standard addition method
was used to avoid matrix
interference.
Calibration of analyte concentration
The preparation of calibration standards and the strategy
for instrument calibration. Includes external calibration
and standard additions procedures.
BIM, CENAM,
EIM, GLHK,
INMETRO, JSI,
LNE, NIM,
NIMT, NMIJ,
NPLI, SIRIM
BIM: External linear calibration.
CENAM and EIM: standard
additions with internal std.
LNE: Dissolution of As2O5.
NIM: We used As(V) standard
solution to prepare calibration
standards, and a comparison was
made with As(III) considering
the sensitivity differences.
SIRIM: The preparation of
calibration standard is by

Page 36 of 47
Capabilities/Challenges Not tested Tested Specific challenges
encountered
weight.
Signal detection
The detection and recording of the analyte isotope
signals. The degree of difficulty increases for analytes
present at low concentrations, of low isotopic abundance,
or that are poorly ionized.
BIM, CENAM,
EIM, GLHK,
INMETRO, JSI,
LNE, NIM,
NIMT, NMIJ,
SIRIM
NIM: The background of As is
not high.
SIRIM: The Detection limit of
the ICPMS is very low.
Memory effect
Any techniques used to avoid, remove or reduce the
carry-over of analyte between consecutively measured
standards and/or samples.
CENAM, EIM,
GLHK, JSI,
NIM, NIMT,
NMIJ, NPLI,
SIRIM
CENAM: Before and after
analysis, rinse with 2 %
HNO3and pure water.
NIM: As have low memory
effect.
SIRIM: For the Teflon tube,
after it use for digestion, it was
immersed in 10% HNO3 for one
day and rinse with pure water.
For the analysis, before and after
analysis, rinse with 3% HNO3
and pure water.
Correction or removal of isobaric/polyatomic
interferences
Any techniques used to remove, reduce, or
mathematically correct for interferences caused by mass
overlap of analyte isotopes with isobaric or polyatomic
species. Includes collision cell techniques, high
resolution mass spectrometry, or chemical separations.
The relative concentrations and sensitivities of the
analyte isotopes and the interfering species will affect the
degree of difficulty.
BIM, CENAM,
CMQ, EIM,
GLHK, JSI,
LNE, NIM,
NIMT, NMIJ,
NPLI, SIRIM
CENAM: In order to reduce the
polyatomic interference of 40Ar35Cl, it was used high
resolution mode, this affect the
sensitivity in the instrument for
As isotope and the degree of
difficulty in the instrumental
optimization.
CMQ: Interferences for Zn
(CaO, KO) and Fe (ArMg) were
minimized using reaction cell
(He).
EIM: HR-MS
JSI: Reaction/collision cell.
Reaction gas applied was He.
LNE: Use of CCT to remove
ArCl interference.
NIM: We used collision reaction
cell technology to reduce the
interference from matrix.
NMIJ: Interference of 40Ar16O
with the measurement of 56Fe
was removed by high-energy
collision gas.
SIRIM: We used collision cell,
He mode to remove the

Page 37 of 47
Capabilities/Challenges Not tested Tested Specific challenges
encountered
interference.
Correction or removal of matrix-induced
signal suppression or enhancement
Chemical or instrumental procedures used to avoid or
correct for matrix-induced signal suppression or
enhancement.
BIM, CENAM,
CMQ, GLHK,
JSI, LNE, NIM,
NIMT, NMIJ,
NPLI
BIM: Sufficient dilution of the
samples.
CENAM: In order to reduce the
polyatomic interference of 40Ar35Cl, it was used high
resolution mode, this affects the
sensitivity in the instrument for
As isotope and the degree of
difficulty in the instrumental
optimization.
CMQ: Measurements carried out
using Standard Additions
method.
NIM: Standard addition method
used to avoid matrix
interference.
Detector deadtime correction
Measurement of, and correction for, ion detector
deadtime. Importance increases in situations where high
ion count rates are encountered.
BIM, EIM,
GLHK, LNE,
NIM, NIMT,
NMIJ, NPLI
BIM: Default detector dead time
correction was used.
NIM: The ICP-MS instrument
does dead time correction
automatically.
Mass bias/fractionation control and correction
Techniques used to determine, monitor, and correct for
mass bias/fractionation.
BIM, EIM,
INMETRO,
NIMT, NMIJ,
SIRIM
BIM: Obligatory preliminary
every-day mass calibration using
tuning solution.
SIRIM: Spike the standard into
the sample, %recovery is
80-120%.

Page 38 of 47
Inorganic Core Capabilities Table
APMP Supplementary Comparison: APMP.QM-S5 Institute/Laboratory: INMETRO Method: ICP-OES Analytes: Fe
Capabilities/Challenges Not tested Tested Specific challenges
encountered
Contamination control and correction
All techniques and procedures employed to reduce potential
contamination of samples as well as blank correction
procedures. The level of difficulty is greatest for analytes that
are environmentally ubiquitous and also present at very low
concentrations in the sample.
INMETRO
Digestion/dissolution of organic matrices
All techniques and procedures used to bring a sample that is
primarily organic in nature into solution suitable for liquid
sample introduction to the ICP.
INMETRO
Digestion/dissolution of inorganic matrices
All techniques and procedures used to bring a sample that is
primarily inorganic in nature into solution suitable for liquid
sample introduction to the ICP.
INMETRO
Volatile element containment
All techniques and procedures used to prevent the loss of
potentially volatile analyte elements during sample treatment
and storage.
INMETRO
Pre-concentration
Techniques and procedures used to increase the concentration
of the analyte introduced to the ICP. Includes evaporation,
ion-exchange, extraction, precipitation procedures, but not
vapor generation procedures.
INMETRO
Vapor generation
Techniques such as hydride generation and cold vapor
generation used to remove the analyte from the sample as a
gas for introduction into the ICP.
INMETRO
Matrix separation
Techniques and procedures used to isolate the analyte(s) from
the sample matrix to avoid or reduce interferences caused by
the matrix. Includes ion-exchange, extraction, precipitation
procedures, but not vapor generation procedures , but not
vapor generation procedures. Techniques and procedures
used to isolate the analyte(s) from the sample matrix to avoid
or reduce interferences caused by the matrix. Includes
ion-exchange, extraction, precipitation procedures, but not
vapor generation procedures.
INMETRO
Calibration of analyte concentration
The preparation of calibration standards and the strategy for
instrument calibration. Includes external calibration and
standard additions procedures.
INMETRO
Signal detection
The detection and recording of the analyte signals. The degree
INMETRO

Page 39 of 47
Capabilities/Challenges Not tested Tested Specific challenges
encountered
of difficulty increases for analytes present at low
concentrations, or that are have weak emission lines.
Memory effect
Any techniques used to avoid, remove or reduce the carry-over
of analyte between consecutively measured standards and/or
samples.
INMETRO
Complex spectral backgrounds
Any techniques used to remove, reduce, or mathematically
correct for interferences caused by the overlap of analyte
emission lines with atomic, ionic, or molecular emission from
matrix components. The relative concentrations and
sensitivities of the analyte and the interfering species will
affect the degree of difficulty. Samples containing high
concentration matrix components with large numbers of
emission lines or molecular bands may increase the
measurement challenge.
INMETRO
Correction or removal of matrix-induced signal
suppression or enhancement
Chemical or instrumental procedures used to avoid or correct
for matrix-induced signal suppression or enhancement. High
concentrations of acids, dissolved solids, or easily ionized
elements will increase the degree of difficulty.
INMETRO

Page 40 of 47
Inorganic Core Capabilities Table APMP Supplementary Comparison: APMP.QM-S5 Institutes: CENAM, GLHK, HSA, KRISS, LNE, NIM, NIMT, NMIJ Method: ID-ICP-MS Analytes: Cd, Fe, Zn
Capabilities/Challenges Not tested Tested Specific challenges
encountered
Contamination control and correction
All techniques and procedures employed to reduce
potential contamination of samples as well as
blank correction procedures. The level of difficulty
is greatest for analytes that are environmentally
ubiquitous and also present at very low
concentrations in the sample.
CENAM,
GLHK, HSA,
KRISS, LNE,
NIM, NIMT,
NMIJ
NIM: The blank of Zn and Cd is low,
but the Fe maybe came from
environment.
Digestion/dissolution of organic
matrices
All techniques and procedures used to bring a
sample that is primarily organic in nature into
solution suitable for liquid sample introduction to
the ICP.
CENAM,
GLHK, HSA,
KRISS, LNE,
NIM, NIMT,
NMIJ
NIM: The HNO3/H2O2/HF can digest
shrimp powder easily and completely.
Digestion/dissolution of inorganic
matrices
All techniques and procedures used to bring a
sample that is primarily inorganic in nature into
solution suitable for liquid sample introduction to
the ICP.
GLHK, HSA,
KRISS, LNE,
NIMT, NMIJ
HSA: Sample digestion requires HF
acid for complete dissolution.
NIMT: Need to use HF to obtain
complete digestion for Fe analysis.
Volatile element containment
All techniques and procedures used to prevent the
loss of potentially volatile analyte elements during
sample treatment and storage.
GLHK, HSA,
LNE, NIM,
NIMT, NMIJ
NIM: Fe, Zn and Cd are not volatile
elements.
Pre-concentration
Techniques and procedures used to increase the
concentration of the analyte introduced to the
ICP. Includes evaporation, ion-exchange,
extraction, precipitation procedures, but not vapor
generation procedures.
NIMT, NMIJ NIM: We did not use pre-concentration
procedure.
Vapor generation
Techniques such as hydride generation and cold
vapor generation used to remove the analyte from
the sample as a gas for introduction into the ICP.
NIMT, NMIJ NIM: We did not use vapor generation
method.
Matrix separation
Techniques and procedures used to isolate the
analyte(s) from the sample matrix to avoid or
reduce interferences caused by the matrix.
Includes ion-exchange, extraction, precipitation
procedures, but not vapor generation procedures.
Techniques and procedures used to isolate the
analyte(s) from the sample matrix to avoid or
reduce interferences caused by the matrix.
CENAM, NIMT,
NMIJ
CENAM: It was applied anion
exchange method separation for Zn and
Cd
NIM: We did not separate Fe, Zn and
Cd from matrix, but diluted the samples
to avoid matrix interference before
determination.

Page 41 of 47
Capabilities/Challenges Not tested Tested Specific challenges
encountered
Includes ion-exchange, extraction, precipitation
procedures, but not vapor generation procedures.
Spike equilibration with sample
The mixing and equilibration of the enriched
isotopic spike with the sample.
CENAM,
GLHK, HSA,
KRISS, LNE,
NIM, NIMT,
NMIJ
NIM: The sample was completely
digested with HNO3/H2O2/HF in PTFE
vessel.
Signal detection
The detection and recording of the analyte isotope
signals. The degree of difficulty increases for
analytes present at low concentrations, of low
isotopic abundance, or that are poorly ionized.
CENAM,
GLHK, HSA,
KRISS, LNE,
NIM, NIMT,
NMIJ
NIM: The background of Zn and Cd is
not high. The degree of difficulty
increases for low concentration of Cd
and relatively high Fe background for
Fe determination.
Memory effect
Any techniques used to avoid, remove or reduce
the carry-over of analyte between consecutively
measured standards and/or samples.
GLHK, HSA,
NIM, NIMT,
NMIJ
NIM: Three elements have low memory
effect.
Correction or removal of
isobaric/polyatomic interferences
Any techniques used to remove, reduce, or
mathematically correct for interferences caused
by mass overlap of analyte isotopes with isobaric
or polyatomic species. Includes collision cell
techniques, high resolution mass spectrometry, or
chemical separations. The relative concentrations
and sensitivities of the analyte isotopes and the
interfering species will affect the degree of
difficulty.
CENAM,
GLHK, HSA,
KRISS, LNE,
NIM, NIMT,
NMIJ
CENAM: Interference of 40Ar16O with
the measurement of 56Fe was removed
by using medium resolution mode.
KRISS: Interferences including Pd were
avoided using alternative choice of
isotope.
LNE (Cd): Matrix matching for matrix
blank subtraction.
LNE (Fe): Use of CCT to remove ArO
interference.
NIM: We choose 56Fe/57Fe, 68Zn/67Zn
and 111Cd/110Cd to do the IDMS
measurement and calculation. There is
no isobaric interference, but Fe affected
by oxide.
NIMT: For Fe analysis, used gas mode
to remove polyatomic interferences. For
Cd analysis, need to confirm with
another spiking isotope.
NMIJ: Interference of 40Ar16O with the
measurement of 56Fe was removed by
high-energy collision gas.
Detector deadtime correction
Measurement of, and correction for, ion detector
deadtime. Importance increases in situations
where high ion count rates are encountered.
GLHK, HSA,
KRISS, LNE,
NIM, NIMT,
NMIJ
NIM: The ICP-MS instrument does
dead time correction automatically.
Mass bias/fractionation control and
correction
Techniques used to determine, monitor, and
correct for mass bias/fractionation.
GLHK, HSA,
KRISS, LNE,
NIM, NIMT,
NMIJ
NIM: Mass bias is corrected by using
primary standard for Cd and isotope
CRMs for Zn and Fe. Considering the
variation of isotope abundance in
different samples and matrix effect, we

Page 42 of 47
Capabilities/Challenges Not tested Tested Specific challenges
encountered
specially determined Zn, Cd and Fe
isotope abundance of the shrimp
sample.
Spike calibration
Techniques used to determine the analyte
concentration in the enriched isotopic spike
solution.
CENAM,
GLHK, KRISS,
LNE, NIM,
NIMT, NMIJ
CENAM (Fe, Zn, Cd): Not required for
“Exact matching IDMS”
“HSA (Fe): Not required for “Exact
Matching” IDMS
NIM: Primary standard solutions were
used to calibrate 57Fe and 67Zn spikes.

Page 43 of 47
Inorganic Core Capabilities Table APMP Supplementary Comparison: APMP.QM-S5 Institutes: ANSTO, JSI, KRISS Method: INAA Analytes: As, Cd, Fe, Zn
Capabilities/Challenges Not tested Tested Specific challenges
encountered
Sample preparation
Procedures used to prepare samples for irradiation;
determination of the mass basis (e.g., determination of
dry mass basis); procedures to minimize sample loss
during preparation; procedures to minimize
contamination with the elements of interest (highest
difficulty for determination of low levels of elements that
are ubiquitous in the sample preparation environment).
ANSTO, JSI,
KRISS
JSI: Aliquots varied from 0.23 to
0.24 g. Samples were pelletized
using a manual hydraulic press
into pellets 10 mm in diameter
and 2.8 mm high. Each pellet was
sealed in polyethylene foil.
KRISS: Aliquots of about 0.16 g
of the sample were pelletized
using a manual hydraulic press in
diameter 13 mm and 2 mm thick.
Standards preparation
Procedures used to prepare element standards or other
comparators used for standardization. (e.g., low
difficulty for use of pure elements or compounds; higher
difficulty for procedures involving dissolution and
dilution, or dilution with solid matrices.)
All JSI: IRMM-530R Al-0.1%Au
alloy in form of foil with
thickness of 0.1 mm was used.
Discs of about 6 mm in diameter
were prepared. Each disc was
sealed in polyethylene foil.
KRISS: Arsenic standard solution
was transferred to cellulose filter
papers. They were air dried and
pelletized using a manual
hydraulic press in diameter 13
mm and 1.3 mm thick.
General applications
Procedures associated with specific method of NAA and
the evaluation of the associated uncertainties for
comparator NAA, ko NAA, or other method specific
parameters not described below.
ANSTO, JSI,
KRISS
JSI: A sample and standard
Al-0.1%Au were stacked
together, fixed in the polyethylene
vial in sandwich form and
irradiated in the TRIGA reactor.
Characterization of irradiation
channel in the carousel facility
(CF) of TRIGA reactor and
absolute calibration of the HPGe
detector are needed. Optimization
and validation of the k0-INAA
with different matrix certified
reference materials are necessary.
Concentration levels in the
sample for As, Fe and Zn have to
be suitable for INAA.
Determination of peak areas (complex
spectra/small peaks)
Procedures used to determine peak areas. (e.g., high
difficulty for small peak areas on complex backgrounds
or determination of areas for multiple unresolved peaks.)
ANSTO, JSI,
KRISS
JSI: For peak area evaluation, the
HyperLab 2002 program was
used. No difficulties in net peak
areas determination were
encountered for As-76 at 559.1

Page 44 of 47
Capabilities/Challenges Not tested Tested Specific challenges
encountered
keV, Fe-59 at 1099.3 keV and
1291.6 keV, and for Zn-65 at
1115.5 keV. Expected peak of
Cd/In-115m at 336.2 keV was
below the background.
KRISS: Net count rate of the peak
of the primary gamma-ray energy
(559 keV) was small (~ 3 cps) but
not so bad for qualification.
Correction for spectral interferences
Procedures used to determine peak areas from
interfering nuclides and subtraction of the appropriate
number of counts from the peak of interest. Level of
difficulty increases with the number of corrections
needed and the magnitude of the corrections relative to
the total peak area.
All JSI: Negligible background
spectrum corrections were used in
this study (subtraction of recent
background spectrum for all
gamma spectra was applied). No
corrections for gamma-ray
interferences were applied for
radionuclides As-76, Fe-59 and
Zn-65.
KRISS: No gamma-ray peak from
the elements which might cause
spectral interference with 559
keV of As-76 was found.
Correction of fast neutron and fission
interferences
Procedures used to determine the contributions from fast
neutron reactions or fission of U to the peak area of
interest. The level of difficulty is related to the magnitude
of the corrections needed.
All JSI: Used irradiation channel in
the CF of the TRIGA reactor
(IC-40) has a
thermal-to-epithermal flux ratio
of 28.6 and a thermal-to-fast flux
ratio of 7.8. For the studied
radionuclides the threshold
reactions are negligible.
KRISS: The irradiation facility is
well thermalized.
Fission interference does not
cause any problem for As
analysis.
Corrections for sample and standard
geometry differences
Procedures used to determine correction factors for
differences in sample and standard irradiation and
counting geometries. These may include, e.g., use of flux
monitors to determine irradiation geometry correction
factors, and calculated correction factors based on
measured thicknesses and sample-to-detector distances.
Level of difficulty increases with the magnitude of the
correction.
All JSI: A standard Al-0.1%Au was
used as comparator and neutron
flux monitor. A sample and
standard Al-0.1%Au were stacked
together, fixed in the polyethylene
vial in sandwich form and
irradiated. Based on this
procedure, corrections for axial
neutron flux gradient inside the
polyethylene vial were applied.
Differences in sample/standard
geometry are taken into account
and they are calculated by the
Kayzero for Windows
(KayWin®) software.
Corrections or uncertainty assessments for
high count rates
All JSI: HPGe detector with 40 %
relative efficiency connected to

Page 45 of 47
Capabilities/Challenges Not tested Tested Specific challenges
encountered
Procedures used to correct for losses in the analyzer due
to high count rates; e.g., set up and validation of
loss-free counting hardware, use of mathematical
corrections for pulse pileup as a function of analyzer
dead time, etc. Level of difficulty increases with the
magnitude of the correction.
MULTIPORT II multichannel
analyzer (Canberra) and
GENIE-2000 Spectroscopy
software were used.
Measurements were carried out at
such distances that the dead time
was kept below 5 % with
negligible random coincidences.
KRISS: Detector dead time was
less than 4 %.
Corrections for neutron absorption or
scattering differences between samples and
standards
Procedures used to correct for differences between
neutron exposure of samples and standards associated
with differences in the absorbing and scattering power;
e.g., corrections derived from measurements of different
amounts of materials or thicknesses of materials, or
calculations based on cross-section values to correct for
neutron attenuation. Level of difficulty increases with the
magnitude of the correction.
All JSI: The standard Al-0.1%Au
(nuclide Au-198 (T1/2=2.695 d)
at gamma line of 411.8 keV) was
used for axial neutron flux
gradient corrections in the
sample. Radial flux gradient is
negligible due to similar diameter
of sample and standard. Thermal
and epithermal self-shielding
factors are equal to 1.
KRISS: Major composition of the
sample is nearly the same as that
of cellulous filter paper (standard
comparator).
Corrections for differences in neutron
exposure of samples and standards
For some NAA applications, samples and standards are
irradiated individually and corrections are needed for
any differences in neutron exposures. Corrections may
be based on, e.g., results from flux monitors or estimates
based on knowledge of the facility.
All JSI: The samples and standards
were irradiated together.
KRISS: Neutron flux monitors
(Al-Au foil, IRMM-530R) were
used for the correction.
Corrections for gamma-ray attenuation
Procedures used to correct for differences in gamma-ray
attenuation between samples and standards; typically
relevant only for high-z sample or standard matrices and
where samples and standards differ. Level of difficulty
increases with the magnitude of the correction.
All JSI: Corrections for gamma-ray
attenuations in sample/standard
were calculated by Kayzero for
Windows (KayWin®) software
via effective solid angle
calculations (SOLCOI
subroutine). Different measuring
distances from the top of the
HPGe detector for sample and
standard can be used due to
absolute calibration of the HPGe
detector.
KRISS: Major composition of the
sample is nearly the same as that
of cellulous filter paper (standard
comparator).

Page 46 of 47
Inorganic Core Capabilities Table APMP Supplementary Comparison: APMP.QM-S5 Institutes: INTI, NIS, NPLI Method: AAS (FAAS, GF-AAS or electrothermal AAS, HG-AAS) Analytes: INTI : Fe, Zn by FAAS; As, Cd by GF-AAS NPLI: Fe, Zn by FAAS; As by HG-AAS NIS: As, Cd by electrothermal AAS; Fe, Zn by FAAS
Capabilities/Challenges Not tested Tested Specific challenges
encountered
Contamination control and correction
All techniques and procedures employed to reduce potential
contamination of samples as well as blank correction
procedures. The level of difficulty is greatest for analytes that are
environmentally ubiquitous and also present at very low
concentrations in the sample.
INTI, NIS, NPLI INTI (Cd): Low
concentration in the
sample.
Digestion/dissolution of organic matrices
All techniques and procedures used to bring a sample that is
primarily organic in nature into solution suitable for liquid
sample introduction to the ETA-AAS.
INTI, NIS, NPLI NIS: Dissolution should
be carried out carefully
and completely because
incomplete dissolution
may affect the element
conc.
Digestion/dissolution of inorganic matrices
All techniques and procedures used to bring a sample that is
primarily inorganic in nature into solution suitable for liquid
sample introduction to the ETA-AAS.
INTI, NIS
Volatile element containment
All techniques and procedures used to prevent the loss of
potentially volatile analyte elements during sample treatment and
storage.
INTI, NIS INTI: MW with closed
vessel.
NIS: It may be lost during
the dissolution process.
Pre-concentration
Techniques and procedures used to increase the concentration of
the analyte introduced to the ETA-AAS. Includes evaporation,
ion-exchange, extraction, precipitation procedures, but not vapor
generation procedures.
NIS
Matrix separation
Techniques and procedures used to isolate the analyte(s) from
the sample matrix to avoid or reduce interferences caused by the
matrix. Includes ion-exchange, extraction, precipitation
procedures, but not vapor generation procedures.
NIS NIS: Cadmium is affected
by the presence of arsenic
and iron. Std. addition
calibration is used.
Hydride preconcentration/matrix separation of
volatile species.
Coupling of a hydride system to the ETA-AAS and optimization
of conditions.
All
Calibration of analyte concentration
The preparation of calibration standards and the strategy for
instrument calibration. Includes external calibration and
standard additions procedures. Also use of matrix-matched
standards to minimize effect of interferences.
INTI, NIS, NPLI INTI (As): Standard
addition
Signal detection INTI, NIS INTI: Matrix modifier,

Page 47 of 47
The detection and recording of the absorption signals of
analytes. The degree of difficulty increases for analytes present
at low concentrations, of low atomic absorption coefficient.
Requires selection of operating conditions such as light source,
absorption line, Zeeman background correction conditions.
Includes selection of signal processing conditions (peak area or
height).
Mg+Pd, Zeeman
Background Correction.
Peak Area
Memory effect
Any techniques used to avoid, remove or reduce the carry-over of
analyte between consecutively measured standards and/or
samples.
All
Optimization of the furnace temperature program
Optimization of temperature and duration of steps for sample
drying, pyrolysis to remove (residual) organics, and atomization.
Furnace temperature program to minimize analyte loss in the
drying/pyrolysis steps, while maximizing analyte vaporization in
the atomization step.
INTI, NIS INTI: STPF condition
(Stabilized Temperature
Platform Furnace).
Atomization Step with fast
ramp, hold time 5s and
stop gas flow. Matrix
modifier: Pd+Mg for both
element.
Correction or removal of matrix effects or
interferences
Chemical or instrumental procedures used to avoid or correct for
spectral and non-spectral interferences. Includes effects of
differences in viscosity and chemical equilibrium states of
analyte between the standard and sample. Selection of matrix
modifier to adjust volatility of analyte and/or matrix to eliminate
these effects is also included. Addition of reactive gases (e.g.
oxygen) to the carrier gas to improve matrix separation. Also
included is Zeeman or other background correction techniques to
remove interference due to absorption and scattering from
coexisting molecules/atoms in the sample.
INTI, NIS INTI: Zeeman
Background Correction