apmp supplementary comparisons of led measurements · apmp supplementary comparisons of led...
TRANSCRIPT

APMP Supplementary Comparisons of
LED Measurements
APMP.PR-S3a Averaged LED Intensity
APMP.PR-S3b Total Luminous Flux of LEDs
APMP.PR-S3c Emitted Colour of LEDs
Final Report (July 2012)
Dong-Hoon Lee, Seongchong Park, and Seung-Nam Park
Division of Physical Metrology, Korea Research Institute of Standards and Science (KRISS)
1 Doryong-Dong, Yuseong-Gu, Daejeon 304-340, Rep. Korea
Correspondance to: [email protected]

APMP.PR-S3b Total Luminous Flux of LEDs Final Report
2
Table of Contents
1. Introduction ...................................................................................................................................................... 5
2. Comparison Protocol .................................................................................................................................... 5
3. Arttifact LEDs ................................................................................................................................................... 7
4. Measurement Capabilities of Participants........................................................................................... 9
4.1. KRISS .......................................................................................................................................................... 9
4.2. MIKES ...................................................................................................................................................... 13
4.3. CMS-ITRI ................................................................................................................................................ 21
4.4. PTB ........................................................................................................................................................... 28
4.5. NMIJ ......................................................................................................................................................... 34
4.6. CENAM ................................................................................................................................................... 41
4.7. LNE ........................................................................................................................................................... 48
4.8. METAS ..................................................................................................................................................... 58
4.9. NMC-A*STAR ....................................................................................................................................... 68
4.10. VSL ....................................................................................................................................................... 72
4.11. NIST ..................................................................................................................................................... 79
4.12. VNIIOFI ............................................................................................................................................... 89
4.13. INM ...................................................................................................................................................... 89
5. Reported Results of Participants .......................................................................................................... 96
5.1. KRISS ....................................................................................................................................................... 96
5.2. MIKES ...................................................................................................................................................... 98
5.3. CMS-ITRI ................................................................................................................................................ 99
5.4. PTB ........................................................................................................................................................... 99
5.5. NMIJ ....................................................................................................................................................... 100
5.6. CENAM ................................................................................................................................................. 100
5.7. LNE ......................................................................................................................................................... 101

APMP.PR-S3b Total Luminous Flux of LEDs Final Report
3
5.8. METAS ................................................................................................................................................... 101
5.9. NMC-A*STAR ..................................................................................................................................... 102
5.10. VSL ..................................................................................................................................................... 102
5.11. NIST ................................................................................................................................................... 103
5.12. VNIIOFI ............................................................................................................................................. 103
5.13. INM .................................................................................................................................................... 104
6. Pre-draft A Process .................................................................................................................................. 104
6.1. Verification of Reported Results ............................................................................................... 105
6.2. Temperature Correction and Artifact Drift ........................................................................... 105
6.3. Review of Relative Data ................................................................................................................ 113
6.4. Review of Uncertainty Budgets ................................................................................................. 114
6.5. Identification of Outliers ............................................................................................................... 114
7. Data Analysis ............................................................................................................................................... 115
7.1. Calculation of Difference to Pilot ............................................................................................. 115
7.2. Calculation of Comparison Reference Value ....................................................................... 116
7.3. Calculation of Degree of Equivalence .................................................................................... 117
7.4. Data Analysis Spreadsheet .......................................................................................................... 117
8. Comparison Results ................................................................................................................................. 118
8.1. Red LEDs .............................................................................................................................................. 118
8.2. Green LEDs ......................................................................................................................................... 120
8.3. Blue LEDs ............................................................................................................................................. 121
8.4. White LEDs.......................................................................................................................................... 123
9. Discussion ..................................................................................................................................................... 126
9.1. Test of Consistency ......................................................................................................................... 126
9.2. Accuracy of Color Correction ..................................................................................................... 126
10. Summary .................................................................................................................................................. 129

APMP.PR-S3b Total Luminous Flux of LEDs Final Report
4
Acknowledgement ............................................................................................................................................. 129
Appendix A: Technical Protocol ................................................................................................................... 130
Appendix B: Review of Relative Data ........................................................................................................ 131
Appendix C: Comments from Review of Relative Data .................................................................... 132
Appendix D: Comments from Review of Uncertainty Budgets ..................................................... 133
Appendix E: Identification of Outliers ....................................................................................................... 134
Appendix F: Comments and Revision to Draft A Report ................................................................. 135

APMP.PR-S3b Total Luminous Flux of LEDs Final Report
5
1. Introduction
With the recent growth of the solid state lighting and display industry, the interest and
importance of accurate measurement of light-emitting diodes (LEDs) are increasing.
Photometric measurement of LEDs, however, is influenced by the specific properties of
individual LED such as spectral distribution, spatial emission profile, temperature
dependence, etc. In general, the measurement uncertainty of LEDs is larger than that of
the conventional incandescent lamps, and greater care is required to avoid or correct the
systematic errors related to the LED properties.
The Asia Pacific Metrology Programme (APMP) Technical Committee of Photometry
and Radiometry (TCPR) decided at its meeting in December 2006 to conduct
supplementary comparisons on measurement of LEDs to test the metrological
equivalence among national metrology institutes (NMIs) under the CIPM Mutual
Recognition Arrangement (MRA)1. The participation was not limited to NMIs in APMP, but
also NMIs of other regional metrology organizations (RMOs). The Korea Research
Institute of Standards and Science (KRISS) of Republic Korea is designated as the pilot
laboratory.
Three measurement quantities of LEDs are selected for the comparisons, which are
listed as service categories for Calibration and Measurement Capabilities (CMCs):
averaged LED intensity in condition B defined by International Commission on
Illumination (CIE) 2 , total luminous flux, and emitted color expressed as chromaticity
coordinates (x, y) according to the CIE 1931 standard colorimetric system3. The three
comparisons are registered as APMP.PR-S3a, -S3b, and -S3c, respectively.
In this report, we summarize the results of the comparison S3b on total luminous
flux of LEDs.
2. Comparison Protocol
The organization, the artifact LEDs, and the guidelines for measurement and report of all
the three comparisons (S3a, S3b, S3c) are settled on one technical protocol before the
start of the comparisons. The protocol is drafted by the pilot lab, agreed by the
participants, and approved by the APMP TCPR in January 2008. The protocol is once
revised in November 2008, as the INM of Romania has joined as an additional participant.
1 http://www.bipm.org/en/cipm-mra/ 2 Measurement of LEDs, 2nd edition, CIE Technical Report 127-2007. 3 Colorimetry, 3rd edition, CIE 015:2004.

APMP.PR-S3b Total Luminous Flux of LEDs Final Report
6
The final version of the technical protocol is included in 오류! 참조 원본을 찾을 수
없습니다. as an electronic file. Table 2-1 shows the final list of participants to the S3b
comparison with the measurement schedules planned and performed. We note that the
NPL of the UK listed on the technical protocol has withdrawn its participation in August
2009.
Table 2-1. List of participants and measurement schedules of APMP.PR-S3b.
NMI country contact person(s) measurement
planned LED set
measurement
performed
results
reported
KRISS
(pilot) Korea
Seongchong Park,
Dong-Hoon Lee -- -- -- --
NMC-
A*STAR
Singapore Yuanjie Liu,
Gan Xu
June ~ Aug.
2008 #8
10 July ~ 28 Aug.
2008
12 Jan.
2009
MIKES Finland (Pasi Manninen),
Tuomas Poikonen,
March ~ May
2008 #1
7 April ~ 13 April
2008
17 June
2008
NIST USA
Cameron Miller,
Yoshi Ohno,
Yuqin Zong
Aug. ~ Oct.
2008 #3
18 Feb. ~ 25 Feb.
2009
31 July
2009
CMS-
ITRI
Chinese
Taipei Cheng-Hsien Chen
March ~ May
2008 #2
26 May 2008 ~ 2
Oct. 2009*
26 Oct
2009
PTB Germany
Matthias
Lindemann,
Robert Maass
April ~ June
2008 #3 May ~ July 2008
18 July
2009
CENAM Mexico
Laura P. González,
Anayansi Estrada,
Eric Rosas
May ~ July
2008 #5
17 July ~ 21 July
2008
08 May
2009
NMIJ Japan Kenji Godo,
(Terubumi Saito)
April ~ June
2008 #4
17 April ~ 22
June 2008
01 Aug.
2008
METAS Switzerland Peter Blattner June ~ Aug.
2008 #7
08 Sept ~ 17 Sept
2008
07 April
2009
LNE France Jimmy Dubard May ~ July
2008 #6
15 June ~ 13 July
2008
15 April
2009
VSL The
Netherlands
(Eric van der Ham),
M. Charl Moolman,
Daniel Bos
July ~ Sept.
2008 #1
13 Oct 2008 ~ 12
Jan 2009
1 Oct
2009
VNIIOFI Russia Tatiana Gorshkova,
Stanislav Shirokov
Sept. ~ Nov.
2008 #5
28 Nov ~ 05 Dec
2008
06 Feb.
2009
INM Romania Mihai Simionescu Nov. ~ Dec.
2008 #7 Dec 2008
30 March
2009
* The CMS-ITRI had the initial measurement in May 2008, but it had to repeat the measurement on the red
LEDs in Oct 2009 due to damages in the initial measurement.
The comparison was performed as a star-type circulation of multiple sets of artifact
LEDs. The round for each participant had the following sequence: (1) first measurement
by the pilot, (2) measurement by the participant, (3) second measurement by the pilot.
The results of the repeated measurement by the pilot are used to evaluate the stability of
the artifact LEDs.

APMP.PR-S3b Total Luminous Flux of LEDs Final Report
7
3. Arttifact LEDs
Five different types of LEDs are used as comparison artifacts: RED (Nichia model
NSPR518S), GREEN (Nichia model NSPG518S), BLUE (Nichia model NSPB518S), WHITE
(Nichia model NSPW515BS), and DIFFUSER-TYPE GREEN (NSPG518S mounted in a
cylinder-type cap with an opal diffuser). All the bare LEDs had a lamp diameter of 5 mm
and were to be operated at a forward direct current of 20 mA. The detailed information
of the LEDs is included in the technical protocol (Appendix A). Note, however, the
diffuser-type green LEDs are not measured for the comparison S3b.
Each set of artifact LEDs consisted of three pieces of the red (R), green (G), blue (B),
and white (W) LEDs and two pieces of the diffuser-type green (D) LEDs. They were
packaged and identified as shown in Fig. 3-1. The pilot prepared eight sets of artifact
LEDs for the LED comparisons S3a, S3b, and S3c. Each artifact LED is designated in a
form #N-X-M with three codes:
- #N as the artifact set number: N = 1, 2, …, 8
- X as LED color and type code: X = R for red, G for green, B for blue, W for white, D for
diffuser-type green
- M as sample serial number for each type: M = 1, 2, 3
Fig. 3-1. Artifact LED set circulated in the LED comparisons S3a, S3b, and S3c.

APMP.PR-S3b Total Luminous Flux of LEDs Final Report
8
The artifact LEDs are prepared based on the functional seasoning 4 that records
during the pre-burning the relative change of luminous intensity and spectral distribution
of each individual LED together with its junction voltage under the ambient temperature
periodically varied from 18 °C to 33 °C. From the recorded data, the temporal drift and
the temperature dependence of the optical characteristics of each LED could be
separately determined. Each artifact LEDs has passed a seasoning procedure over 300
hours.
Since the photometric properties of LEDs have a very high dependence upon
temperature, their comparison requires a sensitive control or monitoring of the junction
temperature. As the junction voltage Vj of a LED can be approximated as a linear
function of the junction temperature T in a small interval, say ±10 °C, around a reference
temperature of T0,5 we can model the temperature dependence of its total luminous flux
ΦLED as a third-order polynomial with three coefficients:
2 3
0 0 0
0
1 ( ) ( ) ( ) ( ) ( ) ( )LED
j j j j j j
LED
Ta V T V T b V T V T c V T V T
T
. (3-1)
The coefficients a, b, and c of each artifact LED could be determined by fitting the
function of Eq. (3-1) to the functional seasoning data. With these results, the pilot was
capable to calculate a temperature correction factor for the measurement result of any
artifact LED to the same measurement condition, as long as the junction voltage at the
time of measurement is known. The uncertainty of this correction factor is estimated to
be less than 0.5 % as a relative standard uncertainty from the goodness of fit for the
coefficients.
In the comparison S3b, the measurement condition was specified with an ambient
temperature of 25 °C. In addition, the junction voltage of each LED was to be recorded
to monitor the junction temperature and to apply the aforementioned temperature
correction. In the chapters 오류! 참조 원본을 찾을 수 없습니다.~오류! 참조 원본을
찾을 수 없습니다., we will show and discuss this effect of the temperature correction to
the comparison results.
4 Seongchong Park et al., Metrologia 43, 299 (2006). 5 See, for example, E. F. Schubert, Light-Emitting Diodes (Cambrige University Press, 2003)

APMP.PR-S3b Total Luminous Flux of LEDs Final Report
9

APMP.PR-S3b Total Luminous Flux of LEDs Final Report
10
4. Measurement Capabilities of Participants
In this chapter, we summarize the information on measurement capabilities and
uncertainty budgets for total luminous flux of LEDs, which are reported by each
participant.
4.1. KRISS
4.1.1. Measurement setup
Fig. 4-1 shows the measurement setup of total luminous flux in KRISS. This setup is
implemented in a similar way to the NIST absolute integrating sphere method. The
integrating sphere has a diameter of 300 mm. There are 2 photometers: one (photometer
#1) is located outside the sphere for luminous flux measurement of a collimated
reference beam, and the other one (photometer #2) is attached to the sphere surface,
which acts a comparator of the illuminance between the reference beam and an LED. The
photometer #1 has a diameter of 15 mm (P15F0T made by LMT), and the photometer #2
has an aperture of 1 cm2 (P11S0Ts made by LMT).
For spectral mismatch correction, we use a CCD-mounted spectrograph-type
spectroradiometer (CAS140CT-153 made by Instrument Systems), of which the input
optics is composed of an 1.5” integrating sphere and fiber bundle. The aperture area of
the integrating sphere is 1 cm2. It covers 380 nm to 1050 nm, and its spectral bandwidth
(FWHM) is about 3 nm at 633 nm. The photometer #2 can be substituted by the
spectroradiometer input optics. Other geometry is shown in the right-side of Fig. 4-1.
The LED is driven by a source-meter unit (2400 Sourcemeter made by Keithley),
which provides both of current sourcing and voltage measuring function. The LED is
connected to the source-meter unit using 4-wire connection.

APMP.PR-S3b Total Luminous Flux of LEDs Final Report
11
Fig. 4-1. LED total luminous flux measurement setup in KRISS.
4.1.2. Mounting and alignment
Normally, the LED holder is positioned as the right-side of Fig. 4-1, thus the LED tip is
aimed at 115° from z-axis. For spatial response distribution measurement, we use
another LED holder with an LED beam source, which enables to adjust the aiming angle
over nearly 4 solid angle. Based on the SRDF measurement, the spatial mismatch
correction is performed.
4.1.3. Traceability
The absolute spectral responsivity of photometer #1 and the relative spectral responsivity
of photometer #2 are calibrated using a KRISS working standard photodiode. The scale is
traceable to KRISS cryogenic radiometer. For the spectroradiometer, the relative spectral
responsivity is calibrated using a spectral irradiance standard lamp traceable to NIST
spectral irradiance scale.
4.1.4. Measurement uncertainty
Tables in the following are the detailed uncertainty budgets of total luminous flux
measurement for the LEDs used in this APMP LED comparison. The uncertainty
evaluation is carried out according to Guide to the Expression of Uncertainty in
Measurement (GUM). Expanded uncertainty are evaluated at a confidence level of
approximately 95% with a coverage factor normally k = 2. Table 4-5 is the detailed
uncertainty budget of the junction voltage measurement.
Table 4-1. KRISS uncertainty budget of total luminous flux measurement for red LEDs (R).
baffle
Collimated
QTH Lamp
photometer 1
photometer 2
Linear stage
Integratingsphere
baffle
Collimated
QTH Lamp
photometer 1
photometer 2
Linear stage
Integratingsphere
z
40
35
y
65
x
REF. beam
test LED
z
40
35
y
65
x
REF. beam
test LED

APMP.PR-S3b Total Luminous Flux of LEDs Final Report
12
Uncertainty Component Standard
uncertaint
y Ty
pe Probability
distribution
Sensitivity
coefficient
Contribut
ion (%)
DoF Correl
ated?
sphere photometer repeatability
(DUT)
0.00 % A t 1 0.00 9 N
current feeding accuracy 0.05 % B rectangular 1 0.05 Y
near field reflection loss 0.50 % B rectangular 1 0.50 Y
external photometer repeatability
(REF)
0.00 % A t 1 0.00 9 N
sphere photometer repeatability
(REF)
0.00 % A t 1 0.00 9 N
external photometer linearity 0.05 % B rectangular 1 0.05 Y
sphere photometer linearity 0.05 % B rectangular 1 0.05 Y
transfer procedure repeatability 0.01 % A t 1 0.01 9 N
spatial mismatch correction 0.75 % B normal 1 0.75 Y
luminous flux responsivity 0.46 % B normal 1 0.46 Y
stray light 0.20 % B rectangular 1 0.20 Y
color correction 0.24 % B normal 1 0.24 Y
reproducibility 0.33 % A t 1 0.33 >30 N
Combined standard
uncertainty (%)
normal 1.11 >20
Table 4-2. KRISS uncertainty budget of total luminous flux measurement for green LEDs (G).
Uncertainty Component Standard
uncertain
ty Ty
pe Probability
distribution
Sensitivity
coefficient
Contribut
ion (%)
DoF Correl
ated?
sphere photometer repeatability
(DUT)
0.00 % A t 1 0.00 9 N
current feeding accuracy 0.03 % B rectangular 1 0.03 Y
near field reflection loss 0.50 % B rectangular 1 0.50 Y
external photometer repeatability
(REF)
0.00 % A t 1 0.00 9 N
sphere photometer repeatability
(REF)
0.00 % A t 1 0.00 9 N
external photometer linearity 0.05 % B rectangular 1 0.05 Y
sphere photometer linearity 0.05 % B rectangular 1 0.05 Y
transfer procedure repeatability 0.01 % A t 1 0.01 9 N
spatial mismatch correction 0.74 % B normal 1 0.74 Y
luminous flux responsivity 0.46 % B normal 1 0.46 Y
stray light 0.20 % B rectangular 1 0.20 Y
color correction 0.16 % B normal 1 0.16 Y
reproducibility 0.32 % A t 1 0.32 >30 N
Combined standard
uncertainty (%)
normal 1.09 >20

APMP.PR-S3b Total Luminous Flux of LEDs Final Report
13
Table 4-3. KRISS uncertainty budget of total luminous flux measurement for blue LEDs (B).
Uncertainty Component Standard
uncertain
ty Ty
pe Probability
distribution
Sensitivity
coefficient
Contribut
ion (%)
DoF Correl
ated?
sphere photometer repeatability
(DUT)
0.00 % A t 1 0.00 9 N
current feeding accuracy 0.04 % B rectangular 1 0.04 Y
near field reflection loss 0.50 % B rectangular 1 0.50 Y
external photometer repeatability
(REF)
0.00 % A t 1 0.00 9 N
sphere photometer repeatability
(REF)
0.00 % A t 1 0.00 9 N
external photometer linearity 0.05 % B rectangular 1 0.05 Y
sphere photometer linearity 0.05 % B rectangular 1 0.05 Y
transfer procedure repeatability 0.01 % A t 1 0.01 9 N
spatial mismatch correction 0.75 % B normal 1 0.75 Y
luminous flux responsivity 0.46 % B normal 1 0.46 Y
stray light 0.20 % B rectangular 1 0.20 Y
color correction 0.32 % B normal 1 0.32 Y
reproducibility 0.15 % A t 1 0.15 >30 N
Combined standard
uncertainty (%)
normal 1.09 >20
Table 4-4. KRISS uncertainty budget of total luminous flux measurement for white LEDs (W).
Uncertainty Component Standard
uncertain
ty Ty
pe Probability
distribution
Sensitivity
coefficient
Contribut
ion (%)
DoF Correl
ated?
sphere photometer repeatability
(DUT)
0.00 % A t 1 0.00 9 N
current feeding accuracy 0.04 % B rectangular 1 0.04 Y
near field reflection loss 0.50 % B rectangular 1 0.50 Y
external photometer repeatability
(REF)
0.00 % A t 1 0.00 9 N
sphere photometer repeatability
(REF)
0.00 % A t 1 0.00 9 N
external photometer linearity 0.05 % B rectangular 1 0.05 Y
sphere photometer linearity 0.05 % B rectangular 1 0.05 Y
transfer procedure repeatability 0.01 % A t 1 0.01 9 N
spatial mismatch correction 0.70 % B normal 1 0.70 Y
luminous flux responsivity 0.46 % B normal 1 0.46 Y
stray light 0.20 % B rectangular 1 0.20 Y
color correction 0.05 % B normal 1 0.05 Y

APMP.PR-S3b Total Luminous Flux of LEDs Final Report
14
reproducibility 0.41 % A t 1 0.41 >30 N
Combined standard
uncertainty (%)
normal 1.08 >20
Table 4-5. KRISS uncertainty budget of junction voltage measurement.
Uncertainty Component Standard
uncertainty
Ty
pe Probability
distribution
Sensitivity
coefficient
Contribut
ion (mV)
DoF Correl
ated?
sourcemeter calibration 0.05 mV B normal 1 0.05 Y
sourcemeter offset 0.10 mV B normal 1 0.10 Y
repeatability 0.04 mV A t 1 0.04 9 N
stray resistance 0.02 mV B rectangular 1 0.02 Y
Combined standard
uncertainty (mV)
t 0.12 >10
4.2. MIKES
4.2.1. Measurement setup
The total luminous flux of LEDs was measured using a 30-cm integrating sphere. The
sphere has three ports: a main port for the LED under calibration, a detector port for a
photometer head, and an auxiliary port for an auxiliary LED. An LED holder used for total
luminous flux and a 5-cm precision aperture for the luminous flux responsivity of the
sphere photometer can be attached in the main port. The photometer used was made
by PRC Krochmann and had good cosine response. The auxiliary port was utilized in the
self-absorption measurements of the LEDs and in the transfer calibration of the total flux
mode.
The integrating sphere photometer has been calibrated for the illuminance
responsivity with an external source (luminous intensity standard lamp) when the 5-cm
entrance aperture is mounted in the main port. The illuminance in the center of the
entrance aperture is measured with a reference photometer, and the corresponding
photocurrent is measured with the sphere photometer at the same distance (70 cm) from
the external source. A correction due to illuminance non-uniformity of radiation field at
the aperture plane has been made. The light beam of the LED under calibration hit the
sphere wall at the same angle of incidence as the reference light from the external
source. The obtained illuminance responsivity of the sphere with the 5-cm aperture has
been transferred to the total flux mode by measuring the signal from a white LED in the
auxiliary port with two cases: when the 5-cm aperture and the LED holder have been

APMP.PR-S3b Total Luminous Flux of LEDs Final Report
15
attached in the main port.
For calculating the spectral mismatch correction factor of the LEDs, the relative
spectral responsivity of the photometer has been calibrated with a reference
spectrometer of MIKES, and relative spectral throughput of the integrating sphere and
spectral power distribution of the LEDs have been measured with a spectroradiometer of
type DM150 from Bentham inc.
The total luminous flux measurements for each LED were made with the
integrating sphere photometer. The self-absorption measurements were made with an
auxiliary 5-mm white LED used in the auxiliary port by measuring the signal of the
photometer with and without the LED under calibration. To calculate the spectral
mismatch correction factor, the relative spectral power distributions were measured by
steps of 1 nm within the wavelength range of 380-780 nm, and the relative spectral
responsivity of the used photometer and the relative throughput of the integrating
sphere were measured by steps of 2 nm and 5 nm within the wavelength range of the
380-780 nm. During the measurements, the ambient temperature was (23.0 ± 1.0) °C and
the relative humidity of air was (31 ± 5) °C.
4.2.2. Mounting and alignment
The LED holder used in the total luminous flux measurements of the LEDs is shown in Fig.
4-2. The LED is located in the center of the integrating sphere. The sensitivity of the
system to the positioning of the LEDs was tested by repeating the LED mounting and
signal measurement. The V(λ)-corrected photometer used for luminous flux signal
measurements and the diffuser of the spectroradiometer for the spectral measurements
were mounted to the detector port one at a time.
Fig. 4-2. LED holder used in the measurements of the total LED luminous flux in MIKES.
4.2.3. Traceability
The illuminance responsivity of the photometer used is traceable to MIKES’ reference
photometer. The reference photometer includes a precision aperture, a V(λ) filter, and a

APMP.PR-S3b Total Luminous Flux of LEDs Final Report
16
silicon trap detector. The absolute transmittance of the V(λ) filter used in the reference
photometer is traceable to the national standard of the regular transmittance [Calibration
certificate T-R 479]. The spectral responsivity of the trap detector is traceable to a
cryogenic electrical substitution radiometer at SP in Sweden [Calibration certificate
MTeP501362-025] and modeling the spectral shape [Calibration certificate INT-028]. The
determinations of the areas of the precision apertures are traceable to the realization of
the meter at MIKES [Calibration certificate M-07L193]. The spectral irradiance responsivity
of the spectroradiometer is traceable to the national standard of spectral irradiance
[Calibration certificate T-R 506]. The calibrations of the current-to-voltage converter
Vinculum SP042 and digital voltmeter HP 3458A are traceable to the national standards
of electricity [Calibration certificates INT-033, INT-032].
4.2.4. Measurement uncertainty
Uncertainty components for the total luminous flux and junction voltage of the LEDs
have been presented in Tables below. The sensitivity coefficients of the uncertainty
components have been calculated as the ratio between the relative standard uncertainty
of the component and the standard deviation of the probability distribution of the
component. The uncertainty components due to wavelength errors and relative spectral
responsivity are based on Monte Carlo simulations.
Table 4-6. MIKES uncertainty budget of total luminous flux measurement for red LEDs (R).
Uncertainty Component Standard
uncertainty
(%)
Ty
pe
Probability
distribution
Sensitivity
coefficient
Contrib
ution
(%)
Deg. of
freedo
m
Correl
ated?
Setup-related
Repeatability 0.41 A normal 1 0.41 11 X
Near-field absorption 1.00 B rectangular 1 1.00 ∞ O
Self-absorption correction
factor
0.02 A normal 1 0.02 5 X
Non-uniformity of sphere
wall
0.20 B rectangular 1 0.20 ∞ O
Photocurrent measurement
(flux signal)
0.03 B rectangular 1 0.03 ∞ X
Current feeding B rectangular 3 –
5 %/mA
0.03 ∞ O
Integrating sphere
calibration

APMP.PR-S3b Total Luminous Flux of LEDs Final Report
17
Illuminance responsivity of
photometer
0.20 B normal 1 0.20 ∞ O
Photocurrent measurement
(illuminance)
0.01 A normal 1 0.01 19 X
Drift of the external source 0.01 B rectangular 1 0.01 ∞ O
Long-term stability of
photometer
0.14 B rectangular 1 0.14 ∞ O
Distance setting of sphere-
photometer
B rectangular 0.5 %/mm 0.06 ∞ X
Aperture diameter B rectangular 0.006
%/μm
0.04 ∞ O
Reflection from aperture
land
B rectangular 1 0.05 ∞ O
Illuminance non-uniformity
correction
0.02 A normal 1 0.02 8 X
Calibration transfer factor 0.20 B rectangular 1 0.20 ∞ O
Repeatability of calibration 0.04 A normal 1 0.04 9 X
Spectral mismatch
correction
Wavelength error in LED
spectrum
B normal 0.05 –
0.2 %/nm
0.02 ∞ O
Wavelength error in
photometer response
B normal 0.5 –
4.7 %/nm
0.19 ∞ O
Relative spectral
responsivity of photometer
0.20 B rectangular 1 0.20 ∞ O
Throughput of integrating
sphere
0.50 B rectangular 1 0.50 ∞ O
Measurement geometry of
relative spectral response of
photometer
0.30 B rectangular 1 0.30 ∞ O
Combined standard
uncertainty (%)
-- -- normal -- 1.32 ∞ --
Table 4-7. MIKES uncertainty budget of total luminous flux measurement for green LEDs (G).
Uncertainty Component Standard
uncertainty
(%)
Ty
pe
Probability
distribution
Sensitivity
coefficient
Contrib
ution
(%)
Deg. of
freedo
m
Correl
ated?
Setup-related
Repeatability 0.41 A normal 1 0.41 11 X
Near-field absorption 1.00 B rectangular 1 1.00 ∞ O

APMP.PR-S3b Total Luminous Flux of LEDs Final Report
18
Self-absorption correction
factor
0.02 A normal 1 0.02 5 X
Non-uniformity of sphere
wall
0.20 B rectangular 1 0.20 ∞ O
Photocurrent measurement
(flux signal)
0.03 B rectangular 1 0.03 ∞ X
Current feeding B rectangular 3 –
5 %/mA
0.02 ∞ O
Integrating sphere
calibration
Illuminance responsivity of
photometer
0.20 B normal 1 0.20 ∞ O
Photocurrent measurement
(illuminance)
0.01 A normal 1 0.01 19 X
Drift of the external source 0.01 B rectangular 1 0.01 ∞ O
Long-term stability of
photometer
0.14 B rectangular 1 0.14 ∞ O
Distance setting of sphere-
photometer
B rectangular 0.5 %/mm 0.06 ∞ X
Aperture diameter B rectangular 0.006
%/μm
0.04 ∞ O
Reflection from aperture
land
B rectangular 1 0.05 ∞ O
Illuminance non-uniformity
correction
0.02 A normal 1 0.02 8 X
Calibration transfer factor 0.20 B rectangular 1 0.20 ∞ O
Repeatability of calibration 0.04 A normal 1 0.04 9 X
Spectral mismatch
correction
Wavelength error in LED
spectrum
B normal 0.05 –
0.2 %/nm
0.03 ∞ O
Wavelength error in
photometer response
B normal 0.5 –
4.7 %/nm
0.15 ∞ O
Relative spectral
responsivity of photometer
0.20 B rectangular 1 0.10 ∞ O
Throughput of integrating
sphere
0.50 B rectangular 1 0.30 ∞ O
Measurement geometry of
relative spectral response of
photometer
0.30 B rectangular 1 0.30 ∞ O
Combined standard
uncertainty (%)
-- -- normal -- 1.24 ∞ --
Table 4-8. MIKES uncertainty budget of total luminous flux measurement for blue LEDs (B).

APMP.PR-S3b Total Luminous Flux of LEDs Final Report
19
Uncertainty Component Standard
uncertainty
(%)
Ty
pe
Probability
distribution
Sensitivity
coefficient
Contrib
ution
(%)
Deg. of
freedo
m
Correl
ated?
Setup-related
Repeatability 0.41 A normal 1 0.41 11 X
Near-field absorption 1.00 B rectangular 1 1.00 ∞ O
Self-absorption correction
factor
0.02 A normal 1 0.02 5 X
Non-uniformity of sphere
wall
0.20 B rectangular 1 0.20 ∞ O
Photocurrent measurement
(flux signal)
0.03 B rectangular 1 0.03 ∞ X
Current feeding B rectangular 3 –
5 %/mA
0.02 ∞ O
Integrating sphere
calibration
Illuminance responsivity of
photometer
0.20 B normal 1 0.20 ∞ O
Photocurrent measurement
(illuminance)
0.01 A normal 1 0.01 19 X
Drift of the external source 0.01 B rectangular 1 0.01 ∞ O
Long-term stability of
photometer
0.14 B rectangular 1 0.14 ∞ O
Distance setting of sphere-
photometer
B rectangular 0.5 %/mm 0.06 ∞ X
Aperture diameter B rectangular 0.006
%/μm
0.04 ∞ O
Reflection from aperture
land
B rectangular 1 0.05 ∞ O
Illuminance non-uniformity
correction
0.02 A normal 1 0.02 8 X
Calibration transfer factor 0.20 B rectangular 1 0.20 ∞ O
Repeatability of calibration 0.04 A normal 1 0.04 9 X
Spectral mismatch
correction
Wavelength error in LED
spectrum
B normal 0.05 –
0.2 %/nm
0.02 ∞ O
Wavelength error in
photometer response
B normal 0.5 –
4.7 %/nm
0.28 ∞ O
Relative spectral
responsivity of photometer
0.20 B rectangular 1 0.30 ∞ O

APMP.PR-S3b Total Luminous Flux of LEDs Final Report
20
Throughput of integrating
sphere
0.50 B rectangular 1 2.50 ∞ O
Measurement geometry of
relative spectral response of
photometer
0.30 B rectangular 1 0.30 ∞ O
Combined standard
uncertainty (%)
-- -- normal -- 2.80 ∞ --
Table 4-9. MIKES uncertainty budget of total luminous flux measurement for white LEDs (W).
Uncertainty Component Standard
uncertainty
(%)
Ty
pe
Probability
distribution
Sensitivity
coefficient
Contrib
ution
(%)
Deg. of
freedo
m
Correl
ated?
Setup-related
Repeatability 0.41 A normal 1 0.41 11 X
Near-field absorption 1.00 B rectangular 1 1.00 ∞ O
Self-absorption correction
factor
0.02 A normal 1 0.02 5 X
Non-uniformity of sphere
wall
0.20 B rectangular 1 0.20 ∞ O
Photocurrent measurement
(flux signal)
0.03 B rectangular 1 0.03 ∞ X
Current feeding B rectangular 3 –
5 %/mA
0.03 ∞ O
Integrating sphere
calibration
Illuminance responsivity of
photometer
0.20 B normal 1 0.20 ∞ O
Photocurrent measurement
(illuminance)
0.01 A normal 1 0.01 19 X
Drift of the external source 0.01 B rectangular 1 0.01 ∞ O
Long-term stability of
photometer
0.14 B rectangular 1 0.14 ∞ O
Distance setting of sphere-
photometer
B rectangular 0.5 %/mm 0.06 ∞ X
Aperture diameter B rectangular 0.006
%/μm
0.04 ∞ O
Reflection from aperture
land
B rectangular 1 0.05 ∞ O
Illuminance non-uniformity
correction
0.02 A normal 1 0.02 8 X
Calibration transfer factor 0.20 B rectangular 1 0.20 ∞ O

APMP.PR-S3b Total Luminous Flux of LEDs Final Report
21
Repeatability of calibration 0.04 A normal 1 0.04 9 X
Spectral mismatch
correction
Wavelength error in LED
spectrum
B normal 0.05 –
0.2 %/nm
< 0.01 ∞ O
Wavelength error in
photometer response
B normal 0.5 –
4.7 %/nm
0.03 ∞ O
Relative spectral
responsivity of photometer
0.20 B rectangular 1 0.03 ∞ O
Throughput of integrating
sphere
0.50 B rectangular 1 1.50 ∞ O
Measurement geometry of
relative spectral response of
photometer
0.30 B rectangular 1 0.10 ∞ O
Combined standard
uncertainty (%)
-- -- normal -- 1.89 ∞ --
Table 4-10. MIKES uncertainty budget of junction voltage measurement for red LEDs (R).
Uncertainty Component Standard
uncertainty
Ty
pe
Probability
distribution
Sensitivity
coefficient
Contrib
ution
(mV)
Deg. of
freedo
m
Correl
ated?
Calibration of voltmeter B normal 1 0.02 ∞ O
Junction position
dependence
B rectangular 1 0.03 ∞ X
Stability of junction voltage A normal 1 0.01 –
0.02
19 X
Combined standard
uncertainty (mV)
-- -- normal -- 0.04 –
0.045
∞ --
Table 4-11. MIKES uncertainty budget of junction voltage measurement for green LEDs (G).
Uncertainty Component Standard
uncertainty
Ty
pe
Probability
distribution
Sensitivity
coefficient
Contrib
ution
(mV)
Deg. of
freedo
m
Correl
ated?
Calibration of voltmeter B normal 1 0.03 ∞ O
Junction position
dependence
B rectangular 1 0.12 ∞ X
Stability of junction voltage A normal 1 0.03 –
0.04
19 X
Combined standard
uncertainty (mV)
-- -- normal -- 0.13 ∞ --
Table 4-12. MIKES uncertainty budget of junction voltage measurement for blue LEDs (B).

APMP.PR-S3b Total Luminous Flux of LEDs Final Report
22
Uncertainty Component Standard
uncertainty
Ty
pe
Probability
distribution
Sensitivity
coefficient
Contrib
ution
(mV)
Deg. of
freedo
m
Correl
ated?
Calibration of voltmeter B normal 1 0.03 ∞ O
Junction position
dependence
B rectangular 1 0.10 ∞ X
Stability of junction voltage A normal 1 0.03 –
0.06
19 X
Combined standard
uncertainty (mV)
-- -- normal -- 0.11 –
0.12
∞ --
Table 4-13. MIKES uncertainty budget of junction voltage measurement for white LEDs (W).
Uncertainty Component Standard
uncertainty
Ty
pe
Probability
distribution
Sensitivity
coefficient
Contrib
ution
(mV)
Deg. of
freedo
m
Correl
ated?
Calibration of voltmeter B normal 1 0.03 ∞ O
Junction position
dependence
B rectangular 1 0.20 ∞ X
Stability of junction voltage A normal 1 0.03 –
0.04
19 X
Combined standard
uncertainty (mV)
-- -- normal -- 0.21 ∞ --
4.3. CMS-ITRI
4.3.1. Measurement setup
As Fig. 4-3, the test LED is located within the integrating sphere centre. The integrating
sphere diameter is 1500 mm, include one auxiliary lamp for calculating absorption effect
and a optical detector for measuring optical signal. By substitute method, comparing the
output signal from the LED to that from the standard lamp in the integrating sphere.
Using the DC multiple standard resistor, two voltage meter and DC power supply that
give the LED current and monitor the current and voltage of the junction of LED. The
detector is the V(λ) optical detector connect the optical current meter for getting the
optical signal.

APMP.PR-S3b Total Luminous Flux of LEDs Final Report
23
Fig. 4-3. Total Luminous Flux of LEDs measurement system in CMS-ITRI.
4.3.2. Mounting and alignment
Fig. 4-4 is the vertical view of LED alignment. The LED at the centre of integrating sphere
and the beam direction is at the uniform area of the sphere that is flat spatial response
of distribution area. The LED is mounting by a holder that has two pins connect and has
two wires at the end of holder for power current connecting.
Fig. 4-4. The vertical view of LED alignment in CMS-ITRI.
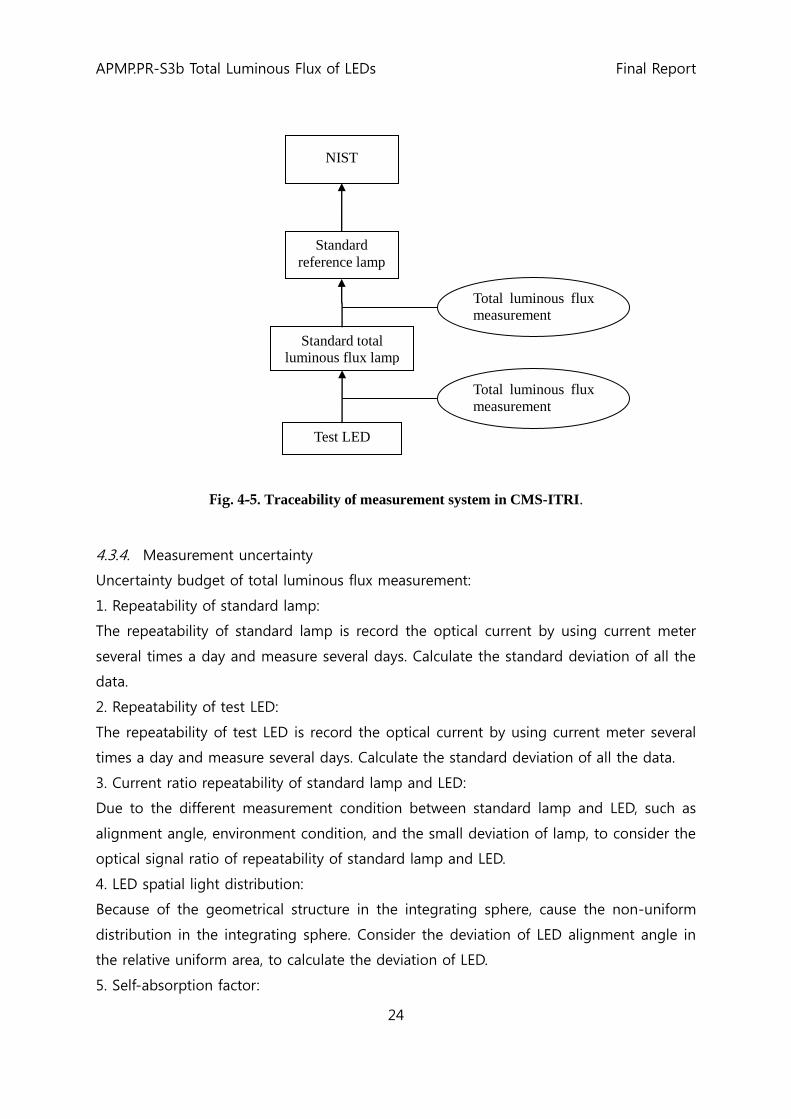
4.3.3. Traceability
The traceability of LED total luminous flux is trace to the standard total luminous flux
lamp by total luminous flux measurement system. The standard total luminous flux lamp
is trace to the standard reference lamp then trace to NIST.
Baffle
Baffle
Detector Auxiliary
lamp
LED
(Vertical view)
LED
holder
Detector
(100 mm2 circular
aperture) LED
Alignment CCD
Alignment CCD
100 mm
APMP.PR-S3b Total Luminous Flux of LEDs Final Report
24
Fig. 4-5. Traceability of measurement system in CMS-ITRI.
4.3.4. Measurement uncertainty
Uncertainty budget of total luminous flux measurement:
1. Repeatability of standard lamp:
The repeatability of standard lamp is record the optical current by using current meter
several times a day and measure several days. Calculate the standard deviation of all the
data.
2. Repeatability of test LED:
The repeatability of test LED is record the optical current by using current meter several
times a day and measure several days. Calculate the standard deviation of all the data.
3. Current ratio repeatability of standard lamp and LED:
Due to the different measurement condition between standard lamp and LED, such as
alignment angle, environment condition, and the small deviation of lamp, to consider the
optical signal ratio of repeatability of standard lamp and LED.
4. LED spatial light distribution:
Because of the geometrical structure in the integrating sphere, cause the non-uniform
distribution in the integrating sphere. Consider the deviation of LED alignment angle in
the relative uniform area, to calculate the deviation of LED.
5. Self-absorption factor:
Standard total
luminous flux lamp
Standard
reference lamp
Test LED
Total luminous flux
measurement
system
NIST
Total luminous flux
measurement
system

APMP.PR-S3b Total Luminous Flux of LEDs Final Report
25
The self-absorption factor is when turn on the auxiliary lamp to measure the optical
signal of standard lamp and LED lamp, then to calculate the both of two ratio.
6. Spectral mismatch correction:
Because of the correction of spectrometer which the wavelength shifts affect the spectral
correction factor (SCF). Consider the wavelength shifts cause the error of SCF.
7. Calibration of standard lamp:
The uncertainty of calibration of standard lamp is drive from the relative expand
uncertainty calibrated by National measurement laboratory (NML) in Taiwan.
Uncertainty budget of junction voltage measurement:
1. Repeatability of test LED:
The repeatability of test LED is record the junction voltage by using voltage meter several
times a day and measure several days when measuring the LED averaged intensity.
Calculate the standard deviation of all the data.
2. Resolution of voltmeter:
To consider the drift when measure the junction voltage that is the maximum digit of
voltage meter.
3. Long-term drift of voltmeter:
Long-term drift of voltmeter is the drift of the traceability since the past. Calculate the
maximum deviation of the uncertainty drift.
4. Voltmeter calibration:
The uncertainty of voltmeter is drive from the relative expand uncertainty calibrated by
National measurement laboratory (NML) in Taiwan.
Table 4-14. CMS-ITRI uncertainty budget of total luminous flux measurement for red LEDs
(R).
Uncertainty Component Standard
uncertainty
Ty
pe
Probability
distribution
Sensitivity
coefficient
Contrib
ution
(%)
Deg. of
freedo
m
Correl
ated?
Repeatability of standard
lamp
0.002 A t 1 0.002 87 X
Repeatability of test LED 0.040 A t 1 0.040 87 O
Current ratio repeatability
of standard lamp and LED
0.156 A t 1 0.156 2 O
LED spatial light
distribution
0.664 B rectangular 1 0.664 200 X

APMP.PR-S3b Total Luminous Flux of LEDs Final Report
26
Self-absorption factor 0.123 A t 1 0.123 89 O
Spectral mismatch
correction
0.090 B rectangular 1 0.090 200 O
Calibration of standard
lamp
0.920 B normal 1 0.920 5000 O
Combined standard
uncertainty (%)
-- -- normal -- 1.16 1264 --
Table 4-15. CMS-ITRI uncertainty budget of total luminous flux measurement for green LEDs
(G).
Uncertainty Component Standard
uncertainty T
yp
e Probability
distribution
Sensitivity
coefficient
Contrib
ution
(%)
Deg. of
freedo
m
Correl
ated?
Repeatability of standard
lamp
0.003 A t 1 0.003 87 X
Repeatability of test LED 0.032 A t 1 0.032 87 O
Current ratio repeatability
of standard lamp and LED
0.228 A t 1 0.228 2 O
LED spatial light
distribution
0.664 B rectangular 1 0.664 200 X
Self-absorption factor 0.041 A t 1 0.041 89 O
Spectral mismatch
correction
0.271 B rectangular 1 0.271 200 O
Calibration of standard
lamp
0.920 B normal 1 0.920 5000 O
Combined standard
uncertainty (%)
-- -- normal -- 1.19 807 --
Table 4-16. CMS-ITRI uncertainty budget of total luminous flux measurement for blue LEDs
(B).
Uncertainty Component Standard
uncertainty
Ty
pe
Probability
distribution
Sensitivity
coefficient
Contrib
ution
(%)
Deg. of
freedo
m
Correl
ated?
Repeatability of standard
lamp
0.003 A t 1 0.003 87 X
Repeatability of test LED 0.033 A t 1 0.033 87 O
Current ratio repeatability
of standard lamp and LED
0.222 A t 1 0.222 2 O
LED spatial light
distribution
0.664 B rectangular 1 0.664 200 X

APMP.PR-S3b Total Luminous Flux of LEDs Final Report
27
Self-absorption factor 0.022 A t 1 0.022 89 O
Spectral mismatch
correction
0.156 B rectangular 1 0.156 200 O
Calibration of standard
lamp
0.920 B normal 1 0.920 5000 O
Combined standard
uncertainty (%)
-- -- normal -- 1.17 794 --
Table 4-17. CMS-ITRI uncertainty budget of total luminous flux measurement for white LEDs
(W).
Uncertainty Component Standard
uncertainty T
yp
e
Probability
distribution
Sensitivity
coefficient
Contrib
ution
(%)
Deg. of
freedo
m
Correl
ated?
Repeatability of standard
lamp
0.003 A t 1 0.003 87 X
Repeatability of test LED 0.032 A t 1 0.032 87 O
Current ratio repeatability
of standard lamp and LED
0.252 A t 1 0.252 2 O
LED spatial light
distribution
0.664 B rectangular 1 0.664 200 X
Self-absorption factor 0.044 A t 1 0.044 89 O
Spectral mismatch
correction
0.032 B rectangular 1 0.032 200 O
Calibration of standard
lamp
0.920 B normal 1 0.920 5000 O
Combined standard
uncertainty (%)
-- -- normal -- 1.16 586 --
Table 4-18. CMS-ITRI uncertainty budget of junction voltage measurement for red LEDs (R).
Uncertainty Component Standard
uncertainty
(%)
Ty
pe
Probability
distribution
Sensitivity
coefficient
Contrib
ution
(%)
Deg. of
freedo
m
Correl
ated?
Repeatability 0.020 A t 1 0.020 200 X
Resolution of voltmeter 0.003 B rectangular 1 0.003 200 O
Long-term drift of
voltmeter
0.026 B rectangular 1 0.026 200 O
Voltmeter calibration 0.001 B normal 1 0.001 5000 O
Combined standard
uncertainty (%)
-- -- normal -- 0.04 402 --

APMP.PR-S3b Total Luminous Flux of LEDs Final Report
28
Table 4-19. CMS-ITRI uncertainty budget of junction voltage measurement for green LEDs
(G).
Uncertainty Component Standard
uncertainty
(%)
Ty
pe
Probability
distribution
Sensitivity
coefficient
Contrib
ution
(%)
Deg. of
freedo
m
Correl
ated?
Repeatability 0.070 A t 1 0.070 200 X
Resolution of voltmeter 0.003 B rectangular 1 0.003 200 O
Long-term drift of
voltmeter
0.026 B rectangular 1 0.026 200 O
Voltmeter calibration 0.001 B normal 1 0.001 5000 O
Combined standard
uncertainty (%)
-- -- normal -- 0.07 261 --
Table 4-20. CMS-ITRI uncertainty budget of junction voltage measurement for blue LEDs (B).
Uncertainty Component Standard
uncertainty
(%)
Ty
pe
Probability
distribution
Sensitivity
coefficient
Contrib
ution
(%)
Deg. of
freedo
m
Correl
ated?
Repeatability 0.050 A t 1 0.050 200 X
Resolution of voltmeter 0.003 B rectangular 1 0.003 200 O
Long-term drift of
voltmeter
0.026 B rectangular 1 0.026 200 O
Voltmeter calibration 0.001 B normal 1 0.001 5000 O
Combined standard
uncertainty (%)
-- -- normal -- 0.06 294 --
Table 4-21. CMS-ITRI uncertainty budget of junction voltage measurement for white LEDs
(W).
Uncertainty Component Standard
uncertainty
(%)
Ty
pe
Probability
distribution
Sensitivity
coefficient
Contrib
ution
(%)
Deg. of
freedo
m
Correl
ated?
Repeatability 0.140 A t 1 0.140 200 X
Resolution of voltmeter 0.003 B rectangular 1 0.003 200 O

APMP.PR-S3b Total Luminous Flux of LEDs Final Report
29
Long-term drift of
voltmeter
0.026 B rectangular 1 0.026 200 O
Voltmeter calibration 0.001 B normal 1 0.001 5000 O
Combined standard
uncertainty (%)
-- -- normal -- 0.15 213 --
4.4. PTB
4.4.1. Measurement setup
Fig. 4-6 below shows the measurement setup in principle. To enable the measurement of
all the desired quantities, a special mechanism is needed. This allows the following
functionality: the alignment of the LED transfer standard to the optical axis of the system,
the rotation of the LED transfer standard around its horizontal axis φ and rotation
around its vertical axis θ. Furthermore, it allows the variation of the distance r between
the selected detector and the LED transfer standard. Opposite the LED transfer standard,
a rotating wheel is used for a quick detector selection. Additionally, there is a laser and a
CCD camera mounted to enable the easy alignment of the LED transfer standard. Due to
the rotation of φ angle, the interconnection between the power supply and the LED
under test prohibits an endless rotation.
Thus, in the case of luminous flux measurements after a little more than one
rotation, a stop is needed. The next movement will then be the turn back and so on.
The goniophotometer measured the zonal photocurrent (which is proportional to
the measured averaged illuminance) as a function of the angle θ where θ = 0 represents
the optical axis of the goniophotometer, which is also the mechanical axis of the LED
package in the direction of emittance. See Fig. 4-7 below.

APMP.PR-S3b Total Luminous Flux of LEDs Final Report
30
Fig. 4-6. Measurement setup for total luminous flux in PTB.
Fig. 4-7. Geometry of the gonio-photometric measurement of LED total luminous flux in PTB.
4.4.2. Mounting and alignment
Fig. 4-8 below shows the holder which was used to hold, align and operate each LED. A
high reflecting cone directly behind the installed LED allows for the indirect measurement
of the backward directed partial luminous flux of the LEDs, which also contributes to the
total luminous flux.

APMP.PR-S3b Total Luminous Flux of LEDs Final Report
31
Fig. 4-8. Pictures of the LED holder used in the measurement of total luminous flux in PTB.
4.4.3. Traceability
The primary standards for the measured quantities are traceable to national standards.
4.4.4. Measurement uncertainty
The uncertainties are determined from up to 30 individual contributions originated in the
operation and alignment of an LED in thermal conditions influenced by the holder and
the environment. The specific properties of the measurement devices and their effects
are considered in detail. The estimated uncertainties of the contributions are maximum
for standard LED calibrations at PTB. They are listed and sorted in uncertainty budgets.
The components are treated as uncorrelated.
The next statement shows the formula to determinate luminous flux:

APMP.PR-S3b Total Luminous Flux of LEDs Final Report
32
Table 4-22. PTB uncertainty budget of total luminous flux measurement for red LEDs (R).
Uncertainty Component Standard
uncertainty
Ty
pe
Probability
distribution
Sensitivity
coefficient
Contribut
ion (%)
Deg.
of
freedo
m
Correl
ated?
LED nominal current 0 A 22.8679 0
Exponent LED current
correction
0.36 B normal 9.98E-6 5.42E-4 13
LED current reading 2.0E-6 A A normal -22.8683 -6.88E-3 10
Correction factor for
spectral mismatch as
function of θ
0 B normal 0.665126 0 20
Exponent LED voltage
correction
1.6 B normal 1.0678E-3 0.25 13
LED nominal voltage for
25 °C
7.3E-4 V A normal 1.89755 0.21 9
LED voltage reading 6.0E-4 V A normal -1.9006 -0.17 10
Correction factor for
straylight
0.00050 B normal 0.665219 0.050 10
LED backward emission 0.0010 B normal 0.664462 0.10 10
Straylight correction of
spectrometer
5.0E-5 B normal 0.665126 0.0050 50
Bandbass correction of
spectrometer
0.00011 B normal 0.665126 0.011 50
Distance 0.00050 m B rectangular 4.20966 0.32 10
Photometric sensitivity of
photometer
8.9E-11 A/lx B normal -2.4003E7 -0.32 10
Spectral mismatch
correction factor
0.0078 B normal 0.648397 0.76 20
Integrated photocurrent,
solid angle weighted
2.3E-10 A B normal 2.34488E7 0.82 90

APMP.PR-S3b Total Luminous Flux of LEDs Final Report
33
Combined standard
uncertainty (%)
-- -- normal -- 1.27 105 --
Table 4-23. PTB uncertainty budget of total luminous flux measurement for green LEDs (G).
Uncertainty Component Standard
uncertainty
Ty
pe
Probability
distribution
Sensitivity
coefficient
Contribut
ion (%)
Deg.
of
freedo
m
Correl
ated?
LED nominal current 0 A 72.1745 0
Exponent LED current
correction
0.13 B normal 2.5724E-5 1.2E-4 13
LED current reading 2.0E-6 A A normal -72.1751 -0.0051 10
Correction factor for
spectral mismatch as
function of θ
0 B normal 2.85823 0 20
Exponent LED voltage
correction
0.45 B normal 6.5639E-3 0.10 13
LED nominal voltage for
25 °C
0.0026 V A normal 1.32354 0.12 9
LED voltage reading 0.0011 V A normal -1.32658 -0.052 10
Correction factor for
straylight
0.00050 B normal 2.85863 0.050 10
LED backward emission 0.0010 B normal 2.85537 0.10 10
Straylight correction of
spectrometer
3.0E-5 B normal 2.85823 0.003 50
Bandbass correction of
spectrometer
0.00010 B normal 2.85863 0.010 50
Distance 0.00050 m B rectangular 18.09 0.32 10
Photometric sensitivity of
photometer
8.9E-11 A/lx B normal -1.0314E8 -0.32 10
Spectral mismatch
correction factor
0.0035 B normal 2.87028 0.35 20
Integrated photocurrent,
solid angle weighted
1.2E-9 A B normal 2.26512E7 0.95 90
Combined standard
uncertainty (%)
-- -
-
normal -- 1.12 135 --
Table 4-24. PTB uncertainty budget of total luminous flux measurement for blue LEDs (B).
Uncertainty Component Standard
uncertainty
Ty
pe
Probability
distribution
Sensitivity
coefficient
Contribut
ion (%)
Deg.
of
free
dom
Correl
ated?

APMP.PR-S3b Total Luminous Flux of LEDs Final Report
34
LED nominal current 0 A 28.3522 0
Exponent LED current
correction
0.028 B normal 7.75322E-6 2.8E-5 13
LED current reading 2.0E-6 A A normal -28.3428 -0.0073 10
Correction factor for
spectral mismatch as
function of θ
0.00020 B normal 0.77 0.020 20
Exponent LED voltage
correction
0.10 B normal 0.0016 0.022 13
LED nominal voltage for
25 °C
0.0017 V A normal 0.109 0.024 9
LED voltage reading 8.0E-4 V A normal -0.109743 -0.011 10
Correction factor for
straylight
0.00050 B normal 0.775426 0.050 10
LED backward emission 0.0010 B normal 0.774543 0.10 10
Straylight correction of
spectrometer
0.0010 B normal 0.775318 0.10 50
Bandbass correction of
spectrometer
0.0010 B normal 0.775318 0.10 50
Distance 0.00050 m B rectangular 4.9 0.32 10
Photometric sensitivity of
photometer
8.9E-11
A/lx
B normal -2.79797E7 -0.32 10
Spectral mismatch
correction factor
0.0071 B normal 0.873302 0.80 50
Integrated photocurrent,
solid angle weighted
3.1E-10 A B normal 2.0155E7 0.82 90
Combined standard
uncertainty (%)
-- -- normal -- 1.24 157 -
Table 4-25. PTB uncertainty budget of total luminous flux measurement for white LEDs (W).
Uncertainty Component Standard
uncertainty
Ty
pe
Probability
distribution
Sensitivity
coefficient
Contribut
ion (%)
Deg.
of
freedo
m
Correl
ated?
LED nominal current 0 A 62.2722 0
Exponent LED current
correction
0.21 B normal 1.6824E-5 2.1E-4 13
LED current reading 2.0E-6 A A normal -62.2728 -0.0074 10
Correction factor for
spectral mismatch as
function of θ
0.00020 B normal 1.68311 0.020 20

APMP.PR-S3b Total Luminous Flux of LEDs Final Report
35
Exponent LED voltage
correction
0.61 B normal 0.0026366 0.095 13
LED nominal voltage for
25 °C
0.0025 V A normal 1.34013 0.20 9
LED voltage reading 0.0011 V A normal -1.34223 -0.09 10
Correction factor for
straylight
0.00050 B normal 1.68267 0.050 10
LED backward emission 0.0010 B normal 1.68076 0.10 10
Straylight correction of
spectrometer
1.0E-5 B normal 1.68244 0.001 50
Bandbass correction of
spectrometer
4.0E-5 B normal 1.68244 0.0040 50
Distance 0.00050 m B rectangular 10.6483 0.32 10
Photometric sensitivity of
photometer
8.9E-11 A/lx B normal -6.0715E7 -0.32 10
Spectral mismatch
correction factor
0.0023 B normal 1.69072 0.23 50
Integrated photocurrent,
solid angle weighted
6.8E-10 A B normal 2.2639E7 0.92 90
Combined standard
uncertainty (%)
-- -- normal -- 1.1 134 --
Table 4-26. PTB uncertainty budget of junction voltage measurement of blue LED (example).
Uncertainty Component Standard
uncertainty
Ty
pe
Probability
distribution
Sensitivity
coefficient
Contrib
ution
(mV)
Deg. of
freedo
m
Correl
ated?
Calibration of voltmeter 0.00005 B rectangular 3.44 0.17 10
Junction position
dependence
0.00052 V B rectangular -1 -0.52 10
Reproducibility 0.00058 V A normal 1 0.58 10
Combined standard
uncertainty (mV)
-- -- normal -- 0.80 21 --
4.5. NMIJ
4.5.1. Measurement setup
The measurement of LED luminous flux at NMIJ is based on the goniophotometric
method. The measurement distance is 1.15m. "f1' value" of a photometer for LED
luminous flux (LED-photometer) is 2.4. The Photometer and the LED mount socket were

APMP.PR-S3b Total Luminous Flux of LEDs Final Report
36
installed on the automatic-move stage.
Fig. 4-9. Calibration facility for LED luminous intensity and total luminous flux in NMIJ.
4.5.2. Mounting and alignment
a) The laser system and the telescope with CCD camera are used for LED alignment.
b) LED holder is mounted to the gonio-stage. (see Fig. 4-10)
c) Fig. 4-11 shows picture of the LED holder. (Pin socket is used to mount LED)
Fig. 4-10. LED mount socket mounted to the gonio-stage in NMIJ.
Fig. 4-11. LED mount socket in NMIJ.

APMP.PR-S3b Total Luminous Flux of LEDs Final Report
37
4.5.3. Traceability
a) Illuminance responsivity of the LED photometer ⇒ luminous intensity standard at
NMIJ.
b) Relative spectral responsivity of the LED photometer ⇒ spectral responsivity
standard at NMIJ.
c) Relative spectral distribution of the test LED ⇒ spectral irradiance standard at NMIJ.
4.5.4. Measurement uncertainty
Table 4-27. NMIJ uncertainty budget of total luminous flux measurement for red LEDs (R).
Uncertainty Component Standard
uncertainty
Ty
pe
Probability
distribution
Sensitivity
coefficient
Contrib
ution
(%)
Deg. of
freedo
m
Correl
ated?
Calibration of illuminance
responsivity
B gaussian 1 0.32 1510 O
Temperature dependence of
illuminance responsivity 1.2 °C B rectangular 0.08 %/°C 0.09 ∞ O
Linearity of illuminance
responsivity
B rectangular 1 0.05 ∞ O
Reference plane of
photometer
0.62 mm B rectangular 0.17 %/mm 0.11 ∞ O
Distance alignment 0.21 mm B rectangular 0.17 %/mm 0.04 ∞ X
Current feeding accuracy B rectangular 1 < 0.01 ∞ O
DMM accuracy B rectangular 1 < 0.01 ∞ O
Axis alignment 0.29 mm B rectangular 0.62 %/mm 0.18 ∞ X
Optical center in LED B rectangular 1 0.61 ∞ X
Angle accuracy B rectangular 1 0.05 ∞ O
Repeatability of LED
lighting (including noise
and drift)
A t 1 0.13 6 X
Stray light B rectangular 1 0.10 ∞ O
measurement angle step
and angular resolution
B rectangular 1 0.91 ∞ X
Spectral mismatch correction factor
Spectral responsivity
calibration (including
A
+
gaussian 1 0.11 ∞ X

APMP.PR-S3b Total Luminous Flux of LEDs Final Report
38
repeatability) B
Spectral irradiance
calibration (including
repeatability)
A
+
B
gaussian 1 < 0.01 ∞ X
Wavelength uncertainty of
relative spectral
responsivity
Random
0.1 nm,
systematic
0.1 nm
A
+
B
gaussian
(random
factor),
rectangular
(systematic
factor)
-- 0.19 ∞ X
Wavelength uncertainty of
LED spectral distribution
Random
0.1 nm,
systematic
0.1 nm
A
+
B
gaussian
(random
factor),
rectangular
(systematic
factor)
-- 0.02 ∞ X
Effect of slit function width B rectangular 1 0.04 ∞ X
Angular dependence of
LED spectral distribution
B rectangular 1 0.12 ∞ X
Combined standard
uncertainty (%)
-- -- normal -- 1.2 >>
20000
--
Table 4-28. NMIJ uncertainty budget of total luminous flux measurement for green LEDs (G).
Uncertainty Component Standard
uncertainty
Ty
pe
Probability
distribution
Sensitivity
coefficient
Contrib
ution
(%)
Deg. of
freedo
m
Correl
ated?
Calibration of illuminance
responsivity
B gaussian 1 0.32 1510 O
Temperature dependence of
illuminance responsivity 1.2 °C B rectangular 0.21 %/°C 0.25 ∞ O
Linearity of illuminance
responsivity
B rectangular 1 0.05 ∞ O
Reference plane of
photometer
0.62 mm B rectangular 0.17 %/mm 0.11 ∞ O
Distance alignment 0.21 mm B rectangular 0.17 %/mm 0.04 ∞ X
Current feeding accuracy B rectangular 1 < 0.01 ∞ O
DMM accuracy B rectangular 1 < 0.01 ∞ O
Axis alignment 0.29 mm B rectangular 0.62 %/mm 0.18 ∞ X
Optical center in LED B rectangular 1 0.61 ∞ X
Angle accuracy B rectangular 1 0.05 ∞ O

APMP.PR-S3b Total Luminous Flux of LEDs Final Report
39
Repeatability of LED
lighting (including noise
and drift)
A t 1 0.09 6 X
Stray light B rectangular 1 0.10 ∞ O
measurement angle step
and angular resolution
B rectangular 1 0.28 ∞ X
Spectral mismatch correction factor
Spectral responsivity
calibration (including
repeatability)
A
+
B
gaussian 1 0.10 ∞ X
Spectral irradiance
calibration (including
repeatability)
A
+
B
gaussian 1 < 0.01 ∞ X
Wavelength uncertainty of
relative spectral
responsivity
Random
0.1 nm,
systematic
0.1 nm
A
+
B
gaussian
(random
factor),
rectangular
(systematic
factor)
-- 0.2 ∞ X
Wavelength uncertainty of
LED spectral distribution
Random
0.1 nm,
systematic
0.1 nm
A
+
B
gaussian
(random
factor),
rectangular
(systematic
factor)
-- 0.02 ∞ X
Effect of slit function width B rectangular 1 0.05 ∞ X
Angular dependence of
LED spectral distribution
B rectangular 1 0.05 ∞ X
Combined standard
uncertainty (%)
-- -- normal -- 0.86 >>
20000
--
Table 4-29. NMIJ uncertainty budget of total luminous flux measurement for blue LEDs (B).
Uncertainty Component Standard
uncertainty
Ty
pe
Probability
distribution
Sensitivity
coefficient
Contrib
ution
(%)
Deg. of
freedo
m
Correl
ated?
Calibration of illuminance
responsivity
B gaussian 1 0.32 1510 O
Temperature dependence of
illuminance responsivity 1.2 °C B rectangular 0.33 %/°C 0.38 ∞ O
Linearity of illuminance
responsivity
B rectangular 1 0.05 ∞ O
Reference plane of
photometer
0.62 mm B rectangular 0.17 %/mm 0.11 ∞ O
Distance alignment 0.21 mm B rectangular 0.17 %/mm 0.04 ∞ X
Current feeding accuracy B rectangular 1 < 0.01 ∞ O

APMP.PR-S3b Total Luminous Flux of LEDs Final Report
40
DMM accuracy B rectangular 1 < 0.01 ∞ O
Axis alignment 0.29 mm B rectangular 0.62 %/mm 0.18 ∞ X
Optical center in LED B rectangular 1 0.61 ∞ X
Angle accuracy B rectangular 1 0.05 ∞ O
Repeatability of LED
lighting (including noise
and drift)
A t 1 0.06 6 X
Stray light B rectangular 1 0.10 ∞ O
measurement angle step
and angular resolution
B rectangular 1 0.26 ∞ X
Spectral mismatch correction factor
Spectral responsivity
calibration (including
repeatability)
A
+
B
gaussian 1 0.19 ∞ X
Spectral irradiance
calibration (including
repeatability)
A
+
B
gaussian 1 < 0.01 ∞ X
Wavelength uncertainty of
relative spectral
responsivity
Random
0.1 nm,
systematic
0.1 nm
A
+
B
gaussian
(random
factor),
rectangular
(systematic
factor)
-- 0.31 ∞ X
Wavelength uncertainty of
LED spectral distribution
Random
0.1 nm,
systematic
0.1 nm
A
+
B
gaussian
(random
factor),
rectangular
(systematic
factor)
-- < 0.01 ∞ X
Effect of slit function width B rectangular 1 0.04 ∞ X
Angular dependence of
LED spectral distribution
B rectangular 1 0.06 ∞ X
Combined standard
uncertainty (%)k=1
-- -- normal -- 0.94 >>
20000
--
Table 4-30. NMIJ uncertainty budget of total luminous flux measurement for white LEDs (W).
Uncertainty Component Standard
uncertainty
Ty
pe
Probability
distribution
Sensitivity
coefficient
Contrib
ution
(%)
Deg. of
freedo
m
Correl
ated?
Calibration of illuminance
responsivity
B gaussian 1 0.32 1510 O
Temperature dependence of
illuminance responsivity 1.2 °C B rectangular 0.17 %/°C 0.20 ∞ O

APMP.PR-S3b Total Luminous Flux of LEDs Final Report
41
Linearity of illuminance
responsivity
B rectangular 1 0.05 ∞ O
Reference plane of
photometer
0.62 mm B rectangular 0.17 %/mm 0.11 ∞ O
Distance alignment 0.21 mm B rectangular 0.17 %/mm 0.04 ∞ X
Current feeding accuracy B rectangular 1 < 0.01 ∞ O
DMM accuracy B rectangular 1 < 0.01 ∞ O
Axis alignment 0.29 mm B rectangular 0.62 %/mm 0.18 ∞ X
Optical center in LED B rectangular 1 0.31 ∞ X
Angle accuracy B rectangular 1 0.05 ∞ O
Repeatability of LED
lighting (including noise
and drift)
A t 1 0.14 6 X
Stray light B rectangular 1 0.10 ∞ O
measurement angle step
and angular resolution
B rectangular 1 0.12 ∞ X
Spectral mismatch correction factor
Spectral responsivity
calibration (including
repeatability)
A
+
B
gaussian 1 0.03 ∞ X
Spectral irradiance
calibration (including
repeatability)
A
+
B
gaussian 1 < 0.01 ∞ X
Wavelength uncertainty of
relative spectral
responsivity
Random
0.1 nm,
systematic
0.1 nm
A
+
B
gaussian
(random
factor),
rectangular
(systematic
factor)
-- 0.04 ∞ X
Wavelength uncertainty of
LED spectral distribution
Random
0.1 nm,
systematic
0.1 nm
A
+
B
gaussian
(random
factor),
rectangular
(systematic
factor)r
-- < 0.01 ∞ X
Effect of slit function width B rectangular 1 0.01 ∞ X
Angular dependence of
LED spectral distribution
B rectangular 1 0.42 ∞ X
Combined standard
uncertainty (%)k=1
-- -- normal -- 0.71 >>
20000
--
Table 4-31. NMIJ uncertainty budget of junction voltage measurement.

APMP.PR-S3b Total Luminous Flux of LEDs Final Report
42
Uncertainty Component Standard
uncertainty
Ty
pe
Probability
distribution
Sensitivity
coefficient
Contrib
ution
(V)
Deg. of
freedo
m
Correl
ated?
Calibration of DMM B gaussian 1 0.0001 ∞ O
Repeatability (including
effect of temperature
difference)
A gaussian 1 0.0001
~
0.0033
4 X
Junction position B rectangular 1 0.0003 ∞ X
Combined standard
uncertainty (V) k=1
-- -- normal -- 0.0003
~
0.0033
20 --
4.6. CENAM
4.6.1. Measurement setup
The measurement system used for Total Luminous Flux is conformed by a set of standard
incandescent lamps and a 1 m diameter luminous integrating sphere. The integrating
sphere includes a photometric detector coupled to the exit port of a satellite sphere, an
auxiliary lamp, a pair of baffles to avoid the direct incidence of light into the photometric
detector, and a lamp holder. The measurement system is completed with the electronic
instrumentation commonly used to measure photocurrents and other electric operating
parameters of the lamps. The measurement system used is shown in Fig. 4-12 and Fig.
4-13.
Fig. 4-12. Schematic diagram of the total luminous flux measurement setup in CENAM.

APMP.PR-S3b Total Luminous Flux of LEDs Final Report
43
Fig. 4-13. 1 m diameter integrating sphere at CENAM.
4.6.2. Mounting and alignment
In order to mount the LEDs artefacts inside the integrating sphere, an LED holder was
adapted to the lamp holder as shown in Fig. 4-14. No alignment was provided to the
LEDs.
Fig. 4-14. LED holders for integrating sphere in CENAM.
4.6.3. Traceability
The total luminous flux was measured by using a photometric detector and set of
standard lamps calibrated for this quantity by NIST. Fig. 4-15 shows the traceability chart
for the Total Luminous Flux measurements performed at CENAM, where the expanded
uncertainty presented correspond to a coverage factor of k = 2.

APMP.PR-S3b Total Luminous Flux of LEDs Final Report
44
Fig. 4-15. Traceability chart for the total luminous flux measurements performed at CENAM.
4.6.4. Measurement uncertainty
The total luminous flux of the LED led is determined by using Eq. (4.1):
, (4.1)
where iled is the photocurrent of the photometer head when measuring the LED’s, led is
the LED self-absorption correction, ccf*(Sled) is the LED spectral mismatch correction
factor, ccf*(Sp) is the standard lamp spectral mismatch correction factor, p is the value of
the standard lamps total luminous flux, and T is the system transfer function given by
Eq. (4.2):
, (4.2)
where p is the standard lamps self-absorption correction and ip is the photocurrent of
the photometer head when measuring standard lamps.
The spectral mismatch correction factor used for the standard lamps and the
white LED’s is given by Eq. (4.3):
, (4.3)
where SA(λ) is the relative spectral power distribution of the CIE Illuminant A, Si(λ) is the
relative spectral power distribution of the source when located inside the integrating
Total Luminous Flux
0,5 lm - 5 000 lm
LED’S
U = 11%
volt
[V]
Voltage [V]
Multimeter
M-3457-883
M-3458-334
U ≤ 13 µV/V
CNM-PNE-5
Electric DC
Voltage
ohm
[]
Resistance []
Shunt Resistor
Res-61173
0,0999965
U ≤ 1,7µΩ/Ω
[V]
Multimeters
M-3457-883
M-3457-885
U = 15µV
/Ω
r
M-3457-881
CNM-PNE-3
Electric
Resistance
ampere
[A]
Electrical DC
current [A]
Multimeter
M-3458-334
U ≤ 13 µA/A
CNM-PNE-13
Electric DC
Current
lumen
[lm]
Total Luminous Flux
NIST
Integrating Sphere
CNM-PNF-15
Total Luminous
Flux
Total Luminous Flux
[lm]
Lamps
P486, P487
U = 0.5 %
SI units
External
Services

APMP.PR-S3b Total Luminous Flux of LEDs Final Report
45
sphere, V(λ) is the spectral luminous efficiency function and Rs(λ) is the relative spectral
responsivity function of the sphere system, that can be obtained by measuring the
relative spectral responsivity of the photometer head, Srel-df (, and the relative spectral
throughput of the integrating sphere Ts(λ) as in Eq. (4.4):
), (4.4)
The relative spectral throughput Ts(λ) of the sphere was obtained using a
spectrorradiometer and calculating the ratios of the spectral irradiance on the detector
port of the sphere to the spectral irradiance of the same lamp or LED measured outside
the integrating sphere, as shown in Eq. (4.5):
, (4.5)
For the red, green and blue LEDs, the spectral mismatch correction factor used is given
by Eq. (4.6):
, (4.6)
where SA(λ) is the relative spectral power distribution of the CIE Illuminant A, Srel-df () is
the relative spectral responsivity of the photometer head and SLED is the LED relative
spectral power distribution, which was simulated from the measured FWHM and peak
wavelength6.
Thus, the uncertainty estimation of the spectral irradiance was done by
considering the input and influence quantities presented in Fig. 4-16.
6 Richard Y., Kathleen M.., Carolyn J., Quantifying photometric spectral mismatch uncertainties in LED measurements, Proceedings of the 2nd Expert Symposium on LED Measurement, CIE, Genève, (2001).

APMP.PR-S3b Total Luminous Flux of LEDs Final Report
46
Fig. 4-16. Total luminous flux uncertainty components in CENAM.
Table 4-32. CENAM uncertainty budget of total luminous flux measurement for red LEDs (R).
Uncertainty Component Standard
uncertainty
(%)
Ty
pe
Probability
distribution
Sensitivity
coefficient
Contrib
ution
(%)
Deg. of
freedom Correl
ated?
Total
Luminous
Flux
T
Reading repeatibility
Multimeter resolution
Multimeter error
p
i p
Multimeter resolution
Reading repeatibility
Multimeter error
Total luminous flux reference value
ccf*
standard lamps and
white LED’s
S rel
S lamp
Photometer head relative spectral responsivity
Spectroradiometer error
Spectroradiometer repeatibility in the sphere
Spectroradiometer repeatibility out the sphere
i led
Multimeter resolution
Multimeter repeatibility
Multimeter error
led
Multimeter resolution
Multimeter repeatibility
Multimeter error
ccf*
red, green and blue
LED’s
S rel
S lamp Spectroradiometer error
Photometer head relative spectral responsivity
Spectroradiometer repeatibility in the sphere
Current
feeding
accuracy
R Resistance value
V Resistance
Multimeter resolution
Multimeter repeatibility
Multimeter error
Voltage
junction
due to position
position vled FLT
V LED
Multimeter resolution
Multimeter repeatibility
Multimeter error

APMP.PR-S3b Total Luminous Flux of LEDs Final Report
47
Luminous flux reference
value
0.25 B normal 1 0.25 200 X
System transfer function 0.11 B normal 1 0.11 200 X
Standard lamps spectral
mismatch correction
2.22 B normal 1 2.22 200 X
LED self-absorption
correction
0.06 B normal 1 0.06 200 O
LED readings repeatability 3.87 A normal 1 3.87 14 O
LEDs spectral mismatch
correction
2.65 B normal 1 2.65 200 O
Junction voltage 0.012 A normal 1 0.012 14 X
Current feeding accuracy 0.17 A normal 1 0.17 14 X
Combined standard
uncertainty (%)
-- -- normal -- 5.20 45 --
Table 4-33. CENAM uncertainty budget of total luminous flux measurement for green LEDs
(G).
Uncertainty Component Standard
uncertainty
(%) Ty
pe
Probability
distribution
Sensitivity
coefficient
Contrib
ution
(%)
Deg. of
freedom Correl
ated?
Luminous flux reference
value
0.25 B normal 1 0.25 200 X
System transfer function 0.11 B normal 1 0.11 200 X
Standard lamps spectral
mismatch correction
2.44 B normal 1 2.44 200 X
LED self-absorption
correction
0.06 B normal 1 0.06 200 O
LED readings repeatability 1.63 A normal 1 1.63 14 O
LEDs spectral mismatch
correction
2.93 B normal 1 2.93 200 O
Junction voltage 0.012 A normal 1 0.012 14 X
Current feeding accuracy 1.24 A normal 1 1.24 14 X
Combined standard
uncertainty (%)
-- -- normal -- 4.33 290 --
Table 4-34. CENAM uncertainty budget of total luminous flux measurement for blue LEDs (B).

APMP.PR-S3b Total Luminous Flux of LEDs Final Report
48
Uncertainty Component Standard
uncertainty
(%)
Ty
pe
Probability
distribution
Sensitivity
coefficient
Contrib
ution
(%)
Deg. of
freedom Correl
ated?
Luminous flux reference
value
0.25 B normal 1 0.25 200 X
System transfer function 0.11 B normal 1 0.11 200 X
Standard lamps spectral
mismatch correction
2.22 B normal 1 2.22 200 X
LED self-absorption
correction
0.07 B normal 1 0.07 200 O
LED readings repeatability 3.36 A normal 1 3.36 14 O
LEDs spectral mismatch
correction
2.79 B normal 1 2.79 200 O
Junction voltage 0.004 A normal 1 0.004 14 X
Current feeding accuracy 0.31 A normal 1 0.31 14 X
Combined standard
uncertainty (%)
-- -- normal -- 4.92 61 --
Table 4-35. CENAM uncertainty budget of total luminous flux measurement for white LEDs
(W).
Uncertainty Component Standard
uncertainty
(%)
Ty
pe
Probability
distribution
Sensitivity
coefficient
Contrib
ution
(%)
Deg. of
freedom Correl
ated?
Luminous flux reference
value
0.25 B normal 1 0.25 200 X
System transfer function 0.11 B normal 1 0.11 200 X
Standard lamps spectral
mismatch correction
2.22 B normal 1 2.22 200 X
LED self-absorption
correction
0.06 B normal 1 0.07 200 O
LED readings repeatability 2.83 A normal 1 3.36 14 O
LEDs spectral mismatch
correction
2.62 B normal 1 2.79 200 O
Junction voltage 0.009 A normal 1 0.004 14 X
Current feeding accuracy 0.90 A normal 1 0.31 14 X
Combined standard
uncertainty (%)
-- -- normal -- 4.55 86 --
Table 4-36. CENAM uncertainty budget of junction voltage measurement.

APMP.PR-S3b Total Luminous Flux of LEDs Final Report
49
Uncertainty Component Standard
uncertainty
(%)
Ty
pe
Probability
distribution
Sensitivity
coefficient
Contrib
ution
(%)
Deg. of
freedom
Cor
rela
ted?
Readings repeatability 0.01604 A normal 1 0.01604 14 O
Multimeter resolution 0.00001 B rectangular 1 0.00001 200 X
Multimeter error 0.00055 B normal 1 0.00055 200 X
Combined standard
uncertainty (%)
-- -- normal -- 0.016 14 --
4.7. LNE
4.7.1. Measurement setup
LNE has developed a measurement set-up to measure photometric and colorimetric
characteristics of LEDs. This set-up is based on a goniophotometer designed to meet the
requirements of the CIE127 standards for averaged intensity and total flux measurements.
It is optimised for high power white LEDs measurements and was adapted for the LEDs
in the framework of the APMP-S3 supplementary comparison. The schematic of the
goniophotometer is shown on Fig. 4-17. It is 2 m long and 1.8 m high.

APMP.PR-S3b Total Luminous Flux of LEDs Final Report
50
Fig. 4-17. Goniophotometer for LEDs flux measurements in LNE.
The set-up is made of the following parts :
- Optical rails to set the main frame
- A multi-axis LED mount which allow the accurate alignment of the LED along the
horizontal optical axis and with respect to the photometric center of the
goniophotometer. This device is mounted onto a horizontal axis motorised
rotation stage that rotates the LED around the optical axis. A detailed schematic
of the LED mount is shown on figure 2.
- A vertical axis motorised rotation stage on which the multi-axis LED mount is
placed.
A camera placed above the LED allows us to adjust the position of the LED with
respect to the photometric center. The photometer is mounted on an optical rail. The
Photometer
Spectrocolorimeter
LED mount
Stepping
motor driver
Camera
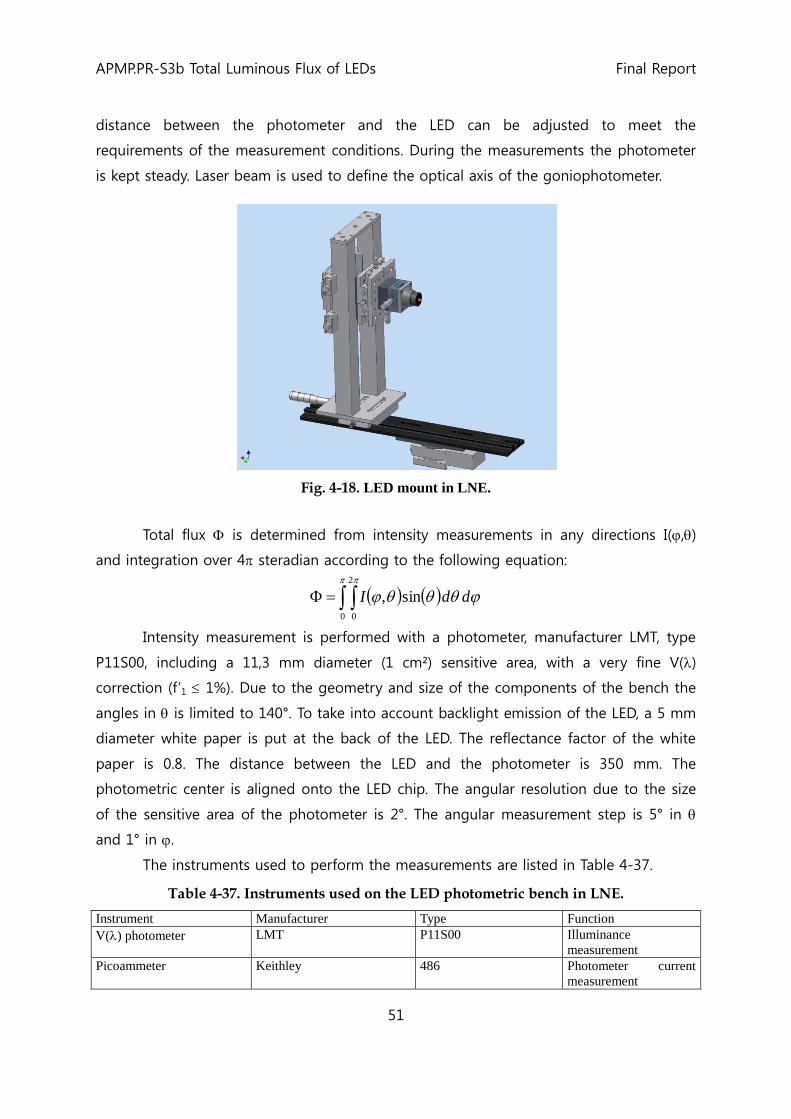
APMP.PR-S3b Total Luminous Flux of LEDs Final Report
51
distance between the photometer and the LED can be adjusted to meet the
requirements of the measurement conditions. During the measurements the photometer
is kept steady. Laser beam is used to define the optical axis of the goniophotometer.
Fig. 4-18. LED mount in LNE.
Total flux is determined from intensity measurements in any directions I(,)
and integration over 4 steradian according to the following equation:
0
2
0
sin, ddI
Intensity measurement is performed with a photometer, manufacturer LMT, type
P11S00, including a 11,3 mm diameter (1 cm²) sensitive area, with a very fine V()
correction (f’1 1%). Due to the geometry and size of the components of the bench the
angles in is limited to 140°. To take into account backlight emission of the LED, a 5 mm
diameter white paper is put at the back of the LED. The reflectance factor of the white
paper is 0.8. The distance between the LED and the photometer is 350 mm. The
photometric center is aligned onto the LED chip. The angular resolution due to the size
of the sensitive area of the photometer is 2°. The angular measurement step is 5° in
and 1° in .
The instruments used to perform the measurements are listed in Table 4-37.
Table 4-37. Instruments used on the LED photometric bench in LNE.
Instrument Manufacturer Type Function
V() photometer LMT P11S00 Illuminance
measurement
Picoammeter Keithley 486 Photometer current
measurement

APMP.PR-S3b Total Luminous Flux of LEDs Final Report
52
LED power supply Agilent 3436A Stabilised LED power
supply
Shunt resistor AOIP 1000 / 228RE6 LED current
measurement
Multimeter Hewlett-Packard 3457A LED junction voltage
measurement
4.7.2. Mounting and alignment
Alignment of the LED is performed using a luminancemeter, manufacturer LMT, type
L1009 with reflex viewing.
Fig. 4-19. LED holders in LNE.
4.7.3. Traceability
Photometer
The photometer is calibrated in illuminance at LNE using a set of three standard lamps
calibrated in luminous intensity at LNE-INM. The standards lamps are calibrated using
primary realisation of the candela through filter radiometer.
Electrical Instruments
All electrical instruments with critical impact on the measurements are calibrated by the
LNE electrical department which is COFRAC (Comité Français d’Accréditation) accredited.
COFRAC is the French accreditation body.
Length
The distance between the LED and the photometer is measured using a meter calibrated
by the LNE length department which is COFRAC accredited.

APMP.PR-S3b Total Luminous Flux of LEDs Final Report
53
4.7.4. Measurement uncertainty
Flux measurement
Reading repeatability
This uncertainty is estimated from the standard deviation of 5 measurements performed
in the same operating conditions. The uncertainty associated to each colours are the
following:
- Red: 0.25 %
- Green: 0.10 %
- Blue: 0.10 %
- White: 0.20 %
This uncertainty includes also the uncertainty due to horizontal, vertical and
angular alignment of the LED.
Component due to distance between the LED and the photometer
The distance between the LED and the reference plane of the photometer is known with
an uncertainty of 100 µm. The associated contribution to the intensity measurement is
evaluated by measuring the changes in the photometer signal when the distance is
changed by 5 mm. The result is shown in the following table for the different LED
colours.
LED type Relative uncertainty due to distance
LED-photometer
(%)
Red 0.03
Green 0.03
Blue 0.03
White 0.03
Component due to current feeding accuracy.
The current is measured through a 1000 resistor using a voltmeter. The resistor is
calibrated with an uncertainty of 1. 10-5. The voltmeter is calibrated with an uncertainty
of 1. 10-5. Therefore the current is measured with an uncertainty of 1.4 10-5. The current
is adjusted with an offset of 0.001 mA which corresponds to a relative error of 5. 10-5 .
The intensity is not corrected for this offset which is included in the uncertainty of the
current. The overall uncertainty on the current feeding is obtained from the uncertainty
due to the current measurement and the current offset, that is 5.2 10-5. The
corresponding uncertainty of the LED intensity measurement is determined from the
manufacturer’s data sheets. The results are summarized in the following table:

APMP.PR-S3b Total Luminous Flux of LEDs Final Report
54
LED type Relative uncertainty due to
current feeding
(%)
Red 0.0052
Green 0.0042
Blue 0.0031
White 0.0042
Diffuser 0.0042
Component due to stray light in the optical bench
Stray light in the optical bench is evaluated by placing a mask on the optical path of the
beam at a distance of about 100 mm from the LED. The size of the mask is 10 mm. For
all types of LED the relative contribution of the stray light to the photometer signal is <
0.01 %.
Component due to ambient temperature
The measurements are performed at 23 °C 1 °C. The measurement uncertainty due to
the uncertainty on the ambient temperature is determined from the manufacturer’s data
sheets. The results are summarized in the following table:
LED type Uncertainty due to ambient temperature
(%)
Red 0.5
Green 0.25
Blue 0.25
White 0.2
Diffuser 0.25
Component due to angular resolution and computation
Flux measurement is performed with a step angle of 5° in and 1° in . The uncertainty
due to the angular resolution is evaluated by comparing results of the measurement
performed with a 2° and 5° step in . The results show an uncertainty of 0.15%.
Component due to backward emission
Contribution of the backward emission of the LED is measured by placing a white
diffused paper at the back of the LED. The reflectance factor of the white paper is 0.8
with an uncertainty of 0.05. Assuming that backward emission represents 4% of the
forward emitted light the uncertainty due to the use of the white paper is 0.2%.
Component due to the calibration of the photometer
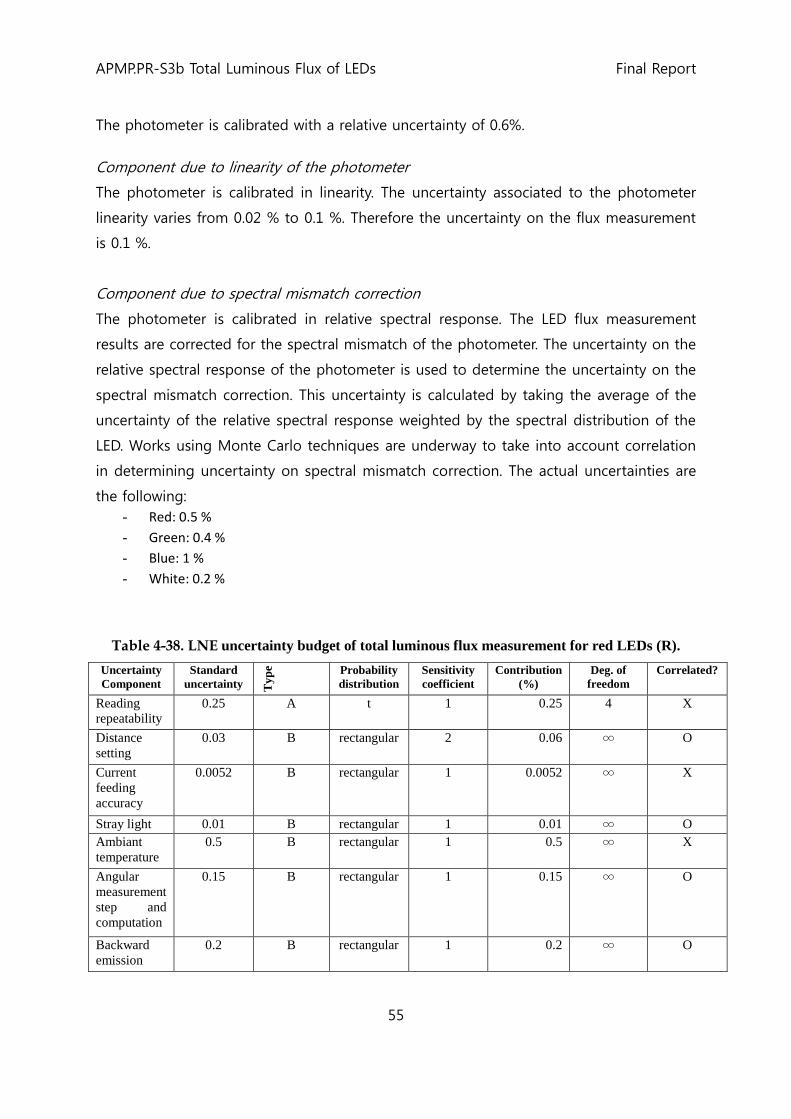
APMP.PR-S3b Total Luminous Flux of LEDs Final Report
55
The photometer is calibrated with a relative uncertainty of 0.6%.
Component due to linearity of the photometer
The photometer is calibrated in linearity. The uncertainty associated to the photometer
linearity varies from 0.02 % to 0.1 %. Therefore the uncertainty on the flux measurement
is 0.1 %.
Component due to spectral mismatch correction
The photometer is calibrated in relative spectral response. The LED flux measurement
results are corrected for the spectral mismatch of the photometer. The uncertainty on the
relative spectral response of the photometer is used to determine the uncertainty on the
spectral mismatch correction. This uncertainty is calculated by taking the average of the
uncertainty of the relative spectral response weighted by the spectral distribution of the
LED. Works using Monte Carlo techniques are underway to take into account correlation
in determining uncertainty on spectral mismatch correction. The actual uncertainties are
the following:
- Red: 0.5 %
- Green: 0.4 %
- Blue: 1 %
- White: 0.2 %
Table 4-38. LNE uncertainty budget of total luminous flux measurement for red LEDs (R).
Uncertainty
Component
Standard
uncertainty Ty
pe Probability
distribution
Sensitivity
coefficient
Contribution
(%)
Deg. of
freedom
Correlated?
Reading
repeatability
0.25 A t 1 0.25 4 X
Distance
setting
0.03 B rectangular 2 0.06 ∞ O
Current
feeding
accuracy
0.0052 B rectangular 1 0.0052 ∞ X
Stray light 0.01 B rectangular 1 0.01 ∞ O
Ambiant
temperature
0.5 B rectangular 1 0.5 ∞ X
Angular
measurement
step and
computation
0.15 B rectangular 1 0.15 ∞ O
Backward
emission
0.2 B rectangular 1 0.2 ∞ O

APMP.PR-S3b Total Luminous Flux of LEDs Final Report
56
Calibration
of
photometer
0.6 B normal 1 0.6 ∞ O
Non-
linearity
0.1 B rectangular 1 0.1 ∞ O
Spectral
mismatch
correction
0.5 B normal 1 0.5 ∞ X
Combined
standard
uncertainty
(%)
-- -- normal -- 1.0 ∞ --
Table 4-39. LNE uncertainty budget of total luminous flux measurement for green LEDs (G).
Uncertainty
Component
Standard
uncertainty Ty
pe Probability
distribution
Sensitivity
coefficient
Contribution
(%)
Deg. of
freedom
Correlated?
Reading
repeatability
0.1 A t 1 0.1 4 X
Distance
setting
0.03 B rectangular 2 0.06 ∞ O
Current
feeding
accuracy
0.0052 B rectangular 0.8 0.00416 ∞ X
Stray light 0.01 B rectangular 1 0.01 ∞ O
Ambiant
temperature
0.25 B rectangular 1 0.25 ∞ X
Angular
measurement
step and
computation
0.15 B rectangular 1 0.15 ∞ O
Backward
emission
0.2 B rectangular 1 0.2 ∞ O
Calibration
of
photometer
0.6 B normal 1 0.6 ∞ O
Non-
linearity
0.1 B rectangular 1 0.1 ∞ O
Spectral
mismatch
correction
0.4 B normal 1 0.4 ∞ X
Combined
standard
uncertainty
(%)
-- -- normal -- 0.82 ∞ --
Table 4-40. LNE uncertainty budget of total luminous flux measurement for blue LEDs (B).
Uncertainty
Component
Standard
uncertainty Ty
pe Probability
distribution
Sensitivity
coefficient
Contribution
(%)
Deg. of
freedom
Correlated?

APMP.PR-S3b Total Luminous Flux of LEDs Final Report
57
Reading
repeatability
0.1 A t 1 0.1 4 X
Distance
setting
0.03 B rectangular 2 0.06 ∞ O
Current
feeding
accuracy
0.0052 B rectangular 0.6 0.00312 ∞ X
Stray light 0.01 B rectangular 1 0.01 ∞ O
Ambiant
temperature
0.25 B rectangular 1 0.25 ∞ X
Angular
measurement
step and
computation
0.15 B rectangular 1 0.15 ∞ O
Backward
emission
0.2 B rectangular 1 0.2 ∞ O
Calibration
of
photometer
0.6 B normal 1 0.6 ∞ O
Non-
linearity
0.1 B rectangular 1 0.1 ∞ O
Spectral
mismatch
correction
1 B normal 1 1 ∞ X
Combined
standard
uncertainty
(%)
-- -- normal -- 1.2 ∞ --
Table 4-41. LNE uncertainty budget of total luminous flux measurement for white LEDs (W).
Uncertainty
Component
Standard
uncertainty Ty
pe Probability
distribution
Sensitivity
coefficient
Contribution
(%)
Deg. of
freedom
Correlated?
Reading
repeatability
0.2 A t 1 0.2 4 X
Distance
setting
0.03 B rectangular 2 0.06 ∞ O
Current
feeding
accuracy
0.0052 B rectangular 0.8 0.00416 ∞ X
Stray light 0.01 B rectangular 1 0.01 ∞ O
Ambiant
temperature
0.2 B rectangular 1 0.2 ∞ X
Angular
measurement
step and
computation
0.15 B rectangular 1 0.15 ∞ O
Backward
emission
0.2 B rectangular 1 0.2 ∞ O
Calibration
of
0.6 B normal 1 0.6 ∞ O

APMP.PR-S3b Total Luminous Flux of LEDs Final Report
58
photometer
Non-
linearity
0.1 B rectangular 1 0.1 ∞ O
Spectral
mismatch
correction
0.2 B normal 1 0.2 ∞ X
Combined
standard
uncertainty
(%)
-- -- normal -- 0.75 ∞ --
Junction Voltage
Repeatability
This uncertainty is estimated from the standard deviation of 20 measurements performed
in the same operating conditions. For all type of LED the uncertainty is 0.02%.
Component due to the calibration of the voltmeter
The voltmeter used for the junction voltage measurement is calibrated with an
uncertainty of 0.001 %.
Component due to position of junction voltage measurement point.
The leads of the LED are made of iron for the red LED and of copper for the green,
blue and white LED. The 4-wires device used to measure the junction voltage is located
20 mm away from the LED chip. Taking into account the geometry of the leads (40 mm
long and 0.25 mm² area) and the conductivity of the material used for the leads we
determine the voltage drop due to the leads. The results are summarized in the following
table.
LED type Relative voltage drop @ 20 mA
(%)
Red 0.008
Green 0.0008
Blue 0.0008
White 0.0008
Diffuser 0.0008
Table 4-42. LNE uncertainty budget of junction voltage measurement of red LEDs.
Uncertainty
Component
Standard
uncertainty Ty
pe Probability
distribution
Sensitivity
coefficient
Contribution
(%)
Deg. of
freedom
Correlated?
Repeatability* 0.04 A normal 1 0.04 29 X

APMP.PR-S3b Total Luminous Flux of LEDs Final Report
59
Calibration of
voltmeter
0.001 B normal 1 0.001 ∞ O
Junction
position
dependence*
0.008 B rectangular 1 0.008 ∞ X
Combined
standard
uncertainty
(%)
-- -- normal -- 0.041 ∞ --
4.8. METAS
4.8.1. Measurement setup
The measurements were performed in two steps. First the DUT-LED is used for
calibrating the luminous flux sensitivity of the integrating sphere. For this purpose the
LED is placed at 100 mm in front of a 100 mm2 aperture. A LED of same colour is used
inside the sphere in order to minimize self absorption effects. In the second step the LED
is placed inside the sphere and the flux of the DUT-LED is measured. The main
components of the system are listed in the following diagram.
Fig. 4-20. Schematic setup for LED total luminous flux in METAS.
4.8.2. Mounting and alignment
The LED was mounted inside the integrating sphere in a way that the absorption of light
emitted on the back side of the LED is as small as possible. The output of the LED is
100 mm
aperture 100 mm2
1-m integrating sphere, Czibula & Grundmann GmbH, BaSO4, ρ>0.98
cos-corrected Photometer LMT
baffle
Keithley Sourcemeter 2400, 4wires
Keithley Multimeter 2010

APMP.PR-S3b Total Luminous Flux of LEDs Final Report
60
oriented in the same direction than the light beam generated during the sphere
calibration process. No mapping of the whole integrating sphere was made, but some
uniformity tests around the measurement and calibration direction were made.
Fig. 4-21. LED mount in the integrating sphere in METAS.
4.8.3. Traceability
All primary quantities (i.e. illuminance, length, current, voltage etc) and secondary
quantities (temperature, humidity, etc) are traceable to national standards realized at
METAS. The detailed view of the traceability of the primary quantities is shown in the
following diagram.
Averaged LED intensity
METAS Electricity Section
ULED, ILED
Reference Integrating sphere METAS
Length Section
Distance, Aperture
Luminous flux of LED
METAS Electricity Section
ULED, ILED, IPhoto
APMP-PR.S3a
(METAS)

APMP.PR-S3b Total Luminous Flux of LEDs Final Report
61
4.8.4. Measurement uncertainty
The uncertainty budgets are based on the recommendation of CIE TC2-43
“Determination of measurement uncertainty in photometry”, Draft 9, 2008, and thus
following the GUM.
For simplicity only the uncertainty budget for a green LED is illustrated explicitly
in the following. The estimated input quantities of the other LED’s are listed in their
description.
Model for total luminous flux:
22
11111
2
1
0
01
/21
)(/21
aSSSUU
aSSSSSUSDMCPCM
SU
UCS
cc
mmCS
Tdd
ThddfG
d
AI
VV
VV
Description of terms:
1CS output quantity: luminous flux of the LED at certified conditions.
mV = 0.269054 V, DVM signal photometer, the DUT-LED is installed inside the
integrating sphere, 10n independent readings, the SDM is taken as standard
MU mVu 0.000004 V and is significantly larger than the resolution; Type A
with DOF 9v , no correlation.
0mV = 0.000054 V, DVM dark signal photometer, the DUT-LED is installed inside the
integrating sphere, 10n independent readings, the SDM is taken as standard
MU m0Vu 0.000001 V and is significantly larger than the resolution; Type A
with DOF 9v , no correlation.
cV = 0.299314 V, DVM signal photometer, the DUT-LED is installed outside the
integrating sphere (calibration), a dummy LED of same color is inside, 10n
independent readings, the SDM is taken as standard MU cVu 0.000011 V and
is significantly larger than the resolution; Type A with DOF 9v , no correlation.
0cV = 0.000241 V, DVM dark signal photometer, the DUT-LED is installed outside
the integrating sphere (calibration), a dummy LED of same color is inside,
10n independent readings, the SDM is taken as standard MU c0Vu
0.000007 V and is significantly larger than the resolution; Type A with DOF
9v , no correlation.
1CSI = 2.7951 cd, luminous intensity of the LED used for calibrating the sphere (c.f.
METAS report on APMP PR-S3.a); The standard MU Type B )( 1CSIu = 0.0224
with DOF v , no correlation.
UA = 100 mm2, limiting entrance aperture used in front of the integrating sphere for its

APMP.PR-S3b Total Luminous Flux of LEDs Final Report
62
calibration. The standard MU Type B )( uAu = 0.01 mm2 with DOF v , no
correlation.
SUd = 0.100 m, distance between tip of the LED and the limiting entrance aperture of
the integrating sphere, interval ±0.00020 m with RPD, converted into standard
measurement uncertainty (MU) )( SUdu = (0.00020/ 3 = 0.000115) m; Type B
with degree of freedom (DOF) v , no correlation.
PCMG = , gain factor of the photometer when switching calibration to the
measurement certified with absolute standard MU PCMGu = 0.2 ; Type B with
DOF v , no correlation.
DMCf = 1.00 (spatial) distribution mis-match correction factor of the integrating when
switching from calibration to the measurement. No mapping of the whole
integrating sphere was made. But some uniformity tests around the measurement
and calibration direction were made. As a high reflectance integrating sphere is
used and the DUT is illuminating similar part of the integrating sphere the absolute
standard MU is estimated to DMCfu = 0.003 ; Type B with DOF v , no
correlation.
SUS1 dd = (0 ± 0.2) mm/100 mm, distance alignment of LED tip within interval with
RPD, converted into standard MU SUP ddu = 0.2/(100* 3 ) = 0.0012;
Type B with DOF v , no correlation.
)( 11 SSh = 0.0, angular misalignment of the LED within interval 1S 2° with RPD
converted into standard MU 2022
11 ghu SS )( = 0.0025;
Type B with DOF v , no correlation. )log(cos/).log( .5050 g = 9.0, is
determined from the FMHW 50. (datasheet of the green LED). For the other
LED’s the values are g (red) = 6.9, g (blue) = 9.0, g (white) = 3.2, g (diffuse)
= 1.0 . The uncertainty on g is neglected.
S1 = -0.0019 -1K , relative temperature coefficient of the green LED (based on the
datasheet) used during calibration procedure, with standard MU
S1u = (0.0002/2 = 0.0001) -1K ; Type B with DOF v , no correlation. For
other LED’s the temperature coefficient is estimated as: S1 (red) = (-0.0074 ±
0.0005) -1K , S1 (blue) = (0.00175 ± 0.00020)
-1K , S1 (white) = (0.0016
± 0.0005) -1K
aS1T = 0.0°C, above nominal ambient temperature near LED (outside the integrating
sphere, i.e. during the calibration procedure), with standard MU aS1Tu = (0.5/
3 =0.28) °C; Type B with DOF 1000v , no correlation.
SUU dd = (0 ± 0.2) mm/100 mm, distance alignment of integrating sphere aperture
within interval with RPD, converted into standard MU )( SUU ddu = 0.2/(100*
3 ) = 0.0012; Type B with DOF v , no correlation.

APMP.PR-S3b Total Luminous Flux of LEDs Final Report
63
S2 = S1 relative temperature coefficient of the green LED (based on the datasheet)
used inside the integrating sphere (i.e. during the measurement procedure).
aS2T = 0.0°C, above nominal ambient temperature near LED inside the sphere
(measurement procedure), with standard MU aS2Tu = (0.5/ 3 =0.28)°C;
Type B with DOF 1000v , no correlation.
The following quantities were ignored:
- The influence of the ambient temperature uncertainty on the photometer as a temperature
stabilized photometer was used.
- ageing of the DUT as no relevant information was available.
- variation of the output intensity as a change of electrical current (c.f. luminous intensity
report).
- Calibration factor and its uncertainty of the DVM (c.f. luminous intensity report).
- straylight effects (not estimated) during calibration.
- angular and directional misalignment of the integrating sphere during calibration.
- influence of the directional change of spectral distribution of LED (the sphere is calibrated
with an LED in CIE averaged intensity condition (100mm), therefore not all directions are
included during calibration process).
Sensitivity coefficients:
m
CS
m
CS
VVc 11
1
9.344 lm/V
m
CS
m
CS
VVc 1
0
12
-9.344 lm/V
C
CS
C
CS
VVc 11
3
-8.3993 lm/V
C
CS
C
CS
VVc 1
0
14
-8.3993 lm/V
1
1
1
15
CS
CS
CS
CS
IIc
0.8994 lm/cd
U
CS
U
CS
AAc 11
6
25140 lm/m
2
SU
CS
SU
CS
ddc 11
7 2
50.28 lm/m
PCM
CS
PCM
CS
GGc 11
8
0.0251 lm
DMC
CS
DMC
CS
ffc 11
9
2.5140 lm
1
110 2 CS
CS
ddc
)( SUS1
5.0281
lm
1
11
111 CS
SS
CS
hc
)( 2.5140 lm
aS
S1
Tc CSCS
1
112
0.000 lm K
S1
aS
1
113 CS
CS
Tc
= -0.004777 lm K
-1
1
114 2 CS
CS
ddc
SUU
-

APMP.PR-S3b Total Luminous Flux of LEDs Final Report
64
5.0281 lm
aS2
S2
Tc CSCS
1
115
0.000 lm K S2
aS2
1
116 CS
CS
Tc
=0.004777 lm K
-1
Table 4-43. METAS uncertainty budget of total luminous flux measurement for red LEDs (R).
Uncertainty Component Standard
uncertainty
Ty
pe
Probability
distribution
Sensitivity
coefficient
Contribut
ion (%)
Deg. of
freedo
m
Correl
ated?
Mean value photosignal
mV
4E-6 V A t 1.1342 lm/V 0.006 9 X
Mean value dark
photosignal 0mV
1E-6 V A t -1.1342
lm/V
<0.001 9 X
Mean value photosignal
calibration CV
1.1E-6 V A t -0.1341
lm/V
-0.002 9 X
Mean value dark
photosignal calibration
0CV
7E-6 V A t 0.1341 lm/V <0.001 9 X
Intensity of calib. LED at
normal current 1CSI
0.0224 cd B normal 0.1190 lm/cd 0.69 ∞ O
Limiting entrance
aperture UA
1.0E-8 m2 B normal 822 lm/ m
2 0.01 ∞ O
Distance LED to
integrating sphere SUd
0.000115
m
B rectangular -1.64 lm/m -0.23 ∞ X
Gain switching factor of
the photometer PCMG
0.2 B normal 0.00082 lm 0.20 ∞ O
(Spatial) distribution
mismatch correction
factor DMCf
0.003 B normal 0.0822 lm 0.30 ∞ X
Relative distance
variation of LED SUS1 dd
0.0012 B rectangular 0.1643 lm 0.24 ∞ X
Angular misalignment of
LED )( 11 SSh
0.0025 B rectangular 0.0822 lm 0.20 ∞ X
Temperature coefficient
of LED S1 and S2
0.0001 B normal 0 0 ∞ X
Temperature above
nominal temp., calibration
aS1T
0.28 K B rectangular -0.000608
lm/K
-0.21 ∞ X
Temperature above
nominal temp., calibration
aS2T
0.28 K B rectangular 0.000608
lm/K
0.21 ∞ X
Distance alignment of
integrating sphere
aperture SUU dd
0.0012 B rectangular -0.1643 lm -0.24 ∞ X

APMP.PR-S3b Total Luminous Flux of LEDs Final Report
65
Combined standard
uncertainty (%)
-- -- normal -- 0.95 > 1000 --
Table 4-44. METAS uncertainty budget of total luminous flux measurement for green LEDs
(G).
Uncertainty Component Standard
uncertainty
Ty
pe
Probability
distribution
Sensitivity
coefficient
Contribut
ion (%)
Deg. of
freedo
m
Correl
ated?
Mean value photosignal
mV
4E-6 V A t 9.3440 lm/V <0.001 9 X
Mean value dark
photosignal 0mV
1E-6 V A t -9.3440
lm/V
<0.001 9 X
Mean value photosignal
calibration CV
1.1E-6 V A t -8.3993
lm/V
-0.004 9 X
Mean value dark
photosignal calibration
0CV
7E-6 V A t 8.3993 lm/V 0.002 9 X
Intensity of calib. LED at
normal current 1CSI
0.0224 cd B normal 0.8994 lm/cd 0.80 ∞ O
Limiting entrance
aperture UA
1.0E-8 m2 B normal 25140 lm/
m2
0.01 ∞ O
Distance LED to
integrating sphere SUd
0.000115
m
B rectangular -50.28 lm/m -0.23 ∞ X
Gain switching factor of
the photometer PCMG
0.2 B normal 0.0251 lm 0.20 ∞ O
(Spatial) distribution
mismatch correction
factor DMCf
0.003 B normal 2.5140 lm 0.30 ∞ X
Relative distance
variation of LED SUS1 dd
0.0012 B rectangular 5.0281 lm 0.24 ∞ X
Angular misalignment of
LED )( 11 SSh
0.0025 B rectangular 2.5140 lm 0.25 ∞ X
Temperature coefficient
of LED S1 and S2
0.0001 B normal 0 0 ∞ X
Temperature above
nominal temp., calibration
aS1T
0.28 K B rectangular -0.00478
lm/K
-0.05 ∞ X
Temperature above
nominal temp., calibration
aS2T
0.28 K B rectangular 0.00478
lm/K
0.05 ∞ X
Distance alignment of
integrating sphere
aperture SUU dd
0.0012 B rectangular -5.0281 lm -0.24 ∞ X
Combined standard
uncertainty (%)
-- -- normal -- 1.00 > 1000 --

APMP.PR-S3b Total Luminous Flux of LEDs Final Report
66
Table 4-45. METAS uncertainty budget of total luminous flux measurement for blue LEDs (B).
Uncertainty Component Standard
uncertainty
Ty
pe
Probability
distribution
Sensitivity
coefficient
Contribut
ion (%)
Deg. of
freedo
m
Correl
ated?
Mean value photosignal
mV
4E-6 V A t 1.2876 lm/V 0.005 9 X
Mean value dark
photosignal 0mV
1E-6 V A t -1.2876
lm/V
<0.001 9 X
Mean value photosignal
calibration CV
1.1E-6 V A t -0.1588
lm/V
-0.002 9 X
Mean value dark
photosignal calibration
0CV
7E-6 V A t 0.1588 lm/V <0.001 9 X
Intensity of calib. LED at
normal current 1CSI
0.0224 cd B normal 0.1229 lm/cd 1.61 ∞ O
Limiting entrance
aperture UA
1.0E-8 m2 B normal 1094 lm/ m
2 0.01 ∞ O
Distance LED to
integrating sphere SUd
0.000115
m
B rectangular -2.19 lm/m -0.23 ∞ X
Gain switching factor of
the photometer PCMG
0.2 B normal 0.00109 lm 0.20 ∞ O
(Spatial) distribution
mismatch correction
factor DMCf
0.003 B normal 0.1094 lm 0.30 ∞ X
Relative distance
variation of LED SUS1 dd
0.0012 B rectangular 0.2189 lm 0.24 ∞ X
Angular misalignment of
LED )( 11 SSh
0.0025 B rectangular 0.1094 lm 0.25 ∞ X
Temperature coefficient
of LED S1 and
S2
0.0001 B normal 0 0 ∞ X
Temperature above
nominal temp., calibration
aS1T
0.28 K B rectangular -0.000191
lm/K
-0.05 ∞ X
Temperature above
nominal temp., calibration
aS2T
0.28 K B rectangular 0.000191
lm/K
0.05 ∞ X
Distance alignment of
integrating sphere
aperture SUU dd
0.0012 B rectangular -0.2189 lm -0.24 ∞ X
Combined standard
uncertainty (%)
-- -- normal -- 1.72 > 1000 --
Table 4-46. METAS uncertainty budget of total luminous flux measurement for white LEDs
(W).

APMP.PR-S3b Total Luminous Flux of LEDs Final Report
67
Uncertainty Component Standard
uncertainty
Ty
pe
Probability
distribution
Sensitivity
coefficient
Contribut
ion (%)
Deg. of
freedo
m
Correl
ated?
Mean value photosignal
mV
4E-6 V A t 4.5301 lm/V 0.005 9 X
Mean value dark
photosignal 0mV
1E-6 V A t -4.5301
lm/V
<0.001 9 X
Mean value photosignal
calibration CV
1.1E-6 V A t -2.3580
lm/V
-0.007 9 X
Mean value dark
photosignal calibration
0CV
7E-6 V A t 2.3580 lm/V 0.005 9 X
Intensity of calib. LED at
normal current 1CSI
0.0224 cd B normal 0.5188 lm/cd 0.66 ∞ O
Limiting entrance
aperture UA
1.0E-8 m2 B normal 3560 lm/ m
2 0.01 ∞ O
Distance LED to
integrating sphere SUd
0.000115
m
B rectangular -7.12 lm/m -0.23 ∞ X
Gain switching factor of
the photometer PCMG
0.2 B normal 0.00356 lm 0.20 ∞ O
(Spatial) distribution
mismatch correction
factor DMCf
0.003 B normal 0.3560 lm 0.30 ∞ X
Relative distance
variation of LED SUS1 dd
0.0012 B rectangular 0.7120 lm 0.24 ∞ X
Angular misalignment of
LED )( 11 SSh
0.0025 B rectangular 0.3560 lm 0.10 ∞ X
Temperature coefficient
of LED S1 and
S2
0.0001 B normal 0 0 ∞ X
Temperature above
nominal temp., calibration
aS1T
0.28 K B rectangular -0.00057
lm/K
-0.04 ∞ X
Temperature above
nominal temp., calibration
aS2T
0.28 K B rectangular 0.00057
lm/K
0.04 ∞ X
Distance alignment of
integrating sphere
aperture SUU dd
0.0012 B rectangular -0.7120 lm -0.24 ∞ X
Combined standard
uncertainty (%)
-- -- normal -- 1.73 > 1000 --
Model for junction voltage:
L0L1aL0aLrelL,CLL 1 UUTTccU
Description of terms:

APMP.PR-S3b Total Luminous Flux of LEDs Final Report
68
LU output quantity: junction voltage of the LED at certified conditions.
Lc = 1.0000, DVM calibration factor with absolute standard MU )( Lcu = 1E-5;
Type B with DOF v , no correlation.
Cc = 1.000, non-equivalence of the contact. We have tried different connectors. A
spread in junction voltages have been observed even with 4 wires connections. The
estimated absolute standard MU )( Ccu = 0.0020; Type B with DOF v , no
correlation.
relL, = 0.000015, relative temp. coefficient according standard MU )( relL,u = 5E-6;
Type B with DOF v , no correlation.
aLT = 22.6 °C, ambient temperature with ±0.5°C RPD, converted into standard MU
)( aLTu = (0.5/ 3 = 0.29)°C; Type B with DOF v , no correlation.
aL0T = 23.0 °C, nominal ambient temperature, no uncertainty
L1U = 1.94058 V, measured voltage (DVM), with standard MU of L1Uu = 0.00011
V, 361 readings, Type A with DOF 360v , no correlation.
L0U = 0.00002 V, measured zero voltage (DVM), with standard MU of L1Uu =
0.00011 V, 361 readings , Type A with DOF 360v , no correlation.
Table 4-47. METAS uncertainty budget of junction voltage measurement.
Uncertainty Component Standard
uncertainty
Ty
pe
Probability
distribution
Sensitivity
coefficient
Contrib
ution
(%)
Deg. of
freedo
m
Correl
ated?
DVM mean value voltage
L1U
0.00011 V A t 0.99999
V/V
0.0055 360 X
DVM calibration factor
Lc
1.0E-5 B normal 1.94055 V 0.0010 ∞ O
Relative temperature
coefficienct relL,
5.0E-6 K-1
B normal -0.77622
VK
-0.0002 ∞ X
Ambient temperature aLT 0.29 °C B rectangular 0.00003
V/°C
0.0004 ∞ X
Offset voltage L0U 0.00011 V A t -0.99999
V/V
-0.0055 360 X
Non-equivalence of contact
Cc
0.0021 B rectangular 1.94055 V 0.21 ∞ X
Combined standard
uncertainty (V)
-- -- Normal -- 0.21 >1000 --

APMP.PR-S3b Total Luminous Flux of LEDs Final Report
69
4.9. NMC-A*STAR
4.9.1. Measurement setup
The measurement setup of the total luminous flux of LED is shown from Fig. 4-22 to Fig.
4-24. The LED is mounted at the centre of a 1-meter integrating sphere. The LED light in
the sphere is fed to a spectroradiometer (Model OL770 made by Optronic Laboratories,
see report for S3a) through an optical fibre as shown in Fig. 2. A baffle and an opal
glass diffuser are mounted in front of the tip of the optical fibre to avoid the direct
illumination from the LED.
Fig. 4-22. LED total luminous flux measurement setup in A*STAR.
Fig. 4-23. Relative spectral responsivity calibration;
Fig. 4-24. Absolute luminous flux calibration in A*STAR.
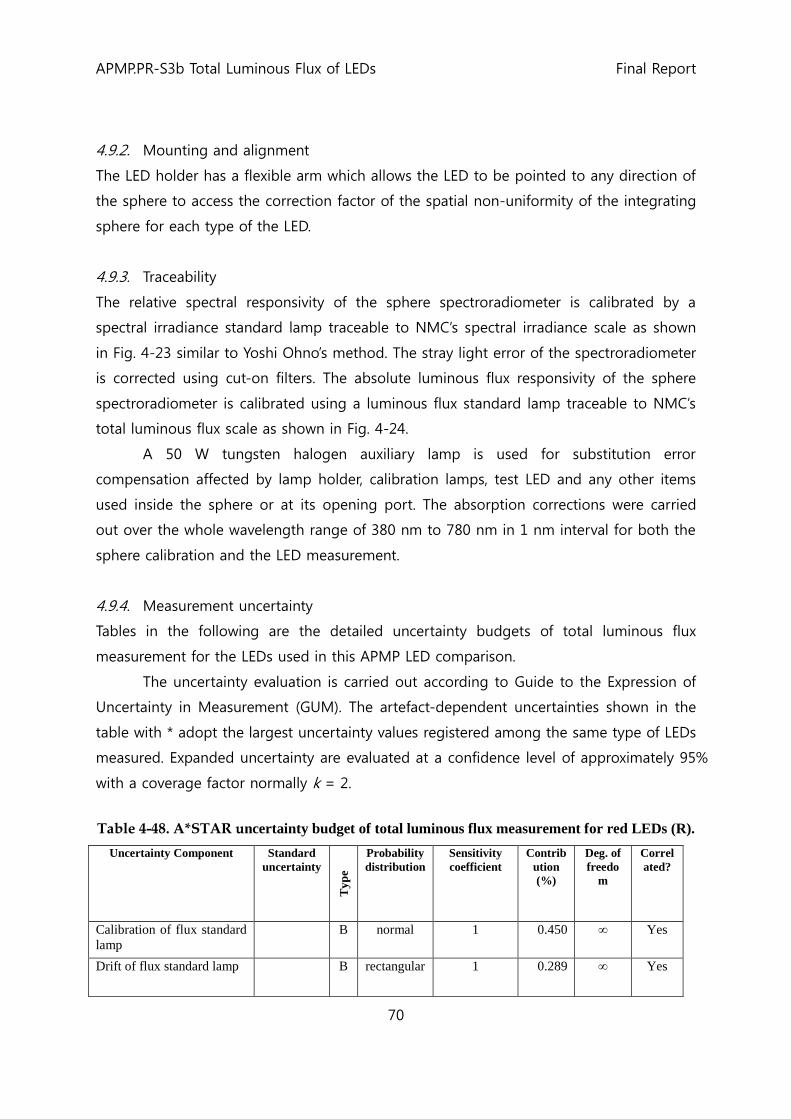
APMP.PR-S3b Total Luminous Flux of LEDs Final Report
70
4.9.2. Mounting and alignment
The LED holder has a flexible arm which allows the LED to be pointed to any direction of
the sphere to access the correction factor of the spatial non-uniformity of the integrating
sphere for each type of the LED.
4.9.3. Traceability
The relative spectral responsivity of the sphere spectroradiometer is calibrated by a
spectral irradiance standard lamp traceable to NMC’s spectral irradiance scale as shown
in Fig. 4-23 similar to Yoshi Ohno’s method. The stray light error of the spectroradiometer
is corrected using cut-on filters. The absolute luminous flux responsivity of the sphere
spectroradiometer is calibrated using a luminous flux standard lamp traceable to NMC’s
total luminous flux scale as shown in Fig. 4-24.
A 50 W tungsten halogen auxiliary lamp is used for substitution error
compensation affected by lamp holder, calibration lamps, test LED and any other items
used inside the sphere or at its opening port. The absorption corrections were carried
out over the whole wavelength range of 380 nm to 780 nm in 1 nm interval for both the
sphere calibration and the LED measurement.
4.9.4. Measurement uncertainty
Tables in the following are the detailed uncertainty budgets of total luminous flux
measurement for the LEDs used in this APMP LED comparison.
The uncertainty evaluation is carried out according to Guide to the Expression of
Uncertainty in Measurement (GUM). The artefact-dependent uncertainties shown in the
table with * adopt the largest uncertainty values registered among the same type of LEDs
measured. Expanded uncertainty are evaluated at a confidence level of approximately 95%
with a coverage factor normally k = 2.
Table 4-48. A*STAR uncertainty budget of total luminous flux measurement for red LEDs (R).
Uncertainty Component Standard
uncertainty
Ty
pe
Probability
distribution
Sensitivity
coefficient
Contrib
ution
(%)
Deg. of
freedo
m
Correl
ated?
Calibration of flux standard
lamp
B normal 1 0.450 ∞ Yes
Drift of flux standard lamp B rectangular 1 0.289 ∞ Yes

APMP.PR-S3b Total Luminous Flux of LEDs Final Report
71
Sphere-radiometer transfer
measurement (non-
linearity)*
B rectangular 1 0.405 ∞ No
Sphere spatial uniformity B rectangular 1 0.289 ∞ Yes
Calibration of current
feeding
0.0058 % B rectangular 0.8 0.005 ∞ Yes
LED holder absorption B rectangular 1 0.116 ∞ Yes
Wavelength scale of
spectroradiometer*
0.2 nm B rectangular 2.17 %/nm 0.434 ∞ No
stray light correction of
spectroradiometer (20 % of
correction)*
B rectangular 1 0.208 ∞ No
Reproducibility A t 1 0.173 2 No
Combined standard
uncertainty (%)
-- -- normal -- 0.90 1444 --
Table 4-49. A*STAR uncertainty budget of total luminous flux measurement for green LEDs
(G).
Uncertainty Component Standard
uncertainty
Ty
pe
Probability
distribution
Sensitivity
coefficient
Contrib
ution
(%)
Deg. of
freedo
m
Correl
ated?
Calibration of flux standard
lamp
B normal 1 0.450 ∞ Yes
Drift of flux standard lamp B rectangular 1 0.289 ∞ Yes
Sphere-radiometer transfer
measurement (non-
linearity)*
B rectangular 1 0.347 ∞ No
Sphere spatial uniformity B rectangular 1 0.289 ∞ Yes
Calibration of current
feeding
0.0058 % B rectangular 0.8 0.005 ∞ Yes
LED holder absorption B rectangular 1 0.116 ∞ Yes
Wavelength scale of
spectroradiometer*
0.2 nm B rectangular 2.17 %/nm 0.289 ∞ No
stray light correction of
spectroradiometer (20 % of
correction)*
B rectangular 1 0.092 ∞ No
Reproducibility A t 1 0.116 2 No
Combined standard
uncertainty (%)
-- -- normal -- 0.78 4148 --
Table 4-50. A*STAR uncertainty budget of total luminous flux measurement for blue LEDs (B).

APMP.PR-S3b Total Luminous Flux of LEDs Final Report
72
Uncertainty Component Standard
uncertainty
Ty
pe
Probability
distribution
Sensitivity
coefficient
Contrib
ution
(%)
Deg. of
freedo
m
Correl
ated?
Calibration of flux standard
lamp
B normal 1 0.450 ∞ Yes
Drift of flux standard lamp B rectangular 1 0.289 ∞ Yes
Sphere-radiometer transfer
measurement (non-
linearity)*
B rectangular 1 0.289 ∞ No
Sphere spatial uniformity B rectangular 1 0.289 ∞ Yes
Calibration of current
feeding
0.0058 % B rectangular 0.8 0.005 ∞ Yes
LED holder absorption B rectangular 1 0.116 ∞ Yes
Wavelength scale of
spectroradiometer*
0.2 nm B rectangular 2.17 %/nm 0.434 ∞ No
stray light correction of
spectroradiometer (20 % of
correction)*
B rectangular 1 0.208 ∞ No
Reproducibility A t 1 0.231 2 No
Combined standard
uncertainty (%)
-- -- normal -- 0.87 395 --
Table 4-51. A*STAR uncertainty budget of total luminous flux measurement for white LEDs
(W).
Uncertainty Component Standard
uncertainty
Ty
pe
Probability
distribution
Sensitivity
coefficient
Contrib
ution
(%)
Deg. of
freedo
m
Correl
ated?
Calibration of flux standard
lamp
B normal 1 0.450 ∞ Yes
Drift of flux standard lamp B rectangular 1 0.289 ∞ Yes
Sphere-radiometer transfer
measurement (non-
linearity)*
B rectangular 1 0.347 ∞ No
Sphere spatial uniformity B rectangular 1 0.289 ∞ Yes
Calibration of current
feeding
0.0058 % B rectangular 0.8 0.005 ∞ Yes
LED holder absorption B rectangular 1 0.116 ∞ Yes
Wavelength scale of
spectroradiometer*
0.2 nm B rectangular 2.17 %/nm 0.289 ∞ No

APMP.PR-S3b Total Luminous Flux of LEDs Final Report
73
stray light correction of
spectroradiometer (20 % of
correction)*
B rectangular 1 0.092 ∞ No
Reproducibility A t 1 0.231 2 No
Combined standard
uncertainty (%)
-- -- normal -- 0.81 295 --
Table 4-52 is the detailed uncertainty budget of the junction voltage measurement,
representatively presented for the red LEDs. The artefact-dependent uncertainties shown
in the table with * adopt the largest uncertainty values registered among the same type
of LEDs measured.
Table 4-52. A*STAR uncertainty budget of junction voltage measurement.
Uncertainty Component Standard
uncertainty
Ty
pe
Probability
distribution
Sensitivity
coefficient
Contribut
ion (V)
Deg.
of
freedo
m
Correl
ated?
Calibration of DVM B normal 1 9.50E-5 ∞ Yes
Position of junction (0.05
Ω)
B rectangular 1 5.78E-4 ∞ No
Drift of junction voltage B rectangular 1 1.73E-4 ∞ No
Reproducibility* A t 1 4.66E-4 5 No
Combined standard
uncertainty (V)
-- -- normal -- 7.7E-4 37 --
4.10. VSL
4.10.1. Measurement setup
The quantity for average LED intensity and total luminous flux of LEDs (as defined by the
key-comparison protocol) are measured with a goniometer facility specifically designed
and build for small single LED light sources. The facility is based on the method where
the light source is turned and the detector stands still. Therefore the facility consists out
of a detector platform and a turn-able light source unit. The light source unit includes
two rotation stages, a LED mounting unit and one linear translation stage. The linear
translation stage is applied to be able to change the distance between the turn-able
light source unit and the detector platform. The two rotation stages are perpendicular
mounted to each other so that the LED can be rotated exactly in the midpoint of each

APMP.PR-S3b Total Luminous Flux of LEDs Final Report
74
stage.
The detector platform consists out of an illuminance meter with a circular
aperture with a surface of 100mm2 and an array-spectroradiometer (SRM). The SRM is
used to correct for colour mismatch introduced by the detector and the individual LED. In
order to reduce stray light a baffle was places between the detector platform and the
turn-able light source unit. The aperture of the baffle was large compare to the diameter
of the detector and the LED to be measured.
Fig. 4-25. Schematic drawing of LED goniometer facility at VSL.
4.10.2. Mounting and alignment
The LED is fixed in a holder, which is mounted into a mounting unit. The mounting unit
is mounted on the turn-able light source unit consisting out of the two rotation stages.
The LED holder is shown in the following figure.
Fig. 4-26. VSL LED holder.
The LED holder clamps the two LED pins with two parallel copper plates. The
copper plates are connected to the current source which provides the LED with operating

APMP.PR-S3b Total Luminous Flux of LEDs Final Report
75
current. The mounting unit allows one to translate the LED in both vertical as well as
horizontal direction, and also to tilt the LED. This alignment unit is in turn mounted to
the two rotation stages. The layout of the alignment system of the LED facility together
with the mounted holder is shown in the following figure.
Fig. 4-27. Turn-able light source unit of the LED goniometer facility at VSL.
In Fig. 4-27, one sees the LED mounted on the mounting unit fixed on a two axis
rotational system. The alignment of the LED with regards to the detector as well as axis
of rotation is done as follows:
1. A high resolution camera is placed perpendicular to the mounted LED.
2. The mounted LED is rotated and visually inspected by using the high resolution camera.
3. If the mounted LED is in the centre of the rotational axis, no movement is detected
with the camera, otherwise translation is observed. The mounted LED is then
iteratively adjusted until no translation of the mounted LED is visible with the camera.
This is iteratively repeated also for the polar rotation. When varying the polar angle the
alignment criteria was that the location of the LED tip remained constant.
4. The mounted LED and illuminance detector are then optically aligned with the double
alignment laser.
The nominal distance between LED and detector is brought to 100 mm by making
use of an electronic translation stage where the LED alignment axes are mounted on, as
well as a calibrated gauge block of nominal length 100 mm. The gauge block is placed
against the detector reference surface and the LED is translated precisely until contact is
made with the gauge block. This translation distance is recorded. The gauge block is
then removed and the LED is translated back to the correct position. The distance is then
100 mm between detector and LED. The following figure illustrates this graphically.
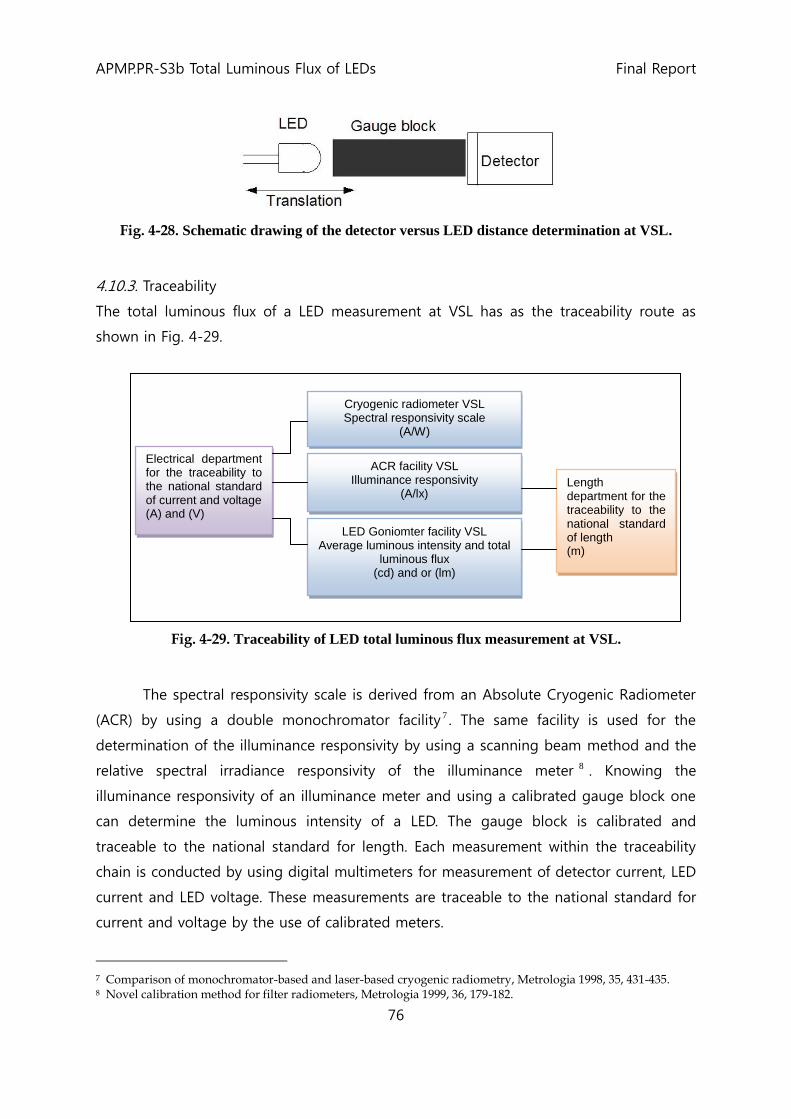
APMP.PR-S3b Total Luminous Flux of LEDs Final Report
76
Fig. 4-28. Schematic drawing of the detector versus LED distance determination at VSL.
4.10.3. Traceability
The total luminous flux of a LED measurement at VSL has as the traceability route as
shown in Fig. 4-29.
Fig. 4-29. Traceability of LED total luminous flux measurement at VSL.
The spectral responsivity scale is derived from an Absolute Cryogenic Radiometer
(ACR) by using a double monochromator facility 7 . The same facility is used for the
determination of the illuminance responsivity by using a scanning beam method and the
relative spectral irradiance responsivity of the illuminance meter 8 . Knowing the
illuminance responsivity of an illuminance meter and using a calibrated gauge block one
can determine the luminous intensity of a LED. The gauge block is calibrated and
traceable to the national standard for length. Each measurement within the traceability
chain is conducted by using digital multimeters for measurement of detector current, LED
current and LED voltage. These measurements are traceable to the national standard for
current and voltage by the use of calibrated meters.
7 Comparison of monochromator-based and laser-based cryogenic radiometry, Metrologia 1998, 35, 431-435. 8 Novel calibration method for filter radiometers, Metrologia 1999, 36, 179-182.
Cryogenic radiometer VSL Spectral responsivity scale
(A/W)
ACR facility VSL Illuminance responsivity
(A/lx)
LED Goniomter facility VSL Average luminous intensity and total
luminous flux (cd) and or (lm)
Electrical department for the traceability to the national standard of current and voltage (A) and (V)
Length department for the traceability to the national standard of length (m)

APMP.PR-S3b Total Luminous Flux of LEDs Final Report
77
4.10.4. Measurement uncertainty
After the LED and detector are aligned, the following steps are performed to measure
the total luminous flux of each of the twelve LEDs respectively:
1. The LED is brought to an operating current of nominal 20 mA.
2. The whole setup is enclosed by a thermal insulation box and allowed to stabilize for at
least 20 minutes.
3. The measurement of the illuminance at different angles are performed by varying the
polar angle of the LED from 0° to 125° in 5° increments, repeating this for an azimuthal
rotations from 0° to 360° in 5° increments, thereby effectively scanning a partial sphere
of 2.78π around the LED tip.
4. The stray light was measured by blocking light only on the optical axis and repeating
step 3. The light was blocked by using a strip with an effective area just greater then
the surface of the LEDs so no direct light from the LED was seen by the detector.
5. The dark signal was measured, by closing the baffle situated in front of the detector
completely and repeating step 3.
6. The illuminance of the LED at each goniometer position is calculated as described in the
report for S3a. The responsivity of the detector is corrected for the spectral mismatch
by using the spectral irradiance measurement conducted with the spectroradiometer
at polar position 0, 0.
7. Finally the total luminous flux of the LED is calculated using model equation below.
Model equation for the total luminous intensity:
)sin())(,()(sin),(),(
1
2
2
2
2
nm
i
v ErddErdAE
A is the surface area
E
(ε,η)
is the measured illuminance at a certain position
r is the radius of the sphere
ε is the polar angle
η is the azimuthal angle
δ is step size for or azimuth or polar axis
m the amount of steps along the polar angle
n the amount of steps along the azimuth angle
The comparison protocol states that the participant describes the total uncertainty
in detail for the LEDs of each color. As the total uncertainty of each LED is depending on
individual components the uncertainty from one LED to one other is different. Knowing

APMP.PR-S3b Total Luminous Flux of LEDs Final Report
78
this we chose to present a detailed uncertainty budget of that LED that has the lowest
uncertainty, instead of determining the average total uncertainty of the LEDs with the
same color. This was done since no information is given how to determine the average
uncertainty of a group of LEDs. The detailed uncertainty budgets are summarized in the
tables below.
Table 4-53. VSL uncertainty budget of total luminous flux measurement for red LEDs (R).
Uncertainty Component Standard
uncertainty
(%) Ty
pe Probability
distribution
Sensitivity
coefficient
Contri-
bution
(%)
Deg. of
freedom
Correlated
Spectral mismatch
correction
B normal 1 0.21 ∞ X
Reproducibility B rectangular 1 0.45 ∞ X
Current feeding of LED B normal 1 0.01 ∞ O
Near-field absorption of
backward emission
B rectangular 1 0.29 ∞ O
Stray light A normal 1 0.28 9 O
Missing emitted flux B rectangular 1 1.17 ∞ X
Alignment of LED A normal 1 0.10 28 X
Distance between LED and
detector
0.27 B rectangular 2 0.55 ∞ O
Responsivity of detector B normal 1 0.15 ∞ O
Detector readout A normal 1 0.03 9 O
Combined standard
uncertainty (%)
-- -- normal -- 1.46 ∞ --
Table 4-54. VSL uncertainty budget of total luminous flux measurement for green LEDs (G).
Uncertainty Component Standard
uncertainty
(%) Ty
pe Probability
distribution
Sensitivity
coefficient
Contri-
bution
(%)
Deg. of
freedom
Correlated
Spectral mismatch
correction
B normal 1 0.11 ∞ X
Reproducibility B rectangular 1 0.12 ∞ X
Current feeding of LED B normal 1 0.01 ∞ O
Near-field absorption of
backward emission
B rectangular 1 0.23 ∞ O
Stray light A normal 1 0.35 9 O
Missing emitted flux B rectangular 1 0.91 ∞ X
Alignment of LED A normal 1 0.29 28 X
Distance between LED and
detector
0.27 B rectangular 2 0.55 ∞ O
Responsivity of detector B normal 1 0.15 ∞ O
Detector readout A normal 1 0.03 9 O
Combined standard
uncertainty (%)
-- -- normal -- 1.20 ∞ --

APMP.PR-S3b Total Luminous Flux of LEDs Final Report
79
Table 4-55. VSL uncertainty budget of total luminous flux measurement for blue LEDs (B).
Uncertainty Component Standard
uncertainty
(%) Ty
pe Probability
distribution
Sensitivity
coefficient
Contri-
bution
(%)
Deg. of
freedom
Correlated
Spectral mismatch
correction
B normal 1 0.07 ∞ X
Reproducibility B rectangular 1 0.09 ∞ X
Current feeding of LED B normal 1 0.01 ∞ O
Near-field absorption of
backward emission
B rectangular 1 0.28 ∞ O
Stray light A normal 1 0.27 9 O
Missing emitted flux B rectangular 1 1.11 ∞ X
Alignment of LED A normal 1 0.11 28 X
Distance between LED and
detector
0.27 B rectangular 2 0.54 ∞ O
Responsivity of detector B normal 1 0.15 ∞ O
Detector readout A normal 1 0.03 9 O
Combined standard
uncertainty (%)
-- -- normal -- 1.30 ∞ --
Table 4-56. VSL uncertainty budget of total luminous flux measurement for white LEDs (W).
Uncertainty Component Standard
uncertainty
(%) Ty
pe Probability
distribution
Sensitivity
coefficient
Contri-
bution
(%)
Deg. of
freedom
Correlated
Spectral mismatch
correction
B normal 1 0.05 ∞ X
Reproducibility B rectangular 1 0.10 ∞ X
Current feeding of LED B normal 1 0.01 ∞ O
Near-field absorption of
backward emission*
B rectangular 1 0.35 ∞ O
Stray light A normal 1 0.12 9 O
Missing emitted flux** B rectangular 1 1.41 ∞ X
Alignment of LED A normal 1 0.11 28 X
Distance between LED and
detector
0.27 B rectangular 2 0.55 ∞ O
Responsivity of detector B normal 1 0.15 ∞ O
Detector readout A normal 1 0.03 9 O
Combined standard
uncertainty (%)
-- -- normal -- 1.58 ∞ --
* The LED mount used in the measurements is black to absorb backwards emission i.e. rather than choosing
a highly reflective mount to include the backwards emission in the illuminance measurement. This means
that the backwards emission is filtered out from the goniometric illuminance measurements alternatively.
However some backwards emission may reflect of the black mount and contribute to the forward
illuminance measurement. As this leads to an uncertainty we have measured the flux emitted directly at the
backside of the LED to estimate the flux reflecting from the mount with taken into account the reflection
coefficient of the mount surface and the effective area illuminated by the reflected light. This then is taken
as the uncertainty for the near-field absorption of backwards emission.
** Do to the structure of the goniometer facility it is not possible to measure the total polar plane from 0° to
180°. Therefore the illuminance measured at polar angle 125° is extrapolated till 180°. The model for
extrapolation is based on the knowledge from a measurement directly behind the LED itself performed
outside the goniometer facility at a distance of 100 mm. The associated uncertainty for the extrapolation is

APMP.PR-S3b Total Luminous Flux of LEDs Final Report
80
based on the estimated flux within the missing cone from 125° to 180°.
Table 4-57 is the detailed uncertainty budget of the junction voltage
measurement.
Table 4-57. VSL uncertainty budget of junction voltage measurement.
Uncertainty Component Standard
uncertainty
Ty
pe
Probability
distribution
Sensitivity
coefficient
Contribut
ion (%)
Deg.
of
freedo
m
Correl
ated?
Calibration of DVM B normal 1 1.2E-5 ∞ O
Junction position
dependence
B rectangular 1 0.081 ∞ X
Reproducibility* A t 1 0.0001 9 X
Combined standard
uncertainty (%)
-- -- normal -- 0.081 ∞ --
4.11. NIST
4.11.1. Measurement setup
The test LEDs were measured for total luminous flux with 4π geometry in the NIST 2.5 m
detector-based absolute integrating sphere (with 98 % reflectance barium sulfate coating)
with the scale realized in 2009. The schematic of the measurement setup is shown in Fig.
4-30. The reference standard of the 2.5 m absolute sphere system is the luminous flux of
the external source introduced into the sphere through a Ø50 mm precision aperture.
The illuminance of the external source at the precision aperture plane is measured by
two standard photometers to calculate the luminous flux entering into the sphere. For a
measurement of total luminous flux, the test LED and the external source illuminated
directly, in turn, a different part of the sphere wall on the equator. The error arising from
the spatial mismatch in comparison to an isotropic light source inside the sphere was
analyzed and corrected for both the LED and the external source. The details of the
measurement facility and procedures are described in Reference9.
9 Ohno Y. and Zong Y., Detector-Based Integrating Sphere Photometry, in Proc. of 24th Session of the CIE, Vol. 1, Part 1, 155-160. (1999) / Miller C. C., and Ohno Y., Luminous Flux Calibration of LEDs at NIST, in Proc. of 2nd CIE Expert Symposium on LED Measurement, 45-48. (2001)

APMP.PR-S3b Total Luminous Flux of LEDs Final Report
81
Fig. 4-30. Illustration of the setup for measurement of total luminous flux of the test LEDs in NIST.
The test LED was operated on DC power at a constant current of 20 mA using a
four-wire connection. The wiring diagram for this measurement is shown in Fig. 4-31. The
operating current of the LED was measured with an 8.5 digit multimeter. The test LED
was measured after it was powered on for 10 minutes. The output signal of the sphere
photometer was simultaneously recorded with the LED current, LED voltage, sphere
ambient temperature, room temperature, and room humidity. Corrections were applied
for the dark reading, the self-absorption (automatically corrected), the spectral mismatch,
the spatial mismatch, and the sphere fluorescence (see next paragraph), to calculate the
total luminous flux of a test LED. Each LED was measured for a total of two lightings to
check its reproducibility. The mean value of the two measurements was reported, and the
variation was included in the uncertainty budget of the measurement.
Fig. 4-31. Wiring diagram for measurement of a test LED in NIST.
After the measurement of total luminous flux, each LED was measured in the
same 2.5 m integrating sphere for relative total spectral radiant flux using a CCD-array
spectroradiometer in order to correct the spectral mismatch error and sphere

APMP.PR-S3b Total Luminous Flux of LEDs Final Report
82
fluorescence error. The measurement was based on the NIST spectral irradiance scale10
as described in Reference11. The sphere-spectroradiometer system, shown in Fig. 4-32,
was calibrated for total spectral radiant flux responsivity against two standard spectral
irradiance FEL lamps aligned in turn at 0.5 m away from the Ø50 mm precision aperture.
The two standard FEL lamps were calibrated in the direction of its optical axis for
absolute spectral irradiance at 0.5 m in the NIST Facility for Automated
Spectroradiometric Calibrations (FASCAL). The CCD-array spectroradiometer has a
bandpass of approximately 3 nm (FWHM) and the spectral range from 200 nm to 800
nm. A heat-absorbing optical filter (Schott KG-5) was inserted between the opal glass
diffuser and the optical fiber bundle to prevent the unwanted infrared radiation of the
standard spectral irradiance FEL lamp from entering into the spectroradiometer in order
to reduce stray light inside the spectroradiometer. The integrating-time nonlinearity and
signal-level nonlinearity of the spectroradiometer were both corrected. The
spectroradiometer was first characterized for spectral stray light12 and then was used to
measure a set of laser sources to characterize the fluorescence of the 2.5 m sphere
coating. The measured relative total spectral radiant flux of the test LED was corrected
for both spectral stray light of the spectroradiometer and the fluorescence of the 2.5 m
sphere, and was used to correct the spectral mismatch error. The error resulting from the
sphere fluorescence was analyzed and corrected based on the characterization result of
the sphere fluorescence.
10 J. H. Walker, R. D. Saunders, J. K. Jackson, and D. A. McSparron, Spectral Irradiance Calibrations, NBS Special Publication 250-20. (1987) / Yoon H. W., Gibson C. E., and Barnes P. Y., Realization of the National Institute of Standards and Technology detector-based spectral irradiance scale, Appl. Opt. 41, 5879-5890. (2002) 11 Zong Y., Miller C. C., Lykke K. R., and Ohno Y., Measurement of total radiant flux of UV LEDs, Proc. CIE, CIE x026:2004, 107–110. (2004) 12 Zong Y., Brown S. W., Johnson B. C., Lykke K. R., and Ohno Y., Simple spectral stray light correction method for array spectroradiometers, Appl. Opt., 45, 1111-1119. (2006)

APMP.PR-S3b Total Luminous Flux of LEDs Final Report
83
Fig. 4-32. Schematic of the setup for measurement of relative total spectral radiant flux of LEDs in NIST.
4.11.2. Mounting and alignment
The test LED was mounted horizontally on the lamp post at the center of the NIST 2.5 m
integrating sphere by using a four-wire, C-shaped LED socket/holder for minimizing the
near-field absorption and for including any backward light. Fig. 4-33 is a photograph of a
test LED mounted at the center of the 2.5 m integrating sphere.
Fig. 4-33. Photograph of a test LED mounted at the center of the 2.5 m integrating sphere in
NIST.
4.11.3. Traceability
The two standard photometers, mounted on the wheel (shown in Fig. 4-30), used to
measure illuminance of the external source were calibrated for spectral irradiance
responsivity in the NIST tuneable-laser-based SIRCUS facility. The calibration was done by
direct comparison of the photometer with two of the NIST trap detectors, which maintain

APMP.PR-S3b Total Luminous Flux of LEDs Final Report
84
the NIST spectral irradiance scale and are periodically calibrated against the NIST
Reference Cryogenic Radiometer - Primary Optical Watt Radiometer (POWR).
4.11.4. Measurement uncertainty
The uncertainty budgets for measurement of total luminous flux of the red, green, blue,
and white LEDs are shown in the tables below, and the uncertainty budget for
measurement of junction voltage of the test LEDs is shown in Table 4-62. The NIST policy
on uncertainty statements is described in Reference13.
13 B. N. Taylor, and C. E. Kuyatt, Guidelines for Evaluating and Expressing the Uncertainty of NIST Measurement Results, NIST Technical Note 1297. (1993)

APMP.PR-S3b Total Luminous Flux of LEDs Final Report
85
Table 4-58. NIST uncertainty budget of total luminous flux measurement for red LEDs (R).

APMP.PR-S3b Total Luminous Flux of LEDs Final Report
86
Table 4-59. NIST uncertainty budget of total luminous flux measurement for green LEDs (G).

APMP.PR-S3b Total Luminous Flux of LEDs Final Report
87

APMP.PR-S3b Total Luminous Flux of LEDs Final Report
88
Table 4-60. NIST uncertainty budget of total luminous flux measurement for blue LEDs (B).

APMP.PR-S3b Total Luminous Flux of LEDs Final Report
89
Table 4-61. NIST uncertainty budget of total luminous flux measurement for white LEDs (W).

APMP.PR-S3b Total Luminous Flux of LEDs Final Report
90
Table 4-62. NIST uncertainty budget of junction voltage measurement (typical).
4.12. VNIIOFI
Not submitted.
4.13. INM
4.13.1. Measurement setup
A lumen-meter equipped with a 150 mm dia. integrating sphere provided with a
precision aperture was used (Fig. 4-34). It allowed for comparison of the LED under
calibration with a standard luminous intensity lamp basically using the substitution
method.

APMP.PR-S3b Total Luminous Flux of LEDs Final Report
91
Fig. 4-34. LED total luminous flux measurement setup in INM Romania.
For electrical measurements, a four wire technique as described in the comparison
protocol was used in order to (almost) simultaneously measure the current fed into the
measured LED and the junction voltage. The LED current was generated by a finely
adjustable voltage supply and a current measurement shunt across which the voltage
was measured with a digital voltmeter. The LEDs junction voltage was measured with a
similar digital voltmeter.
A photometric head provided with a diffusing IR filter and calibrated in terms of
spectral responsivity was attached to the lumen-meter integrating sphere. The
photocurrent generated by the photometric head was fed into Current to Voltage
converter with a transimpedance factor of 1E6 V/A. The output voltage was measured
with a third digital voltmeter.
The measurement of the spectral densities of the emitted flux of the standard
lamp and of the LED under calibration was performed with a CCD spectrometer
providing a (1 ± 0.1) nm bandwidth. The spectrometer input fibre head was provided
with a diffusing IR filter.
4.13.2. Mounting and alignment
The lumen-meter was calibrated in terms of luminous flux responsivity against the
luminous flux produced by a luminous intensity lamp. The calibration of the lumen-meter
as a whole was performed on the INM optical bench using the regular procedure for
photometers calibration (based on the distances inverse squares law).
Subsequently, the LEDs to be calibrated were mounted in the lumen-meter sphere
in such a position as to illuminate almost the same area previously illuminated by the

APMP.PR-S3b Total Luminous Flux of LEDs Final Report
92
luminous intensity lamp during the lumen-meter calibration. In order to avoid the direct
illumination of the photometer, a shade was mounted in front of the photometer
transducer (Fig. 4-34).
4.13.3. Traceability
The lumen-meter (including the 150 mm dia. integrating sphere, the photometer head,
the current to voltage converter and the associated multimeter) was calibrated against
a luminous intensity standard traceable to the national reference for luminous intensity
(group of absolute photometers) maintained by INM-RO. The calibration was performed
at several distances so that the lumen-meter photometric linearity could be checked to
be within ±0.5 %.
The lumen-meter transducer (IR filtered photo-diode) spectral responsivity was
characterised against the INM spectral responsivity references traceable to LNE-INM
primary reference (cryogenic radiometer).
The 150 mm dia. sphere wall was coated with multiple layers of BaSO4 (>20
layers). The last 10 layers were sprayed without any binder. A test sample coated in a
similar manner was characterised in terms of spectral reflectance (0/d geometry) against
standards traceable to the INM reference standard (primary reflectance standard based
on the Taylor-Budde method).
The spectral densities of the standard lamp and of the LED under calibration were
measured with a fibre optic input spectrometer. The spectrometer wavelength scale was
calibrated against low pressure spectral Hg, Cd and He lamps traceable to the INM
reference for length measurements (stabilised He-Ne laser). For all wavelengths within
the visible range it was found to be accurate within ±0.3 nm.
The spectrometer irradiance scale was calibrated against an irradiance spectral
density lamp, traceable to the MIKES–TKK reference. The spectrometer photometric
linearity was calibrated and further checked against a set of spectral transmittance filters
(neutral glass of NG type), traceable to the INM reference spectrophotometer.
The length measurements (standard lamp-lumen-meter aperture plane, the
diameter of the lumen-meter sphere aperture) are traceable to the INM-RO national
reference for length (stabilised He-Ne laser).
All voltage measurements were traceable to the national references of Romania
(group of stabilised Zener diodes of Fluke 732 B). The shunt resistance used to generate
the feeding current was calibrated with traceability to the national references (group of
electrical resistors).

APMP.PR-S3b Total Luminous Flux of LEDs Final Report
93
The temperature was measured with a digital thermometer calibrated with
traceability to the INM maintained SIT90 fixed points.
4.13.4. Measurement uncertainty
The total luminous flux )( x expression is:
)1()(2
,
321 lmAd
IRCCCC
ev
xspvx
where: 1C is the lamp-LED illumination non-equivalence factor;
2C is the LED feeding
current factor; 3C is the correction factor for the ambient temperature;
ve
xx
Y
YR with
xY
the output generated by the LED emitted flux and veY the output generated by the
luminous intensity standard lamp; evI ,is the value of the luminous intensity standard
lamp; A is the area of the integrating sphere aperture (1256,6 mm2); d is the standard
lamp-lumen-meter sphere aperture distance;
spC is the spectral correction factor:
)2(2
1
2
1
2
1
2
1
,,,
,,,
VSsS
VSsS
C
erphrxr
xrphrer
sp
where: )(, erS is the relative spectral density of the luminous intensity standard lamp;
)(, xrS is the relative spectral density of the LED under calibration; )(, phrs is the
relative spectral responsivity of the lumen-meter; 21, are the extreme wavelengths of
the visible spectrum; )(V is the relative responsivity of the CIE standard observer.
Tables in the following are the detailed uncertainty budgets of the total luminous
flux measurement for the LEDs used in this APMP LED comparison.
Table 4-63. INM uncertainty budget of total luminous flux measurement for red LEDs (R).
Uncertainty Component Standard
uncertainty
Ty
pe
Probability
distribution
Sensitivity
coefficient
Contrib
ution
(%)
Deg. of
freedo
m
Correl
ated?
Lamp-LED illumination
non-equivalence factor 1C
0.060 B rectangular vx 6.0 ∞ O
LED feeding current factor
2C
0.001 B normal vx 0.1 ∞ X
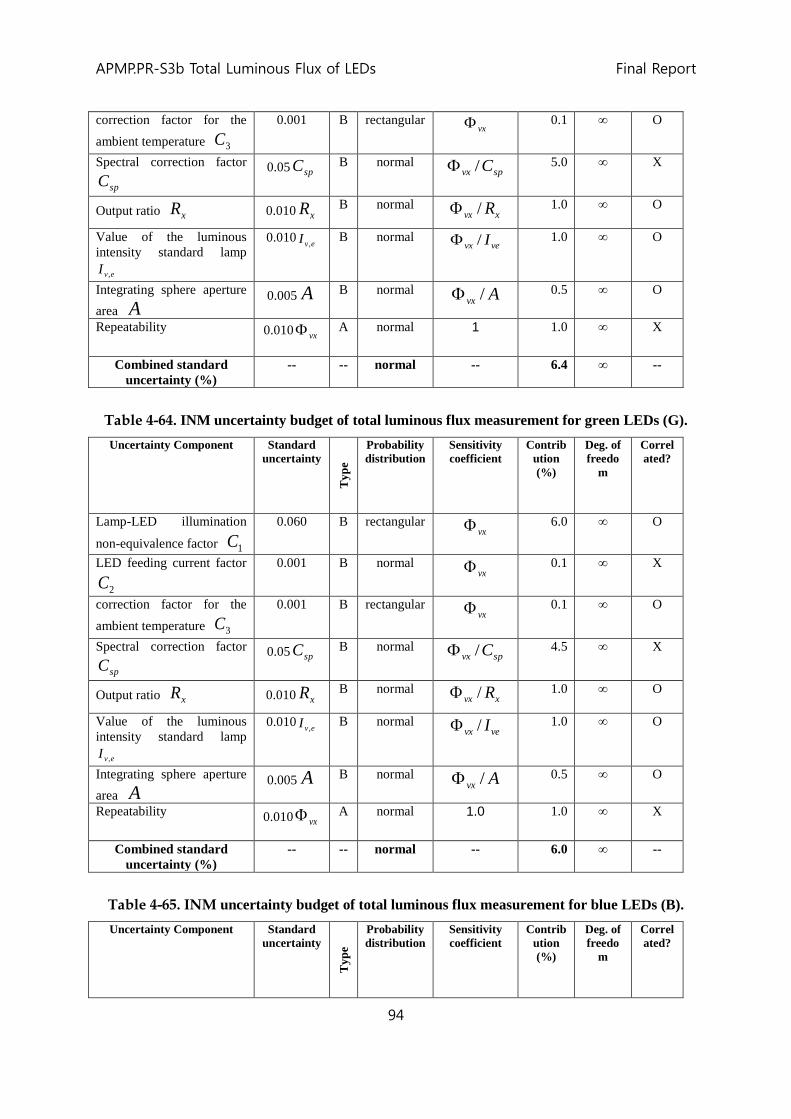
APMP.PR-S3b Total Luminous Flux of LEDs Final Report
94
correction factor for the
ambient temperature 3C
0.001 B rectangular vx 0.1 ∞ O
Spectral correction factor
spC
0.05 spC B normal spvx C/ 5.0 ∞ X
Output ratio xR 0.010 xR B normal
xvx R/ 1.0 ∞ O
Value of the luminous
intensity standard lamp
evI ,
0.010evI , B normal
vevx I/ 1.0 ∞ O
Integrating sphere aperture
area A
0.005 A B normal Avx / 0.5 ∞ O
Repeatability 0.010vx A normal 1 1.0 ∞ X
Combined standard
uncertainty (%)
-- -- normal -- 6.4 ∞ --
Table 4-64. INM uncertainty budget of total luminous flux measurement for green LEDs (G).
Uncertainty Component Standard
uncertainty
Ty
pe
Probability
distribution
Sensitivity
coefficient
Contrib
ution
(%)
Deg. of
freedo
m
Correl
ated?
Lamp-LED illumination
non-equivalence factor 1C
0.060 B rectangular vx 6.0 ∞ O
LED feeding current factor
2C
0.001 B normal vx 0.1 ∞ X
correction factor for the
ambient temperature 3C
0.001 B rectangular vx 0.1 ∞ O
Spectral correction factor
spC
0.05 spC B normal spvx C/ 4.5 ∞ X
Output ratio xR 0.010 xR B normal
xvx R/ 1.0 ∞ O
Value of the luminous
intensity standard lamp
evI ,
0.010evI , B normal
vevx I/ 1.0 ∞ O
Integrating sphere aperture
area A
0.005 A B normal Avx / 0.5 ∞ O
Repeatability 0.010 vx A normal 1.0 1.0 ∞ X
Combined standard
uncertainty (%)
-- -- normal -- 6.0 ∞ --
Table 4-65. INM uncertainty budget of total luminous flux measurement for blue LEDs (B).
Uncertainty Component Standard
uncertainty
Ty
pe
Probability
distribution
Sensitivity
coefficient
Contrib
ution
(%)
Deg. of
freedo
m
Correl
ated?

APMP.PR-S3b Total Luminous Flux of LEDs Final Report
95
Lamp-LED illumination
non-equivalence factor 1C
0.060 B rectangular vx 6.0 ∞ O
LED feeding current factor
2C
0.001 B normal vx 0.1 ∞ X
correction factor for the
ambient temperature 3C
0.001 B rectangular vx 0.1 ∞ O
Spectral correction factor
spC
0.05 spC B normal spvx C/ 5.0 ∞ X
Output ratio xR 0.010 xR B normal
xvx R/ 1.0 ∞ O
Value of the luminous
intensity standard lamp
evI ,
0.010evI , B normal
vevx I/ 1.0 ∞ O
Integrating sphere aperture
area A
0.005 A B normal Avx / 0.5 ∞ O
Repeatability 0.010 vx A normal 1.0 1.0 ∞ X
Combined standard
uncertainty (%)
-- -- normal -- 6.4 ∞ --
Table 4-66. INM uncertainty budget of total luminous flux measurement for white LEDs (W).
Uncertainty Component Standard
uncertainty
Ty
pe
Probability
distribution
Sensitivity
coefficient
Contrib
ution
(%)
Deg. of
freedo
m
Correl
ated?
Lamp-LED illumination
non-equivalence factor 1C
0.060 B rectangular vx 6.0 ∞ O
LED feeding current factor
2C
0.001 B normal vx 0.1 ∞ X
correction factor for the
ambient temperature 3C
0.001 B rectangular vx 0.1 ∞ O
Spectral correction factor
spC
0.05 spC B normal spvx C/ 5.3 ∞ X
Output ratio xR 0.010 xR B normal
xvx R/ 1.0 ∞ O
Value of the luminous
intensity standard lamp
evI ,
0.010evI , B normal
vevx I/ 1.0 ∞ O
Integrating sphere aperture
area A
0.005 A B normal Avx / 0.5 ∞ O
Repeatability 0.010 vx A normal 1.0 1.0 ∞ X
Combined standard
uncertainty (%)
-- -- normal -- 6.6 ∞ --

APMP.PR-S3b Total Luminous Flux of LEDs Final Report
96
The junction voltage expression is:
readj VCCV 21
readV : the mean reading ; 1C : temperature factor and 2C : position factor
Table 4-67 is the detailed uncertainty budget of the junction voltage
measurement.
Table 4-67. INM uncertainty budget of junction voltage measurement.
Uncertainty Component Standard
uncertainty T
yp
e
Probability
distribution
Sensitivity
coefficient
Contribut
ion (%)
Deg.
of
freedo
m
Correl
ated?
Mean reading readV 2E-5 V B normal 1 0.002 ∞ O
Temperature factor 1C 0.0010 B rectangular readV
0.10 ∞ X
Position factor 2C 0.0005 B rectangular readV
0.05 ∞ X
Repeatability 0.0005 jV
A normal 1 0.05 ∞ X
Combined standard
uncertainty (%
-- -- normal -- 0.12 ∞ --

APMP.PR-S3b Total Luminous Flux of LEDs Final Report
97
5. Reported Results of Participants
In this chapter, the results of the comparison S3b are presented, which are reported by
each participant as the final version, i.e., after the verification in the pre-draft A process.
We note that, throughout this report document, the uncertainty values with a symbol U
indicate the expanded uncertainties for a confidence level of 95 % normally with a
coverage factor of k = 2, while the values with a symbol u indicate the standard
uncertainties.
5.1. KRISS
As the pilot laboratory of the comparison, KRISS measured each LED at most three times:
the first measurement before sending the LEDs for the first round, the second after
receiving the LEDs from the first round, and the third after receiving the LEDs from the
second round. The final control measurement of the first round is also regarded as the
initial control measurement of the second round. Note that the artefact sets #2, #4, #6,
and #8 are circulated only one round. The repeated measurements provide information
on the stability of the artefact LEDs, which will be discussed in Section 6.2.
Table 5-1 sumarizes the measurement results of KRISS of all the artefact LEDs. The
uncertainty values are not explicitly shown in this table but refered to the budgets in
Table 4-1 ~ Table 4-4. The laboratory conditions are kept at a temperature of (25 ± 2)
ºC and a relative humidity of (45 ± 15) %. The burning time of each measurement was
20 minutes in average.
Table 5-1. Measurement results of KRISS.
artifact
set LED
1. measurement 2. measurement 3. measurement
Φ (lm) Vj (V) Φ (lm) Vj (V) Φ (lm) Vj (V)
#1
R-1 0.6757 1.8849 0.6730 1.8848 0.6710 1.8826
R-2 0.6781 1.8888 0.6755 1.8888 0.6750 1.8866
R-3 0.6506 1.9211 0.6481 1.9211 0.6493 1.9191
G-1 3.0107 3.2912 2.9976 3.2911 2.9756 3.3190
G-2 2.8639 3.4307 2.8467 3.4300 2.8258 3.4543
G-3 2.9543 3.3098 2.9450 3.3122 2.9262 3.3381
B-1 0.7512 3.3723 0.7488 3.3731 0.7340 3.3994
B-2 0.7648 3.3744 0.7608 3.3751 0.7389 3.3991
B-3 0.7974 3.3412 0.7967 3.3435 0.7842 3.3671
W-1 1.5951 3.4358 1.6992 3.4371 1.6839 3.4561
W-2 1.5890 3.4568 1.5749 3.4574 1.5525 3.4788
W-3 1.7533 3.4123 1.7413 3.4124 1.7087 3.4320

APMP.PR-S3b Total Luminous Flux of LEDs Final Report
98
#2
R-1 0.6367 1.8886 0.6399 1.8932
R-2 0.6945 1.8981 0.6950 1.9024
R-3 0.7023 1.9020 0.7047 1.9064
G-1 2.7609 3.4710 2.8661 3.4689
G-2 2.8444 3.3910 2.8291 3.3889
G-3 2.9915 3.3017 2.9757 3.2996
B-1 0.7438 3.4519 0.7321 3.4517
B-2 0.8121 3.3697 0.8045 3.3677
B-3 0.7318 3.3510 0.7259 3.3509
W-1 1.7008 3.3014 1.7061 3.2989
W-2 1.7136 3.4204 1.6983 3.4167
W-3 1.5545 3.4492 1.5425 3.4460
#3
R-1 0.6749 1.8900 0.6675 1.8873 0.6724 1.8906
R-2 0.6887 1.8931 0.6811 1.8906 0.6856 1.8934
R-3 0.6864 1.8975 0.6796 1.8948 0.6845 1.8986
G-1 2.9676 3.5036 2.9421 3.4951 2.9298 3.5025
G-2 2.7133 3.3718 2.6977 3.3652 2.6758 3.3732
G-3 2.6582 3.3323 2.6377 3.3262 2.6189 3.3322
B-1 0.7804 3.4291 0.7744 3.4237 0.7597 3.4286
B-2 0.8262 3.4177 0.8196 3.4108 0.7993 3.4141
B-3 0.6624 3.5096 0.6599 3.5033 0.6454 3.5102
W-1 1.7035 3.4353 1.6824 3.4262 1.6709 3.4321
W-2 1.6709 3.3377 1.6534 3.3291 1.6334 3.3348
W-3 1.7216 3.3060 1.7029 3.2992 1.6805 3.3024
#4
R-1 0.7098 1.8982 0.7029 1.8957
R-2 0.6725 1.8946 0.6654 1.8923
R-3 0.6933 1.8961 0.6876 1.8938
G-1 2.9251 3.5108 2.8934 3.5034
G-2 3.1816 3.2985 3.1474 3.2946
G-3 2.9647 3.3586 2.9395 3.3527
B-1 0.8849 3.4215 0.8801 3.4165
B-2 0.7567 3.4645 0.7523 3.4590
B-3 0.8270 3.4018 0.8229 3.3965
W-1 1.7656 3.4352 1.7270 3.4287
W-2 1.7379 3.3397 1.7039 3.3341
W-3 1.7825 3.4446 1.7491 3.4388
#5
R-1 0.6827 1.9146 0.6868 1.9182 0.6896 1.9194
R-2 0.6829 1.9187 0.6881 1.9226 0.6885 1.9230
R-3 0.6495 1.8824 0.6542 1.8857 0.6537 1.8857
G-1 2.9119 3.2991 2.9171 3.3075 2.9012 3.3151
G-2 2.8201 3.4336 2.7947 3.4434 2.7550 3.4530
G-3 2.8484 3.3686 2.8501 3.3766 2.8421 3.3862
B-1 0.7790 3.4020 0.7768 3.4097 0.7672 3.4168
B-2 0.8820 3.4045 0.8803 3.4130 0.8714 3.4204
B-3 0.8248 3.4180 0.8219 3.4268 0.8128 3.4352
W-1 1.6785 3.3057 1.6842 3.3123 1.6805 3.3206
W-2 1.7536 3.4314 1.7598 3.4387 1.7476 3.4460
W-3 1.7000 3.4379 1.7101 3.4475 1.6980 3.4544
#6 R-1 0.6992 1.9041 0.6927 1.9005
R-2 0.6610 1.8912 0.6530 1.8870

APMP.PR-S3b Total Luminous Flux of LEDs Final Report
99
R-3 0.6906 1.9016 0.6818 1.8968
G-1 3.0411 3.3048 3.0086 3.2964
G-2 2.9213 3.3042 2.9000 3.2986
G-3 2.8715 3.3227 2.8551 3.3188
B-1 0.8924 3.4183 0.8908 3.4158
B-2 0.7632 3.3799 0.7599 3.3756
B-3 0.7932 3.3856 0.7904 3.3812
W-1 1.7634 3.4041 1.7047 3.4018
W-2 1.7206 3.4038 1.6762 3.4014
W-3 1.7303 3.4208 1.6969 3.4169
#7
R-1 0.6559 1.9181 0.6570 1.9189 0.6619 1.9222
R-2 0.7196 1.9003 0.7234 1.9016 0.7254 1.9039
R-3 0.6466 1.9170 0.6483 1.9178 0.6527 1.9212
G-1 3.0373 3.2876 3.0222 3.2896 3.0194 3.2945
G-2 2.8805 3.3519 2.8689 3.3541 2.8643 3.3587
G-3 3.0100 3.2931 2.9972 3.2953 3.0015 3.2991
B-1 0.8098 3.4509 0.8039 3.4523 0.7630 3.4596
B-2 0.7816 3.3859 0.7763 3.3896 0.7567 3.3942
B-3 0.7966 3.4154 0.7914 3.4159 0.7792 3.4243
W-1 1.6594 3.4605 1.6525 3.4638 1.6534 3.4698
W-2 1.5769 3.3495 1.5720 3.3502 1.5728 3.3579
W-3 1.5905 3.4025 1.5882 3.4036 1.5817 3.4085
#8
R-1 0.6490 1.8866 0.6524 1.8876
R-2 0.6793 1.8904 0.6833 1.8918
R-3 0.7060 1.8953 0.7098 1.8968
G-1 2.8770 3.5206 2.8631 3.5245
G-2 3.0247 3.2848 3.0101 3.2875
G-3 2.8590 3.2859 2.8468 3.2899
B-1 0.8507 3.4371 0.8449 3.4422
B-2 0.7713 3.3549 0.7665 3.3588
B-3 0.7712 3.4550 0.7641 3.4587
W-1 1.6656 3.4149 1.6645 3.4198
W-2 1.3472 3.4155 1.3425 3.4197
W-3 1.5594 3.4507 1.5509 3.4528
5.2. MIKES
MIKES of Finland measured the artifact set #1 in its first round from 07 April 2008 to 14
April 2008. The laboratory conditions are reported as temperature of (21.5 ± 1.0) ºC and
relative humidity of (31 ± 5) %. Table 5-2 shows the reported results of MIKES.
Table 5-2. Measurement results of MIKES.
artifact
set LED Φ (lm) U(Φ) (lm) Vj (V) U(Vj) (V)
burning
time (min)
#1
R-1 0.717 0.019 1.88996 0.00009 90
R-2 0.721 0.019 1.89352 0.00008 30
R-3 0.691 0.018 1.92577 0.00008 30
G-1 3.080 0.077 3.30151 0.00025 90

APMP.PR-S3b Total Luminous Flux of LEDs Final Report
100
G-2 2.922 0.073 3.44605 0.00026 30
G-3 3.028 0.076 3.31910 0.00026 30
B-1 0.765 0.043 3.38394 0.00024 150
B-2 0.775 0.043 3.38170 0.00023 30
B-3 0.811 0.045 3.35990 0.00022 30
W-1 1.771 0.067 3.44276 0.00042 160
W-2 1.659 0.063 3.46634 0.00042 90
W-3 1.822 0.069 3.41695 0.00042 70
5.3. CMS-ITRI
CMS-ITRI of Chinese Taipei measured the artifact set #2 in its first round from 6 May
2008 to 8 May 2008. The laboratory conditions are reported as temperature of (23.0 ±
1.5) ºC and relative humidity of (45 ± 10) %. During the measurement at CMS-ITRI,
however, all the three red LEDs were damaged so that the red LEDs of the set #2 had to
be completely replaced for the second round. On the agreement of the other
participants, CMS-ITRI repeated the measurement of the new red LEDs of the set #2 in
Sept. ~ Oct. 2009. Table 5-3 shows the reported results of CMS-ITRI.
Table 5-3. Measurement results of CMS-ITRI.
artifact
set LED Φ (lm) U(Φ) (lm) Vj (V) U(Vj) (V)
burning
time (min)
#2
R-1 0.638 0.015 1.896 0.002 35
R-2 0.694 0.016 1.905 0.002 35
R-3 0.703 0.017 1.909 0.001 35
G-1 2.777 0.067 3.516 0.005 35
G-2 2.868 0.069 3.430 0.004 35
G-3 3.008 0.073 3.337 0.005 35
B-1 0.723 0.017 3.456 0.004 35
B-2 0.797 0.019 3.411 0.003 35
B-3 0.711 0.017 3.420 0.003 35
W-1 1.729 0.040 3.341 0.003 35
W-2 1.743 0.041 3.463 0.003 35
W-3 1.584 0.037 3.495 0.011 35
5.4. PTB
PTB of Germany measured the artifact set #3 in its first round from 16 June to 2 July
2008. The laboratory conditions are reported as temperature of (25.0 ± 0.7) ºC and
relative humidity of (50 ± 10) %. Table 5-4 shows the reported results of PTB.
Table 5-4. Measurement results of PTB.
artifact LED Φ (lm) U(Φ) (lm) Vj (V) U(Vj) (V) burning

APMP.PR-S3b Total Luminous Flux of LEDs Final Report
101
set time (min)
#3
R-1 0.6652 0.0183 1.8945 0.0012 590
R-2 0.6758 0.0186 1.8976 0.0012 446
R-3 0.6757 0.0186 1.9024 0.0012 426
G-1 2.8550 0.0608 3.5230 0.0026 560
G-2 2.6163 0.0557 3.3894 0.0025 278
G-3 2.5650 0.0546 3.3503 0.0025 399
B-1 0.7750 0.0206 3.4455 0.0017 574
B-2 0.8211 0.0218 3.4338 0.0017 213
B-3 0.6630 0.0176 3.5314 0.0017 410
W-1 1.6826 0.0372 3.4509 0.0025 495
W-2 1.6511 0.0365 3.3525 0.0025 495
W-3 1.6996 0.0376 3.3217 0.0024 395
5.5. NMIJ
NMIJ of Japan measured the artifact set #4 in its first round from 15 April 2008 to 22
June 2008. The laboratory conditions are reported as temperature of (23 ± 2) ºC and
relative humidity of (50 ± 30) %. Table 5-5 shows the reported results of NMIJ.
Table 5-5. Measurement results of NMIJ.
artifact
set LED Φ (lm) U(Φ) (lm) Vj (V) U(Vj) (V)
burning
time (min)
#4
R-1 0.701 0.017 1.8995 0.0007 527
R-2 0.663 0.016 1.8957 0.0007 494
R-3 0.685 0.016 1.8973 0.0006 499
G-1 2.9530 0.0508 3.5223 0.0065 374
G-2 3.2061 0.0551 3.3075 0.0053 371
G-3 2.9883 0.0514 3.3682 0.0065 378
B-1 0.9373 0.0176 3.4340 0.0056 370
B-2 0.8020 0.0151 3.4724 0.0064 382
B-3 0.8746 0.0164 3.4087 0.0048 378
W-1 1.7788 0.0254 3.4469 0.0052 655
W-2 1.7441 0.0249 3.3505 0.0044 457
W-3 1.7897 0.0256 3.4562 0.0029 374
5.6. CENAM
CENAM of Mexico measured the artifact set #5 in its first round from 17 July 2008 to 21
July 2008. The laboratory conditions are reported as temperature of (22.7 ± 2.2) ºC and
relative humidity of (47.5 ± 8.0) %. Table 5-6 shows the reported results of CENAM.
Table 5-6. Measurement results of CENAM.
artifact
set LED Φ (lm) U(Φ) (lm) Vj (V) U(Vj) (V)
burning
time (min)

APMP.PR-S3b Total Luminous Flux of LEDs Final Report
102
#5
R-1 0.5350 0.0534 1.9228 0.0007 26
R-2 0.5367 0.0582 1.9271 0.0007 19
R-3 0.5245 0.0593 1.8898 0.0044 21
G-1 3.3739 0.2837 3.3208 0.0008 22
G-2 3.2135 0.2864 3.4362 0.0010 23
G-3 3.4003 0.2985 3.3913 0.0009 19
B-1 0.9105 0.0951 3.4235 0.0009 21
B-2 0.9486 0.1179 3.4264 0.0009 18
B-3 0.8750 0.0889 3.4403 0.0015 20
W-1 1.7994 0.1850 3.3253 0.0012 25
W-2 1.8595 0.1760 3.4553 0.0010 22
W-3 1.8181 0.1670 3.4633 0.0015 19
5.7. LNE
LNE of France measured the artifact set #6 in its first round from 15 June 2008 to 13 July
2008. The laboratory conditions are reported as temperature of (22 ± 2) ºC and relative
humidity of (50 ± 10) %. Table 5-7 shows the reported results of LNE.
Table 5-7. Measurement results of LNE.
artifact
set LED Φ (lm) U(Φ) (lm) Vj (V) U(Vj) (V)
burning
time (min)
#6
R-1 0.687 0.014 1.90903 0.00057 720
R-2 0.651 0.013 1.89522 0.00057 1080
R-3 0.680 0.014 1.90532 0.00057 720
G-1 2.972 0.053 3.3120 0.0013 900
G-2 2.870 0.052 3.3137 0.0013 1200
G-3 2.814 0.051 3.3359 0.0013 1230
B-1 0.882 0.021 3.4343 0.0014 1440
B-2 0.755 0.018 3.3927 0.0014 720
B-3 0.785 0.019 3.3988 0.0014 1440
W-1 1.717 0.024 3.4182 0.0017 1410
W-2 1.689 0.024 3.4171 0.0017 2550
W-3 1.701 0.024 3.4346 0.0017 2130
5.8. METAS
METAS of Switzerland measured the artifact set #7 in its first round from 30 Sept. 2008
to 8 Oct. 2008. The laboratory conditions are reported as temperature of (25.0 ± 0.5) ºC
and relative humidity of (45 ± 5) %. Table 5-8 shows the reported results of METAS.
Table 5-8. Measurement results of METAS.
artifact
set LED Φ (lm) U(Φ) (lm) Vj (V) U(Vj) (V)
burning
time (min)
#7 R-1 0.5801 0.0114 1.9296 0.0082 290

APMP.PR-S3b Total Luminous Flux of LEDs Final Report
103
R-2 0.6445 0.0127 1.9130 0.0082 101
R-3 0.5751 0.0115 1.9297 0.0082 103
G-1 2.5280 0.0519 3.2997 0.063 119
G-2 2.4159 0.0497 3.3643 0.063 82
G-3 2.5336 0.0510 3.3066 0.063 162
B-1 0.7186 0.0252 3.4650 0.075 135
B-2 0.7096 0.0246 3.3995 0.075 96
B-3 0.7079 0.0252 3.4310 0.075 104
W-1 1.3201 0.0237 3.4748 0.083 183
W-2 1.2496 0.0222 3.3635 0.083 88
W-3 1.2603 0.0226 3.4162 0.083 100
5.9. NMC-A*STAR
NMC-A*STAR of Singapore measured the artifact set #8 in its first round from 10 July
2008 to 28 August 2008. The laboratory conditions are reported as temperature of (23 ±
2) ºC and relative humidity of (60 ± 10) %. Table 5-9 shows the reported results of
NMC-A*STAR.
Table 5-9. Measurement results of NMC-A*STAR.
artifact
set LED Φ (lm) U(Φ) (lm) Vj (V) U(Vj) (V)
burning
time (min)
#8
R-1 0.661 0.012 1.8918 0.0016 51
R-2 0.692 0.012 1.8965 0.0016 39
R-3 0.719 0.013 1.9022 0.0016 62
G-1 2.832 0.045 3.5329 0.0033 50
G-2 2.987 0.048 3.2946 0.0033 38
G-3 2.834 0.045 3.2958 0.0033 54
B-1 0.872 0.015 3.4500 0.0026 48
B-2 0.795 0.014 3.3650 0.0026 38
B-3 0.800 0.014 3.4684 0.0026 53
W-1 1.670 0.027 3.4273 0.0078 49
W-2 1.347 0.022 3.4273 0.0078 37
W-3 1.564 0.025 3.4617 0.0078 53
5.10. VSL
VSL of the Netherlands measured the artifact set #1 in its second round from 13 October
2008 to 12 January 2009. The laboratory conditions are reported as temperature of (24.0
± 0.5) ºC and relative humidity of (45 ± 10) %. Table 5-10 shows the reported results of
VSL.
Table 5-10. Measurement results of VSL.
artifact LED Φ (lm) U(Φ) (lm) Vj (V) U(Vj) (V) burning

APMP.PR-S3b Total Luminous Flux of LEDs Final Report
104
set time (min)
#1
R-1 0.683 0.020 1.8870 0.0031 231
R-2 0.676 0.021 1.8913 0.0031 215
R-3 0.652 0.019 1.9239 0.0031 333
G-1 2.978 0.077 3.2986 0.0056 705
G-2 2.872 0.069 3.4396 0.0059 925
G-3 2.855 0.081 3.3170 0.0054 715
B-1 0.769 0.020 3.3805 0.0055 292
B-2 0.790 0.021 3.3806 0.0058 285
B-3 0.809 0.023 3.3491 0.0055 620
W-1 1.737 0.055 3.4444 0.0057 270
W-2 1.575 0.058 3.4646 0.0059 267
W-3 1.767 0.070 3.4193 0.0059 352
5.11. NIST
NIST of the USA measured the artifact set #3 in its second round on 23 April 2009. The
laboratory conditions are reported as temperature of 25 ºC and relative humidity of
17 %. Table 5-11 shows the reported results of NIST.
Table 5-11. Measurement results of NIST.
artifact
set LED Φ (lm) U(Φ) (lm) Vj (V) U(Vj) (V)
burning
time (min)
#3
R-1 0.669 0.010 1.887 0.005 40
R-2 0.683 0.010 1.891 0.005 25
R-3 0.682 0.010 1.895 0.005 25
G-1 2.919 0.022 3.494 0.008 50
G-2 2.658 0.020 3.364 0.008 25
G-3 2.604 0.020 3.323 0.008 40
B-1 0.789 0.019 3.421 0.008 40
B-2 0.831 0.020 3.409 0.008 25
B-3 0.672 0.016 3.500 0.009 25
W-1 1.668 0.012 3.423 0.008 40
W-2 1.629 0.012 3.326 0.008 25
W-3 1.680 0.013 3.295 0.008 25
5.12. VNIIOFI
VNIIOFI of Russia measured the artifact set #5 in its second round from 12 January 2009
to 20 January 2009. The laboratory conditions are reported as temperature of (22.0 ±
0.5) ºC and relative humidity of (62 ± 2) %. Table 5-12 shows the reported results of
VNIIOFI. We note that VNIIOFI reported two sets of results: the one based on the
goniophotometer method, and the other based on the integrating sphere method. We
use the integrating sphere results for the comparison, which had slightly lower

APMP.PR-S3b Total Luminous Flux of LEDs Final Report
105
uncertainties.
Table 5-12. Measurement results of VNIIOFI.
artifact
set LED Φ (lm) U(Φ) (lm) Vj (V) U(Vj) (V)
burning
time (min)
#5
R-1 0.736 0.013 1.932 0.001 37
R-2 0.732 0.015 1.936 0.001 39
R-3 0.707 0.013 1.897 0.001 36
G-1 2.851 0.06 3.339 0.001 40
G-2 2.712 0.04 3.483 0.001 35
G-3 2.792 0.05 3.411 0.001 37
B-1 0.738 0.016 3.441 0.001 36
B-2 0.839 0.016 3.443 0.001 36
B-3 0.816 0.015 3.458 0.001 37
W-1 1.715 0.04 3.345 0.001 36
W-2 1.789 0.04 3.476 0.001 39
W-3 1.745 0.04 3.487 0.001 37
5.13. INM
INM of Romania measured the artifact set #7 in its second round from 13 December
2008 to 16 December 2008. The laboratory conditions are reported as temperature of
(25.0 ± 0.2) ºC and relative humidity of (30 ± 5) %. Table 5-13 shows the reported
results of INM.
Table 5-13. Measurement results of INM.
artifact
set LED Φ (lm) U(Φ) (lm) Vj (V) U(Vj) (V)
burning
time (min)
#7
R-1 0.63 0.04 1.926 0.006 5
R-2 0.69 0.04 1.906 0.006 5
R-3 0.61 0.04 1.924 0.006 5
G-1 2.71 0.17 3.300 0.010 5
G-2 2.69 0.17 3.367 0.010 5
G-3 2.76 0.17 3.306 0.010 5
B-1 0.70 0.10 3.467 0.010 5
B-2 0.64 0.10 3.400 0.010 5
B-3 0.66 0.10 3.433 0.010 5
W-1 1.50 0.20 3.477 0.010 5
W-2 1.34 0.20 3.367 0.010 5
W-3 1.35 0.20 3.418 0.010 5
6. Pre-draft A Process
After the measurement process is completed, the preparation of the comparison report is

APMP.PR-S3b Total Luminous Flux of LEDs Final Report
106
conducted according to the CCPR Guidelines. 14 The pre-draft A process consists of
verification of reported results, review of uncertainty budgets, and review of relative data.
In this chapter, we also describe the temperature-corrected results and the identification
of outliers.
6.1. Verification of Reported Results
The verification of reported results started in November 2009 after most of the
participants have submitted their results. The pilot sent to each participant the submitted
result values and the technical report including the uncertainty budgets. The participant
reviewed it to correct any error. After the participant confirmed the final version, no
correction is applied in the results and in the technical reports of the participants.
6.2. Temperature Correction and Artifact Drift
After the results are finalized by the verification, the pilot applied the temperature
correction based on the Eq. (3-1). By using the temperature sensitivity coefficients a, b,
and c of each LED and the measured junction voltages reported by the participants, all
the results could be converted to the values expected at the same junction voltage, i.e.,
at the same reference condition with a temperature of T0. We took the initial control
measurement of the pilot for each round as the reference condition for correction.
The tables below summarize the results before and after the temperature correction
for each measurement round. The relative differences of the participant’s results and of
the pilot’s results by the temperature correction are also calculated in the last two
columns to show the magnitudes of the correction. Note that the uncertainty of the
temperature correction was estimated to be 0.5 % as a relative standard uncertainty (see
Chapter 3), while all the participants claimed the uncertainty of the junction voltage
measurement much lower than this.
Table 6-1. Results of temperature correction for the round to MIKES.
artifact
set LED
1. meas.
of pilot
participant
lab
2. meas.
of pilot temperature corrected relative
difference
ΦL* - ΦL
relative
difference
ΦP2* – ΦP2 ΦP1 (lm) ΦL (lm) ΦP2 (lm) ΦL
* (lm) ΦP2
* (lm)
#1 R-1 0.6757 0.717 0.6730 0.7084 0.6732 -1.21% 0.02%
14 CCPR Key Comparison Working Group, Guidelines for CCPR Comparison Report Preparation, Rev. 2 (Sept. 18, 2009), available at http://www.bipm.org/en/committees/cc/ccpr/publications_cc.html

APMP.PR-S3b Total Luminous Flux of LEDs Final Report
107
R-2 0.6781 0.721 0.6755 0.7130 0.6756 -1.12% 0.00%
R-3 0.6506 0.691 0.6481 0.6845 0.6482 -0.95% 0.01%
G-1 3.0107 3.080 2.9976 3.0646 2.9977 -0.50% 0.00%
G-2 2.8639 2.922 2.8467 2.9049 2.8475 -0.59% 0.03%
G-3 2.9543 3.028 2.9450 3.0151 2.9417 -0.43% -0.11%
B-1 0.7512 0.765 0.7488 0.7661 0.7488 0.14% 0.01%
B-2 0.7648 0.775 0.7608 0.7755 0.7608 0.06% 0.00%
B-3 0.7974 0.811 0.7967 0.8094 0.7964 -0.20% -0.04%
W-1 1.5951 1.771 1.6992 1.7636 1.6979 -0.42% -0.08%
W-2 1.5890 1.659 1.5749 1.6500 1.5744 -0.55% -0.03%
W-3 1.7533 1.822 1.7413 1.8172 1.7412 -0.27% 0.00%
Table 6-2. Results of temperature correction for the round to CMS-ITRI.
artifact
set LED
1. meas.
of pilot
participant
lab
2. meas.
of pilot temperature corrected relative
difference
ΦL* - ΦL
relative
difference
ΦP2* – ΦP2 ΦP1 (lm) ΦL (lm) ΦP2 (lm) ΦL
* (lm) ΦP2
* (lm)
#2
R-1 0.6367 0.638 0.6399 0.6256 0.6319 -1.99% -1.26%
R-2 0.6945 0.694 0.6950 0.6820 0.6875 -1.76% -1.09%
R-3 0.7023 0.703 0.7047 0.6904 0.6966 -1.83% -1.16%
G-1 2.7609 2.777 2.8661 2.7317 2.8688 -1.66% 0.09%
G-2 2.8444 2.868 2.8291 2.8224 2.8321 -1.62% 0.11%
G-3 2.9915 3.008 2.9757 2.9518 2.9798 -1.90% 0.14%
B-1 0.7438 0.723 0.7321 0.7226 0.7322 -0.05% 0.00%
B-2 0.8121 0.797 0.8045 0.7917 0.8052 -0.67% 0.08%
B-3 0.7318 0.711 0.7259 0.7173 0.7259 0.87% 0.00%
W-1 1.7008 1.729 1.7061 1.6800 1.7097 -2.92% 0.21%
W-2 1.7136 1.743 1.6983 1.6928 1.7033 -2.97% 0.29%
W-3 1.5545 1.584 1.5425 1.5312 1.5468 -3.45% 0.28%
Table 6-3. Results of temperature correction for the round to PTB.
artifact
set LED
1. meas.
of pilot
participant
lab
2. meas.
of pilot temperature corrected relative
difference
ΦL* - ΦL
relative
difference
ΦP2* – ΦP2 ΦP1 (lm) ΦL (lm) ΦP2 (lm) ΦL
* (lm) ΦP2
* (lm)
#3
R-1 0.6749 0.6652 0.6675 0.6568 0.6730 -1.27% 0.82%
R-2 0.6887 0.6758 0.6811 0.6675 0.6862 -1.25% 0.73%
R-3 0.6864 0.6757 0.6796 0.6660 0.6849 -1.45% 0.77%
G-1 2.9676 2.8550 2.9421 2.8327 2.9521 -0.79% 0.34%
G-2 2.7133 2.6163 2.6977 2.5953 2.7053 -0.81% 0.28%
G-3 2.6582 2.5650 2.6377 2.5390 2.6461 -1.03% 0.32%
B-1 0.7804 0.7750 0.7744 0.7741 0.7749 -0.12% 0.05%
B-2 0.8262 0.8211 0.8196 0.8198 0.8204 -0.15% 0.09%
B-3 0.6624 0.6630 0.6599 0.6610 0.6605 -0.31% 0.09%
W-1 1.7035 1.6826 1.6824 1.6624 1.6951 -1.21% 0.75%
W-2 1.6709 1.6511 1.6534 1.6324 1.6644 -1.15% 0.66%

APMP.PR-S3b Total Luminous Flux of LEDs Final Report
108
W-3 1.7216 1.6996 1.7029 1.6788 1.7124 -1.24% 0.55%
Table 6-4. Results of temperature correction for the round to NMIJ.
artifact
set LED
1. meas.
of pilot
participant
lab
2. meas.
of pilot temperature corrected relative
difference
ΦL* - ΦL
relative
difference
ΦP2* – ΦP2 ΦP1 (lm) ΦL (lm) ΦP2 (lm) ΦL
* (lm) ΦP2
* (lm)
#4
R-1 0.7098 0.701 0.7229 0.6987 0.7077 -0.33% 0.68%
R-2 0.6725 0.663 0.6746 0.6610 0.6698 -0.30% 0.65%
R-3 0.6933 0.685 0.6979 0.6827 0.6923 -0.34% 0.68%
G-1 2.9251 2.9530 2.6238 2.9413 2.9008 -0.40% 0.26%
G-2 3.1816 3.2061 2.7930 3.1902 3.1540 -0.50% 0.21%
G-3 2.9647 2.9883 2.6636 2.9744 2.9479 -0.47% 0.29%
B-1 0.8849 0.9373 0.9182 0.9378 0.8799 0.05% -0.02%
B-2 0.7567 0.8020 0.7942 0.8024 0.7521 0.05% -0.03%
B-3 0.8270 0.8746 0.8769 0.8753 0.8223 0.08% -0.07%
W-1 1.7656 1.7788 0.6897 1.7640 1.7352 -0.84% 0.47%
W-2 1.7379 1.7441 0.6846 1.7300 1.7111 -0.81% 0.42%
W-3 1.7825 1.7897 0.6991 1.7759 1.7561 -0.77% 0.40%
Table 6-5. Results of temperature correction for the round to CENAM.
artifact
set LED
1. meas.
of pilot
participant
lab
2. meas.
of pilot temperature corrected relative
difference
ΦL* - ΦL
relative
difference
ΦP2* – ΦP2 ΦP1 (lm) ΦL (lm) ΦP2 (lm) ΦL
* (lm) ΦP2
* (lm)
#5
R-1 0.6827 0.5350 0.6868 0.5251 0.6811 -1.89% -0.83%
R-2 0.6829 0.5367 0.6881 0.5267 0.6821 -1.91% -0.88%
R-3 0.6495 0.5245 0.6542 0.5142 0.6484 -2.01% -0.91%
G-1 2.9119 3.3739 2.9171 3.3360 2.9031 -1.14% -0.48%
G-2 2.8201 3.2135 2.7947 3.2099 2.7832 -0.11% -0.41%
G-3 2.8484 3.4003 2.8501 3.3646 2.8383 -1.06% -0.42%
B-1 0.7790 0.9105 0.7768 0.9101 0.7761 -0.04% -0.09%
B-2 0.8820 0.9486 0.8803 0.9461 0.8785 -0.26% -0.21%
B-3 0.8248 0.8750 0.8219 0.8738 0.8207 -0.14% -0.15%
W-1 1.6785 1.7994 1.6842 1.7734 1.6759 -1.46% -0.50%
W-2 1.7536 1.8595 1.7598 1.8299 1.7510 -1.62% -0.51%
W-3 1.7000 1.8181 1.7101 1.7862 1.6984 -1.79% -0.69%
Table 6-6. Results of temperature correction for the round to LNE.
artifact
set LED
1. meas.
of pilot
participant
lab
2. meas.
of pilot temperature corrected relative
difference
ΦL* - ΦL
relative
difference
ΦP2* – ΦP2 ΦP1 (lm) ΦL (lm) ΦP2 (lm) ΦL
* (lm) ΦP2
* (lm)
#6 R-1 0.7000 0.745 0.7136 0.7257 0.7076 -2.66% -0.84%

APMP.PR-S3b Total Luminous Flux of LEDs Final Report
109
R-2 0.6563 0.692 0.6635 0.6740 0.6575 -2.67% -0.91%
R-3 0.7023 0.750 0.7144 0.7298 0.7082 -2.77% -0.88%
G-1 2.8398 2.985 2.8575 2.9632 2.8493 -0.74% -0.29%
G-2 2.7226 2.861 2.7450 2.8443 2.7372 -0.59% -0.29%
G-3 2.4871 2.603 2.4902 2.5850 2.4814 -0.70% -0.35%
B-1 0.9185 0.934 0.9231 0.9337 0.9224 -0.03% -0.08%
B-2 0.8098 0.816 0.8125 0.8158 0.8116 -0.03% -0.11%
B-3 0.8244 0.825 0.8236 0.8251 0.8228 0.01% -0.09%
W-1 0.6933 0.709 0.6739 0.7026 0.6716 -0.91% -0.34%
W-2 0.6828 0.702 0.6709 0.6941 0.6680 -1.13% -0.43%
W-3 0.7091 0.731 0.7016 0.7236 0.6986 -1.02% -0.44%
Table 6-7. Results of temperature correction for the round to METAS.
artifact
set LED
1. meas.
of pilot
participant
lab
2. meas.
of pilot temperature corrected relative
difference
ΦL* - ΦL
relative
difference
ΦP2* – ΦP2 ΦP1 (lm) ΦL (lm) ΦP2 (lm) ΦL
* (lm) ΦP2
* (lm)
#7
R-1 0.6559 0.5801 0.6570 0.5643 0.6556 -2.79% -0.21%
R-2 0.7196 0.6445 0.7234 0.6243 0.7208 -3.24% -0.36%
R-3 0.6466 0.5751 0.6483 0.5571 0.6469 -3.24% -0.22%
G-1 3.0373 2.5280 3.0222 2.5112 3.0185 -0.67% -0.12%
G-2 2.8805 2.4159 2.8689 2.4020 2.8657 -0.58% -0.11%
G-3 3.0100 2.5336 2.9972 2.5135 2.9930 -0.80% -0.14%
B-1 0.8098 0.7186 0.8039 0.7182 0.8038 -0.06% -0.01%
B-2 0.7816 0.7096 0.7763 0.7091 0.7760 -0.06% -0.05%
B-3 0.7966 0.7079 0.7914 0.7058 0.7913 -0.29% -0.01%
W-1 1.6594 1.3201 1.6525 1.3047 1.6478 -1.18% -0.29%
W-2 1.5769 1.2496 1.5720 1.2348 1.5710 -1.19% -0.06%
W-3 1.5905 1.2603 1.5882 1.2459 1.5866 -1.16% -0.10%
Table 6-8. Results of temperature correction for the round to NMC-A*STAR.
artifact
set LED
1. meas.
of pilot
participant
lab
2. meas.
of pilot temperature corrected relative
difference
ΦL* - ΦL
relative
difference
ΦP2* – ΦP2 ΦP1 (lm) ΦL (lm) ΦP2 (lm) ΦL
* (lm) ΦP2
* (lm)
#8
R-1 0.6490 0.661 0.6524 0.6510 0.6506 -1.53% -0.28%
R-2 0.6793 0.692 0.6833 0.6792 0.6803 -1.88% -0.43%
R-3 0.7060 0.719 0.7098 0.7050 0.7066 -1.99% -0.45%
G-1 2.8770 2.832 2.8631 2.8190 2.8589 -0.46% -0.15%
G-2 3.0247 2.987 3.0101 2.9670 3.0040 -0.67% -0.20%
G-3 2.8590 2.834 2.8468 2.8147 2.8385 -0.69% -0.29%
B-1 0.8507 0.872 0.8449 0.8701 0.8439 -0.22% -0.12%
B-2 0.7713 0.795 0.7665 0.7924 0.7653 -0.32% -0.16%
B-3 0.7712 0.800 0.7641 0.7991 0.7637 -0.12% -0.05%
W-1 1.6656 1.670 1.6645 1.6512 1.6568 -1.14% -0.47%
W-2 1.3472 1.347 1.3425 1.3340 1.3378 -0.97% -0.35%

APMP.PR-S3b Total Luminous Flux of LEDs Final Report
110
W-3 1.5594 1.564 1.5509 1.5487 1.5480 -0.99% -0.19%
Table 6-9. Results of temperature correction for the round to VSL.
artifact
set LED
1. meas.
of pilot
participant
lab
2. meas.
of pilot temperature corrected relative
difference
ΦL* - ΦL
relative
difference
ΦP2* – ΦP2 ΦP1 (lm) ΦL (lm) ΦP2 (lm) ΦL
* (lm) ΦP2
* (lm)
#1
R-1 0.6733 0.683 0.6710 0.6795 0.6746 -0.52% 0.53%
R-2 0.6755 0.676 0.6750 0.6718 0.6787 -0.62% 0.55%
R-3 0.6477 0.652 0.6493 0.6482 0.6520 -0.59% 0.42%
G-1 2.9980 2.978 2.9756 2.9672 2.9373 -0.36% -1.30%
G-2 2.8473 2.872 2.8258 2.8613 2.8003 -0.37% -0.91%
G-3 2.9450 2.855 2.9262 2.8487 2.8932 -0.22% -1.14%
B-1 0.7488 0.769 0.7340 0.7696 0.7369 0.08% 0.39%
B-2 0.7609 0.790 0.7389 0.7900 0.7398 0.01% 0.12%
B-3 0.7969 0.809 0.7842 0.8084 0.7822 -0.08% -0.25%
W-1 1.7017 1.737 1.6839 1.7291 1.6639 -0.45% -1.20%
W-2 1.5761 1.575 1.5525 1.5685 1.5327 -0.42% -1.29%
W-3 1.7439 1.767 1.7087 1.7593 1.6885 -0.44% -1.20%
Table 6-10. Results of temperature correction for the round to NIST.
artifact
set LED
1. meas.
of pilot
participant
lab
2. meas.
of pilot temperature corrected relative
difference
ΦL* - ΦL
relative
difference
ΦP2* – ΦP2 ΦP1 (lm) ΦL (lm) ΦP2 (lm) ΦL
* (lm) ΦP2
* (lm)
#3
R-1 0.6669 0.669 0.6724 0.6696 0.6657 0.08% -1.01%
R-2 0.6809 0.683 0.6856 0.6821 0.6799 -0.13% -0.84%
R-3 0.6791 0.682 0.6845 0.6816 0.6772 -0.05% -1.08%
G-1 2.9418 2.919 2.9298 2.9203 2.9213 0.05% -0.29%
G-2 2.6986 2.658 2.6758 2.6595 2.6667 0.05% -0.34%
G-3 2.6374 2.604 2.6189 2.6084 2.6107 0.17% -0.31%
B-1 0.7744 0.789 0.7597 0.7893 0.7593 0.04% -0.05%
B-2 0.8204 0.831 0.7993 0.8313 0.7989 0.03% -0.05%
B-3 0.6601 0.672 0.6454 0.6724 0.6448 0.06% -0.10%
W-1 1.6872 1.668 1.6709 1.6725 1.6628 0.27% -0.49%
W-2 1.6575 1.629 1.6334 1.6331 1.6261 0.25% -0.45%
W-3 1.7063 1.680 1.6805 1.6859 1.6761 0.35% -0.26%
Table 6-11. Results of temperature correction for the round to VNIIOFI.
artifact
set LED
1. meas.
of pilot
participant
lab
2. meas.
of pilot temperature corrected relative
difference
ΦL* - ΦL
relative
difference
ΦP2* – ΦP2 ΦP1 (lm) ΦL (lm) ΦP2 (lm) ΦL
* (lm) ΦP2
* (lm)
#5 R-1 0.6868 0.736 0.6896 0.7132 0.6878 -3.20% -0.26%

APMP.PR-S3b Total Luminous Flux of LEDs Final Report
111
R-2 0.6881 0.732 0.6885 0.7104 0.6879 -3.04% -0.09%
R-3 0.6542 0.707 0.6537 0.6860 0.6537 -3.06% 0.00%
G-1 2.9171 2.851 2.9012 2.8122 2.8901 -1.38% -0.38%
G-2 2.7947 2.712 2.7550 2.6754 2.7448 -1.37% -0.37%
G-3 2.8501 2.792 2.8421 2.7554 2.8297 -1.33% -0.44%
B-1 0.7768 0.738 0.7672 0.7412 0.7672 0.44% 0.00%
B-2 0.8803 0.839 0.8714 0.8410 0.8709 0.24% -0.07%
B-3 0.8219 0.816 0.8128 0.8187 0.8126 0.33% -0.02%
W-1 1.6842 1.715 1.6805 1.6752 1.6701 -2.37% -0.62%
W-2 1.7598 1.789 1.7476 1.7463 1.7390 -2.44% -0.49%
W-3 1.7101 1.745 1.6980 1.7002 1.6899 -2.64% -0.48%
Table 6-12. Results of temperature correction for the round to INM.
artifact
set LED
1. meas.
of pilot
participant
lab
2. meas.
of pilot temperature corrected relative
difference
ΦL* - ΦL
relative
difference
ΦP2* – ΦP2 ΦP1 (lm) ΦL (lm) ΦP2 (lm) ΦL
* (lm) ΦP2
* (lm)
#7
R-1 0.6570 0.63 0.6619 0.6193 0.6565 -1.73% -0.81%
R-2 0.7234 0.69 0.7254 0.6822 0.7210 -1.14% -0.61%
R-3 0.6483 0.61 0.6527 0.6003 0.6469 -1.61% -0.91%
G-1 3.0222 2.71 3.0194 2.6948 3.0111 -0.56% -0.28%
G-2 2.8689 2.69 2.8643 2.6744 2.8581 -0.58% -0.22%
G-3 2.9972 2.76 3.0015 2.7429 2.9945 -0.62% -0.23%
B-1 0.8039 0.70 0.7630 0.6998 0.7627 -0.03% -0.04%
B-2 0.7763 0.64 0.7567 0.6399 0.7565 -0.02% -0.03%
B-3 0.7914 0.66 0.7792 0.6580 0.7778 -0.30% -0.18%
W-1 1.6525 1.50 1.6534 1.4842 1.6452 -1.07% -0.50%
W-2 1.5720 1.34 1.5728 1.3213 1.5624 -1.41% -0.67%
W-3 1.5882 1.35 1.5817 1.3340 1.5750 -1.20% -0.43%
Based on the temperature-corrected results of the pilot, the drift of the artifact LEDs
could be analyzed. Each LED is measured by the pilot two or three times depending on
the measurement rounds. The relative changes of the total luminous flux measured by
the pilot for each artifact LED are shown in the following figures, separated to a plot
without temperature correction and to a plot after correction. They show that the effect
of the temperature correction is small because the laboratory condition of the pilot was
little changed during the comparison. The most of the artifact LEDs show a drift smaller
than ±1 % for each round that is comparable to the measurement uncertainty of the
pilot. However, a few LEDs underwent a large drift and should be excluded from the data
analysis. The exclusion of the non-stable artifact LEDs is decided by the participant
through the procedure of review of relative data.

APMP.PR-S3b Total Luminous Flux of LEDs Final Report
112
Fig. 6-1. Drift of the artefact set #1.
Fig. 6-2. Drift of the artefact set #2.
Fig. 6-3. Drift of the artefact set #3.

APMP.PR-S3b Total Luminous Flux of LEDs Final Report
113
Fig. 6-4. Drift of the artefact set #4.
Fig. 6-5. Drift of the artefact set #5.
Fig. 6-6. Drift of the artefact set #6.
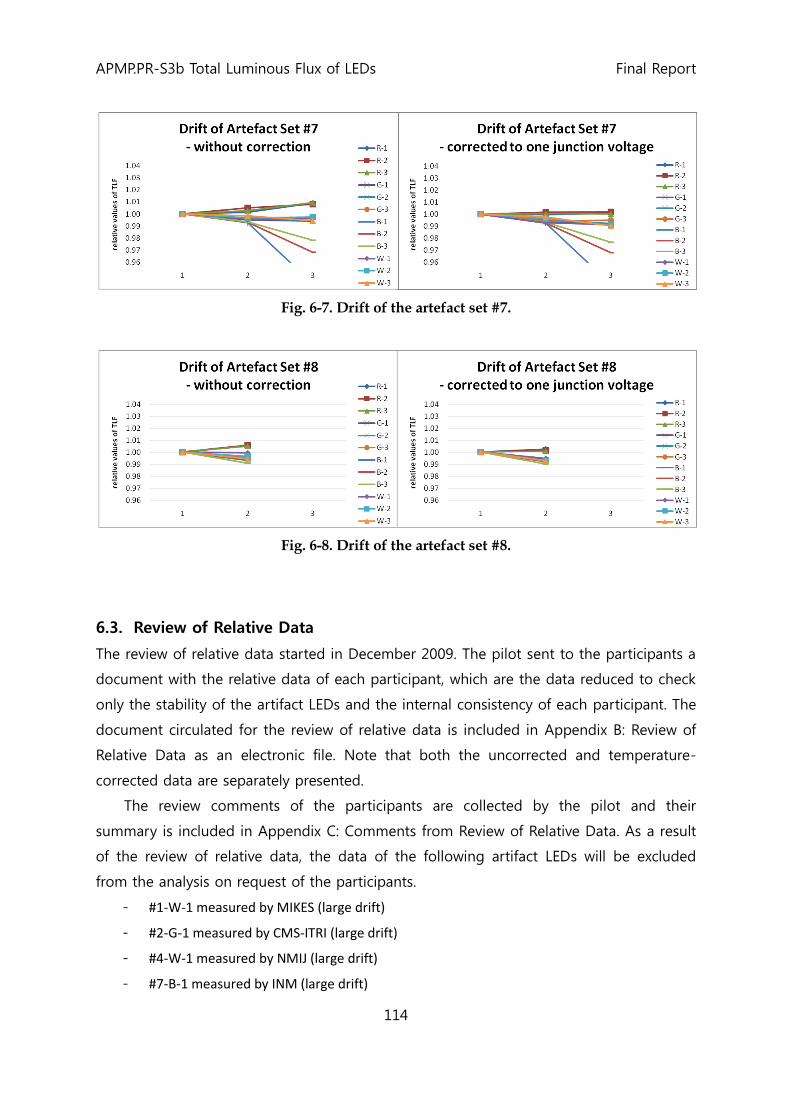
APMP.PR-S3b Total Luminous Flux of LEDs Final Report
114
Fig. 6-7. Drift of the artefact set #7.
Fig. 6-8. Drift of the artefact set #8.
6.3. Review of Relative Data
The review of relative data started in December 2009. The pilot sent to the participants a
document with the relative data of each participant, which are the data reduced to check
only the stability of the artifact LEDs and the internal consistency of each participant. The
document circulated for the review of relative data is included in Appendix B: Review of
Relative Data as an electronic file. Note that both the uncorrected and temperature-
corrected data are separately presented.
The review comments of the participants are collected by the pilot and their
summary is included in Appendix C: Comments from Review of Relative Data. As a result
of the review of relative data, the data of the following artifact LEDs will be excluded
from the analysis on request of the participants.
- #1-W-1 measured by MIKES (large drift)
- #2-G-1 measured by CMS-ITRI (large drift)
- #4-W-1 measured by NMIJ (large drift)
- #7-B-1 measured by INM (large drift)

APMP.PR-S3b Total Luminous Flux of LEDs Final Report
115
6.4. Review of Uncertainty Budgets
The review of relative data started in March 2010 and completed in June 2010. The pilot
summarized the technical reports and uncertainty budgets of the participants to one
document and sent it to all the participants. We note that VNIIOFI could not participate
to the review process because their submission of the technical report was abandoned.
The discussion among the participants and the revisions of the budgets are conducted
according to the CCPR Guidelines. The review comments of the participants are collected
by the pilot and their summary is included in Appendix D: Comments from Review of
Uncertainty Budgets. The final version of the uncertainty budgets is summarized in
Chapter 4.
6.5. Identification of Outliers
For the identification of outliers that can significantly skew the reference value of the
comparison, the pilot prepared a document with the relative deviation data of each
participant from the simple mean values of all the participants without disclosing the
participant’s identity and the absolute results. The document sent to the participant in
June 2010 is included in Appendix E: Identification of Outliers. As a result of the
discussion, it was agreed in September 2010 that the data with a relative deviation of
more than ±10 % from the mean are to identify as outliers. As the measurements of
each type (color) of LEDs are taken as each separate comparison, the outlier will be
excluded only from the analysis for the related LED type.

APMP.PR-S3b Total Luminous Flux of LEDs Final Report
116
7. Data Analysis
The data analysis is performed based on the example in Appendix B of the CCPR
Guidelines.15 The only difference was the sequence of each round: “pilot – participant –
pilot” in the LED comparison, while “participant – pilot – participant” in the example of
the Guidelines. In this chapter, the equations of each analysis step are described. The
complete data of the calculation is included as an electronic file (Excel spreadsheet) at
the end of the chapter. Note that the analysis is repeated for each type of LEDs, and also
for the data without and with the temperature-correction.
7.1. Calculation of Difference to Pilot
For each participant with index i and for each LED with index j, the two measurement
results of the pilot (index P), before (index P1) and after (index P2) the participant, are
averaged by
1 2
, , ,
1
2
P P P
i j i j i j . (7-1)
The relative standard uncertainty of the pilot’s average value Φi,jP is calculated from the
relative standard uncertainty ur,corP of the correlated components (scale uncertainty) and
the relative standard uncertainty ur,ucP of the uncorrelated components (transfer
uncertainty) according to
2
2 2
, , ,21
1( )
2
P P Pk
r i j r cor r uc
k
u u u
. (7-2)
The values of ur,corP and ur,uc
Pk are determined by combing the related components in the
reported uncertainty budgets of the pilot in Table 4-1 ~ Table 4-4. Note that the pilot
reported and applied the upper boundary values for all the uncertainty components in
the budgets so that the relative standard uncertainty of each measurement remained the
same for each LED type.
The relative difference Δi,j between the participant i and the pilot (index P) for each
LED j is then calculated by
,
,
,
1i j
i j P
i j
(7-3)
and its uncertainty by
2 22
, , , , ,( ) P
i j r i j r uc r add i ju u u u . (7-4)
15 CCPR Key Comparison Working Group, Guidelines for CCPR Comparison Report Preparation, Rev. 2 (Sept. 18, 2009), available at http://www.bipm.org/en/committees/cc/ccpr/publications_cc.html

APMP.PR-S3b Total Luminous Flux of LEDs Final Report
117
Here, ur,add(Φi,j) denotes the additional uncertainty in the measurement of LED j by the
participant i due to non-ideal characteristics of the artifact LEDs. For the results without
temperature correction, we used the drift of the LED for the corresponding round as the
value of ur,add(Φi,j), which is calculated from the relative difference of the two
measurement results of the pilot. For the results with temperature correction, the relative
standard uncertainty of the correction procedure of 0.5 % is additionally combined to
ur,add(Φi,j). The relative standard uncertainty of the participant ur(Φi,j) is determined from
the reported expanded results in Chapter 5.
Finally, the results of the multiple LEDs for each type are averaged for the participant
i by
,
1
3i i j
j
. (7-5)
Under assumption that the results of multiple LEDs measured by the same participant are
strongly correlated, the uncertainty of the relative differences is calculated simply by
,
1
3i i j
j
u u . (7-6)
For the pilot, we use now the index i = 0 and set Δ0 = 0. According to Eq. (7-4), the
uncertainty u(Δ0) for the pilot is the same as the total relative standard uncertainty
averaged over all the measurements by the pilot. For case of the temperature corrected
results, we added also the uncertainty of the correction to u(Δ0).
7.2. Calculation of Comparison Reference Value
The Reference Value (RV) of the comparison for each LED type is calculated using
weighted mean with cut-off. The cut-off value ucut is calculated by
for ; 0,...,cut r i r i r iu average u u median u i N . (7-7)
Note that the outliers are not included in the calculation of the RV so that the number N
denotes the number of the participants whose comparison results are not identified as
outliers (the pilot not counted as a participant here).
The total relative standard uncertainty ur(Φi) of each participant i, averaged over LEDs
with different j, is adjusted by the cut-off (i = 0, …, N):
,
,
for
otherwise
r adj i r i r i cut
r adj i cut
u u u u
u u
(7-8)
Also, the uncertainty of Δi is adjusted after cut-off by
2 2
,adj i r adj i T iu u u . (7-9)

APMP.PR-S3b Total Luminous Flux of LEDs Final Report
118
Here, uT(Δi) denotes the transfer uncertainty component in u(Δi), which is separated by
2 2
T i i r iu u u . (7-10)
These uncertainties are used to calculate the weights wi for each participant i given by
2
2
0
adj i
i N
adj i
i
uw
u
. (7-11)
Finally, the RV is determined by
0
N
RV i i
i
w
. (7-12)
The uncertainty of the comparison RV is given by
2
40
2
0
Ni
i adj i
RV N
adj i
i
u
uu
u
. (7-13)
7.3. Calculation of Degree of Equivalence
The unilateral degree of equivalence (DoE) of the participant i is defined by
i i RVD . (7-14)
The DoE is calculated according to Eq. (7-13) also for the participants whose comparison
results are identified as outliers. However, the uncertainty of DoE is different. For the
participants whose results are included in the calculation of the RV, the uncertainty of
DoE is given, as an expanded uncertainty with a coverage factor k = 2, by
2
2 2 2
20
2N
i
i i RV adj i
iadj i
uU k u u u
u
. (7-15)
For the participants whose results are excluded in the calculation of the RV, the
uncertainty of DoE is simplified to
2 2
i i RVU k u u . (7-16)
7.4. Data Analysis Spreadsheet
The Excel-file can be opened by a double-click on the icon below.
DoE_flux_rev.xlsx

APMP.PR-S3b Total Luminous Flux of LEDs Final Report
119
8. Comparison Results
8.1. Red LEDs
The comparison RV for total luminous flux of red LEDs is calculated to be
0.01651, 0.80% ( 2)RV rU k
for the results without temperature correction, and
0.00083, 0.80% ( 2)RV rU k
for the results after temperature correction. Table 8-1
and Table 8-2 summarize the comparison results for red LEDs without and with
temperature correction, respectively. The last column of each table shows the En criteria
of each participant, which is defined as the absolute ratio of Di and U(Di). Note that the
results of CENAM and METAS are identified as outliers and not included in the
calculation of the RV.
Table 8-1. Comparison results for red LEDs without temperature correction.
participant Δi u(Δi) wi Di U(Di) En
MIKES 0.06423 1.41% 0.08441 0.048 0.027 1.778
CMS-ITRI -0.00078 1.27% 0.10341 -0.017 0.024 0.708
PTB -0.01098 1.77% 0.05333 -0.027 0.034 0.794
NMIJ -0.00810 1.56% 0.06876 -0.025 0.030 0.833
CENAM -0.21039 5.41% N.A. -0.227 0.108 2.102
LNE -0.01035 1.56% 0.06827 -0.027 0.030 0.900
METAS -0.11160 1.10% N.A. -0.128 0.023 5.565
NMC-
A*STAR 0.01576 1.10% 0.13038 -0.001 0.020 0.050
VSL 0.00753 1.55% 0.06978 -0.009 0.030 0.300
NIST -0.00036 1.12% 0.10546 -0.017 0.021 0.810
VNIIOFI 0.07135 1.03% 0.15859 0.055 0.019 2.895
INM -0.05148 3.19% 0.01638 -0.068 0.063 1.079
KRISS 0.00000 1.09% 0.14122 -0.017 0.020 0.850
Table 8-2. Comparison results for red LEDs after temperature correction.
participant Δi u(Δi) wi Di U(Di) En
MIKES 0.05266 1.50% 0.07649 0.052 0.029 1.793
CMS-ITRI -0.01332 1.59% 0.06800 -0.014 0.031 0.452
PTB -0.02768 1.54% 0.07237 -0.029 0.030 0.967
NMIJ -0.01458 1.37% 0.09185 -0.015 0.026 0.577
CENAM -0.22202 5.49% N.A. -0.223 0.110 2.027
LNE -0.02725 1.19% 0.12225 -0.028 0.022 1.273
METAS -0.13712 1.18% N.A. -0.138 0.025 5.520
NMC-
A*STAR -0.00028 1.10% 0.12349 -0.001 0.021 0.048
VSL -0.00075 1.68% 0.06090 -0.002 0.033 0.061
NIST 0.00422 0.97% 0.12227 0.003 0.019 0.158
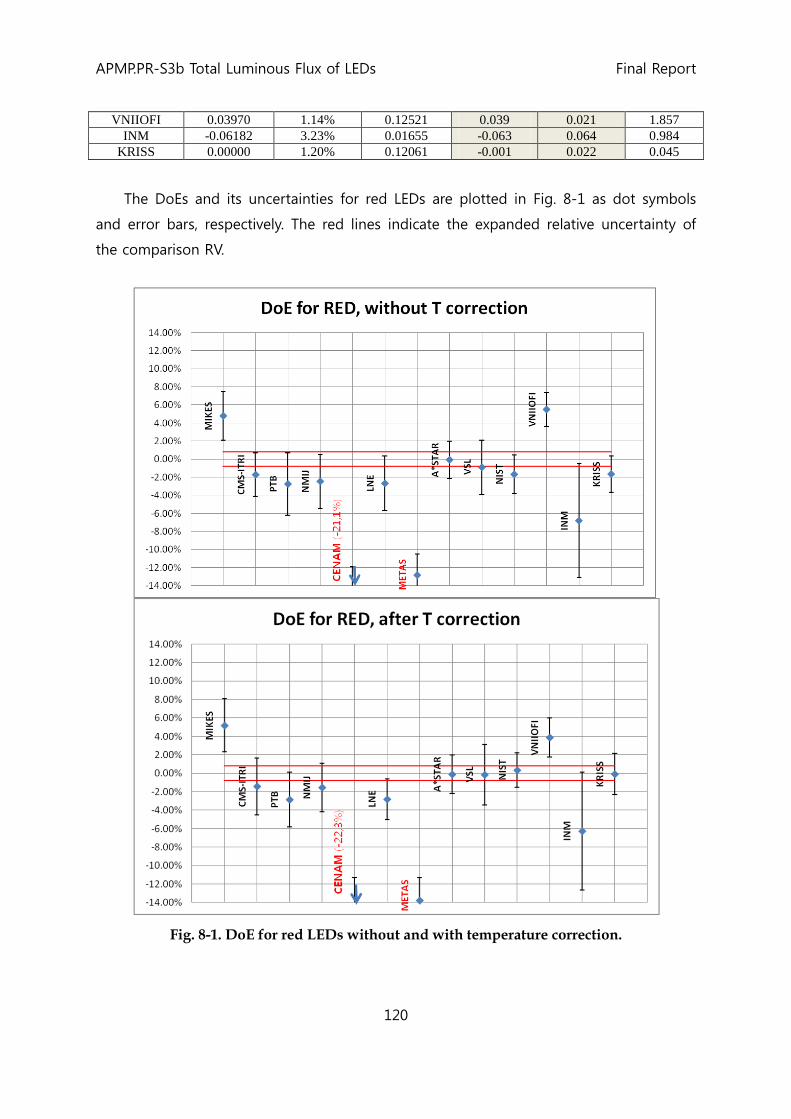
APMP.PR-S3b Total Luminous Flux of LEDs Final Report
120
VNIIOFI 0.03970 1.14% 0.12521 0.039 0.021 1.857
INM -0.06182 3.23% 0.01655 -0.063 0.064 0.984
KRISS 0.00000 1.20% 0.12061 -0.001 0.022 0.045
The DoEs and its uncertainties for red LEDs are plotted in Fig. 8-1 as dot symbols
and error bars, respectively. The red lines indicate the expanded relative uncertainty of
the comparison RV.
Fig. 8-1. DoE for red LEDs without and with temperature correction.

APMP.PR-S3b Total Luminous Flux of LEDs Final Report
121
8.2. Green LEDs
The comparison RV for total luminous flux of green LEDs is calculated to be
0.00650, 0.76% ( 2)RV rU k
for the results without temperature correction, and
0.01221, 0.84% ( 2)RV rU k
for the results after temperature correction. Table
8-3 and Table 8-4 summarize the comparison results for green LEDs without and with
temperature correction, respectively. The last column of each table shows the En criteria
of each participant, which is defined as the absolute ratio of Di and U(Di). Note that the
results of CENAM and METAS are identified as outliers and not included in the
calculation of the RV.
Table 8-3. Comparison results for green LEDs without temperature correction.
participant Δi u(Δi) wi Di U(Di) En
MIKES 0.02507 1.37% 0.07955 0.032 0.026 1.231
CMS-ITRI 0.00960 1.36% 0.08110 0.016 0.026 0.615
PTB -0.03270 1.34% 0.08381 -0.026 0.026 1.000
NMIJ 0.01349 1.36% 0.08074 0.020 0.026 0.769
CENAM 0.16523 4.39% N.A. 0.172 0.088 1.955
LNE -0.01622 1.25% 0.09578 -0.010 0.024 0.417
METAS -0.16056 1.16% N.A. -0.154 0.024 6.417
NMC-
A*STAR -0.00998 0.98% 0.15190 -0.003 0.018 0.167
VSL -0.00596 1.52% 0.06463 0.001 0.029 0.034
NIST -0.00860 0.83% 0.12400 -0.002 0.016 0.125
VNIIOFI -0.02055 1.29% 0.09090 -0.014 0.024 0.583
INM -0.08144 3.15% 0.01518 -0.075 0.062 1.210
KRISS 0.00000 1.07% 0.13241 0.007 0.020 0.350
Table 8-4. Comparison results for green LEDs after temperature correction.
participant Δi u(Δi) wi Di U(Di) En
MIKES 0.02004 1.47% 0.08502 0.032 0.028 1.143
CMS-ITRI -0.00846 1.43% 0.09050 0.004 0.027 0.148
PTB -0.04258 1.30% 0.10855 -0.030 0.025 1.200
NMIJ 0.00764 1.30% 0.10952 0.020 0.024 0.833
CENAM 0.15880 4.49% N.A. 0.171 0.090 1.900
LNE -0.02291 1.17% 0.13367 -0.011 0.022 0.500
METAS -0.16574 1.32% N.A. -0.154 0.028 5.500
NMC-
A*STAR -0.01490 1.21% 0.12361 -0.003 0.023 0.130
VSL -0.00365 2.31% 0.03444 0.009 0.045 0.200
NIST -0.00615 1.20% 0.09330 0.006 0.023 0.261
VNIIOFI -0.03176 1.62% 0.07027 -0.020 0.031 0.645
INM -0.08572 3.21% 0.01785 -0.074 0.064 1.156
KRISS 0.00000 1.18% 0.13326 0.012 0.022 0.545

APMP.PR-S3b Total Luminous Flux of LEDs Final Report
122
The DoEs and its uncertainties for green LEDs are plotted in Fig. 8-2 as dot symbols
and error bars, respectively. The red lines indicate the expanded relative uncertainty of
the comparison RV.
Fig. 8-2. DoE for green LEDs without and with temperature correction.
8.3. Blue LEDs
The comparison RV for total luminous flux of blue LEDs is calculated to be
0.01187, 0.92% ( 2)RV rU k
for the results without temperature correction, and

APMP.PR-S3b Total Luminous Flux of LEDs Final Report
123
0.01081, 0.96% ( 2)RV rU k
for the results after temperature correction. Table 8-5
and Table 8-6 summarize the comparison results for blue LEDs without and with
temperature correction, respectively. The last column of each table shows the En criteria
of each participant, which is defined as the absolute ratio of Di and U(Di). Note that the
results of CENAM, METAS, and INM are identified as outliers and not included in the
calculation of the RV.
Table 8-5. Comparison results for blue LEDs without temperature correction.
participant Δi u(Δi) wi Di U(Di) En
MIKES 0.01785 2.68% 0.03056 0.006 0.053 0.113
CMS-ITRI -0.01958 1.64% 0.08120 -0.031 0.031 1.000
PTB -0.00084 1.49% 0.09843 -0.013 0.028 0.464
NMIJ 0.06179 1.09% 0.16375 0.050 0.020 2.500
CENAM 0.10325 5.51% N.A. 0.091 0.111 0.820
LNE -0.00932 1.25% 0.14046 -0.021 0.023 0.913
METAS -0.10229 1.89% N.A. -0.114 0.039 2.923
NMC-
A*STAR 0.03487 1.16% 0.13661 0.023 0.022 1.045
VSL 0.03800 2.56% 0.03344 0.026 0.050 0.520
NIST 0.02806 2.54% 0.03397 0.016 0.050 0.320
VNIIOFI -0.02929 1.50% 0.09556 -0.041 0.028 1.464
INM -0.16231 7.97% N.A. -0.174 0.160 1.088
KRISS 0.00000 1.09% 0.18601 -0.012 0.020 0.600
Table 8-6. Comparison results for blue LEDs after temperature correction.
participant Δi u(Δi) wi Di U(Di) En
MIKES 0.01793 2.73% 0.03434 0.007 0.054 0.130
CMS-ITRI -0.01923 1.70% 0.08805 -0.030 0.032 0.938
PTB -0.00317 1.55% 0.10659 -0.014 0.029 0.483
NMIJ 0.06262 1.22% 0.15207 0.052 0.023 2.261
CENAM 0.10250 5.55% N.A. 0.092 0.112 0.821
LNE -0.00997 1.33% 0.14503 -0.021 0.024 0.875
METAS -0.10341 1.97% N.A. -0.114 0.041 2.780
NMC-
A*STAR 0.03316 1.32% 0.12349 0.022 0.025 0.880
VSL 0.03757 2.54% 0.03960 0.027 0.050 0.540
NIST 0.02885 2.65% 0.03641 0.018 0.052 0.346
VNIIOFI -0.02587 1.60% 0.09591 -0.037 0.030 1.233
INM -0.16322 8.02% N.A. -0.174 0.161 1.081
KRISS 0.00000 1.20% 0.17851 -0.011 0.022 0.500
The DoEs and its uncertainties for blue LEDs are plotted in Fig. 8-3 as dot symbols
and error bars, respectively. The red lines indicate the expanded relative uncertainty of

APMP.PR-S3b Total Luminous Flux of LEDs Final Report
124
the comparison RV.
Fig. 8-3. DoE for blue LEDs without and with temperature correction.
8.4. White LEDs
The comparison RV for total luminous flux of white LEDs is calculated to be
0.00824, 0.92% ( 2)RV rU k
for the results without temperature correction, and
0.00284, 1.02% ( 2)RV rU k
for the results after temperature correction. Table
8-7 and Table 8-8 summarize the comparison results for white LEDs without and with

APMP.PR-S3b Total Luminous Flux of LEDs Final Report
125
temperature correction, respectively. The last column of each table shows the En criteria
of each participant, which is defined as the absolute ratio of Di and U(Di). Note that the
results of METAS and INM are identified as outliers and not included in the calculation of
the RV.
Table 8-7. Comparison results for white LEDs without temperature correction.
participant Δi u(Δi) wi Di U(Di) En
MIKES 0.04573 2.09% 0.04962 0.037 0.041 0.902
CMS-ITRI 0.01989 1.42% 0.10838 0.012 0.027 0.444
PTB -0.00672 1.63% 0.08196 -0.015 0.031 0.484
NMIJ 0.01351 2.09% 0.04879 0.005 0.041 0.122
CENAM 0.06501 4.86% 0.00922 0.057 0.097 0.588
LNE -0.00758 2.75% 0.02840 -0.016 0.054 0.296
METAS -0.20539 1.03% N.A. -0.214 0.023 9.304
NMC-
A*STAR 0.00342 0.98% 0.22825 -0.005 0.017 0.294
VSL 0.01885 2.40% 0.03770 0.011 0.047 0.234
NIST -0.00817 1.42% 0.08668 -0.016 0.027 0.593
VNIIOFI 0.02119 1.35% 0.12009 0.013 0.025 0.520
INM -0.12951 7.19% N.A. -0.138 0.144 0.958
KRISS 0.00000 1.04% 0.20093 -0.008 0.019 0.421
Table 8-8. Comparison results for white LEDs after temperature correction.
participant Δi u(Δi) wi Di U(Di) En
MIKES 0.04159 2.17% 0.05627 0.044 0.042 1.048
CMS-ITRI -0.01218 1.47% 0.12262 -0.009 0.027 0.333
PTB -0.02169 1.38% 0.13961 -0.019 0.026 0.731
NMIJ 0.00348 1.80% 0.07847 0.006 0.035 0.171
CENAM 0.05096 4.94% 0.01082 0.054 0.098 0.551
LNE -0.01950 2.58% 0.03883 -0.017 0.051 0.333
METAS -0.21406 1.21% N.A. -0.211 0.026 8.115
NMC-
A*STAR -0.00518 1.23% 0.17513 -0.002 0.022 0.091
VSL 0.02059 3.33% 0.02382 0.023 0.066 0.348
NIST -0.00331 1.86% 0.06638 0.000 0.036 0.000
VNIIOFI -0.00095 1.72% 0.08976 0.002 0.033 0.061
INM -0.13775 7.32% N.A. -0.135 0.147 0.918
KRISS 0.00000 1.15% 0.19830 0.003 0.021 0.143
The DoEs and its uncertainties for white LEDs are plotted in Fig. 8-4 as dot symbols
and error bars, respectively. The red lines indicate the expanded relative uncertainty of
the comparison RV.

APMP.PR-S3b Total Luminous Flux of LEDs Final Report
126
Fig. 8-4. DoE for white LEDs without and with temperature correction.

APMP.PR-S3b Total Luminous Flux of LEDs Final Report
127
9. Discussion
9.1. Test of Consistency
In order to test the consistency of the comparison results, the Birge ratio RB is calculated
by the equation
2
RV
B 20 adj
1
( )
Ni
i i
RN u
, (9-1)
where N is the number of the participants, without counting the pilot, whose results are
used for the calculation of the RV. For this calculation, the data of the outliers are not
used. Note that the consistency is satisfied, if RB ≤ 1.
Table 9-1 shows the calculated Birge ratios of the comparison S3b without and with
temperature correction. The results of the white LEDs show the satisfactory consistency.
For the other LEDs, the values of RB range from 1.4 to 2.4, which indicate that the
uncertainties of the participants are underestimated. Table 9-1 also shows that the
temperature correction has the effect of decreasing the Birge ratios and, hence,
improving the consistency. This verifies that the temperature correction based on the
junction voltage measurement described in Chapter 3 is capable to correct the
systematic errors of the artifact LEDs due to different measurement conditions.
Table 9-1. Birge ratio of the comparison S3b.
LED type Birge ratio
without T correction
Birge ratio after T
correction
Red 2.426 1.944
Green 1.437 1.469
Blue 2.087 1.894
White 0.976 0.938
9.2. Accuracy of Color Correction
The narrow spectral bandwidth of LEDs is another important source of systematic errors
in the photometric measurement of LEDs. If a photometer is used for LED measurements,
correction of spectral mismatch, often referred to as color correction, is essential to
achieve high accuracy, which requires both relative spectral distribution of the test LED
and relative spectral responsivity of the photometer. As we have circulated four different
colors of LEDs (R/G/B/W), analysis of the dependence of the comparison results upon the
LED colors can provide important information on the accuracy of color correction. Table

APMP.PR-S3b Total Luminous Flux of LEDs Final Report
128
9-2 summarizes the DoEs of each participant for different colors of LEDs, which are
based on the temperature corrected data.
Table 9-2. DoEs for different LED colors (after temperature correction).
participant DoE for red
LEDs
DoE for green
LEDs
DoE for blue
LEDs
DoE for white
LEDs MIKES 0.052 0.032 0.007 0.044
CMS-ITRI -0.014 0.004 -0.030 -0.009
PTB -0.029 -0.030 -0.014 -0.019
NMIJ -0.015 0.020 0.052 0.006
CENAM -0.223 0.171 0.092 0.054
LNE -0.028 -0.011 -0.021 -0.017
METAS -0.138 -0.154 -0.114 -0.211
NMC-A*STAR -0.001 -0.003 0.022 -0.002
VSL -0.002 0.009 0.027 0.023
NIST 0.003 0.006 0.018 0.000
VNIIOFI 0.039 -0.020 -0.037 0.002
INM -0.063 -0.074 -0.174 -0.135
KRISS -0.001 0.012 -0.011 0.003
Fig. 9-1 shows plots of the data in Table 9-2. We classified the participants to three
groups. The first group shown on the top plot in Fig. 9-1 have only a weak (< 2 %)
dependence of DoE on the LED colors. The second group shown on the middle plot in
Fig. 9-1 have a moderate (3 % ~ 8 %) dependence of DoE on the LED colors. Especially,
the results of many participants have a maximum or a minimum for blue LEDs. The last
group shown on the bottom plot in Fig. 9-1 have a large dependence of DoE on the LED
colors or a too large offset. The results of Table 9-2 and Fig. 9-1 can be useful for the
participants to investigate the unknown systematic errors in their color correction.

APMP.PR-S3b Total Luminous Flux of LEDs Final Report
129
Fig. 9-1. Plots of DoEs for different colors of LEDs (R, G, B, W). The participants are classified to three groups.

APMP.PR-S3b Total Luminous Flux of LEDs Final Report
130
10. Summary
The measurement of total luminous flux is compared by circulating four different types of
artifact LEDs (red, green, blue, and white) to 13 NMIs (including the pilot). The artifact
LEDs are prepared by the functional seasoning to enable a temperature correction based
on the junction voltage measurement. The comparison reference values and the
unilateral degrees of equivalence (DoEs) of each participant are calculated for each type
of LEDs from the reported measurement results. Table 10-1 shows the summary of the
DoEs and their uncertainties of each participant for each type of LEDs as the comparison
result.
Table 10-1. Summary of the unilateral DoEs and their uncertainties for APMP.PR-S3b (temperature correction applied).
NMI
RED GREEN BLUE WHITE
DoE U of
DoE DoE
U of
DoE DoE
U of
DoE DoE
U of
DoE
MIKES 0.052 0.029 0.032 0.028 0.007 0.054 0.044 0.042
CMS-ITRI -0.014 0.031 0.004 0.027 -0.030 0.032 -0.009 0.027
PTB -0.029 0.030 -0.030 0.025 -0.014 0.029 -0.019 0.026
NMIJ -0.015 0.026 0.020 0.024 0.052 0.023 0.006 0.035
CENAM -0.223 0.110 0.171 0.090 0.092 0.112 0.054 0.098
LNE -0.028 0.022 -0.011 0.022 -0.021 0.024 -0.017 0.051
METAS -0.138 0.025 -0.154 0.028 -0.114 0.041 -0.211 0.026
NMC-
A*STAR -0.001 0.021 -0.003 0.023 0.022 0.025 -0.002 0.022
VSL -0.002 0.033 0.009 0.045 0.027 0.050 0.023 0.066
NIST 0.003 0.019 0.006 0.023 0.018 0.052 0.000 0.036
VNIIOFI 0.039 0.021 -0.020 0.031 -0.037 0.030 0.002 0.033
INM -0.063 0.064 -0.074 0.064 -0.174 0.161 -0.135 0.147
KRISS -0.001 0.022 0.012 0.022 -0.011 0.022 0.003 0.021
Acknowledgement
The pilot work of this comparison is partly supported by the Korean Ministry of
Knowledge and Economy under the project of LED standardization, grant B0010209.

APMP.PR-S3b Total Luminous Flux of LEDs Final Report
131
Appendix A: Technical Protocol
The pdf-file can be opened by a double-click on the image below.

APMP.PR-S3b Total Luminous Flux of LEDs Final Report
132
Appendix B: Review of Relative Data
The pdf-file can be opened by a double-click on the image below.

APMP.PR-S3b Total Luminous Flux of LEDs Final Report
133
Appendix C: Comments from Review of Relative Data
The pdf-file can be opened by a double-click on the image below.

APMP.PR-S3b Total Luminous Flux of LEDs Final Report
134
Appendix D: Comments from Review of Uncertainty Budgets
The pdf-file can be opened by a double-click on the image below.

APMP.PR-S3b Total Luminous Flux of LEDs Final Report
135
Appendix E: Identification of Outliers
The pdf-file can be opened by a double-click on the image below.
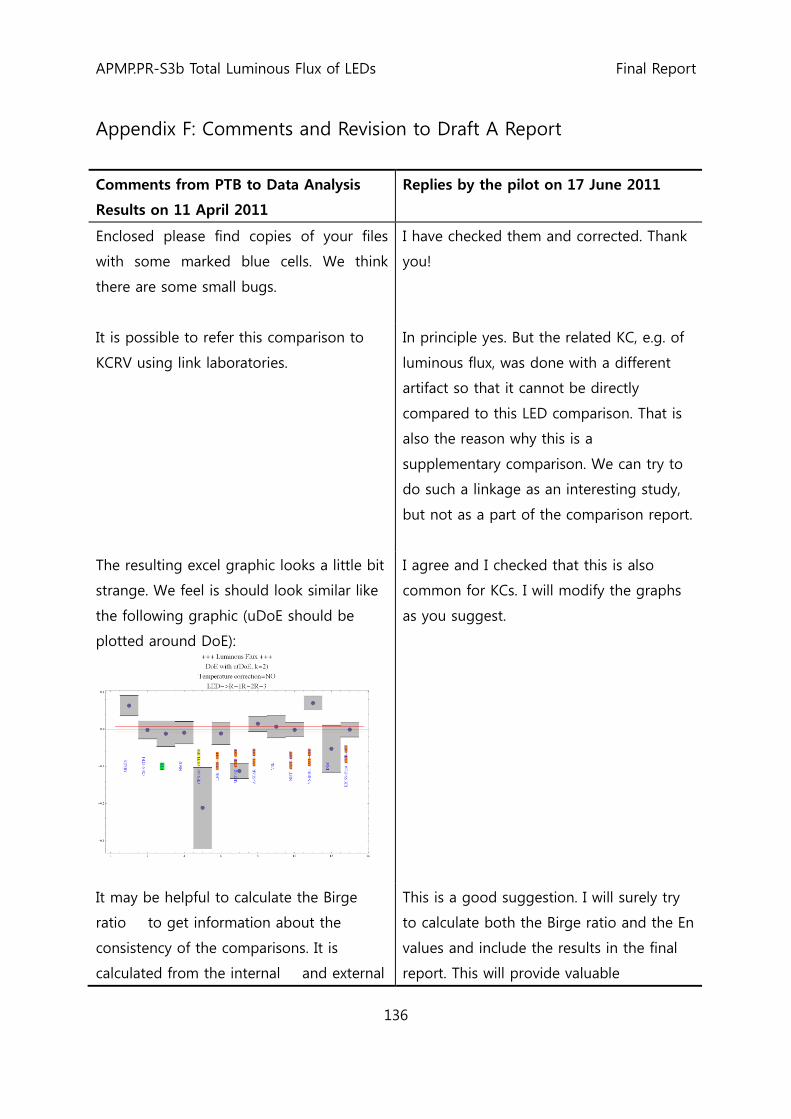
APMP.PR-S3b Total Luminous Flux of LEDs Final Report
136
Appendix F: Comments and Revision to Draft A Report
Comments from PTB to Data Analysis
Results on 11 April 2011
Replies by the pilot on 17 June 2011
Enclosed please find copies of your files
with some marked blue cells. We think
there are some small bugs.
I have checked them and corrected. Thank
you!
It is possible to refer this comparison to
KCRV using link laboratories.
In principle yes. But the related KC, e.g. of
luminous flux, was done with a different
artifact so that it cannot be directly
compared to this LED comparison. That is
also the reason why this is a
supplementary comparison. We can try to
do such a linkage as an interesting study,
but not as a part of the comparison report.
The resulting excel graphic looks a little bit
strange. We feel is should look similar like
the following graphic (uDoE should be
plotted around DoE):
I agree and I checked that this is also
common for KCs. I will modify the graphs
as you suggest.
It may be helpful to calculate the Birge
ratio to get information about the
consistency of the comparisons. It is
calculated from the internal and external
This is a good suggestion. I will surely try
to calculate both the Birge ratio and the En
values and include the results in the final
report. This will provide valuable

APMP.PR-S3b Total Luminous Flux of LEDs Final Report
137
consistency. A value of close to 1 or less
indicates that the results are consistent.
Values greater than 1 are not.
in
extB
u
uR with
n
i
i
n
i
ii
Dun
DuD
u
1
2
1
2
ext
)()1(
)](/[
and
2/1
1
2
in )(
n
i
iDuu .
For luminous flux we found values around
2 for most cases. For luminous intensity
(without diffuse LEDs) we found values
around 1. Please see enclosed jpg files (I
apologize this jpg, but is takes a while to
get nice prints with mathematica). We also
calculated the criteria by
)(2Absin,
i
i
DoEu
DoEE
Values greater than 1 indicate a too small
uncertainty of the participant. So we
suggest to use specific enlargements of the
participant uncertainties in that way that
the Birge ratio is equal or less 1 and
criteria is close to 1. This procedure also
would solve the problem of outliers.
information to the next version of the KC
guidelines which should include a
procedure of consistency check and of a
better outlier selection.
Comments from PTB to Draft A Report
on 19 Oct 2011
Replies by the pilot on 22 Nov 2011
We found some typing errors in the draft
A paper. Enclosed please find our errata
ZIP-file.
I have checked the errors. But all the errors
you found were the corrections of the
uncertainty budgets of PTB. These,
however, cannot be corrected in the draft
A report stage, because they are already

APMP.PR-S3b Total Luminous Flux of LEDs Final Report
138
reviewed by the participants. This is
communicated via email on 21.10.2011.
PTB has acknowledged this and confirms
that these corrections do not affect the
comparison results. Therefore, the
corrections are not considered in the
revision of the draft A report.
The Plots Fig. 9-1 of S3a and S3b are very
helpful. It would be great to have these
plots for S3c, too.
In case of S3c, the plots such as Fig. 9-1 of
S3a and S3b were not easy because a 2
dimensional plot is required to make
systematic effects visible. I will try to realize
this in the next revision of the S3c report,
but I should also manage the workload.
Based on the results data, however, each
participant can make such analysis to
investigate the systematic effect of his
results.
The appendices should include all
important comments, suggestions and
recommendations of the participants to
simplify future comparisons. For example
our Suggestions PTB.docx of 15.04.2011.
I will make another appendix to record the
comments during the draft A report
procedure.
The tables in chapter 8 should include the
criteria
)(2Absin,
i
i
DoEu
DoEE
that would be helpful to evaluate the
stated uncertainty by each participants.
I will consider this in the revision.
The Birge ratios stated in table 9-1
especially for S3a and S3a are often
significant greater than 1. I think the
I agree that the large Birge ratio means
that the uncertainties of the participants
are underestimated. I wrote this also in the

APMP.PR-S3b Total Luminous Flux of LEDs Final Report
139
meaning of that is, that some stated
uncertainties are too small. Please, refer
the related En criteria.
Here we have an additional hint for that.
The first diagram from S3a (intensity)
shows a relative flat DoE around 0% of PTB
results. But the second diagram from S3b
(flux) shows relative big differences
between (R,G) and (B,W) LEDs. The
luminous flux values were determined by a
goniophotometer directly after the
luminous intensity measurement with the
same operation state of the LED and in the
same system without new alignment of the
LED. So there is no reason for that
difference. We know from hundreds of
measurements that the integration
capability of the goniophotometer has a
very high reproducibility.
So I think this a hint for an inconsistency
of the data as we know from the Birge
ratios.
report. Your statement will be documented
in the Appendix of the revised report.

APMP.PR-S3b Total Luminous Flux of LEDs Final Report
140
List of Revisions from A-1 to A-2
Draft A-1 Draft A-2
Page 99, section 5.4, the first line: “June ~
July 2008 (the exact dates not reported)”
Corrected to “from 16 June to 2 July 2008”
based on the result verification records.
Chapter 8, the first paragraph of each
section.
Addition of a sentence “The last column of
each table Table 8-2shows the En criteria of
each participant, which is defined as the
absolute ratio of Di and U(Di).”
Chapter 8, Table 8-1 ~ Table 8-8. Addition of a new column with the
calculated En criteria values.
After Chapter 10 Addition of <Acknowledgment> by the
pilot.
After Appendix E Addition of <Appendix F: Comments and
Revision to Draft A Report>
Statement of METAS to the results of S3b on 24 Jan 2012 (added to Draft B)
Comparison APMP.PR-S3a (averaged luminous intensity of single LEDs) has shown that
the photometric scale of luminous intensity and illuminance of METAS is in agreement
with the world mean value.
For the comparison APMP.PR-S3b (luminous flux of single LEDs) a new facility
was build based on a 1 m integrating sphere. The calibration was done directly traceably
through APMP.PR-S3a by determine the flux responsivity of the sphere using a LED of
known averaged luminous intensity and a precision sphere aperture positioned at 100
mm distance to the LED.
Analysing the situation we found different problems in the set up, mainly the
general reproducibility, sphere uniformity, linearity of the photometer, stability of the
photometer, and absorption problems of the LED holder system. Unfortunately no other
validation of the calibration capability was made prior to the APMP.PR-S3.b comparison.

APMP.PR-S3b Total Luminous Flux of LEDs Final Report
141
No calibration services for the quantity luminous flux for single LEDs were ever
offered to costumers. METAS has no intention to do so in near future. No CMCs are
affected by the results of the APMP.PR-S3.b comparison. N.B. METAS is offering
measurement and calibration of luminous flux of diverse lamps and luminaires (including
LED luminaires). These measurements are performed on the METAS primary flux scale
realized by a goniophotometer. This quantity is directly traceable to the photometric
scale of METAS through calibrated illuminance meters. This competence has been shown
through the successful participation at the most recent CCPR comparison (CCPR-K4) and
are internationally accepted (CMCs on luminous flux).
No further corrective actions are foreseen in near future (no subsequential
comparison on that quantity).
- End of the Report -

APMP supplementary comparison 1
Technical Protocol on
APMP Supplementary Comparisons of
LED Measurements
APMP.PR-S3a Averaged LED Intensity
APMP.PR-S3b Total Luminous Flux of LEDs
APMP.PR-S3c Emitted Colour of LEDs
Approved in January 2008, Revised in November 2008 due to change of participants list
Contents
1. INTRODUCTION........................................................................................................................................ 2
2. ORGANIZATION........................................................................................................................................ 2
2.1. CONDITION OF PARTICIPATION ............................................................................................................... 2 2.2. LIST OF PARTICIPANTS............................................................................................................................ 3 2.3. FORM OF COMPARISON ........................................................................................................................... 4 2.4. TIMETABLE............................................................................................................................................. 4 2.5. TRANSPORT AND HANDLING OF ARTEFACTS ........................................................................................... 6
3. DESCRIPTION OF ARTEFACTS ............................................................................................................ 7
4. MEASUREMENT INSTRUCTIONS ........................................................................................................ 9
4.1. AVERAGED LED INTENSITY (S3A) ......................................................................................................... 9 4.2. TOTAL LUMINOUS FLUX (S3B).............................................................................................................. 11 4.3. EMITTED COLOUR (S3C) ....................................................................................................................... 12
5. REPORTING OF RESULTS AND UNCERTAINTIES ........................................................................ 12
5.1. AVERAGED LED INTENSITY (S3A) ....................................................................................................... 12 5.2. TOTAL LUMINOUS FLUX (S3B).............................................................................................................. 13 5.3. EMITTED COLOUR (S3C) ....................................................................................................................... 13
6. PREPARATION OF COMPARISON REPORT.................................................................................... 14
APPENDIX 1: INSPECTION REPORT ON RECEIPT OF ARTEFACTS................................................. 15
APPENDIX 2: RESULT REPORT OF AVERAGED LED INTENSITY (S3A).......................................... 16
APPENDIX 3: RESULT REPORT OF TOTAL LUMINOUS FLUX (S3B) ................................................ 17
APPENDIX 4: RESULT REPORT OF EMITTED COLOUR (S3C) ........................................................... 18
Technical protocol on comparison of LED measurements

APMP supplementary comparison 2
Technical protocol on comparison of LED measurements
1. INTRODUCTION
Under the Mutual Recognition Arrangement (MRA), the metrological equivalence of national measurement standards will be determined by a set of key comparisons chosen and organized by the consultative committees of CIPM working closely with regional metrology organizations (RMOs). In addition, RMOs can organize supplementary comparisons which should be carried out in the same procedure as that of key comparisons following the guidelines established by BIPM1.
At its meeting in December 2006, Asia Pacific Metrology Programme (APMP) Technical Committee of Photometry and Radiometry (TCPR) proposed several regional comparisons in the field of optical radiation metrology. One of those, a set of photometric quantities of light-emitting diodes (LEDs) has been agreed to be conducted with Korea Research Institute of Standards and Science (KRISS) of Republic Korea as the pilot institute. It is also decided that APMP TCPR invites the institutes of other RMOs to participate this supplementary comparison.
In March 2007, the first invitation to participate is distributed to the members of Consultative Committee of Photometry and Radiometry (CCPR) of CIPM by the chairperson of APMP TCPR. Based on the responses to this invitation, a provisional list of participants is prepared.
Three measurement quantities of LEDs are selected for the comparison, which are listed as service categories for Calibration and Measurement Capabilities (CMCs): averaged LED intensity defined by International Commission on Illumination (CIE), total luminous flux of LEDs, and emitted colour of LEDs expressed as chromaticity coordinates (x, y) according to the CIE 1931 standard colorimetric system.2
It should be noted that total luminous flux is the measurement quantity for CCPR-K4. The current supplementary comparison of total luminous flux of LEDs is, however, not to be linked to this KC, but can be regarded as a pilot study testing the suitability of LEDs as an alternative artefact for CCPR-K4.
This document is to treat the technical protocol for the comparison of LED measurements, and has been prepared by KRISS and agreed by all the participants on the preliminary list.
2. ORGANIZATION
2.1. CONDITION OF PARTICIPATION
KRISS is acting as the pilot institute in the comparison among the participants.
Three comparisons for three measurement quantities are conducted simultaneously by circulating one artefact set. The participant can decide to take part in only one or two of the three comparisons by selecting the measurement quantities. However, it should be declared with the confirmation of participation and stated in the technical protocol.
All the participants must be able to demonstrate traceability to an independent realization of each quantity, or make clear the route of traceability via another named laboratory.
By their declared intention to participate in this comparison, the laboratories accept the general instructions and the technical procedures written down in this document and commit themselves to follow the procedures strictly.
1 Guidelines for CIPM Key Comparisons, March 1999 (modified in October 2003). Available at http://www.bipm.fr/en/convention/mra/guidelines_kcs/ 2 Measurement of LEDs, CIE Technical Report 127-1997.

APMP supplementary comparison 3
Technical protocol on comparison of LED measurements
Once the protocol has been agreed, no change to the protocol may be made without prior agreement of all the participants.
2.2. LIST OF PARTICIPANTS
(Nr.) NMI
country contact person email address post address participating comparisons
(1) KRISS
Rep. Korea Seongchong
Park, Dong-Hoon Lee
[email protected] [email protected]
Division of Physical Metrology Korea Research Institute of Standards
and Science 1 Doryong-Dong, Yuseong-Gu Daejeon 305-340, Rep. Korea
all (S3a, S3b,
S3c)
(2)3 NMC-
A*STAR Singapore
Yuanjie Liu, Gan Xu
Optical Metrology Department National Metrology Centre
1 Science Park Drive Singapore 118221
all
(3) MIKES
Finland Pasi Manninen [email protected]
Metrology Research Institute Helsinki University of Technology
P.O.Box 3000 FI-02015 TKK, Finland
all
(4) NIST
USA Cameron Miller,
Yoshi Ohno Yuqin Zong
[email protected]@nist.gov
Optical Technology Division National Institute of Science and
Technology 100 Bureau Drive, Mailstop 8442
Gaithersburg, MD 20899-8442, USA
all
(5) CMS-ITRI
Chinese Taipei
Cheng-Hsien Chen
CMS/ITRI Rm. 301, Bldg. 16, 321, Sec. 2,
Kuang Fu Rd. Hsinchu, Taiwan 300, R.O.C.
all
(6) PTB
Germany Matthias
Lindemann Robert Maass
Physikalisch-Technische Bundesanstalt
AG 4.15, Goniophotometrie Bundesallee 100,
D-38116 Braunschweig, Germany
all
(7) CENAM
Mexico
Laura P. González, Anayansi Estrada,
Eric Rosas
[email protected]@[email protected]
División de Óptica y Radiometría Centro Nacional de Metrología
km 4,5 Carretera a Los Cués 76241, El Marqués, Querétaro,
México
all
(8)
NMIJ Japan
Kenji Godo, Terubumi Saito
[email protected] [email protected]
Optical Radiation Section Photometry and Radiometry Division
National Institute of Advanced Industrial Science and Technology 1-1-1, Umezono, Tsukuba, Ibaraki,
JAPAN 305-8563
all
(9) METAS
Switzerland Peter Blattner Peter.Blattner@metas
.ch
Federal Office of Metrology Lindenweg 50, 3003 Bern-Wabern
Switzerland all
(10) NPL
UK Paul Miller, Nigel Fox
National Physical Laboratory Hampton Road, Teddington, Middx,
TW11 0LW, UK all
(11) LNE
France Jimmy Dubard [email protected]
Laboratoire National de Métrologie et d’Essais
29, avenue Roger Hennequin 78197 TRAPPES, FRANCE
all
3 Formerly SPRING

APMP supplementary comparison 4
(12) NMi VSL
The Netherlands
Eric W.M. van der Ham, M.Charl
Moolman
[email protected]@NMi.nl
NMi Van Swinden Laboratorium B.V. Department Electricity, Radiation and
Length Section Optics Thijsseweg 11, 2629 JA Delft
Zuid-Holland, The Netherlands
all
(13) NMIA
Australia Philip Lukins Philip.Lukins@measu
rement.gov.au
National Measurement Institute of Australia
2 Bradfield Rd Lindfield, NSW 2070, Australia
all
(14) VNIIOFI
Russia Tatiana
Gorshkova [email protected]
All-Russian Research Institute for Optical and Physical Measurements
Ozernaya 46 119361 Moscow, Russia
all
(15) MKEH
Hungary George Andor [email protected]
Magyar Kereskedelmi és Engedélyezési Hivatal (MKEH)
Németvölgyi út 37-39 H-1124 Budapest XII.
Hungary
all
(16) INM
Romania Mihai
Simionescu mihai.simionescu@in
m.ro
Institutul National de Metrologie Sos. Vitan Barzesti nr.11, Sector 4
Bucharest, Romania all
2.3. FORM OF COMPARISON
The comparison is carried out by distributing 8 sets of the artefact standard LEDs prepared and provided by the pilot. Each set of the artefact LEDs contains 14 pieces of LED, consisting of 12 lamp-type, 5-mm diameter LEDs (3 x Red, 3 x Green, 3 x Blue, 3 x White) and 2 specially-designed diffuser-type green LEDs. The specifications, preparation, and characteristics of the standard LEDs are described in Chapter 3.
The comparison runs as a star-type. The pilot sends to each participant one set of the artefact LEDs after preparation and characterisation. The participant measures (1) the averaged LED intensity in the CIE condition B, and/or (2) the total luminous flux, and/or (3) the chromaticity coordinate CIE1931 (x,y) of every artefact LEDs according to the introductions described in Chapter 4. After the measurement, the participant sends the artefact set back to the pilot, who characterises it again to check out a possible drift or change. The measurement results should be reported to the pilot as soon as possible after the measurement is finished according to the guidelines in Chapter 5.
The timetable given below shows an overview on how the comparison is to be preceded. Since the preparation of the artefact LEDs takes much time (over 300 hours) due to seasoning process, the pilot requires at least one month preparing the artefact LEDs ready for delivery. The pilot tries to provide as many artefact sets as possible so that the circulation runs without significant loss of time (multiple star-type circulation).
Each participant has two months for measurement after the receipt of the artefact set. With its confirmation to participate, each participant has confirmed that it is capable of performing the measurements in the time allocated to it. If anything happens so that it can not meet the timetable, the participant must contact the pilot immediately.
2.4. TIMETABLE
Time Activity of pilot Activity of participants
July 2007 ~ January 2008
- Preparation of artefact sets (#1 ~ #8) - Preparation of technical protocol draft
- Review of technical protocol draft
Technical protocol on comparison of LED measurements

APMP supplementary comparison 5
January 2008 - Finalization and approval of technical protocol by APMP TCPR
February 2008
- Control measurement of artefact set #1 and #2
- Delivery of artefact set #1 to MIKES - Delivery of artefact set #2 to CMS-ITRI
March 2008
- Control measurement of artefact set #3 and #4
- Delivery of artefact set #3 to PTB - Delivery of artefact set #4 to NMIJ
- Receipt of artefact set #1 in MIKES, Finland
- Receipt of artefact set #2 in CMS-ITRI, Taiwan
April 2008
- Control measurement of artefact set #5 and #6
- Delivery of artefact set #5 to CENAM- Delivery of artefact set #6 to LNE
- Receipt of artefact set #3 in PTB, Germany
- Receipt of artefact set #4 in NMIJ, Japan
May 2008
- Control measurement of artefact set #7 and #8
- Delivery of artefact set #7 to METAS - Delivery of artefact set #8 to NMC-A*STAR
- Receipt of artefact set #5 in CENAM, Mexico
- Receipt of artefact set #6 in LNE, France
- Return of artefact set #1 and #2 to KRISS (MIKES, CMS-ITRI)
June 2008
- Control measurement of artefact set #1 and #2
- Delivery of artefact set #1 to NMi-VSL
- Delivery of artefact set #2 to NMIA
- Receipt of artefact set #7 in METAS, Switzerland
- Receipt of artefact set #8 in NMC-A*STAR, Singapore
- Return of artefact set #3 and #4 to KRISS (PTB, NMIJ)
July 2008
- Control measurement of artefact set #3 and #4
- Delivery of artefact set #3 to NIST - Delivery of artefact set #4 to NPL
- Receipt of artefact set #1 in NMi-VSL, The Netherlands
- Receipt of artefact set #2 in NMIA, Australia
- Return of artefact set #5 and #6 to KRISS (CENAM, LNE)
August 2008
- Control measurement of artefact set #5 and #6
- Delivery of artefact set #5 to VNIIOFI- Delivery of artefact set #6 to MKEH
- Receipt of artefact set #3 in NIST, USA
- Receipt of artefact set #4 in NPL, UK
- Return of artefact set #7 and #8 to KRISS (METAS, NMC-A*STAR)
September 2008 - Control measurement of artefact set #7 and #8
- Receipt of artefact set #5 in VNIIOFI, Russia
- Receipt of artefact set #6 in MKEH, Hungary
- Return of artefact set #1 and #2 to KRISS (NMi-VSL, NMIA)
October 2008 - Control measurement of artefact set #1 and #2
- Delivery of artefact set #7 to INM
- Return of artefact set #3 and #4 to KRISS (NIST, NPL)
Technical protocol on comparison of LED measurements

APMP supplementary comparison 6
November 2008 - Control measurement of artefact set #3 and #4
- Return of artefact set #5 and #6 to KRISS (VNIIOFI, MKEH)
- Receipt of artefact set #7 in INM, Romania
December 2008
- Control measurement of artefact set #5 and #6
- Control measurement of artefact set #7
- Return of artefact set #7 to KRISS (INM)
January 2009 ~ April 2009
- Pre-Draft A process 1: distribution of uncertainty budget - Pre-Draft A process 2: review of relative data
May 2009 ~ June 2009
- Draft A report: preparation and distribution
July 2009 ~ August 2009
- Draft A report: review and approval by the participants
Sept. 2009 ~ October 2009
- Draft B report: preparation and submission to TCPR (Or Draft A-2 report process, if required)
2.5. TRANSPORT AND HANDLING OF ARTEFACTS
Each set of 14 artefact LEDs is transported in a wooden box (size 90 cm x 90 cm x 80 cm) with conductive foam matting, where the LEDs are pinned down at the specified positions. Packaging of the box should be sufficiently robust to be sent by courier, but precautions must be taken to prevent any damage by mechanical impact, heat, water, and moisture. The artefact set will be accompanied by a suitable customs carnet (where appropriate) or documentation identifying the items uniquely.
Each participating laboratory covers the cost for its own measurements, transportation and any customs charges as well as for any damages that may have occurred within its country.
The artefact LEDs should be visually inspected immediately upon receipt. However, care should be taken to ensure that the LEDs have sufficient time to acclimatise to the laboratory environment thus preventing any condensation, etc. The condition of the artefact LEDs and associated packaging should be noted and communicated via email and fax to the pilot by using the form APPENDIX 1: INSPECTION REPORT ON RECEIPT OF ARTEFACTS.
The artefact LEDs should be handled only by the authorized persons, who are well aware of the cautions stated in the manufacturer’s specification sheets of the artefact LEDs.
LEDs can be damaged by static electricity or surge voltage. Using an anti-static wrist band is strongly recommended. When the LEDs are not installed for measurement, they should always be kept at the specified positions on the conductive foam matting in the package box, which prevents not only electrostatic and mechanical damages but also confusion in identifying each LED.
The LEDs should never be touched with bare hands. Please use an anti-static vinyl glove in handling the LEDs. No cleaning of LEDs should be attempted except using dry air.
The mechanical condition of the LEDs should never be changed by actions such as soldering, cutting, polishing, and bonding.
If an artefact LED is damaged or shows any unusual property during operation, the operation should immediately be terminated and the pilot should be contacted.
After measurement, the artefact LEDs should be repackaged as received. Ensure that the content of the package is complete before shipment.
Technical protocol on comparison of LED measurements

APMP supplementary comparison 7
Technical protocol on comparison of LED measurements
3. DESCRIPTION OF ARTEFACTS
The artefact LEDs are prepared from the commercially available “raw” LEDs in the following procedure:
1. Seasoning: the raw LEDs are pre-burned for more than 300 hours while the temporal change of their electrical and optical properties are recorded. The temporal drift and the temperature dependence of the optical characteristics of each LED are determined during the seasoning process.
2. Selection: based on the seasoning characteristics, the LEDs with predictable seasoning characteristics are selected as the artefact LEDs for the comparison.
3. Test measurement: the photometric quantities of the artefact LEDs are measured by the pilot before sent to each participant. The measurement by the pilot is repeated when the artefacts are received back from the participant after the measurement. If the measured drift of an artefact is greater than expected from the seasoning, it should be replaced by another seasoned LED of the same type for the next measurement round.
The “raw” LEDs used in this comparison are manufactured by Nichia Corporation.4 The selected models are listed in the following table with the specifications provided by the manufacturer (pdf-files included).
colour model initial characteristics in specifications
(forward current 20 mA, 25 ºC) specification sheets (file)
RED NSPR518S
forward voltage 2.2 V luminous intensity 1 cd dominant wavelength 625 nm spectral bandwidth 15 nm (FWHM) angular directivity 50º (FWHM)
Adobe Acrobat 7.0 Document
GREEN NSPG518S
forward voltage 3.5 V luminous intensity 2 cd dominant wavelength 525 nm spectral bandwidth 40 nm (FWHM) angular directivity 40º (FWHM)
Adobe Acrobat 7.0 Document
BLUE NSPB518S
forward voltage 3.6 V luminous intensity 0.6 cd dominant wavelength 470 nm spectral bandwidth 30 nm (FWHM) angular directivity 40º (FWHM)
Adobe Acrobat 7.0 Document
WHITE NSPW515BS
forward voltage 3.6 V luminous intensity 0.7 cd chromaticity near x = 0.31, y = 0.32 angular directivity 70º (FWHM)
Adobe Acrobat 7.0 Document
The mechanical dimensions are the same for every raw LED as summarized below. The detailed drawing of the LEDs can be found in the specification sheets.
- lamp diameter: 5 mm (diffusion type, epoxy resin mold)
- lamp base diameter: 5.6 mm (LED’s outer diameter)
- lamp length (length of the lamp part with diameter ≤ 5 mm): 7.3 mm
4 More information on the LEDs available at http://www.nichia.co.jp/

APMP supplementary comparison 8
Technical protocol on comparison of LED measurements
- wire length (measured from backside of lamp): 20.3 mm for cathode, 22.3 mm for anode
- wire thickness: 0.5 mm
- wire distance: 2.5 mm
In the seasoning process, the relative luminous intensity and spectral distribution of each LED is recorded together with its junction temperature as a function of time for burning time of longer than 300 hours, while the ambient temperature is periodically varied from 18 ºC to 33 ºC. From the recorded data, the temperature dependence and the slow-varying drift characteristics of the LED’s photometric and colorimetric quantities can be separately determined.5 The pilot keeps and uses the measured data and characteristics of each artefact LED during the seasoning, first, to monitor and compensate the temperature effect of the measurands and, second, to control if the drift of the artefact LEDs occurred during the comparison is within the expected range. Note that the record of the junction voltage with the comparison measurands for each artefact LED is essential for this purpose.
Since the mechanical alignment of a LED is known as one of the most critical components affecting the measurement accuracy of averaged LED intensity, the pilot circulates, in addition to the 12 standard-type artefact LEDs, two samples of a specially-designed diffuser-type LED that shows a spatial emission distribution being not sensitive to the alignment. This diffuser-type artefact LED is constructed by putting a green LED (NSPG518S) into a cylinder-type cap with an opal diffuser, as shown in Fig. 1, and should provide a possibility to analyze the result of the comparison. Note, however, that this diffuser-type artefact LEDs are not used in the measurement of total luminous flux.
Fig. 1 Schematic drawing of a diffuser-type artefact LED.
One artefact set finally contains 14 artefact LEDs, and the pilot prepares and circulates 8 different sets for the 14 participants. Each participant receives and measures one among these artefact sets according to the timetable in Section 2.4. Each artefact set is identified with a serial number (set #1, set #2, etc.) and the 14 LEDs in one set is identified and positioned in a package box as shown in Fig. 2. Note that one artefact LED is uniquely identified in a form #N-X-M with three codes: (1) #N as artefact set number (N = 1, 2, …, 8), (2) X as LED colour and type code (X = R for red, G for green, B for blue, W for white, D for diffuser-type), and (3) M as sample serial number for each type (M = 1, 2, 3). As the individual LED could not be indicated by writing the full identification code on the LED due to the small size, only the sample number M of each LED is marked on the wires according to the colour code as shown in the right-hand part of Fig. 2.
5 Seongchong Park et al., Metrologia 43, 299 (2006); Proc. SPIE 6355, 63550G-1 (2006)
13.5 mm
8.3 mm
diffuser diameter 8.3 mm
[side view] [front view]

APMP supplementary comparison 9
Technical protocol on comparison of LED measurements
Fig. 2 Identification of individual LEDs in the box of one artefact set.
4. MEASUREMENT INSTRUCTIONS
4.1. AVERAGED LED INTENSITY (S3A)
The averaged LED intensity (unit: cd) of each artefact LED is to be measured in the standard condition B defined by CIE, as depicted in Fig. 3. 6 Either an illuminance meter or a spectroradiometer is used as the detector measuring the illuminance Ev for a circular area with size A = 100 mm2 at a distance d = 100 mm from the front tip of the LED. This is also valid for the diffuser-type LEDs with a flat front tip (see Fig. 1).
Fig. 3 Measurement condition for averaged LED intensity (CIE standard condition B).
The LED should be mounted so that the geometric axis of the LED is aligned to coincide with the normal of the reference plane of the detector head at the centre of the aperture area. The geometric axis of a LED is defined as the axis of rotational symmetry of the LED lamp cap,
6 Measurement of LEDs, CIE Technical Report 127-1997.
R-1 R-2 R-3
G-1 G-2 G-3
B-1 B-2 B-3
D-1 D-2
[wire marking]
- black for X-1
- red for X-2
- blue for X-3
(X = R/G/B/W/D)
W-1 W-2 W-3
Detector head
distance d
d = 100 mm ( = 0.01 sr)
circular aperture with size A =100 mm2

APMP supplementary comparison 10
which, in general, does not coincide with the optical axis of the light emission, as depicted in Fig. 4. Each participant may use a different method to achieve the target alignment condition with high reproducibility. For instance, one can confirm the target alignment condition by visually inspect the LED from the detector head position to check the rotational symmetry of the cap, as shown in Fig. 5.
optical axis
Technical protocol on comparison of LED measurements
Fig. 4 Definition of the geometric axis of a LED used for alignment to measure its averaged LED intensity.
Fig. 5 Inspection of alignment for the averaged LED intensity measurement by viewing the LED from the detector head position using a camera.
The LED should be mounted so that the backward emission, i.e. radiation emitted from the LED back surface to the direction of the connection wires, does not contribute to the detector signal. For this purpose, it is recommended to design the LED holder so that the backward emission is effectively scattered out of the measurement axis and blocked by a baffle.
The measurement should be performed by applying a constant forward current of 20 mA at an ambient temperature as close as 25 ºC for every artefact LED. In order to determine the junction temperature of the LED, the junction voltage between the anode and cathode should be measured in a 4-wire connection and recorded simultaneously with the value of averaged LED intensity, as shown in Fig. 6.
geometric axis LED front tip
[side view] [front view]
LED lamp cap
well-aligned slightly tilted

APMP supplementary comparison 11
anode
cathode
current source
+
−
+
voltmeter
I = 20 mA
−
Fig. 6 Circuit diagram of the 4-wire connection used to measure the junction voltage of a LED while applying the forward current.
The measurement of averaged LED intensity and junction voltage should be performed after a warming-up time of longer than 5 minutes. The turn-on time and turn-off time of each measurement sequence should be recorded so that the total burning time of each artefact LED can be determined and reported.
The measurement should be repeated and reproduced so that its uncertainty can be evaluated with sufficient confidence.
4.2. TOTAL LUMINOUS FLUX (S3B)
The luminous flux integrated for the whole 4 direction (unit: lm) of each artefact LED is to be measured using either a goniophotometer or an integrating sphere. Note, however, that the two diffuser-type LEDs are excluded for the measurement of total luminous flux.
The LED should be mounted so that the contribution of the backward emission is properly included in the total luminous flux. For this purpose, it is recommended to mount the LED back surface as far as possible from the holder and to minimize the near-field absorption in the holder.
The measurement should be performed by applying a constant forward current of 20 mA at an ambient temperature as close as 25 ºC for every artefact LED. In order to determine the junction temperature of the LED, the junction voltage between the anode and cathode should be measured in a 4-wire connection and recorded simultaneously with the value of total luminous flux, as shown in Fig. 6.
The measurement of total luminous flux and junction voltage should be performed after a warming-up time of more than 5 minutes. The turn-on time and turn-off time of each measurement sequence should be recorded so that the total burning time of each artefact LED can be determined and reported.
The measurement should be repeated and reproduced so that its uncertainty can be evaluated with sufficient confidence.
Technical protocol on comparison of LED measurements

APMP supplementary comparison 12
Technical protocol on comparison of LED measurements
4.3. EMITTED COLOUR (S3C)
The chromaticity coordinate CIE1931 (x,y) of the emitted colour of each artefact LED is to be determined by measuring the spectral distribution in the geometric condition of averaged LED intensity as shown in Fig. 3.7
The measurement should be performed by applying a constant forward current of 20 mA at an ambient temperature as close as 25 ºC for every artefact LED. In order to determine the junction temperature of the LED, the junction voltage between the anode and cathode should be measured in a 4-wire connection and recorded simultaneously with chromaticity coordinate, as shown in Fig. 6.
The measurement of chromaticity coordinate and junction voltage should be performed after a warming-up time of more than 5 minutes. The turn-on time and turn-off time of each measurement sequence should be recorded so that the total burning time of each artefact LED can be determined and reported.
The measurement should be repeated and reproduced so that its uncertainty can be evaluated with sufficient confidence.
5. REPORTING OF RESULTS AND UNCERTAINTIES
5.1. AVERAGED LED INTENSITY (S3A)
The measurement results should be reported to the pilot via email and fax by using the form APPENDIX 2: RESULT REPORT OF AVERAGED LED INTENSITY (S3A) immediately after the measurement is finished.
In addition to the result report, the participant is requested to provide the pilot a technical report containing the information listed in the following. This free-form report should be sent to the pilot via email as a Microsoft Word file within one month after the completion of measurement.
- Measurement setup and instruments used
- Mounting and alignment method, including a picture of the LED holder
- Traceability of measurement
- Detailed uncertainty budget for averaged LED intensity including values, evaluation type, probability distribution, degree of freedom, and sensitivity coefficient of each uncertainty component
- Detailed uncertainty budget for junction voltage including values, evaluation type, probability distribution, degree of freedom, and sensitivity coefficient of each uncertainty component
In the uncertainty budgets of the technical report, the participant should state whether and how an uncertainty component is artefact-dependent.
The pilot requests the participants to explicitly include the following uncertainty components in the uncertainty budgets to analyze the critical contributions:
- Component due to axis alignment. Note that the sensitivity to both angular (tilting) and translational (centring) misalignment should be separately considered.
7 This corresponds to a solid angle of 0.01 sr with a detector aperture size of 100 mm2. In case, however, that the aperture size of the instrument cannot be 100 mm2, the emitted colour should be measured for a solid angle of 0.01 sr at an appropriate distance, and the uncertainty budget should include components due to the different geometric condition.

APMP supplementary comparison 13
Technical protocol on comparison of LED measurements
- Component due to current feeding accuracy.
- Component due to stray light in the optical bench. Note that the backward emission of the LED scattered from the LED holder/mount can also contribute to the stray light.
- Component due to spectral mismatch correction, when a filter-type illuminance meter is used. Note that the spectral quantities used for spectral mismatch correction can be strongly correlated.
- For junction voltage: component due to position of junction.8
5.2. TOTAL LUMINOUS FLUX (S3B)
The measurement results should be reported to the pilot via email and fax by using the form APPENDIX 3: RESULT REPORT OF TOTAL LUMINOUS FLUX (S3B) immediately after the measurement is finished.
In addition to the result report, the participant is requested to provide the pilot a technical report containing the information listed in the following. This free-form report should be sent to the pilot via email as a Microsoft Word file within one month after the completion of measurement.
- Measurement setup and instruments used
- Mounting and alignment method, including a picture of the LED holder
- Traceability of measurement
- Detailed uncertainty budget for total luminous flux including values, evaluation type, probability distribution, degree of freedom, and sensitivity coefficient of each uncertainty component
- Detailed uncertainty budget for junction voltage including values, evaluation type, probability distribution, degree of freedom, and sensitivity coefficient of each uncertainty component
In the uncertainty budgets of the technical report, the participant should state whether and how an uncertainty component is artefact-dependent.
The pilot requests the participants to explicitly include the following uncertainty components in the uncertainty budget to analyze the critical contributions:
- Component due to near-field absorption of backward emission
- Component due to current feeding accuracy.
- Component due to stray light, when a goniophotometer is used.
- Component due to spectral mismatch correction, when a filter-type illuminance meter is used. Note that the spectral quantities used for spectral mismatch correction can be strongly correlated.
- Component due to spatial correction, when an integrating sphere is used.
- For junction voltage: component due to position of junction.
5.3. EMITTED COLOUR (S3C)
The measurement results should be reported to the pilot via email and fax by using the form APPENDIX 4: RESULT REPORT OF EMITTED COLOUR (S3C) immediately after the measurement is finished.
8 That means an uncertainty component due to the different distance from the LED junction to the voltage measurement point.

APMP supplementary comparison 14
Technical protocol on comparison of LED measurements
In addition to the result report, the participant is requested to provide the pilot a technical report containing the information listed in the following. This free-form report should be sent to the pilot via email as a Microsoft Word file within one month after the completion of measurement.
- Measurement setup and instruments used
- Traceability of measurement
- Detailed uncertainty budget for chromacitycoordinates including values, evaluation type, probability distribution, degree of freedom, and sensitivity coefficient of each uncertainty component
- Detailed uncertainty budget for junction voltage including values, evaluation type, probability distribution, degree of freedom, and sensitivity coefficient of each uncertainty component
In the uncertainty budgets of the technical report, the participant should state whether and how an uncertainty component is artefact-dependent.
The pilot requests the participants to explicitly include the following uncertainty components in the uncertainty budget to analyze the critical contributions:
- Component due to axis alignment. Note that the sensitivity to both angular (tilting) and translational (centring) misalignment should be separately considered.
- Component due to current feeding accuracy.
- Component in calculating the chromaticity coordinate from the measured spectral distribution. Note that the spectral quantities used for calculation can be strongly correlated.
- For junction voltage: component due to position of junction.
6. PREPARATION OF COMPARISON REPORT
After the measurement schedule of every participant is completed, the pilot prepares the report of the comparisons according to the guidelines by CCPR.9
Since three comparisons are performed together by using one artefact LED set, three reports are to be separately prepared.
Before starting the Pre-Draft A process, the pilot will re-confirm its reception of the artefact sets, the measurement results, and the technical reports from every participant. If any result or report is missing until this time, the pilot will announce a deadline for re-submission. After this deadline, the pilot proceeds the report preparation only with the data submitted so far.
9 Guidelines for CCPR Comparison Report Preparation, Rev. 1 of March 2006. Available at http://www.bipm.org/utils/en/pdf/ccpr_guidelines.pdf

APMP supplementary comparison 15
Technical protocol on comparison of LED measurements
APPENDIX 1: INSPECTION REPORT ON RECEIPT OF ARTEFACTS
Has the artefact set package been opened during transit? (e.g. by Customs) …… Y / N
If Yes, please give details.
Is there any damage to the package box? …… Y / N
If Yes, please give details.
Are the 14 artefact LEDs inside the package box complete and properly fixed into the conductive
matting? …… Y / N
If No, please give details.
Are there any visible signs of damage to the artefact LEDs? …… Y / N
If Yes, please give details (e.g. scratches or contaminations on the lamp, bending of wires, etc).
Is the LED identification sheet prepared by the pilot found in the package? …… Y / N
Laboratory: ………………………………………………………………………………………………
Date: …………………………………………… Signature: ………………………………..……

APPENDIX 2: RESULT REPORT OF AVERAGED LED INTENSITY (S3A)
Artefact set number:
Measurement dates: from to
Laboratory condition: temperature ( ± ) ºC , relative humidity ( ± ) %
LED
measurement value of
averaged LED intensity (cd)
expanded uncertainty* of averaged LED intensity (cd)
measurement value of
junction voltage (V)
expanded uncertainty* of junction voltage
(V)
total burning time (min)
R-1
R-2
R-3
G-1
G-2
G-3
B-1
B-2
B-3
W-1
W-2
W-3
D-1
D-2
* estimated for a 95 % confidence level (normally with a coverage factor k = 2)
Laboratory: ………………………………………………………………………………………………
Date: …………………………………………… Signature: ………………………………..……

APPENDIX 3: RESULT REPORT OF TOTAL LUMINOUS FLUX (S3B)
Artefact set number:
Measurement dates: from to
Laboratory condition: temperature ( ± ) ºC , relative humidity ( ± ) %
LED
measurement value of total luminous flux
(lm)
expanded uncertainty* of total luminous
flux (lm)
measurement value of
junction voltage (V)
expanded uncertainty* of junction voltage
(V)
total burning time (min)
R-1
R-2
R-3
G-1
G-2
G-3
B-1
B-2
B-3
W-1
W-2
W-3
* estimated for a 95 % confidence level (normally with a coverage factor k = 2)
Laboratory: ………………………………………………………………………………………………
Date: …………………………………………… Signature: ………………………………..……

APPENDIX 4: RESULT REPORT OF EMITTED COLOUR (S3C)
Artefact set number:
Measurement dates: from to
Laboratory condition: temperature ( ± ) ºC , relative humidity ( ± ) %
measurement value of chromaticity
coordinate
expanded uncertainty* of
chromaticity coordinate LED
x y x y
measurement value of
junction voltage (V)
expanded uncertainty* of junction voltage (V)
total burning
time (min)
R-1
R-2
R-3
G-1
G-2
G-3
B-1
B-2
B-3
W-1
W-2
W-3
D-1
D-2
* estimated for a 95 % confidence level (normally with a coverage factor k = 2)
Laboratory: ………………………………………………………………………………………………
Date: …………………………………………… Signature: ………………………………..……

Summary of Comments in Review of Relative Data
VSL
Mail on Dec 14, 2009
Looking to the data of VSL we see a big instability for some of the LEDs. Can you tell me how
you are going to deal with this and what the effect will be for the KCRV values or final
presentation of the results?
Response of KRISS on Dec 22, 2009
I think the stability for the LEDs used for VSL is not so bad (all below 1 % drift). I propose to
average the LEDs of the same type (three of red, three of green, etc.) and take the instability as an
uncertainty component of the difference from the reference value. (There will be no KCRV and
DoE because these are supplementary comparisons.)
Of course, we will exclude particular LEDs which show bad stability based on the opinion and
agreement of the participant.
Mail on March 17, 2010
Looking to the remarks of the temperature correction data we are wondering if the inconsistence
for some of the data has to do with the measurement of the junction voltage. As I can remember
there was a relative large variation in voltage over the legs of the LEDs. So in some cases
depending on the position of the junction measurement this can affect the correction for
temperature. Of course one needs to take this variation into the uncertainty for the voltage
measurement at the junction but maybe some of the inconsistencies can be explained looking to
the uncertainty for junction measurements versus temperature correction and the variation of
junction voltage over the legs of the LEDs.
Response of KRISS on March 24, 2010
It is true that there is a change of junction voltage when the measurement position of the LED
electrodes changes. We have noticed this at the stage of the artefact preparation, and therefore
arranged that this variation due to the junction position should be checked and reported by each
participant as an uncertainty component of junction voltage.
Because we have all the sensitivity data of photometric quantity to junction voltage for each
artefact LED, we can analyze the inconsistency caused by the inaccurate measurement of junction
voltage. We will surely include this in the result report. From our experience, however, the
uncertainty of photometric quantities propagated from the uncertainty of junction voltage
measurement, including the junction position variation, was much lower than 0.5 %, which is the
principal accuracy limit of the temperature correction method via junction voltage.
METAS
Mail on Dec 15, 2009
I have no special observation.
Mail on Feb 10, 2010

I have no special comments in respect to our relative data except that applying the temperature
correction will increase non-consistency of our data. I’ve done this analysis for all participants (see
enclosed excel-file) and it is interesting to see that only for few laboratories the consistency
increases.
Response of KRISS on Feb 12, 2010
You showed that the consistency decreases after the temperature correction, i.e. the standard
deviation of all the relative data for a participant increases. I think this is reasonable because the
process of temperature correction contains also the uncertainty, which is the limitation of the
theoretical model for temperature correction via junction voltage. We estimate this uncertainty to
be less than 0.5 % (see our publication in Metrologia, 43, 299, 2006). Therefore, we expect that
the application of temperature correction unavoidably causes a slight decrease of the consistency
of the relative data. Based on your calculation, the standard deviations of the relative data lie, for
most of the participants, between 0.5 % and 1 % without temperature correction, but the
(absolute) change of them due to temperature correction remains much below 0.5 %. From this,
we can confirm the accuracy of the temperature correction method.
In addition, we could also see the validity of temperature correction in the change of the absolute
data (not published yet) that the consistency between the pilot and the participants clearly
increases after temperature correction.
MKEH
Mail on Jan 20, 2010
After the overview of the MKEH relative data of the comparisons APMP-S3a (averaged LED
intensity) we have two remarks:
The LED G1, which was strongly different, died after the MKEH measurement. So this diode does
not have remeasured value. It might be damaged before the MKEH measurement. We ask for
remove the data of this diode.
The LED B3, which was different as well, died after the MKEH measurement. So this diode does
not have remeasured value. It might be damaged before the MKEH measurement as well. We ask
for remove the data of this diode.
Mail on Feb 17, 2010
We accept the data you have sent. (with respect to S3c)
MIKES
Mail on Jan 21, 2010
Could we remove the W-1 LED from the both comparisons?
NIST
Mail on Jan 29, 2010
We think that the LED set measured by NIST was not so bad if KRISS' measurement results for R1

and R2 were reliable. So we want to confirm that the differences (shown in your relative data)
between the measurement results of R1 and R2 are acceptable to us.
NMIJ
Mail on Dec 28, 2009 (not delivered in time)
By the way, it is the matter of review of relative data, in order to estimate whether it is drift of
LEDs, I would like to know the information of total burning time of our artifact(set #4) including
measurement burning time in KRISS.
I know the burning time in our measurement, but I don't know it in KRISS.
In addition, I would like to know about the seasoning result of our artifact.
Unless KRISS clarifies these information, it is very difficult to judge against our result of relative
data whether it is a drift of LEDs or some issue.
Mail on Feb 19, 2010
I would like to request to remove the result of B-1, B-3, W-1 from our APMP.PR-S3a results. In
addition, I would like also to request to remove the result of W-1 from our APMP.PR-S3b results.
Because, I think that the change of those LED result is large.
ASTAR
Mail on Feb 23, 2010
Thanks for the relative data. We have reviewed the data. The data looks in order and we have not
further comments for the relative data of all three comparisons.

Summary of Comments in Review of Uncertainty Budgets
Part 1. General Comments and Revisions
INM (Romania)
Mail on April 02, 2010
As far as the INM reports are concerned, the uncertainty budgets for Green, Blue, White and
Diffuse LEDs were not included in the APMP PR S 3a and APMP PR S3b reports just because they
are very close to our uncertainty budgets for the Red LEDs so we thought not necessary to repeat
the almost exactly same figures. But do you think this is necessary or should we merely mention
this in the reports? Anyway, in order to comply I`ll revise and sent you our reports today, provided
it`s not already too late.
Here attached are our revised reports for APMP PR S3a and APMP PR S3b comparisons, incliding
the uncertainty budgets for all tipes of LEDs.
Please notice that changes only concerned the spectral correction factors for the various LEDs and
while the combined standard uncertainties were of about 5.5 %, the various spectral correction
factors induced quite small changes (less than +/- 0,5 %) in the combined uncertainties values.
That`s why, initially we only reported the uncertainty budgets for the red LEDs.
Response of KRISS on April 12, 2010
I have properly received your two documents including the uncertainty budgets for all color-types
of LEDs. The formats you sent me are ok.
Because your revision deals only with an addition of information, I see no problem to accept your
revision for the report. I will wait for a while for other revisions or corrections, and distribute the
revised files then.
METAS
Mail on April 15, 2010
Please find enclosed an update of our description of the uncertainty budget of the chromaticity
coordinates. I’m sorry to have it sent after your deadline. In the updated version I stated explicitly
uncertainty budgets for the 4 types of LEDs. It’s just to give more information, no value has been
changed.
I also would like to recall our worries in respect to the correlation of chromaticity coordinates (see
the attached file).
APMP.PR-S3 Correlation of chro

Response of KRISS on April 15, 2010
I have received your files well. I will revise the uncertainty review document for S3c and distribute
it again. (But I will wait for a while to collect the revisions also from other participants.)
I think that your suggestion of reporting the correlation can be discussed open. Do you agree to
forward your document directly to all the participants to ask for their opinions?
A*STAR
Mail on June 21, 2010
We found not error in the three files containing technical information and uncertainty budgets.
However we added a paragraph in section 10.3 (in red colour text) of the “uncertainty
budgets_S3b” to mention the absorption correction in integrating sphere calibration and
measurement. The modified file is attached.
All Participants (open discussion)
Mail from KRISS on May 10, 2010
I have a comment which is sent from METAS to all the participants. Peter agreed to discuss this
issue openly.
This deals with a suggestion that, for the uncertainty budgets of chromaticity coordinates (x, y) for
APMP-S3c, the correlation between u(x) and u(y) should be considered by submitting the
correlation coefficient u(x,y)/u(x)u(y). Please see also the attached letter from Peter.
I personally think that it is meaningful to compare also the correlation coefficients among the
participants. However, it may be difficult at this stage to make the report of the correlation
mandatory because we did not mention this in the technical protocol. What we can do instead is
to encourage the participants to voluntarily report the correlation analysis as far as possible. If we
have many volunteers, we can include this part in the comparison report. If we have only a few
participants reporting the correlation, we can prepare this issue to an extra publication.
I would like to ask first who can submit the results of the correlation coefficients for the
chromaticity coordinates as supplementary to the uncertainty budget report. (METAS surely, and
KRISS can also do it.)
Mail from PTB on May 12, 2010
Correlation (x,y): If needed we can add the correlation of (x,y). Please let us know what is the
decision.

Mail from A*STAR on June 21, 2010
Regarding the issue our response is that we cannot submit the correlation coefficients for the uncertainty of the chromaticity coordinates.
Communication from KRISS on June 21, 2010
Typical values of correlation coefficient r(x,y) = u(x,y)/u(x)u(y) are -0.69 for RED, +0.41 for GREEN, -
0.86 for BLUE, and +0.96 for WHITE. The values do not change much as the artifact set changes.

Part 2. Questions and Answers
KRISS
Question to KRISS on May 10, 2010
-S3a average LED intensity
What are the uncertainty of the axis alignment (angular, translational) and distance: expressed in °
and mm?
-S3c, chromaticity coordinates, red LED
For the red LED the main contribution of the uncertainty is given by the spectral straylight. Has
the data been corrected for straylight? Why the contribution for red is much large then for the
others (red x: 0.00148, blue x: 0.00032) and why x and y are so different (usually there is full
correlation for the chromaticity coordinates for red LEDs).
-S3c, chromaticity coordinates, wavelength
For the other LED’s the main contribution of the uncertainty is given by the wavelength accuracy.
It would be useful to know the absolute uncertainty of the wavelength scale (expressed in nm).
Have there been some spectral correlations taking to account in the analysis?
Answers from KRISS on June 21, 2010 -S3a average LED intensity What are the uncertainty of the axis alignment (angular, translational) and distance: expressed in ° and mm? Response: The standard uncertainty of angular axis alignment, translation axis alignment, and distance setting is 0.82°, 0.41 mm and 0.25 mm, respectively. For translational axis alignment, the uncertainty contribution has been revised such as 0.2 % for red (Other else remain the same). -S3c, chromaticity coordinates, red LED For the red LED the main contribution of the uncertainty is given by the spectral stray light. Has the data been corrected for stray light? Why the contribution for red is much large then for the others (red x: 0.00148, blue x: 0.00032) and why x and y are so different (usually there is full correlation for the chromaticity coordinates for red LEDs). Response: The spectral stray light of spectral data is not corrected. We estimated the spectral stray light as an uncertainty based on the spectrograph response under He-Ne laser illumination. Most of stray light readout is distributed around the laser wavelength except the in-band region, which means that the spectral stray light has a similar spectral distribution with the input illumination. Thus, the contribution of the stray spectrum on chromaticity is more or less proportional to that of the input illumination. While the stray spectrum gives more contribution to x in case of a red LED, the stray spectrum of a green LED and a blue LED give more contribution to y and z, respectively. In our calculation, the correlation coefficient r(x, y) of a red LED turned out to -0.69. -S3c, chromaticity coordinates, wavelength For the other LED’s the main contribution of the uncertainty is given by the wavelength accuracy. It would be useful to know the absolute uncertainty of the wavelength scale (expressed in nm). Have there been some spectral correlations taking to account in the analysis? Response: The standard uncertainty of wavelength scale is (0.45 ~ 0.48) nm depending on wavelength. Of the uncertainty,

0.2 nm is a global wavelength offset, which mainly contributes on the chromaticity uncertainty. The spectral correlations are taken account in.
MIKES
Question to MIKES on May 10, 2010
-S3a average LED intensity
The uncertainty is by far dominated by the repeatability of the measurement. What is the origin of
this? Were measurement noisy? In the case of the diffuse type LED this contribution is smaller
than for the other type. Is it related to the geometry of the source? Is it really repeatability and
not reproducibility (i.e. were the LED realigned?)?
-S3b, luminous flux
The most important contribution (expect for the blue LED) originates from the near field
absorption (1%, with rectangular distribution!). How this value has been determined?
-S3c, chromaticity coordinates, white LED, angular alignment
The uncertainties of the chromaticity coordinates of the white LED are much higher than the other
coloured LEDs (except to the one with diffuser). The main contribution seems to be originated for
the angular alignment, although the sensitivity coefficient of that quantity seems to be the similar.
What is the origin of this?
-S3c, chromaticity coordinates, green LED
The uncertainty of the green LED with diffuser is dominated by the noise. How this contribution
has been determined as it as of Type B with rectangular probability? Usually noise contributions
are included in the repeatability of the measurement (Type A).
Answers from MIKES on May 31, 2010 > /-S3a average LED intensity / > > The uncertainty is by far dominated by the repeatability of the > measurement. What is the origin of this? Were measurement noisy? In > the case of the diffuse type LED this contribution is smaller than for > the other type. Is it related to the geometry of the source? Is it > really repeatability and not reproducibility (i.e. were the LED > realigned?)? > Answer: The uncertainty of repeatability originates mainly from the alignment accuracy of the measurement setup, i.e. the realignment of the LED before each repeat measurement. For the diffuser type of LEDs, the uncertainty due to the alignment was not found as sensitive as for the other type of LEDs. This could be partly explained by the optical properties of the measured LEDs. The LEDs without diffusing output may have nonuniform structure in the light output. > > /-S3b, luminous flux/ > > The most important contribution (expect for the blue LED) originates

> from the near field absorption (1%, with rectangular distribution!). > How this value has been determined? > Answer: The uncertainty of the near field absorption (type B) was estimated by considering the geometry and materials used in the LED holder and the amount of light emitted backward by the measured LEDs. > /-S3c, chromaticity coordinates, white LED, angular alignment/ > > The uncertainties of the chromaticity coordinates of the white LED are > much higher than the other coloured LEDs (except to the one with > diffuser). The main contribution seems to be originated for the > angular alignment, although the sensitivity coefficient of that > quantity seems to be the similar. What is the origin of this? > Answer: In the case of white LEDs, the spectral output may change as a function of angle of observation due to the phosphor coating. Therefore they are more sensitive to the alignment than the other type of LEDs. > /-S3c, chromaticity coordinates, green LED/ > > The uncertainty of the green LED with diffuser is dominated by the > noise. How this contribution has been determined as it as of Type B > with rectangular probability? Usually noise contributions are included > in the repeatability of the measurement (Type A). > Answer: The uncertainty of the diffuser type of LED was obtained by calculating the color coordinates for the original measurement data and for another data, in which the noise of the low signal values was replaced with extrapolated modelled values of the measured LED spectrum.
CMS-ITRI
Question to CMS-ITRI on May 10, 2010
-S3a average LED intensity, LED spatial light distribution
Why the quantity “LED spatial light distribution” is the same for all type of LEDs even the spatial
distribution is very different for the different LEDs (in particular the one with diffuser to the one
without diffuser)
-S3a average LED intensity, red LED,
The uncertainty of the spectral mismatch correction seems to be exceptionally small for the red
LED in respect to the other colours. What is the f1’ of the photometer?
-S3c, chromaticity coordinates, red LED
The uncertainty of the “x” - chromaticity coordinate of the red LED is dominated by two
contributions (repeatability :0.0015 and mechanical alignment: 0.0014). Why the combined
uncertainty is only 0.0014?
-S3c, chromaticity coordinates, mechanical alignment

why the uncertainty contribution due to mechanical alignment is the same for all type of LEDs? Is
there an evidence that a misalignment causes the same amount of shift in colour coordinates?
-S3c, chromaticity coordinates, green LED and green LED with diffusor
why the contribution of the wavelength shift of the green LED with diffusor is much higher than
the green LED without diffuser (more than 20x), the spectral distribution of both type of LEDs
being very similar?
PTB
Question to PTB on May 10, 2010
-S3a average LED intensity
It would be interesting to know the area of the sensitive surface of the photometer head, and in
the case that it is different to 100mm2 how that results were corrected.
-S3a average LED intensity, Correction for LED angular align,
Why the uncertainty due to the correction for angular alignment of the blue LED (0.57%) is much
larger than for the other LEDs (green: 0.11%) although the spatial distribution of is very similar?
-S3b, luminous flux, Integrated photocurrent, solid angle weighted
The most important contribution of uncertainty is originated from the quantity “Integrated
photocurrent, solid angle weighted”. It would be useful to have further information about this
quantity (i.e. eventl. citation). How it has been determined?
-S3c, chromaticity coordinates, red LED
The uncertainty of the chromaticity coordinates of the red LED is mainly given by the spectral
bandpass correction and the straylight correction of the spectrometer. There is however no
information about the amount of correction that has been applied and the spectrometer used for
the measurement(bandpass, wavelength accuracy, level of straylight,…)
-There is no information about the uncertainty contributions (input quantities and their
uncertainties) used in the Monte Carlo simulation.
Answers from PTB on May 12, 2010 Here are the answers of PTB concerning some questions of a participant: -S3a average LED intensity It would be interesting to know the area of the sensitive surface of the photometer head, and in the case that it is different to 100mm2 how that results were corrected. PTB: According to CIE Pub. 127 in all cases (S3a, S3b and S3c) the sensitive area of photometers or spectrometer input optics were 100 mm2. So no corrections for a different sensitive area were applied.

-S3a average LED intensity, Correction for LED angular align, Why the uncertainty due to the correction for angular alignment of the blue LED (0.57%) is much larger than for the other LEDs (green: 0.11%) although the spatial distribution of is very similar? PTB: From goniophotometric luminous flux measurements we know the spatial distribution of all LEDs. Especially the spatial distribution of green and blue LEDs are not similar in the interesting range of approx. 0° < ϑ < 2.5° ! Please, see figures below (on the left: example of green LED, on the right: example of blue LED). We describe the spatial distribution with cos[ϑ]g. In case of the green LED we found g=8.9 and in case of the blue LED we found g=39. Please, compare blue plots.
Now we are able the estimate the uncertainty contribution of angular alignment and translational alignment of the LED for luminous intensity measurements by help of a mathematical simulation. The figure below on the left shows a LED aligned in front of a photometer. The angular and aerial responsivity oft he photometer is simulated by a number of hexagons. For our estimations we used a larger number of smaller hexagons (see figure on the right). Based on the knowledge of uncertainty for angular alignment and translational alignment we are able to calculate the estimated uncertainty contributions.
Total area = 100 mm2
5
10
15
20
2530
3540
4550
5560
6570758085
0.2 0.4 0.6 0.8 1.0
0.2
0.4
0.6
0.8
1.0
LEDG101.evk, redmeasured datablueFit Cosg with g8.92036, dashedCos
5
10
15
20
25
30
3540
4550
5560
6570758085
0.2 0.4 0.6 0.8 1.0
0.2
0.4
0.6
0.8
1.0
LEDB101.evk, redmeasured datablueFit Cosg with g39.0866, dashedCos

-S3b, luminous flux, Integrated photocurrent, solid angle weighted The most important contribution of uncertainty is originated from the quantity “Integrated photocurrent, solid angle weighted”. It would be useful to have further information about this quantity (i.e. eventl. citation). How it has been determined? PTB: The figure below on the left shows the goniophotometric measurement of the LEDs in principle. The averaged zonal illuminance is derived from the measured averaged zonal photocurrent ( )ϑj . The figure on the right shows it as a function of the angle ϑ .
Since the determination of this averaged zonal photocurrent is a complex system which consists of several dc motor drives, a current/voltage converter and a digital voltmeter a correction factor czone
was introduced. The averaged value of czone = 1, but to consider the uncertainty caused by an
unsharp start and stop angle ( EndStart ϕϕ , ) it is necessary and defined as follows :
πϕϕ
2EndStart
zonec −=
Now we can start the MC-simulation: Repeat the following with normal distributed varied KVVEndStart j,,, ϑϕϕ
( ) ( ) ( ) ϑϑϑϑϑπ
ϑ
d1Sin0
zone ⋅+⋅+⋅+⋅= ∫=
KVVV jjcX
and in principle from X you will get the so called “Integrated photocurrent, solid angle weighted”
( )Xj Mean=Φ with ( ) ( )XU j viationStandardde=Φ .
-S3c, chromaticity coordinates, red LED The uncertainty of the chromaticity coordinates of the red LED is mainly given by the spectral bandpass correction and the straylight correction of the spectrometer. There is however no information about the amount of correction that has been applied and the spectrometer used for the measurement(bandpass, wavelength accuracy, level of straylight,…) -There is no information about the uncertainty contributions (input quantities and their uncertainties) used in the Monte Carlo simulation.
0.5 1.0 1.5 2.0 2.5 3.0Radian
2.107
4.107
6.107
8.107
Photocurrent AMeasured averaged zonal photocurrent as function of zone angle

PTB: As you can see in our uncertainty budgets the correction values of bandpass and spectrometer straylight is always 0. That means no correction was applied. But we estimated the uncertainty contributions by help of some MC simulations. The following figure shows an example result of a similar simulation.
Varied input parameters of the simulation were mainly spectrometer response data during measurement the LED and the halogen lamp used for sensitive calibration with an uncertainty of their spectral irradiance expressed as an uncertainty of the distribution temperature of a planckian radiator (approx. 10 K), an estimated straylight correction matrix (similar to the figure below, which is the real strayight correction matrix of the used array spectrometer from knowledge we have today ), an assumed triangle-shaped bandpass (halfwidth approx. 3nm ), the function between channel-no and wavelengths with a wavelength uncertainty of approx. 0.8nm, etc.
NMIJ
Question to NMIJ on May 10, 2010
0.6998 0.7002 0.7004 0.7006x
0.2988
0.2992
0.2994
0.2996
y
500 500
1000 1000

-S3a average LED intensity, illuminance responsivity
It is very unusual to see a rectangular probability function for the uncertainty of the illuminance
responsivity. Usually this value is either taken from a calibration certificate or determined by
another measurement (traceable to the radiometric scale). In both cases the distribution is
typically Gaussian type. Furthermore the uncertainty seems to be rather large (much larger than
declared CMC values in the KCDB with k=2…).
-S3b, luminous flux, Angular resolution, etc.
Why the contribution of the quantity called « angular resolution, etc » is much larger for the red
LED than for the others (red: 0.91%, green: 0.28%) even if the angular distribution of the LEDs are
very similar (the green LED is even narrower than the red)?
-S3c, chromaticity coordinates, red LED
It would be useful to report in the uncertainty budget of the chromaticity coordinates of the red
LED one additional digit (in the column “contribution”). The GUM recommands to report
uncertainty with two significant digit.
Answers from NMIJ on June 02, 2010
I am submitting two file (Reply to Question and Revised verification report).
Revised points in verification file are edited the Word files with red characters. New verification
report is revised according to the comment (Uncertainty Component name, Deg. of freedom, add
to new figure etc,).
But, there is no modify of the combined standard uncertainty .
Q1:-S3a average LED intensity, illuminance responsivity
It is very unusual to see a rectangular probability function for the uncertainty of the illuminance
responsivity. Usually this value is either taken from a calibration certificate or determined by
another measurement (traceable to the radiometric scale). In both cases the distribution is
typically Gaussian type. Furthermore the uncertainty seems to be rather large (much larger than
declared CMC values in the KCDB with k=2…).
Re1:
Thank you for good advice. I made a mistake about probability function of illuminance
responsivity. I would like to correct about probability function and freedom of it.
Next, I would like to explain about uncertainty of illuminance responsivity. In order to consider a
near-field effects which CIE 127:2007 (5.4 P17) described, illuminance responsivity of our
photometer for LED measurement is calibrated by luminous intensity standard lamp at far-field
condition, and then it is calibrated by an integrating sphere source(operated at 2856K) at the
distance corresponding to CIE condition B. Our uncertainties of illuminance responsivity include

uncertainty of near-filed effect. Therefore it becomes larger than uncertainty of CMC.
Q1:-S3b, luminous flux, Angular resolution, etc.
Why the contribution of the quantity called ≪ angular resolution, etc ≫is much larger for the
red LED than for the others (red: 0.91%, green: 0.28%) even if the angular distribution of the LEDs
are very similar (the green LED is even narrower than the red)?
Re2:
Firstly, I would like to change the contribution of the quantity's name from "angular resolution,
etc" to "measurement angle step and angular resolution". I send the modified uncertainty budget.
Sorry, my expressions confuse.
Fig1 indicate an angular distribution of red and green LED. The angular distributions of red LED
is not smoother than it of green LED .I think the angular distribution of the red LED is not the
same as others. Red LED have an irregular angular distribution. For this reasons, the uncertainty of
"measurement step and angular resolution" on red LED became larger than green LED in our
budget.
Fig1: angular distribution
Q3:-S3c, chromaticity coordinates, red LED
It would be useful to report in the uncertainty budget of the chromaticity coordinates of the red
LED one additional digit (in the column "contribution”). The GUM recommends reporting
uncertainty with two significant digits.
A3:
Thank you for good advice. I send the modified uncertainty budget. I add one additional digit to
uncertainty values of contribution, but the combined standard uncertainty isn't changed.
CENAM
Question to CENAM on May 10, 2010

-S3a, average LED intensity, Spectral mismatch correction
Why the uncertainty of the spectral mismatch correction is almost constant for all type of LED’s?
Usually the uncertainty is much lower for white LEDs than for blue LEDs?
-S3b, luminous flux, Standard lamps spectral mismatch correction
The quantity “Standard lamps spectral mismatch correction” seems to be rather large. What kind
of standard lamps was used (usually incandescent lamps are used which are not too far from CIE
illuminant A)? What is the f1’ value of the photometer? What is the estimated relative spectral
throughput of the sphere (i.e. how “flat” is the painting)?
-S3c, chromaticity coordinates
What is the quantity “Propagation from spectral distribution measurement”? Why is it constant for
all colours (15.66% , 13.96%) and why the sensitivity coefficient so small 0.00002 (% per %?) and
constant?
-S3c, chromaticity coordinates
uncertainty of chromaticity coordinates are usually reported as absolute value as chromaticity
coordinates are highly non-linear quantities.
-S3c, chromaticity coordinates, red LED
in the case of the red LED the absolute uncertainty are as following: ux= 0.006 and uy=0.0006
(hence a factor of 10 between both coordinates). Is there are an explication for this behavior?
Usually the chromaticity of red LED are fully (negative) correlated resulting in similar uncertainties
in x an y?
Answers from CENAM on May 20, 2010
Please find below the answers to the questions done for CENAM. -S3a, average LED intensity, Spectral mismatch correction
Why the uncertainty of the spectral mismatch correction is almost constant for all type of LED’s?
Usually the uncertainty is much lower for white LEDs than for blue LEDs?
RE: Unfortunately the resolution of the spectrorradiometer we used to measure the LEDs spectra was very bad; thus causing this component to be dominant over the other, and making the spectral mismatch uncertainties to look almost constant.
-S3b, luminous flux, Standard lamps spectral mismatch correction
The quantity “Standard lamps spectral mismatch correction” seems to be rather large. What kind
of standard lamps was used (usually incandescent lamps are used which are not too far from CIE
illuminant A)? What is the f1’ value of the photometer? What is the estimated relative spectral

throughput of the sphere (i.e. how “flat” is the painting)?
RE: Unfortunately the resolution of the spectrorradiometer we used to measure the spectra was very bad; thus causing this spectral mismatch corrections to be very large. We used incandescent lamps operated as CIE Standard illuminant A. The f1=13,36. The estimated relative spectral throughput of the sphere is fairly plain.
-S3c, chromaticity coordinates
What is the quantity “Propagation from spectral distribution measurement”? Why is it constant for
all colours (15.66% , 13.96%) and why the sensitivity coefficient so small 0.00002 (% per %?) and
constant?
RE: We call “Propagation from spectral distribution measurement” to the uncertainty component due to the calculation method from the spectral irradiance lectures. This is constant because we used the average value obtained from the standard lamps used. This also produced such a sensitivity coefficient values, and almost constants.
-S3c, chromaticity coordinates
uncertainty of chromaticity coordinates are usually reported as absolute value as chromaticity
coordinates are highly non-linear quantities.
RE: We reported our final results for those values as absolute to the pilot laboratory; however, according to the final report format, we were requested to report those as relative, and we did it as well.
-S3c, chromaticity coordinates, red LED
in the case of the red LED the absolute uncertainty are as following: ux= 0.006 and uy=0.0006
(hence a factor of 10 between both coordinates). Is there are an explication for this behavior?
Usually the chromaticity of red LED are fully (negative) correlated resulting in similar uncertainties
in x an y?
RE: We do not find such a values as they are mentioned. We have double-checked the results we send to the pilot laboratory; as well as those the pilot laboratory sent back for revision; and we found they are ok, within the same magnitude order. Would you please let us know where you found those?
LNE
Question to LNE on May 10, 2010
-S3c, chromaticity coordinates
uncertainty of chromaticity coordinates are usually reported as absolute value as chromaticity
coordinates are highly non-linear quantities.

NMC-A*STAR
Question to A*STAR on May 10, 2010
-S3b, luminous flux,
A*STAR has not used an auxiliary lamp for compensating changes of the integration properties of
the sphere resulting in the different configuration between the LED measurement and the sphere
calibration. Has this influence being estimated?
-S3c, chromaticity coordinates
uncertainty of chromaticity coordinates are usually reported as absolute value as chromaticity
coordinates are highly non-linear quantities.
Answers from A*STAR on June 21, 2010
Question for: -S3b, luminous flux, A*STAR has not used an auxiliary lamp for compensating changes of the integration properties of the sphere resulting in the different configuration between the LED measurement and the sphere calibration. Has this influence being estimated? Reply: The one-meter integrating sphere that we used for LED flux measurement do have a tungsten auxiliary lamp. The absorption corrections were carried out over the whole wavelength range of 380 nm to 780 nm in 1 nm interval for both the LED measurement and the sphere calibration. An additional paragraph explaining this is added in section 10.3 of the uncertainty budgets_S3b. Please refer to the revised file attached. (Dong-Hoon, the revised file is actually attached in my last email to you so I didn’t repeat here) Question for: -S3c, chromaticity coordinates uncertainty of chromaticity coordinates are usually reported as absolute value as chromaticity coordinates are highly non-linear quantities. Reply: The uncertainty of chromaticity coordinates that we reported for the -S3c results are indeed in absolute values.
VSL
Question to VSL on May 10, 2010
-S3a, average LED intensity
What is the quantity “Non-uniformity of source”? Is this due to the non-coincidence of the optical
and mechanical axis? In Figure 11-6 of the report a measurement of the illuminance in function of
different (azimuthal) angles is shown. It is written that this is due to the non-coincidence of the
mechanical axis and the optical axis. However we believe that it is to a misalignment of the
photometer in respect to the rotation axis as illustrated below.

-S3b, luminous flux, Near-field absorption of backward emission
The most important contribution to uncertainty is the quantity “Near-field absorption of backward
emission”. Has the flux also being corrected with this quantity, if yes what was the estimated ratio
from the backwards flux to the total flux?
-S3b, luminous flux
The goniophotometrical measurements were done at an angular increment of 5° (polar angle).
Has the uncertainty due to this rather large increment been estimated (The half angle of the
green LED is only 22°)?
Answers from VSL on May 10, 2010 -S3a, average LED intensity What is the quantity “Non-uniformity of source”? Is this due to the non-coincidence of the optical and mechanical axis? In Figure 11-6 of the report a measurement of the illuminance in function of different (azimuthal) angles is shown. It is written that this is due to the non-coincidence of the mechanical axis and the optical axis. However we believe that it is to a misalignment of the photometer in respect to the rotation axis as illustrated below. Answer VSL As the reference axis for alignment is not defined in the protocol, one needs to make a choice which axis is used for alignment (optical or mechanical). From our research we believe that the mechanical axis for alignment is the best choice for comparability of the measurement results. When using the mechanical axis as a reference axis you will need to check what this means with respect to the azimuthal angle direction in respect to the uncertainty. As measurements show (figure 11-6 of the report) one needs to take the non-coincidence of the mechanical and optical axis into account, again: if you are using the mechanical axis as reference. Please notice that when you align on optical axis you will introduce an angular shift between the optical axis of your LED and the rotation axis of your goniometer. This will also introduce an uncertainty. -S3b, luminous flux, Near-field absorption of backward emission The most important contribution to uncertainty is the quantity “Near-field absorption of backward emission”. Has the flux also being corrected with this quantity, if yes what was the estimated ratio from the backwards flux to the total flux?
Answer VSL The flux has not been corrected for the “Near-field absorption of backward emission”.
-S3b, luminous flux The goniophotometrical measurements were done at an angular increment of 5° (polar angle). Has

the uncertainty due to this rather large increment been estimated (The half angle of the green LED is only 22°)?
Answer VSL As the detector size of our photometer is 10 mm^2 one can calculate the smallest step size that is required to have overlap between the measurement points measuring at a distance of 100 mm. With a step size of 5º we still have an overlap from point to point. Next to this we have taken the green LED and measured ones in steps of 5º and ones in steps of 1º. The results showed that there is a small difference in respect to the total uncertainty between a step of 5º compared to a step size of 1º. We have taken the difference into the uncertainty component for the integration method.
NIST
Question to NIST on May 10, 2010
-S3c, chromaticity coordinates
What is the estimated wavelength uncertainty of the spectrometer measurement (expressed in
nm)? Have there been some spectral correlations taking to account in the analysis?
-S3c, chromaticity coordinates, contributions due to alignment of the LED
Minor comment: It is very unusually that Type A has an infinite number of degree of freedom.
Either the contribution has been determined experimentally and then a statistics is used (Type A
with limited number of degrees of freedom) or a model was used (perhaps also based on
experimental results) to describe the specific input quantity (Type B with infinite number of
degrees of freedom).
MKEH
Question to MKEH on May 10, 2010
-S3a, average LED intensity
Several important contributions are missing: temperature, readout of the photometer (Type A).
Why the calibration accuracy has a rectangular distribution, usually it should be Gaussian
distributed.
-S3c, chromaticity coordinates
Why the uncertainty is stated as a minimum value (>0.0004 and >0.0002). The uncertainty analysis
is used to determine the estimates of the output quantity and its uncertainty (for a given
confidence interval). If only a minimum value is stated either the uncertainty budget is incomplete
or the estimation of some of the contributions are believed to be too small (and should therefore
be adapted).
Answers from MKEH on June 1, 2010
1. In the luminous intensity error budget our main source of error comes from the detector
calibration. We do not have cryogenic radiometer we have Si selfcalibration as an absolute

method. In this case the main source of error is not statistical, but the practical uncertainty of the
method (the internal QE is not measured just believed, based on the literature).
Therefore this is a type B error. All the other participants have cryogenic radiometer……
2. In the color uncertainty budget I have left out data. YOU ARE right…
Revised budget:
source of uncertainty
standard uncertainty
probability distribution
sensitivity coefficient
standard uncertainty in
∆x
standard uncertainty in
∆y spectral
irradiance calibration
1,5% rectangular type B
sample dependent
∆x1 <0,002 0,0003 < ∆x1
∆y1 <0,002 0,0001 < ∆y1
wavelength error 0,1 nm rectangular
type B sample
dependent ∆x2 <0,001
0,00005 < ∆x2 ∆y2 <0,001
0,00005 < ∆y2
linearity 0,05% rectangular type B
sample dependent
∆x3 <0,0005 0,00005 < ∆x3
∆y3 <0,0005 0,00005 < ∆y3
stray light 10-15 – 10-13W rectangular type B
sample dependent
∆x4 <0,0014 0,00005 < ∆x4
∆y4 <0,002 0,00005 < ∆y4
dark noise 2*10-15 W rectangular type B
sample dependent
∆x5 <0,002 0,00003< ∆x5
∆y5 <0,003 0,00001 < ∆y5
room temp. dependence 1 K rectangular
type B sample
dependent ∆x6 <0,00005 ∆y6 <0,00005
light source repeatability as measured normal
type A sample
dependent as calculated as calculated
geometry error rectangular type B
sample dependent as calculated as calculated
combined standard
uncertainty 0,0004 < ∆x
∆x < 0,0026 0,0002 < ∆y ∆y < 0,0032

APMP Supplementary Comparisons of
LED Measurements
APMP.PR-S3a Averaged LED Intensity
APMP.PR-S3b Total Luminous Flux of LEDs
APMP.PR-S3c Emitted Colour of LEDs
Identification of Outliers

1. INTRODUCTION
The relative deviations from the mean value are calculated for each participant and for each type of LEDs and distributed in order to identify the obvious outliers, which can significantly skew the Reference Values of the comparison. Each participant should recommend which data should be removed in the calculation of the Reference Values. The name of the participant is not disclosed in this stage.
The relative deviations from the mean value are obtained as follows:
1. The ratios r1(Xi) and r2(Xi) are calculated for each artefact LED (Xi = R-i, G-i, B-i, or W-i with i = 1, 2 or 3):
1 21 2
( ) ( )( ) ; ( )( ) ( )
L i L ii i
P i P i
y X y Xr X r Xy X y X
= = . (1)
Here, yL(Xi), yP1(Xi), yP2(Xi) denote the measurement result of the participant laboratory, of the pilot laboratory before travel, and of the pilot laboratory after travel, respectively, for the artefact LED Xi.
2. The difference of the ratios corresponding to the artefact drift is calculated for each artefact LED Xi:
2 1( ) ( ) ( )i i id X r X r X= − . (2)
3. The mean value of each type of LEDs is calculated for each type of the artefact LEDs:
,
,
,
,
( ) ( ) ,
( ) ( ) ,
( ) ( ) ,
( ) ( ) .
i j i j
i j i j
i j i j
i j i j
m R Mean r R
m G Mean r G
m B Mean r B
m W Mean r W
=
=
=
=
. (3)
Here, the following data are excluded in the calculation of the mean: firstly, the data which are requested to be removed by the participant in the process of review of relative data, secondly, the data with its drift in Eq. (2) larger than 3 % after the temperature correction.
Note that the mean values of the ratios in Eqs. (3) correspond to the relative deviations of the participant’s data with respect to the pilot’s data.
4. The mean values in Eqs. (3) are normalized to the mean value of the measurement data of all the participants for the same type of the artefact LEDs:
[ ]
[ ]
[ ]
[ ]
( )( ) ,( )
( )( ) ,( )
( )( ) ,( )
( )( ) .( )
Lab xLab x
Lab n n
Lab xLab x
Lab n n
Lab xLab x
Lab n n
Lab xLab x
Lab n n
m RM RMean m R
m GM GMean m G
m BM BMean m B
m WM WMean m W
−−
−
−−
−
−−
−
−−
−
=
=
=
=
(4)
5. The deviations of the mean values in Eqs.(4) from 1 are calculated for each participant and for each type of the artefact LED:

( ) ( ) 1,( ) ( ) 1,( ) ( ) 1,( ) ( ) 1.
Lab x Lab x
Lab x Lab x
Lab x Lab x
Lab x Lab x
R M RG M GB M BW M W
− −
− −
− −
− −
∆ = −∆ = −∆ = −∆ = −
(5)
Note that the deviations in Eq. (5) correspond to the relative deviations of each participant from the mean value over all the participants for each type of the artefact LEDs.
In the case of the LED measurement, the quantity to be measured is a function of junction temperature. Therefore, the junction voltage is simultaneously measured and reported with the comparison quantity. Based on the reported junction voltage data and the characteristic parameters of each artefact LED determined by the pilot laboratory in the preparation stage, the measured comparison quantities can be corrected to one junction voltage.
In the following, the relative deviations in Eqs.(5) of all the participants are listed in a table and plotted for visualization. There are two sets of the data: the first set is based on the submitted measurement data without any correction. The second set is based on the data corrected to one junction voltage as a result of the temperature correction.
In the data table, the relative deviations larger than 6 % are indicated as red, which seem to be the obvious outliers. Note that we have considered here only the result data with an artefact drift much smaller than 3 %.

2. WITHOUT CORRECTION
Lab1 Lab2 Lab3 Lab4 Lab5 Lab6 Lab7
R 2.08% 8.64% 2.01% 0.97% 1.26% -19.39% 1.03%
G 1.03% 3.56% 2.00% -2.27% 2.39% 17.73% -0.61%
B 0.17% 1.96% -1.79% 0.09% 6.36% 10.51% -0.76%
W 1.43% 6.07% 3.45% 0.75% 2.82% 8.03% 0.68%
Lab8 Lab9 Lab10 Lab11 Lab12 Lab13
-9.31% 3.69% 2.85% 2.05% 9.37% -3.17%
-15.19% 0.02% 0.43% 0.16% -1.04% -7.20%
-10.07% 3.67% 3.99% 3.00% -2.76% -14.20%
-19.40% 1.78% 3.35% 0.61% 3.58% -11.71%


3. WITH TEMPERATURE CORRECTION
Lab1 Lab2 Lab3 Lab4 Lab5 Lab6 Lab7
R 3.54% 9.00% 2.16% 0.68% 2.03% -19.45% 0.72%
G 1.65% 3.69% 0.79% -2.67% 2.43% 17.80% -0.68%
B 0.35% 2.15% -1.58% 0.03% 6.63% 10.64% -0.65%
W 2.54% 6.81% 1.29% 0.32% 2.90% 7.77% 0.56%
Lab8 Lab9 Lab10 Lab11 Lab12 Lab13
-10.65% 3.51% 3.47% 3.98% 7.65% -3.10%
-15.19% 0.14% 1.29% 1.03% -1.57% -7.06%
-10.03% 3.68% 4.13% 3.26% -2.24% -16.02%
-19.41% 2.01% 4.67% 2.21% 2.45% -11.58%


APMP Supplementary Comparisons of
LED Measurements
APMP.PR-S3a Averaged LED Intensity
APMP.PR-S3b Total Luminous Flux of LEDs
APMP.PR-S3c Emitted Colour of LEDs
Pre-draft A Process
Review of Relative Data

1. INTRODUCTION
The relative data are calculated and distributed for review to check the stability of the artefact LEDs for each participant before and after travel, and the internal consistency of the artefact LEDs measured at each participant lab.
The relative data are obtained as follows:
1. The ratio R1(Xi) and R2(Xi) are calculated for each artefact LED (Xi = R-i, G-i, B-i, W-i, or D-i with i = 1, 2 or 3)
)()()( ;
)()()(
22
11
iP
iLi
iP
iLi Xy
XyXRXyXyXR == . (1)
Here, yL(Xi), yP1(Xi), yP2(Xi) denote the measurement result of the participant laboratory, of the pilot laboratory before travel, and of the pilot laboratory after travel, respectively, for the artefact LED Xi.
2. The ratios in Eq. (1) are normalized to the mean value of the measurement data for the same type (colour) of artefact LEDs:
[ ] [ ]jiji
ii
jiji
ii XRMean
XRXrXRMean
XRXr,
22
,
11 )(
)()( ;)(
)()( == . (2)
We refer these normalized ratios r1(Xi) and r2(Xi) as to the relative data for the artefact LED Xi. Note that the normalization in Eq. (2) removes any relationship of the absolute scale of the participant laboratory and leaves only internal consistency information within the sub-set of the same LED types.
In the case of the LED measurement, the quantity to be measured is a function of junction temperature. Therefore, the junction voltage is simultaneously measured and reported with the comparison quantity. Based on the reported junction voltage data and the characteristic parameters of each artefact LED determined by the pilot laboratory in the preparation stage, the measured comparison quantities can be corrected to one junction voltage. It is expected that this temperature correction via junction voltage can improve the stability and internal consistency of the artefact LEDs.
In the next chapters, the relative data of all the participants are listed and plotted for visualization. There are two sets of the relative data: the first set is based on the submitted measurement data without any correction. The second set is based on the data corrected to one junction voltage as a result of the temperature correction. By comparison of the two relative data, one can check if the temperature correction via junction voltage works properly by improving the stability of the artefact LEDs. The scale of all the plot of relative data is fixed (from 0.96 to 1.04) for a better comparison. Note that the non-correlated uncertainty of the pilot lab is smaller than 0.1 % (k = 1) for all the type of LEDs.

2. MIKES (SET #1)
2.1. WITHOUT CORRECTION
r1 r2
R-1 0.9971 1.0010
R-2 0.9992 1.0029
R-3 0.9980 1.0018
G-1 0.9980 1.0024
G-2 0.9953 1.0013
G-3 0.9999 1.0031
B-1 1.0005 1.0037
B-2 0.9956 1.0009
B-3 0.9992 1.0001
W-1 1.0515 0.9870
W-2 0.9887 0.9976
W-3 0.9842 0.9910
2.2. WITH TEMPERATURE CORRECTION
r1_cor r2_cor
R-1 0.9961 0.9997
R-2 0.9989 1.0026
R-3 0.9995 1.0032
G-1 0.9979 1.0022
G-2 0.9944 1.0001
G-3 1.0005 1.0048
B-1 1.0018 1.0050
B-2 0.9961 1.0014

B-3 0.9972 0.9985
W-1 1.0512 0.9875
W-2 0.9872 0.9964
W-3 0.9854 0.9922

3. CMS-ITRI (SET #2)
3.1. WITHOUT CORRECTION
r1 r2
R-1 1.0028 0.9979
R-2 1.0000 0.9993
R-3 1.0017 0.9983
G-1 1.0036 0.9668
G-2 1.0061 1.0115
G-3 1.0033 1.0086
B-1 0.9914 1.0072
B-2 1.0010 1.0104
B-3 0.9909 0.9990
W-1 0.9967 0.9937
W-2 0.9973 1.0063
W-3 0.9991 1.0069
3.2. WITH TEMPERATURE CORRECTION
r1_cor r2_cor
R-1 0.9957 1.0033
R-2 0.9952 1.0053
R-3 0.9962 1.0043
G-1 1.0049 0.9671
G-2 1.0078 1.0121
G-3 1.0021 1.0061
B-1 0.9905 1.0063
B-2 0.9940 1.0025

B-3 0.9993 1.0074
W-1 0.9999 0.9947
W-2 1.0000 1.0061
W-3 0.9972 1.0021

4. PTB (SET #3)
4.1. WITHOUT CORRECTION
r1 r2
R-1 0.9966 1.0076
R-2 0.9921 1.0032
R-3 0.9953 1.0052
G-1 0.9946 1.0032
G-2 0.9968 1.0026
G-3 0.9975 1.0053
B-1 0.9939 1.0016
B-2 0.9946 1.0027
B-3 1.0018 1.0055
W-1 0.9944 1.0068
W-2 0.9948 1.0053
W-3 0.9939 1.0048
4.2. WITH TEMPERATURE CORRECTION
r1_cor r2_cor
R-1 1.0009 1.0037
R-2 0.9967 1.0005
R-3 0.9980 1.0002
G-1 0.9970 1.0022
G-2 0.9990 1.0020
G-3 0.9976 1.0022
B-1 0.9950 1.0022
B-2 0.9954 1.0025

B-3 1.0010 1.0039
W-1 0.9975 1.0025
W-2 0.9986 1.0025
W-3 0.9968 1.0022

5. NMIJ (SET #4)
5.1. WITHOUT CORRECTION
r1 r2
R-1 0.9957 1.0054
R-2 0.9939 1.0045
R-3 0.9961 1.0044
G-1 0.9961 1.0070
G-2 0.9943 1.0051
G-3 0.9945 1.0030
B-1 0.9976 1.0030
B-2 0.9982 1.0040
B-3 0.9961 1.0010
W-1 0.9923 1.0145
W-2 0.9883 1.0080
W-3 0.9890 1.0079
5.2. WITH TEMPERATURE CORRECTION
r1_cor r2_cor
R-1 0.9990 1.0018
R-2 0.9976 1.0016
R-3 0.9993 1.0008
G-1 0.9979 1.0063
G-2 0.9951 1.0038
G-3 0.9956 1.0013
B-1 0.9973 1.0030
B-2 0.9979 1.0040

B-3 0.9961 1.0017
W-1 0.9942 1.0116
W-2 0.9905 1.0061
W-3 0.9914 1.0063

6. CENAM (SET #5)
6.1. WITHOUT CORRECTION
r1 r2
R-1 0.9924 0.9865
R-2 0.9952 0.9878
R-3 1.0227 1.0153
G-1 0.9943 0.9926
G-2 0.9779 0.9868
G-3 1.0245 1.0239
B-1 1.0595 1.0624
B-2 0.9749 0.9767
B-3 0.9616 0.9649
W-1 1.0066 1.0032
W-2 0.9957 0.9921
W-3 1.0042 0.9982
6.2. WITH TEMPERATURE CORRECTION
r1_cor r2_cor
R-1 0.9885 0.9908
R-2 0.9912 0.9924
R-3 1.0176 1.0194
G-1 0.9886 0.9916
G-2 0.9822 0.9953
G-3 1.0193 1.0230
B-1 1.0598 1.0637
B-2 0.9730 0.9769

B-3 0.9610 0.9657
W-1 1.0054 1.0069
W-2 0.9929 0.9944
W-3 0.9997 1.0007

7. LNE (SET #6)
7.1. WITHOUT CORRECTION
r1 r2
R-1 0.9928 1.0021
R-2 0.9952 1.0074
R-3 0.9949 1.0077
G-1 0.9934 1.0041
G-2 0.9986 1.0059
G-3 0.9961 1.0018
B-1 0.9977 0.9994
B-2 0.9985 1.0029
B-3 0.9990 1.0025
W-1 0.9809 1.0147
W-2 0.9889 1.0152
W-3 0.9904 1.0099
7.2. WITH TEMPERATURE CORRECTION
r1_cor r2_cor
R-1 0.9969 0.9965
R-2 1.0014 1.0021
R-3 1.0019 1.0012
G-1 0.9963 1.0017
G-2 1.0004 1.0046
G-3 0.9967 1.0003
B-1 0.9975 0.9987
B-2 0.9996 1.0028

B-3 0.9994 1.0020
W-1 0.9818 1.0137
W-2 0.9904 1.0147
W-3 0.9915 1.0078

8. METAS (SET #7)
8.1. WITHOUT CORRECTION
r1 r2
R-1 0.9955 0.9939
R-2 1.0081 1.0028
R-3 1.0012 0.9985
G-1 0.9915 0.9965
G-2 0.9991 1.0032
G-3 1.0027 1.0070
B-1 0.9884 0.9957
B-2 1.0113 1.0182
B-3 0.9900 0.9964
W-1 1.0011 1.0053
W-2 0.9973 1.0004
W-3 0.9972 0.9986
8.2. WITH TEMPERATURE CORRECTION
r1_cor r2_cor
R-1 0.9971 0.9975
R-2 1.0053 1.0036
R-3 0.9985 0.9980
G-1 0.9910 0.9972
G-2 0.9995 1.0047
G-3 1.0010 1.0066
B-1 0.9891 0.9966
B-2 1.0119 1.0193

B-3 0.9883 0.9948
W-1 1.0003 1.0074
W-2 0.9964 1.0001
W-3 0.9967 0.9991

9. A*STAR (SET #8)
9.1. WITHOUT CORRECTION
r1 r2
R-1 1.0027 0.9975
R-2 1.0029 0.9970
R-3 1.0026 0.9973
G-1 0.9943 0.9991
G-2 0.9975 1.0023
G-3 1.0012 1.0056
B-1 0.9905 0.9973
B-2 0.9960 1.0022
B-3 1.0024 1.0117
W-1 0.9992 0.9999
W-2 0.9965 0.9999
W-3 0.9996 1.0050
9.2. WITH TEMPERATURE CORRECTION
r1_cor r2_cor
R-1 1.0034 1.0010
R-2 1.0002 0.9986
R-3 0.9988 0.9980
G-1 0.9947 1.0010
G-2 0.9958 1.0026
G-3 0.9994 1.0066
B-1 0.9899 0.9979
B-2 0.9944 1.0022

B-3 1.0028 1.0127
W-1 0.9965 1.0018
W-2 0.9954 1.0024
W-3 0.9983 1.0056

10. VSL (SET #1)
10.1. WITHOUT CORRECTION
r1 r2
R-1 1.0068 1.0103
R-2 0.9932 0.9940
R-3 0.9991 0.9967
G-1 0.9993 1.0068
G-2 1.0147 1.0224
G-3 0.9753 0.9815
B-1 0.9892 1.0091
B-2 1.0001 1.0298
B-3 0.9779 0.9938
W-1 1.0018 1.0124
W-2 0.9807 0.9957
W-3 0.9944 1.0149
10.2. WITH TEMPERATURE CORRECTION
r1_cor r2_cor
R-1 1.0099 1.0080
R-2 0.9953 0.9906
R-3 1.0015 0.9948
G-1 0.9933 1.0138
G-2 1.0085 1.0254
G-3 0.9708 0.9881
B-1 0.9904 1.0064
B-2 1.0006 1.0291

B-3 0.9776 0.9959
W-1 0.9954 1.0181
W-2 0.9749 1.0025
W-3 0.9883 1.0208

11. NIST (SET #3)
11.1. WITHOUT CORRECTION
r1 r2
R-1 1.0035 0.9952
R-2 1.0035 0.9965
R-3 1.0046 0.9967
G-1 1.0008 1.0049
G-2 0.9935 1.0019
G-3 0.9959 1.0029
B-1 0.9909 1.0101
B-2 0.9852 1.0112
B-3 0.9901 1.0126
W-1 0.9967 1.0064
W-2 0.9909 1.0055
W-3 0.9926 1.0079
11.2. WITH TEMPERATURE CORRECTION
r1_cor r2_cor
R-1 0.9998 1.0016
R-2 0.9977 0.9991
R-3 0.9995 1.0024
G-1 0.9988 1.0058
G-2 0.9916 1.0034
G-3 0.9951 1.0053
B-1 0.9905 1.0102
B-2 0.9847 1.0113

B-3 0.9899 1.0134
W-1 0.9945 1.0091
W-2 0.9885 1.0075
W-3 0.9912 1.0091

12. VNIIOFI (SET #5)
12.1. WITHOUT CORRECTION
r1 r2
R-1 1.0003 0.9962
R-2 0.9929 0.9923
R-3 1.0087 1.0096
G-1 0.9978 1.0033
G-2 0.9908 1.0050
G-3 1.0001 1.0030
B-1 0.9787 0.9909
B-2 0.9818 0.9918
B-3 1.0227 1.0341
W-1 0.9972 0.9994
W-2 0.9955 1.0024
W-3 0.9992 1.0063
12.2. WITH TEMPERATURE CORRECTION
r1_cor r2_cor
R-1 0.9987 0.9973
R-2 0.9929 0.9932
R-3 1.0085 1.0093
G-1 0.9956 1.0049
G-2 0.9887 1.0067
G-3 0.9984 1.0056
B-1 0.9795 0.9918
B-2 0.9807 0.9914

B-3 1.0225 1.0342
W-1 0.9956 1.0040
W-2 0.9932 1.0051
W-3 0.9951 1.0070

13. INM (SET #7)
13.1. WITHOUT CORRECTION
r1 r2
R-1 1.0110 1.0035
R-2 1.0056 1.0028
R-3 0.9919 0.9852
G-1 0.9762 0.9771
G-2 1.0208 1.0224
G-3 1.0025 1.0010
B-1 1.0166 1.0711
B-2 0.9625 0.9874
B-3 0.9736 0.9888
W-1 1.0428 1.0422
W-2 0.9793 0.9788
W-3 0.9765 0.9805
13.2. WITH TEMPERATURE CORRECTION
r1_cor r2_cor
R-1 1.0047 1.0054
R-2 1.0052 1.0085
R-3 0.9870 0.9892
G-1 0.9753 0.9789
G-2 1.0196 1.0235
G-3 1.0009 1.0019
B-1 1.0170 1.0719
B-2 0.9630 0.9883

B-3 0.9714 0.9884
W-1 1.0416 1.0462
W-2 0.9748 0.9808
W-3 0.9741 0.9823