aplicaÇÕes de ce-dad e hplc-dad-esi/ms na...
TRANSCRIPT

UNIVERSIDADE ESTADUAL DE CAMPINAS
FACULDADE DE ENGENHARIA DE ALIMENTOS
DEPARTAMENTO DE CIÊNCIA DE ALIMENTOS
APLICAÇÕES DE CE-DAD E HPLC-DAD-ESI/MS NA
DETERMINAÇÃO DE COMPOSTOS FENÓLICOS,
METILXANTINAS E ÁCIDOS ORGÂNICOS EM
BEBIDAS
Renato Garcia Peres Bacharel em Química
Mestre em Ciências – Química Analítica
Profa. Dra. Delia B. Rodriguez-Amaya Orientadora
Tese apresentada à Faculdade de Engenharia de Alimentos da Universidade Estadual de Campinas, para obtenção do título de Doutor em Ciência de Alimentos.
Campinas – SP 2007

ii

iii
BANCA EXAMINADORA
_________________________________________ Dra. Delia B. Rodriguez-Amaya
(Orientadora)
__________________________________________ Dra. Helena Teixeira Godoy
(FEA/UNICAMP)
__________________________________________ Dr. Jaime Amaya Farfan
(FEA/UNICAMP)
____________________________________________ Dra. Marina Franco Maggi Tavares
(IQ/USP)
__________________________________________ Dra. Mieko Kimura (IBILCE/UNESP)
____________________________________________ Dra. Myrna Sabino
(INSTITUTO ADOLFO LUTZ)

iv
Dedico
Ao meu filho Victor nascido durante este trabalho por me mostrar o “verdadeiro amor”, por me dar tanta energia pra seguir em frente, prazer e
tanta alegria de viver.
À Rita, minha esposa, grande amor da minha vida, companheira, porto seguro, pela paciência quase inesgotável, pelo carinho e amor.

v
AGRADECIMENTOS
À Deus fonte eterna de Luz, sabedoria, bondade, harmonia e paz!
À Profa. Delia B. Rodriguez-Amaya, pela orientação segura, conhecimento, apoio, empolgação com o trabalho, experiência transmitida, bom humor e principalmente pela paciência com minhas limitações, meus sinceros agradecimentos; À Profa. Marina F. M. Tavares, pela amizade, por ter me recebido e aberto as portas de seu Laboratório (LACE/IQ/USP), pelo apoio, conhecimentos transmitidos de maneira muito sensata e segura; Ao amigo Dr. Fernando Tonin pela amizade, grande ajuda e apoio nos trabalhos da tese, pelas idéias e pela paciência; Ao hoje Prof. Gustavo Micke pela ajuda na primeira etapa da tese com os vinhos e pelas muitas idéias sempre bastante valiosas; Aos Menbros da Banca examinadora, Dra. Myrna Sabino, Dr. Jaime Amaya Farfan, Dra. Mieko Kimura, Dra. Helena Godoy e Dra. Marina Tavares pela ajuda na correção rápida, ótimas contribuições para a melhoria deste trabalho de tese; Aos Professores e Pesquisadores: Prof. Dr. Antonio Miranda (Biofísica/Unifesp) e Dr. Daniel Pimenta (Instituto Butantan); pelo uso dos equipamentos de LC/MS, de seus respectivos laboratórios e grande ajuda na discussão dos trabalhos; Ao Professor Agenor Maccari (UFPR) pelas amostras de erva mate e pelos conhecimentos transmitidos; Aos colegas do Lab de Carotenóides (FEA/Unicamp) e LACE (IQ/USP) pelo apoio de ajuda em todos estes anos; Aos meus irmãos Rogério (Piguinho) e Paulo pela amizade e companheirismo; Aos meus Pais Oswaldo e Jeni que sempre souberam me transmitir os melhores valores de vida; A todos que contribuíram, direta ou indiretamente, para que esta etapa fosse cumprida.

vi
ÍNDICE
ÍNDICE DE TABELAS....................................................................................................... ix ÍNDICE DE FIGURAS........................................................................................................ xi
xiii RESUMO GERAL............................................................................................................... GENERAL ABSTRACT..................................................................................................... xviiINTRODUÇÃO GERAL..................................................................................................... xxi CAPITULO 1 - Métodos para a Determinação de Flavonóides em Chás: Uma Revisão........................................................................................ 1 Resumo............................................................................................................................. 2 Introdução......................................................................................................................... 3 Polifenois de chá............................................................................................................... 4 Efeitos benéficos à saúde.................................................................................................. 8 Métodos analíticos............................................................................................................ 10 Cromatografia líquida de alta eficiência.................................................................... 10 Eletroforese capilar.................................................................................................... 13 Espectrometria de massas.......................................................................................... 17 Considerações finais......................................................................................................... 20 Abstract............................................................................................................................. 22 Referências Bibliograficas................................................................................................ 23 CAPITULO 2 - Métodos por eletroforese capilar para a determinação de polifenóis e ácidos orgânicos em vinhos: Uma revisão.......................... 39 Resumo............................................................................................................................. 40 Abstract............................................................................................................................. 41 Introdução......................................................................................................................... 42 Compostos fenólicos em vinho........................................................................................ 43 Análise de fenólicos em vinho por eletroforese capilar................................................... 46 Análise de ácidos orgânicos em vinho por eletroforese capilar....................................... 53 Referências....................................................................................................................... 59 CAPITULO 3 - HPLC-DAD-ESI/MS Identification and Quantification of Phenolic Compounds in Ilex paraguarienses Beverages and On-line Evaluation of Individual Antioxidant Activity............................................ 67 Abstract............................................................................................................................ 69 Introduction...................................................................................................................... 70 Material and Methods...................................................................................................... 72 Chemicals................................................................................................................... 72 Sample Preparation.................................................................................................... 73 Preparative HPLC...................................................................................................... 73 HPLC analysis……………………………………………………………………... 73 HPLC-ESI/MS analysis……………………………………………………………. 74

vii
Preparation of ABTS.+ solution……………………………………………………. 74 On-line ABTS.+ assay................................................................................................ 75 Results and discussion...................................................................................................... 77 Identification of the phenolic compounds and purine alkaloids of Ilex
paraguariensis infusions…………………………………………………………… 77 Quantification of the phenolic compounds and purine alkaloids of Ilex
paraguariensis infusions…………………………………………………………… 83
Antioxidant activity of the phenolic compounds…………………………………... 85 Literature cited................................................................................................................. 88 CAPITULO 4 - Quantification of Phenolic Compounds and Purine Alkaloids in Ilex paraguarienses Infusions……………………………….. 92 Abstract............................................................................................................................ 94 1. Introduction………………………………………………………………………….. 95 2. Materials and methods.................................................................................................. 97 2.1. Chemicals……………………………………………………………………… 97 2.2. Sample preparation……………………………………………………………. 98 2.3. µLC analysis of the aglycones………………………………………………… 100 2.4. HPLC analysis of the phenolic compounds and the purine alkaloids ………... 100 2.5. ESI/MS analysis……………………………………………………………….. 101 2.6. Statistical analysis……………………………………………………………... 102 3. Results and discussion……………………………………………………………...... 102 3.1 Flavonol identification and performance of the quantitative method………….. 102 3.2. Quantitative composition……………………………………………………… 104 4. Conclusions………………………………………………………………………….. 106 Acknowledgement……………………………………………………………………… 106 References……………………………………………………………………………… 112 CAPITULO 5 - Determination of catechins in green tea infusions by reduced flow micellar electrokinetic chromatography…………………... 115 Abstract………………………………………………………………………………… 115 1. Introduction………………………………………………………………………….. 118 2. Experimental………………………………………………………………………... 120 2.1. CE instrumentation and capillary conditioning……………………………….. 120 2.2. Reagents and solutions........................................................................................ 120 2.3. Sample preparation……………………………………………………………. 121 2.4. Analytical conditions………………………………………………………….. 121 2.5. Method development………………………………………………………….. 122 3. Results and discussion................................................................................................. 125 3.1. Method performance…………………………………………………………... 125 3.2. Catechins of Brazilian tea……………………………………………………... 126 4. Conclusions………………………………………………………………………….. 132 References……………………………………………………………………………… 132 CAPITULO 6 Determination of polyphenols and phenolic acids in Brazilian wine by capillary electrophoresis…..…………………………. 136

viii
Abstract.………………………………………………………………………………… 138 1. Introduction………………………………………………………………………….. 139 2. Materials and methods………………………………………………………………. 140 2.1. Instrumentation………………………………………………………………... 140 2.2. Reagents and solvents…………………………………………………………. 141 2.3. Sample preparation……………………………………………………………. 141 2.4. Capillary electrophoresis procedure…………………………………………... 142 2.5. Method development and evaluation of performance………………………… 143 3. Results and discussion……………………………………………………..………… 145 3.1. Optimum electrolyte composition and CE conditions………………………… 145 3.2. Method performance…………………………………………………………... 148 3.3. Polyphenols of Brazilian wines……………………………………………….. 150 4. Conclusion…………………………………………………………………………… 154 References……………………………………………………………………………….. 154 CAPITULO 7 - Rapid quality control method for organic acids in wine by capillary electrophoresis with indirect UV detection …….………….. 159 Abstract…………………………………………………………………………………. 161 1. Introduction………………………………………………………………………….. 162 2. Materials and methods……………………………………………………………….. 164 2.1. Instrumentation………………………………………………………………... 164 2.2. Chemicals……………………………………………………………………… 164 2.3. Sample preparation……………………………………………………………. 165 2.4. Capillary conditioning………………………………………………………… 165 2.5. Development and evaluation of method performance………………………… 165 3. Results and discussion………………………………………………………………. 166 3.1. Optimization of the electrolyte composition………………………………….. 166 3.2. Method performance…………………………………………………………... 169 3.3. Organic acids of Brazilian wines……………………………………………… 169 4. Conclusion…………………………………………………………………………… 174 References……………………………………………………………………………… 174
CONCLUSÕES GERAIS.............................................................................................. 178
ix
ÍNDICE DE TABELAS
CAPÍTULO 1
Tabela 1. Métodos por cromatografia líquida de alta eficiência para a análise de polifenóis em chás.......................................................................................... 11
Tabela 2. Métodos eletroforéticos (CZE , MEKC e MEECK) para análise de polifenois em chás............................................................................................... 14
Tabela 3. Aplicações de espectrometria de massas na análise de fenólicos em chás.................................................................................................................... 18
CAPÍTULO 2 Tabela 1. Principais métodos eletroforéticos para polifenóis em vinhos............ 50 Tabela 2. Métodos eletroforéticos para ácidos orgânicos em vinhos.................. 53 CAPÍTULO 3
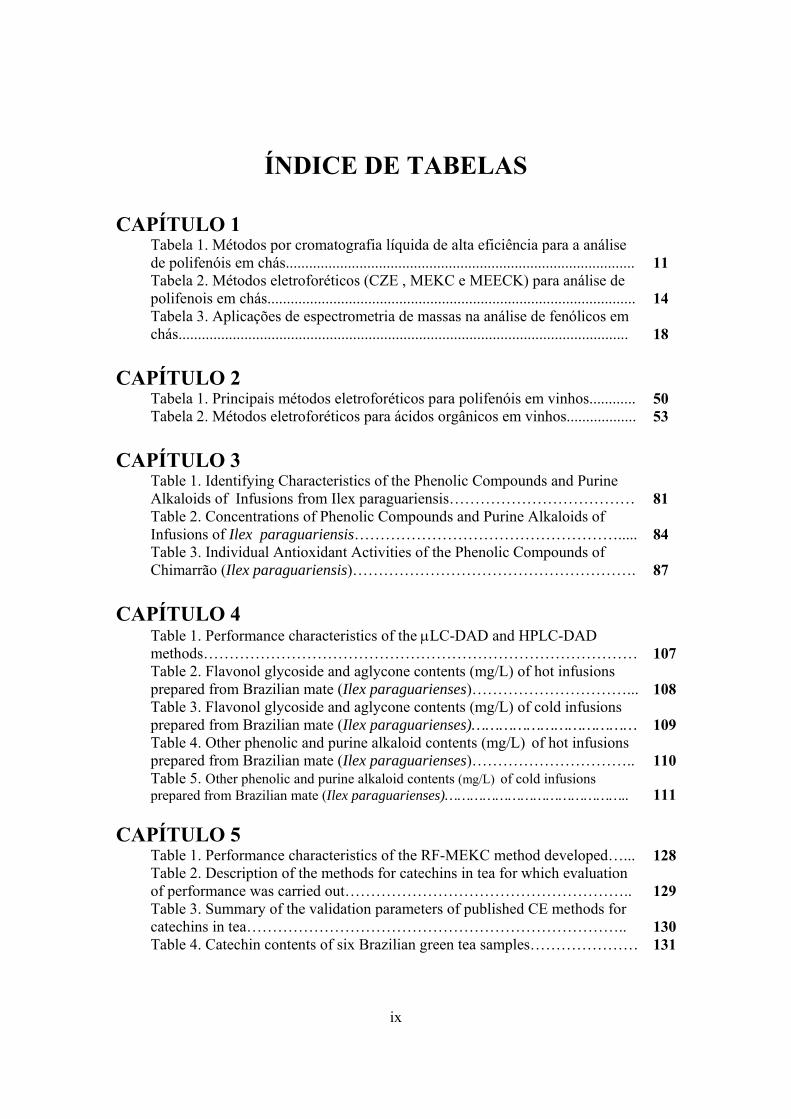
Table 1. Identifying Characteristics of the Phenolic Compounds and Purine Alkaloids of Infusions from Ilex paraguariensis……………………………… 81
Table 2. Concentrations of Phenolic Compounds and Purine Alkaloids of Infusions of Ilex paraguariensis……………………………………………..... 84
Table 3. Individual Antioxidant Activities of the Phenolic Compounds of Chimarrão (Ilex paraguariensis)………………………………………………. 87
CAPÍTULO 4
Table 1. Performance characteristics of the μLC-DAD and HPLC-DAD methods………………………………………………………………………… 107
Table 2. Flavonol glycoside and aglycone contents (mg/L) of hot infusions prepared from Brazilian mate (Ilex paraguarienses)…………………………... 108
Table 3. Flavonol glycoside and aglycone contents (mg/L) of cold infusions prepared from Brazilian mate (Ilex paraguarienses)……………………………… 109
Table 4. Other phenolic and purine alkaloid contents (mg/L) of hot infusions prepared from Brazilian mate (Ilex paraguarienses)………………………….. 110
Table 5. Other phenolic and purine alkaloid contents (mg/L) of cold infusions prepared from Brazilian mate (Ilex paraguarienses)…………………………………….. 111
CAPÍTULO 5 Table 1. Performance characteristics of the RF-MEKC method developed…... 128
Table 2. Description of the methods for catechins in tea for which evaluation of performance was carried out……………………………………………….. 129
Table 3. Summary of the validation parameters of published CE methods for catechins in tea……………………………………………………………….. 130
Table 4. Catechin contents of six Brazilian green tea samples………………… 131

x
CAPÍTULO 6 Table 1. 27-3 Factorial design variable levels………………………………….. 144 Table 2. Principal effects obtained from the factorial design 27-3 ……………. 146
Table 3. Response function results of the response surface analysis…………..……………………………………………………………... 147
Table 4. Performance characteristics of the CE method developed…………… 149
Table 5. Phenolic compound concentrations (mg/L) in Brazilian wines obtained by the CE method developed………………………………………… 151
CAPÍTULO 7 Table 1. Performance characteristics of the CZE method developed………….. 170
Table 2. Organic acid concentrations (mg/L) in Brazilian wines obtained by the capillary electrophoresis proposed method………………………………... 171

xi
ÍNDICE DE FIGURAS
CAPÍTULO 1
Figura 1. Estrutura básica de flavonóides (A) e de flavonóis agliconas presentes em chás (B).......................................................................................................................... 5
Figura 2. Estruturas das catequinas principais encontradas em chás............................. 6 Figura 3. Estruturas das teaflavinas encontradas em chás.............................................. 7 CAPÍTULO 2 Figura 1. Estruturas das principais classes de compostos fenólicos em vinhos............. 44 CAPÍTULO 3 Figure 1. Set-up for the HPLC-ABTS.+ on-line system……………………………… 76
Figure 2. Chromatograms of (A) standards and (B) phenolic compounds of Ilex paraguariensis infusion………………………………………………………………... 78
Figure 3. Structures of purine alkaloids and caffeoylquinic compounds found in Ilex paraguariensis infusions………………………………………………………………. 79
Figure 4. Structures of flavonols found in Ilex paraguariensis infusions……………... 80
Figure 4. On-line HPLC ABTS+ analysis of the Ilex paraguarienses beverage chimarrão……………………………………………………………………………… 86
CAPÍTULO 4 Figure 1. Industrial steps in mate production…………………………………………. 99
Figure 2. Absorption and mass spectra of the aglycones quercetin (Q) and kaempferol (K) and sample chromatograms: (A): chromatogram of the aglycones and (B) chromatogram of the glycosides, other phenolic compounds and purine alkaloids. Chromatographic conditions are in the text………………………………. 103
CAPÍTULO 5
Fig. 1. Electropherograms of tea catechins obtained with the RF-MEKC method, using 0.2% TEA and 50mM SDS with 0.0% (A), 0.2% (B), 0.4% (C), 0.6% (D) 0.8% and 1.0% (E) of s-ß-CD (sulfated cyclodextrin salt)…………………………… 124
Fig. 2. Typical electropherogram of the catechins of Brazilian green tea. Conditions are described in the text………………………………………………………………. 127
CAPÍTULO 6 Figure 1. Figure 1. Response surface for electrolyte composition and CE conditions.. 148
Figure 2. Electropherograms of the phenolic compounds in (a) mixture of standards, (b) red wine and (c) white wine………………………………………………………. 152

xii
CAPÍTULO 7 Figure 1. Curves of effective mobility values versus pH……………………………. 168
Figure 2. Eletropherogram of organic acid standards: 1-tartaric acid, 2-malic acid, 3-lactic acid, 4 - succinic acid, 5 - acetic acid, 6-citric acid……………………………..
172
Figure 3. Typical eletropherogram of the organic acids in a sample of white wine: 1-tartaric acid, 3- lactic acid, 4 - succinic acid, 5 - acetic acid, 6-citric acid……………. 173

xiii
RESUMO GERAL
Considerando que os artigos de pesquisa desta tese já estão em inglês e na forma
para serem enviados aos periódicos internacionais, nos quais os resumos estão restritos a
100 ou 200 palavras, nesta seção, os resumos estão apresentados com maiores detalhes para
uma apreciação melhor dos trabalhos e dos seus resultados. Devido à grande abrangência
dos trabalhos, e para facilitar a leitura, os resumos estão apresentados em parágrafos
separados, em vez de um único parágrafo.
Os chás verde e preto (Camellia sinensis) são bebidas muito consumidas
mundialmente. Na última década, estas bebidas têm sido alvo de investigação intensa
devido a seus possíveis efeitos benéficos à saúde, atribuídos aos compostos fenólicos.
Catequinas e teaflavinas são os fenólicos mais importantes em chá verde e chá preto,
respectivamente. Têm sido também atribuídas a infusões de chá mate (Ilex paraguariensis),
bebidas bastante consumidas no Brasil, atividades biológicas promotoras da saúde,
possivelmente devido aos compostos derivados cafeoilquínicos e outros fenólicos. Portanto,
o Capítulo 1 é um artigo de revisão que discute os avanços na instrumentação e
metodologia analítica aplicadas aos compostos fenólicos em chás. Técnicas analíticas
modernas, como cromatografia líquida de alta eficiência, espectrometria de massas e
eletroforese capilar têm fornecido dados importantes sobre a composição destes compostos
nas bebidas mencionadas.
Compostos fenólicos ocorrem abundantemente em vinhos e têm sido alvo de
inúmeras pesquisas científicas nos últimos anos devido aos supostos benefícios à saúde.
Ácidos orgânicos exercem influência direta na qualidade e propriedades sensoriais de
vinhos, bem como na sua estabilidade e controle microbiológico. A determinação de ambos

xiv
compostos é, portanto, de extrema importância. Uma revisão da literatura (Capítulo 2)
mostra que a eletroforese capilar vem substituindo gradativamente a cromatografia líquida
de alta eficiência com vantagens de baixo custo operacional, baixo consumo de solventes,
rapidez, simplificação no preparo das amostras, etc. Com fenólicos, a eletroforese capilar
tem sido utilizada com sucesso para a determinação de isômeros do resveratrol, ácidos
fenólicos e flavonóides. Em ácidos orgânicos, sua utilização se dá nos modos de detecção
direta e indireta.
“Chimarrão” e “tererê” são infusões de erva mate (Ilex paraguariensis) largamente
consumidas na América do Sul. O artigo do Capítulo 3 descreve a aplicação de HPLC-
DAD-ESI/MS na identificação e quantificação de ácidos cafeoilquínicos (CQA),
glicosídeos de flavonóis e purina alcalóides nestas bebidas. Infusões foram preparadas de
amostras comerciais de Ilex paraguarienses do Sul do Brasil. Os ácidos cafeoilquínicos,
4,5-diCQA, 3-CQA, 5-CQA e 4-CQA foram os principais compostos, 238-289, 153-242,
183-263 e 123-188 μg/mL, respectivamente, em chimarrão, e 206-265, 122-218, 164-209,
103-169 μg/mL, respectivamente, em tererê. Cafeína também foi encontrada em altas
quantidades. Os glicosídeos de quercetina e kaempferol estavam presentes em níveis
baixos. A atividade antioxidante individual foi determinada por um sistema “on-line” que
mede a habilidade da substância sequestrar o radical ABTS.+, revelando que a capacidade
antioxidante não foi proporcional às concentrações dos compostos fenólicos. 3-O-CQA,
quercetina-3-O-ramnosilglucosídeo e quercetina-3-O-glucosídeo tiveram maior
contribuição para a capacidade antioxidante, embora os glicosídeos de quercetina estavam
em teores mais de 10 vezes menores que o 3-O-CQA.
O Capítulo 4 teve dois objetivos: (1) comparar a quantificação de flavonóis nas
formas glicosidicas e agliconas, e (2) comparar a composição de fenólicos e metilxantinas

xv
de mates retiradas em dois pontos da produção e entre as infusões chimarrão e tererê. O
método quantitativo utilizado para as agliconas obtidas por hidrólise e aquele usado para
glicosídeos, outros fenólicos e metilxantinas tiveram bom desempenho, medido em termos
de linearidade, limites de detecção e quantificação, recuperação e repetitividade. Para as 13
amostras analisadas, nas duas infusões, resultados equivalentes foram obtidos para
quercetina e kaempferol, nas formas glicosídicas e agliconas. Os teores dos analitos foram
todos maiores no chimarrão em comparação ao tererê. Em ambas infuses, os níveis de
fenólicos e metilxantinas foram significativamente maiores nos mates obtidos diretamente
dos produtores que nas amostras comerciais, indicando que perdas ocorreram nas etapas
adicionais do processamento e durante a estocagem das amostras obtidas diretamente dos
produtores.
Um método rápido por RF-MEKC modificado com β-ciclodextrina sulfatada foi
desenvolvido e validado para a determinação de cinco catequinas em chá verde (Capítulo
5). O eletrólito otimizado consistiu de 0.2% trietilamina, 50 mmol/L SDS e 0.8% s-ß-CD
(pH=2,9). Os padrões e as amostras foram injetados em 0,6 psi por 5 segundos sob
voltagem constante de -30 kV. O preparo da amostra envolveu a extração de 2g de chá com
200mL de água a 95oC sob agitação constante por 5 min. O método demonstrou excelente
desempenho com limites de detecção e quantificação de 0,02 a 0,1 µg/L e 0.1 a 0,5 µg/mL,
respectivamente, e recuperação de 94 a 101%. O método foi utilizado para analisar infusões
de chás verdes comercializados no Brasil. Epigalocatequina galato (23,4-112,4 µg/mL) foi
o principal componente, seguido por Epigalocatequina (18,4-78,9 µg/mL), Epicatequina
galato (5,6-29,6 µg/mL), Epicatequina (4,6-14,5 µg/mL) e Catequina (3,2-8,2 µg/mL).
Foi desenvolvido e avaliado um método para determinação simultânea da estilbeno
resveratrol, quatro ácidos fenólicos e cinco flavonóides em vinhos por eletroforese capilar

xvi
(CE) (Capítulo 6). A composição do eletrólito e as condições instrumentais foram
otimizadas, usando um planejamento fatorial 27-3 e análise de superfície de resposta,
mostrando TBS (tetraborato de sódio) / metanol como a variável mais influente. As
condições eletroforéticas ótimas, minimizando os valores de CRS, consistiram de 17
mmol/L TBS com 20% MeOH como eletrólito, voltagem constante de 25 kV, injeção
hidrodinâmica a 50 mBar por 3 segundos e temperatura de 25oC. Os valores de R2 para
linearidade foram igual ou maior que 0,99. Os limites de detecção e quantificação foram de
0,01 a 0,03 e de 0,04 a 0,08 mg/L, respectivamente. Os coeficientes de variação para os
tempos de migração e áreas dos picos, obtidos por 10 injeções consecutivas, foram menores
de 2%. A recuperação variou de 97 a 102%. O método foi aplicado a 23 diferentes tipos e
marcas de vinhos brasileiros.
Um método por eletroforese capilar para os ácidos orgânicos mais importantes em
vinho foi desenvolvido e validado (Capítulo 7). O eletrólito otimizado consistiu de 10
mmol/L de ácido 3,5-dinitrobenzóico (DNB) a pH 3,6, com 0,2 mmol/L de brometo de
cetiltrimetilamônio para inversão de fluxo. O DNB foi escolhido porque tem mobilidade
efetiva semelhante aos analitos, boa capacidade tamponante a pH 3,6 e características
cromofóricas para detecção indireta. O preparo da amostra envolveu apenas diluição e
filtração. O método demonstrou bom desempenho: linearidade (R2 > 0,99) na faixa de
concentração avaliada (6 a 285 mg/L); limites de detecção e quantificação de 0,64 a 1,55
mg/L e de 2,12 a 5,15 mg/L, respectivamente; tempo de análise de 5,5 minutos. Os
coeficientes de variação, em relação aos tempos de migração e as áreas dos picos, foram
abaixo de 5%. As porcentagens de recuperação variaram de 95 a 102%. O método foi
aplicado a 23 tipos e marcas de vinhos brasileiros, confirmando a boa repetibilidade e
demostrando a grande variação nas concentrações dos ácidos orgânicos.

xvii
GENERAL ABSTRACT
Green and black teas (Camellia sinensis) are widely consumed beverages in the
entire world. In the last decade, these beverages have been the subject of intense
investigations in relation to their possible beneficial effects on health. Catechins and
theaflavins are the most important phenolics in green and black tea, respectively. Health
promoting have also been attributed to the infusions of mate, beverages widely consumed
in Brazil, probably due to caffeoylquinic derivatives and other phenolics. Chapter 1
reviews advances in instrumentation and analytical methodology applied to phenolic
compounds in teas. Modern analytical techniques, such as high performance liquid
chromatography (HPLC), mass spectrometry (MS) and capillary electrophoreses (CE),
have provided important data about the composition of these compounds in the above
mentioned beverages.
Phenolic compounds occur in abundance in wine and have been the object of
intense research in recent years because of their potential benefits to health. Organic acids
have a direct influence on the quality and sensory properties of wine, as well as in their
stability and microbial control. The determination of phenolic compounds and organic
acids of wine is, therefore, of paramount importance. A review of the literature (Chapter 2)
shows that capillary electrophoresis is gradually substituting high performance liquid
chromatography, with the advantages of low operational cost, low solvent consumption,
short analysis time, minimal sample preparation, etc. With phenolics, CE has been
successfully used for the determination of resveratrol isomers, phenolic acids and

xviii
flavonoids. With organic acids, this technique has been employed in the direct and indirect
mode.
“Chimarrão” and “tererê” are mate (Ilex paraguariensis) infusions widely consumed
in South America. This paper (Chapter 3) describes the application of HPLC-DAD-
ESI/MS in the identification and quantification of caffeoylquinic acids (CQA), flavonol
glycosides and purine alkaloids in these beverages. Infusions were prepared from
commercial samples of Ilex paraguarienses from Southern Brazil. The cafeoylquinic acids,
4,5-diCQA, 3-CQA, 5-CQA, and 4-CQA were the major compounds, having 238-289, 153-
242, 183-263, and 123-188 μg/mL, respectively, in chimarrão and 206-265, 122-218, 164-
209, 103-169 μg/mL, respectively in tererê. Caffeine also had high amounts while
glycosides of quercetin and kaempferol were found at much lower levels. The individual
antioxidant activity was determined by an on-line system that measured their ABTS.+
radical scavenging activity, showing that the antioxidant capacity was not proportional to
the concentrations of the phenolic compounds. 3-O-CQA, quercetina-3-O-
ramnosylglucoside, and quercetina-3-O-glucoside were the major contributors to the
antioxidant capacity, although the quercetin glycosides had concentrations less than 10
times that of 3-O-CQA.
Chapter 4 had a two-fold objective: (1) compare quantification of flavonols in the
glycosidic and aglycone forms, and (2) compare the phenolic and purine alkaloid
composition of mate samples taken from two stages of industrial production and of hot and
cold infusions. The HPLC quantitative method used for the quantification of the flavonol
aglycones obtained by hydrolysis and that used for quantifying the glycosides, other
phenolics and the purine alkaloids performed well. Both methods showed good linearity,
limits of detection and quantification, recovery and repeatability. For all thirteen samples,

xix
analyzed as hot or cold infusion, equivalent results were obtained for quercetin and
kaempherol, thus these flavonols are amenable to quantification either in the glycoside or
aglycone form. The levels of all the analytes in all the samples were lower in the cold
infusion. In both infusions the phenolic and purine alkaloid concentrations were
significantly higher in the samples obtained from the producers than in the commercial
samples, indicating that losses occurred in the additional processing step and during storage
of the later samples.
A fast RF-MEKC method modified by sulfated-ß-cyclodextrin was developed and
validated for the determination of catechins in green tea (Chapter 5). The optimal
electrolyte consisted of 0.2% triethylamine, 50 mmol/L SDS and 0.8% s-β-CD (pH=2.9).
The samples and standards were injected at 0.6 psi for 5 s under constant voltage of -30 kV.
Sample preparation involved extraction of 2 g of tea with 200 mL water at 95oC under
constant stirring for 5 min. The method demonstrated excellent performance, with LOD and
LOQ of 0.02 to 0.1 and 0.1 to 0.5 µg/mL, respectively, and recovery percentages of 94 to
101%. The method was applied to six samples of Brazilian green tea infusions.
Epigallocatechin gallate (23.4-112.4 µg/mL) was the major component, followed by
epigallocatechin (18.4-78.9 µg/mL), epicatechin gallate (5.6-29.6 µg/mL), epicatechin (4.6-
14.5 µg/mL) and catechin (3.2-8.2 µg/mL).
In Chapter 6, a method for simultaneously determining the stilbene resveratrol,
four phenolic acids and five flavonoids in wine by capillary electrophoresis (CE) was
developed and evaluated. The CE electrolyte composition and instrumental conditions were
optimized using 27-3 factorial design and response surface analysis, showing TBS
(tetraborate)/MeOH as the most influential variables. The optimal electrophoretic
conditions, minimizing the chromatographic resolution statistic (CRS) values, consisted of

xx
17 mmol/L TBS with 20% methanol as electrolyte, constant voltage of 25 kV,
hydrodynamic injection at 50 mbar for 3s and temperature of 25oC. The R2 values for
linearity were equal to or higher than 0.99; limits of detection and quantification were 0.01
to 0.03 and 0.04 to 0.08, respectively. Coefficients of variation for migration time and peak
area obtained from ten consecutive injections were less than 2% and recoveries varied from
97 to 102%. The method was applied to 23 different samples of Brazilian wines.
A capillary electrophoresis method for six organic acids in wine was developed and
validated (Chapter 7). The optimal electrolyte consisted of 10 mmol/L 3,5-dinitrobenzoic
acid (DNB) at pH 3.6 with 0.2 mmol/L cetyltrimethylammonium bromide as flow reverser.
DNB was chosen because it had effective mobility similar to the organic acids, good
buffering capacity at pH 3.6 and good chromophoric characteristics for indirect detection.
Sample preparation involved dilution and filtration. The method showed good performance
characteristics: linearity at 6 to 285 mg/L (r> 0.99); detection and quantification limits of
0.64 to 1.55 and 2.12 to 5.15 mg/L, respectively; separation time of less than 5.5 min.
Coefficients of variation for ten injections was less than 5% and recoveries varied from 95
to 102%. Application to 23 samples of Brazilian wine confirmed good repeatability and
demonstrated wide variation in the organic acid concentrations.

xxi
INTRODUÇÃO GERAL
Os avanços em análise de alimentos espelham tanto o refinamento da
instrumentação e metodologia analítica como o aprofundamento dos conhecimentos sobre a
contribuição dos componentes alimentícios na qualidade, segurança e efeitos benéficos à
saúde. A aplicação aprimorada e inovadora das técnicas analíticas modernas à análise de
alimentos tem proporcionado maior entendimento das propriedades dos compostos
alimentícios. Por outro lado, a necessidade de conhecer melhor as funções e ações destes
compostos vem incentivando o desenvolvimento de metodologias analíticas mais
poderosas, capazes de determinar tanto os macro como os microcomponentes nas suas
diversas formas.
Entre as técnicas analíticas disponíveis atualmente, a eletroforese capilar nas suas
diferentes modalidades e a cromatografia líquida de alta eficiência com detectores de
arranjo de diodos e de massas (CLAE-DAD-EM) destacam-se pelas suas grandes utilidades
no estudo de alimentos. Utilizando estas técnicas, portanto, compostos fenólicos foram
estudados em chá verde, infusões de erva mate e vinho. No último, foram também
investigados os ácidos orgânicos.
Os compostos fenólicos estão bem destacados na literatura internacional pelos seus
possíveis benefícios na saúde, principalmente na diminuição do risco de doenças
cardiovasculares e de câncer. A determinação da composição de fenólicos, portanto, é
considerada uma prioridade mundial. São também importantes na qualidade de bebidas,
influenciando as propriedades sensoriais como cor e sabor. Os ácidos orgânicos influem na
estabilidade físico-química e microbiológica do vinho e também nas propriedades

xxii
sensoriais como cor e sabor. A determinação destes ácidos é, portanto, importante no
monitoramento dos processos de fermentação e no controle de qualidade de vinhos.

1
CAPÍTULO 1
Métodos para a Determinação de Flavonóides em Chás: Uma Revisão
RENATO G. PERES
DELIA B. RODRIGUEZ-AMAYA
Artigo a ser submetido à Revista Alimentos e Nutrição

2
Métodos para a determinação de flavonóides em chás: Uma
revisão
Renato G. PERES e Delia B. RODRIGUEZ-AMAYA*
Departamento de Ciência de Alimentos, Faculdade de Engenharia de Alimentos,
Universidade Estadual de Campinas, C.P. 6121, CEP 13083-862, Campinas, Sao Paulo,
Brasil
Resumo
Os chás verde e preto (Camellia sinensis) são bebidas muito consumidas no mundo
todo, principalmente em países orientais e europeus. Na última década, estas bebidas têm
sido alvo de investigação intensa quanto a seus possíveis efeitos benéficos à saúde.
Catequinas e teaflavinas são os fenólicos mais importantes em chá verde e chá preto,
respectivamente. Possíveis aplicações terapêuticas e farmacológicas têm sido também
atribuídas a infusões de chá mate (Ilex paraguariensis), bebidas bastante consumidas no
Brasil, possivelmente devido a compostos derivados de cafeoilquínicos e outros fenólicos.
Técnicas analíticas modernas, como cromatografia líquida de alta eficiência (HPLC),
espectrometria de massas (MS) e eletroforese capilar (CE) têm fornecido dados importantes
sobre a composição de fenólicos nas bebidas mencionadas. O presente artigo de revisão
discute os avanços na instrumentação e metodologia analítica aplicadas aos compostos
fenólicos em chás.
Palavras-chave: chá, polifenóis, flavonóides, CLAE, EC, EM

3
Introdução
Embora tradicionalmente associado a países da Ásia e Europa, o consumo do chá
tem aumentado em todo o mundo nos últimos anos, em boa parte devido às evidências
ligadas à saúde.
Os chás verde e preto são os mais consumidos, sendo que o chá preto responde a
cerca de 80% do consumo mundial enquanto que o chá verde a 20%, com maior
concentração de consumo na Europa e Ásia, respectivamente. Ambos são produzidos a
partir de folhas de Camellia sinensis e suas diferenças principais estão no modo de
processamento. No chá verde, ocorre a inativação da enzima polifenoloxidase por injeção
direta de vapor ou aplicação de calor indireto com posterior secagem e tostagem. No chá
preto, ocorre primeiramente a secagem das folhas, seguida de trituração em rolos para o
rompimento das paredes celulares e exposição ao oxigênio e à enzima polifenoloxidase.
Este processo é conhecido por fermentação, embora não exista um processo fermentativo
envolvido. O termo possivelmente surgiu devido a produção de gás carbônico no processo
oxidativo, que foi associada a uma suposta fermentação75. Por fim, as folhas são tostadas, e
o processo oxidativo é interrompido pela aplicação de calor.
No Brasil, o chá mais consumido é o chá mate que é obtido a partir de folhas de Ilex
paraguarensis, encontrada principalmente no Brasil, Paraguai e Argentina. A erva mate,
também bastante consumida, difere em sua produção do chá mate somente pela ausência da
etapa de tostagem. A matéria-prima (folhas, ramos verdes) é beneficiada em diversas
formas pela indústria e comercializada como chás, pó solúvel, essências e erva para
chimarrão e tererê. Esta produção está concentrada nos estados da região Sul e Mato
Grosso do Sul.

4
A erva mate é consumida em três formas principais: (1) a forma tradicional na qual
a erva é colocada em copo com água quente (70-85oC), conhecido como chimarrão; (2)
similar a tradicional, com temperatura da água mais baixa (5-10oC), mais consumida em
regiões quentes e conhecido como Tererê; (3) por infusão de maneira similar aos chás verde
e preto20,65.
Polifenóis de chá
O efeito benéfico do consumo de chás levou em anos recentes a um aumento
significativo do número de trabalhos científicos que tem tentado demonstrar a provável
ação biológica, atribuída principalmente aos polifenóis.
Entre os polifenóis, os mais largamente encontrados em alimentos são os
flavonóides. Estes são metabólitos secundários sintetizados por plantas, nas quais possuem
propriedades que vão desde a pigmentação a importantes funções na sinalização entre as
plantas, fertilidade, defesa e proteção à radiação ultravioleta71,88.
Os flavonóides podem ser classificados em grupos como: flavonas, flavanonas,
isoflavonas, antocianinas, flavonóis e flavanóis. A estrutura dos flavonóides é baseada no
núcleo que consiste de dois anéis benzênicos A e B e um anel C (Figura 1), que pode ser
um pirano heterocíclico, como no caso de flavanóis (catequinas) e antocianidinas, ou
pirona, como no caso dos flavonóis, flavonas, isoflavonas e flavanonas, que possuem um
grupo carbonila na posição C4 do anel C. Os flavonóis são geralmente encontrados na
natureza em sua forma glicosídica, com exceção das catequinas. Os açúcares ligados na
posição 3 do anel C, são geralmente glicose, ramnose ou galactose e sua presença confere
caráter mais hidrossolúvel aos flavonóides.

5
O
OHOH
HOR2
OH
R1
O
O
43
56
78 2
2'3'
4'
5'6'
(A) (B)
A
B
C
Figura 1. Estrutura básica de flavonóides (A) e de flavonóis agliconas presentes em chás
(B).
O destaque no chá verde são os flavanóis ou catequinas (Figura 2) e no chá preto as
teaflavinas (Figura 3), que são formados pela condensação de catequinas duas a duas. Em
chá verde, as catequinas podem chegar a 75% do conteúdo de flavonóides e podem
influenciar o sabor da bebida, podendo servir como um indicativo da qualidade do produto.
Podem ocorrer reações químicas conhecidas como epimerização durante o processamento
ou preparação do chá, transformando as catequinas majoritárias em seus isômeros81.
R1 R2
Miricetina OH OH
Quercetina OH H
Kaempferol H H

6
O
OH
HO
OHOH
O
OH
HO
OH
OH
OH
OH
CO
O
O
OH
HOOH
OH
OH
OH
O
OH
HOOH
OHOH
OH
OH
OH
CO
O
OH
(+) - Catequina
O
OH
HO
OHOH
OH
(-)-Epicatequina(-)-Epigalocatequina
OH
(-)-Epicatequina galato (-)-Epigalocatequina galato
Figura 2. Estruturas das principais catequinas encontradas em chás.

7
OHO
OH
O
HO
HO OH OH
O
OH
OH
OHOH
OHCO
O
OHO
OH
O
HO
HO OH
O
OH
OH
OHOH
OHCO
O
OH
OHHO
CO
O
Teaflavina 3'-galato (TF3)Epicatequina + Epigalocatequina Galato
Teaflavina 3,3'-digalato (TF4)Epicatequina galato + Epigalocatequina galato
OHO
OH
O
HO
HO OH OH
O
OH
OH
OH
Teaflavina (TF1)Epicatequina + Epigalocatequina
OHO
OH
O
HO
HO OH
O
OH
OH
OH
HO OH
OH
CO
O
Teaflavina 3-galato (TF2)Epicatequina Galato + Epigalocatquina
Figura 3. Estruturas das teaflavinas encontradas em chás.

8
Em chá preto as teaflavinas são responsáveis pelo desenvolvimento de sabor na
infusão e também contribuem para o desenvolvimento de cor, variando de amarelo a
marrom8.
Efeitos benéficos à saúde
Os polifenóis, até pouco tempo, eram considerados como anti-nutrientes.
Posteriormente, a constatação da sua ação antioxidante promoveu novo interesse em
relação ao seu papel benéfico à saúde humana12.
Vários estudos foram publicados nos últimos anos sobre os benefícios dos
polifenóis na saúde humana19,23,28,29,49,68,76.
Estudos in vitro encontram-se bem avançados, e mostram possíveis mecanismos de
ação de catequinas e teaflavinas nas diversas etapas do desenvolvimento do câncer.
Resumidamente, na etapa de iniciação, os mecanismos são: redução da formação72 e
ativação do carcinógeno66, aumento da detoxificação do carcinógeno44, redução da ligação
carcinógeno-DNA43, atividade antioxidante91 e redução da alquilação do DNA70. Na etapa
de promoção, os mecanismos são os seguintes: redução na ligação do promotor1,21,92,
proteção da comunicação célula-célula46 e redução da lipoperoxidação30. Na etapa de
progressão, há uma diminuição da conversão da célula benigna a maligna42 e diminuição do
crescimento de tumores5,58.
Em animais (ratos) catequinas e teaflavinas reduziram a proliferação ou número de
tumores gastrointestinais22 ,do estômago79,93 ,do pulmão79,80,93 e da pele54 em experimentos
induzidos por compostos como teleocidina, azometano, nitrosamina, luz ultravioleta B,
entre outros.

9
Papilomas provocados por nitrosamina, acetato de tetradecanoiforbiol, antraceno e
luz ultravioleta regrediram ou foram inibidos quanto ao seu crescimento em peles de
ratos80. Extratos de chá verde tiveram ação em dois importantes estágios (iniciação e
propagação) de tumores de estômago e pulmão em ratos42.
Os estudos epidemiológicos, porém, vêm fornecendo resultados não conclusivos ou
inconsistentes. Kono e colaboradores48 no Japão, relataram a correlação inversa entre o
consumo de chá verde e a incidência de câncer gástrico em 2.991 indivíduos. Outro estudo
no Japão, conduzido com 8.000 pessoas, revelou uma correlação direta entre o consumo de
chá preto e câncer no reto, enquanto que para o de próstata a correlação foi inversa25.
Tajima e Tominaga74 não constataram uma correlação significativa entre o consumo de
chás verde e preto com o risco de câncer de estomago e cólon em 550 japoneses. Outro
estudo, com 12.763 homens, não encontrou relação entre o consumo de flavonóis e
flavonas com a mortalidade por câncer de pulmão e colo-retal27. Outros estudos foram
conduzidos e todos eles tiveram resultados promissores, porém, ainda não conclusivos
sobre o efeito benéfico do consumo de chás em relação à incidência de várias
doenças39,73,76.
Os estudos epidemiológicos, portanto, ainda não fornecem suficiente suporte à idéia
do aumento do consumo de chá para a proteção contra câncer, embora exista alguma
evidencia que o chá verde em grandes quantidades pode proporcionar algum benefício na
prevenção do câncer do trato digestivo, especialmente câncer gástrico.

10
Métodos analíticos
Cromatografia líquida de alta eficiência
A técnica analítica mais utilizada para as análises de polifenóis em chá tem sido a
cromatografia líquida de alta eficiência (HPLC). O primeiro trabalho para este fim foi
publicado em 1976 por Hoefler e Coggon31, envolvendo a identificação de 5 catequinas na
infusão de chá verde. A separação foi pobre em termos cromatográficos, mas como marco
inicial, merece destaque, pois representa o início dos trabalhos com catequinas em chá. A
Tabela 1 apresenta os principais métodos relatados na literatura, bem como suas
características principais.
A HPLC no modo fase reversa tem sido o mais usado para a separação dos
polifenóis, com a fase estacionária C18, sendo a preferida pela grande maioria dos autores.
As fases móveis mais comumente empregadas consistem de acetonitrila ou metanol
em uma mistura ácida diluída com ácido acético18,63 ou acido fórmico40,53 em concentrações
que não ultrapassam 1.0%. Em alguns casos se utiliza solução tampão fosfato pH=2,4,
como no caso do trabalho de Hertog et al.26 ou mesmo com a utilização de tampão acetato
como no caso do trabalho de Karakaya e Ei41. Dalluge e colaboradores16 compararam várias
fases estacionárias e condições de eluição e observaram que a utilização de fases
estacionárias com máxima cobertura e sílica ultrapura melhorou a separação
cromatográfica, e a presença do ácido na fase móvel foi essencial para a separação. As
fases móveis utilizando metanol foram piores que aquelas com acetonitrila como solvente
base.

11
Tabela 1. Métodos por cromatografia líquida de alta eficiência para a análise de polifenóis em chás.
Analitos Coluna
(comp. x diametro interno (mm)
Fase móvel Temperatura (°C)
Detecção (nm)
Padrão interno Referência
Catequinas Hypersil ODS 3 µm 250 x 4,0 5% ácido acético, MeOH PCR 77
EGCg, ECg, EGC, EC, TB, cafeína Tosoh ODS-80Ts 250 x 4,6
20 mmol/L fosfato (pH 3.0) ACN 45 207 86
EGCg, Ecg, EGC, EC, C, TF Hypersil 3µm ODS 100 x 4.6
0.5% ácido acético, 30% ACN 0.5% ácido acético,
69.5% água 280
(450 TF) 69
EGCg, EcCg, EGC, EC, GC, C, GCg, Cg, cafeína
Develosil ODS-HG 150 x 4.6
94.5% água, 4.5% ACN 0.05% ácido fosfórico,
49.95% água, 50.00% ACN,
0.05% ácido fosfórico
40 231 24
EGCg, ECg, EGC, EC, cafeína Capcell pak C18 UG 120 200 x 4,6
6% ACN,11% MeOH, 0.5% ácido fosfórico, 82.5%
água 40 270 34
EGCg, ECg, EGC, EC, cafeína Hypersil ODS 5 µm 250 x 4,6
12% acetonitrila, 2% acetato de etila,0.04% H2SO4
280 (+)-catequina 96
EGCg, ECg, EGC, EC, cafeína Altima C18 250 x 4,6
tampão acetato (1 mmol/L, pH 4.5)
ACN 210 naringenin
a 14
EGCg, Ecg, EGC, GCg, C Zorbax Eclipse XDB-C18 250 x 4,6 0.05% TFA, 60% MeOH,
40% acetonitrila, 0.05% TFA 210 naringenin
a 16
EGCg, Ecg, EGC, EC, cafeína, TP, Tb, GCg, Cg
Cosmosil C18-MS 250 x 4,6
20% MeOH, 0.3% ácido fórmico, 79.7% água
99.7% MeOH, 0.3% água 280 53
EGCg, Ecg, EGC, EC, catequinas minoritárias
Nucleosil 100-5 C18 250 x 4,6
0.05 M ácido fosfórico, 60% água,
40% ACN, 0.05 mol/L ácido fosfórico
280 67

12
Cafeína, TB, Ecg, EGCg, ácido clorogênico
Hypersil 5 µm ODS 250 x 4,6 2% ácido acético, ACN 280, 380,
460, 510 7
C,EC,EGC,EGCg,EGC,GC, Caf, GCg Kingsorb 5um, 150 x 4,6
MeOH /água/ácido fosfórico (20/79.9/0.1) 30 210 82
GC,EC,ECG,EGC,EGCG,Cafeína, adenina,TF,GA,CA
Partsphere 5um C18 110 x 4,6
(A) 5% ACN(0.035%) TFA (B) 50% ACN (0.025%) TFA 32 205 51
Miricetina,Quercetina e Kaempferol Kingsorb 5um, 150 x 4,6
30% ACN, 0.025MKH2PO4 pH=2.5 30 370 83
GA,EGC,EGCG,EC,ECG,CA,Cg Adsorbosil C18 250 x 4,5
água/ácido acético (97:3) (A) MeOH (B) 280 98
(+)-GC, (-)-GC, EGC, (+)-C, (-)-C, Caf, (-)-EGCG, (-)-EC, GCG, ECG, C
Wakosil-II 5um C18 HG 150 x 3,0
água/MeOH/ácido fosfórico (85/15/0.1) 40 280 59
Cafeína, C, EC, GC, EGC,ECg,EGCg Phenomenex C18 5um 300 x 4,6 280 84
Cafeína,EGC,C,EC,EGCg,ECg e TF Xterra Waters RP C18 23.5um 100 x 3,9
água/ACN/TFA (919/80/1) (A) água/ACN/MeOH/TFA
(699/270/30/1) (B) 35 280 56
TB,GC,EGC, C,Cafeína,EC,EGCg,GCG,ECg
Mightysil RP-18 5um 150 x 4,6
ACN (A) ACN +
0.05% ácido fosfórico (B)
40 231 94
EGCg, Epigalocatequina galato; ECg, Epicatequina galato; EGC, Epigalocatequina; EC, Epicatequina; C, catequina; GCg, Galocatequina galato;
EGCg, Epigalocatequina galato; ACN, acetonitrila; TFA, ácido trifluoroacético

13
O detector mais usado é, sem dúvida, o arranjo de diodos (DAD), pois os
flavonóides apresentam duas bandas características com máximos entre 300 a 550nm
(banda I) e 240 a 285nm (banda II). O comprimento de onda utilizado para a detecção varia
bastante, sendo que os comprimentos mais utilizados são 280nm2,9,53,63,69 e 210nm16,51,82.
Alguns autores justificam o uso de 210nm pela relação sinal:ruído apresentada.
Eletroforese capilar
Recentemente, a eletroforese capilar (CE) tem sido utilizada, oferecendo
custo/volume reduzido de reagentes, rapidez nas análises e condicionamento da
instrumentação, entre outras vantagens. Vários métodos foram publicados para a separação
e quantificação de catequinas em chás. Entre as técnicas, a eletroforese capilar de zona
(CZE)3,34 e a cromatografia micelar eletrocinética (MEKC)10,11,32,35,57,85 tem sido as mais
empregadas, tanto para folhas frescas quanto para infusões. A Tabela 2 detalha os 18
métodos relatados, com a utilização de CE nos diversos modos de operação.
Lee e Ong51 compararam HPLC e CE na análise de catequinas e teaflavinas em chá.
As condições analíticas foram otimizadas para os dois métodos e ambos mostraram-se
confiáveis e aplicáveis ao uso em rotina.
Métodos por MEKC oferecem melhores alternativas em relação aos métodos
iniciais por CZE, por sua versatilidade e rapidez, entre outras vantagens. Recentemente,
métodos utilizando a técnica de MEEKC (cromatografia eletrocinética micelar em
microemulsão)36,38,62 tem sido utilizados como técnica alternativa a ME

14
Tabela 2. Métodos eletroforéticos (CZE , MEKC e MEEKC) para análise de polifenois em chás.
Método Analitos Dim. Capilar (cm x µm) Eletrólito Detecção
(nm) Voltagem (kV) Temeratura (°C)
Tempo de corrida (min)
Ref
CZE EGCg, Ecg, EGC, EC, C tiamina, cafeina, ácido
ascórbico 77 x 50 20 mmol/L borato (pH 8,0) 200 30 23 11 34
CZE EGCg, ECg, EGC EC, C, ácido gálico, adenina 77 x 57 150 mmol/L borato (pH 8,5) 210 20 20 20 3
MEKC EGCg, Ecg, EGC
EC, C, tiamina, cafeína, ácido ascórbico
75 x 57
50 mmol/L ácido bórico, 10 mmol/L fosfato
50 mmol/L SDS, 10% MeOH (pH 8,4)
194 270 25 3 11 32
MEKC EGCg, Ecg, EGC, EC,
tiamina, Cafeína, ácido ascórbico
75 x 57
50 mmol/L borato, 10mmol/L fosfato
50 mmol/L SDS, 10% MeOH (pH 8,2)
200 270 25 20 -
35
MEKC EGCg, Ecg, EGC, EC, C, Cg, GCg, cafeína, ácido
ascórbico 50 x 36
25 mmol/L SDS, 25 mmol/L fosfato
50 mmol/L borato (pH 7,0) 280 20 20 10 85
MEKC EGCg, Ecg, EGC, EC, C, GCg, cafeína 50 x 85 20 mmol/L borato - fosfato
25mmol/L SDS (pH 7,0) 200 30 21 20 10
MEKC EGCg, Ecg, EGC, EC, C, Gg 50 X 67
20 mmol/L borato, 110 mmol/L SDS, 14% MeOH 1.5% uréia,
1mmol/L, β-CD (pH 8,0)
280 20 20 30 57
MEKC EGCg, Ecg, EGC, EC,
cafeína, TB, ácido clorogênico
50 x 64,5
20 mmol/L SDS, 50 mmol/L fosfato
50 mmol/L borato, 1.0% acetonitrila
278 - 25 20 50
MEKC
C,CG,EC,EG,EGC,TF,TF2, TF3,TF4,Cafeína,
adenina, Q,GA,CA
40 x 50 500 mmol/L borato, 200 mmol/L fosfato,
20 mmol/L β-CD, acetonitrila 205 25 30 10 51
MEKC C, EC, EG, CG, EGCg, ECG, cafeína 50 x 50 100 mmol/L SDS, 90% fosfato 20
mmol/L, pH 2,5, 10% MeOH 195 - 25 22 90
MEKC C,EC,EGC,ECg,EGCg, tiamina, GA 58 x 50
25 mmol/L fosfato (pH=7.)
100 mmol/L SDS e 6% MeOH
200 14 25 13 4

15
NACE TF’s (chá preto) 40 x 50 71% acetonitrila ,25% MeOH, 0,1M KOH, 4% ácido acético, 90 mmol/L acetato de amônio
380 22.5 18.5 10 89
MEKC
GC, C, EGC, EGCg, EC, ECg,
GCg, Teofilina, Teobromina,
ácido gálico, cafeína
40 x 50 20 mmol/L fosfato, 50 mmol/L borato
200 mmol/L SDS (pH 7.0) 200 20 29 5 11
MEKC EC,EGC,C,EGCG,EGC, Cafeína 77x50 25 mmol/L fosfato pH=7.0
20 mmol/L SDS 200 27 - 29 87
-20
MEKC & MEEKC
(comparação)
ácido sivingico, ácido p-coumárico,
ácido vanilico, ácido caféico, GA, 3,4-
dihidroxibenzóico, 4-hidroxibenzóico,
catequina, epigalocatequina,
epicatequina galato, epigalocatequina galato,
epicatequina, galocatequina, cafeína e teofilina
48,5 x 50
MEKC: 2.89% SDS, 2% MeOH, e 95.5% fosfato 25 mmol/L pH 2.0
MEEKC: 2.89% SDS. 1.36%
heptano, 7.66% ciclohexanol, 2% acetonitrila e 86.1% fosfato
(25 mmol/L, pH 2.0)
200
-27
35 14 37
MEKC
(+)-C,(-)-C,(+)-EC,(-)-,CG, (-)-EGC,(-)-EGCG, (-)-
ECg, (-)-EGCg,(-)-ECg, Cafeína
64,5 x 50 200 mmol/L borato-20 mmol/L fosfato (pH 6.4) 240 mmol/Le
25 mmol/L 6G-β-CD 210 25 20 35 47
MEEKC EC,C,EGCg,ECg,EGC,GC 47,5 x 50
50 mmol/L fosfato,PH2.0 SDS (2.89%)
co-surfactante (2-propanol, isobutanol ou ciclohexanol (3.66%
a 7.66%) e acetato de etila, cliclohexano, heptano ou octano
(1.36%) borato 55 mmol/L (pH=8)
200 -20 30 16-24 38
MEEKC ECg, EGCg, EC, C, EGC, GC, cafeína. teofilina 24 x 50
50 mmol/L fosfato (pH 2.5) surfactante SDS (2.31% a 2.89% e
n-heptano (1.36%) e nove alcoois
(co-surfactantes): (1-butanol ou tert-butanol ou 1-
pentanol ou 2-pentanol ou 3-pentanol ou ciclopentanol ou 1-
hexanol ou 2-hexanol e ciclohexanol)
230 -10 40 10-18 62
EGCg, epigalocatequina galato; ECg, epicatequina galato; EGC, epigalocatequina; EC, epicatequina; C, catequina; GCg, galocatequina galato;.Cg, catequina galato; TF, teaflavina; GA, ácido
gálico; CA, ácido cafeico; TP, teofilina; TB, teobromina;

16
MEKC foi comparado a HPLC na análise de catequinas (11) em chá verde sob
condições otimizadas, e apresentou vantagens sobre HPLC, principalmente em tempo de
análise (separação em menos de 4,5 minutos de corrida para 7 catequinas) e limites de
detecção 20 a 100 vezes menores que HPLC. O método por HPLC, no entanto, apresentou-
se mais robusto que MEKC.
A separação de catequinas em chá verde foi estudada por CZE34 e MEKC32,33 e
ambas técnicas mostraram-se dependentes da formação de um complexo com borato, o qual
foi usado como um dos componentes do eletrólito.

17
Espectrometria de massas
A espectrometria de massas (MS) tem se tornado uma ferramenta indispensável em
laboratórios analíticos modernos, tanto como instrumento utilizado em separado, ou quanto
acoplado a uma técnica de separação, como a cromatografia gasosa de alta resolução,
HPLC ou CE. Diferentes sistemas de espectrometria de massas têm sido utilizados,
incluindo bombardeamento rápido de átomos (FAB/MS)78, ionização química a pressão
atmosférica (APCI/MS)95 e ionização eletrospray (ESI/MS)17 para as análises em chás. A
Tabela 3 traz um resumo dos métodos publicados, utilizando a MS na determinação de
polifenóis em chá.
O primeiro trabalho com a utilização de HPLC-MS para a separação e identificação
de catequinas em um extrato de chá foi publicado em 199352, utilizando-se o modo de
ionização “termospray”. HPLC-ESI/MS foi utilizada para catequinas em plasma humano e
chá verde por Miketova et al.55. Neste e no trabalho de Poon64, a espectrometria de massas
foi também diretamente empregada, sem a utilização de HPLC.
A interface APCI-MS95 forneceu informações sobre a massa molecular e
informações sobre as fragmentações produzidas. Todas as catequinas analisadas
produziram o íon m/z=139, sendo que este íon foi derivado do anel A destes compostos.
Del Rio et al.17, utilizaram HPLC-MS para a análise de mais de 30 compostos
fenólicos, incluindo catequinas, teaflavinas e derivados glicosilados de flavonóides.
Infusões de chá verde e preto foram injetadas em HPLC, usando dois gradientes diferentes,

18
Tabela 3. Aplicações de espectrometria de massas na análise de fenólicos em chás.
Composto/matriz
Dimensões coluna (mm)
Fase móvel Modo de operação/interface Referência
EGCg, Ecg, EGC, EC (chá verde)
Zorbax Eclipse C18 300 x 4.6
5 mmol/L acetato de amônio, 0.05% TFA
5 mmol/L acetato de amônio , 0.05% TFA
40% ACN, 60% MeOH (gradiente)
[M+H]+íons ESI 15
EGCg, Ecg, EGC, EC (chá verde)
Waters C18 250 x 2.0
30% MeOH, 0.05% TFA (gradiente)
[M+H]+ íons MS-MS, CID 52
Ácidos cafeoilquínicos, ácidos coumaroilquínicos, TF’s e TR’s
(Chá preto)
Waters C18 250 x 4.6
0.1 mol/L acetato de amônio 10% MeOH
[M+H]+íons TSI
45
27 Compostos fenólicos (Ilex paraguarienses)
Nucleosil 120 C18 250 x 4.6
ácido fórmico 1% (A) e ACN (B) (gradiente binário)
[M+H]+íons
ESI 13
Catequinas, ácido gálico, ácido quínico, ácido
coumaroilquínico - - [M+H]+íons
ESI 64
Flavonóis, TF’s, hidroxinamatos e alcalóides
(chá preto e chá verde)
Phenomenex RP-Max C12 250 x 4.6
ACN, água e ácido fórmico (1%) (gradientes diversos)
[M+H]+ e [M+H]- ESI, MSn 17
Catequinas (chá verde e chá preto)
Zorbax Eclipse XBD C18 250 x 4.6
água (0.05% TFA) (A) e ACN (0.05% TFA) (B) (gradiente linear)
[M+H]+
APCI 95
Catequinas (chá verde) Zorbax SB C18 150 x 2.1
ACN/acetato de amônio (10%/2mM pH5.0)
(gradiente)
[M+H]+e [M+H]+
EI e ESI
55

19
Catequinas e cafeína (chá verde
e tintura de chá verde)
Altima C18 250 x 4.6
água (0.1% TFA) (A) e ACN (B) (gradiente)
[M+H]+ FAB, PB/GD
78
Catequinas (chá verde) Phenomenex Luna C18
250 x 4.6 250 x 3.0
água/MeOH/ácido fórmico (A) (74.7/25/0.3)
ACN/ácido fórmico (B) (99.7/0.3)
(gradiente linear)
[M+H]+ API / ESI 61
Catequinas (chá verde) Phenomenex Luna C18
250 x 4.6
água/MeOH/ácido fórmico (A) (74.7/25/0.3)
ACN/ácido fórmico (B) (99.7/0.3)
(gradiente linear)
[M+H]+ API / ESI 60
Chá verde, chá preto e chás do mediterrâneo
Supersphere 100 C18 125 x 2.0
água/ACN (2.5%) (A) MeOH/ água (2.5% ACN) (B)
(gradiente)
[M+H]+ ESI 6
Teamina, catequinas, metilxantinas e ácido
clorogenico (chá verde e chá preto)
Spherigel C18 250 x 4.6
ácido fórmico 0.5% (A) ACN (B)
(gradiente)
[M+H]+ e [M+H]-
ESI 97
EGCg, epigalocatequina; ECg, epicatequina galato; EGC, epigalocatequina; EC, epicatequina; TF, teaflavina; TR, tearrubina; TFA, ácido
trifluoroacetico; EI, impacto eletrônico; ESI, ionização eletrospray; FAB, Bombardeamento rápido de átomos; MS, Espectrometria de massas;
APCI, Ionização química à pressão ambiente; CID, detector de ionização química; TSI, ionização termospray; ACN, acetonitrila; TFA, ácido
trifluoroacético.

20
e os compostos identificados por tempo de retenção, espectros de absorção UV-VIS e de
massas.
Pelillo et al.61 analisaram extrato de chá verde por HPLC-DAD e HPLC-MS. Foram
inicialmente testadas colunas com diâmetros internos diferentes (3,0mm e 4,6mm),
mostrando limites de detecção melhores para a coluna de 4,6mm. Posteriormente, as
catequinas foram identificadas, utilizando a interface “eletrospray”.
Neilson et al.56, utilizaram a técnica HPLC-ESI/MS para identificação
complementar aos dados obtidos por DAD. O trabalho enfatizou principalmente a rapidez
nas análises (5 min para as catequinas e 10 min para as teaflavinas). Baseando-se nas
fragmentações e valores de absorção máxima, os autores puderam identificar catequinas e
teaflavinas em chá verde, verde descafeinado, “oolong” e chá preto.
A análise dos fenólicos principais de extratos e infusões de mate (Ilex paraguienses
St. Hil.) por HPLC-ESI/MS foi recentemente publicada. Neste trabalho isômeros do ácido
cafeoilquínico foram identificados, bem como alguns compostos glicosilados derivados de
quercetina e kaempferol13.
Considerações finais
A introdução de equipamentos modernos e sofisticados vem proporcionando uma
riqueza de informações não apenas sobre a composição e as propriedades dos componentes
de alimentos, com implicações marcantes no controle de qualidade dos alimentos como no
seguimento dessas substâncias ao longo das vias metabólicas e a elucidação da relevância
dos metabólitos na saúde. Em relação aos flavonóides de chás, a utilização de HPLC, CE e
MS, inclusive HPLC-MS, vem contribuindo de maneira altamente significativa para melhor

21
entendimento das propriedades químicas, ocorrência, variação na composição e os fatores
influentes e o comportamento destes durante processamento e estocagem. Com a
continuação de desenvolvimento metodológico e refinamento da instrumentação analítica,
as perspectivas de maiores avanços em análise e química de alimentos são ótimas.

22
PERES, R. G.; RODRIGUEZ-AMAYA, D. B. Methods for the determination of flavonoids
in tea: A review. Alim. Nutr., Araraquara, v. n., p. , 2007.
ABSTRACT: Green and black teas (Camellia sinensis) are widely consumed beverages in
the entire world, principally in the Orient and Europe. In the last decade, these beverages
have been subject of intense investigations in relation to their possible beneficial effects on
health. Catechins and theaflavins are the most important phenolics in green and black tea,
respectively. Possible therapeutic and pharmacological applications have also been
attributed to the infusions of “mate”, a drink widely consumed in Brazil, probably due to
caffeoylquinic derivatives and other phenolics. Modern analytical techniques, such as high
performance liquid chromatography (HPLC), mass spectrometry (MS) and capillary
electrophoreses (CE), have provided important data about the composition of phenolic
compounds in the above mentioned beverages. The present review article discusses
advances in instrumention and analytical methodology applied to phenolic compounds in
teas.
KEYWORDS: tea, polyphenols, flavonoids, HPLC, CE, MS

23
Referências bibliográficas
1. AGARWAL, R.; KATIYAR, S. K.; ZAIDI, S. A. I.; MUKTAR, H. (falta título). Cancer
Res., v.52, p.3582-3588, 1992.
2. AMAROWICZ, R.; SHAHIDI, F. A rapid chromatographic method for separation of
individual catechins from green tea. Food Res. Int., v.29, p.71-76, 1996.
3. ARCE, L.; RIOS, A.; VALCAREL, M. Determination of anti-carcinogenic polyphenols
present in green tea using capillary electrophoresis coupled to a flow injection system. J.
Chromatogr. A, v.827, p.113-120, 1998.
4. AUCAMP, J. P.; HARAB, Y.; APOSTOLIDES, Z. Simultaneous analysis of tea
catechins, caffeine, gallic acid, theanine and ascorbic acid by micellar electrokinetic
capillary Chromatography. J. Chromatogr. A, v.876, p.235 –242, 2000.
5. AUSTIN, C. A.; PATEL, S.; ONO, K.; NAKANE, H.; FISHE, L. M. Site-specific DNA
cleavage by mammalian DNA topoisomerase II induced by novel flavone and catechin
derivatives. Biochem. J., v.282, p.883-889, 1992.
6. ATOUI, A. K.; MANSOURI, A.; BOSKU, G.; KEFALAS, P. Tea and herbal infusions:
their antioxidant acivity abd phenlic profile. Food Chem., v.89, p.27-36, 2005.

24
7. BAILEY, R. G.; McDOWELL, I.; NURSTEN, H. E. Use of an HPLC photodiode-array
detector in a study of the nature of a black tea liquor. J. Sci. Food Agric., v.52, p.509-525,
1990.
8. BALENTINE, D. A.; WISEMAN, D. A.; BOUWENS, L. C. M. The chemistry of tea
flavonoids. Crit. Rev. Food Sci. Nutr., v.37, p.693-704, 1997.
9. BAPTISTA, J. A. B.; TAVARES, J. F. P.; CARVALHO, R. C. B. Comparison of
catechins and aromas among different green teas using HPLC/SPME-GC. Food Res. Int.,
v.31, p.729-736, 1998.
10. BARROSO, M. B.; VAN DE WERKEN, G. Determination of Green and Black Tea
Composition by Capillary Electrophoresis. J. High Res. Chromatogr., v.22, p.225-230,
1999.
11. BONOLI, M.; PELILLO, M.; TOSCHI, T. G. LERCKER, G. Analysis of green tea
catechins: comparative study between HPLC and HPCE. Food Chem., v.81, p.631-638,
2003.
12. BRAVO, I. Polyphenols: chemistry, dietary source, metabolism, and nutritional
significance. Nutr. Rev., v.56, p.317-333, 1998.

25
13. BRAVO, L.; GOYA, L.; LECUMBERRI, E. LC/MS Characterization of phenolic
constituents of mate (IIlex paraguienses, St. Hil.) and its antioxidant activity compared to
commonly consumed beverages. Food Res. Int., v.40, v.393-405, 2007.
14. BRONNER, W. E.; BEECHER, G. R. Method for determining the content of catechins
in tea infusions by high-performance liquid chromatography. J. Chromatogr., v.805,
p.137-142, 1998.
15. DALLUGE, J. J.; NELSON, B. C.; THOMAS, J. B.; WELCH, M. J.; SANDER, L. C.
Capillary liquid chromatography/electrospray mass spectrometry for the separation and
detection of catechins in green tea and human plasma. Rapid Comm. Mass Spec., v.16,
p.1753-1756, 1997.
16. DALLUGE, J. J.; NELSON, B. C.; THOMAS, J. B.; SANDER, L. C. Selection of
column and gradient elution system for the separation of cathechins in green tea using high-
performance liquid chromatography. J. Chromatogr. A, v. 793, p.265-274, 1998.
17. DEL RIO, D.; STEWART, A. J.; MULLEN, W.; BURNS, J.; LEAN, M. E. J.;
BRIGHENTI, F.; CROZIER, A. HPLC-MS analysis of phenolic compounds and purine
alkaloids in green and black tea. J. Agric. Food Chem., v.52, p.2807-2815, 2004.
18. DING, M.; YANG, H.; XIAO, S. Rapid, direct determination of polyphenols in tea by
reversd-phase column liquid chromatography. J. Chromatogr. A, v.849, p.637-640, 1999.
19. DUFRESNE, C.; FARNWORTH, E. Tea, kombucha, and health: a review. Food Res.
Int., v.33, p.409-421, 2000.

26
20. FILIP, R.; LOTITO, S. B.; FERRARO, G.; FRAGA, C. G. Antioxidant activity of Ilex
paraguariensis and related species. Nutr. Res., v.20, p.1437–1446, 2000.
21. FUJIKI, H.; YOSHIZAWA, S.; HORIUCHI, T.; SUGANUMA, M.; YATSUNAMI, J.;
NISHIWAKI, S. et al. Anticarcinogenic effects of (-)-epigallocatechin gallate. Prev. Med.
v.21, p.503-509, 1992.
22. FUJITA, Y.; YAMANE, T.; TANAKA, M.; KUWATA, K.; OKUZUMI, J.;
TAKAHASHI, T.; FUJIKI, H.; OKUDA, T. Inhibitory effect of (-)- epigallocatechin
gallate on carcinogenesis with N-ethyl-N’-nitro-N-nitrosoguanidine in mouse duodenum. J.
Cancer Res., v.80, p.503-505, 1989.
23. GELEIJNSE, J. M.; LAUNER, L. J.; HOFMAN, A.; POLS, H. A. P.; WITTERMAN,
J. C. M. The flavonoids may protect against atherosclerosis. Arch. Internal. Med., v.159,
p.2170-2174, 1999.
24. GOTO, T.; YOSHIDA, Y.; KISO, M.; NAGASHIMA, H. Simultaneous analysis of
individual catechins and caffeine in green tea. J. Chromatogr. A, v.749:295-299, 1996.
25. HEILBRUN, L. K.; NOMURA, A.; STEMMERMANN, G. N. Black tea consumption
and cancer risk: a prospective study. Brit. J. Cancer, v.54, p.677-683, 1986.
26. HERTOG, M. G. L.; HOLLMAN, P. C. H. VAN DE PUTTE, B. Content of potencially
anticarcinogenic flavonoids of tea infusion, wines and fruit juices. J. Agric. Food Chem.
v.41, p.1242-1246. 1993.

27
27. HERTOG, M. G. L.; KROMHOUT, D.; ARAVANIS, C.; BLACKBURN, H.;
BUZINA, R.; FIDANZA, F. Flavonoid intake and long-term risk of coronary heart disease
and cancer in the seven countries study. Arch. Internal. Med., v.155, p.381-386, 1995.
28. HERTOG, M. G. L. Epidemiological evidence on potencial health properties of
flavonoids. Proc. Nutr. Soc., v.55, p.385-397, 1996.
29. HIGDON, J. V.; FREI, B. Tea catechins and polyphenols: health effects, metabolism
and antioxidant functions. Crit. Rev. Food Sci. Nutr., v.43, p.89-143, 2003.
30. HO, C.; CHEN, Q.; SHI, H.; ZHANG, K.; ROSEN, R. T. Antioxidative effect of
polyphenol extract prepared form various Chinese teas. Prev. Med., v.21, p.520-525, 1992.
31. HOEFLER, A. C.; COGGON, P. Reversed-phase high-performance liquid
chromatography of tea constituents. J. Chromatogr. A, v.129, p.460-463, 1976.
32. HORIE, H.; KOHATA, K. Application of capillary electrophoresis to tea quality
estimation. J. Chromatogr. A, v.802, p.219-223, 1998.
33. HORIE, H.; KOHATA, K. Review analysis of tea components by high-performance
liquid chromatography and high performance capillary electrophoresis. J. Chromatogr. A,
v. 881, p.425-438, 2000.

28
34. HORIE, H.; MUKAI, T. KOHATA, K. Simultaneous determination of qualitatively
important components in green tea infusions using capillary electrophoresis. J.
Chromatogr. A, v.758, p.332-335, 1997.
35. HORIE, H.; YAMASAKI, Y.; YAMAUCHI, Y., KOHATA, K. Tea Res J. v.87, p89,
1999. (Citado por HORIE, H.; KOHATA, K. Review analysis of tea components by high-
performance liquid chromatography and high performance capillary electrophoresis. J.
Chromatogr. A, v.881, p.425-438, 2000.
36. HUANG, H.-Y.; WEI-CHIH, L. Analyses of phenolic compounds by microemulsion
electrokinetic chromatography. Electrophoresis, v.26, p.3134-3140, 2005.
37. HUANG, H. –Y.; YUN, H.; HSIN-HUI, L.; SZETSEN, L. Sample stacking for the
analysis of catechins by microemulsion EKC. Electrophoresis, v.28, p.1735-1743, 2007.
38. HUANG, H. -Y.; LIEN, W.-C.; CHIU, C.-W. Comparison of microemulsion
electrokinetic chromatography and micellar electrokinetic chromatography methods for the
analysis of phenolic compounds. J. Sep. Sci., v.28, p.973-981, 2005.
39. JI, B. Green tea and cancer. Food Chem. Toxicol., v.35, 529, 1997.
40. JUSTESEN, U.; KNUTHSEN, P.; LETH, T. Quantitative analysis of flavonols,
flavones, in fruits, vegetables and beverages by high-performance liquid chromatography

29
with photo-diode array mass spectrometric detection. J. Chromatogr. A, v.799, 101-110,
1998.
41. KARAKAYA, S.; EI, S. N. Quercetin, luteolin, apigenin and kaempferol contents of
some foods. Food Chem., v.66, p.289-292, 1999.
42. KATIYAR, S. K.; AGARWAL, R.; MUKHTAR, H. Protection against malignant
conversion of chemically induced benign skin papillomas to squamous cell carcionomas in
SENCAR mice by a polyphenolic fraction isolated from green tea. Cancer Res., v.53,
p.5409-5412, 1993.
43. KATIYAR, S. K.; AGARWAL, R.; WANG, Z. Y.; BHATIA, A. K.; MUKHTAR,
H. (-)-Epigallocateachin-3-gallate in Cammellia sinensis leaves from the Himalayan region
of Sikkim: inhibitory effects against biochemical events in tumor initiation in SENCAR
mouse skin. Nutr. Cancer, v.18, p.73-83, 1996.
44. KHAN, S. G.; KATIYAR, S. K.; AGARWAL, R.; MUKHTAR, H. Enhancement of
antioxidant and phase II enzymes by oral feeding of green tea polyphenols in drinking
water to SKH-1 hairless mice,: possible role in cancer chemoprevention. Cancer Res., 52,
p.4050-4052, 1992.
45. KIEHNE, A.; ENGELHARDT, U. H. Thermospray-LC-MS analysis of various groups
of polyphenols in tea II. Chlrorogenic acids, teaflavins and thearubins. Z. Lebensm.
Unters. Forsch. v.202, p.299-302, 1996.

30
46. KLAUNING, J. E. Chemopreventive effects of green tea components on hepatic
carcinogenesis. Prev. Med. v.21, p.510-519, 1992.
47. KODAMA, S.; YAMAMOTO, A.; MATSUNAGA, A.; YANAI, H. Direct
enantioseparation of catechin and epicatechin in tea drinks by 6-O-α-D-glucosyl-β-
cyclodextrin-modified micellar electrokinetic chromatography. Electrophoresis, v.25,
p.2892-2898, 2004.
48. KONO, S.; IKEDA, M.; TOKUDOME, S. KURATSUNE, M. A case-control study of
gastric cancer and diet in northerm Kyushu. J. Cancer Res. v.79, p.1067-1074, 1988.
49. KURODA, Y.; HARA, Y. Antimutagenic and anticarcinogenic activity of
teapolyphenols. Mut. Res.Fund. Mol. Mech. Mutagenesis v.436, p.69-97, 1999.
50. LARGER, P. J.; JONES, A. D.; DACOMBE, C. Separation of tea polyphenols using
micellar electrokinetic chromatography with diode array detection. J. Chromatogr. A,
v.799, p.309-320, 1998.
51. LEE, B.; ONG, C. Comparative analysis of tea catechins and theaflavins by hogh-
performance liquid chromatography and capillary electrophoresis. J. Chromatogr. A, 881,
p.439-447, 2000.
52. LIN, Y.; KWOKEI, J.; YANG, S. Characterization of flavonoids by liquid
chromatography tandem mass spectrometry. J. Chromatogr. A, v.629, p.389-393, 1993.

31
53. LIN, J.; LIN, C.; LIANG, Y.; LIN-SHIAU, S.; JUAN, I. Survey of catechins, gallic
acid and methylxantines in green, oolong, pu-erh black teas. J. Agric. Food Chem., v.46,
3635-3642, 1998.
54. LU, Y.; LOU, Y.; XIE, J.; YEN, P.; HUANG, M.; CONNEY, A. H. Inhibition effect of
black tea on the growth of established skin tumors in mice: effects on tumor size, apoptosis,
mitosis and bromodeoxyuridine incorporation into DNA. Carcinogenesis, v.18, p.2163-
2169, 1997.
55. MIKETOVA, P.; SCHRAM, K.; WHITNEY, J. L.; KERNS, E. H.; VALCIC, S.;
TIMMERMANN, B. N.; VOLK, K. J. Mass spectrometry of selected compounds of
biological interest in green tea extracts. J. Nat. Prod., v.61, p.461-467, 1998.
56. NEILSON, A. P.; GREEN, R. J.; WOOD, K. V.; FERRUZZI, M. G. High-throughput
analysis of catechins and theaflavins by high performance liquid chromatography with
diode array detection. J. Chromatogr A, v.1132, p.132-140, 2006.
57. NELSON, B. C.; THOMAS, J. B.; WISE, S. A.; DALLUGE, J. J. The separation of
green tea catechins by micellar electrokinetic chromatography. J. Microcolumn Sep., v.10,
671-679, 1998.
58. NISHIDA, H.; OMORI, M.; FUKUTOMI, Y. NINOMIYA, M.; NISHIWAKI, S.;
SUGANUMA, M.; MIRIWAKI, H.; MUTO, Y. Inhibitory effects of (-)-epigallocatechin
gallate on spontaneous hepatoma in C3H/HeNCrj mice and human hepatoma-derived
PLC/PRF/5 cells. J. Cancer Res., v.85, p.221-225, 1994.

32
59. NISHITANI, E.; SAGEGAKA, Y. M. Simultaneous determination of catechins,
caffeine and other phenolic compounds in tea using new HPLC method. J. Comp. Anal. 17
(5), p.675-685, 2004.
60. PELILLO, M.; BIGUZZI, B.; BENDINI, A.; TOSCHI, T.G.; LERCKER, V.G.
Preliminary investigation into development of HPLC with UV and MS-electrospray
detection for the analysis of tea catechins. Food Chem., v.78, p.369-374, 2002.
61. PELILLO, M.; BONOLI, M.; BIGUZZI, B.; BENDINI, A.; TOSCHI, T.G.;
LERCKER, V.G. An investigation in the use of HPLC with UV and MS-electrospray
detection for the quantification of tea catechins. Food Chem., v.87, p.465-470, 2004.
62. POMPONIO, R.; GOTTI, R.; LUPPI, B.; CAVARINI, V. Microemulsion electrokinetic
chromatography for the analysis of green tea catechins: Effect of the co-surfactant on the
separation selectivity. Electrophoresis, v 24, p.1658-1667, 2003.
63. PRICE, W. E. SPITZER, J. C. Variations in the amounts of individual flavanols in a
range of green teas. Food. Chem., v.47, p.271-276, 1993.
64. POON, G. K. Analysis of catechins in tea extract by liquid chromatography-
electrospray ionization mass spectrometry. J. Chromatogr. A, v.794, p.63-74, 1998.
65. RAMALHO, L. A.; SMORCEWSKI, M.; VALDEZ, E. C. Contenido Nutricional del
extracto acuoso de la yerba mate en tres formas diferentes de consumo. Aliment.
Latinoamer., v.255, p.48-52, 1998.

33
66. RODGERS, E. H., GRANT, M. H. The effect of the flavonoids, quercetin, myricetin
and epicatechin on the grow and enzyme activities of MCF7 human breast cancer cells.
Chem. Biol. Interaction, v.166, p.213-228, 1998.
67. SAIJO, R.; TAKEDA, Y. Nippon Shokuhin Kogaku Kaish, v.46, p. 138, 1999. (Citado
por DALLUGE, J.J.; NELSON, B.C. Determination of tea catechin J. Chromatogr. A,
v.881, p.414-424, 2000.
68. SCHRAMM, D. D.; GERMAN, J. B. Potencial effects of flavonoids on the etiology of
vascular disease. J. Nutr. Biochem., v.9, p.560-566, 1998.
69. SHAO, W.; POWELL, C.; CLIFFORS, M. N. The analysis by HPLC of green, black
and pu’ er teas produced in Yunnan. J. Sci. Food Agric., v.69, p.535-540, 1995.
70. SHI, S. T.; WANG, Z.; SMITH, T. J.; HONG, J.; CHEN, W.; HO, C.; YANG, C. S.
Effects of green tea and black tea on 4-(methylnitrosoamino)-1-(3-pyridyl)-1-butanone
bioactivation, DNA methylation and lung tumorigenesis in A/J mice. Cancer Res., 54:
4641-4647, 1994.
71. SMITH, D. A.; BANK, S. W. In: Middleton, E. HARBORNE, J. B. Plant flavonoids
in biology and medicine: Biochemical, pharmacological and structure-activity
relationship. New York: Alan R. Liss Inc. 1986.
72. STICH, H. F. Teas and tea components and inhibitors of carcinogen formation in model
systems and man. Prev. Med., v.21, p.377-384, 1992.

34
73. SUGANUMA, M.; OKABE, S.; SUEOKA, N.; SUEKA, E.; MATSUYAMA, S.;
IMAI, K.; NAKACHI, K.; FUJIKI, H. Green tea and cancer chemoprevetion. Mut. Res./
Rev. Mut. Res., v.428, p.339-344, 1999.
74. TAJIMA, K.; TOMINAGA, S. Dietary habits and gastro-intestinal cancers: a
comparative case-control study of stomach and large intestinal cancers in Nagoya, Japan. J.
Cancer Res., v.76, p.705-716, 1985.
75. TAKEO, T. Green tea and semi-fermented teas. In: WILSON, K. C.; CLIFFORD, M.N.
Tea: cultivation to consumption. London: Chapman & Hall, 1992.
76. TIJBURG, L. B. M.; MATTERN, T.; FOLTS, J. D. WEISGERBER, U. M.; KATAN,
M. B. Tea flavonoids and cardiovascular diseases: a review. Crit. Rev. in Food Sci. and
Nutr. v.37, p.771-785, 1997.
77. TREUTTER, D. Chemical reaction detection of catechins and proanthocyanidins with
4-dimethylaminocinnamaldehyde . J. Chromatogr. A, v.467, 185-193, 1989.
78. VENZIE, J. L.; CASTRO, J.; KRISHNA, M. V. B.; NELSON, D. M.; MARCUS, R. K.
Electron-impact and glow-discharge ionization LC-MS analysis of green tea tincture. Anal.
Bional. Chem., v.387, p.321-333, 2007.

35
79. WANG, Z. Y.; AGARWAL, R.; KHAN, W. A.; MUKHTAR, R. Protection against
benzo[a] pyrene- and N-nitrosodiethylamine-induce lung and forestomach tumorigenesis in
A/J mice by water extracts of green tea and licorice. Carcinogenesis v.13, p.1491-1494,
1992.
80. WANG, Z. Y.; HONG, J.; HUANG, M.; REUHL, K. R.; CONNEY, A. H.; YANG, C.
S. Inhibition of N-nitrosodiethylamine and 4-(methylnitrosoamino)-1(3-pyridyl)-1-
butanone- induced tumorigenesis in A/J mice y green tea and black tea. Cancer Res. v.52,
p.1943-1947, 1992.
81. WANG, H.; HELLIWELL, K. Epimerisation of catechins in green tea infusions. Food.
Chem., v.70, 337-344, 2000.
82. WANG, H.; HELLIWELL, K.; YOU, X. Isocratic elution system for the determination
of catechins, caffeine and gallic acid in green tea using HPLC. Food Chem., v.68, p.115-
121, 2000.
83. WANG, H.; HELLIWELL, K. Determination of flavonols in green and black tea leaves
and green tea infusions by high-performance liquid chromatography. Food Res. Int. v.34,
p.223-227, 2001.
84. WANG, H. F.; TSAI, Y. S.; LIN, M. L.; OU, A. S. Comparison of bioactive
components in GABA tea and green tea produced in Taiwan. Food Chem., v.96, p.648-
653, 2006.

36
85. WATANABE, T.; NISHIYAMA, R.; YAMAMOTO, A.; NAGAI, S.; TERABE, S.
Simultaneous analysis of individual catechins, caffeine, and ascorbic acid in commercial
canned green and black teas by micellar electrokinetic chromatography. Anal Sci., v.14,
435-438 ,1998.
86. WATANABE, N.; TERADA, K.; ISSHIKI, K.; J. Jpn. Soc. Food Sci. Technol. v.39,
p.907, 1992. (Citado por HORIE, H.; KOHATA, K. Review analysis of tea components by
high-performance liquid chromatography and high performance capillary electrophoresis.
J. Chromatogr. A, v.881, p.425-438, 2000.
87. WEISS, D.J.; ANDERTON, C.R. Determination of catechins in Matcha green tea by
micellar electrokinetic chromatography. J. Chromatogr. A, v.1011, 173-180, 2003
.
88. WINKEL-SHIRLEY, B. Flavonoid Biosynthesis. A colorful model for genetics,
biochemistry, cell biology, and biotechnology. Plant Physiol., v.126, p.485-493, 2001.
89. WRIGHT , L.P.; AUCAMP, J.P.; APOSTOLIDES, Z. Analysis of black tea teaflavins
by non-aqueous capillary electrophoresis. J. Chromatogr. A, v.919, 205-213, 2001.
90. WÖRTH, C.C.T.; WIEBLER, M.; SCHIMITZ, O.J. Analysis if catechins and caffeine
in tea extracts by micellar electrokinetic chromatography. Electrophoresis, v.21, p.3634-
3638. 2000.

37
91. XU, Y.; HO, C.; AMIN, S. G.; HAN, C.; CHUNG, F. Inhibition of tobacco-specific
nitrosamine-induced lung tumorigenesis n A/J mice by green tea and its major polyphenol
as antioxidants. Cancer Res., 52: 3875-3879.1992
92. YANAME, T.; TAKAHASHI, T.; KUWATA, K.; OYA, K.; INAGAKE, M.; KITAO,
Y.; SUGANUMA, M.; FUJIKI, H. Inhibition of N-methyl-N’-nitro-N-nitrosoguanidine-
induced carcinogenesis by (-)-epigallocatechin gallate in the rat glandular stomach. Cancer
Res., v.55, p.2081-2084, 1995.
93. YANG, G.; LIU, Z.; SERIL, D. N.; LIAO, J.; DING, W.; KIM, S.; BONDOC, F.;
YANG, C. S. Black tea constituents, theaflavins, inhibit 4-(methylnitrosoamino)-1-(3-
pyridyl)-1-butanone (NNK)-induced lung tumorigenesis in A/J mice. Carciogenesis, v.18,
2361-2365, 1997.
94. YANG, X. R.; YE, C. X.; XU, J. K.; JIANG, Y. M. Simultaneous analysis of purine
alkaloids and catechins in Camellia sinensis, Camellia ptilophylla and Camellia assamica
var. kucha by HPLC. Food Chem., v.100, p.1132-1136, 2007.
95. ZEEB, D. J.; NELSON, B. C.; KLAUS, A.; DALLUGE, J. Separation and
identification of twelve catechins in tea using liquid chromatography/atmospheric pressure
chemical ionization-mass spectrometry. Anal. Chem., v.72, p.5020-5026. 2000.
96. ZHU, Q. Y.; ZHANG, A.; TSANG, D.; HUANG, Y.; CHEN, Z.-Y. Stability of green
tea catechins J. Agric. Food Chem., v.45, p.4624-4628, 1997.

38
97. ZHU, X.; CHEN, B.; MA, M.; LUO, X.; ZHANG, F.; YAO, S.; WAN, Z.; YANG, D.;
HANG, H. Simultaneous analysis of theamine, chlorogenic acod, purine alkaloids and
catechins in green tea samples with the help of multi-dimension information of on-line high
performance liquid chromatography/electrospray-mass spectrometry. J. Pharm. and Biom.
Anal., v.34, p.695-704, 2004
98. ZUO, Y.; CHEN, H.; DENG, Y. Simultaneous determination of catechins, caffeine and
gallic acids in green, Oolong, black and pu-erh teas using HPLC with a photodiode array
detector. Talanta, v.57, p.307-316, 2002.

39
CAPÍTULO 2
Métodos por eletroforese capilar para a determinação de polifenóis e ácidos
orgânicos em vinhos: Uma revisão
RENATO G. PERES
DELIA B. RODRIGUEZ-AMAYA*
Artigo a ser submetido à Revista Instituto Adolfo Lutz

40
Métodos por eletroforese capilar para a determinação de
polifenóis e ácidos orgânicos em vinhos: Uma revisão
Renato G. PERES, Delia B. RODRIGUEZ-AMAYA* Resumo Compostos fenólicos ocorrem em vinho em abundância e tem sido objeto de inúmeras
pesquisas científicas nos últimos anos, devido aos supostos benefícios à saúde. Ácidos
orgânicos exercem influência direta na qualidade e propriedades sensoriais de vinhos, bem
como na sua estabilidade e controle microbiológico. A determinação tanto de compostos
fenólicos quanto de ácidos orgânicos em vinho é, portanto, de extrema importância. Nos
últimos anos a eletroforese capilar tem sido bastante utilizada na resolução de problemas
analíticos na área de ciência de alimentos, fornecendo informações sobre processamento,
controle de qualidade, adulteração, composição química, etc. Vem substituindo
gradativamente a cromatografia liquida de alta eficiência (HPLC) com vantagens que vão
desde baixo custo operacional até baixo consumo de solventes, rapidez, minimização do
preparo das amostras. Com fenólicos, a eletroforese capilar tem sido utilizada com sucesso
para a determinação de isômeros do resveratrol, ácidos fenólicos e flavonóides de maneira
geral. Em ácidos orgânicos sua utilização se dá nos modos de detecção direta e indireta.
Este artigo de revisão tem como objetivo a discussão do uso de eletroforese capilar na
análise de compostos fenólicos e ácidos orgânicos em vinhos.
Palavras-Chave: Ácidos orgânicos, Compostos fenólicos, Flavonóides, Eletroforese
Capilar, Vinho

41
Abstract Phenolic compounds occur in abundance in wine and have been the object of intensive
research in recent years because of their potential benefits to health. Organic acids have a
direct influence on the quality and sensory properties of wine, as well as in their stability
and microbial control. The determination of phenolic compounds and organic acids of
wine is, therefore, of paramount importance. In recent years, capillary electrophoresis (CE)
has been widely used in the resolution of analytical problems in food science, furnishing
information about processing, quality control, adulteration, chemical composition, etc. It is
gradually substituting high performance liquid chromatography, with the advantages of low
operational cost, low solvent consumption, short analysis time, minimal sample
preparation. With phenolics, CE has been successfully used for the determination of
resveratrol isomers, phenolic acids and flavonoids in general. With organic acids, this
technique has been employed in the direct and indirect mode. This review article has the
objective of discussing the use of CE in the analysis of phenolic compounds and organic
acids in wine.
Key words: Organic acids, Phenolic compounds, Flavonoids, Capillary electrophoresis,
Wine
*Endereço para correspondência: Departamento de Ciências de Alimentos, Faculdade de
Engenharia de Alimentos, Universidade Estadual de Campinas, C.P. 6121, CEP 13083-970.
Campinas, São Paulo, Brasil. Tel +55-19-35214013; Fax: +55-19-35212153.

42
Introdução
Com o advento do novo campo da promoção da saúde, dentro da medicina
preventiva, o melhor caminho para se alcançar a longevidade e o envelhecimento ameno, a
humanidade passou a ter grande interesse por alimentos funcionais, definidos como sendo
alimentos que proporcionam efeitos fisiológicos benéficos à saúde, além de satisfazer as
necessidades nutricionais clássicos. De acordo com Roberfroid1, um alimento funcional
deve ter relevante efeito na saúde e bem estar ou resultar na redução do risco de doenças. O
componente funcional pode ser um macronutriente, um micronutriente ou um componente
não nutritivo.
A procura por evidências científicas que pudessem comprovar e suportar hipóteses
de que alguns compostos de alimentos realmente trouxessem benefícios adicionais à saúde,
nos últimos anos, contribuiu para um aumento expressivo no número de publicações
científicas sobre a composição dos alimentos em termos das supostas substâncias bioativas.
Entre estas publicações, estão os estudos sobre os compostos fenólicos de vinho.
Por outro lado, existem compostos não considerados funcionais, como os ácidos
orgânicos, mas que exercem influência direta e importante em vinhos, como, por exemplo,
em propriedades sensoriais como sabor, cor e aroma, além de contribuírem a sua
estabilidade e controle microbiológico.
O presente artigo de revisão discute métodos eletroforéticos aplicados a compostos
fenólicos e ácidos orgânicos presentes em vinhos.

43
Compostos fenólicos em vinho
Fenólicos ocorrem em vinhos tintos em teores maiores (1000–4000mg/L) que nos
vinhos brancos (200-300mg/L). Vinho tinto contém uma predominância de compostos
solúveis em água que incluem ácidos fenólicos, o trihidroxistilbeno resveratrol, flavonóis,
flavanóis. Também há presença de grande quantidade de procianidinas (taninos) e
antocianinas (500-900mg/L)2-5. Vinhos tintos mais novos, geralmente, apresentam
relativamente altos níveis de procianidinas e antocianinas, conferindo ao vinho a cor
púrpura. A maturação dos vinhos tintos forma novos pigmentos oligoméricos e
monoméricos vermelho-alaranjados com massa molecular de 2000 a 4000 Daltons. A
figura 1 mostra as estruturas das principais classes de compostos presentes em vinho.
A contribuição dos fenólicos não está relacionada apenas a sua influência direta na
qualidade dos vinhos em propriedades enológicas importantes, como cor em vinhos tintos,
turvamento, aroma, adstringência, entre outros6, mas também com o possível benéficio do
consumo moderado de vinho na saúde.

44
OH
HO
OH
O
OH
O
OH
HO
R1
R3
R2
ESTILBENOS FLAVONÓIS
O
OHR1
R2
R3
O
OH
R2
R1
ÁCIDOS HIDROXIBENZÓICOS ÁCIDOS HIDROXICINÂMICOS
O+
OH
OH
OH
HO
R1
R2
O
OH
OH
HO
R1
R2
R3
ANTOCIANINAS FLAVANÓIS
Figura 1. Estruturas das principais classes de compostos fenólicos em vinhos.

45
O paradoxo francês, relatado por Renaud & de Lorgeril7, ganhou grande destaque,
pois, os autores constataram que apesar dos franceses possuírem hábitos não recomendáveis
como alta ingestão de gorduras saturadas e sedentarismo, a incidência de doenças
cardiovasculares na população em geral era relativamente baixa.
Este fenômeno foi reforçado por um estudo conduzido na Dinamarca por Gronbaech
et al8 onde pessoas que tomaram 3 a 5 taças de vinho por dia tiveram, independentemente
da idade ou educação, aproximadamente 50% menor risco de morte por doenças
cardiovasculares durante os 12 anos da pesquisa. O consumo de vinho foi também
associado com o baixo risco de morte por outras causas durante o período da pesquisa.
Outros estudos apresentaram evidências científicas que levam a crer que o consumo
moderado de vinhos reduz consideravelmente o risco de doenças cardiovasculares9-17.
Outro estudo importante conduzido por Renaud et al. (2004)18 acompanhou durante
8 anos (1978-1985) 36.583 homens franceses de meia idade, e observaram que o consumo
comedido de vinho tinto (equivalente a 60g etanol/dia) pode reduzir o risco de morte por
doença cardíaca em até 37% em comparação a população abstêmia, sendo o efeito mais
pronunciado quanto menor for a pressão sistólica média. Uma análise de 13 estudos
epidemiológicos envolvendo um total de 209.418 participantes demonstrou uma redução de
32% no risco de morte por doença aterosclerótica no grupo consumidor de vinho tinto (em
comparação à população abstêmia), redução maior que a de 22% observada para o grupo
consumidor de cerveja.
Estes efeitos benéficos do consumo de vinho foi atribuído aos antioxidantes
polifenólicos, tais como o resveratrol e as proantocianidinas, que na dieta francesa estão em
cerca de 1800-3000ug/L 19. Além dos polifenóis, o vinho contém etanol que, se consumido

46
em pequenas quantidades (1 a 2 doses por dia de qualquer bebida alcoólica), pode reduzir
em 20% o risco de isquemia cardíaca, além de aumentar o HDL colosterol em 12%.
Estudos in vitro indicam que o resveratrol pode atuar como cardioprotetor por uma
série de mecanismos, como: inibição da agregação plaquetária, da proliferação de celulas
musculares lisas e da oxidação do LDL-colesterol; redução da síntese de certos lipídeos e
eicosanóides que podem promover inflamação e aterosclerose; e supressão de certos tipo de
arritmia20. Outro estudo in vitro mostrou ainda a atividade anticarcinogênica e
quimiopreventiva do resveratrol, que pode atuar nas fases de iniciação, promoção e
progressão de células tumorais21.
Análise de fenólicos em vinho por eletroforese capilar
A cromatografia liquida de alta eficiência (HPLC) é, sem dúvida, a técnica mais
utilizada quando se busca informação mais completa sobre a composição de fenólicos em
alimentos. Em vinho, HPLC tem sido bastante utilizada na determinação de compostos
fenólicos com detecção espectofotométrica22-24. Mais recentemente, o acoplamento a
espectrometria de massas possibilitou a confirmação da identidade dos analitos, bem como
a obtenção de dados que podem ajudar na elucidação de mecanismos complexos e reações
envolvidos no envelhecimento de vinhos25-26. A HPLC, no entanto, está sendo
gradativamente substituído por electroforese capilar (CE).
A literatura nos últimos anos sugere que a eletroforese capilar tem se tornado uma
ferramenta indispensável em laboratórios analíticos modernos nas análises de alimentos.
Em CE, bebidas podem ser injetadas diretamente no capilar ou requerem pouco tratamento

47
da amostra, com apenas diluição ou filtração. Desvios padrão relativos entre 2 a 5% para
área do pico e 0.5 a 1.0% para tempo de migração, tem sido obtidos na análise de bebidas.
A eletroforese é uma técnica de separação de alta eficiência baseada na migração
diferencial de espécies iônicas ou ionizáveis quando submetidas a um campo elétrico27. Em
CE, a separação e conduzida em tubos de sílica fundida de dimensões capilares de 15 a
100μm de diâmetro interno, e 50 a 100cm de comprimento, preenchidos com um eletrólito
condutor, e submetidos a ação de um campo elétrico. Devido a fatores geométricos (a
relação entre a área superficial interna e volume é apreciavelmente grande), um capilar
possibilita a dissipação eficiente do calor gerado pela passagem da corrente elétrica (efeito
Joule). Além disso, a alta resistência elétrica do capilar permite o estabelecimento de
campos elétricos elevados (100 a 1000 V/cm), resultando em separações de alta eficiência
(geralmente excede 105 pratos teóricos), excelente resolução e tempos de análise bastante
curtos.
A utilização de capilares de sílica fundida introduziu à técnica uma importante
peculiaridade: a geração do chamado fluxo eletrosmótico. Este fluxo é conseqüência de
uma interação entre a solução e as paredes do capilar. Quimicamente, a sílica é
caracterizada pela presença de vários grupos silanóis, os quais, em média apresentam um
caráter ácido. Em contato com o meio aquoso, alguns destes grupos são ionizados e, com a
ionização, a superfície do capilar torna-se negativamente carregada, gerando um saldo
positivo de espécies carregadas positivamente na solução. Quando um campo elétrico é
imposto tangencialmente à superfície, forcas elétricas causam um movimento unilateral de
íons em direção ao eletrodo de carga oposta. Durante a migração, os íons transportam
moléculas de água, induzindo a um fluxo de solução como um todo, na direção do cátodo,
conhecido como fluxo eletrosmótico normal27-28. Para promover a inversão do fluxo, são

48
adicionados ao eletrólito condutor, surfactantes catiônicos, principalmente os derivados de
sais quaternários de amônio de cadeia longa. Desta forma, uma camada de semi-micelas é
adsorvida na superfície do capilar, promovendo a organização de uma camada de ânions na
solução, que sob a ação do campo elétrico, migra na direção do ânodo, definindo o
chamado fluxo eletrosmótico invertido29.
O volume de injeção é critico em CE. Por exemplo, um capilar de 1m x 75μm
(diâmetro interno) contem cerca de 5μL de tampão e o volume da amostra devera ser menor
que 50nL (para evitar carregamento excessivo).
Os métodos permitem a análise simultânea de uma faixa ampla de moléculas. Como
os polifenóis são moléculas geralmente carregadas em meio alcalino, são separados pelas
técnicas eletroforéticas.
A eletroforese capilar propriamente dita não é aplicável a moléculas sem carga.
Entretanto, a técnica desenvolvida por Terabe et al.30 chamada de cromatografia
eletrocinética micelar (MECK), a qual é híbrida da eletroforese e cromatografia e envolve a
introdução de um surfactante na solução tampão (por exemplo, SDS), é apropriada às
moléculas sem carga.
O uso de MEKC em análise de flavonóides tem recebido atenção31 e os fatores
como resolução, seletividade, voltagem aplicada, temperatura do capilar, concentração e
natureza do eletrólito tem sido estudados. A introdução de solventes orgânicos modifica a
interação entre as micelas e solutos, alterando a retenção e resolução32.
A separação dos flavonóides foi melhorada com a adição de SDS a pH 8,3, sendo
que o aumento do pH, por exemplo a pH 10,5, teve efeito nulo ou apenas pequena
influência. A separação procede pela ionização dos grupos hidroxilas33.

49
Em vinhos CE foi utilizada para a análise de flavonóides em diversas condições
experimentais. A Tabela 1 mostra as principais aplicações e características dos métodos,
em sua maioria nas modalidades de MEKC e CZE.
A análise de nove flavonóides em vinho, incluindo apigenina, luteolina,
naringenina, kaempferol, miricetina e quercetina, foi realizada por EC-UV34 onde as
condições experimentais do método foram: preparação de amostra por extração em fase
sólida (SPE), eletrólito de 35mM de bórax a pH 8.9, com detecção a 250nm.
O uso do detector eletroquímico em sistema de eletroforese na análise de vinho foi
proposto35 e o efeito do potencial do eletrodo, pH, tempo de injeção, voltagem e
concentração do tampão foram estudados. Após a otimização, foi escolhida como eletrólito
100mM tampão borato a pH 9.2, o tempo de corrida sendo vinte minutos. O método
otimizado foi aplicado à determinação simultânea de trans-resveratrol, epicatequina e
catequina em vinho tinto.
CE combinada a isotacofore foi utilizada para aumentar a capacidade de separação e
sensibilidade durante a análise por CZE de 14 flavonóides e fenólicos em vinho tinto36. Sob
condições otimizadas, o tempo de corrida foi de 45 minutos e o limite de detecção foi de
30ng/mL para ácidos fenólicos, 100ng/mL para quercetina e kaempferol e 250ng/mL para
catequina.
Vinte e cinco compostos polifenólicos em bebidas foram estudados por CE,
comparada a HPLC. Tampões clássicos foram utilizados (borato e fosfato) e a mistura dos

50
Tabela 1. Principais métodos eletroforéticos para polifenóis em vinhos.
Método Analitos Dimensões
capilar (cm x µm)
Eletrólito Detecção
Voltagem (kV)
Temperatura (°C)
Tempo de
corrida(min)
Referência
CZE Resveratrol 65 x 25 100 mmol/L borato (pH 9.24) eletroquímica 30 ambiente 35 Gao et al.41
MEKC resveratrol 57 x 75 20 mmol/L borato
25 mmol/L polietilino glicol 400, 25 mmol/L SDS
DAD 28 25 15 Brandolini et al 42
CZE 9 flavonóides 45 x 75 35 mmol/L borato, (pH 8.9) 250nm 24 ambiente 20 Wang et al.34
CE trans-resveratrol, epicatequina, catequina 70 x 25 100 mmol/L borato,(pH=9.2) eletroquímica 12 ambiente 20 Peng at al.35
CZE-ITP 14 fenólicos
ITP: 9.0 x 80
CZE: 16 x 30
Eletrólito 1: água/MeOH (4:1), 25 mmol/L MOPSO,
50 mmol/L tris, 15 mmol/L borato, pH 8.5, 0.2% 2-HEC,
5 mmol/L β-ciclodextrina
Eletrólito 2: água/MeOH (4:1) 25 mmol/L TAPS, 50 mmol/L tris 40
mmol/L borato, pH 8.7 0.2% 2-HEC, 5 mmol/L
β-ciclodextrina
254nm 27 25 45 Hamoudová et al.36
CZE 11 fenólicos 50 x 7 5 100 mmol/L borato (pH 9.5) 280nm 20 30 20
Garcia-Viguera et al.
Andrade et al. 37,38
CE ácidos fenólicos 43 x 50 50 mmol/L carbonato (pH 8.3) UV 15 25 15 Cartoni et
al.69
MEKC cis and trans-
resveratrol, quercetin, catequina, ácido galico
60 x 50
10 mmol/L fosfato, 6 mmol/L borato,
50 mmol/L deoxicolato de sódio (pH 9.3)
220nm 20 40 12 Prasongsidh et al 40

51
CZE cis- and trans-resveratrol 25 x 75 40 mmol/L borato (pH 9.5) 320nm 5 25 8 Berzas
Nevado71
CE 18 compostos 57 x 75 25 mmol/L fosfato e 10 mmol/L borato (pH 8.8) DAD 15 20 30
Minussi et al72
NACE quercetina, miricetina,
catequina,epicatequina e resveratrol
50;30;8.5x50 5 mmol/L ácido malônico, 9.6 mmol/L TBAOH em MeOH
(pH 13.5) 230nm 10-30 25 4-35 Demianová
et al73
CE, eletroforese capilar; CZE, eletroforese capilar de zona; MEKC, cromatografia eletrocinética micelar; ITP, isotacoforese; DAD, detector de arranjo de diodos;
NACE, eletroforese capilar em meio não aquoso; SDS, dodecil sulfato de sódio; TBAOH, hidróxido de tetradecil trimetilamônio; 2-HEC, 2-hidroxietileno celulose;
TAPS, acido 3-amino propanosulfônico N-[tris(hidroximetil)metil]; MOPSO, ácido β-Hidroxi-4-morfolino propanosulfonico.

52
mesmos, e ensaios foram realizados com aditivos como surfactante SDS (0.1M) e etanol
(5%). O tampão contendo 5% de etanol apresentou melhor separação dos padrões e com
adição de surfactante pôde ser separado um composto importante, o furfural. As técnicas
HPLC e CE foram complementares e puderam, em conjunto, permitir a caracterização
completa37,38.
Minussi et al.72 utilizou um método por CZE para determinação de 18 compostos
fenólicos em vinhos brasileiros, portugueses, chilenos e uma amostra argentina. Estes
autores também determinaram a atividade antioxidante através do cátion ABTS, utilizando
acido gálico como padrão.
Em vinhos portugueses, dez compostos fenólicos foram quantificados, comparando
HPLC e CZE. Pequenas diferenças nos teores foram encontradas como no caso do ácido
cafeico, com valores superiores encontrados no método por CE, e flavonóis como a
miricetina, kaempferol e quercetina que foram detectados por HPLC e não por CE. O
método por CE foi aplicado em vinhos do porto, estudando o envelhecimento relacionado
aos compostos fenólicos38.
Resveratrol, um dos compostos antioxidantes e cardioproteores mais importantes
encontrados em vinho39 em sua forma cis e trans, foi primeiramente determinado em uvas
e, posteriormente, em vinhos por eletroforese capilar juntamente com ácido gálico,
catequinas, quercetina, cis e outros fenólicos40. Foi utilizado o tampão fosfato-borato a pH
9.1, o tempo de análise sendo 11 minutos. Amostras e padrões foram injetadas sem
preparação previa. Geralmente estes compostos requerem métodos de pré-concentração ou
extração, pois apresentam-se em baixas concentrações. Outros autores relataram

53
metodologias para o resveratrol41,42,70 por eletroforese capilar, inclusive com um artigo
revisão43.
Análise de ácidos orgânicos em vinho por eletroforese capilar
A determinação de ácidos orgânicos em vinhos fornece informações relevantes no
monitoramento dos processos de fermentação, gerando informações importantes sobre a
estabilidade do produto, propriedades sensoriais (sabor, cor) e controle microbiologico44.
Freqüentemente os vinhos são produzidos em duas etapas ou duas fermentações
sucessivas. A primeira, a fermentação alcoólica, é realizada com leveduras, e a segunda, a
fermentação malolática, que envolve a conversão do acido málico em lático e dióxido de
carbono (CO2), por bactérias láticas.
Em vinhos, existe uma diferenciação entre os ácidos provenientes da uva (tartárico,
málico, cítrico) e ácidos que originam-se no processo de fermentação (succínico, acético e
lático). Pequenas quantidades de outros ácidos como galacturônico, glucorônico,
citramálico, dimetilglicérico, pirúvico e cetoglutárico também podem estar presentes44. O
controle dos ácidos orgânicos, portanto, possibilita um acompanhamento de etapas
importantes na produção de vinho, como processos de fermentação alcoólica e malolática e
processos ligados ao envelhecimento de vinhos. Ácido tartárico, por exemplo, é um
parâmetro critico para a estabilização do vinho. Os ácidos orgânicos ainda podem ser
considerados decisivos no controle de adulteração em vinhos.
Vários métodos têm sido propostos para a determinação de ácidos orgânicos em
vinhos como métodos enzimáticos e não-enzimáticos (Mato et al. 2005)46. Dentro os não
enzimáticos, foram utilizados métodos baseados em cromatografia em camada delgada

54
(TLC)45, cromatografia gasosa (GC)47, cromatografia líquida de alta eficiencia (CLAE)48 e
cromatografia de íons (IC)49.
Métodos eletroforéticos estão tornando mais preferidos e utilizados na análise de
ácidos orgânicos em vinhos devido as características como simplicidade, alta resolução,
preparação mínima de amostra, baixo consumo de reagentes e solventes, rápido
condicionamento do sistema de análise, entre outras. A Tabela 2 mostra um resumo dos
principais métodos para análise de ácidos orgânicos em vinho por eletroforese capilar de
zona (CZE).
A grande maioria dos métodos utiliza capilares de sílica fundida, geralmente de 50 a
75 um de diâmetro interno. Saavedra e Barbas (2003)50 empregaram capilares recobertos
com poliacrilamida que apresentaram excelente reprodutibilidade se comparados a
capilares convencionais. Os métodos principais utilizam detecção na região do UV e podem
ser divididos por modos de detecção, em detecção direta e indireta46.
Na detecção direta50-55, a absorção do eletrólito na região do UV é menor que a dos
ácidos, portanto, os analitos ao passarem pela janela de detecção do capilar geram sinal
positivo. No modo indireto 56-67, a absorção do eletrólito na região do UV é maior que a dos
analitos, ou seja, ao passarem pela janela de detecção, a absorbância decresce e são obtidos
picos negativos. Comprimentos de onda mais utlizados estão entre 185 e 254nm.

55
Tabela 2. Métodos eletroforéticos para ácidos orgânicos em vinhos.
Ácidos orgânicos Dim.
capilar (cm x µm)
Tampão Voltagem (kV) Detecção Temp.
(oC)
Tempo de corrida (min)
Referência
tartárico, málico, cítrico, succínico, acético, lático 67 x 70
7 mmol/L MES/His; 0,5 mmol/L TTAB; 30% MeOH
(pH 6)
-25 condutividade - 12 Huang et al.69
tártarico, málico 70 x 75 5 mmol/L ftalato; 0.5 mM TTAB; 50 mmol/L MES
(pH 5.2)
-30 indireta (205nm)
20 5 Kelly and Nelson56
tártarico, málico, lático 100 x 75
5 mmol/L ftalato; 0.5 mmol/L CTAB (pH 5.6)
-20 indireta (254nm)
20 20 Levi et al.57
málico, lático, acético, succínico, cítrico
60 x 77
5 mmol/L cromato; 0.154% (p/v) PDDPi cromato (pH 8)
-30 indireta (254nm)
- 8 Stathakis and Cassidy58
tartárico, málico, cítrico, succínico, acético.,
lático
80.5 x 75
5 mmol/L PDC; 0.5 mmol/L CTAB (pH 5.6)
-25 indireta (200nm)
20 7 Soga59
tartárico, málico, succínico, adípico, glutámico, acético, lático, shikimico.
48 (UV) 60 (cond.) x 50
7.5 mmol/L PAB 10.5 mmol/L BIS TRIS; 0.1 mmol/L
TTAB (pH 7.0)
-30 condutividade e indireta (254nm)
- 7 (cond.). 8 (UV)
Klampfl et al.60
tartárico, málico, succ., acético, lático
60 x 75
3 mmol/L fosfato; 0.5 mmol/L MTAB (pH6.5)
-20 direta (185nm)
- 6 Castiñeira et al54,55
tartárico, málico, succínico, cítrico,
acético, lático
65 x 50
3 mmol/L BTA; 15mmol/L Tris; 1.5 mmol/L TEPA
(pH 8.4)
-25 indireta (240nm)
9 Sing Fung and Man Lau61

56
acético, cítrico, fumárico, lático, málico,
oxálico, succínico, tartárico
50 x50 recoberto
poliacrilamida
200 mmol/L fosfato (pH 7.50)
-14 direta (200nm)
20 13 Saavedra and Barbas50
tartárico, málico, succínico, cítrico,
acético, lático
110 x 75
7.5 mmol/L PDC; 0.5 mmol/L CTAB;
0.5 mmol/L EDTA (pH 5.6)
0 a -22 kV em 0,5
min
indireta (210nm)
15 18 De Villiers et al.62
tartárico, málico, succínico, acético, lático
78 x 75 5 mmol/L PDC; 0.5 mmol/L CTAB
(pH 5.6)
25 indireta (200nm)
18 7.5 Esteves et al.63
cítrico, tartárico, málico, succínico, acético, lático
100 x 75 5 mmol/L ftalato; 0.5 mmol/L
OFM – anion BT (pH 7)
- 20
indireta (254 mm)
- 15 Kenney64
tartárico, málico, succínico, cítrico,
acético, lático
44 x 75
3 mmol/L PMA; 3 mmol/L EDTA (pH 7.5)
- 20 indireta (220 nm)
30 12 Arellano et al.65,66
tartárico, málico, cítrico, succínico, acético, lático
80.5 x 75 5 mM PDC; 0.5 mmol/L CTAB (pH 5.6)
-25 indireta (200 nm)
18 7.5 Kandl and Kupina67

57
succínico, málico, tartárico, acético
60 x 75
10 mmol/L tetraborato; 0.5 mmol/L TTAOH;
10 ppm Ca²+ and Mg²+ (pH 9.3)
-7 direta (185 nm)
20 20 Garcia-Moreno et al.59 Moreno et al.51,52
tartárico, málico, succínico, acético,
cítrico, lático
60 x 75
7.5 mmol/L NaH2 PO4; 2.5 mmol/L
Na2 HPO4; 2.5 mmol/L TTAOH; 0.24
mmol/L CaCl2 (pH 6.40)
-25 direta (185 nm)
25 3.5 Mato et al.53
MÊS, ácido etanosulfônico 2-(N-morfolino); HIS, histidina; TTAB, brometo de tetradecil trimetilamônio; PDC ácido piridinodicarboxílico; CTAB, brometo de cetiltrimetilamônio; BIS-TRIS, bis(2-hidroxietil)imino-tris(hidroximetil)aminometano; MTAB, brometo de miristil trimetilamônio; BTA1,3,5-benzeno tricarboxílico; PMA, ácido piromelitico; EDTA, etilenodiamintetracetato;TTAOH, hidróxido de tetradecil trimetilamônio; PAB, ácido 4 aminobenzóic

58
Os métodos eletroforéticos para a análise de ácidos orgânicos em vinho, utilizam
geralmente os tampões bis(2-hidroxietil)imino-tris(hidroximetil)aminometano (BIS-
TRIS)60,61, ácido bórico59,60, 1,3,5-benzeno tricarboxílico (BTA)61, ácido etanosulfônico 2-
(N-morfolino) (MES)56, cromato58, ácido 4-aminobenzóico (PAB) 60, fosfato50,53, ftalato57,64,
ácido piridinodicarboxílico (PDC)62,63, ácido piromelitico (PMA)65,66 ou tetraborato51,52.
São também adicionados ao eletrólito, modificadores (inversores) do fluxo eletrosmótico
(surfactantes catiônicos) como brometo de cetiltrimetilamônio (CTAB),67
etilenodiamintetracetato (EDTA)62, brometo de miristil trimetilamônio (MTAB)54,55,
brometo de tetradecil trimetilamônio (TTAB)56,60 ou hidróxido de tetradecil trimetilamônio
(TTAOH) 51,52. Em relação ao tempo de análise, métodos eletroforéticos apresentam grande
vantagem em relação aos métodos por HPLC aplicados a análise de ácidos orgânicos em
vinhos. A maioria dos métodos apresenta tempo de corrida inferior a 15 minutos. O método
apresentado por Mato et al.53 por detecção direta a 185nm requereu apenas 3,5 minutos.
Como desvantagem principal apontada por alguns autores, a reprodutibilidade é
considerada inferior quando comparada a métodos enzimáticos e cromatográficos. Isso,
porém, pode ser contornado com a utilização de padrão interno, com o qual o tempo de
migração e área dos analitos são relacionados. Padrões internos mais utilizados são ácido
bútirico,64 ácido oxálico53, entre outros.

59
Referências
1. Roberfroid MB. Concepts in functional foods: the case of inulin and oligofructose. J
Nutr 1999; 129:1398S-401S.
2. Dreosti IE. Antioxidant polyphenols in tea, cocoa, and wine. Nutr 2000; 16:7-8.
3. Andersen OM, Markham KR. Flavonoids: Chemistry, biochemistry and applications.
Boca Raton:Taylor & Francis, 2006.
4. Hollman PCH, Arts ICW. Flavonols, flavones and flavanols – nature, occurrence and
dietary burden. J Sc Food Agric 2000; 80:1081-93.
5. Robards K, Antolovich M. Analytical chemistry of fruit bioflavonoids. Analyst 1997;
122:11R-34R.
6. Amerine MA, Ough, CS. Methods for analysis of musts and wine. John Wiley &.
Sons, New York, 341p. 1980.
7. Renaud S, Lorgeril M. Wine, alcohol, platelets, and the French paradox for coronary
heart disease. Lancet 1992; 339:1523-6.
8. Szmitko PE, Verna S. Red wine and your heart. Circulation 2003; 111:e10-1.
9. Groenbaek M, Dels A, Sorensen, TI, Becker U, Schonohr P, Jensen G. Mortality
associated with moderate intakes of wine, beer or spirits. Br Med J 1995; 310:1165-9.
10. Madhavi DL, Deshpande SS, Salunkhe DK, Food antioxidantes: Technological,
toxicological, and health perspectives. 1º ed., New York: Marcel Dekker, 1996, 490p.
11. Frankel E. Kanner J, German JB, Parks E, Kinsella JE. Inhibition of oxidation of
human low-density lipoprotein by phenolic substances in red wine. Lancet 1993; 341:
454-7.

60
12. Kanner J, Frankel E, Granit R, German B, Kinsella JE. Natural antioxidants in grapes
and wines. J Agric Food Chem 1994; 42:64-9.
13. Kinsella JE, Frankel E, German B, Kanner J. Possible mechanisms for the protective
role of antioxidants in wine and plant foods. Food Technol 1993; 47:85-9.
14. Tomera JF. Current knowledge of the health benefits and disadvantages of wine
consumption. Trends Food Sci Technol 1999; 10:129-38.
15. Estruch R. Wine and cardiovascular disease. Food Res Int 2000; 33:219-26.
16. Nigidikar SV, Willians NR, Griffin BA, Howard AN. Consumption of red wine
polyphenols reduces the susceptibility of low-density lipoproteins to oxidation in vivo.
Am J Clin Nutr 1998; 68:258-65.
17. Cook NC, Samman S. Flavonoids chemistry, metabolism, cardioprotective effects, and
dietary sources. Nutr Biochem 1996; 7:66-76.
18. Renaud SC, Guégnen R, Conard P, Lanzmann-Petithory D, Orgogozo JM. Moderate
wine drinkers have lowe hypertension-related mortality: a prospective cohort study in
French men. Am. J Clin Nutr 2004;80:621-25.
19. Sato M, Maulik N, Das D K. Cardioprotection with alcohol: role of both alcohol and
polyphenolic antioxidants. Annals of N.Y. Academy of Science 2002; 957:122-35.
20. Somoza V. Magic-ol Resveratrol. Mol Nutr Food Res 2005; 49:373.
21. Signorelli P, Ghidoni R. Resveratrol as an anticancer nutrient: molecular basis, open
question and promises. J Nutr Biochem 2003; 16:449-66.
22. Revilla E, Ryan J. Analysis of several phenolic compounds with potential antioxidant
properties in grape extracts and wines by high-performance liquid chromatography-
protodiode array detection without sample preparation. J Chromatogr A 2000;
881:461-9.

61
23. Monagas M, Bartolomé B, Gómez-Cordovez C. Evolution of polyphenols in red wines
from Vitis vinefera L. during aging in the bottle. II. Non-anthocyanin phenolic
compounds. Eur Food Res Tech 2005; 220:331-40.
24. Castellari M, Sartini E, Fabiani A, Arfelli G, Amati A. Analysis of wine phenolics by
high-performance liquid chromatography using a monolithic type column. J
Chromatogr A 2002; 973:221-7.
25. Alcalde-Eon C, Escribano-Bailón MT, Santos-Buelga C, Rivas-Gonzalo JC. Changes
in the detailed pigment composition of red wine during maturity and ageing. A
comprehensive study. Anal Chim Acta 2006; 563:238-54.
26. Dominguez D., Guinllén DA, Barroso C G. Automated solid-phase extraction for
sample preparation followed by high-performance liquid cromatography with diode
array and mass spectrometric detection for analysis of resveratrol derivates in wine. J
Chomatogr A 2001; 918: 303-10.
27. Bier M, Ed. Electrophoresis, Theory, Methods and Applications. New York:
Academic Press, Inc., 1959. p.225.
28. Baker DR. Capillary Electrophoresis, John Wiley & Sons, Inc., New York, 1995.
29. Grossman PD, Colburn JC. Capillary Electrophoresis Theory and Practice, Academic
Press Inc., San Diego, CA, 1992.
30. Terabe S, Otsuka K, Ichikawa K, Tsuchiya A, Ando T. Eletrokinetic separations with
micellar solutions and open tubular. Anal Chem 1984; 56:111-3.
31. Rijke E, Out P,. Niessen W M.A, Ariese F, Gooijer CBrinkman , U ATh. Analytical
separation and detection methods for flavonoids.
J Chromatogr A 2006 ;1112:31-63.

62
32. Pietta, PG, Mauri PL, Zini L, Gardana C. Optimization of separation selectivity
incapillary electrophoresis of flavonoids. J Chromatogr A 1994; 680:175-9
33. Robards K, Antolovich M, Analytical Chemistry of Fruit Bioflavonoids. Analyst
1997; 122:11R-34R.
34. Wang SP, Huang KJ. Determination of flavonoids by high-performance liquid
chromatography and capillary electrophoresis. J Chromatogr A 2004; 1032:273-9.
35. Peng Y, Chu Q, Liu F, and Ye J. Determination of phenolic constituents of biological
interest in red wine by capillary electrophoresis with electrochemical detection. J
Agric Food Chem 2004; 52:153-6.
36. Hamoudová R, Urbánek M, Pospí ilová M, Polá ek M. Assay of phenolic compounds
in red wine by on-line combination of capillary isotachophoresis with capillary zone
electrophoresis. J Chromatogr A 2004; 1032: 281-7.
37. Garcia-Viguera C, Bridle P. Analysis of non-coloured phenolic compounds in red
wines. A comparison of high-performance liquid chromatography and capillary zone
electrophoresis. Food Chem 1995; 54:349-52.
38. Andrade P, Seabra R, Ferreira M, Ferreres F, Garcia- Viguera C. Analysis of non-
coloured phenolics in port wines by capillary zone electrophoresis. Lebensm Z Unters
Forsch A 1998; 206:161-4.
39. Siemann H, Creasy LL. Concentration of the phytoalexin resveratrol in wine.
Am J Enol Vitic 1992, 43:49-52.
40. Prasongsidh BC, Skurray GR. Capillary electrophoresis analysis of trans- and cis-
resveratrol, quercetin, catechin and gallic acid in wine. Food Chem 1998; 62:355-8.

63
41. Gao L, Chu Q, and Ye J. Determination of trans-resveratrol in wines, herbs and health
food by capillary electrophoresis with electrochemical detection. Food Chem
2002; 78:255-60.
42. Brandolini V, Maietti A, Tedeschi P, Durini E, Vertuani S, Manfredini S.
Capillary electrophoresis determination, synthesis, and stability of resveratrol and
related 3-O-β-D-glucopyranosides. J Agric Food Chem 2002; 50:7407-11.
43. Gu X, Chu Q, O’Dwyer M, Zeece M. Analysis of resveratrol in wine by capillary
electrophoresis J Chromatogr A 2000; 881:471-81
44. Amerine, MA, Berg HW, Cruess WV. The Tecnology of Wine Making. Westport:
AVI Publishing company, Inc., Westport, 1967, 799p.
45. Bourzeix M, Guitraud J, Champagnol F. Identification des acides organiques et
évaluation de leurs teneurs individuelles dans les jus de raisin et les vins par
chromatographie et photodensitométrie. J Chromatogr A 1970; 50:83-9.
46. Mato I, Suárez-Luque S, Huidobro JF. A review of the analytical methods to
determine organic acids in grape juices and wines. Food Res Int 2005; 38: 1175–88.
47. Yang MH, Choong YM. Rapid gas chromatographic method for direct determination
of short-chain (C2–C12) volatile organic acids in foods.
Food Chem 2001; 75:101-8.
48. Liorente M, Villarroya B, Gomez-Cordovés C. Reverse-phase HPLC of organic acids
in musts. Chromatographia 1991; 32:555-8.
49. Kupina SA, Pohl CA, Giannotti JL. Determination of tartaric, malic and citric acids in
grape juice and wine using gradient ion chromatography. American J of Enol. and
Vitic 1991 ; 42 :1-5.

64
50. Saavedra L, Barbas C. Validated capillary electrophoresis method for small-anions
measurement in wines. Electrophoresis 2003; 24:2235–43.
51. García Moreno MV, Jurado Campoy CJ, García Barroso C. Method devised for
determining low molecular weight organic acids in wine samples by capillary
electrophoresis: validation of the method with real samples. Eur Food Res Technol
2001; 213: 381–5.
52. Moreno MVG, Jurado CJ, Barroso CG. Determination of organic acids by capillary
electrophoresis with simultaneous addition of Ca and Mg as complexing agents.
Chromatogr 2003; 57:185–9.
53. Mato I, Suárez-Luque S, Huidobro JF. Simple determination of main organic acids in
grape juice and wine by using capillary zone electrophoresis with direct UV detection.
Food Chem 2007; 102:104-12.
54. Castiñeira A, Peña RM, Herrero C, García-Martín S. Simultaneous determination of
organic acids in wine samples by capillary electrophoresis and UV detection:
optimization with five different background electrolytes. J High Res Chromatogr
2000; 2311:647–52.
55. Castiñeira A, Peña RM, Herrero C, García-Martín S. Analysis of organic acids in wine
by capillary electrophoresis with direct UV detection. J Food Comp Anal 2002;
153:319–31.
56. Kelly L, Nelson RJ. Capillary zone electrophoresis of organic acids and anions. J Liq
Chromatogr Rel Technol 1993; 16:2103–12.
57. Levi V, Wehr T, Talmadge K, Zhu M. Analysis of organic acids in wines by capillary
electrophoresis and HPLC. Am Lab 1993; 25:29–32.

65
58. Stathakis C, Cassidy RM. Effect of electrolyte composition in the capillary
electrophoretic separation of inorganic/organic anions in the presence of cationic
polymers. J Chromatogr A 1995; 699: 353–61.
59. Soga T. Analysis of inorganic and organic anios by capillary zone electrophoresis.
Hewlett–Packard Application Note 12-59631, 996; 5744E.
60. Klampfl CW, Katzmayr MU, Buchberger W. Separation of inorganic and organic
anions by capillary zone electrophoresis with simultaneous indirect UV and
conductivity detection. Electrophoresis 1998; 19:2459–64.
61. Sing Fung Y, Man Lau K. Analysis of organic acids and inorganic anions in beverage
drinks by capillary electrophoresis. Electrophoresis 2003; 24: 3224–32.
62. De Villiers A, Lynen F, Crouch A, Sandra P. A robust capillary electrophoresis
method for the determination of organic acids in wines. Eur Food Res Technol 2003;
217:535–40.
63. Esteves VI, Lima SSF, Lima DLD, Duarte AC. Using capillary electrophoresis for the
determination of organic acids in Port wine. Anal Chim Acta 2004; 5131:163–7.
64. Kenney BF. Determination of organic acids in food samples by capillary
electrophoresis. J Chromatogr A 1991; 546:423–30.
65. Arellano M, Andrianary J, Dedieu F., Couderc F, Puig PH. Method development and
validation for the simultaneous determination of organic and inorganic acids by
capillary zone electrophoresis. J Chromatogr A 1997; 765:321–28.
66. Arellano M, Couderc F, Puig PH. Simultaneous separation of organic and inorganic
acids by capillary zone electrophoresis. Application to wines and fruit juices. Am J
Enol Vitic 1997; 484:408–12.

66
67. Kandl T, Kupina S. An improved capillary electrophoresis procedure for the
determination of organic acids in grape juice and wine. Am J Enol Vitic 1999;
502:155–61.
68. Huang X, Luckey JA, Gordon MJ, Zare RN. Quantitative analysis of low molecular
weight carboxylic acids by capillary zone electrophoresis/conductivity detection. Anal
Chem 1989; 61:766-70.
69. Cartoni G, Coccioli F, Jasionowska R. Capillary electrophoretic separation of phenolic
acids. J Chromatogr A 1995; 709:209-14.
70. Chu Q, O’Dwyer M, Zeece M. Direct analysis of resveratrol in wine by micellar
electrokinetic capillary electrophoresis. J Agric Food Chem 1998; 46:509-13.
71. Berzas NJJ, Salcedo CAM, Castañeda GP. Simultaneous determination of cis- and
trans-resveratrol in wines by capillary zone electrophoresis. Analyst 1999; 124:61–6.
72. Minussi RC, Rossi M, Bologna L, Cordi L, Rotilio D, Pastore GM, Duran N. Phenolic
compounds and total antioxidants potential of commercial wines. Food Chem 2003;
82:409-16.
73. Demianová Z, Sirén H, Kuldvee R, Riekkola ML. Nonaqueous capillary
electrophoretic separation of polyphenolic compounds in wine using coated capillaries
at high pH in methanol. Electrophoresis 2003;24: 4264-71.

67
CAPÍTULO 3
HPLC-DAD-ESI/MS Identification and Quantification of Phenolic Compounds in Ilex paraguarienses Beverages and
On-line Evaluation of Individual Antioxidant Activity
RENATO G. PERES
FERNANDO G. TONIN
MARINA F.M. TAVARES
DELIA B. RODRIGUEZ-AMAYA
Artigo a ser submetido à Revista
Journal of Agricultural and Food Chemistry

68
HPLC-DAD-ESI/MS Identification and Quantification of
Phenolic Compounds in Ilex paraguarienses Beverages and On-
line Evaluation of Individual Antioxidant Activity
Renato G. Peres †, Fernando G. Tonin §, Marina F.M. Tavares§, and Delia B. Rodriguez-
Amaya∗,†
†Departamento de Ciência de Alimentos, Faculdade de Engenharia de Alimentos,
Universidade Estadual de Campinas, C.P. 6121, 13083-862 Campinas, SP, Brazil. §Instituto
de Química, Universidade de São Paulo, C.P. 26077, 05599-970, São Paulo, SP, Brazil
KEYWORDS: Flavonols; antioxidant capacity; Ilex paraguarienses; beverages;
HPLC-DAD-ESI-MS; phenolics
* Corresponding author. Tel: 55-19-3521-4013. Fax: 55-19-3521-2153.
E-mail: [email protected]

69
Abstract
“Chimarrão” and “tererê” are mate (Ilex paraguariensis) infusions widely consumed
in South America. This paper describes the application of HPLC-DAD-ESI/MS method for
the identification and quantification of caffeoylquinic acids (CQA), flavonol glycosides and
purine alkaloids in these beverages. Infusions were prepared from commercial samples of
Ilex paraguarienses from Southern Brazil. The cafeoylquinic acids, 4,5-diCQA, 3-CQA, 5-
CQA, and 4-CQA were the major compounds, having 238-289, 153-242, 183-263, and
123-188 μg/mL, respectively, for chimarrão and 206-265, 122-218, 164-209, 103-169
μg/mL, respectively for tererê. Caffeine also had high amounts while glycosides of
quercetin and kaempferol were found at much lower levels. The individual antioxidant
activity was also determined by an on-line system that measured their ABTS.+ radical
scavenging activity, showing that the antioxidant capacity was not proportional to the
concentrations of the phenolic compounds. 3-CQA, quercetina-3-O-ramnosylglucoside, and
quercetina-3-O-glucoside were the major contributors to the antioxidant capacity, although
the quercetin glycosides had concentrations less than 10 times that of 3-CQA.

70
INTRODUCTION
“Mate” or “yerba mate” (Ilex paraguarienses St. Hilaire) is used to prepare tea-like
beverages widely consumed in South America. It is estimated that 30% of the population in
this region drink over 1 liter per day of mate infusions (1). Around 80% of the planted area
is in Brazil (2), where it contributes very positively to the local economy with an estimated
production of 650,000 tons of mate per year (3). Typical beverages from mate consumed in
Brazil are “chimarrão” (infusion prepared from dry mate with hot water) and “tererê”
(infusion prepared with cold water).
Some therapeutic properties have been attributed to mate such as antirheumatic,
hypocholesterolemic, anti-thrombotic, anti-inflammatory, anti-obesity, anti-aging,
hepatoprotective and diuretic activities (1, 4-9). Some of the pharmacological properties
have been attributed to the high content of phenolic compounds, especially caffeoyl
derivatives (6, 7, 10-12).
High performance liquid chromatography with diode array and mass detectors
(HPLC-DAD-MS) has been used to identify the phenolic compounds of Ilex
paraguariensis. Using an atmospheric pressure chemical ionization (APCI) interface in the
negative-ion mode and collision-induced dissociation (CID) of precursor ions, along with
UV-diode array detection, Carini et al. (13) analyzed mate from Argentina and identified 10
constituents: three naturally occurring caffeoylquinic acid (neo-chlorogenic, chlorogenic
and crypto-chlorogenic acids), three isomeric dicaffeoylquinic acids, rutin (quercetin-3-
rutinoside), a diglycosyl derivative of luteolin, and two caffeoyl-glucosides isomers.
Quantification was not carried out, however. Also analyzing Argentinian mate by the UV

71
and MS (ESI) spectra, 28 compounds were identified by Bravo et al. (14), including seven
of those reported by Carini et al.(13) Percentages of polyphenol groups were presented.
Phenolic compounds in Ilex paraguariensis were quantified in some articles (7, 11,
12), confirming the predominance of chlorogenic acid derivatives, but the data were
expressed as total contents or relative percentages. The antioxidant properties have also
been studied in chemical and biological systems (13-21).
Aqueous extracts of Ilex paraguariensis have been shown to scavenge superoxide
anions and the 2,2,-diphenyl-1-picrylhydrazyl (DPPH) radical (13, 21) and inhibit oxidation
induced by 2,2’-azobis-(2-aminopropane) hydrochloride (AAPH) (9, 16, 21). The ferric
reducing antioxidant power (FRAP) and 2,2’-azinobis-3-ethylbenzothiazoline-6-sulfonic
acid (ABTS) (14) assays have also been employed. In vivo, water extracts of mate were
evaluated with healthy volunteers and the results suggested that Ilex paraguariensis
antioxidants reached the plasma, increased the aqueous phase antioxidant capacity of the
plasma and inhibited copper-induced autoxidation of LDL (15).
Numerous papers assessing the antioxidant activity of extracts of foods and
beverages have been published. The values obtained, however, represent the total
antioxidant capacity of the food. Although often correlated or attributed to some food
constituent groups (e.g., polyphenols), these are presumed rather than direct measurements
and the contribution of individual compounds is not known. Recently, on-line HPLC
methods for the evaluation of the individual antioxidant activity of food constituents have
been introduced (22, 23). The HPLC-separated analytes react postcolumn with preformed
radical cation ABTS.+ (22) or radical DPPH. or inhibit luminol chemilumiscence (CL) (23).
In the on-line ABTS+ method, the eluate reacts with a stabilized solution of ABTS+. radical
and the absorbance is monitored at high wavelengths such as 720 nm or 600 nm. The

72
solution with the radical has a deep blue color and if a quenching reaction occurs, there will
be a loss of color and a negative peak will be registered. This method was applied to green
and black tea samples, using HPLC-MS for identification of the phenolic compounds (24).
The objectives of this work were to identify and measure the amounts of the
principal phenolic compounds in the Brazilian beverages chimarrão and tererê by HPLC-
ESI/MS and HPLC-DAD and evaluate their individual contribution to the total antioxidant
capacity through an on-line HPLC system.
MATERIALS AND METHODS
Chemicals. Standards of the flavonoids quercetin-3-rhamnosylglucoside, quercetin-
3-O-glucoside, kaempferol-3-O-glucoside and 3,5-dicaffeoylquinic acid were purchased
from Extrasynthese (Genay, France); caffeine, teobromine and 5-O-cafeoylquinic acid were
obtained from Sigma Chemical Company (St. Louis, MO, EUA). HPLC-grade methanol
and acetonitrile were purchased from Tedia Company (Fairfield, OH, USA). The 2,2’-
azinobis-(3-ethylbenzothiazoline-6-sulfonic acid was from ICN Biomedicals Inc. (Aurora,
OH, USA) and 6-hydroxy-2,5,7,8-tetramethylchroman-2-carboxylic acid (Trolox), and
butyl-hydroxyanisol (BHA), from Aldrich (St. Louis, MO, EUA). Membrane filters were
purchased from Millipore (Bedford, MA, USA).
Stock standard solutions were prepared at a concentration of 1 mg/mL in methanol
and stored at -20oC for a maximum of two months. Water was purified using a Milli-Q
system from Millipore Corporation (Millipore, Bedford, MA, USA).

73
Sample Preparation. The mate samples (S1 to S6) were purchased from
supermarkets in São Paulo, Brazil, and were produced in the states of Paraná, Santa
Catarina, and Rio Grande do Sul (two sample lots from each state). Two packages of each
sample lot were ground to pass a 40-mesh screen and mixed.
Chimarrão was prepared in duplicate by adding 250 mL of deionized water at 70oC
to 5g of the sample. The infusion was stirred for 3 min and then filtered through a 0.45 µm
membrane filter (Millipore, Bedford, MA, USA) (25). Tererê was prepared using the same
procedure, but the water temperature was 5oC.
An aliquot of chimarrão or tererê was diluted 20-fold with deionized water and
injected in the HPLC system.
Preparative HPLC. 3-Caffeoylquinic acid (CQA) and 4-CQA have the same MS
and UV spectra and are not commercially available as standards. So it was necessary to
prepare (26) and isolate them by preparative HPLC (27). For this, the isomers were
separated and collected using a preparative Phenomenex C18 column, 15 μm, 250 x 21.2
mm (Torrance, CA, USA). The mobile phase and gradient system were those employed by
Negishi et al. (27). These authors identified the isomers by MS and NMR. The preparative
HPLC procedure was performed on a Waters Prep System (Milford, MA, USA),
comprising of a HPLC Prep pump model 600E, Rheodyne injector, dual absorbance
detector model 2487, a preparative flow cell, and a fraction collector (WFC) connected to
the recorder model BD40 (Kipp & Zonen, Delft, The Netherlands).
HPLC analysis. The HPLC equipment used for the separation and quantification of
the phenolic acids consisted of a Waters alliance model 2695 separation module with a
photodiode array detector model 996, equipped with an X-Bridge C18 column, 5µm, 4.6 x
150 mm, a microbore detection cell and, for data collection and treatment, an Empower 2

74
software (Waters Corporation, Milford, MA, USA). The system was thermostated at 35oC
with a Waters temperature control module and the flow rate was 1.0 mL/min. A binary
convex gradient was employed with the following solutions: H2O/formic acid (99:1 v/v) as
phase A and acetonitrile/formic acid (99:1.0 v/v) as phase B. Starting with 95A/5B, the
proportion was altered to 40A/70B in 5 min, then to 20A/80B in 15 min, and to 95A/5B in
30 min. The injection volume was 10 µL.
Quantification was done by external standardization, using the respective standards.
However, tricaffeoylquinic acid, for which there is no commercially available standard, was
estimated from the 3,5-dicaffeoylquinic acid curve.
HPLC-ESI/MS analysis. The extracts were analyzed by a Micromass ZMD
quadrupole mass spectrometer, with electrospray interface and MassLysnx software version
3.5 (Micromass UK Ltd, Manchester, UK) for data acquisition.This instrument was coupled
to a Waters separation module, model 2695, equipped with a photodiode detector model
996 and a microbore cell (Waters Corporation, Milford, MA, USA). The mass spectrometer
parameters were set as follows: ionization mode, electrospray positive ion; capillary
voltage, 4.0 kV; source block temperature, 140oC; desolvation temperature, 400oC;
nebulizer nitrogen flow rate, 50 L/hr; desolvation nitrogen gas flow, 568 L/hr; LM
resolution, 10; HM resolution, 12; ion energy, 1.0 V; cone voltage, 35 V; RF lens, 0.5 V;
extractor lens, 5 V. Spectra were recorded by scanning the mass range from m/z 100 to
1000 with scan time of 1 s.
Preparation of ABTS.+ solution. ABTS (2 mmol/L) was dissolved in 10 mmol/L
phosphate-buffered solution and adjusted to pH 7.4 with ammonium persulfate solution in
ultrapure water (0.5 mmol/L final concentration) to produce the ABTS.+. To maximize the

75
conversion of ABTS to ABTS.+, the mixture was prepared in an amber glass volumetric
flask and stored in the dark at room temperature for 16 h under constant stirring. Fresh
working solutions of the appropriate concentrations were prepared daily; the final dilution
was 1:40 v/v in water.
On-line ABTS.+ assay. Determination of the antioxidant activity was based on the
ABTS.+ assay of Koleva et al. (22). The on-line set-up utilized in the present study is shown
in Figure 1. The HPLC equipment consisted of a Shimadzu HPLC system pump model
LC-10ADvp, system controller model SCL-10Avp, an autosampler Waters model 717Plus,
DAD detector model SPD-M10Avp, controlled by a Class VP software v. 5.03. Separation
was carried out on a Synergi Max-RP C12 column, 4 µm, 4.6 x 250 mm (Phenomenex,
Torrance, CA, USA) and the flow rate was 1.0 mL/min. The HPLC column and the PEEK
(polyether ether ketone) tubing were maintained at 35oC, using a Waters column heater,
model TCM/CHM (Waters Corporation, Milford, MA, USA). When the HPLC eluent from
the DAD detector (recorded from 200 to 600 nm and monitored at 280 nm) arrived at a
connection in “T” form (Altech, Deerfield, IL, USA) where the ABTS.+ was added, the
compound reacted with the cation radical and decolorization was monitored by a second
detector, a Waters UV/VIS tunable absorbance detector, model 486. The antioxidant on-
line part of the system was controlled and monitored by Waters Empower 2 software. The
ABTS.+ solution flow rate was 0.8 mL/min, delivered by a Waters 515 HPLC pump. After
mixing through a 13.7 x 0.25 mm i.d. PEEK tubing (Upchurch Scientific Corporation, Oak

76
Figure 1. Set-up for the HPLC-ABTS.+ on-line system.

77
Harbor, WA , USA) (used as reaction coil), the absorbance was measured by a Waters
tunable absorbance detector, model 486, set at 600 nm.
To calculate the antioxidant activity, Trolox was injected with the extracts at three
concentrations to construct the calibration curves. The Trolox equivalent antioxidant
capacity (TEAC) was calculated by dividing the slope of the compound’s curve by the
slope of the Trolox curve (22).
RESULTS AND DISCUSSION
Identification of the phenolic compounds and purine alkaloids of Ilex
paraguariensis infusions. The typical chromatogram of the phenolics and purine alkaloids
of Ilex paraguariensis influsions is shown in Figure 2. The structures of the compounds
identified are in Figures 3 and 4. The HPLC-ESI/MS and UV data used for identification
are presented in Table 1, which were compared with those of Bravo et al. (14).
Peak 1 was identified as caffeine. It had a retention time of 13.9 min, maximum
absorbance at 272 nm (with typical spectra of methylxanthine), and positively charged
molecular ion [M+H]+ at m/z 195. It co-chromatographed with caffeine standard.
Peaks 2, 3, and 5 had similar UV spectra (λmax at 326 nm, shoulder at 296 nm),
typical of chlorogenic acid. Their MS spectra exhibited [M+H]+ at m/z 355, indicative of
isomers of chlorogenic acid (C16H18O19 (M.W. 355), which had been reported as important

78
Figure 2. Chromatograms of (A) standards and (B) phenolic compounds of Ilex
paraguariensis infusion. Peak identification: 1, caffeine; 2, 3-O-Caffeoylquinic acid; 3, 5-
O-Caffeoylquinic acid; 4, Teobromine; 5, 4-O-Caffeoylquinic acid; 6, Quercetin-3-
rhamnosylglucoside; 7, Quercetin-3-O-glucoside; 8, Kaempferol-3-O-glucoside; 9, 3,5-
Dicaffeoylquinic acid; 10, 4,5-Dicaffeoylquinic acid; 11, Tricaffeoylquinic acid.
Chromatographic conditions are described in the text.
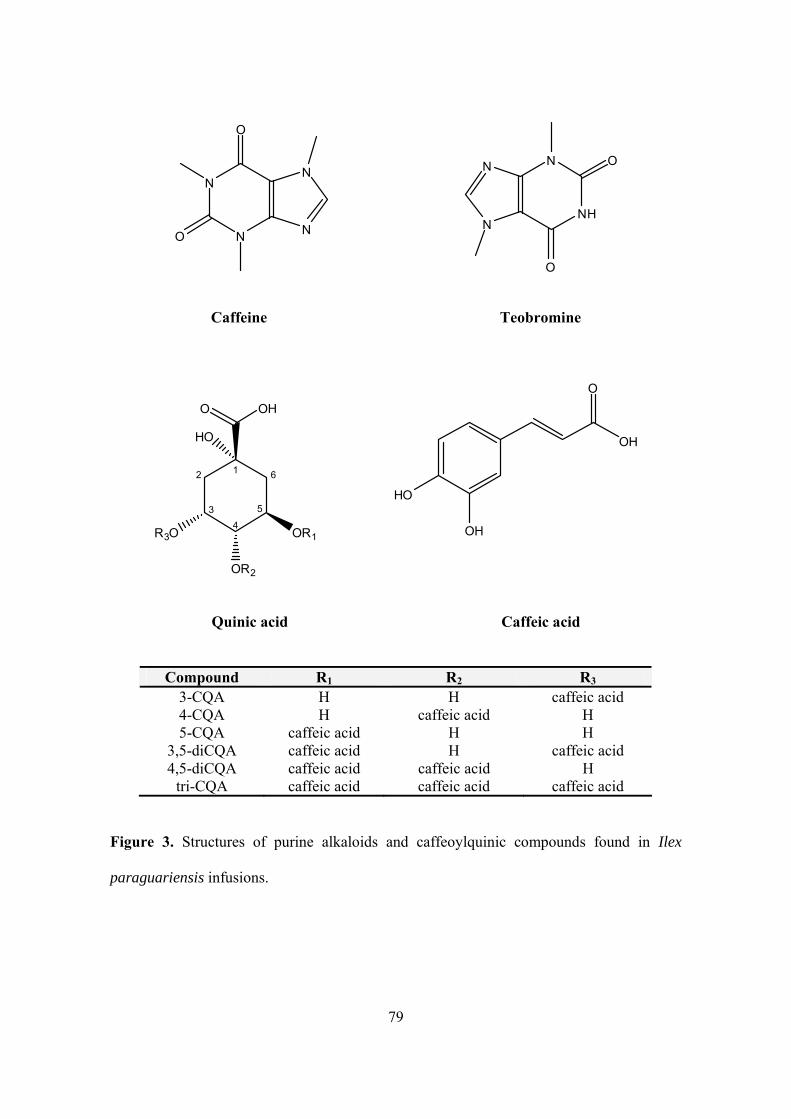
79
N
N N
N
O
O
NN O
NHN
O
Caffeine Teobromine
5
612
34
R3O OR1
OR2
HO
O OHO
OH
OH
HO
Quinic acid Caffeic acid
Compound R1 R2 R3
3-CQA H H caffeic acid 4-CQA H caffeic acid H 5-CQA caffeic acid H H
3,5-diCQA caffeic acid H caffeic acid 4,5-diCQA caffeic acid caffeic acid H
tri-CQA caffeic acid caffeic acid caffeic acid Figure 3. Structures of purine alkaloids and caffeoylquinic compounds found in Ilex
paraguariensis infusions.

80
O
R2
OH
R1
OOH
HO
Compound R1 R2 Quercetin-3-rhamnosylglucoside O-rutinose OH
Quercetin-3-O-glucoside O-glucose OH Kaempferol-3-O-glucoside O-glucose H
Figure 4. Structures of flavonols found in Ilex paraguariensis infusions.

81
Table 1. Identifying characteristics of the phenolic compounds and purine alkaloids of
infusions from Ilex paraguariensis.
Peak RT
(min)
λmax
nm
[M+H]+ Fragment
ions
Structure attribution
1 13.9 272 195 Caffeine
2 16.8 326,296sh 355 193,181 3-O-Caffeoylquinic acid
3 19.8 326,296sh 355 193,181 5-O-Caffeoylquinic acid
4 19.8 272 181 Teobromine
5 20.1 326,296sh 355 193,181 4-O-Caffeoylquinic acid
6 24.2 256,354 611 Quercetin-3-rhamnosylglucoside
7 25.0 256,344 465 303 Quercetin-3-O-glucoside
8 25.6 266,342 449 Kaempferol-3-O-glucoside
9 27.4 326,296sh 517 355,193 3,5-Dicaffeoylquinic acid
10 27.8 326,296sh 517 355,193 4,5-Dicaffeoylquinic acid
11 28.5 326,296sh 679 517,181,163 Tricaffeoylquinic acid
sh, shoulder

82
and major constituents of mate (6, 26). Peak 3 co-chromatographed with the 5-CQA
standard and peaks 2 and 5 with 3-CQA and 4-CQA standards prepared as described in the
experimental section. The order of elution was the same as that of Bravo et al. (14) and
Negishi et al. (28).
Peak 4 was identified as teobromine by the UV (λmax at 272 nm) and MS (with
[M+H]+ at m/z 181) spectra and co-chromatography with its standard.
Minor peaks 6, 7 and 8 were identified as flavonoids from the UV and MS spectral
data. Peak 6 (λmax at 256 and 354 nm, [M+H]+ at m/z 611) was identified as quercetin-3-
rhamnosylglucoside (quercetin-3-rutinoside) known as rutin. Peak 7 (λmax at 256 and 344
nm, [M+H]+ at m/z 465) was identified as quercetin-3-O-glucoside and peak 8 (λmax at 266
and 342 nm, [M+H]+ at m/z 449) as kaempferol 3-O-glucoside. These compounds co-
chromatographed with the respective standards.
Peaks 9 e 10 both had [M+H]+ at m/z 517, indicative of dicaffeoyl quinic acid
isomers, which were found in mate leaves by some authors (6,11). The loss of one
dehydrated caffeic acid molecule [M-caffeic acid-H2O]+, giving the fragment at 355 m/z,
the elution profile similar to that reported in C18 columns by others authors (11,28), and the
UV data (λmax at 326 nm, shoulder at 296 nm) all agreed to the identification of peaks 9 and
10 as 3-5-dicaffeoylquinic and 4-5 dicaffeoylquinic acids. Additionally, peak 9 co-
chromatographed with the standard of 3,5-dicaffeoylquinic acid.
Another major compound found in the mate beverages was peak 11 with UV spectra
(λmax at 326 nm, shoulder at 296 nm) and [M+H]+ at m/z 679 of a caffeoyl quinic
derivative. The fragment at m/z 517 could be attributed to tricaffeoylquinic acid with a loss
of a dehydrated molecule of caffeic acid that corresponded to the fragment at m/z=163.

83
Tricaffeoylquinic acid was cited by Yoshimoto et al. (28) in sweet potato and by Bravo et
al. (14) in mate extracts, identified by HPLC/MS.
Quantification of the phenolic compounds and purine alkaloids of Ilex
paraguariensis infusions. Table 2 shows the concentrations of phenolic acids and purine
alkaloids of the chimarrão e tererê infusions prepared from mate. The methylxanthine
caffeine varied from 124 to 268 μg/mL for chimarrão and from 114 to 246 μg/mL for
tererê, while teobromine varied from 64 to 126 μg/mL for chimarrão and 54 to 114 μg/mL
for tererê. This agrees with the work of Clifford and Ramirez-Martinez (12), in which
caffeine levels were approximately twice as much as those of teobromine. Bastos et al. (29)
encountered slightly higher values (150-294 μg/mL) for caffeine in chimarrão prepared
from Ilex paraguariesis from the state of Parana. The samples in this work came from three
states.
The ranges for 3-CQA, 5-CQA, and 4-CQA in the present work were 153-242, 183-
263, and 123-188 μg/mL, respectively, for chimarrão and 122-218, 164-209, 102-169
μg/mL, respectively for tererê. Values in the literature are given as chlorogenic acid or 5-
CQA, without distinguishing the three isomers.
Three flavonol glycosides (quercetin-3-rhamnosylglucoside, quercetin-3-O-
glycoside e kaempferol-3-O-glycoside) were detected and quantified (Table 2). The first
glycoside varied from 8 to 18 μg/mL in chimarrão and from 7 to 12 μg/mL in tererê. The
ranges for the second glycoside were 6-13 μg/mL for chimarrão and 4-12 μg/mL for tererê,
and for the third glycoside trace levels to16 μg/mL for chimarrão and trace levels to 12
μg/mL for tererê. The flavonol concentrations presented in the literature are in terms of the

84
Table 2. Concentrations (µg/mL) of Phenolic Compounds and Purine Alkaloids of Infusions of Ilex paraguariensis.
S1 S2 S3 S4 S5 S6
Compound Chimarrão Tererê Chimarrão Tererê Chimarrão Tererê Chimarrão Tererê Chimarrão Tererê Chimarrão Tererê
Caffeine 146±11 124±9 265±12 234±10 190±13 168±9 124±8 114±9 268±12 246±10 197±15 175±11
3-O-Caffeoylquinic acid 183±6 167±4 153±7 122±5 193±8 168±8 166±4 135±7 189±5 169±6 242±9 218±4
5-O-Caffeoylquinic acid 263±4 203±5 212±9 199±6 183±8 164±10 213±12 209±7 219±8 193±6 210±9 185±6
Teobromine 72±3 57±3 125±9 114±8 102±6 77±5 64±7 54±4 126±8 113±1 90±4 73±3
4-O-Caffeoylquinic acid 153±8 125±4 188±4 169±9 139±8 114±12 153±7 133±1 130±5 104±3 123±8 102±6
Quercetin-3-
rhamnosylglucoside
10±1 9±1 12±2 11±2 10±1 8±1 10±1 8±1 18±1 12±1 8±1 7±1
Quercetin-3-O-glucoside 12±1 10±1 13±1 12±1 13±2 7±1 8±1 6±1 10±1 11±1 6±1 4±1
Kaempferol-3-O-glucoside 9±1 7±1 10±1 8±1 tr tr tr tr 12±1 13±1 16±1 15±1
3,5-Dicaffeoylquinic acid 112±7 103±8 138±8 112±8 167±7 123±3 145±5 123±6 156±3 126±4 165±4 145±5
4,5-Dicaffeoylquinic acid 238±8 206±7 278±6 254±7 289±6 256±8 267±7 224±8 279±5 239±6 287±5 265±8
Tricaffeoylquinic acida 125±9 102±5 128±7 106±4 156±6 134±5 136±4 108±5 143±6 139±6 154±4 143±5
aEstimated from the 3,5-dicaffeoylquinic acid calibration curve. tr, trace levels.

85
aglycone, not the glycoside form. Comparison of quantification of flavonols in the
glycoside and aglycone forms is the subject of another paper.
For 3,5-dicaffeoylquinic acid, the ranges were 112-167 μg/mL for chimarrão and
103-145 μg/mL for tererê; the corresponding ranges for 4,5-dicaffeoylquinic acid were 238-
289 and 206-265 μg/mL. Comparison could not be made with the literature because these
acids were quantified in terms of the dried leaves (7).
Tricaffeoylquinic acid ranged from 125 to 156 μg/mL in chimarrão and 102 to 143
μg/mL in tererê. This acid has not been previously quantified.
It is noteworthy that the concentrations of all the compounds quantified were lower
in tererê than in chimarrão, which is coherent with the fact that the former was prepared
with cold water and the latter with hot water, reflecting better extraction of the compounds
studied in the latter infusion.
Antioxidant activity of the phenolic compounds. Figure 4 shows the HPLC
profile of the infusions (positive trace indicates the absorbance obtained with the DAD
detector at 280 nm and the negative trace the absorbance obtained by the second detector at
600 nm). An indication that the on-line measurement was coherent is the fact that caffeine
(peak 1), which is not an antioxidant, did not give a negative peak. In the column used for
the antioxidant activity, teobromine co-eluted with 5-CQA, giving the highest positive peak
and a small negative peak because teobromine is not an antioxidant.
Table 3 displays the mean concentrations of the phenolic compounds and the TEAC
value, clearly showing that the antioxidant capacity was not proportional to the analytes’
concentrations. 3-CQA, quercetin-3-O-glucoside, quercetin-3-rhamnosylglucoside had the
highest TEAC values ( about 1.00 ), although the quercetin glycosides had concentrations

86
Figure 4. On-line HPLC ABTS+ analysis of the Ilex paraguarienses beverage chimarrão.
Positive Trace: PDA at 280 nm and Negative Trace: UV-VIS at 600 nm. Peak
identification: 1, caffeine; 2, 3-O-Caffeoylquinic acid; 3, 5-O-Caffeoylquinic acid; 4,
Teobromine; 5, 4-O-Caffeoylquinic acid; 6, Quercetin-3-rhamnosylglucoside; 7, Quercetin-
3-O-glucoside; 8, Kaempferol-3-O-glucoside; 9, 3,5-Dicaffeoylquinic acid; 10, 4,5-
Dicaffeoylquinic acid; 11, Tricaffeoylquinic acid. Chromatographic conditions are
described in the text.

87
Table 3. Individual antioxidant capacity of the phenolic compounds of chimarrão (Ilex
paraguariensis).
Compound Mean Concentration
(µg/mL)
TEAC (ac/aT)
3-O-Caffeoylquinic acid 187.6 1.01
5-O-Caffeoylquinic acid 216.6 0.76
4-O-Caffeoylquinic acid 147.6 0.87
Quercetin-3-rhamnosylglucoside 11.3 1.00
Quercetin-3-O-glucoside 10.3 1.01
Kaempferol-3-O-glucoside 11.7 0.92
3,5-Dicaffeoylquinic acid 147.2 0.83
4,5-Dicaffeoylquinic acid 273.0 0.80
Tricaffeoylquinic acid 140.3 0.95
Trolox - 1.00
TEAC, trolox equivalent antioxidant capacity; ac, slope of compound calibration curve; aT, slope of
trolox calibration curve.
less than 10 times that of 3-CQA. Tri-CQA, kaempherol-3-O-glucoside, and 4-O-CQA had
TEAC values of 0.95, 0.92 and 0.87, respectively, although the CQA´s had levels more
than 10 times that of the kaempferol glycoside. The major phenolic compounds of the mate
infusions, 4,5-diCQA and 5-CQA, had lower TEAC values.

88
LITERATURE CITED (1) Delacassa, E.; Bandoni, A. L. El Mate. Ver. Fitoterapia. 2001, 1, 269-278.
(2) Maccari Junior, A. Produtos alternatives e desenvolvimento da tecnologia industrial na
cadeia produtiva da erva-mate. Curitiba: Câmara Setorial de Cadeia Produtiva da Erva-
Mate, 2000. 160p. (Série PDACT;1)
(3) Maccari, A. Jr. Análise do pré-processamento da erva mate para chimarrão. Doctoral
Thesis. Universidade Estadual de Campinas, Campinas, Brasil, 2005.
(4) Andersen, T; Fogh, J. Weight loss and delayed gastric emptying following a South
American herbal preparation in overweight patients. J. Human Nutr. Diet. 2001, 14,
243–250.
(5) Athayde, M. L.; Coelho G.C.; Schenkel E. P. Caffeine and teobromine in epicuticular
wax of Ilex paraguariensis A. St.-Hil. Phytochem. 2000, 55, 853-857.
(6) Filip, R.; Lotito S. B.; Ferraro, G.; Fraga C. G. Antioxidant activity of Ilex
paraguariensis and related species. Nutr. Res. 2000, 20, 1437-1446.
(7) Filip, R.; López, P.; Giberti, G.; Coussio, J.; Ferraro, G. Phenolic compounds in seven
South American Ilex species Fitoterapia 2001, 72, 774-778.
(8) González, A.; Ferreira, F.; Vázquez, A.; Moyna, P.; Alonso Paz, E. Biological
screening of Uruguayan medicinal plants. J. of Ethnopharm. 1993, 39, 217-220.
(9) Gugliucci, A.; Menini, T. The botanical extracts of Achyrocline sauteroides and Ilex
paraguariensis prevent methylglyoxal-induced inhibition of plasminogen and
antithrombin III. Life Sci. 2002, 72, 279-292.
(10) Chandra, S.; Gonzalez de Mejia, E. Polyphenolic compounds, antioxidant capacity,
and quinone reductase activity of an aqueous extract of Ardisia compressa in

89
comparison to mate (Ilex paraguariensis) and green (Camellia sinensis) teas. J. Agric.
Food Chem. 2004, 52, 3583-3589.
(11) Mazzafera, P. Maté drinking:caffeine and phenolic acid intake
Food Chem. 1997, 60, 67-71.
(12) Clifford, M. N.; Ramirez-Martinez, J. R. Chlorogenic acids and purine alkaloids
contents of maté (Ilex paraguariensis) leaf and beverage
Food Chem. 1990, 35, 13-21.
(13) Carini, M.; Facino, R.M.; Aldini, G.; Calloni, M.; Colombo, L. Characterization of
phenolic antioxidants from mate (Ilex paraguariensis) by liquid chromatography/mass
spectrometry and liquid chromatography/tandem mass spectrometry. Rapid Commun.
in Mass Spectr. 1998, 12, 1813-1819.
(14) Bravo, L.; Goya, L.; Lecumberri, E. LC/MS characterization of phenolic constituents
of mate (Ilex paraguarienses, St. Hill.) and its antioxidant activity compared to
commonly consumed beverages. Food Res. Int. 2007, 40, 393-394
(15) Gugliucci, A. Antioxidant effect of Ilex paraguariensis: induction of decreased
oxidability of human LDL in vivo. Biochem. Biophys. Res. Commum. 1996, 224, 338-
344.
(16) Gugliucci, A.; Stahl A. J. Low density lipoprotein oxidation is inhibited by extracts of
Ilex paraguariensis. Biochem. Mol. Biol. Int. 1995, 224, 338-344.
(17) Kerry, N.; Rice-Evans, C. Inhibition of peroxynitrile-mediated oxidation of dopamine
by flavonoid and phenolic antioxidants and their structural relationships. J.
Neurochem. 1999, 73, 247-253.

90
(18) Nardini, M.; Natella, F.; Gentili, V.; Di Felice. M; Saccini, C. Effect of caffeic acid
dietary supplementation on the antioxidant defense system in rat: an in vivo study.
Arch. Biochem. Biophys. 1997, 342, 157-160.
(19) Kono, Y.; Kobyashi, K; Tagawua, S. Adachi, K.; Ueda, A.; Sawa, Y.; Shibata, H.
Antioxidant activity of polyphenolicsin diets. Rate constants of reactions of
chlorogenic acid and caffeic acid with reactive species of oxygen and nitrogen.
Biochim. Biophys. Acta 1997, 1335, 335-342.
(20) Bracesco, N.; Dell, M..; Rocha, A.; Benhtash, S.; Menini, T.; Gugliucci, A.
Antioxidant activity of a botanical extract preparation of Ilex paraguariesis:
Prevention of DNA double-strand breaks in Saccharomyces cerivisiae and human low-
density lipoprotein oxidation. J. Altern. Complement. Med. 2003, 9, 379-387.
(21) Schinella G.R., Troiani, G., Dávila, V., de Buschiazzo, P.M., Tournier, H.A.
Antioxidant effects of an aqueous extract of Ilex paraguarienses. Biochem. Biophys.
Res. Commun. 2000, 269, 357-360.
(22) Koleva, I. I.; Niederländer, H. A. G.; Van Beek ,T. A. Application of ABTS radical
cation for selective on-line detection of radical scavengers in HPLC eluates. Anal.
Chem. 2001, 73, 3373 – 3381.
(23) Dapkevicius, A.; van Beek, T. A.; Niederländer, H. A. G. Evaluation and comparison
of two improved techniques for the on-line detection of antioxidants in liquid
chromatography eluates. J. Chromatogr. A. 2001, 912, 73-82.
(24) Stewart, A. J.; Mullen, W.; Crozier, A. On-line high-performance liquid
chromatography analysis of the antioxidant activity of phenolic compounds in green
and black tea. Mol. Nutr. Food Res. 2005, 49, 52-60.

91
(25) Ribani, R.H. (2006). Phenolic compounds in erva-mate and fruits. Doctoral Thesis in
food Science. Campinas, Brazil: School of Food Engineering, State University of
Campinas, 137p.
(26) Trugo, L.C.; Macrae, R. The chlorogenic acid composition of instant coffees. Analyst
1984, 109, 263-266.
(27) Negish, O.; Negish, Y.; Yamaguchi, F.; Sugahara,T. Deodorization with ku-ding-cha
containing a large amount of caffeoyl quinic acids derivates. J. Food Agric. Chem.
2004, 52, 5513-5518.
(28) Yoshimoto, M.; Yabara, S.; Okuno, S.; Islam, M.S.; Ishiguro, K.; Yamakawa, O.
Antomutagenicity of mono-, di-, and tricaffeoylquinic acid derivatives isolated from
sweet potato (Ipomoea batatas L.). Leaf Biosci. Biotechnol. Biochem. 2002, 66, 2336-
2341.
(29) Bastos, D. H. M.; Fornari, A. C.; Queiroz, Y. S.; Torres, E. A. F. S. Bioactive
compound contentc of chimarrão infusions related to the moisture of yerba maté (Ilex
paraguariensis) leaves. Braz. Archiv. Biol. Technol. 2006, 49, 399-404.

92
CAPITULO 4
Quantification of Phenolic Compounds
and Purine Alkaloids in Ilex
paraguarienses Infusions
RENATO G. PERES
DELIA B. RODRIGUEZ-AMAYA
Artigo a ser submetido à revista
Journal of Food Composition and Analysis

93
Quantification of phenolic compounds and purine alkaloids in
Ilex paraguarienses infusions
Renato G. Peres, Delia B. Rodriguez-Amaya∗
Departamento de Ciência de Alimentos, Faculdade de Engenharia de Alimentos,
Universidade Estadual de Campinas, C.P. 6121, 13083-862 Campinas, SP, Brazil
Keywords: Ilex paraguarienses infusions; mate; phenolics; purine alkaloids, HPLC analysis
* Corresponding author. Tel: 55-19-3521-4013. Fax: 55-19-3521-2153.
E-mail: [email protected]

94
Abstract
Hot and cold infusions of mate (Ilex paraguariensis dried leaves) are widely
consumed in Brazil. These infusions have been shown to have beneficial effects on health,
which have been mainly attributed to their phenolic compounds. This work had a two-fold
objective: (1) compare quantification of flavonols in the glycosidic and aglycone forms,
and (2) compare the phenolic and purine alkaloid composition mate taken from two stages
of industrial production and of hot and cold infusions. The HPLC quantitative method used
for the quantification of the flavonol aglycones obtained by hydrolysis and that used for
quantifying the glycosides, other phenolics and the purine alkaloids performed well. Both
methods showed good linearity, limits of detection and quantification, recovery and
repeatability. For all thirteen samples, analyzed as hot or cold infusion, equivalent results
were obtained for quercetin and kaempherol, thus these flavonols are amenable to
quantification either in the glycoside or aglycone form. Understandably, the levels of all the
analytes in all the samples were lower in the cold infusion. In both infusions the phenolic
and purine alkaloid concentrations tended to be higher in the samples obtained from the
producers than in the commercial samples, indicating that losses occurred in the additional
processing and probably storage that the latter samples underwent.

95
1. Introduction
The dried leaves of Ilex paraguarienses St. Hilaire commonly called “mate” or
“yerba mate” is used to prepare tea-like beverages widely consumed in South America. It is
estimated that 30% of the population in this region drink over 1 liter per day of mate
infusions (Delacassa and Bandoni, 2001). Around 80% of the planted area is in Brazil with
an estimated production of 650,000 tons of mate per year (Maccari, 2005). Typical
beverages from mate consumed in Brazil are “chimarrão” (infusion prepared with hot
water) and “tererê” (infusion prepared with cold water).
Some therapeutic properties have been attributed to mate such as antirheumatic,
hypocholesterolemic, anti-thrombotic, anti-inflammatory, anti-obesity, anti-aging,
hepatoprotective and diuretic activities (Gonzalez et al., 1993; Athayde et al., 2000;
Delacassa and Bandoni, 2001; Filip et al., 2000, 2001; Andersen and Fogh, 2001;
Gugliucci, 2002). Some of the pharmacological properties have been attributed to the
antioxidant activity of the high content of phenolic compounds, especially caffeoyl
derivatives (Clifford and Ramirez-Martinez, 1990; Gugliucci, 1996; Mazzafera, 1997; Filip
et al., 2000; 2001).
The phenolic compounds of Argentinian mate have been identified by high
performance liquid chromatography with diode array and mass detectors (HPLC-DAD-MS)
(Carini et al., 1998; Bravo et al., 2007). However, quantification was not carried out in the
first paper and only relative percentages were calculated in the second. Filip et al. (2000)
analyzed phenolic compounds in dried powdered leaves of Argentinian Ilex species and
Pomillo et al., (2002) the purine alkaloids in Argentinian mate infusions, but in both cases
the quantitative data were also given in percentages. Clifford and Ramirez-Martinez (1990)

96
quantified caffeine, teobromine, total chlorogenic acids and total dichlorogenic acids, on a
mg per cup basis, of infusions prepared from Brazilian mate purchased in the UK and
Germany. For the mate leaves, these analytes were reported as percentages on a dry weight
basis. In a Brazilian study, Bastos et al. (2006) determined caffeine, caffeic acid and 5-
CGA (in µg/mL) in chimarrão. Thus, absolute quantitative data on the phenolic compounds
and purine alkaloids of mate or its infusions are lacking.
In a previous paper (Chapter 3), the phenolic compounds and purine alkaloids of
infusions prepared from commercial Brazilian mate were identified by HPLC-DAD-
ESI/MS and the absolute concentrations determined by HPLC-DAD. On-line evaluation of
the individual antioxidant activity, measured by their ABTS+ radical scavenging activity,
showed that quercetin-3-O-glucoside and kaempherol-3-O-glucoside were principal
contributors to the antioxidant capacity of the infusions, along with 3-O-caffeoylquinic acid
and tricaffeoylquinic acid, although the latter compounds had levels more than 10 times
those of the flavonols.
The flavonols are found in plant foods in the glycosidic form. In flavonol analysis,
hydrolysis of the glycosides is usually done to minimize interferences and simplify the
subsequent chromatography since each flavonoid can occur as various glycosides.
Hydrolysis is generally done simultaneously with extraction, using HCL in aqueous
methanol under reflux or ambient conditions, but optimization in terms of the HCl
concentration, time and temperature of hydrolysis (Hertog et al., 1993, Häkkinen et al.,
1998; Nuutila et al., 2002), is necessary to insure complete hydrolysis without degrading
the aglycones.
The objectives of the present study were: (1) to compare the quantification
procedure of flavonols in the glycosidic with that in the aglycone form and (2) to compare

97
the phenolic and purine alkaloid composition at two stages of mate production and of hot
and cold infusions.
2. Materials and methods
2.1. Chemicals
Standards of the flavonol aglycones, kaempferol and quercetin, and the purine
alkaloids, caffeine and teobromine, were purchased from Sigma Chemical Company (St.
Louis, MO, USA). Standards of quercetin-3-rhamnosylglucoside, quercetin-3-O-glucoside,
kaempferol-3-O-glucoside, 3,5-dicaffeoylquinic acid were obtained from Extrasynthese
(Genay, France). HPLC-grade methanol and acetonitrile were purchased from Tedia
Company (Fairfield, OH, USA); analytical-grade HCl and formic acid from Merck
(Darmstad, Germany); and butyl-hydroxyanisol (BHA) from Aldrich (St. Louis, MO,
EUA). Membrane filters were provided by Millipore (Bedford, MA, USA).
Stock standard solutions were prepared at a concentration of 1 mg/mL in methanol
and stored at -20oC for a maximum of 2 months. Water was purified using a MilliQ system
from Millipore Corporation (Millipore, Bedford, MA, USA).
3-Caffeoylquinic acid and 4-caffeoylquinic acid, which are not commercially
available, were prepared and isolated as described in Chapter 3.

98
2.2. Sample preparation
The mate samples from PR1 to PR7 were yerba “cancheada”, kindly donated by Dr.
Agenor Maccari (Federal University of Paraná, Curitiba, PR, Brazil), which were obtained
directly from producers in the state of Paraná, Brazil. The other mate samples (S1 to S6)
were purchased from supermarkets in São Paulo, Brazil and were produced in the states of
Paraná, Santa Catarina, and Rio Grande do Sul (two sample lots from each state). The
flowsheet for yerba mate production is shown in Figure 1. “Sapeco” consists of heating the
leaves over fire in a gyrating, inclined cylinder to reduce enzymatic activity, thus
controlling enzymatic browning.
Two packages of each sample lot were ground to pass a 40-mesh screen and mixed
and chimarrão (hot infusion) was prepared in duplicate for each lot by adding 250 mL of
deionized water at 70oC to 5 g of the sample. The infusion was stirred for 3 min and then
filtered through a 0.45 µM membrane. Tererê (cold infusion) was prepared using the same
procedure, but the water temperature was 5oC. An aliquot of chimarrão or tererê was
diluted 20 fold with deionized water and immediately injected in the HPLC system.
For flavonol hydrolysis (Hertog et al., 1993), to 15 mL of the beverage, 40 mL of
62.5% methanol/water (with 2 g/L BHA) were added, followed by the addition of 10 mL
6M HCl. The solution was refluxed in a water bath at 90oC for 2 h, then cooled in an ice
bath and its volume completed to 100 mL with methanol. Two mL of the resulting solution
were

99
Figure 1. Industrial steps in mate production.

100
filtered in a 0.22 µm membrane and injected into the HPLC system. An aliquot was diluted
20 fold with deionized water and immediately injected in the HPLC and µLC systems.
2.3. µLC analysis of the aglycones
The aglycones quercetin and kaempferol were quantitated by a µLC-DAD system
consisting of a Waters Alliance model 2695 separations module with a photodiode array
detector model 996, equipped with a microbore detection cell. For data collection and
treatment, Empower 2 Software (Waters Corporation, Milford, MA, USA) was used.
Chromatographic separation was achieved using a microbore Atlantis difunctional dC18
column (Cat no.186001279) (3 µm,1.0 x 50 mm) (Waters Corporation, Milford, MA, USA)
thermostated at 35oC with a Waters temperature control module. System flow-rate was
90µL/min. A binary convex gradient was used, the mobile phase consisting of H2O/formic
acid (99:1 v/v) as phase A and ACN/formic (99:1 v/v) as phase B. Prior to each injection,
the system was equilibrated at 95/5 (A/B). This proportion was changed to 40/70 in 1.8
min, then to 20/80 in 10 min and back to 95/5 in 10 to 15 min. The chromatographic run
time was 15 min and injection volume was 1.0 µL.
2.4. HPLC analysis of the phenolic compounds and the purine alkaloids
The HPLC equipment used for the separation and quantification of the phenolic
compounds, including the flavonol glycosides, and purine alkaloids consisted of a Waters
Alliance model 2695 separation module with a photodiode array detector model 996,
equipped with an X-Bridge C18 column, 5µm, 4.6 x 150 mm, a microbore detection cell

101
and, for data collection and treatment, an Empower 2 software (Waters Corporation,
Milford, MA, USA). The system was thermostated at 35oC with a Waters temperature
control module and the flow rate was 1.0 mL/min. A binary convex gradient was employed
with the following solutions: H2O/formic acid (99:1 v/v) as phase A and acetonitrile/formic
acid (99:1.0 v/v) as phase B. Starting with 95A/5B, the proportion was altered to 40A/70B
in 5 min, then to 20A/80B in 15 min, and to 95A/5B in 30min. The chromatographic run
time was 30 min and the injection volume was 10 µL.
Quantification was done by external standardization, using the respective standards.
However, tricaffeoylquinic acid, for which there is no commercially available standard, was
estimated from the 3,5-dicaffeoylquinic acid curve.
Both quantitative methods were validated. Linearity was evaluated by the injection
of five standard solutions of each analyte at the concentration ranges expected in the
samples. Limits of detection (LOD) and quantification (LOQ) were calculated as the
solution concentrations that gave signal-to-noise ratios of 3 and 10, respectively. Recovery
was studied at three levels, each level injected in triplicate.
2.5. ESI/MS analysis
The identity of the aglycones obtained after hydrolysis was confirmed by mass
spectrometry (ESI/MS). The extracts were analyzed by a Micromass ZMD quadrupole
mass spectrometer with electrospray interface, coupled to a HPLC system Waters model
2690 separations module, equipped with a photodiode detector model 996 and a microbore
cell (Waters Corporation, Milford, MA, USA). Mass spectrometer parameters were set as
follows: ionization mode, electrospray positive ion mode; capillary voltage, 4.0 kV; source

102
block temperature, 140oC; desolvation temperature, 400oC; nebulizer nitrogen flow rate, 50
L/hr; desolvation nitrogen gas flow, 568 L/hr; LM resolution, 10; HM resolution, 12; ion
energy, 1.0 V; cone voltage, 35 V; RF lens, 0.5 V; extractor lens, 5 V. The spectrum was
recorded by scanning the mass range from m/z 100 to 1000 with scan time of 1 s.
MassLysnx Software Version 3.5 (Micromass UK Ltd, Manchester, UK) was used for data
acquisition.
2.6. Statistical analysis
The quantitative results were submitted to analysis of variance (p ≤ 0.05), the means
being compared by the Tukey’s test.
3. Results and discussion
3.1 Flavonol identification and performance of the quantitative method.
Typical μLC-DAD chromatogram of major flavonols in mate infusion and HPLC-
DAD chromatogram of phenolic compounds and purine alkaloids are presented in Figure 2.
For the aglycones, a baseline separation was achieved by a simple binary gradient for the
two major compounds in less than 15 minutes and for the flavonol glycosides, purine
alkaloids and other phenolics, the run time was 30 min. Preliminary assignment of peak

103
Figure 2. Absorption and mass spectra of the aglycones quercetin (Q) and kaempferol (K) and sample chromatograms: (A): chromatogram of the aglycones and (B) chromatogram of the glycosides, other phenolic compounds and purine alkaloids. Chromatographic conditions are in the text. Peak identification: Q = quercetin, K = kaempferol, 1 = caffeine, 2 = 3-O-caffeoylquinic acid, 3 = 5-O-caffeoylquinic acid, 4 = teobromine , 5 = 4-O-caffeoylquinic acid, 6 = quercetin-3-rhamnosylglucoside, 7 = quercetin-3-O-glucoside, 8 = kaempferol-3-O-glucoside, 9 = 3,5-dicaffeoylquinic acid, 10 = 4,5-dicaffeoylquinic acid, 11 = tricaffeoylquinic acid.

104
identities in the infusion samples (chimarrao and tererê) was based on comparison of peak
retention time (tR) and on-line DAD spectra with those of authentic standards, confirming
two absorption bands characteristic of flavonoids, band II with maximum in the 240-285
nm range, due to the B-ring, and Band I with a maximum in the 300-550 nm range (Merken
and Beecher, 2000). Identification was subsequently confirmed by μLC-ESI-MS, resulting
in molecular ions of [M+H]+=303 m/z (C15H10O7 ) and [M+H]+= 287m/z (C15H10O6),
corresponding to quercetin and kaempferol.
The performance characteristics of the quantitative methods were good (Table 1).
For quercetin, R2 was 0.9999 (concentration range of 1-80 mg/L); limit of detection, 0.6
mg/L; limit of quantification, 2.4 mg/L and % recovery, 95%. The corresponding values for
kaempherol were: 0.9998 (concentration range, 1-30 mg/L), 0.4 mg/L, 1.8 mg/L and 99%.
For the favonol glycosides, other phenolics and purine alkaloids, R2 values were also
generally above 0.9997, except for quercetin-3-O-glucoside and 4,5-dicaffeoylquinic acid,
both of which had 0.9989, and kaempferol-3-O-glucoside, with 0.9990. Limit of detection
varied from 0.4 to 0.8 mg/L, limits of quantification from 1.8 to 2.9 mg/L and recoveries
from 96 to 100%. The coefficients of variation for peak area of ten consecutive injections
of standard solutions were lower than 1%.
3.2. Quantitative composition
The flavonol concentrations of the hot and cold infusions of two types of mate
samples are shown in Tables 2 and 3. For all thirteen samples analyzed, there was excellent
agreement between the sum of the concentrations of the two quercetin glucosides and that

105
of the aglycone quercetin in both the hot and cold infusions. Likewise, the concentrations of
the kaempherol glucoside and the aglycone kaempherol were equivalent for both influsions.
Therefore, the flavonols can be quantified in either forms, provided that conditions are
optimized and glycoside standards are used for the quantification in the glycoside form and
the free flavonols for the hydrolyzed samples. Glycosides absorb at different wavelengths
and different from those of the free flavonols. Quantification in the hydrolyzed form is
attractive for its simplicity in the chromatographic step. However, the pre-chromatographic
step is longer and more laborious, and drastic reagents are used. Additionally, simultaneous
quantification of other phenolic and the purine alkaloids may not be recommended as
degradation of these other analytes may occur, as indicated in Figure 2A. On the other
hand, standards for glycosides are expensive and not easy to obtain. For mate, only two
glycosides of quercetin and one glycoside for kaempferol were found. In other foods, there
are more glycosides for each flavonol, making the analysis more complex
In all of the samples, the flavonol concentrations in both glycoside and aglycone
forms were understandably lower in the cold infusion compared to the hot infusion. This
was also true with the glycosides, other phenolic compounds and the purine alkaloids
(Tables 4 and 5).
In both infusions, the phenolic and purine alkaloid concentrations tended to be
higher in the samples obtained from the producers (samples PR-1 to PR-7) than in the
commercial samples (S1-S6). As can be seen in Figure 1, the latter samples were subjected
to additional processing steps, during which degradation and/or physical removal of the
compounds investigated in this study might have occurred.
Bastos et al. (2006) found 145 to 294 mg/L in three “cancheada” samples from
Paraná, values which agree with those obtained in the present study (142-248 mg/L). For 5-

106
CQA, the range was 357 to 447 mg/L, higher than those of the present study (145-269
mg/L). However, it is not clear if 3-CQA and 4-CQA were separated from 5-CQA in the
work of Bastos et al. These compounds are not easily separated. Quantitative data for the
other analytes herein quantified are not available.
4. Conclusions
The flavonols can be quantified either in the glycoside or the aglycone form provided that
the conditions are optimized in each case. Each procedure has limitations and advantages to
be considered in choosing the procedure to be used. Greater amounts of phenolic
compounds and purine alkaloids are extracted into the infusion when hot water is used. In
both hot and cold infusions, the phenolic and purine alkaloid concentrations tended to be
higher in samples obtained from the producers than in the commercial samples, indicating
losses during the additional processing steps or during storage of the latter samples.
Acknowledgement
The authors wish to thank FAPESP and CNPq for the financial support through the projects
PRONEX n° 2003/10151-4 and Projeto Universal n° 477189/2004-0, respectively.

107
Table 1
Performance characteristics of the μLC-DAD and HPLC-DAD methods.
Phenolic compound Retention
time (min)a
Concentration
range
(mg/L)a
Coefficient of
correlationa
Limit of
quantification
(mg/L)a
Limit of
detection
(mg/L)a
Recovery (%)b
Quercetin 11.2 1-80 0.9999 2.4 0.6 95 ± 1
Kaempferol 11.9 1-30 0.9998 1.8 0.4 99 ± 2
Caffeine 13.9 20-300 0,9997 2.9 0.8 98 ± 1
3-O-Caffeoylquinic acid 16.8 20-300 0,9998 2.2 0.5 96 ± 1
5-O-Caffeoylquinic acid 19.8 20-300 0,9999 2.3 0.5 99 ± 2
Teobromine 19.8 5-300 0.9998 2.8 0.8 100 ± 1
4-O-Caffeoylquinic acid 20.1 20-300 0.9999 2.3 0.5 97 ± 1
Quercetin-3-rhamnosylglucoside 24.2 1-50 0,9998 2.8 0.8 98 ± 1
Quercetin-3-O-glucoside 25.0 1-50 0.9989 2.6 0.7 100 ± 2
Kaempferol-3-O-glucoside 25.6 1-50 0.9990 2.4 0.5 99 ± 1
3,5-Dicaffeoylquinic acid 27.4 20-300 0.9997 2.3 0.4 98 ± 1
4,5-Dicaffeoylquinic acid 27.8 20-300 0.9989 2.3 0.4 99 ± 1
aSix concentrations, each injected in triplicate. bAt three levels, each level injected in triplicate.

108
Table 2
Flavonol glycoside and aglycone contents (mg/L)a of hot infusions prepared from Brazilian mate (Ilex paraguarienses)
Sample Codeb Quercetin-3-
rhamnosylglucoside
Quercetin-3-O-
glucoside
Quercetin aglycone Kaempferol-3-O-
glucoside
Kaempferol
aglycone
PR-1 15±1 19±1 35±1 12±0.1 12±0.1
PR-2 29±1 37±1 67±1 15±0.2 14±0.2
PR-3 20±2 25±2 45±2 10±0.1 9±0.1
PR-4 19±1 19±2 38±1 10±0.2 10±0.2
PR-5 15±1 18±1 35±1 21±1 22±1
PR-6 35±2 28±2 65±2 10±0.3 11±0.3
PR-7 38±2 33±2 74±2 18±0.5 18±0.5
S1 10±1 12±1 23±1 9±1 9±0.2
S2 12±2 13±1 26±1 10±1 10±0.5
S3 10±1 13±2 23±0.8 trc trc
S4 10±1 8±1 18±0.5 trc trc
S5 18±1 10±1 28±1 12±1 13±1
S6 8±1 6±1 15±0.3 16±1 16±0.2 an = 6, each infusion prepared in duplicate, each injected in triplicate. bSamples PR-1 to PR-7 were obtained from the producers and samples
S1 to S6 were taken from supermarkets. ctr = trace (LOD = 0.5 mg/L). The sums of the concentrations of the quercetin glycosides are
equivalent to those of quercetin; the concentrations of the kaempferol glycoside are equivalent to those of kaempferol.

109
Table 3
Flavonol glycoside and aglycone contents (mg/L)a of cold infusions prepared from Brazilian mate (Ilex paraguarienses)
Sample Code Quercetin-3-
rhamnosylglucoside
Quercetin-3-O-
glucoside
Quercetin
aglycone
Kaempferol-3-O-
glucoside
Kaempferol
aglycone
PR-1 13±1 18±1 32±0.5 10±0.1 11±0.1
PR-2 26±1 35±1 62±2 13±0.2 13±0.2
PR-3 16±2 22±2 39±1 8±0.1 8±0.1
PR-4 17±1 15±2 31±0.5 7±0.2 7±0.2
PR-5 14±1 14±1 28±1 19±1 21±1
PR-6 32±2 22±2 54±2 10±0.3 10±0.3
PR-7 36±2 31±2 69±2 16±0.5 17±0.5
S1 9±1 10±1 19±1 7±1 7±0.2
S2 11±2 22±1 33±1 8±1 9±0.2
S3 8±1 7±1 16±0.7 tr tr
S4 8±1 6±1 15±0.4 tr tr
S5 12±1 11±1 22±1 13±1 12±1
S6 7±1 4±1 12±0.3 15±1 14±0.2 an = 6, each infusion prepared in duplicate, each injected in triplicate. bSamples PR-1 to PR-7 were obtained from the producers and samples
S1 to S6 were taken from supermarkets. ctr = trace (LOD = 0.5 mg/L). The sums of the concentrations of the quercetin glycosides are
equivalent to those of quercetin; the concentrations of the kaempferol glycoside are equivalent to those of kaempferol.

110
Table 4
Other phenolic and purine alkaloid contents (mg/L) a of hot infusions prepared from Brazilian mate (Ilex paraguarienses)
Sample
codeb
Caffeine 3-CQA 5-CQA Teobromine 4-CQA 3,5-DiCQA 4,5-DiCQA TriCQAc
PR-1 184±9 202±11 244±12 98±7 145±12 144±12 184±10 125±7
PR-2 198±11 224±18 268±11 103±9 178±11 187±11 198±12 147±9
PR-3 224±8 278±12 287±15 87±8 197±10 192±10 224±8 148±8
PR-4 157±12 252±13 256±7 112±10 124±8 176±10 187±7 167±11
PR-5 224±8 219±10 245±12 67±5 187±9 134±7 197±9 134±9
PR-6 267±13 198±8 289±8 87±4 192±11 138±10 194±7 137±7
PR-7 254±15 174±8 165±8 74±6 196±13 141±9 189±9 134±9
S1 146±11 183±6 263±4 72±3 153±8 112±7 238±8 125±9
S2 265±12 153±7 212±9 125±9 188±4 138±8 278±6 128±7
S3 190±13 193±8 183±8 102±6 139±8 167±7 289±6 156±6
S4 124±8 166±4 213±12 64±7 153±7 145±5 267±7 136±4
S5 268±12 189±5 219±8 126±8 130±5 156±3 279±5 143±6
S6 197±15 242±9 210±9 90±4 123±8 165±4 287±5 154±4 an = 6, each infusion prepared in duplicate, each injected in triplicate. bSamples PR-1 to PR-7 were obtained from the producers and
samples S1 to S6 were taken from supermarkets. cEstimated from 3,5-dicaffeoylquinic acid calibration curve. CQA = caffeoylquinic
acid. Although not statistically significant, the general means of all analytes are higher for the producers’ samples, except for
4,5,-DiCQA, which is significantly higher in the commercial sample.

111
Table 5
Other phenolic and purine alkaloid contents (mg/L)a of cold infusions prepared from Brazilian mate (Ilex paraguarienses)
Sample
code
Caffeine 3-CQA 5-CQA Teobromine 4-CQA 3,5-DiCQA
4,5-DiCQA TriCQAb
PR-1 172±9 196±12 216±10 78±9 139±9 124±8 174±8 121±9
PR-2 178±12 213±11 237±9 94±8 162±8 178±11 182±9 134±10
PR-3 212±10 256±10 269±12 83±9 179±9 185±10 208±9 132±9
PR-4 142±9 228±11 245±10 101±7 112±7 167±9 182±8 149±7
PR-5 207±9 207±10 231±9 63±4 178±8 123±8 177±9 112±8
PR-6 248±12 186±8 268±10 69±6 184±11 131±9 175±10 126±9
PR-7 239±9 163±9 145±8 71±6 190±9 133±8 179±12 130±7
S1 124±9 167±4 164±10 57±3 114±12 103±8 206±7 102±5 S2 234±10 122±5 199±6 114±8 169±9 112±8 254±7 106±4 S3 168±9 168±8 203±5 77±5 125±4 123±3 256±8 134±5 S4 114±9 135±7 209±7 54±4 133±1 123±6 224±8 108±5 S5 246±10 169±6 193±6 113±1 104±1 126±4 239±6 139±6 S6 175±11 218±4 185±6 73±3 102±6 145±5 265±8 143±5
an = 6, each infusion prepared in duplicate, each injected in triplicate. bSamples PR-1 to PR-7 were obtained from the producers and
samples S1 to S6 were taken from supermarkets. cEstimated from 3,5-dicaffeoylquinic acid calibration curve. CQA = caffeoylquinic
acid. The general means of all analytes are higher for the producers’ samples (statistically significant for 3-CQA, 5-CQA, 4-
CQA and 3,5-CQA), except for 4,5,-DiCQA, which is significantly higher in the commercial sample.

112
References
Andersen, T., Fogh, J., 2001. Weight loss and delayed gastric emptying following a South
American herbal preparation in overweight patients. Journal of Human Nutrition and
Dietetics 14, 243–250.
Athayde, M.L., Coelho, G.C., Schenkel, E.P., 2000. Caffeine and teobromine in
epicuticular wax of Ilex paraguariensis St. Hill. Phytochemistry 55, 853-857.
Bravo, L., Goya, L., Lecumberri, E., 2007. LC/MS characterization of phenolic constituents
of mate (Ilex paraguarienses, St. Hill.) and its antioxidant activity compared to
commonly consumed beverages. Food Research International 40, 393-394.
Bastos, D.H.M., Fornari, A.C., Queiroz, Y.S., Torres, E.A.F.S., 2006. Bioactive
compounds content of chimarrão infusions related to the moisture of yerba maté (Ilex
paraguariensis) leaves. Brazilian Archives of Biology and Technology 49, 399-404.
Carini, M., Facino, R.M., Aldini, G., Calloni, M., Colombo, L., 1998. Characterization of
phenolic antioxidants from maté (Ilex paraguariensis) by liquid
chromatography/mass spectrometry and liquid chromatography/tandem mass
spectrometry. Rapid Communications in Mass Spectrometry 12, 1813-1819.
Clifford, M.N., Ramirez-Martinez, J.R., 1990. Chlorogenic acids and purine alkaloids
contents of maté (Ilex paraguariensis) leaf and beverage. Food Chemistry 35, 13-21.
Delacassa, E., Bandoni, A.L., 2001. El mate. Revista de Fitoterapia 1, 269-278.
Filip, R., Lotito S.B., Ferraro, G., Fraga C.G., 2000. Antioxidant activity of Ilex
paraguariensis and related species. Nutrition Research 20, 1437-1446.
Filip, R., López, P., Giberti, G., Coussio, J., Ferraro, G., 2001. Phenolic compounds in
seven South American Ilex species. Fitoterapia 72, 774-778.

113
González, A., Ferreira, F., Vázquez, A., Moyna, P., Alonso Paz, E., 1993. Biological
screening of Uruguayan medicinal plants. Journal of Ethnopharmacology 39, 217-
220.
Gugliucci, A., 1996. Antioxidant effects of Ilex Paraguariensis: Induction of decreased
oxidability of human L.D.L. in vivo. Biochemical and Biophysical Research
Communications 224 ,338-344.
Gugliucci, A., Menini, T., 2002. The botanical extracts of Achyrocline sauteroides and Ilex
paraguariensis prevent methylglyoxal-induced inhibition of plasminogen and
antithrombin III. Life Science 72, 279-292.
Hertog, M.G.L, Hollman, P.C.H, van de Putte, B., 1993. Content of potentially
anticarcinogenic flavonoids of tea infusions, wines and fruit juices. Journal of
Agricultural and Food Chemistry 41, 1242-1246.
Häkkinen, S.H., Kärenlampi, S., Heinonen, M., Mykkänen, H.M., Törrönen, A.R., 1998.
HPLC method for screening of flavonoids and phenolic acids in berries. Journal of the
Science of Food and Agriculture 77, 543-551.
Maccari Júnior, A., 2005. Análise do pré-processamento da erva mate para chimarrão.
Doctoral Thesis. Faculdade de Engenharia Agrícola. Universidade Estadual de
Campinas, 215 p.
Mazzafera, P., 1997. Maté drinking: caffeine and phenolic acid intake. Food Chemistry 60,
67-71.
Merken, H.M., Beecher G.R., 2000. Measurement of food flavonoids by high-performance
liquid chromatography: A review. Journal of Agricultural and Food Chemistry 48,
577-579.

114
Nuutila, A.M., Kammiovirta, K., Oksman-Caldentey, K.M., 2002. Comparison of methods
for the hydrolysis of flavonoids and phenolic acids from onion and spinach for HPLC
analysis. Food Chemistry 76, 519-525.
Pomillo, A.B., Trajtemberg, S., Vitale, A.A., 2002. High-performance capillary
electrophoresis analysis of mate infusions prepared from stems and leaves of Ilex
pararaguariensis using automated micellar electrokinetic capillary chromatography.
Phytochemical Analysis 13, 235-241.

115
CAPÍTULO 5
Determination of catechins in green tea infusions by reduced flow micellar
electrokinetic chromatography
RENATO G. PERES
FERNANDO G. TONIN
MARINA F.M. TAVARES
DELIA B. RODRIGUEZ-AMAYA
Artigo a ser submetido à revista Food Chemistry

116
Determination of catechins in green tea infusions by reduced
flow micellar electrokinetic chromatography
Renato G. Peresa, Fernando G. Toninb, Marina F.M. Tavares b, Delia B. Rodriguez-
Amayaa
aDepartamento de Ciência de Alimentos, Faculdade de Engenharia de Alimentos,
Universidade Estadual de Campinas, C.P. 6121, 13083-862 Campinas, SP, Brazil
bLaboratório de Eletroforese e Cromatografia, Departamento de Química Analítica,
Instituto de Química, Universidade de São Paulo, C.P. 260777, 05599-970 São Paulo, SP,
Brazil
Keywords: Capillary electrophoresis; RF-MEKC; Catechins, Tea; Camellia sinensis;
Flavan-3-ols.

117
Abstract
A fast RF-MEKC method modified by sulfated-β-cyclodextrin was developed and validated
for the determination of catechins in green tea. The optimal electrolyte consisted of 0.2%
triethylamine, 50 mmol/L SDS and 0.8% s-ß-CD (pH=2.9), allowing baseline separation of
five catechins in four min. The samples and standards were injected at 0.6 psi for 5 s under
constant voltage of -30 kV. Sample preparation simply involved extraction of 2 g of tea
with 200 mL water at 95oC under constant stirring for 5 min. The method demonstrated
excellent performance, with LOD and LOQ of 0.02 to 0.1 and 0.1 to 0.5 µg/mL,
respectively, and recovery percentages of 94 to 101%. The method was applied to six
samples of Brazilian green tea infusions. EGCg (23.4-112.4 µg/mL) was the major
component, followed by EGC (18.4-78.9 µg/mL), ECg (5.6-29.6 µg/mL), EC (4.6-14.5
µg/mL) and C (3.2-8.2 µg/mL).
118
1. Introduction
Tea is a widely consumed beverage worldwide. It has been promoted as a functional
food with cancer preventive action (Katiyar & Mukhtar, 1997; Yang, Lambert, Ju, Lu, &
Sang, 2006; Zaveri, 2006; Béliveau & Gringas, 2004). Various other properties, such as
antibacterial, antiviral, antiallergic, antiteratogenic activity (Jankun, Selman, Swiercz, &
Skrzypczak-Jankun, 1997; Yang, 1997; Toschi, Bordoni, Hrelia, Bendini, Lercker, Biagi,
2000) were observed in in vivo and in vitro experiments.
Using different varieties of Camellia sinensis, green tea is prepared from dried and
unfermented leaves. It is an important source of polyphenols, especially flavan-3-ols, also
called green tea catechins, a class of strong antioxidants, which might explain their
protective effects (Takeo, 1992). The major catechins in green tea are: epigallocatechin
(EGC), catechin (C), epigalocatechin gallate (EGCG), epicatechin (EC) and epicatechin
gallate (ECG).
Catechins have been mostly determined by reverse phase high performance liquid
chromatography (HPLC) (Dalluge, Nelson, Thomas, & Sander, 1998; Bronner & Beecher,
1998; Arts, Van de Putte, & Hollman, 2000; Lin, Tsai, Tsay, & Lin, 2003, Matsubara &
Rodriguez-Amaya, 2006). HPLC-MS has also been employed (Pelillo, Bonoli, Biguzzi,
Bendini, Toschi, &. Lercker, 2004). Capillary electrophoresis (CE) has been used in more
recent years. Neutral and ionizable groups in flavonoids make it possible for these
molecules to be separated in both capillary zone electrophoresis (CZE) (Horie, Mukai, &
Kohata,1997) or micellar electrokinetic chromatography (MEKC) modes. Several methods
have been described for catechin separation and quantification using MEKC (Bonoli,

119
Pelillo, Toschi, &Lercker, 2003; Horie & Kohata, 1998, Aucamp, Hara, & Apostolides,
2000).
Reduced flow-MEKC has been used in cases where it is necessary to reduce the pH
to prevent analyte degradation. As a consequence, the electroosmotic flow (EOF) is
significantly suppressed, a fast anodic migration occurs as the analytes partition into the
SDS negatively charged micelles (Janini, Issaq and Muschik, 1997). RF-MEKC has
become the method of choice of some authors in flavonoid study (Tonin, Jager, Micke,
Farah, & Tavares, 2005) and phenolic acids (Risso, Peres, & Amaya-Farfan, 2007).
Cyclodextrins (CD´s) are widely used for chiral separations in CE. The anionic
CD´s, like sulfated-β-cyclodextrin (s-β-CD) is negatively charged throughout the entire pH
range and are used for chiral separations of neutral and acidic compounds. The neutral and
charged groups in cyclodextrin allow hydrophobic and polar/electrostatic interactions and
can offer a diversity of options for CE separation (Vigh, Sokolowski, 1997; Eeckhaut and
Michotte, 2006). In catechin separation the use of CD´s is not usual, but it was employed
by Kodama et al. (2004) for enantioseparation of catechin and epicatechin with 6-O-α-D-
glucosyl-β-cyclodextrin and by Nelson et al. (1998) to improve the selectivity of the
method using β-cylodextrin.
In this work, a RF-MEKC method based on a SDS and s-β-CD system was
developed and optimized for the determination of five catechins in green tea in less than 5
min. RF-MEKC was chosen because catechins are stable at low pH and since at that pH
condition they are neutral the only possible separation strategy is to provide a secondary
charged phase in which they partition, i.e. an EKC phase.

120
2. Experimental
2.1. CE instrumentation and capillary conditioning
Experiments were conducted in a capillary electrophoresis system model P/ACE
MDQ (Beckman Instruments, Fullerton, CA, USA) equipped with a DAD detector, a
temperature control device maintained at 25oC, and a software (32 Karat® Software
Version 8.0) for data acquisition.
CE separations were carried out on an uncoated fused-silica capillary (Polymicro
Technologies, Phoenix, AZ, USA) with 40.0 cm effective length, 50.2 cm total length, 50
µm id and 375 µm od.
At the beginning of each working day, the capillary was conditioned by running 5
min of deionized water, 30 min of 1mmol/L NaOH, followed by 10 min of the electrolyte
solution. In between runs, the capillary was reconditioned by flushing with the electrolyte
solution for 2 min. At the end of the day, the capillary was rinsed with deionized water (5
min), followed by 1mmol/L NaOH (10 min) and again deionized water (5 min).
2.2. Reagents and solutions
All reagents were of analytical grade and water was purified by deionization
(18mΩ.cm) (Milli-Q system, Millipore, Bedford, MA, USA). The following catechin
standards were obtained from Sigma (St. Louis, MO, USA): EC, C, EGCg, EGC and ECg.
β-Cyclodextrin sulfated sodium salt was purchased from Fluka Biochemika (Bucks,
Switzerland), sodium dodecylsulfate from Riedel-de Haen (Sweelze, Germany),

121
triethylamine and phosphoric acid (both HPLC grade) from Tedia company (Fairfield, OH,
USA).
2.3. Sample preparation
Six samples of Brazilian green tea of different brands were purchased from a
supermarket in Sao Paulo, Brazil. Sample characteristics are listed in Table 3. The
infusions were prepared using an aqueous extraction simulating a normal brewing for a cup
of tea. For each sample, the contents of two bags were mixed, 2 g were weighed and placed
in a 250 ml conical flask and 200 ml of boiling water was added. Heating on a hot plate at
90oC for 5 min was then done with magnetic stirring. The extract was filtered through a
0.45 µm pore Millex HV filter (PVDF) from Millipore (Bedfrod, MA,USA), diluted with
purified water at a proportion of 1:5 and injected immediately in the CE system. The
samples were prepared in duplicate, each duplicate being injected three times.
2.4. Analytical conditions
The standard solutions and sample extracts used in this study were injected
hydrodynamically at 0.6 psi during 5s and monitored at 210 nm. The electrophoresis
system was operated under constant voltage condition of -30 kV.
Stock standard solutions of each 5 catechin were prepared at 1000 mg/L. Working
solutions were prepared by mixing appropriate volumes of the stock solutions and purified

122
water to give solutions containing 100, 75, 50, 25, 5 and 2.5 mg/L of each phenolic
compound. Quantification was carried out by external standardization.
2.5. Method development
The initial experiments involved testing a range of concentrations (10-100 mmol/L)
SDS in RF-MEKC. The SDS concentration that gave the best resolution of the compounds
of interest was 50 mmol/L.
With the objective of achieving better resolution and the shortest analysis time as
possible, three types of neutral or unsubstituted cyclodextrins (α-CD, γ-CD and β-CD) were
examined as buffer modifiers. α-CD and γ-CD were individually incorporated in the
running buffer, but no significant effect on the separation was observed. On the other hand,
β-CD had a positive effect, but it was not enough to achieve complete separation of all
catechins under investigation.
Figure 1 shows the electropherograms obtained with increasing s-β-CD
concentration from 0 to 1.0%. Although the electropherogram without addition of s-β-CD
appeared to have adequate resolution, the spectrum obtained by DAD for ECg peak in the
real sample showed the presence of an interfering substance. With the addition of s-β-CD,
the spectrum was that of ECg and the relative peak area was smaller.
It can be seen that the peaks of catechin and epigallocatechin overlapped at 0.2% s-
β-CD. A baseline separation was achieved with 0.4% s-β-CD. However, 0.8% was chosen
for method validation because a better separation with less tailing and better peak shape and
more evenly spaced were obtained under this condition.

123
Because catechin interacts more strongly with s-β-CD, which migrates more rapidly
than the SDS micelles, the migration time of catechin decreases with increasing
concentration of s-β-CD.
The optimized electrolyte consisted of 0.2% TEA, 50 mmol/L SDS and 0.8% w/v s-
β-CD (pH=2.9) adjusted with phosphoric acid. The electrolyte solution was prepared daily
and filtered through a 0.45 µm membrane.
Linearity was evaluated by the injection of five standard solutions of each catechin
at concentrations varying from 1.25 to 100 µg/mL. Limits of detection (LOD) and
quantification (LOQ) were calculated as the solution concentrations that gave signal-to-
noise ratios of 3 and 10, respectively. Peak and migration time repeatability was evaluated
by 10 consecutive injections of the standard solutions. Recovery was studied at three levels,
each level injected in triplicate.

124
Fig. 1. Electropherograms of tea catechins obtained with the RF-MEKC method, using
0.2% TEA and 50mM SDS with 0.0% (A), 0.2% (B), 0.4% (C), 0.6% (D) 0.8% (E) and
1.0% (F) of s-β -CD (sulfated cyclodextrin salt). Conditions are described in the text.

125
3. Results and discussion
3.1. Method performance
Performance characteristics of the method developed are listed in Table 1.
Correlation coefficients for the curves varied from 0.99983 for EC to 0.99998 for C. Limits
of detection of 0.02 to 0.1, considering the signal-to-noise ratio of 3:1, and limits of
quantification of 0.1 to 0.5, using the signal-to-noise ratio of 10:1, were obtained.
Repeatability for migration time and peak area was excellent, the coefficients of variation
(CV %) for 10 consecutive injections ranging from 0.008 to 0.019 and from 0.02 to 0.03,
respectively. The theoretical plates and peak symmetry are also shown in Table1.
For comparative purposes, published methods for tea catechins, with some
evaluation data (8 out of 17 methods presented in Chapter 1) are described in Table 2 and
the performance characteristics are shown in Table 3. All methods had good linearity with
R greater than 0.99. LOQ, determined for only three methods, ranged from 0.01 to 18 mg/l.
LOD was determined for all methods and it varied from 0.013 to 6.07. Recovery was done
for only one method and it ranged from 93.5 to 100.5%. The peak area repeatability,
determined for 5 methods, varied from 0.88 to 6.9%. Thus, the method herein developed
compares very favorably with other developed methods.

126
3.2. Catechins of Brazilian tea
The electropherogram (Figure 2) shows excellent separation of the catechins from a
Brazilian green tea infusion. The use of negatively charged s-β-CD) permitted the
separation of an interfering substance from ECg and anticipated the elution of catechin.
Table 4 presents the catechin concentrations for 6 Brazilian green tea analyzed by the
optimized method. The catechins, identified by co-chromatography and comparison of their
absorption spectra with those of standards, were EGCg (23.4-112.4 µg/ml) as the major
component, followed by EGC (18.4-78.9 µg/ml), ECg (5.6-29.6 µg/ml), EC (4.6-14.5
µg/mL) and C (3.2-8.2 µg/ml). In green tea of two brands commercialized in Campinas,
Brazil, the corresponding values determined by HPLC were 41-80, 37-72, 7.3-12, 7.0-14
and 1.3-4.5 µg/ml (Matsubara and Rodriguez-Amaya, 2006), thus in excellent agreement
with the present data especially considering that different samples collected in different
years were analyzed. The HPLC method of Matsubara and Rodriguez-Amaya, however,
took 30 min.

127
Fig. 2. Typical electropherogram of the catechins of Brazilian green tea. Conditions are
described in the text. Peak Identification: ECg, epicatechin gallate; EGCg, epigallocatechin
gallate; EC, epicatechin; C, catechin; EGC, epigallocatechin.
Migration time (min)
0.00 0.50 1.00 1.50 2.00 2.50 3.00 3.50 4.00
AU
0.000
0.005
0.010
0.015
0.020
0.025
0.030
ECG
EGCG
EC
C
EGC
Migration time (min)
0.00 0.50 1.00 1.50 2.00 2.50 3.00 3.50 4.00
AU
0.000
0.005
0.010
0.015
0.020
0.025
0.030
Migration time (min)
0.00 0.50 1.00 1.50 2.00 2.50 3.00 3.50 4.00
AU
0.000
0.005
0.010
0.015
0.020
0.025
0.030
ECG
EGCG
EC
C
EGC

128
Table 1. Performance characteristics of the RF-MEKC method developed.
Analyte Concentration
rangea (µg/mL)
Coefficient
of
correlationa
Limit of
quantification
(µg/mL)a
Limit of
detection
(µg/mL)a
Recovery
(%)b
Peak
symmetryc
Plates/m Migration
Timec (min)
(%CV)
Peak area
repeatabilityc
(%CV)
ECg 1.25-100 0.99994 0.1 0.05 99±2 0.99 77422 2.005
(0.008)
0.02
EGCg 1.25-100 0.99987 0.1 0.02 94±3 0.87 69698 2.269
(0.008)
0.02
EC 1.25-100 0,99983 0.1 0.03 97±2 0.75 51854 2.629
(0.011)
0.03
C 1.25-100 0.99985 0.5 0.1 100±3 0.70 32614 2.997
(0.019)
0.02
EGC 1.25-100 0.99998 0.5 0.1 101±4 0.69 43630 3.422
(0.015)
0.03
aSeven concentrations, each injected in triplicate.bAt three levels, each level in triplicate.cTen consecutive injections.

129
Table 2. Description of the methods for catechins in tea for which evaluation of performance was carried out
Method Analytes Capillary
Dimension (cm x µm)
Electrolyte Detection (nm)
Voltage (kV)
Temperature (°C)
Run time
(min) Reference
CZE EGCg, ECg, EGC EC, C, GA and Adenine 77 x 57 150mmol/L borate (pH 8,5) 210 20 20 20 Arce et al.
(1998)
MEKC EGCg, Ecg, EGC, EC, C, GCg and Caffeine 50 x 85 20mmol/L borate-phosfate 25 mmol/L SDS (pH 7,0) 200 30 21 20 Barroso et
al. (1999)
MEKC C,EC,EGC, ECg, EGCg, Tiamine and GA 58 x 50 25mmol/L phosfate (pH=7.) 100mmol/LSDS e 6% MeOH 200 14 25 13
Aucamp et al.
(2000)
MEKC GC, C, EGC, EGCg, EC, ECg, GCg, TP, TB, GA, Caffeine 40 x 50
20mmol/L phosfate, 50mmol/L tetraborate
200mmol/L SDS (pH 7.0) 200 20 29 5 Bonoli et
al. (2003)
-20 MEKC
& MEEKC
SA, p-Coumaric acid, VA, CA, GA, 3,4-Dihidroxibenzoic acid, 4-hidroxibenzoic, C,
EGC, ECg, , EC, GC, Caffeine and TP 48,5 x 50
MEKC: 2.89% SDS, 2% MeOH, e 95.5% phosfate 25mmol/L pH 2.0
MEEKC: 2.89% SDS. 1.36% heptane, 7.66%
cyclohexanol, 2% acetonitrile e 86.1% Phosfate
(25mmol/L, pH 2.0)
200
-27
35 14 Huang et al. (2005),
(2007)
MEKC (+)-C,(-)-C,(+)-EC,(-)-,Cg, (-)-EGC,(-)-EGCg, (-)-ECg, (-)-EGCg,(-)-ECg and Caffeine 64,5 x 50
200 mmol/L borate-20mmol/L phosfate (pH 6.4) 240 mmol/L and 25mmol/L 6G-β-CD
210 25 20 35
Kodama et al.
(2004)
MEEKC ECg, EGCg, EC, C, EGC, GC, Caffeine and TP 24 x 50
50mmol/L phosfate (pH 2.5) SDS (2.31% a 2.89% e n-heptane (1.36%) and
nine alcohols as co-surfactants: (1-butanol or tert-butanol or 1-pentanol or 2-pentanol or 3-pentanol or cyclopentanol or 1-
hexanol or 2-hexanol and cyclohexanol)
230 -10 40 10-18 Pomponio
et al. (2003)
CZE= Capillary zone electrophoresis; MEKC= Micellar electrokinetic chromatography; MEEKC= Microemulsion electrokinetic capillary chromatography; EGCg=
Epigallocatechin gallate; ECg= Epicatechin; EGC= Epigallocatechin; EC= Epicatechin; GCg= Gallocatechin Gallate; GC= Gallocatechin; Cg= Catecnhin gallate; C= Catechin; TB=
Teobromine; TP= Teophiline; CA= Caffeic acid; GA= Gallic acid; SA= Syringic acid; VA= Vanilic acid.

130
Table 3. Summary of the validation parameters of published CE methods for catechins in tea
CATECHIN R LOQ (mg/L)
LOD (mg/L)
Recovery (%)
Peak area % CV
Reference
EC 0.996 0.14 0.04 3.38 Arce et al. (1998) C 0.996 0.15 0.04 4.18
EGC 0.993 0.21 0.06 4.50 EGCg 0.998 0.10 0.03 3.70 ECg 0.997 0.14 0.04 4.30 EC 0.9998 3.0 3.0 Barroso et al. (1999) C 0.9999 5.0 2.41
EGC 0.9999 2.0 2.68 EGCg 0.9998 5.0 ECg 0.9997 4.0 2.95 EC 0.996 2.0 1.0 Aucamp et al. (2000) C 0.999 2.0 1.0
EGC 0.997 4.0 2.0 EGCg 0.994 11.0 6.0 ECg 0.994 10.0 3.0 EC 0.999 2.3 2.70 Bonoli et al. (2003) C 0.992 1.2 2.38
EGC 0.999 1.7 2.06 EGCg 0.999 1.8 1.47 ECg 0.999 2.3 2.77 EC 1.0000 0.064 2.19 Huang et al. (2007) C 0.9836 0.069 0.80
EGC 0.9981 0.294 0.88 EGCg 0.9944 0.031 2.77 ECg 0.9905 0.013 3.73 EC 0.9995 0.14 Huang et al. (2005) C 0.9991 0.45
EGC 0.9995 0.15 EGCg 0.9996 0.13 ECg 0.9998 0.10 EC 0.9994 0.46 Huang et al. (2005) C 0.9990 1.13
EGC 0.9993 0.40 EGCg 0.9996 0.62 ECg 0.9995 0.35
(+)-EC 0.5 93.5 1.0 Kodama et al. (2004) (-)-EC 0.5 99.2 1.1 (-)-C 0.2 98.4 1.5 (+)-C 0.2 100.5 1.6
(-)-EGC 0.5 98.2 1.8 (-)-EGCg 0.5 99.8 6.9 (-)-ECC 0.2 99.7 6.0
EC 0.9999 3.80 1.27 Pomponio et al. (2003) C 0.9999 0.90 0.30
EGC 0.9999 1.50 0.48 EGCg 0.9998 18.18 6.07 ECg 0.9999 2.64 0.88
EGCg= Epigallocatechin gallate; ECg= Epicatechin; EGC= Epigallocatechin; EC= Epicatechin; C= Catechin.

131
Table 4. Catechin contents of six Brazilian green tea samples.
Catechin concentration (µg/ml) Sample*
code
Sample
characteristics ECg EGCg EC C EGC
GT1 Lemon flavoured,
Leaves and buds
12.3
(0.2)
84.5
(6.5)
12.9
(0.2)
4.5
(0.1)
74.6
(3.4)
GT2** Leaves and buds 29.6
(1.0)
80.4
(8.9)
7.8
(0.1)
8.2
(0.1)
39.4
(2.5)
GT3 Leaves 13.3
(0.7)
96.7
(5.1)
14.5
(0.2)
4.0
(0.1)
78.9
(4.6)
GT4 Apple flavoured
Leaves and buds
9.6
(0.2)
112.4
(7.2)
9.8
(0.1)
5.4
(0.1)
68.9
(5.6)
GT5 Leaves and buds 13.4
(0.3)
70.4
(3.4)
13.9
(0.2)
6.8
(0.1)
72.4
(3.9)
GT6 Leaves and buds,
minimum 3 years old.
5.6
(0.1)
23.4
(1.1)
4.6
(0.1)
3.2
(0.1)
18.4
(1.4)
ECg= Epicatechin; EGCg= Epigallocatechin gallate; EC= Epicatechin; C= Catechin EGC= Epigallocatechin;*Two lots of each sample were analyzed;** Imported material from Germany, packed in Brazil; GT=Green tea.

132
4. Conclusions
A RF-MEKC method, which utilizes 0.2% TEA, 50 mmol/L SDS and w/v 0.8% β-
CD sulfated salt (pH=2.9) adjusted with phosphoric acid, was developed and evaluated.
With direct injection of green tea infusions, the analysis time was less than 4 min and
excellent selectivity and resolution were obtained. Applied to green tea samples, the
method provides fast quantitative routine analyses of catechins of green tea.
References
Arce, L., Rios, A., & Valcarel, M. (1998). Determination of anti-carcinogenic polyphenols
present in green tea using capillary electrophoresis coupled to a flow injection system.
Journal of Chromatography A, 827, 113-120.
Arts, I. C. W., Van de Putte, B., & Hollman, P. C. H. (2000). Catechin contents of foods
commonly consumed in the Netherlands. 2. Tea, wine, fruit juices, and chocolate milk.
Journal of Agriculture and Food Chemistry, 48, 1752-1757.
Aucamp, J. P., Hara, Y., & Apostolides, Z. (2000). Simultaneous analysis of tea catechins,
caffeine, gallic acid, theanine and ascorbic acid by micellar electrokinetic capillary
chromatography. Journal of Chromatography A, 876, 235-242.
Barroso, M. B., & van de Werken, G. (1999). Determination of green and black tea
composition by capillary electrophoresis. Journal of High Resolution Chromatography,
22, 225-230.
Béliveau, R., Gingras, D. (2004). Green tea: Prevention and treatment of cancer by
nutraceuticals. The Lancet, 364, 1021-1022.

133
Bonoli, M., Pelillo, M., Toschi, T. G., & Lercker, G. (2003). Analysis of green tea
catechins: Comparative study between HPLC and HPCE. Food Chemistry, 81, 631-638.
Bronner, W. E., & Beecher, G. R. (1998). Method for determining the content of catechins
in tea infusions by high-performance liquid chromatography. Journal of
Chromatography A, 805, 137-142.
Dalluge, J. J., Nelson, B. C., Thomas, J. B., & Sander L. C. (1998). Selection of column
and gradient elution system for the separation of catechins in green tea using high-
performance liquid chromatography. Journal of Chromatography A, 793, 265-274.
Eeckhaut, A. V., & Michotte, Y. (2006). Chiral separations by capillary electrophoresis:
Recent developments and applications. Electrophoresis, 27, 2880-2895.
Horie, H., Mukai, T., & Kohata, K. (1997). Simultaneous determination of qualitatively
important components in green tea infusions using capillary electrophoresis. Journal of
Chromatography A, 758, 332-335.
Horie, H., & Kohata, K. (1998). Application of capillary electrophoresis to tea quality
estimation. Journal of Chromatography A, 802, 219-223.
Huang. H.-Y., Lien, W.-C., Chiu, C.-W. (2005). Comparison of microemulsion
electrokinetic chromatography and micellar electrokinetic chromatography methods for
the analysis of phenolic compounds. Journal of Separation Science, 28, 973-981.
Huang, H.-Y., Yun, H., Hsin-Hui, L., Szetsen, L. (2007). Sample stacking for the analysis
of catechins by microemulsion EKC. Electrophoresis, 28, 1735-1743.
Janini, G. M., Issaq, H. J., &. Muschik G. M. (1997). Electrokinetic chromatography
without electroosmotic flow. Journal of Chromatography A, 792 125-141.
Jankun, J., Selman, S. H., Swiercz, R., & Skrzypczak-Jankun, E. (1997). Why drinking
green tea could prevent cancer. Nature, 387, 561.

134
Katiyar, S. K., & Mukhtar, H. (1997). Tea antioxidants in cancer chemoprevention. Journal
of Cellular Biochemistry, 27, 59-67.
Kodama, S., Yamamoto, A., Matsunaga, A., & Yanai, H. (2004). Direct enantioseparation
of catechin and epicatechin in tea drinks by 6-O-α-D-glucosyl-β-cyclodextrin-modified
micellar electrokinetic chromatography. Electrophoresis, 25, 2892-2898.
Lin, Y.-S., Tsai, Y.-J., Tsay, J.-S., & Lin, J.-K. (2003). Factors affecting the levels of tea
polyphenols and caffeine in tea leaves. Journal of Agricultural and Food Chemistry,
51, 1864 -1873.
Matsubara, S., & Rodriguez-Amaya, D. B. (2006). Teores de catequinas e teaflavinas em
chás comercializados no Brasil. Ciência e Tecnologia de Alimentos, 26, 401-407.
Nelson, B. C., Thomas, J. B., Wise, S. A. & Dalluge, J. J. (1998). The separation of green
tea catechins by micellar electrokinetic chromatography. Journal of Microcolumn
Separations, 10, 671-679.
Pelillo, M., Bonoli, M., Biguzzi, B., Bendini, A., Toschi, T. G., & Lercker, G. (2004). An
investigation in the use of HPLC with UV and MS-electrospray detection for the
quantification of tea catechins. Food Chemistry, 87, 465-470.
Pomponio, R., Gotti, R., Luppi, B. & Cavarini, V. (2003). Microemulsion electrokinetic
chromatography for the analysis of green tea catechins: Effect of the co-surfactant on
the separation selectivity. Electrophoresis, 24, 1658-1667.
Risso, E. M., Peres, R. G., & Amaya-Farfan, J. (2007). Determination of phenolic acids in
coffee by micellar electrokinetic chromatography. Food Chemistry, 105, 1578-1582.

135
Tonin, F. G.,. Jager, A. V.,. Micke G. A., Farah, J. P. S.& Tavares M. F. M. (2005)
Optimization of the separation of flavonoids using solvent-modified micellar
electrokinetic chromatography. Electrophoresis, 26, 3387-3396.
Yang, C. S. (1997). Inhibition of carcinogenesis by tea. Nature, 389, 134-135.
Yang, C. S., Lambert, J. D., Ju, J., Lu, G., & Sang, S. (2006) Tea and cancer prevention:
Molecular mechanisms and human relevance. Toxicology and Applied Pharmacology.
Article in press.
Takeo, T. (1992). Green tea and semi-fermented teas. In K. C. Willson, & M. N. Clifford,
Tea: Cultivation to Consumption, (pp. 413-454). London: Chapman & Hall.
Toschi, T. G., Bordoni, A., Hrelia, S., Bendini, A., Lercker, G., & Biagi, P. L. (2000). The
protective role of different green tea extracts after oxidative damage is related to their
catechin composition. Journal of Agricultural and Food Chemistry, 48, 3973-3978.
Vigh, G., & Sokolowski, A. D. (1997). Capillary electrophoretic separations of enantiomers
using cyclodextrin-containing background electrolytes. Electrophoresis, 18, 2305-2310.
Zaveri, N. T. (2006). Green Tea and its polyphenolic catechins: Medicinal uses in cancer
and noncancer applications. Life Sciences, 78, 2073-2080.

136
CAPÍTULO 6
Determination of polyphenols and phenolic acids in Brazilian wine by
capillary electrophoresis
RENATO GARCIA PERES
GUSTAVO AMADEU MICKE
MARINA FRANCO MAGGI TAVARES
DELIA B. RODRIGUEZ-AMAYA
Artigo a ser submetido à revista
Journal of Food Composition and Analysis

137
Determination of polyphenols and phenolic acids in Brazilian
wine by capillary electrophoresis
Renato G. Peresa, Gustavo A. Mickeb,
Marina F. M. Tavaresb and Delia B. Rodriguez-Amayaa*
aDepartament of Food Science, Faculty of Food Engineering,
State University of Campinas, C.P. 6121, 13083-862 Campinas, SP, Brazil
bInstitute of Chemistry, University of São Paulo, C.P. 26077, 05599-970,
São Paulo, SP, Brazil
Keywords: Polyphenols; Resveratrol; Wine; Capillary electrophoresis; Phenolic acids;
Factorial design
*Correponding author: Tel: +55-19-35214013; Fax: +55-19-35212153
E-mail address: [email protected] (D.B. Rodriguez-Amaya)

138
Abstract
In this work, a method for simultaneously determining the stilbene resveratrol, four
phenolic acids and five flavonoids in wine by capillary electrophoresis (CE) was developed
and evaluated. The CE electrolyte composition and instrumental conditions were optimized
using 27-3 factorial design and response surface analysis, showing TBS (tetraborate)/MeOH
as the most influential variables. The optimal electrophoretic conditions, minimizing the
chromatographic resolution statistic (CRS) values, consisted of 17 mmol/L TBS with 20%
methanol as electrolyte, constant voltage of 25 kV, hydrodynamic injection at 50 mbar for
3s and temperature of 25oC. The R2 values for linearity were equal to or higher than 0.99;
limits of detection and quantification were 0.01 to 0.03 and 0.04 to 0.08, respectively.
Coefficients of variation for migration time and peak area obtained from ten consecutive
injections were less than 2% and recoveries varied from 97 to 102%. The method was
applied to 23 different samples of Brazilian wines.

139
1. Introduction
Moderate and regular consumption of wine may have some health benefits (Renaud
and De Lorgeril, 1992; de Lorgeril and Salen, 1999). Lower incidence of coronary heart
disease (CHD) (Frankel et al.,1995; Orralo at al., 2002), through an increase of the blood
antioxidant capacity and reduction of the level of oxidized LDL-cholesterol, have been
attributed to the phenolic compounds of wine (Shahidi and Janita, 1992; Jovanovic et al.,
1994; Kanner et a., 1994; Nigidikar et al., 1998; Tadesco, et al., 2000). Phenolic
compounds, such as phenolic acids, catechins and other flavonoids, also have an important
role in wine quality, contributing to flavor and color. (Lea et al, 1979).
High performance liquid chromatography (HPLC) has been the method of choice
for the analysis of phenolic compounds in wine (Revilla, et al., 2000; Lopez et. al., 2001;
Rodriguez-Delgado et al., 2001; Fang et al, 2007), but capillary electrophoresis (CE)
(Garcia-Vigueira and Bridle, 1995; Kulomaa, et. al, 1997; Pazourek et al., 2000; Minussi et
al., 2003; Saenz-Lopez et al, 2004), micellar electrokinetic chromatography (MEKC)
(Watanabe, et al., 1998) and nonaqueous capillary electrophoresis (NACE) (Demianová et
al. 2003) have been increasingly used for this purpose. A diode array detector (DAD) has
been generally used, but electrochemical (Gao et al., 2002; Peng et al., 2004) and
fluorimetric detection (Rodriguez-Delgado et al., 2001) have also been employed.
Comparison between HPLC and CE methods has been carried out, showing agreement of
the results (Garcia-Vigueira and Bridle, 1995; Andrade et al., 2001; Wang and Huang,
2004). CE has the advantages of high speed, high resolution, low operational cost, low
consumption of chemicals and convenience. Some CE studies in wine have focused solely

140
on the determination of phytoalexin resveratrol (Prasongsidh and Skurray, 1998; Lima et
al., 1999; Dobiá ová et al., 2002; Spanilá et al., 2005).
In Brazil the production of wine is concentrated in the southern region (state of Rio
Grande do Sul). A couple of articles has been published on the phenolic compounds of
Brazilian wines (Souto et al., 2001; Minussi et al., 2003), but the data available is still very
limited.
The objective of this study was to develop and evaluate a CE method for the
simultaneous determination of the most important phenolic compounds in wine and apply it
to a variety of Brazilian wines.
2. Materials and methods
2.1. Instrumentation
Method development and evaluation, as well as sample analyses, were conducted in
a capillary electrophoresis system model HP3DCE (Agilent Technologies, Palo Alto, CA,
USA), equipped with a photodiode array detector (DAD) set at 280 nm for quantification.
The temperature was controlled and stabilized at 25 °C. For data acquisition, a
Chemstation Software (Rev A.06.01) (Agilent Technologies, Palo Alto, CA, USA) installed
in a personal computer supplied by the manufacturer, was used. Samples and standard
solutions were injected hydrodynamically (50 mbar for 3 sec) and constant voltage of 25
kV was employed. The column was a fused-silica capillary (Polymicro Technologies,

141
Phoenix, AZ, U.S.A.) with dimensions of 48.5 cm total length, 40.0 cm effective length, 75
μm i.d. and 375 μm o.d.
2.2. Reagents and solvents
All reagents were of analytical grade and solvents of chromatographic grade, used
without previous purification. Methanol was purchased from Tedia Company (Fairfield,
OH, USA), hydrochloric acid from Merck KGaA (Darmstad, Germany), sodium tetraborate
(TBS) and sodium dodecyl sulfate (SDS) from Riedel-de Haen (Sweelze, Germany) and
Brij35 from Aldrich Chemical Company, Inc. (Milwaukee, WI, USA). Water was purified
by deionization (18mΩ) (Milli-Q system, Millipore, Bedford, MA, USA). The standards
resveratrol (R5010), gallic acid (G7384), p-coumaric acid (C9008), quercetin (Q0125),
rutin (R2303), myricetin (M6760), caffeic acid (C0625) and catechin (C0567) were
purchased from Aldrich (St. Louis, MO, USA); syringic acid (86230) and kaempferol
(60010) were from Fluka (St. Louis, MO, USA). Stock standard solutions of each of the 10
phenolic compounds were prepared at 1000 mg/L in 60:40 v/v water/ethanol. Working
solutions were prepared by mixing appropriate volumes of the stock solutions with 60:40
v/v water/ethanol.
2.3. Sample preparation
Twenty-three samples of different types (red, white and blended) and brands of
wine were purchased from a supermarket in São Paulo, Brazil. Year of production and

142
types of wine are listed in Table 5. These wines were chosen to get a good representation
of wines produced in the region of Serra Gaucha, which are sold at reasonable prices, thus
reaching a greater part of the population.
All wines were stored in the dark at 4oC until analysis. The contents of two freshly
opened bottles were mixed and 1 mL was extracted with ethyl ether at a solvent/wine
proportion of 8:5 mL, followed by hydrolysis with 100μL of hydrochloric acid for 15 min
with magnetic stirring. The organic phase was separated from the aqueous phase, dried
under nitrogen and dissolved with 2.5 mL of ethanol:water 60:40 v/v. The samples were
filtered through a 0.45 µm membrane (Millex LCR PTFE ) (Millipore, Sao Paulo, Brazil).
The analytes were identified by comparison of the migration times with those of
standards and with wine spiked with standards under identical conditions, along with the
spectra of the migrated solutes obtained with the PDA detector.
2.4. Capillary electrophoresis procedure
On each day of analysis, the capillary was conditioned by flushing with 1 mol/L
NaOH for 5 min, followed by purified water (MilliQ System, Millipore, Bedford, MA,
USA) for 5 min and the electrolyte solution for 30 min. In between runs, the capillary was
flushed with the electrolyte solution (1 min). The electrolyte solution was prepared daily
and filtered through a 0.45 µm membrane. All standards and samples were injected in
triplicate.

143
2.5. Method development and evaluation of performance
During method development and optimization in the present study, the
chromatographic resolution statistic equation (CRS) was used. This is a mathematical
function developed originally for chromatographic separations (Schlabach and Excoffier,
1988); the CRS tends to a minimum value for chromatograms having well resolved and
uniformly spaced peaks. It has been used in the CE area for optimizing fatty acids (Oliveira
et al. 2001) and food dyes (Jager et al. 2005) separations.
TBS based buffers, MeOH as organic modifier, SDS or Brij35 as surfactants,
time/pressure of injection, voltage and temperature were tested. Since it was not possible to
select adequate electrolyte components by studying their effects by one-at-a-time approach,
a factorial design was employed .
TBS as the electrolyte was assessed from 10 to 30 mmol/L. The lower level was
established considering the need to maintain the pH in all of the analyses. Very low levels
of TBS do not provide good buffering capacity. The upper level was limited by the
electrical current. High amounts of TBS combined with high levels of SDS may result in a
high current, and temperature gradients can occur in the capillary due to the Joule heating.
MeOH as organic modifier was evaluated from 0 to 10%. One of the first effects is a
decrease in the electrical current, reducing the Joule heating and peak band broadening. The
second effect is increasing the migration time and the resolution of the peaks. Modification
of the pKa of the analytes can occur with MeOH, thereby increasing solubilization.
The third variable was SDS, evaluated from 0 to 10 mmol/L. The absence and
presence of micelles was the main objective in selecting this variable. The presence of
micelles can increase the selectivity because each compound can partition to the micelle

144
core. Brij35 from 0 to 5 mmol/L was also included because the presence of both SDS and
Brij in the electrolyte results in a mixed micelle system constituted by anionic monomers
(SDS) and neutral monomers (Brij35).
Time of injection from 1 to 3s at 10 mbar, operation voltage from 10 to 25 V and
temperature from 25 oC to 35oC were also evaluated.
Optimization of the CE method was initially carried out, using a factorial design, for
the selection of the factors with direct influence on the separation. After selection of these
factors, they were optimized by a response surface methodology.
Table1 shows the studied variables for the factorial design as well as the low (-1)
and high (+1) levels.
Table 1. 27-3 Factorial design variable levels
Coded
Levels
TBS
mmol/L
MeOH
% v/v
SDS
mmol/L
[Brij 35]
mmol/L
Injection time
s/mbar
Voltage
kV
Temp
oC
-1 10 0 0 0 1 / 10 15 25
+1 30 10 10 5 3 / 10 25 35
TBS, sodium tetraborate; SDS, sodium dodecylsulfate.
Linearity was evaluated by the injection of five standard solutions of each
compound at concentrations varying from 2.5 to 220 mg/L. Limits of detection (LOD) and
quantification (LOQ) were calculated as the solution concentrations that gave signal-to-
noise ratios of 3 and 10, respectively. Peak and migration time precision was evaluated by

145
10 consecutive injections of the standard solutions. Recovery was studied at three levels,
each level injected in triplicate.
3. Results and discussion
3.1. Optimum electrolyte composition and CE conditions
The effects of the 27-3 fractionary factorial design are shown in Table 2. A close look
at the results values reveals that the effects of the Brij35 and SDS levels were not
significant, thus the lower levels for both were adopted. The time of injection did not also
have any significant effect during the studied interval and the high level was chosen in
order to obtain better sensitivity. The temperature was kept at a low level to avoid bubbles
that could be formed by the evaporation of the organic solvent. The most significant effects
came from the variables TBS, MeOH and their interaction. These variables were therefore
studied further through the response surface methodology.
According to Table 3, the best condition (lowest CRS value) was achieved with
20% MeOH and 10 mmol/L. However, these conditions did not give good separation of the
phenolic compounds of wine. Thus, response surface analysis, using the reciprocal of the
CRS value, was used to obtain the optimum separation condition: 20% MeOH, 17 mM
TBS, 25 kV, 3 s inj. 10 mBar at 25oC (Figure 1).

146
Table 2. Principal effects obtained from the factorial design 27-3
Variable % Contribution
Sodium tetraborate 26.1
MeOH 12.9
Sodium dodecylsulfate 3.5
Brij35 1.6
Injection time 8.3
Voltage 0.9
Temperature 3.8
Sodium tetraborate:MeOH 18.1
Sodium tetraborate: Sodium dodecylsulfate 4.4
Sodium tetraborate:Brij 1.1
Sodium tetraborate:injection time 9.6
Sodium tetraborate:voltage 2.6
Sodium tetraborate:temperatue 6.9

147
Table 3. Response function results of the response surface analysis
Experiment % MeOH
v/v
TBS
mmol/L
CRS
1 0 20 9.6
2 0 10 43.8
3 20 20 3.9
4 10 10 6.3
5 0 30 135.5
6 20 10 2.6
7 20 10 2.8
8 20 30 1000
9 10 20 4
10 10 30 5.1
11 20 13 3.5
12 30 10 3.8
13 30 5 7.9
14 40 3 1000
15 20 5 8.2
16 10 2 1000
17 40 25 1000
TBS, sodium tetraborate; CRS, chromatographic resolution statistic.

148
Figure 1. Response surface for electrolyte composition and CE conditions. Optimum
conditions: 20% MeOH, 17mM tetraborate, 25 kV, 3 s injection 10 mBar, 25oC. TBS,
sodium tetraborate; CRS, chromatographic resolution statistic
3.2. Method performance
Table 4 shows the performance characteristics of the proposed method. At the
concentration range tested (2.5 to 220 mg/L), the method presented good R2 values (from
0.9997 to 0.9936). The limit of quantification varied from 0.04 to 0.08 mg/L and the limit
of detection from 0.01 to 0.03 mg/L. The coefficients of variation (CV) of ten consecutive
injections of standard solutions were lower than 2% for both peak area and

149
Table 4. Performance characteristics of the CE method developed
Repeatability (%CV)c Compound Concentration
range (mg/L)a
Coefficient of
correlationa
Limit of
quantificationa
(mg/L)
Limit of
detectiona
(mg/L)
Recovery
(%)b Peak area Migration time
(min)
Resveratrol 2.5-80 0.9975 0.08 0.03 98±1 1.2 1.1
Catechin 2.5-80 0.9985 0.04 0.01 101±1 1.6 1.1
Rutin 2.5-80 0.9963 0.05 0.02 102±1 1.2 1.0
Syringic acid 5.0-60 0.9985 0.07 0.03 99±1 1.7 1.3
Kaempferol 5.5-60 0.9989 0.05 0.02 101±1 2.0 1.4
Coumaric acid 18-220 0.9963 0.05 0.02 98±1 0.9 1.5
Myricetin 5.0-90 0.9974 0.08 0.02 97±1 1.3 1.4
Quercetin 4.0-60 0.9976 0.05 0.01 97±1 1.4 1.4
Caffeic acid 4.0-60 0.9936 0.07 0.02 101±1 1.3 1.6
Gallic Acid 4.0-60 0.9944 0.05 0.01 99±1 1.7 1.7
aSeven concentrations, each injected in triplicate. bAt three levels, each level in triplicate. cTen consecutive injections.

150
migration time. Recoveries varied from 97% (myricetin and quercetin) to 102% (rutin). The
method is considered therefore suitable for the analysis of phenolic compounds in wine.
3.3. Polyphenols of Brazilian wines
Figure 2 presents typical electropherograms of white and red wines and Table 5 the
concentrations of the 10 phenolic compounds determined in 23 Brazilian wines.
Gallic (15.0-69.9 mg/L for red wine; 1.6-2.9 mg/L for white wine) and caffeic
(11.7-17.9 mg/mL for red wine; 1.8-4.4 mg/L for white wine) acids were the only phenolic
compounds found in all the wines. German and Walzem (2000) put together published data
on phenolic compounds and the ranges were 26-320 mg/L gallic acid and 3-18 mg/L caffeic
acid for red wines. The Brazilian wines, therefore, are in the lower end and caffeic in the
upper end of these ranges.
Myricetin was found in all red wines (11.1-12.8 mg/L) and one white wine (1.6
mg/L). Quercetin was also encountered in all red wines (1.0-15.9 mg/L) and in one white
wine (1.7mg/L). According to German and Walzem, myricetin (2-45 mg/L) and quercetin
(5-53) were found only in red wines, the Brazilian values falling within these ranges.
Syringic acid was detected in seven (4.4-4.9 mg/L) out of 11 red wines and in one
white wine. The range reported by German and Walzen (2000) was 4.2-5.9mg/L, in
agreement with the data of the present work.
Coumaric acid was greater in blended wines (14.4-19.9), the range in red wine
being 10.0-13.6 mg/L. These ranges agree with that of German and Walzen (7.5-22mg/L).

151
Table 5. Phenolic compound concentrations (mg/L)a in Brazilian wines obtained by the CE method developed.
Sample resveratrol syringic acid coumaric acid myricetin quercetin caffeic acid gallic acid Cabernet Sauvignon red 2000 3.1 ± 0.1 4.9 ± 0.1 nd 12.3 ± 0.1 11.7 ± 0.1 11.7 ± 0.1 29.1 ± 0.1 Cabernet Sauvignon red 2001 3.5 ± 0.3 4.4 ± 0.1 nd 12.8 ± 0.1 1.0b 17.1 ± 2.0 31 ± 3 Cabernet Sauvignon red 1.4 ± 0.2 4.5 ± 0.3 12.7 ± 0.1 12.3 ± 0.1 14.2 ± 0.1 15.9 ± 0.3 15 ± 1 Cabernet Sauvignon red 3.1 ± 0.1 4.9 ± 0.1 nd 12.3 ± 0.1 11.7 ± 0.1 11.7 ± 0.1 29.1 ± 0.1 Cabernet Franc red 2000 2.3 ± 0.1 4.5 ± 0.1 13.6 ± 0.1 12.1 ± 0.2 15.6 ± 0.4 17.9 ± 0.3 30,8 ± 1 Cabernet Franc red 2001 3.4 ± 0.1 4.4 ± 0.1 12.9 ±0 .1 11.9 ± 0.1 14.8 ± 0.3 16.4 ± 0.7 37.6 ± 0.1 Gammay red 2002 3.7 ± 0.1 nd nd 11.1 ± 0.2 10.6 ± 0.3b 14.0 ± 0.4 45 ± 0.4 Gammay red 2003 1.0 ± 0.1b 4.5 ± 0.3 12.5 ± 0.2 11.7 ± 0.3 15.1 ± 0.5 15.2 ± 1.6 56.4 ± 2.1 Merlot red 2001 2.0 ± 0.1 nd nd 11.2 ± 0.3 11.5 ± 0.2 17.7 ± 0.1 68.7 ± 0.2 Merlot red 1.5 ± 0.2 nd nd 11.7 ± 0.2 13.5 ± 0.1 17.7 ± 0.1 69.9 ± 0.1 Shiraz red 2002 1.4 ± 0.2 nd 10 ± 1 12.0 ± 0.1 15.9 ± 0.2 17 ± 0.1 57.7 ± 0.1 Blended red 0.01b nd nd 14.6 ± 0.1 nd 14.8 ± 0.2 53.1±0.1 Blended 1.4 ± 0.1 4.1 ± 0.1 19.9 ± 0.3 12.7 ± 0.1 12.9 ± 0.3 14.7 ± 0.3 36.3 ± 0.2 Blended 0.4 ± 0.1 b nd 14.6 ± 0.3 11.9 ± 0.1 12.1 ± 0.2 13.0 ± 0.2 35.3 ± 0,4 Blended 1.2 ± 0.2b 4.9 ± 0.1 16.5 ± 0.5 12.0 ± 0.3 14.6 ± 0.1 19.2 ± 0.6 28,5 ± 1 Chardonnay White 2002 nd nd nd 1.6 ± 0.1 1.7 ± 0.4b 1.8 ± 0.3 1.6 ± 0.4 Riesling white 2000 nd nd nd nd nd 2.2 ± 0.1 2.2 ± 0.2 Riesling white 2001 0.9 ± 0.2b 1.3 ± 0.1 2.1 ± 0.3 nd nd 4.4 ± 1.5 2.5 ± 1.2 Riesling white 2002 nd nd nd nd nd 3.4 ± 0.3 2.5± 0.5 Riesling white nd nd nd nd nd 3.3 ± 0.3 2.4 ± 0.2 Sauvignon Blanc white 2002 nd nd nd nd nd 2.9 ± 0.2 2.9 ± 0.2 Ugni Blanc white 2002 nd nd nd nd nd 2.2 ± 0.4 2.8 ± 0.2
aMeans and standard deviations of triplicate analyses. bEstimated by extrapolation of the calibration curve. nd. not detected (<LOD).

152
Figure 2. Electropherograms of the phenolic compounds in (a) mixture of standards, (b)
red wine and (c) white wine. Peak identification: 1. resveratrol, 2. catechin, 3.rutin,
4.syringic acid, 5.kaempferol, 6.p-coumaric acid, 7.myricetin, 8.quercetin, 9.caffeic acid,
10. gallic acid. CE conditions are described in the text.

153
The concentration of the one of the most important phenolic compounds in wine,
resveratrol, ranged from 1.0 to 3.7 mg/L in red wine. The range in blended wine was 0.01-
1.4 mg/L; in white wine, only one had resveratrol at a low concentration (0.9 mg/L). Souto
et al. (2001) found 0.82 to 5.75 mg/L in 8 types of Brazilian red wines, in agreement with
the values obtained in the present work, slightly higher than the range of German and
Walzen (0.1-2.3 mg/L).
The wide variation in the phenolic concentrations obtained in this and other work
has two important practical implications. First, the inconsistencies in the findings of
epidemiological studies, leading authors to contend that the scientific evidence is
questionable or not conclusive for the beneficial effects of resveratrol and other
polyphenols in wine, can be due, at least in part, to analytical and natural variability of the
data on the levels of these compounds. In studies correlating these bioactive compounds
with the incidence of diseases, the intake is obtained from the estimated consumption of
wine, from which the amount of the bioactive substance is approximated. Second, there is
now wide recognition that the levels of bioactive compounds in the diet can be maximized
through agriculture, food technology and nutrition. For such a strategy, the compositional
variation in the food chain has to be known. Thus, the determination of composition and
investigation of the factors affecting composition of bioactive substances, using reliable
methods, should remain a priority.

154
4. Conclusion
A simple, versatile and low-cost CE method, which utilizes methanol, sodium
tetraborate and silica capillaries, was optimized by factorial design and response surface
methodologies. Optimization of the electrolyte composition and CE conditions resulted in
excellent selectivity. The method provided good limits of detection and quantification, as
well as linearity, peak area and migration time repeatability and good recovery in the
concentration levels studied. Applied to the Brazilian wines, good precision was confirmed.
References
Andrade, P.B., Oliveira, B.M., Seabra, R.M., Ferreira, M.A., Ferreres, F., García-Viguera,
C., (2001). Analysis of phenolic compounds in Spanish Albrariño and Portuguese
Alvarinho and Loureiro wines by capillary zone electrophoresis and high-performance
liquid chromatography. Electrophoresis 22, 1568-1572.
De Lorgeril, M., Salen, P., 1999. Wine ethanol, platelets, and Mediterranean diet. Lancet
353, 1067.
Demianová, Z., Sirén, H., Kuldvee, R., Riekkola, M., 2003. Nonaqueous capillary
electrophoretic separation of polyphenolic compounds in wine using coated capillaries at
high pH in methanol. Electrophoresis 24, 4264-4271.
Dobiášová, Z., Pazourek, J., Havel, J., 2002. Simultaneous determination of trans-
resveratrol and sorbic acid in wine by capillary zone electrophoresis. Electrophoresis 23,
263-267.

155
Fang, F., Li, J.M., Pan, Q.H., Huang, W.D., 2007. Determination of red wine flavonoids by
HPLC and effect of aging. Food Chemistry 101, 428-433.
Frankel, E.N., Waterhouse, A.L.,and Teissedre, P.L., 1995. Principal phenolic
phytochemicals in selected California wines and their antioxidant activity in inhibiting
oxidation of human low-density kipopreteins. Journal of Agricultural and Food
Chemistry, 43(4), 890-894.
Gao, L., Chu, Q., Ye, J., 2002. Determination of trans-resveratrol in wines, herbs and health
food by capillary electrophoresis with electrochemical detection. Food Chemistry 78,
255-260.
Garcia-Viguera, C., Bridle, P., 1995. Analysis of non-coloured phenolic compounds in red
wines. A comparison of high-performance liquid chromatography and capillary zone
electrophoresis. Food Chemistry 54, 349-352.
German, J. B., Walzem, R. L., 2000. The health benefits of wine. Annual Review of
Nutrition 20, 561-593.
Jager A.V., Tonin F., G.,, Tavares M.F.M., 2005. Optimizing the separation of food dyes
by capillary electrophoresis. Journal of Separation Science 28,(9-10),957-965.
Jovanovic, S.V., Steeden, S., Tosic, M., Marjanovic, B.T., Simicg, M. G., 1994. Flavonoids
as antioxidants. Journal of the American Chemical Society 116, 4846-4851.
Kulomaa, A., Sirén, H., Riekkola, M.L., 1997. Identification of antioxidative compounds in
plant beverages by capillary electrophoresis with the marker index technique. Journal of
Chromatography A 781, 523-532.
Kanner, J., Frankel, E., Granit, R., German, B., Kinsella, J.E. 1994. Natural antioxidants in
grapes and wines. Journal of Agricultre and Food Chemistry, 42(1), 64-69.

156
Lima, M.T., Waffo-Téguo, P., Teissedre, P.L., Pujolas, A., Vercauteren, J., Cabanis J.C.,
and Mérillon, J.M. (1999). Determination of stilbenes (trans-astringinm cis- and trans-
piceid, and trans-resveratrol) in Portuguese wines. Journal of Agricultre and Food
Chemistry, 47, 2666-2670.
Lea, A. G. H., Bridle, P., Timberlake, C. F., Singleton, V. L., 1979. The procyanidins of
white grapes and wines. American Journal of Enology and Viticulture 30, 289-300.
López, M., Martínez, F., Del Valle, C., Orte, C., Miro, M., 2001. Analysis of phenolic
constituents of biological interest in red wines by high-performance liquid
chomatography. Journal of Chomatography A 922, 359-363.
Minussi, R. C., Rossi, M., Bologna, L., Cordi, L., Rotilio, D., Pastore, G.M., Durán, N.,
2003. Phenolic compounds and total antioxidant potential of commercial wines. Food
Chemistry 82, 409-416.
Nigidikar, S.V., Williams, N.R., Griffin, B.A., Howard, A.N., 1998. Consumption of red
wine polyphenols reduces the susceptibility of low-density lipoproteins to oxidation in
vivo. American Journal of Clinical Nutrition 68, 258-265.
Oliveira, M. A. L., Micke, G. A., Bruns, R. E., Tavares, M. F. M. Factorial design of
electrolyte systems for the separation of fatty acids by capillary electrophoresis
Journal of chromatography A 924, 533-539.
Orralo, F., Alvarez, E., Camina, M., Leiro, J.M., Gomez, E., Fernandez, P., 2002. The
possible implication of trans-resveratrol in the cardioprotective effects of long-term
moderate wine consumptiom. Molecular Pharmacology 61, 294-302.
Pazourek, J., González, G., Revilla, A. L., Havel, J., 2000. Separation of polyphenols in
Canary Islands wine by capillary zone electrophoresis without preconcentration. Journal
of Chromatography. A 874, 111-119.

157
Peng, Y., Chu, Q., Liu, F., Ye, J., 2004. Determination of phenolic constituents of
biological interest in red wine by capillary electrophoresis with electrochemical
detection. Journal of Agricultural and Food Chemistry 52, 153-156.
Prasongsidh, B.C., Skurray, G.R., 1998. Capillary electrophoresis analysis of trans- and
cis-resveratrol, quercetin, catechin and gallic acid in wine. Food Chemistry 62, 355-358.
Renaud, S., de Lorgeril, M., 1992. Wine, alcohol, platelets, and the French paradox for
coronary heart disease. Lancet 339, 1523-1526.
Revilla, E., Ryan, J., 2000. Analysis of several phenolic compounds with potential
antioxidant propreties in grape extracts and wines by high-performance liquid
chromatography-protodiode array detection without sample preparation. Journal of .
Chromatography A 881, 461-469.
Rodriguez-Delgado, M.A., Malovaná, S., Pérez, J.P., Borges, T.,Garcia Montelongo, F.J.,
2001. Separation of phenolic compounds by high-performance liquid chromatography
with absorbance and fluorimetric detection. Journal of Chromatography A 912, 249-257.
Sáenz-López, R., Fernández-Zurbano, P., Tena, M.T., 2004. Analysis of aged red wine
pigments by capillary zone electrophoresis. Journal of Chromatography A 1052, 191-
197.
Schlabach, T.D., Excoffier J.L., 1988. Multi-variate ranking function for optimizing
separations. Journal of Chromatography A 439, 173-184.
Shahid, F., Janita, P.K., Wanasundara, P.D., 1992. Phenolic antioxidants. Critical Review
of Food Science and Nutrition 130, 2073S-2085S.
Spanilá, M., Pazourek, J., Farková, M., Havel, J., 2005. Optimization of solid-phase
extraction using artificial neural networks in combination with experimental design for

158
determination of resveratrol by capillary zone electrophoresis in wines. Journal of
Chromatography A 1084, 180-185.
Souto, A.A., Carneiro, M.C., Seferin, M., Senna, M.J.H., Conz, A., Gobbi, K., 2001.
Determination of trans-resveratrol concentrations in Brazilian red wines by HPLC.
Journal of Food Composition and Analysis 14, 441-445.
Tadesco, I., Russo, M., Lacomino, G., Russo, G.L., Carraturo, A., Faruolo, C., Moio, L.,
Palumbo, R., 2000. Antioxidant effect of red wine polyphenols on red blood cells. The
Journal of Nutritional Biochemistry 11, 114-119.
Wang, S., Huang, K., 2004. Determination of flavonoids by high-performance liquid
chromatography and capillary electrophoresis. Journal of Chromatography A 1032, 273-
279.
Watanabe, A.T., Yamamoto, A., Nagai, S., Terabe, S., 1998. Micellar eletrokinetic
chromatography as an alternative to high performance liquid chromatography for
separation and determination of phenolic compounds in Japanese spirituous liquor. Journal
of Chromatography A 793, 409-4.

159
CAPÍTULO 7
Rapid quality control method for organic acids in wine by capillary electrophoresis with indirect UV
detection
RENATO GARCIA PERES
EDGAR P. MORAES
GUSTAVO AMADEU MICKE
FERNANDO G. TONIN
MARINA FRANCO MAGGI TAVARES
DELIA B. RODRIGUEZ-AMAYA
Artigo a ser submetido à Revista Food Control

160
Rapid quality control method for organic acids in wine by
capillary electrophoresis with indirect UV detection
R. G. Peresb, E. P. Moraesa, G. A. Mickea, F. Tonina, M. F.M. Tavaresa and D. B.
Rodriguez-Amayab*
a Institute of Chemistry , University of Sao Paulo, C.P. 26077, 05599-970, Sao Paulo, SP,
Brazil
bDepartment of Food Science, Faculty of Food Engineering, State University of Campinas,
C.P. 6121, 13083-970 Campinas, SP, Brazil
Corresponding author: Tel + 55-19-35214013; Fax: + 55-19-35212153
E-mail address: [email protected] (D.B. Rodriguez-Amaya)

161
Abstract
A capillary electrophoresis method for six organic acids in wine was developed and
validated. The optimal electrolyte consisted of 10 mmol/L 3,5-dinitrobenzoic acid (DNB) at
pH 3.6 with 0.2 mmol/L cetyltrimethylammonium bromide as flow reverser. DNB was
chosen because it had effective mobility similar to the organic acids, good buffering
capacity at pH 3.6 and good chromophoric characteristics for indirect detection. Sample
preparation involved dilution and filtration. The method showed good performance
characteristics: linearity at 6 to 285 mg/L (r> 0.99); detection and quantification limits of
0.64 to 1.55 and 2.12 to 5.15 mg/L, respectively; separation time of less than 5.5 min.
Coefficients of variation for ten injections was less than 5% and recoveries varied from 95
to 102%. Application to 23 samples of Brazilian wine confirmed good repeatability and
demonstrated wide variation in the organic acid concentrations.
Keywords: Organic acids; Wine, Capillary electrophoresis, Indirect UV detection

162
1. Introduction
Monitoring of organic acids in wine is of paramount importance for quality and
process control in the wine industry. Organic acids have a major role in the microbiological
and physicochemical stability and sensory properties of wines (Ribereau-Gayon, Gloris,
Maujean, & Duburdieu, 2000). These acids come from the grapes (tartaric and malic acids
and, to a much lesser extent, citric acid) used as raw materials or are produced during
fermentation (lactic, acetic and succinic acids) (Zoecklein, Fugelsang, Gump, & Nury,
1999). Bacterial involvement may also produce significant amounts of lactic and acetic
acids.
Many analytical methods have been developed for determining organic acids. The
most widely employed technique has been high performance liquid chromatography
(HPLC) in various modes. Although the overall performance of HPLC methods have been
found to be adequate, reversed phase HPLC with UV detection suffers from poor sensitivity
and selectivity, and often requires derivatisation, increasing the time of analysis (de
Villiers, Lynen, Crouch, & Sandra, 2003). Better separation is obtained with ion exchange
chromatography, but expensive columns, harsh operating conditions, as well as the need for
sample clean-up for complex samples as red wine, limits its use. capillary electrophoresis
(CE) has therefore been increasingly promoted with the advantages of speed, simple sample
preparation, efficiency of separation, low column costs, and reduced sample/solvent
consumption.
CE methods for organic acids encompass direct detection (Castiñeira, Peña,
Herrero, García-Martín, 2000, 2002; Garcia Moreno, Jurado Campoy, & Garcia Barroso,
2001; Mato, Suárez-Luque, S., & Huidobro, 2007; Moreno, Jurado, & Barroso, 2003;

163
Saavedra & Barbas, 2003) and indirect detection (Arellano, Andrianary, Dedieu, Couderc,
& Puig, 1997; Arellano, Couderc, & Puig, 1997; Bianchi, Careri, & Corradini, 2005; de
Villiers, et al., 2003; Esteves, Lima, Lima, & Duarte, 2004; Kandl & Kupina, 1999; Kelly
& Nelson,1993; Kenney, 1991; Klampfl, Katzmayr, & Buchberger, 1998; Levi, Wehr,
Talmadge, & Zhu, 1993; Sing Fung & Man Lau, 2003; Stathakis & Cassidy, 1995).
Although methods based on low UV-absorbance direct detection are more sensitive, not all
commercially available equipments possess detection capability at 200 nm or below. For
indirect detection the choice of the background electrolyte is crucial. Different electrolyte
systems have been proposed, generally comprising of quaternary ammonium salt as
electroosmotic flow (EOF) reverser and either phthalate (Kelly & Nelson, 1993; Kenney,
1991; Levi et al., 1993) or chromate (de Villiers et al., 2003; Stathakis & Cassidy, 1995) as
chromophoric agent. The use of chromate as chromophore is limited to high pH electrolytes
because together with EOF reverser it causes precipitation below pH 7.0. Phthalate is a
medium mobility chromophore and for peak symmetry considerations, it is better suited for
moderately low mobility anions. Since the anions originating from the organic acids under
investigation in the present work have moderate to low mobilities, a low mobility
chromophoric anion was pursued.
In this work, therefore, a capillary electrophoresis (CE) method with indirect UV
detection based on 3,5-dinitrobenzoic acid (DNB)/cetyltrimethylammonium bromide
(CTAB) system was developed and optimized for the determination of six organic acids of
enological importance in 23 Brazilian wines of popular consumption. This was the first
time that DNB was used as running buffer in combination with CTAB for the analysis of
organic acids in wine. CTAB was used by De Villiers et al. (2003), Esteves et al. (2004)
and Kandl and Kupina (1999), but with PDC (pyridinedicarboxylic acid).

164
2. Materials and methods
2.1. Instrumentation
The experiments were carried out in a Beckman P/ACE capillary electrophoresis
system model 5010 (Beckman Coulter Inc., Fullerton, CA, USA), equipped with a UV
detector set at 254 nm for indirect detection. The temperature was controlled and stabilized
at 25oC. For data acquisition and treatment, a P/ACE System Gold software equipped with
a personal computer was used. Electrophoretic separation was carried out in a fused-silica
capillary (Polymicro Technologies, Phoenix, AZ, USA) with dimensions of 57 cm (50 cm
to detector) x 75 µm i.d. x 375 µm o.d.
2.2. Chemicals
All of the reagents were analytical grade, used without previous purification. DL-
tartaric (>99%), citric (>99%), malic (>99%), lactic (>98%) and succinic (>99%) acids and
CTAB were obtained from Aldrich (Milwaukee, WI, USA). Acetic acid (100%) and DNB
(>99%) were from Merck (Darmstadt, Germany). Standard stock solutions were prepared
with purified water (18.2mΩ) (Milli-Q, Millipore, Bedford, MA, USA) at 1000 mg/L and
stored in a freezer for future dilutions. Stock solutions of DNB at 20 mmol/L and CTAB at
10 mmol/L were also prepared. The electrolyte solution was prepared daily and filtered
through a 0.45 μm membrane.

165
2.3. Sample preparation
Twenty-three samples of different types (red, white and blended) and brands of
Brazilian wine were purchased from local markets in Sao Paulo, Brazil. Year of production
and types of wine are listed in Table 2. The contents of two freshly opened bottles were
mixed, diluted 1:5 with distilled water, filtered through a 0.45 µm membrane (Millipore)
and immediately analyzed.
2.4. Capillary conditioning
At each day of analysis, the capillary was conditioned by pressure flushes of 1
mol/L NaOH (5 min), deionized water (5 min) and electrolyte solution (10 min), followed
by an electrokinetic flush with electrolyte solution (-25 kV during 10 min). In between
runs, the capillary was reconditioned with a pressurized wash with the electrolyte solution
(2 min).
2.5. Development and evaluation of method performance
Ionic mobility and pKa data of the six acids under consideration (acetic, citric,
tartaric, malic, lactic, and succinic acids) were obtained from the literature (Hirokawa,
Nishino, Aoki, & Kiso, 1983) and used to calculate effective mobilities. The separation pH
was first optimized by screening effective mobility versus pH curves for the largest
mobility differences. Once the pH region was selected, a suitable chromophoric anion was

166
pursued. Electrolyte concentration was then varied from 20 to 5 mmol/L and a proper value
was selected taking into consideration analysis time. Considering that the effective
mobilities of the organic acids were small, a flow reverser was chosen to speed up
separation. The optimized electrolyte consisted of 10 mmol/L DNB and 0.2 mmol/L
CTAB, the pH being adjusted to 3.6 with HCl.
Linearity was evaluated by the injection of five standard solutions of each organic
acid at concentrations varying from 6 to 285 mg/L. Limits of detection (LOD) and
quantification (LOQ) were calculated as the solution concentrations that gave signal-to-
noise ratios of 3 and 10, respectively. Instrumental precision was evaluated by 10
consecutive injections of the standard solutions. Recovery was studied using wine samples
spiked with 20 mg/L of organic acids.
The standard solutions and the samples were hydrodynamically injected at a 0.5 psi
pressure in 3 s. The electrophoretic system was operated with inverted polarity and constant
voltage of -25 kV. Detection was in the indirect mode at 254 nm. All standards and
samples were injected in triplicate.
3. Results and discussion
3.1. Optimization of the electrolyte composition
The absence of chromophores in the organic acids under study indicated, as a
possible CZE methodological alternative, the use of indirect detection. Selection of suitable
conditions such as the electrolyte and its concentration, pH, as well as the electrolyte co-ion
became critical in the method development due to resolution and symmetry considerations.

167
As can be observed from Fig. 1, above pH 7, separation is not possible because co-
elution of succinic and tartaric acids occurs. At intermediate pH (4<pH<7), separation of all
acids is possible but at a very narrow pH window. At the low pH region (3<pH<4),
separation is more likely to be achieved. Therefore pH 3.6 was selected as the optimal pH
condition.
As can also be seen in Fig.1, DNB appeared to be a suitable chromophoric anion
because its effective mobility is bracketted by the solute mobilities and it has good
buffering capacity at pH 3.6.
At the optimal pH, the effective mobilities of the organic acids are relatively low. Thus, a
flow reverser was needed to speed up the analysis. CTAB was chosen as the flow reverser
and the analysis was conducted under inverted polarity.

168
-75
-65
-55
-45
-35
-25
-15
-5
2 3 4 5 6 7 8 9 10
pH
effe
ctiv
e m
obili
ty /
x10-5
cm
2 V-1s-1
3,5-dinitrobenzoic acetic citric lactic malic succinic tartaric
Figure 1. Curves of effective mobility values versus pH.
Fig. 2 presents the separation of standards of the organic acids under investigation at
the optimal conditions. Baseline separation was achieved for all organic acids in less than
5.5 min. The proposed method was thus faster than those presented in the literature, the
separation time of which varied from 6 min (Castiñeira, et al., 2000) to 20 min (Garcia
Moreno et al., 2001; Levi et al., 1993), except for the methods of Mato et al. (2007) (less
than 3 min), Bianchi et al. (2005) (3.5 min) and Kelly and Nelson (1993) (5 min).

169
3.2. Method performance
Table 1 presents the performance characteristics of the method. At the concentration
ranges tested (6 to 285 mg/L), the method presented good r2 values (from 0.9901 to
0.9988). The LOD varied from 0.64 to 1.55 mg/L and the LOQ from 2.12 to 5.15 mg/L,
being lowest for malic acid and highest for citric acid in both case. As summarized by Mato
et al. (2007), reported LOD varied from 0.006 to 46.4 mg/L and LOQ from 0.02 to 122
mg/L. The coefficients of variation of ten consecutive injections of standard solutions were
lower than 5%. Recoveries varied from 95% (succinic acid) to the 102% (citric acid). For
the few papers that reported recovery results, also summarized by Mato et al. (2007), the
percentage recovery varied from 90 to 107%. When compared to values in the literature,
therefore, the method developed in this study has good performance.
3.3. Organic acids of Brazilian wines
Figure 2 presents the electropherogram of the standards and Figure 3 the typical
electropherogram of a Brazilian white wine, run at the optimized conditions. Table 2
shows the organic acid concentrations of 23 Brazilian wines analyzed by the proposed
method.
Taking out the values which were only estimates (below the limit of quantification),
the coefficients of variation of triplicate analyses varied from 0.1 to 3.9 (mean of 1.4% for
89 measurements), except for one value for acetic acid which had a CV of 7.4%. Thus, the
developed method as applied to real samples has good repeatability.

170
Table 1. Performance characteristics of the CZE method developed.
Order
of
Elution
Organic
Acid
Concentration
range (mg/L)
Coefficient
of
correlationa
Limit of
quantification
(mg/L)b
Limit of
detection
(mg/L)b
Recovery
(%)b
1 Tartaric 13-145 0.9983 3.42 1.02 98 ± 1
2 Malic 9-145 0.9966 2.12 0.64 99 ± 1
3 Latic 6-145 0.9988 2.35 0.70 97 ± 1
4 Succinic 7-145 0.9983 2.87 0.86 95 ± 1
5 Acetic 7-145 0.9983 3.13 0.93 101 ± 0
6 Citric 65-285 0.9901 5.15 1.55 102 ± 1
aFive concentrations, each injected in triplicate. bInjected in triplicate.
Citric acid at a concentration of 2418 mg/L was found in only one sample, a popular
inexpensive Brazilian wine. Because this acid was not detected in the other wines and it is
present at high level in this single wine sample, it could have been added to adjust the
acidity. Citric acid as acidulant has the advantage of not forming insoluble precipitates with
calcium and potassium in alcoholic solution, compared to tartaric acid (Zoecklein et al.,
1999).
Tartaric (1023-2212 mg/L) lactic (35-7306 mg/L), succinic (83-700 mg/L) and
acetic acid (118-1003 mg/L) were found in all the wine samples at highly variable levels.
Malic acid, which is transformed to lactic acid in malolactic fermentation, was found in one
sample of blended wine (2627 mg/L), two samples of red wine (2153-2243 mg/L) and three
samples of white wine (1117-2112 mg/L).

171
Table 2. Organic acid concentrations (mg/L) in Brazilian wines obtained by the capillary
electrophoresis proposed method.
Organic acids
Sample Tartaric Malic Lactic Succinic Acetic Citric
Cabernet Sauvignon red 2000 1404 ± 4 3815 ± 44 598 ± 9 1003 ± 22
Cabernet Sauvignon red 2001 1628 ± 37 2683 ± 20 699 ± 8 752 ± 10
Cabernet Sauvignon red 1801 ± 21 2187 ± 31 682 ± 1 620 ± 6
Cabernet Sauvignon red 1023 ± 41 751 ± 6 142 ± 3 404 ± 14 2418 ± 14
Cabernet Franc red 2000 1603 ± 21 2153 ± 31 84±8 66 ± 6 118 ± 12
Cabernet Franc red 2001 1642 ± 51 2566 ± 3 590 ± 18 512 ± 14
Gammay red 2002 1498 ± 2 1981 ± 4 616 ± 14 917 ± 6
Gammay red 2003 1459 ± 9 2504 ± 26 700 ± 9 703 ± 11
Merlot red 2001 1536 ± 35 7306 ± 35 520 ± 2 671 ± 13
Merlot red 1495 ± 6 2243 ± 23 35 ± 4 66 ± 3 269 ± 20
Shiraz red red 2002 2212 ± 25 2084 ± 34 478 ± 3 814 ± 3
Blended red 1204 ± 7 2325 ± 36 589 ± 9 775 ± 23
Blended 1517 ± 14 2504 ± 2 631 ± 14 822 ± 5
Blended 1555 ± 4 3392 ± 27 609 ± 1 924 ± 13
Blended 1614 ± 33 2627 ± 21 183 ± 10 361 ± 1 224 ± 7
Chardonnay white 2002 1273 ± 28 2112 ± 22 536 ± 2 278 ± 4 276 ± 9
Pinot Blanc white 2001 1569 ± 38 1996 ± 18 61 ± 0.3 83 ± 3 245 ± 2
Riesling white 2000 1521 ± 24 2761 ± 44 566 ± 10 734 ± 29
Riesling white 2001 1345 ± 14 2269 ± 7 546 ± 8 669 ± 5
Riesling white 2002 1451 ± 42 2381 ± 6 615 ± 5 679 ± 4
Riesling white 1048 ± 6 2500 ± 17 338 ± 9 445 ± 7
Sauvignon Blanc white 2002 1623 ± 11 3933 ± 18 468 ± 7 650 ± 23
Ugni Blanc white 2002 1208 ± 25 1117 ± 8 1296 ± 6 384 ± 10 308 ± 7
Values are the means and standard deviations of triplicate analyses.

172
-12000
-10000
-8000
-6000
-4000
-2000
0
2 2,5 3 3,5 4 4,5 5 5,5
Time (min)
Au
1
2
3
4
5
6
Figure 2. Eletropherogram of organic acid standards: 1-tartaric acid, 2-malic acid, 3-lactic
acid, 4 - succinic acid, 5 - acetic acid, 6-citric acid. CE conditions are described in the text.

173
-10000
-8000
-6000
-4000
-2000
0
2 2,5 3 3,5 4 4,5 5 5,5
Time (min)
Au
1
3
4
56
Figure 3. Typical eletropherogram of the organic acids in a sample of white wine: 1-
tartaric acid, 3- lactic acid, 4 - succinic acid, 5 - acetic acid, 6-citric acid. CE conditions are
described in the text.
According to Mato et al. (2007), when acetic acid is found in quantities greater than
1 g/L and lactic acid greater than various g/L, alteration of the wine could have occurred.
Of the 23 Brazilian wines analyzed, one Cabernet Sauvignon red wine had 1 g/L of acetic
acid, all the other wines having lower levels. The highest lactic acid content (7.3 g/L) was
that of a Merlot red wine.

174
Recent years have seen marked improvement in the quality of Brazilian wines. The
substantial variation in the organic acid composition shown in the present study indicates
ample room for further improvement. The simple, rapid and reliable method herein
developed can serve as a valuable tool for such an endeavor. It can also be used for quality
evaluation and control in other countries.
4. Conclusion
The method developed is versatile, fast, simple and low-cost. The electrolyte/pH
optimization made it possible to obtain excellent selectivity. Indirect UV detection provided
good limits of detection and quantification, as well as linearity and good recovery in the
concentration levels studied. Applied to Brazilian wines, good repeatability was confirmed.
The organic acid concentrations of the Brazilian wines varied considerably.
References
Arellano, M. Andrianary, J., Dedieu, F., Couderc, F., & Puig, P. (1997). Method
development and validation for the simultaneous determination of organic acid and
inorganic acids by capillary zone electrophoresis, Journal of Chromatography A, 765,
321-328.
Arellano, M., Couderc, F., & Puig, P. H. (1997). Simultaneous separation of organic and
inorganic acids by capillary zone electrophoresis. Application to wines and fruit juices.
American Journal of Enology and Viticulture, 48, 408-412.

175
Bianchi, F., Careri, M., & Corradini, C. (2005). Novel approach for the rapid determination
of water-soluble organic acids in wine by co-electroosmotic flow capillary zone
electrophoresis. Journal of Separation Science, 28, 898-904.
Castiñeira, A. Peña, R. M., Herrero, C., & García-Martín, S. (2000). Simultaneous
determination of organic acids in wine samples by capillary electrophoresis and UV
detection: optimization with five different background electrolytes. HRC – Journal of
High Resolution Chromatography, 23, 647-652.
Castiñeira, A., Peña, R. M., Herrero, C., & García-Martín, S. (2002). Analysis of organic
acids in wine by capillary electrophoresis with direct UV detection. Journal of Food
Composition and Analysis, 15, 319-331.
De Villiers, A., Lynem, F., Crouch, A., & Sandra, P. (2003). A robust capillary
electrophoresis method for the determination of organic acids in wines. European Food
Research and Technology, 217, 535-540.
Esteves, V.I., Lima, S. S. F., Lima, D. L. D., & Duarte, A. C. (2004). Using capillary
electrophoresis for the determination of organic acids in Port wine. Analytica Chimica
Acta, 5131, 163-167.
García Moreno, M. V., Jurado Campoy, C. J., & García Barroso, C. (2001). Method
devised for determining low molecular weight organic acids in vinic samples by
capillary electrophoresis: validation of the method with real samples. European Food
Research and Technology, 213, 381-385.
Hirokawa, T., Nishino, M., Aoki, N., Kiso, Y. (1983) Table of isotacophoretic indices. I.
Simulating qualitative indices of 287 anionic substances in the range pH 3-10. Journal
of Chromatography, 271, D1-D106.

176
Kandl, T., & Kupina, S. (1999). An improved capillary electrophoresis procedure for the
determination of organic acids in grape juice and wine. American Journal of Enology
and Viticulture, 50, 155-161.
Kelly, L., & Nelson, R. J. (1993). Capillary zone electrophoresis of organic acids and
anions. Journal of Liquid Chromatography & Related Technologies, 16, 2103-2112.
Kenney, B. F. (1991) Determination of organic acids in food samples by capillary
electrophoresis, Journal of Chromatography A, 546, 423-430.
Klampfl, C. W., Katzmayr, M. U., & Buchberger, W. (1998). Separation of inorganic and
organic anions by capillary zone electrophoresis with simultaneous indirect UV and
conductivity detection. Electrophoresis, 19, 2459-2464.
Levi, V., Wehr, T., Talmadge, K., & Zhu, M. (1993). Analysis of organic acids in wines by
capillary electrophoresis and HPLC. American Laboratory, 25, 29-32.
Mato I, Suárez-Luque S, & Huidobro JF. (2007) Simple determination of main organic acid
in grape juice and wine by using capillary zone electrophoresis with direct UV
detection. Food Chemistry; 102, 104-112.
Moreno, M. V. G., Jurado, C. J., & Barroso, C. G. (2003). Determination of organic acids
by capillary electrophoresis with simultaneous addition of Ca and Mg as complexing
agents. Chromatographia, 57, 185-189.
Ribereau-Gayon P., Gloris, Y., Maujean, A., & Dubourdieu, D. (2000). Handbook of
enology, vol. 2. The chemistry of wine, stabilization and treatments, pp.3-39. New
York: Wiley.
Sing Fung, Y., & Man Lau, K. (2003). Analysis of organic acids and inorganic anions in
beverage drinks by capillary electrophoresis. Electrophoresis, 24, 3224-3232.
177
Stathakis, C., & Cassidy, R.M. (1995). Effect of electrolyte composition in the capillary
electrophoretic separation of inorganic/organic anions in the presence of cationic
polymers. Journal of Chromatography A, 699, 353-361.
Zoecklein, B. W., Fugelsang, K. C., Gump, B. H., & Nury, F. S. (1999). Wine analysis and
production, pp.76-96. Gaithersburg: Aspen Publishers, Inc.

178
CONCLUSÕES GERAIS
1. As técnicas de eletroforese capilar e cromatografia liquida de alta eficiência
acopladas a detectores de arranjo de diodos e espectrometria de massas
proporcionam aplicações valiosas em alimentos, fornecendo informações
sobre compostos importantes tanto na qualidade quanto nas propriedades
benéficas à saúde.
2. Foram desenvolvidos métodos confiáveis por eletroforese capilar para a
determinação de catequinas em chá verde, compostos fenólicos e ácidos
orgânicos em vinhos.
3. Foram desenvolvidos métodos por HPLC-DAD-ESI/MS para a
deterrminação simultânea de compostos fenólicos e metilxantinas em infusões
de mate (Ilex paraguariensis).
4. Há uma marcante variação na composição dos analitos investigados em chá
verde, infusões de mate e vinho, indicando a necessidade de maior controle.

179
5. Os flavonois quercetina e kaempferol podem ser determinados tanto na
forma glicosídica como na forma de agliconas;
6. A atividade individual de compostos antioxidantes pode ser medida on-line,
demonstrando que esta atividade não é proporcional a concentração;
6. Chimarrão (infusões quentes) extrai maior quantidade de compostos
benéficos à saúde.
7. A comercialização de mate acarreta perdas nos compostos fenólicos e
metilxantinas.