aplastic anemiaassets.aamds.org/pdfs/damonaplastic anemia.pdf · 7/17/11 1 aplastic anemia: current...
TRANSCRIPT

7/17/11
1
Aplastic Anemia: Current Thinking on the Disease, Diagnosis, and Non-Transplant
Treatment
Lloyd E. Damon, MD University of California, San
Francisco
Aplastic Anemia Diagnosis
• Pancytopenia – Neutropenia – Anemia – Thrombocytopenia
• Empty or hypocellular bone marrow for age
• Normal karyotype • Other bone marrow disorders excluded
Normal bone marrow aspirate (50x)

7/17/11
2
Bone Marrow Aspirate Aplastic Anemia
Normal bone marrow biopsy (10x)
Bone Marrow Biopsy Aplastic Anemia
7/17/11
3
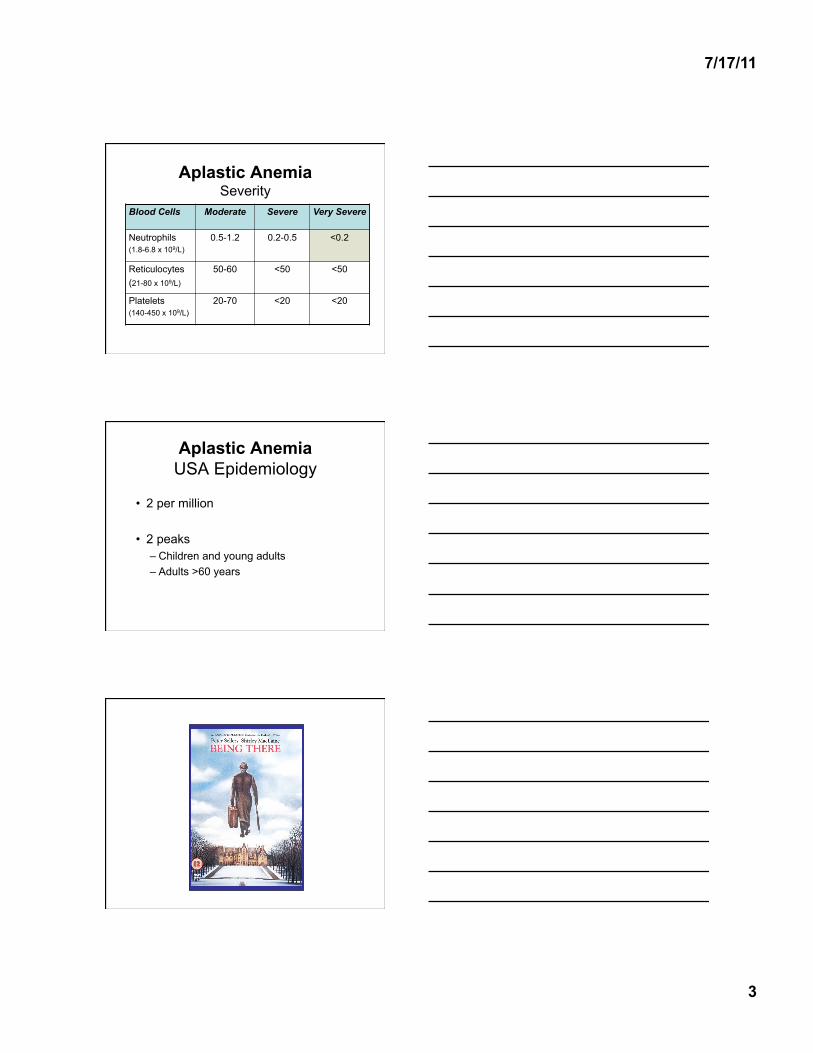
Aplastic Anemia Severity
Blood Cells Moderate Severe Very Severe
Neutrophils (1.8-6.8 x 10⁹/L)
0.5-1.2 0.2-0.5 <0.2
Reticulocytes (21-80 x 109/L)
50-60 <50 <50
Platelets (140-450 x 109/L)
20-70 <20 <20
Aplastic Anemia USA Epidemiology
• 2 per million
• 2 peaks – Children and young adults – Adults >60 years

7/17/11
4
Aplastic Anemia Etiology
Primary (idiopathic) Secondary • Acquired
– Hepatitis – Other viruses – Chemotherapy – Ionizing radiation – Medications
• Inherited
autoimmune
Aplastic Anemia Secondary — Acquired
• Hepatitis – B,C, undiscovered
• Other viruses – Epstein Barr virus – Parvovirus B19 – HIV
• Viruses in the setting of chronic hemolysis – Sickle cell anemia – Thalassemia – Hereditary spherocytosis – Autoimmune
• Chemotherapy • Ionizing Radiation • Medications
– Gold – Chloramphenicol – Anti-epileptics – Anti-arrythmics
• Pregnancy • PNH • Thymoma • Graft-vs-Host Disease
Aplastic Anemia Secondary — Inherited
• Fanconi’s anemia – Abnormal DNA repair
• Dyskeratosis congenita – Shortened chromosomal telomeres
• Shwachman-Diamond syndrome • Reticular dysgenesis • Amegakaryocytic thrombocytopenia • Familial myelodysplasia • Down’s syndrome • Familial (unnamed)

7/17/11
5
Pathophysiology of Primary Aplastic Anemia
• Autoimmunity – Cytotoxic T-cells shut down/destroy hematopoietic
stem cells (HSC) – Mature blood elements are not made
• Shortened telomeres – Fewer HSC – Reduced pool of blood progenitor cells – 10% of patients with primary AA have mutations in
telomere rebuilding genes
Hematology Am Soc Hematol Educ Prog 2006: 72 Mech Ageing Dev 2008; 129: 35
Telomeres
Blood 2008; 111: 4446
Telomere Attrition Over Time
Hematology Am Soc Hematol Educ Program 2010: 30

7/17/11
6
Telomere Attrition • 50-100 base pairs of telomeric DNA is lost
with each cell division • Attrition is dampened by rebuilding some lost
base pairs after each cell division: – TERT and TERC
• Short for age telomeres in stem cells results in: – Reduced proliferation – Abnomral cellular repair (Fibrosis) – Genomic instability – Chromosome fusions/translocations/gain or loss
(Cancer) Blood 2008; 111: 4446
Rebuilding Telomeres
Blood 2008; 111: 4446
TERC
Telomere Attrition
0
20
40
60
80
100
120
1 2 3 4 5 6 7 8 9 10% o
f Sta
rtin
g Te
lom
ere
Leng
th
# of Cell Divisions

7/17/11
7
Hematopoietic Stem Cells and Telomeres
Biochimica et Biophyica Acta 2009; 1792: 371
Treatment of Primary (Autoimmune) Aplastic Anemia:
Immunosuppression
Treatment of Severe Aplastic Anemia with Immunosuppression
Haematologica 2009; 94: 310
40%
50%
65%

7/17/11
8
Age and Survival After Immunosuppression
ATG/CSA ± G-CSF
Blood 2011; 117: 4434
Idiopathic Aplastic Anemia Treatment Algorithm
Biol Blood Marrow Transplant 2010; 16: S119
Immunosuppressive Therapy Primary Aplastic Anemia
• Response definitions – Complete
• Normal blood counts – Neutrophils 1.5 x 10⁹/L – Hemoglobin ≥13 g/dL (men), ≥ 12 g/dL (women) – Platelets ≥150 x 109/L
• No use of growth factors or transfusions – Partial
• Transfusion and growth factor independence • Blood counts less than normal
– Overall • Complete + Partial
7/17/11
9
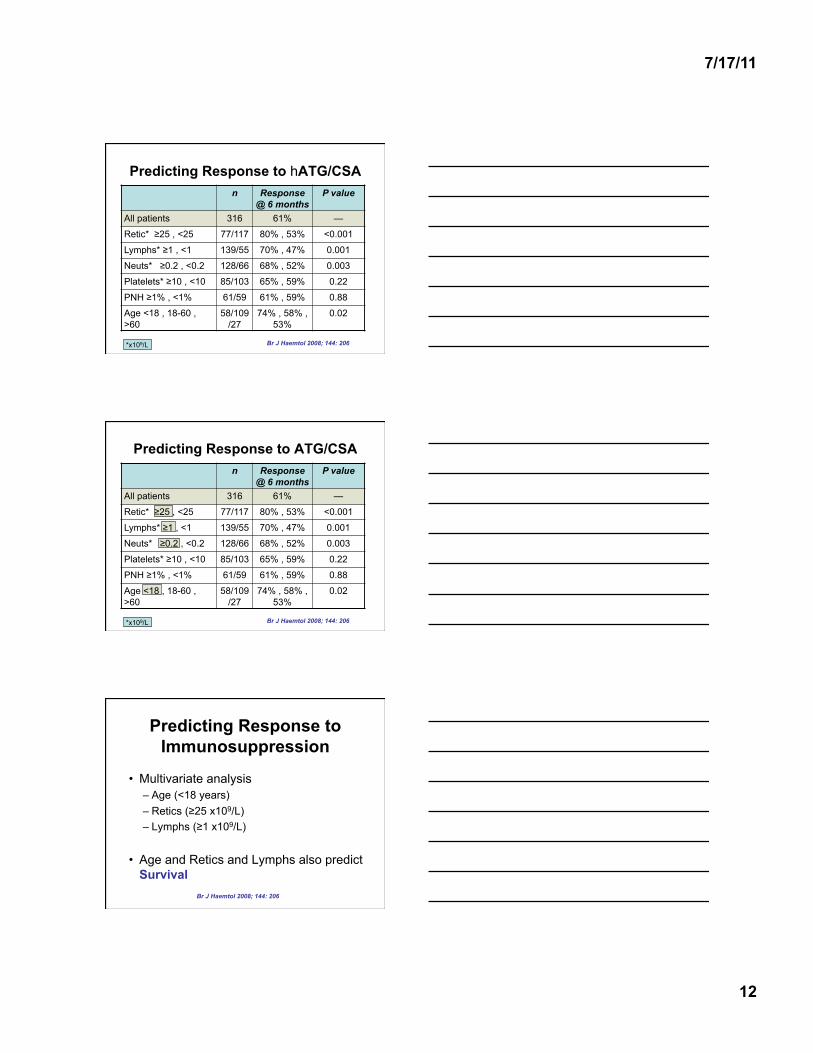
Immunosuppression: Treatment Strategy
• ATG (antithymocyte globulin) – 5 daily doses
• CSA (cyclosporine) – Twice daily – Blood levels: 500-800 (1st month), then 200-500 ng/mL – Through 6 months, then attempt taper
• Corticosteroids – 1 mg/kg/day – First 14 days, then taper
NEJM 1991; 324: 1297
Hematology 2010; 36-42
hATG vs hATG + CSA
Blood 2003; 101: 1236
Response at 4 mo (all patients)
Response at 4 mo (severe)
Time to response
(days)
FFS at 11 years
Relapse at 11 years
ATG + CSA
70% 65% 60 39% 45%
ATG 41% 31% 82 24% 30%
P value
0.02 0.01 0.02 0.04 0.4
*ATG = horse ATG (lymphoglobuline)

7/17/11
10
Kinetics of Response Time to Immunosuppresssion
Blood 2003; 101: 1236
Failure Free Survival after Immunosuppression
Blood 2003; 101: 1236
Survival After Immunosuppression
Blood 2003; 101: 1236

7/17/11
11
Aplastic Anemia Relapse After Immunosuppression
Blood 2003; 101: 1236
45%
30%
Relapse of Aplastic Anemia After Immunosuppression
• No one relapsed while on CSA • Time from stopping CSA to relapse
– 27 months (2-29) • 2nd response to ATG/CSA better if
– relapsing from a Complete Response
Blood 2003; 101: 1236
2nd Clonal Disease After Immunosuppression
• Cumulative probability 25 % at 11 years • PNH
– 8/84 (6%) • MDS/AML
– 4/84 (5%) • Solid cancer
– 8/84 (5%) • Latency
– MDS/AML - 6.6-9.5 years – Solid cancer - 1.2-11.5 years
Blood 2003; 101: 1236
7/17/11
12
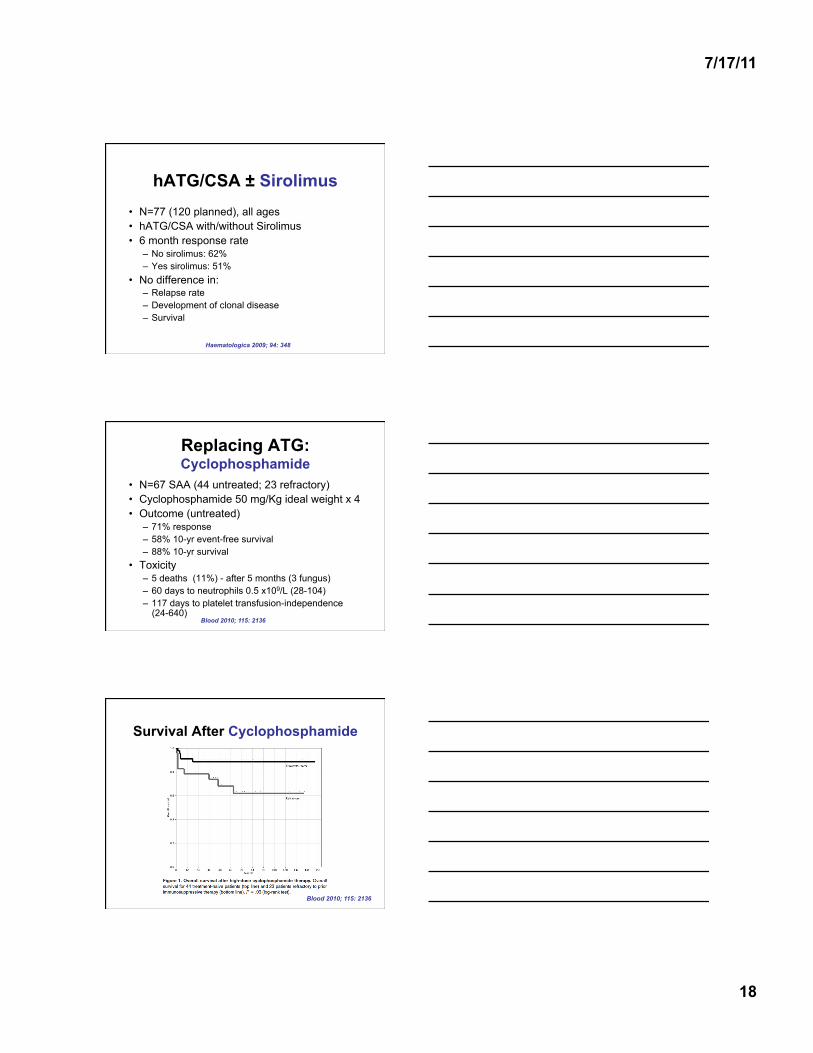
Predicting Response to hATG/CSA n Response
@ 6 months P value
All patients 316 61% —
Retic* ≥25 , <25 77/117 80% , 53% <0.001
Lymphs* ≥1 , <1 139/55 70% , 47% 0.001
Neuts* ≥0.2 , <0.2 128/66 68% , 52% 0.003
Platelets* ≥10 , <10 85/103 65% , 59% 0.22
PNH ≥1% , <1% 61/59 61% , 59% 0.88
Age <18 , 18-60 , >60
58/109/27
74% , 58% , 53%
0.02
*x109/L Br J Haemtol 2008; 144: 206
Predicting Response to ATG/CSA n Response
@ 6 months P value
All patients 316 61% —
Retic* ≥25 , <25 77/117 80% , 53% <0.001
Lymphs* ≥1 , <1 139/55 70% , 47% 0.001
Neuts* ≥0.2 , <0.2 128/66 68% , 52% 0.003
Platelets* ≥10 , <10 85/103 65% , 59% 0.22
PNH ≥1% , <1% 61/59 61% , 59% 0.88
Age <18 , 18-60 , >60
58/109/27
74% , 58% , 53%
0.02
*x109/L Br J Haemtol 2008; 144: 206
Predicting Response to Immunosuppression
• Multivariate analysis – Age (<18 years) – Retics (≥25 x109/L) – Lymphs (≥1 x10⁹/L)
• Age and Retics and Lymphs also predict Survival
Br J Haemtol 2008; 144: 206

7/17/11
13
Survival by Reticulocytes and Lymphocytes at Diagnosis
Br J Haemtol 2008; 144: 206
Survival by Reticulocytes and Lymphocytes at Diagnosis
Br J Haemtol 2008; 144: 206
Telomere Length* and Response of SAA to Immunosuppression
*White blood cells JAMA 2010; 304: 1358
Telomere Quartile
Number Response Rate
1 46 57% (41-71)
2 46 54% (39-69)
3 45 60% (45-75)
4 46 57% (42-71)

7/17/11
14
Telomere Length* and Outcomes
*White blood cells JAMA 2010; 304: 1358
Relapse rate
Telomere Length* and Survival
*Blood white cells JAMA 2010; 304: 1358
hATG/CSA ± G-CSF No G-CSF G-CSF* P value
Response 63% 73% 0.54
Infections in first 3 months
36% 24% 0.01
% days in hospital in first month
87% 82% 0.003
Death at 6 years 24% 22% 0.67
Relapse at 6 years 33% 32% 0.79
2nd Cancer 6% 3% 0.54
PNH at 6 years 22% 16% 0.07
Blood 2011; 117: 4434 *G-CSF, day 8-240

7/17/11
15
Impact of G-CSF on Survival
Blood 2011; 117: 4434
Impact of G-CSF on Event -Free Survival
Blood 2011; 117: 4434
Neutrophil Response and Impact on Survival
All on G-CSF
Blood 2011; 117: 4434
75% CI

7/17/11
16
CSA-Dependence of Blood Counts
Blood 2003; 101: 1236
Duration of CSA • 42 children with vSAA/SAA in Italy • ATG + CSA • CSA, blood levels 150-300 ng/ml to 6 months • 71% response rate at 6 months • CSA tapering
– 22/33 (67%) come off at 95 months (12-164) – Median duration of full dose, 12 months (3-45) – Median duration of taper, 19 months (4-64) – Probability off CSA at 5 yr (21%), 10 yr (41%)
• 6/33 (18%) CSA-dependent – Median time on CSA - 104+ months (89-120+)
Br J Haematol 2008; 140: 197
Duration of CSA in Children
Br J Haematol 2008; 140: 197

7/17/11
17
Aplastic Anemia Relapse by CSA Taper Rate
Br J Haematol 2008; 140: 197
≥0.8 mg/kg/mo
<0.8 mg/kg/mo
hATG/CSA + MMF (Mycophenolic Acid Mofetil)
• 104 children and adults with vSAA/SAA • MMF for 18 months
– 600 mg/m2 twice daily (<12 yr) or 1g twice daily (≥12 yr)
• Response rate 62% at 6 months • Probability of aplastic anemia relapse
37% at 4 years – 15/24 relapses occur during MMF
Br J Haematol 2006; 133: 606
Survival and Relapse, MMF
Br J Haematol 2006; 133: 606
7/17/11
18
hATG/CSA ± Sirolimus
• N=77 (120 planned), all ages • hATG/CSA with/without Sirolimus • 6 month response rate
– No sirolimus: 62% – Yes sirolimus: 51%
• No difference in: – Relapse rate – Development of clonal disease – Survival
Haematologica 2009; 94: 348
Replacing ATG: Cyclophosphamide
• N=67 SAA (44 untreated; 23 refractory) • Cyclophosphamide 50 mg/Kg ideal weight x 4 • Outcome (untreated)
– 71% response – 58% 10-yr event-free survival – 88% 10-yr survival
• Toxicity – 5 deaths (11%) - after 5 months (3 fungus) – 60 days to neutrophils 0.5 x10⁹/L (28-104) – 117 days to platelet transfusion-independence
(24-640) Blood 2010; 115: 2136
Survival After Cyclophosphamide
Blood 2010; 115: 2136

7/17/11
19
hATG/CSA vs Cyclophosphamide/CSA ATG Cyclophos-
phamide P value
n 16 15 Response @ 6 mo 75% 46% 0.1 Fungus or Death <3 mo 0 (0%) 6 (40%) <0.01 Hospital days 12 59 <0.001 IV antibiotics 7% 47% <0.002 RBC units 11 36 0.02 Platelet transfus. 9 32 0.03 Days G-CSF 3 14 0.001 Days Neuts <0.5 3 53 <0.003
Lancet 2000; 356: 1554
Neutrophil Recovery: hATG vs Cyclophosphamide
Lancet 2000; 356: 1554
Replacing hATG with Alemtuzumab
• Alemtuzumab – Anti-CD52 antibody – 73-103 mg subcutaneous
• Alemtuzumab followed by CSA • 6 month response: 58% (84%
cumulative) • No clear advantage to hATG
Br J Haematol 2010; 148: 791

7/17/11
20
Primary Aplastic Anemia Summary -1-
• Pathophysiology – Overactive T-cells – Shortened telomeres
• Standard Immunosuppression – ATG + CSA – 60-70% response rate – G-CSF shortens hospitalization and reduces
infections – No benefit to add MMF or Sirolimus, or using
Alemtuzumab – Cyclophosphamide is too toxic
Primary Aplastic Anemia Summary -2-
• CSA – Average duration is 8 years – On full dose 1 year – 18% are CSA-dependent – More relapse and shorter time to relapse with
faster tapers (≥0.8 mg/kg/month) • Predicting Response and Survival
– Young age – Higher reticulocyte count – Higher lymphocyte count
Primary Aplastic Anemia Summary -3-
• Shorter Telomeres predict – More relapse – Shorter survival – More clonal evolution
• Long-Term problems with Immunosuppression – Relapse – PNH – MDS/AML – 2nd cancers