apipa 20091 statistical sampling for auditors jeanne h. yamamura cpa, mim, phd
TRANSCRIPT

APIPA 2009APIPA 2009 11
STATISTICAL SAMPLING FOR
AUDITORS
Jeanne H. Yamamura
CPA, MIM, PHD
APIPA 2009APIPA 2009 22
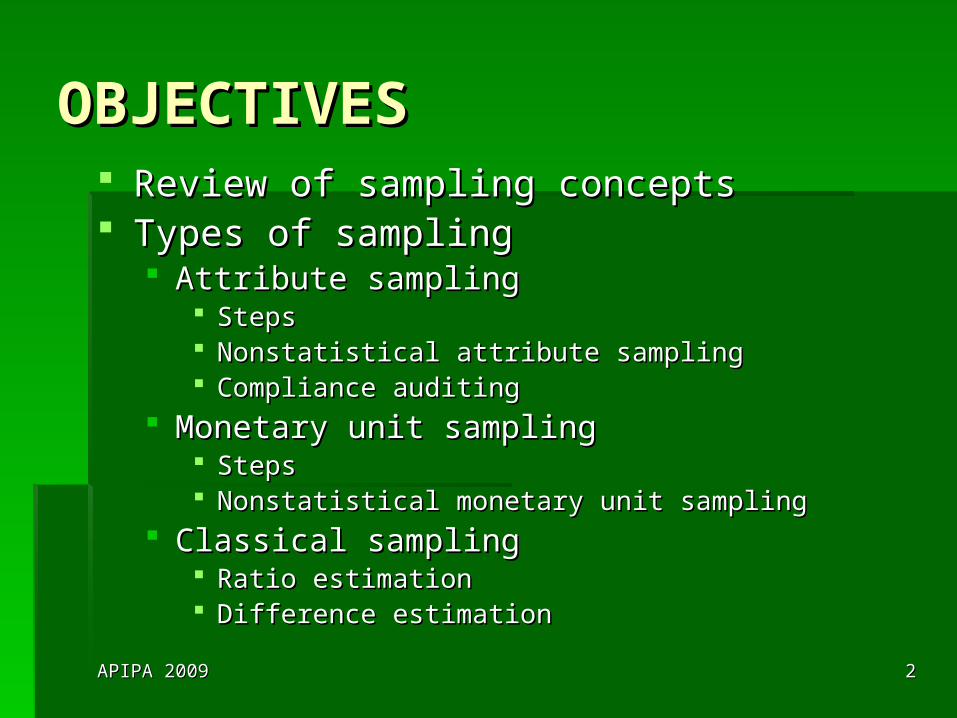
OBJECTIVESOBJECTIVES Review of sampling conceptsReview of sampling concepts Types of samplingTypes of sampling
Attribute samplingAttribute sampling StepsSteps Nonstatistical attribute samplingNonstatistical attribute sampling Compliance auditingCompliance auditing
Monetary unit samplingMonetary unit sampling StepsSteps Nonstatistical monetary unit sampling Nonstatistical monetary unit sampling
Classical samplingClassical sampling Ratio estimationRatio estimation Difference estimationDifference estimation

APIPA 2009APIPA 2009 33
AUDIT SAMPLINGAUDIT SAMPLING
Application of an audit procedure to less Application of an audit procedure to less than 100% of the items in a populationthan 100% of the items in a population Account balanceAccount balance Class of transactionsClass of transactions
Examination “on a test basis”Examination “on a test basis” Key: Sample is intended to be Key: Sample is intended to be
representative of the population.representative of the population.
APIPA 2009APIPA 2009 44
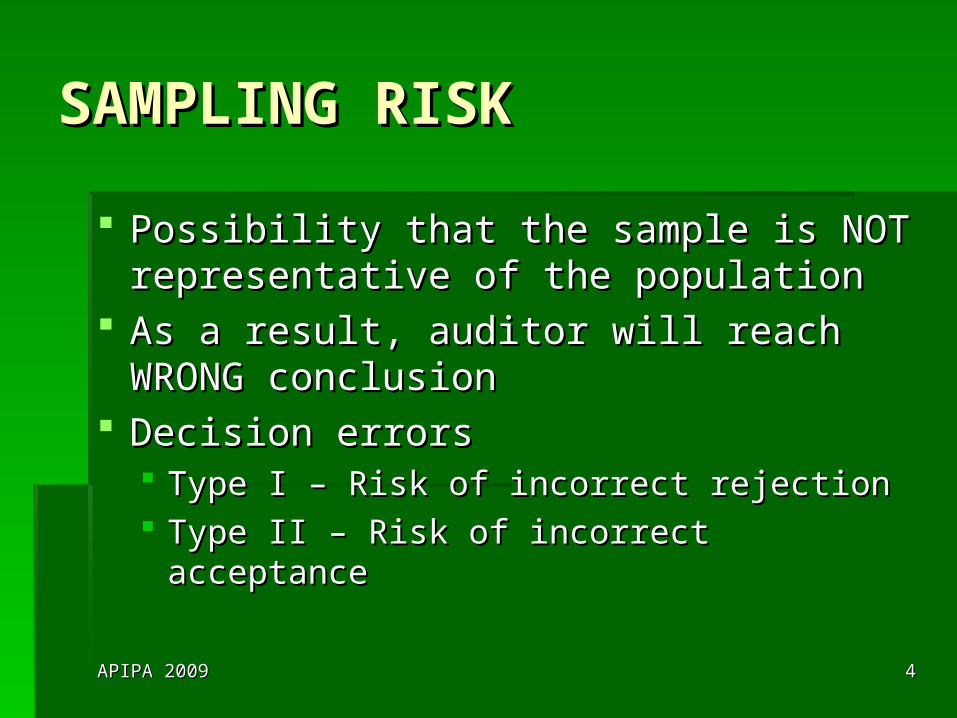
SAMPLING RISKSAMPLING RISK
Possibility that the sample is NOT Possibility that the sample is NOT representative of the populationrepresentative of the population
As a result, auditor will reach WRONG As a result, auditor will reach WRONG conclusionconclusion
Decision errorsDecision errors Type I – Risk of incorrect rejectionType I – Risk of incorrect rejection Type II – Risk of incorrect acceptanceType II – Risk of incorrect acceptance

APIPA 2009APIPA 2009 55
TYPE I – RISK OF TYPE I – RISK OF INCORRECT REJECTIONINCORRECT REJECTION
Internal controlInternal control: Risk that sample : Risk that sample supports conclusion that control is NOT supports conclusion that control is NOT operating effectively when it really isoperating effectively when it really is AKA – Risk of underreliance, risk of AKA – Risk of underreliance, risk of
assessing control risk too highassessing control risk too high
Substantive testingSubstantive testing: Risk that sample : Risk that sample supports conclusion that balance is NOT supports conclusion that balance is NOT properly stated when it really isproperly stated when it really is

APIPA 2009APIPA 2009 66
TYPE II – RISK OF TYPE II – RISK OF INCORRECT ACCEPTANCEINCORRECT ACCEPTANCE
Internal controlInternal control: Risk that sample : Risk that sample supports conclusion that control is supports conclusion that control is operating effectively when it really isn’toperating effectively when it really isn’t AKA – Risk of overreliance, risk of assessing AKA – Risk of overreliance, risk of assessing
control risk too lowcontrol risk too low
Substantive testingSubstantive testing: Risk that sample : Risk that sample supports conclusion that balance is supports conclusion that balance is properly stated when it really isn’tproperly stated when it really isn’t

APIPA 2009APIPA 2009 77
WHICH RISK POSES THE WHICH RISK POSES THE GREATER DANGER TO AN GREATER DANGER TO AN AUDITOR?AUDITOR?
Risk of incorrect rejectionRisk of incorrect rejection EfficiencyEfficiency
Risk of incorrect acceptanceRisk of incorrect acceptance EffectivenessEffectiveness
Auditor focus on Type IIAuditor focus on Type II Also provides coverage for Type IAlso provides coverage for Type I
APIPA 2009APIPA 2009 88
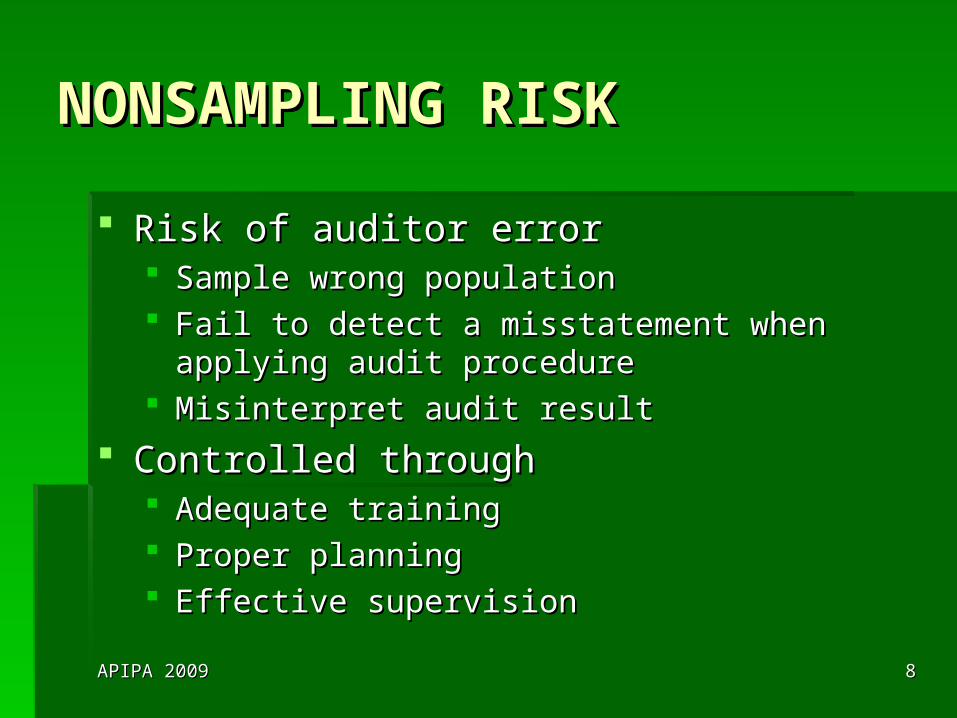
NONSAMPLING RISKNONSAMPLING RISK
Risk of auditor errorRisk of auditor error Sample wrong populationSample wrong population Fail to detect a misstatement when applying audit Fail to detect a misstatement when applying audit
procedureprocedure Misinterpret audit resultMisinterpret audit result
Controlled through Controlled through Adequate trainingAdequate training Proper planningProper planning Effective supervisionEffective supervision

APIPA 2009APIPA 2009 99
SAMPLE SIZE FACTORSSAMPLE SIZE FACTORS
Desired level of assurance Desired level of assurance (confidence level)(confidence level)
Acceptable defect rate (tolerable Acceptable defect rate (tolerable error)error)
Historical defect rate (expected Historical defect rate (expected error)error)

APIPA 2009APIPA 2009 1010
CONFIDENCE LEVELCONFIDENCE LEVEL
Complement of sampling riskComplement of sampling risk 5% sampling risk, 95% confidence level5% sampling risk, 95% confidence level
How much reliance will be placed on test How much reliance will be placed on test resultsresults
The greater the reliance and the more severe The greater the reliance and the more severe the consequences of Type II error, the higher the consequences of Type II error, the higher the confidence level neededthe confidence level needed
Sample size increases with confidence level Sample size increases with confidence level (decreases with sampling risk)(decreases with sampling risk)
APIPA 2009APIPA 2009 1111
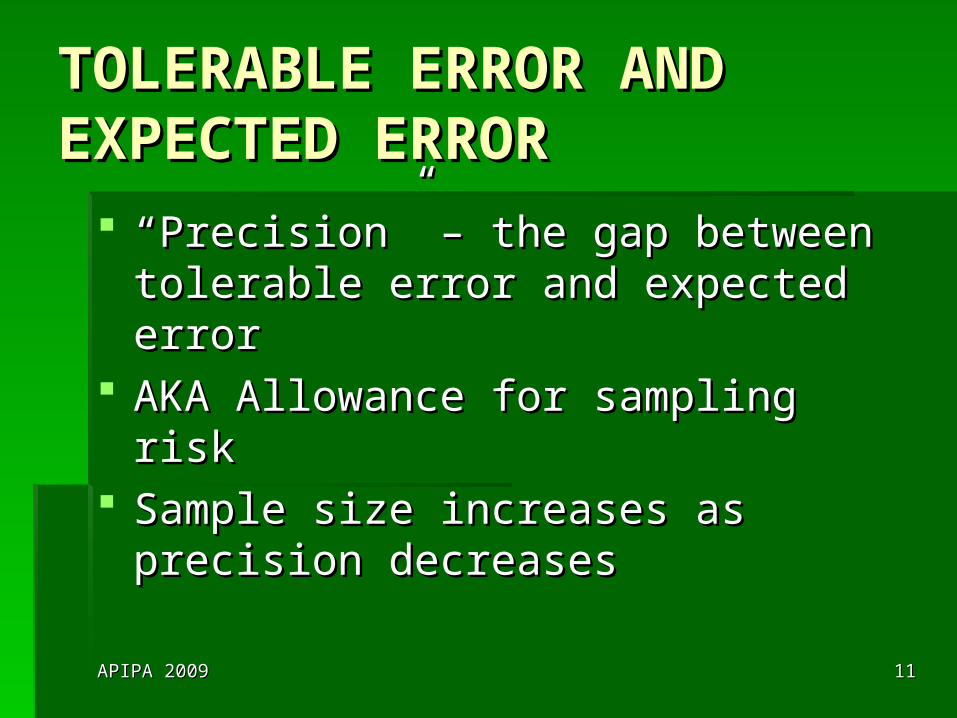
TOLERABLE ERROR AND TOLERABLE ERROR AND EXPECTED ERROREXPECTED ERROR
““Precision” – the gap between tolerable Precision” – the gap between tolerable error and expected errorerror and expected error
AKA Allowance for sampling riskAKA Allowance for sampling risk Sample size increases as precision Sample size increases as precision
decreasesdecreases

APIPA 2009APIPA 2009 1212
WHEN DO YOU SAMPLE?WHEN DO YOU SAMPLE?
Inspection of tangible assets, e.g., Inspection of tangible assets, e.g., inventory observationinventory observation
Inspection of records or documents, e.g., Inspection of records or documents, e.g., internal control testinginternal control testing
Reperformance, e.g., internal control Reperformance, e.g., internal control testingtesting
Confirmation, e.g., verification of AR Confirmation, e.g., verification of AR balancesbalances
APIPA 2009APIPA 2009 1313
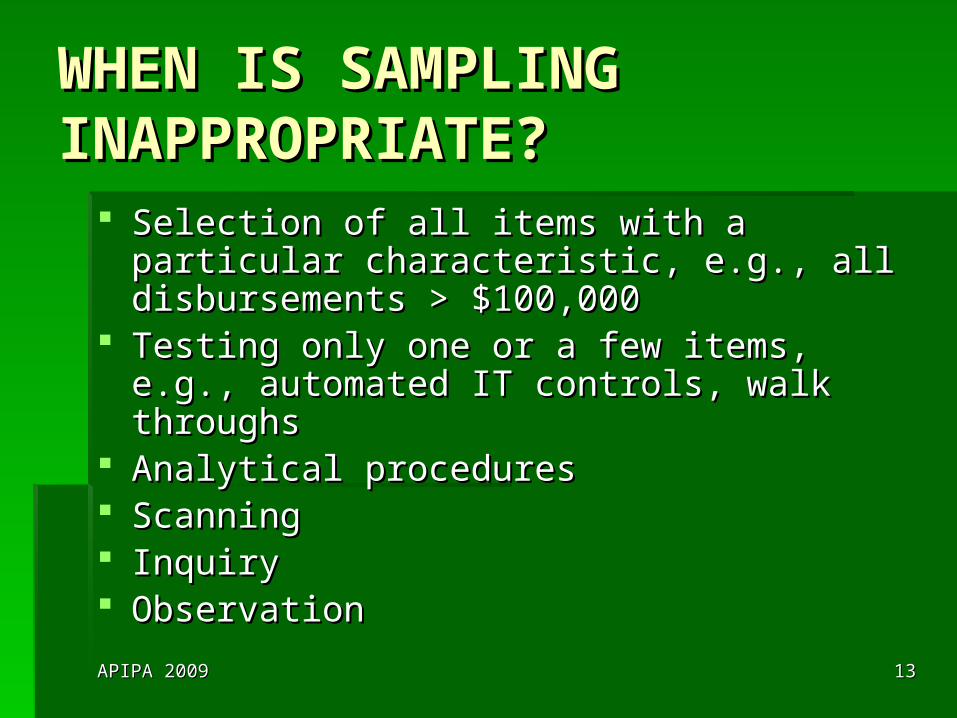
WHEN IS SAMPLING WHEN IS SAMPLING INAPPROPRIATE?INAPPROPRIATE?
Selection of all items with a particular Selection of all items with a particular characteristic, e.g., all disbursements > characteristic, e.g., all disbursements > $100,000$100,000
Testing only one or a few items, e.g., Testing only one or a few items, e.g., automated IT controls, walk throughsautomated IT controls, walk throughs
Analytical proceduresAnalytical procedures ScanningScanning InquiryInquiry ObservationObservation

APIPA 2009APIPA 2009 1414
WALKTHROUGHSWALKTHROUGHS
Designed to provide evidence regarding the Designed to provide evidence regarding the design and implementation of controlsdesign and implementation of controls
Can provide some assurance of operating Can provide some assurance of operating effectiveness BUTeffectiveness BUT Depends on nature of control (automated or Depends on nature of control (automated or
manual)manual) Depends on nature of auditor’s procedures to test Depends on nature of auditor’s procedures to test
control (also includes inquiry and observation control (also includes inquiry and observation combined with strong control environment and combined with strong control environment and adequate monitoring)adequate monitoring)
Walkthough = sample of 1Walkthough = sample of 1

APIPA 2009APIPA 2009 1515
STATISTICAL VS STATISTICAL VS NONSTATISTICAL SAMPLINGNONSTATISTICAL SAMPLING
Statistical samplingStatistical sampling Statistical computation of sample sizeStatistical computation of sample size Statistical evaluation of resultsStatistical evaluation of results
Nonstatistical samplingNonstatistical sampling Sample sizes should be approximately the Sample sizes should be approximately the
same (AU 350.22)same (AU 350.22) Sample sizes must be sufficient to support Sample sizes must be sufficient to support
reliance on controls and assertions being reliance on controls and assertions being testedtested

APIPA 2009APIPA 2009 1616
WHEN IS SAMPLING WHEN IS SAMPLING NONSTATISTICAL?NONSTATISTICAL?
If sample size determined judgmentallyIf sample size determined judgmentally If sample selected haphazardlyIf sample selected haphazardly If sample results evaluated judgmentallyIf sample results evaluated judgmentally

APIPA 2009APIPA 2009 1717
TYPES OF SAMPLINGTYPES OF SAMPLING
Attribute samplingAttribute sampling Monetary unit samplingMonetary unit sampling Classical variables samplingClassical variables sampling
APIPA 2009APIPA 2009 1818
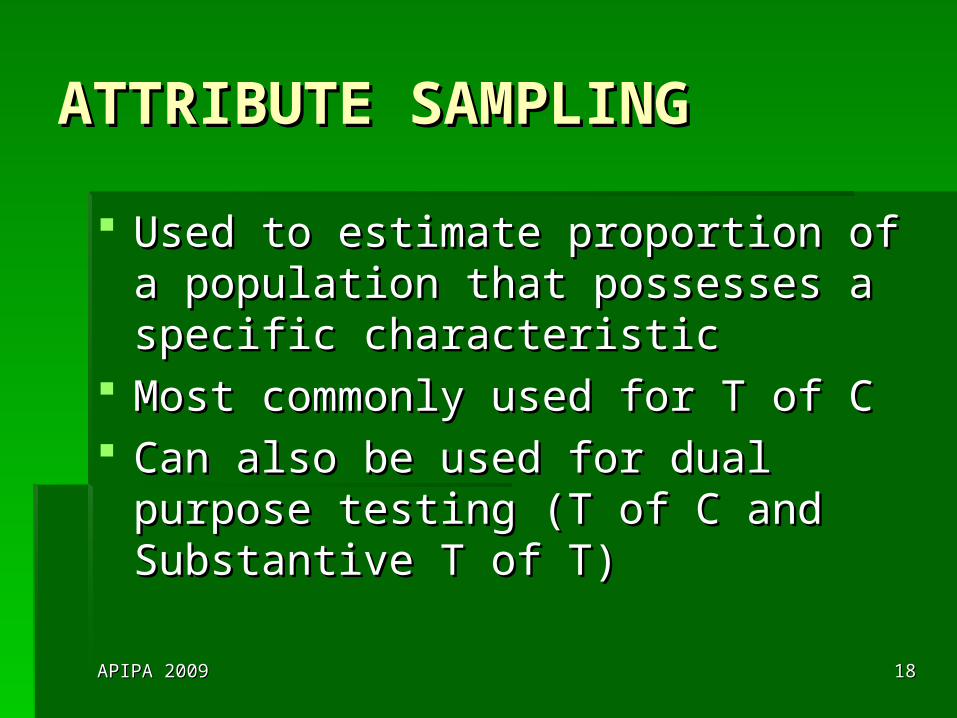
ATTRIBUTE SAMPLINGATTRIBUTE SAMPLING
Used to estimate proportion of a Used to estimate proportion of a population that possesses a specific population that possesses a specific characteristiccharacteristic
Most commonly used for T of CMost commonly used for T of C Can also be used for dual purpose Can also be used for dual purpose
testing (T of C and Substantive T of T)testing (T of C and Substantive T of T)

APIPA 2009APIPA 2009 1919
MONETARY-UNIT MONETARY-UNIT SAMPLINGSAMPLING
AKA probability proportional to size AKA probability proportional to size (PPS) sampling, cumulative monetary (PPS) sampling, cumulative monetary unit samplingunit sampling
Used to estimate dollar amount of Used to estimate dollar amount of misstatementmisstatement
APIPA 2009APIPA 2009 2020
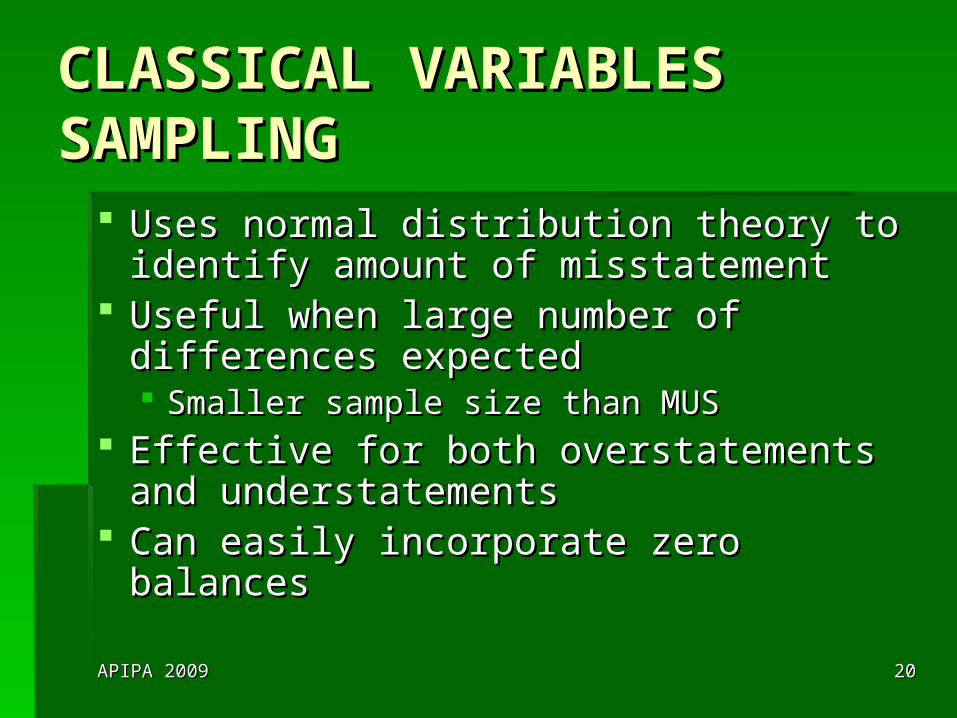
CLASSICAL VARIABLES CLASSICAL VARIABLES SAMPLINGSAMPLING
Uses normal distribution theory to identify Uses normal distribution theory to identify amount of misstatementamount of misstatement
Useful when large number of differences Useful when large number of differences expectedexpected Smaller sample size than MUSSmaller sample size than MUS
Effective for both overstatements and Effective for both overstatements and understatementsunderstatements
Can easily incorporate zero balancesCan easily incorporate zero balances

APIPA 2009APIPA 2009 2121
IN-CLASS EXERCISE IN-CLASS EXERCISE NO. 1 NO. 1

APIPA 2009APIPA 2009 2222
IN-CLASS EXERCISE IN-CLASS EXERCISE NO. 1NO. 1
TestTest Involves Involves Sampling?Sampling?
Attribute / Variable / MUS / NAAttribute / Variable / MUS / NA
11 YesYes Attribute (ST of T)Attribute (ST of T)
22 NoNo NANA
33 YesYes Attribute (T of C)Attribute (T of C)
44 NoNo NANA
55 NoNo NA (Could be MUS if large NA (Could be MUS if large population)population)
66 NoNo NANA

APIPA 2009APIPA 2009 2323
IN-CLASS EXERCISE IN-CLASS EXERCISE NO. 1NO. 1
TestTest Involves Involves Sampling?Sampling?
Attribute / Variable / MUS / NAAttribute / Variable / MUS / NA
77 YesYes Attribute (T of C)Attribute (T of C)
88 YesYes MUSMUS
99 NoNo NANA
1010 YesYes Attribute (T of C/ST of T)Attribute (T of C/ST of T)
1111 NoNo NANA
APIPA 2009APIPA 2009 2424
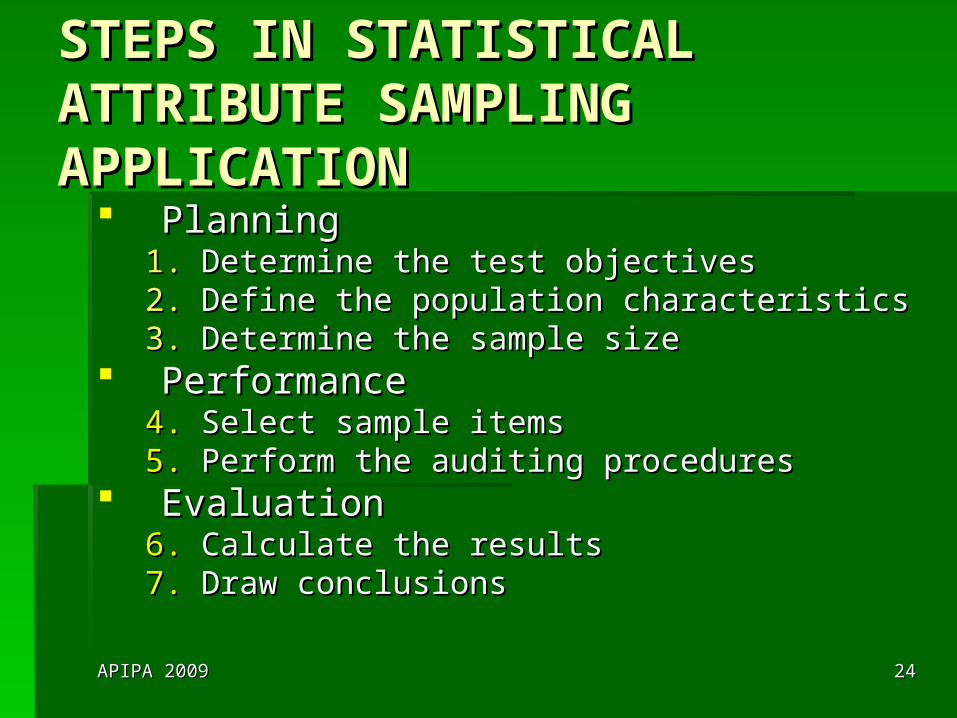
STEPS IN STATISTICAL STEPS IN STATISTICAL ATTRIBUTE SAMPLING ATTRIBUTE SAMPLING APPLICATIONAPPLICATION
PlanningPlanning1.1. Determine the test objectivesDetermine the test objectives2.2. Define the population characteristicsDefine the population characteristics3.3. Determine the sample sizeDetermine the sample size
PerformancePerformance4.4. Select sample itemsSelect sample items5.5. Perform the auditing proceduresPerform the auditing procedures
EvaluationEvaluation6.6. Calculate the resultsCalculate the results7.7. Draw conclusionsDraw conclusions

APIPA 2009APIPA 2009 2525
STEP 1: DETERMINE THE STEP 1: DETERMINE THE TEST OBJECTIVESTEST OBJECTIVES
Objective for T of CObjective for T of C: To determine the : To determine the operating effectiveness of the internal operating effectiveness of the internal controlcontrol Support control risk assessment below Support control risk assessment below
maximummaximum
Identify controls to be tested and Identify controls to be tested and understand why they are to be testedunderstand why they are to be tested

APIPA 2009APIPA 2009 2626
TESTS OF CONTROLSTESTS OF CONTROLS
Concerned primarily withConcerned primarily with Were the necessary controls performed?Were the necessary controls performed? How were they performed?How were they performed? By whom were they performed?By whom were they performed?
Appropriate when documentary evidence Appropriate when documentary evidence of performance existsof performance exists

APIPA 2009APIPA 2009 2727
STEP 2: DEFINE THE STEP 2: DEFINE THE POPULATION POPULATION CHARACTERISTICSCHARACTERISTICS
Define the sampling populationDefine the sampling population AssertionAssertion CompletenessCompleteness
Define the sampling unitDefine the sampling unit Determined by available recordsDetermined by available records
Define the control deviation conditionsDefine the control deviation conditions
APIPA 2009APIPA 2009 2828
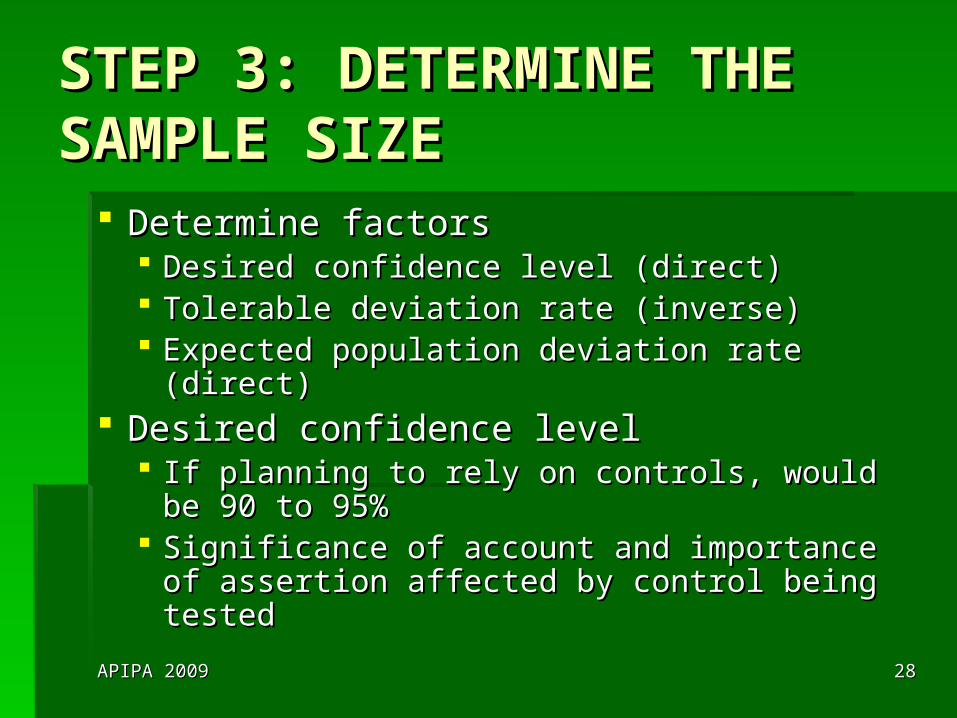
STEP 3: DETERMINE THE STEP 3: DETERMINE THE SAMPLE SIZESAMPLE SIZE
Determine factorsDetermine factors Desired confidence level (direct)Desired confidence level (direct) Tolerable deviation rate (inverse)Tolerable deviation rate (inverse) Expected population deviation rate (direct)Expected population deviation rate (direct)
Desired confidence levelDesired confidence level If planning to rely on controls, would be 90 to If planning to rely on controls, would be 90 to
95%95% Significance of account and importance of Significance of account and importance of
assertion affected by control being testedassertion affected by control being tested

APIPA 2009APIPA 2009 2929
STEP 3: DETERMINE THE STEP 3: DETERMINE THE SAMPLE SIZESAMPLE SIZE
Tolerable deviation rateTolerable deviation rate Maximum deviation rate that auditor willing to Maximum deviation rate that auditor willing to
accept and still consider control effectiveaccept and still consider control effective Control would be relied uponControl would be relied upon
Why any errors acceptable?Why any errors acceptable? Control deviation = MisstatementControl deviation = Misstatement
Assessed importance of controlAssessed importance of control Tolerable Tolerable deviation ratedeviation rate
Highly importantHighly important 3-5%3-5%
Moderately importantModerately important 6-10%6-10%

APIPA 2009APIPA 2009 3030
STEP 3: DETERMINE THE STEP 3: DETERMINE THE SAMPLE SIZESAMPLE SIZE
Expected population deviation rateExpected population deviation rate Rate expected to exist in populationRate expected to exist in population Based on prior years’ results or pilot sampleBased on prior years’ results or pilot sample If expected population deviation rate > If expected population deviation rate >
tolerable rate, DO NOT TESTtolerable rate, DO NOT TEST
SAMPLE SIZE TABLESSAMPLE SIZE TABLES

APIPA 2009APIPA 2009 3131
STEP 3: DETERMINE THE STEP 3: DETERMINE THE SAMPLE SIZESAMPLE SIZE
Testing multiple attributes on the same Testing multiple attributes on the same samplesample Select largest sample size and audit all of Select largest sample size and audit all of
them for all attributesthem for all attributes Result is some overauditing BUT may take Result is some overauditing BUT may take
less time than trying to remember which less time than trying to remember which sample items need to be tested for which sample items need to be tested for which attribute attribute

APIPA 2009APIPA 2009 3232
FINITE POPULATION FINITE POPULATION CORRECTION FACTORCORRECTION FACTOR
When population size < 500When population size < 500 Apply finite population correction factorApply finite population correction factor
√√1-(n/N)1-(n/N) Where n = sample size from table and N = Where n = sample size from table and N =
number of units in populationnumber of units in population

APIPA 2009APIPA 2009 3333
STEP 4: SELECT THE STEP 4: SELECT THE SAMPLE ITEMSSAMPLE ITEMS
Sample must be selected to be Sample must be selected to be representative of the populationrepresentative of the population
Each item must have an equal Each item must have an equal opportunity of being selectedopportunity of being selected

APIPA 2009APIPA 2009 3434
STEP 4: SELECT THE STEP 4: SELECT THE SAMPLE ITEMSSAMPLE ITEMS
Random number selectionRandom number selection Unrestricted random sampling without Unrestricted random sampling without
replacement (once selected cannot be replacement (once selected cannot be selected again)selected again)
APIPA 2009APIPA 2009 3535
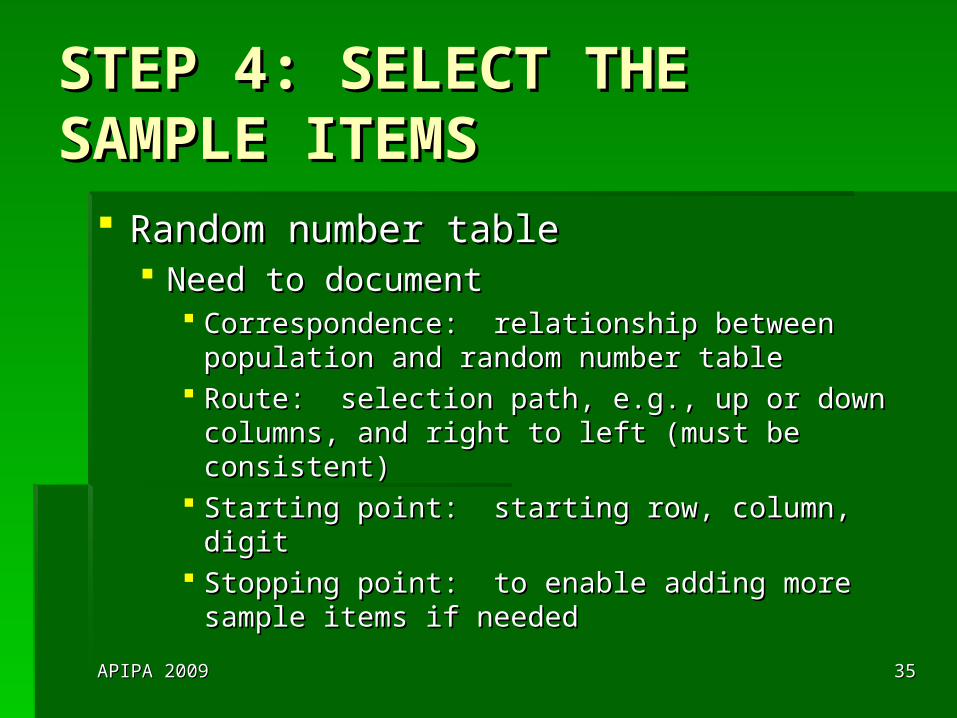
STEP 4: SELECT THE STEP 4: SELECT THE SAMPLE ITEMSSAMPLE ITEMS
Random number tableRandom number table Need to documentNeed to document
Correspondence: relationship between Correspondence: relationship between population and random number tablepopulation and random number table
Route: selection path, e.g., up or down columns, Route: selection path, e.g., up or down columns, and right to left (must be consistent)and right to left (must be consistent)
Starting point: starting row, column, digitStarting point: starting row, column, digit Stopping point: to enable adding more sample Stopping point: to enable adding more sample
items if neededitems if needed

APIPA 2009APIPA 2009 3636
RANDOM NUMBER TABLE RANDOM NUMBER TABLE ILLUSTRATIONILLUSTRATION
Select a sample of 4 items from prenumbered Select a sample of 4 items from prenumbered canceled checks numbered from 1 to 500. canceled checks numbered from 1 to 500. Start at row 5, column 1, digit starting position Start at row 5, column 1, digit starting position 1. Select three-digit numbers. Items selected 1. Select three-digit numbers. Items selected are:are: 145 (sample item #1)145 (sample item #1) 516 (discard because checks numbers do not 516 (discard because checks numbers do not
exceed 500)exceed 500) 032 (sample item #2)032 (sample item #2) 246 (sample item #3)246 (sample item #3) 840 (discard)181 (sample item #4)840 (discard)181 (sample item #4)

APIPA 2009APIPA 2009 3737
RANDOM NUMBER TABLE RANDOM NUMBER TABLE ILLUSTRATIONILLUSTRATION
To minimize discards, table numbers > 500 can To minimize discards, table numbers > 500 can be reduced by 500 to produce a sample item be reduced by 500 to produce a sample item within the population boundary of 1 to 500. The within the population boundary of 1 to 500. The four sample items selected are:four sample items selected are: 145 (sample item #1)145 (sample item #1) 016 (sample item #2 = 516 – 500 = 016)016 (sample item #2 = 516 – 500 = 016) 032 (sample item #2)032 (sample item #2) 246 (sample item #3)246 (sample item #3) 340 (sample item #4 = 840 – 500 = 340)340 (sample item #4 = 840 – 500 = 340)

APIPA 2009APIPA 2009 3838
RANDOM NUMBER TABLE RANDOM NUMBER TABLE ILLUSTRATIONILLUSTRATION
Select 4 sales invoices numbered from 5000 to Select 4 sales invoices numbered from 5000 to 12000. Start at row 21, column 2, digit starting 12000. Start at row 21, column 2, digit starting point 1. Rather than use a 5-digit number, point 1. Rather than use a 5-digit number, which produces a large number of discards, which produces a large number of discards, add a constant to get a population with 4 digits. add a constant to get a population with 4 digits. If a constant of 3000 is used, the usable If a constant of 3000 is used, the usable numbers selected from 2000 to 9000 are:numbers selected from 2000 to 9000 are: 6,043 (sample item #1 = 3043 + 3000)6,043 (sample item #1 = 3043 + 3000) 10,120 (sample item #2 = 7120 + 3000)10,120 (sample item #2 = 7120 + 3000) 10,212 (sample item #3 = 7212 + 3000)10,212 (sample item #3 = 7212 + 3000) 5,259 (sample item #4 = 2259 + 3000)5,259 (sample item #4 = 2259 + 3000)
APIPA 2009APIPA 2009 3939
STEP 4: SELECT THE STEP 4: SELECT THE SAMPLE ITEMS - EXCELSAMPLE ITEMS - EXCEL
Excel Excel Select ToolsSelect Tools Select Data AnalysisSelect Data Analysis Select SamplingSelect Sampling

APIPA 2009APIPA 2009 4040
STEP 4: SELECT THE STEP 4: SELECT THE SAMPLE ITEMS - EXCELSAMPLE ITEMS - EXCEL

APIPA 2009APIPA 2009 4141
STEP 4: SELECT THE STEP 4: SELECT THE SAMPLE ITEMSSAMPLE ITEMS
Input RangeInput Range Enter the references for the range of data that contains the population of Enter the references for the range of data that contains the population of
values you want to sample. Microsoft Excel draws samples from the first values you want to sample. Microsoft Excel draws samples from the first column, then the second column, and so on.column, then the second column, and so on.
LabelsLabels Select if the first row or column of your input range contains labels. Clear Select if the first row or column of your input range contains labels. Clear
if your input range has no labels; Excel generates appropriate data labels if your input range has no labels; Excel generates appropriate data labels for the output table.for the output table.
Sampling MethodSampling Method Click Click PeriodicPeriodic or or RandomRandom to indicate the sampling interval you want. to indicate the sampling interval you want. PeriodPeriod Enter the periodic interval at which you want sampling to take place. The Enter the periodic interval at which you want sampling to take place. The
periodperiod-th value in the input range and every -th value in the input range and every periodperiod-th value thereafter is -th value thereafter is copied to the output column. Sampling stops when the end of the input copied to the output column. Sampling stops when the end of the input range is reached.range is reached.

APIPA 2009APIPA 2009 4242
STEP 4: SELECT THE STEP 4: SELECT THE SAMPLE ITEMSSAMPLE ITEMS
Number of SamplesNumber of Samples Enter the number of random values you want in the Enter the number of random values you want in the
output column. Each value is drawn from a random output column. Each value is drawn from a random position in the input range, and position in the input range, and any number can be any number can be selected more than onceselected more than once..
Output RangeOutput Range Enter the reference for the upper-left cell of the output Enter the reference for the upper-left cell of the output
table. Data is written in a single column below the cell. table. Data is written in a single column below the cell. If you select If you select PeriodicPeriodic, the number of values in the , the number of values in the output table is equal to the number of values in the output table is equal to the number of values in the input range, divided by the sampling rate. If you select input range, divided by the sampling rate. If you select RandomRandom, the number of values in the output table is , the number of values in the output table is equal to the number of samples.equal to the number of samples.

APIPA 2009APIPA 2009 4343
STEP 4: SELECT THE STEP 4: SELECT THE SAMPLE ITEMSSAMPLE ITEMS
Systematic selectionSystematic selection Determine sampling interval = Population / Sample Determine sampling interval = Population / Sample
SizeSize Ensure population is in random orderEnsure population is in random order Select random starting number (within first interval)Select random starting number (within first interval)
Better to use multiple random starting points to reduce risk Better to use multiple random starting points to reduce risk of missing systematic deviationsof missing systematic deviations
Select every nth itemSelect every nth item Continue sample selection until population is Continue sample selection until population is
exhausted exhausted (Last sample selected + sampling interval) > Last item in (Last sample selected + sampling interval) > Last item in
populationpopulation In other words, don’t stop when desired sample size In other words, don’t stop when desired sample size
reachedreached

APIPA 2009APIPA 2009 4444
STEP 5: PERFORM THE STEP 5: PERFORM THE AUDITING PROCEDURESAUDITING PROCEDURES
Conduct planned audit proceduresConduct planned audit procedures What if?What if?
Voided documents - if properly voided, not a Voided documents - if properly voided, not a deviation; replace with new sample itemdeviation; replace with new sample item
Unused or inapplicable documents – replace Unused or inapplicable documents – replace with new sample itemwith new sample item
Inability to examine sample item – deviationInability to examine sample item – deviation Stopping test before completion – large Stopping test before completion – large
number of deviations detectednumber of deviations detected

APIPA 2009APIPA 2009 4545
STEP 5: PERFORM THE STEP 5: PERFORM THE AUDITING PROCEDURESAUDITING PROCEDURES
Deviations observedDeviations observed Investigate nature, cause, and consequence Investigate nature, cause, and consequence
of every exceptionof every exception Unintentional error? Or fraud?Unintentional error? Or fraud? Monetary misstatement resulted?Monetary misstatement resulted? Cause – misunderstanding of instructions? Cause – misunderstanding of instructions?
Carelessness?Carelessness? Effect on other areas?Effect on other areas?

APIPA 2009APIPA 2009 4646
STEP 6: CALCULATE STEP 6: CALCULATE RESULTSRESULTS
Summarize deviations for each controlSummarize deviations for each control Calculate sample deviation rate and Calculate sample deviation rate and
computed upper deviation ratecomputed upper deviation rate Sample deviation rate + Allowance for Sample deviation rate + Allowance for
sampling risk = Computed upper deviation sampling risk = Computed upper deviation raterate
Statistical sampling results evaluation tablesStatistical sampling results evaluation tables

APIPA 2009APIPA 2009 4747
STEP 7: DRAW STEP 7: DRAW CONCLUSIONSCONCLUSIONS
If Computed Upper Deviation Rate > If Computed Upper Deviation Rate > Tolerable Rate, control is ineffective and Tolerable Rate, control is ineffective and cannot be relied upon.cannot be relied upon.
If Computed Upper Deviation Rate < If Computed Upper Deviation Rate < Tolerable Rate, control is effectiveTolerable Rate, control is effective

APIPA 2009APIPA 2009 4848
EVALUATION OF EVALUATION OF EXPOSUREEXPOSURE
In a sample of 25 manual control In a sample of 25 manual control operations from a population of 3,000 operations from a population of 3,000 control operations, 1 deviation was control operations, 1 deviation was identified. The sample was designed with identified. The sample was designed with an expectation that 0 deviations would be an expectation that 0 deviations would be found.found.
Looking up the results (in 90% Looking up the results (in 90% confidence level table): Computed upper confidence level table): Computed upper error limit = 14.7%error limit = 14.7%
APIPA 2009APIPA 2009 4949
EVALUATION OF EVALUATION OF EXPOSUREEXPOSURE
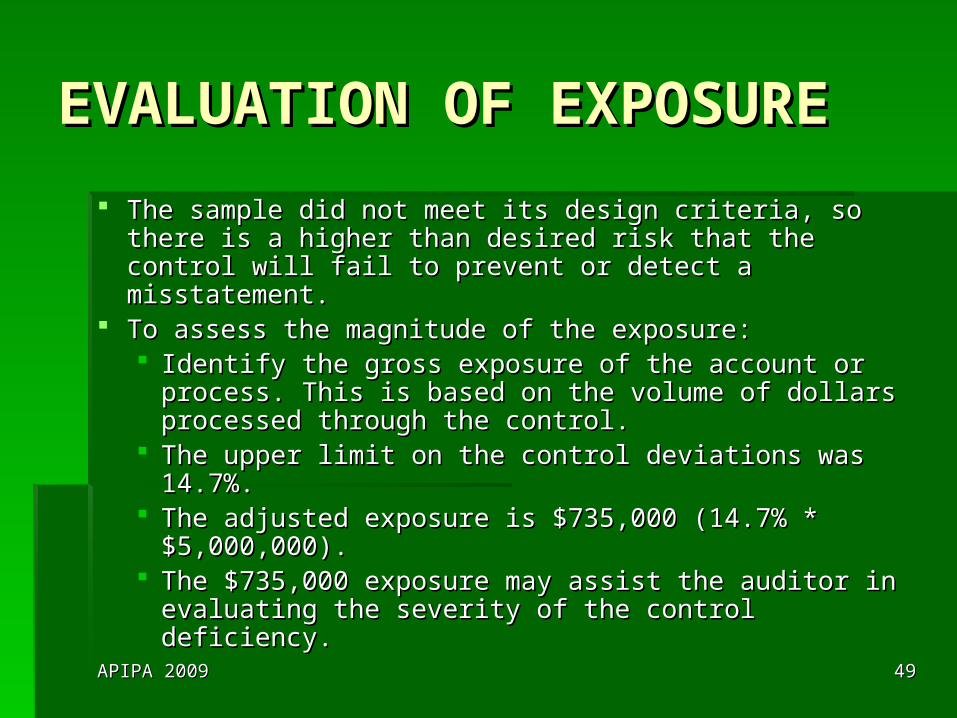
The sample did not meet its design criteria, so there is The sample did not meet its design criteria, so there is a higher than desired risk that the control will fail to a higher than desired risk that the control will fail to prevent or detect a misstatement.prevent or detect a misstatement.
To assess the magnitude of the exposure:To assess the magnitude of the exposure: Identify the gross exposure of the account or Identify the gross exposure of the account or
process. This is based on the volume of dollars process. This is based on the volume of dollars processed through the control.processed through the control.
The upper limit on the control deviations was 14.7%.The upper limit on the control deviations was 14.7%. The adjusted exposure is $735,000 (14.7% * The adjusted exposure is $735,000 (14.7% *
$5,000,000).$5,000,000). The $735,000 exposure may assist the auditor in The $735,000 exposure may assist the auditor in
evaluating the severity of the control deficiency.evaluating the severity of the control deficiency.

APIPA 2009APIPA 2009 5050
IN-CLASS EXERCISES IN-CLASS EXERCISES NO. 2 & NO. 3NO. 2 & NO. 3
APIPA 2009APIPA 2009 5151
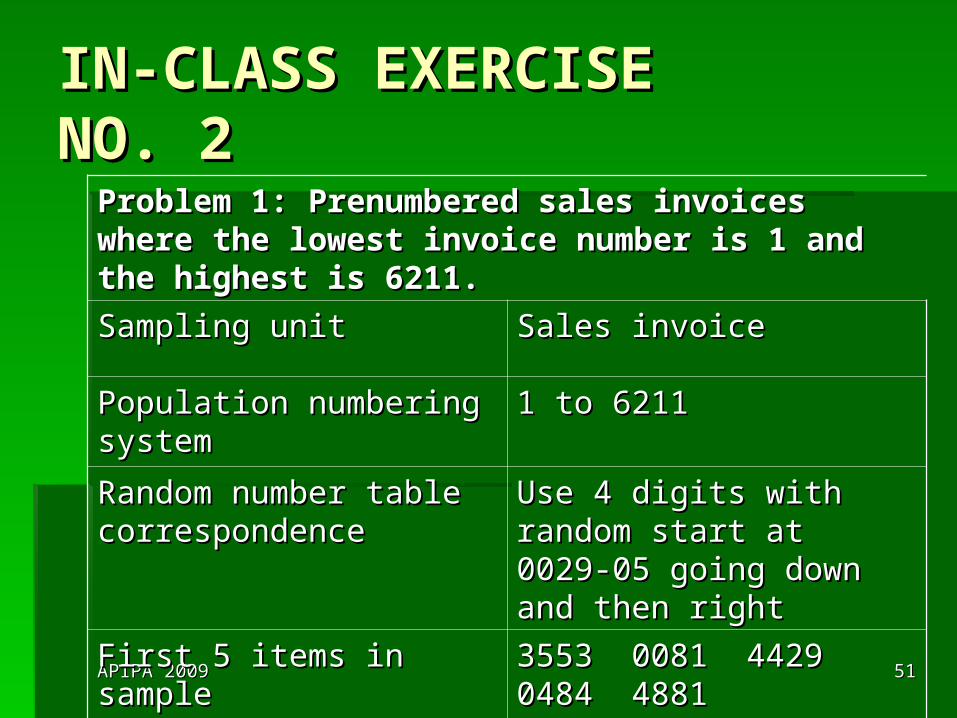
IN-CLASS EXERCISE IN-CLASS EXERCISE NO. 2NO. 2
Problem 1: Prenumbered sales invoices where the Problem 1: Prenumbered sales invoices where the lowest invoice number is 1 and the highest is 6211.lowest invoice number is 1 and the highest is 6211.
Sampling unitSampling unit Sales invoiceSales invoice
Population numbering Population numbering systemsystem
1 to 62111 to 6211
Random number table Random number table correspondencecorrespondence
Use 4 digits with random Use 4 digits with random start at 0029-05 going down start at 0029-05 going down and then rightand then right
First 5 items in sampleFirst 5 items in sample 3553 0081 4429 0484 3553 0081 4429 0484 48814881
APIPA 2009APIPA 2009 5252
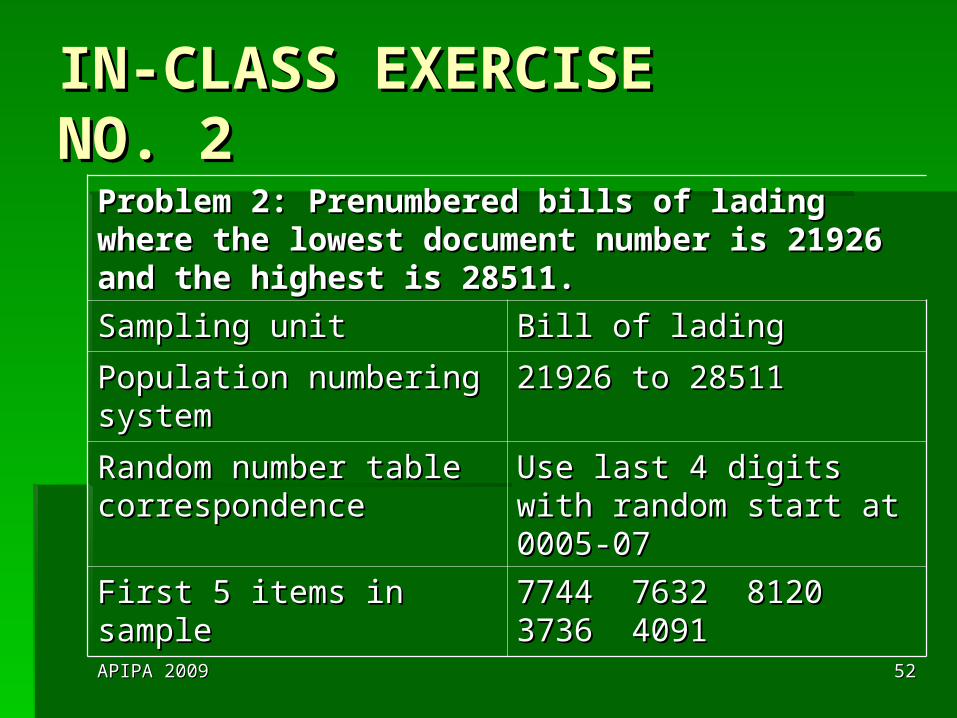
IN-CLASS EXERCISE IN-CLASS EXERCISE NO. 2NO. 2
Problem 2: Prenumbered bills of lading where the Problem 2: Prenumbered bills of lading where the lowest document number is 21926 and the highest is lowest document number is 21926 and the highest is 28511.28511.
Sampling unitSampling unit Bill of ladingBill of lading
Population numbering Population numbering systemsystem
21926 to 2851121926 to 28511
Random number table Random number table correspondencecorrespondence
Use last 4 digits with Use last 4 digits with random start at 0005-07random start at 0005-07
First 5 items in sampleFirst 5 items in sample 7744 7632 8120 3736 7744 7632 8120 3736 40914091

APIPA 2009APIPA 2009 5353
IN-CLASS EXERCISE IN-CLASS EXERCISE NO. 2NO. 2
Problem 3: Accounts Receivable on 10 pages with 60 lines per Problem 3: Accounts Receivable on 10 pages with 60 lines per page except the last page, which has only 36 full lines. Each page except the last page, which has only 36 full lines. Each line has a customer name and an amount receivable.line has a customer name and an amount receivable.
Sampling unitSampling unit Each lineEach line
Population numbering Population numbering systemsystem
9 * 60 = 540 + 36 = 576 9 * 60 = 540 + 36 = 576 lineslines
Add 2000 (2001 to 2576)Add 2000 (2001 to 2576)
Random number table Random number table correspondencecorrespondence
Use last 4 digits with Use last 4 digits with random start at 00040-01 random start at 00040-01 going down and then rightgoing down and then right
First 5 items in sampleFirst 5 items in sample 2240 2055 2094 2087 2240 2055 2094 2087 26082608

APIPA 2009APIPA 2009 5454
IN-CLASS EXERCISE IN-CLASS EXERCISE NO. 2NO. 2
Problem 4: Prenumbered invoices in a sales journal where each month Problem 4: Prenumbered invoices in a sales journal where each month starts over with number 1. (Invoices for each month are designated by starts over with number 1. (Invoices for each month are designated by the month and document number.) There is a maximum of 20 pages the month and document number.) There is a maximum of 20 pages per month with a total of 185 pages for the year. All pages have 75 per month with a total of 185 pages for the year. All pages have 75 invoices except for the last page for each month.invoices except for the last page for each month.
Sampling unitSampling unit Page of invoicesPage of invoices
Population numbering systemPopulation numbering system Starting with January, first page is Starting with January, first page is 1 (up to 185)1 (up to 185)
Random number table Random number table correspondencecorrespondence
Random start at 0008-03 going Random start at 0008-03 going down then right, subtract random down then right, subtract random number from next 1000number from next 1000
First 5 items in sampleFirst 5 items in sample 4000 – 3982 = 18; 7000 – 6847 = 4000 – 3982 = 18; 7000 – 6847 = 153; 5000 - 4956 = 44; 6000 – 153; 5000 - 4956 = 44; 6000 – 5985 = 15; 5000 – 4941 = 595985 = 15; 5000 – 4941 = 59

APIPA 2009APIPA 2009 5555
IN-CLASS EXERCISE IN-CLASS EXERCISE NO. 3NO. 3
For which of these auditing procedures can For which of these auditing procedures can attribute sampling be conveniently used?attribute sampling be conveniently used?
11 NoNo
22 NoNo
33 NoNo
44 YesYes
5a5a YesYes
5b5b YesYes

APIPA 2009APIPA 2009 5656
IN-CLASS EXERCISE IN-CLASS EXERCISE NO. 3NO. 3
For which of these auditing procedures can For which of these auditing procedures can attribute sampling be conveniently used?attribute sampling be conveniently used?
5c5c YesYes
5d5d YesYes
5e5e YesYes
66 YesYes

APIPA 2009APIPA 2009 5757
IN-CLASS EXERCISE IN-CLASS EXERCISE NO. 3NO. 3
2. Considering the audit procedures to be 2. Considering the audit procedures to be performed, what is the most appropriate performed, what is the most appropriate sampling unit for conducting most of the audit sampling unit for conducting most of the audit sampling tests?sampling tests?
Sales invoiceSales invoice

APIPA 2009APIPA 2009 5858
IN-CLASS EXERCISE IN-CLASS EXERCISE NO. 3NO. 3
For each T of C or ST of T, identify the attribute For each T of C or ST of T, identify the attribute being tested and the exception condition.being tested and the exception condition.
AttributeAttribute Exception ConditionException Condition
4. Existence of the sales 4. Existence of the sales invoice number in the invoice number in the sales journalsales journal
No record of the sales No record of the sales invoice number in the invoice number in the sales journalsales journal
5a. Amount and other 5a. Amount and other data in MF agree with data in MF agree with the sales journal entrythe sales journal entry
The amount recorded in The amount recorded in the MF differs from the the MF differs from the amount recorded in the amount recorded in the sales journal.sales journal.

APIPA 2009APIPA 2009 5959
IN-CLASS EXERCISE IN-CLASS EXERCISE NO. 3NO. 3
For each T of C or ST of T, identify the attribute For each T of C or ST of T, identify the attribute being tested and the exception condition.being tested and the exception condition.
AttributeAttribute Exception ConditionException Condition
5b. Amount and other 5b. Amount and other data on the duplicate data on the duplicate sales invoice agree with sales invoice agree with the sales journal entrythe sales journal entry
Customer name and Customer name and account number on the account number on the invoice differ from the invoice differ from the information recorded in the information recorded in the sales journalsales journal

APIPA 2009APIPA 2009 6060
IN-CLASS EXERCISE IN-CLASS EXERCISE NO. 3NO. 3
For each T of C or ST of T, identify the attribute For each T of C or ST of T, identify the attribute being tested and the exception condition.being tested and the exception condition.
AttributeAttribute Exception ConditionException Condition
5b. Evidence that 5b. Evidence that pricing, extensions, and pricing, extensions, and footings are checked footings are checked (initials and correct (initials and correct amounts).amounts).
Lack of initials indicating Lack of initials indicating verification of pricing, verification of pricing, extensions, and footings.extensions, and footings.

APIPA 2009APIPA 2009 6161
IN-CLASS EXERCISE IN-CLASS EXERCISE NO. 3NO. 3
For each T of C or ST of T, identify the attribute For each T of C or ST of T, identify the attribute being tested and the exception condition.being tested and the exception condition.
AttributeAttribute Exception ConditionException Condition
5c. Quantity and other 5c. Quantity and other data on the bill of lading data on the bill of lading agree with the duplicate agree with the duplicate sales invoice and sales sales invoice and sales journaljournal
Quantity of goods shipped Quantity of goods shipped differs from quantity on differs from quantity on sales invoicesales invoice

APIPA 2009APIPA 2009 6262
IN-CLASS EXERCISE IN-CLASS EXERCISE NO. 3NO. 3
For each T of C or ST of T, identify the attribute For each T of C or ST of T, identify the attribute being tested and the exception condition.being tested and the exception condition.
AttributeAttribute Exception ConditionException Condition
5d. Quantity and other 5d. Quantity and other data on the sales order data on the sales order agree with the duplicate agree with the duplicate sales invoicesales invoice
Quantity on the sales Quantity on the sales order differs from quantity order differs from quantity on the duplicate sales on the duplicate sales invoiceinvoice
5e. Quantity and other 5e. Quantity and other data on the customer data on the customer order agree with the order agree with the duplicate sales invoiceduplicate sales invoice
Product number and Product number and description on the description on the customer order differ from customer order differ from information on the information on the duplicate sales invoiceduplicate sales invoice

APIPA 2009APIPA 2009 6363
IN-CLASS EXERCISE IN-CLASS EXERCISE NO. 3NO. 3
For each T of C or ST of T, identify the attribute For each T of C or ST of T, identify the attribute being tested and the exception condition.being tested and the exception condition.
AttributeAttribute Exception ConditionException Condition
5e. Credit is approved5e. Credit is approved Lack of initials indicating Lack of initials indicating credit approvalcredit approval
6. For recorded sales in 6. For recorded sales in the sales journal, the file the sales journal, the file of supporting documents of supporting documents includes a duplicate includes a duplicate sales invoice, BL, sales sales invoice, BL, sales order, and customer order, and customer order.order.
BL is not attached to the BL is not attached to the duplicate sales invoice duplicate sales invoice and the customer order.and the customer order.
APIPA 2009APIPA 2009 6464
IN-CLASS EXERCISE IN-CLASS EXERCISE NO. 3NO. 3
See Solution

APIPA 2009APIPA 2009 6565
STEPS IN NONSTATISTICAL STEPS IN NONSTATISTICAL ATTRIBUTE SAMPLING ATTRIBUTE SAMPLING APPLICATIONAPPLICATION
PlanningPlanning1.1. Determine the test objectivesDetermine the test objectives2.2. Define the population characteristicsDefine the population characteristics3.3. Determine the sample sizeDetermine the sample size
PerformancePerformance4.4. Select sample itemsSelect sample items5.5. Perform the auditing proceduresPerform the auditing procedures
EvaluationEvaluation6.6. Calculate the resultsCalculate the results7.7. Draw conclusionsDraw conclusions
APIPA 2009APIPA 2009 6666
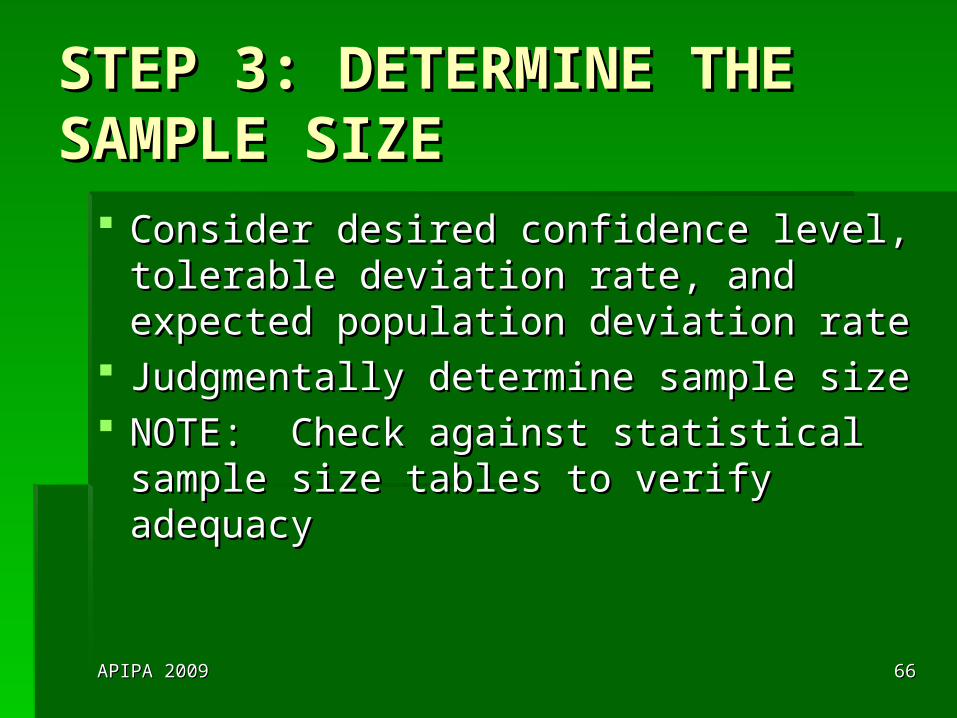
STEP 3: DETERMINE THE STEP 3: DETERMINE THE SAMPLE SIZESAMPLE SIZE
Consider desired confidence level, Consider desired confidence level, tolerable deviation rate, and expected tolerable deviation rate, and expected population deviation ratepopulation deviation rate
Judgmentally determine sample sizeJudgmentally determine sample size NOTE: Check against statistical sample NOTE: Check against statistical sample
size tables to verify adequacysize tables to verify adequacy

APIPA 2009APIPA 2009 6767
STEP 3: DETERMINE THE STEP 3: DETERMINE THE SAMPLE SIZESAMPLE SIZE
Guidelines for nonstatistical sample sizes for tests Guidelines for nonstatistical sample sizes for tests of controlsof controls
If any errors found, increase sample size or If any errors found, increase sample size or increase control riskincrease control risk
Desired level of controls relianceDesired level of controls reliance Sample sizeSample size
LowLow 15-2015-20
ModerateModerate 25-3525-35
HighHigh 40-6040-60

APIPA 2009APIPA 2009 6868
STEP 4: SELECT SAMPLE STEP 4: SELECT SAMPLE ITEMSITEMS
Random sampleRandom sample Systematic sample (with random start)Systematic sample (with random start) Haphazard selectionHaphazard selection
Still desire representative sampleStill desire representative sample Avoid unusual, large, first or lastAvoid unusual, large, first or last

APIPA 2009APIPA 2009 6969
STEP 6: CALCULATE THE STEP 6: CALCULATE THE RESULTSRESULTS
No computed upper deviation rateNo computed upper deviation rate If sample deviation rate > expected If sample deviation rate > expected
population deviation rate, control not population deviation rate, control not effectiveeffective

APIPA 2009APIPA 2009 7070
COMPLIANCE AUDITINGCOMPLIANCE AUDITING
Performance of auditing procedures to Performance of auditing procedures to determine whether an entity is complying with determine whether an entity is complying with specific requirements of laws, regulations, or specific requirements of laws, regulations, or agreementsagreements
Governmental entities and other recipients of Governmental entities and other recipients of governmental financial assistancegovernmental financial assistance Compliance with laws and regulations that materially Compliance with laws and regulations that materially
affect each major federal assistance programaffect each major federal assistance program

APIPA 2009APIPA 2009 7171
COMPLIANCE AUDITING OF COMPLIANCE AUDITING OF FEDERAL ASSISTANCE FEDERAL ASSISTANCE PROGRAMSPROGRAMS
Definition of population for testing of an Definition of population for testing of an internal control procedure that applies to internal control procedure that applies to more than one programmore than one program Define items from each major program as a Define items from each major program as a
separate population, ORseparate population, OR Define all items to which control is applicable Define all items to which control is applicable
as a single populationas a single population Second choice usually more efficientSecond choice usually more efficient

APIPA 2009APIPA 2009 7272
COMPLIANCE AUDITING - COMPLIANCE AUDITING - EXAMPLEEXAMPLE
Federal financial assistance for Island Federal financial assistance for Island CityCity Three major federal financial assistance Three major federal financial assistance
programsprograms Four nonmajor programsFour nonmajor programs
Control: Transaction review to ensure Control: Transaction review to ensure that only legally allowable costs are that only legally allowable costs are charged to each programcharged to each program

APIPA 2009APIPA 2009 7373
COMPLIANCE AUDITING - COMPLIANCE AUDITING - EXAMPLEEXAMPLE
More efficient to select one sample from More efficient to select one sample from population of all transactions (major and population of all transactions (major and nonmajor programs)nonmajor programs)
Confidence level = 95%Confidence level = 95% Tolerable deviation rate = 9%Tolerable deviation rate = 9% Expected population deviation rate = 1%Expected population deviation rate = 1% Sample size: 51Sample size: 51 1 allowable deviation1 allowable deviation

APIPA 2009APIPA 2009 7474
SMALL POPULATIONS AND SMALL POPULATIONS AND INFREQUENTLY OPERATING INFREQUENTLY OPERATING CONTROLSCONTROLS
Small Population Sample Size TableSmall Population Sample Size Table
Control Frequency and Control Frequency and Population SizePopulation Size
Sample SizeSample Size
Quarterly (4)Quarterly (4) 22
Monthly (12)Monthly (12) 2-42-4
Semimonthly (24)Semimonthly (24) 3-83-8
Weekly (52)Weekly (52) 5-95-9

APIPA 2009APIPA 2009 7575
IN-CLASS EXERCISE IN-CLASS EXERCISE NO. 4 NO. 4

APIPA 2009APIPA 2009 7676
IN-CLASS EXERCISE IN-CLASS EXERCISE NO. 4NO. 4
Selected Payroll T of CSelected Payroll T of C
1. Examine the time card 1. Examine the time card for approval of a for approval of a supervisorsupervisor
Moderately critical – Moderately critical – affects E/O of S& W affects E/O of S& W
2. Account for a 2. Account for a sequence of payroll sequence of payroll checks in the payroll checks in the payroll journaljournal
Very critical – affects E/O Very critical – affects E/O of S&Wof S&W
3. Recompute hours on 3. Recompute hours on the time cardthe time card
Moderately critical – Moderately critical – affects V of S&Waffects V of S&W

APIPA 2009APIPA 2009 7777
IN-CLASS EXERCISE IN-CLASS EXERCISE NO. 4NO. 4
4. Compare the 4. Compare the employee name in the employee name in the payroll journal to payroll journal to personnel recordspersonnel records
Very critical – affects Very critical – affects E/O - affects E/O of S& E/O - affects E/O of S& W; also an area subject W; also an area subject to fraud to fraud
5. Review OT charges 5. Review OT charges for approval of a for approval of a supervisorsupervisor
Moderately critical – Moderately critical – affects E/O and V of affects E/O and V of S&WS&W

APIPA 2009APIPA 2009 7878
IN-CLASS EXERCISE IN-CLASS EXERCISE NO. 4NO. 4
Selected Cash Disbursement T of CSelected Cash Disbursement T of C
6. Examine voucher for 6. Examine voucher for supporting invoices, supporting invoices, receiving reports, etc.receiving reports, etc.
Very critical – affects Very critical – affects E/O of purchase E/O of purchase transactionstransactions
7. Examine supporting 7. Examine supporting documents for evidence documents for evidence of cancellation (“paid”)of cancellation (“paid”)
Moderately critical – Moderately critical – affects validity of affects validity of purchase transactions purchase transactions and relates to double and relates to double paymentpayment

APIPA 2009APIPA 2009 7979
IN-CLASS EXERCISE IN-CLASS EXERCISE NO. 4NO. 4
Selected Cash Disbursement T of CSelected Cash Disbursement T of C
8. Ascertain whether 8. Ascertain whether cash discounts were cash discounts were takentaken
Least critical – affects V Least critical – affects V of purchase of purchase transactions; amounts transactions; amounts usually minorusually minor
9. Review voucher for 9. Review voucher for clerical accuracyclerical accuracy
Moderately critical – Moderately critical – affects V of purchase affects V of purchase transactionstransactions

APIPA 2009APIPA 2009 8080
IN-CLASS EXERCISE IN-CLASS EXERCISE NO. 4NO. 4
Selected Cash Disbursement T of CSelected Cash Disbursement T of C
10. Agree purchase 10. Agree purchase order price to invoiceorder price to invoice
Moderately critical – Moderately critical – affects V of purchase affects V of purchase transactionstransactions

APIPA 2009APIPA 2009 8181
MONETARY UNIT MONETARY UNIT SAMPLINGSAMPLING
Uses attribute sampling theory to express Uses attribute sampling theory to express conclusions in dollar amountsconclusions in dollar amounts Estimates the percentage of monetary units in a Estimates the percentage of monetary units in a
population that might be misstatedpopulation that might be misstated Multiples the percentage by an estimate of how Multiples the percentage by an estimate of how
much the dollars are misstatedmuch the dollars are misstated
Developed by auditorsDeveloped by auditors Assumes little or no misstatementsAssumes little or no misstatements Designed primarily to test for overstatementsDesigned primarily to test for overstatements

APIPA 2009APIPA 2009 8282
ADVANTAGESADVANTAGES
When no misstatements expected, When no misstatements expected, results in smaller (more efficient) sample results in smaller (more efficient) sample size than classical variables samplingsize than classical variables sampling
No need to compute/identify standard No need to compute/identify standard deviationdeviation
Automatically stratifies sampleAutomatically stratifies sample

APIPA 2009APIPA 2009 8383
DISADVANTAGESDISADVANTAGES
Zero or negative balances must be tested Zero or negative balances must be tested separatelyseparately
Assumes audited amount of sample Assumes audited amount of sample items is not in error by more than 100%items is not in error by more than 100%
When more than 1 or 2 misstatements When more than 1 or 2 misstatements found, allowance for sampling risk may found, allowance for sampling risk may be overstatedbe overstated Auditor more likely to reject balance and Auditor more likely to reject balance and
overauditoveraudit

APIPA 2009APIPA 2009 8484
STEPS IN MONETARY UNIT STEPS IN MONETARY UNIT SAMPLING APPLICATIONSAMPLING APPLICATION
PlanningPlanning1.1. Determine the test objectivesDetermine the test objectives2.2. Define the population characteristicsDefine the population characteristics3.3. Determine the sample sizeDetermine the sample size
PerformancePerformance4.4. Select sample itemsSelect sample items5.5. Perform the auditing proceduresPerform the auditing procedures
EvaluationEvaluation6.6. Calculate the resultsCalculate the results7.7. Draw conclusionsDraw conclusions

APIPA 2009APIPA 2009 8585
STEP 1: DETERMINE THE STEP 1: DETERMINE THE TEST OBJECTIVESTEST OBJECTIVES
Substantive testingSubstantive testing: To test the : To test the reasonableness of an amount, i.e., that reasonableness of an amount, i.e., that an amount is fairly statedan amount is fairly stated
To test the assertion that no material To test the assertion that no material misstatements exist in an account misstatements exist in an account balance, class of transactions, or balance, class of transactions, or disclosure component of the financial disclosure component of the financial statementsstatements
APIPA 2009APIPA 2009 8686
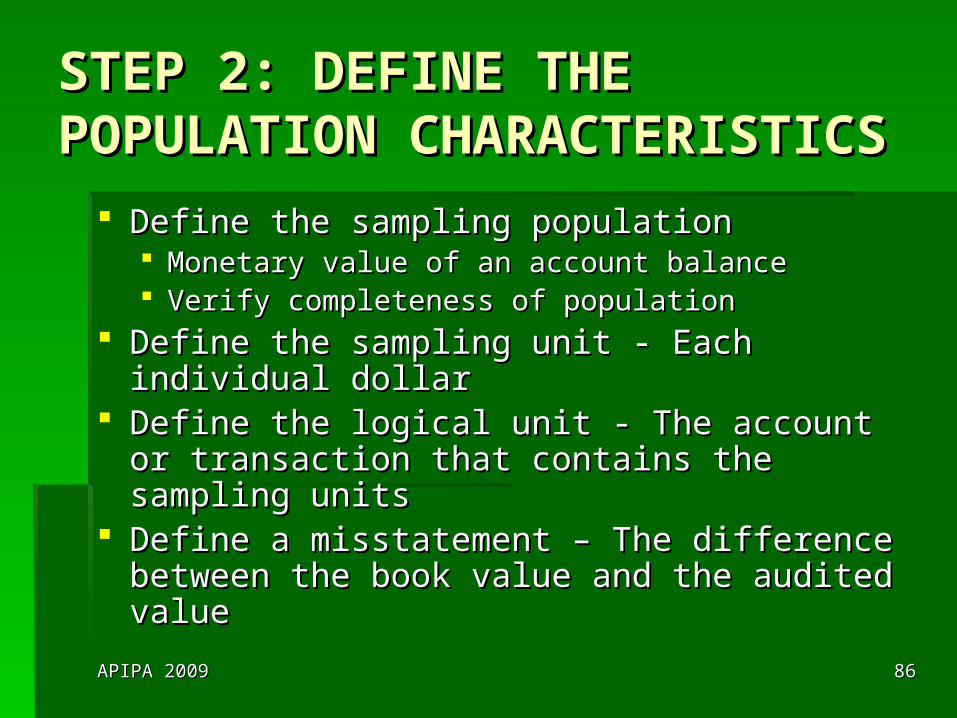
STEP 2: DEFINE THE STEP 2: DEFINE THE POPULATION POPULATION CHARACTERISTICSCHARACTERISTICS
Define the sampling populationDefine the sampling population Monetary value of an account balanceMonetary value of an account balance Verify completeness of populationVerify completeness of population
Define the sampling unit - Each individual Define the sampling unit - Each individual dollardollar
Define the logical unit - The account or Define the logical unit - The account or transaction that contains the sampling unitstransaction that contains the sampling units
Define a misstatement – The difference Define a misstatement – The difference between the book value and the audited valuebetween the book value and the audited value

APIPA 2009APIPA 2009 8787
STEP 3: DETERMINE THE STEP 3: DETERMINE THE SAMPLE SIZESAMPLE SIZE
Determine factors (effect on sample size)Determine factors (effect on sample size) Desired confidence level (direct)Desired confidence level (direct)
To increase confidence, more work is required! To increase confidence, more work is required! (larger sample size)(larger sample size)
Tolerable misstatement (inverse)Tolerable misstatement (inverse) Expected misstatement (direct)Expected misstatement (direct) Population size (direct)Population size (direct)
APIPA 2009APIPA 2009 8888
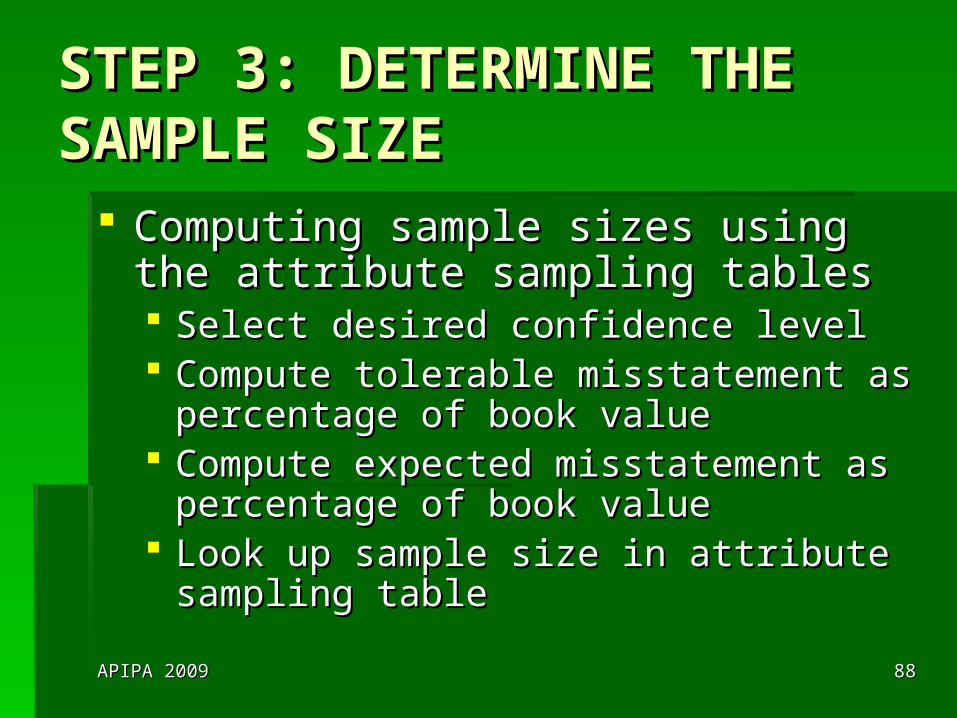
STEP 3: DETERMINE THE STEP 3: DETERMINE THE SAMPLE SIZESAMPLE SIZE
Computing sample sizes using the Computing sample sizes using the attribute sampling tablesattribute sampling tables Select desired confidence levelSelect desired confidence level Compute tolerable misstatement as Compute tolerable misstatement as
percentage of book valuepercentage of book value Compute expected misstatement as Compute expected misstatement as
percentage of book valuepercentage of book value Look up sample size in attribute sampling Look up sample size in attribute sampling
tabletable

APIPA 2009APIPA 2009 8989
STEP 4: SELECT THE STEP 4: SELECT THE SAMPLE ITEMSSAMPLE ITEMS
Systematic selection approach called Systematic selection approach called probability proportional to size (PPS)probability proportional to size (PPS)
Calculate sampling intervalCalculate sampling interval Book value / sample sizeBook value / sample size
From random start (within first interval), From random start (within first interval), select every nth dollarselect every nth dollar Logical unit included only once even if Logical unit included only once even if
includes more than one sample unitincludes more than one sample unit

APIPA 2009APIPA 2009 9090
STEP 5: PERFORM THE STEP 5: PERFORM THE AUDITING PROCEDURESAUDITING PROCEDURES
Conduct planned audit procedures on Conduct planned audit procedures on logical unitslogical units
What if?What if? Missing document – consider to be a Missing document – consider to be a
misstatementmisstatement

APIPA 2009APIPA 2009 9191
STEP 6: CALCULATE STEP 6: CALCULATE RESULTSRESULTS
Projected misstatement: Projection of Projected misstatement: Projection of the errors to the populationthe errors to the population
Upper limit on misstatement: Adds an Upper limit on misstatement: Adds an allowance for sampling risk to the allowance for sampling risk to the projected misstatementprojected misstatement
APIPA 2009APIPA 2009 9292
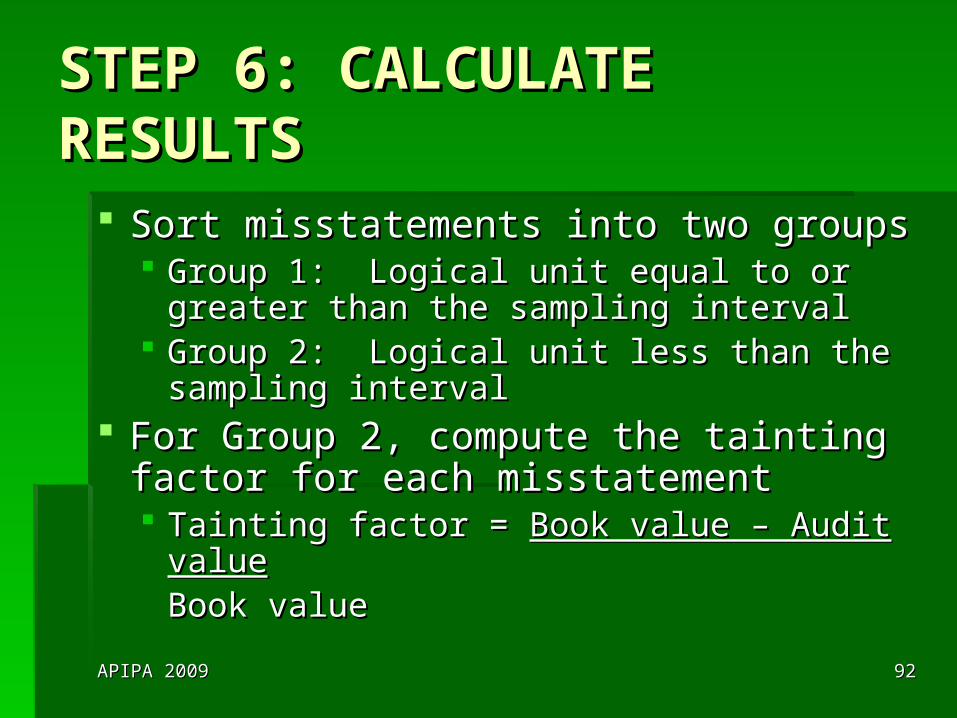
STEP 6: CALCULATE STEP 6: CALCULATE RESULTSRESULTS
Sort misstatements into two groupsSort misstatements into two groups Group 1: Logical unit equal to or greater Group 1: Logical unit equal to or greater
than the sampling intervalthan the sampling interval Group 2: Logical unit less than the sampling Group 2: Logical unit less than the sampling
intervalinterval For Group 2, compute the tainting factor For Group 2, compute the tainting factor
for each misstatementfor each misstatement Tainting factor = Tainting factor = Book value – Audit valueBook value – Audit value
Book valueBook value

APIPA 2009APIPA 2009 9393
STEP 6: CALCULATE STEP 6: CALCULATE RESULTSRESULTS
Place the Group 2 items in rank order by Place the Group 2 items in rank order by tainting factor (from largest to smallest)tainting factor (from largest to smallest)
Compute the projected misstatementCompute the projected misstatement Calculate the upper limit increments (using the Calculate the upper limit increments (using the
Monetary Unit Sampling – Confidence Monetary Unit Sampling – Confidence Factors for Sample EvaluationFactors for Sample Evaluation table)table)
Calculate upper misstatement for each Group 2 Calculate upper misstatement for each Group 2 itemitem
Add differences for Group 1Add differences for Group 1 Total = Upper misstatement limitTotal = Upper misstatement limit

APIPA 2009APIPA 2009 9494
STEP 6: CALCULATE STEP 6: CALCULATE RESULTS - EXAMPLERESULTS - EXAMPLE
Book value = $3,100,000Book value = $3,100,000 Tolerable misstatement = $150,000Tolerable misstatement = $150,000 Expected misstatement = $25,000Expected misstatement = $25,000 Desired confidence level = 95%Desired confidence level = 95% Tolerable misstatement rate = Tolerable misstatement rate =
4.8%,round to 5%4.8%,round to 5% Expected misstatement rate = .8%, round Expected misstatement rate = .8%, round
to 1%to 1%

APIPA 2009APIPA 2009 9595
STEP 6: CALCULATE STEP 6: CALCULATE RESULTS - EXAMPLERESULTS - EXAMPLE
Sample size = 93Sample size = 93 Sampling interval = $33,333Sampling interval = $33,333 Expected misstatement = $25,000Expected misstatement = $25,000

APIPA 2009APIPA 2009 9696
STEP 6: CALCULATE STEP 6: CALCULATE RESULTS - EXAMPLERESULTS - EXAMPLE
ItemItem Book ValueBook Value Audited ValueAudited Value DifferenceDifference
Item 1 12,000 3,120 8,880
Item 2 35,000 32,000 3,000
Item 3 1,400 0 1,400
Item 4 45,200 41,000 4,200
Item 5 740 555 185

APIPA 2009APIPA 2009 9797
STEP 6: CALCULATE STEP 6: CALCULATE RESULTS - EXAMPLERESULTS - EXAMPLE
ItemItem Book ValueBook Value Audited ValueAudited Value DifferenceDifference
Group 1: BV > SI (33,333)
Item 2 35,000 32,000 3,000
Item 4 45,200 41,000 4,200
7,200

APIPA 2009APIPA 2009 9898
STEP 6: CALCULATE STEP 6: CALCULATE RESULTS - EXAMPLERESULTS - EXAMPLE
ItemItem DifferenceDifference Book ValueBook Value Tainting Tainting FactorFactor
Group 2: BV < SI (33,333)
Item 1 8,880 12,000 .74
Item 3 1,400 1,400 1.0
Item 5 185 740 .25

APIPA 2009APIPA 2009 9999
STEP 6: CALCULATE STEP 6: CALCULATE RESULTS - EXAMPLERESULTS - EXAMPLE
ItemItem Tainting Tainting FactorFactor
Sampling Sampling IntervalInterval
Projected Projected Misstatement Misstatement
(Tainting (Tainting Factor * SI)Factor * SI)
Item 3 1.0 33,333 33,333
Item 1 .74 33,333 24,666
Item 5 .25 33,333 8,333

APIPA 2009APIPA 2009 100100
STEP 6: CALCULATE STEP 6: CALCULATE RESULTS - EXAMPLERESULTS - EXAMPLE
ItemItem Projected Projected MisstatementMisstatement
95% Upper 95% Upper Limit Limit
IncrementIncrement
Upper Upper MisstatementMisstatement
Item 3 33,333 3.0 99,999
Item 1 24,666 1.7 41,932
Item 5 8,333 1.5 12,500
154,431

APIPA 2009APIPA 2009 101101
STEP 6: CALCULATE STEP 6: CALCULATE RESULTS - EXAMPLERESULTS - EXAMPLE
ItemItem Projected Projected MisstatementMisstatement
95% Upper 95% Upper Limit Limit
IncrementIncrement
Upper Upper MisstatementMisstatement
Group 2 154,431
Group 1 7,200
Upper Misstatement Limit 161,631

APIPA 2009APIPA 2009 102102
STEP 7: DRAW STEP 7: DRAW CONCLUSIONSCONCLUSIONS
If Upper Misstatement Limit > Tolerable If Upper Misstatement Limit > Tolerable Misstatement, balance is materially Misstatement, balance is materially misstated.misstated.
If Upper Misstatement Limit If Upper Misstatement Limit >> Tolerable Tolerable Misstatement, balance is not materially Misstatement, balance is not materially misstatedmisstated

APIPA 2009APIPA 2009 103103
IN-CLASS EXERCISES IN-CLASS EXERCISES NO. 5 TO NO. 6NO. 5 TO NO. 6
APIPA 2009APIPA 2009 104104
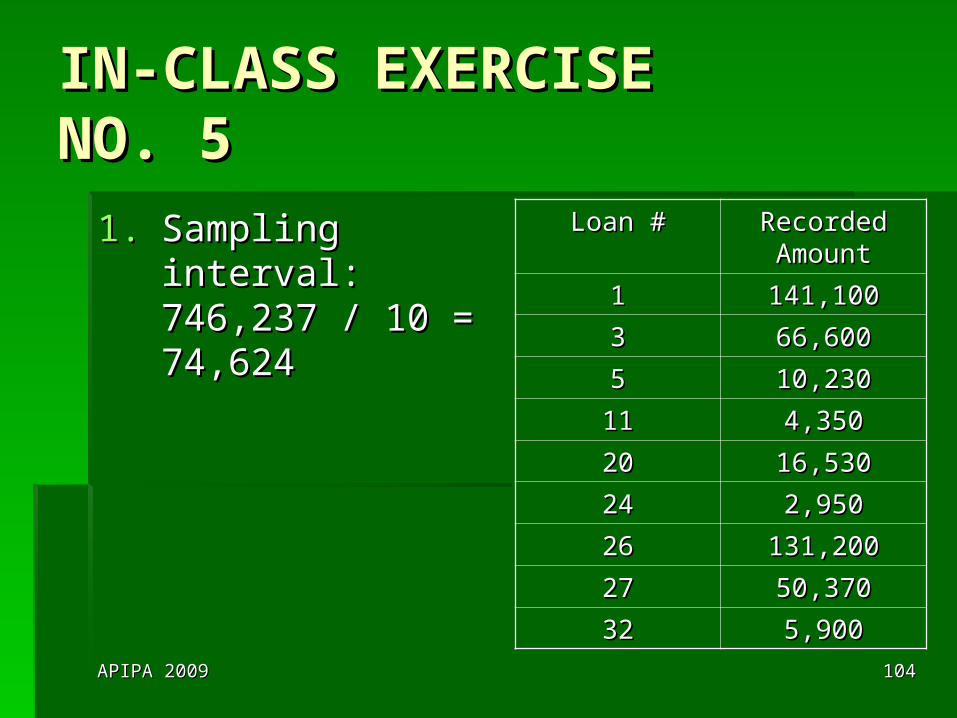
IN-CLASS EXERCISE IN-CLASS EXERCISE NO. 5NO. 5
1.1. Sampling interval: Sampling interval: 746,237 / 10 = 746,237 / 10 = 74,62474,624
Loan #Loan # Recorded Recorded AmountAmount
11 141,100141,100
33 66,60066,600
55 10,23010,230
1111 4,3504,350
2020 16,53016,530
2424 2,9502,950
2626 131,200131,200
2727 50,37050,370
3232 5,9005,900

APIPA 2009APIPA 2009 105105
IN-CLASS EXERCISE IN-CLASS EXERCISE NO. 5NO. 5
2.2. Sampling items always included:Sampling items always included:
The loans > the sampling intervalThe loans > the sampling interval
Loan #1 – 141,100Loan #1 – 141,100
Loan #26 – 131,200Loan #26 – 131,200

APIPA 2009APIPA 2009 106106
IN-CLASS EXERCISEIN-CLASS EXERCISENO. 6NO. 6
Recorded amount of accounts receivable = Recorded amount of accounts receivable = $400,000$400,000
Tolerable misstatement: $20,000; 20,000 / Tolerable misstatement: $20,000; 20,000 / 400,000 = 5%400,000 = 5%
Risk of incorrect acceptance: 5%Risk of incorrect acceptance: 5% Expected misstatements: 0Expected misstatements: 0
Sample size = 59Sample size = 59 Sampling interval = 400,000 / 59 = 6,780Sampling interval = 400,000 / 59 = 6,780

APIPA 2009APIPA 2009 107107
IN-CLASS EXERCISEIN-CLASS EXERCISENO. 6NO. 6
ErrorError Recorded Recorded AmountAmount
Audit Audit AmountAmount
DifferenceDifference Tainting Tainting %%
11 400400 320320 8080 20%20%
22 500500 00 500500 100%100%
33 7,0007,000 6,5006,500 500500 NANA

APIPA 2009APIPA 2009 108108
IN-CLASS EXERCISEIN-CLASS EXERCISENO. 6NO. 6
ErrorError Tainting Tainting %%
Sampling Sampling IntervalInterval
Projected Projected Misstate-Misstate-mentment
Upper Upper Limit Limit IncrementIncrement
Upper Upper Limit Limit Misstate-Misstate-mentment
Logical unit BV < Sampling IntervalLogical unit BV < Sampling Interval
22 100100 6,7806,780 6,7806,780 1.71.7 11,52611,526
11 2020 6,7806,780 1,3561,356 1.51.5 2,0342,034

APIPA 2009APIPA 2009 109109
IN-CLASS EXERCISEIN-CLASS EXERCISENO. 6NO. 6
ErrorError Tainting Tainting %%
Sampling Sampling IntervalInterval
Projected Projected Misstate-Misstate-mentment
Upper Upper Limit Limit IncrementIncrement
Upper Upper Limit Limit Misstate-Misstate-mentment
Logical unit BV > Sampling IntervalLogical unit BV > Sampling Interval
33 NANA NANA 500500 NANA 500500
Basic Precision: 3.0 * 6,780 = 20,340Basic Precision: 3.0 * 6,780 = 20,340

APIPA 2009APIPA 2009 110110
IN-CLASS EXERCISEIN-CLASS EXERCISENO. 6NO. 6
ErrorError Tainting Tainting %%
Sampling Sampling IntervalInterval
Projected Projected Misstate-Misstate-mentment
Upper Upper Limit Limit IncrementIncrement
Upper Upper Limit Limit Misstate-Misstate-mentment
Logical unit BV < Sampling IntervalLogical unit BV < Sampling Interval 13,56013,560
Logical unit BV > Sampling IntervalLogical unit BV > Sampling Interval 500500
Basic PrecisionBasic Precision 20,34020,340
Upper Misstatement LimitUpper Misstatement Limit 34,40034,400Conclusion: The account is materially misstated. The upper misstatement limit of 34,400 exceeds the tolerable misstatement of 20,000.

APIPA 2009APIPA 2009 111111
NONSTATISTICAL SAMPLING NONSTATISTICAL SAMPLING – BALANCE TESTING– BALANCE TESTING
Differences inDifferences in Identifying individually significant itemsIdentifying individually significant items Determining sample sizeDetermining sample size Selecting sample itemsSelecting sample items Calculating sample resultsCalculating sample results

APIPA 2009APIPA 2009 112112
IDENTIFYING INDIVIDUALLY IDENTIFYING INDIVIDUALLY SIGNIFICANT ITEMSSIGNIFICANT ITEMS
Selected due to large sizeSelected due to large size Tested 100%Tested 100% Results similar to PPS selectionResults similar to PPS selection For example, selecting all items > For example, selecting all items >
$100,000$100,000
APIPA 2009APIPA 2009 113113
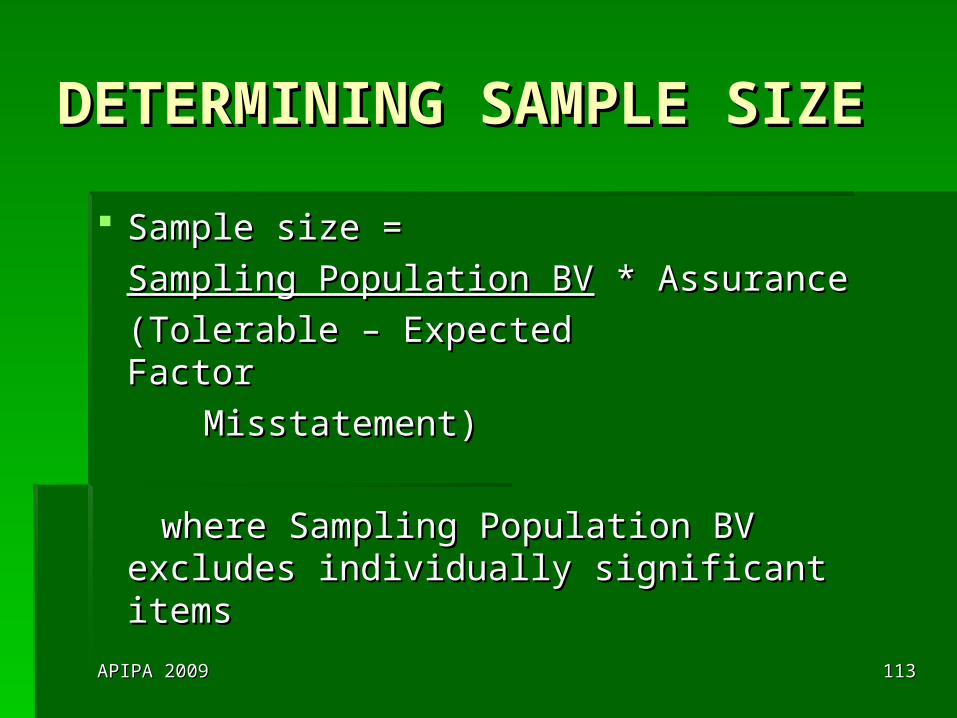
DETERMINING SAMPLE DETERMINING SAMPLE SIZESIZE
Sample size = Sample size =
Sampling Population BVSampling Population BV * Assurance * Assurance
(Tolerable – Expected Factor(Tolerable – Expected Factor
Misstatement)Misstatement)
where Sampling Population BV excludes where Sampling Population BV excludes individually significant itemsindividually significant items

APIPA 2009APIPA 2009 114114
DETERMINING SAMPLE DETERMINING SAMPLE SIZESIZE
Assessment Assessment of RMMof RMM
Desired Level of Confidence – Assurance FactorsDesired Level of Confidence – Assurance Factors
MaximumMaximum Slightly below Slightly below maximummaximum
ModerateModerate LowLow
MaximumMaximum 3.0 2.7 2.3 2.0Slightly below Slightly below maximummaximum
2.7 2.4 2.0 1.6
ModerateModerate 2.3 2.1 1.6 1.2LowLow 2.0 1.6 1.2 1.0

APIPA 2009APIPA 2009 115115
DETERMINING SAMPLE DETERMINING SAMPLE SIZE - EXAMPLESIZE - EXAMPLE
Book value = $3,100,000Book value = $3,100,000 Individually significant items = $1,500,000Individually significant items = $1,500,000 Tolerable misstatement = $150,000Tolerable misstatement = $150,000 Expected misstatement = $25,000Expected misstatement = $25,000 Desired confidence level = MaximumDesired confidence level = Maximum Risk of MM = MaximumRisk of MM = Maximum Sample size = Sample size = 1,600,0001,600,000 * 3.0 * 3.0
(150,000 – 25,000)(150,000 – 25,000) = 38.4, round to 39= 38.4, round to 39

APIPA 2009APIPA 2009 116116
SELECTING SAMPLE SELECTING SAMPLE ITEMSITEMS
Random selectionRandom selection Systematic selectionSystematic selection Haphazard selectionHaphazard selection

APIPA 2009APIPA 2009 117117
CALCULATING SAMPLE CALCULATING SAMPLE RESULTSRESULTS
Sample misstatement MUST be Sample misstatement MUST be projected to populationprojected to population
Two acceptable methodsTwo acceptable methods Apply sample misstatement ratio to Apply sample misstatement ratio to
population (ratio estimation)population (ratio estimation) Apply average misstatement $ of each item Apply average misstatement $ of each item
in sample to all items in population in sample to all items in population (difference estimation)(difference estimation)

APIPA 2009APIPA 2009 118118
CLASSICAL SAMPLINGCLASSICAL SAMPLING
Ratio estimationRatio estimation Difference estimationDifference estimation

APIPA 2009APIPA 2009 119119
RATIO ESTIMATIONRATIO ESTIMATION
Sample misstatements = $19,000Sample misstatements = $19,000 Sample book value = $175,000Sample book value = $175,000 Sample error rate = 10.9%, round to 11%Sample error rate = 10.9%, round to 11% Total population BV = $1,840,000Total population BV = $1,840,000 Projected misstatement = $1,840,000 * Projected misstatement = $1,840,000 *
11% = $202,40011% = $202,400 Compare projected misstatement to Compare projected misstatement to
tolerable misstatementtolerable misstatement

APIPA 2009APIPA 2009 120120
DIFFERENCE ESTIMATIONDIFFERENCE ESTIMATION
Sample misstatements = $19,000Sample misstatements = $19,000 # of sample items with misstatements = 5# of sample items with misstatements = 5 Average misstatement per sample item = Average misstatement per sample item =
$3,800$3,800 # items in population = 256# items in population = 256 Projected misstatement = $3,800 * 256 = Projected misstatement = $3,800 * 256 =
$972,800$972,800 Compare projected misstatement to tolerable Compare projected misstatement to tolerable
misstatementmisstatement

APIPA 2009APIPA 2009 121121
IN-CLASS EXERCISE IN-CLASS EXERCISE NO. 7NO. 7
APIPA 2009APIPA 2009 122122
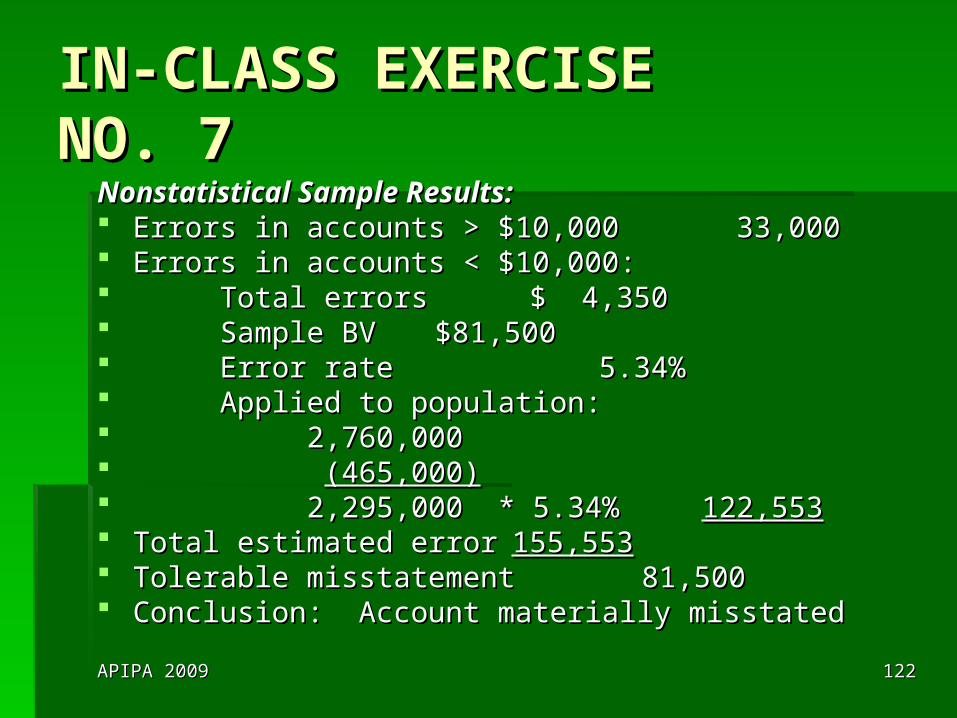
IN-CLASS EXERCISE IN-CLASS EXERCISE NO. 7NO. 7
Nonstatistical Sample Results:Nonstatistical Sample Results: Errors in accounts > $10,000Errors in accounts > $10,000 33,000 33,000 Errors in accounts < $10,000:Errors in accounts < $10,000: Total errorsTotal errors $ 4,350 $ 4,350 Sample BV Sample BV $81,500 $81,500 Error rate Error rate 5.34% 5.34% Applied to population:Applied to population: 2,760,0002,760,000 (465,000)(465,000) 2,295,000 * 5.34%2,295,000 * 5.34% 122,553122,553 Total estimated errorTotal estimated error 155,553155,553 Tolerable misstatementTolerable misstatement 81,500 81,500 Conclusion: Account materially misstatedConclusion: Account materially misstated

APIPA 2009APIPA 2009 123123
IN-CLASS EXERCISE IN-CLASS EXERCISE NO. 7 - PPSNO. 7 - PPS
PPS Sample Results:PPS Sample Results: Accounts receivable recorded Accounts receivable recorded
balance: balance: $2,760,000$2,760,000 Accounts > $10,000 (tested Accounts > $10,000 (tested
separately)separately) ( (465,000465,000)) Accounts receivable populationAccounts receivable population
– – PPSPPS $2,295,000$2,295,000 Tolerable misstatementTolerable misstatement $ 81,500$ 81,500

APIPA 2009APIPA 2009 124124
IN-CLASS EXERCISE IN-CLASS EXERCISE NO. 7 - PPSNO. 7 - PPS
Sample and sampling interval: Sample and sampling interval:
Tolerable rate: 81,500 / 2,295,000 = 3.55%, Tolerable rate: 81,500 / 2,295,000 = 3.55%, round to 4%round to 4%
Expected rate: 0Expected rate: 0
5% risk of overreliance (since IR and CR are 5% risk of overreliance (since IR and CR are both high)both high)
Sample size: 74Sample size: 74
Sampling interval: 2,295,000 / 74 = 31,014Sampling interval: 2,295,000 / 74 = 31,014

APIPA 2009APIPA 2009 125125
IN-CLASS EXERCISE IN-CLASS EXERCISE NO. 7 - PPSNO. 7 - PPS
RecordedValue
AuditedValue
Difference Tainting %
Item 12 5,120 4,820 300 5.85
Item 19 485 385 100 20.6
Item 33 1,250 250 1,000 80
Item 35 3,975 3,875 100 25.2
Item 51 1,850 1,825 25 1.4
Item 59 4,200 3,780 420 10
Item 74 2,405 0 2,405 100

APIPA 2009APIPA 2009 126126
IN-CLASS EXERCISE IN-CLASS EXERCISE NO. 7 - PPSNO. 7 - PPS
# of Overstatement Misstatements 5% Upper Limit Increment
0 3.00
1 4.75 1.75
2 6.30 1.55
3 7.76 1.46
4 9.16 1.40
5 10.52 1.36
6 11.85 1.33
7 13.15 1.30

APIPA 2009APIPA 2009 127127
IN-CLASS EXERCISE IN-CLASS EXERCISE NO. 7 - PPSNO. 7 - PPS
Tainting%
SamplingInterval
ProjectedMisstatement
Upper LimitFactor
UpperMisstatement
Item 74 100 31,014 31,014 1.75 54,275
Item 33 80 31,014 24,811 1.55 38,457
Item 35 25.2 31,014 7,816 1.46 11,411
Item 19 20.6 31,014 6,389 1.40 8,944
Item 59 10 31,014 3,101 1.36 4,218
Item 12 5.85 31,014 1,814 1.33 2,413
Item 51 1.4 31,014 434 1.30 564
120,282

APIPA 2009APIPA 2009 128128
IN-CLASS EXERCISE IN-CLASS EXERCISE NO. 7 - PPSNO. 7 - PPS
Items < Sampling Interval:Items < Sampling Interval: 120,282 120,282 Items > Sampling Interval: NoneItems > Sampling Interval: None Basic precision: 3.0 * 31,014 = Basic precision: 3.0 * 31,014 = 93,04293,042 Upper misstatement limit =Upper misstatement limit = 213,324213,324 Conclusion: Account is materially misstated. Conclusion: Account is materially misstated.
Upper misstatement limit 213,324 > tolerable Upper misstatement limit 213,324 > tolerable misstatement 81,500misstatement 81,500

APIPA 2009APIPA 2009 129129
RESOURCESRESOURCES
Audit Sampling: An Introduction, 3Audit Sampling: An Introduction, 3rdrd Edition, Guy, Carmichael & WhittingtonEdition, Guy, Carmichael & Whittington
Audit Guide: Audit Sampling, New Edition Audit Guide: Audit Sampling, New Edition as of May 1, 2008, AICPAas of May 1, 2008, AICPA
Auditing & Assurance Services, 6Auditing & Assurance Services, 6thth Edition, Messier, Glover, & PrawittEdition, Messier, Glover, & Prawitt
Auditing & Assurance Services, 12Auditing & Assurance Services, 12thth Edition, Arens, Elder & BeasleyEdition, Arens, Elder & Beasley

APIPA 2009APIPA 2009 130130
THE END!THE END!