apex and el nido mines€¦ · final report preliminary assessment /site investigation apex and el...
TRANSCRIPT

PRELIMINARY ASSESSMENT/SITE INVESTIGATIONFINAL REPORT
US Army Corpsof EngineersAlaska District
APEX AND EL NIDO MINESTONGASS NATIONAL FOREST, ALASKA
OCTOBER 2003
FINAL REPORT PRELIMINARY ASSESSMENT /SITE INVESTIGATION
APEX AND EL NIDO MINES TONGASS NATIONAL FOREST, ALASKA
Prepared for:
Tryck Nyman Hayes, Inc. 911 West Eighth Avenue, Suite 300
Anchorage, Alaska 99501
Submitted to:
U.S. Army Corps of Engineers, Alaska District Post Office Box 6898
Anchorage, Alaska 99508
and
U.S. Department of Agriculture Forest Service, Alaska Region
709 West Ninth Street Juneau, Alaska 99802-1628
Prepared by:
URS Corporation
2700 Gambell Street Anchorage, Alaska 99503
Contract Number:
DACW85-00-D-0004, Task Order No. 7, 27 November 2002
October 2, 2003
PRELIMINARY ASSESSMENT/SITE INVESTIGATION APEX AND EL NIDO MINES FINAL REPORT i OCTOBER 2003
TABLE OF CONTENTS
Section Title Page
1.0 EXECUTIVE SUMMARY.......................................................................................................................1 2.0 INTRODUCTION .....................................................................................................................................3 3.0 SITE DESCRIPTION................................................................................................................................3
3.1 SITE LOCATION AND ACCESS .............................................................................................3 3.2 CLIMATE ....................................................................................................................................4 3.3 OPERATIONAL AND OWNERSHIP HISTORY....................................................................5 3.4 REGIONAL AND LOCAL GEOLOGY....................................................................................6 3.5 SOILS ...........................................................................................................................................7 3.6 SURFACE HYDROLOGY.........................................................................................................7 3.7 ECOLOGICAL SETTING..........................................................................................................8
4.0 PREVIOUS EXAMINATIONS AND CURRENT SITE CONDITIONS .............................................9 4.1 PREVIOUS INVESTIGATIONS ...............................................................................................9 4.2 CURRENT SITE CONDITIONS .............................................................................................11
5.0 HAZARD RANKING SYSTEM............................................................................................................14 5.1 ECOLOGICAL TOXICITY OF SITE CONTAMINANTS ...................................................14 5.2 CONTAMINANT MIGRATION PATHWAYS.....................................................................14 5.3 TARGETS..................................................................................................................................15 5.4 HRS DATA GAPS ....................................................................................................................15
6.0 PA/SI SAMPLING PROGRAM.............................................................................................................16 6.1 OVERVIEW...............................................................................................................................16 6.2 BACKGROUND SAMPLES....................................................................................................16 6.3 PRIMARY SAMPLES..............................................................................................................17
6.3.1 Surface Water............................................................................................................17 6.3.2 Soil.............................................................................................................................17 6.3.3 Waste Rock ...............................................................................................................18
7.0 ANALYTICAL RESULTS.....................................................................................................................19 7.1 SURFACE WATER ..................................................................................................................19
7.1.1 Background...............................................................................................................19 7.1.2 Primary Samples.......................................................................................................19
7.2 SOIL............................................................................................................................................20 7.2.1 Background...............................................................................................................20 7.2.2 Primary Samples.......................................................................................................20
7.3 WASTE ROCK..........................................................................................................................22
8.0 SOURCES AND IMPACTS TO POTENTIALLY AFFECTED TARGETS .....................................22 8.1 UPPER CAMP (INDUSTRIAL CENTER) ....................................................................................22 8.2 ASSAY SHOP AND RETORT HOUSE ........................................................................................23
PRELIMINARY ASSESSMENT/SITE INVESTIGATION APEX AND EL NIDO MINE S FINAL REPORT ii OCTOBER 2003

8.3 LOWER CANN CREEK .................................................................................................................23
9.0 REMOVAL ACTION ASSESSMENT..................................................................................................24 9.1 CERCLA RELEASES...............................................................................................................25 9.2 POTENTIAL THREAT TO THE ENVIRONMENT .............................................................25
10.0 CONCLUSIONS AND RECOMMENDATIONS ................................................................................26 11.0 REFERENCES.........................................................................................................................................27
TABLES Table 1 Previous Water Quality Data Table 2 Previous Blue Mussel Tissue Data Table 3 PA/SI Water Quality Data Table 4 PA/SI Soil Data Table 5 Waste Rock Acid-Base Accounting Data Table 6 Applicable Criteria for Soil and Water
FIGURES Figure 1 Site Location Map Figure 2 Site Layout and Features Figure 3 Mine Workings, Upper Camp and Mill Figure 4 Beach Camp and Lower Area Figure 5 Sample Locations – Upper Area Figure 6 Sample Locations – Lower Area
PHOTOGRAPHS PA/SI Site Photographs
APPENDICES Appendix A Field Notes Appendix B Analytical Laboratory Reports Appendix C QA/QC Data Summary
ATTACHMENT Attachment I Supporting Laboratory Quality Assurance/Quality Control Data
PRELIMINARY ASSESSMENT/SITE INVESTIGATION APEX AND EL NIDO MINE S FINAL REPORT iii OCTOBER 2003

ACRONYMS AND ABBREVIATIONS AAC Alaska Administrative Code ADEC Alaska Department of Environmental Conservation ADF&G Alaska Department of Fish and Game ADNR Alaska Department of Natural Resources Alaska District Environmental Engineering Branch, Alaska District, U.S. Army Corps of Engineers AP acid potential AWQC ambient water quality criteria BLM Bureau of Land Management BOM Bureau of Mines CERCLA Comprehensive Environmental Response, Compensation and Liability Act CFR Code of Federal Regulations cfs cubic feet per second DRO diesel range organics EA Environmental Assessment Forest Service U.S. Forest Service, Alaska Region HRS Hazard Ranking System mg/kg milligrams per kilogram mg/L milligrams per liter NOAA National Oceanic and Atmospheric Administration NP neutralization potential NNP net neutralization potential oz/ton ounces per ton PAH polycyclic aromatic hydrocarbons PA/SI Preliminary Assessment/Site Investigation QA/QC Quality Assurance/Quality Control RCRA Resource Conservation and Recovery Act RRO residual range organics TCLP toxicity characteristic leaching procedure TOC total organic carbon ug/L micrograms per liter USACE U.S. Army Corps of Engineers USEPA U.S. Environmental Protection Agency USFS U.S. Forest Service USFWS U.S. Fish and Wildlife Service yds3 cubic yards
PRELIMINARY ASSESSMENT/SITE INVESTIGATION APEX AND EL NIDO MINE S FINAL REPORT iv OCTOBER 2003

1.0 EXECUTIVE SUMMARY This Report details the results of a Preliminary Assessment (PA) and Site Investigation (SI) for the Apex and El Nido Mines and mill (site). The site is located in Southeastern Alaska within the Chichagof Roadless Area on the northwestern side of Chichagof Island in the Tongass National Forest. The purpose of this PA/SI was to identify conditions that may pose a risk to human health and the environment as defined by the Comprehensive Environmental Response, Compensation and Liability Act (CERCLA), and to determine whether a removal action should be conducted. Information obtained during the PA was combined with contemporary data obtained during a site investigation to complete this project. The mine properties lie on the northern end of a north-northwest trending belt of lode gold occurrences that lies along the west coast of Chichagof Island (Kimball 1982, North American Exploration 1982). Both mines are located just below timberline in a glacial valley. The properties are situated within the Cann Creek drainage, which lies on the south side of Lisianski Inlet approximately three miles west of the town of Pelican. The two mines are roughly 2,000 feet apart. They are not connected underground although, aerial trams once connected both mine sites with the mill downstream on Cann Creek. The U. S. Forest Service conducted an Environmental Assessment (EA) of the Apex-El Nido mine sites in 1992 and 1993. The EA was prepared to assess a proposed Plan of Operations for mineral exploration by Apex-El Nido Mines, Inc. As part of the EA process, surface water quality was evaluated, biologic and watershed analysis was conducted, and a cultural resource inventory was completed. Water samples were collected from the Apex portal, from below waste rock, and from Cann Creek at 800 feet elevation. All samples were analyzed for field parameters (temperature, pH, and conductivity), total suspended solids (TSS), alkalinity, and dissolved metals (arsenic, cadmium, chromium, copper, lead, manganese, nickel, silver, and zinc). One background sample was also collected from a nearby stream, similar in size to Cann Creek, and tested for field parameters only. Conductivity and pH levels from the portal were similar to the values measured from a nearby stream. All samples had dissolved metals concentrations that were below the State of Alaska freshwater aquatic life criteria, except for the Apex portal sample. That sample had an arsenic concentration of 80 micrograms per liter (ug/L), below the freshwater ambient water quality criteria (AWQC) of 150 ug/L, but exceeding the State drinking water quality criterion of 50 ug/L. Sampling of blue mussels in Lisianski Inlet, near the mouth of Cann Creek in 1993 showed slightly elevated concentrations of cadmium, chromium and copper. This PA/SI was completed in accordance with requirements under CERCLA to evaluate the presence of releases, and to assess the need for removal actions. The sampling program included collection and analysis of thirteen primary soil samples, four primary surface water samples and three waste rock samples. One water sample and five soil samples were considered to represent background conditions.
PRELIMINARY ASSESSMENT/SITE INVESTIGATION APEX AND EL NIDO MINES FINAL REPORT 1 OCTOBER 2003

The remaining primary water and soil samples represented source areas. Waste rock samples were tested to evaluate acid generating potential of waste rock stockpiles. All surface water samples were analyzed for eight Resource Conservation and Recovery Act (RCRA) listed metals, including arsenic, barium, cadmium, chromium, lead, mercury, selenium and silver. Eleven soil samples were analyzed for eight RCRA metals, and two soil samples were analyzed for diesel range organics (DRO) and residual range organics (RRO). Two of the samples analyzed for metals were further tested for leachable metals according to the Toxicity Characteristic Leaching Procedure (TCLP). Background soil and water samples were analyzed for RCRA metals only. The selection of sample location and analytical protocol was based on historical information and field observations. Results indicate the presence of elevated metals concentrations in three areas of the site: adjacent to the assay shop, adjacent to the retort house and at the mouth of Cann Creek. Elevated DRO concentrations were detected at the industrial center near the upper camp. Samples from each of these areas contained analyte concentrations in excess of three times background concentrations, and also showed exceedences of State of Alaska Department of Environmental Conservation (ADEC) Method 2, over 40-inch zone, migration to groundwater soil cleanup criteria. Results showing elevated DRO concentrations at the industrial center are suspect due to likely organic interference, and are considered estimates based on data qualifiers. Observations made during the site visit and results of TCLP testing indicate that metals-impacted soils downslope of the assay shop and retort house are relatively limited in extent and immobile. No complete pathway for transport of metals from this source to Cann Creek was observed. Results of tissue sampling conducted in 1993 showed no evidence of impacts from metals found in tailings in lower Cann Creek. Soil containing elevated DRO concentrations at the upper camp appears to be mostly beneath the historic ruins of the industrial center and inaccessible. Additionally, highly organic soil conditions at the upper camp would likely support the application of alternative cleanup levels, higher than the reported DRO concentrations. Waste rock analysis indicated a low potential for acid generation from the major waste rock stockpiles. One small stockpile of ore showed a high potential for acid generation; however, the stockpile is small (approximately 1 cubic yard) and no significant adverse impacts to the environment are expected. Additional evaluation of the extent of tailings distribution near the mouth of Cann Creek may be warranted. Consideration should be given to closing the open El Nido adit, or placement of warning signs to discourage entry into the underground workings. Signage may be appropriate to warn potential visitors of general physical hazards associated with the site features in their current condition.
PRELIMINARY ASSESSMENT/SITE INVESTIGATION APEX AND EL NIDO MINES FINAL REPORT 2 OCTOBER 2003

2.0 INTRODUCTION This Preliminary Assessment (PA) and Site Investigation (SI) for the Apex and El Nido Mines in Southeast Alaska (Figure 1) was completed for Tryck Nyman Hayes, Inc. for submittal to the U. S. Army Corps of Engineers, Alaska District (Alaska District) and the U.S. Department of Agriculture, Forest Service (USFS) under Contract DACW85-00-D-0004, Task Order No. 07 (27 November 2002). The purpose of this PA/SI was to identify conditions that may pose a risk to human health and the environment as defined by the Comprehensive Environmental Response, Compensation and Liability Act (CERCLA), and to determine whether a removal action should be conducted. The PA was based on existing site information, including materials obtained from the USFS, and from Bureau of Mines (BOM) files housed at the Bureau of Land Management (BLM). This information was combined with contemporary data obtained during the Site Investigation (SI) to complete this evaluation.
3.0 SITE DESCRIPTION 3.1 SITE LOCATION AND ACCESS The site is located in Southeastern Alaska within the Chichagof Roadless Area on the northwestern side of Chichagof Island in the Tongass National Forest (Figure 1). The individual mine sites are specifically located in Sections 13, 23, and 24 of Township 45 South, Range 56 East, of the Copper River Meridian (57o 57’ N latitude, 136o 17’ W longitude). The mine properties lie on the northern end of a north-northwest trending belt of lode gold occurrences that bisects western Chichagof Island (Kimball 1982, North American Exploration 1982). Both mines are located just below timberline in a glacial valley. The properties are situated on Cann Creek, which lies on the south side of Lisianski Inlet approximately three miles west southwest of the town of Pelican. A delapidated corduroy road winds 1-1/2 miles up Cann Creek, formerly connecting the inlet with the wreckage of the former mill and associated structures. The Apex mine is developed on 4 levels and consists of about 2,400 feet of tunnels and 1,200 feet of raises. The El Nido mine is opened on 2 levels and has about 1,500 feet of tunnels and 300 feet of raises (Reed 1941). The two mines are roughly 2,000 feet apart. They are not connected underground, although, aerial trams once connected both mine sites with the upper camp and mill sites, both downstream on Cann Creek. Surface equipment supporting the two mines included a water power plant, crusher, stamp mill, amalgamators and concentrating tables, pipelines, an aerial tramway, camp buildings and a corduroy access road. The remnants of at least nine structures are at present at the mine site (Figure 2), located at an upper camp near the El Nido Mine, at the mill site along Cann Creek, and at a lower camp near Lisianski Inlet. The former buildings included a cabin, bunkhouse, bathhouse, privy, dining hall, a watchman’s cabin, and a 10-stamp mill. A former “industrial center” is also present at the upper camp. Additional features also present at the mine site include the remains of an aerial tram, pneumatic lines, a
PRELIMINARY ASSESSMENT/SITE INVESTIGATION APEX AND EL NIDO MINES FINAL REPORT 3 OCTOBER 2003
winch, a pick-up truck chassis, a barge, and a cook stove. These features are in generally poor condition. None of the former buildings are intact, and the condition of the corduroy road varies, with some sections relatively intact and other sections gone altogether. The USFS performed a Level III Cultural Resource Inventory of the site workings in 1993 as part of the Environmental Assessment completed by the USFS in December of 1993. As a result, the Apex-El Nido Mine Complex has been determined “Eligible” for inclusion on the National Register of Historic Places (Myron and Iwamoto 1993). Local access to the site is possible by boat from Pelican and then by foot up the old corduroy road to the mill site at approximately 450 feet elevation; however, the corduroy road is in poor condition. The upper reaches of the site, above the mill, can be reached by following the former pipeline route up a very steep slope. The upper basin area below the mine workings is also accessible by helicopter. Helicopter access to the mill site directly is possible, but the area between the upper basin and the beach camp is generally not well suited for helicopter access and no safe landing zones currently exist. Some tree clearing would be necessary to establish a safe landing zone in the area between the mill and the inlet. The town of Pelican has scheduled air and ferry service from Juneau, as well as commercial accommodations for over night guests. Charter floatplane and helicopter services are available from both Juneau and Sitka. 3.2 CLIMATE The nearest climatological data stations to the site are located in Pelican, approximately 3 miles east of the mine site; and at Elfin Cove, located about 15 miles north of Pelican on the northern tip of Chichagof Island. Data recorded by the National Climatic Data Center of the National Oceanic and Atmospheric Administration (NOAA) includes mean precipitation rates, average daily temperatures and average snowfall for the years 1970 through 2001. The mean daily and annual precipitation rates for this area and time period are 0.28 and 77.01 inches, respectively. Rainfall is heaviest in October, decreasing sharply in November and December and then gradually decreasing throughout the spring time months. The least rainfall occurs during the months of May and June. Rainfall begins to increase steadily from July to October. The average snowfall is 62.8 inches per year. The average daily temperature is 42.8 oF with an average maximum temperature of 47.1 oF and an average minimum of 38.5 oF. Summer temperatures generally range from 51 oF to 62 oF, and winter temperatures fom 21 oF to 39 oF. In the mine area snowfall is heavy and deep snowdrifts last until late June in the vicinity of the upper mine workings. The upper portal of the Apex mine is often closed by snow until late July while the El Nido portal may be open by mid-June (Kimball 1982, North American Exploration 1982). Fog may also be encountered in the area during the summer months of May through September.
PRELIMINARY ASSESSMENT/SITE INVESTIGATION APEX AND EL NIDO MINES FINAL REPORT 4 OCTOBER 2003

3.3 OPERATIONAL AND OWNERSHIP HISTORY Captain John Hartely Cann originally staked the Apex mine in 1919, and the El Nido mine in 1920. Initially, two companies were organized to work these properties separately. Eventually, the two companies merged to form the Apex-El Nido Mining Company that carried ownership of the properties until the death of Mrs. Jenny Cann in about 1953 (Buddington 1923, Reed, 1937; Homes, 1941; Kimball 1982). Throughout this period various other mining companies (Chichagof Mining Company, Condor Mining Company) worked the Apex property under option from the Apex-El Nido Mining Company. Initially a camp was built at the beach near the mouth of Cann Creek and a barge landing was constructed in Lisianski Inlet. A pack trail approximately 2 miles in length connected the beach camp to the mine area. An upper camp was constructed at approximately 800 feet elevation. A skidroad was constructed in 1921 that extended from the beach to a point at the foot of the steep slope below the upper camp area, and a powerhouse and compressor plant were erected in Cann Creek below the upper camp. A jigback tram 1,500 feet in length was built to transport equipment and supplies from the end of the skidroad to the upper camp and mine workings. The Chichagof Mining Company, under bond on the Apex property during 1920 and 1921 drove nearly 1,400 feet of tunnel at the 870-foot elevation. The attempt to find the ore vein at the Tunnel No. 1 level was unsuccessful and as a result the company released its option on the Apex property. Cann and associates eventually found the down dip projection of the Apex vein that was exposed in a drift at the 1,227-foot elevation. This drift was known as the No. 2 level and was the main working level during mining of the property. In 1922 they extended the drift on the 1,227-foot level along the Apex vein. In 1923 they connected the No. 1 and No. 2 levels, which became the main transfer raise through which the Apex ore was lowered to the main haulage level (Holmes, 1941; Kimball 1982). Also in 1923, a 10-stamp mill was constructed at the 450-foot elevation and a 1½-mile long corduroy road was constructed from the beach to the mill site. Evidence at the mill site suggests that a ball mill was also in use. Aerial trams once connected both mine sites with the upper camp, and the upper camp with the mill. The Apex-El Nido mines produced nearly 17,000 ounces of gold and 2,400 ounces of silver during the periods 1924-28, 1934-35, and 1937-39 (Kimball 1982). Data from the two mines are combined, however; most production appears to have come from the Apex mine and the most productive years were 1925, 1926 and 1927 (Kimball, 1982). In 1954 Clell Hodson of Pelican took control of the Apex mine and Joe Ott, also of Pelican, took control of the El Nido mine. Joe Ott renamed the El Nido Mine the Ariel Mine (Williams, 1955). The Apex and El Nido mines have been held by Apex-El Nido Gold Mines, a Juneau based company, since 1968. Forty-three unpatented lode and 3 placer claims were held in 1979 (Kimball 1982). The properties consisted of four lode claim groups, a placer claim group, and a mill site claim group. In 1975 the Apex-El Nido Mining Company reactivated their interest in the Apex and El Nido mine sites and submitted a letter of “Intent to Operate” to the USFS Hoonah Ranger District (Intent to operate files
PRELIMINARY ASSESSMENT/SITE INVESTIGATION APEX AND EL NIDO MINES FINAL REPORT 5 OCTOBER 2003

held at the Hoonah Ranger District Office, Hoonah, Alaska). In 1982 Phillips Petroleum Company acquired a lease and option from Apex-El Nido Mining Company and along with geologists from the U.S. Bureau of Mines, performed a geologic field investigation of both the Apex and El Nido mine sites (Kimball 1982, North American Exploration 1982). In the late 1980’s and early 1990’s the Apex-El Nido Mining Company submitted numerous “Intent to Operate” letters and in 1992 the company submitted a substantial plan of operations that lead the USFS to perform an Environmental Assessment (EA) for the proposed mining efforts. The final EA document was released in December 1993 and the required U.S. Army Corps of Engineers (USACE) permits were obtained in the spring of 1994. The project file for the proposed mining efforts was closed in the fall of 1995 as a result of lack of follow-up and acquisition of required State and Federal permits. Although there has been much recent exploration at the Apex and El Nido mine sites, no known production has occurred since the late 1930’s. There are currently 57 claims staked in Section 23 arcording to the BLM Alaska Land Information System (ALIS) database (BLM 2003). 3.4 REGIONAL AND LOCAL GEOLOGY Extensive geologic investigations have been completed in the Northern Chichagof area and specifically in the area of the Apex-El Nido mine sites, first by A.F. Buddington in 1923 (Buddington 1923), by G.L. Holmes in 1941 (Holmes 1941), by Rossman in 1959 (Rossman 1959), by Kimball in 1982 (Kimball 1982), by the USFS in 1993 (Baer 1993), and most recently by BLM (Bittenbender et al 1999). A summary description of the geology of the site is provided below. The northwestern part of Chichagof Island is comprised almost entirely of metamorphic rocks of Mesozoic and Paleozoic age that have been intruded by dioritic plutons (Rossman, 1959). The Mesozoic rocks consist mainly of green stone, slate, schist and greywacke. The exposed Paleozoic rocks are dominantly limestone and argillite. The structural trend of the region is northwest to southwest. Deposits in the area consist of low sulfide, gold bearing, quartz veins that are controlled by northeast to east-west striking, steeply dipping faults that are discordant to the regional structure. Sulfides in the veins consist mainly of pyrite and arsenopyrite (Kimball 1982, Maas et al 1999). The principal host rock in the vicinity of the Apex and El Nido mine sites is predominately massive amphibolite that has been intruded by a large dioritic pluton. The country rock at the property consists of several types of intrusive rocks including hornblend, pyroxenite, hornblendite, hornblende gabbro, diorite, quartz diorite and aplite dike rock (Baer 1993). The Apex mine is developed in fissure type quartz veins that cut the amphibolite mass and extend into the a dioritic pluton, while the El Nido mine is developed in quartz veins that occur only within a dioritic pluton. The Apex and El Nido veins occur within the well-defined Apex and El Nido fault zones. The Apex fault strikes N 42o-60o E and dips 30o-80o NW. The El Nido fault strikes N 68o E and dips 30o to 80o SE (Rossman 1959). A large vertical fault that strikes N 65o E lies between the Apex and El Nido faults. The gold deposit of the Apex mine is developed on a fissure-type quartz vein following along the fault zone. The main ore body is found in the Apex vein, a 5 to 48-inch thick quartz vein. The vein can be
PRELIMINARY ASSESSMENT/SITE INVESTIGATION APEX AND EL NIDO MINES FINAL REPORT 6 OCTOBER 2003

followed for approximately 1,500 feet in a southwesterly direction away from the workings of the mine. Many of the quartz veins in the Apex system contain minor amounts of sulfide minerals and gold. The most common metallic minerals other than gold in this system are pyrite, arsenopyrite, chalcopyrite, galena, sphalerite, and tetrahedirte (Rossman 1959). Free gold occurs along shear zones and fractures in the quartz veins. During a geologic investigation in 1982, five samples collected from ore passes in the Apex mine contained between 2.83 and 0.185 ounces per ton (oz/ton) gold, with the average being 0.80 oz/ton gold (Kimball 1982, North American Exploration 1982). Past production records for the Apex mine indicate that the average mine grade was between 0.945 to 1.32 oz/ton gold (North American Exploration 1982). The El Nido mine also lies on a fissure-type quartz vein and follows along the El Nido fault. Multiple dikes occur within the fault zone. The El Nido vein can be traced on the surface for approximately 2500 feet southwest of the mine workings. The vein is characterized by alternating light colored bands of quartz and darker-colored bands of gouge, formed from pulverized sulfide, talc and chlorite (Rossman 1959). Traces of free gold have reportedly been found at this site, signaled at many places by a distinctive green stain on the surrounding quartz. Scheelite, a valuable tungsten-bearing mineral, has also been documented in the El Nido mine (Reed 1949, Williams 1955, Rossman 1959, Kimball 1982). Observations made during the PA/SI site visit indicate the Apex waste rock to consist of approximately 85% to 90% amphibolite with less than 5% diorite and less than 5% quartz vein. The El Nido waste rock consists of approximately 75% to 80% diorite, 5% marble, 5% to 10% amphibolite and 5% quartz vein. Significant free calcium carbonate veins were observed in ore rock and in situ country rock around and above the Apex workings. The presence of calcium carbonate could be expected to provide some buffering of sulfide-related acidity. 3.5 SOILS Soil development in the Northern Chichagof Island area is influenced by moderately-low soil temperature, high levels of rainfall, cool summer temperatures and a short growing season (USFS Draft EIS for the Chichagof Roadless Area). Steeper slopes tend to have rocky soils with relatively good drainage, and gentler slopes generally contain muskeg exhibiting poorly drained highly organic soils. The Apex and El-Nido mine workings lie in areas of steep slopes, just below timberline. These areas are relatively unstable, as evidenced by talus slopes and areas of rockfall or sliding. The upper camp lies in an area of transition between steeper slopes and muskeg, and exhibits deep organic peat-rich soils with very poor drainage. The mill site lies on bedrock, and on moderately steep slopes adjacent to Cann Creek. Soils in this area appear to be moderately well drained and rocky, but do not exhibit the instability of the higher slopes around the mine workings. The area between the mill and Lisianski Inlet is moderately sloped, and contains a mixture of poorly drained muskeg areas and moderately well drained rocky soils.
PRELIMINARY ASSESSMENT/SITE INVESTIGATION APEX AND EL NIDO MINES FINAL REPORT 7 OCTOBER 2003
3.6 SURFACE HYDROLOGY The Apex-El Nido mine sites lie in a glacial basin roughly 3 square miles in size (USFS 1993). The highest elevation of the watershed is 3000 feet. Cann Creek lies along the access corridor to each mine site. The headwaters of Cann Creek between 1,000 and 3,000 feet elevation are primarily high gradient, contained or high gradient alluvial channels. The upper sections are capable of carrying large sediment loads during spring and fall runoff peaks. At approximately 800 feet elevation, a flat 10-acre depositional area has developed, probably due to glacially-influenced topography of the upper basin area. In this area, two apparently natural ponds have formed (Figure 3). The upper pond, nearly 2 acres in size, is very shallow. Below the El Nido portal a second, deeper pond approximatley ¼ acre in size is present. The ponds are fed by Cann Creek and other tributary streams. The lower segment of Cann Creek, between 800 and 25-foot elevations, is a high energy, steep gradient stream. A narrow channel characterizes the stream from the 25-foot elevation level down to sea level where the stream ends in an estuary. Sedimentation from Cann Creek has created a large delta at the creeks confluence with Lisiankski Inlet. During watershed investigations by the USFS in 1993, flow from both the Apex haulage tunnel and El Nido adit was reported to be approximately 130 gallons per minute (gpm) or 0.3 cubic feet per second (cfs) (USFS 1993). At the Apex haulage tunnel, the drainage flows under and around the waste rock placed there from mining activities during the 1920-30’s and mixes with other surface water within 50 feet of the tunnel. The water then flows into the upper pond described previously, where it mixes with Cann Creek. At the El Nido portal, the water flows along the waste rock pile and into the lower pond described previously, where it mixes with Cann Creek. These flow pathways were also observed during the PA/SI site visit; however, the flow from the Apex haulage tunnel was estimated at less than 0.05 cfs and the flow from the El Nido adit was estimated at less that 0.09 cfs, for a total flow of less than 0.14 cfs. According to the USFS Watershed Report, flow from the mine workings are a minor contributor to the flow of Cann Creek, which was estimated at 60 cfs in June 1993 near the 800-foot elevation. The flow in Cann Creek during the PA/SI site visit was estimated at approximately 13 cfs. 3.7 ECOLOGICAL SETTING Habitats throughout the Cann Creek drainage have been classified as being within the East Chichagof Island Biogeographic Province (USFS Draft EIS for the Chichagof Roadless Area). Specifically the sites sit in a glacial basin below timberline along the Cann Creek drainage. Topography in the area is relatively steep along the hillside near the portal entrances. The access areas traverse diverse habitats including open forest, closed forest, rock outcrop, talus slope, subalpine meadow, subalpine shrubfield, bogs, ericaceous dwarf shrub, shallow freshwater, lakeshore, riparian, wet meadow, upper beach meadow, estuarine and marine (USFS 1993). Dense western hemlock and Sitka spruce forests dominate the landscape. The understory is composed of shrubs such as red huckleberry, rusty menziesia and devils club. The forest floor is covered with a mat of mosses, liverworts and plants such as fern, bunchberry dogwood, and skunk cabbage. Salmonberry, devil’s club, alder, grasses, ferns and currants characterize streamside riparian vegetation (USFS 1993).
PRELIMINARY ASSESSMENT/SITE INVESTIGATION APEX AND EL NIDO MINES FINAL REPORT 8 OCTOBER 2003
The habitat is suitable for typical Southeast Alaska fauna. Species such as deer, bear, mink, martin, river otter, sea otter and various bird species including bald eagles may be found near the site. Lower reaches of Cann Creek support pink and chum salmon, however due to the lack of suitable gravels and pool tailouts, spawning habitat is minimal. An aquatic habitat study completed in 1993 noted the presence of salmon in the lower creek area. The mid and upper reaches of Cann Creek are thought to be incapable of supporting fish species because the steep slope, narrow channel and numerous waterfalls provide a natural barrier to upstream migration. No evidence of any resident fish above the upper camp area was observed during the PA/SI field visit, and no fish were observed in the lower reaches of the creek. A micro-invertebrate analysis completed by the USFS in 1993 showed 13 sensitive genera present at a low-elevation sampling site on Cann Creek (USFS 1993).
4.0 PREVIOUS EXAMINATIONS AND CURRENT SITE CONDITIONS
4.1 PREVIOUS INVESTIGATIONS A Plan of Operations describing proposed mineral exploration at the Apex and El Nido Mines site was submitted by Apex-El Nido Mines, Inc. to the Hoonah Ranger District in 1992. The USFS conducted an Environmental Assessment (EA) in 1992 and 1993 to assess impacts from the proposed operations. An interdisciplinary team was formed, including archaeologists, engineers, landscape architects, geologists, hydrologists, soil scientists, wildlife and fisheries biologists, botanists, mineral specialists, and transportation planners. The interdisciplinary team provided a series of reports to the USFS Hoonah District Ranger, including a detailed report on cultural resources at the mine sites, an inventory of site geology and mineralogy, a report on rare plants in the area, an aquatic habitat report, and a watershed report. A short summary for each of these reports is provided below. In December1993 the final EA, Decision Notice, and Finding of No Significant Impact were released. Cultural Resource Survey A Level III Cultural Resource Inventory was conducted in 1993 at the Apex-El Nido mine site by the USFS; the inventory included a detailed literature search and site visits. The purpose of the Level III Cultural Resource Survey was to determine eligibility for inclusion in the National Register of Historic Places. The inventory catalogs and maps specific historic mine relicts in great detail. The USFS Chatham Area Forest Archeologist recommended that the “Apex-El Nido Mine Complex” (SIT-020) was eligible for inclusion on the National Register of Historic Places. On November 1, 1993, the State Historic Preservation Officer (SHPO) concurred with the finding of eligibility. Geology, Minerals, and Caves Inventory Report In 1993 a geotechnical investigation of waste rock stability was completed. A report summarizing mineral and geologic resources for lands located within the project area, and describing waste rock dumps at the Apex and El Nido mine sites was prepared. The report describes the Apex waste rock dump as being approximately 50 to 60 feet high, constructed on a moderate slope, and containing an estimated
PRELIMINARY ASSESSMENT/SITE INVESTIGATION APEX AND EL NIDO MINES FINAL REPORT 9 OCTOBER 2003

15,000 to 18,000 cubic yards (yds3) of material. Calculations made during the PA/SI suggest that the waste rock volume in this dump is probably closer to 7,000 to 8,000 yds3. The waste rock dump was described as stable. The Apex waste dump is not located near Cann Creek, and failure of the slope would not likely deposit waste material into the creek. The El Nido waste rock dump is constructed on a relatively steep slope above Cann Creek and is described in the report as containing an estimated 8,000 to 10,000 cubic yards of material. Calculations conducted during the PA/SI suggest that the volume of the El Nido waste rock dump to be closer to 3,000 to 4,000 yds3. A section of the El Nido dump has had a slope failure in the past, sending material roughly 70 to 100 feet down-slope. The failure may have been caused by water runoff from the El Nido portal flowing over the dump face and causing the waste material to become saturated. The El Nido dump has a high potential for shallow slope failure. Rare Plants, Apex-El Nido Mine The regional botanist for the USFS prepared a Rare Plants Report for the Apex-El Nido Mine project area in 1993. Prior to field investigations, a literature search was performed, and 22 vascular plants were identified that are known or suspected to exist in the Hoonah Ranger District of the Tongass National Forest. Additionally, the U.S. Fish and Wildlife Service identified two plant species that are suspected to occur in the project area. Field studies in July and August identified one proposed sensitive plant in the project area, the Choris bog orchid (Platanthera chorisiana). The report recommended that further investigations be performed during various times of the year to determine if any additional sensitive plants exist in the area, and that the Choris bog orchid should be left undisturbed as much as possible. Apex-El Nido Watershed Report In 1993, a Watershed Report was prepared for the Apex-El Nido Mine exploration proposal. The report describes the watershed and assesses water quality within the watershed. Water quality sampling was performed to determine how past mining activity has impacted water quality at the mine site. Samples were collected from the Apex portal, from below waste rock, and from Cann Creek at 800 feet elevation. All samples were analyzed for field parameters (temperature, pH, and conductivity), total suspended solids (TSS), alkalinity, and dissolved metals (arsenic, cadmium, chromium, copper, lead, manganese, nickel, silver, and zinc). Additionally, field parameters were measured in a nearby stream, similar in size to Cann Creek; however, it is unclear from the report specifically where this data was collected. Conductivity and pH levels from the portal were similar to the values measured from a nearby stream. All samples had dissolved metals concentrations that were below the State of Alaska freshwater aquatic life criteria, except for the Apex portal sample. This sample had an arsenic concentration of 80 micrograms per liter (ug/L). The report incorrectly stated that this result exceededs State freshwater quality criteria. The State freshwater quality criterion for arsenic is 150 ug/L. The result exceed State drinking water standards (MCLs), which are 50 ug/L for arsenic. Sample results from the Watershed Report are shown in Table 1. Locations of samples are shown on Figures 5 and 6.
PRELIMINARY ASSESSMENT/SITE INVESTIGATION APEX AND EL NIDO MINES FINAL REPORT 10 OCTOBER 2003

Aquatic Habitat Report; Apex-El Nido EA In 1993, an Aquatic Habitat Report was prepared for Cann Creek. Field personnel performed a survey of fish and fish habitat in the creek, collected blue mussel samples, and performed macroinvertebrate, sediment, and water quality analysis. The Cann Creek estuary was investigated, revealing chum salmon fry, pink salmon fry, and juvenile saltwater sculpin in the intertidal zone. The creek contained minimal anadromous fish spawning habitat and moderate rearing habitat. Three mature bald eagles, one sea otter, and one river otter were also observed. To assess water quality of the creek, a transect of five macroinvertebrate samples and three fine sediment/water quality samples were collected. Thirteen sensitive genera of macroinvertebrate were present in the creek, indicating high water quality. Microtoxicity analysis of the sediment and water quality samples did not reveal any exceedences relative to sediment and surface water criteria. Tissue samples collected from blue mussels were analyzed for polycyclic aromatic hydrocarbons (PAHs) and ten heavy metals (arsenic, cadmium, chromium, copper, lead, mercury, nickel, selenium, silver, and zinc). Mussel tissue sample results for Cann Creek are shown in Table 2. Sample locations are shown on Figure 6. When compared to current mean concentrations of these constituents in bivalve tissue samples from 183 sites throughout the coastal United States (NOAA Blue Mussel Watch Program values, Table 2) (NOAA 2003), the reported PAH concentrations are shown to be very low. Seven of the ten metals concentrations were also below or approximately consistent with the current NOAA Mussel Watch mean values for those constituents. Cadmium, chromium and copper values were detected at slightly elevated concentrations relative to the national NOAA mean, generally on the order of two to three times the national mean value. This may be due to naturally high background concentrations or a tendency of this specific strain of blue mussel to bioaccumulate these metals at higher concentrations. 4.2 CURRENT SITE CONDITIONS URS and USFS personnel visited the site between July 10 and 12, 2003. URS personnel included Mark Vania, Environmental Scientist; and, Mike Gray, Geologist. USFS personnel included Ken Maas, Geologist; Gary Sonnenberg, Environmental Engineer; and, Pat Bauer, Archaeologist. Weather conditions were clear with temperatures in the mid 60s. Variable morning ground fog on the 11th and 12th lifted by 10:30 AM. The site was dry and the water level in Cann Creek was relatively low, relative to established creek banks. Historical site information, mainly consisting of a 1941 site map drawn by G.L. Holmes was used in conjunction with the 1993 Cultural Resource Survey to identify and evaluate site features. Figure 2 shows the site layout based on information contained in the Cultural Resource Survey, and Figures 3 and 4 show the site layout as it existed in 1941. Site photographs are attached to this report. Copies of URS field notes are provided in Appendix A. The observed condition of site features were much as described in the 1993 survey. Additional degradation to the upper camp was evidenced by the partial collapse of the cabin reported to be standing
PRELIMINARY ASSESSMENT/SITE INVESTIGATION APEX AND EL NIDO MINES FINAL REPORT 11 OCTOBER 2003

in 1993. That structure was noted to be partially collapsed. The condition of the remainder of the upper camp appeared to be as described in the1993 survey. A description of current site conditions is as follows: Beach Camp and Lower Cann Creek Area - The beach camp and lower Cann Creek was observed to be much as described in the Cultural Resource Report and USFS EA documents from 1993. The original beach camp site is located in a small cove northwest of the mouth of Cann Creek. Features identified at the beach camp site included dilapidated ruins of three former buildings. Two of the former buildings are believed to be a shop and a garage, based on the G.L. Holmes map. The nature of the third structure is unknown; however, assumed to be housing. Concrete pillars, a truck chassis, a car chassis, a winch, a drum, and other miscellaneous small items area also present. The remains of a platform or dock and a possible ramp are located adjacent to a small pond in the intertidal area. The corduroy road begins near the pond, and winds uphill to the mill site toward the southwest. Lower Cann Creek lies over a low ridge to the southeast of the former beach camp, in another small cove. Another site, identified as “old abandoned camp” on the G.L. Holmes map, is apparently present in that area; however this feature was not observed during the PA/SI site visit. Lower Cann Creek flows much slower than the mid sections near the mill as it approaches the intertidal zone of Lisianski Inlet. Small riffles, pools and gravel bars are typical of this area. Several dry flood channels were observed, indicating that the creek flows in a somewhat braided channel under high water conditions. Mill Site and Mid-Cann Creek Area - The mill site is located approximately 1-mile southwest of the former beach camp, up Cann Creek and at the end of the corduroy road. The mill appeared to be much as described in the Cultural Resource Survey. Some additional items not identified in the 1993 survey were observed, including a ball mill and balls, the ruins of a retort house, and the ruins of an assay shop. The locations of the retort house and assay shop were established from the 1941 site map and visible evidence of former structures. Several intact crucibles were found adjacent to the assay shop, further confirming its former function. The ruins of a guard shack and/or small bunkhouse are present across Cann Creek approximately 400 feet from the mill. The corduroy road connecting the mill with the beach camp has likely degraded somewhat since 1993, and its condition varies significantly along its length. The road is currently locatable in several discontinuous sections between the mill and beach camp. The corduroy road is approximately 1 ½ miles in length, and crosses Cann Creek three times as it winds up the valley to the mill. The middle section of Cann Creek near the mill is a high-energy stream, flowing through narrow channels carved in bedrock. Numerous waterfalls are present. The nature of the creek changes somewhat approximately 1,500 feet downstream from the mill, where it becomes lower energy, flowing over gravel bars. Several dry flood channels are present in the middle sections of the creek, most notably at the mill, where a large dry channel is carved directly below the former mill structure, curving toward the north before it rejoins the main stream channel approximately 500 feet downstream. Based on vegetation in the
PRELIMINARY ASSESSMENT/SITE INVESTIGATION APEX AND EL NIDO MINES FINAL REPORT 12 OCTOBER 2003

dry channel and the general appearance of the gravel deposits, the dry channel probably only contains water during flood events. Upper Camp and Upper Cann Creek Area – The upper camp is located approximately 1,600 feet southwest of the mill, up a very steep hill. The upper camp is also located on Cann Creek, near the point that the creek flows out of the upper basin area. The upper camp is much as described in the 1993 Cultural Resource Survey, with some additional degradation of site features apparent since that time. The ruins of a kitchen, bunkhouse, cabin and industrial center are identifiable. Several other smaller features are also present, including an ore bin, a small pile of ore, and various tram components. The small cabin identified as standing in 1993 has collapsed. Several drums are present near the center of the industrial center, along with numerous metal, wood and rubber artifacts. Upper Cann Creek from the area near the upper camp upstream beyond the site flows at a lower rate than downstream near the mill. The flow is generally through small rifles and pools, with small gravel bars present. Flow in Cann Creek was estimated at approximately 12 to 13 cfs at three separate locations, significantly down from the reported 60 cfs measured in 1993. El Nido Workings - The El Nido haulage tunnel was open at the time of the site visit. USFS personnel reported the tunnel to be passable to at least 100 feet, where unstable conditions were encountered. The upper El Nido adit was not visited, but was observed along the east edge of a prominent gully about 500 feet west and 200 feet uphill of the haulage tunnel portage. As reported in the 1993 Watershed Report, water was flowing from the El Nido adit. It is estimated that the flow at the time of the PA/SI visit was less than 0.09 cfs. The waste rock dump at the El Nido workings was estimated to contain approximately 3,000 to 4,000 yds3 of material. Apex Workings - The Apex haulage tunnel and lower adit were blocked with rocks. Water was flowing from the Apex haulage tunnel at an estimated rate of less than 0.05 cfs. This is apparently less than the flow from the Apex haulage tunnel (referred to as the Apex adit) estimated in 1993. No water was observed to be flowing from the lower Apex adit, and no evidence of past flow from that opening was observed. Water from above the Apex workings was cascading down the rock face adjacent to the lower adit, where it infiltrated into talus along the slope below the adit. The upper Apex adit located above 1,300 feet elevation could not be accessed because of its location on a steep rock face. Several stopes developed along the surface exposure of the Apex vein were either blocked with rotten timbers and lagging, left partially open, or were completely open and supported with stulls. One open stope above the lower Apex adit was observed to be open to a depth of approximately 15 feet horizontally, and supported with intact stulls. The stope is relatively inaccessible due to its location on a steep rock face. The waste rock dump at the Apex haulage tunnel was estimated to contain approximately 7,000 to 8,000 yds3 of material.
PRELIMINARY ASSESSMENT/SITE INVESTIGATION APEX AND EL NIDO MINES FINAL REPORT 13 OCTOBER 2003
5.0 HAZARD RANKING SYSTEM The Hazard Ranking System (HRS) is a tool used by EPA’s Superfund program to place sites on the National Priority List. The HRS assesses the relative threat to human health or the environment associated with actual or potential hazardous substance releases to the environment. The HRS generates a relative rather than absolute measure of risk as compared to those sites already listed on the NPL. Factors that affect an HRS score include the specific pathways and identified targets that may be affected by a hazardous substance. The HRS does not consider Clean Water Act substances (BLM 1998). 5.1 ECOLOGICAL TOXICITY OF SITE CONTAMINANTS The minimum standard to assess if a contaminant release has occurred is if analytical results are greater than three times background levels for a particular substance in the same media. If background concentrations are not detected, then any concentration observed above detection limits is considered a potential release (PRC 1996 as cited in BLM 1998). For the purpose of evaluating the significance of an identified release, sample data is compared to regulatory cleanup levels for the media of concern. The Alaska State Freshwater Criteria (ADEC 1999) were used to evaluate surface water samples. For Resource Conservation and Recovery Act (RCRA) listed metals, these criteria default to EPA National Recommended Water Quality Criteria (USEPA 2002). State of Alaska Method 2 Soil Clean-up Criteria (over 40-inch zone, migration to groundwater) as presented in 18 AAC 75 were used to evaluate soil data. Surface water samples were analyzed for eight RCRA metals and hardness. Soil samples were analyzed for RCRA metals or DRO/RRO, depending on the location sampled. TCLP tests were performed on selected samples to qualitatively assess the potential mobility of metals. Specific sampling targets are discussed in Section 6. Background and control samples were taken to establish a baseline upon which to compare samples containing metals. No background sampling was performed for hydrocarbons. 5.2 CONTAMINANT MIGRATION PATHWAYS The potential threat of a hazardous substance release to a particular target must be determined (BLM 1998). The surface water and soil pathways were directly evaluated at the Apex/El Nido mine sites through sampling and analysis of environmental samples. Groundwater and air migration pathways were not considered for this investigation. There is no recorded groundwater use in or near the Cann Creek watershed. No year-round population or drinking water wells are known to exist in the watershed. The nearest population center is Pelican, located across Lisianski Inlet approximately 3 miles from the site. The only apparent tailings deposits identified at the site are beneath flood deposits at the mouth of Cann Creek. The vegetative cap eliminates wind-blown transport as a potential pathway across the site.
PRELIMINARY ASSESSMENT/SITE INVESTIGATION APEX AND EL NIDO MINES FINAL REPORT 14 OCTOBER 2003

5.3 TARGETS Human and environmental targets may potentially be affected by hazardous substances from the site. Recreational visitors may visit the site occasionally. The presence of the mines is well known to local residents, several of whom have staked claims at the site (URS 2003). There are no recreational cabins in the drainage, and the difficulty of the hike from Lisianski Inlet to the mine workings apparently limits most visitors to the mill site and below (URS 2003). There is little evidence of significant recreational use of the site. Very little contemporary litter was observed during the field visit. There is a potential for site visitors to consume water from Cann Creek or its tributaries. There are several potential environmental targets at or near the site. These include anadromous fish utilizing lower Cann Creek, transient and resident wildlife in the area, and invertebrate life along the shoreline of Lisianski Inlet. There are no sensitive environmental areas designated by the Alaska Costal Management Program near the site (ADNR 2003). The Alaska Dept. of Fish and Game (ADF&G) identified tanner crab and groundfish fisheries in Lisianski Inlet. These are active but not primary fisheries. Abalone and dungeness crab fisheries in upper Lisianski Inlet have been discontinued due to low populations (ADF&G 1986). Anadroumous fish have been reported in Cann Creek (USFS 1993); however, the creek is not listed as an anadromous fish stream by ADF&G (ADF&G 1982). Transient and resident wildlife may be present in this area; however, no critical habitat has been identified for Federally designated threatened and endangered (T&E) species near the site. The only Federally designated terrestrial T&E species that may reasonably be expected to occur in the project area is the American peregrine falcon. This species visits during seasonal migration and there are no known nesting sites throughout all of Southeast Alaska (USFWS, 1997). Bald eagle nesting sites are reportedly present on the southeastern shore of Lisianski Inlet; however, no eagles were seen near the site during the site visit. There is no designated habitat used by State listed T&E species in Lisianski Inlet (ADF&G, 1997). The humpback whale and Stellar sea lions may be transient visitors to the area, but no designated habitat is present in Lisianski Inlet. The intertidal areas at the mouth of Cann Creek are sensitive environments/wetlands (NOAA 2001) that may be affected by hazardous substances leaving the site. 5.4 HRS DATA GAPS Sampling of selected surface water was completed in 1993 as described in the Apex – El Nido Watershed Report in 1993 (Beilharz 1993). Blue mussel tissues were sampled and analyzed for metals during the 1993 EA (USFS 1993). A full evaluation of the site was not completed. Data gaps remaining included the following:
• Full evaluation of surface water quality was not completed;
PRELIMINARY ASSESSMENT/SITE INVESTIGATION APEX AND EL NIDO MINES FINAL REPORT 15 OCTOBER 2003

• Evaluation of soil and sediment quality was not completed; • Evaluation of potential contaminant source areas was not completed; • Evaluation of tailings distribution was not completed; • Evaluation of the acid generating potential of waste rock stockpiles was not completed; • Full evaluation of potential targets and exposure pathways was not completed; • Full evaluation of physical hazards was not completed; and, • A Removal Action Assessment was not performed.
6.0 PA/SI SAMPLING PROGRAM
6.1 OVERVIEW Four surface water samples, thirteen soil samples and three waste rock samples were collected to evaluate potential releases of hazardous materials or acid rock drainage potential. The samples included one background surface water and five background soils/sediments to establish a baseline for naturally occurring metals concentrations. The remaining surface water and soil/sediment samples were collected from potentially impacted areas of the site to assess the presence of hazardous materials. Waste rock sampling was conducted to assess the potential for acid rock drainage. Sample locations were generally defined in the project Work Plan, and were further refined in the field based on historical information and observed site conditions. All soil and sediment samples were collected from depths of between 3 and 6 inches below ground surface. The sampling program was designed to address known data gaps, given the previous data collected at the site. All surface water, soil and sediment samples were collected using dedicated equipment to prevent cross contamination. Duplicate samples were collected at a frequency of 10 % for quality control purposes. Samples were collected, stored and transported under documented chain-of-custody procedures. Sample locations are shown on Figures 5 and 6. All surface water and soil samples were analyzed by Columbia Analytical Services of Vancouver, Washington. These samples were transported under documented chain-of-custody procedures. Analyses included eight RCRA metals (Arsenic, Barium, Cadmium, Chromium Lead, Mercury, Selenium and Silver) by EPA 6000/7000 series methods on all waters and selected soils, Toxicity Characteristic Leaching Procedure (TCLP) by EPA Method 1311 on two soils, diesel range organics (DRO) by Alaska method AK 102, residual range organics (RRO) by Alaska method AK103 on selected soils, and hardness on all waters. The waste rock samples were analyzed by ALS/Chemex of Vancouver, B.C. for acid-base accounting using a modified Sobek method. 6.2 BACKGROUND SAMPLES Background surface water and soil samples were collected as part of this investigation to evaluate baseline conditions. Background sample locations were carefully selected to provide data representative of true background conditions. The background surface water sample (AMSW-1) was collected from an unnamed stream originating in the basin above the Apex Mine workings. This location was selected because it most closely represents the host rock at the site, and because it was unlikely to have been
PRELIMINARY ASSESSMENT/SITE INVESTIGATION APEX AND EL NIDO MINES FINAL REPORT 16 OCTOBER 2003

impacted by mine-related activities. Background soil/sediment samples (AMSS-1BG through 5BG) were collected from various locations around the upper basin of the site. Two background samples (AMSS-2BG and AMSS-3BG) were collected from Cann Creek and tributary sediment, and three background samples (AMSS-1BG, AMSS-4BG and AMSS-5BG) were collected from upland soils representative of the site. 6.3 PRIMARY SAMPLES 6.3.1 Surface Water In addition to the background surface water sample, three primary surface water samples were collected for the purpose of evaluating mine-related impacts to water quality. One duplicate surface water sample was collected for quality control purposes. All water samples were tested for RCRA metals and hardness. At each surface water sample location, a non-filtered sample was collected to characterize total metals, and a filtered sample was collected to characterize dissolved metals. Water pH, temperature, conductivity, salinity, turbidity, total dissolved solid content and dissolved oxygen content were measured at each water sample location using a Horiba direct reading instrument. Primary surface water sample AMSW-2 was collected from Cann Creek at the outflow of the upper basin area, roughly adjacent to the upper camp. The intent of this sample was to characterize potential impacts to water quality that originate at the mine workings or as a result of leaching from waste rock piles. Primary surface water sample AMSW-3 was collected from Cann Creek approximately 175 feet from the mill. The intent of this sample was to characterize potential impacts to water quality that originate at the mill. Primary surface water sample AMSW-4 was collected from Cann Creek above the zone of tidal influence near the beach camp. One duplicate surface water sample (AMSW-5) was also collected at this location for quality control purposes. The intent of this sample was to characterize water quality in Cann Creek at the discharge point to Lisianski Inlet, and to evaluate any potential impacts originating below the mill. 6.3.2 Soil In addition to the five background soil samples, eight primary soil samples were collected for the purpose of evaluating the presence and nature of hazardous substances. Two duplicate samples were also collected for quality control purposes. Primary soil samples AMSS-6 and AMSS-7 were collected from the “industrial center” located at the upper camp to assess the potential presence of hydrocarbon contamination. Sample AMSS-6 targeted soil beneath several empty drums, and sample AMSS-7 was collected to assess migration of contaminants from the potential source area near the drums. Sample AMSS-7 was located approximately 25 feet from sample AMSS-6, just outside the footprint of the former industrial center. One duplicate soil sample
PRELIMINARY ASSESSMENT/SITE INVESTIGATION APEX AND EL NIDO MINES FINAL REPORT 17 OCTOBER 2003

(AMSS-8) was collected from the same location as AMSS-7. Soil at both locations appeared to be relatively high in organic content. All three samples were analyzed for diesel range organics (DRO) and residual range organics (RRO). Primary soil samples AMSS-9 and AMSS-11 were collected from the mill site to assess the potential presence of metals contamination. Sample AMSS-9 targeted potential impacts associated with the former assay shop, and was collected approximately 15 feet down slope from that former structure. Sample AMSS-11 targeted potential impacts associated with the former retort house, and was collected approximately 5 feet down slope from that former structure. Both of these former features were identified as potential sources of metals impacts. Both samples were located approximately 50 to 100 feet upslope from a dry flood channel in Cann Creek on a heavily vegetated slope. One duplicate soil sample (AMSS-10) was collected from the same location as AMSS-9. All three samples were analyzed for RCRA metals. Sample AMSS-9 was further tested for leachable metals using TCLP. Primary sediment sample AMSS-12 was collected from sediment in the dry stream channel below the mill site, approximately 75 feet downstream from the feature. The intent of this sample was to evaluate potential impacts from the mill site as a whole, and potential impacts on the downstream environment. This sample was analyzed for RCRA metals. Primary soil samples AMSS-13, AMSS-14 and AMSS-15 were collected from the lower reaches of Cann Creek, near the beach camp. These samples were intended to evaluate the potential presence of tailings and mine-related metals impacts on sediment deposited near the mouth of Cann Creek. Llower Cann Creek, near Lisianski Inlet was the only location where tailings were found. The full extent of tailings in this area was not delineated during this investigation. All three samples from this area were analyzed for RCRA metals. Sample AMSS-13 was further tested for leachable metals using TCLP. 6.3.3 Waste Rock Three waste rock samples were collected to evaluate the acid generating potential of waste rock by static acid base accounting procedures. Waste rock sample AMWR-1 was collected from the waste rock pile located below the Apex Mine haulage tunnel. This sample is believed to represent approximately 7,000 to 8,000 yds3 of waste rock. Waste rock sample AMWR-2 was collected from the waste rock pile located below the El Nido Mine workings. This sample is believed to represent approximately 3,000 to 4,000 yds3 of waste rock. Waste rock sample AMWR-3 was collected from a small stockpile of ore rock at the ore bin located at the upper camp. This sample directly represents approximately 3 to 4 yds3 of material at that location, and is assumed to be fairly representative of ore mined at the site.
PRELIMINARY ASSESSMENT/SITE INVESTIGATION APEX AND EL NIDO MINES FINAL REPORT 18 OCTOBER 2003
7.0 ANALYTICAL RESULTS This Section describes the results of field screening and laboratory analysis for surface water, soil and waste rock collected during the site investigation portion of this project. Surface water, soil and waste rock results are summarized in Tables 3, 4 and 5, respectively. Results of previous site investigations are discussed in Section 4, and previous data is summarized in Tables 1 and 2. For comparative purposes, applicable Alaska Department of Environmental Conservation (ADEC) Method 2, over 40-inch zone, migration to groundwater (MGW) soil cleanup criteria and ambient water quality criteria (AWQC) for chemicals of concern are summarized in Table 6. Copies of PA/SI analytical reports are included as Appendix B. A Quality Assurance/Quality Control (QA/QC) Data Summary is included as Appendix C. Supporting laboratory QA/QC data used in completing data validation is supplied under separate cover as Attachment I. 7.1 SURFACE WATER 7.1.1 Background Field screening results for background surface water sample AMSW-1 indicate a relatively low pH of 5.94. This may be a result of sulfide-rich rock outside of the mine-influenced area. The pH for this background sample was the lowest observed in surface water at the site, and is outside the AWQC pH range of 6.5 to 9. Analytical results indicate low concentrations of arsenic, barium, chromium, lead, selenium and silver in both the unfiltered and filtered components of the background water sample (AMSW-1), with very little difference between dissolved and total fractions. Barium, chromium, lead and silver concentrations are similar to the concentrations of those metals in the other three surface water samples, all of which were collected from Cann Creek. The arsenic concentration in the background sample (0.16 and 0.23 ug/L) is an order of magnitude lower than the concentration of arsenic in Cann Creek samples. All background metals concentrations are below AWQCs. 7.1.2 Primary Samples Field screening results show the pH of the three primary surface water samples to be relatively neutral, ranging from 6.23 to 7.28. Analytical results for RCRA metals indicate low concentrations of arsenic (7.00 to 8.54 ug/L), barium (0.129 to 0.394 ug/L), cadmium (ND to 0.008 ug/L), chromium (0.06 to 0.09 ug/L), lead (ND to 0.023 ug/L), selenium (ND to 0.2 ug/L) and silver (ND to 0.008 ug/L) in one or more of the samples. With the exception of arsenic, all detected metals are present at concentrations that are very similar to observed background (AMSW-1). The reported arsenic concentration in all Cann Creek samples is more than three times higher than reported arsenic concentrations for the background location; however, still well below the 150 ug/L AWQC. All Cann Creek samples showed similar arsenic concentrations. There appears to be very little difference between filtered and unfiltered sample results, suggesting that sampled surface water contains very little suspended solids.
PRELIMINARY ASSESSMENT/SITE INVESTIGATION APEX AND EL NIDO MINES FINAL REPORT 19 OCTOBER 2003

7.2 SOIL 7.2.1 Background Analytical results for background soil show varying concentrations of all eight RCRA metals. The following represent the range of metals concentrations reported for background soils, based on the range of results for 2003 background soil samples: Arsenic - 7.6 to 53 mg/kg Lead - 1.18 to 5.61 mg/kg Barium - 2.84 to 11.8 mg/kg Mercury - 0.01 to 0.10 mg/kg Cadmium - 0.048 to 0.149 mg/kg Selenium - <0.1 to 1.7 mg/kg Chromium - 5.19 to 19.3 mg/kg Silver - 0.03 to 0.38 mg/kg These results indicate that naturally occurring levels of arsenic in soil in the site vicinity exceed ADEC MGW criteria. Arsenic, cadmium and lead values should be considered as estimates based on data validation flags. 7.2.2 Primary Samples Primary samples AMSS-6 and AMSS-7, and duplicate sample AMSS-8 collected from the industrial center at the upper camp showed potentially elevated concentrations of hydrocarbons. The samples were analyzed for DRO and RRO. The results for the three samples ranged from 500 to 6,700 mg/kg DRO and 1,100 to 5,800 mg/kg RRO. These results should be considered as estimates, based on data validation flags. These results indicate a potential release, and an exceedence of ADEC MGW criteria for DRO. It should be noted that no indication of hydrocarbon contamination (i.e. – no odor or staining) was observed in the field. Typically, hydrocarbon impacted soil showing DRO concentrations in the range reported for these samples will exhibit observable evidence of impacts, including an odor and usually staining. This, combined with the poor duplication of results between AMSS-7 and its duplicate, AMSS-8, suggests that the DRO and RRO results reported for these samples may not accurately reflect site conditions and should be considered as estimates. Soil at the locations sampled was highly organic, and it is likely that this interfered with the analysis and resulted in a high bias in reported results. This is not believed to account for all of the reported DRO and RRO, but the actual hydrocarbon content of the soil is likely less than the reported value. Review of the sample chromatograms by the laboratory indicated the presence of fuel hydrocarbons; however, the chromatogram pattern was not consistent with the diesel standard used in calibration. It is likely that the high organic content of the soil would support alternate cleanup levels that are higher than the reported DRO and RRO concentrations. Additionally, based on observations in the field, the majority of potentially impacted soil at this location is beneath the historic ruins of the industrial center and not accessible. Primary sample AMSS-9 and its duplicate, AMSS-10, collected from the assay shop near the mill site showed elevated metals concentrations. The reported concentrations of cadmium, lead and mercury exceeded three times the measured background concentrations for those metals. The concentrations of
PRELIMINARY ASSESSMENT/SITE INVESTIGATION APEX AND EL NIDO MINES FINAL REPORT 20 OCTOBER 2003
arsenic (up to 142 mg/kg), lead (up to 2,180 mg/kg), mercury (up to 6.11 mg/kg) and selenium (up to 4.4 mg/kg) exceeded ADEC MGW criteria. The reported concentrations of arsenic and lead are significantly above ADEC MGW criteria, and the concentrations of mercury and selenium are slightly above ADEC MGW criteria. The reported arsenic, cadmium and lead results should be considered estimates based on data validation flags.. Analysis for leachable metals was conducted on sample AMSS-9 using TCLP methodology. The results showed low concentrations of cadmium (0.012 mg/L) and lead (0.40 mg/L) in the leachate. These results suggest that metals at this location are relatively immobile. Sample AMSS-11, collected from the retort near the mill site also showed elevated metals concentrations. The reported mercury concentration (2.22 mg/kg) exceeded three times background and ADEC MGW criteria, and the reported arsenic concentration (69.2 mg/kg) exceeded ADEC MGW criteria. The reported arsenic concentration should be considered as an estimate based on data validation flags. Sample AMSS-12, collected from fines in the dry channel of Cann Creek approximately 75 feet below the mill site, showed elevated metals concentrations. The reported concentration of cadmium (0.462 mg/kg) exceeded three times background, and the concentration of arsenic exceeded ADEC MGW criteria. The reported concentration of arsenic (125 mg/kg) is higher than was reported for any of the upstream samples, and is significantly elevated relative to ADEC MGW criteria. The reported concentrations of arsenic and cadmium should be considered estimates based on data validation flags. Very few deposits of fine materials were observed in the creek bed above the area around the beach camp. Samples AMSS-13, AMSS-14 and AMSS-15 collected from fine sediments deposited in currently dry flood channels above the intertidal zone in the lower reaches of Cann Creek showed elevated concentrations of metals. The arsenic (647 mg/kg) and mercury (0.59 mg/kg) concentrations in sample AMSS-15 exceeded three times background, and the lead concentration in samples AMSS-13 (405 mg/kg) and AMSS-15 (44mg/kg) exceeded three times background. Arsenic concentrations in all three samples, ranging from 135 to 647 mg/kg, and lead concentrations in sample AMSS-13 exceeded ADEC MGW criteria. The reported arsenic and lead concentrations should be considered estimates based on data validation flags. Analysis for leachable metals was conducted on sample AMSS-13 using TCLP methodology. The results showed low concentrations of barium (0.6 mg/L) and lead (0.04 mg/L) in the leachate. These results suggest that metals in sediment att he locations sampled are relatively immobile.
PRELIMINARY ASSESSMENT/SITE INVESTIGATION APEX AND EL NIDO MINES FINAL REPORT 21 OCTOBER 2003

7.3 WASTE ROCK Acid-base accounting (ABA) data is used to determine the potential for acid generation in rock. An ABA for the waste rock samples collected from the site was completed according to a modified Sobek method. The fundamental principles of the ABA comprise two distinct measurements:
• Determination of the neutralization potential (NP) of the material; and, • Calculation of the acid potential (AP) of the material.
The difference between the two values, the Net Neutralization Potential (NNP); and the ratio of NP/AP, allow classification of the material as potentially acid producing or acid consuming (Robertson GeoConsultants). The ABA test also includes measurement of pH (paste pH) and sulfur content. The data are interpreted as follows:
• Samples with low pH are considered to be potentially acid generating; • Samples with a negative NNP or an NP/AP ratio of less than 1 are potentially acid generating; • Samples with an NP/AP ratio of 1 to 3 are considered to have an uncertain potential for acid
generation; and, • Samples with an NP/AP ratio of greater than 3 are considered to have a low potential for acid
generation (Mine Environment Neutral Drainage Program, 2001). The ABA data for the three waste rock samples collected at the site is summarized in Table 5. A copy of the laboratory report is provided in Appendix B. The results for samples from waste rock stockpiles at both the Apex and El Nido workings (AMWR-1 and AMWR-2) showed a low potential for acid generation. Both of these samples exhibited a high pH (8.9 to 9.1) and a high NP/AP ratio (11.89 and 17.45, respectively). The sample collected from the small ore pile (ore bin) at the upper camp (AMWR-3) also exhibited a high pH (8.4), but had a low NP/AP ratio (0.17), suggesting that the ore may have an elevated potential for acid generation. Ore stockpiles were not observed at any other locations at the site, and the volume of the stockpile sampled at the upper camp was estimated at approximately 1 yd3.
8.0 SOURCES AND IMPACTS TO POTENTIALLY AFFECTED TARGETS A limited amount of soil contamination was identified at the site. No measurable significant impact to surface water was identified. Potentially complete exposure pathways and possible impacts on targets for each area of identified soil contamination are discussed below. 8.1 UPPER CAMP (INDUSTRIAL CENTER) Analytical data indicate that potential hydrocarbon impacts may be present in soil beneath and immediately down slope of the former industrial center located at the upper camp. The reported concentrations of DRO in soil samples collected from this area exceed ADEC MGW criteria. As discussed previously, the DRO and RRO data for samples from the industrial center should be
PRELIMINARY ASSESSMENT/SITE INVESTIGATION APEX AND EL NIDO MINES FINAL REPORT 22 OCTOBER 2003

condsidered estimates, and are further suspect due to likely organic interference. The presence of DRO and RRO constituents at the concentrations reported, however, is not believed to pose any significant threat to human or ecological targets given the apparently limited extent and location beneath a historic structure of impacts. Additionally, given the apparent high organic content of soil in the vicinity of the upper camp, there is a good possibility that alternate cleanup levels above the reported concentrations would be applicable. 8.2 ASSAY SHOP AND RETORT HOUSE Analytical data indicate that elevated concentrations of metals are present in soil immediately down slope of the former assay shop and former retort house near the mill. These structures were essentially adjacent to one another. The reported concentrations of arsenic and lead in soil below the assay shop and arsenic, cadmium and lead in soil below the retort house exceed ADEC soil criteria. It should be noted that the arsenic, cadmium and lead values are considered estimates, based on data validation flags. Based on topographic profile of the slope below the assay shop and the distance to the dry Cann Creek channel approximately 100 feet down slope, it is estimated that a minimum of 30 yds3 and a maximum of approximately 150 yds3 of soil may be impacted with significant concentrations of arsenic and lead. Based on topographic profile of the slope below the former retort house and the distance to the dry streambed approximately 50 feet down slope, it is estimated that a minimum of 5 yds3 and a maximum of approximately 50 yds3 of soil may be impacted with significant concentrations of arsenic, cadmium and lead. It should be noted that the estimation of the maximum volume of impacted soil at each of these locations is based on significant extrapolation of data. Based on the results of TCLP analysis, the metals present are relatively immobile, and it is probable that concentrations drop off rapidly downslope from the assay shop and retort house. No evidence of active erosion of the potentially impacted slope was observed, and heavy vegetative cover is present. This suggests that no complete pathway exists between metals in soil at the assay shop and retort house and Cann Creek. Based on the elevated arsenic concentration found in sample AMSS-12 downstream from the mill, some impact from elevated metals in the vicinity of the mill may have occurred in the past. It should be noted that very little fine sediment is present in the Cann Creek streambed between the mill and the beach camp area, so the significance of an impact to sediment is limited. 8.3 LOWER CANN CREEK Based on field observations and the results of analysis, tailings deposits may be present in the lower area of Cann Creek, intermixed or beneath forest soil. Quartz-rich sands were observed in a 2 to 6-inch thick layer exposed in a dry flood channel outside of the main Cann Creek channel. The sand layers observed were stratigraphically below 6 inches to 1 foot of unsorted flood deposits. The assumption that the material observed may be tailings is based on lithology, color, texture and analytical results. Because none of the assumed tailings deposits are exposed outside of the dry creek channels, it is difficult to
PRELIMINARY ASSESSMENT/SITE INVESTIGATION APEX AND EL NIDO MINES FINAL REPORT 23 OCTOBER 2003

estimate the lateral extent or the volume that could be expected to be present. It is assumed that these deposits are spread within the lower flood channel of the creek, probably discontinuously deposited along low energy stream channels. Elevated concentrations of arsenic and lead were present in the assumed tailings material. The concentrations of both of these metals in one or more samples collected from the lower Cann Creek area exceed ADEC MGW criteria. It should be noted that the reported concentrations of arsenic and lead are considered estimates, based on data validation flags. The pattern of high metals concentrations and the texture of the material sampled suggest it to be tailings. Where sampled, the apparent tailings were present in a thin layer, approximately 2 inches thick, exposed in the cut of a dry stream channel. The apparent tailings layer was overlain by approximately 1 foot of non-tailings sand and forest soil. The lateral extent of the apparent tailings away from the stream channel is not known; however, based on the topography of the area, it is unlikely that deposition would have occurred to any significant degree more than a few feet to a few tens of feet from the current dry stream channel. Tailings were not observed on the bank of the current active stream bank, or at any location above the lower-most reaches of Cann Creek. At a higher water level than was present during the PA/SI site visit, Cann Creek would be in direct contact with the material sampled and identified as apparent tailings. Under those conditions, depending on the time of year, a complete exposure pathway could exist between that material and anadromous fish populations. Discharge of material to Lisianski Inlet could also occur; however, given the relatively small quantity of material exposed and the effect of dilution, it is unlikely that this would have any significant impact on the marine environment. Tissue samples collected in 1993 (Table 2) showed no evidence of elevated arsenic or lead concentrations, the metals found to be elevated in tailings within the Cann Creek flood channels.
9.0 REMOVAL ACTION ASSESSMENT Two objectives for conducting a PA/SI at this site were:
1) Evaluate whether CERCLA releases of hazardous substances are present, and, 2) Evaluate the need for a removal action based on the eight factors defined by 40 CFR 300.415.
As discussed in previous sections, CERCLA releases are present. The following discussion assesses the need for removal actions to be conducted.
PRELIMINARY ASSESSMENT/SITE INVESTIGATION APEX AND EL NIDO MINES FINAL REPORT 24 OCTOBER 2003

9.1 CERCLA RELEASES A contaminant concentration of three times background, or a detection at any concentration when none was detected in background indicates an “observed release” (PRC 1996 as cited in BLM 1998). Releases of hazardous substances are classified as CERCLA releases when the observed release contains CERCLA-listed contaminants. These criteria are met at the following three specific locations of the Apex and El Nido Mines site where elevated metals concentrations in soil were found:
• Beneath and down slope of the retort house near the mill where elevated concentrations of arsenic
and mercury in soil were identified; • Beneath and down slope of the assay shop near the mill where elevated concentrations of arsenic,
lead, mercury and selenium in soil were identified; and, • In the depositional areas within flood channels near the mouth of Cann Creek where assumed
tailings containing elevated concentrations of arsenic and lead were identified. An observed release of non-CERCLA contaminants may be present beneath and immediately down slope of the industrial center at the upper camp, based on DRO and RRO results. 9.2 POTENTIAL THREAT TO THE ENVIRONMENT The determination of whether a CERCLA release poses a threat requiring a removal action is based on the eight factors defined by 40 CFR 300.415:
1) Actual or potential exposure to nearby human populations, animals, or the food chain from hazardous substances, pollutants or contaminants;
2) Actual or potential contamination of drinking water supplies or sensitive ecosystems; 3) Hazardous substances in containers that may pose a threat of release; 4) High levels of hazardous substances in soils largely at the surface, that may migrate; 5) Weather conditions that may cause hazardous substances to migrate or be released. 6) Threat of fire or explosion; 7) The availability of other appropriate Federal or State response mechanisms to respond to the
release; and, 8) Other situations or factors that may pose threats to public health or welfare, or the environment.
The identified CERCLA releases at the assay shop, retort house and lower reaches of Cann Creek may meet the criteria established in items 1, 2, 4 and 5, as discussed below: 1. A complete pathway between identified CERCLA release sites and aquatic targets in Cann Creek may temporarily exist during high water events. Based on water quality sampling and the previous tissue sampling, no measurable lasting impacts to are expected.
PRELIMINARY ASSESSMENT/SITE INVESTIGATION APEX AND EL NIDO MINES FINAL REPORT 25 OCTOBER 2003

2. Under the conditions described in (1), sensitive ecosystems, including Cann Creek and intertidal areas of Lisianski Inlet may be impacted. Based on water quality sampling and previous tissue sampling, measurable lasting impacts are not expected. 4. High levels of metals in near surface soil appear to be relatively limited in extent and immobile. Under high water conditions, or in the event of increased erosion of slopes beneath the retort house and assay shop, migration of contaminants may occur. The evidence generated through this and previous studies did not indicate significant ongoing migration of contaminants from identified source areas. 5. Weather conditions in Southeast Alaska may result in temporary mobilization of contaminants. Based on the results of TCLP testing on samples from locations showing the highest metals concentrations, the solubility of metals in these areas appears to be very low. Because the solubility of the metals is low, the only significant exposure pathway to the aquatic environment is through direct erosion of metals laden soil into Cann Creek, which would only be expected to occur during flood events. Leaching of metals is not likely to have a significant impact on water quality. Water quality in Cann Creek appears to be good, with no exceedences of freshwater quality criteria. Additionally, a watershed survey of Cann Creek in 1993 concluded that water and sediment quality on the creek were good, based on observed macroinvertebrate populations. Testing of waste rock indicated that the potential for generation of acid mine drainage is very low. The ore pile that showed some potential for acid generation is of insignificant quantity to result in an adverse impact to the environment. Measured pH of surface water confirms that conditions are not remarkably acidic.
10.0 CONCLUSIONS AND RECOMMENDATIONS
Based on the findings of this PA/SI, the following conclusions are made:
• CERCLA releases or potential CERCLA releases have been identified at three areas of the site: around the assay shop and retort house near the mill, and near the mouth of Cann Creek.
• Metals-impacted soil at the retort house and assay shop appears to be limited in extent and immobile, and no identified pathway exists that would likely result in significant impacts to Cann Creek or downstream receptors. It is not believed that removal actions are warranted at this location.
• Assumed tailings deposits near the mouth of Cann Creek do not appear to be extensive, based on the observations made during the site visit. Past sampling of Lisianski Inlet mussels in the area of Cann Creek showed no evidence of impacts from metals found in tailing samples. Based on the apparent lack of impacts to surface water quality or representative shellfish tissue, it is not believed that removal actions are warranted at this location.
• A non-CERCLA observed release may be present below and adjacent to the industrial center at the upper camp, where DRO concentrations in two soil samples exceeded ADEC MGW criteria. The majority of impacted soil appears to lie beneath the historic ruins of the industrial center, and there is likely an element of organic interference in laboratory results causing a high bias in
PRELIMINARY ASSESSMENT/SITE INVESTIGATION APEX AND EL NIDO MINES FINAL REPORT 26 OCTOBER 2003

reported DRO and RRO concentrations. Soil in the area is highly organic, which would likely support alternative cleanup levels that are higher than reported DRO concentrations. It is not believed that removal actions are warranted at this location.
• The likelihood of any significant impact to identified potential targets appears to be low. Previous sampling of tissue in Lisianski Inlet at the mouth of Cann Creek showed no evidence of impacts from contaminants found to be present at the identified CERCLA release locations.
• The potential for generation of acid mine drainage from waste rock stockpiles appears to be extremely low.
• Some physical hazards exist at the site. Based on the these conclusions, the following recommendations are made:
• Consideration should be given to closing the El Nido haulage tunnel, or placement of warning
signs to discourage entry into the underground workings. • Signage may be appropriate to warn potential visitors of general physical hazards associated with
the site features in their current condition.
11.0 REFERENCES Alaska Department of Environmental Conservation (ADEC). 1999. 18 AAC 70, Water Quality
Standards. As amended through May 27, 1999. _____. 2003. Oil and Hazardous Materials Pollution Control (18 AAC 75), as amended through January 30, 2003. Alaska Department of Fish and Game (ADF&G). 1982. Anadromous Stream Catalog Maps. _____. 1982. Habitat Management Guides. Alaska Department of Natural Resources (ADNR). 2003. Alaska Coastal Management Program.
Http://www.alaskacoast.state.ak.us. Baer, R.L. 1993. Apex-El Nido Mines Inc. Proposed Mineral Plan of Operations geology, Minerals and
CAVES Inventory Report. U.S.D.A. Forest Service, Alaska Region, Chatham Area, Hoonah Ranger District.
Beilharz, M. 1993. Apex-El Nido Watershed Report, 11 November 1993. U.S.D.A. Forest Service,
Alaska Region, Chatham Area, Juneau Ranger District.
PRELIMINARY ASSESSMENT/SITE INVESTIGATION APEX AND EL NIDO MINES FINAL REPORT 27 OCTOBER 2003

Bittenbender, P.E., J.C. Still, Maas, K.M., and M.E. McDonald, Jr. 1999. Mineral Resources of the Chichagof and Baranof Islands Area, Southeast Alaska. Bureau of Land Management – Alaska Technical Report 19. 221 pp.
Brooks, A.H. 1923. Mineral Resources of Alaska: Report on Progress of Investigations in 1923. U.S.
Geological Survey Bulletin 773. Buddington, A.F. and T. Chapin. 1923. Geology and Mineral Deposits of Southeastern Alaska. U.S.
Geological Survey Bulletin 800, 398 pp. Bureau of Land Management (BLM). 1998. Final Report - Removal Preliminary Assessment, Salt
Chuck Mine, Thorne Bay Ranger District, Tongass national Forest, Region 10 – Alaska. April 1998.
_____. 2003. Alaska Land Information System (ALIS Online). Http://www.ak.blm.gov/perl-
bin/alis/twpall/get.mtrland.pl. Holmes, G.L. 1941. Apex-El Nido Mine, Lisianski Inlet, Chichagof Island, Alaska. San Francisco
California. 20 pp., plus photo pages. Huecher, B. 1993. Apex-El Nido Final Soils Report, 19 July 1993. U.S.D.A. Forest Service, Alaska
Region, Chatham Area, Hoonah Ranger District. Kimball, A. L. 1982. Mineral Land Assessment of Yakobi Island and Adjacent Parts of Chichagof
Island, Southeastern Alaska. Bureau of Mines MLA 97-82, pp. 1-47. Mine Environment Neutral Drainage Program, 2001. MEND Manual - Prediction. Volume 3. MEND
Project 5.4.2b. Natural Resources Canada, Ottawa, Ontario. January 2001. Myron, R.E. and K.S. Iwamoto. 1993. A Level III Cultural Resource Inventory of the Apex-El Nido
Exploration Project, Lisianski Strait, Chichagof Island, Alaska. U.S. Forest Service, Tongass National Forest, Chatham Area, Sitka, Alaska. Project #92-056.
National Oceanic and Atmospheric Administration (NOAA). 2001. Environmental Sensitivity Atlas,
Southeast Alaska, Environmental Sensitivity Index Maps CD set 1992/2001. _____. 2003. Blue Mussel Watch Program, Data Statistics. Http://ccmaserver.nos.noaa.gov. North America Exploration. 1982. The Apex and El Nido Gold Properties, Southeastern Alaska.15 pp,
plus appendices.
PRELIMINARY ASSESSMENT/SITE INVESTIGATION APEX AND EL NIDO MINES FINAL REPORT 28 OCTOBER 2003

PRC Environmental Management, Inc. 1996. Final Report – Granite Mine Removal Preliminary Assessment and Site Inspection, Chugach National Forest, Alaska. Delivery Order 95-3, Prepared for USDA Forest Service, Region 10, Juneau, Alaska. As cited in BLM 1998.
Reed, J.C. 1938. Some Mineral Deposits of Glacier Bay and Vicinity, Alaska. Ecomonic Geology. Vol.
33, No. 1. pp. 52-80. Reed, J.C. and R.R. Coats. 1941. Geology and Ore Deposits of the Chichagof Mining District, Alaska.
U.S. Geological Survey Bulletin 929. Reily, C. 1993. Aquatic Habitat Report, 26 August 1993. U.S.D.A. Forest Service, Alaska Region,
Chatham Area, Hoonah Ranger District. Robertson GeoConsultants Inc. Date unknown. Modified Acid Base Accounting Procedure in Test
Procedures for Field Reconnaissance Programs. HTTP://tecnology.infomine.com/enviromine/proced/modified_ABA.pdf.
Rossman, D.L. 1959. Geology and Ore Deposits of Northwestern Chichagof Island, Alaska. U.S.
Geological Survey Bulletin 1058-E, 216 pp. Stensvold, M.C. 1993. Specialist’s Report Rare Plants Apex-El Nido Mine, 29 September 1993.
U.S.D.A. Forest Service, Alaska Region, Chatham Area, Hoonah Ranger District. URS. 2003. Personal communications between M. Gray of URS and several unknown residents of
Pelican between July 11 and July 13, 2003. U.S Environmental Protection Agency (USEPA). 2002. National Recommended Water Quality Criteria:
2002. Office of Water, Publication EPA 822-R-047. November 2002. U.S. Forest Service (USFS). Draft. Tongass Land Management Plan Environmental Impact Statement,
Washington, D.C. Appendix C, pp. C2-1:C2-21. _____. 1993. Environmental Assessment, Decision Notice and Finding of No Significant Impact.
U.S.D.A. Forest Service, Alaska Region, Hoonah Area, Juneau Ranger District. U.S. Fish and Wildlife Service (USFWS). 1997. Endangered, Threatened and Candidate Species in
Alaska. Williams, J.A. 1955. Ariel Property, Sitka Quadrangel, Gold and Tungsten. U.S. Bureau of Mines
Property Examination Report. 6 pp.
PRELIMINARY ASSESSMENT/SITE INVESTIGATION APEX AND EL NIDO MINES FINAL REPORT 29 OCTOBER 2003

TABLES

TABLE 1SUMMARY OF PREVIOUS WATER QUALITY DATA
APEX AND EL NIDO MINES1993 WATERSHED REPORT
93SMS001-003 93SMS004-005 93SMS006-007 -Apex portal (haulage tunnel)
Below waste rock at Apex Mine
Cann Creek at 800 feet elevation
Headwater stream (similar to Cann Creek)
Temperature Field Measured deg C 2.7 5.0 3.0 5.0pH Field Measured - 8.2 8.4 7.0 8.4Conductivity Field Measured umhos/cm 53 46 13 42Total Suspended Solids EPA 160.2 mg/L ND (4) ND (4) ND (4) NAAlkalinity EPA 310.1 mg/L 22 19 7 NAArsenic EPA 206.2 mg/L 0.080 0.039 0.0058 NACadmium EPA 213.2 mg/L ND (0.001) ND (0.001) ND (0.001) NAChromium EPA 218.1 mg/L ND (0.050) ND (0.050) ND (0.050) NACopper EPA 220.1 mg/L ND (0.020) ND (0.020) ND (0.020) NALead EPA 239.2 mg/L ND (0.002) ND (0.002) ND (0.002) NAManganese EPA 243.1 mg/L ND (0.020) ND (0.020) ND (0.020) NANickel EPA 249.2 mg/L ND (0.020) ND (0.020) ND (0.020) NASilver EPA 272.1 mg/L ND (0.050) ND (0.050) ND (0.050) NAZinc EPA 289.1 mg/L ND (0.020) ND (0.020) ND (0.020) NA
Notes: 1. All samples collected on 6/9/93 4. deg C = degrees celsius2. ND = not detected (reporting limit shown in parentheses) 5. umhos/cm = micromhos per centimeter3. NA = not analyzed 6. mg/L = milligrams per liter
UNITSMETHODPARAMETER
RESULT

TABLE 2SUMMARY OF PREVIOUS BLUE MUSSEL TISSUE DATA
APEX AND EL NIDO MINESCANN CREEK
1993 AQUATIC HABITAT REPORT
SITE A SITE B SITE CAcenaphthene Unknown ug/kg 1.64 1.63 1.69 NAAcenaphthylene Unknown ug/kg ND (0.82) ND (0.82) ND (0.82) NAAnthracene Unknown ug/kg ND (2.23) ND (2.23) ND (2.23) NABenzo(a)anthracene Unknown ug/kg 1.86 1.87 1.87 NABenzo(a)pyrene Unknown ug/kg 1.68 1.66 1.60 NABenzo(b)fluoranthene Unknown ug/kg 2.09 2.02 2.02 NABenzo(g,h,i)anthraperylenecene Unknown ug/kg ND (2.42) ND (2.42) ND (2.42) NABenzo(k)fluoranthene Unknown ug/kg ND (0.82) ND (0.82) ND (0.82) NAChrysene Unknown ug/kg 1.02 1.06 1.06 NADibenzo(a,h)anthracene Unknown ug/kg ND (2.92) ND (2.92) ND (2.92) NAFluoranthene Unknown ug/kg 1.70 ND (1.64) 1.80 NAFluorene Unknown ug/kg ND (1.38) ND (1.38) ND (1.38) NAIndeno(1,2,3-cd)pyrene Unknown ug/kg ND (2.71) ND (2.71) ND (2.71) NANaphthalene Unknown ug/kg 2.10 2.05 2.08 NAPhenanthrene Unknown ug/kg 1.84 1.67 1.87 NAPyrene Unknown ug/kg ND (1.18) ND (1.18) ND (1.18) NASum of PAHs8 NA ug/kg 28.41 26.44 28.47 750Arsenic XRF ug/g 12.0 13.0 12.0 11Cadmium ICP-MS ug/g 6.7 8.3 7.9 3.3Chromium ICP-MS ug/g 5.1 5.4 5.5 2.3Copper XRF ug/g 7.0 6.4 7.2 2.3Lead ICP-MS ug/g 1.0 0.30 0.40 3.0Mercury CVAA ug/g 0.076 0.091 0.084 0.14Nickel ICP-MS ug/g 2.1 2.0 2.6 2.2Selenium XRF ug/g 2.3 3.2 2.3 2.8Silver ICP-MS ug/g 0.15 0.12 0.16 0.55Zinc XRF ug/g 78 61 72 2,700
Notes: 1. All samples collected 5/10/932. ND = not detected (reporting limit shown in parentheses)3. ug/kg = micrograms per kilogram (ppb); ug/g = micrograms per gram (ppm)4. XRF = x-ray fluorescence5. ICP-MS = inductively coupled plasma-mass spectroscopy6. CVAA = cold vapor atomic absorption7. Reference bivalve concentration represents NOAA nationwide mean from Blue Mussel Watch Program8. Total PAH value calculated by summing individual analytes, with minimum reporting limit value used for NDs
REFERENCE BIVALVE7 RESULTPARAMETER METHOD UNITS

TABLE 3SUMMARY OF PA/SI SURFACE WATER DATA
APEX AND EL NIDO MINES PA/SI
AMSW-5 METHOD BLANK
Total Dissolved Total Dissolved Total Dissolved Total Dissolved TotalpH Field Test -Meter (Horiba) -- 5.94 NA 6.33 NA 7.28 NA 7.23 NA 7.23 NAConductivity Field Test -Meter (Horiba) S/cm 0.016 NA 0.023 NA 0.025 NA 0.027 NA 0.027 NATemperature Field Test -Meter (Horiba) 0C 9.60 NA 11.24 NA 11.3 NA 12.5 NA 12.5 NADO Field Test -Meter (Horiba) mg/L 11.9 NA 7.9 NA 8.7 NA 9.5 NA 9.5 NASalinity Field Test -Meter (Horiba) mg/L 0.0 NA 0.0 NA 0.0 NA 0.0 NA 0.0 NATDS Field Test -Meter (Horiba) g/l 0.01 NA 0.02 NA 0.02 NA 0.02 NA 0.02 NATurbidity Field Test -Meter (Horiba) NTU 120 NA 54 NA 89 NA 100 NA 100 NAHardness EPA 6010B mg/L CaCO3 3.3 NA 9.0 NA 9.7 NA 10.6 NA 10.6 ND (0.4)Arsenic EPA 6020 ug/L 0.16 0.23 8.11 8.16 8.54 8.46 7.00 6.93 7.12 ND (0.05)Barium EPA 6020 ug/L 0.122 0.129 0.228 0.223 0.195 0.222 0.363 0.394 0.353 ND (0.007)Cadmium EPA 6020 ug/L ND (0.006) ND (0.006) ND (0.006) 0.008 ND (0.006) ND (0.006) ND (0.006) ND (0.006) ND (0.006) ND (0.006)Chromium EPA 6020 ug/L 0.06 0.08 0.09 0.09 0.08 0.08 0.09 0.08 0.09 0.04Lead EPA 6020 ug/L 0.009 0.023 0.016 0.012 0.010 0.010 ND (0.007) 0.010 ND (0.007) ND (0.007)Mercury EPA 7471A ug/L ND (0.10) ND (0.10) ND (0.10) ND (0.10) ND (0.10) ND (0.10) ND (0.10) ND (0.10) ND (0.10) ND (0.10)Selenium EPA 6020 ug/L ND (0.1) 0.1 ND (0.1) ND (0.1) 0.2 ND (0.1) 0.1 ND (0.1) 0.1 ND (0.1)Silver EPA 6020 ug/L 0.005 0.008 0.005 ND (0.004) ND (0.004) ND (0.004) ND (0.004) ND (0.004) ND (0.004) 0.013
Notes: 1. All samples collected between 7/11/03 and 7/12/03 6. DO = dissolved oxygen 11. mg/L = milligrams per liter2. ND = not detected (reporting limit shown in parentheses) 7. TDS = total dissolved solids 12. g/l = grams per liter3. NA = not analyzed 8. S/cm = siemens per centimeter 13. ug/L = micrograms per liter4. Total = Unfiltered; Dissolved = Filtered (0.45 micron filter) 9. 0C = degrees celsius 14. Shading indicates exceedence of AWQC.5. cfs = cubic feet per second 10. NTU = nephelemetric turbidity units
AMSW-1 (Background)
Approximate Flow = 13.5 cfs Approximate Flow = 12.5 cfs Approximate Flow = 13.5 cfs
AMSW-4AMSW-3AMSW-2RESULT
UNITSMETHODPARAMETER Unnamed Stream above Apex workings
Cann Crk. near Upper Camp, outflow of upper basin area
Cann Crk., approx. 175 ft. downstream of Mill
Cann Crk. downstream of Beach Camp
Duplicate of AMSW-4
Approximate Flow = 0.002 cfs

TABLE 4SUMMARY OF PA/SI SOIL DATAAPEX AND EL NIDO MINES PA/SI
AMSS-1BG AMSS-2BG AMSS-3BG AMSS-4BG AMSS-5BG AMSS-6 AMSS-7 AMSS-8Background above El Nido Workings
Background from Cann Crk. sediment, upstream from Apex Mine area
Background from unnamed stream channel above Apex workings
Background from hillside above Upper Camp
Background from hillside above Cann Crk., across from Upper Camp
Beneath empty drums at Industrial Center (Upper Camp)
Below Industrial Center building ruins (Upper Camp)
Duplicate of AMSS-7
TOTAL METALS TCLP METALS mg/kg mg/kg mg/kg mg/kg mg/kg mg/kg mg/kg mg/kg mg/kg mg/L8
Arsenic EPA 6020 20.5N, * 53.0N, * 18.3N, * 32.7N, * 7.6N, * NA NA NA 142N, VJ, * ND (0.06)Barium EPA 6020 11.8 3.21 2.84 7.65 7.13 NA NA NA 12.1 ND (0.5)Cadmium EPA 6020 0.067 0.056 0.149 0.063 0.048 NA NA NA 3.900VJ 0.012 Chromium EPA 6020 6.50 19.3 15.5 5.19 5.37 NA NA NA 7.53 ND (0.002)Lead EPA 6020 5.61* 1.18* 1.39* 2.92* 3.69* NA NA NA 2,180* 0.40Mercury EPA 7471A 0.10 0.02 0.01 0.06 0.04 NA NA NA 6.11 ND (0.0005)Selenium EPA 6020 1.7 0.5 ND (0.1) 1.5 0.8 NA NA NA 4.4 ND (0.06)Silver EPA 6020 0.13 0.03 0.08 0.38 0.16 NA NA NA 1.00 ND (0.003)DRO (C10 - C25) AK 102 NA NA NA NA NA 500Y 1000Y, VJ 6,700Y, VJ NA NARRO AK 103 NA NA NA NA NA 1,100O 1,700O 5,800O NA NA
RESULT
METHODPARAMETER
AMSS-9Small dry drainage below Assay Shop (Mill)
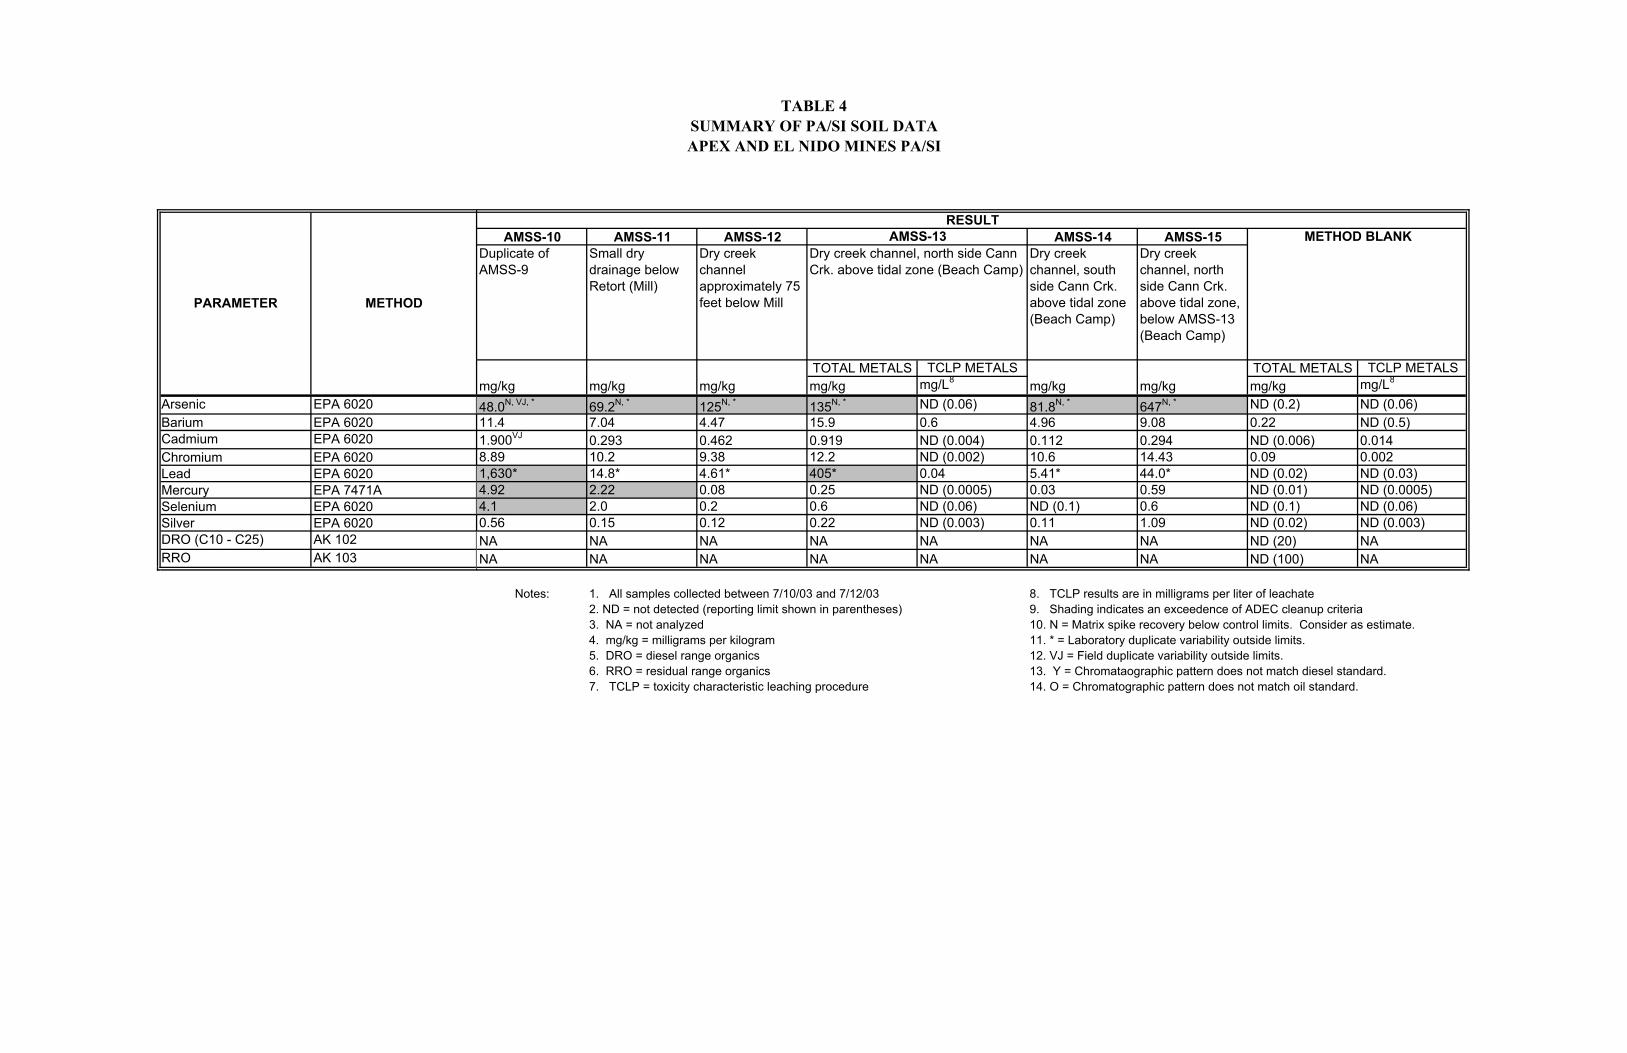
TABLE 4SUMMARY OF PA/SI SOIL DATAAPEX AND EL NIDO MINES PA/SI
Arsenic EPA 6020Barium EPA 6020Cadmium EPA 6020Chromium EPA 6020Lead EPA 6020Mercury EPA 7471ASelenium EPA 6020Silver EPA 6020DRO (C10 - C25) AK 102RRO AK 103
METHODPARAMETER
AMSS-10 AMSS-11 AMSS-12 AMSS-14 AMSS-15Duplicate of AMSS-9
Small dry drainage below Retort (Mill)
Dry creek channel approximately 75 feet below Mill
Dry creek channel, south side Cann Crk. above tidal zone (Beach Camp)
Dry creek channel, north side Cann Crk. above tidal zone, below AMSS-13 (Beach Camp)
TOTAL METALS TCLP METALS TOTAL METALS TCLP METALS mg/kg mg/kg mg/kg mg/kg mg/L8 mg/kg mg/kg mg/kg mg/L8
48.0N, VJ, * 69.2N, * 125N, * 135N, * ND (0.06) 81.8N, * 647N, * ND (0.2) ND (0.06)11.4 7.04 4.47 15.9 0.6 4.96 9.08 0.22 ND (0.5)1.900VJ 0.293 0.462 0.919 ND (0.004) 0.112 0.294 ND (0.006) 0.0148.89 10.2 9.38 12.2 ND (0.002) 10.6 14.43 0.09 0.0021,630* 14.8* 4.61* 405* 0.04 5.41* 44.0* ND (0.02) ND (0.03)4.92 2.22 0.08 0.25 ND (0.0005) 0.03 0.59 ND (0.01) ND (0.0005)4.1 2.0 0.2 0.6 ND (0.06) ND (0.1) 0.6 ND (0.1) ND (0.06)0.56 0.15 0.12 0.22 ND (0.003) 0.11 1.09 ND (0.02) ND (0.003)NA NA NA NA NA NA NA ND (20) NANA NA NA NA NA NA NA ND (100) NA
Notes: 1. All samples collected between 7/10/03 and 7/12/03 8. TCLP results are in milligrams per liter of leachate2. ND = not detected (reporting limit shown in parentheses) 9. Shading indicates an exceedence of ADEC cleanup criteria3. NA = not analyzed 10. N = Matrix spike recovery below control limits. Consider as estimate.4. mg/kg = milligrams per kilogram 11. * = Laboratory duplicate variability outside limits.5. DRO = diesel range organics 12. VJ = Field duplicate variability outside limits.6. RRO = residual range organics 13. Y = Chromataographic pattern does not match diesel standard.7. TCLP = toxicity characteristic leaching procedure 14. O = Chromatographic pattern does not match oil standard.
RESULTAMSS-13
Dry creek channel, north side Cann Crk. above tidal zone (Beach Camp)
METHOD BLANK

TABLE 5SUMMARY OF WASTE ROCK
ACID-BASE ACCOUNTINGAPEX AND EL NIDO MINES PA/SI
AMWR-1 AMWR-2 AMWR-3
Paste pH NA 8.9 9.1 8.4Total Sulfur % 0.42 0.22 0.77Acid Potential (AP) equiv. tons CaCO3/1,000 tons rock 13.1 6.9 24.1Neutralization Potential (NP) equiv. tons CaCO3/1,000 tons rock 156 120 4Net Neutralization Potential equiv. tons CaCO3/1,000 tons rock 143 113 -20NP/AP NA 11.89 17.45 0.17Fizz Ratio NA 3 3 1
SAMPLE ID/RESULT
UNITSPARAMETER Main Apex stockpile below haulage tunnel
Main El Nido stockpile below workings
Small ore pile at ore bin, Upper Camp
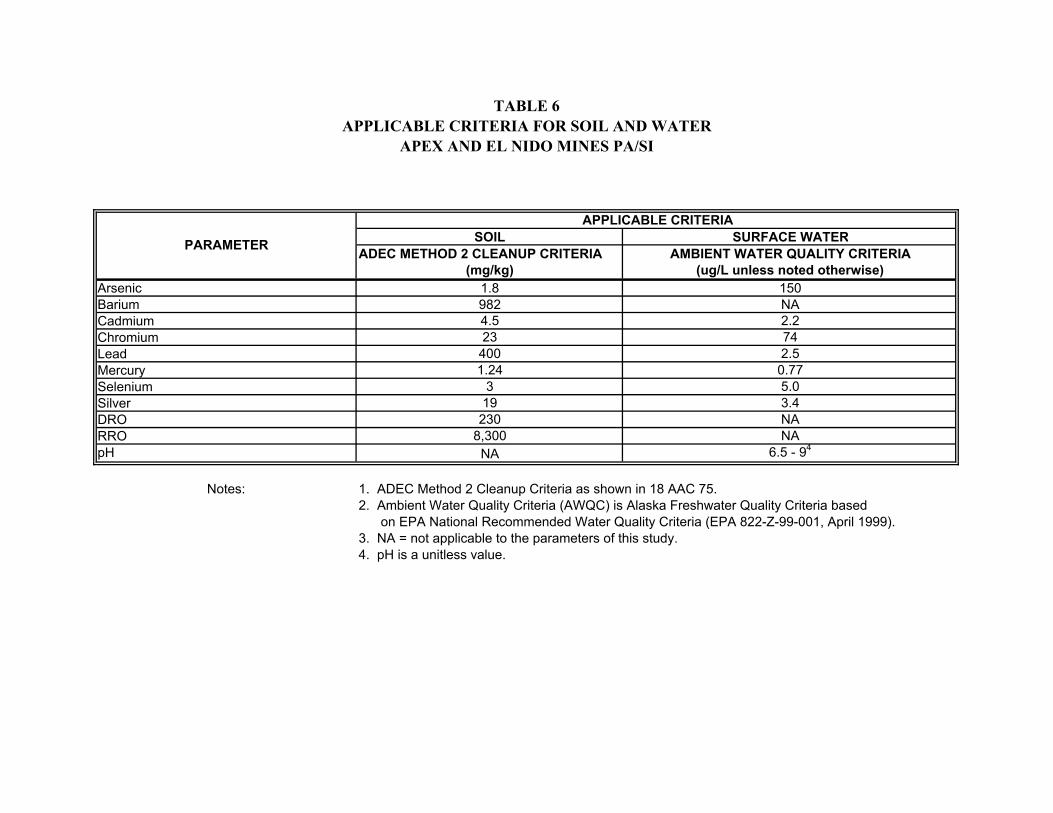
TABLE 6APPLICABLE CRITERIA FOR SOIL AND WATER
APEX AND EL NIDO MINES PA/SI
SOIL SURFACE WATERADEC METHOD 2 CLEANUP CRITERIA AMBIENT WATER QUALITY CRITERIA
(mg/kg) (ug/L unless noted otherwise)Arsenic 1.8 150Barium 982 NACadmium 4.5 2.2Chromium 23 74Lead 400 2.5Mercury 1.24 0.77Selenium 3 5.0Silver 19 3.4DRO 230 NARRO 8,300 NApH NA 6.5 - 94
Notes: 1. ADEC Method 2 Cleanup Criteria as shown in 18 AAC 75.2. Ambient Water Quality Criteria (AWQC) is Alaska Freshwater Quality Criteria based on EPA National Recommended Water Quality Criteria (EPA 822-Z-99-001, April 1999).3. NA = not applicable to the parameters of this study.4. pH is a unitless value.
APPLICABLE CRITERIA
PARAMETER

FIGURES
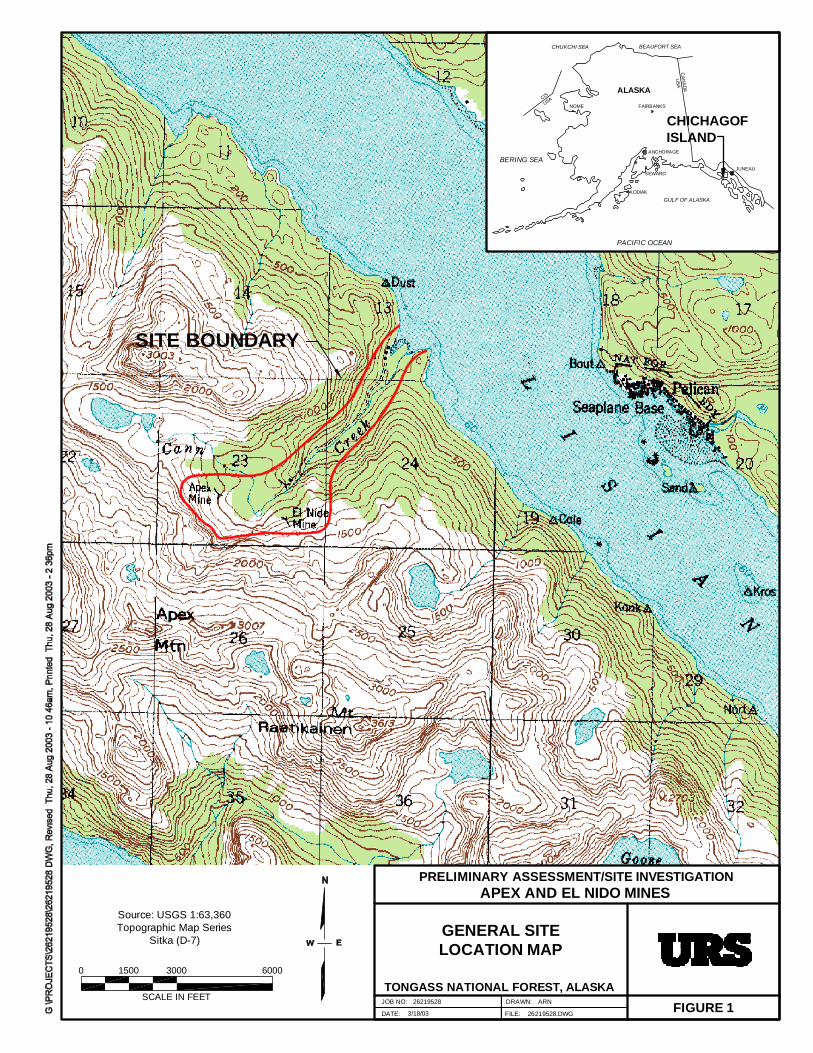
0 1500 3000 6000
SCALE IN FEET
GENERAL SITELOCATION MAP
FILE: 26219528.DWG
DRAWN:
DATE:
JOB NO:
PRELIMINARY ASSESSMENT/SITE INVESTIGATIONAPEX AND EL NIDO MINES
TONGASS NATIONAL FOREST, ALASKA26219528 ARN
3/18/03 FIGURE 1
SITE BOUNDARY
CAN
ADAU
SA
FAIRBANKS
ALASKA
NOME
ANCHORAGE
BEAUFORT SEA
SEWARD
KODIAKGULF OF ALASKA
JUNEAU
CIS
USA
BERING SEA
CHICHAGOFISLAND
PACIFIC OCEAN
CHUKCHI SEA
Source: USGS 1:63,360Topographic Map Series
Sitka (D-7)

500
1000
1500
2000
2500
1500
20002500
LISIANSKI INLET
25
20
21
4
2
1
171615
18
12
22
23
24
UPPER CAMPFEATURES 5-10
3
1413
19
0 1500 3000 6000
SCALE IN FEET
SITE LAYOUT AND FEATURES
FILE: 26219528.DWG
DRAWN:
DATE:
JOB NO:
PRELIMINARY ASSESSMENT/SITE INVESTIGATIONAPEX AND EL NIDO MINES
TONGASS NATIONAL FOREST, ALASKA26219528 ARN
3/18/03 FIGURE 2
EL NIDO MINE
APEX MINE
LEGENDCORDUROY ROAD
CREEK
TRAIL
POND OR LAKE
MINE ADIT
CANN CREEK
SITE FEATURESUPPER CAMP FEATURES5- Standing Cabin6- Bunkhouse7- Bathhouse8- Privy9- Dining Hall10- Industrial Center
BEACH CAMP FEATURES3- Term. of Corduroy Road13- Cabin Remains14- Cook Stove15- Int. Pick-up Chassis16- Winch17- Wannigan Remains18- Barge19- Pond20- Pack Trail Terminus21- Water Pipe
OTHER1- Watchman's Cabin2- 10 Stamp Mill4- Corduroy Road11- Pneumatic Line(Location Unknown)12- Pack Trail22- Aerial Tram23- Apex Portal24- El Nido Portal25- Skidroad
SOURCE: USFS (1993)

MINE WORKINGS,UPPER CAMP AND MILL
FILE: FIGS 3 AND 4.DWG
DRAWN:
DATE:
JOB NO:
PRELIMINARY ASSESSMENT/SITE INVESTIGATIONAPEX AND EL NIDO MINES
TONGASS NATIONAL FOREST, ALASKA26219528 ARN
8/12/03 FIGURE 3
BASIN
POND
TRAMWAY
TRAMWAY
UPPER ADIT
LOWER HAULAGE
HAULAGE TUNNEL
SHOP
APEX WORKINGS
EL NIDO WORKINGS
TRAMWAY
ORE BIN
MILL BUNKHOUSE/GUARDSHACK
ORE BIN
MILL
SHOP
WATER PLANTRETORT HOUSE
ASSAY OFFICE
0 200 400 800
APPROXIMATE SCALE IN FEET
CANN CREEK
SOURCE: REPORT OF G.L. HOLMES, ENGINEER, OCTOBER 1941 FEATURES SHOWN AS PRESENT IN 1941
INDUSTRIAL CENTER
LOWER ADIT
UPPER ADIT
UPPER CAMPDINING HALL
BUNKHOUSE
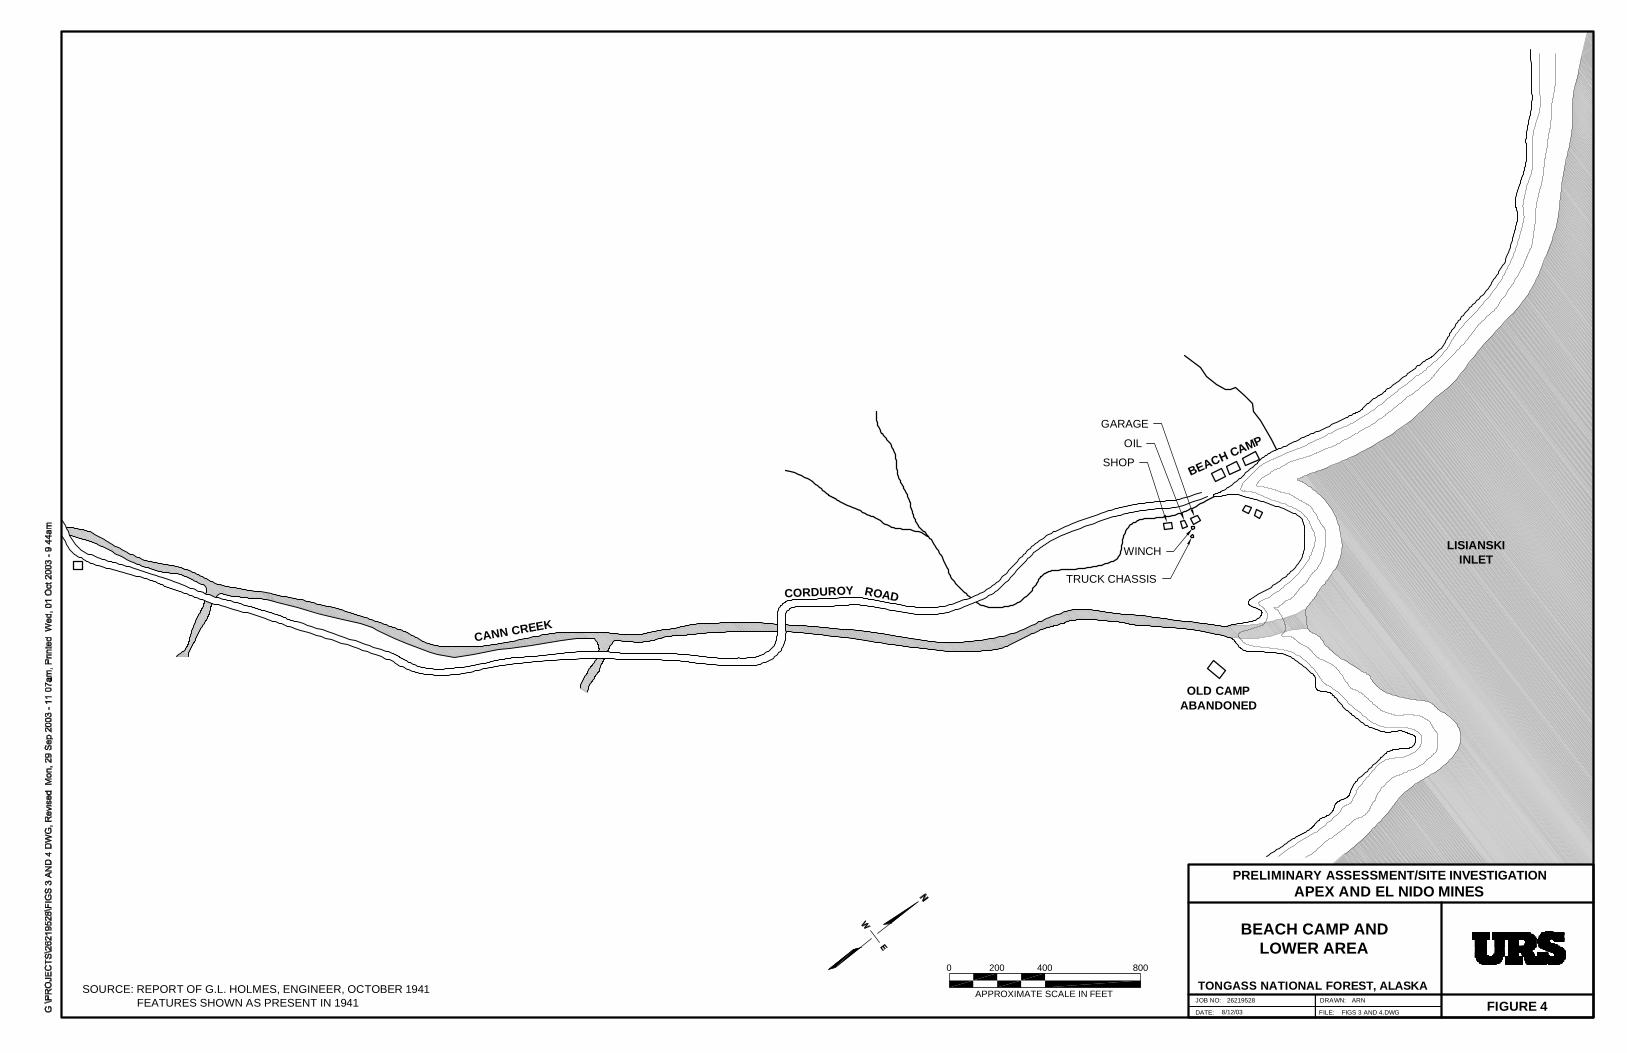
0 200 400 800
APPROXIMATE SCALE IN FEET
BEACH CAMP ANDLOWER AREA
FILE: FIGS 3 AND 4.DWG
DRAWN:
DATE:
JOB NO:
PRELIMINARY ASSESSMENT/SITE INVESTIGATIONAPEX AND EL NIDO MINES
TONGASS NATIONAL FOREST, ALASKA26219528 ARN
8/12/03 FIGURE 4
CANN CREEK
CORDUROY ROAD
SHOP
OIL
GARAGE
BEACH CAMP
OLD CAMPABANDONED
SOURCE: REPORT OF G.L. HOLMES, ENGINEER, OCTOBER 1941 FEATURES SHOWN AS PRESENT IN 1941
LISIANSKIINLET
WINCH
TRUCK CHASSIS

SAMPLE RESULTSUPPER AREA
FILE: FIGS 3 AND 4.DWG
DRAWN:
DATE:
JOB NO:
PRELIMINARY ASSESSMENT/SITE INVESTIGATIONAPEX AND EL NIDO MINES
TONGASS NATIONAL FOREST, ALASKA26219528 ARN
8/12/03 FIGURE 5
BASIN
POND
TRAMWAY
TRAMWAY
HAULAGE TUNNEL
SHOP
APEX WORKINGS
EL NIDO WORKINGS
TRAMWAY
DINING HALLORE BIN
MILL BUNKHOUSE/GUARDSHACK
ORE BIN
MILL
SHOP
WATER PLANT
RETORT HOUSE
ASSAY OFFICE
0 200 400 800
APPROXIMATE SCALE IN FEET
CANN CREEK
AMWR-3²
AMWR-2²
AMWR-1²
AMSS-5BGANALYTE:
RESULT (mg/kg):As7.6 7.13
Ba Cd0.048 5.37
Cr Pb3.69 0.04
Hg Se0.8 0.16
Ag
Ag0.131.7
SeHg0.15.61
PbCr6.50.067
CdBa11.820.5
AsRESULT (mg/kg):
ANALYTE:AMSS-1BG
Ag0.381.5
SeHg0.062.92
PbCr5.190.063
CdBa7.6532.7
AsRESULT (mg/kg):
ANALYTE:AMSS-4BG
AMSS-6ANALYTE:
RESULT (mg/kg):DRO500 1100
RRO
RRO17001000
DRORESULT 7(mg/kg):
ANALYTE:AMSS-7/8
RESULT 8(mg/kg): 6700 5800
AMSS-3BGANALYTE:
RESULT (mg/kg):As
18.3 2.84Ba Cd
0.149 15.5Cr Pb
1.39 0.01Hg Se
ND 0.08Ag
AMSS-2BGANALYTE:
RESULT (mg/kg):As53 3.21
Ba Cd0.056 19.3
Cr Pb1.18 0.02
Hg Se0.5 0.03
Ag
Ag1.004.4
SeHg6.112180
PbCr7.533.9
CdBa12.1142
AsRESULT 9(mg/kg):
ANALYTE:AMSS-9/10
0.40 ND ND NDND ND 0.012 NDRESULT 9 TLCP(mg/kg):RESULT 10(mg/kg): 8.891.911.448 0.564.14.921630
Ag0.152.0
SeHg2.2214.8
PbCr10.20.293
CdBa7.0469.2
AsRESULT (mg/kg):
ANALYTE:AMSS-11
AMSS-12ANALYTE:
RESULT (mg/kg):As125 4.47
Ba Cd0.462 9.38
Cr Pb4.61 0.08
Hg Se0.2 0.12
Ag
Ag - SILVERAs - ARSENICBa - BARIUMCd - CADMIUMCr - CHROMIUMPb - LEADHg - MERCURYSe - SELENIUMND - NOT DETECTEDNA - NOT ANALYZEDmg/kg - MILLIGRAMS PER KILOGRAM
g/L - MICROGRAMS PER LITER(¹) - RESULT IS FOR UNFILTERED SAMPLE(²) - WASTE ROCK RESULTS PROVIDED IN TABLE 5
AMSS-4BG
LEGEND
- PA/SI SOIL/SEDIMENT SAMPLE LOCATION
93SMS006-007 - PREVIOUS SURFACE WATER SAMPLE LOCATION
SOURCE: REPORT OF G.L. HOLMES, ENGINEER, OCTOBER 1941FEATURES SHOWN AS PRESENT IN 1941
AgNDND
SeHgND0.009
PbCr0.06ND
CdBa0.1220.16
AsRESULT¹( g/L):
ANALYTE:AMSW-1 (BACKGROUND)
AMSW-3ANALYTE:
RESULT¹( g/L):As
8.54 0.195Ba Cd
ND 0.08Cr Pb
0.010 NDHg Se
0.2 NDAg
93SMS004-005ANALYTE:
RESULT ( g/L):As39 NA
Ba CdND ND
Cr PbND NA
Hg SeNA ND
Ag
AgNDNA
SeHgNAND
PbCrNDND
CdBaNA80
AsRESULT ( g/L):
ANALYTE:93SMS001-003
AgNDNA
SeHgNAND
PbCrNDND
CdBaNA5.8
AsRESULT ( g/kg):
ANALYTE:93SMS006-007
AMSW-2ANALYTE:
RESULT¹( g/L):As
8.11 0.228Ba Cd
ND 0.09Cr Pb
0.016 NDHg Se
ND NDAg
INDUSTRIAL CENTER
LOWER ADIT/STOPE
UPPER ADIT
UPPER ADIT
LOWER HAULAGE
- PA/SI SURFACE WATER SAMPLE LOCATIONAMSW-2
BOLD VALUES EXCEED ADEC METHOD 2 MGW CLEANUP LEVELS
BUNKHOUSE
As, Cd, Pb, DRO AND RRO VALUES SHOULD BE CONSIDERED ESTIMATES
UPPER CAMP
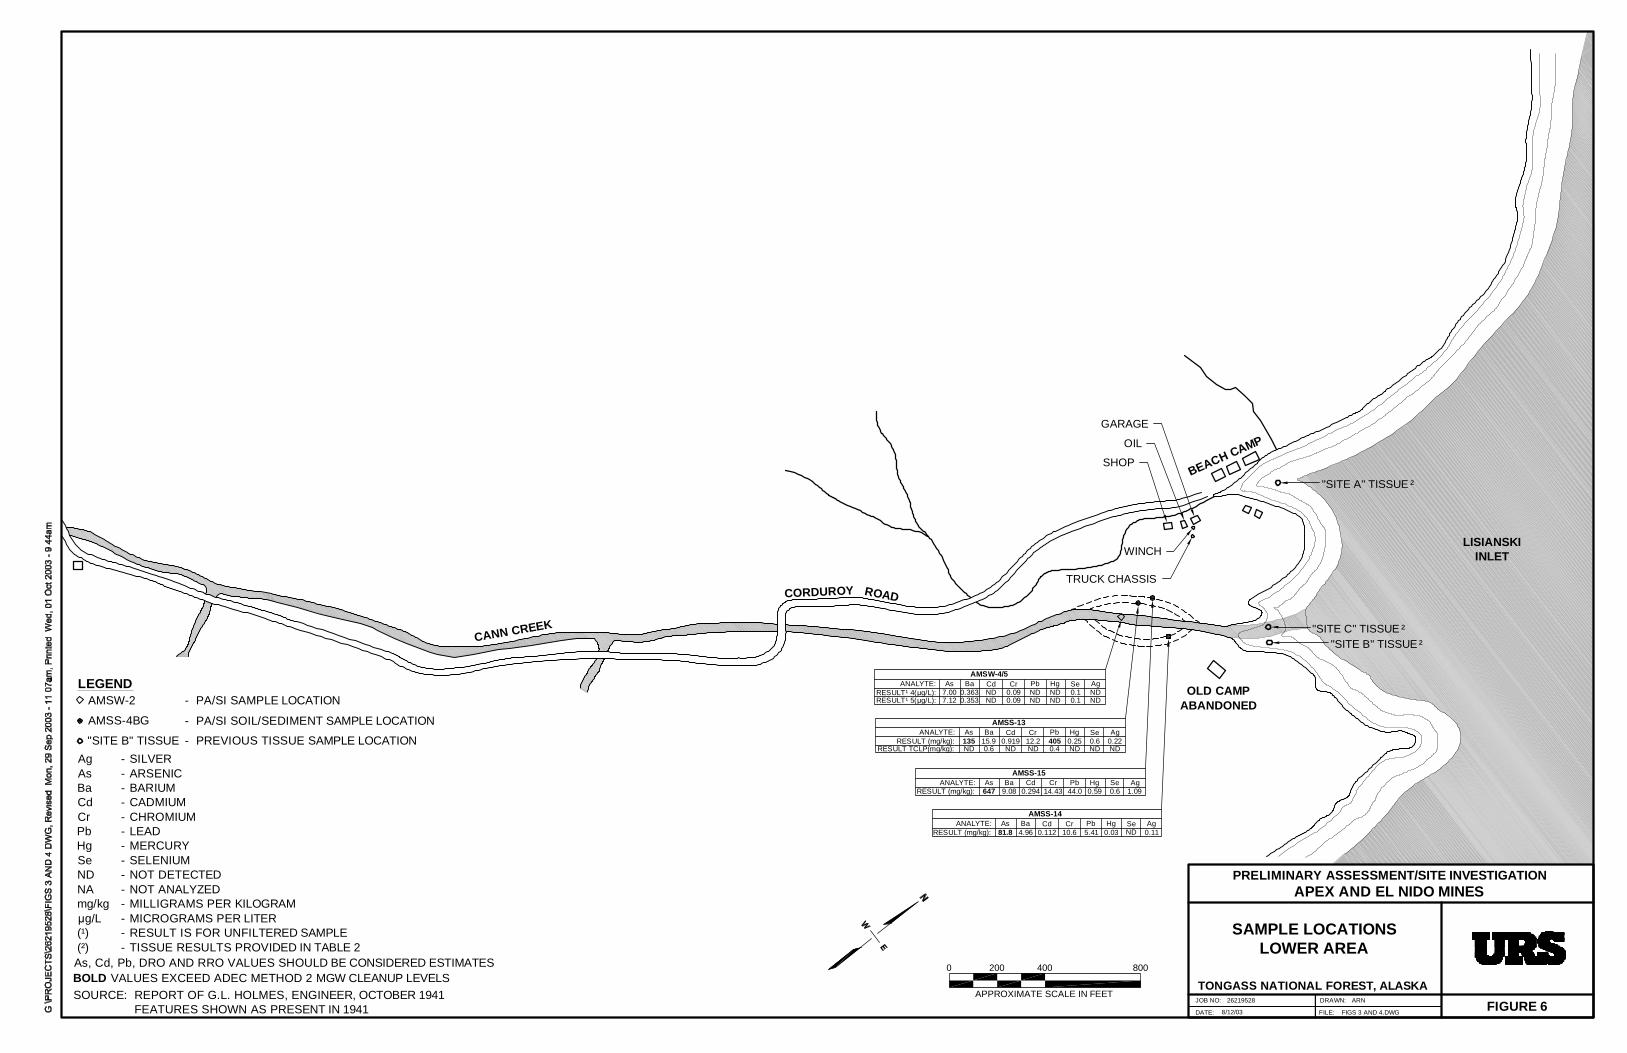
0 200 400 800
APPROXIMATE SCALE IN FEET
SAMPLE LOCATIONSLOWER AREA
FILE: FIGS 3 AND 4.DWG
DRAWN:
DATE:
JOB NO:
PRELIMINARY ASSESSMENT/SITE INVESTIGATIONAPEX AND EL NIDO MINES
TONGASS NATIONAL FOREST, ALASKA26219528 ARN
8/12/03 FIGURE 6
CANN CREEK
CORDUROY ROAD
SHOP
OIL
GARAGE
BEACH CAMP
OLD CAMPABANDONED
SOURCE: REPORT OF G.L. HOLMES, ENGINEER, OCTOBER 1941FEATURES SHOWN AS PRESENT IN 1941
LISIANSKIINLET
- PREVIOUS TISSUE SAMPLE LOCATION"SITE B" TISSUE
- PA/SI SAMPLE LOCATION
AMSS-4BG
"SITE A" TISSUE ²
"SITE C" TISSUE ²"SITE B" TISSUE ²
AMSS-14ANALYTE:
RESULT (mg/kg):As
81.8 4.96Ba Cd
0.112 10.6Cr Pb
5.41 0.03Hg Se
ND 0.11Ag
Ag1.090.6
SeHg0.5944.0
PbCr14.430.294
CdBa9.08647
AsRESULT (mg/kg):
ANALYTE:AMSS-15
AMSS-13ANALYTE:
RESULT (mg/kg):As135 15.9
Ba Cd0.919 12.2
Cr Pb405 0.25
Hg Se0.6 0.22
Ag
RESULT TCLP(mg/kg): ND 0.6 ND ND 0.4 ND ND NDAg - SILVERAs - ARSENICBa - BARIUMCd - CADMIUMCr - CHROMIUMPb - LEADHg - MERCURYSe - SELENIUMND - NOT DETECTEDNA - NOT ANALYZEDmg/kg - MILLIGRAMS PER KILOGRAM
g/L - MICROGRAMS PER LITER(¹) - RESULT IS FOR UNFILTERED SAMPLE(²) - TISSUE RESULTS PROVIDED IN TABLE 2
ND0.1NDND0.09ND0.3537.12RESULT¹ 5( g/L):
AgND0.1
SeHgNDND
PbCr0.09ND
CdBa0.3637.00
AsRESULT¹ 4( g/L):
ANALYTE:AMSW-4/5
TRUCK CHASSIS
WINCH
AMSW-2
- PA/SI SOIL/SEDIMENT SAMPLE LOCATION
LEGEND
BOLD VALUES EXCEED ADEC METHOD 2 MGW CLEANUP LEVELSAs, Cd, Pb, DRO AND RRO VALUES SHOULD BE CONSIDERED ESTIMATES

SITE PHOTOGRAPHS
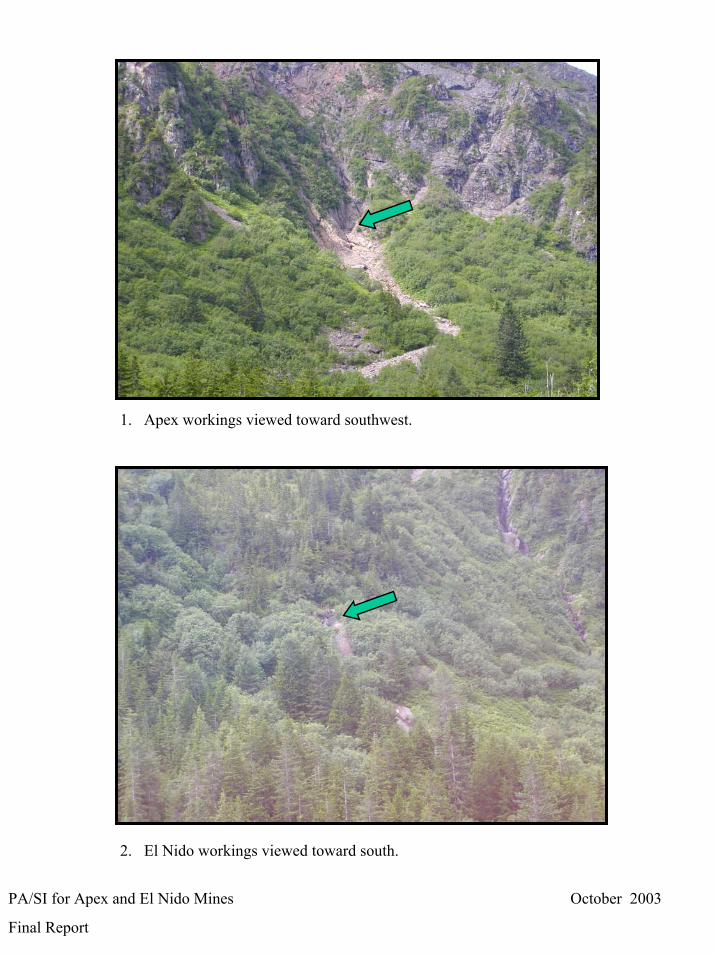
PA/SI for Apex and El Nido Mines October 2003
Final Report
1. Apex workings viewed toward southwest.
2. El Nido workings viewed toward south.
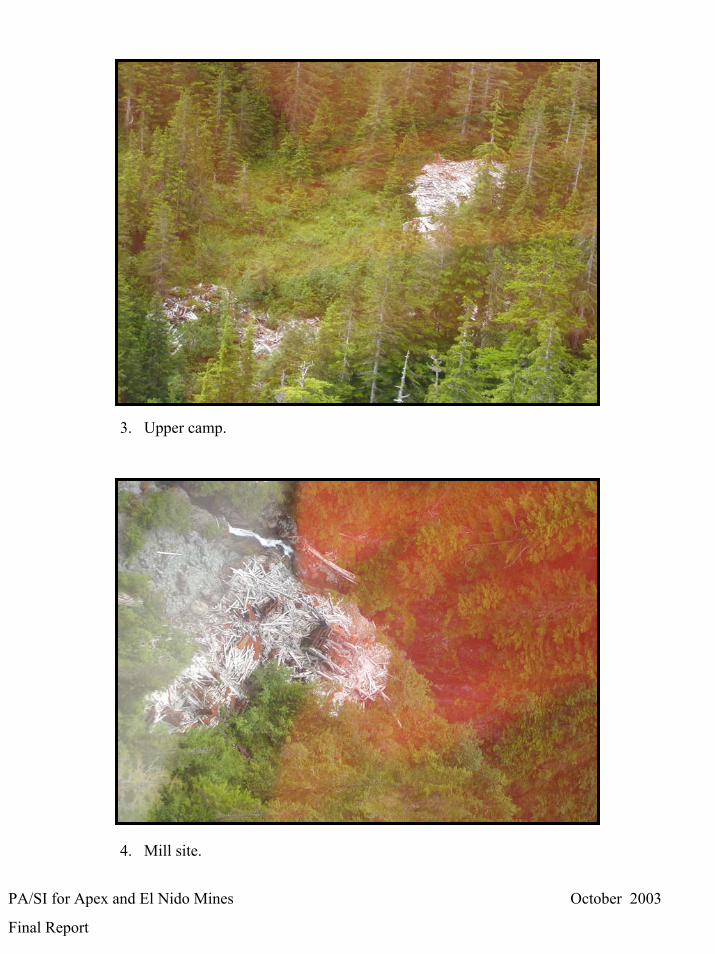
PA/SI for Apex and El Nido Mines October 2003
Final Report
3. Upper camp.
4. Mill site.

PA/SI for Apex and El Nido Mines October 2003
Final Report
5. Beach camp area viewed toward southwest.
6. Mouth of Cann Creek viewed toward southwest.

PA/SI for Apex and El Nido Mines October 2003
Final Report
7. Apex haulage tunnel opening.
8. Shop at Apex haulage tunnel.
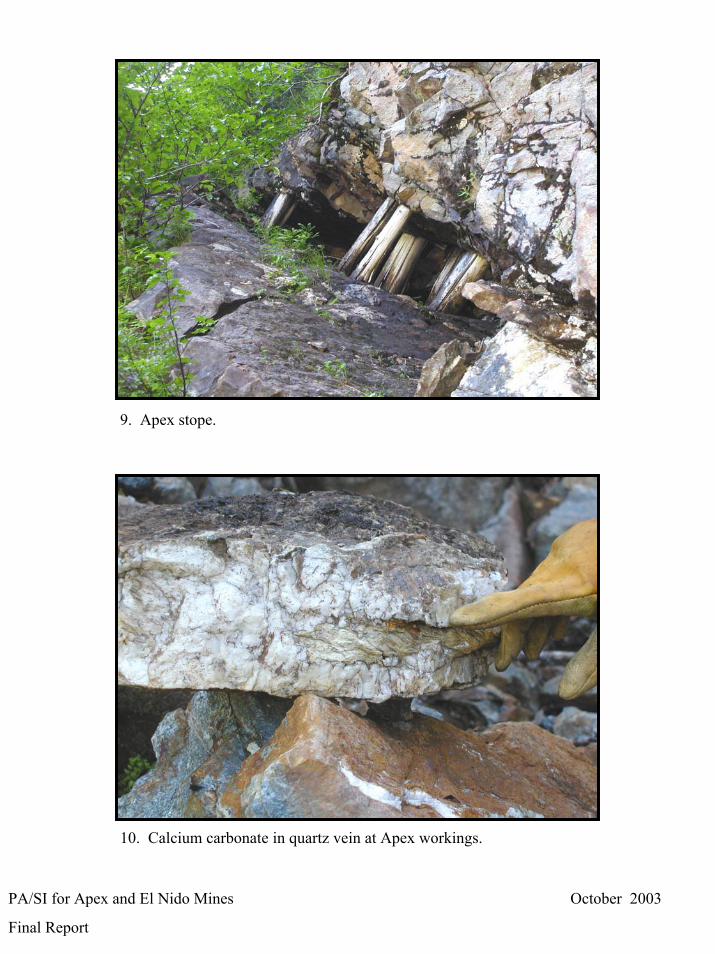
PA/SI for Apex and El Nido Mines October 2003
Final Report
9. Apex stope.
10. Calcium carbonate in quartz vein at Apex workings.

PA/SI for Apex and El Nido Mines October 2003
Final Report
11. Upper basin area viewed from near Apex workings, view toward northeast.
12. Cann Creek at upper camp. Sample AMSS–2.
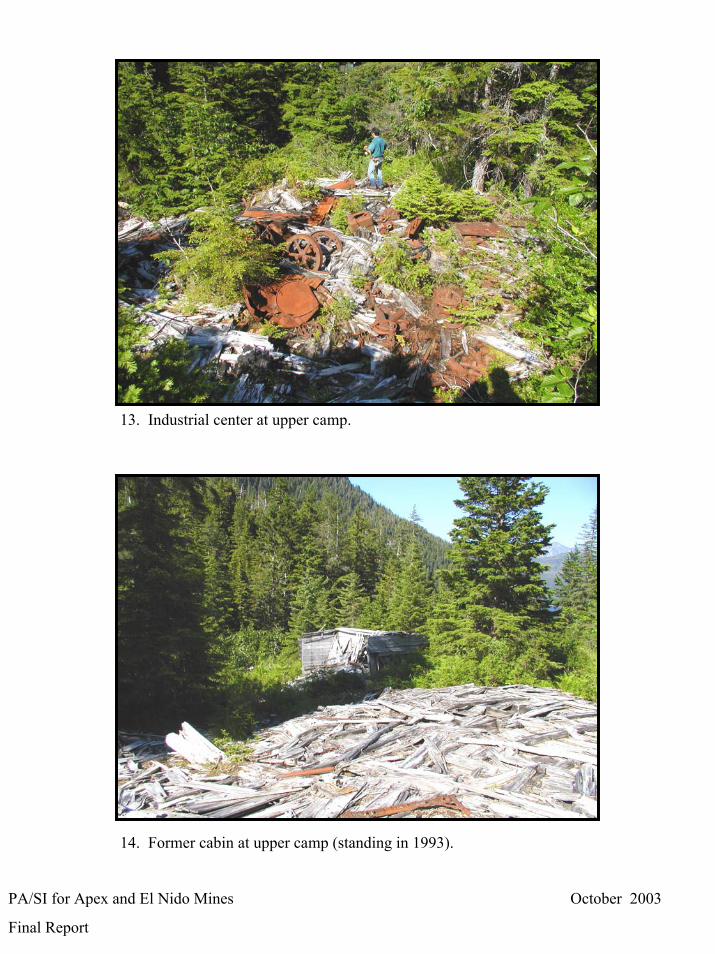
PA/SI for Apex and El Nido Mines October 2003
Final Report
13. Industrial center at upper camp.
14. Former cabin at upper camp (standing in 1993).

PA/SI for Apex and El Nido Mines October 2003
Final Report
15. Drum at industrial center at upper camp. Sample AMSS-6.
16. Industrial center at upper camp. Sample AMSS-7/8.
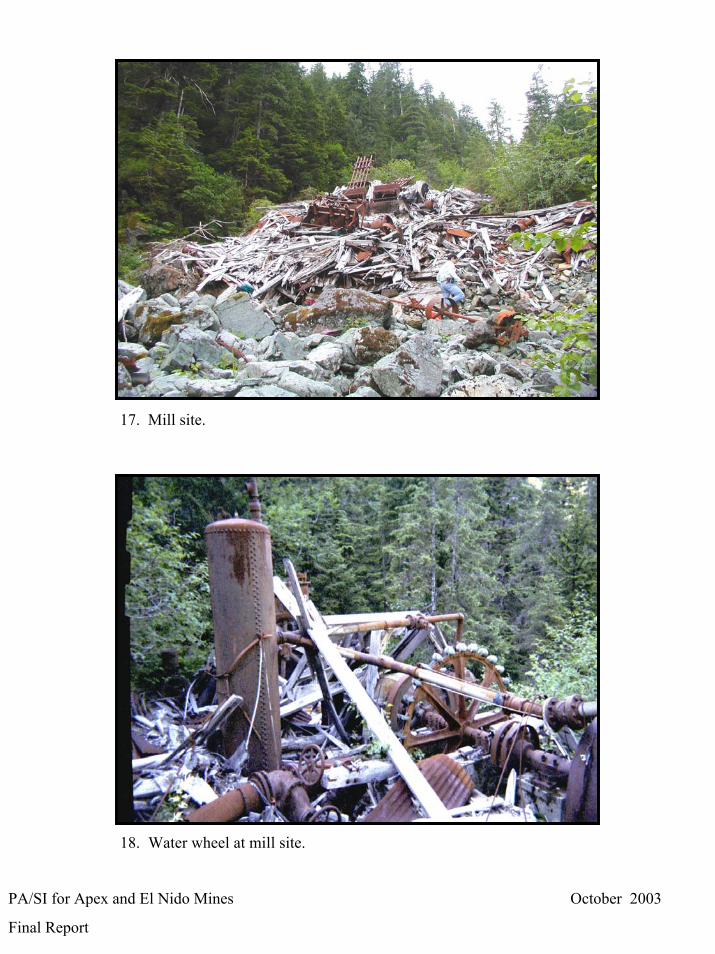
PA/SI for Apex and El Nido Mines October 2003
Final Report
17. Mill site.
18. Water wheel at mill site.

PA/SI for Apex and El Nido Mines October 2003
Final Report
19. Stamp mill at mill site.
20. Mill bunkhouse/guard shack below mill site.

PA/SI for Apex and El Nido Mines October 2003
Final Report
21. Cann Creek below mill site. Sample AMSW-3.
22. Cann Creek dry channel below mill. Sample AMSS-12.

PA/SI for Apex and El Nido Mines October 2003
Final Report
23. Corduroy road below mill bunkhouse.
24. Lower corduroy road above beach camp.

PA/SI for Apex and El Nido Mines October 2003
Final Report
25. Cann Creek dry channel near beach camp. Samples AMSS-13 and AMSS-15.
26. Lower Cann Creek dry channel containing potential mine tailings. Sample AMSS-15.

APPENDIX A FIELD NOTES

FIELD NOTES ARE PROVIDED IN HARD COPY FORM

APPENDIX B ANALYTICAL REPORTS
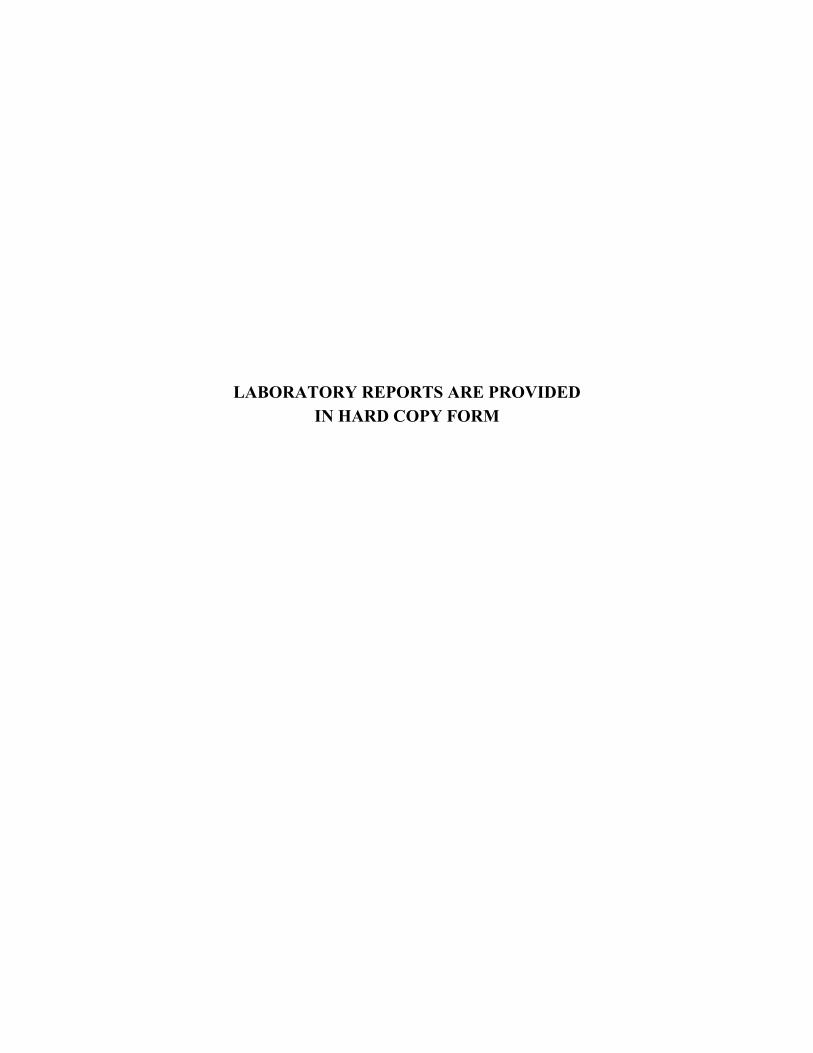
LABORATORY REPORTS ARE PROVIDED IN HARD COPY FORM

APPENDIX C QA/QC SUMMARY

CHEMISTRY QA/QC SUMMARY
1.0 INTRODUCTION This section provides a summary of fixed-laboratory analyses performed, quality assurance/quality control (QA/QC) procedures, and evaluation of analytical results for the Apex/El Nido PA/SI. Soil samples were collected at 13 locations and water samples were collected at 4 locations on July 11th and 12th, 2003. Non-conformance of data is identified, discussed, and qualified in this report. The results of the QA/QC data associated with the analysis of the following parameters are summarized in this report: • Total, Dissolved and TCLP RCRA Metals (Arsenic, Barium, Cadmium, Chromium, Lead, Selenium,
Silver) by ICP mass spectroscopy (ICPMS), EPA Method SW6020
• Hardness Metals (Calcium, Magnesium) by inductively coupled plasma (ICP) optical emission spectroscopy, EPA Method SW6010B
• Total, Dissolved and TCLP Mercury by cold vapor atomic absorption (CVAA), EPA Method SW7471A (soil) and EPA method SW7470A water)
• Diesel and Residual Range Organic Compounds (DRO/RRO), ADEC Method AK102/103
Sample analysis was performed by Columbia Analytical Services, Inc. (CAS) at their Kelso, Washington laboratory. A summary of samples submitted for analysis is provided in Table 1.
Table 1 Summary of Samples
Analyses
Tot
al M
etal
s
Dis
solv
ed M
etal
s
TC
LP
Met
als
Die
sel R
ange
O
rgan
ics
Res
idua
l Ran
ge
Org
anic
s
Water Samples 4 4 - - - Field Dups (Splits) 1 - - - - MS/MSDs 1 - - - - Soil Samples 10 - 2 3 3 Field Dups (Splits) 1 - - 1 1 MS/MSDs 1 - - - -
Samples were analyzed in accordance with EPA Test Methods for Evaluating Solid Waste Physical/Chemical Methods, SW-846, Third Edition (USEPA, 1999b); EPA Methods for Chemical Analysis for Water and Wastes (USEPA, 1983b); and State of Alaska Department of Environmental Conservation, Petroleum Hydrocarbon Methods AK102 and AK 103 (ADEC, 1999). The laboratory provided a CLP-type hard copy deliverable including method and project specific QC and a digital deliverable in an Excel flat file format. Sample results were reported to the laboratory method detection limit (MDL). EPA CLP laboratory data qualifiers (flagging) were included in the metals deliverables. Standard CAS petroleum method flags were used for the AK102/103 methods. Flags
1

applied by URS as a result of this data review are preceded with a “V”. The list of qualifiers used is included in this report as Attachment 1. The data review focuses on criteria for the following QA/QC parameters and their overall effect on the data: • Sample handling (chain-of-custody);
• Holding time compliance;
• Field QA/QC (field duplicates);
• Calibration verification and laboratory control samples;
• Method reporting limits;
• Method blanks;
• Surrogates;
• Analytical methods;
• Precision and accuracy; and
• Completeness.
2.0 SAMPLE HANDLING (CHAIN-OF-CUSTODY) URS field personnel shipped all samples via Alaska Airlines Goldstreak to Portland, OR. The samples were couriered from the airport to the CAS laboratory in Kelso, Washington. Hard copy Chain of Custody (COC) forms were utilized for the entirety of the project. Cooler receipt forms, documenting sample condition and temperature, were completed upon receipt at the laboratory. Final sample login information, COCs and cooler receipt forms were faxed to the URS Anchorage office by CAS. COC, cooler receipt forms, and laboratory case narratives were provided in the final reports and were reviewed to determine if any sample handling procedures possibly affected the integrity of the samples and the quality of the resulting data. All sample containers were received at CAS intact. The coolers shipped arrived with temperatures outside the required 4o + 2oC temperature range. The temperatures ranged from 1.2oC to 1.4oC. Temperatures were documented on the individual cooler receipt forms. The analyses requested for these samples would not be significantly affected by the minor temperature variation seen during shipment of these samples. All of the COCs were signed and dated as relinquished by the field personnel and as received by the laboratory.
3.0 HOLDING TIME AND PRESERVATION COMPLIANCE Holding time for samples is defined as the required time frame, from the date of collection, within which the laboratory must perform analysis. Recommended holding times and sample preservation are based on EPA and ADEC method guidance. The holding times and preservation for sample analyses performed for this report are listed in Table 2.
2

Table 2 Holding Times and Preservation for Physical and Chemical Analyses
Sample Type Holding Time Preservative
Metals (except mercury) 6 months (28 days) HNO3 (water) DRO/RRO 14 days None
All samples were extracted and/or analyzed within the recommended hold time for the analytical procedures utilized for this project. All samples were preserved properly.
4.0 FIELD QA/QC Field QA/QC protocol is designed to monitor possible contamination during collection and transport so that the accuracy and precision of the samples collected in the field can be determined. Collection and analysis of the field QA/QC samples allows for a measurement of precision that takes into account variables such as field sampling and laboratory analysis techniques. For this project, field duplicates (splits) were submitted in conjunction with the collected samples for analysis.
4.1 Field Duplicates (Splits)
Three field duplicates were collected in association with samples and submitted to the laboratory blind for analyses. The field duplicate pairs submitted were: water samples AMSW-4T and AMSW-5T for total metals analyses; soil samples AMSS-7 and AMSS-8 for DRO/RRO analyses; and soil samples AMSS-9 and AMSS-10 for total metals analyses. The field duplicates were separate samples, collected from the same grab sample. Refer to Table 1 for the specific number of field duplicates and/or analyses requested. Field duplicate data are summarized in the tables included as Attachment 2. Table 3 lists criteria used for comparing field duplicates. These are recommended by the Army Corps of Engineers in CRREL Special Report No 96-9. The summary tables included as Attachment 2 include a Relative Percent Difference (RPD) precision calculation for the original sample and field duplicate results. Differences correlate to RPD as follows:
• A RPD greater than 67 equals a difference greater than 2 times the result
• A RPD greater than 100 equals a difference greater than 3 times the result.
• A RPD greater than 133 equals a difference greater than 5 times the result
• A RPD greater than 164 equals a difference greater than 10 times the result.
Results for total arsenic and cadmium in the soil field duplicate sample pair, AMSS-9 and AMSS-10, were flagged VJ by the URS validator due to a difference greater than 2 times in duplicate results.
Results for Diesel Range Organics and Residual Range Organics in the field duplicate sample pair, AMSS-7 and AMSS-8, were flagged VJ by the URS validator due to a difference greater than 3 times in duplicate results.
All other field duplicate results were within the agreement criteria below.
3

Table 3 Criteria for Comparing Field Duplicate Data
Matrix Parameter Disagreement Major Disagreement
All All >5x difference when one result is < MDL
>10x difference when one result is < MDL
All All >3x difference when one result is < RL
>5x difference when one result is < RL
Water and soil Metals >2x difference >3x difference
Water and soil TPH >3x difference suggested
>5x difference suggested
5.0 LABORATORY QA/QC
5.1 Calibration Verification
Initial and continuing calibration verification standards were analyzed to monitor laboratory instrument performance prior to, during, and concluding sample analysis. The laboratory SOPs specify these ranges of standards in accordance with the associated EPA method used for the analysis. The laboratory is required to report any discrepancies, if they occur, and the effect on project samples. There were no calibration verification discrepancies affecting project samples.
5.2 Laboratory Control Samples
Laboratory Control Samples and Laboratory Control Sample Duplicates (LCS/LCSD) are prepared in the laboratory by spiking a clean matrix (e.g. DI water, Ottawa sand) with a known concentration of target analyte. These samples are processed with a batch of 20 or less field samples. LCS/LCSD sample results are calculated for accuracy, by percent recovery (%R), and precision, by RPD. LCS/LCSD %R and RPD are evaluated against laboratory determined acceptance ranges to monitor if the analytical method was in control. All LCS and/or LCSD recoveries were within the specified acceptance ranges.
5.3 Matrix Spike Samples
Matrix Spike (MS) samples are prepared in the laboratory by spiking an aliquot of the submitted field sample with a known concentration of target analyte. These samples are processed with a batch of 20 or less field samples. Inorganic methods require only a MS to fulfill batch quality control requirements. Organic methods include a MS and Matrix Spike Duplicate (MSD). MS/MSD samples are calculated for accuracy by %R, and precision by RPD. MS/MSD %R and RPD are evaluated against laboratory specified acceptance ranges to monitor the accuracy and precision of the analytical method for the submitted matrix.
URS personnel requested MS analyses for metals on surface water sample AMSW-1T and soil sample AMSS-12. The laboratory chose additional samples, depending on analysis, for MS/MSD analysis to
4

fulfill the batch requirements. Refer to Table 1 for the specific number of MS/MSDs and analyses requested for the project.
Matrix Spike sample results were reported for metals (SW6010B/SW6020/SW7470A/SW7471A). Matrix Spike/Matrix Spike Duplicate sample results were reported for DRO and RRO. Cases where the MS and/or MSD were outside of the specified acceptance ranges are documented below:
• Results for total arsenic in all soil samples were flagged “N” due to matrix spike recoveries below the laboratory control limits in the spiked sample AMSS-12. The low matrix recovery may be due to the heterogenous nature of the sample.
5.4 Laboratory Duplicate Samples
Laboratory duplicates are repeated, independent determinations of the same sample, by the same analyst, at essentially the same time, and under the same conditions. The sample is split in the laboratory and each fraction is carried through all stages of sample preparation and analysis. Duplicate analyses measure the precision of each analytical method. Laboratory duplicate analyses are performed for 10 percent of samples analyzed, or at least one per day, for analytical methods not requiring MS/MSDs. Laboratory duplicates were reported for the metals analyses.
Cases where the duplicates were outside of the laboratory specified acceptance ranges are documented below:
• Results for total arsenic and lead in all soil samples were flagged “*” due to the laboratory duplicate variability being outside the laboratory control limits. The laboratory noted a heterogenous matrix in this soil sample. The sample used as the laboratory duplicate, AMSS-12, was described as containing relatively large amount of rocks, twigs and vegetation.
6.0 METHOD REPORTING LIMITS
MRLs were determined by multiplying the MDL by a factor of generally three to five. For this project, methods were selected that could provide project specific detection limits and results are reported to the laboratory MDL. MRLs were adjusted by the laboratory for sample weight/volume, percent solids, dilutions, matrix interference, etc. No samples results were reported as non-detect with elevated MRLS. Reported results, which are greater than the MDL but less than the MRL were flagged by the laboratory as applicable and should be considered estimates. Sample results for metals between the MDL and the MRL were flagged with a “B”.
7.0 METHOD BLANKS
Method blanks are clean matrices, extracted and analyzed concurrent with a batch of 20 or less samples for each of the analytical procedures performed for this project. These samples are prepared in the laboratory in conjunction with project samples to monitor for contamination during the analytical procedure performed in the laboratory. A measured result above the MRL in a method blank would
5

indicate a laboratory method control problem that could affect data quality. For this project, method blanks were tested at the required frequency. Method blank results for target analyte results were all below the laboratory MRL.
8.0 SURROGATES
Surrogates are specified for organic chromatographic analytical procedures. Surrogates are compounds similar to those tested that are added to each sample tested before the extraction step of the procedure. Subsequent measurements of surrogate compounds indicate overall method performance for each sample. Organic methods AK102 and AK103 utilize this technique. Samples diluted (usually by a factor of five or more prior to analysis), due to high analyte concentration or matrix interference, result in reduced surrogate concentration. The accuracy of surrogates measured at these levels is impacted and should not necessarily be compared to limit ranges developed for the method. All surrogate recoveries were within specified acceptance ranges for DRO and RRO analyses.
9.0 ANALYTICAL METHODS
URS used the appropriate EPA-approved methods for analysis of samples and achieved the required detection limits as specified in the project work plan. The following section summarizes the analytical methods utilized for the project.
• Metals by EPA Method SW6010B and EPA Method SW6020
• Mercury by EPA Method SW7470A and SW7471A
• Diesel and Residual Range Organics (DRO/RRO) by ADEC method AK102/103
QA/QC criteria were met for the listed methods, except as noted in the previous sections or below.
• Results for Diesel Range Organics were flagged with a “Y”. The chromatographic pattern of the sample resembles a petroleum product eluting in the correct carbon range, but does not match the elution pattern of the diesel fuel calibration standard.
• Results for Residual Range Organics were flagged with an “O”. The chromatographic pattern of the sample resembles oil, but does not match the calibration standard.
10.0 ACCURACY AND PRECISION Accuracy criteria monitor agreement of measured results with “true values” as determined by the analytical spike recovery project samples. Accuracy was measured for this project by the analysis of LCS/LCSD (see Section 5.2), and MS/MSD (see Section 5.3) analyses. Accuracy measurements that were outside of the laboratory specified ranges are qualified appropriately. Precision criteria monitor analytical reproducibility. Precision was measured by the analysis of sample duplicates (field and laboratory), MS duplicates (MSD), and/or LCS duplicates (LCSD). Precision measurements that were above the laboratory specified limit are qualified appropriately.
6

11.0 COMPLETENESS Completeness is based on two factors: whether or not all of the planned samples were collected (field completeness), and whether or not all of the planned analyses were acceptable (laboratory completeness). The percentage of valid results is reported as completeness. Laboratory completeness is calculated after the QC data have been evaluated and applied to the measurement data. In addition to results identified as being outside of the QC limits established for a method, broken or spilled samples, or samples that could not be analyzed for any other reason, are included in the assessment of completeness. Only sample results totally rejected are considered invalid for the calculation of completeness. Since URS collected all of the planned samples, field completeness is considered to be 100%. There were no rejected sample results for the project, so the laboratory completeness is calculated at 100%. Since both factors of completeness were achieved, the completeness goals for the project were met.
12.0 REFERENCES Grant, C.G., Jenkins, T.F., and Mudambi, A.R., May 1996. “Comparison Criteria for Environmental chemical Analyses of Split Samples Sent to Different Laboratories – Corps of Engineers Archived Data”, CCREL Special Report No. 96-9, USACE Cold Regions and Environmental Research Laboratory, Hanover, N.H. USEPA, 1999b. Test Methods for Evaluating Solid Waste Physical/Chemical Methods, SW-846, Third Edition. USEPA,1983b. EPA Methods for Chemical Analysis for Water and Wastes.
7

Attachment 1
Data Qualifiers
Qualifier Type Symbol Definition
Metals B The result is an estimated concentration that is less than the MRL but greater than or equal to the MDL.
Metals N The Matrix Spike sample recovery is not within control limits. See case narrative.
Metals * The duplicate analysis was not within control limits.
Petroleum Hydrocarbon
O The chromatographic fingerprint of the sample resembles an oil, but does not match the calibration standard.
Petroleum Hydrocarbon
Y The chromatographic fingerprint of the sample resembles a petroleum product eluting in the correct carbon range, but the elution pattern does not match the calibration standard.
Validator VJ The result is estimated. Replicate precision was not met.
8

Attachment 2
Field Duplicate Data
9
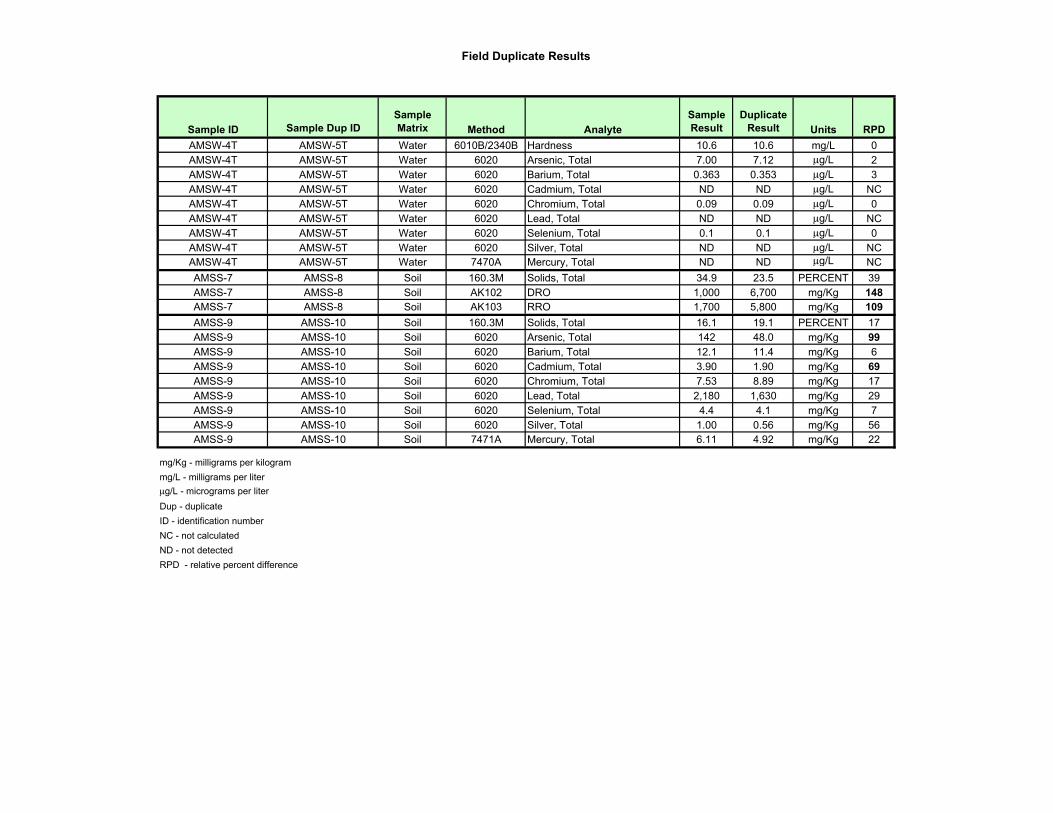
Field Duplicate Results
Sample ID Sample Dup IDSample Matrix Method Analyte
Sample Result
Duplicate Result Units RPD
AMSW-4T AMSW-5T Water 6010B/2340B Hardness 10.6 10.6 mg/L 0AMSW-4T AMSW-5T Water 6020 Arsenic, Total 7.00 7.12 µg/L 2AMSW-4T AMSW-5T Water 6020 Barium, Total 0.363 0.353 µg/L 3AMSW-4T AMSW-5T Water 6020 Cadmium, Total ND ND µg/L NCAMSW-4T AMSW-5T Water 6020 Chromium, Total 0.09 0.09 µg/L 0AMSW-4T AMSW-5T Water 6020 Lead, Total ND ND µg/L NCAMSW-4T AMSW-5T Water 6020 Selenium, Total 0.1 0.1 µg/L 0AMSW-4T AMSW-5T Water 6020 Silver, Total ND ND µg/L NCAMSW-4T AMSW-5T Water 7470A Mercury, Total ND ND µg/L NCAMSS-7 AMSS-8 Soil 160.3M Solids, Total 34.9 23.5 PERCENT 39AMSS-7 AMSS-8 Soil AK102 DRO 1,000 6,700 mg/Kg 148AMSS-7 AMSS-8 Soil AK103 RRO 1,700 5,800 mg/Kg 109AMSS-9 AMSS-10 Soil 160.3M Solids, Total 16.1 19.1 PERCENT 17AMSS-9 AMSS-10 Soil 6020 Arsenic, Total 142 48.0 mg/Kg 99AMSS-9 AMSS-10 Soil 6020 Barium, Total 12.1 11.4 mg/Kg 6AMSS-9 AMSS-10 Soil 6020 Cadmium, Total 3.90 1.90 mg/Kg 69AMSS-9 AMSS-10 Soil 6020 Chromium, Total 7.53 8.89 mg/Kg 17AMSS-9 AMSS-10 Soil 6020 Lead, Total 2,180 1,630 mg/Kg 29AMSS-9 AMSS-10 Soil 6020 Selenium, Total 4.4 4.1 mg/Kg 7AMSS-9 AMSS-10 Soil 6020 Silver, Total 1.00 0.56 mg/Kg 56AMSS-9 AMSS-10 Soil 7471A Mercury, Total 6.11 4.92 mg/Kg 22
mg/Kg - milligrams per kilogrammg/L - milligrams per literµg/L - micrograms per literDup - duplicateID - identification numberNC - not calculatedND - not detectedRPD - relative percent difference