apeejay publishes a biannual journal named apeejay business review”(abr)
TRANSCRIPT

ISSN: 0974-1798
Apeejay Business Review
Volume 13, Number 1 & 2 January-December 2014
Editorial Advisory Board
Abad Ahmad, Formerly Pro Vice Chancellor, University of Delhi, Delhi
Alok Saklani, Director, Apeejay School of Management, New Delhi
G. S. Batra, Punjab School of Management Studies, Punjabi University, Patiala
H. L. Verma, Pro Vice Chancellor, Apeejay Stya University, Sohna
K. N. Badhani, Indian Institute of Management, Kashipur
Mukesh Chaturvedi, Formerly with Birla Institute of Management Technology,
Greater Noida
N. K. Chaddha, Department of Psychology, University of Delhi, Delhi
R. P. Hooda, Formerly Vice Chancellor, M D University, Rohtak
Raghbir Singh, Guru Nanak Dev University, Amritsar
Sanjay Jain, Department of Commerce, University of Delhi, Delhi
T. N. Kapoor, Formerly Vice Chancellor, Panjab University, Chandigarh
Editors Srirang Jha, Apeejay School of Management, New Delhi
Deepak Halan, Apeejay Stya University, Sohna
Assistant Editors Amiya Kumar Mohapatra, Apeejay School of Management, New Delhi
Priya Gupta, Apeejay School of Management, New Delhi
Published by
Apeejay School of Management, New Delhi
School of Management Sciences, Apeejay Stya University, Sohna

Apeejay Business Review, Vol. 13, No.1 & 2, January-December 2014
2
Apeejay Business Review (ABR) is a peer-reviewed and refereed bi-annual journal
published jointly by Apeejay School of Management, New Delhi and School of Management
Sciences, Apeejay Stya University, Sohna.
ABR publishes original research papers on all the functional areas of Management to
augment body of knowledge as also to influence managerial practices, holistic policy-
making, strategy formulation and raise the level of public discourse on contemporary issues
in business and management.
ABR follows a fair peer-review policy. Each paper received for publication is sent for review
where identity of both the reviewers and contributors are kept confidential. Normally the
review process takes 10-12 weeks.
Papers submitted for publication in ABR must be accompanied with a signed note by the
contributors stating that the paper is original contribution of the author/authors and does not
violate copyrights/intellectual property of any individual or institution.
Annual Subscription: Rs. 200/- (India) $ 30 (Overseas)
Editorial and Subscription Enquiry: [email protected]
Copyright © Apeejay School of Management, New Delhi, 2014
All Rights Reserved. None of the articles can be reproduced without written permission of
the Publisher/Editor.
Disclaimer:
All the papers are published in good faith.
Authors are responsible for any violation of copyrights.
Views expressed in the papers are those of the authors and not necessarily of the
members of Editorial Advisory Board or Editors or Publishers.
Printed and Published by Director, Apeejay School of Management, Sector 8, Institutional
Area, Dwarka, New Delhi –110077 on behalf of Apeejay School of Management, New Delhi
and School of Management Sciences, Apeejay Stya University, Sohna.

Apeejay Business Review, Vol. 13, No.1 & 2, January-December 2014
3
Contents
Editorial 4
Managing Risk in Supply Chain: Review
of Approaches and Emerging Trends Pramod Kumar Gupta & Tanuj Nandan 6
Knowledge Management in Business:
A Review of Implementation Issues and Evaluation Techniques
Parul Sinha, Monika Arora & N. M. Mishra 17
Decoding Impact of Job Design on Employee Burnout Anjali Jindal, Pooja Garg & Renu Rastogi 28
Employees‘ Perception towards Innovative Climate
in Public Utility Enterprises: A Comparative Analysis
Sandeep Tandon & Ranju Katoch 38
Understanding Consumer Psychology via Social Media
Deepak Halan & VarunaTyagi 51

Apeejay Business Review, Vol. 13, No.1 & 2, January-December 2014
4
Editorial
With great pleasure, we present the 13
th Volume of Apeejay Business Review to the
community of scholars and practitioners. From this edition, the journal is being published by
Apeejay School of Management, New Delhi in collaboration with School of Management
Sciences, Apeejay Stya University, Sohna. This collaboration is likely to strengthen the
journal in terms of quality, reach and inter-disciplinary research outcomes.
The current volume provides interesting readings in various functional areas of management.
All the articles and research papers are imbued with the fresh insights. We hope that the
present Volume enlightens and enriches the readers with new perspectives on diverse aspects
of Management function. We are publishing five research papers in this issue.
Pramod Kumar Gupta and Tanuj Nandan have analysed the significance of supply chain risks
which have immense potential to affect the operational and financial performance of firms in
their work “Managing Risk in Supply Chain: Review of Approaches and Emerging Trends”.
The authors argue that mitigation and management of supply chain risks and uncertainties are
crucial for the success of an organization.
Parul Sinha, Monika Arora and N. M. Mishra have explicated the need and importance of
Knowledge Management in business so as to make sustainable business in their work
“Knowledge Management in Business: A Review of Implementation Issues and Evaluation
Techniques”. Knowledge-based competitive advantage is very much essential for success and
growth of each organization in a dynamic environment. In this paper an effort has been made
by the authors to review some of the implementation issues and evaluation techniques in a
systematic manner.
Anjali Jindal, Pooja Garg and Renu Rastogi have provided a broad overview on the
relationship between job design and employee burnout in their work “Decoding Impact of
Job Design on Employee Burnout”. The empirical evidences show that there is inverse
relationship and impact of job design on burnout of employees. The present study confirms
that job design and its related factors do have negative impact on burnout for the managers.
Sandeep Tandon and Ranju Katoch have studied the role of innovative climate on the
performance and growth of public utilities enterprises in their paper “Employees’ Perception
towards Innovative Climate in Public Utility Enterprises: A Comparative Analysis”. The
authors emphasize a need to nurture innovative climate at public utility enterprises for better
quality of service and efficiency.
Deepak Halan and Varuna Tyagi have tried to decode consumer behaviour through the lens
of social media in their paper ―Understanding Consumer Psychology via Social Media‖. It
goes without saying that social media tools have become superb channels for marketers to reach
consumers, given their two-way communication format. An organisation that uses social media is
more likely to create relationships with members of its target demographic vis-à-vis one that uses
traditional media. The authors have examined the influence of social media on consumer behaviour in
this paper.
We would like to thank all our contributors, anonymous reviewers and readers for their
continual encouragement and support. We earnestly request the readers to forward their

Apeejay Business Review, Vol. 13, No.1 & 2, January-December 2014
5
suggestions if any, towards improving the journal. You are also invited to contribute
empirical research papers, conceptual papers, review articles, book reviews, etc. for June
2015 issue of the journal.
–Editors

Apeejay Business Review, Vol. 13, No.1 & 2, January-December 2014
6
Managing Risk in Supply Chain: Review
of Approaches and Emerging Trends
Pramod Kumar Gupta and Tanuj Nandan
School of Management Studies,
Motilal Nehru National Institute of Technology, Allahabad
Abstract
Business imperatives to survive and sustain in highly competitive economic scenarios viz.
agile, leaner and global supply chains as well as events such as inclement weather, terrorist
attacks and financial instability have played catalytic role in the emergence of Supply Chain
Risk Management (SCRM) as a vital component of corporate strategy during the past decade.
Supply chain risks are primarily related to inbound and outbound logistics in organizations’
material, information, and financial flows. Significant supply chain disruptions affect an
organization’s revenue, erode market share, bloat costs and budget, threaten production and
distribution, tarnish credibility with investors and other stakeholders, and skyrocket the cost
of capital. The recent researches indicate that only those companies, that prepare themselves
systematically, recover from supply chain events effectively. Supply chain risk management
has accordingly evolved as a popular area of research, especially during past decade. Many
papers, with varied focus and approaches, have been published during this period to address
several issues related to identification, assessment and mitigation of myriad risks
encountered in supply chains. This paper intends to survey and classify available literature
on SCRM with an aim to identify various trends emerging in this area.
Keywords: supply chain risk management, risk assessment, literature review, vulnerability,
risk optimization, risk mitigation
Introduction
To contain cost and gain strategic competitive advantage MNCs across various industries
pursued ambitious innovative improvement initiatives, including total quality management,
global just-in-time supply chain management, lean manufacturing, lean supply chain
logistics, efficient consumer response, quick response, global outsourcing/sourcing, and co-
manufacturing. Although these ambitious initiatives indeed saved firms billions of dollars,
they equally made the global supply chains more complex, convoluted, and venerable to
disruptive risks. Indeed, Supply chain has gained a deserving attention because it focuses on
the efficiency and effectiveness of material/product, information, and financial flows from
upstream (suppliers) to downstream (customers) and today‘s competition is based on it, not
among firms (Sadler and Gough, 2005). Although supply chain management has been touted
as source of building, sustaining, and gaining competitive edge (Hendricks and Singhal,
2005), improved financial performance from designing effective supply chains, and
shareholder value creation (Chopra and Meindl, 2001), firms can no longer guarantee the past
achievements because of today‘s risks and uncertainties. Safeguarding the SC that
contributed to the success of a variety of firms against the risks of disruptions has

Apeejay Business Review, Vol. 13, No.1 & 2, January-December 2014
7
become imperative in recent years. Nevertheless, its complex nature has become increasingly
uncontrollable and vulnerable to disruptions linked to lean initiatives such as reduction in
supplier base, just-in-time supply chain management, outsourcing, and sourcing (Enyinda,
Tolliver, and Szmerekovsky, 2007).
The ultimate goal of SCM entails cost containment, increased customer value and
satisfaction, sustaining competitive advantage (Mentzer et al., 2001), enhance the operational
efficiency, profitability of a firm and its supply chain members (Min and Zhou, 2002),
integrating business functions and processes to build a cohesive and high-performing
business model . Indeed, SCM has been acknowledged as a great differentiator to the success
of a variety of firms competing in the new era of fast changing and turbulent business
environments. It has become one of the most discussed disciplines in the popular press
because of such variables as globalization of production and market, competitive pressure,
information and communication technology, consumer behavior, mass customization and
complex supply chain networks that have become increasingly uncontrollable, vulnerable and
susceptible to disruptions (Enyinda, Tolliver, and Szmerekovsky, 2007) and adapt to
prolonged disruptions.
While globalization (global production and marketing), outsourcing and sourcing, lean
manufacturing, total quality management, downsizing and rightsizing, and global just-in-time
supply chain management initiatives have enabled organizations to contain costs, focus on
strategic core competencies, and ameliorate operational efficiencies, the same initiatives more
than ever before, have rendered the modern global SC more vulnerable and/or less resilient to
sudden disruptions. Indeed, organizations are increasingly susceptible to both high-impact
and low-impact disruptive events (Sheffi and Rice, 2005). They ―are vulnerable not only to
attacks on their assets, but also to attacks on their suppliers, customers, transportation
providers, communication lines, and other elements in their eco-system‖ (Sheffi ,2001).
Disruptions due to risks inherent in SC have become a cynosure and assumed exponential
importance during the current decade. SC risks signify risks that are related to inbound and
outbound logistics in organizations‘ material, information, and financial flows. Supply chain
risk pertains to any threat of interruption to the functioning of the supply chain (Christopher,
2005). These risks and uncertainties can have profound implications for global manufacturing
organisations. In fact, significant SC disruptions can tailspin an organization‘s revenue, erode
market share, inflate costs and budget, intimidate production and distribution, tarnish
credibility with investors and other stakeholders, and skyrocket the cost of capital (Bosman,
2006). Hendricks and Singhal‘s (2005) study of 800 firms that announced a supply chain
disruption between 1989 and 2000, reported that during a three-year period, disrupted firms
experienced a 33 to 40 percent decline in stock returns relative to comparable industry
counterparts, regardless of industry, disruption cause or duration of time period. Similarly,
share price volatility in the year after the disruption was reported to be approximately 14
percent higher relative to the volatility in the year before the disruption. The purpose of this
paper is to provide an extensive literature review on supply chain risk management.
In particular, we aim to:
• Classify SCRM articles according to their approaches and methodologies.
• Discuss opportunities for future research.

Apeejay Business Review, Vol. 13, No.1 & 2, January-December 2014
8
Research Methodology
In this paper, an exhaustive search of the articles related to supply chain risk management
was undertaken. Articles published from 2000 to 2010, focusing on risk management issues
in supply chain were searched through various electronic databases, including Science Direct,
Emerald Full text, EBSCO, and Inderscience. The keyword used for the search was ―supply
chain risk‖. A total of 256 articles were found. After looking at the types of articles, we have
finally shortlisted 65 relevant articles to be reviewed in this paper.
Analysis: Categorisation of Research Papers Apart from reviews and surveys, various methodologies used by various researchers could be
divided into five categories, conceptual, descriptive, empirical, exploratory cross-sectional
and exploratory longitudinal. The conceptual is meant to represent a research methodology
that describes basic/ fundamental concepts on supply chain risk management. In this
classification, most papers propose a conceptual methodology for managing supply chain
risks.
Descriptive is a methodology that descripts, formulates, and develops model in supply chain
risk management. For example, there are models that have been developed as a supply chain
management framework that include identification, analysis and prioritizing mitigation
actions. Some popular tools such as failure mode and effect analysis (FMEA) and analytical
hierarchy process (AHP) have been used for this purpose.
Empirical is a methodology in which the data for study is taken from existing database, case
study, literature review, and taxonomy or typology approaches. Some of the studies in this
category are in the form of a survey study involving practitioners as respondents.
Exploratory cross-sectional is a methodology where the information is collected at one point
in time while exploratory longitudinal is a survey methodology where the data collection is
done at two or more points over time in the same organization.
The overview and year-wise distribution of supply chain risk management papers according
to the various methodologies is shown in Fig. 1 and Fig. 2 respectively.
As it is shown, almost one third of the papers have applied the conceptual approach in their
methodology. In the second place is the empirical research, and is by far lower than the two
are conceptual and exploratory researches. The descriptive and empirical researches together
account for 80% of the methodologies used.
Type of Study
2000
2001
2002
2003
2004
2005
2006
2007
2008
2009
2010
Tota
l
Case Study 1 2 3 1 1 1 9
Conceptual 1 1 2 9 1 2 1 1 1 2 21
Empirical
(Qualitative)
1 1 1 1 1 2 1 1 2 11
Empirical (Secondary) 1 1 2 4
Model/Simulation 2 1 3 1 2 9

Apeejay Business Review, Vol. 13, No.1 & 2, January-December 2014
9
Review 1 2 1 4
Survey 1 1 1 1 1 2 7
Grand Total 4 3 3 6 14 10 7 5 4 3 6 65
Figure 1: Distribution of Research Papers
Figure 2: Approaches applied in Research Papers
Stages in managing risks in SC
Risk management in supply chains normally involves activities such as identifying supply
chain risk events, assessing the probabilities and the severity of impacts, prioritizing the risk
event to be dealt with and developing actions for mitigating risks or planning for backup
actions. In the identification stage, one may use various techniques or tools. Following risk
management stages were considered pertinent from the view of Supply chain management:
1. SC Risk Identification
2. SC Risk Assessment
3. SC Risk Management
4. Business Continuity Management
SC Risk Identification
The initial step in the process of managing risk is to identify potential risks. Risks are about
events that, when triggered, cause problems. Hence, risk identification can start with the
source of problems, or with the problem itself. Kleindorfer and Wassenhove (2004) argued
that to mitigate risks in supply chain one must first identify the underlying sources of risks.
By risk mitigation, Miller (1992) means those strategic actions that organizations pursue to
thwart the uncertainties identified from variety of sources. Therefore, since risks are caused
by unexpected events and uncertainty, it is necessary to identify and categorize the sources of
risks in global supply chains.
SC Risk Assessment
Lack of ownership of risk sources in supply chains can lead to little or no control because of
ambiguous lines of responsibility; chaos risk sources in supply chains are due over-reactions,
unwarranted interventions, false alarm, lack of transparency, etc.; and inertia risk sources

Apeejay Business Review, Vol. 13, No.1 & 2, January-December 2014
10
emanate from the inability of organizations to sense and respond to changing environmental
and market conditions (Juttner et al., 2003).
Van Landeghem and Vanmaele (2002) posit that sources of uncertainty in supply chain
include customs regulations, price changes, information delays, competitor action, political
environment, stochastic cost, available capacity, supplier quality, manufacturing yield, and
internal organization. Sources of supply chain risks emanate from environmental,
organizational, or supply chain logistics-related factors that cannot accurately be predicted
and can impact the supply chain outcome variables (Juttner et al., 2003). Also, due to the
inherent complexities of the physical and economic systems, the unfolding of most processes
shows attributes that cannot be forecast with absolute accuracy (Moschini and Hennessy,
1999).
Once risks have been identified, they must then be assessed as to their potential severity of
impact (generally a negative impact, such as damage or loss) and to the probability of
occurrence. These quantities can be either simple to measure, in the case of the value of a lost
building, or impossible to know for sure in the case of the probability of an unlikely event
occurring. Therefore, in the assessment process it is critical to make the best educated
decisions in order to properly prioritize the implementation of the risk management plan.
SC Risk Management
The risk management involves the course of actions to be considered in order to reduce the
risks. This can be done by reducing the probability of occurrence, the severity of impacts, or
both. Generally, risk management involves such options as transferring it to or sharing it with
other parties, accepting it as it is, or avoiding the risks. Transferring risk to other parties is a
common supply chain management practices nowadays. The stage immediately after
completion of the risk assessment phase consists of preparing a Risk Management Plan,
which should document the decisions about how each of the identified risks should be
handled. Mitigation of risks often means selection of security controls, which should be
documented in a Statement of Applicability, which identifies which particular control
objectives and controls from the standard have been selected, and why. On one side a supply
chain is exposed to certain risks, that may (or not) lead to certain supply chain disruptions.
One the other side the supply chain has certain characteristics, which determine the supply
chain vulnerability. The severity of supply chain disruptions is related to supply chain design
characteristics (supply chain density, supply chain complexity and node criticality) and
supply chain mitigation capabilities (recovery capability and warning capability). In brief:
supply chain structure and supply chain organization. Within this framework, a company can
address supply chain disruptions in two ways:
1) Redesign the supply chain towards a better structure, in order to gain a better location, or
2) Redesign the supply chain towards a better organization, in order to gain better
preparedness.
Business Continuity Management
Business Continuity Management (BCM) deals with the development of strategies, plans and
actions which provide protection or alternative modes of operation for those activities which,
if interrupted, might bring a seriously damaging impact or fatal loss to the company.
According to Norrman and Lindroth (2004), BCM covers wider scopes than the supply chain
risk management.BCM includes crisis management, disaster recovery, business recovery, and
contingency planning which are often not considered to be the main focuses of supply chain
risk management.
Apeejay Business Review, Vol. 13, No.1 & 2, January-December 2014
11
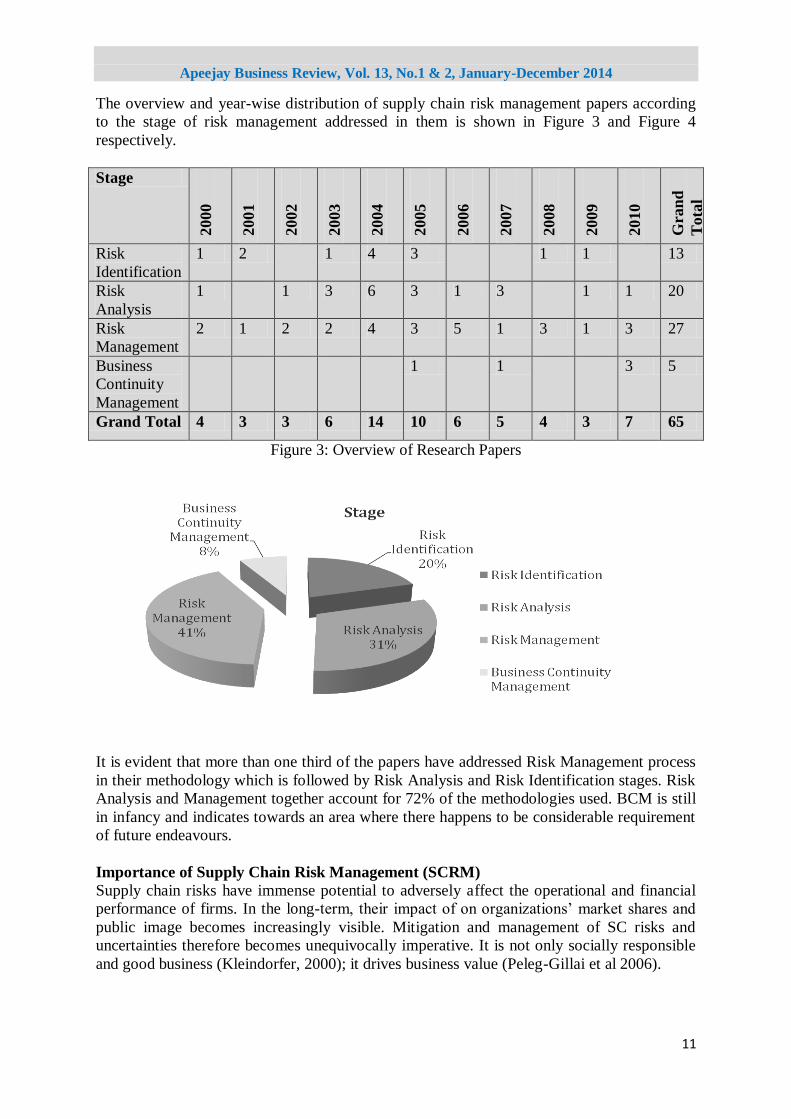
The overview and year-wise distribution of supply chain risk management papers according
to the stage of risk management addressed in them is shown in Figure 3 and Figure 4
respectively.
Stage
2000
2001
2002
2003
2004
2005
2006
2007
2008
2009
2010
Gra
nd
Tota
l
Risk
Identification
1 2 1 4 3 1 1 13
Risk
Analysis
1 1 3 6 3 1 3 1 1 20
Risk
Management
2 1 2 2 4 3 5 1 3 1 3 27
Business
Continuity
Management
1 1 3 5
Grand Total 4 3 3 6 14 10 6 5 4 3 7 65
Figure 3: Overview of Research Papers
Figure 4: Distribution based on Stage of Risk Management
It is evident that more than one third of the papers have addressed Risk Management process
in their methodology which is followed by Risk Analysis and Risk Identification stages. Risk
Analysis and Management together account for 72% of the methodologies used. BCM is still
in infancy and indicates towards an area where there happens to be considerable requirement
of future endeavours.
Importance of Supply Chain Risk Management (SCRM)
Supply chain risks have immense potential to adversely affect the operational and financial
performance of firms. In the long-term, their impact of on organizations‘ market shares and
public image becomes increasingly visible. Mitigation and management of SC risks and
uncertainties therefore becomes unequivocally imperative. It is not only socially responsible
and good business (Kleindorfer, 2000); it drives business value (Peleg-Gillai et al 2006).

Apeejay Business Review, Vol. 13, No.1 & 2, January-December 2014
12
Kleindorfer (2000) proposed that in order to manage and mitigate supply chain risks one must
execute following integrated processes:
1) Identifying underlying sources of risks,
2) Determining the gateways by which such risks can manifest,
3) Assessing the potential impact of these risks under various scenarios, and
4) Providing the measures for mitigating and coping with these impacts.
Faisal et al. (2007) argued that understanding of the variables associated with risk mitigation
and their relative interdependencies are the most difficult part of SCRM. Peck (2006) puts it
that the primary goal of risk management is to identify and quantify the potential sources of
risks, control and reduce specific narrowly defined risks.
In realizing the business objectives, organizations are immensely dependent on the supply
chain partners and the influence of any link in the supply chain. To ensure that the
organizational objectives stand a better chance of being attained, it becomes necessary to gain
a full understanding of all the developments and uncertainties that could emerge at any point
in the supply chain.
Effective Supply Chain Risk Management provides a number of direct benefits:
The ability to anticipate and respond promptly to external trends and developments.
A focus on uncertainties rather than the certainties.
Greater influence over your supply chain partners.
Greater mutual understanding of the interests and problems of all supply chain partners.
Better balance between opportunities and threats.
Management which is not based on the cost factor alone.
Competitive edge through the acceptance of controlled risks.
Emerging Trends
The ability to ―optimize an organization‘s financial performance requires ongoing analysis of
key risks spanning the entire supply network that connect suppliers, manufacturers,
distributors, retailers, and customers. Analyzing the supply chains with the perspective of
risks gives organizations a better understanding of the potential sources of a disruption, and,
most importantly, the potential financial impact resulting from the disruption‖ (Lowery,
2004). However, Mitroff and Alpaslan (2003) reported that only a mere 5% to 25% of
Fortune 500 companies were girded to deal with disruptions and/or crisis.
In recent years, the relevance of risks and uncertainty in supply chain has received an
avalanche of attention from academics, practitioners, (Hendricks and Singhal, 2005;
Kleindorfer and Van Wassenhove, 2004; Cavinato, 2004; Kleindorfer and Saad, 2005;
Towill, 2005; Peck, 2006; Barry, 2004; Christopher, 2003 Christopher and Lee, 2004;
Zsidisin et al., 2004; Spekman and Davis; 2004), markets and governments. From the
perspective of supply chain management, probability is generally regarded as the measure of
how often a disruptive event that can lead to a loss occurs (Zsidisin et al., 2004). However,
despite the fact that the risks continue to rise, most organizations have not done enough and
are unprepared to effectively manage and mitigate those risks.
A global survey of business executives by the McKinsey Quarterly (2006) reported that:
1) Approximately 67% of respondents said that the risks to their global supply chains
have increased over the past five years;

Apeejay Business Review, Vol. 13, No.1 & 2, January-December 2014
13
2) About two out of three executives who responded indicated that they are facing
increasing risks to their ability to supply their customers with goods and services cost
effectively;
3) A significant number of the executives do not spend enough time or resources on
managing and mitigating risks;
4) Approximately 25% of their companies do not perform formal risk assessment and
about 50% lack company-wide standards to help manage and mitigate risks;
5) Few executives expressed confidence in their firms‘ ability to manage variety of
risks successfully and are making limited use of some well-known tools that could
help.
SCRM has been a rapidly growing area for a few years. Papers on supply chain risk
management address various types of supply chain risks and authors have developed various
risk classifications. Understanding the types of risks and their probability of occurrence as
well as the associated impacts is a starting point for companies to develop effective risk
management strategies. Since supply chain risk management is still in the infancy stage and
the need for better supply chain risk management is high, this field will continue to be placed
on top list of future research agenda.
In general, the use of information technology could improve information visibility across the
supply chain. It is important to understand what different people in an organization or across
different organizations within a supply chain perceive about supply chain risks. Similarly, It
would be interesting to explore differences and similarities in perceptions toward supply
chain risks inside an organization and across organizations in a supply chain. More research
needs to be conducted to learn how technologies could be used to mitigate risks in a supply
chain.
The collaborative planning and forecasting are gaining more attention in the literature. Future
research should then be expanded to explore how collaborative risk management between
companies in a supply chain could work. The possible research could be the design of a
framework for collaborative risk management and various possible schemes for collaborative
risk management between organizations in a supply chain.
Conclusion
Globalization, outsourcing, lean and agile approaches have made the supply chains
exceedingly vulnerable to risks. More than ever, they are exposed to myriad risks viz.
regulatory compliance, exchange rate fluctuation, interest and inflation rates, tariffs,
commodity prices, quality labor, socio-political conditions, natural disasters, and
infrastructure imperatives. Only firms capable of managing supply chain risks would enhance
shareholder value and firms that neglect to respond to the challenges posed by SCRM would
do so at their own peril. According to McBeath (2004), ―understanding the risks and
managing to avert them can prevent unplanned cost and improve total performance. As the
inventible disruptions occur every day in supply chains (as in life), those that are the most
resilient will win by a long shot.‖ Accordingly, the businesses have an obligation towards
shareholders and consumers to pursue SCRM implementation. Those organisations that are
successful in addressing and vaccinating their global supply chain against disruptions risks
and uncertainties will gain competitive advantage and create value for shareholders.
To survive and thrive amidst the emerging challenges in the twenty-first century, firms are
required to learn and adapt expeditiously to environmental imperatives. This implies that

Apeejay Business Review, Vol. 13, No.1 & 2, January-December 2014
14
they must find ―a new way of operating that gives them the flexibility to respond quickly to
unexpected changes. Transforming business to succeed in this rapidly accelerating
environment is no longer optional. In essence, adapt or die‖ (Heinrich and Betts, 2003).
Therefore, to succeed, the businesses must look proactively towards implementation of
SCRM to become resilient to abrupt disruptions in supply chains.
References
Atkinson, W. (2004). Tagged: the risks and rewards of RFID technology. Risk Management,
51(7), 12-19.
Atkinson, W. (2006). Supply chain management: new opportunities for risk managers. Risk
Management, 53(6), 10-15.
Barry, J. (2004). Supply chain risk in an uncertain global supply chain environment.
International Journal of Physical Distribution & Logistics Management, 34(9), 695 -
697.
Bosman, R. (2006). The new supply chain challenge: risk management in a global
economy.‖www.fmglobal.com, Global, 1-10.
Cavinato, J. L. (2004). Supply chain logistics risks: from the back room to the board room.
International Journal of Physical Distribution & Logistics Management, 34(5), 383-
389.
Chopra, S. & Meindl, P. (2001). Supply chain management: Strategy, planning and operation.
Pearson Education Asia.
Chopra, S. & Sodhi, M. S. (2004). Managing risk to avoid supply-chain breakdown. MIT
Sloan Management Review, 46(1), 53-61.
Christopher, M. (2003). ―Creating resilient supply chains: A practical
guide.‖www.cranfield.ac.uk/som/scr, pp. 1-100.
Christopher, M. (2005). Managing risk in the supply chain. In logistics and supply chain
management (3rd ed., pp. 231-258). Harlow: Prentice Hall.
Christopher, M. & Peck, H. (2004). Building the resilient supply chain. International Journal
of Logistics Management, 15(2), 1-13.
Cucchiella, F. & Gastaldi, M. (2006). Risk management in supply chain: a real option
approach. Journal of Manufacturing Technology Management, 17(6), 700 - 720.
Cucchiella, F. & Gastaldi, M. (2007). Risk management in a globalised cosmetic firm.
International. Journal of Logistics Economics and Globalisation, 1(1), 21-33.
Enyinda, C. I., Tolliver, D. & Szmerekovsky, J. (2007). Mitigating and managing global
supply chain risks and security: leveraging RFID technology. In Proceeding of the
Society for Advancement of Management.
Faisal, M. N., Banwet, D. K. & Shankar, R. (2006). Mapping supply chains on risk and
customer sensitivity dimensions. Industrial Management & Data System, 106(6), 878-
895.
Faisal, M. N., Banwet, D. K. & Shankar, R. (2007). Quantification of risk mitigation
environment of supply chains using graph theory and matrix methods. European
Journal of Industrial Engineering, 1(1), 22-39.
Finch, P. (2004). Supply chain risk management. Supply Chain Management: An
International Journal, 9(2), 183 - 196.
Hallikas, J., Puumalainen, K., Vesterinen, T. & Virolainen, V.-M. (2005). Risk-based
classification of supplier relationships. Journal of Purchasing & Supply Management,
11, 72-82.
Heinrich, C. & Betts, B. (2003). Adapt or Die: Transforming your supply chain into an
Adaptive Business Network. John Wiley & Sons, Inc. 1-233.

Apeejay Business Review, Vol. 13, No.1 & 2, January-December 2014
15
Hendricks, K. B. & Singhal, V. R. (2005). An empirical analysis of the effect of supply chain
disruptions on long-run stock price performance and equity risk of the firm. Production
and Operations Management, 14(1), 35-52.
Juttner, U. (2005). Supply chain risk management: Understanding the business requirements
from a practitioner perspective. International Journal of Logistics Management, 16(1),
120-141.
Juttner, U., Peck, H., & Christopher, M. (2003). Supply chain risk management: Outlining an
agenda for future research. International Journal of Logistics: Research and
Applications, 6(4), 197-210.
Kleindorfer, P. R. (2000). Industrial ecology and risk analysis.
http://grace.wharton.upenn.edu/risk/downloads/01-25-pk.pdf.
Kleindorfer, P. R., & Wassenhove, V. L. N. (2004). Managing risk in global supply chains. In
H. Gatignon & J. R. Kimberly (Eds.), The INSEAD-Wharton Alliance on Globalizing
– Strategies for Building Successful Global Businesses (pp. 288-305): Cambridge
University Press.
Kleindorfer, P. R. & Saad, G. H. (2005). Managing disruption risks in supply chains.
Production and Operations Management, 14(1), 53-68.
Lindroth, R., & Norrman, A. (2004). Risk, information and incentives in telecom supply
chains. International Journal of Production Economics, 90(1), 1-16.
Lowery, R. (2004). Supply chain: risky business. Logistics today, 1-4.
McBeath, B. (2004). Resilient supply chains – the next frontier.
chainlinkresearch.com/research/detail.cfm?
McKinsey Quarterly. (2006). Understanding supply chain risk: a McKinsey global survey.
September, 1-9.
Mentzer, J. T., DeWitt, W. Keebler, J. S., & Min, S. (2001). Defining supply chain
management. Journal of Business Logistics, 22(2), 1-25.
Miller, K. D. (1992). A framework for integrated risk management in international business.
Journal of International Business Studies, 23(2), 311—33, 311--331.
Mitroff, I. I. & Alpaslan, M. C. (2003). Preparing for evil. Harvard Business Review, April,
109-115.
Moschini, G. & Hennessy, D. A. (1999). Uncertainty, risk aversion and risk management for
agricultural producers. In Bruce Gardner & Gordon Rausser, (Eds.) Handbook of
Agricultural Economics, Amsterdam: Elsevier Science Publishers.
Norrman, A. & Jansson, U. (2004). Ericsson‘s proactive supply chain risk management
approach after a serious sub-supplier accident. International Journal of Physical
Distribution & Logistics Management, 34(5), 434 - 456.
Norrman, A. & Lindroth, R. (2004). Categorization of supply chain risk and risk
management. In C. Brindley (Ed.), Supply chain risk: Ashgate Publishing Limited.
Ojala, M. & Hallikas, J. (2006). Investment decision-making in supplier networks:
Management of risk. International Journal of Production Economics, 104(1), 201-213.
Paulsson, U. (2004). Supply chain risk management. In C. Brindley (Ed.), Supply chain risk
,79-96 . Burlington: Ashgate Publishing Limited.
Peck, H. (2005). Drivers of supply chain vulnerability: an integrated framework. International
Journal of Physical Distribution & Logistics Management, 35(3/4), 210-232.
Peck, H. (2006). Reconciling supply chain vulnerability, risk and supply chain management.
International Journal of Logistics: Research and Applications, 9(2), 127-142.
Sadler, I. & Gough R. (2005). Applying a strategic planning process to several supply chain
partners. Journal of Manufacturing Technology Management,16(8), 890-908.
Sheffi, Y. (2001). Supply chain management under the threat of international terrorism.
International Journal of Logistics Management, 12(2), 1-11.
Apeejay Business Review, Vol. 13, No.1 & 2, January-December 2014
16
Sheffi, Y. & Rice, J. B. (2005). A supply chain view of the resilient enterprise. MIT Sloan
Management Review, 47(1), 41-52.
Sodhi, M. S. (2005). Managing demand risk in tactical supply chain planning for a global
consumer electronics company. Production and Operations Management, 14(1), 69-79.
Sorensen, L. B. (2005). How risk and uncertainty is used in supply chain management: a
literature study. International. Journal of Integrated Supply Management, 1(4), 387-
409.
Spekman, R. E. & Davis, E. W. (2004). Risky business: expanding the discussion on risk and
the extended enterprise. International Journal of Physical Distribution & Logistics
Management, 34(5), 414 - 433.
Tang, C. S. (2006). Perspectives in supply chain risk management. International Journal of
Production Economics, 103(2), 451-488.
Towill, D. R. (2005). The impact of business policy on bullwhip induced risk in supply chain
management. International Journal of Physical Distribution & Logistics Management,
35(8), 555.
Van Landeghem, H. and Vanmaele, H. (2002). Robust planning: A new paradigm for demand
chain planning. Journal of Operations Management, Vol. 20, 769-83.
Wagner, S. M. & Bode, C. (2006). An empirical investigation into supply chain vulnerability.
Journal of Purchasing and Supply Management, 12(6), 301-312.
Zsidisin, G. A. (2003). Managerial perceptions of supply risk. Journal of Supply Chain
Management, 39(1), 14-25.
Zsidisin, G. A. & Ellram, L. M. (2003). An agency theory investigation of supply risk
management. Journal of Supply Chain Management, 39(3), 15
Zsidisin, G. A. & Smith, M. E. (2005). Managing Supply Risk with Early Supplier
Involvement: A Case Study and Research Propositions. Journal of Supply Chain
Management, 41(4), 44.

Apeejay Business Review, Vol. 13, No.1 & 2, January-December 2014
17
Knowledge Management in Business: A Review of
Implementation Issues and Evaluation Techniques
Parul Sinha
IILM Institute for Higher Education, Gurgaon
Monika Arora Apeejay School of Management, New Delhi
N. M. Mishra Institute of Management Technology-Centre for Distance Learning, Ghaziabad
Abstract
Knowledge Management Systems (KMS) are of prime importance in the business scenario
these days. They act as key enablers of business performance monitoring and also catalysts
for the business processes. The background of the paper lies on the fact that, just as human
beings are unable to draw on the full potential of their brains, organizations are generally
not able to fully utilize the knowledge that they possess. Through Knowledge Management
(KM), organizations seek to acquire or create potentially useful knowledge and to make it
available to those who can use it at a time and place that is appropriate for them to achieve
maximum effective usage in order to positively influence organizational performance. Despite
of these continuous efforts by every organisation for achieving sustainable competitive
advantage, a desire exists to constantly monitor their KM system and also to iteratively
resolve the KM adaptation and Implementation issues that may occur. In this paper an effort
is made by the authors to review some of these implementation issues and evaluation
techniques. Some methods, obtained from literature review and real life case studies are also
suggested to conquer the challenges that may occur and improvement methods are suggested.
Keywords: knowledge management, knowledge management system, organisation
Introduction
In today's business environment, knowledge has emerged as the most valuable corporate asset
and deserves to be managed as a primary resource. Managing knowledge is about monitoring,
securing and realizing the potential and value of the information the company possesses and
the people, who multiply this value by adding experience, knowledge and associations in
order to produce new insights. This cycle continues endlessly and the companies who
succeed in organizing and using this flow will be the winners of tomorrow. Information
technology acts as a facilitator and contributes tools, enable processes and networks that make it
easier to find relevant information and people. Further, Information Technology leverage the value of information by providing structure, perspective and access to otherwise unstructured information.
Knowledge management has evolved from the thinking of academics and pioneers such as
Peter Drucker in the 1970s, Karl-Erik Sveiby in the late 1980s, and Nonaka and Takeuchi in
the 1990s. Globalization emerged and brought new opportunities and increased competition.
Companies adapted by downsizing, merging, acquiring, reengineering and outsourcing. Many
streamlined their workforce and boosted their productivity and their profits by using advances

Apeejay Business Review, Vol. 13, No.1 & 2, January-December 2014
18
in computer and network technology. By the early 1990s a growing body of academics and
consultants were talking about knowledge management as ―the‖ new business practice, and it
began to appear in more and more business journals and on conference agendas. By the mid-
1990s, it became widely acknowledged that the competitive advantage of some of the world‘s
leading companies was being carved out from those companies‘ knowledge assets such as
competencies, customer relationships and innovations. Managing knowledge therefore
suddenly became a mainstream business objective as other companies sought to follow the
market leaders.
Many of these companies took the approach of implementing ―knowledge management
solutions‖, focusing almost entirely on knowledge management technologies. However they
met with limited success. Fortunately companies are now recognizing their mistakes and are
beginning to take a different approach to knowledge management – one in which the
emphasis is more on people, behaviors and ways of working, than on technology.
Knowledge Management
Knowledge management involves two important parts: ―Knowledge‖ and ―Information‖.
Before moving forward to knowledge management it is important to know what knowledge
is: In general knowledge can be defined as ―the facts, feelings or experiences known by a
person or group of people‖. Knowledge is derived from information while information is
derived is from data which is raw facts and figures. When data is processed it gets converted
into information and finally it gets converted into knowledge after some gaining some
familiarity, awareness and understanding through experience or study therefore knowledge is
much richer and meaningful than information. Knowledge results from making comparisons,
identifying consequences, and making connections. Information, knowledge, and wisdom are
more than simply gatherings; they are one step ahead of each other. Each evolves to the other
stage as a synergy of numerous factors. This could be depicted with the help of Fig. 1.
Figure 1: Knowledge Evolution
Knowledge is a fluid mix of framed experience, values, contextual information, expert insight
and grounded intuition that provides an environment and framework for evaluating and
incorporating new experiences and information. It originates and is applied in the minds of
knower. In organizations, it often becomes embedded not only in documents or repositories
Apeejay Business Review, Vol. 13, No.1 & 2, January-December 2014
19
but also in organizational routines, processes, practices, and norms (Davenport & Prusak
1998). In organizational terms, knowledge is ―know how‖ or ―applied action‖. Knowledge
Management is about applying the collective knowledge of the entire workforce to achieve
specific organizational goals. In organization it is based on the concept that organization‘s
most valuable resource is the knowledge of its people. Therefore, the extent to which an
organization performs well, will depend, among other things, on how effectively its people
can create new knowledge, share knowledge around the organization, and use that knowledge
to best effect.
The aim of knowledge management is not necessarily to manage all knowledge resulting
from Information processing, because it may lead to Overloading. According to (Derbyshire,
2011) Scientists have worked out exactly how much data is sent to a typical person in the
course of a year – the equivalent of every person in the world reading 174 newspapers every
single day. This overload of data is making knowledge management increasingly important.
It is about ensuring that people have the knowledge they need, where they need it, when they
need it – the right knowledge, in the right place, at the right time. Knowledge management
can be understood as a business activity with two fundamental aspects:1)Treating the
knowledge component of business activities as an obvious concern of business , as a strategic
resource, and 2)Making a Proportionate relationship between an organization‘s intellectual
assets and business results.
In practice, knowledge management often consists of activities for 1) Identifying and
mapping intellectual assets within the organization, 2)Generating new knowledge for
competitive advantage within the organization,3) Making vast amounts of corporate
information accessible,4) Sharing of best practices, and 5)Technology that enables all of the
above - including groupware and intranets.
The KM practices in most organizations have three phases: 1) Creation of databases or
knowledge repositories -- gathering data/information; 2) Dispensing information -- meetings,
seminars, or accessing online databases; and 3) Maintaining the KM database -- adding,
deleting and updating information. The best known KM system is Google. Another well-
known repository of knowledge is Wikipedia. Knowledge management systems are not new;
just the name is new. The old version of a KM system used to be called library, where we
obtained books that contained vast amounts of knowledge. When someone wanted to retrieve
some information they went to the library searched for books and periodicals, and tried to
find the required information. Libraries still exist, but most people today want immediate
gratification, coupled with an urgent need to get reliable, updated and tried and tested
solutions to their unique requirements. These demands can be satisfied by a KM solution to
some extent.
Need of Knowledge Management in Business
Over the past several years there have been intensive discussions about the need or
importance of knowledge management within our society and in particular within the
Industry. Also it is stated that, the mere existence of knowledge somewhere in an
organization is of little benefit; it becomes a valuable corporate asset only when it is
accessible, and its value increases with the level of accessibility (Davenport & Prusak, 1998).
Thus, the transmission of knowledge is crucial. It is the ability to transmit knowledge more
quickly and more effectively to a wider global audience that lies at the root of the New
Economy‘s productivity potential. Knowledge management is critical to business success and
to make knowledge work productive is the great management task of this century (Botkin

Apeejay Business Review, Vol. 13, No.1 & 2, January-December 2014
20
1999). According to (Serban and Luan 2002), knowledge-based competitive advantage is
sustainable because learning is indispensable and hence the limit to knowledge creation. Thus
there are five reasons for the rise in popularity of KM in various areas namely, 1) Information
overload and chaos 2) Information congestion 3) Information and Skill segmentation and
specialization 4) Workforce mobility and turnover and 5) Competition .
These views from the literature review can be discussed with the help of following important
points:
a) Knowledge Management is promoted as an important and necessary factor for
organizational survival and maintenance of competitive strength. To remain the market
leaders, organizations need to maintain a good capacity to retain, develop, organize, and
utilize their employee‘s capabilities. With the current globalization scenario of strategic
alliances and expansion programs, organizations are increasingly confronted with worldwide
competition. In order to build and sustain their competitive advantage, the knowledge and
expertise of an organization‘s staff needs to be observed and preserved as a critical strategic
resource.
b) Knowledge management also includes resolving and improving relationships among
individuals and companies and increasing the knowledge of employees. It paves the way for
rewarding, to encourage innovative and creative thinking, contributing ideas, giving way to
knowledge acquisition and knowledge creation. Due to the dynamic nature of knowledge, its
management is an ongoing, permanent cycle of gleaning, collating, data-basing and editing
as the knowledge is updated. The customer feedback also adds to the knowledge base and
provides information as to how the respondents perceive the products and services on offer,
whether they require additional products and services and how they feel generally about the
company.
c) Correct management of the required knowledge will increase sales and ensure improved
customer satisfaction. Storing the knowledge acquired is a must, because something that is in
someone's head is of no use unless there is access to it and nothing can do that well than a
good knowledge management software system. Scholars have broadly classified knowledge
as tacit and explicit (Polanyi, 1966; Wagner, 1987; Nonaka, 1994; Nonaka & Takeuchi,
1995; Sternberg,et al, 1995).
Wagner and Sternberg (1995) have defined tacit knowledge as work-related practical
knowledge learned informally through experience on the job. They further observe that tacit
knowledge is an intellectual and cognitive process that is neither expressed nor declared
openly but rather implied or simply understood. It is intimately related to action such that it
reflects knowing how as contrasted with knowing what. It is normally procedural in nature
and acquired without direct instruction or help from others. Indeed, tacit knowledge is highly
personal and hard to formalize, making it difficult to communicate and share with others.
Subjective insights, intuition and hunches fall into this category (Nonaka & Konno, 1998).
Example of explicit knowledge include strategies, methodologies, processes, patents,
products and services, whereas example of tacit knowledge include skills and competencies,
experiences, relationships within and outside the organization, individual beliefs ,values and
ideas.
Knowledge Management Implementation
Knowledge management is essentially about facilitating the processes by which knowledge is
created, shared and used in organizations. It is not about setting up a new department or

Apeejay Business Review, Vol. 13, No.1 & 2, January-December 2014
21
getting in a new computer system. It is about making small changes to the way everyone in
the organization works. There are many ways of looking at knowledge management and
different organizations will follow their own tailor made unique approaches. Generally,
creating a knowledge environment usually requires changing organizational values and
culture, changing people‘s behaviors and work patterns, and providing people with easy
access to each other and to relevant information resources.
When we talk of actual implementation, the processes of knowledge management are many
and varied. Knowledge management is essentially about people – how they create, share and
use knowledge, and so no knowledge management tool will work if it is not applied in a
manner that is sensitive to the ways people think and behave. Some of the processes that can
be a part of a knowledge management program can be : 1)Providing induction programs
concerned with ―know how‖ to new staff, 2)Conducting exit interviews when staff leave so
that their knowledge is not lost, 3)Creating databases of all publications produced by an
organization so that staff can access them with ease, 4)Providing ongoing learning so that
people can constantly update their knowledge, 5)Encouraging people with a common interest
to work and network with each other, 6)Creating electronic filing systems that can be
searched in a number of ways, making the information much easier to find, 7)Redesigning
physical workspaces , where people are more visible and approachable, 8) Putting staff
directories online so that people are aware of their peers, 9)Creating intranets so that staff can
access all kinds of organizational information and knowledge that might otherwise take a
great deal of time and energy to retrieve, and several others.
The Knowledge Management Process Cycle
KM processes directly improve organizational processes and procedures about innovation,
collaborative decision-making, and individual and collective learning. These improved
organizational processes and procedures produce intermediate outcomes such as better
decisions, organizational behaviours, products, services and relationships. These, in turn, lead
to improved organizational performance. The process cycle model of Fig. 2 depicts the same
with the generally accepted terminology of KM. There have been numerous KM processes
cycle models that describe the relationships of the key processes of KM, ranging from
Davenport and Prusak‘s (2000) 3-stage model ―Generate, Codify/Coordinate, Transfer‖ to
Ward and Aurum‘s (2004) 7-stage ―Create, Acquire, Identify, Adapt, Organize, Distribute,
Apply‖ (William R. King, 2009).
Immediate Outcomes of KM-based Organisational Process
Figure 2: KM in an Organization (W.R. King (ed.), Knowledge Management and
Organizational Learning, Annals of Information Systems, DOI 10.1007/978-1-4419-
0011-1_1, © Springer Science + Business Media, LLC 2009)
Apeejay Business Review, Vol. 13, No.1 & 2, January-December 2014
22
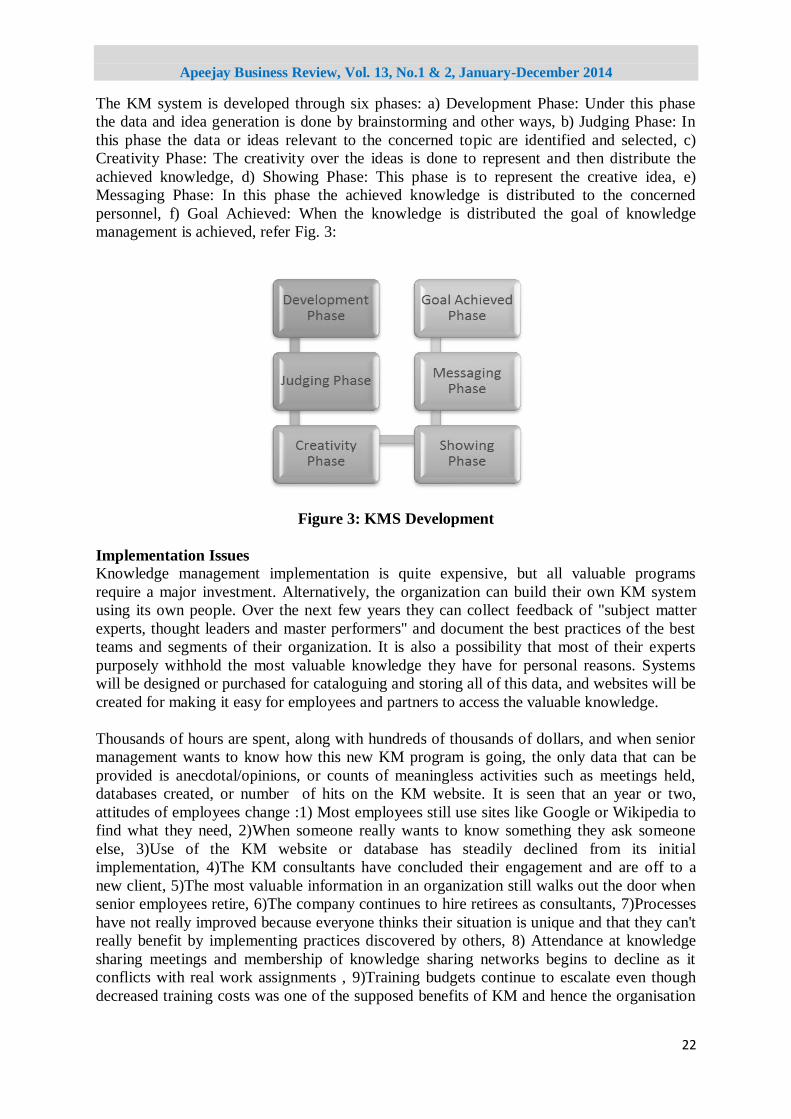
The KM system is developed through six phases: a) Development Phase: Under this phase
the data and idea generation is done by brainstorming and other ways, b) Judging Phase: In
this phase the data or ideas relevant to the concerned topic are identified and selected, c)
Creativity Phase: The creativity over the ideas is done to represent and then distribute the
achieved knowledge, d) Showing Phase: This phase is to represent the creative idea, e)
Messaging Phase: In this phase the achieved knowledge is distributed to the concerned
personnel, f) Goal Achieved: When the knowledge is distributed the goal of knowledge
management is achieved, refer Fig. 3:
Figure 3: KMS Development
Implementation Issues
Knowledge management implementation is quite expensive, but all valuable programs
require a major investment. Alternatively, the organization can build their own KM system
using its own people. Over the next few years they can collect feedback of "subject matter
experts, thought leaders and master performers" and document the best practices of the best
teams and segments of their organization. It is also a possibility that most of their experts
purposely withhold the most valuable knowledge they have for personal reasons. Systems
will be designed or purchased for cataloguing and storing all of this data, and websites will be
created for making it easy for employees and partners to access the valuable knowledge.
Thousands of hours are spent, along with hundreds of thousands of dollars, and when senior
management wants to know how this new KM program is going, the only data that can be
provided is anecdotal/opinions, or counts of meaningless activities such as meetings held,
databases created, or number of hits on the KM website. It is seen that an year or two,
attitudes of employees change :1) Most employees still use sites like Google or Wikipedia to
find what they need, 2)When someone really wants to know something they ask someone
else, 3)Use of the KM website or database has steadily declined from its initial
implementation, 4)The KM consultants have concluded their engagement and are off to a
new client, 5)The most valuable information in an organization still walks out the door when
senior employees retire, 6)The company continues to hire retirees as consultants, 7)Processes
have not really improved because everyone thinks their situation is unique and that they can't
really benefit by implementing practices discovered by others, 8) Attendance at knowledge
sharing meetings and membership of knowledge sharing networks begins to decline as it
conflicts with real work assignments , 9)Training budgets continue to escalate even though
decreased training costs was one of the supposed benefits of KM and hence the organisation

Apeejay Business Review, Vol. 13, No.1 & 2, January-December 2014
23
concludes that their implementation is a failure. Thus the need arises for an effective
implementation system, calibration system and a system to monitor the performance of the
KM system.
For effective implementation some guidelines need to be followed carefully. Knowledge
management doesn‘t need to be formally introduced throughout a company as a tool/process
to their workforce. Anyone can introduce knowledge management techniques at any level of
a company or organization. For example, a department manager could implement project
reviews where the entire project team gets together at the end of the project to discuss what
went well, what didn‘t go as well as expected, and what could be changed in the next project
to help improve the outcomes. This information can then be captured electronically so others
in the department and even within the company can learn from past project successes and
failures. KM is less about implementing a software tool and more about creating a learning
organization
Measuring the Impact of Knowledge Management System: Evaluation Techniques
Measurement is undoubtedly the least developed aspect of knowledge management. Without
measurable success, however, enthusiasm and support for knowledge management is unlikely
to be sustainable. And without measurable success the organizations are unlikely to be able
to identify what works and what doesn‘t, and therefore not able to make an informed
judgement about what to carry on doing and what to change.
For measuring the impact of knowledge management, many organizations may simply rely
on their standard performance measures of things like growth, profit and sales While these
types of outcome measures are certainly important, they are highly unlikely to be influenced
solely by KM activities, and therefore make poor metrics. As we have discussed that the tacit
knowledge that has been acquired over years of experience is the biggest concern in
organizations when a senior employee retires or moves to another job. Thus organizations
that have made a major investment in KM need a separate gauge on their corporate
dashboards to tell them how the KM program is working.
Features of Evaluation Techniques
Measuring outcomes focuses on the extent to which a project or a process achieves its stated
objectives. The success of the project or process serves as a proxy measure for the success of
the knowledge management practices embedded in it. Measuring activities then shifts the
focus on to the particular knowledge management practices that were applied in the project or
process. What were the particular knowledge management activities and what was their
effect? In measuring activities, the organization looks particularly at things like how often
users are accessing, contributing to, or using the knowledge resources and practices they have
set up. Some of these measures will be quantitative (hard) measures such as the number and
frequency of hits or submissions to an intranet site per employee. However, these measures
only give part of the picture – they do not tell the organisation why people are doing what
they are doing. Thus the organisation thus needs to adopt qualitative (soft) measures by
asking people about the attitudes and behaviours behind their activities. For measuring
outcomes and activities, qualitative indicators help to determine whether the organisation is
making progress on both the outcomes and activities
Such indicators could include the following points :1) Employees have shown an increase in
critical thinking and communication skills which enable them to synthesize, sort and
summarize information and knowledge as they work and interact with peers and ; 2) There is

Apeejay Business Review, Vol. 13, No.1 & 2, January-December 2014
24
a conscious effort to learn before, during and after key projects and activities using
established learning processes.
An effective metric or gauge for KMS might be an calibration system that is comprised of
the following four types of measures: 1) Awareness - knowledge of what to document, how to
document it, how to access KM databases, etc, 2) Behaviour - participation in KM activities
such as committees/teams, making presentations, etc, 3) Outputs - creation of databases,
whitepapers, lessons learned reports, best practice documentation, etc, 4) Outcomes - impact
of new knowledge on key measures of organizational performance such as product sales,
productivity, cost reduction, or quality improvement.
A business case was studied in which the organisation searched for best practices when it
came to KM metrics, and found that many of the activity measures that various companies
had tracked often did not correlate to any meaningful outcomes. In other words, lots of
databases were built, presentations were made and knowledge sharing meetings were held,
but overall company performance had failed to improve. The KM metric they were most
impressed with was of an XYZ organisation in similar business that followed an approach
that focuses on outputs and outcomes. The organisation does not bother measuring how many
things get documented or reviewed. Rather, they measured how many ideas or approaches are
developed in one part of the company that are then adopted and implemented in other parts of
the company. They also measured how implementation of the ideas and approaches has paid
off on bottom-line outcome measures.
KM behaviour measures also tracked documentation of important information and lessons
learned, and use of KM software that the company had purchased. They came up with
measures of awareness and engagement (behaviour) on a 10-point scale, and ratings were
done quarterly because the level of participation on KM activities tended to increase or
decrease with time. It was subjective to say whether the KM gauge they created was a valid
one, but at least it was one that all participants agree on, and the 60% portion was taken from
XYZ and had been proven over a number of years. In fact, XYZ was one of few companies
for having an excellent KM measurement system. Knowledge management looks like a valid
and effective approach for organizations to pass on lessons learned to others. However, some
other management programs that have come and gone over the years or the ones still existing
have failed to produce promised results. The failures have not been due to any shortcomings
in the programs themselves, but are due to poor implementation or a lack of resources.
Because of this, it is important to have a way of measuring on at least a quarterly basis how
well KM initiative is going. Companies should not fall into the trap of measuring KM by
counting teams, meetings, databases, website hits, or similar meaningless things that are easy
to quantify and report on. They should focus most of their metric on real results that can be
attributed to KM. On the other hand, simply tracking existing performance measures like
ROI, sales, profits, or customer loyalty will not really show the effectiveness of KM.
In many large organizations, KM is just one of many programs or activities designed to
improve performance. This was also the reflected in a business case studied. They created a
section of their dashboard called "Enterprise Excellence" that included one gauge for each of
the four major improvement initiatives the company had. There was a KM gauge, another for
Lean, another for Balanced Scorecard and a fourth gauge that measured the success of
Process Improvement. Each of the four Enterprise Excellence metrics had a similar structure,
Apeejay Business Review, Vol. 13, No.1 & 2, January-December 2014
25
with 60% of the weight on the output/outcome measures and 40% on the awareness/behavior
measures. This approach makes sense for measuring any improvement initiative.
The best approach to designing a KM metric is to include the categories of measures we
previously have mentioned and include both leading and lagging indicators. To test the
validity of the leading indicators, we should monitor to see if an improvement in the leading
indicators leads to improvements in the lagging ones. The organizations that we studied
found no correlation between KM activity measures and outcomes.
Steps to Measure the Impact of Knowledge Management System
The following steps can be followed for monitoring the KMS in our organisation (Knowledge
management toolkit for the crisis prevention and recovery practice area, March 2007)
Step 1: Revisit your goals- The starting point for measuring any knowledge management
initiative will be the original goals of that initiative: what did we set out to achieve?
Step 2: Know your audience -When it comes to defining success, we often find that different
people have different ideas about what constitutes success. Managers who approved the
knowledge management initiative may want to know whether it helped to raise the profile of
their area of work. Users of the knowledge management initiative will want to know how it
has benefited them and whether their participation has been worthwhile.
Step 3: Be clear on why you are collecting data-Measuring for the sake of measuring is a
waste of time – be sure that we are measuring for a specific purpose or purposes, and that
some kind of action or decision will be taken as a result. Measuring against the objectives and
goals that we have defined at the beginning of a process is a good way to track our progress
and will help us to take appropriate corrective action if necessary.
Step 4: Decide what data will be collected and how- Spell out the details by clarifying what
data will be collected, who will collect it, how, when, where, etc.
Step 5: Analyse and communicate the measures- When analysing and presenting the results,
we should be sure to refer back to the original goals and the audience. The aim should be to
present results in a manner that we know that when KM is happening in our organization, it
answers the questions in a meaningful way, rather than simply presenting facts and figures.
Step 6: Review your combination of measures- Monitor and evaluate how our measures are
working. Developing measures is a process of trial and error- it may take some time.
Similarly, as objectives and situations change over time, so does our measures will need to
change refer Fig. 4

Apeejay Business Review, Vol. 13, No.1 & 2, January-December 2014
26
Figure 4: Steps to Measure the Impact of Knowledge Management System
Conclusion
An organization which embraces KM tends to benefit in several ways, foremost being its
ability to cut cost and time. Knowledge management has proven benefits across a business.
Which can be categorized as: a) Decreased costs, b) Improved quality, c) Improved sales, and
d) Save time. Elaborating these, the benefits can be in plenty such as: 1) Recording of
valuable knowledge acquired by senior employees that is in their heads; 2) Identifying where
to find valuable facts, data and lessons that will be useful for others; 3) Increased speed of
access to information; 4) Sharing of lessons learned in one part of an organization with others
who may benefit from it; 5) Minimizing the impact of valuable employees retiring or quitting
by first documenting what they know and have learned over the years; 6) A centralized
repository of corporate knowledge or intellectual capital; 7) Quality control on data entry to
ensure accuracy and completeness of knowledge - a benefit not found with Google or
Wikipedia; 8) Increased sharing and cooperation across units, locations and levels in the
organization; 9) Improved processes resulting in cost savings and productivity improvements.
References
Davenport, T. H. & Prusak, L., (1998). Working knowledge: How organizations manage
what they know, Boston, Harvard Business School Press.
Botkin, J., (1999, 32). Smart Business: How knowledge communities can revolutionize your
company, New York, Simon & Schuster.
Serban A. M., & Luan J., (No. 113, Spring 2002). Overview of knowledge management, New
Directions For Institutional Research, Wiley Periodicals, Inc.
Polanyi, M. (1957). The tacit dimension. Garden City, NY: Anchor Books.
Polanyi, M. (1966), The tacit dimension. Garden City, NY: Anchor Books
Wagner, R. K. (1987). Tacit knowledge in everyday intelligent behavior. Journal of
Personality & Social Psychology, 52, 1236-1247.
Nonaka, I., & Takeuchi, H. (1995). The knowledge creating company, New York: Oxford
University Press.
Nonaka, I. (1994). A dynamic theory of organizational knowledge creation. Organization
Science, 5, 14-37.

Apeejay Business Review, Vol. 13, No.1 & 2, January-December 2014
27
Sternberg, R. J., Wagner, R. K., Williams, W. M., & Horvath, J. A. (1995). Testing
commonsense, American Psychologist, 50, 912-927.
Nonaka, I., & Konno, N. (1998). The concept of ―BA‖: Building a foundation for knowledge
creation, California Management Review, 40(3), 40-54.
Each person is inundated with 174 newspapers' worth of information EVERY DAY via
television, emails and post By David Derbyshire UPDATED: 10:30 GMT, 11 February
2011 from : http://www.dailymail.co.uk/sciencetech/article-1355892/Each-person-
inundated-174-newspapers-worth-information-EVERY-DAY.html
ABC of Knowledge Management Freely extracted from the NHS National Library for Health
at http://www.library.nhs.uk/knowledgemanagement/ by Géraud Servin, publication
date: July 2005 from:
http://www.fao.org/fileadmin/user_upload/knowledge/docs/ABC_of_KM.pdf
Knowledge Management and Organizational Learning , William R. King, Katz Graduate
School of Business, University of Pittsburgh, Annals of Information Systems ,DOI
10.1007/978-1-4419-0011-1_1, © Springer Science+Business Media, LLC 2009 from
http://www.uky.edu/~gmswan3/575/KM_and_OL.pdf
Knowledge Management Toolkit For The Crisis Prevention And Recovery Practice Area,
March2007.fromhttp://www.undp.org.ye/reports/Knowledge%20Management%20Tool
kit%20for%20the%20Crisis%20Prevention%20and%20Recovery%20Practice%20Area
Richard T. Herschel & Nory E. Jones, Knowledge management and business intelligence: the
importance of integration, VOL. 9 NO. 4 2005, pp. 45-55, Emerald Group Publishing
Limited, ISSN 1367-3270 ,JOURNAL OF KNOWLEDGE MANAGEMENT , PAGE
45 from: http://www.umaine.edu/business/files/2009/06/ 47_business -intelligence-
paper.pdf

Apeejay Business Review, Vol. 13, No.1 & 2, January-December 2014
28
Decoding Impact of Job Design on Employee Burnout
Anjali Jindal, Pooja Garg and Renu Rastogi
Deptt. of Humanities & Social Sciences,
Indian Institute of Technology Roorkee, Roorkee
Abstract
Job related burnout can cause serious consequences for individual and organization,
because managers have major role in the functioning of the organizations. The purpose of
the paper is to focus on the relationship of job design and burnout of employees and
examining how the job design affects the dimensions of burnout. The study has been
conducted on a sample of 250 managers from FMCGs. Correlation and Stepwise regression
analysis was employed to test the proposed hypotheses. The findings indicate a significantly
negative relationship between job design and burnout. This paper offers useful insights for
the managers based on empirical evidence.
Keywords: job design, burnout, managers, FMCGs
Introduction
Job design is actually the process of deciding on the contents of a job in terms of duties and
responsibilities, on the methods to be used in carrying out the job, in terms of techniques,
systems and procedures, and on the relationships that should exist between the job holder and
his superior, subordinates and colleagues (Michael Armstrong, 1976). Today educated and
creative employees demand well designed jobs. Therefore, increasing attempts are being
made to redesign jobs so as to reduce the burnout level in employees.
Burnout is a work-related syndrome that most often affects the professionals. According to
Maslach et al. (2001) burnout is a prolonged response to chronic exposure to a variety of job
stressors. Empirical evidence indicates serious implications of burnout, implying substantial
costs for both organizations and individuals.
When an employee experiences the meaningfulness and responsibility on the job, he feels
motivated. He works hard to perform well to the extent. Research has demonstrated that
perceived job design and job characteristics are critical aspects that mitigate burnout
(Babakus et al., 1996; Ito and Brotheridge, 2003; Stamper and Johlke, 2003; Xanthopoulou,
et al., 2007). Consequently, burnout as experienced by employees is likely to have a
detrimental impact on customer‘s perceptions of service quality (Ledgerwood et al., 1998).
Empirical evidence indicates serious implications of burnout, implying substantial costs for
both organizations and individuals. Possible effects of burnout at the organizational level are
increased job turnover and absenteeism, decreased organizational commitment and reduced
productivity (Jackson et al., 1986; Lee and Ashforth, 1996; Leiter and Maslach, 1988; Wright
and Bonett, 1997; Wright and Cropanzano, 1998). Burnout has been also linked with various
health problems such as depression, irritability, anxiety, fatigue, insomnia and headaches
(Jackson and Maslach, 1982; Kahill, 1988).

Apeejay Business Review, Vol. 13, No.1 & 2, January-December 2014
29
Conceptualizing the Variables
Job Design: The concept of job design is not new. It has roots back to the beginning of the
industrial era. Perhaps the best-known theorist on job design is Frederick Taylor, who wrote
―The Principles of Scientific Management‖. He proposed analyzing and breaking jobs into
simplified tasks through motion studies. Job design defines and delineates the tasks, duties,
and responsibilities of a job. This information is then used to write job descriptions.
In the 1940s, at Berkeley, Louis E. Davis (1918-1998) published highly original research
about the human impacts of automation and coined the term ‗Job Design‘ to embrace the
notion of efficient and more socially effective alternatives to the prevailing industrial
paradigm of scientific management. Job design is affected by organizational, environmental
and behavioural factors. A properly designed job will make it more productive and satisfying.
If a job fails on this count, it must be redesigned based on the feedback.
Hackman & Oldham (1975) identified five dimensions of job design. These dimensions are:
(i) Skill Variety which concerns the degree to which the job requires that employees use a
variety of different activities, talents and skills in order to successfully complete the job
requirement.
(ii) Task Identity which refers the degree to which the job allows employees to complete
whole tasks from start to finish, rather than disjointed portions of the job.
(iii) Task Significance refers the degree of which job significantly impact the lives of others
both within and outside the workplace.
(iv) Autonomy refers to ―the degree to which the job provides substantial freedom,
independence, and discretion to the employee in scheduling the work and in determining the
procedures to be used in carrying it out‖.
(v) Feedback includes the degree to which the job itself provides employees with clear, direct
and understandable knowledge of their performance.
Burnout: It can be said that Burnout is the burning topic in the present scenario. This term
was coined in 1972 by Herbert J. Freudenberger, the New York psychologist. He defined this
term as a specific condition.
It is an emotional state characterized by an overwhelming and enduring feeling of exhaustion
or aggravation. Burnout is a condition that develops gradually as the person's creativity and
effectiveness erode into fatigue, skepticism and an inability to function productively.
Maslach and her colleagues developed a method for assessing burnout as a multidimensional
construct that went beyond mere exhaustion (Maslach and Jackson, 1981; Maslach & Leiter
et al., 2008).
Maslach identified the areas that contribute to people‘s experience of well-being. They are as:
(i) Exhaustion (Ex): Exhaustion refers to ―a consequence of intensive physical, affective and
cognitive strain, for example as a long term consequence of prolonged exposure to certain
demands‖. It includes references to fatigue, but do not make direct reference to people as the
source of those feelings.
(ii) Cynicism (CY): This is the indifferent attitude towards the work.
(iii) Professional Efficacy (PE): This includes the social and non-social aspects of
occupational accomplishment.
Literature Review
Job Design
Hackman and Oldham (1974) began by searching for the basic psychological states that
promote high-performance motivation and satisfaction at work.

Apeejay Business Review, Vol. 13, No.1 & 2, January-December 2014
30
The Job characteristics model identifies autonomy (along with the task significance, skill
variety, task identity and feedback) as contributing to the internal motivational potential of a
job (Hackman and Oldham, 1976).
Employees having jobs high on certain core job dimensions such as autonomy, variety, task
identity, task significance and feedback experience a sense of meaning, derive a sense of
personal fulfilment and motivation (Kahn, 1990) and as a result, feel more satisfied with their
job (Loher et al., 1985) and show greater attachment towards their organization (Flynn and
Tannenbum, 1993).
Hackman and Oldham’s (1976) job characteristics theory describes the relationship between
job characteristics and individual response to work.
Friedman and Greenhaus (2000) revealed that the core job characteristics namely autonomy,
skill variety, skill identity, task significance and feedback (Hackman and Oldham, 1976)
associated with a job provide a perception of added resource base to a job incumbent. These
resources embedded in a job may increase the perceived control over work and family
matters, provide motivation and energy and help in acquiring new skills which may facilitate
better performance.
Bontis and Serenko (2007) suggested that job characteristics contribute to employee
satisfaction, and through that, to organizational efficiency and customer focus.
Burnout
Kickul and Posig, (2001); Maslach and Jackson, (1981); and Maslach et al., (2001)
emphasized that Burnout results in reduced productivity, higher absenteeism and an intention
to quit one‘s job.
Schaufeli, (2006); Schaufeli and Bakker, (2004), Schaufeli et al. (2008) emphasized that the
systemic imbalance of demands to resources promotes exhaustion and reduces professional
efficacy while alienation from corporate values reduces providers‘ involvement in their work
or their service recipients.
Job burnout a serious outcome in itself, it also has been linked with reported intentions to
leave jobs (Burke and Greenglass, (1995); Burke et al. (1984); Jackson and Maslach, (1982);
Lee and Ashforth, (1996), as well as turnover and job dissatisfaction (Maslach et al., 1996).
Schaufeli and Bakker (2007), and Henkens & Leenders (2010) found that burnout may arise
as a result of problems employees may have with others. A lack of peer support may heighten
the risk of burnout
Hypotheses
The study has been initiated to verify the following hypotheses:
H1: There is significantly negative relationship between job design and burnout of
employees. Morever, there is significantly negative relationship between dimensions of job
design and dimensions of burnout of employees.
H2: There is significant impact of Job Design on burnout of employees.
H3: There is significant impact of job design on the dimension of burnout (Exhaustion) of
employees.
H4: There is significant impact of job design on the dimension of burnout (Cynicism) of
employees.

Apeejay Business Review, Vol. 13, No.1 & 2, January-December 2014
31
H5: There is significant impact of job design on the dimension of burnout (Personal Efficacy)
of employees.
Research Methodology
Sample: The sample for the study consists of 300 employees working at different managerial
levels. Data will be collected from managers and supervisors working in FMCGs and
manufacturing industries.
Procedure: Questionnaires were distributed among employees through personal contacts
within sampled organizations. Accompanied each questionnaire a letter explaining the
purpose of the study was there. Along with the questionnaires there was a Proforma
completed by the employees regarding demographic variables as: Name, Age, Sex,
Educational Qualification, Tenure, Rank and Marital Status.
Instruments: Following questionnaires were used to conduct the study:
(i) Job Design: To describe the job within organizations, Scale developed by Hackman and
Oldham (1976) was used. There are five dimensions in this scale to describe the job in any
organization as Skill variety, Task Identity, Task significance, Autonomy and feedback. The
scale has 23 items which has been measured on 5 point scale and the score ranges from 1=
very non-descriptive to 5 = very descriptive. The reliability is 0.56 (minimum) to 0.88
(maximum).
(ii) Burnout: To measure burnout, Maslach Burnout Inventory (MBI) developed by Maslach
C., Jackson S., & Leiter M.P. et.al (1996) was used. The scale measures dimensions of
Exhaustion (0.65), Cynicism (0.60) and Professional Efficacy (0.67). It is a 16 item scale
which will be rated on a 7 point scale and the score ranges from 0= never to 6= everyday.
The internal consistencies of the dimensions have been defined within the parentheses.
Analysis of Results: For the analysis of results, means and standard deviations were
calculated. Furthermore, Pearson correlation and Stepwise Regression Analysis was used to
study the relationships between the variables, and other suitable techniques can also be used
as per the requirement of the research. For the analysis of data SPSS v. 17 was used.
Results & Analysis
Descriptive statistics of the variables that have been examined in the study are reported in
Table 1, including sum, means and standard deviation.
H1: There is significantly negative relationship between Job Design and Burnout of
employees. And also there is significant relationship between dimensions of Job Design
and dimensions of Burnout of employees.
Table 2 represents a significantly negative relationship between Job design and burnout (on
over-all basis) with the calculated r=-0.652(significant at .01 level).The correlation between
the dimensions of job design and dimensions of burnout has been discussed separately in a
more detailed fashion in Table 1, under the pertinent headings.

Apeejay Business Review, Vol. 13, No.1 & 2, January-December 2014
32
Pearson Correlation between Job design and Burnout of Employees on Over-all Basis
Table 2
Variables JD
BO -.652**
**. Correlation is significant at the 0.01 level (2-tailed)
A glance of correlations shown in Table 1 reveals that all the dimensions of Job design as:
SV, TI, TS, AU and FB significantly correlate with the dimensions of burnout. It can be
noted that there is low correlation between Skill Variety (SV) and the dimensions of burnout
(EX & CY) with the calculated r-values as: .05 and -.03 respectively, while there is
significantly negative correlation with PE with the calculated r –value as -.24 (significant at
0.01 levels).
Another dimension i.e. Task Identity (TI) is significantly negatively correlated with
dimensions of burnout (EX, CY & PE) with the calculated correlation values as -.14
(significant at 0.05 level), -.37 and -.35 (significant at 0.01 level) respectively.
Another dimension i.e. Task significance (TS) is significantly negative correlated with
dimensions of burnout (EX, CY & PE) with the calculated correlation values as: -.36, -.52 &
-.44 (significant at 0.01 level) respectively.
There is also significantly negative correlation between Autonomy (AU) with dimensions of
burnout with the calculated r-value as: -.38, -.62 &-.51 (significant. at .01 level) respectively.

Apeejay Business Review, Vol. 13, No.1 & 2, January-December 2014
33
Last dimension of job design, Feedback (FB) is also in significantly negative correlation with
the dimensions of burnout (CY & PE) with the calculated correlation values as: -.24 & -.43
(significant at 0.01 levels) respectively. ). It can also be noted that the correlation between FB
and EX is low with the calculated r-value as: -.09.
H2: There is significant impact of Job Design on Burnout of employees.
In order to examine the extent to which weighted combination of various variables included
in the study predicts burnout of employees, stepwise regression analysis was conducted on
the observed data. Although the bi-variate correlation has dealt with the degree of
relationship among all the measures, but it cannot be interpreted directly as an index of the
extent to which scores on burnout are influenced by other variables, that is, job design.
Therefore, multiple regression analysis has been worked out by using stepwise method. On
an over-all basis, job design predicted burnout with calculated R as .652(F=219.78, p<.05,
beta=.652), and explained 42% of variance in predicting burnout as shown in Table 3.
Table 3
Multiple Regression Analysis for the Prediction of Burnout of Employees, with the
Independent Variable as Job Design and Dependent Variable as BO, on Over-all Basis
Variables R R2 Adjusted R
2 SEm F-value DF Beta
D.V: BO
I.V: JD
.652 .424 .423 3.78 219.78 229 .652
* Significant at .05 level. BO-Burnout, JD- Job Design
H3: There is significant impact of job design on the dimension of Burnout (Exhaustion)
of employees.
The above criteria allowed entry of five predictors as: Skill Variety, Task Identity, Task
significance, Autonomy and Feedback and all these variables jointly contributed in the
prediction of dimensions of burnout.
On the basis of result Table 4,the results of stepwise multiple regression reveal that among
all the dimensions of job design, SV predicted EX, with multiple R as .05 (F= .66, p<.01,
beta=.05, R2=.002); TI with multiple R as .15 (F= 3.35, p<.01,beta=.14, R
2=.02); TS with
multiple R as .38 (F= 16.17, p<.01, beta=.37, R2 =.14); and AU with multiple R as .43 (F=
16.94, p<.01,beta=.29, R2 =.19). FB with multiple R as .44 (F= 14.11, p<.01, beta=.10, R
2
=.19). The five dimensions jointly accounted for 19% of variance in the prediction of
exhaustion. As a whole, autonomy is the strongest predictor of exhaustion with the calculated
Beta value as .30.
H4: There is significant impact of job design on the dimension of Burnout (Cynicism) of
employees.
The five dimensions of job design predicted CY while SV predicted CY with multiple R as
.03 (F= .26, p<.01, beta=.03, R2=.001); TI with multiple R as .37(F= 23.41, p<.01,beta=.37,
R2=.14); TS with multiple R as .56 (F= 44.36, p<.01, beta=.45, R
2 =.31); and AU with
multiple R as .66 (F= 55.99, p<.01,beta=.46, R2 =.43). FB with multiple R as .66 (F= 44.81,
p<.01, beta=.04, R2 =.43). The five dimensions jointly accounted for 43% of variance in the
prediction of cynicism. As a whole, autonomy is the strongest predictor of cynicism with the
calculated Beta value as .47.
H5: There is significant impact of job design on the dimension of Burnout (Personal
Efficacy) of employees.
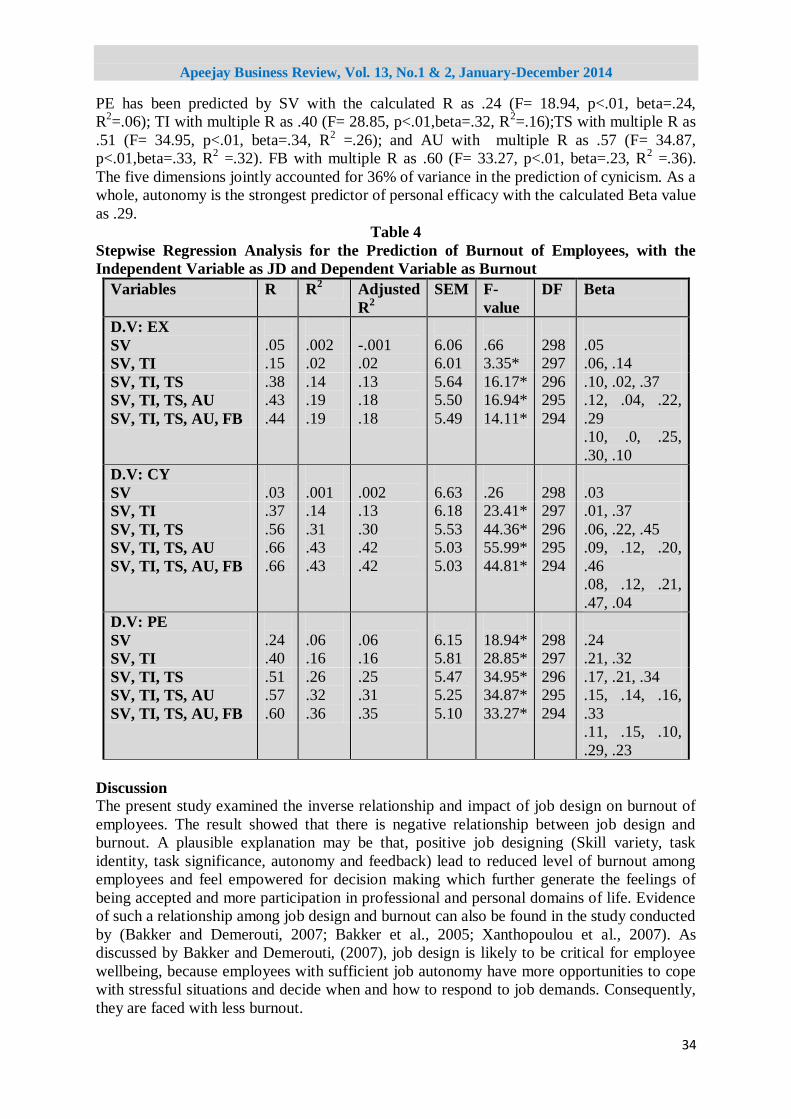
Apeejay Business Review, Vol. 13, No.1 & 2, January-December 2014
34
PE has been predicted by SV with the calculated R as .24 (F= 18.94, p<.01, beta=.24,
R2=.06); TI with multiple R as .40 (F= 28.85, p<.01,beta=.32, R
2=.16);TS with multiple R as
.51 (F= 34.95, p<.01, beta=.34, R2 =.26); and AU with multiple R as .57 (F= 34.87,
p<.01,beta=.33, R2 =.32). FB with multiple R as .60 (F= 33.27, p<.01, beta=.23, R
2 =.36).
The five dimensions jointly accounted for 36% of variance in the prediction of cynicism. As a
whole, autonomy is the strongest predictor of personal efficacy with the calculated Beta value
as .29.
Table 4
Stepwise Regression Analysis for the Prediction of Burnout of Employees, with the
Independent Variable as JD and Dependent Variable as Burnout
Variables R R2 Adjusted
R2
SEM F-
value
DF Beta
D.V: EX
SV
.05
.002
-.001
6.06
.66
298
.05
SV, TI .15 .02 .02 6.01 3.35* 297 .06, .14
SV, TI, TS
SV, TI, TS, AU
SV, TI, TS, AU, FB
.38
.43
.44
.14
.19
.19
.13
.18
.18
5.64
5.50
5.49
16.17*
16.94*
14.11*
296
295
294
.10, .02, .37
.12, .04, .22,
.29
.10, .0, .25,
.30, .10
D.V: CY
SV
.03
.001
.002
6.63
.26
298
.03
SV, TI .37 .14 .13 6.18 23.41* 297 .01, .37
SV, TI, TS
SV, TI, TS, AU
SV, TI, TS, AU, FB
.56
.66
.66
.31
.43
.43
.30
.42
.42
5.53
5.03
5.03
44.36*
55.99*
44.81*
296
295
294
.06, .22, .45
.09, .12, .20,
.46
.08, .12, .21,
.47, .04
D.V: PE
SV
.24
.06
.06
6.15
18.94*
298
.24
SV, TI .40 .16 .16 5.81 28.85* 297 .21, .32
SV, TI, TS
SV, TI, TS, AU
SV, TI, TS, AU, FB
.51
.57
.60
.26
.32
.36
.25
.31
.35
5.47
5.25
5.10
34.95*
34.87*
33.27*
296
295
294
.17, .21, .34
.15, .14, .16,
.33
.11, .15, .10,
.29, .23
Discussion
The present study examined the inverse relationship and impact of job design on burnout of
employees. The result showed that there is negative relationship between job design and
burnout. A plausible explanation may be that, positive job designing (Skill variety, task
identity, task significance, autonomy and feedback) lead to reduced level of burnout among
employees and feel empowered for decision making which further generate the feelings of
being accepted and more participation in professional and personal domains of life. Evidence
of such a relationship among job design and burnout can also be found in the study conducted
by (Bakker and Demerouti, 2007; Bakker et al., 2005; Xanthopoulou et al., 2007). As
discussed by Bakker and Demerouti, (2007), job design is likely to be critical for employee
wellbeing, because employees with sufficient job autonomy have more opportunities to cope
with stressful situations and decide when and how to respond to job demands. Consequently,
they are faced with less burnout.
Apeejay Business Review, Vol. 13, No.1 & 2, January-December 2014
35
This study showed that job design is highly correlated to burnout. Thus a decrease in the level
of job design could precede burnout therefore serve as a rapid alert system. In this case,
managers should be surveyed regarding their job satisfaction at regular intervals, and
managers with lower job satisfaction should receive special attention.
Conclusion
The current study makes significant contribution to knowledge and practice in this field.
There is only sparse literature concerning the relationships between job design and burnout,
and the present article significantly enriches our understanding of this issue. Furthermore this
study helps to resolve the ambiguity regarding the relationships between job design and
burnout. Previous studies examining the relationship between job design and burnout have
produced variable results, while those of the present study confirm that job design and its
dimensions have negative impact on burnout for the managers, both theoretically and
statistically.
Research Limitations and Future Research
This study also offers several avenues for future research. Although the study explored
causality, this can only be fully tested using data collected at different time points. Therefore,
researchers could consider using longitudinal investigations to demonstrate the causal
relationship reported here. Of course, it is too early to generalize the results outlined here to
all managers in FMCGs. More research is needed before we reach strong conclusions about
the extent of burnout in the industry.
The data obtained from a sample of professional and managerial men, provided considerable
support for the general hypothesis linking job design with burnout. The findings must be
interpreted in the light of the study‘s limitation that the sample size is low and it has been
selected from NCR, India only. It would be more appropriate to increase the sample size and
have diversified of the sample.
References
Amarjit S. Gill, & Mathur M., (2007). Improving employee dedication and pro-social
behavior, International Journal of Contemporary Hospitality Management, Vol. 19 Iss:
4, 328-337.
Aspasia Togia, (2005). Measurement of burnout and the influence of background
characteristics in Greek academic librarians, Library Management, Vol. 26 Iss: 3, 130-
138.
Babakus, E., Cravens, D. W., Johnston, M. & Moncrief, W. C. (1996). Examining the role of
organizational variables in the salesperson job satisfaction model , Journal of Personal
Selling and Sales Management, Vol. 16 No. 3, 33-46.
Babakus, E., Yavas, U. & Karatepe, O. M. (2008). The effects of job demands, job resources
and intrinsic motivation on emotional exhausation and turnover intentins: a study in the
Turkish hotel industry, International Journal of Hospitality and Tourism
Administration, Vol. 9 No. 4, 384-404.
Bakker, A. B., & Demerouti, E. (2007). The job demands-resources model: state of the art‖,
Journal of Managerial Psychology, Vol. 22 No. 3, 309-28.
Bakker, A. B., Demerouti, E. & Euwema, M. C. (2005). Job resources buffer the impact of
job demands on burnout, Journal of Occupational Health Psychology, Vol. 10 No. 2,
170-80.

Apeejay Business Review, Vol. 13, No.1 & 2, January-December 2014
36
Bontis, N. & Serenko, A. (2007). The moderating role of human capital management
practices on employee capabilities , Journal of Knowledge Management, Vol. 11 No. 3,
31-51.
Carstern C. Schermuly, & Bertolt Meyer, (2011). Effects of vice-principals‘ psychological
empowerment on job satisfaction and burnout. International Journal of Educational
Management, Vol. 25 Iss: 3 , 252-264.
Cohen, J. & Cohen, P. (1983). Applied multiple regression/correlation analyses for the
behavioural sciences, Erlbaum, Hillsdale, NJ.
Cordes, C. L. & Dougherty, T. W. (1993). A review and an integration of research on job
burnout, Academy of Management Review, Vol. 18 No. 4, 621-56.
Dana Yagil. (2006). The relationship of service provider power motivation, empowerment
and burnout to customer satisfaction, International Journal of Service Industry
Management, Vol. 17 Iss: 3 258-270.
Xanthopoulou D , Bakker A. B., Dollard M. F. , Demerouti E, Schaufeli W. B., Taris T. W.,
& Paul J.G. Schreurs, (2007). When do job demands particularly predict burnout? The
moderating role of job resources, Journal of Managerial Psychology, Vol. 22, Iss: 8
766-786.
Dunham, R. B. (1976). The measurement and dimensionality of job characteristics. Journal of
Applied Psychology, 61, 404-409.
Flynn, D. M. & Tannenbaum, S.I. (1993). Correlates of organizational commitment:
differences in the public and private sector, Journal of Business and Psychology, Vol.
81, 103-16.
Fried, Y., & Ferris, G. R. (1987). The validity of the Job Characteristics Model: A review and
meta-analysis. Personnel Psychology, 40, 287-322.
Friedman, S. D. & Greenhaus, J. H. (2000). Work and Family – Allies or Enemies?, Oxford
University Press, New York, NY.
Hackman, J. & Oldham, G. (1975). Development of the job diagnostic survey, Journal of
Applied Psychology, Vol. 60 No. 2, 159-70.
Hackman, J. R. & Oldham, G. R. (1980), Work Redesign, Addison-Wesley, Reading, MA.
Hackman, J. R., & Lawler, E. E. (1971). Employee reactions to job characteristics. Journal of
Applied Psychology, 55, 259-286.
Ito, J. K. & Brotheridge, C. M. (2003), Resources , coping strategies, and emotional
exhausation: a conservation of resource perspective, Journal of Vocational Behavior,
Vol. 63 No. 3, 490-509.
Jackson, S. E. & Maslach, C. (1982). After-effects of job-related stress: families as victims,
Journal of Occupational Behaviour, Vol. 3, 63-77.
Kahill, S. (1988). Symptoms of professional burnout: a review of the empirical evidence,
Canadian Psychology, Vol. 29, 284-97.
Kahn, W. A. (1990). Psychological conditions of personal engagement and disengagement at
work, Academy of Management Journal, Vol. 33, 692-724.
Kelly Z. Peng, Chi-Sum Wong, & Hong-Sheng Che, (2010). The missing link between
emotional demands and exhaustion, Journal of Managerial Psychology, Vol. 25 Iss: 7,
777-798.
Ledgerwood, C. E., Crotts, J. C. &Everett, A. M. (1998). Antecedents of employee burnout in
the hotel industry, Progress in Tourism and Hospitality Research, Vol. 4 No. 1, 31-44.
Lee, R. T. & Ashforth, B. E. (1996). A meta-analytic examination of the correlates of the
three dimensions of job burnout, Journal of Applied Psychology, Vol. 81 No. 2, 123-33.
Leiter, M. P. & Maslach, C. (1988). The impact of interpersonal environment on burnout and
organizational commitment, Journal of Organizational Behavior, Vol.9 No. 4, 297-308.

Apeejay Business Review, Vol. 13, No.1 & 2, January-December 2014
37
Loher, B. T., Noe, R. A., Moeller, N.L. & Fitzgerald, M. P. (1985), ―A meta-analysis of the
relation of job characteristics and job satisfaction‖, Journal of Applied Psychology,
Vol. 70, 280-89.
Maslach, C. & Jackson, S. E. (1981). Maslach Burnout Inventory: Manual, Consulting
Psychologists Press, Palo Alto, CA
Maslach, C. & Leiter, M. P. (2008). Early predictors of job burnout and engagement, Journal
of Applied Psychology, Vol. 93 No. 3, 498-512.
Maslach, C., Jackson, S. E. & Leiter, M. P. (1996). Maslach Burnout Inventory Manual, 3rd
ed., Vol. 3, Consulting Psychologists Press, Palo Alto, CA.
Maslach, C., Schaufeli, W. B. & Leiter, M. P. (2001). Job burnout, Annual Review of
Psychology, Vol. 52 No. 1, 397-422.
Michel Rod, & Nicholas J. Ashill, (2009). Symptoms of burnout and service recovery
performance: The influence of job resourcefulness, Managing Service Quality, Vol. 19
Iss: 1 , 60-84.
Nicholas J. Ashill, Michel Rod, Peter Thirkell & Janet Carruthers, (2009). Job
resourcefulness, symptoms of burnout and service recovery performance: an
examination of call centre frontline employees, Journal of Services Marketing, Vol. 23
Iss: 5, 338-350.
Osman M Karatepe, (2011). Do job resources moderate the effect of emotional dissonance on
burnout? A study in the city of Ankara, Turkey, International Journal of Contemporary
Hospitality Management, Vol. 23 Iss: 1, 44-65.
Ronald J. Burke, Astrid M. Richardsen & Monica Martinussen, (2006). Gender differences in
policing: reasons for optimism?, Policing: An International Journal of Police Strategies
& Management, Vol. 29 Iss: 3, 513-523.
Schaufeli, W. B. & Bakker, A. B. (2004). Job demands, job resources, and their relationship
with burnout and engagement: a multi-sample study, Journal of Organizational
Behavior, Vol. 25 No. 3, 293-315.
Schaufeli, W. B., Leiter, M. P. & Maslach, C. (2008). Burnout: 35 years of research and
practice, Career Development International, Vol. 14 No. 3, 204-20.
Stamper, C. L. & Johlke, M. C. (2003). The impact of perceived organizational support on
the relationship between boundary spanner role stress and work outcomes, Journal of
Management, Vol. 29 No. 4, 569-88.
Wright, T. A. & Bonett, D. G. (1997). The contribution of burnout to work performance,
Journal of Organizational Behavior, Vol. 18, 491-499.
Wright, T. A. & Cropanzano, R. (1998). Emotional exhaustion as a predictor of job
performance and voluntary turnover, Journal of Applied Psychology, Vol. 83 No. 3,
486-93.
Xanthopoulou, D., Bakker, A.B., Demerouti, E. & Schaufeli, W. B. (2007). The role of
personal resources in the job demands-resources model, International Journal of Stress
Management, Vol. 14 No. 2, 121-41.
Ying-Wen Liang, (2012). The relationships among work values, burnout, and organizational
citizenship behaviors: A study from hotel front-line service employees in Taiwan,
International Journal of Contemporary Hospitality Management, Vol. 24 Iss: 2 ,251-
268.

Apeejay Business Review, Vol. 13, No.1 & 2, January-December 2014
38
Employees‟ Perception towards Innovative Climate
in Public Utility Enterprises: A Comparative Analysis
Sandeep Tandon and Ranju Katoch
University of Jammu, Jammu
Abstract
Over the last two decades, globalization and rapid technological advancements have created
a situation where organizations encounter various challenges like varying customer
demands, increased competition etc. To keep pace with these changes and to maintain a
competitive edge, organizations need to innovate that is to explore and implement new ideas.
Innovation is broadly seen as an essential component of competitiveness, embedded in the
organizational structures, processes, products, and services within a firm. If developing
countries are to compete effectively in the world market, they must make every effort to
develop innovative practices. The aim of this research is to study Innovation Climate and
investigate the effect of Innovation climate on the types of innovation in the Public Utilities
Enterprises. The global changes have forced the Public utility enterprises to realise the
significance of need for Innovation. The Public utilities enterprises need Innovation as a
means to create their competitive advantages to compete successfully. This paper presents a
quantitative study in measuring the perception of Public utilities enterprises employees
towards the support for Innovation and the types of Innovation in three public utilities
organisations i.e Public Health Engineering (PHE,) Public Works Department (PWD) and
Power Development Department (PDD) in Jammu. Against these backgrounds, the present
study is aimed primarily to study Innovation climate and types of innovation in the Public
Utilities Enterprises. Findings reveal that level of perception of employees is more in case of
PDD in comparison to other two utilities.
Keywords: innovation climate, public utility, competitiveness.
Introduction
Organisations conducting business in the global environment are facing significant
competition. The search for competitive advantage has led to the recognition of Innovation as
a vital ingredient for survival and profitability. The word Innovation is derived from the Latin
word Novus, and defined as "a new idea, method or device" or "the process of introducing
something new" (Gopalakrishnan & Damanpour, 1994). Innovation refers to the introduction
of any new product, process, or system into an organisation. (Drucker, 1993) states,
Innovation is the application of knowledge to produce new knowledge. Innovation is about
the successful exploitation of new ideas and is essential for sustained competitiveness and
wealth creation. Innovation is defined as any idea, practice, or material artefact perceived as
new by the individuals involved (Zaltman et al., 1973).
Luecke and Katz (2003), has given a convenient definition of Innovation, Innovation is
understood as the successful introduction of a new thing or method. Innovation implies
bringing something new into use, change in the way of doing things, the creation of the new
or the re-arranging of the old in a new way and the act of introducing something new or doing
something in a different way. To survive in current competitive global business environment,

Apeejay Business Review, Vol. 13, No.1 & 2, January-December 2014
39
enterprises need a regular stream of Innovations to succeed (Hellriegel , 2001; Simon, 1997;
& Porter, 1980). Peters & Waterman (1982) Innovative enterprises are those which
continually are responding to change of any sort in their environment and are characterized
by creative people developing new products and services. Innovation is widely recognised as
a driving force for a firm‘s economic growth (Gann, 2003). Innovation requires at the
workplace which is the preconditions for success. Baregheh et al. (2009), states that
Innovation is the multi-stage process whereby organisation transform ideas into
new/improved products, service or processes, in order to advance, compete and differentiate
themselves successfully in their marketplace.
Successful Innovation requires good management, appropriate finance skills and a supportive
overall climate. (Ekvall, 1996) defines innovation climate as an attribute of the organisation,
composed of behaviours, attitudes and feelings, which characterizes life in the organisation.
The concept of innovation climate was given by Neil Anderson and Michael West, 1998 in
relation to assessment of climate in work teams, and is operationalized in the Team Climate
Inventory. Innovation climate can be seen as an attribute that captures the openness to new
ideas and hence, an organisation orientation towards Innovation (Hurley and Hult 1998). The
new ideas can be in the form of product, services, processes, markets or organisation changes.
Schumpeter (1983) defined Innovation as encompassing the entire process, starting from a
kernel of an idea continuing through all the steps to reach a marketable product that changes
the economy. Hunter (2005) proposed that innovation occurs as a result of the interplay
between individual and work-context factors, the most notable factor is the organizational
climate. There is also some research pointing to the importance of organizational climate for
the successful implementation of change initiatives or innovation in organizations (Huq and
Martin, 2000). It is presumed that strategies of innovation influences employees‘ sense of
engagement, identification and belonging as well as performance (Hurley and Hult, 1998;
Loof and Heshmati, 2002). Organizational Innovation climate influences employees
Innovative attitudes, beliefs, values, motivations and behaviors, and finally organizational
Innovative performance (Amabile et al., 1988).
Innovation has become the industrial religion of the late 20th century. In the dynamic
environments with rapid globalization and advances in technology, innovation climate play
an important role of in long-term survival and development of organizations. Level of
innovation is one of the most important potentials for firms to gain the sustainable
competitive advantage and high benefit return. (Pawl W Hyland, 2004) states that the
pressure of competition, which at one time makes some firms innovators, forces others, who
are driven by the instinct of survival and growth, to seek to catch up and remove the initial
competitive advantage of the innovating firms. Competition and long-term growth are
achieved through efficient innovation management i.e. the level of innovation. Relevant
studies have has shown that organization success measured by growth, profitability, and
productivity is highly correlated with innovation climate and level of innovation (Baldwin,
1994, Bommer, 2002). Not promoting innovative projects and activities will have a negative
effect on organizational performance (Loof & Heshmati, 2002).
Significance of Innovative Climate for public utilities
Innovation should be a core activity of the public sector: it helps public utilities to improve
performance and increase public value; respond to the expectations of citizens and adapt to
the needs of users; increase service efficiency and minimise costs. Effective public services

Apeejay Business Review, Vol. 13, No.1 & 2, January-December 2014
40
depend on successful innovation climate – to develop better ways of meeting needs, solving
problems, and using resources and technologies. It should be seen as a core activity:
♦ To increase the responsiveness of services to local and individual needs;
♦ To keep up with public needs and expectations.
Without Innovation public services costs tend to rise faster than the rest of the economy.
Also, the inevitable pressures to contain costs can only be met by forcing already stretched
staff to work even harder. There is a broad assumption that the public sector is inherently
less innovative than the private sector. Imputed reasons include a lack of competition and
incentives; a culture of risk aversion and bureaucratic conservatism; a workforce which is
unresponsive to, and unwilling to change. The main motivation for innovation climate is the
need to maintain or increase profitability, which in turn provides an incentive to innovate to
cut costs, improve market share and to create new products and services. Innovation climate,
the degree of support and encouragement an organisation provides to its employees to take
initiative and explore innovative approaches is predicted to influence the level of actual
innovation in that organisation. There are many different Level of innovation identified from
literature: Radical Innovation, Incremental Innovation, Ad hoc Innovation, and Formalization
Innovation (Gallouj, 2002).
In short, in this globalized landscape, changing comparative knowledge advantage and the
availability of cutting edge technologies, Innovation at lower costs are becoming critical
factors in the race to achieve economic competitiveness. Less-favoured countries and regions
are often those that lack the capacity to Innovate and, consequently, that lack the ability to
improve their positions in today‘s competitive global market. Innovation climate is required
for the improvement of processes and services by finding new ways to solve a problem,
retaining existing customers and increasing customer base, enhancing jobs by making tasks
easier faster and more enjoyable which in turn helps in achieving great results.
Scope of the Study
The scope of this study extends to the Public utilities enterprises. For the purpose of this
study 3 public enterprises are chosen namely PDD (Power Development Department), PHE
(Public Health Engineering), and PWD (Public works Department). The study was conducted
in Jammu city. The respondents are the employees working in the organisations.
Objectives
1. To study the dimensions of innovation climate in the select organizations.
2. To examine the relationship between the demographic characteristics of the employees
and innovation climate.
3. To study the type of innovation in the Public utility organizations.
4. To study the relationship between innovation climate and the level of innovation in the
organization.
5. To study the effect of innovation climate on the level of innovation in the select
organizations.
Review of Literature
The current Literature demonstrates that there exists a strong relationship between
Innovation climate and level of Innovation ( Liorens-Montes and Verdú-Jover, 2002).
Innovation is a key ingredient in building high performance in organisations (Damanpur
and Evan, 1984). Research literature embodies adequate evidence to infer that for high
organisational performance, Innovation is much more important today than it was in the

Apeejay Business Review, Vol. 13, No.1 & 2, January-December 2014
41
past and that it forms a core competency for the 21st
century organizations (Ekanem, 2001).
Recent research literature shows that Innovation is a double- edged sword (Hall and
Vredenburgh, 2003). Innovative organizations are characterized by an orientation toward
creativity and innovation, support for their members in functioning independently in the
pursuit of new ideas (Kanter, 1983; Siegel and Kaemmerer, 1978), and a tolerance for
diversity among their members (Siegel and Kaemmerer, 1978). It has been widely accepted
that leadership play a key role in determining Innovation in organisations (Montes et al,
2005; Nam and Tatum, 1997). High quality Leadership is a major asset of an organization.
Conversely, poor leadership not only affects the morale but may also give rise to
complacency, failure to respond to markets, poor strategic choices and many other evils.
The immediate effects on market valuations, when key leaders leave or join organizations,
can be measured in real value (Andrew Mayo., 2000). Effective leadership is a critical
factor to enhance Innovation. In fact, without effective leadership very few other factors
will work for success of Innovation in an organization. Leaders have a big part to play in
enhancing organizational Innovation. It is the task of organizational leaders to provide the
climate that nurtures and acknowledges innovation at every level (Martin and Terblanche
et. al., 2003). Leadership should also be in a position to balance employee‘s freedom and
responsibility, without domination or control, while at the same time they have to show
concern for employee‘s feelings and needs, generously recognize creative work and
encourage employees to voice their own concerns, provide feedback, and facilitate skill
development (Amabile, 1998). There should be continuous development programs in the
organization to improve employee‘s skills and to develop their knowledge.
Organizational climate that supports continuous development should encourage creativity
and innovation (Binshan Lin, 2007). By focusing on being inquisitive, keeping knowledge
and skills up to date and learning creative thinking skills, Innovation climate can be created
and maintained (Elspeth Mc Fadzean., 1998). An organizational climate that has an
effective continuous development programme for enhancing employee‘s creativity and
Innovation is in better position in developing new technologies (Elspeth Mc Fadzean.,
1998). In order to be competitive in the world of globalization and liberalization the
organizations have to use advanced technology, technical workforce, and continuous
development programmes for innovations ( Rakesh Narain et al, 2004).
It is proposed that when ownerships exist, group members do not limit themselves to the
application of previously determined solutions or the solutions of others but are committed
to their own work. They are also committed to their organization and participate in their
organization's decision-making processes. Ownership exists when group members feel they
originate and/or develop the ideas, processes, and procedures with which they work
(Campbell, 2000). Employees will be Innovative when they are given a high level of
autonomy and control over their own work (King and West., 1985). Management should
believe in personnel and encourage them to be more Innovative by allowing them
ownership. In other words empowering them instead of controlling them (Martin and
Terblanche et. al., 2003). The literature study reveals that the degree to which employees
have freedom and authority to participate in decision making and solving problems
determines the level of ownership, which is positively related to the level of creativity and
innovation in an organization (Morris W, 2005). An organization that is innovative,
members of the system have a positive attitude toward diversity, the system itself responds
positively toward Innovation, and few behaviors are judged as being deviant (Andriopoulos
C, 2000).
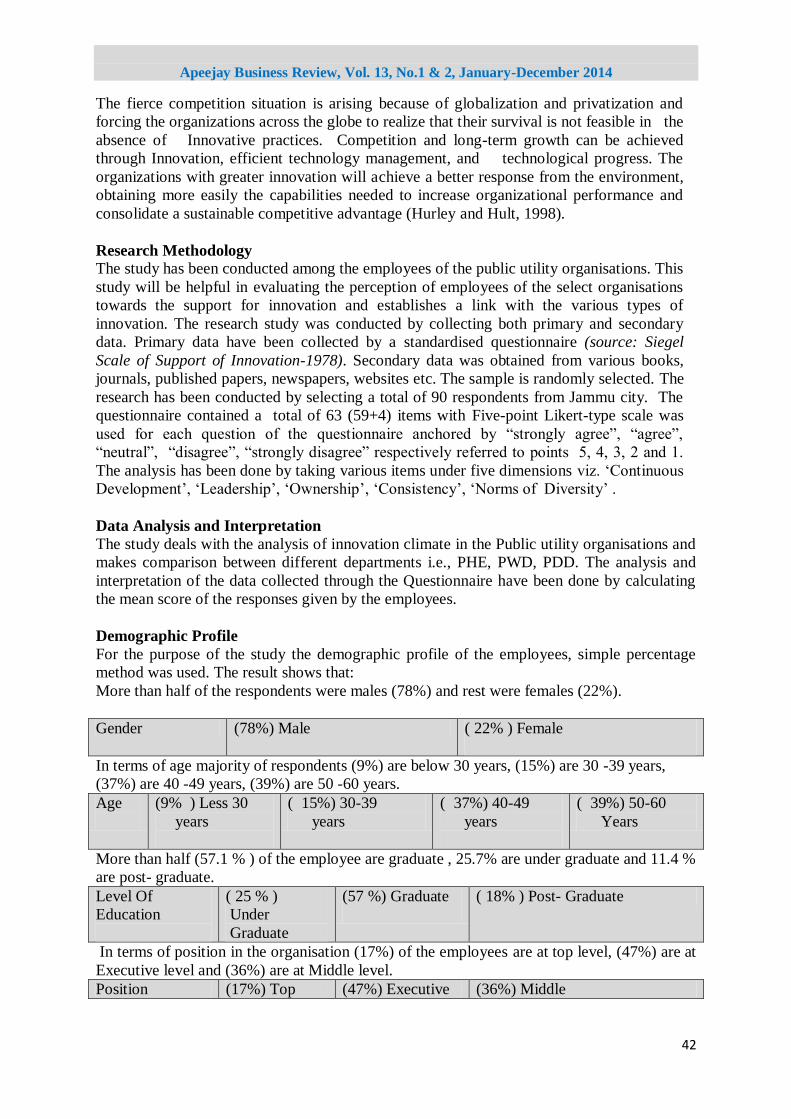
Apeejay Business Review, Vol. 13, No.1 & 2, January-December 2014
42
The fierce competition situation is arising because of globalization and privatization and
forcing the organizations across the globe to realize that their survival is not feasible in the
absence of Innovative practices. Competition and long-term growth can be achieved
through Innovation, efficient technology management, and technological progress. The
organizations with greater innovation will achieve a better response from the environment,
obtaining more easily the capabilities needed to increase organizational performance and
consolidate a sustainable competitive advantage (Hurley and Hult, 1998).
Research Methodology
The study has been conducted among the employees of the public utility organisations. This
study will be helpful in evaluating the perception of employees of the select organisations
towards the support for innovation and establishes a link with the various types of
innovation. The research study was conducted by collecting both primary and secondary
data. Primary data have been collected by a standardised questionnaire (source: Siegel
Scale of Support of Innovation-1978). Secondary data was obtained from various books,
journals, published papers, newspapers, websites etc. The sample is randomly selected. The
research has been conducted by selecting a total of 90 respondents from Jammu city. The
questionnaire contained a total of 63 (59+4) items with Five-point Likert-type scale was
used for each question of the questionnaire anchored by ―strongly agree‖, ―agree‖,
―neutral‖, ―disagree‖, ―strongly disagree‖ respectively referred to points 5, 4, 3, 2 and 1.
The analysis has been done by taking various items under five dimensions viz. ‗Continuous
Development‘, ‗Leadership‘, ‗Ownership‘, ‗Consistency‘, ‗Norms of Diversity‘ .
Data Analysis and Interpretation
The study deals with the analysis of innovation climate in the Public utility organisations and
makes comparison between different departments i.e., PHE, PWD, PDD. The analysis and
interpretation of the data collected through the Questionnaire have been done by calculating
the mean score of the responses given by the employees.
Demographic Profile
For the purpose of the study the demographic profile of the employees, simple percentage
method was used. The result shows that:
More than half of the respondents were males (78%) and rest were females (22%).
Gender (78%) Male ( 22% ) Female
In terms of age majority of respondents (9%) are below 30 years, (15%) are 30 -39 years,
(37%) are 40 -49 years, (39%) are 50 -60 years.
Age
(9% ) Less 30
years
( 15%) 30-39
years
( 37%) 40-49
years
( 39%) 50-60
Years
More than half (57.1 % ) of the employee are graduate , 25.7% are under graduate and 11.4 %
are post- graduate.
Level Of
Education
( 25 % )
Under
Graduate
(57 %) Graduate
( 18% ) Post- Graduate
In terms of position in the organisation (17%) of the employees are at top level, (47%) are at
Executive level and (36%) are at Middle level.
Position (17%) Top (47%) Executive (36%) Middle
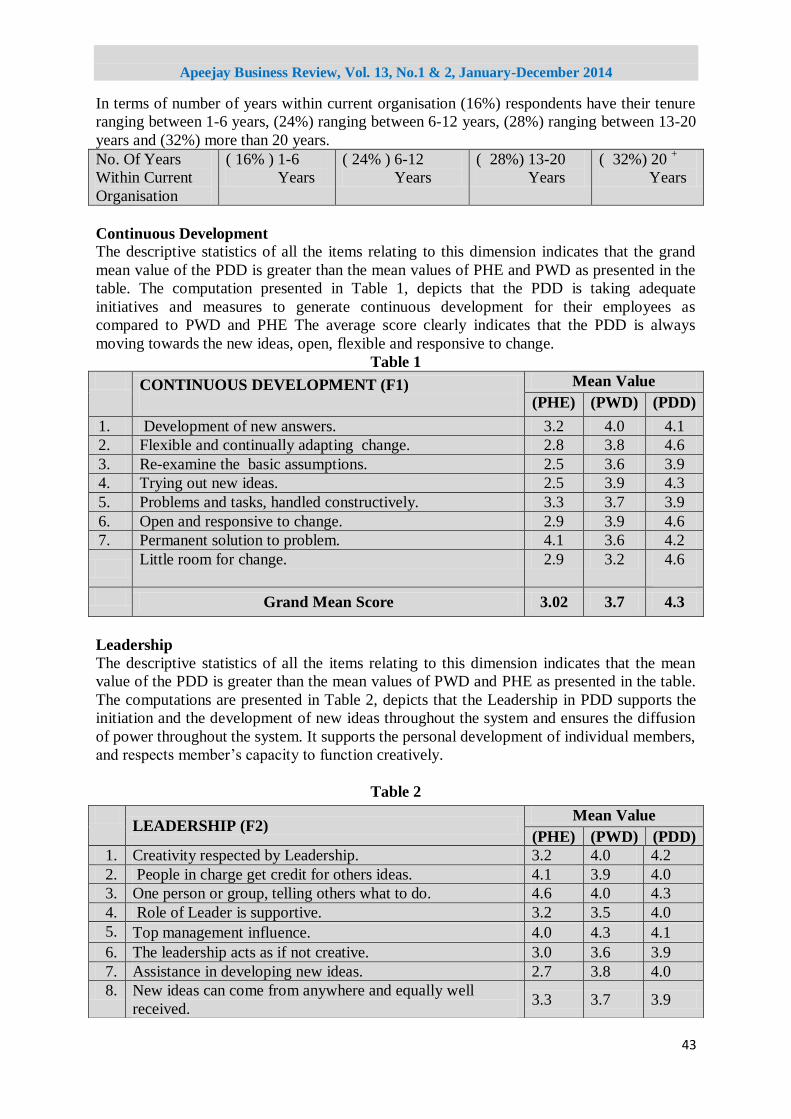
Apeejay Business Review, Vol. 13, No.1 & 2, January-December 2014
43
In terms of number of years within current organisation (16%) respondents have their tenure
ranging between 1-6 years, (24%) ranging between 6-12 years, (28%) ranging between 13-20
years and (32%) more than 20 years.
No. Of Years
Within Current
Organisation
( 16% ) 1-6
Years
( 24% ) 6-12
Years
( 28%) 13-20
Years
( 32%) 20 +
Years
Continuous Development The descriptive statistics of all the items relating to this dimension indicates that the grand
mean value of the PDD is greater than the mean values of PHE and PWD as presented in the
table. The computation presented in Table 1, depicts that the PDD is taking adequate
initiatives and measures to generate continuous development for their employees as
compared to PWD and PHE The average score clearly indicates that the PDD is always
moving towards the new ideas, open, flexible and responsive to change.
Table 1
CONTINUOUS DEVELOPMENT (F1)
Mean Value
(PHE) (PWD) (PDD)
1. Development of new answers. 3.2 4.0 4.1
2. Flexible and continually adapting change. 2.8 3.8 4.6
3. Re-examine the basic assumptions. 2.5 3.6 3.9
4. Trying out new ideas. 2.5 3.9 4.3
5. Problems and tasks, handled constructively. 3.3 3.7 3.9
6. Open and responsive to change. 2.9 3.9 4.6
7. Permanent solution to problem. 4.1 3.6 4.2
Little room for change. 2.9 3.2 4.6
Grand Mean Score 3.02 3.7 4.3
Leadership
The descriptive statistics of all the items relating to this dimension indicates that the mean
value of the PDD is greater than the mean values of PWD and PHE as presented in the table.
The computations are presented in Table 2, depicts that the Leadership in PDD supports the
initiation and the development of new ideas throughout the system and ensures the diffusion
of power throughout the system. It supports the personal development of individual members,
and respects member‘s capacity to function creatively.
Table 2
LEADERSHIP (F2)
Mean Value
(PHE) (PWD) (PDD)
1. Creativity respected by Leadership. 3.2 4.0 4.2
2. People in charge get credit for others ideas. 4.1 3.9 4.0
3. One person or group, telling others what to do. 4.6 4.0 4.3
4. Role of Leader is supportive. 3.2 3.5 4.0
5. Top management influence. 4.0 4.3 4.1
6. The leadership acts as if not creative. 3.0 3.6 3.9
7. Assistance in developing new ideas. 2.7 3.8 4.0
8. New ideas can come from anywhere and equally well
received. 3.3 3.7 3.9

Apeejay Business Review, Vol. 13, No.1 & 2, January-December 2014
44
Ownership
The descriptive statistics of all the items relating to this dimension indicates that the mean
value of the PDD is greater than the mean values of PHE and PWD, as presented in the table.
The computation is presented in Table 3, depicts that group members of PDD, feel they
originate and/or develop the ideas, processes and procedures with which they work.
Ownerships exist in PDD the employees do not limit themselves to the application of
previously determined solutions or solutions of others, but are committed to their own work.
Table 3
OWNERSHIP (F3)
Mean Value
(PHE) (PWD) (PDD)
1. Personally identify with the ideas with which I work. 3.0 3.8 4.3
2. I help make decisions here. 2.9 3.3 3.9
3. I really don't care what happens to this organization. 3.1 3.3 3.7
4. I am committed to the goals of this organization. 3.5 4.1 4.3
5. My goals and the goals of this organization are quite
similar.
3.8 3.7 4.0
6. In this organization we tend to stick to tried and true ways. 3.3 4.0 3.2
7. On the whole, I feel a sense of commitment to this
organization.
3.9 4.0 4.3
8. The people here are very loyal to this place. 3.5 4 4.2
9. I have the opportunity to test out my own ideas here. 2.8 3.9 4.0
10. I feel a real sense of responsibility for my work. 3.2 4.0 4.3
11. Nobody asks me for suggestions about how to run this
place.
2.4 3.7 4.1
12. I have a voice in what goes on in this organization. 2.6 3.8 4.2
13. People here try new approaches to tasks 3.0 3.6 4.2
14. I mostly agree with how we do things here. 3.1 3.7 4.0
15. These aren't my ideas, I just work here. 4.2 3.9 4.2
Grand Mean Score 3.2 3.7 4.06
Norms of Diversity
The descriptive statistics of all the items relating to this dimension indicates that the mean
value of the PDD is greater than the mean values of PWD and PHE as presented in the table.
The computation are presented in Table 4, depicts that the employees of the PDD have a
positive attitude towards toward diversity, the system responds positively toward creativity,
and few behaviours are judged as being deviant.
9. Encouraged to develop own interests 3.5 3.7 3.5
8. Superiors encouraged opinions and ideas. 3.6 4.1 4.3
9. Original ideas respected by those at the top. 3.8 4.3 4
10. Individual independence is encouraged in this organization. 3.7 3.6 4.2
11. One individual is usually the originator of ideas and
policies. 4.3 3.4 4.0
12. The power of final decision traced to the same few people. 4.0 3.7 4.2
13. The leader's "pets" are in a better position. 4.1 3.5 4.4
14. Follow orders that come down through channels. 4.4 4.1 4.6
Grand Mean Score 3.7 3.8 4.1

Apeejay Business Review, Vol. 13, No.1 & 2, January-December 2014
45
Table 4
NORMS OF DIVERSITY (F4)
Mean Value
(PHE) (PWD) (PDD)
1. Solve the same problem in different ways. 2.8 3.5 4.0
2. Creativity is encouraged here. 3.1 4.0 4.4
3. Deal with problems in the same way. 4.2 4.1 4.0
4. Encouraged to be different. 2.4 4.0 3.8
5. A person can't do things without provoking anger. 3.4 3.7 3.3
6. Think the way the rest of the group does. 4.1 3.9 4.3
7. Creative efforts are usually ignored here. 3.9 3.9 4.3
8. Person can get into trouble by being different. 2.9 3.4 4.2
Grand Mean Score 3.3 3.8 4.0
Consistency
The descriptive statistics of all the items relating to this dimension indicates that the mean
value of the PDD is greater than the mean values of PHE and PWD, as presented in the table.
The computation are presented in Table 5, depicts that there is consistency between PWD
processes and desired results. Employees of this department are sensitive to the notion that
the way in which something is accomplished can have immediate and unintended
consequences that may conflict with the objective of the activity. Employees of this
department are sensitive to the notion that the way in which something is accomplished can
have immediate and unintended consequences that may conflict with the objective of the
activity.
Table 5
1. People don't practice what they preach. 3.5 3.2 3.8
2. Sometimes the way things are done makes matters
worse.
3.8 4.0 3.7
3. The leaders talk one game but act another. 3.8 3.5 3.9
4. Work in this organization is evaluated by results. 3.2 3.8 4.1
5. The methods used seem well suited to stated goals. 4.1 3.9 4.4
6. The way things are taught is as important as what is
taught.
3.8 3.5 3.7
Grand Mean Score 3.7 3.6 3.9
Overall Mean Score of Innovation Climate
As given in the table 6, the Grand Mean score were calculated which comes out to be
Continuous Development (3.8), Leadership (3.9), Ownership (3.6), Norms Of Diversity (2.3)
and Consistency (3.1) respectively of PHE, PWD and PHE departments.
CONSISTENCY (F5)
Mean Value
(PHE)
(PWD)
(PDD)

Apeejay Business Review, Vol. 13, No.1 & 2, January-December 2014
46
Table 6
Thus it can been seen that the components of innovation climate i.e Continuous
Development, Leadership, Ownership, Norms of Diversity, and Consistency individually
affects the innovation climate of the employees but the impact of Continuous Development ,
Leadership , Ownership, alone cannot lead to the significant results . It is more Norms of
diversity and Consistency which need to be improved in order to enhance the overall
innovation climate of the organisation.
Comparative Analysis of Innovation Climate in the Select Organisations:
Table 7 depicts, over all mean scores of the three public utilities enterprises viz 3.38 in PHE,
3.72 in PWD and 4.072 in PDD. This reveals that employees‘ perception level pertaining to
innovation climate in PDD is much highest than the other two public utilities enterprises i.e,
PHE and PWD. This requires more efforts on the part of PHE and PWD to bring better
innovation climate in order to have competitive edge.
Table 7
VARIABLES PHE PWD PDD
Continuous Development 3.02 3.6 3.9
Leadership 3.7 3.8 4.0
Ownership 3.2 3.7 4.06
Norms Of Diversity 3.3 3.8 4.1
Consistency 3.7 3.7 4.3
INNOVATION CLIMATE 3.38 3.72 4.072
Types of Innovation in Public Utility Organisation
As given in the table 7, the Grand Mean score were calculated which comes out to be
Formalization Innovation (4.0%), Ad hoc Innovation (3.6%), and Incremental Innovation
(3.1) Radical Innovation (2.2%) respectively were calculated.
Table 8
The above table summarizes the mean rating that indicated the level of Innovation in select
organisations. In public utilities organisation there is more formalization innovation.
INNOVATION CLIMATE Grand Mean
Continuous Development (F1) 3.8
Leadership (F2) 3.9
Ownership (F3) 3.6
Norms Of Diversity (F4) 2.3
Consistency (F5) 3.1
LEVEL OF INNOVATION Grand Mean
Formalization Innovation 4.0
Ad hoc Innovation 3.6
Incremental Innovation 3.1
Radical Innovation 1.2

Apeejay Business Review, Vol. 13, No.1 & 2, January-December 2014
47
Spearman‟s Rank Correlation Coefficient:
For the purpose of the study, the two variables viz. innovation climate and level on
innovation has been taken. By using spearman‘s rank correlation method, the obtained value
in table 2 of r= .742. It shows that the relationship further between innovation climate and
level of innovation is positive (r=.742)
r t Sig
.742a 8.431 .000
Both the variables show a positive relationship among themselves so, the purpose of studying
these two variables simultaneously has been served. The two variables are related to each
other and mutually dependent on each other. For testing the significance of the relationships t
test has been used. The value of t is 8.43. The relationship between the innovation climate
and level of innovation is significant. Therefore, on the basis of rank correlation the relation
was observed to be positive between the innovation climate and level of innovation. On the
basis of t test, it is found to be significant.
Effect of Innovation Climate On level of innovation Regression analysis for Innovation Climate and level of innovation
Innovation climate has 5 sub-factors i.e Continuous Development, Leadership, Ownership,
Norms of Diversity, and Consistency, Now the effect of 5 sub-factors on the level of
innovation in the organisation. The results are as under: Here r2
is equal to .551, which
indicates the fit is better. Calculated value of F is 71.083, which shows that regression
analysis as a whole is significant.
R 2
F Sig
.551 6.083 .000a
In order to investigate the level of innovation through innovation climate, the regression
analysis was done, with level of innovation as dependent variable and following independent
variables: Continuous Development, Leadership, Ownership, Norms of Diversity, and
Consistency. The regression results in above table indicate that the variables together explain
55% of the variation in level of innovation (R2=0.551) and the model is statistically
significant at the 0.000 level (F-test).
Limitations and Future Research
The sample of the study is relatively small (n=90) and is taken from public utility in Jammu
only i.e. PDD, PWD, PHE. They might not reflect the overall result. Therefore further studies
with large sample and across different sectors and areas suggested to get more evidences.
Analysing and comparing the organisational outcomes can see the different implications of
different organisational interventions.
Findings of Survey Some of the findings are as follows: Respondents rated the Innovation climate in the
somewhat favourable range overall, neither highly favourable nor unfavourable. There was
some variation among respondents. Men rated the Innovation climate more favourably than
did Women. Higher level employees gave slightly more favourable ratings than lower level
employees.

Apeejay Business Review, Vol. 13, No.1 & 2, January-December 2014
48
Respondents of over 12 years of experience in the organization serving at higher levels
have consistently rated the Innovation climate more favourably than employee belonging
to lower level.
The organization has scored high in the areas of Continuous Development, Leadership
and Ownership.
The organization scored moderate ratings with some variances in areas of Norms of
Diversity and Consistency.
The organization has scored high for Formalization and Incremental Innovation.
The organization scored moderate ratings for Adhoc Innovation
The organization has scored low for the Radical Innovation
Conclusion
The general picture emerging out of these findings indicate that overall a favourable
Innovation climate exists in the organization. The organization has a pool of professionals
which are working for a larger cause and meeting their professional satisfaction. However,
the organization shows great deal of transparency in decision making and shares information
across levels. The management believes in having a participative approach to decision
making. There is enough autonomy to perform one‘s job. Also the organization offers enough
scope for personal and professional growth. The leadership of the origination is approachable
and is sensitive to the needs of the employees.
At the same time there are roles and responsibilities to be performed and each one is held
accountable for work. There is a great emphasis on continuous development and skill
enhancement of the employees. As the organization is in its expansion phase, it promises its
employees enhanced roles and responsibilities. The organization needs to plan consistency
and norms of diversity so as to optimize the productivity. In case of employees having
multiple reporting, job description should be decided jointly by the leaders and made known
to the employee. The organizational climate can become conducive to develop potential and
competencies of the employees and provide opportunities for fulfilment. There is a need for
an enhanced role of leaders who should feel responsible for building a positive, motivating
work climate e which would ensure optimum utilization of the capabilities of the employees
leading to self and organizational effectiveness.
The organizations with greater innovation will achieve a better response from the
environment, thereby obtaining more easily the capabilities needed to increase organizational
performance and consolidate a sustainable competitive advantage. Organisation success
measured by growth, profitability, and productivity is highly correlated with the emphasis
that a firm places on innovation. Climate for innovation as an indicator of the capacity of
organizations to become Innovative, i.e, the degree of support and encouragement an
organization provides its employees to take initiative and explore Innovative approaches is
predicted to influence the degree of actual innovation in that organization.
Reference
Amabile, (1988). A model of creativity and innovation in organizations. Journal of
Organizational Behavior, Vol. 10, 123-167.
Arif Hassan et. al. (2000). Assessing your organization's potential for value innovation.
Journal of Research Technology Management, Vol. 8, 37–42.
Andre P. Walton. (2003). The impact of interpersonal factors on creativity.International
Journal of Entrepreneurial Behavior and Research. Vol. 9, 146-162.

Apeejay Business Review, Vol. 13, No.1 & 2, January-December 2014
49
Aditha Persaud, (2006). Factors affecting innovation performance in manufacturing and
services firms in Australia. Journal of Product Innovation Management. Vol. 13, 35-
52.
Binshan Lin, (2007). Technological innovations in small firms in the North East of England:
Dimensions and Implications. The International Journal for Entrepreneurship and
Innovation. Vol. 2, 141–52.
Beets, (1994). Managing innovation in SMEs: A Comparison of Companies in the UK,
France and Portugal. International Journal of Technology Management. Vol. 12,
291-305.
Cooper, (1998). A multidimensional approach to the adoption of innovation. Jounal of
Management Decision. Vol. 36, 493-502.
David J. Teece, (1996). Organizational innovation and performance: The problem of
organizational lag'. Journal of Administrative Science Quarterly. Vol. 29, 392-402.
Damanpour, F. (1996). Organizational complexity and innovation: developing and testing
multiple contingency models. Journal of Management Science. Vol 14, 693- 716.
Denton, K. D. (1999). Gaining competitiveness through innovation. European Journal of
Innovation Management. Vol. 2, 82-85.
DiLiello, T. C. & Houghton, J. D. (2006). Maximising organizational leadership capacity for
the future Towards a model of self- leadership, innovation and creativity. Journal of
Managerial Psychology. Vol. 21, 319- 337.
Dokeniya Anupama, 1999. Reforming the state: Telecom liberalization in India.
Telecommunications Policy.
Drucker, (1993). Introduction: Toward the new organization. The organization of the future.
San Francisco, CA: Jossey-Bass Publishers. 1-5.
Ekvall, G. (1996). Organizational climate for creativity and innovation. European Journal of
Work and Organizational Psychology, Vol. 5 (1), 105-123.
G Leskovar Spacapan, (2000). When openness to experience and conscientiousness are
related to creative behavior: an interactional approach. Journal of Applied Psychology,
Vol. 86, 513-24.
Gann, (2003). Innovative Genius: A Framework for Relating Individual and Organizational
Intelligence to Innovation. Academy of Management Review, 21/4, 1081-1111.
Jack Mc Gourthy & Lemuel A., (1996). Managing Innovation: Lessons from World Class
Organization. International Journal Technology Management, Vol. 11, 354-361.
Jin, Z., Hewitt-Dundas, N. & Thompson, N. J., (2004). Innovativeness and performance:
Evidence from manufacturing sectors. Journal of Strategic Marketing, Vol 12, 255-
266.
Lock E. A. & Kirkpatrick, S. A. (1995). Promoting creativity in organizations. Academy of
Management Journal, Vol. 10, 115-20.
Martin & Terblanche. F (2003). Building organization climate that stimulate creativity.
European Journal of Innovation management, Vol. 6, 64-74.
Mostafa, M. (2005). Factors affecting organizational creativity and innovativeness in
Egyptian business organizations: an empirical investigation. Journal of Management
Development, Vol. 24, 7-33.
Roffe, I. (1999). Innovation and creativity in organizations: a review of the implications for
training and development. Journal of European Industrial Training, Vol. 23, 224- 237.
Shantha Liyanage (2003). Technology and Innovation Management Learning in the
knowledge Economy. Journal of Management Development, Vol. 22, 579-602.
Scott, S. G. & Bruce, R. A (1994). Determinants of innovative behavior: A path model of
individual innovation in the workplace. Academy of Management Journal, Vol. 32,
580-607.

Apeejay Business Review, Vol. 13, No.1 & 2, January-December 2014
50
Scott W. (2001). Managing Creativity Enhancement Through Goal-Setting and Feedback.
Journal of Creative Behavior, Vol. 27, 36-45.
Smilor, R.W. Gibson & Kosmetsky (1988). Creating the Techonopolis: High Technology
Development in Austin. Benchmarking an International Journal, Vol. 8, 191-211.
Swann P. & Birke D, (2005). How do Creativity and Design Enhance Business
Performance? A framework for interpreting the Evidence. International Journal of
Manpower, Vol. 20, 171-186.
Turnipseed, (1994). The relationship between the social environment of organizations and
the climate for innovation and creativity. Journal of Creativity and Innovation
Management, Vol. 3, 184 - 195.
Vittoria et. al., (2001). Employee Creativity and the role of risk. European Journal of
Innovation Management, Vol. 7, 257-266.
Neil Adnerson & Michael West, (1998). Innovation in top management teams. Journal of
Applied Psychology, Vol. 8, 680-693.
W. David Sheasley (1999). Leading the technology development process. Journal of
Technology Management, Vol. 6, 36-45.
Zaltman et. Al, (2005). Organizational effectiveness through technology innovation and
HRM strategies. International Journal of Manpower, Vol. 26, 481-487.

Apeejay Business Review, Vol. 13, No.1 & 2, January-December 2014
51
Understanding Consumer Psychology via Social Media
Deepak Halan and Varuna Tyagi
Apeejay Stya University, Sohna
Abstract
In our very core, each of us is a social animal and social media has provided us an outlet to
create online communities making it easier to network with others. Hence social media tools
have become superb channels for marketers to reach consumers, given their two-way
communication format and hence are important to study. An organisation that uses social
media is more likely to create relationships with members of its target demographic vis-à-vis
one that uses traditional media. The key objective of this paper is to study the influence of this
new media on consumer behaviour- the psychology behind it and how and why it’s a rich and
natural source of consumer insights.
Keywords: Consumer Psychology, Consumer Behaviour, Social Media, Online Communities
Introduction
One of the key findings of the 2011 FICCI-KPMG report is that three-quarters of the global
internet population visits social media websites spending an average of almost six hours a
month. As per the IMRB-IAMAI Social Media in India-2012 Report, social media usage
(72%) ranks second - only after Email (80%) in terms of usage. Essentially, social
networking often serves to be among the ―First Internet Uses‖ of Internet in India i.e. besides
the usual reasons like Email, Music and Gaming. The Top social media website accessed
interestingly as per the report is Facebook, used by 97%, whereas the next places are taken by
Google+ and LinkedIn. This data tells us that social media is emerging as a strong medium
of communication; companies are increasingly experimenting with various online marketing
strategies. Most companies have used social media platforms to establish a large follower
base, and are currently trying to convert these fans into paying customers. Dell‘s and Sony‘s
twitter campaign are some examples. People are no longer asking their neighbours or family
members for suggestions before buying any product, instead it is asked through social sites
and going through the reviews.
Studying Consumer Behaviour on Social Media
None of the firms can now ignore the social media as all their customers now use social
media. Consumers connect with their favourite brands today through the internet over which
manufacturers and retailers have no control. Social Media resembles our society in a number
of ways, one of them being community affiliation. Just like offline communities (groups
existing in our societal setup) influence our actions and ideologies, similarly affiliation to an
online community too influences an individual‘s decision making and choices. Consumers
seek approval from others for any choice they make through social media. Earlier, a
consumer after narrowing down on her choices would make a final purchase selection and
complete her engagement with the brand. In this digital era, the engagement does not stop at
the final purchase only, but the consumer remains engaged with the brand through social
media after a purchase. Smart marketers must study this consumer choice and decision
behaviour to decide on their marketing strategy, spends and other brand related decisions.
The similarity between consumers earlier and today is that both want a clear brand promise

Apeejay Business Review, Vol. 13, No.1 & 2, January-December 2014
52
and a value offering. The only change characterizing the market space today is the touch
points.
A McKinsey Quarterly in 2009 introduced consumer‘s brand engagement through
―Consumer Brand Journey‖. The study revealed that unlike their previous counterparts who
used to start with a wide array of brands and narrow them down to the preferred ones, the
consumer today uses a less iterative process, thanks to an abundant array of information
available on social media and the internet. The research also revealed that the traditional
media are only effective during the consideration stage, while the subsequent stages of
consumer decision were characterized by various online media. A significant outcome of the
research was also that consumers seldom visited the manufacturer‘s website when making a
purchase decision but would visit various social media websites to narrow down on their
preferred brand. Marketers must aim at making the customer experience coherent and create a
customer experience plan based on company products and target segments. Apple for
instance has created aligned product descriptions by eliminating jargons and thus created a
wide library of explanatory videos ensuring consistency and accuracy among various touch
points. The touch points are increasingly digital today and this offers an opportunity to the
marketer to collect and use customer information to create a positive customer experience.
The speed, accuracy and interactivity of the digital touch points define the quality of this
brand experience. Starbucks, in order to get consumer feedback, came out with “My
Starbucks Idea”. The site allows users to provide suggestions, which are then voted by the
consumers with the most popular suggestion reviewed. Taking this idea a step forward,
Starbucks also now offers a ―Ideas in Action‖ blog to update users how their suggestions
have made a difference to the company. Drury (2007) opines that due to fragmented nature of
the media, the consumer tends to be divided on what are the best destinations for informed
and professionally edited content and sites populated with user generated content, and social
media offers both of them together.
„Listening‟ Naturally
There is no doubt that social media influences consumer behaviour, hence it is vital to utilise
this new and dynamic media for studying consumer behaviour and generating insights. Social
media enables us to tap into a unique panel - quite different from the typical panels that we
create in traditional marketresearch. In this unique panel, generally there is no data collected
using formal questionnaires. Instead insights are culled out from the interactions between
members which could be one to one or one to many. The plan is largely consumer driven and
not pre-defined by the researchers. The good thing is that while clients and researchers can
trigger dialogues, they cannot control them. The consumers join the group voluntarily and are
free to decide whether to respond to any stimulus.
Below is an illustration of reviews from www.mouthshut.com. (A social media site that helps
consumers make informed shopping decisions) given by consumers from their natural
environments. The reviews contain a wealth of insights ranging from dietary habits, product
design, product availability etc. These insights could also serve as forewarnings to take early
action and should be useful to Marketing teams of both Britannia Bourbon and Parle Hide
and Seek biscuits which compete with each other.
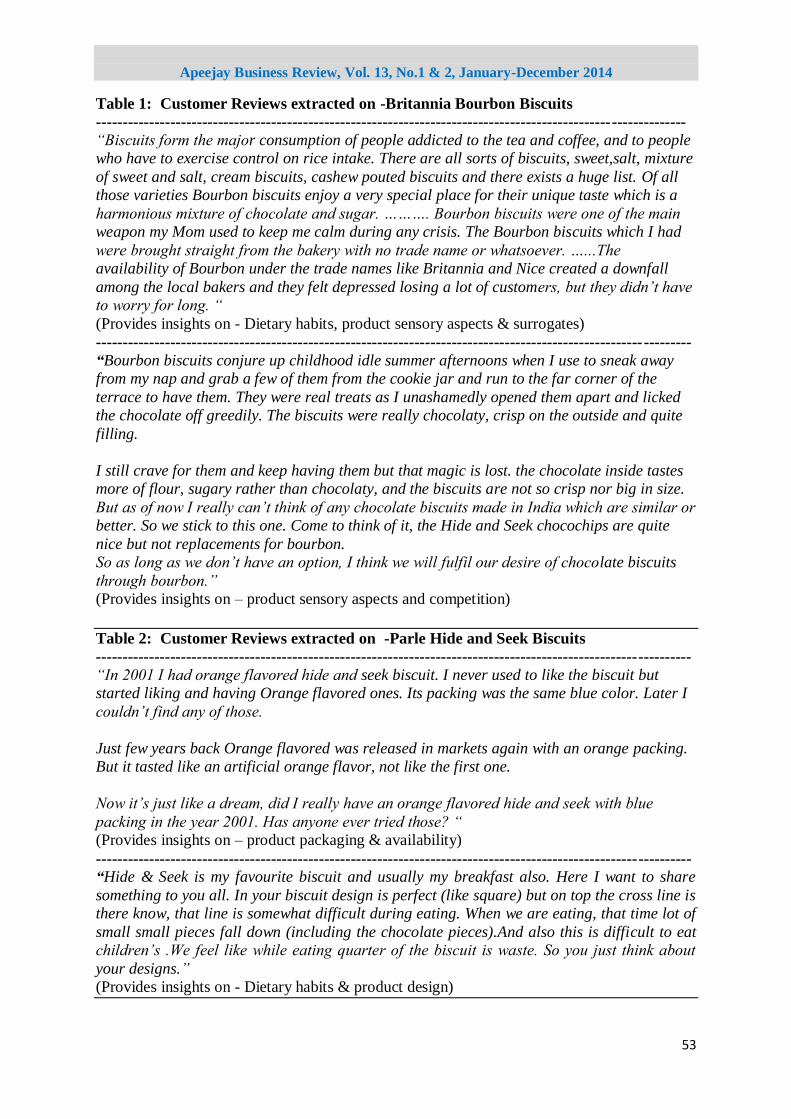
Apeejay Business Review, Vol. 13, No.1 & 2, January-December 2014
53
Table 1: Customer Reviews extracted on -Britannia Bourbon Biscuits
---------------------------------------------------------------------------------------------------------------
“Biscuits form the major consumption of people addicted to the tea and coffee, and to people
who have to exercise control on rice intake. There are all sorts of biscuits, sweet,salt, mixture
of sweet and salt, cream biscuits, cashew pouted biscuits and there exists a huge list. Of all
those varieties Bourbon biscuits enjoy a very special place for their unique taste which is a
harmonious mixture of chocolate and sugar. ………. Bourbon biscuits were one of the main
weapon my Mom used to keep me calm during any crisis. The Bourbon biscuits which I had
were brought straight from the bakery with no trade name or whatsoever. …...The
availability of Bourbon under the trade names like Britannia and Nice created a downfall
among the local bakers and they felt depressed losing a lot of customers, but they didn’t have
to worry for long. “
(Provides insights on - Dietary habits, product sensory aspects & surrogates)
----------------------------------------------------------------------------------------------------------------
“Bourbon biscuits conjure up childhood idle summer afternoons when I use to sneak away
from my nap and grab a few of them from the cookie jar and run to the far corner of the
terrace to have them. They were real treats as I unashamedly opened them apart and licked
the chocolate off greedily. The biscuits were really chocolaty, crisp on the outside and quite
filling.
I still crave for them and keep having them but that magic is lost. the chocolate inside tastes
more of flour, sugary rather than chocolaty, and the biscuits are not so crisp nor big in size.
But as of now I really can’t think of any chocolate biscuits made in India which are similar or
better. So we stick to this one. Come to think of it, the Hide and Seek chocochips are quite
nice but not replacements for bourbon.
So as long as we don’t have an option, I think we will fulfil our desire of chocolate biscuits
through bourbon.”
(Provides insights on – product sensory aspects and competition)
Table 2: Customer Reviews extracted on -Parle Hide and Seek Biscuits
----------------------------------------------------------------------------------------------------------------
“In 2001 I had orange flavored hide and seek biscuit. I never used to like the biscuit but
started liking and having Orange flavored ones. Its packing was the same blue color. Later I
couldn’t find any of those.
Just few years back Orange flavored was released in markets again with an orange packing.
But it tasted like an artificial orange flavor, not like the first one.
Now it’s just like a dream, did I really have an orange flavored hide and seek with blue
packing in the year 2001. Has anyone ever tried those? “
(Provides insights on – product packaging & availability)
----------------------------------------------------------------------------------------------------------------
“Hide & Seek is my favourite biscuit and usually my breakfast also. Here I want to share
something to you all. In your biscuit design is perfect (like square) but on top the cross line is
there know, that line is somewhat difficult during eating. When we are eating, that time lot of
small small pieces fall down (including the chocolate pieces).And also this is difficult to eat
children’s .We feel like while eating quarter of the biscuit is waste. So you just think about
your designs.”
(Provides insights on - Dietary habits & product design)
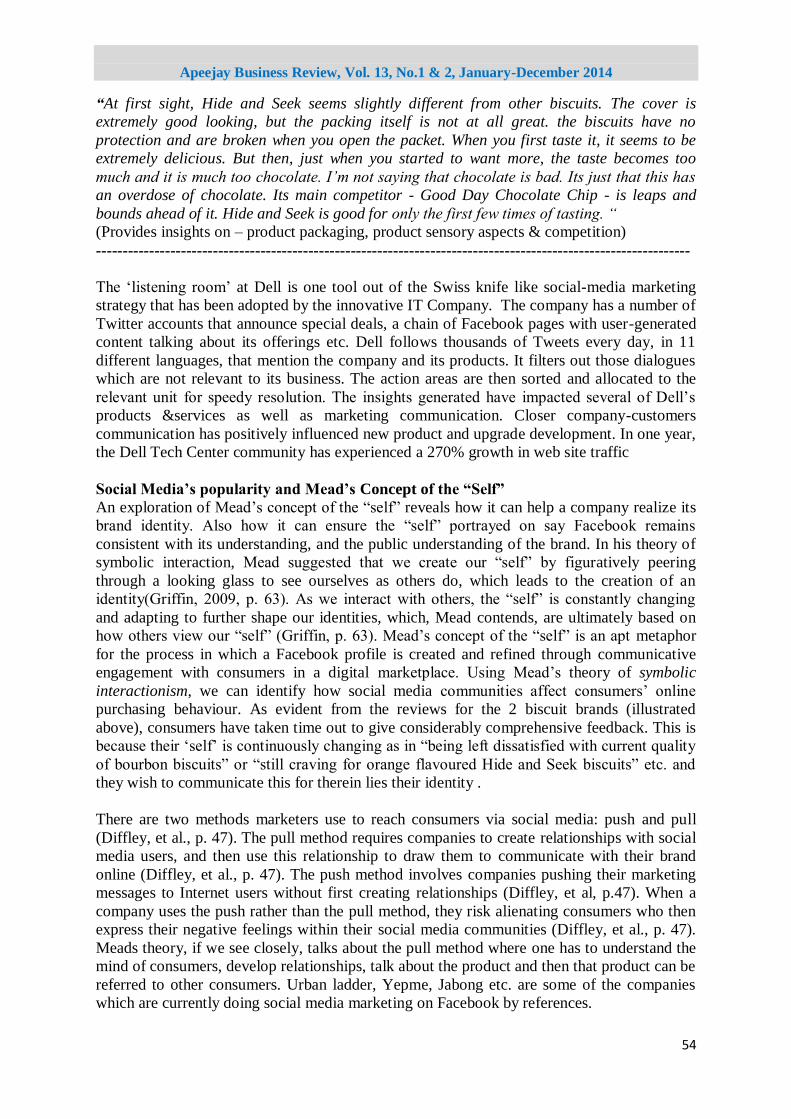
Apeejay Business Review, Vol. 13, No.1 & 2, January-December 2014
54
“At first sight, Hide and Seek seems slightly different from other biscuits. The cover is
extremely good looking, but the packing itself is not at all great. the biscuits have no
protection and are broken when you open the packet. When you first taste it, it seems to be
extremely delicious. But then, just when you started to want more, the taste becomes too
much and it is much too chocolate. I’m not saying that chocolate is bad. Its just that this has
an overdose of chocolate. Its main competitor - Good Day Chocolate Chip - is leaps and
bounds ahead of it. Hide and Seek is good for only the first few times of tasting. “
(Provides insights on – product packaging, product sensory aspects & competition)
----------------------------------------------------------------------------------------------------------------
The ‗listening room‘ at Dell is one tool out of the Swiss knife like social-media marketing
strategy that has been adopted by the innovative IT Company. The company has a number of
Twitter accounts that announce special deals, a chain of Facebook pages with user-generated
content talking about its offerings etc. Dell follows thousands of Tweets every day, in 11
different languages, that mention the company and its products. It filters out those dialogues
which are not relevant to its business. The action areas are then sorted and allocated to the
relevant unit for speedy resolution. The insights generated have impacted several of Dell‘s
products &services as well as marketing communication. Closer company-customers
communication has positively influenced new product and upgrade development. In one year,
the Dell Tech Center community has experienced a 270% growth in web site traffic
Social Media‟s popularity and Mead‟s Concept of the “Self”
An exploration of Mead‘s concept of the ―self‖ reveals how it can help a company realize its
brand identity. Also how it can ensure the ―self‖ portrayed on say Facebook remains
consistent with its understanding, and the public understanding of the brand. In his theory of
symbolic interaction, Mead suggested that we create our ―self‖ by figuratively peering
through a looking glass to see ourselves as others do, which leads to the creation of an
identity(Griffin, 2009, p. 63). As we interact with others, the ―self‖ is constantly changing
and adapting to further shape our identities, which, Mead contends, are ultimately based on
how others view our ―self‖ (Griffin, p. 63). Mead‘s concept of the ―self‖ is an apt metaphor
for the process in which a Facebook profile is created and refined through communicative
engagement with consumers in a digital marketplace. Using Mead‘s theory of symbolic
interactionism, we can identify how social media communities affect consumers‘ online
purchasing behaviour. As evident from the reviews for the 2 biscuit brands (illustrated
above), consumers have taken time out to give considerably comprehensive feedback. This is
because their ‗self‘ is continuously changing as in ―being left dissatisfied with current quality
of bourbon biscuits‖ or ―still craving for orange flavoured Hide and Seek biscuits‖ etc. and
they wish to communicate this for therein lies their identity .
There are two methods marketers use to reach consumers via social media: push and pull
(Diffley, et al., p. 47). The pull method requires companies to create relationships with social
media users, and then use this relationship to draw them to communicate with their brand
online (Diffley, et al., p. 47). The push method involves companies pushing their marketing
messages to Internet users without first creating relationships (Diffley, et al, p.47). When a
company uses the push rather than the pull method, they risk alienating consumers who then
express their negative feelings within their social media communities (Diffley, et al., p. 47).
Meads theory, if we see closely, talks about the pull method where one has to understand the
mind of consumers, develop relationships, talk about the product and then that product can be
referred to other consumers. Urban ladder, Yepme, Jabong etc. are some of the companies
which are currently doing social media marketing on Facebook by references.
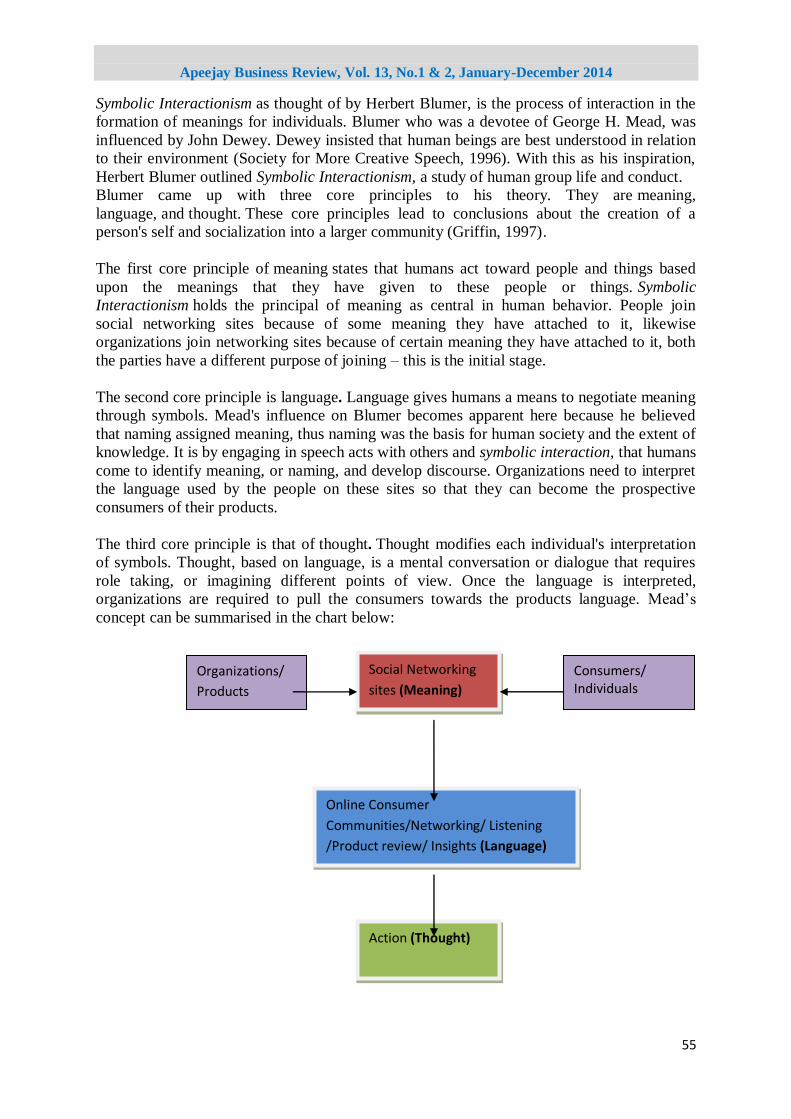
Apeejay Business Review, Vol. 13, No.1 & 2, January-December 2014
55
Symbolic Interactionism as thought of by Herbert Blumer, is the process of interaction in the
formation of meanings for individuals. Blumer who was a devotee of George H. Mead, was
influenced by John Dewey. Dewey insisted that human beings are best understood in relation
to their environment (Society for More Creative Speech, 1996). With this as his inspiration,
Herbert Blumer outlined Symbolic Interactionism, a study of human group life and conduct.
Blumer came up with three core principles to his theory. They are meaning,
language, and thought. These core principles lead to conclusions about the creation of a
person's self and socialization into a larger community (Griffin, 1997).
The first core principle of meaning states that humans act toward people and things based
upon the meanings that they have given to these people or things. Symbolic
Interactionism holds the principal of meaning as central in human behavior. People join
social networking sites because of some meaning they have attached to it, likewise
organizations join networking sites because of certain meaning they have attached to it, both
the parties have a different purpose of joining – this is the initial stage.
The second core principle is language. Language gives humans a means to negotiate meaning
through symbols. Mead's influence on Blumer becomes apparent here because he believed
that naming assigned meaning, thus naming was the basis for human society and the extent of
knowledge. It is by engaging in speech acts with others and symbolic interaction, that humans
come to identify meaning, or naming, and develop discourse. Organizations need to interpret
the language used by the people on these sites so that they can become the prospective
consumers of their products.
The third core principle is that of thought. Thought modifies each individual's interpretation
of symbols. Thought, based on language, is a mental conversation or dialogue that requires
role taking, or imagining different points of view. Once the language is interpreted,
organizations are required to pull the consumers towards the products language. Mead‘s
concept can be summarised in the chart below:
Social Networking
sites (Meaning)
Organizations/
Products
Consumers/ Individuals
Online Consumer
Communities/Networking/ Listening
/Product review/ Insights (Language)
Action (Thought)

Apeejay Business Review, Vol. 13, No.1 & 2, January-December 2014
56
The Old School of Studying Consumer Behaviour
Market Research conducted for studying consumer behaviour is frequently made to stand in a
corner and admonished for not being able to deliver the insights desired by the marketer. We
stay in a society that becoming more complicated by the day and hence there is a need to
adopt an innovative model of thinking and try different approaches. For most of us, Market
Research is interviewing a sample of our target audience - often by enquiring them about
themselves - to understand their thoughts and then adding up the individual responses,
looking for patterns etc. to represent the universe.
Whether we are conducting a qualitative research, a quantitative research or even
‗neuromarketing‘ – we take it for granted that ―the individual and what happens between their
ears is where the action is‖. (Earls, International Journal of Market Research Vol. 54 Issue).
We need to ask ourselves – what is it that we are researching and is the consumer behaviour
individually designed or is it more social. Some researchers may argue that there is a chance
for consumers to get conditioned by others‘ feedback on social media and hence change their
own feedback. However we must not forget that social media enables us to observe social
interactions and measure their outcomes–instead of mere individual static responses.
Moreover, when we conduct a focus group discussion, we are only collecting communication
generated from artificial interactions initiated by the moderator. Social media allows us to
catch the ‗weak signals‘ that are generally lost in traditional marketing research.
Crowdsourcing and other Consumer Insight Opportunities on Social Media
Gathering feedback about your products and services from the conversations on social media
is just one of the application areas - there are a host of opportunities to gather consumer
insights. You can also carry out a competition mapping by listening to what customers are
talking about your rival brands and why, who is influencing them etc. This will be
particularly beneficial if you are a late adopter vis-à-vis your competitors, since it will allow
you to learn from your competitors‘ mistake while formulating your social media strategy.
Crowdsourcing is a contemporary buzz word which stands for tapping into the collective
intelligence, ideas, need gaps etc. of your target audience. It is a powerful tool for product
innovation and involves considerably lower time and cost as compared to traditional market
research methods. Coca Cola harnessed social media to involve its target audience in creating
a new flavour of vitamin water. People got a chance to participate in a "flavour creator lab"
on Coke‘s Facebook page. The objective was to create a new type of drink right up to its
packaging. Fans voted for their favourite flavour, enjoyed games and participated in quizzes
to arrive at the key "functional benefit. Crowdsourcing was successfully used to research a
new product in about three months and with an investment of a few thousand dollars.
Traditional research would have meant a time frame of at least 2 years and millions of dollars
of investment.
Social media can be effectively used to conduct online surveys and polls. Revlon India
gainfully used social media in the form of Revlon India Facebook page to understand the
beauty habits of Indian girls. A survey was conducted and 75,000 consumers responded in the
2-week time period. How do you apply the foundation? How long does it take you to apply
make-up? How many times do you touch up your makeup in a day?...were some of the
questions asked, amongst others. Getting beneath the make–up, Revlon discovered that
approximately 80% of the ladies use their fingers to apply foundation; 4 in every 10 spend
less than 15 minutes applying their make-up and four-fifths of them touch up their make-up
on a daily basis. These insights were used instantly to fine tune Revlon‘s advertising

Apeejay Business Review, Vol. 13, No.1 & 2, January-December 2014
57
campaign which was then made to focus on Revlon‘s ColorStay Whipped Crème as it
emerged as the best solution based on the findings.
Conclusion
Social Media is being used by brands not only to share content or offer product reviews but
also to launch products, invite customer feedback, and to update customer about the brand.
This has resulted in customer engagement at all levels of the brand. If we consider pre-
purchase behaviour, research shows that the traditional media are only effective during the
consideration stage, while the subsequent stages of consumer decision are characterized by
various online media. Talking about post-purchase behaviour, unlike in the past, today in the
digital era, consumer engagement continues after final purchase via social media.
Organizations need to be very clear about the purpose for which they have joined social
networking sites, at the same time try to converge consumers towards their products.
According to Mead‘s theory, as we interact with others, the ―self‖ is constantly changing and
adapting to further shape our identities and thought process. This makes it clear that
consumers do make choices based on reviews because there ―self‖ changes with exposure to
every new piece of information. Consumers also seek approval from others for any choice
they make through social media.
Social media influences consumer behaviour considerably and hence it is vital to utilise this
new media for studying consumer behaviour and generating insights. It provides a natural
environment to study consumers since the interaction on social media is largely consumer
driven and not pre-defined by the researchers. Apart from gathering feedback about your
products and services from the conversations on social media, crowdsourcing is an efficient
tool for new product development.
It is important to make the customer experience coherent and create a customer experience
plan based on company products and target segments. Integrating traditional marketing with
digital or social marketing is a challenge. Even data and insights gathered via traditional and
social media need to be married and that is a tough task. Today‘s marketers are more trained
to deliver messages but social media demands careful listening and responding in a timely
manner. The dynamic nature of social media demands dedicated resources, perhaps there is a
need for a social media manager post. While Social Media is here to stay and you can ignore
it only at your own risk, the speed, accuracy and interactivity of the digital touch points will
define the quality of consumer experience.
References Budzanowska-Drzewiecka, M. (2011). Social conditioning of purchasing decisions of 9-11
year-old consumers, Journal of Customer Behaviour, 10 (2), 143-160.
Cooke Mike, Buckley Nick. ‗Web 2.0, social networks and the future of market research‘,
International Journal of Market Research Vol. 50 Issue 2, pp. 267-292
Dellarocas, C., Gao, G., & Narayan, R. (2010). ‗Are consumers more likely to contribute
online reviews for hit or niche products?‘. Journal of Management Information
Systems, 27(2), 127-157.
Diffley, S., Kearns, J., Bennett, W., & Kawalek, P. (2011). Consumer behaviour in social
networking sites: implications for marketers. Irish Journal Of Management, 30(2),
47-65.
Drury, G 2007, ‗Opinion Piece: Social Media: Should Marketers Engage and How Can it be
Done Effectively‘, Journal of Direct, Data and Digital Marketing Practice, vol. 9, no.
3, pp. 274 – 277.

Apeejay Business Review, Vol. 13, No.1 & 2, January-December 2014
58
Earls Mark, ‗Social: the new space formarket research innovation‘, International Journal of
Market Research Vol. 54 Issue 2, pp. 285-287
Edelman, D. C. (2010). ‗Branding in the Digital Age‘, Harvard Business Review, December
2010.
Griffin, Em. (2009). A First Look at Communication Theory. New York, NY:McGraw-Hill
Hoffman, D L &Fodor, M 2010, ‗Can You Measure the ROI of your Social Media
Marketing?‘, MIT Sloan Management Review, Vol. 52, No. 1, pp. 40 – 49.
How Revlon India used Social Media to gain consumer insights, 2013. Available from
http://www.socialsamosa.com
Internet Outlook in India-2013, Available from:http://www.ojaswitech.com/india-
pune/internet-penetration-india.php
Lee, D. (2010). Growing popularity of social media and business strategy. SERI Quarterly,
3(4), 112-117.
Martinka, L. (2012). How Social Media Communities Impact Consumer Behavior, thesis,
Gonzaga University, viewed 27 April 2013.
Puri Anjali, The web of insights: The art and practice of webnography, International Journal
of Market Research Vol. 49 Issue 3.
Scott, D. M. (2010). The New Rules of Marketing & PR – How to use Social Media, Blogs,
News Releases, Online Video and Viral Marketing to Reach Buyers Directly, Wiley
Publications, New Jersey.
Stephen D. Rappaport. (2011). Listen First!: Turning Social Media Conversations Into
Business Advantage, John Wiley & Sons.
Using Social Media Monitoring for Market Research, 2012. Available from
http://econsultancy.com/in
Why Marketers Should Invest in Crowd sourced research, 2013. Available from
http://mashable.com
Zarella, D. (2010). The Social Media Marketing Book, O‘ Reilly Media, Canada.