ap pre – registration help yourself to a drink – but be carful, they fizz over
TRANSCRIPT

AP Pre – Registration
Help yourself to a drink – but be carful, they fizz over.


You Must Know
• How changes in biotic and abiotic factors may alter ecosystems.
• How density, dispersion, and demographics can describe a population.
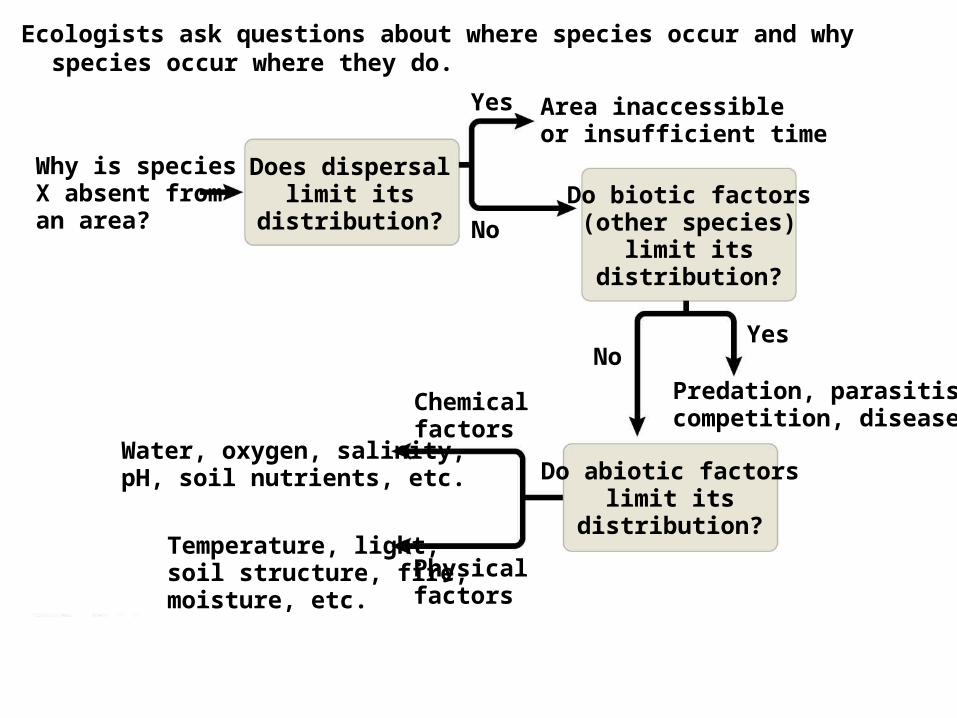
Chemicalfactors
Why is speciesX absent froman area?
Does dispersallimit its
distribution?
Area inaccessibleor insufficient time
Predation, parasitism,competition, disease
Water, oxygen, salinity,pH, soil nutrients, etc.
Do biotic factors(other species)
limit itsdistribution?
Temperature, light,soil structure, fire,moisture, etc.
Do abiotic factorslimit its
distribution?
Physicalfactors
Yes
No
YesNo
Ecologists ask questions about where species occur and why species occur where they do.

Dispersal and Distribution
• Dispersal is the movement of individuals away from centers of high population density or from their area of origin.

• Transplants include organisms that are intentionally or accidentally relocated from their original distribution.
• If a transplant is successful, it indicates that the species’ potential range is larger than its actual range.

Biotic Factors
• Biotic factors that affect the distribution of organisms may include– Predation– Herbivory
• For example, sea urchins can limit the distribution of seaweeds
– Mutualism– Parasitism– Competition
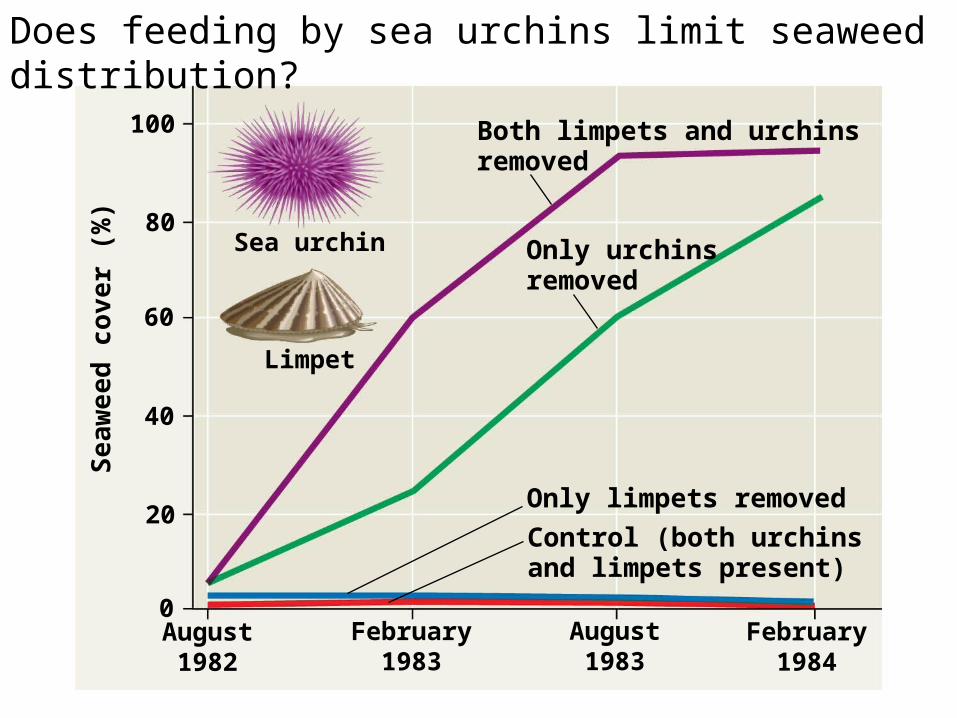
Control (both urchinsand limpets present)
100 Both limpets and urchinsremoved
Only urchinsremoved
Only limpets removed
Limpet
Sea urchin
August1982
August1983
February1983
February1984
80
60
40
20
0
Se
awee
d c
ov
er (
%)
Does feeding by sea urchins limit seaweed distribution?

Abiotic Factors
• Abiotic factors affecting the distribution of organisms include– Temperature– Water – Sunlight– Salinity– Rocks and soil

Human Population Density in the United States
Population Density

Figure 40.14
Births andimmigrationadd individuals toa population.
Deaths andemigrationremove individualsfrom a population.
Births
Immigration
Deaths
Emigration

(a) Clumped
Patterns of dispersion within a population’s geographic range
(b) Uniform (c) Random
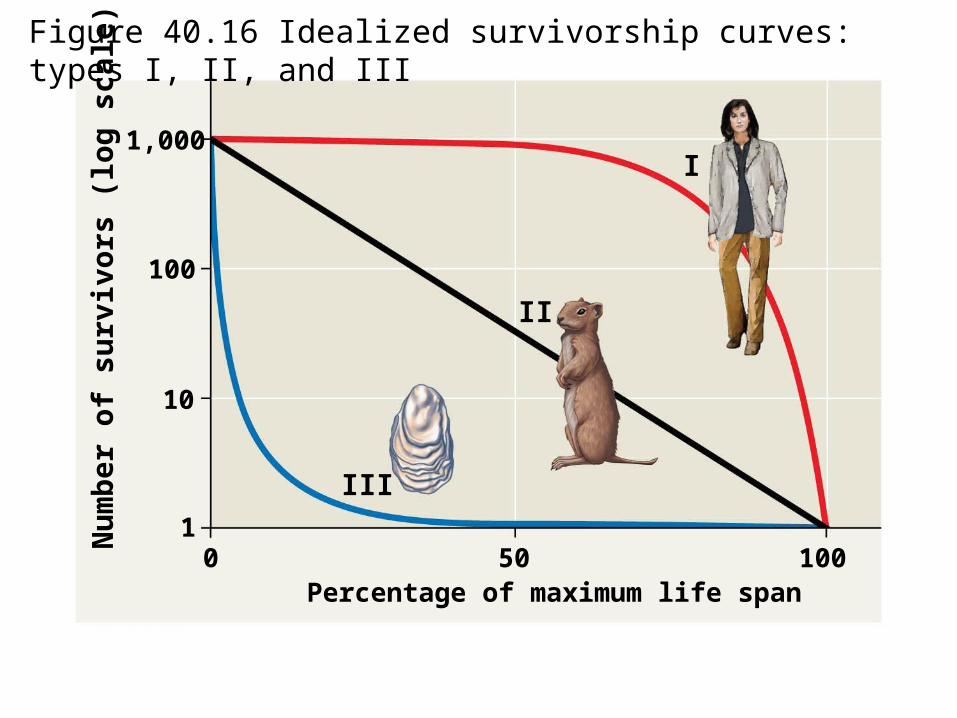
1,000
Percentage of maximum life span
III
Nu
mb
er o
f su
rviv
ors
(lo
g s
cale
)
100
10
01
10050
II
I
Figure 40.16 Idealized survivorship curves: types I, II, and III