ap alternative assets, l.p. q3 2008 results presentation ...€¦ · ap alternative assets, l.p. q3...
TRANSCRIPT

AP Alternative Assets, L.P. Q3 2008 Results Presentation – November 19, 2008
It should not be assumed that investments made in the future will be profitable or will equal the performance of investments in this document.

1
1. Net Asset Value at September 30, 2008
2. Private Equity Portfolio Update
3. Capital Markets Portfolio Update
4. Summary of Q3 2008 Financial Results
Agenda

2
Net Asset Value at September 30, 2008($ in millions)
��
����
������
������
������
������
���� �� � ���
���� �
���������
�� ���� ���
����� ���
���
$2,459$(902)
$(3) $1,554
Private Equity: $988
Capital Markets: $1,116
Cash: $355
Debt: $(900)
Other: $(2)
NAV per unit at September 30, 2008 was $16.05

3
1. Net Asset Value at September 30, 2008
2. Private Equity Portfolio Update
3. Capital Markets Portfolio Update
4. Summary of Q3 2008 Financial Results
Agenda
4
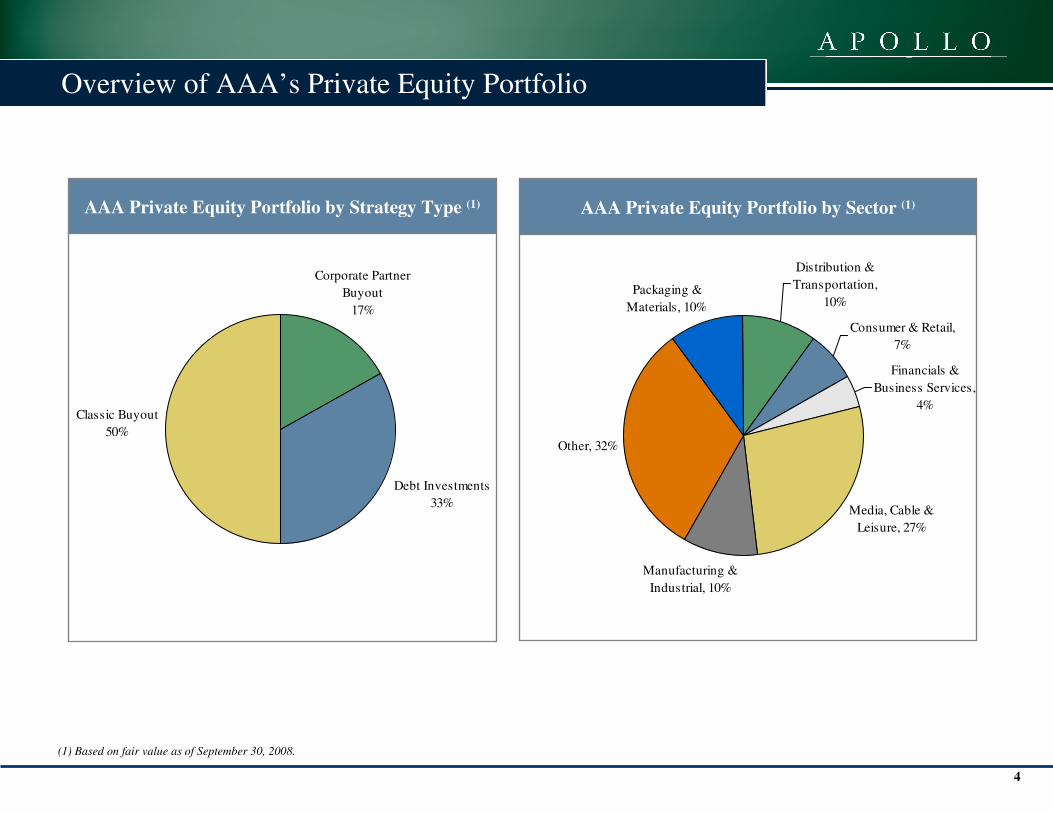
Overview of AAA’s Private Equity Portfolio
AAA Private Equity Portfolio by Strategy Type (1)
Classic Buyout50%
Corporate Partner Buyout
17%
Debt Investments33%
(1) Based on fair value as of September 30, 2008.
AAA Private Equity Portfolio by Sector (1)
Distribution & Transportation,
10%
Consumer & Retail, 7%
Financials & Business Services,
4%
Media, Cable & Leisure, 27%
Manufacturing & Industrial, 10%
Other, 32%
Packaging & Materials, 10%

5
AAA’s Largest Private Equity Investments
5
Distressed debt44%
Performing credits56%
Debt Investment Vehicles Allocation by Type of Credit (3)
(1) AAA invests its capital though, and is the sole limited partner of, AAA Investments, L.P. (the “Investment Partnership”), which has made co-investments alongside Apollo Investment Fund VI and Apollo Investment Fund VII. The table above includes details on each of the Investment Partnership’s investments that represent more than 5% of AAA’s net asset value as of September 30, 2008; “all others”represents the combined cost and fair value of all other private equity co-investments made by the Investment Partnership alongside Apollo Investment Funds VI and VII. As of September 30, 2008.
(2) Debt Investment Vehicles includes investments in Apollo Fund VI BC, L.P., APB Holdings, LLC, Autumnleaf, L.P., Broadleaf, L.P., and Leverage Source, L.P. Allocation based on fair value at September 30, 2008.
(3) As of September 30, 2008. Performing credits reflect negotiated credit purchases of single name or a basket of credits. Distressed debt reflects credits purchased through open market transactions.
278,762457,8466. All Others
$987,986$1,143,419 Total
Co-investments in Apollo Investment Funds VI & VII (1)
93,800 37,4615. Rexnord
98,900165,6253. Harrah’s Entertainment
100,400100,0192. Prestige Cruise Holdings
17,174
$365,294
Cost
94,4944. CEVA Logistics
$321,6301. Debt Investment Vehicles (2)
Fair Value ($000)

6
Current Debt Prices of Large LBOs 2006 - 2007
97%
83%
76%
69% 68% 68%
54%
88%
24%
69%
76%78%
84%88%
33%38%
47%
35%
71%75%
61%
81%
0%
10%
20%
30%
40%
50%
60%
70%
80%
90%
100%
Alltel HCA Intelsat SunGard TXU FirstData
Harrah's Freescale ClearChannel
Hilton Univision
Bank Debt Bond/Sub Debt
Note: Prices as of November 10, 2008. Source: Bloomberg.(1) For Hilton, bank debt represents mortgage debt and bond debt represents CMBS debt. Prices are estimated as debt does not actively trade.
(% o
n Pa
r)
(1)

7
Equity Market Decline Following Completion of Large LBOs
-43.7%1514.421%$26,93210/25/07Hilton Hotels
-31.1%1,237.8 33%$11,7548/11/2005SunGard Data Systems
-40.1%1,422.5 29%$14,0003/29/2007Univision Communications
-38.3%1,380.8 9%$16,4002/4/2008Intelsat
-39.5%1,409.1 36%$19,70012/4/2006Freescale Semiconductor
-33.6%1,284.3 14%$26,7007/30/2008Clear Channel Communications
-41.6%1,458.7 17%$27,50011/16/2007Alltel
-43.8%1,517.7 21%$29,0009/24/2007First Data Corporation
-37.1%1,354.0 20%$30,0001/28/2008Harrah's
-32.4%1,260.9 14%$32,6757/24/2006HCA Inc.
-44.9%1,547.0 20%$45,00010/1/2007TXU
S&P decline since date of purchase(1)
S&P at time of
purchase
Equity %TEVDateCompany
Source: LoanConnector, CapitalIQ, Bloomberg.(1) As of November 12, 2008.
($ in millions)

8
1. Net Asset Value at September 30, 2008
2. Private Equity Portfolio Update
3. Capital Markets Portfolio Update
4. Summary of Q3 2008 Financial Results
Agenda

9
Overview of AAA’s Capital Markets Portfolio
9
Capital Markets Investments
94.2
218.0
339.5
$550.0
Cost(2)
230.4Apollo Asia Opportunity Fund
80.6Apollo European Principal Finance Fund
238.8AP Investment Europe Limited
$566.2Apollo Strategic Value Fund
Fair Value(2)
Apollo Strategic Value Fund, $566.2
51%
AP Investment Europe Ltd, $238.8
21%
Apollo Asia Opportunity Fund,
$230.4 21%
Apollo European Principal Finance
Fund, $80.6 7%
(1) Based on fair market value as of September 30, 2008.(2) As of September 30, 2008.
Breakdown of Total Capital Invested in Capital Markets Funds (1)
($ in millions)

10
-33.99%-25.7550.0075.75Univision-20.50%-18.6372.2590.88TXU-13.53%-11.5073.5085.00Thomson-19.37%-15.2563.5078.75SVM-17.62%-16.2576.0092.25SunGard-15.18%-14.0078.2592.25HCA-21.32%-19.3871.5090.88First Data-21.69%-18.0065.0083.00CCU-23.37%-21.5070.5092.00Asurion
% DeclinePrice11/17/20089/15/2008Change
Sample Loan Credits - Since Lehman Bankruptcy (3)
Dow Jones Industrial Average Closing Price (3)
Average High Yield Index Spread (2)
Average Discounted Spread of Leveraged Loans (1)
7,000
8,000
9,000
10,000
11,000
12,000
13,000
14,000
15,000
May
-00
Nov-0
0M
ay-0
1Nov
-01
May
-02
Nov-0
2M
ay-0
3Nov
-03
May
-04
Nov-0
4M
ay-0
5Nov
-05
May
-06
Nov-0
6M
ay-0
7Nov
-07
May
-08
Nov-0
8
Recent Debt & Equity Market Turmoil is Unprecedented
L+200
L+400
L+600
L+800
L+1000
L+1200
L+1400
L+1600
L+1800
May
-01Nov
-01M
ay-02
Nov-02
May
-03Nov
-03M
ay-04
Nov-04
May
-05Nov
-05M
ay-06
Nov-06
May
-07Nov
-07M
ay-08
Nov-08
L+100
L+350
L+600
L+850
L+1100
L+1350
L+1600
May
-01Nov
-01M
ay-02
Nov-02
May
-03Nov
-03M
ay-04
Nov-04
May
-05Nov
-05M
ay-06
Nov-06
May
-07Nov
-07M
ay-08
Nov-08
(1) Source: S&P/LSTA Leveraged Loan Index.(2) Source: Standard and Poor’s LCD High Yield Flow Name Index. HY Spreads are Spread to Worst through 10/31/08, Option-Adjusted Spreads thereafter, reverse swapped.(3) Source: Bloomberg for Dow Jones information; Bloomberg, Advantage Data, MarkIt Partners for sample loan credit information.

11
Apollo Capital Markets Funds Update
Strategy• Invests in performing debt, mezzanine and equity,
primarily in Europe, on a long-only, levered basis
• Seeks current income and capital appreciation though its flexible strategy which is intended to capture opportunities across the capital structure
Q3 2008 Results
• For the three months ended September 30, 2008, Apollo Investment Europe’s fair value decreased by $94.2 million - Includes $(28.2) million of unrealized foreign
exchange losses- AIE had a (18.1)% net return for the quarter
(excluding foreign exchange losses)- Average price of debt portfolio was 70.9 with a
yield to four year par of 21.8% at quarter end- Difficult quarter to operate a long-only book
with 1:1 leverage
• Although AIE continues to operate with less leverage, exposure to volatility in mark-to-market valuations due to unhedged strategy
Apollo Investment Europe (AIE)
Strategy
• Focus on distressed investments, value driven investments, and special opportunities
• Invests across economic cycles primarily in North America and Europe
Q3 2008 Results
• For the three months ended September 30, 2008, the Strategic Value Fund’s fair value decreased by $60.0 million, and
- SVF had a net return of (10.2%) for the quarter with declines in nearly all economic sectors, led by holdings in industrials, media and communications, consumer and energy
- SVF took on an increasingly defensive posture during the third quarter
• Negative performance partially mitigated by lack of leverage and positioning in distressed market
Apollo Strategic Value Fund (SVF)

12
Apollo Capital Markets Funds Update (Cont’d)
Strategy
• Invests in non-performing loan (“NPL”) portfolios in Europe- Invests in NPLs backed by real estate, corporate
assets and unsecured loans- NPLs are loans held by financial institutions
that are in default of principal or interest payments for 90 days or more
Q3 2008 Results
• For the three months ended September 30, 2008, the European Principal Finance Fund’s fair value declined by $15.3 million, due largely to $9.5 million of unrealized foreign exchange losses
• At September 30, 2008 EPF had total investor commitments of €685 million and capital contributions of €200 million
Apollo European Principal Finance Fund (EPF)
Strategy
• Invests in public and private securities across the capital structure, principally focused on Asia, ex-Japan
• Focus on event driven investments and strategic opportunity investments
Q3 2008 Results
• For the three months ended September 30, 2008, the Asia Opportunity Fund’s fair value decreased by $15.0 million
- AOF had a (6.3)% net return for the quarter
• AOF moved aggressively to shore up its defensive positioning during the quarter
- Focus on risk management and capital preservation
Apollo Asia Opportunity Fund (AOF)

13
1. Net Asset Value at September 30, 2008
2. Private Equity Portfolio Update
3. Capital Markets Portfolio Update
4. Summary of Q3 2008 Financial Results
Agenda

14
Liquidity & Tax Distributions
Liquidity
• In light of recent market volatility and significant tightening of credit markets, AAA has taken several steps to ensure it maintains appropriate level of liquidity
- Cash balance of $355 million as of September 30, 2008, and approximately $433 million of cash as of November 17, 2008
- As a result of the Lehman bankruptcy, AAA drew down the full amount of its $900 million credit facility during September 2008
- In order to maintain appropriate reserves, AAA intends to exercise its right to “opt-out” of new co-investments alongside Apollo Investment Fund’s VI and VII for the remainder of 2008
Tax Distributions
• Currently anticipate continued payment of annual tax distributions to AAA unitholders in 2009

15
Private Equity Valuation Methodology
Comparable company & industry multiples, 59%
Broker quotes on underlying assets of
debt investment vehicles, 19%
Discounted cash flows, 18%
Other, 3%
Publicly traded, 1%
Private Equity Co-Investment Valuation Method (1)
(1) Fair value as of September 30, 2008.
• For the quarter ended September 30, 2008, AAA’s portfolio of private equity investments was valued based on the methodologies below

16
Q3 2008 NAV Performance
$ in millions.Note: Figures as of September 30, 2008. The past performance of Apollo’s funds is intended to be illustrative of Apollo’s investing experience and not indicative of future results.
��
�!��
� ��
������
���"��
������
���!��
��� #$� ���
���
��%���
��&'�
()���� � &���* ��
$�����+,
����&���'� '-
��%��� ��
���
��%����
�����.� &�����
&'����$�'��
�����.� &�����
,�����$�'��
��� �����
��� ���
$1,967.0 $19.3 $(11.7) $(421.2)
$0.4 $0 $1,553.8
(1.3)Other(15.0)Apollo Asia Opportunity Fund(15.3)Apollo European Principal Finance(60.0)Apollo Strategic Value Fund(94.2)AP Investment Europe
$(235.4)Private Equity

17
Legal Disclaimer
The attached document does not constitute an offer to sell, or the solicitation of an offer to buy, any security, product, service or fund sponsored by Apollo, for which an offer can be made only by such fund's Confidential Private Placement Memorandum. This presentation is for informational purposes only and is qualified in its entirety by the applicable Private Placement Memorandum. Unless otherwise noted, information included herein is presented as of the dates indicated and may differ from the terms and provisions respecting an investment in an individual Apollo Fund which will be more fully set forth in applicable materials and corresponding (limited) partnership agreements of such Fund or such other applicable constituent governing documentation.
Information contained herein may include information respecting prior investment performance of one or more Apollo Funds including gross and net internal rates of return (“IRRs”). Information respecting prior performance, while a useful tool in evaluating an Apollo Fund’s investment activities, is not necessarily indicative of actual results to be achieved for unrealized investments, the realization of which is dependent upon many factors, many of which are beyond the control of Apollo Management. Further, there can be no assurance that the indicated valuations for unrealized investments accurately reflect the amounts for which the subject investments could be sold. Unless otherwise noted, all such IRR amounts described herein are calculated as of the dates indicated. Gross IRRs are computed prior to management fees, carried interest and expenses; net IRRs give effect to management fees, carried interest and expenses. Gross and net IRRs are based on actual cash flows to and from the indicated Apollo Fund in accordance with the applicable provisions within the partnership agreement of the Apollo Funds.
Certain information contained herein may be “forward-looking” in nature. Due to various risks and uncertainties, actual events or results or the actual performance of an Apollo Fund may differ materially from those reflected or contemplated in such forward-looking information. As such, undue reliance should not be placed on such information. Similarly, it is noted that references to EBITDA in the attached presentation should not be construed as a substitute for income from operations, net income or cash flow from operating activities (as determined accordance with GAAP) for the purpose of analyzing operating performance, financial position and cash flows. To the extent applicable, reference is made to the subject portfolio company’s publicly available reports and filings with the Securities and Exchange Commission. We further note that nothing in the presentations herein shall be deemed to constitute an offer for sale of limited partner interests in any Apollo sponsored investment fund, whether an existing or contemplated fund (an “Apollo Fund”); offers and sales of any such interests shall only be made by a definitive Confidential Private Placement Memorandum and in compliance with applicable law.
Neither Apollo nor any of its affiliates have made any representation or warranty, expressed or implied, with respect to fairness, correctness, accuracy, reasonableness, or completeness of any of the information contained herein (including or not limited to information obtained from third parties unrelated to Apollo), and they expressly disclaim any responsibility or liability. Neither Apollo nor any of its affiliates have any responsibility to update any of the information provided in this summary document.