antimicrobial sensitivity testing: the search for antibiotics
TRANSCRIPT

W&M ScholarWorks W&M ScholarWorks
Reports
2021
Antimicrobial Sensitivity Testing: The Search for Antibiotics Antimicrobial Sensitivity Testing: The Search for Antibiotics
Amanpreet Kohli Virginia Institute of Marine Science
Follow this and additional works at: https://scholarworks.wm.edu/reports
Part of the Marine Biology Commons, and the Science and Mathematics Education Commons
Recommended Citation Recommended Citation Kohli, A. (2021) Antimicrobial Sensitivity Testing: The Search for Antibiotics. VA SEA 2021 Lesson Plans. Virginia Institute of Marine Science, William & Mary. doi: 10.25773/YC2G-2A72
This Report is brought to you for free and open access by W&M ScholarWorks. It has been accepted for inclusion in Reports by an authorized administrator of W&M ScholarWorks. For more information, please contact [email protected].

ANTIMICROBIAL SENSITIVITY TESTING:
THE SEARCH FOR ANTIBIOTICS
Amanpreet Kohli Virginia Institute of Marine Science Grade Level High School Subject Area Biology

The 2020-21 VA SEA project was made possible through funding from the National Estuarine Research Reserve System Margaret Davidson Fellowship Program which supports graduate students in partnership with research reserves where fieldwork, research, and community engagement come together. VA SEA is currently supported by the Chesapeake Bay National Estuarine Research Reserve, Virginia Sea Grant, and the Virginia Institute of Marine Science Marine Advisory Program.


Title: Antimicrobial Sensitivity Testing: The Search for Antibiotics
Focus: Determining effectiveness of antibiotics for pathogens, effects of pathogens on fish
Grade Levels/Subject: High School Biology
VA Science Standard(s) addressed:
1) BIOL. 1: The student will demonstrate an understanding of scientific and engineering practices by- a) asking questions and defining problems
• ask questions that arise from careful observation of phenomena and/or organisms, from examining models and theories, and/or to seek additional information
b) planning and carrying out investigations • individually and collaboratively plan and conduct observational and experimental
investigations • select and use appropriate tools and technology to collect, record, analyze, and evaluate
data c) interpreting, analyzing, and evaluating data
• construct and interpret data tables showing independent and dependent variables, repeated trials, and means
• construct, analyze, and interpret graphical displays of data • use data in building and revising models, supporting an explanation for phenomena, or
testing solutions to problems • analyze data using tools, technologies, and/or models to make valid and reliable scientific
claims or determine an optimal design solution d) constructing and critiquing conclusions and explanations
• construct and revise explanations based on valid and reliable evidence obtained from a variety of sources including students’ own investigations, models, theories, simulations, and peer review
• construct arguments or counterarguments based on data and evidence e) developing and using models
• evaluate the merits and limitations of models f) obtaining, evaluating, and communicating information
• compare, integrate, and evaluate sources of information presented in different media or formats to address a scientific question or solve a problem
• communicate scientific and/or technical information about phenomena in multiple formats
2) BIO.4: The student will investigate and understand that bacteria and viruses have an effect on living
systems. Key ideas include d) bacteria and viruses have a role in other organisms and the environment; and e) the germ theory of infectious disease is supported by evidence.
Learning objectives/outcomes:
1) Students will be able to explain what a microbe is and types of microbes.
2) Students will be able to explain what a pathogen is.

3) Students will determine some common bacterial species found in fish.
4) Students will demonstrate an understanding of scientific reasoning and be able to analyze and interpret data. 5) Students will be able to determine sensitivity of a pathogen to an antibiotic by-
• Collecting data from experimental replicates • Comparing and contrasting data among groups • Calculating proportions of susceptible and resistant experimental replicates • Graphing susceptibility to antibiotics and discussing an effective solution
6) Students will research the issue of antibiotic resistance and some alternatives to antibiotics.
7) Students will research information about human pathogens.
Total length of time required for lesson: About 1 hour. Additional 15mins prep time for teacher.
Key words, vocabulary:
Agar plate – An agar plate is a Petri dish containing agar and nutrients as a solid growth medium for microbes (usually bacteria). Mueller Hinton is a type of growth media commonly used for antimicrobial testing.
Antibiotic sensitivity testing – Antibiotic sensitivity testing is used to measure the sensitivity of microbes such as bacteria to antibiotics. The test results may indicate the bacteria to be completely susceptible or resistant to the bacteria or have intermediate susceptibility for the antibiotic.
Antimicrobial – Any natural or synthetic substance that inhibits or kills a microorganism without causing damage to the host.
Experimental replication – replication in an experiment means that the entire experiment is repeated (conducted multiple times) on a large number of subjects.
Kirby-Bauer test – A commonly used antibiotic sensitivity test to determine an effective antibiotic for treating an infection. This method determines susceptibility based on measurement of inhibition of bacterial growth due to presence of antibiotic on an agar plate.
Microbe – A microscopic organism such as bacteria, fungi, virus.
Pathogen — A bacterium, virus, or other microorganism that can cause disease.
Therapeutic agent— A chemical substance that is used for the treatment or mitigation of a disease condition or ailment.
Zone of inhibition – Area of an agar plate where bacteria are unable to grow due to the presence of an antibiotic

Background information:
The teacher should provide some background information on microbes by defining what are microbes and giving some common examples of useful and harmful microbes. Discussing the various groups of microbes including bacteria and viruses is also helpful. The focus should then be shifted to the disease-causing microbes or pathogens and potential treatments for them including antibiotics. There are slides in the PowerPoint to facilitate this discussion. Therapeutic agent(s), that have antimicrobial properties are often used to cure an illness in humans or animals. Determining the antimicrobial sensitivity of a pathogen isolated and identified from a patient is crucial to selecting the most appropriate agent for treating a disease. Microbiologists use several different methods to determine the sensitivity of microorganisms to antibiotics. The Kirby-Bauer method of antimicrobial sensitivity, also known as the disk-diffusion method, is a simple, accurate, and reproducible method. In this method, Mueller Hinton agar plates are inoculated with a microbial culture and then antimicrobial disks are placed on the agar surface. During incubation, the antimicrobial agent diffuses from the disk on to the plate. This inhibits growth of microbes and forms a clear zone around the disk known as the zone of inhibition (Fig. 1). Beyond the zone of inhibition, the therapeutic agent is very diluted and no longer affects bacterial growth. The effectiveness of an antimicrobial agent in sensitivity testing is dependent on the size of its zone of inhibition. Based on how the diameter of the zone of inhibition compares to a standard zone size, the pathogen may be rated as susceptible (S), intermediate (I), or resistant (R) to an antibiotic. A zone of inhibition greater than the standard zone indicates susceptibility while a zone of inhibition smaller than the standard zone indicates resistance. The zone of inhibition varies with factors such as the disk potency, diffusibility of the agent, the amount of the inoculum, and the type of media used.
Fig. 1. An agar plate with antibiotic disks showing zone of inhibition (ZOI) and bacterial growth. Based on the comparisons of ZOI on the plate and the standard values, the bacteria tested were determined to be resistant, intermediate, and susceptible to different antibiotics present.

Student handouts: Each student will receive an image of a plate and a student worksheet (instructions, part I, part II, and part III)
Materials and supplies:
• Printed images of plates • Rulers • Pens/pencils • Student worksheets • Shared computer for the class (or individual devices) • Calculators (optional - the exercise involves very simple math)
Teacher Preparation:
Teachers need to print images of plates and cut them out individually such that each student only receives one image. Each image is labelled with a pathogen name and a group. If possible, laminate the images (can be reused) and print out worksheets in advance. Each student should have a copy of the student worksheet (instructions, part I, part II, and part III).
In addition, two tables should be prepared in Excel or Word as shown in part II of worksheet. In the first table, one person from each group can enter the data for their group so that its shared with the entire class. In the second table, the class can calculate proportions together. For part III, graphs can be plotted on the worksheet directly or on a computer.
Classroom setup:
Students should ideally be grouped together in groups of 4. Each group receives 4 plates, therefore, each student can work with one pathogen. Content is provided for 4 groups (16 students), but more groups can be added either by giving the same plates to multiple groups or by creating more images by selecting some new values for zone of inhibitions. For example, if there are 6 groups in your class instead of 4, you can print out two copies of the images in group 1 and group 2 and group 5 and 6 get the same images as group 1 and 2 (remember to change the group number label for group 5 and 6) OR you can create some new plates in Word by copying the image of any plate in this document and changing the diameters of zone of inhibition. To select an appropriate diameter for the zone of inhibition, refer to the table in part I worksheet. If one group has less than 4 students, they can work on all 4 pathogens together or some pathogen(s) can simply be eliminated for that group since there will still be replicates for the eliminated pathogen(s) from other groups in the class (Note: the total number of replicates tested for this eliminated pathogen will be different than that for other pathogens, this is key for calculating the percentage of replicates sensitive to an antibiotic). Instructions for a virtual classroom setup are provided later.
Each student will work on the first half of part I by themselves and then fill in the rest with other group members. The entire class will then share data for part II. For part III students will return to their groups. Each student will plot a graph for their pathogen, share graphs among their group, and answer the questions.

Adjusting for hybrid/virtual settings-
Hybrid Setting – Groups of 2 in-person students and 2 virtual students can be created where the in-person students can focus on measuring the zones of inhibitions on the 4 plates for their groups and relaying the information to the 2 students joining virtually. The virtual students can lead the data recording part. However, both groups should participate in questioning and discussions.
Virtual Setting – If all the students have access to a printer and a ruler, proceed as normal. Share the plate images from above with them which they can print out and measure.
If students do not have access to a printer and a ruler, use the second set of images labeled “for virtual use only”. In this set of images, a ruler (in cms) has been placed on all the zones of inhibition on every plate. A student can simply record the measurement by reading the scale without a need to print and use a ruler.
Procedure:
Engagement – Begin PowerPoint –
Review the needed background information provided in the PowerPoint. Start by asking students if they can define microbes and list the major groups of microbes such as bacteria, fungi, virus, etc. Then ask if they can discuss the importance of microbes, both good (nutrient cycling, gut microbiota) and bad (food spoilage, diseases). Next steer the discussion towards diseases, ask if anyone knows what made them sick sometime in the past and what treatment they got from the doctor (no one should feel they have to share sensitive information, so you can provide some common examples too. COVID-19 and researchers trying to find a treatment for it is an interesting discussion if time permits). Introduce the term pathogens and antibiotics here. Next provide the background on antibiotic testing using Kirby-Bauer method provided in this lesson plan and the PowerPoint. Start the class activity.
Activity –
1) Each student receives a copy of the student worksheet including the instructions, part I, part II, and part III.
2) Form groups of 4 students each and hand out the 4 images belonging to a group, representing one replication of the experiment. The number of groups in class represents the number of times the experiment was repeated.
3) Within a group, the students can randomly allot one pathogen per student. 4) Students will measure the zone of inhibition (in mm) for each of the 4 different antibiotics for
their particular pathogen. In case of overlapping zones, measure a zone’s diameter from a non-overlapping section (Note: the diameter of a circle can be measured in any direction by the length of a line which touches two points on the edge of the circle and passes through the center).
5) They will then determine the susceptibility of their pathogen to the antibiotics by comparing their zone of inhibition measurements to the standards provided in a table in part I worksheet. This information should be filled in the first half of part I sheet.

X 100
6) Members of a group should share their findings with each other and fill in the table for their group in part I worksheet.
7) Students should finish answering the questions in part I as a group before proceeding to part II. 8) For part II, one person from a group can enter the data for the entire group in the first table. This
can be done on a shared computer for the class (If everyone has access to a device, a table can be shared on a platform like google sheets so multiple students can enter data at same time).
9) Once the data for all the experimental replications is entered, fill in the second table in part II. In this table, percentage of replicates of each pathogen susceptible to an antibiotic is calculated.
10) Students should calculate the proportions as follows. For example, to calculate the % of replicates of Aeromonas hydrophila susceptible to ATM -
% A. hydro. replicates susceptible to ATM = number of replicates of A. hydro. susceptible to ATM number of replicates of A. hydro. tested
11) Similarly, % of A. hydro replicates intermediate or resistant to ATM can be calculated. 12) Calculations should be repeated for all pathogens and all antibiotics. All percentages should be
filled in the second table in part II worksheet. 13) For part III, students should work in their groups again and make a graph for their pathogen based
on the second table in part II. Each student in a group will make a different graph since they will be graphing their particular pathogens.
14) Once all the four graphs for a group are plotted, they should look at them together and answer the questions.
15) Questions under extra credit can be used for purpose of extra credit, given as homework, or used for wrap-up discussion in class. This will require access to internet, journals or books.
Assessment:
The students should record their own observations (part I) and plot their own graphs (part III). They will need to share information within their groups and with the rest of the class. Questions in part I and part III should be answered after discussion in respective groups. Assessment can be done based on the worksheets. Additional questions for extra credit are also provided.
References:
Biemer, J. J. (1973). Antimicrobial susceptibility testing by the Kirby-Bauer disc diffusion method. Annals of Clinical & Laboratory Science, 3(2), 135-140.
Hudzicki, J. (2009). Kirby-Bauer disk diffusion susceptibility test protocol.
Image Credits:
www.pixabay.com

Student Worksheet
Instructions:
Dr. Kohli repeats her antibiotic sensitivity experiment several times and you are provided with an image of one of the experimental replications for a particular pathogen. Your task is to help Dr. Kohli record the observations from your plate and analyze the data to determine an effective antibiotic for the eels. To do this, you have to measure the zone of inhibition for each antibiotic (in mm) on a plate in your group. Next, you will compare these values to the standard zones of inhibition to determine the antibiotic sensitivity rating for your pathogen. After this, compare the results for your pathogen with the results for other pathogens in your group. Lastly, share your data with other groups in your class (i.e., compare results from all the replications of the experiment) and based on the compiled data answer the questions at the end.
Dr. Kohli is a fish biologist who studies fish health and diseases, and is approached by an eel aquaculturist regarding fish mortality at his eel house. The aquaculturist reports that he is losing about 25% of the fish that he catches and these fish that die show some lesions and abscesses. He calls this condition the red sore disease and seeks the help of Dr. Kohli to mitigate disease associated mortality at his farm.
To help him, Dr. Kohli collects some eels from the eel farm. She isolates bacteria from the lesions and spleen of the diseased fish while no bacteria are present in the samples collected from the healthy fish. Using molecular techniques, Dr. Kohli identifies four different species of bacteria. They are Aeromonas hydrophila, Aeromonas veronii, Aeromonas salmonicida, and Vibrio vulnificus. She now tests these bacteria for their antibiotic sensitivity to four different antibiotics using the Kirby-Bauer method. The antibiotics and their concentrations she uses are Aztreoname (ATM) 30 µg, Gentamicin (GM) 10µg, Imipenem (IPM) 10µg, and Levofloxacin (LVX) 5µg.

Name ____________________
PART I
Start by filling out details for your sample
Group number _____________________ Pathogen _________________________
Measure the zone of inhibitions on your plate for the 4 antibiotics (be careful to note the name of the antibiotic on the disk) and determine the antibiotic sensitivity of your pathogen to different antibiotics based on the reference table below.
ATM GM IPM LVX
Zone d (mm) Rating Zone d (mm) Rating Zone d (mm) Rating Zone d (mm) Rating
Antibiotic Abbreviation Disk content (µg)
Antibiotic sensitivity rating Susceptible (S) Intermediate (I) Resistant (R)
Aztreonam ATM 30 ≥21 18-20 ≤17 Gentamicin GM 10 ≥15 13-14 ≤12 Imipenem IPM 10 ≥23 20-22 ≤19 Levofloxacin LVX 5 ≥17 14-16 ≤13
Fill in data for the rest of the pathogens from your group
Pathogen ATM GM IPM LVX Zone d (mm) Rating Zone d (mm) Rating Zone d (mm) Rating Zone d (mm) Rating
Aeromonas hydrophila
Aeromonas salmonicida
Aeromonas veronii
Vibrio vulnificus
1) Were all the antibiotics equally effective against all the pathogens in your group?
2) Which is the most effective antibiotic against all pathogens in your group?

X 100
Group number _____________________ Name ____________________
PART II
Now compile data from the entire class. One person from each group should walk up to the computer and enter the sensitivity ratings for all pathogens for their group. Fill in data in the table below.
Pathogen Group Antibiotic sensitivity rating ATM GM IPM LVX
Aeromonas hydrophila
1 2 3 4
Aeromonas salmonicida
1 2 3 4
Aeromonas veronii
1 2 3 4
Vibrio vulnificus
1 2 3 4
Calculate percentage of replicates that are susceptible, intermediate, or resistant to different antibiotics for each pathogen. (see example calculation below)
% A. hydro. replicates susceptible to ATM = number of replicates of A. hydro. susceptible to ATM number of replicates of A. hydro. tested
Pathogen ATM GM IPM LVX S I R S I R S I R S I R
Aeromonas hydrophila
Aeromonas salmonicida
Aeromonas veronii
Vibrio vulnificus

Group number _____________________ Name ____________________ PART III
Now return to your groups and graph the antibiotic sensitivity of your pathogen to the different antibiotics. Look at everyone’s graphs in your group and collectively answer the questions that follow.
1) How does your pathogen compare to the other pathogens (refer to the graphs for each pathogen your group made)?
2) Considering results from all groups, which is the most effective antibiotic against all pathogens tested? Did your answer change from part I?
3) Based on this exercise, what is the significance of replication in scientific experiments?

Name ____________________
EXTENSION QUESTIONS (use of credible sources including websites, journals, and books permitted)
1) What is antibiotic resistance and why is it a problem?
2) What are some alternatives to using antibiotics?
3) Are any of these pathogens also known to infect humans?

GROUP 1
Pathogen - Aeromonas hydrophila
GROUP 1
Pathogen - Aeromonas salmonicida
IPM 10
GM 10 LVX
5
ATM 30
IPM 10
GM 10
LVX 5
ATM 30

GROUP 1
Pathogen - Aeromonas veronii
GROUP 1
Pathogen - Vibrio vulnificus
IPM 10
GM 10
LVX 5
ATM 30
ATM 30
IPM 10
GM 10
LVX 5

GROUP 2
Pathogen - Aeromonas hydrophila
GROUP 2
Pathogen - Aeromonas salmonicida
IPM 10
GM 10
LVX 5
ATM 30
IPM 10 GM
10
LVX 5
ATM 30

GROUP 2
Pathogen - Aeromonas veronii
GROUP 2
Pathogen - Vibrio vulnificus
IPM 10
GM 10
LVX 5
ATM 30
IPM 10
GM 10
LVX 5
ATM 30

GROUP 3
Pathogen - Aeromonas hydrophila
GROUP 3
Pathogen - Aeromonas salmonicida
GM 10
ATM 30
IPM 10
LVX 5
GM 10
ATM 30
IPM 10 LVX
5

GROUP 3
Pathogen - Aeromonas veronii
GROUP 3
Pathogen - Vibrio vulnificus
IPM 10
GM 10
LVX 5 ATM
30
IPM 10
GM 10
LVX 5
ATM 30

GROUP 4
Pathogen - Aeromonas hydrophila
GROUP 4
Pathogen - Aeromonas salmonicida
IPM 10
ATM 30
LVX 5
GM 10
GM 10
IPM 10
ATM 30
LVX 5

GROUP 4
Pathogen - Aeromonas veronii
GROUP 4
Pathogen - Vibrio vulnificus
LVX 5
GM 10 IPM
10
ATM 30
ATM 30 GM
10
LVX 5
IPM 10

FOR VIRTUAL USE ONLY
GROUP 1
Pathogen: Aeromonas hydrophila
GROUP 1
Pathogen: Aeromonas salmonicida
IPM 10
GM 10
LVX 5
ATM 30
IPM 10
GM 10 LVX
5
ATM 30

FOR VIRTUAL USE ONLY
GROUP 1
Pathogen: Aeromonas veronii
GROUP 1
Pathogen: Vibrio vulnificus
IPM 10
GM 10
LVX 5
ATM 30
ATM 30
IPM 10
GM 10
LVX 5

FOR VIRTUAL USE ONLY
GROUP 2
Pathogen: Aeromonas hydrophila
GROUP 2
Pathogen: Aeromonas salmonicida
IPM 10
GM 10
LVX 5
ATM 30
IPM 10 GM
10
LVX 5 ATM
30

FOR VIRTUAL USE ONLY
GROUP 2
Pathogen: Aeromonas veronii
GROUP 2
Pathogen: Vibrio vulnificus
IPM 10
GM 10
LVX 5
ATM 30
IPM 10 GM
10
LVX 5 ATM
30

FOR VIRTUAL USE ONLY
GROUP 3
Pathogen: Aeromonas hydrophila
GROUP 3
Pathogen: Aeromonas salmonicida
GM 10
ATM 30
IPM 10
LVX 5
GM 10
ATM 30
IPM 10 LVX
5

FOR VIRTUAL USE ONLY
GROUP 3
Pathogen: Aeromonas veronii
GROUP 3
Pathogen: Vibrio vulnificus
IPM 10
GM 10
LVX 5 ATM
30
IPM 10
GM 10
LVX 5
ATM 30

FOR VIRTUAL USE ONLY
GROUP 4
Pathogen: Aeromonas hydrophila
GROUP 4
Pathogen: Aeromonas salmonicida
IPM 10
ATM 30
LVX 5
GM 10
GM 10
IPM 10
ATM 30
LVX 5

FOR VIRTUAL USE ONLY
GROUP 4
Pathogen: Aeromonas veronii
GROUP 4
Pathogen: Vibrio vulnificus
LVX 5
GM 10 IPM
10
ATM 30
ATM 30 GM
10
LVX 5
IPM 10

ANSWER KEY PART I
GROUP 1
Pathogen ATM GM IPM LVX Zone d Rating Zone d Rating Zone d Rating Zone d Rating
A. hydrophila 40 S 30 S 24 S 44 S A. salmonicida 30 S 22 S 23 S 44 S A. veronii 40 S 26 S 22 I 44 S V. vulnificus 32 S 23 S 20 I 44 S
GROUP 2
Pathogen ATM GM IPM LVX Zone d Rating Zone d Rating Zone d Rating Zone d Rating
A. hydrophila 44 S 34 S 30 S 42 S A. salmonicida 44 S 24 S 20 I 48 S A. veronii 44 S 24 S 20 I 38 S V. vulnificus 25 S 26 S 28 S 46 S
GROUP 3
Pathogen ATM GM IPM LVX Zone d Rating Zone d Rating Zone d Rating Zone d Rating
A. hydrophila 50 S 27 S 25 S 48 S A. salmonicida 44 S 24 S 25 S 48 S A. veronii 44 S 30 S 24 S 40 S V. vulnificus 42 S 21 S 29 S 42 S
GROUP 4
Pathogen ATM GM IPM LVX Zone d Rating Zone d Rating Zone d Rating Zone d Rating
A. hydrophila 46 S 26 S 28 S 40 S A. salmonicida 40 S 23 S 20 I 46 S A. veronii 50 S 21 S 26 S 42 S V. vulnificus 36 S 25 S 30 S 40 S
1) Were all the antibiotics equally effective against all the pathogens in your group? Only group 3 will have all antibiotics effective against all pathogens, i.e. all pathogens susceptible to all antibiotics. For groups 1, 2, and 4, different pathogens show intermediate susceptibility for IPM.
2) Which is the most effective antibiotic against all pathogens in your group? Group 3 may choose any antibiotic since all pathogens are susceptible to all antibiotics. Groups 1, 2, and 4 should choose an antibiotic between GM, LVX and ATM since some of their pathogens exhibit intermediate susceptibility for IPM.
X 100
X 100 = 100% 4
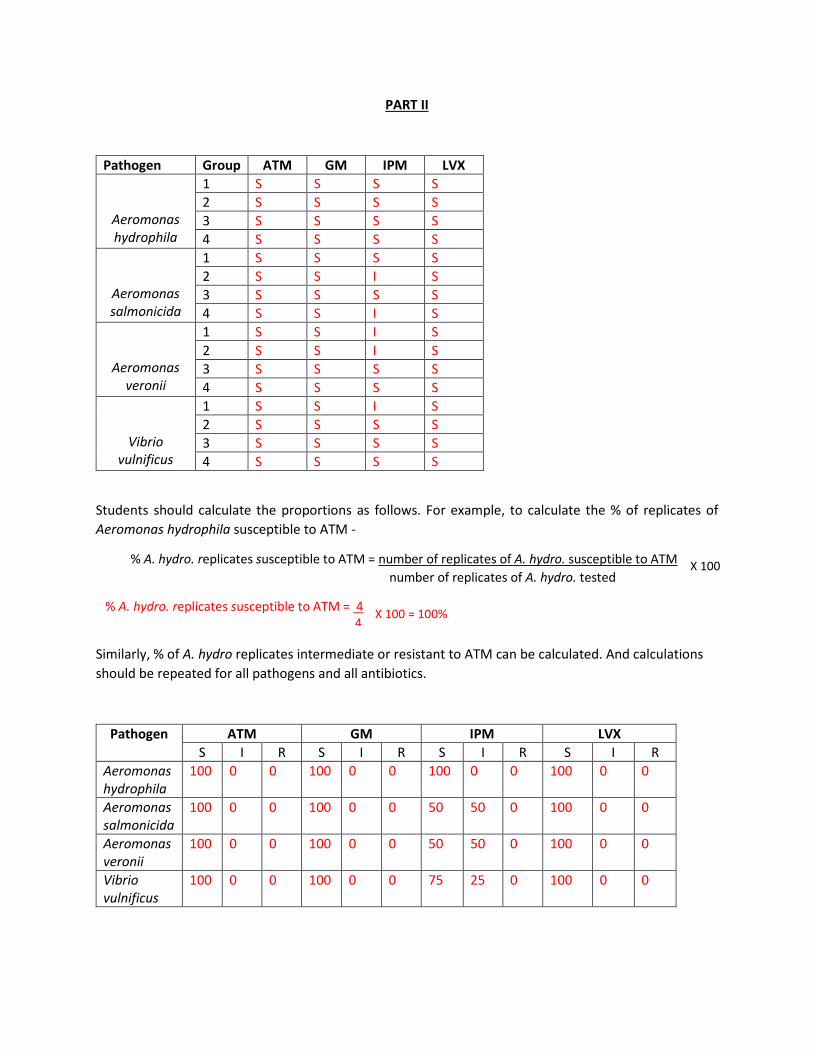
PART II
Pathogen Group ATM GM IPM LVX
Aeromonas hydrophila
1 S S S S 2 S S S S 3 S S S S 4 S S S S
Aeromonas salmonicida
1 S S S S 2 S S I S 3 S S S S 4 S S I S
Aeromonas veronii
1 S S I S 2 S S I S 3 S S S S 4 S S S S
Vibrio vulnificus
1 S S I S 2 S S S S 3 S S S S 4 S S S S
Students should calculate the proportions as follows. For example, to calculate the % of replicates of Aeromonas hydrophila susceptible to ATM -
% A. hydro. replicates susceptible to ATM = number of replicates of A. hydro. susceptible to ATM number of replicates of A. hydro. tested
% A. hydro. replicates susceptible to ATM = 4
Similarly, % of A. hydro replicates intermediate or resistant to ATM can be calculated. And calculations should be repeated for all pathogens and all antibiotics.
Pathogen ATM GM IPM LVX S I R S I R S I R S I R
Aeromonas hydrophila
100 0 0 100 0 0 100 0 0 100 0 0
Aeromonas salmonicida
100 0 0 100 0 0 50 50 0 100 0 0
Aeromonas veronii
100 0 0 100 0 0 50 50 0 100 0 0
Vibrio vulnificus
100 0 0 100 0 0 75 25 0 100 0 0

PART III
0
20
40
60
80
100
S I R S I R S I R S I R
ATM GM IPM LVX
Perc
enta
ge o
f rep
licat
es (%
)
Pathogen: Aeromonas hydrophila
0
20
40
60
80
100
S I R S I R S I R S I R
ATM GM IPM LVX
Perc
enta
ge o
f rep
licat
es (%
)
Pathogen: Aeromonas salmonicida
0
20
40
60
80
100
S I R S I R S I R S I R
ATM GM IPM LVX
Perc
enta
ge o
f rep
licat
es (%
)
Pathogen: Aeromonas veronii

1) How does your pathogen compare to the other pathogens (refer to the graphs for each pathogen your group made)? All three pathogens are 100% susceptible to ATM, GM, and LVX. However, they show a difference in their susceptibility to IPM. While all replicates of A. hydrophila were susceptible to IPM, only 50% of both A. salmonicida and A. veronii were susceptible to IPM, and 75% of Vibrio vulnificus were susceptible to IMP.
2) Considering results from all groups, which is the most effective antibiotic against all pathogens tested? Did your answer change from part I? ATM, GM, or LVX. The answer should change only for group 3 as earlier all antibiotics were effective against all pathogens in their group. However, now with data from entire class it can be seen that not all pathogens are susceptible to IPM.
3) Based on this exercise, what is the significance of replication in scientific experiments? Replication provides confidence to our results as some variation was seem within replicates. Getting consistent results indicates no error and validates our findings.
0
20
40
60
80
100
S I R S I R S I R S I R
ATM GM IPM LVX
erce
ntag
e of
repl
icat
es (%
)
Pathogen: Vibrio vulnificus

EXTENSION QUESTIONS
1) What is antibiotic resistance and why is it a problem? Antibiotic resistance happens when a pathogen is resistant to an antibiotic designed to inhibit or kill it. That means that the pathogen is no longer affected by the antibiotic and can continue to grow which makes treating infections caused by antibiotic resistant pathogens more difficult to treat. New antibiotics to which the pathogen is susceptible need to be designed.
2) What are some alternatives to using antibiotics? A variety of answers are acceptable ranging from probiotics, bacteriophages, and antimicrobial peptides to natural remedies like honey, garlic. The idea is to get the students to think about anything with antimicrobial properties.
3) Are any of these pathogens also known to infect humans? All the four pathogens are known to infect humans. The evidence for A. salmonicida infections in humans is relatively recent, so students may answer yes or no for it.