antibiotics in the environment: sources, fate, … in the environment: sources, fate, exposure, and...
TRANSCRIPT

Antibiotics in the Environment:
Sources, Fate, Exposure, and Risk
Damian Shea
Department of Biology
North Carolina State University
2012 “One Medicine” Symposium
5 December 2012

Outline of Presentation
• Conceptual model of the sources and fate of antibiotics and potential non-AMR risk
• Provide some detail of fate processes in water, soil, waste and water treatment
• Present data on antibiotics in soil and water
• Perform simple screening assessment for non-resistance risk to humans & ecosystem
• New research on measuring chronic exposure to antibiotics in water

Available: http://www.epa.gov/nerlesd1/chemistry/pharma/image/drawing.pdf

Pharmaceuticals Personal Care Products
Sanitary Sewer
Metabolism
Waste-water
Treatment Plant
Compartments
Toxicity to WWTP
bacteria
Exposure/
Effects
Surface Water Sludge
Sediment Ground Water
Ecological Exposure
bacteria (resistance and microbial web)
algae (primary prod, harmful vs beneficial)
aquatic invertebrates
benthic invertebrates
fish/shellfish
soil fauna and flora
mammals and birds
ecological processes
Human Exposure (direct)
Ingestion of groundwater
Ingestion of surface Water
Ingestion of contaminated fish/shellfish
Human Exposure (indirect)
Exposure to pathogens resulting from WWTP
Exposure to antibiotic-resistant bacteria
Ag Waste Lagoons
Soil

Veterinary Pharmaceuticals
Drugs used in
aquaculture
Drugs used in
livestock
(therapeutic)
Drugs used in
livestock
(prophylactic or as
growth promoters)
SOURCE
Local waste water
treatment plant
(WWTP)
Sludge or manure
dispersed on
agricultural fields
Manure tank
Groundwater
Aquatic
environment
FATE EFFECTS
Effects on human
population
Effects on
terrestrial
organisms
Effects on aquatic
organisms
Drugs in urine and
dung on pasture
land

Transport and Fate ModelEnvironmental Factors that
Modify Exposure
Exposure-Response Model
Toxicant Source(s) Toxicant Exposure Toxicant Effects
Prospective and Retrospective Assessments
How does the environment change effective exposure to antibiotics?
Can we measure it?
Can we model it?

Antibiotics in Environmental Media
In 2000, roughly 17,000 tons of antibiotics were produced in the US ~70% used on livestock farming
Antibiotics detected in
waste (10-12,000 μg/kg)
soil (0-200 μg/kg)
sediment (0-25 μg/kg)
(500-4000 μg/kg aquaculture)
ground water (0-400 ng/L)
surface water (0-1,900 ng/L)
drinking water (0-200 ng/L)

The PhATETM
Model (Pharmaceutical Assessment and Transport Evaluation)
MODEL
For 11 U.S. watersheds:
• Population Distribution
• Sewage Treatment Plant Flows
• Stream/River Flows
• Drinking Water Treatment Plant Flows
Human Health Risk Assessment Module
INPUTS OUTPUTS
Annual US Sales (IMS)
Acceptable Daily
Intake (ADI) or toxicity data
Percent Removal
at Each Step • Metabolism
• Wastewater Treatment
• In-Stream Loss
• Drinking Water Treatment
Predicted Concentrations • In Sewage Treatment Plant
Effluent
• In Streams/Rivers
• In Drinking Water
Predicted No Effect Concentration for
Human Health
AMR was not considered

Summary of PhATE Screening Study
• Anderson, P. D., et al. (2004) Screening Analysis of Human Pharmaceutical Compounds in U.S. Surface Waters, Envir. Sci. Tech., 38:838-849
• PhATE PECs (Predicted) vs. USGS MECs (Measured) for 11 compounds: – PEC/MEC in agreement for 2;
– PEC<LOD (Limits of Detection) for 3; evaluate potential effects below LOD;
– PEC>MEC for 3; Depletion unaccounted for by model, evaluate impact of POTW and in-stream removal;
– PEC<<MECs for 3; Comparing the PECs to the measured data identified some questionable analytical findings.

Estimating Exposure
• Persistence – Rate constants are dependent on many
environmental parameters due to multiple mechanisms of degradation (hydrolysis, photolysis, biotic, de-conjugation)
– Overall half-lives range from many hours to many months, often with large uncertainty
• Partitioning (between water and particles) – Multiple mechanisms of sorption to
soil/sediment
– Dependent on many parameters (pH, CEC, metals)
– Bioaccumulation potential is generally low

P: Parent compound
M: metabolites
KPSW and KMSW: PSD-water
partition coefficients of P and M
KPOC and KMOC: oil or other
organic carbon sorption
coefficients of P and M
BCF: bioconcentration factor
BMF: biomagnification factor
MET: metabolic clearance
Simplified model of the partitioning processes of chemicals

This study
Tolls et al. ES&T 2001
Kd,solid = Cs/Caq
KOC = Kd / fOC
Sulfamide, cycline and floxacin drugs
Tylosin, efrotomycin, avermectin VPs (MW > 875)

Plot of the log Kd,DOM data against hydrophobicity expressed as log Kow. The solid line is a regression line obtained for a wide range of neutral organic chemicals. Kd,DOM must be expressed
as a combination of all important sorption mechanisms.

Partitioning
• Sorption – Adsorption
– Absorption
• Partitioning – KOC = fOC * KD

Estimating Exposure
Due to the complexity of partitioning and the
lack of information on both partitioning and
persistence, most are relying on analytical
measurements in the environment rather
than models
Ongoing research is addressing these fate
processes to allow for more quantitative
modeling in the future

Environmental
Exposure

Is There Potential for non-AMR
Adverse Human Health Effects?
• Substantial information from Phase II toxicity
testing, Phase III clinical trials, and subsequent use
• Uncertainty over chronic low-dose toxicity in
susceptible populations
• We will use a simple hazard quotient using
therapeutic dose as a screen and measured
antibiotic concentrations in water from literature
and data from recent work of ours

Antibiotic Dosage Range (mg/kg/d)
Equivalent Drinking
Water Dose (mg/L)
low high low high
sulfachloropyridazine
sulfadimethoxine
sulfamerazine
sulfamethoxazole 40 100 1400 3500
sulfathiazole 71 250 2485 8750
chlortetracycline 10 30 350 1050
doxycycline 1.4 2.2 49 77
oxytetracycline 14 50 490 1750
tetracycline 14 50 490 1750
ciprofloxacin 2.9 21 101.5 735
enrofloxacin
norfloxacin 11.4 11.4 399 399
sarafloxacin

Therapeutic Dose is One Million Times
Above Highest Reported Exposure
0.000001
0.00001
0.0001
0.001
0.01
0.1
1
10
100
1000
10000
sulfa
chlo
ropyr
idaz
ine
sulfa
dimet
hoxin
e
sulfa
mer
azin
e
sulfa
met
hazi
ne
sulfa
met
hoxa
zole
sulfa
thia
zole
chlo
rtet
racy
clin
e
doxycy
clin
e
oxyte
trac
yclin
e
tetrac
yclin
e
cipro
floxa
cin
enro
floxa
cin
norflo
xaci
n
sara
floxa
cin
Co
nc
en
tra
tio
n (
mg
/L)
Lowest Dose Literature Water Surface Water Groundwater
Animal and human waste
Children, pregnant women, and other
susceptible sub-populations?

Are Antibiotics Removed During
Drinking Water Treatment?
• Previous work with other drugs show:
– No significant removal with sand (oxic or anoxic)
– Variable removal rates with flocculation
– 50-99% removal with ozonation
– 50-95% removal with granular activated carbon
• We conducted standard batch adsoprtion
experiments with granular activated carbon
to measure removal efficiencies of
antibiotics

0 10 20 30 40 50 60 70 80 90 100
sulfachloropyridazine
sulfadimethoxine
sulfamerazine
sulfamethazine
sulfamethoxazole
sulfathiazole
chlortetracycline
doxycycline
oxytetracycline
tetracycline
ciprofloxacin
enrofloxacin
norfloxacin
sarafloxacin
Removal Using Activated Carbon (%)

Removal of Antibiotics in Water Treatment Plant
0.00 0.05 0.10 0.15
tetracycline
ciprofloxacin
Concentration in Water (ug/L)
Finished Raw

Antibiotics Were Not Detected in Drinking Water
0.000001
0.00001
0.0001
0.001
0.01
0.1
1
10
100
1000
10000
sulfa
chlo
ropyr
idaz
ine
sulfa
dimet
hoxin
e
sulfa
mer
azin
e
sulfa
met
hazi
ne
sulfa
met
hoxa
zole
sulfa
thia
zole
chlo
rtet
racy
clin
e
doxycy
clin
e
oxyte
trac
yclin
e
tetrac
yclin
e
cipro
floxa
cin
enro
floxa
cin
norflo
xaci
n
sara
floxa
cin
Co
nc
en
tra
tio
n (
mg
/L)
Lowest Dose
Tap Water
Groundwater

Summary of Drinking Water Exposure
• Antibiotics were not detected in drinking water
(groundwater beneath municipal sludge/hog
waste/manure, or tap water)
• Estimated exposures are ~ 106 times below lowest
therapeutic dose, – susceptible sub-populations not considered, therapeutic dose may
slightly overestimate safe exposure for some populations, i.e. no
doctor/pharmacist involved
• Activated carbon removes ~ 90% of antibiotics
• Additional treatment would remove even more (home)
• We have no evidence of unacceptable human health
risk from direct effects using this simple analysis

Removal of Antibiotics in Sewage Treatment (%)
0
10
20
30
40
50
60
70
80
90
100
Trim
etoprim
Sulfam
ethazin
Roxithromycin
Clarithromycin
Levofloxacin
Azithromycin
Sulfam
ethoxazole
Tetracyclin
Erythromycin
Ciprofloxacin
Norfloxacin
Removalefficiencyforwastewatertreatment(%
)

Adverse Ecological Effects
• Very little information on non-mammalian species
• Uncertainty over chronic low-dose toxicity in susceptible populations
• We will use hazard quotients and bioassays as screening indicators
• Indirect effect of exposure to antibiotic resistant bacteria or changes in microbial populations and food web?

Indicators of Adverse Ecological Effects
• Algal toxicity tests (growth inhibition) – M. aeruginosa (cyanobacteria) ~ 100 times more sensitive
than S. capricornutum (green algae)
– EC50s (mg/L): 0.006 (benzylpenicillin) to > 100
• Bacteria (Pseudomonas putida) – Growth inhibition EC50 = 0.08 mg/L
• Soil fauna tests – Survival, growth, reproduction, and cocoon hatching
success of earthworms, springtails, and enchytraeids (NOEC 2000 to > 5000 mg/kg)
• Aquatic invertebrates (Daphnia magna) – Acute 48-h EC50s (mg/L): 4.6 (oxolinic acid) to > 1000
– Chronic EC50s (mg/L): 5.4 (tiamulin) to > 250
– Acute:Chronic ratio ~ 10
• Fish and crustaceans
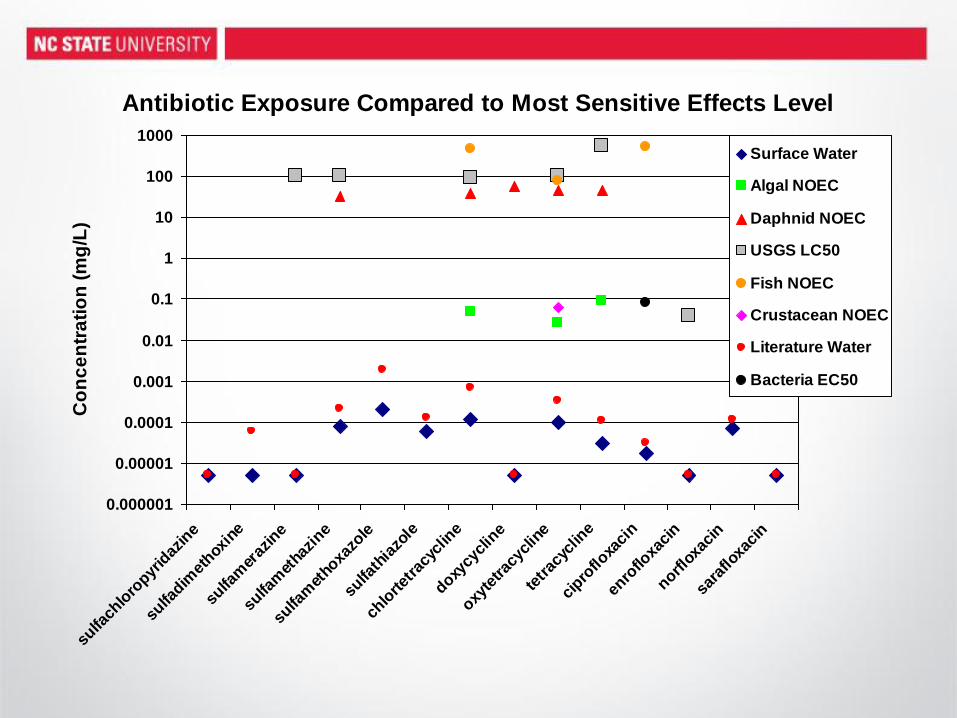
Antibiotic Exposure Compared to Most Sensitive Effects Level
0.000001
0.00001
0.0001
0.001
0.01
0.1
1
10
100
1000
sulfa
chlo
ropyr
idaz
ine
sulfa
dimet
hoxin
e
sulfa
mer
azin
e
sulfa
met
hazi
ne
sulfa
met
hoxa
zole
sulfa
thia
zole
chlo
rtet
racy
clin
e
doxycy
clin
e
oxyte
trac
yclin
e
tetrac
yclin
e
cipro
floxa
cin
enro
floxa
cin
norflo
xaci
n
sara
floxa
cin
Co
nc
en
tra
tio
n (
mg
/L)
Surface Water
Algal NOEC
Daphnid NOEC
USGS LC50
Fish NOEC
Crustacean NOEC
Literature Water
Bacteria EC50

Exposure is 50,000 Times Below NOEC in Sludge Ammended Soil
0.001
0.01
0.1
1
10
100
1000
10000
sulfa
chlo
ropyr
idaz
ine
sulfa
dimet
hoxin
e
sulfa
mer
azin
e
sulfa
met
hazi
ne
sulfa
met
hoxa
zole
sulfa
thia
zole
chlo
rtet
racy
clin
e
doxycy
clin
e
oxyte
trac
yclin
e
tetrac
yclin
e
cipro
floxa
cin
enro
floxa
cin
norflo
xaci
n
sara
floxa
cin
Co
nc
en
tra
tio
n (
mg
/kg
)
Lowest NOEC for Soil
Fauna
Highest Measured
Concentration

Bioassays Were Performed at Maximum
Aggregate Exposure of all Antibiotics
• No Adverse Effects Were Observed for All Tests
• Freshwater and marine tests for:
– Algal toxicity – no growth inhibition
– Aquatic invertebrate (D. magna and A. tonsa)
no change in survival, growth, reproduction
• No bacterial growth inhibition or resistance tests were performed

Summary
• Antibiotic residues are detectable in many places and generally follow our expectations of their fate
• Antibiotic fate models provide good generic and evaluative assessments, but the complexity of chemical transformation and partitioning limits their quantitative use
• Both models and measurements indicate low probability for direct adverse effects on human and ecological health
• However, we do not yet know the effect of antibiotics in water/sediment/soil on AMR and changes to microbial communities

P: Parent compound
M: metabolites
KPSW and KMSW: PSD-water
partition coefficients of P and M
KPOC and KMOC: oil or other
organic carbon sorption
coefficients of P and M
BCF: bioconcentration factor
BMF: biomagnification factor
MET: metabolic clearance
Simplified model of the partitioning processes of chemicals
PSD

Passive Sampling Device (PSD): Exposure Dosimeter
• Sequester and preconcentrate chemicals from water in a time-
integrated fashion using polymers (PDMS, PE, POM, etc.)
• Laboratory derived uptake rates (RS) to estimate CW
• Can provide estimate of chronic exposure with lower detection
limits and much less cost than traditional grab sampling
CW = NPSD/Rs * t

Field Data: Surface Water near CAFO
0
10
20
30
40
50
60
70
0 5 10 15 20 25 30
Te
tra
cy
clin
e (
ng
/L)
Time (days)
Grab
C-PSD
f-PSD
Grab Mean

Acknowledgments
• USDA and NC ARS
• National Institute of Environmental Health
Sciences
• NC State Collaborators:
– N Hirons, X Xia, A Kong, P Lazaro, A McEachran