sources and environmental fate of selected pharmaceutical
TRANSCRIPT

The sources and environmental fate of pharmaceuticals and
personal care products in lowland river catchments
A thesis submitted to Imperial College London for the degree of Doctor of
Philosophy in the Faculty of Life Sciences
By
James William Treadgold BSc (Honours) MSc DIC
Centre for Environmental Policy
Imperial College London
2012

2
DECLARATION OF ORIGINALITY
I can confirm that the research presented in this thesis is my own work. The work
has not been submitted in any form for another degree of diploma at any other
university. Information derived from the work of others has been cited in the text
and a list of references is given in the bibliography.

3
PUBLICATIONS
Published
Treadgold, J. W., Liu, Q-T., Plant, J. A., Voulvoulis, N. (2011) Chapter 8
Pharmaceuticals and personal care products. In: Plant, J. A., Voulvoulis, N.,
Ragnarsdottir, V. A. (eds.) Pollutants, human health and the environment: A risk
based approach. Wiley-Blackwell.
Submitted
Treadgold, J. W., Frickers, P. E., Voulvoulis, N., Readman, J. W. The relative
importance of microbial heterotrophic degradation versus photodegradation in
removal of triclosan from estuarine waters. Chemosphere,
Treadgold, J. W., Liu, Q-T., Sharpe, A., Voulvoulis, N. Aquatic fate of
pharmaceutical mixtures and determination of degradation pathways in a tidal river
system. Science of the Total Environment,
For submission
Treadgold, J. W., Voulvoulis, N. Source assessment of pharmaceuticals under the
principles of the Water Framework Directive. Journal of Environmental Monitoring,
Treadgold, J. W., Bound, J. P., Martin, O., Voulvoulis, N. The relative importance of
pharmaceutical use in care homes versus residential households in contributing to
aquatic concentrations. Environment International,

4
ACKNOWLEDGEMENT
I would like to thank my supervisor, Dr Nikolaos Voulvoulis for obtaining the
NERC funding for the PhD and for trusting in my ability to research this interesting
and important subject. The opportunity has allowed me to develop many skills that
will be highly beneficial for my future career. I am grateful for your continued
support during the last four years.
As I spent some of my time on industrial placements, I would like to thank Dr Qin-
Tao Liu for allowing me to work at Brixham Environmental Laboratories. This
placement was fundamental for the development of my research skills and the
weekly support was superb. I would also like to thank Professor Jim Readman who I
worked with at Plymouth Marine Laboratories. The level of supervision and
advanced knowledge of chemical pollution was fantastic. There are too many people
to name individually at BEL and PML that I worked with but thank-you to you all
for making the two placements very enjoyable.
Back at Imperial, I have met some very interesting people from all over the world
and I would like to thank all past and present members of the Environmental Quality
Research Group. I really enjoyed spending time with Carmina Jorquera, Danelle
Dhaniram, Khareen Singh, Eleni Iacovidou, Alex Collins, Aisha Sans Nom, James
Bone, Ho-sik Chon, Youngsuk Lee, Atun Manap, Dieudonne-Guy Ohandja, Claire
Hunt, Martin Head, Sally Donovan, Maria Taoussi-Emmanualson, Victoria Rowsell,
Olwenn Martin, Rebecca McKinlay and Jilang Pan and hope to keep seeing many of
you in the future.

5
Finally and most important of all I would like to thank my family. Mum, Dad,
Rachael, Andrew, Grandma, Granddad, Julia, Richard and Daniel. You have all
been here for me right from the start and this would not have been possible without
any of you. For this, I will always be grateful.

6
ABSTRACT
The presence of pharmaceuticals and personal care products (PPCPs) and their
potential to induce adverse biological effects in aquatic environments has been the
subject of increased scientific and public interest. Over the last thirty years, a range
of PPCPs including antibiotics, antidepressants, antimicrobials, cardiovascular drugs,
non-steroidal anti-inflammatory drugs and phthalates have been found in water
bodies all over the world. Unlike many other potential pollutants, there are currently
no consent standards on concentrations for most pharmaceuticals that can be
discharged to the environment. This environmental concern therefore creates the
need to understand the source inputs and the environmental fate mechanisms
responsible for removing these PPCPs from the aquatic environment. As a result,
this thesis aimed to further knowledge of the sources and environmental fate of
PPCPs using the principles of the Water Framework Directive to deliver holistic
understanding to water policy issues. This new approach to source assessment is
useful for developing more realistic site specific environmental risk assessments that
can identify catchments and causes of environmental concern. Further research
regarding source assessment addresses nursing homes as a relatively understudied
source and compares the consumption of drugs to residential households to find that
nursing homes have the potential to input more pharmaceuticals to the aquatic
environment. In light of the new sources, the next step was to study the aquatic fate
of PPCPs. Experimental fate studies show degradation rates and removal
mechanisms are influenced by the environmental conditions of the catchment. The
findings of the research aimed to facilitate catchment management of PPCPs and
inform future water policy.

7
CONTENT
Declaration of originality 2
Publications 3
Acknowledgement 4
Abstract 6
Content 7
List of figures 14
List of tables 15
List of equations 17
List of abbreviations 19
Chapter 1: Introduction 24
1.1. Introduction 24
1.2. Aim 26
1.3. Objectives 27
1.4. Structure of thesis 27
1.5. Significance of thesis 29
Chapter 2: Background 30
2.1. Water Framework Directive 31
2.2. Pharmaceuticals 31
2.2.1. Consumption 32
2.3. Pharmaceutical sources 33
2.3.1. Primary and secondary sources 33
2.3.2. Residential households and care homes 33
2.4. Pathways into the environment 34

8
2.5. Environmental fate 35
2.6. Improved analysis techniques and environmental occurrence 38
2.7. Environmental risk assessment 40
2.8. Modelling 43
Chapter 3: Life cycle of pharmaceuticals and personal-care products 45
3.1. Introduction 46
3.1.1. Pharmaceuticals 46
3.1.2. Personal-care products 49
3.2. Hazardous properties 51
3.2.1. Antibiotics 51
3.2.2. Antidepressants 52
3.2.3. Cardiovascular drugs 53
3.2.4. Non-steroidal anti-inflammatory drugs 54
3.2.5. Phthalates 54
3.3. Anthropogenic sources 55
3.3.1. Antibiotics 56
3.3.2. Antidepressants 60
3.3.3. Cardiovascular drugs 61
3.3.4. Non-steroidal anti-inflammatory drugs 62
3.3.5. Phthalates 64
3.4. Pathways and environmental fate 65
3.4.1. Antibiotics 66
3.4.2. Antidepressants 69
3.4.3. Cardiovascular drugs 70
3.4.4. Non-steroidal anti-inflammatory drugs 71

9
3.4.5. Phthalates 73
3.5. Physiological effects 73
3.5.1. Antibiotics 74
3.5.2. Antidepressants 75
3.5.3. Cardiovascular drugs 76
3.5.4. Non-steroidal anti-inflammatory drugs 77
3.5.5. Phthalates 78
3.6. Discussion 79
3.7. Conclusions 80
Chapter 4: Source assessment of pharmaceuticals under the principles of the
Water Framework Directive 81
4.1. Introduction 82
4.1.1. Importance of catchments for accurate source and risk assessment 84
4.2. Primary and secondary of pharmaceuticals 85
4.2.1. Primary sources 87
4.2.1.1.Residential households 87
4.2.1.2. Hospitals 88
4.2.1.3. Care homes 89
4.2.1.4. Prisons 90
4.2.1.5. Manufacturing 91
4.2.1.6. Agriculture 92
4.2.1.7. Aquaculture 92
4.2.2. Secondary sources 93
4.2.2.1. Sewage Treatment Plants 93
4.2.2.2. Biosolids 94

10
4.2.2.3. Landfill sites 95
4.3. Discussion 97
4.4. Conclusion 101
Chapter 5: Residential households and care homes as a source for
pharmaceuticals in the environment 102
5.1. Introduction 103
5.2. Methodology 105
5.3. Results and discussion 108
5.3.1. Risk assessment 120
5.4. Conclusions 122
Chapter 6: Environmental fate of pharmaceutical mixtures in the river Dart
catchment 123
6.1. Introduction 124
6.2. Material and methods 127
6.2.1. Study site 127
6.2.2. Sample collection and water characterisation 128
6.2.3. Test substances 129
6.2.4. UV-VIS absorbance spectra 130
6.2.5. Photolysis experiments 131
6.2.6. Chemical analysis 132
6.2.7. Statistical analysis 133
6.3. Results and discussion 133
6.3.1. Parameter profile of the river Dart sampling locations 133
6.3.2. Removal mechanisms of pharmaceuticals under the experimental conditions
134

11
6.3.2.1. Ibuprofen 135
6.3.2.2. Mefenamic acid 136
6.3.2.3. Paracetamol 136
6.3.2.4. Propranolol 137
6.3.2.5. Salbutamol 138
6.3.3. Individual compound kinetics vs. compound mixture kinetics in DIW 138
6.3.4. Location specific degradation kinetics 140
6.3.5. Tide specific degradation kinetics 141
6.3.6. Impact of river water parameters on the overall rate constants 141
6.4. Conclusions 142
Chapter 7: Environmental fate of triclosan in the river Tamar estuary 144
7.1. Introduction 145
7.2. Material and methods 147
7.2.1. Test substances, standards, solvents and acids 147
7.2.2. Study area, sampling and field and water parameter analysis 148
7.2.3. Laboratory analysis of water samples 149
7.2.4. Degradation experiments 150
7.2.5. Sub-samples and extraction 150
7.2.6. GC-MS analysis 151
7.2.7. Statistical analysis 151
7.3. Results and discussion 152
7.3.1. Parameter profile of the Tamar Estuary 152
7.3.2. Experimental conditions and triclosan degradation pathways 153
7.3.3. Location specific degradation of triclosan in the Tamar Estuary 154

12
7.3.4. Relative importance of indirect photodegradation and microbial
heterotrophic degradation 155
7.3.5. Statistical analysis of degradation data and environmental parameters 156
7.4. Conclusions 158
Chapter 8: Overall discussion 160
8.1. The sources and environmental fate of pharmaceuticals 161
8.2. Environmental risk assessment and risk reduction policies 165
Chapter 9: Conclusions 171
References: 173
Appendices: 205
Appendix A Data for chapter 5 205
Appendix A1 Example of MAR sheet 205
Appendix B Data for chapter 6 206
Appendix B1 River Dart annual mean flow rates and daily flow rate for 10th
August
2009. Data recorded from Austins Bridge, Buckfastleigh. 206
Appendix B2 Solar irradiance of Heraeus Suntest CPS Photosimulator measured
before and after each experiment with a Spectrad Spectroradiometer
208
Appendix B3 Reaction vessel for the degradation experiments 209
Appendix B4 Experimental set-up for the degradation studies 210
Appendix B5 Wavelength screening for HPLC method development 211
Appendix B6 Chemical analysis methodology 220
Appendix B7 Calibration curves and peak areas for all degradation experiments
228

13
Appendix B8 Concentration data (calculated from calibration curve equation), r2
values, kinetics and half lives (calculated from exponential
regressions) for all degradation experiments 235
Appendix C Data for chapter 7 243
Appendix C1 Environmental variables field data 243
Appendix C2 Chromatograph showing retention time of 4-n-nonylphenol and
triclosan 245
Appendix C3 Peak areas of 4-n-nonylphenol and triclosan used for calculating
triclosan concentrations during experimental degradation studies
246

14
LIST OF FIGURES
Figure 1. Primary sources of human and veterinary pharmaceuticals in the
environment 56
Figure 2. Pathways and fate of pharmaceuticals after human use. Modified from
personal communication with V Cunningham in 2007 65
Figure 3. Links between environmental and human-health risks of PPCPs 79
Figure 4. Movements of human and veterinary pharmaceuticals from primary
and secondary sources in a river basin district 86
Figure 5. (A) The mass of the 42 most used pharmaceuticals and (B) the
consumption of each therapeutic class of drug as a percentage of the
total mass consumed 117
Figure 6. The relative distribution of drug use in households and care homes
119
Figure 7. River Dart catchment and location of the three sample sites 128
Figure 8. UV-Visible absorbance spectra for studied compounds at 10 mg L-1
131
Figure 9. Locations of the sample sites in the Tamar estuary, UK 149
Figure 10. Axial transect profiles for environmental variables 153
Figure 11. Location specific triclosan degradation at seven locations from the
river Tamar estuary 155

15
LIST OF TABLES
Table 1. Analytical methods used for determining the occurrence of
pharmaceuticals in environmental matrices 40
Table 2. Measured concentrations (µg L-1
) of antibiotics in effluent 59
Table 3. Measured concentrations (µg L-1
) of antidepressants in effluent 60
Table 4. Measured concentrations (µg L-1
) of cardiovascular drugs in effluent
61
Table 5. Measured concentrations (µg L-1
) of NSAIDs in effluent 63
Table 6. Risk assessment data for selected pharmaceutical compounds 83
Table 7. RBDs in England and Wales 85
Table 8. Reduction in pharmaceutical concentrations during STP treatment 94
Table 9. Measured concentrations of pharmaceutical compounds from source
wastewater 96
Table 10. Drug use in residential households and care homes 109
Table 11. Risk assessment of the 25 drugs used in residential households and
care homes 120
Table 12. Physicochemical properties of test substances 130
Table 13. River Dart water parameters 134
Table 14. Overall and comparative degradation kinetics for direct and indirect
photodegradation, biodegradation and hydrolysis of five
pharmaceuticals in DIW and environmental matrices 139
Table 15. Pearson’s correlation coefficient and significance of rate constant and
river water parameter 142

16
Table 16. Summary of triclosan general information and physicochemical
properties 145
Table 17. Relative loss of triclosan from indirect photodegradation and
microbial heterotrophic degradation as a percentage of the total
degradation 156
Table 18. Pearson correlation coefficients for degradation data and
environmental parameters 158

17
LIST OF EQUATIONS
Equation 1 40
EIC (µg L-1
) = A * B * C * D
Equation 2 41, 107
DOSEai * Fpen
PEC (mg L-1
) SURFACEWATER =
WASTEWinhab * DILUTION
DOSEai = Maximum daily dose consumed per inhabitant
WASTEWinhab = Amount of wastewater per inhabitant per day (200 L inh-1
d-1
)
DILUTION = Dilution factor (10)
Fpen = Percentage of market penetration (1%)
Equation 3 42
Consumption * 100
Fpen [%] =
DDD * inhabitants * 365
Consumption = sales of drug substances per annum in geographical area (mg y-1
)
DDD = defined daily dose per patient in geographical area (mg d-1
* inhab)
Inhabitants = number of people in geographical area

18
Equation 4 43
Elocalwater * Fstpwater
PEC (mg L-1
) SURFACEWATER =
WASTEWinhab * CAPACITYstp * FACTOR * DILUTION
Fstpwater = Fraction of emission directed to surface water
CAPACITYstp = Capacity of local STP (inh-1
)
FACTOR = Factor taking the adsorption to suspended matter into account
Equation 5 43
Elocalwater = DOSEai * Fexcreta * Fpen * CAPACITYstp
Fexcreta = fraction of active ingredient excreted
Equation 6 105
n = π (1 – π) z2/e
2

19
LIST OF ABBREVIATIONS
ACORN A Classification of Residential Neighbourhoods
AF Assessment factor
API Active pharmaceutical ingredient
BEL Brixham Environmental Laboratory
BOD Biochemical oxygen demand
CAFO Concentrated animal feeding operation
CAS Chemical Abstracts Service
cDOM Chromophoric dissolved organic matter
CMR Carcinogenicity, mutagenicity and reproductive toxicity
CNS Central nervous system
COD Chemical oxygen demand
COX Cyclo-oxygenase
CT Controlled temperature
DCDD Dichlorodibenzo-p-dioxin
DCM Dichloromethane
DDD Defined daily dose
DIW De-ionised water
DMB(s) Dewatered municipal biosolids(s)
DO Dissolved oxygen
DOC Dissolved organic carbon
DOW Octanol-water partition coefficient (dissociated)
EA Environment Agency of England and Wales

20
EC European Commission
EC50 Half maximal effective concentration
EDC(s) Endocrine-disrupting chemical(s)
EEA European Economic Area
EEC European Economic Community
EIC Expected introductory concentration
EMEA European Medicines Agency
ENR Enoyl-acyl carrier protein reductase
EQS Environmental quality standard
ERA Environmental risk assessment
EU European Union
FASS Farmaceutiska Specialiteter i Sverige (Swedish national formulary of
drugs)
Fpen Market penetration factor
FDA Food and Drug Administration
FSI Freshwater-seawater interphase
GC-MS Gas chromatography-mass spectroscopy
GDP Gross domestic product
GLP Good laboratory practice
GMP Good manufacturing practice
GP General Practitioner
GREAT-ER Geo-referenced Regional Exposure Assessment Tool for European
Rivers
HCl Hydrochloric acid
HLB Hydrophilic-lipophilic balance

21
HPLC High pressure liquid chromatography
HRT Hormone replacement therapy
ICPDR International Commission for the Protection of the Danube
IUCN International Union for Conservation of Nature
IS Internal standard
kd Biosolids/water distribution coefficient
KOC Soil organic carbon adsorption coefficient
KOW Octanol-water partition coefficient (non-dissociated)
LC50 Half lethal effective concentration
LC-MS Liquid chromatography-mass spectrometry
LMB(s) Liquid municipal biosolids(s)
MAOI(s) Monoamine oxidase inhibitors(s)
MEC(s) Measured environmental concentration
MeOH Methanol
MoA Mechanism of action
MW Molecular weight
ND Not detected
NHS National Health Service
NOEC(s) No-observed-effect-concentration(s)
NPOC Non-purgeable organic carbon
NSAID(s) Non-steroidal anti-inflammatory drug(s)
NTU Nephelometric turbidity unit
OECD Organisation for Economic Cooperation and Development
OH Hydroxyl
OTC Over-the-counter

22
PBT Persistence, bioaccumulation and toxicity
PCDD(s) Polychlorinated dibenzo-p-dioxins
PCP(s) Personal-care product(s)
PEC Predicted environmental concentration
PhATETM
Pharmaceutical Assessment and Transport Evaluation
pKa Acid dissociation constant
PML Plymouth Marine Laboratory
PMS Performance monitoring system
PoM(s) Programme of measures(s)
POM Prescription only medicine
POTW(s) Publicly owned treatment work(s)
PNEC Predicted no effect concentration
PPCP(s) Pharmaceutical and personal-care product(s)
RBD(s) River basin district(s)
RBMP(s) River basin management plan(s)
RCR(s) Risk-characterisation ratio(s)
REACH Registration, Evaluation, Authorisation and restriction of CHemicals
legislation
RIB Rigid inflatable boat
SCCS Scientific Committee on Consumer Safety
SIADH Syndrome of inappropriate secretion of an antidiuretic hormone
SNRI(s) Serotonin-noradrenalin reuptake inhibitors(s)
SPE Solid phase extraction
SSRI(s) Selective serotonin re-uptake inhibitor(s)
STP(s) Sewage treatment plant(s)

23
SWWSL South West Water Services Ltd
TOC Total organic carbon
TOF-MS Time-of-flight-mass spectrometry
TQ-MS Triple quadrupole-mass spectrometry
TSS(s) Total suspended solid(s)
UK United Kingdom of Great Britain and Northern Ireland
UP-LC Ultra pure-liquid chromatography
US United States of America
UV Ultra violet
VOC Volatile organic compounds
VWS Wet oxidation in stand-alone mode
WFD(s) Water Framework Directive(s)
WHO World Health Organisation
24
CHAPTER ONE: INTRODUCTION
1.1. Introduction
Modern humans and animals have survived through the consumption and intelligent
use of plant species and for this we should be grateful for the existence of such plant
biodiversity. To put this into context, many early pharmaceuticals appear to have
been plants which have enhanced the early survival of humanity, allowing us to
synthesize the huge variety of drugs that we see today (Sweetman 2011). However,
once pharmaceuticals have been metabolised by human and veterinary targets and
released into the environment, the biologically active compounds can cause concern
at an ecological level (Martin and Voulvoulis 2009).
In line with better health care from the development of pharmaceuticals,
personal-care products have been developed to improve hygiene and the delivery of
drugs. These include fragrances, phthalates, preservatives and surfactants that are
used in a range of products including cosmetics, cleaning products, enteric coating of
pharmaceutical pills and toiletries.
Pharmaceuticals and personal care products (PPCPs) have probably been
present in the aquatic environment since the beginning of modern healthcare, but it
was not until the mid 1970s that their presence was first detected (Hignite &
Azarnoff 1977). This investigation initiated extensive research during the eighties
and the nineties and improved analytical techniques allowed for the detection of
drugs in sewage treatment plant (STP) influents and effluents, surface waters of
rivers and lakes, ground water aquifers and drinking water supplies (Joneset al.
2001). The subject is of public and scientific concern and now makes national news
in leading newspapers (Conner 2008).

25
The presence of PPCPs in the aquatic environment has been reported across
Europe and the US and many therapeutic classes have been detected, including
antibiotics, anticancer drugs, antidepressants, antimicrobials, NSAIDs and
cardiovascular drugs (Heberer 2002a). Pharmacologically active substances enter
the environment from a variety of anthropogenic sources and through different
pathways. Human PPCPs that are excreted or flushed into lavatories and washed
into sewers are released into the aquatic environment continuously by STPs (Ternes
1998). Active pharmaceutical ingredients (APIs) in veterinary pharmaceuticals
deposited on land by treated farm animals can be found in soils and can enter surface
waters through runoff or leach into groundwater (Boxall et al. 2003). Hundreds of
different compounds from a variety of different therapeutic classes have been
detected in soils, lakes, rivers, groundwaters and estuaries in countries across the
globe (Kümmerer 2008). Although their measured concentrations are only in the ng
L-1
to low µg L-1
range, their biological effects and their continuous release into
surface waters from STPs means that aquatic life is chronically exposed to a mixture
of biologically potent chemicals.
As PPCPs are considered less harmful to the environment than other
pollutants including industrial chemicals and pesticides they are not considered as
priority pollutants in the context of the Water Framework Directive (WFD).
However, pharmaceuticals have been responsible for the severe decline of Indian
vultures (Prakash et al. 2003) and some pharmaceuticals have endocrine-disrupting
properties that are responsible for the feminisation of fish (Han et al. 2010;
Mennigen et al. 2010). The personal-care product triclosan degrades into dioxins in
the presence of sunlight and has can bioaccumulate into fish species that are used for
human consumption (Fletcher & McKay 1993).

26
The huge and increasing global PPCP market driven by the need for better
health care has the potential to release thousands of tonnes of new and existing
compounds into the environment. Coupled with the global populations need for
potable drinking water and the potential impacts of climate change leading to a drier
future, the presence of PPCPs in aquatic environments could escalate the need for
advanced management techniques for the prevention and cure of PPCP pollution.
This thesis aimed to further knowledge of the sources and environmental fate of
PPCPs. To improve understanding of the sources that release pharmaceuticals into
the environment, the WFDs approach to water management was used as a
framework to understand how different catchment activities can influence the
quantities and types of drugs released into receiving waters. To gain further insight
into the levels of pharmaceuticals that are released into the environment from
anthropogenic activities, the consumption of pharmaceuticals in care homes and
residential households were investigated. As the concentrations of pharmaceuticals
measured in catchment receiving waters result from catchment specific
anthropogenic activity, it is important to understand the removal of PPCPs from
receiving waters at a catchment level. Therefore, environmental fate studies were
conducted to show how environmental conditions can influence the degradation rates
and removal mechanisms of PPCPs at spatial levels.
1.2. Aim
The aim of this thesis was to improve knowledge of the sources and environmental
fate of PPCPs at catchment levels of the Water Framework Directives (WFDs)
approach to water management. The approach aimed to determine the link between
catchment specific anthropogenic inputs and environmental conditions that

27
ultimately determine environmental concentrations and the mechanisms responsible
for removing PPCPs from the environment. The outcome of the thesis results in
informing and facilitating future catchment management of PPCPs and water policy.
1.3. Objectives
In order to satisfy the aim of this thesis, the following objectives must be achieved:
Review the literature to identify gaps in knowledge and rational for thesis.
Review the source-pathway-receptor linkages for pharmaceutical and personal-
care product pollution at catchment levels.
Develop a catchment framework for pharmaceutical pollution.
Assess the aquatic inputs of lesser studied sources than can contribute to
catchment level pharmaceutical pollution.
Use laboratory experiments to determine the environmental fate of mixtures of
pharmaceutical compounds.
Determine the effects of river water conditions for removing triclosan from the
environment.
To evaluate the evidence in this thesis for future environmental risk assessment
and risk reduction policies.
1.4. Structure of thesis
This thesis is designed to further knowledge of the sources and environmental fate of
pharmaceuticals. Chapter 1 introduces why the subject area of pharmaceuticals in
the environment is important to study, gives the aims and objectives of the thesis and
explains why the following research improves scientific knowledge.

28
In order for this thesis to make a significant contribution to knowledge,
chapter 2 presents the background to the thesis which provides an up to date
assessment of the scientific principles behind pharmaceutical source and
environmental fate research.
Chapter 3 follows on from the scientific principles explained in chapter 2
and focuses in on providing a thorough assessment of source-pathway-receptor
linkages of pharmaceuticals and personal-care products.
Chapters 4 and 5 are assigned to the research based upon the sources for
pharmaceuticals to enter into the environment. In chapter 4, the sources for
pharmaceuticals to enter into the aquatic environment are reviewed in context with
the WFDs catchment strategy for managing water resources. Chapter 5 provides
the details of a source characterisation study using consumption data from residential
households and nursing homes to compare relative emissions to the aquatic
environment.
Chapters 6 and 7 provide the technical part of the thesis and are assigned to
the environmental fate of pharmaceuticals. Chapter 6 presents results for the
collaborative study between Imperial College London and Brixham Environmental
Laboratories to investigate the environmental fate of five pharmaceuticals in the
river Dart catchment and chapter 7 quantifies the degradation mechanisms
responsible for removing triclosan from the river Tamar estuary. This work was
completed at Plymouth Marine Laboratories.
The overall discussion is presented in chapter 8 and summarises the aims
and objectives of the thesis in relation to environmental risk assessment and risk
reduction strategies. Recommendations for further research are highlighted. The
conclusions drawn from the research are presented in chapter 9. The remainder of

29
the thesis provides the reference list and the appendices associated with the
development of the research.
1.5. Significance of thesis
This thesis is designed to contribute to the scientific literature through furthering
knowledge of the sources and environmental fate of pharmaceuticals for
environmental risk assessment and management strategies for minimising the
environmental impacts of pharmaceuticals.
The WFD is used as a source assessment model for investigating
pharmaceutical pollution at a catchment level should pharmaceuticals become
priority pollutants in the future. This holistic approach to source assessment is
important for the development of localised environmental risk assessment that shifts
management strategies from a national level to a localised catchment level. Source
characterisation of drug consumption in residential households and care homes
develops source assessment further through identifying source emissions for source
reduction strategies at a local level.
Catchment source emissions ultimately determine the concentrations of
pharmaceuticals released into receiving waters and it is important to understand the
extent of removal for understanding the persistence of pharmaceuticals in the aquatic
environment. The results of the aquatic fate experiments can be used for improving
current environmental risk assessments for the fate of drugs in the aquatic
environment, and to inform of areas of increased persistence and exposure to aquatic
organisms.
30
CHAPTER TWO: BACKGROUND
This chapter provides the information required to understand the issues surrounding
pharmaceuticals in the environment, under the principles of the Water Framework
Directive and explains the concepts behind the research contained in this thesis.

31
2.1. Water Framework Directive
The EU Water Framework Directive (2000/60/EC) (WFD) came into force in
December 2000 and became part of UK law in December 2003. It replaces previous
water legislation and aims to introduce a simpler legislative approach to the
management of water resources. Although the WFDs approach to water
management does not currently consider pharmaceuticals as priority pollutants,
current priority pollutants are likely to be phased out, suggesting that
pharmaceuticals could be considered in the future, should environmental concerns
increase. The directive will help to protect and enhance the quality of surface
freshwater, groundwaters, groundwater dependent ecosystems, estuaries and coastal
waters out to one mile from low water. The Environment Agency (EA) is the lead
authority in England and Wales and will assess the impact of human activity on the
water bodies within the eleven river basin districts. Water resources in each river
basin district will be chemically and biologically monitored to make assessments on
their current ecological status and from this Programmes of Measures (PoMs) and
River Basin Management Plans (RBMPs) will be developed for the future
management of water resources. Across continental Europe, many catchments
require international cooperation for cross-border management strategies. Chapter 5
presents further detail of the WFD and pharmaceuticals.
2.2. Pharmaceuticals
Pharmaceuticals are a highly diverse class of compounds often with complex
structures that are designed to exhibit a biological effect within the target organism.
Normally, pharmaceuticals are classified according to their therapeutic purpose,
including antibiotics, antidepressants, cardiovascular drugs and NSAIDs. These
32
therapeutic classes can further be classified by their chemical structure e.g. the
therapeutic class antibiotics include penicillins, quinolones, cephalosporins, and
beta-lactams. Pharmaceuticals are used for both human and veterinary purposes and
growing pharmaceutical markets are leading to increased environmental incidence.
2.2.1. Consumption
The global pharmaceutical market is expected to reach a value of US$1.1 trillion in
2014 (IMS 2010) and consumption patterns are linked to the gross domestic product
(GDP) of countries. On a country level, the US has the largest worldwide market
share (52.9%) which was worth US$149.5 billion in 2000 (WHO 2004). The
European pharmaceutical market is worth US$247.5 billion and is expected to
increase by 3-6% by 2013 (IMS 2009). In the UK alone, there are about 3,000
registered pharmaceuticals and approximately 5,000 substances listed as human
pharmaceutical preparations and consumption estimates are between 50 and 150 g
per person per year in industrialised countries (Watts et al. 2007).
In 2007-2008, 785.4 million prescriptions were dispensed in England and
Wales by NHS community pharmacies (National Statistics 2008). Prescription only
medicines (POMs) were calculated to account for 48% of the UK pharmaceutical
market in 2010, while self medication over-the-counter (OTC) drugs and prescribed
OTC drugs account for 41% and 11% of the market share respectively (OTC bulletin
2011). The annual consumption of UK pharmaceuticals in terms of weight indicates
that paracetamol, metformin hydrochloride, ibuprofen, co-codamol and co-proxamol
usage was greater than 100 tonnes per year (Jones et al. 2002; Sebastine & Wakeman
2003).

33
2.3. Pharmaceutical sources
2.3.1. Primary and secondary sources
This thesis categorises sources into primary and secondary routes to the environment
for a greater understanding of the links between pharmaceutical use and
environmental exposure. Primary sources that include manufacturing plants, private
households, hospitals, care homes and prisons are considered as places for the
production and consumption of pharmaceuticals. Human pharmaceuticals are
released from these sources and enter into sewerage systems and accumulate in
secondary sources including STPs, biosolids and landfills. These secondary sources
can also be considered as pathways for releasing pharmaceuticals into the
environment. Veterinary pharmaceuticals used in agriculture and aquaculture are
released into the environment directly from the primary source, hence can also be
considered as direct pathways to the environment. This concept is developed in
further detail in chapter 5.
2.3.2. Residential households and care homes
Even though pharmaceutical use in households is considered to contribute the
highest levels of drugs into the environment (Kümmerer 2009c), little consumption
data or effluent concentration measurements exist. Lin et al. (2008) provides data
for residential household contributions to wastewater and the most detailed case
study for relative contributions across primary and secondary sources. Very little
data exists for pharmaceutical use in care homes even though monthly repeat
prescriptions are supplied for around the clock treatment of acute and chronic illness.
The antibiotic ofloxacin was detected at a concentration of 23.5 µg L-1
in retirement
home effluent (Brown et al. 2006) and Nagarnaik et al. (2010) found a number of

34
therapeutic classes at ng L-1
concentrations from nursing homes. More research is
required for these two sources due to the large number of residential households and
daily use of pharmaceuticals in care homes. This research is presented in chapter 6.
2.4. Pathways into the environment
The pathways for pharmaceuticals to enter the environment are initiated when drugs
are administered to humans and animals at primary sources. Drugs may be
administered via oral (mouth), intramuscular (into the muscle) and intravenous
injection (into a vein), topically (onto the skin), subcutaneously (under the skin),
nasally (nose), pessary (genito-urinary tract) and as a suppository (rectally)
applications. These administration mechanisms introduce pharmaceuticals to the
body and in-situ metabolic processes, mainly in the liver, instigate the
therapeutic/curative effects in target organisms. Phase I (oxidation, reduction and
hydrolysis of parent compounds) and phase II (conjugation of phase I metabolites)
reactions introduce hydrophilic species such as hydroxyl groups to reactive parent
compounds through enzyme catalysed reactions and produce polar compounds.
Drugs are excreted, predominantly through the kidneys but also via faeces, as the
parent compound, metabolites or conjugates (Cunningham 2004). For example,
fluoxetine is extensively metabolised by demethylation in the liver to its primary
active metabolite norfluoxetine (Altamura et al. 1994). Diclofenac is metabolised to
4´-hydroxydiclofenac, 5-hydroxydiclofenac, 3´-hydroxydiclofenac and 4´, 5-
dihydroxydiclofenac in the human body. It is then excreted in the form of
glucuronide and sulphate conjugates, mainly in urine (about 65 per cent) and also in
bile (about 35 per cent) (Davies & Anderson 1997). Amoxicillin is excreted as 80–
90 per cent parent compound and 10–20 per cent metabolites, while chloramphenicol

35
leaves the body as 5–10 per cent unchanged compound and 70–90 per cent as
glucuronides (Hirsch et al. 1999). Excreted or incorrectly disposed parent compound
and metabolites enter into the sewerage system and accumulate at STP influents.
Depending on the partitioning behaviour of the accumulated compounds (Jones et al.
2006) pharmaceuticals will enter the environment via final effluents to receiving
waters (Kolpin et al. 2002) or biosolids to agricultural land (Rooklidge 2004).
Even though manufacture packaging usually recommends returning of out-
of-date medicine to pharmacies for controlled disposal by incineration or landfill,
some drugs are disposed of via household waste. Bound & Voulvoulis (2005)
surveyed 400 households and disposal routes showed most drugs were disposed into
trash bins that increase landfill as a secondary source of pharmaceutical pollution.
As a result, household disposal pathways increase in importance of landfill as a
pathway for pharmaceuticals to enter into the environment.
2.5. Environmental fate
Once medicines are released into the environment, their fate depends on the physical
and chemical properties of the active pharmaceutical ingredients (APIs) and the
properties of the environmental compartments (Gurr & Reinhard 2006; Kümmerer
2008; Liu et al. 2009a). For example, the solubility of the molecule, vapour
pressure, Henry’s Law constant, octanol/water partition coefficients and dissociation
constants determine the fate of pharmaceuticals in aquatic, terrestrial or atmospheric
environments. The acid dissociation constant (pKa) describes the degree of
ionisation of a molecule and is dependent on the pH of the containing solution.
Ionisation states influence the solubility of molecules and the octanol/water partition
coefficient of dissociating pharmaceuticals are described using DOW. A log DOW

36
value of less than one indicates that a pharmaceutical is unlikely to significantly
bioconcentrate or sorb onto organic matter and a value of equal to or greater than
three may significantly sorb or bioconcentrate (Cunningham 2004). For example,
pharmaceuticals including paracetamol and propranolol have log DOW values of < 1
and remain in surface waters (Liu et al. 2009a; Yamamoto et al. 2009). The
partitioning behaviour of nondissociated pharmaceuticals are calculated using the
octanol/water partition coefficient (KOW) and the organic carbon partition coefficient
(KOC) is influenced by particulate size of suspended solids (Karickhoff et al. 1979).
Mefenamic acid has high KOW (5.12) and KOC (2.66) values and is likely to bind to
solids (Jones et al. 2006). KOW is also important for determining the
bioconcentration of compounds (Geyer et al. 1992) and the biosolids/water
distribution coefficient (kd) is used for predicting partitioning of drugs in sewage
sludge.
Hydrolysis (Waterman et al. 2002; El-Gindy et al. 2007), biodegradation
(Kim et al. 2005; Pérez et al. 2005; Quintana et al. 2005) and photodegradation (Lam
& Mabury 2005; Liu & Williams 2007) are the main transformation mechanisms for
the removal of pharmaceuticals in surface waters.
Hydrolysis is the cleavage of a chemical species by water that results in the
loss of a functional group from an electrophilic carbon atom (Waterman et al. 2002).
For instance, the ester type drug etofibrate is susceptible to hydrolysis and
metabolises to 2-hydroxyethyl 2-(p-chlorophenoxy)-2-methylpropanoate and 2-
hydroxyethyl nicotinate (El-Gindy et al. 2007).
Photodegradation can occur on two levels. Direct photodegradation results
from the absorption of photons by the chromophore of a molecule and a chemical
reaction is initiated. The rate of degradation can be calculated from the quantum

37
yield of the reaction and absorption spectra of the molecule (Zepp & Cline 1977).
For example, diclofenac has a quantum yield of 0.094 and has a half live of 39
minutes in deionised water (DIW) while a quantum yield of 0.002 results in a longer
half live of 50 hours for clofibric acid (Packer et al. 2003). In river waters, the
presence of natural sensitising substances can lead to the indirect photodegradation
of certain compounds. After being activated by solar UV photons, dissolved organic
carbon (DOC), nitrate and nitrites can produce reactive oxygen species including
singlet oxygen (102), OH radicals (•OH) and DOC-derived peroxy radicals (
3DOC),
which are able to degrade anthropogenic organic compounds (Zepp et al. 1981; Zepp
et al. 1985). Faster rates of degradation are often observed in natural waters.
Propranolol is reported to have a fast rate of photodegradation in DIW and an even
faster kinetics in natural waters, with half lives of < 24 hours and <10 hours
respectively (Liu & Williams 2007; Piram et al. 2008).
Biodegradation is the breakdown of a chemical by bacteria and is an
important removal process during wastewater treatment process (Jones et al. 2005)
that is dependent on the nature of the compound and bacterial species. For example,
NSAIDs undergo extensive biodegradation during sewage treatment processes.
Paracetamol has been found to decrease in concentration from 0.13 µg L-1
to below
the limit of detection and from 26.1 µg L-1
to 5.99 µg L-1
(Gros et al. 2006).
Diclofenac decreases from an average concentration of 2.33 ng L-1
to 1.56 ng L-1
(Quintana & Reemtsma 2004) and ibuprofen from 7.74 µg L-1
to 1.98 µg L-1
and
from 33.8 µg L-1
to 4.24 µg L-1
(Roberts & Thomas 2006). On the other hand, the
cardiovascular drug propranolol does not biodegrade and most research indicates that
effluent concentrations are higher than measured influent concentrations (Fono &
Sedlak 2005; Gros et al. 2006; Roberts & Thomas 2006). Higher effluent

38
concentrations have also been reported for atenolol (Bendz et al. 2005; Gros et al.
2006). Removal of pharmaceuticals in sewage treatment is incomplete and both
parent compound and metabolites enter receiving waters (Ternes 1998).
Biodegradation also occurs in natural water and rates are affected by bacterial
numbers and species as shown by Yamamoto et al. (2009) who recorded half lives
for paracetamol of 50 hours from the river Tamiya and 1400 hours from the river
Tsumeta.
Liu et al. (2009a) emphasised that both biotic and abiotic transformation
processes may occur in natural surface waters, and they developed a test strategy for
measuring the multiple kinetics of photodegradation, biodegradation and hydrolysis
in river waters simultaneously. This latest research methodology provides a
systematic view of in-stream depletion mechanisms in the aqueous phase. However,
it still remains unclear which degradation mechanisms are most important for the
removal of specific compounds when water matrices compromise different abiotic
and biological parameters. The environmental fate research in this thesis is
presented in chapters 7 and 8.
2.6. Improved analysis techniques and environmental occurrence
The initial detection of environmental concentrations of pharmaceuticals in the
1970’s (Hignite & Azarnoff 1977) coupled with improved analytical techniques led
to the detection of many compounds in STP influents and effluents, surface waters of
rivers and lakes, ground water aquifers and drinking water supplies (Jones et al.
2001).
Solid phase extraction (SPE) is a common technique for extracting analytes
from environmental samples that include sludge and water. The environmental

39
matrix containing the target analytes (mobile phase) is passed through a cartridge
loaded with sorbent packing for adsorbing analytes (stationary phase). The
stationary phase that contains the analytes is dried and the cartridge is flushed with
solvent to produce eluent ready for analysis. Hydrophobic pharmaceuticals can
easily be preconcentrated through reverse phase SPE techniques that require silica
based sorbents but more polar compounds are detected with new Oasis HLB
polymeric sorbets that have a hydrophilic-hydrophobic balance. These have become
the cartridge of choice for multi-residue analysis in environmental matrices (Loos et
al. 2010).
Eluents are separated and analysed using liquid or gas chromatography
techniques. High performance liquid chromatography (HPLC) is usually coupled
with ultra-violet (UV) detection or mass spectrometry (MS) for higher sensitivity
and gas chromatography-mass spectrometry (GC-MS) involves derivatisation of
protonic functional groups to enhance the volatility and thermal stability of the
sample. Improvements in the sensitivity of these techniques including triple
quadrupole mass spectrometry and time-of-flight mass spectrometry (TOFMS) have
allowed the detection of trace concentrations of pharmaceuticals in environmental
matrices. The most recent experiments that detail the methods for determining the
occurrence of pharmaceuticals in environmental matrices are presented in table 1.

40
Table 1. Analytical methods used for determining the occurrence of
pharmaceuticals in environmental matrices
Compound Matrix Location SPE Separation and
detection
Concentration
(ng L-1) or
(ng/g)
Reference
Paracetamol STP influent S. Korea Oasis HLB LCMS 7460 (mean) Behera et al. 2011
Paracetamol STP effluent S. Korea Oasis HLB LCMS 10 (mean) Behera et al. 2011
Ibuprofen Surface fresh water S. Korea Oasis HLB TQMS 23 (mean) Yoon et al. 2010
Naproxen Surface fresh water S. Wales Oasis MCX UPLC-TQMS 5 (mean) Kasprzyk-Hordern
et al. 2008
Salicylic acid Surface marine water Canada Oasis HLB GCMS 36 (mean) Comeau et al. 2008
Ketoprofen Ground water EU Oasis HLB RPLC- ESI-TQMS-MS 26 (mean) Loos et al. 2010
Diclofenac Sediment Hungary Oasis HLB GCMS 5-38 (range) Varga et al. 2010
Naproxen Sediment Hungary Oasis HLB GCMS 2-20 (range) Varga et al. 2010
2.7. Environmental risk assessment
Environmental risk assessment (ERA) is a requirement for the registration of new
medicinal products. It is used for determining the environmental impact and toxicity
of drugs to aquatic organisms. The Food and Drug Administration (FDA) is the
regulatory authority responsible for the ERA of drugs in the USA (FDA 1998).
Should environmental depletion process i.e. hydrolysis and biodegradation
incompletely remove drugs from the aquatic environment and microbial inhibition
tests indicate negative effects, an ERA is necessary and an expected introductory
concentration (EIC) is calculated [Eq 1].
EIC (µg L-1
) = A * B * C * D [Eq 1]
A = amount of active compound produced for direct use (kg year-1
); B = quantity
entering publicly owned treatment works (POTWs) (L day-1
); C = 365 (days per
year); D = conversion factor (109 µg kg
-1). The calculation assumes:
All drug products produced in a year are used and enter the POTW system

41
Drug product usage occurs throughout the United States in proportion to the
population and the amount of waste water generated
There is no metabolism
If the EIC of a drug or its metabolites is shown to be < 1 µg L-1
, no further ERA is
required as the effects to the environment are deemed negligible. On the other hand,
an EIC value of > 1 µg L-1
triggers a fully comprehensive ERA. This includes
further microbial inhibition tests, acute toxicity tests and chronic toxicity tests should
the drug show bioaccumulation potential.
The European Medicines Agency (EMEA) is responsible for ERA in Europe
(EMEA 2006). Phase I of the tiered approach acts as a pre-screening tool to estimate
risk exposure through calculating a PEC value [Eq 2].
DOSEai * Fpen [Eq 2]
PEC (mg L-1
) SURFACEWATER =
WASTEWinhab * DILUTION
DOSEai = maximum daily dose consumed per inhabitant (mg inh-1
d-1
); Fpen =
percentage of market penetration (1%) WASTEWinhab = amount of wastewater per
inhabitant per day (200 L inh-1
d-1
); DILUTION = Dilution factor (10). The
calculation of the PEC in surface water makes the following assumptions:
A fraction of the overall market penetration (market penetration factor Fpen)
within the range of existing medicinal products. The applicant may use the
default value or refine the Fpen by providing reasonably justified market
penetration data based on published epidemiological data [Eq 3].
The predicted amount used per year is evenly distributed over the year and
throughout the geographic area.

42
The sewage system is the main route of entry of the drug substance into the
surface water; there is no biodegradation or retention of the drug substance in the
STP.
Metabolism in the patient is not taken into account.
Consumption * 100 [Eq 3]
Fpen [%] =
DDD * Inhabitants * 365
Consumption = sales of drug substances per annum in geographical area (mg y-1
);
DDD = defined daily dose per patient in geographical area (mg d-1
* inhab) (WHO
2001); Inhabitants = number of people in geographical area; 365 (d y-1
). If the
PECSURFACEWATER value is below 0.01µg L-1
and no other environmental concerns
are apparent, it is assumed that the medicinal product is unlikely to represent a risk to
the environment following its prescribed use in patients. However, should the
calculated value for PECSURFACEWATER exceed 0.01µg L-1
, the Phase II environmental
fate and effects analysis is initiated.
Phase II consists of two tiers and Phase IIA reviews the physicochemical
properties of the drug to determine the extent of removal or accumulation in the
environment. The potential for the drug to bioaccumulate with a logKOW > 4.5
initiates specific risk assessment for persistence, bioaccumulation and toxicity
(PBT). In addition, the aquatic effects study requires long term standard toxicity
tests using algae, daphnia and fish species to calculate a predicted no-effect
concentration (PNEC) in water. A PNEC is estimated by dividing the lowest no-
observed-effect concentration (NOEC) for the most sensitive species by an
assessment factor (AF) (Carlsson, Johansson, Alvan, Bergman & Kühler 2006a;
Carlsson, Johansson, Alvan, Bergman & Kühler 2006b). A higher AF value is used

43
in the NOEC calculation when toxicological data is limited. At the end of Phase IIA,
the risk characterisation ratio PEC:PNEC is calculated. A ratio of less than 1
indicates that further testing is not necessary as the drug substance is unlikely to
present a risk to the environment. A ratio of greater than 1 requires an extended
environmental fate and effects analysis to be carried out in Phase IIB. This includes
assessing the extent of drug removal in the environment, further chronic toxicity
tests of at least one of algae, daphnia and fish and refinement of PEC for local
surface water concentration that incorporates human metabolism and environmental
removal [Eq 4].
[Eq 4]
Elocalwater * Fstpwater
PEC (mg L-1
) SURFACEWATER =
WASTEWinhab * CAPACITYstp * FACTOR * DILUTION
Fstpwater = the fraction of emission directed to surface water; CAPACITYstp = the
capacity of local STP (inh); FACTOR = Factor taking the adsorption to suspended
matter into account. Elocalwater is the local emission to wastewater of the relevant
residue [Eq 5] where Fexcreta = the fraction of active ingredient excreted after human
metabolism.
Elocalwater = DOSEai * Fexcreta * Fpen * CAPACITYstp [Eq 5]
2.8. Modelling
Modelling requires the development of conceptual models for predicting spatially
explicit concentrations of environmental pollutants. On the basis of data from
previous measurements models can replace further time consuming and expensive

44
environmental analysis. However, many models inaccurately predict environmental
concentrations (Bound & Voulvoulis 2006), which suggests the need for more data
in order to understand localised conditions that can influence the presence,
persistence and fate of pharmaceutical compounds. Robinson et al. (2007) suggested
the importance of changing cloud cover, river conditions and phototransformation
rates when using PhATE and GREAT-ER models for predicting environmental
concentrations of propranolol under direct phototransformation conditions.

45
CHAPTER THREE: LIFE-CYCLE OF PHARMACEUTICALS AND
PERSONAL-CARE PRODUCTS
This chapter highlights the source-pathway-receptor linkages for pharmaceuticals
and personal-care products in the environment. Antibiotics, antidepressants,
cardiovascular drugs, non-steroidal anti-inflammatory drugs and phthalates were
used to demonstrate the potential impacts on the environment and human health.

46
3.1. Introduction
3.1.1. Pharmaceuticals
The earliest pharmaceuticals appear to have been plants, which
palaeopharmacological studies indicate were used to treat illness since prehistoric
times (Ellis 2000). The earliest compilation to describe the medicinal properties of
plant species is thought to be the Sushruta Samhita, an Indian Ayurvedic treatise
attributed to Sushruta, the father of surgery, in the sixth century BC (Dwivedi &
Dwivedi 2007). Further descriptions of the therapeutic effects of plant extracts,
animal parts and minerals are given by Pedanius Dioscorides in the book Materia
Medica, published in the first century AD. The Divine Farmer’s Materia Medica,
which is thought to have been compiled around 960–1280 AD, includes hundreds of
plant and animal medicines discovered and researched by Shen Nong (also known as
the Yan emperor), the legendary ruler of China six thousand years ago (Yang 1998).
Other contributions to the Materia Medica were made by Islamic physicians, and the
book remains one of the most influential texts on herbal medicine (Rashed 1996).
Ancient Chinese medicine used various plants and minerals to treat illnesses,
including low mood, fevers and back pain. For example, Dichroa febrifuga, an
evergreen shrub that grows in Nepal and China, is one of the fifty most important
plants in traditional Chinese herbalism. The powerful antimalarial alkaloids
contained in its roots and leaves have been used to treat fevers since at least the first
century AD (Manandhar 2002). Aloe vera, recorded in Dioscorides’ De Materia
Medica, is used today for the treatment of burns and wounds (Volger & Ernst 1999).
The North American Plains Indians used species of Echinacea for its general
medical properties (Wishart 2007).

47
The era of modern Western pharmacology probably dates from the early
nineteenth century, when small molecules and a series of alkaloids, including
morphine, quinine, caffeine and later cocaine, were isolated and purified for
medicinal use. By 1829, scientists had identified the compound salicin in willow,
and by the end of the nineteenth century, acetylsalicylic acid had been patented by
Bayer as aspirin. The discovery of the potent antibiotic, penicillin, by Fleming in
1928 and its development by Chain, Florey and Heatley in the 1940s marked another
important milestone in the development of the modern pharmaceutical industry.
More recently, drug molecules, often known as designer drugs, have been developed,
such as ondansetron (an antinausea drug), ibuprofen (a non-steroidal anti-
inflammatory drug, NSAID) and many selective serotonin re-uptake inhibitors
(SSRIs) for the treatment of depression.
Pharmaceuticals are used for both human and veterinary purposes. Most
pharmaceuticals have been of great value in the treatment of illness and the
alleviation of pain and distress. However, since the 1990s, there have been
increasing concerns about their presence and pseudo-persistence in the environment,
and their potential effects on wildlife and human health (Halling-Sørensen et al.
1998; Daughton & Ternes 1999; Heberer 2002a). For example, the feminisation and
masculinisation of fish in many rivers downstream of sewage treatment plants
(STPs) has been attributed to the presence of natural and synthetic steroid
oestrogens, including ethinyl estradiol (EE2), and possibly the interaction of these
drugs with other endocrine-disrupting compounds (EDCs) such as polychlorinated
biphenyls (PCBs), pharmaceuticals and surfactants (Vos et al. 2000; Jobling 2004;
Hinck et al. 2009).

48
Pharmacologically active substances enter the environment from a variety of
anthropogenic sources and through different pathways. Human pharmaceuticals that
are excreted or flushed into lavatories are released into the aquatic environment
continuously by STPs (Ternes 1998). Active pharmaceutical ingredients (APIs) in
veterinary pharmaceuticals deposited on land by treated farm animals can be found
in soils and can enter surface waters through runoff or leach into groundwater
(Boxall et al. 2003). Hundreds of different compounds from a variety of different
therapeutic classes have been detected in soils, lakes, rivers, groundwaters and
estuaries in countries across the globe (Kümmerer 2008). Although their measured
concentrations are only in the ng L-1
to low µg L-1
range, their biological effects and
their continuous release into surface waters from STPs means that aquatic life is
chronically exposed to a mixture of biologically potent chemicals.
Excreted and incorrectly disposed compounds can be detected in the
environment as parent compounds, metabolites or conjugates (Ternes 2000;
Kümmerer 2004a). Some conjugates can be converted back to the active compounds
by bacterial action in STPs (Jones et al. 2001). Furthermore, depending on the
properties of the APIs and the nature of the receiving environment, APIs can also
undergo biotic and abiotic transformation processes both in the environment (Liu &
Williams 2007; Liu et al. 2009a) and during waste-water treatment (Escher et al.
2010). For example, biodegradation and photodegradation can produce
transformation products that coexist with the parent APIs in STPs and in the
environment, so it is important that the ecological effects of the reaction mixtures
should be to be understood (Liu et al. 2009a). The ecotoxicology of many APIs is
poorly understood, but data for the chronic effects of individual pharmaceuticals and

49
their mixtures is mounting (Crane et al. 2006, Giltrow et al. 2009, Haeba et al. 2008,
Han et al. 2010, Quinn et al. 2008, Winter et al. 2008).
Pharmaceuticals for veterinary use in the EU have been regulated since the
1990s and their assessment and authorisation is similar to that of agrochemicals.
Regulation or approval of human pharmaceuticals is based on efficacy, safety,
residues and quality control of the engineering and manufacturing processes; it
varies between different countries and regions. New EU guidelines for testing the
environmental impacts of human pharmaceuticals have been published by the
European Medicines Agency (EMEA 2006). They are based on principles similar to
those used for testing other chemicals under the new EU Registration, Evaluation,
Authorisation and restriction of CHemicals legislation (REACH 2008). Hence both
hazard assessment, i.e. PBT (persistence, bioaccumulation and toxicity), CMR
(carcinogenicity, mutagenicity and reproductive toxicity) and risk assessment are
used. However, the general perception is that this legislation is implemented less
strictly for human pharmaceuticals than for industrial chemicals. Environmental
data alone would not be sufficient to have a pharmaceutical restricted or banned,
because the benefits of pharmaceuticals to humans are considered to outweigh their
potential risks to the environment. Furthermore, most pharmaceuticals assessed so
far by the Swedish Association of the Pharmaceutical Industry show predicted
environmental concentration / predicted no-effect concentration (PEC / PNEC) ratios
less than one (FASS 2008).
3.1.2. Personal-care products
Personal care products (PCPs) include a diverse group of chemicals, such as
additives, fragrances, preservatives and surfactants, contained in cosmetics, toiletries

50
and other household cleaning products. They are considered together with human
pharmaceuticals mainly because of the similarity of their release from humans and
their ubiquitous presence in surface waters (Boyd et al. 2003). Furthermore, some
PCPs, such as surfactants, have similar physical and chemical (but not biological)
properties to pharmaceuticals, i.e. they are ionisable compounds with one or more
pKa values. Phthalates, for example, have a wide range of uses in PCPs depending
on their chain lengths and degree of branching. It is important to consider whether
exposure to PCPs is sufficiently significant to cause harm to wildlife or human
health, and a risk-based approach is needed to assess their safety.
EU and US regulations currently have different approaches to the treatment
of PCP ingredients. The components of PCPs are covered by the new REACH
regulation for chemicals in the EU (REACH 2008), which includes hazard and
environmental risk assessment. However, the US law does not presently require the
disclosure of chemical ingredients in PCPs. In one survey, nearly 100 volatile
organic compounds (VOCs), of which ten are regulated in the US as toxic or
hazardous chemicals, were found in six samples of fresheners and laundry products
(Steinemann 2009). The problem is compounded by the frequent lack of material
safety data sheets (Barrett 2005).
In this chapter, we examine the potential impacts of pharmaceuticals and
personal-care products (PPCPs) on the environment and human health. The
examples used include antibiotics, NSAIDs, cardiovascular drugs, antidepressants
and phthalates. The selection criteria are based on their difference in molecular
structure, mode of action and therapeutic groups. Data on individual compounds for
the specific therapeutic classes are used to demonstrate the potential hazards and
risks of PPCPs in the environment generally.

51
3.2. Hazardous properties
Pharmaceutical substances are designed to have a biological effect when
administered to humans and animals. One key drug design consideration is to have
the appropriate pharmacokinetics, such as a half-life of hours in the body (at stomach
pH ~2) in order to have the effect required. This means that APIs are normally
resistant to biodegradation at a pH less than four. Drug safety mainly refers to
ensuring, as much as possible, that the only effects of the drug are those for ‘curing’
or suppressing the symptoms of diseases. However, sometimes drugs may have
undesirable side effects. Conventional STP techniques are designed for removing
organic molecules, nutrients and heavy metals but may not be effective in removing
micro-pollutants, such as pharmaceuticals. Since patients are continually releasing
pharmaceuticals into the sewage system, APIs are often detected in surface waters
and there is increasing concern about their potential chronic toxicological effects on
aquatic species. This section outlines some of the hazardous side effects that PPCPs
can have on humans; their effects on other species in the environment are discussed
later in physiological effects.
3.2.1. Antibiotics
Antibiotics kill or inhibit the growth of bacteria. They are a hugely diverse group of
chemicals that can be divided into subgroups such as -lactams, tetracyclines,
macrolides, quinolones and sulphonamides; some occur naturally in the
environment. These complex molecules are used for the prevention and treatment of
diseases in humans, farmed animals and aquaculture (Sarmah et al. 2006).
Depending on the therapeutic class of antibiotic administered, general
gastrointestinal side effects, such as diarrhoea, nausea, vomiting and abdominal pain

52
may occur, while headache, dizziness and restlessness are associated central nervous
system (CNS) effects. Moreover, failure to complete a course of prescribed
antibiotics can lead to the build up of resistance, while overuse can reduce healthy
bacteria in the gastrointestinal system, leaving users prone to further infections.
For example, two patients treated with ciprofloxacin have been reported to
have developed acquired transitory von Willebrand syndrome, which causes
difficulty in blood clotting (Castaman et al. 1995) and in addition to the known
gastrointestinal upsets associated with clarithromycin, an elderly patient also
developed thrombocytopenic purpura, causing the blood not to clot properly (Oteo et
al. 1994).
3.2.2. Antidepressants
Antidepressants are used to treat mood disorders such as depression or dysthymia.
They are classified into different groups, depending on their structure or the central
neurotransmitters they act upon. Before the 1950s, opiates and amphetamines were
used as antidepressants (Weber & Emrich 1988), but they were superseded by
monoamine oxidase inhibitors (MAOIs) and, more recently, by selective serotonin
reuptake inhibitors (SSRIs) and serotonin-noradrenalin reuptake inhibitors (SNRIs).
Antimuscarinic side-effects, including dry mouth and constipation, are
associated with taking antidepressants. Drowsiness is also a common side effect,
and in some cases insomnia may occur. Adverse neurological effects include
headache, peripheral neuropathy, tremors and tinnitus; while gastrointestinal side
effects include stomatitis and gastric irritation with nausea and vomitting.
Abnormal platelet aggregation has been noted as a side effect of fluoxetine
given to a severely underweight patient (Alderman et al. 1992). Hyponatraemia and
53
the syndrome of inappropriate secretion of an antidiuretic hormone (SIADH) have
been reported in over 700 cases, yet over 10 million patients are exposed to SSRIs
worldwide, suggesting that side effects are negligible (Liu et al. 1996).
3.2.3. Cardiovascular drugs
Cardiovascular drugs are a diverse group of chemicals that are used for treating
disorders of the cardiovascular system. Calcium-channel blockers are used primarily
for the dilation of coronary and peripheral arteries and arterioles. Beta-blockers act
by competitively inhibiting beta1 and beta2 receptor subtypes and are used for
hypertension and the prevention and treatment of heart attacks.
Depending on the specific beta-blocker drug, side effects occur because of
the selective or non-selective inhibition of beta2 receptors, which are found mainly in
non-cardiac tissue, including bronchial tissue, peripheral blood vessels, the uterus
and the pancreas. The most serious adverse effects are heart failure, heart block and
bronchospasm. Adverse effects of calcium-channel blockers include effects on the
vasodilatory system, such as dizziness, flushing, headache, hypotension and
palpitations.
Treatment of patients with nifedipine, a dihydropyridine calcium-channel
blocker, significantly reduces the ability of platelets to aggregate (Ośmiałowska et al.
1990) and four patients who underwent routine coronary bypass surgery while
receiving nifedipine suffered sudden circulatory collapse (Goiti 1985). A patient
taking the beta-blocker atenolol for coronary thromboses developed retroperitoneal
fibrosis (Johnson & McFarland 1980), and atrial fibrillation was induced in six out
of twelve predisposed patients after intravenous injection with 2.5 mg atenolol
(Rasmussen et al. 1982).

54
3.2.4. Non-steroidal anti-inflammatory drugs
NSAIDs are a group of unrelated organic acids that have analgesic, anti-
inflammatory and antipyretic properties. Most NSAIDs act by inhibiting both
isomers of the cyclo-oxygenase enzymes, which results in the direct inhibition of the
biosynthesis of prostaglandins and thromboxanes from arachidonic acid (Vane &
Botting 1998). Inhibition of COX-2, the enzyme responsible for inflammation, is
thought to be responsible for delivering some of the therapeutic effects of NSAIDs,
whereas inhibition of COX-1 is thought to produce some of their toxic effects.
The most common side effects of NSAIDs are associated with
gastrointestinal disturbances such as nausea and diarrhoea, and CNS-related side
effects including headache, tinnitus, depression and insomnia. Anaemia’s and
thrombocytopenia are also associated with use of the drugs. Hughes & Sudell
(1983) reported a rare case of a patient developing haemolytic anaemia after a two-
week course of naproxen, and Roderick et al. (1993) showed that aspirin can cause a
multitude of symptoms including haematemesis, melaena, bloody stools and ulcers,
albeit at low frequencies.
3.2.5. Phthalates
Phthalates are used to increase the flexibility and durability of plastics in the enteric
coatings of pharmaceutical pills and in time-release mechanisms of pharmaceutical
capsules. They are used in a range of cosmetics and as solvents in PCPs (Barrett
2005; Rudel & Perovich 2009). The main phthalates in PCPs are dibutyl phthalate in
nail polish, diethyl phthalate in perfumes and lotions, and dimethyl phthalate in hair
spray (Barrett 2005), while dibutyl phthalate and diethyl phthalate are used in
pharmaceutical formulations (Hernández-Díaz et al. 2009).

55
Patients using the ulcerative colitis drug asacol showed levels of monobutyl
phthalate, a metabolite of dibutyl phthalate (DBP), 50 times higher than the mean for
non-users in the urinary system (Hernández-Díaz et al. 2009). It has been found that
adult men with average amounts of phthalates in their urine had lower levels of
testosterone and oestrogen in their blood (Meeker et al. 2008), and research by Swan
et al (2008) indicates the antiandrogenic properties of phthalates. This has been
suggested to be a factor in testicular dusgenesis syndrome, which, in the worst cases,
is linked to testicular cancer.
3.3. Anthropogenic sources
A detailed overview of human and veterinary pharmaceutical sources is given by
(Ruhoy & Daughton 2008) and the importance of secondary sources has also been
suggested (Daughton & Ruhoy 2009). The principal sources for human
pharmaceuticals to enter the environment are from residential, industrial and
commercial services that are connected to the sewerage system. Pharmaceuticals are
produced and consumed in manufacturing plants, private households, hospitals, care
homes and prisons and source effluents are released into the sewerage system.
Pharmaceuticals and accumulate at sewage treatment plants (STPs) and landfills, and
are subsequently released into the environment. Veterinary pharmaceuticals enter
the environment directly from farm animals and aquaculture. Human
pharmaceuticals may be introduced into agricultural land via the application of
biosolids to fields, while both human and veterinary pharmaceuticals can be disposed
to landfill sites (Figure 1).

56
Figure 1. Primary sources of human and veterinary pharmaceuticals in the
environment
3.3.1. Antibiotics
Worldwide antibiotic consumption has been estimated to be between 100,000 and
200,000 tonnes per annum (Wise 2002) for use in both human and veterinary
medicine. Several hundred different antibiotic substances are used extensively in
human and veterinary medicine and aquaculture, with considerable potential for
contamination of the environment. Measured concentrations of antibiotics in source
effluent are detailed in Table 2.
In Western countries, manufacturing plants are not considered a major source
of antibiotics in the environment because of the on-site treatment of production
waste water. In contrast, the environmental standards for manufacturing
pharmaceuticals in developing countries is often not regulated (Larsson & Fick
2009), and many classes of antibiotics have been detected in effluent at high mg L-1
ENVIRONMENT
Hospitals
Prisons
Residential
Care homes
Manufacturing
Agriculture
Aquaculture
Biosolids Landfill

57
concentrations (Larsson et al. 2007; Li et al. 2008a,b; Lin et al. 2008; Lin & Tsai
2009).
Antibiotics that are used to treat humans are mostly dispensed as
prescriptions from pharmacies or as a treatment in hospitals. However, in some
countries (e.g. China, Spain and Mexico), antibiotics can be purchased over the
counter. It is reported that community (i.e. not hospital) use of antibiotics in the UK
is about 70 per cent (House of Lords, 1998) and 75 per cent in the US (Wise 2002).
In Germany, about 75 per cent of antibiotics are used in the community while 25 per
cent are used in hospitals (Kümmerer & Henninger 2003). Thomas et al. (2007)
found that only 10 per cent of selected antibiotics detected in a local STP in Oslo
came from hospitals. The measured concentrations of antibiotics in hospital waste
water is often in the ng L-1
range (Lin et al. 2008; Lin & Tsai 2009), but some APIs
have been measured in mg L-1
concentrations (Hartmann et al. 1998; Gómez et al.
2006; Thomas et al. 2007; Brown et al. 2006). Measured concentrations from
residential drains are more scarce, although Lin et al. (2008), found various
antibiotics at concentrations in the range low ng L-1
to low µg L-1
, and Brown et al.
(2006) reported measured µg L-1
concentrations of ofloxacin in residential facilities
in New Mexico.
Agricultural contributions come from the use of antibiotics in veterinary
medicine and plant agriculture. Antibiotics are administered for the treatment of
infections in domesticated animals in veterinary surgeries, and treatment is often
continued on the farm. Streptomycin and oxytetracycline are primarily used for fruit
crops, but in the USA antibiotics applied to plants account for less than 0.5 per cent
of total antibiotic use (McManus et al. 2002).

58
The livestock industry has intensified over the last few decades and operates
concentrated animal feeding operations (CAFOs) for the production of human food
from beef and dairy cattle, pigs, sheep and poultry. Pharmaceutical compounds
including antibacterial and antimicrobial agents are administered at therapeutic doses
for disease treatment and at non-therapeutic doses for growth promotion and
increased food efficiency (Bloom 2001). Depending on the volume of
pharmaceutical compounds used, CAFOs can generate large volumes of wastes,
containing compounds that can pose risks to ecosystems and human health (Lee et al.
2007). Various antibiotic classes, including sulphonamides and lincosamides have
been detected in the environment in the USA and Australia, derived from dairy farms
(Fisher & Scott 2008; Brown et al. 2006).
The use of antibiotics for therapeutic purposes and as prophylactic agents in
aquaculture for the production of molluscs, crustaceans, fish and aquatic plants is the
most direct release of antibiotics into the aquatic environment. Only a small number
of compounds are approved for the treatment of fish, including amoxicillin,
flumequine, oxytetracycline, sulphamerazine and thiamphenicol (Lalumera et al.
2004), which are often administered as feed additives or by injection (Bloom 2001).
These substances are most commonly detected in the sediment below fish-farming
structures (Jacobsen & Berglind 1988; Björklund et al. 1990, 1991; Coyne et al.
1994).
Municipal landfill sites are often used for the disposal of household and
industrial wastes. Although modern landfill sites are designed to collect and reduce
the leachate produced from the decomposition of waste and rainwater, the toxicity
and treatment of the leachate produced is of concern (Visvanathan et al. 2007).
Moreover, older landfill sites that do not recover leachate can leach pollutants

59
directly to soil and surrounding watercourses. Antibiotics have been detected in
leachate plumes, often at ng L-1
to g/l concentrations; mg L-1
concentrations have
also been detected (Barnes et al. 2004; Holm et al. 1995).
Table 2. Measured concentrations (µg L-1
) of antibiotics in effluent
Source
Therapeutic
class
Compound Concentration Reference
Manufacturing plant (Croatia) Sulphonamide Sulphaguanidine >1100 Babić et al., 2007
Manufacturing plant (Croatia) Sulphonamide Sulphamethazine >400 Babić et al., 2007
Manufacturing plant (India) Quinolone Ciprofloxacin 28,000–31,000 Larsson et al., 2007
Manufacturing plant (India) Quinolone Enrofloxacin 780–900 Larsson et al., 2007
Manufacturing plant (Taiwan) Cephalosporin Cephalexin 0.027 (median) Lin et al., 2008
Manufacturing plant (Taiwan) Cephalosporin Cephradine 0.001 (median) Lin et al., 2008
Manufacturing plant (Taiwan) Tetracycline Oxytetracycline 0.023 (median), 7.44 (max) Lin & Tsai, 2009
Manufacturing plant (Taiwan) Tetracycline Tetracycline 0.025 (median), 9.66 (max) Lin & Tsai, 2009
Hospitals (New Mexico) Quinolone Ofloxacin 4.9–35.5 Brown et al., 2006
Rikshospitalet hospital (Norway) Quinolone Ciprofloxacin 14.0 (median), 39.8 (max) Thomas et al., 2007
Ullevål hospital (Norway) Quinolone Ciprofloxacin 24.0 (median), 54.0 (max) Thomas et al., 2007
Hospitals (Spain) Macrolide Erythromycin 0.025 (mean), 0.01– 0.03 Gómez et al., 2006
Hospitals (Switzerland) Quinolone Ciprofloxacin 2– 83 Hartmann et al., 1998
Hospitals (Taiwan) Imidazole Metronidazole 1.59 (median) Lin et al., 2008
Hospitals (Taiwan) Tetracycline Tetracycline 0.089 (median), 0.455 (max) Lin and Tsai, 2009
Regional discharges (Taiwan) Penicillin Ampicillin 0.042 (median) Lin et al., 2008
Regional discharges (Taiwan) Cephalosporin Cefazolin 5.89 (median) Lin et al., 2008
Regional discharges (Taiwan) Imidazole Metronidazole 0.314 (median) Lin et al., 2008
Regional discharges (Taiwan) Quinolone Nalidixic acid 0.178 (median) Lin et al., 2008
Animal husbandries (Taiwan) Cephalosporin Cefazolin 0.053 (median) Lin et al., 2008
Animal husbandries (Taiwan) Lincosamide Lincomycin 56.8 (median) Lin et al., 2008
Dairy farm (Australia) Penicillin Nalidixic acid 0.00094– 0.173 Fisher & Scott, 2008
Dairy farm (Australia) Sulphonamide Sulphasalazine 0.076–0.321 Fisher & Scott, 2008
Dairy (New Mexico) Lincosamide Lincomycin 0.7–6.6 Brown et al., 2006
Swine farm (Malaysia) Sulphonamide Sulphamethoxyp
yridazine
0.00512–0.0950 Malintan & Mohd, 2006

60
3.3.2. Antidepressants
Between 1975 and 1988, antidepressant prescriptions more than doubled in the UK,
with a total of 23.4 million prescriptions issued by GPs (Middleton et al. 2001).
Sertraline and fluoxetine were the two most prescribed generic antidepressants in
2007 (Verispan 2007). As they are mostly prescribed for human use, they enter into
the environment through STPs. However, some antidepressants are also used for the
treatment of animals and may enter into the environment through leaching and run-
off (Vogel et al. 1986).
Fluoxetine, a selective serotonin re-uptake inhibitor, has been detected in ng
L-1
concentrations from various sources including drug production facilities, landfill
waste water and effluent from animal husbandries (Barnes et al., 2004; Lin et al.,
2008). Gómez et al. (2006) and Lin et al. (2008) detected carbamazepine at ng L-1
concentrations in a variety of sources including hospital waste waters, and high
concentrations of citalopram were measured (770–840 µg L-1
) from drug-production
facilities in India (Larsson et al. 2007) (Table 3).
Table 3. Measured concentrations (µg L-1
) of antidepressants in effluent
Source
Therapeutic
class
Compound Concentration Reference
Manufacturing plant (India) Antidepressants Citalopram 770–840 Larsson et al., 2007
Manufacturing plant (Taiwan) Antidepressants Carbamazepine 7.81 (median) Lin et al., 2008
Manufacturing plant (Taiwan) Antidepressants Fluoxetine 0.154 (median) Lin et al., 2008
Manufacturing plant (Taiwan) Antidepressants Paroxetine 0.003 (median) Lin et al., 2008
Hospitals (Spain) Antidepressants Carbamazepine 0.03–0.07, 0.04 (mean) Gómez et al., 2006
Hospitals (Taiwan) Antidepressants Carbamazepine 0.163 (median) Lin et al., 2008
Regional discharges (Taiwan) Antidepressants Carbamazepine 0.138 (median) Lin et al., 2008
Animal husbandries (Taiwan) Antidepressants Carbamazepine 0.003 (median) Lin et al., 2008
Animal husbandries (Taiwan) Antidepressants Fluoxetine 0.013 (median) Lin et al., 2008
Landfill (Oklahoma) Antidepressants Fluoxetine 0.018 Barnes et al., 2004

61
3.3.3. Cardiovascular drugs
The most likely sources for cardiovascular drugs entering into the environment are
hospitals, care homes and residential areas (Table 4). The concentrations measured
in hospital waste waters are usually in the ng L-1
range, with a few reported cases of
µg L-1
concentrations (Gómez et al. 2006; Larsson et al. 2007; Thomas et al. 2007;
Lin et al. 2008; Lin & Tsai 2009). Measured concentrations of atenolol in residential
areas in Taiwan were 1.03 µg L-1
(Lin et al. 2008). The highest recorded source
concentrations were from drug-production facilities in India, where the angiotensin
II receptor antagonist losartan was measured at 2,400–2,500 µg L-1
and metoprolol
concentrations were 800–950 µg L-1
(Larsson et al. 2007). In comparison, atenolol
and acebutolol were present in only ng L-1
concentrations from drug production
facilities in Taiwan (Lin et al. 2008).
Table 4. Measured concentrations (µg L-1
) of cardiovascular drugs in effluent
Source Therapeutic class Compound Concentration Reference
Manufacturing plant (India) Cardiovascular drug Losartan 2400–2500 Larsson et al., 2007
Manufacturing plant (India) Cardiovascular drug Metoprolol 800–950 Larsson et al., 2007
Manufacturing plant (Taiwan) Cardiovascular drug Acebutolol 0.006 (median) Lin et al., 2008
Manufacturing plant (Taiwan) Cardiovascular drug Atenolol 0.016 (median) Lin et al., 2008
Manufacturing plant (Taiwan) Cardiovascular drug Propranolol 63.9 (max) Lin & Tsai, 2009
Manufacturing plant (Taiwan) Cardiovascular drug Salbutamol 0.001 (median) Lin et al., 2008
Manufacturing plant (Taiwan) Cardiovascular drug Tulobuterol 0.001 (median) Lin et al., 2008
Rikshospitalet hospital (Norway) Cardiovascular drug Metoprolol 3.41 (median), 25.097 (max) Thomas et al., 2007
Ullevål hospital (Norway) Cardiovascular drug Metoprolol 0.591 (median), 2.232 (max) Thomas et al., 2007
Hospital (Spain) Cardiovascular drug Atenolol 0.1–122, 3.4 (mean) Gómez et al., 2006
Hospital (Spain) Cardiovascular drug Propranolol 0.2–6.5, 1.35 (mean) Gómez et al., 2006
Hospitals (Taiwan) Cardiovascular drug Acebutolol 0.185 (median) Lin et al., 2008
Hospitals (Taiwan) Cardiovascular drug Atenolol 1.61 (median) Lin et al., 2008
Hospitals (Taiwan) Cardiovascular drug Metoprolol 0.145 (median) Lin et al., 2008
Hospital (Taiwan) Cardiovascular drug Propranolol 0.054 (median), 0.225 (max) Lin & Tsai, 2009
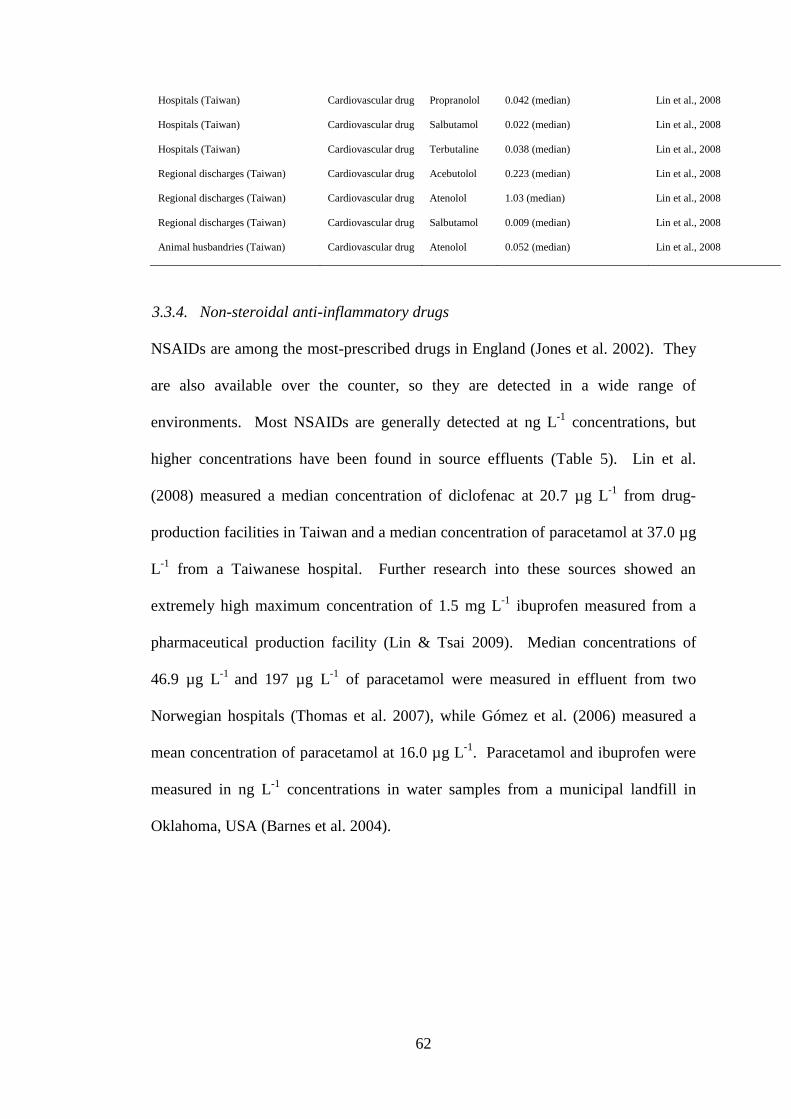
62
Hospitals (Taiwan) Cardiovascular drug Propranolol 0.042 (median) Lin et al., 2008
Hospitals (Taiwan) Cardiovascular drug Salbutamol 0.022 (median) Lin et al., 2008
Hospitals (Taiwan) Cardiovascular drug Terbutaline 0.038 (median) Lin et al., 2008
Regional discharges (Taiwan) Cardiovascular drug Acebutolol 0.223 (median) Lin et al., 2008
Regional discharges (Taiwan) Cardiovascular drug Atenolol 1.03 (median) Lin et al., 2008
Regional discharges (Taiwan) Cardiovascular drug Salbutamol 0.009 (median) Lin et al., 2008
Animal husbandries (Taiwan) Cardiovascular drug Atenolol 0.052 (median) Lin et al., 2008
3.3.4. Non-steroidal anti-inflammatory drugs
NSAIDs are among the most-prescribed drugs in England (Jones et al. 2002). They
are also available over the counter, so they are detected in a wide range of
environments. Most NSAIDs are generally detected at ng L-1
concentrations, but
higher concentrations have been found in source effluents (Table 5). Lin et al.
(2008) measured a median concentration of diclofenac at 20.7 µg L-1
from drug-
production facilities in Taiwan and a median concentration of paracetamol at 37.0 µg
L-1
from a Taiwanese hospital. Further research into these sources showed an
extremely high maximum concentration of 1.5 mg L-1
ibuprofen measured from a
pharmaceutical production facility (Lin & Tsai 2009). Median concentrations of
46.9 µg L-1
and 197 µg L-1
of paracetamol were measured in effluent from two
Norwegian hospitals (Thomas et al. 2007), while Gómez et al. (2006) measured a
mean concentration of paracetamol at 16.0 µg L-1
. Paracetamol and ibuprofen were
measured in ng L-1
concentrations in water samples from a municipal landfill in
Oklahoma, USA (Barnes et al. 2004).

63
Table 5. Measured concentrations (µg L-1
) of NSAIDs in effluent
Source
Therapeutic
class
Compound Concentration Reference
Manufacturing plant (Taiwan) NSAID Paracetamol 0.009 (median) Lin et al., 2008
Manufacturing plant (Taiwan) NSAID Paracetamol 0.124 (median), 418 (max) Lin and Tsai, 2009
Manufacturing plant (Taiwan) NSAID Diclofenac 20.7 (median) Lin et al., 2008
Manufacturing plant (Taiwan) NSAID Diclofenac 0.053 (median), 229 (max) Lin and Tsai, 2009
Manufacturing plant (Taiwan) NSAID Famotidine 0.025 (median) Lin et al., 2008
Manufacturing plant (Taiwan) NSAID Fenbufen 0.031 (median) Lin et al., 2008
Manufacturing plant (Taiwan) NSAID Ibuprofen 0.101 (median) Lin et al., 2008
Manufacturing plant (Taiwan) NSAID Ibuprofen 45.9 (median), 1500 (max) Lin and Tsai, 2009
Manufacturing plant (Taiwan) NSAID Naproxen 1.05 (max) Lin and Tsai, 2009
Rikshospitalet hospital (Norway) NSAID Diclofenac 1.55 (median), 14.9 (max) Thomas et al., 2007
Rikshospitalet hospital (Norway) NSAID Ibuprofen 1.22 (median), 8.96 (max) Thomas et al., 2007
Rikshospitalet hospital (Norway) NSAID Paracetamol 197 (median), 1368 (max) Thomas et al., 2007
Ullevål hospital (Norway) NSAID Diclofenac 0.784 (median), 1.629 (max) Thomas et al., 2007
Ullevål hospital (Norway) NSAID Ibuprofen 0.417 (median), 0.987 (max) Thomas et al., 2007
Ullevål hospital (Norway) NSAID Paracetamol 46.9 (median), 177.674 (max) Thomas et al., 2007
Hospitals (Spain) NSAID Paracetamol 0.5–29, 16.02 (mean) Gómez et al., 2006
Hospitals (Spain) NSAID Diclofenac 0.06–1.9, 1.4 (mean) Gómez et al., 2006
Hospitals (Spain) NSAID Ibuprofen 1.5–151, 19.77 (mean) Gómez et al., 2006
Hospitals (Spain) NSAID Ketorolac 0.2–59.5, 4.2 (mean) Gómez et al., 2006
Hospitals (Taiwan) NSAID Paracetamol 37.0 (median) Lin et al., 2008
Hospitals (Taiwan) NSAID Paracetamol 62.3 (median), 186.500 (max) Lin and Tsai, 2009
Hospitals (Taiwan) NSAID Diclofenac 0.328 (median), 70 (max) Lin and Tsai, 2009
Hospitals (Taiwan) NSAID Diclofenac 0.286 (median) Lin et al., 2008
Hospitals (Taiwan) NSAID Famotidine 0.094 (median) Lin et al., 2008
Hospitals (Taiwan) NSAID Fenbufen 0.015 (median) Lin et al., 2008
Hospitals (Taiwan) NSAID Ibuprofen 0.282 (median) Lin et al., 2008
Hospitals (Taiwan) NSAID Ibuprofen 0.119 (median), 0.300 (max) Lin and Tsai, 2009
Hospitals (Taiwan) NSAID Ketoprofen 0.0096 (median), 0.231 (max) Lin and Tsai, 2009
Hospitals (Taiwan) NSAID Naproxen 0.47 (median) Lin et al., 2008
Hospitals (Taiwan) NSAID Naproxen 0.760 (median), 1.110 (max) Lin and Tsai, 2009
Regional discharges (Taiwan) NSAID Paracetamol 8.06 (median) Lin et al., 2008
Regional discharges (Taiwan) NSAID Diclofenac 0.184 (median) Lin et al., 2008
Regional discharges (Taiwan) NSAID Famotidine 0.014 (median) Lin et al., 2008
Regional discharges (Taiwan) NSAID Ibuprofen 0.747 (median) Lin et al., 2008

64
Regional discharges (Taiwan) NSAID Naproxen 0.278 (median) Lin et al., 2008
Animal husbandries (Taiwan) NSAID Paracetamol 0.012 (median) Lin et al., 2008
Animal husbandries (Taiwan) NSAID Diclofenac 0.004 (median) Lin et al., 2008
Animal husbandries (Taiwan) NSAID Fenoprofen 0.008 (median) Lin et al., 2008
Animal husbandries (Taiwan) NSAID Ibuprofen 0.863 (median) Lin et al., 2008
Animal husbandries (Taiwan) NSAID Ketoprofen 0.164 (median) Lin et al., 2008
Animal husbandries (Taiwan) NSAID Naproxen 1.77 (median) Lin et al., 2008
Aquacultures (Taiwan) NSAID Paracetamol 0.021 (median) Lin et al., 2008
Aquacultures (Taiwan) NSAID Diclofenac 0.004 (median) Lin et al., 2008
Aquacultures (Taiwan) NSAID Ibuprofen 0.05 (median) Lin et al., 2008
Landfill (Oklahoma) NSAID Paracetamol 0.009 Barnes et al., 2004
Landfill (Oklahoma) NSAID Codeine 0.24 Barnes et al., 2004
Landfill (Oklahoma) NSAID Ibuprofen 0.018 Barnes et al., 2004
3.3.5. Phthalates
Phthalates are ubiquitous in the environment and it is difficult to link measured
concentrations to specific sources (Fromme et al. 2004). Indoor air concentrations of
phthalates are generally higher than outdoor air concentrations (Rakkestad et al.,
2007; Rudel et al., 2003) and urban and suburban phthalate concentrations are higher
than rural and remote locations (Rudel & Perovich 2009).
Phthalate metabolites have also been detected in human urine samples and
diet is the most probable source (Tsumura et al. 2010; Fromme et al. 2007).
However, the plastic enteric coatings of tablets may also lead to the detection of
phthalates in urine. A urinary sample collected three months after the start of asacol
use for the treatment of ulcerative colitis, was measured at 16.9 g L-1
. This was
more than two orders of magnitude higher than the 95th percentile for males, as
reported in the 1999–2000 National Health and Nutrition Examination Survey
(Hernández-Díaz et al. 2009). After this discovery, six other asacol users were
identified and the mean urinary concentration of monobutyl phthalate was found to

65
be fifty times higher than the mean for non-users (2257 versus 46 µg L-1
, p < 0.0001)
(Hernández-Díaz et al. 2009).
3.4. Pathways and environmental fate
Potential pathways of pharmaceuticals to the environment after human use are
shown in Figure 2. Once medicines are released from the source, pathways into the
environment depend on the physical and chemical properties of the APIs and the
properties of the environmental compartments. This section will outline the
pathways and fate of human and veterinary drugs in relevant environmental
compartments.
Figure 2. Pathways and fate of pharmaceuticals after human use. Modified
from personal communication with V Cunningham in 2007
Regardless of their route of entry or the aqueous compartment,
pharmaceutical concentration and persistence are governed by similar physical,

66
chemical and biological processes (Gurr & Reinhard 2006). Pharmaceuticals may be
sorbed to the sediment of a river (Liu et al., 2004) or transformed by
photodegradation (Lam & Mabury 2005; Liu & Williams 2007), biodegradation
(Kim et al. 2005; Pérez et al. 2005; Quintana et al. 2005) and/or hydrolysis
(Waterman et al. 2002; El-Gindy et al. 2007). Liu et al. (2009a) emphasised that
both biotic and abiotic transformation processes may occur in natural surface waters,
and they developed a test strategy for measuring the multiple kinetics of
photodegradation, biodegradation and hydrolysis in river waters simultaneously.
However, in spite of various removal processes in surface waters, there are still
concerns about the potential of pharmaceuticals to reach drinking water through
groundwater (Jones et al. 2005; Mompelat et al 2009).
3.4.1. Antibiotics
After an API acts in the body, various reactions, many of them enzyme catalysed,
can cause the drug to be excreted as the parent compound, metabolites or conjugates
(Cunningham, 2004). Ciprofloxacin is eliminated from the body principally by
urinary excretion and to a lesser extent by faecal excretion. About 40–50 per cent of
an oral dose is excreted unchanged in the urine and about 15 per cent as metabolites,
while faecal excretion over five days accounts for 20–35 per cent of an oral dose
(Vance-Bryan et al. 1990). Amoxicillin is excreted as 80–90 per cent parent
compound and 10–20 per cent metabolites, while chloramphenicol leaves the body
as 5–10 per cent unchanged compound and 70–90 per cent as glucuronides (Hirsch
et al. 1999).
After elimination from the human body or from improper disposal of unused
medication, parent compound and metabolites enter the sewerage system. Influent

67
concentrations of antibiotics to waste-water-treatment facilities are generally higher
than effluent concentrations (Göbel et al. 2005a; Lindberg et al. 2005; Gros et al.
2006), and antibiotics are frequently detected in sewage sludge. Lindberg et al.
(2006) measured a maximum concentration of 7.7 mg/kg ciprofloxacin in Swedish
STPs, and Göbel et al. (2005b) measured a 0.012–0.063 mg/kg range of
clarithromycin from German and Swiss STPs. In 2005, 995,000 tonnes of sewage
sludge was applied to English and Welsh agricultural fields as organic fertilisers
(DEFRA 2005), providing a pathway for human pharmaceuticals to enter the
agricultural environment (Kinney, Furlong, Zaugg, et al. 2006). Pharmaceuticals can
also be leached by precipitation from biosolids applied to land and enter surface and
groundwater (Ternes, Joss, et al. 2004).
Within STPs, pharmaceuticals with an octanol/water partition coefficient of
less than one are likely to partition to the aqueous phase. Several studies have been
carried out to investigate the occurrence of antibacterial drugs in STP effluents
across Europe and the US (Ternes 1998; Hirsch et al. 1999; Andreozzi, Raffaele, et
al. 2003; Ternes et al. 2003). Hirsch et al. (1999) detected six antibiotics in a
German STP, at maximum concentrations ranging from 0.24 to the highest
concentration of 6 µg L-1
, measured for erythromycin-H2O. Further studies showed
that various therapeutic classes of antibiotics were measured in French, Greek,
Italian and Swedish STPs, at concentrations in the low µg L-1
range (Andreozzi,
Raffaele, et al. 2003).
Antibiotics have been detected in several surface waters across Europe and
the US. Hirsch et al. (1999) measured 1.7 µg L-1
erythromycin-H2O and ng L-1
concentrations of five other antibiotics in German river waters, and Kolpin et al.
(2002) measured a maximum concentration 1.9 µg L-1
sulphamethoxazole. Hirsch et

68
al. (1999) also measured sulphamethoxazole and sulphamethazine in groundwater
samples at concentrations of 0.47 µg L-1
and 0.16 µg L-1
respectively, while Lindsey
et al. (2001) measured 0.22 µg L-1
of sulphamethoxazole in the US groundwater and
Sacher et al. (2001) measured 0.41 µg L-1
of sulphamethoxazole in German
groundwater sites. Kinney, Furlong, Werner, et al. (2006) detected a concentration
range of 0.15–0.61 ng L-1
for erythromycin in drinking water, but the frequency of
detection was generally very low.
Veterinary pharmaceuticals enter the environment either from direct
excretion of medicated animal’s faeces or from the application of animal manure to
land (Boxall et al. 2003; Sarmah et al. 2006). Irrespective of the source, veterinary
antibiotics enter the environment via soil, and their behaviour is determined by their
physical and chemical properties, including water solubility, lipophilicity, volatility
and partition potential. Depending on the partition coefficients into soil and the soil
organic carbon content (Kd and Koc), antibiotics may be either mobile or persistent in
the soil. Sulphonamide antibiotics have low Koc values and are mobile in the soil,
whereas tetracycline and macrolide antibiotics are less mobile (Kay et al. 2005).
However, the properties of the soil, including pH, organic carbon content, ionic
strength and cation exchange capacity, can influence the sorption behaviour of
antibiotics (ter Laak et al. 2006; Sassman & Lee 2005). Antibiotics can persist in
soil, leach to groundwater, runoff to surface waters or be taken up by biota (Boxall et
al. 2006).
Antibiotics such as oxytetracycline and oxolinic acid are routinely
administered to aquaculture sites as a preventative measure against microbial
pathogens and as prophylactic agents (Björklund et al. 1991; Hirsch et al. 1999).
Halling-Sørensen et al. (1998) calculated that 70–80 per cent of drugs administered

69
in aquaculture remain in the environment. Antibiotics residues can also be
transported into fresh-water and marine sediments, where they have been shown to
accumulate (Richardson & Bowron 1985; Halling-Sørensen et al. 1998).
3.4.2. Antidepressants
Fluoxetine is extensively metabolised by demethylation in the liver to its primary
active metabolite norfluoxetine, and excretion is mainly via urine. The half-life for
fluoxetine in the human body is about 1 to 3 days while the half-life for
norfluoxetine is approximately 4 to 16 days (Altamura et al. 1994). Calisto &
Esteves (2009) reported the metabolites and excretion rates of psychiatric drugs, and
their presence in the environment.
In Norwegian STPs, measured effluent concentrations of SSRIs are lower
than influent concentrations, indicating some removal during treatment. Sertraline
and fluoxetine reduced from 2.0 ng L-1
to 0.9 ng L-1
and from 2.4 ng L-1
to 1.3 ng L-1
,
respectively, and citalopram reduced from 612 ng L-1
to 382 ng L-1
(Vasskog et al.
2006). High quantities of fluoxetine have been found in biosolids produced by a
STP, ranging from 0.1 mg L-1
to 4.7 mg L-1
(Kinney, Furlong, Werner, et al. 2006).
Many psychiatric drugs including diazepam, nordiazepam, oxazepam, fluoxetine and
amitriptyline have been detected in high ng L-1
to low µg L-1
concentrations from
STP effluents across Europe (Ternes et al. 2001; Heberer 2002b; Metcalfe et al.
2003; Togola & Budzinski 2008).
As conventional STPs were not specifically designed to remove
pharmaceutical compounds, antidepressants could have entered the environment
from the application of biosolids to land and from the release of effluent into
receiving waters. Fluoxetine, diazepam and nordiazepam have been detected in

70
surface waters at concentrations ranging from 2.4 ng L-1
to 88 ng L-1
(Ternes 2001;
Kolpin et al. 2002; Togola & Budzinski 2008), but the highest recorded
measurement was for venlafaxine at 1000 ± 400 ng L-1
in samples downstream of the
Pecan Creek Water Reclamation Plant in the USA (Schultz & Furlong 2008). Even
after degradation in STPs and after biotic and abiotic processes in surface waters,
some antidepressants have still been detected in finished drinking-water samples,
albeit at low ng L-1
concentrations(Halling-Sørensen et al. 1998; Zuccato et al. 2000;
Jones et al. 2005a; Togola & Budzinski 2008).
3.4.3. Cardiovascular drugs
Losartan is excreted in urine and in the faeces via bile as parent drug and
metabolites. About 35 per cent of an oral dose is excreted in the urine and about 60
per cent in the faeces. The half-life of Losartan in human bodies is about 1.5 to 3
hours, while the half-life of one of its metabolites, EXP3174 is approximately 3 to 9
hours (Lo et al. 1995).
Propranolol has been measured in both the influent and effluent of STPs, and
in some cases measured concentrations were reduced during STP treatment (Bendz
et al. 2005). However, most research indicates that effluent concentrations are
higher than measured influent concentrations (Fono & Sedlak 2005; Gros et al. 2006;
Roberts & Thomas 2006). Higher effluent concentrations have also been reported
for atenolol (Bendz et al. 2005; Gros et al. 2006). This may be due to the cleavage
of conjugates to produce parent APIs in STPs (Heberer 2002b; Miao et al. 2002).
Although atenolol has been reported to have higher concentrations in STP effluents,
ng L-1
concentrations are still removed to sludge during sewage treatment and are

71
present in biosolids applied to agricultural fields (Lapen et al. 2008; M. Edwards et
al. 2009).
Albuterol, atenolol, metoprolol, propranolol and sotalol have been found in
surface waters at low concentrations ranging from 1 ng L-1
to 107 ng L-1
(Castiglioni
et al. 2004; Bendz et al. 2005; Fono & Sedlak 2005; Zuccato et al. 2005; Bound &
Voulvoulis 2006; Gros et al. 2006; Roberts & Thomas 2006). This reduction in
concentration could be due to abiotic and biotic degradation processes in surface
waters. For example, propranolol, metoprolol and atenolol have been found to
undergo relatively fast direct and indirect photolysis in river waters (Liu & Williams
2007; Liu et al. 2009a). Metoprolol and atenolol underwent biodegradation in river
waters under light conditions (Liu et al. 2009a). Data are much more limited in
groundwater. Sacher et al. (2001) reported sotalol at maximum concentrations of
560 ng L-1
in groundwater samples, and <5 ng L-1
concentrations of atenolol,
metropolol and propranolol have been detected in drinking-water supplies in
Germany (Webb et al. 2003).
3.4.4. Non-steroidal anti-inflammatory drugs
Diclofenac is metabolised to 4´-hydroxydiclofenac, 5-hydroxydiclofenac, 3´-
hydroxydiclofenac and 4´,5-dihydroxydiclofenac in the human body. It is then
excreted in the form of glucuronide and sulphate conjugates, mainly in urine (about
65 per cent) and also in bile (about 35 per cent) (Davies & Anderson 1997).
During waste-water treatment in STPs, NSAIDs generally decrease in
concentration between influent and effluent concentrations. Paracetamol has been
found to decrease in concentration from 0.13 µg L-1
to below the limit of detection
and from 26.1 µg L-1
to 5.99 µg L-1
(Gros et al. 2006). Diclofenac has been found to

72
decrease from an average concentration of 2.33 ng L-1
to 1.56 ng L-1
(Quintana &
Reemtsma 2004) and ibuprofen from 7.74 µg L-1
to 1.98 µg L-1
and from 33.8 µg L-1
to 4.24 µg L-1
(Roberts & Thomas 2006).
After discharge into surface water, concentrations are usually detected at low
ng L-1
concentrations (Castiglioni et al. 2004; Alvarez et al. 2005; Bendz et al. 2005;
Roberts & Thomas 2006; Zhang et al. 2007), with the occasional measurement in the
low µg L-1
concentration range (Ashton et al. 2004; Comoretto & Chiron 2005;
Bound & Voulvoulis 2006). Many NSAIDs undergo photodegradation in surface
waters. Buser et al. (1998) showed that there was significant elimination of
diclofenac in a Swiss lake, concluding that photodegradation was the possible cause.
In contrast, ibuprofen is relatively resistant to photodegradation in surface waters
(Lin & Reinhard 2005).
Diclofenac and ibuprofen have been detected in sludge and biosolids at 0.31
mg/kg to 7.02 mg/kg and 0.12 mg/kg (Ternes, Herrmann, et al. 2004). Diclofenac
can enter surface waters due to runoff after periods of heavy rainfall or leach into
groundwater from terrestrial compartments. Several pharmaceuticals, including
paracetamol, diclofenac and ibuprofen, have been detected in groundwater samples,
originating from the application of biosolids to land or from landfill leachate
(Heberer et al. 2004; Kreuzinger et al. 2004; Scheytt et al. 2004; Verstraeten et al.
2005). Some NSAIDs, such as ibuprofen, naproxen and ketoprofen have also been
detected in low ng L-1
concentrations in drinking water (Vieno et al. 2005; Kinney,
Furlong, Werner, et al. 2006; Loraine & Pettigrove 2006; Mompelat et al. 2009).

73
3.4.5. Phthalates
Phthalates that are used in PPCPs are most likely to enter into the environment
through the washing off of cosmetics and the excretion of phthalates into waste-
water systems (Barrett 2005). Clara et al. (2010) showed that a number of phthalates
have been detected in STPs (n=15) at ng L-1
concentrations and that influent
concentrations are higher than effluent concentrations. Phthalates are readily sorbed
to sewage solids and are thus removed from the aqueous phase (Marttinen et al.
2003; Oliver et al. 2005) although Fromme et al. (2002) showed that phthalates are
present in surface waters and sediments at µg L-1
concentrations.
In addition, phthalates that are used in hair sprays and fragrances may enter
into the atmospheric environment and could be deposited in house dust (Abb et al.
2009; Bornehag et al. 2005). Becker et al. (2004) measured levels of di(2-
ethylhexyl)phthalate (DEHP) in house dust and also the levels of DEHP in urinary
metabolites of 254 children, though correlations suggested that house dust was not a
major contributor to total DEHP exposure. However, Adibi et al. (2003) suggested
that inhalation may be an important pathway for exposure to the lower-molecular-
weight phthalates diethyl phthalate (DEP), dibutyl phthalate (DBP) and butyl benzyl
phthalate (BBP).
3.5. Physiological effects
Pharmaceutical compounds are manufactured to have a specific biological effect on
humans and animals. Many of these compounds can enter the aquatic environment,
both as the parent chemical and as metabolites, and there are concerns that they may
have adverse effects on non-target species. This section will examine the harmful

74
effects that antibiotics, antidepressants, cardiovascular drugs, NSAIDs and
phthalates may be having on fauna in the terrestrial and aquatic environment.
3.5.1. Antibiotics
It is well known that bacteria have become resistant to a number of antimicrobial
compounds that have been used to treat bacterial infections in humans.
Staphylococcus spp. developed resistance to penicillin soon after the mass
introduction of the antibiotic in 1947 (Gould 1957), and methicillin-resistant
Staphylococcus aureus (MRSA) is now a major problem (Enright et al. 2002).
As a result, there is a concern for the development of new resistant strains in
environmental bacteria biofilms (Schwartz et al. 2006). Resistant genes and resistant
bacteria have been detected in many environmental compartments (Zhang et al.
2009), including sewage effluents and sewage sludge (Kim & Carlson 2007), manure
and soils (Thiele-Bruhn 2003) and aquatic environments (Alexy & Kümmerer 2006).
However, it is still debatable whether these resistant bacteria have developed from
environmental concentrations of antimicrobials or from excretion from humans and
other animals (Kümmerer 2004a; Kümmerer 2009a,b).
Schwartz et al. (2003) investigated the resistance of bacteria in a number of
environmental compartments including hospital waste water, surface water and
drinking water. Resistant bacteria, including enterococci, staphylococci and
enterobacteriaceae, were detected, showing the highest resistant levels in hospital
waste water, and some resistant heterotrophic bacteria were found in drinking-water
samples.
Farming practice and farm animals serve as a reservoir for antibiotic
resistance in the environment. Livestock supplied with feed containing 240 g tylosin

75
per tonne resulted in a 2.1 per cent resistance level in field soils and a 25.8 per cent
resistance level in cattle manure (Onan & LaPara 2003). Chen et al. (2007) found
macrolide, lincosamide and streptogramin B resistance in bacteria in a number of
matrices including bovine manure, swine manure, compost of swine manure and
swine-waste lagoons; the highest levels of resistance were in swine manure.
3.5.2. Antidepressants
Fluoxetine is so far the most acutely toxic human pharmaceutical to aquatic life
(Fent et al. 2006), with reported acute toxicity ranging from EC50 (48h, alga) = 0.024
mg L-1
(Brooks et al. 2003) to LC50 (48h) = 2 mg L-1
(Kümmerer 2004a), and it is
possible that these effects may be carried over into aquatic ecosystems. In chronic
toxicity studies, Flaherty & Dodson (2005) found the reproduction of Daphnia
magna to be enhanced when exposed to a concentration of 36 µg L-1
fluoxetine.
However, Péry et al. (2008) found that reproduction was significantly reduced at
exposure concentrations of 31 µg L-1
fluoxetine, and there was 40 per cent mortality
at day 21 at a concentration of 241 µg L-1
. Fong (1998) also showed fluoxetine to
induce mussel spawning. Chronic toxicity studies using the SSRI sertraline
hydrochloride showed that 100 per cent mortality of Daphnia magna was achieved
when they were exposed to a concentration of 0.32 mg L-1
for 21 days and the
number of days to reproduction was increased when 100 per cent mortality was not
achieved (Minagh et al. 2009).
The antidepressants fluoxetine and sertraline and their respective metabolites,
norfluoxetine and desmethylsertraline, were found in brain, liver and muscle tissues
in fish species bluegill (Lepomis macrochirus), channel catfish (Ictalurus punctatus)
and black crappie (Pomoxis nigromaculatus) in an effluent-dominated stream in

76
North Texas (Brooks et al. 2005). In addition, the discharge of sewage into Fourmile
Creek in the USA resulted in the accumulation of low ng L-1
concentrations of
fluoxetine and sertraline and their respective metabolites in the brain tissue of White
Sucker fish (Schultz et al. 2010). Antidepressants can bioaccumulate in the tissue of
Japanese medaka (Oryzias latipes), but a period of depuration has been found to
result in the reduction of fluoxetine and norfluoxetine (Paterson & Metcalfe 2008).
Moreover, it has been found that four weeks of fluoxetine exposure to Japanese
medaka (Oryzias latipes) at concentrations ranging from 0.1 to 5 µg L-1
does not
result in any changes in adult reproductive parameters, though abnormalities,
including oedema, curved spine, incomplete development and non-responsiveness,
were observed in developing medaka embryos (Foran et al. 2004).
3.5.3. Cardiovascular drugs
ß2-adrenoceptors are found in the heart and liver of fish (Reid et al. 1992; Gamperl et
al. 1994) and also in reproductive tissues (Haider & Baqri 2000); hence aquatic
invertebrates may be adversely impacted by some beta-blockers. Exposure of
Japanese medaka to propranolol resulted in a 48 h LC50 value of 24.3 mg L-1
, but
increased mortality was not observed for metoprolol and nadolol. Egg production
was not affected in two-week exposure studies to propranolol but growth of medaka
was significantly reduced at concentrations of 0.5 mg L-1
. Male and female plasma
steroid levels were significantly decreased at all concentrations tested, and male
testosterone levels were significantly decreased and female medaka plasma estradiol
were significantly increased at propranolol concentrations > 0.1 mg L-1
(Huggett et
al. 2002).

77
In aquatic toxicity tests with drugs including NSAIDs, anti-epileptics and
cardiovascular drugs, propranolol was found to be the most toxic out of the ten
prescription drugs tested against Daphnia magna and Desmodesmus subspicatus,
with EC50 values of 7.5 mg L-1
and 5.8 mg L-1
, respectively. The EC50 value for
metoprolol (7.3 mg L-1
) was the second most lethal for Desmodesmus subspicatus.
In comparison, both of the cardiovascular drugs tested were the least toxic to the
duckweed Lemna minor (Cleuvers 2003).
Ferrari et al. (2004) investigated the ecotoxicity of six pharmaceuticals
(carbamazepine, clofibric acid, diclofenac, ofloxacin, sulphamethoxazole and
propranolol), and propranolol was found to be the most toxic in many of the acute
and chronic studies. In 48 h mortality studies using the crustaceans Ceriodaphnia
dubia and Daphnia magna, propranolol had the lowest EC50 values, 1,510 µg L-1
and
2,750 µg L-1
respectively. In chronic studies, the rotifer Brachionus calyciflorus and
the crustacean Ceriodaphnia dubia had the lowest no-observed-effect concentrations
(NOEC), 180 µg L-1
and 9 µg L-1
, in 48-h and 7-d reproduction studies.
3.5.4. Non-steroidal anti-inflammatory drugs
Diclofenac is responsible for the largest ecological disaster involving pharmaceutical
compounds in recent times. Between 1991 and 2000, Prakash et al. (2003) showed a
greater than 90 per cent decline in two species of Gyps vulture populations in
northern India. Even though the drop in numbers was first observed in the 1990s, it
was not until 2004 that this was linked to the use of diclofenac in the treatment of
livestock (Oaks et al. 2004). Dead cattle containing high diclofenac residues were
allowed, for cultural reasons, to rot in the open air. As vultures fed on the rotting
carcases they received a fatal dose. Diclofenac is considered to be safe for the

78
treatment of cattle, but the drug proved to be one of the most toxic to vultures, with
an LD50 value in the range 0.098–0.225 mg/kg (Swan et al. 2006), causing death
from a combination of increased reactive oxygen species and interference with uric
acid transport (Naidoo & Swan 2009). As a result, three species (oriental white-
backed vulture, Gyps bengalensis, long-billed vulture, Gyps indicus, and slender-
billed vulture, Gyps tenuirostris) are at a high risk of global extinction and are IUCN
red-listed as critically endangered population declining (IUCN 2009).
Diclofenac has been shown to have effects on invertebrates and vertebrates
across a number of trophic levels in the aquatic environment. In 30-min
luminescence tests on the bacterium Vibrio fisheri, diclofenac had lower EC50
concentration than carbamazepine, clofibric acid, ofloxacin, propranolol or
sulphamethoxazole (Ferrari et al. 2004). In the crustacean, Daphnia magna, 48-h
mortality studies have produced EC50 values of 39.9 mg L-1
and 44.7 mg L-1
(Haap et
al. 2008). Using the rainbow trout (Oncorhynchus mykiss) as a model for
histopathological and bioaccumulation studies, Schwaiger et al. (2004) showed
concentration-related accumulation of diclofenac in the liver, kidneys and gills. At 5
µg L-1
concentrations and above, individuals exposed to diclofenac showed
significant renal changes, including severe hyaline-droplet degeneration
accompanied by an accumulation of proteinaceous material within the tubular
lumina. Accumulation of diclofenac in the gills resulted in degenerative and necrotic
changes in pillar cells as well as dilation of the capillary walls at 100 µg L-1
.
3.5.5. Phthalates
A monitoring study in the Netherlands found two phthalate esters, DEHP and DBP,
in freshwater, marine water and sediment samples. Even though the concentrations

79
measured in freshwater samples were in the low µg L-1
range, low µg/kg
concentrations were measured in fish lipid (Peijnenburg & Struijs 2006). Phthalates
have also been shown to bioconcentrate in other aquatic organisms (Brown &
Thompson 1982b; Staples et al. 1997), although (Brown & Thompson 1982a) found
that DEHP or di-isodecyl phthalate (DIDP) did not show any acute or chronic effects
on Daphnia magna at concentrations up to 100 µg L-1
. Scholz (2003) reported that
short-chain monoesters, such as mono-isononyl phthalate (MINP) and mono-n-
hexyl/n-octyl/n-decyl-phthalate (MC8/10P) have the greatest acute effects.
3.6. Discussion
Risk is a function of both hazard and exposure. Life-cycle assessment of PPCPs
determines the links between environmental health and human-health risks (Figure
3). Hazards associated with PPCPs can be related to their mechanisms of action
(MoA), PBT and CMR properties with regard to both environmental and human
health risks. These are linked to the physical, chemical and biological properties of
PPCPs.
Figure 3. Links between environmental and human-health risks of PPCPs.

80
Human-health risk assessment requires not only an understanding of CMR
properties of PPCPs and their safety to individuals such as workers, consumers or
patients, but also epidemiological studies of population responses and their effect on
sensitive people such as children, pregnant women and the elderly. Furthermore, the
human-health risks of PPCPs also include secondary routes from environmental
compartments, through inhalation, skin sensitisation, drinking water or food-chain
bioaccumulation.
On the other hand, PBT assessment at a catchment level is relevant to the use
pattern, pathways, fate and exposure in the environment. Read-across hypothesis
between environmental health and human-health and vice-versa are developed
through the application of multidisciplinary science, life-cycle assessment and
integrated test strategies for a better understanding of PPCP safety, both in the
environment and for human health.
3.7. Conclusion
Source-pathway-receptor linkage of pharmaceuticals identifies environmental
problems that may pose significant risk to non-target organisms. Analysis of linkage
at a compound level determines the sources and pathways most likely to lead to
PPCP exposure in receiving waters and acts as the basis for developing human-
health/environmental health read over hypothesis.

81
CHAPTER FOUR: SOURCE ASSESSMENT OF PHARMACEUTICALS
UNDER THE PRINCIPLES OF THE WATER FRAMEWORK DIRECTIVE
This chapter provides a thorough assessment of the sources that can release
pharmaceuticals into the environment. Primary and secondary sources are examined
for both human and veterinary pharmaceuticals and the emissions of these sources
are discussed in terms of developing a catchment framework for pharmaceutical
pollution.

82
4.1. Introduction
The E.U. Water Framework Directive (2000/60/EC) (WFD) was adopted by member
states in October 2000 with the aim to prevent deterioration and enhance the water
quality of surface freshwaters, groundwaters, estuaries and coastal marine
ecosystems through phasing out and reducing priority pollutants. As the directive on
priority substances (2008/105/EC) is subject to review, other pollutants that are
considered less important now may be given an enhanced status in the future as the
existing priority pollutants are controlled and phased out. To put this in perspective,
pharmaceutical consumption is predicted to increase as better health care increases
life expectancy, and climate change trends point towards a drier future, increasing
the volume of pharmaceutical compounds in the aquatic environment and the
potential implications for ecosystem health (Jones et al. 2004).
The WFD shifts water management practices from localised source solutions
to a more holistic river basin catchment approach that results in receiving waters
achieving good chemical and ecological status by 2015 (Article 4). Member
countries are required to manage water bodies by designing River Basin
Management Plans (RBMPs) for designated river basin districts (RBDs) that are
derived by geographical and hydrological boundaries. Across continental Europe,
many catchments require international cooperation. The river Danube catchment
spans nineteen countries and has required the cooperation of E.U. member states
(Austria, Bulgaria, Czech Republic, Germany, Hungary, Italy, Poland, Romania,
Slovak Republic and Slovenia), non E.U. member states (Albania, Bosnia &
Herzegovina, FYR Macedonia, Moldova, Montenegro, Serbia, Switzerland and
Ukraine) and E.U. accession countries (Croatia) to develop the appropriate
management strategies for cross-border catchments (ICPDR 2009). For each

83
individual RBD, Programmes of Measures (PoMs) are implemented for the
anthropogenic activities that impact upon the aquatic environment.
To prevent further deterioration of waters from chemical pollution, thirty-
three priority substances that are considered to be a major concern in European
waters were selected and Environmental Quality Standards (EQS) determined from
various risk assessments in aquatic and terrestrial ecosystems (Klein 1999; European
Commission 2001). The priority substances, which are mainly heavy metals and
pesticides, are to be phased out and eliminated by reducing discharges, emissions
and losses (European Commission 2000). As yet, pharmaceutical compounds have
not been considered by the WFD even though evidence is accumulating to show
detrimental effects in the aquatic environment (Wollenberger et al. 2000; Miranda &
Zemelman 2001; Huggett et al. 2002; Fent et al. 2006; Graham et al. 2009) and data
is being compiled for their consideration as future priority pollutants (Bottoni et al.
2010). As a result, pharmaceutical contamination is currently managed by individual
water service providers and risk assessment data for selected compounds are shown
in Table 6.
Table 6. Risk assessment data for selected pharmaceutical compounds
Compound PEC
(µg L-1
)
Test
organism
PNEC
(µg L-1
)
PEC/PNEC
(µg L-1
) Reference
Paracetamol 65.4 D.magna 136 0.50 Stuer-Lauridsen et al.
2000
65.4 D.magna 9.20 7.10
11.96 D.magna 136 0.09 Jones et al. 2002
Ibuprofen 8.90 D.magna 9.06 1.00 Stuer-Lauridsen et al.
2000
8.90 T.rubrum 5.00 1.80
Aspirin 80.4 D.magna 61 1.30
0.55 D.magna 61 0.01 Jones et al. 2002
Propranolol 0.59 No data 0.73 0.81 Cleuvers 2005
Metoprolol 2.2 No data 7.9 0.28

84
A large amount of research has already measured many pharmaceutical
compounds in the wastewater from individual sources that release pharmaceutical
compounds into sewers (Babić et al. 2007; Thomas et al. 2007; Fisher & Scott 2008).
However, much of this research fails to address the relationship between sources and
environmental concentrations on a catchment scale (Thomas et al. 2007). Under the
context of the WFD, member states are required to carry out full scale source
assessments of catchments. Using this as a model for managing pharmaceutical
pollution would allow for a more detailed assessment of the relative contributions
that individual sources can contribute to environmental concentrations (Langford &
Thomas 2009; Lin et al. 2008; Lin & Tsai 2009).
4.1.1. Importance of catchments for accurate source and risk assessment
The application of defined boundaries provides a framework for investigating water
quality in more detail than in the past. The approach improves the collection of
uniform monitoring data of catchment source emissions and creates the need for
determining the relationship between pharmaceutical source emissions and
catchment concentrations. Therefore, accurate source assessments at catchment
levels are required to account for the changes in populations and primary industries
of the 11 catchments in England and Wales (Table 7). For example the primary
industry of agriculture in the Western Wales catchment has the potential to input
more veterinary pharmaceuticals to the environment than the predominantly urban
Thames catchment creating uncertainty factors in risk assessment. The EMEA
guidelines suggest the use of a market penetration factor (Fpen) for environmental
risk assessment (ERA). Taking into account the variation in the types and quantities
of drugs consumed, Fpen calculations based on catchment drug use make risk

85
assessment more accurate at site specific locations. For example, a catchment with a
high human population is likely to consume more ibuprofen and thus have higher
PEC values for surface waters, potentially triggering risk characterisation ratios
(RCRs) of greater than 1. In addition, the EMEA sets a dilution factor of 10 for
effluent dilution in receiving surface water volume. However, depending on the
volume of the receiving surface water, actual dilution factors may change at a
catchment level and affect environmental risk assessment values. The use of source
assessment for developing catchment ERA is important for developing management
plans that can target catchments of most concern for pharmaceutical emissions to the
environment. This chapter aimed to identify the main sources for human and
veterinary pharmaceuticals to enter into receiving waters at a catchment level.
Table 7. RBDs in England and Wales
RBD Country Size (km2) Population (million)
Anglian England 27,890 ~5.2
Dee England and Wales 2,251 ~0.5
Humber England 26,109 ~10.8
North West England 13,140 ~6.6
Northumbria England and Scotland 9,029 ~2.5
Severn England and Wales 21,590 ~5.3
Solway Tweed England and Scotland 17,500 ~0.45
South East England 10,000 ~3.1
South West England 21,000 ~3.0
Thames England 16,133 ~13
Western Wales Wales 16,653 ~1.3
(Environment Agency 2010a)
4.2. Primary and secondary sources of pharmaceuticals
The quantities of pharmaceuticals detected in the environment depend on the size
and frequency of human and veterinary pharmaceutical sources that are present in a
catchment. The primary sources are considered as manufacturing plants, hospitals,

86
care homes, prisons, residential areas and agricultural systems where they are
administered or made and secondary sources including STPs, biosolids and landfill
sites are where they can accumulate and act as a pathway into the environment.
Further sources where pharmaceuticals are used and accumulate before entering the
environment have been suggested (Daughton & Ruhoy 2009). Human and
veterinary pharmaceutical sources can have different routes into the environment or
can follow similar pathways (Figure 4).
Figure 4. Movements of human and veterinary pharmaceuticals from primary
and secondary sources in a river basin district ( human and veterinary
pharmaceuticals human pharmaceuticals veterinary pharmaceuticals).

87
4.2.1. Primary sources
4.2.1.1. Residential households
Residential households in both the UK and Europe are a likely to be a predominant
source for pharmaceuticals to enter into the environment (Kümmerer 2009c). Over-
the-counter generic medicines and medication prescribed by GPs are consumed
within residential areas and subsequently excreted into the sewerage system as
parent compounds (McClellan & Halden 2010) and metabolites (Ternes 2000; Pérez
& Barceló 2007). To determine the concentrations that residential households may
contribute into the environment, Lin et al. (2008) conducted a study to determine the
emissions of pharmaceuticals from sources in Taiwan. Regional discharges
(residential households) produced the highest measured concentrations of cephradine
(128 ng L-1
) and erythromycin-H20 (705 ng L-1
) in waste streams and effluents.
However, another 95 compounds were measured in higher concentrations from other
sources that included drug production facilities, hospitals, STPs, animal husbandries
and aquacultures, suggesting that other sources may be more important than first
thought. Similar research was also carried out at in Korea to measure
pharmaceutical concentrations from STPs receiving wastewater from four different
sources. Sim et al. (2011) detected 24 compounds from 12 municipal STPs, 4
livestock STPs, 4 hospital STPs and 4 pharmaceutical manufacture STPs. Caffeine
(20.1 µg L-1
) was measured in the highest concentrations in the municipal STP,
followed by lincomycin (9.35 µg L-1
) and oxytetracycline (8.66 µg L-1
). In
comparison to the other sources, the concentrations of drugs in livestock and
pharmaceutical manufacturing STPs had higher total concentrations of
pharmaceuticals in the influents than municipal STPs. Even-though the research

88
points towards livestock STPs as contributing the largest total amount of
pharmaceutical to the environment, results are very compound specific.
In addition to excreted compounds, incorrect disposal of unused or outdated
medicines may contribute to the pharmaceutical concentrations detected from
residential households. To investigate this further, 400 members of households were
interviewed mainly from the south-east of England to build a conceptual model for
pathways for pharmaceuticals to enter into the environment. The model
demonstrated that disposal of unused pharmaceuticals, either by household waste or
via the sink or toilet may be a prominent route that requires greater attention (Bound
& Voulvoulis 2005). Another study surveying patient medication disposal showed
that many admitted to storing unused and expired medications and more than half
had flushed medication down a toilet. Only 22.9% of patients reported returning
medication to a pharmacy for disposal (Seehusen & Edwards 2006).
4.2.1.2. Hospitals
Many therapeutic classes of drugs are used in hospitals and subsequently found in
hospital wastewaters at ng L-1
to µg L-1
concentrations (Hartmann et al. 1998;
Kümmerer 2001; Brown et al. 2006; Gómez et al. 2006; Lin & Tsai 2009). Until
recently it was thought that hospital wastewaters would potentially contain lower
concentrations of drugs than household or industrial wastewaters (Kümmerer 2009)
as effluents are diluted by municipal wastewaters (Kümmerer & Helmers 1997;
Kümmerer & Helmers 2000) and subsequently contribute to less than one per cent of
the total amount of municipal sewage (Kümmerer 2008). However, larger scale and
mass loading sampling methodologies have indicated contrasting results. Lin et al.
(2008) found higher concentrations of cephalexin (2457 ng L-1
) from hospital

89
wastewaters than any other source including drug production facilities (27 ng L-1
)
STPs (283 ng L-1
) regional discharges (610 ng L-1
) animal husbandries (ND) and
aquacultures (12 ng L-1
), even though this was not observed for all drugs.
The comparison of source effluent contributions to STPs was conducted at
two Norwegian hospitals and 5.90% and 5.80% of paracetamol measured in STP
influent came from Rikshospitalet and Ullevål hospitals respectively (Langford &
Thomas 2009). Other studied compounds, including ibuprofen, metoprolol and
sertraline were calculated to contribute less than one percent, while propranolol
contributed 4.2% and 7.2% respectively, indicating that hospital wastewater
contributions to pharmaceuticals loads can vary between healthcare facilities. This is
reflected through further mass loading estimates that suggest hospitals contribute
more pharmaceuticals to the environment than independent living facilities, assisted
living facilities and nursing home facilities (Nagarnaik et al. 2010, 2011).
4.2.1.3. Care Homes
Care homes, like hospitals, supply drugs to patients for the treatment of illnesses.
Much of the medication is often on repeat prescriptions, and prescribed over a longer
period of time. Brown et al. (2006) measured 23.5 µg L-1
and 1.3 µg L-1
ofloxacin
in effluents from a retirement home and assisted living facility in New Mexico
respectively. In addition, Nagarnaik et al. (2010) examined the wastewaters of
independent living facilities, assisted living facilities and nursing homes for the
presence of cardiovascular drugs. The drugs detected in wastewaters at over 1 µg L-1
included hydrochlorothiazide (3636 ng L-1
) atenolol (11326 ng L-1
), diltiazem (2886
ng L-1
), valsartan (4916 ng L-1
) and gemfibrozil (1152 ng L-1
) from independent
living facilities; atenolol (4783 ng L-1
), norverapamil (2829 ng L-1
) and valsartan

90
(8727 ng L-1
) from assisted living facilities and furosemide (1030 ng L-1
), metoprolol
(1584 ng L-1
), diltiazem (2708 ng L-1
), desmethyl diltiazem (2118 ng L-1
) from
nursing homes. The mass loadings based on the daily flow of wastewater were 0.9 g
d-1
from the assisted living facility, 1.8 g d-1
from the independent living facility and
1.0 g d-1
from the nursing home. Further research of the same healthcare facilities
detected the presence of nervous system active pharmaceutical ingredients in source
wastewater (Nagarnaik et al. 2011). Amitriptyline (290 ng L-1
) and fluoxetine (180
ng L-1
) were the only drugs detected in nursing home wastewaters, while oxycodone
(8 ng L-1
), propoxyphene (26 ng L-1
), carbamazepine (30 ng L-1
), amitriptyline (190
ng L-1
), 10-hydroxy-amitriptyline (32 ng L-1
), fluoxetine (42 ng L-1
), sertraline (110
ng L-1
), desmethylsertraline (86 ng L-1
) and amphetamine (102 ng L-1
) were detected
in assisted living facilities and oxycodone (14 ng L-1
), carbamazepine (110 ng L-1
),
amitriptyline (37 ng L-1
), 10-hydroxy-amitriptyline (12 ng L-1
), fluoxetine (81 ng L-
1), paroxetine (28 ng L
-1) and amphetamine (120 ng L
-1) were detected in
independent living facilities. Overall mass loading estimates for nursing homes,
assisted living and independent living facilities were 44 mg d-1
, 29.5 mg d-1
and 28.1
mg d-1
respectively. So far, little source characterisation data for care homes exist
and more is required to determine relative contributions to the environment in
relation to other sources.
4.2.1.4. Prisons
It is estimated that 75% of patients admitted to prison healthcare centres have mental
health problems (Reed & Lyne 2000). Psychiatric drugs have been detected in the
environment (Calisto & Esteves 2009) however it is unsure which source they have
been emitted from. There is also the issue with prisoners taking over doses of

91
medication, normally ibuprofen and subsequently being admitted to hospital (Lawler
& Thomas 2005). There is also potential for recreational drug use in some prisons
that may contribute to the overall load of illegal drugs released into surface waters
from STPs.
4.2.1.5. Manufacturing
The outputs from manufacturing plants are likely to increase pharmaceutical levels
in receiving waters as annual trends in pharmaceutical use indicate more prescribing
by community pharmacies (Office of National Statistics 2008). Specific
manufacturing plants can discharge treated or untreated wastewater either directly
into receiving water or indirectly to receiving water via STPs and concentrations are
likely to depend on the production process and the washing of equipment (Velagaleti
et al. 2002). Even-though the release of pharmaceuticals are not regulated by law,
Good Manufacturing Practice (GMP) principles can control emissions and country
specific environmental policy aims to minimise any significant release of drug
product into the environment (Larsson & Fick 2009). Chemical and biological
wastewater treatments, including Fenton oxidation (Tekin et al. 2006) and solar
photo-fenton and biological treatment (Sirtori et al. 2009) are often implemented as
an end-of-pipe clean up strategies, and as a result, measured concentrations in
European and American manufacturing wastewaters have been within the desired
ERA guidelines (Zühlke et al. 2004; Hoerger et al. 2009). However, outside of
Europe and the US, extremely high levels of pharmaceuticals have been detected in
STP effluents that emanate from 90 manufacturing plants near Hyderabad, India.
Out of the fifty-nine detected pharmaceuticals, twenty-three drugs were found at

92
concentrations above 1 µg L-1
, eleven above 100 µg L-1
and ciprofloxacin levels
reaching 31 mg L-1
(Larsson et al. 2007).
4.2.1.6. Agriculture
Agriculture is a major source for veterinary antibiotics to enter into both the aquatic
and terrestrial environments (Boxall et al. 2003). The livestock industry has
intensified over the last few decades and operates concentrated animal feeding
operations (CAFOs) for the production of human food from beef and dairy cattle,
pigs, sheep and poultry (Lee et al. 2007). For example, chlortetracycline fed to cattle
at 70 mg head-1
day-1
for the treatment of enteritis and leptospirosis and as a growth
promoter turned up in fresh manure containing 14 µg g-1
(Elmund et al. 1971).
Furtula et al. (2010) concluded that poultry litter contributes to the environmental
load of certain antibiotic feed additives at ranges of 0.07 to 66 mg L-1
and Malintan
& Mohd (2006) detected eight sulphonamide antibiotics ranging in concentration
from 5.03 ng L-1
to 94.95 ng L-1
in swine wastewater from three sites in Malaysia.
Fisher & Scott (2008) monitored a large area of Australian grasslands and adjoining
wetlands for antibiotics from dairy farms and showed that ng L-1
concentrations were
detectable at sites away from the source and suggested that variability among results
could be down to variability in the geology of the catchment area.
4.2.1.7. Aquaculture
Aquaculture is probably the most direct source for veterinary pharmaceuticals to
enter into the aquatic environment. Only a small number of compounds are
approved for the treatment of fish, including amoxicillin, flumequine,
oxytetracycline, sulphamerazine and thiamphenicol which are often administered by

93
feed additives or injection of individuals (Bloom 2001). Approximately 70% to 80%
of antibiotics are released into the aquatic environment from urinary and faecal
excretion and uneaten medicated feed (Martinsen & Horsberg 1995; Abedini et al.
1998; Haug & Hals 2000; Samuelsen et al. 2003). These substances are most
commonly detected in the sediment below fish farming structures at low mg kg-1
concentrations (Jacobsen & Berglind 1988; Björklund et al. 1991; Coyne et al.
1994). However, measured concentrations maybe variable and depend on location
as adsorption and degradation rates can depend on the nature of the sediment (sand,
sandy/clay, clay) and microbial composition (Pouliquen & Le Bris 1996).
4.2.2. Secondary sources
4.2.2.1. Sewage Treatment Plants
Many European buildings have sanitation systems that are connected to sewers for
the collection of wastewaters. Domestic, commercial and industrial wastewaters are
combined and treated in STPs and final effluents containing pharmaceuticals are
released into receiving waters (Zuccato et al. 2005; Jones et al. 2007; Gros et al.
2006; Roberts & Thomas 2006; Vasskog et al. 2006; Togola & Budzinski 2008;
Zhang et al. 2007; Schultz & Furlong 2008). STP discharges account for a high
percentage of pharmaceutical inputs into the aquatic environment, which are
determined by the mass balance of primary sources, the lifestyle of the population
and the population equivalent. For example, the number of hospitals within a STP
catchment may increase the number of hospital specific drugs (Ort et al. 2010;
Thomas et al. 2007; Verlicchi et al. 2010) and differences in STP population
equivalents will determine the concentrations of pharmaceuticals in influent
wastewater (Lin et al. 2009; Vasskog et al. 2008).

94
During the wastewater treatment process, pharmaceuticals are incompletely
removed (Ternes 1998) as STPs are designed to remove the biochemical oxygen
demand (BOD), chemical oxygen demand (COD), total suspended solids (TSS) and
nutrients including NH3 and NH4-, from wastewater (DEFRA 2006; Velagaleti et al.
2002). Even-though trace concentrations of many pharmaceuticals are measured in
receiving waters (Camacho-Munoz et al. 2010; Morasch et al. 2010), the treatment
process used in STPs can reduce the concentrations between influents and effluents
(table 8). In addition, the length of time that compounds are present in sedimentation
tanks, the hydraulic retention time and tertiary treatments may influence degradation
and partitioning of specific compounds (Jones et al. 2007).
Table 8. Reduction in pharmaceutical concentrations during STP treatment
STP Treatment process Compound Influent
(µg L-1
)
Effluent
(µg L-1
) Reference
Howden STP,
UK Activated sludge and UV Ibuprofen 7.74-33.76 1.98-4.23
Roberts and
Thomas 2006
Diclofenac 0.901-1.036 0.261-0.598
STP, Germany Activated sludge Ibuprofen 5.533 Nd Quintana and
Reemtsma 2004
Diclofenac 0.2333 0.1561
VEAS STP,
Norway
Filtration, flocculation,
sedimentation, nitrification and denitrification
Citalopram 0.303 0.238 Vasskog et al.
2008
Sertraline 0.019 0.007
Langnes STP, Norway
Less advanced than VEAS Citalopram 0.062 0.024
Sertraline 0.0084 0.0061
4.2.2.2. Biosolids
Pharmaceuticals can accumulate in the solid phase of sewage treatment and become
sorbed to biosolids that are used as alternatives to inorganic fertilisers in agriculture.
In 2005, 995, 000 tonnes of liquid municipal biosolids (LMBs) and dewatered
municipal biosolids (DMBs) was applied to English and Welsh agricultural fields
(DEFRA 2005) and as a result, many compounds can concentrate in soils, leach to

95
groundwaters and runoff to nearby watercourses (Rooklidge 2004). LMBs that
contained acidic drugs, neutral drugs, beta-blockers, sulphonamide antibiotics and
bacteriocides were applied to soil microplots for 266 day rainfall induced runoff
studies. All studied compounds were measured in runoff after day one of rainfall
application and carbamazepine and triclosan were detected at low concentrations
after a runoff event 266 days post LMB application (Topp et al. 2008). Lapen et al.
(2008) applied LMBs to tile drained agricultural fields in Winchester, Ontario,
Canada and found that the acidic drugs naproxen, ibuprofen and gemfibrozil were
detected in the highest concentrations 3 to 5 h post application. Similar field trials
were also conducted for DMBs and results showed that DMB application to fields
leads to less runoff of pharmaceuticals compounds (Edwards et al. 2009). However,
rates of runoff and leaching can vary depending on a number of factors such as soil
type, aspect of field and precipitation rates. Gielen et al. (2009) investigated these
factors and found that soil type was the most influential parameter in reducing
leaching of carbamazepine, suggesting that pharmaceutical mobility could vary
within catchments.
4.2.2.3. Landfill sites
Pharmaceutical compounds can accumulate in municipal landfill sites that are used
for the disposal of household, industrial and agricultural wastes. An American
landfill site that received industrial waste from a hospital was responsible for
contaminating a nearby shallow groundwater with pentobarbital, meprobamate and
phensuximide (Eckel et al. 1993) and a Danish landfill site that received waste from
a pharmaceutical manufacturing plant produced a large variety of compounds down
a leachate gradient (Holm et al. 1995). Barnes et al. (2004) also detected a number

96
of pharmaceuticals in a landfill leachate plume that contaminated groundwater.
Modern landfills are now equipped with protective barriers and leachate collection
systems and some leachates are also treated with active charcoal filtration or high
pressure reverse osmosis (Metzger 2004). However, many of the older landfills still
leach compounds into the environment and the leachate produced from modern
landfills is of concern (Visvanathan et al. 2007).
Table 9. Measured concentrations of pharmaceutical compounds from source
wastewater (µg L-1
) and biosolids (µg g-1
dry weight)
Source Therapeutic
class Compound Concentration Reference
Private households (Taiwan) Antibiotic Nalidixic acid 0.178 (med) Lin et al. 2008
Private households (Taiwan) Cardiovascular Atenolol 1.03 (med) Lin et al. 2008
Private households (Taiwan) NSAID Ibuprofen 0.747 (med) Lin et al. 2008
Hospitals (USA) Antibiotic Ofloxacin 4.9-35.5 (range) Brown et al. 2006
Hospitals (Spain) Antibiotic Erythromycin 0.025 (mean) 0.01-0.03 (range) Gomez et al. 2006
Hospitals (Switzerland) Antibiotic Ciprofloxacin 2-83 (range) Hartmann et al. 1998
Hospitals (Spain) Antidepressant Carbamazepine 0.04 (mean) 0.03-0.07 (range) Gomez et al. 2006
Hospitals (Norway) Cardiovascular Metoprolol 0.591 (med) 2.232 (max) Thomas et al. 2007
Hospitals (Norway) Cardiovascular Metoprolol 3.41 (med) 25.097 (max) Thomas et al. 2007
Hospitals (Taiwan) NSAID Ibuprofen 0.282 (med) Lin et al. 2008
Hospitals (Taiwan) NSAID Naproxen 0.47 (med) Lin et al. 2008
Retirement home (USA) Antibiotic Ofloxacin 23.5 (only) Brown et al. 2006
Manufacturing plant (Croatia) Antibiotic Sulphaguanidine >1100 (only) Babić et al. 2007
Manufacturing plant (India) Antibiotic Enrofloxacin 780–900 (range) Larsson et al. 2007
Manufacturing plant (Taiwan) Antidepressant Carbamazepine 7.81 (med) Lin et al. 2008
Manufacturing plant (Taiwan) Cardiovascular Propranolol 63.9 (max) Lin and Tsai 2009
Manufacturing plant (Taiwan) NSAID Naproxen 1.05 (max) Lin and Tsai 2009
Agriculture (Australia) Antibiotic Sulphasalazine 0.076-0.321 (range) Fisher and Scott 2008
Agriculture (Malaysia) Antibiotic Sulphamethoxyp
yridazine 0.00512-0.0950 (range) Malintan and Mohd 2006
Agriculture (Taiwan) Antidepressant Carbamazepine 0.003 (med) Lin et al. 2008
Aquacultures (Taiwan) NSAID Acetaminophen 0.021 (med) Lin et al. 2008
Aquacultures (Taiwan) NSAID Ibuprofen 0.05 (med) Lin et al. 2008
Aquacultures (Taiwan) NSAID Diclofenac 0.004 (med) Lin et al. 2008
Biosolids (USA) NSAID Naproxen 0.024 (mean) Edwards et al. 2009
Biosolids (USA) Antidepressant Fluoxetine 0.083±0.018 Lapen et al. 2008
Biosolids (USA) Cardiovascular Atenolol 0.0016±0.0006 Sabourin et al. 2009
Landfill (USA) Antidepressant Fluoxetine 0.018 (mean) Barnes et al. 2004
Landfill (USA) NSAID Acetaminophen 0.009 (mean) Barnes et al. 2004

97
Landfill (USA) NSAID Codeine 0.24 (mean) Barnes et al. 2004
Landfill (USA) NSAID Ibuprofen 0.018 (mean) Barnes et al. 2004
4.3. Discussion
The E.U. WFD is replacing seven existing European Economic Community (EEC)
water directives to streamline legislation and unify water management practices
across Europe. The approach requires member states to define the geographical and
hydrological boundaries of river catchments and use RBDs as a framework for
managing biological and chemical water quality. RBMPs will assess the current
pressures facing water bodies and catchment specific PoMs will be managed by
industrial and business sectors. Across Europe, EQS for priority pollutants have
been established for protecting a range of biological receptors (Annex VIII).
The WFD implementation strategy expects member states to adopt RBMPs
by December 2009 (Article 13) and have the PoMs operational by December 2012
(Article 11). Achieving good status for surface water and groundwater is required by
December 2015 when the first updates from the RBMPs are submitted before the
next improvement cycle begins (European Commission 2009). The current situation
indicates that many EU and European Economic Area (EEA) countries have already
adopted RBMPs. Norway lies outside of the EU but forms the EEA agreement with
a time lag of nine years compared with the EU directive. Consultation on the draft
RBMPs in Spain and Portugal have yet to start even though both countries are EU
member states. Both countries share international RBDs and implementation of
RBMPs requires cooperation across political boundaries (ICPDR 2009).
In England and Wales, the WFD was transposed into national law in 2003.
The Environment Agency established eleven RBDs and developed RBMPs that
account for WFD requirements and catchment specific activities (DEFRA 2006;

98
Environment Agency 2010b). All RBMPs have been adopted and PoMs established
for individual sectors to manage. As the PoMs are being implemented the EA will
continue its programme of investigations for waters that were not set an objective for
achieving a good status. Investigations will be completed by December 2012 and the
information gathered for these waters will be phased into the next planning cycle.
The progressive nature of the WFD continually reviews the status of waters
and allows for RBMPs to be redesigned for accommodating new PoMs in future
cycles. For pharmaceuticals to be considered as future primary pollutants (Bottoni et
al. 2010) accurate source assessment should be used for determining the risk they
pose to the environment. The source assessment should measure all emissions and
identify source contributions on a catchment level (Chon et al. 2010). The results of
the source assessment can be used for identifying the main sources and drugs of
concern for catchment specific risk assessment. Water management agencies can
then decide the best management option for reducing the risk of pharmaceuticals to
receiving waters.
Pharmaceuticals are complex molecules that can enter into the environment
from multiple sources which are variable at catchment levels. Human
pharmaceuticals enter the environment from point sources and accumulate in STPs
before being released in to the aquatic environment (Mullot et al. 2010; Sim et al.
2011). In addition, biosolids can remove human pharmaceuticals and release them
into terrestrial ecosystems to follow the same fate of veterinary pharmaceuticals that
are more predominately used in rural catchments (Boxall et al. 2003; Lee et al. 2007;
Lapen et al. 2008; Topp et al. 2008). Most measures of pharmaceutical
concentrations from single point source wastewaters does not fit into the context of
the WFD and leaves huge gaps in data for catchment level assessment. More

99
recently, studies have assessed pharmaceutical emissions using a mass balance
approach that determines the relative inputs of different primary sources in STP
influents (Heberer & Feldmann 2005; Lin et al. 2008; Nagarnaik et al. 2011;
Thomas et al. 2007). Even-though the reports present only a small proportion of
primary sources and pharmaceuticals, this source assessment uses a catchment
methodology for identifying the contributions of primary sources to STP mass
loadings.
During the source assessment, other factors need to be addressed in order to
provide reliable and accurate emission data. Drug use patterns can change during
seasons (Daneshvar et al. 2010a; Daneshvar et al. 2010b) and outbreaks of new
strains of viruses can induce large vaccination programmes (Accinelli et al. 2010).
Commuting between catchments can change working and residing population
figures, and the changing age structure of urban populations will require source
assessment updates that also take into account newly produced drugs. In addition,
the accumulation of medicines (Ruhoy & Daughton 2008) and the disposal of
unused medication via household waste (Bound & Voulvoulis 2005) can skew drug
usage estimates and reduce the accuracy of PEC risk assessments (Bound &
Voulvoulis 2004; Bound & Voulvoulis 2006).
To further improve risk assessments, catchment specific environmental
factors need to be considered. For example, the collection of consumption data for
the accurate refinement of Fpen values within the geographic location and comparison
between catchments. The removal of drugs in STPs can be influenced by different
treatment mechanisms (Vasskog et al. 2008) and dilution factors change depending
on the size of the receiving water. Biologically, the presence of bacteria in a river
system can mineralise certain compounds, with certain species of bacteria

100
mineralising compounds more than other species (Yamamoto et al. 2009). The
abiotic composition of receiving waters can influence indirect photodegradation rates
and increased turbidity can reduce surface water light penetration (Leech et al. 2009;
Liu et al. 2009a). Predictions of directly transformed propranolol hydrochloride
concentrations in UK and US streams were more accurate using PhATE and
GREAT-ER models but future work is required to take into account for cloud cover
and the interrelationships between river flow, turbidity and phototransformation rates
(Robinson et al. 2007). Diffuse pathways for veterinary pharmaceuticals are
currently not considered in PhATE and GREAT-ER (Cunningham 2008) and their
fate is ultimately determined by variability in the weather and geology of the
catchment area (Fisher & Scott 2008). A better understanding of diffuse pathways
would make model predictions more accurate.
Applying source assessment at catchment levels for pharmaceutical sources
will determine the most strategic management strategies. Using a mass balance
approach for determining the relative inputs of individual sources can identify the
main sources for pharmaceutical emissions. This data can be used for modelling
localised source emission trends and compared with data from other areas to
understand catchment variability and determine localised management approaches.
In addition, more complete experimental environmental fate data can be used for
making models more robust by taking into account location specific environmental
changes in catchments. Modelling the source and environmental variability between
catchment can be used to make risk assessments and more accurate.

101
4.4. Conclusion
This chapter reviewed the primary and secondary sources of human and veterinary
pharmaceuticals at catchment levels. It also discussed the factors that need to be
considered for accurate source assessment and how predictive models can be
improved through considering site specific anthropogenic and natural conditions.
The study found that residential areas, hospitals, care homes, prisons and
manufacturing plants can all influence the quantities and types of pharmaceuticals
detected in STP influents, biosolids and landfill sites. In addition, the study shows
that agriculture and aquaculture are major diffuse sources of pharmaceutical inputs
to both terrestrial and aquatic environments.
The levels of pharmaceuticals in receiving waters depend on human activities
and environmental conditions. Therefore, site specific source assessment is required
to develop more accurate predictive models for making informed water management
strategies for local areas. More research is required to determine the impact that
societal and environmental parameters can have on the levels and distributions of
pharmaceuticals in catchments. Eventually, catchment scale models will be required
to take into account the relative contributions of each source.

102
CHAPTER FIVE: RESIDENTIAL HOUSEHOLDS AND CARE HOMES AS
A SOURCE FOR PHARMACEUTICALS IN THE ENVIRONMENT
This chapter investigates care homes as an understudied source for pharmaceuticals
to enter into the environment and compares consumption data to drug use in
residential households.

103
5.1. Introduction
The presence of pharmaceuticals in the environment and their potential for causing
adverse effects in aquatic organisms are generating interest amongst scientists and
the public. Even-though some of these compounds including antibiotics,
antidepressants, cardiovascular drugs, hormones and non-steroidal anti-inflammatory
drugs (NSAIDs) degrade naturally through hydrolysis (El-Gindy et al. 2007;
Waterman et al. 2002), direct (Robinson et al. 2007; Liu & Williams 2007; Zepp &
Cline 1977) and indirect photolysis (Chen et al. 2009; Lam et al. 2003; Pereira et al.
2007; Ryan et al. 2011; Sanchez-Prado et al. 2006), biodegradation (Federle & Itrich
1997; Kunkel & Radke 2008; Pérez et al. 2005; Yamamoto et al. 2009; Yu et al.
2006) and sorption to sediments (Karickhoff et al. 1979; ter Laak et al. 2006;
Pouliquen & Le Bris 1996; Sassman & Lee 2005), many persist in aquatic
environments. Due to the improvement of analytical techniques over the last couple
of decades, trace levels these compounds and many more have been detected in
sewage, freshwaters, marine waters, groundwaters and even drinking water from all
over the world (Ashton et al. 2004; Besse & Garric 2008; Calisto & Esteves 2009;
Jones et al. 2001; Snyder et al. 2003; Ternes 1998). The issue of pharmaceuticals in
the environment now exists as a global concern as public demand for advanced
health care increases, and the production of drugs in high quantities (Jones et al.
2002), could have the potential to cause negative impacts on the aquatic environment
(Jones et al. 2003). For example, receptor sites for pharmaceuticals to have
therapeutic effects in target organisms are present in fish (Gamperl et al. 1994; Reid
et al. 1992) and Haider & Baqri (2000) showed that ß-adrenoceptors in catfish
(Clarias batrachus) are stimulated by the cardiovascular drugs propranolol and
alprenolol to induce oocyte maturation. In addition, the feminisation and
104
masculinisation of fish in many rivers downstream of sewage treatment plants
(STPs) has been attributed to the presence of natural and synthetic steroid
oestrogens, including ethinylestradiol (EE2) (Vos et al. 2000; Jobling 2004; Hinck et
al. 2009) and there are concerns for antibiotic resistance of bacterial biofilms in
environmental matrices (Baquero et al. 2008; Duong et al. 2008; Schwartz et al.
2003; Martinez 2009; Zhang et al. 2009).
The main pathway for human pharmaceuticals to enter into the aquatic
environment is via STPs that collect wastewater from manufacturing plants (Larsson
et al. 2007), residential households (Brown et al. 2006; Lin et al. 2008), hospitals
(Lenz et al. 2007; Escher et al. 2011; Sim et al. 2011; Emmanuel et al. 2009) and
care homes (Brown et al. 2006) and to a lesser extent prisons, pharmacies, dentists
and the military (Ruhoy & Daughton 2008). Even-though data exists for the
concentrations of drugs detected in source emissions, few studies determine the
relative contributions of drugs from individual sources. Thomas et al. (2007)
quantified effluent concentrations of twenty pharmaceutical compounds from two
hospitals. Nagarnaik et al. (2011) characterised the use of nervous system
pharmaceuticals in three healthcare facility wastewaters and (Lin et al. 2008)
compared the presence of drugs in hospital, STP, regional discharge, drug production
facilities, animal husbandry and aquaculture waste streams.
Data about the quantities of drugs used in households and nursing homes are
difficult to obtain and nearly non-existent. To over-come this problem, Bound et al.
(2005) collected unused and expired pharmaceuticals from 463 households in the
southeast of England in the summer of 2003. Over the study period of 9 months,
drugs were collected from the bins provided at each household, every three months,
allowing for seasonal variations in usage patterns. The quantities obtained from

105
households were then compared to pharmaceutical use in care homes. Medical
assessment records (MAR), detailing one month of pharmaceutical use were
collected from 4 care homes in Lincolnshire in the summer of 2010. Both sets of
data were extrapolated to calculate the amounts of drugs used over the period of one
year. . Therefore, this study aims to determine the impact of each source to the
aquatic environment. Without accurate data for the consumption of drugs at a source
level, it is difficult to undertake accurate risk assessments. This will make risk
assessments more accurate for the benefit of environmental management plans.
5.2. Methodology
The primary aim of the project was to collect pharmaceutical consumption data from
nursing homes and households to determine the relative contributions to the aquatic
environment. Household pharmaceutical consumption data was previously collected
in the summer of 2003 during a 9 month household hazardous waste disposal project
that was supported by the Environment Agency and full details are provided by
Bound & Voulvoulis (2005). In brief, the following equation (Equation 6) was used
to calculate the number of homes required to achieve a representative spread of the
UK households and care homes.
n = π (1 – π) z2/e
2 [Eq 6]
A 95% confidence level and a standard error of 0.05 assumes a statistically
significant sample size of 384 (McCall 1982) from a population of 24,475,439
households in the UK (Office of National Statistics 2001) providing homes for
approximately 62,218,761 people. The desired household sample size was targeted

106
in rural and urban areas in the south of England. Households from population
centres including cities (≥ 250,000), large towns (249,000-50,000), mid towns
(49,999-10,000) and small town/village (< 9,999) were identified to represent the
social variability of the UK using socio-demographic models ACORN (A
Classification of Residential Neighbourhoods) and NS-SEC (National Statistics
Socio-Economic Classification). Eleven areas in the South of England were
sampled: three areas in Greater London, four in Oxfordshire and four in the Borough
of Reading. Participants were asked to dispose of used and unwanted
pharmaceuticals into the bin provided. To allow for the possibility of survey
participants having a clear-out of accumulated waste at the start of the project (to
ensure an accurate baseline) the bins were collected after two weeks. Three further
collections were made at three month intervals to allow for seasonal variations in
usage patterns. The obtained data were classified by therapeutic action to allow
comparison with previous disposal studies (Bound & Voulvoulis 2005).
Care homes use monthly repeat prescriptions for long term illnesses and also
store medication for acute pain relief. Medical Assessment Records (MAR) detail
the quantities of drugs used per month and this information was collected directly
from the care home or from the pharmacy that supplies the drugs. Due to patient
confidentiality the names of the care homes and the patients cannot be disclosed. At
present, 20 844 care homes are registered in the UK (Care Home and Nursing Home
UK n.d.) with a population of approximately 410 000 residents (Office Of Fair
Trading 2005). A sample size of 4 homes containing 150 residents was required to
provide a representative spread of drug use from care homes (95% confidence level,
0.5 standard error). The larger standard error results from the smaller population.
The four care homes were situated in a STP catchment in Lincolnshire. The data

107
collected in the summer of 2010 provides an accurate assessment of pharmaceutical
use from two primary sources relative to the UK household and care home
population.
To assess the risk that pharmaceutical use in residential households and care
homes can pose to the environment, the predicted environmental concentration
(PEC) was calculated using the following equation (EMEA 2006).
DOSEai * Fpen [Eq 2]
PEC (mg L-1
) SURFACEWATER =
WASTEWinhab * DILUTION
DOSEai = maximum daily dose consumed per inhabitant (mg inh-1
d-1
); Fpen =
percentage of market penetration (1%) WASTEWinhab = amount of wastewater per
inhabitant per day (200 L inh-1
d-1
); DILUTION = Dilution factor (10). The
calculation of the PEC in surface water makes the following assumptions:
A fraction of the overall market penetration (market penetration factor Fpen)
within the range of existing medicinal products. The applicant may use the
default value or refine the Fpen by providing reasonably justified market
penetration data based on published epidemiological data.
The predicted amount used per year is evenly distributed over the year and
throughout the geographic area.
The sewage system is the main route of entry of the drug substance into the
surface water; there is no biodegradation or retention of the drug substance in the
STP.
Metabolism in the patient is not taken into account.

108
Should the initial PEC calculation trigger the action limit of 0.01µg L-1
in surface
waters, a risk characterisation ratio using PEC and predicted no-effects concentration
(PNEC) is calculated. A value of greater than 1 suggests a risk to the environment.
5.3. Results and discussion
The household drug consumption survey was carried out in southeastern England in
the summer of 2003 to reflect actual age and gender distribution in the UK (Bound &
Voulvoulis 2005) and monthly repeat prescriptions were collected from registered
UK care homes in the summer of 2010. The 463 households that actively
participated in the household hazardous waste project and 4 care homes sampled in
Lincolnshire were calculated to be representative of the 24 475 439 UK homes
(Office of National Statistics 2001) and 20 844 registered UK care homes (Care
Home and Nursing Home UK n.d.).
The method allows for the household and care home consumption data to be
analysed at a UK level and extrapolated down to show drug use per source and per
person level for environmental risk assessment. The masses of drugs recorded
during the 9 month household hazardous waste disposal project and the 1 month care
home study were standardised to show the mass of drugs used per year at each
source and the data shown in table 10 represents the mass of drugs consumed at a
UK level. The masses of drugs used per household and care home are calculated
from the number of UK residential homes and care homes and the population of each
source was used to calculate the mass of drugs used per person.
Drug use between the sources were analysed at a therapeutic class and mass
level. As therapeutic classes of drugs are very diverse and contain mechanistic
classes of drugs that have specific modes of action data is standardised to include

109
mechanistic classes in therapeutic classes. In order to classify the data further, the
presence of a drug with an unknown quantity was classed as below the limit of
quantification (<LOQ). Therefore 5 therapeutic classes that include antiseptics,
carbonic anhydrase inhibitors, hypokalaemia drugs, moisturisers and prostaglandin
analogues and were subsequently not included in any further analysis. The drugs
recorded are administered in different formulations that include tablets, liquids,
powders, inhalers, eye-drops and creams.
Table 10. Drug use in households and care homes
Therapeutic class
(number of drugs) Active ingredient
Mass UK (kg/year)
Households Care homes
Antacid (10) Cimetidine
1400.7
Esomeprazole 2.9
Hydrotalcite and activated dimeticone
43772.4
Lansoprazole 207.5 288.9
Omeprazole 186.8 770.4
Pantoprazole 576.4
Rabeprazole 14.5
Ranitidine 1292.7
Sodium alginate and potassium bicarbonate
<LOQ
Sodium alginate, sodium bicarbonate and calcium carbonate
<LOQ
Antianaemia (4) Ferrous fumarate
2034.5
Ferrous gluconate
1575.8
Ferrous sulphate
2801.4
Ferrous sulphate and ascorbic acid
612.8
Antiasthmatic (7) Budesonide
<LOQ
Budesonide and formoterol fumarate
<LOQ
Montelukast
52.5
Salbutamol <LOQ 15.0
Salbutamol nebules
12.5
Terbutaline sulphate
<LOQ
Zafirlukast
210.1
Antibiotic (17) Amoxycillin 2922.2
Cefalexin 928.7
Chloramphenicol
<LOQ
Clarithromycin 404.9
Doxycycline 461.3
Erythromycin 738.2
Flucloxacillin
1750.9

110
Therapeutic class
(number of drugs) Active ingredient
Mass UK (kg/year)
Households Care homes
Metronidazole 838.2
Oxytetracycline 666.7 437.7
Penicillin 333.4
Phenoxymethylpenicillin 1143.0
Sulphamethoxazole 2324.1
Trimethoprim 693.4 675.3
Tyrothricin 1.0
Nitrofurantoin
700.4
Antibiotic + corticosteroids Fusidic acid and betamethasone valerate
<LOQ
Fusidic acid and hydrocortisone acetate
<LOQ
Anticancer (3) Effudix <LOQ
Letrozole
4.4
Tamoxifen citrate
37.5
Antidementia (10) Co-beneldopa (levodopa and benserazide hydrochloride)
551.5
Co-careldopa (levodopa and carbidopa)
577.8
Donepezil hydrochloride
70.0
Galantamine
42.0
Levodopa and benserazide hydrochloride
1138.1
Levodopa and carbidopa
65.7
Levodopa, carbidopa and entacapone
525.3
Memantine
35.0
Procyclidine
70.0
Rivastigmine
5.3
Antidepressant (14) Amitriptyline hydrochloride 186.3 35.0
Citalopram
770.4
Dosulepin hydrochloride
262.6
Dothiepin 99.3
Escitalopram oxalate
17.5
Fluoxetine hydrochloride 163.3 105.1
Fluphenazine 25.7
Lithium carbonate
1400.7
Lofepramine 376.2
Mirtazapine
213.9
Sertraline
262.6
Tamazepam 17.7
Trazodone 783.7
Venlafaxine hydrochloride
787.9
Antidiabetic (3) Gliclazide
770.4
Metformin
15057.7
Rosiglitazone maleate
14.0
Antidiarrhoea (1) Loperamide hydrochloride 16.2 37.0
Antiemetic (6) Cinnarizine 33.6
Cyclizine 186.4
Domperidone 2.5 52.5
Meclizine 16.8
Metoclopramide 66.4 52.5
Prochlorperazine 51.4 55.0

111
Therapeutic class
(number of drugs) Active ingredient
Mass UK (kg/year)
Households Care homes
Antiepileptic (9) Carbamazepine 4586.5 13657.0
Clonazepam
1.8
Lamotrigine
1650.8
Levetiracetam
22136.3
Phenytoin
1050.5
Pregabalin
1050.5
Primidone
1313.2
Sodium valproate
28464.6
Topiramate
350.2
Antifungal (6) Clotrimazole <LOQ
Clotrimazole (1%) and hydrocortisone (1%)
<LOQ
Clotrimazole (2%)
<LOQ
Ketoconazole
<LOQ
Terbinafine hydrochloride
469.0
Antifungal + corticosteroid Hydrocortisone and miconazole nitrate
<LOQ
Antihistamine (9) Beclomethasone dipropionate 19.3
Betahistine dihydrochloride
252.1
Cetirizine 269.1 113.8
Chlorphenamine maleate 117.6 7.0
Cinnarizine
58.8
Cyclizine hydrochloride
350.2
Hydroxyzine hydrochloride
52.5
Loratidine 916.8
Ranitidine
2401.2
Antimalarial (3) Chloroquine 531.7
Mefloquine 190.0
Proguanil 2582.4
Antimuscarinic (5) Ipratropium bromide
<LOQ
Oxybutynin
8.8
Solifenacin succinate
26.3
Tiotropium bromide monohydrate
67.5
Tolterodine
21.0
Antiosteoporosis (2) Alendronic acid
385.2
Risedronate sodium
8.8
Antipsychotic (5) Amisulpride
192.6
Haloperidol
1.8
Quetiapine
394.0
Risperidone
34.6
Trifluoperazine hydrochloride
5.0
Antiseptic (2) Cetrimide <LOQ
Povidone iodine
<LOQ
Antispasmodic (4) Baclofen
156.3
Hyoscine butylbromide
52.5
Peppermint oil
<LOQ
Quinine sulphate
1575.8
Antithyroid (1) Carbimazole
8.8
Benzodiazepine (6) Chlordiazepoxide hydrochloride
13.1

112
Therapeutic class
(number of drugs) Active ingredient
Mass UK (kg/year)
Households Care homes
Diazepam
52.3
Lorazepam
42.0
Benzodiazepine (non-
benzodiazepine hypnotic) Clomethiazole
360.2
Zolpidem tartrate
26.3
Zopiclone
118.2
Carbonic anhydrase inhibitor
(1) Dorzolamide
<LOQ
Cardiovascular (27)
(ACE inhibitor) Enalapril
8.8
Lisinopril
87.5
Perindopril
24.5
Ramipril
63.5
Cardiovascular (alphablocker)
Alfuzosin hydrochloride
17.5
Tamsulosin hydrochloride
707.9
Cardiovascular (angiotensin II antagonist)
Candesartan cilexetil
56.0
Telmisartan
140.1
Valsartan
140.1
Valsartan and amlodipine besylate
236.4
Cardiovascular
(anticoagulant) Heparinoid
<LOQ
Warfarin sodium
20.0
Cardiovascular
(antiplatelet) Aspirin and dipyridamole
700.4
Clopidogrel hydrogen sulphate
544.0
Dipyridamole
4352.2
Cardiovascular
(betablocker) Atenolol 27.8 481.5
Bisoprolol fumarate 11.9 41.6
Oxprenolol
420.2
Propranolol 19.6
Cardiovascular
(calcium channel blocker) Felodipine
13.1
Diltiazem hydrochloride
315.2
Lacidipine
10.5
Nifedipine 517.4
Cardiovascular
(cardiac glycoside) Digoxin
1422.6
Cardiovascular (nitrate)
Glyceryl trinitrate
<LOQ
Isosorbide mononitrate
630.3
Cardiovascular
(potassium channel activator) Nicorandil
37.5
Contraceptive (4) Desogestrel
512.8
Ethinylestradiol (20ug) and gestodene (75ug)
<LOQ
Ethinylestradiol (30ug) and gestodene (75ug)
<LOQ
Ethinylestradiol and levonorgestrel
157.6
Corticosteroid (8) Beclometasone dipropionate
<LOQ
Betamethasone dipropionate and calcipotriol monohydrate
<LOQ
Betamethasone sodium phosphate
<LOQ
Betamethasone valerate and clioquinol
<LOQ
Clobetasol
<LOQ
Hydrocortisone <LOQ

113
Therapeutic class
(number of drugs) Active ingredient
Mass UK (kg/year)
Households Care homes
Mometasone furoate
<LOQ
Prednisolone sodium phosphate
40.0
Decongestant (1) Pseudoephedrine 62.7
Dietry supplement (5) Calcium carbonate and colecalciferol
<LOQ
Cod liver oil
551.5
Cyanocobalamin
87.5
Folic acid
52.5
Thiamine
525.3
Dieuretic (12) Amiloride hydrochloride
26.3
Bendrofluazide 12.6
Bendroflumethiazide
21.9
Bisacodyl
18.8
Bumetanide 1.4
Co-amilofruse (amiloride hydrochloride and furosemide)
371.4
Co-amilozide (amiloride hydrochloride and hydrochlorothiazide)
48.1
Flavoxate hydrochloride
1050.5
Frusemide 313.1
Furosemide
2083.6
Indapamide 4.4 7.0
Spironolactone 74.9 43.8
Hormone (9) Conjugated Oestrogens 12.4
Dydrogesterone 6.1
EE2 0.1
Estradiol 16.4
Levothyroxine
1670.8
Medroxyprogesterone acetate 8.1 175.1
Norethisterone 645.5
Progesterone 1.4
Tibolone
13.1
Hypokalaemia (1) Potassium bicarbonate and potassium chloride
<LOQ
Laxative (4) (osmotic)
Lactulose
535.7
Macrogol, sodium bicarbonate, sodium chloride and potassium
chloride <LOQ
Laxative
(stimulant) Senna
328.3
Sodium picosulfate monohydrate
6.3
Moisturiser (9) (eye)
Carbomer
<LOQ
White soft paraffin, liquid paraffin and lanolin alcohols
<LOQ
Moisturiser (skin)
Dimeticone and benzalkonium chloride
<LOQ
Dimeticone, zinc oxide and calamine
<LOQ
Emulsifying ointment and phenoxyethanol
<LOQ
Emulsifying wax, yellow soft paraffin and liquid paraffin
<LOQ
Light liquid paraffin, white soft paraffin and anhydrous lanolin
<LOQ
Liquid paraffin, white soft paraffin, cetomacrogol and cetostearyl
alcohol <LOQ
White soft paraffin and light liquid paraffin
<LOQ
Mucolytic (2) Carbocisteine
2016.7
Mecysteine hydrochloride
1050.5

114
Therapeutic class
(number of drugs) Active ingredient
Mass UK (kg/year)
Households Care homes
Painkiller (23) Paracetamol 110968.0 78915.4
Painkiller
(narcotic analgesic) Fentanyl
<LOQ
Painkiller
(NSAID) Aspirin 1966.0 6959.8
Celecoxib 764.5
Dexibuprofen
1050.5
Diclofenac 2332.2 787.9
Felbinac
<LOQ
Ibuprofen (cream)
<LOQ
Ibuprofen (tablet) 8410.0 6303.2
Mefenamic acid 1747.5
Meloxicam 311.4 67.5
Naproxen 491.5
Rofecoxib 144.2
Sodium cromoglicate
<LOQ
Sulphasalazine
1750.9
Painkiller (opioid)
Buprenorphine hydrochloride
<LOQ
Co-codamol (paracetamol and codeine phosphate)
31281.5
Codeine 54.6
Co-dydramol (paracetamol and dihydrocodeine)
11927.4
Dextropropoxyphene 186.8
Dihydrocodeine 30.0
Morphine sulphate 49.2 37.5
Tramadol 87.4
Prostaglandin analogue (1) Latanoprost
<LOQ
Statin (4) Atorvastatin
420.2
Pravastatin sodium
70.0
Rosuvastatin calcium
43.8
Simvastatin 29.6 1313.2
Xanthine oxidase inhibitor (1) Allopurinol
1225.6
The total mass of pharmaceuticals consumed in residential households and care
homes at a UK level in one year is 475.363 tonnes. Figure 5a shows the masses for
42 drugs consumed at a rate of over 1 tonne per annum. The top nine drugs that
include four painkillers, three antiepiletics, one antidiabetic and one antiacid, are all
consumed above 10 tonnes per annum. Paracetamol was by far the most used drug
at a 189.88 tonnes per annum, more than four times the annual amount of 43.77
tonnes of the antiacid hydrotalcite used in the UK. The results of this study show
that 23 of the drugs consumed in residential households and care homes are present

115
in the top 25 English prescription drugs (Jones et al. 2002). In addition, 13 drugs
including paracetamol, metformin hydrochloride, ibuprofen, amoxycillin, sodium
valproate, sulphasalazine, carbamazepine, ferrous sulphate, ranitidine hydrochloride,
diclofenac sodium, flucloxacillin sodium, aspirin and mefenamic acid are in the top
25 for both studies. The two drugs that are included in the top 25 English
prescription drugs and not detected in this study are mesalazine and mebeverine
hydrochloride. In terms of the masses produced, the quantities of drugs recorded in
this study are considerably less suggesting the use of drugs in other industries such
as hospitals (Emmanuel et al. 2009; Escher et al. 2011; Lenz et al. 2007; Sim et al.
2011). In addition, all drugs prescribed by the NHS and dispensed into the
community through Primary Care Trusts (PCTs) and Local Health Boards (LHBs)
(Office of National Statistics 2008) can accumulate in places including pharmacies,
dentists and distributors (Ruhoy & Daughton 2008), remaining unused and
potentially leading to out of date medicines that have to be disposed of under the
Hazardous Waste Regulations (HMSO 2005). In addition, unused medication can be
disposed of through household waste and via sinks and toilets if not returned to the
pharmacy (Bound & Voulvoulis 2005).
Figure 5b shows the number of therapeutic classes of drugs detected and
percent of the total measured concentration. As expected, painkillers were the most
consumed drugs at 56% of the total mass recorded, suggesting the treatment of mild
illnesses with generic medicines is prevalent in the UK. Antiacids, another over-the-
counter generic medicine used for neutralising stomach acidity was the third highest
consumed drug at 10% of the total drugs consumed. Antiepiletics are the most used
prescription drug (16%) resulting from the high masses recorded from the use of
levetiracetam and sodium valproate, mainly for the long term treating of seizures and

116
also for the treatment of bipolar disorders and neuropathic pain (Attal et al. 2006;
Post et al. 2005). Cardiovascular drugs contributed 2.3% which is unsurprising as
heart disease is extremely prevalent in the UK (British Heart Foundation 2008). The
group contains 27 drugs from 9 mechanistic classes including the best selling
antiplatelet clopidogrel. The use of many antidepressants is linked to the increasing
age of the worldwide population (Fratiglioni et al. 1999). Many of the therapeutic
classes containing only one drug are for specific conditions such as over active
thyroids and gastric ulcers. Interestingly, the hormone ethinylestradiol (EE2), an
active ingredient in hormone replacement therapy (HRT) drugs, was the smallest
quantity of drug to be consumed (0.084 kg y-1
) yet has had the most profound
impacts in the environment (Dzieweczynski 2011).

117
A
B
Figure 5. (A) The mass of the 42 most used pharmaceuticals and (B) the
consumption of each therapeutic class of drug as a percentage of the total mass
consumed
18
9.8
8
43
.77
3
1.2
8
28
.46
2
2.1
4
18
.24
1
5.0
6
14
.71
1
1.9
3
8.9
3
4.3
5
3.1
2
2.9
2
2.8
0
2.5
8
2.4
0
2.3
2
2.0
8
2.0
3
2.0
2
1.7
5
1.7
5
1.7
5
1.6
7
1.6
5
1.5
8
1.5
8
1.4
2
1.4
0
1.4
0
1.3
7
1.3
4
1.3
1
1.2
9
1.2
3
1.1
4
1.1
4
1.1
0
1.0
5
1.0
5
1.0
5
1.0
5
1.0
5
0
20
40
60
80
100
120
140
160
180
200
Par
acet
amol
Hyd
rota
lcit
e C
o-c
od
amol
Sod
ium
val
pro
ate
Lev
etir
acet
am
Car
bam
azep
ine
Met
form
in
Ibu
pro
fen
C
o-d
yd
ram
ol
Asp
irin
D
ipyri
dam
ole
D
iclo
fen
ac
Am
oxyci
llin
F
erro
us
sulp
hat
e P
rogu
anil
R
anit
idin
e S
ulp
ham
eth
oxaz
ole
F
uro
sem
ide
Fer
rou
s fu
mar
ate
Car
boci
stei
ne
Flu
cloxac
illi
n
Su
lph
asal
azin
e M
efen
amic
aci
d
Lev
oth
yro
xin
e L
amotr
igin
e F
erro
us
glu
con
ate
Qu
inin
e su
lph
ate
Dig
oxin
C
imet
idin
e L
ith
ium
car
bon
ate
Tri
met
hop
rim
S
imvas
tati
n
Pri
mid
on
e R
anit
idin
e A
llop
uri
nol
Ph
enoxym
eth
ylp
enic
illi
n
Lev
od
op
a O
xyte
trac
ycl
ine
Ph
enyto
in
Pre
gab
alin
F
lavoxat
e M
ecyst
ein
e D
exib
up
rofe
n
Qu
an
tity
(to
nn
es)
Drug
56
16
10
3.3
3.2
2.3
1.5
1.2
0.9
6
0.8
6
0.7
0
0.6
5
0.6
5
0.5
4
0.3
9
0.3
8
0.2
6
0.2
6
0.1
8
0.1
4
0.1
3
0.1
3
0.1
1
0.1
0
0.0
83
0.0
61
0.0
26
0.0
13
0.0
11
0.0
08
8
0.0
08
4
0.0
01
8
0
10
20
30
40
50
60
Pai
nk
ille
r
An
tiep
ilep
tic
An
tiac
ids
An
tid
iab
etic
An
tib
ioti
c
Car
dio
vas
cula
r
An
tian
aem
ia
An
tid
epre
ssan
t
An
tih
ista
min
e
Die
ure
tic
An
tim
alar
ial
An
tid
emen
tia
Mu
coly
tic
Horm
on
e
Sta
tin
An
tisp
asm
od
ic
XO
I
Die
try s
up
ple
men
t
Lax
ativ
e
Con
trac
epti
ve
An
tip
sych
oti
c
Ben
zod
iaze
pin
e
An
tiem
etic
An
tifu
ngal
An
tiost
eop
oro
sis
An
tias
thm
atic
An
tim
usc
arin
ic
Dec
on
ges
tan
t
An
tid
iarr
hoea
An
tica
nce
r
Cort
icost
eroid
An
tith
yro
id
Percen
t o
f to
tal
co
nsu
med
ma
ss
Therapeutic class

118
Drug use between households and care homes contribute 32.5 per cent (154283 kg y-
1) and 67.5 per cent (321080 kg y
-1) to the total respectively. Therefore, it can be
suggested that care homes contribute a greater quantity of drugs to the aquatic
environment across the UK. Figure 6 details the distribution of therapeutic class
drug mass between the studied sources. Out of the 32 therapeutic classes, 97 per
cent of these were used in care homes (31) while 69 per cent were used in
households (22). In addition, 44 per cent of the therapeutic classes were used in both
primary sources (14). Cardiovascular drugs are used most extensively in care homes
and painkillers are detected the most in households and are also the most used drug
between the two primary sources indicating the generic nature of the drug for
alleviating mild illness. Many of the drugs used in care homes and excluded in
households are prescription drugs that are used to treat specific conditions that are
generally related to old age. For example, the onset of dementia in some elderly
people requires treatment with prescription only drugs. In addition to old age
acquired health problems, antimuscarinic drugs and antipsychotic drugs are
associated with a level of care that is required around the clock. Pharmaceutical uses
in households are generally used for low level illness including colds and hay fever
that are treated with over-the-counter drugs. In more severe levels of illness,
prescription drugs are acquired through a GP for the treatment of cardiovascular and
mental illness that can be treated at home when round the clock care are not
currently required.

119
Figure 6. The relative distribution of drug use in households and care homes (■
households ■ care homes)
0%
10%
20%
30%
40%
50%
60%
70%
80%
90%
100%
Pai
nk
ille
r
An
tiep
ilep
tic
An
taci
d
An
tid
iab
etic
An
tib
ioti
c
Car
dio
vas
cula
r
An
tian
aem
ia
An
tid
epre
ssan
t
An
tih
ista
min
e
Die
ure
tic
An
tim
alar
ial
An
tid
emen
tia
Mu
coly
tic
Horm
on
e
Sta
tin
An
tisp
asm
od
ic
XO
I
Die
try s
up
ple
men
t
Lax
ativ
e
Con
trac
epti
ve
An
tip
sych
oti
c
Ben
zod
iaze
pin
e
An
tiem
etic
An
tifu
ngal
An
tiost
eop
oro
sis
An
tias
thm
atic
An
tim
usc
arin
ic
Dec
on
ges
tan
t
An
tid
iarr
hoea
An
tica
nce
r
Cort
icost
eroid
An
tith
yro
id
Rela
tive d
istr
ibu
tio
n o
f d
ru
g m
ass
in
tw
o s
ou
rces
Therapeutic class
0%
10%
20%
30%
40%
50%
60%
70%
80%
90%
100%
Pai
nk
ille
r
An
tiep
ilep
tic
An
tiac
ids
An
tid
iab
etic
An
tib
ioti
c
Car
dio
vas
cula
r
An
tian
aem
ia
An
tid
epre
ssan
t
An
tih
ista
min
e
Die
ure
tic
An
tim
alar
ial
An
tid
emen
tia
Mu
coly
tic
Horm
on
e
Sta
tin
An
tisp
asm
od
ic
XO
I
Die
try s
up
ple
men
t
Lax
ativ
e
Con
trac
epti
ve
An
tip
sych
oti
c
Ben
zod
iaze
pin
e
An
tiem
etic
An
tifu
ngal
An
tiost
eop
oro
sis
An
tias
thm
atic
An
tim
usc
arin
ic
Dec
on
ges
tan
t
An
tid
iarr
hoea
An
tica
nce
r
Cort
icost
eroid
An
tith
yro
id
Rela
tive d
istr
ibu
tio
n o
f d
ru
g m
ass
in
tw
o s
ou
rces
Therapeutic class
Care homes
Households

120
5.3.1. Risk assessment
The risk to the environment from the inputs of pharmaceuticals from source
emissions is characterised from the ratio of PEC to PNEC (Carlsson, Johansson,
Alvan, Bergman & Kühler 2006a; Carlsson, Johansson, Alvan, Bergman & Kühler
2006b). PEC and PNEC values were calculated for the 25 drugs that were present in
both residential households and care homes and the data is presented in Table 11.
The lowest PNECs available in the literature are reported for worst case scenarios to
the environment.
Table 11. Risk assessment of the 25 drugs used in residential households and
care homes
Active
ingredient DOSEai (mg) PEC (µg L
-1) PNEC PEC:PNEC (µg L
-1)
HH+CH HH CH HH+CH HH CH HH+CH HH CH
Paracetamol 532.25 4.92 527.33 2.66 0.025 2.64 9.20a 0.29 0.0027 0.29
Carbamazepine 91.46 0.20 91.26 0.46 0.0010 0.46 0.50b 0.91 0.0020 0.91
Ibuprofen 42.49 0.37 42.12 0.21 0.0019 0.21 9.06a 0.023 0.00021 0.023
Aspirin 46.59 0.087 46.51 0.23 0.00044 0.23 61a 0.0038 0.0000071 0.0038
Diclofenac 5.37 0.10 5.26 0.027 0.00052 0.026 20b 0.0013 0.000026 0.0013
Trimethoprim 4.54 0.031 4.51 0.023 0.00015 0.023 16e 0.00142 0.0000096 0.00141
Simvastatin 8.78 0.0013 8.77 0.044 0.0000066 0.044
Oxytetracycline 2.95 0.030 2.92 0.015 0.00015 0.015 440c 3.4E-05 3.4E-07 3.3E-05
Omeprazole 5.16 0.0083 5.15 0.026 0.000041 0.026
Atenolol 3.22 0.0012 3.22 0.016 0.0000062 0.016 10000d 1.6E-06 6.2E-10 1.6E-06
Lansoprazole 1.94 0.0092 1.93 0.0097 0.000046 0.0097
Cetirizine 0.77 0.012 0.76 0.0039 0.000060 0.0038
Meloxicam 0.47 0.014 0.45 0.0023 0.000069 0.0023
Fluoxetine
hydrochloride 0.71 0.0072 0.70 0.0035 0.000036 0.0035
Amitriptyline hydrochloride
0.24 0.0083 0.23 0.0012 0.000041 0.0012
Medroxyprogest
erone acetate 1.17 0.00036 1.17 0.0059 0.0000018 0.0058
Chlorphenamine
maleate 0.052 0.0052 0.047 0.00026 0.000026 0.00023
Metoclopramide 0.35 0.0029 0.35 0.0018 0.000015 0.0018

121
Spironolactone 0.30 0.0033 0.29 0.0015 0.000017 0.0015
Prochlorperazine 0.37 0.0023 0.37 0.0018 0.000011 0.0018
Morphine sulphate
0.25 0.0022 0.25 0.0013 0.000011 0.00125
Domperidone 0.35 0.00011 0.35 0.0018 0.00000054 0.0018
Bisoprolol
fumarate 0.28 0.00053 0.28 0.0014 0.0000026 0.0014
Loperamide hydrochloride
0.25 0.00072 0.25 0.0012 0.0000036 0.0012
Indapamide 0.047 0.00019 0.047 0.00023 0.0000010 0.00023
a (Stuer-Lauridsen et al. 2000) b (Ferrari et al. 2004) c (Schwab et al. 2005) d (Lin et al. 2008) e
(Grung et al. 2008)
The PEC action limit of 0.01 µg L-1
was triggered for 10 of the compounds that were
used in both residential households and care homes. All of these compounds were
used in care and paracetamol was the only drug to have a PEC value above the action
limit for residential households. The PEC:PNEC risk characterisation ratio for the
10 compounds were calculated below 1 µg L-1
. No data was available for calculating
the PEC:PNEC values for simvastatin and omeprazole. As a result, the combined
drug use from residential households and care homes are unlikely to have toxicity
towards aquatic organisms. However, the trigger concentration of 0.01 µg L-1
in the
initial PEC calculation is not scientifically validated and some pharmaceuticals are
known to have effects at lower concentrations (CSTEE 2001). For example,
ethinylestradiol bioaccumulates in the bile of fish to increase vitellogenin levels in
blood plasmas at concentrations below 0.01 µg L-1
(Larsson et al. 1999). Moreover,
pharmaceuticals are continuously released from STPs and it is the chronic effects of
low level pressures that raise concerns rather than acute toxic effects. This point is
highlighted as 7 day repeat dose toxicity results on C. dubia using carbamazepine,
clofibric acid and diclofenac have greater sub-lethal effects than EC50 48 h studies
(Ferrari et al. 2003).

122
The relationship between PECs and measured environmental concentrations
(MECs) are dependent on the presence of other sources and the nature of the
receiving environment. The PEC of ibuprofen from this study (0.21 µg L-1
) was
below the MEC in the river Thames (3.08 µg L-1
) and above the maximum medium
concentration measured in the river Ely (36 ng L-1
). The population of the
geographical area and other anthropogenic sources including hospitals, prisons,
manufacturing plants, agriculture and aquaculture can all effect the concentrations
entering receiving waters and the composition of river waters can influence the
removal rates of pharmaceuticals.
5.4. Conclusions
The data presented in this study provides a detailed source assessment of the
therapeutic classes and masses of drugs used by residents of private households and
care homes in the UK. Based on the findings of the source assessment, it can be
concluded that more therapeutic classes of drugs and a higher quantity of drugs were
used in nursing homes. The 10 drugs exceeding the PEC action limit of 0.01 µg L-1
were all used in care homes even though the PEC:PNEC values fell below the 1 µg
L-1
limit for further risk assessment.

123
CHAPTER SIX: ENVIRONMENTAL FATE OF PHARMACEUTICAL
MIXTURES IN THE RIVER DART CATCHMENT
The research presented in this chapter was carried out at Brixham Environmental
Laboratories. Ibuprofen, mefenamic acid, paracetamol, propranolol and salbutamol
were irradiated as mixtures and degradation rates were compared to individually
irradiated compounds. Experiments using natural river water samples investigated
degradation rates of pharmaceuticals at specific locations and tides of the river Dart
catchment.

124
6.1. Introduction
As many human APIs are incompletely removed within sewage treatment plants
(STPs) (Ternes 1998) and veterinary antibiotics enter the environment from the
treatment of livestock (Boxall et al. 2003), many pharmaceutical compounds have
been detected in aquatic and terrestrial environments (Ashton et al. 2004; Besse &
Garric 2008; Calisto & Esteves 2009; Jones et al. 2001; Kümmerer 2009c; Lee et al.
2007; Snyder et al. 2003). It is likely that in most natural waters, pharmaceuticals
co-exist as a mixture of compounds in surface water that may have synergistic
effects upon their environmental fate and aquatic toxicity.
Ibuprofen, mefenamic acid and paracetamol are non-steroidal anti-
inflammatory drugs (NSAIDs) with analgesic and antipyretic properties and are
among the most commonly used drugs in the UK (Jones et al. 2002). They are also
non-prescription drugs that can be easily purchased over the counter. Due to the
high consumption of the drugs and partitioning to the aqueous phase in water
treatment processes, µg L-1
concentrations have been detected in STP influent and
effluent, and ng L-1
concentrations in surface waters and groundwaters (Alvarez et al.
2005; Gros et al. 2006; Hilton & Thomas 2003; Kolpin et al. 2002; Roberts &
Thomas 2006; Verstraeten et al. 2005). Propranolol is a non-selective beta-blocker
and a competitive antagonist at both the ß1-adrenoreceptor and ß2- adrenoreceptor
and is used for the treatment of angina and hypertension. Along with other
cardiovascular drugs, propranolol is commonly detected in sewage influents and
effluents (Fono & Sedlak 2005) and also in surface waters at ng L-1
concentrations
(Bendz et al. 2005; Zuccato et al. 2005). Salbutamol is a selective beta-blocker and
acts on the ß2- adrenoreceptors of pulmonary bronchial muscle and is a commonly
used anti-asthmatic drug, which has been measured in surface waters at ng L-1

125
concentrations (Bound & Voulvoulis 2006; Castiglioni et al. 2004). Both
propranolol and salbutamol are prescription drugs.
Once in the aquatic environment, pharmaceutical compounds can undergo a
variety of biotic and abiotic processes including biodegradation (Matamoros et al.
2008; Quintana et al. 2005; Yamamoto et al. 2009), hydrolysis (El-Gindy et al. 2007;
Waterman et al. 2002) and photolysis (Bartels & von Tümpling 2007; Buser et al.
1998; Poiger et al. 2001; Vione et al. 2009), which can have direct and indirect
mechanisms. These depletion mechanisms occur simultaneously in natural surface
waters depending on the physical and chemical properties of pharmaceuticals and
water parameters, therefore requiring further understanding of their kinetics under
environmentally relevant conditions (Liu et al. 2009a). Direct photolysis occurs in
optically dilute solutions when the chromophore of a molecule directly absorbs a
solar photon from a source of incoming radiation (Zepp 1978; Zepp & Cline 1977).
In river waters, the presence of natural sensitising substances can lead to the indirect
photodegradation of certain compounds. After being activated by solar UV photons,
dissolved organic carbon (DOC), nitrate and nitrites can produce reactive oxygen
species including singlet oxygen (102), OH radicals (•OH) and DOC-derived peroxy
radicals (3DOC), which are able to degrade anthropogenic organic compounds (Zepp
et al. 1981; Zepp et al. 1985).
Certain pharmaceutical compounds are susceptible to photodegradation
mechanisms which have been reported in laboratory studies using a number of
matrices. Propranolol is reported to have a fast rate of photodegradation in de-
ionised water (DIW) and an even faster kinetics in natural waters, with half lives of
< 24 hours and <10 hours respectively (Liu & Williams 2007; Liu et al. 2009a;
Piram et al. 2008). In contrast, ibuprofen is stable under direct photolysis conditions

126
(Packer et al. 2003), but degrades rapidly in air-saturated river water matrices (Lin &
Reinhard 2005). Mefenamic acid has been reported to have direct photolysis half
lives ranging from 66 hours to 97 hours depending on experimental conditions and
intensity of natural sunlight (Werner et al. 2005; Yamamoto et al. 2009); however,
data are limited for the photodegradation rates in natural waters. Kinetics data for
the indirect photodegradation of paracetamol are relatively scarce, however, half
lives of 35 hours and 56 hours have been reported for direct photodegradation under
May 2007 and August 2006 Japanese natural sunlight (Yamamoto et al. 2009).
Andreozzi et al. (2003) reported up to 40% mineralisation of paracetamol under
H2O2 photodegradation. Salbutamol is reported to not undergo direct photolysis
(Sakkas et al. 2007).
Many examples of the acute and chronic effects of compound specific
toxicity to aquatic invertebrates exist (Caminada et al. 2006; Graham et al. 2009;
Huggett et al. 2002; Miranda & Zemelman 2001; Wollenberger et al. 2000), and the
complications of using multiple drugs on humans are numerous (Guidry et al. 1979;
Janknegt 1990; Rollof & Vinge 1993). Mixture toxicity to aquatic organisms is less
well documented and requires more research as in some cases it has been reported
that mixtures are more toxic than individual compounds (Cleuvers 2003; Cleuvers
2004) yet some cases report inconclusive evidence of mixture toxicity (Dietrich,
Ploessl, et al. 2010; Dietrich, Dammel, et al. 2010) and propranolol metabolite
mixtures appear to be less toxic to algae and rotifers than parent compound (Liu et
al. 2009b). The environmental fate of pharmaceutical compound mixtures is nearly
non-existent. Doll & Frimmel (2003) suggested that photo-induced degradation of
pharmaceuticals may be influenced by the presence of other pharmaceuticals but

127
many recent literatures focus on the photodegradation of individual compounds
(Chen et al. 2009; Felis et al. 2007; Trovó et al. 2008).
In this study, the removal rates of ibuprofen, mefenamic acid, paracetamol,
propranolol and salbutamol were measured in sterilised and non-sterilised natural
water from high and low tides at three locations (Totnes, Stoke Gabriel and
Dartmouth) from the river Dart, Devon, under light and dark conditions and in de-
ionised water (DIW). In-stream depletion mechanisms (direct and indirect
photodegradation, biodegradation and hydrolysis) are quantified to determine the
prominent removal mechanism for each pharmaceutical. Location and tide analysis
for pharmaceutical degradation are related to river water parameters to determine
optimal conditions for the removal of pharmaceuticals from river Dart surface water.
The results of the study are important for improving the fate and persistence of
pharmaceuticals in the aquatic environment and generate data for more accurate
environmental risk assessment.
6.2. Materials and methods
6.2.1. Study site
The river Dart Catchment (Devon, UK) covers an area of approximately 475km2 and
is formed from the east and west Dart rivers that rise on south east Dartmoor (Figure
7). The river Dart flows for 210km, through the towns of Postbridge and
Buckfastleigh before discharging into the English Channel at Dartmouth. The
approximate population of 31,000 (1991 census) is served primarily by South West
Water Services Ltd (SWWSL) STPs that discharge to surface waters and to ground.
The upper tidal reaches are located on the river Dart at Totnes and at Tuckenhay on
the river Wash.

128
Figure 7. Lower reaches of the river Dart catchment and locations of the three
sample sites
6.2.2. Sample collection and water characterisation
River water samples were taken from the tidal section of the river Dart by Ecospan
Environmental Ltd. Samples were collected from just below the water surface and
1
2
3

129
within half an hour of high and low tides at Totnes (SX 80714 BNG 60590; high tide
height 2.8 m; low tide height 0.2 m), Stoke Gabriel (SX 84256 BNG 57345; high
tide height 4.2 m; low tide height 1.0 m) and Dartmouth (SX 87872 BNG 52855;
high tide height 4.3 m; low tide height 1.0 m) on 10th
August 2009. At each
sampling point, four litres of sample were taken, transported back to the laboratory
and immediately stored at 4°C. Two litres were used for sterilised and non-sterilised
kinetic studies in river water, one litre for archiving for test substance control and
one litre for water parameter analysis by the Environment Agency National
Laboratory Service. Water samples were analysed to quantify dissolved organic
carbon (DOC), ammonia nitrogen, total oxidised nitrogen, nitrate, nitrite,
orthophosphate, conductivity at 20 °C, pH, suspended solids at 105 °C and salinity.
6.2.3. Test substances
The test substances were supplied by Sigma-Aldrich (Dorset, UK). These included
ibuprofen α-Methyl-4-(isobutyl)phenylacetic acid; mefenamic acid, 2-[(2,3-
Dimethylphenyl)amino]benzoic acid; paracetamol, N-Acetyl-4-aminophenol;
propranolol hydrochloride, (±)-1-isopropyl-amino-3-(1-naphthyloxy)-propan-2-ol
hydrochloride and salbutamol, α-[(tert-Butylamino)methyl]-4-hydroxy-m-xylene-
α,α’-diol. The physiochemical properties of these compounds are given in Table 12.

130
Table 12. Physiochemical properties of test substances
Compound Structure
CAS number
MWa
Chemical formulae
Log KOW (a)
pKa (b)
Therapeutic class
Ibuprofen OH
O
15687-27-1
206.28
C13H18O2
3.97
4.91
NSAID with analgesic and
antipyretic properties
Mefenamic acid
OHO
NH
61-68-7
241.29
C15H15NO2
5.12
4.2
NSAID with
analgesic and antipyretic properties
Paracetamol O
NH
OH
103-90-2
151.16
CH3CONHC6H4OH
0.46
9.38
NSAID with
analgesic and
antipyretic properties
Propranolol
hydrochloride
NH
OOH
ClH
318-98-9
295.80
C16H21NO2.HCl
0.74
9.14
beta-adrenoceptor
antagonist
Salbutamol
OH
OH
OHNH
18559-94-9 239.31
C13H21NO3
0.64 10.3
beta-2-adrenoceptor agonist
(a) EPI SuiteTM v4.10
(b) Drug Bank
6.2.4. UV-VIS absorbance spectra
The UV-Visible absorbance spectra of the five test compounds were measured in
DIW at 10 mg L-1
using an Evolution 600 UV-Visible Spectrophotometer (Thermo
Electron Corporation) equipped with 1 cm pathway length CXA-145-050W cuvettes
(Figure 8).

131
Figure 8. UV-Visible absorbance spectra for studied compounds at 10 mg L-1
6.2.5. Photolysis experiments
The OECD guidelines for direct and indirect photolysis of pharmaceuticals were
modified and experiments were performed in a CT room of a GLP compliant
laboratory using previously established methods (Liu & Williams 2007; Liu et al.
2009a). Mixed pharmaceuticals (30 ml at 100 µg L-1
) were placed in borosilicate
glass reaction vessels (4.6 cm i.d x 3.2 cm depth) with blackened sides and quartz
glass lids and placed in a temperature controlled silicone oil water bath. The
temperature of the reaction vessels was maintained at 20 ± 3 °C using a Haake K20
refrigerated circular bath coupled with a Haake DC3 circulator (Karlsruhe,
Germany) and monitored hourly using the in house alarmed PMS system. Magnetic
stirrer fleas (1cm diameter) were placed in the reaction vessels and turned using HI
300N magnetic stirrers (Hanna Instruments) placed beneath the water bath. The
samples were then exposed to a Heraeus Suntest CPS Photosimulator (Hanau)
equipped with a 1.1 kW xenon arc lamp (light intensity 7) and filters to remove UV
(<290 nm) and IR radiation (>800 nm). The solar irradiance was measured with a
0.0
0.2
0.4
0.6
0.8
1.0
1.2
1.4
1.6
1.8
200 250 300 350 400
Ab
sorb
ance
Wavelength (nm)
Ibuprofen
Mefenamic acid
Propranolol
Salbutamol
Paracetamol
Ibuprofen
Mefenamic acid
Propranolol
Salbutamol

132
Spectrad Spectroradiometer (Glen Spectra Ltd) at the beginning and the end of each
experiment.
In total, four experiments were undertaken. Individual compounds and
mixtures of compounds in DIW were irradiated in experiment 1; mixtures of
compounds in Stoke Gabriel high and low tide river water were irradiated in
experiment 2; mixtures of compounds in Dartmouth high and low tide river water
were irradiated in experiment 3 and mixtures of compounds in Totnes high and low
tide river water were irradiated in experiment 4. In each experiment, replicated non-
sterilised and sterilised water samples were irradiated for 168h and non-sterilised and
sterilised dark controls were sampled in conjunction to determine comparative
depletion kinetics of pharmaceuticals in DIW and river water. Approximately 1 mL
aliquots were taken at regular intervals and analysed using HPLC.
6.2.6. Chemical Analysis
Analyses were carried out using an Agilent 1200 HPLC (Santa Clara, California,
USA) system equipped with GINA StarTM version 4.07 software and HPLC
separation was achieved using a Synergi 4u Polar RP80A column (150 mm x 3 mm;
4µm Phenomenex). Injection volume was 200 µL and eluent A was 0.1 % acetic
acid in water and eluent B was 0.1 % acetic acid in acetonitrile. The five compounds
were separated using two chromatographic methods. Paracetamol was detected at
248 nm; eluent flow rate was set at 1 mL min-1
and the gradient was held at 95 %
eluent A for 1 min before rising to 100 % B after 4 mins. Ibuprofen, mefenamic
acid, propranolol and salbutamol were detected at 222 nm; eluent flow rate was set at
0.75 mL min-1
and the gradient of 95% A was held for 2 min, increased to 60 % A at
2.1 min and reached 100 % B after 11 min. Clean up of the column was achieved by
133
running 100 % B for 1 min and 100 % A for 1 min. Working standards were used to
generate calibration curves and linearity was obtained with correlation coefficients of
R2 > 0.998.
6.2.7. Statistical analysis
In order to understand the environmental persistence of pharmaceuticals in DIW and
river water matrices, exponential regressions were fitted to the HPLC derived
concentration data to produce rate constants and half lives. Rate constants were
assessed for significance using Students t-tests (p = 0.05, 2-sided) and to determine
statistical differences between mixtures of compounds/individual compounds and
between high and low tides. One way ANOVA (p = 0.05) was used for determining
significant differences between river locations. The relationship between rate
constants and river water matrices were assessed using Pearson’s product-moment
correlation coefficients (two-tailed t-statistics to a 0.05 significance level). Light and
dark experiments using sterilised and non-sterilised river waters gave results for
determining the environmental degradation pathways of the selected compounds,
which include direct and indirect photodegradation, biodegradation and hydrolysis.
6.3. Results and discussion
6.3.1. Parameter profile of the river Dart sampling locations
In-stream depletion mechanisms for the degradation of the five pharmaceuticals in
the tidal reaches of the river Dart are determined by location and tide specific
chemical and biological parameters. The concentrations of in situ and laboratory
analysis of environmental variables (Table 13) are determined by sampling location
and comparable with data collected from the river Exe and river Tamar, Devon (Liu

134
et al. 2009a). Agricultural practice in the river Dart catchment combined with the
release of treated effluent from STPs suggested higher nitrate levels at Totnes and
Stoke Gabriel and increased downstream ammoniacal nitrogen concentrations. The
levels of suspended solids measured at Stoke Gabriel indicated the maximum
turbidity of the sampling strategy, which should change seasonally as a function of
freshwater input and the tidal nature of the river (The Wildlife Trust Devon 2004).
Table 13. River Dart water parameters
Parameter Totnes
High Tide
Totnes
Low Tide
Stoke Gabriel
High Tide
Stoke Gabriel
Low Tide
Dartmouth
High Tide
Dartmouth
Low Tide
Sampling temperature (°C) 14.71 15.47 17.10 16.36 16.35 17.31
DO2 (%) (field) 94.90 100.00 89.30 90.20 97.70 96.50
pH (field) 8.69 7.87 7.79 7.91 7.80 7.50
pH 7.51 7.53 7.92 7.77 8.16 8.13
Salinity (ppt) (field) 0.09 0.08 18.57 3.79 33.46 27.15
Salinity (ppt) <1.00 <1.00 17.70 3.60 30.70 25.60
Conductivity at 20 °C (µS cm-1) 164 155 25200 5920 41700 35200
REDOX (mV ORP) 185 201 180 199 215 203
Ammoniacal nitrogen (mg L-1) <0.0300 <0.0300 1.0100 0.0582 0.6830 0.9210
Total oxidised nitrogen (mg L-1) 1.40 1.13 0.34 1.26 <0.20 <0.20
Nitrate (mg L-1) <1.40 <1.13 <0.34 <1.26 <0.20 <0.20
Nitrite (mg L-1) <0.004 <0.004 <0.004 <0.004 <0.004 <0.004
Orthophosphate (mg L-1) 0.0357 0.0292 0.0429 0.0375 <0.0200 0.0220
Suspended solids at 105°C (mg L-1) <3.00 3.00 12.00 16.00 <3.00 7.00
DOC (mg L-1) 2.550 1.710 2.480 1.810 1.720 2.050
6.3.2. Removal mechanisms of pharmaceuticals under the experimental conditions
The absorbance spectra of the five pharmaceuticals are shown in Figure 8. Singular
and mixture compound degradation kinetics under simulated sunlight in DIW and
environmental matrices are given in Table 14. Precision of light induced singular
and mixture compound degradation is achieved through photolysis experiment
replication. The environmental degradation pathways for each pharmaceutical are
determined through light and dark experiments in sterilised and non-sterilised river
waters from all three locations. Direct photodegradation (DP), indirect
photodegradation (IP), light induced biodegradation (LB), dark biodegradation (DB)

135
and hydrolysis (H) are tested by the experimental design. Non-sterilised light
experiments represent overall degradation (k(DP+IP+LB+H)), and sterilised light
experiments represent photodegradation kinetics (k(DP+IP+H)). Under dark conditions,
non-sterilised dark controls measure dark biodegradation (k(DB+H)) and sterilised dark
controls indicate hydrolysis (k(H)).
6.3.2.1. Ibuprofen
Ibuprofen has a lambda max of 223 nm is the slowest of all the compounds to
degrade under the experimental conditions. The dark controls in DIW and sterilised
river waters remained unchanged indicating that hydrolysis and biodegradation are
not responsible for removing ibuprofen from the surface water of the river Dart. The
degradation rate under direct photodegradation conditions (k = 0.0015; t1/2 = 470 h)
relates to other studies (Lin & Reinhard 2005; Packer et al. 2003; Yamamoto et al.
2009) and results from decarboxylation of the carboxylic acid functional group due
to UV excitation from singlet to triplet excited state (Musa & Eriksson 2007).
Insignificant although slightly faster removal of ibuprofen was observed in sterilised
(k = 0.0019; t1/2 = 367 h) and non-sterilised (k = 0.0016; t1/2 = 442 h) river waters
suggesting that direct photodegradation is the main mechanism for the removal of
ibuprofen in river Dart surface waters. The kinetics measured between sterilised and
non-sterilised water samples at Totnes low tides and Stoke Gabriel high tides were
significantly different. This highlights the importance of location specific
environmental variables in determining the extent of pharmaceutical removal from
surface waters of the studied locations.

136
6.3.2.2. Mefenamic acid
Mefenamic acid underwent much faster direct photodegradation than ibuprofen in
DIW with a mean rate constant (k) of 0.0043 h-1
and half life (t1/2) of 162 h, which
were comparable to previously measured rate constants for mefenamic acid in DIW
(Werner et al. 2005; Yamamoto et al. 2009). Indirect photodegradation kinetics (k =
0.012; t1/2 = 59) in sterilised natural waters were significantly faster (t (18) = 2.10, p
= 3 x 10-05
) than direct photodegradation reaction kinetics, demonstrating a
photosensitizing effect in river surface water. All dark controls in sterilised river
water remained unchanged suggesting that hydrolysis does not occur under these test
conditions. Measured kinetics in non-sterilised river (k = 0.0097; t1/2 = 72) waters
were significantly slower (t (30) = 2.04, p = 0.0117) that indirect photodegradation
kinetics suggesting that the presence of biological material slows down
photodegradation by inhibiting light from penetrating the chromophore of the
compound. As a result, biodegradation was found to only remove mefenamic at
Totnes and photodegradation was the main mechanism responsible for the removal
of mefenamic from the studied locations.
6.3.2.3. Paracetamol
Paracetamol has a lambda max of 249 nm and is expected to undergo direct
photodegradation. However, direct photodegradation of paracetamol could not be
quantified under these experimental conditions, even-though other direct
photodegradation experiments using paracetamol have produced half lives ranging
from 35h to 56h (Yamamoto et al. 2009). Sterilised dark controls in DIW remained
unchanged suggesting that paracetamol does not degrade by hydrolysis. The rate of
reaction for non-sterilised dark controls indicates that biodegradation is responsible

137
for slowly degrading paracetamol by up to 25% of the initial concentration over the
168 h exposure. This is unsurprising as paracetamol is well documented to be
effectively removed during sewage treatment (Yu, Kwong, et al. 2006) and to a
lesser extent in river waters (Yamamoto et al. 2009) with half lives comparable to
this experiment. In the light experiments indirect photodegradation kinetics in
sterilised river waters (k = 0.025; t1/2 = 28) were significantly faster than
biodegradation kinetics (k = 0.0015; t1/2 = 462); t (15) = 2.13, p = 1.4 x 10-06
demonstrating that photodegradation is the main removal mechanism of paracetamol
in the river Dart. In addition, the degradation kinetics in non-sterilised river waters
(k = 0.0096; t1/2 = 72) were significantly slower (t (23) = 2.07, p = 0.000196) than
indirect photodegradation kinetics indicating that presence of heterotrophic bacteria
in non-sterilised water samples can harvest light and reduce the intensity of photons
required for penetrating the chromophore of the molecule (McDermott et al. 1995).
6.3.2.4. Propranolol
Propranolol has a lambda max of 213 nm and is the fastest pharmaceutical to
degrade under direct photodegradation conditions in DIW (k = 0.022; t1/2 = 32). The
kinetic and half live values are similar to previously studies of propranolol
degradation (Liu & Williams 2007; Liu et al. 2009a; Piram et al. 2008). Degradation
in non sterilised river waters (k = 0.050; t1/2 = 14) was significantly faster (t (16) =
2.12, p = 0.00238) than the measured rate constants under direct photodegradation
conditions indicating a photosensitizing effect in natural surface waters. Hydrolysis
and biodegradation did not occur under the test conditions as the dark controls in
sterilised and non sterilised river waters remained the same across all locations and

138
tides. Therefore, photodegradation is the main mechanism for the removal of
propranolol in river Dart surface waters.
6.3.2.5. Salbutamol
Salbutamol undergoes relatively slow although slightly faster direct photolysis than
ibuprofen under these experimental conditions in DIW (k = 0.0016; t1/2 = 447).
These results oppose previous reports suggesting that direct photolysis of salbutamol
does not occur (Sakkas et al. 2007). The degradation rates for indirect
photodegradation in sterilised river waters (k = 0.0051; t1/2 = 135) were significantly
faster (t (9) = 2.26, p = 0.00122) than direct photolysis conditions suggesting that
stimulation of abiotic material assists in the removal of salbutamol from natural
surface waters. The kinetics from sterilised and non-sterilised river waters is not
significantly different, indicating that biodegradation does not remove salbutamol
from natural surface waters. This is confirmed through the stability of the non-
sterilised dark controls. All starting concentrations of the sterilised dark controls
remained the same over the 168 h exposure, demonstrating that hydrolysis does not
occur and photodegradation is the main mechanism for the removal of salbutamol in
river Dart surface waters.
6.3.3. Individual compound kinetics vs. compound mixture kinetics in DIW
The degradation of individual compounds and mixtures of compounds were tested
under direct photolysis conditions in DIW. Even-though the rate constants were not
significantly different, it is important to point out that ibuprofen (63 h; 13%),
mefenamic acid (121 h; 43%) and salbutamol (483 h; 52%) underwent faster
degradation in a mixture solution. The faster direct photodegradation rates in

139
mixtures suggest enhanced degradation from free radical attack during the
transformation of parent compound (Scholes & Weiss 1952). Applying this to the
environment would suggest that the co-existence of molecules can reduce the
residence time of these compounds in river Dart surface waters.
Table 14. Overall and comparative degradation kinetics for direct and indirect
photodegradation, biodegradation and hydrolysis of five pharmaceuticals in
DIW and environmental matrices
Compound Matrix
Overall degradation
k(DP+IP+LB+H) h-1 ± s.e.
t(1/2) h ± s.e.
Photodegradation
k(DP+IP+H) h-1 ± s.e.
t(1/2) h ± s.e.
Biodegradation
k(DB+H) h-1
t(1/2) h
Hydrolysis
k(H) h-1
t(1/2) h
IBU DIW (M) 0.0015 ± 0.00028 470 ± 98
- - nd
DIW (S) 0.0013 ± 0.0002
533 ± 84
- - nd
T (HT) 0.0028 ± 0.00030
248 ± 26.8
0.0027 ± 0.00005
257 ± 9.5
Nd nd
T (LT) 0.0027 ± 0.00010 262 ± 4.9
0.0018 ± 0.00010 385 ± 21.5
Nd nd
SG (HT) 0.0013 ± 0.00010
536 ± 41.3
0.0030 ± 0.0
231 ± 0.0
Nd nd
SG (LT) 0.0014 ± 0.00005
513 ± 19.0
0.0037 ± 0.00005
190 ± 2.6
Nd nd
D (HT) 0.0014 ± 0.00023 504 ± 89.1
0.0011 ± 0.00014 616 ± 66.4
Nd nd
D (LT) 0.00085 ± 0.00025
816 ± 268
0.00085 ± 0.00008
816 ± 82.5
Nd nd
MEF DIW (M) 0.0043 ± 0.00083
162 ± 32.0
- - nd
DIW (S) 0.0025 ± 0.00015 283 ± 17.0
- - nd
T (HT) 0.010 ± 0.00150
68.0 ± 10.2
0.0095 ± 0.00015
73.3 ± 1.2
0.0014
495
nd
T (LT) 0.0086 ± 0.00025
81.1 ± 2.4
0.0079 ± 0.00010
87.7 ± 1.1
0.0012
578
nd
SG (HT) 0.0092 ± 0.00005
75.8 ± 0.4
0.015 ± 0.00005
46.4 ± 0.2
nd nd
SG (LT) 0.0072 ± 0.00015
97.0 ± 2.0
0.010 ± 0.00010
69.3 ± 0.7
nd nd
D (HT) 0.011 ± 0.0020
65.7 ± 13.1
0.014 ± 0.00045
48.0 ± 1.5
nd nd
D (LT) 0.011 ± 0.00063 65.5 ± 4.0
0.012 ± 0.00094 60.1 ± 4.5
nd nd
PAR DIW (M) - - - -
DIW (S) - - - -
T (HT) 0.0076 ± 0.0013 91.2 ± 16.1
0.0086 ± 0.00015 81.1 ± 1.4
0.0016 433
nd
T (LT) 0.0045 ± 0.0026
155 ± 132
0.0028 ± 0.0011
252 ± 112
0.0015
462
nd
SG (HT) 0.015 ± 0.0010
47.4 ± 3.2
0.031 ± 0.0023
22.2 ± 1.6
0.0019
365
nd
SG (LT) 0.021 ± 0.0053 32.5 ± 8.5
0.026 ± 0.0032 26.4 ± 3.3
0.0013 533
nd
D (HT) 0.0048 ± 0.00020
144 ± 6.0
0.029 ± 0.00078
24.3 ± 0.7
0.0012
578
nd
D (LT) 0.0095 ± 0.0045
73.3 ± 45.2
0.036 ± 0.0014
19.4 ± 0.8 nd
nd

140
PRO DIW (M) 0.022 ± 0.0015
32.0 ± 2.0
- - nd
DIW (S) 0.035 ± 0.0089
20.0 ± 5.0
- - nd
T (HT) 0.025 ± 0.0002 28.1 ± 0.2
0.022 ± 0.0021 31.4 ± 3.0
nd nd
T (LT) 0.022 ± 0.00020
31.9 ± 0.3
0.018 ± 0.00010
38.1 ± 0.2
nd nd
SG (HT) 0.035 ± 0.00
19.7 ± 0.0
0.029 ± 0.00035
23.7 ± 0.3
nd nd
SG (LT) 0.020 ± 0.00015 35.1 ± 0.3
0.017 ± 0.00010 40.3 ± 0.2
nd nd
D (HT) 0.080 ± 0.0093
8.7 ± 1.0
0.074 ± 0.010
9.4 ± 1.4
nd nd
D (LT) 0.070 ± 0.0085
9.9 ± 1.2
0.073 ± 0.0075
9.5 ± 1.0
nd nd
SAL DIW (M) 0.0016 ± 0.00050 447.0 ± 167.0
- - nd
DIW (S) 0.00070 ± 0.00
930.0 ± 0.0
- - nd
T (HT) 0.0078 ± 0.00075
89.4 ± 8.7
0.0075 ± 0.00090
92.4 ± 11.3
nd nd
T (LT) 0.0050 ± 0.000050 140 ± 1.4
0.0043 ± 0.00020 161 ± 7.5
nd nd
SG (HT) 0.0055 ± 0.0010
126 ± 23.7
0.0056 ± 0.00160
124 ± 38.5
nd nd
SG (LT) 0.0048 ± 0.00015
146 ± 4.6
0.0031 ± 0.00010
224 ± 7.2
nd nd
D (HT) - - - -
D (LT) - - - -
6.3.4. Location specific degradation kinetics
The kinetic data measured from the non-sterilised river water samples were used to
establish the effect of location specific river water parameters of the river Dart on the
degradation rates of pharmaceuticals. The degradation rates at Totnes (k = 0.0095;
t1/2 = 73 h), Stoke Gabriel (k = 0.012; t1/2 = 58 h) and Dartmouth (k = 0.023; t1/2 = 30
h) increased towards the mouth of the river. The kinetics suggests that the river
water parameters at Dartmouth are more effective at removing pharmaceuticals from
the aquatic environment. This result highlights the importance of understanding
localised river conditions on the degradation rates of pharmaceuticals for more
accurate environmental risk assessment. Understanding the conditions that optimise
the removal of pharmaceuticals in the aquatic environment assists in reducing
environmental pressures of pharmaceutical pollution.

141
6.3.5. Tide specific degradation kinetics
The kinetic data measured from the non-sterilised river water samples were used to
establish the effects of high and low tides on the degradation rates of the five
pharmaceuticals. Degradation rates were observed to be faster in high tides (k =
0.017; t1/2 = 40 h) than low tides (k = 0.015; t1/2 = 45 h), although the degradation
rates were not significantly different between tides. Therefore, the variability of the
river water parameters at high and low tides of the river Dart are insufficient to affect
degradation rates on a river catchment scale. Tidal effects may have more influence
on degradation rates during mean high water spring tides when fluctuations in tides
are more extreme. Analysis of tidal effects at a location scale showed that
degradation rates in high tides were significantly faster than low tides for mefenamic
acid (t (1) = 12.71, p = 0.032) and propranolol (t (1) = 12.71, p = 0.0062) at Stoke
Gabriel. This suggests that localised river water conditions at Stoke Gabriel may
have specific properties for the removal of individual compounds.
6.3.6. Impact of river water parameters on the overall rate constants
Nitrate and nitrite correlate with propranolol and salbutamol respectively (Table 15).
DOC content of the water samples did not correlate with any of the degraded
compounds. The correlation of humic substances with reaction kinetics is
comparable with other results that demonstrate a photosensitizing effect (Buser et al.
1998; Lin & Reinhard 2005; Poiger et al. 2001). The main mechanisms are likely to
be from radical mediated oxidations (Chiron et al. 2006).
The complexity of abiotic water characteristics in determining rates of
reaction is further complicated by the significant correlations with salinity, pH,
dissolved oxygen and the inhibitory effects that biotic and abiotic material can have

142
on the reaction kinetics of pharmaceutical degradation (Canonica & Laubscher 2008;
Lam et al. 2003). Further research is needed to investigate the optimal natural
concentrations of biological and photosensitizing substances required for
maximising pharmaceutical degradation in aquatic environments.
Table 15. Pearson's correlation coefficient and significance of rate constant and
river water parameter (values in bold indicate a significant correlation (r (4), p
< 0.05)
River parameter Ibuprofen Mefenamic acid Paracetamol Propranolol Salbutamol
DO2 (%) (field) -0.898 0.385 0.463 0.345 0.106
pH (field) -0.117 0.768 -0.107 -0.518 0.945
pH 0.036 -0.895 0.555 0.887 -0.466
Salinity (ppt) (field) -0.185 -0.763 0.710 0.947 -0.238
Salinity (ppt) -0.197 -0.757 0.722 0.948 -0.215
Conductivity at 20 °C (µS/cm) -0.148 -0.787 0.692 0.934 -0.254
REDOX (mV ORP) -0.372 -0.263 0.285 0.628 -0.576
Ammoniacal nitrogen (mg/l) 0.023 -0.772 0.565 0.688 -0.148
Total oxidised nitrogen (mg/l) 0.166 0.760 -0.649 -0.852 0.324
Nitrate (mg/l) 0.166 0.760 -0.649 -0.852 0.324
Nitrite (mg/l) -0.213 0.642 0.166 -0.317 0.977
Orthophosphate (mg/l) 0.652 0.206 -0.664 -0.790 0.056
Suspended solids at 105°C (mg/l) 0.982 -0.536 -0.649 -0.326 -0.557
DOC (mg/l) 0.154 0.136 0.173 -0.241 0.765
6.4. Conclusions
The continuous release of multiple pharmaceutical compounds into the aquatic
environment is causing concern for ecosystem health and it is important to
understand their fate and persistence in the environment. This is the first study to
investigate the fate of multiple pharmaceuticals under direct photolysis conditions
and results indicate that mixtures of pharmaceuticals degrade faster than individual
compounds to reduce the residence time in the water column.
The fate of pharmaceuticals in natural river water is determined by major in-
stream depletion mechanisms that include direct and indirect photodegradation,
biodegradation, hydrolysis and partitioning to sediment. To quantify the

143
mechanisms responsible for pharmaceutical degradation, laboratory experiments
were designed to provide simultaneous measurements to compare the fate pathways
of pharmaceuticals in river water samples containing suspended solids. Results are
compound specific. In general, indirect photodegradation was considered as the
major pathway for pharmaceutical removal in natural water. Hydrolysis was not
observed for any of the compounds. Biodegradation was responsible for degrading
mefenamic acid and paracetamol. In addition, biological material reduces
photodegradation through light harvesting by photosynthetic bacteria and reducing
the amount of light for penetrating the chromophore of the molecule.
It is also important to understand how river conditions can affect the fate of
pharmaceutical compounds. High and low tides were used as a climatic model to
show how degradation may be affected by future drought or heavy rainfall patterns.
Pharmaceuticals were more persistent in low tides as turbidity and suspended solids
reduce the amount of light penetration into surface water. As a result,
pharmaceuticals may be more persistent in future drier conditions and cause more of
a problem for water companies and potable water supplies.
Comparison of pharmaceutical degradation rates across sample sites within a
single river system indicates the importance of river water conditions for inhibiting
and enhancing light penetration. Due to the complex nature of natural water
matrices, further work is required investigate the optimal natural concentrations of
biological and photosensitizing substances required for maximising pharmaceutical
degradation in aquatic environments.

144
CHAPTER SEVEN: ENVIRONMENTAL FATE OF TRICLOSAN IN THE
RIVER TAMAR ESTUARY
The research presented in this chapter was carried out at Plymouth Marine
Laboratories. Laboratory experiments were used to quantify the degradation
mechanisms responsible for the removal of triclosan at different locations along the
river Tamar Estuary.

145
7.1. Introduction
The degradation of triclosan by sunlight in river systems is a cause for concern due
to the formation of toxic polychlorinated dibenzo-p-dioxins (PCDDs) (Kanetoshi et
al. 1988; Latch et al. 2005). PCDDs have lipophilic properties and bioaccumulate
into fish species for human consumption (Fletcher & McKay 1993).
Triclosan [5-chloro-2-(2,4-dichlorophenoxy)phenol] is used in toothpastes,
mouthwashes, shampoos, skin care creams, lotions, deodorants, detergents and soaps
as an antimicrobial agent and preservative that inhibits the enzyme enoyl-acyl carrier
protein reductase (ENR) blocking lipid biosynthesis (Levy et al. 1999; McMurry et
al. 1998). Commercially known as Irgasan DP 300® or Irgacare MP®, there are
currently no restrictions on its use (Wilson et al. 2008) and approximately 10 to
1,000 tonnes of triclosan are produced per year for use within Europe (Dye et al.
2007). During its normal use as a personal care product (PCP) and detergent,
triclosan is usually washed down drains and the physiochemical properties of
triclosan (non-volatile and soluble in water) (Table 16) are in accord with the
presence of triclosan being reported in aquatic environments.
Table 16. Summary of triclosan general information and physiochemical
properties
Compound
CAS
MW
Formula
Chemical structure
Water
solubility
(25°C) (a)
Volatility (20°C) (a)
log
Kow (a)
pKa
(b) kd
(c)
Triclosan
3380-34-5
289.5 C12H7Cl3O2
4.621 mg
L-1 4.65 x 10⁻⁶ mmHg 4.66 7.8
104 @ pH > 8 102 @ pH < 8
(a) EPI SuiteTM v4.10
(b) Hua et al. (2005)
(c) Wilson et al. (2009)
It is often detected in the influents and effluents of sewage treatment plants (STPs)
(Hua et al. 2005; Ricart et al. 2010; Sabaliunas et al. 2003; Zhao et al. 2010), surface

146
fresh waters (Chau et al. 2008; Hua et al. 2005; Kolpin et al. 2002; Weigel et al.
2004; Wilson et al. 2009; Zhao et al. 2010), estuaries (Chau et al. 2008; Xie et al.
2008), seawater (Xie et al. 2008), drinking water (Boyd et al. 2003), and sediments
(Wilson et al. 2009). Therefore, the presence of triclosan in surface waters leads to
concerns about exposure and potential effects on aquatic organisms. For example,
triclosan has been shown to accumulate in the bile of rainbow trout when exposed to
municipal wastewater from Swedish STPs (Adolfsson-Erici et al. 2002) and
concentrations ranging from 0.12 to 0.27 ng g-1
wet weight were measured in blood
plasma of wild bottlenose dolphins (Tursiops truncatus) from estuarine systems in
Charleston, South Carolina and the Indian river lagoon, Florida (Fair et al. 2009).
Orvos et al. (2002) reported an EC50 of 350 µg L-1
and 1.5 µg L-1
for rainbow trout
(Oncorhynchus mykiss) and algae respectively. Coogan et al. (2007) have shown
that Cladophora spp of algae accumulated mean concentrations of 200 to 400 µg L-1
of triclosan from Pecan Creek and a receiving stream from a north Texas STP.
Triclosan exposure has also been linked to the possible development of microbial
resistance to triclosan (Larkin 1999; Schweizer 2001), cross-resistance in other
antimicrobials (Tabak et al. 2007) and antibiotics (Karatzas et al. 2007; Randall et al.
2007).
The fate of triclosan in the environment is determined by its physico-
chemical properties. Biodegradation and sorption effectively remove triclosan in
STPs (McAvoy et al. 2002; Stasinakis et al. 2007). However, approximately 5% of
the influent triclosan is dissolved in the out-flowing effluent (Bester 2003). In
surface water, the chlorinated phenol derivative is expected to undergo direct
photolysis (Boule et al. 1982) and dissolved organic carbon (DOC) sensitized
indirect photolysis reactions, including singlet molecular oxygen mediation (Scully
147
& Hoigné 1987), excited triplet state reactions (Canonica et al. 1995) and organic
peroxy-radical oxidation (Faust & Hoigné 1987). Therefore, triclosan has been
found to photo-degrade in surface waters (Lindström et al. 2002; Tixier et al. 2002)
and produce degradation products including 2,8-DCDD and 2,4-DCP (Aranami &
Readman 2007; Buth et al. 2010; Kanetoshi et al. 1988; Packer et al. 2003; Latch et
al. 2005; Mezcua et al. 2004; Wong-Wah-Chung et al. 2007; Yu, Kwong, et al.
2006).
The photodegradation rates and subsequent production of degradation
products can be influenced by biological and physico-chemical properties of the
receiving environment. Aranami & Readman (2007) investigated the
photodegradation of triclosan in both freshwater and seawater and found that
degradation rates were fastest in marine environments. Chen et al. (2008) found that
alkaline pH (10.5) display slower kinetics for the loss of triclosan when compared to
less alkaline pHs (8.7). Morrall et al. (2004) conducted a field study to investigate
the loss of triclosan in a U.S. river and suggested that the 76 per cent reduction over
8km of river was because of both photo-degradation and biodegradation, yet the
relative losses remained un-quantified. The aim of this study was to determine the
aquatic fate of triclosan and to quantify degradation rates for in-stream depletion
mechanisms based on location specific environmental variables.
7.2. Material and Methods
7.2.1. Test substances, standards, solvents and acids
The test substance, triclosan, purity 99.5 ± 0.5% was supplied by QMX Laboratories
(Essex, UK). The internal standard, 4-n-nonylphenol, purity 98 ± 0.5% was supplied
by Lancaster Synthesis (Morecambe, UK). The following solvents were used:
148
HPLC grade dichloromethane (DCM) (Rathburn Chemicals, Walkerburn, UK);
HPLC grade methanol (MeOH) (Fisher Scientific, UK). Acidification of water
samples was performed using pure 37% HCl (Fisher Scientific, UK).
7.2.2. Study area, sampling and field water parameter analysis
The geographical location of the sampling area and positions of the sample sites are
illustrated in Figure 9. A stratified sampling strategy commenced shortly after high
tide (08:47; 5.1m) on the 13th
October 2010 to monitor for in situ variations in
environmental parameters and to collect water samples for experimental analysis.
Environmental parameters were measured using a portable 650 MDS (YSI
Incorporated) instrument and sampling was conducted from a Rigid Inflatable Boat
(RIB) (locations 1, 2, 3 and 4), RV Sepia (locations 5 and 6) and RV Quest (location
7) during an axial traverse of the estuary. Surface water was collected with a
polypropylene bucket that was pre-rinsed in the sample water. Water samples were
then distributed as follows: 2.5L into amber glass bottles for degradation
experiments and 1L for suspended solid analysis. All water samples were collected
within 5.5 hours, transported back to the laboratory immediately and stored in the
dark at 4°C until commencement of the photo-degradation and biodegradation
experiments.

149
Figure 9. Locations of the sample sites in the Tamar estuary, UK.
7.2.3. Laboratory analysis of water samples
The bacterial populations of the water samples from the seven locations were
measured using flow cytometry. 40 μl of 50% grade 1 glutaraldehyde solution
(Sigma-Aldrich) was added to 1.5 ml aliquots of each sample and then stored at -
80ºC. 5 μl of a 1% Sybr Green 1 solution and 45 μl of 30 mmol potassium citrate
were added to 500 μl of each water sample and stored in the dark at room
temperature for 1 hour before analysis. Analyses were conducted using a flow
cytometer equipped with CFlow software (Accuri C6). DOC content of the water
samples was analysed as non-purgeable organic carbon (NPOC). River water
samples were filtered through a 0.45 µm filter paper (Whatman) and analysis was
1
2
3
4
5
6
7
Ernesettle STP

150
performed using a Shimadzu TOC-VWS analyser equipped with an ASI-V
autosampler and TOC-control software.
7.2.4. Degradation experiments
Hydrolysis, direct and indirect photodegradation and biodegradation experiments
were performed in a similar way to those described by Aranami & Readman (2007),
with some modifications. The 9 day exposure experiments were carried out in a
controlled temperature culture cabinet (15ºC ± 1ºC) (Vindon Scientific Ltd,
Lancashire, UK) between 29th
October 2010 and 1st December 2010. All water
samples were spiked to a starting concentration of 1 mg L-1
using a 100 mg L-1
triclosan stock solution (in MeOH). Samples were exposed in 500 ml borosilicate
conical flasks to a 36 Watt T8 triphosphor spectra-plus fluorescent daylight light
source (Crompton Lamps) emitting a light intensity of 117 μmol m2 s
-1 ± 3.58
(Gigahertz-Optick P-9710-1 optometer (Bentham Instruments Ltd)). Samples were
wrapped in aluminium foil for dark experiments. Milli-Q water (18.2 MΩ)
(Millipore) was acidified to pH 1.9 with 0.5 ml of 37% HCl and degraded under light
and dark conditions to determine the extent of hydrolysis and direct photolysis. The
acidified and non-acidified natural waters were exposed under light and dark
conditions to determine simultaneous measurements for indirect photodegradation
and microbial heterotrophic degradation.
7.2.5. Sub-samples and extraction
Sub-samples (25 ml) were removed from the experimental flasks at 0 hours, 1 day, 3
days, 6 days and 9 days. Each aliquot was immediately acidified to ≤ pH 2 with 25
µl of 37% HCl to prevent degradation. An Internal Standard (IS) of 4-n-nonylphenol

151
(300 mg L-1
in MeOH) was prepared for calibrating the concentrations of triclosan,
of which 100 µl was spiked into each 25ml aliquot. All aliquots were extracted with
DCM (1.5 ml) by using a Heidolph Promax 1020 (Jencons-PLS) mechanical shaker
for two minutes (speed setting 8). 1 ml of extracted DCM was transferred to
autosampler vials for GCMS analysis.
7.2.6. GC-MS analysis
Sample analysis was performed using an Agilent 6890 gas chromatograph interfaced
with an Agilent 5973N mass spectrometer and equipped with Agilent ChemStation
software. 2 µl samples were introduced into the back inlet of the GC by splitless
injection maintained at a temperature of 275 °C. Separation was achieved using a
DB-5MS capillary column (30 m length x 25 mm i.d x 0.25µm film thickness) with
an initial oven temperature of 40 °C (1 minute) increasing to 280 °C at 10 °C min-1
.
Helium was used as the carrier gas at a flow rate of 1 ml min-1
. Electron-impact
ionization (70 eV, 200 °C) with full scan (m/z 50-500) data acquisition was used to
screen for degradation products and confirm the identity of 4-n-nonylphenol (R.T.,
18.74; m/z 107 and 220) and triclosan (R.T., 21.09 min; m/z 218 and 288). The IS 4-
n-nonylphenol was used to calculate the concentrations of triclosan.
7.2.7. Statistical analysis
Exponential regression plots were fitted to the concentration data from the non-
acidified and acidified light and dark experiments to determine rate constants and
half lives for triclosan degradation under different water parameters. The
measurements of light and dark degradation in acidified and non-acidified waters
gave results for quantifying the mechanisms for triclosan removal in natural waters.

152
In order to assess if triclosan degradation rates are significantly influenced by the
composition of test water, Students t-test (p = 0.05, 2-sided) was used to compare the
exponential regression derived rate constants. The influence of river water
parameters on rate constants and degradation mechanisms were assessed using
Pearson’s product-moment correlation coefficients (two-tailed t-statistics to a 0.05
significance level).
7.3. Results and discussion
7.3.1. Parameter profile of the Tamar Estuary
Instream depletion mechanisms for the degradation of triclosan in the Tamar estuary
are likely to be determined by location specific physical, chemical and biological
parameters. In situ analysis of water parameters (Figure 10) are similar to those
reported by Readman et al. (1982) with the decline in dissolved oxygen (DO) and
increase in salinity between locations 2 and 3 indicating the freshwater-seawater
interphase (FSI) (Morris et al. 1978). The higher levels of suspended solids and
turbidity maximum of 163.7 NTU prior to the FSI result from the mixing of the
incoming seawater and outgoing fresh water. The peak in bacterial numbers at
location 4 suggest that the river Tavy and/or Ernesettle STP may act as a source for
bacteria.

153
freshwater ← sample site → seawater
Figure 10. Axial transect profiles for environmental variables
7.3.2. Experimental conditions and triclosan degradation pathways
The pathways for triclosan degradation were calculated from non-acidified/acidified
light and dark experiments. The acidified DIW dark controls remained stable
suggesting that triclosan does not degrade by hydrolysis due to non dissociative
behaviour in strong acids and bases (SCCS 2010). Direct photodegradation of
triclosan (Boule et al. 1982) does not occur in acidified DIW under light conditions
and the production of dioxins was not observed. For direct photolysis to occur the
emission spectrum of the light source must overlap the absorbance spectra of
triclosan (Mezcua et al. 2004; Wong-Wah-Chung et al. 2007) and dichlorodibenzo-
p-dioxin (DCDD) and dibenzo-p-dioxin are only produced when direct photon
effects are highest between the UV intensities of 1.37 x 10⁻⁴
and 1.56 x 10⁻⁴
einstein
12
14
1 2 3 4 5 6 7
Tem
p (
°C)
6.50
7.00
7.50
8.00
1 2 3 4 5 6 7
pH
0
20
40
1 2 3 4 5 6 7 Salin
ity
(‰)
30
32
34
1 2 3 4 5 6 7
DO
(%
)
0
50
100
150
1 2 3 4 5 6 7
Turb
idit
y
0
1
2
1 2 3 4 5 6 7
TSS
(mg/
l)
0
1000000
1 2 3 4 5 6 7
Bac
teri
a (m
l)
0
1
2
3
1 2 3 4 5 6 7
DO
C (
mg/
l)

154
L-1
min-1
at 365 nm (Son et al. 2007). Therefore, the photons emitted from the light
source (117 μmol m2 s
-1 / 86.58 lux) do not provide sufficient energy to degrade the
molecule and produce dioxins. The use of more powerful light sources in other
studies has shown the formation of dioxins in natural river waters (Latch et al. 2005).
As a result, indirect photodegradation and microbial heterotrophic degradation are
the major pathways for the degradation of triclosan in aqueous and particulate bound
phases. The experimental conditions provide important degradation data when
environmental conditions do not favour direct photolysis.
7.3.3. Location specific degradation of triclosan in the Tamar estuary
The removal of triclosan in the Tamar estuary results from the combination of
indirect photodegradation and microbial heterotrophic degradation (Figure 11).
Estuarine half-lives ranged from 3.3 to 7.7 days and were faster than the seawater
half-live of 9.3 days, suggesting that generated hydroxyl radicals are scavenged by
the greater number of chloride ions present in seawaters (Sirtori et al. 2010). The
rates of reaction are comparable to those reported by Aranami & Readman (2007).
The difference in half-lives recorded between the two studies probably relate to the
environmental variables and the composition of the water. Temperature, dissolved
oxygen, salinity, pH, turbidity, metal ions and abiotic and biotic material can all
regulate the rates of degradation in natural environments (Razavi et al. 2011; Ryan et
al. 2011). Also, the effect of light intensity may also be important in resulting
degradation rates (Ahmed et al. 2006).

155
Figure 11. Location specific triclosan degradation at seven locations from the
River Tamar estuary
(DIW dark controls represent removal of triclosan through hydrolysis () and DIW light
experiments represent removal of triclosan through direct photodegradation (). Experiments
in estuarine waters represent indirect photodegradation and microbial heterotrophic
degradation. Location 1 (); location 2 (); location 3 (); location 4 (); location 5 ();
location 6 (); location 7 (). k represents the kinetics of the degradation experiment and t1/2
is the half live calculated from the kinetics.
7.3.4. Relative importance of indirect photodegradation and microbial
heterotrophic degradation
Combined percentage degradation from indirect photodegradation and microbial
heterotrophic degradation accounted for 48 to 86 per cent mineralisation across the
seven sample sites (Table 17). This is comparable to environmental data as
Lindström et al. (2002) showed triclosan to degrade in Lake Greifensee, Germany
and Morrall et al. (2004) showed a similar 76 per cent reduction of triclosan over an
8km river reach below the discharge of a STP. Bacterial action was measured during
0.0
0.2
0.4
0.6
0.8
1.0
1.2
1.4
0 3 6 9
Tri
closa
n c
on
cen
tati
on
(m
g/l
)
Time (days)
1: k=0.110; t1/2=6.3
2: k=0.090; t1/2=7.7
3: k=0.178; t1/2=3.9
4: k=0.187; t1/2=3.7
5: k=0.212; t1/2=3.3
6: k=0.156; t1/2=4.4
7: k=0.075; t1/2=9.3

156
non-acidified dark experiments and the percentage loss was substracted from the
overall degradation rates to give indirect photodegradation. Indirect
photodegradation was responsible for the majority of the degradation in estuarine
sample sites, which suggests estuarine conditions favour light stimulation of abiotic
matter to induce radical mediated degradation mechanisms (Liu et al. 2009a;
Nakatani et al. 2004; Peng et al. 2006). In contrast, microbial heterotrophic
degradation rates were greater, in relative terms, in seawater, indicating specific anti-
microbial degraders (De Gusseme et al. 2011). The degradation mechanisms suggest
the presence of abiotic photosensitizers and free living bacterial species. The tidal
nature of the River Tamar is likely to determine the distribution of abiotic and biotic
species which occur at different concentrations to produce the variability in triclosan
degradation recorded between the sample sites.
Table 17. Relative loss of triclosan from indirect photodegradation and
microbial heterotrophic degradation as a percentage of the total degradation
Site Overall degradation
(%) Indirect photodegradation (%) Heterotrophic microbial biodegradation (%)
1 55 78 22
2 48 51 49
3 77 83 17
4 78 85 15
5 86 87 13
6 74 79 21
7 49 0 100
7.3.5. Statistical analysis of degradation data and environmental parameters
The significant inverse relationship between indirect photodegradation and microbial
heterotrophic degradation (r (5) = -0.861, p < 0.05) (Table 18) suggests opposing
environmental conditions favour different degradation mechanisms in the Tamar
estuary. Significant inverse correlations between indirect photodegradation and DO

157
were opposite to the significantly positive correlations calculated with microbial
heterotrophic degradation. DOC was another important factor for the indirect
photodegradation of triclosan. The negative correlation between indirect
photodegradation and DOC infers the importance of other environmental conditions
for inhibiting degradation rates. Suspended solids and turbidity are strongly
correlated to DOC and reduce light penetration for DOC sensitized degradation
(Boreen et al. 2008). The degradation kinetics between locations 1 and 3; t (2) =
2.92, p = 0.025 and 2 and 3; t (2) = 2.92, p = 0.043 were significantly different due to
the large differences in turbidity and particulate concentrations, even though DOC
content was highest at locations 1 and 2.
The complexity of environmental variables moderating degradation rates
under localised conditions is further evidenced through the non-correlation between
microbial heterotrophic degradation and bacteria counts. This suggests that a
singular biomass of free living bacterial species is not responsible for the degradation
observed during these kinetic experiments and further work needs to be performed to
understand the importance of selective degraders and sediment-bound bacterial
species. In addition to the variables measured in the experiments, complexity is
further enhanced through other water parameters including humic substances (Zhan
et al. 2006), fulvic acids (Guerard et al. 2009), nitrite (Sharpless et al. 2003) and also
atmospheric conditions including specific light wavelengths for chromophoric
dissolved organic matter (cDOM) excitation and cloud cover for modelling purposes
(Robinson et al. 2007). The consideration of these parameters, both abiotic and
biotic, and their interactions in regulating degradation mechanisms is essential if
environmental fates are to be accurately predicted.

158
Table 18. Pearson correlation coefficients for degradation data and
environmental parameters (values in bold indicate a significant correlation (r
(5), p < 0.05)
Photodeg. Biodeg. Salinity DO pH Turbidity TSS Bacteria DOC
Photodeg. 1.000
Biodeg. -0.861 1.000
Salinity 0.253 0.143 1.000
DO -0.456 0.554 0.462 1.000
Ph -0.153 0.346 0.520 0.861 1.000
Turbidity -0.180 -0.163 -0.859 -0.181 -0.167 1.000
TSS -0.313 0.049 -0.634 0.231 0.316 0.855 1.000
Bacteria 0.056 0.214 0.131 -0.399 -0.116 -0.361 -0.317 1.000
DOC -0.325 -0.105 -0.982 -0.444 -0.566 0.835 0.574 -0.196 1.000
7.4. Conclusions
This study quantifies the pathways for triclosan to degrade in estuarine environments
and correlates environmental variables to measured degradation rates for location
specific aquatic fates. The experimental outputs can be used for realistic aquatic fate
prediction and risk assessment.
In the experiments, triclosan did not degrade by hydrolysis or direct
photolysis. Results demonstrated that indirect photodegradation and microbial
heterotrophic degradation are the major pathways in reducing environmental
concentrations of triclosan. Indirect photodegradation was the most prominent
removal process in estuarine environments and microbial heterotrophic degradation
was most important in seawater.
Environmental variables determine the rates of triclosan degradation. DOC
correlated with indirect photodegradation rates in estuarine environments and DO
correlated with microbial heterotrophic degradation in seawater. However, other
factors (nitrates, nitrites, humic acids, fulvic acids) that can influence indirect
photodegradation mechanisms have not been measured and bacterial community

159
compositions need investigation. Further research is also required to determine the
optimal environmental conditions that maximise triclosan degradation.
Simultaneous fate studies that determine the relative importance of all in-
stream depletion mechanisms under localised aquatic conditions are important for
understanding the most prominent degradation routes at specific locations. This is
important for modelling and realistic risk assessment of ecosystem exposure.

160
CHAPTER EIGHT: OVERALL DISCUSSION
The research discussed in this chapter is derived from the overall aim and objectives
stated in chapter 3. The knowledge gained from the research is used to evaluate
future environmental risk assessment and risk reduction policies. Recommendations
for further research are highlighted.

161
8.1. The sources and environmental fate of pharmaceuticals
Source assessment at a catchment level is important for developing future policy on
the management of pharmaceuticals. Source assessment showed that residential
households (Brown et al. 2006; Lin et al. 2008), hospitals (Emmanuel et al. 2009;
Escher et al. 2011; Lenz et al. 2007; Nagarnaik et al. 2011; Sim et al. 2011), care
homes (Brown et al. 2006), manufacturing plants (Larsson et al. 2007) and to a lesser
extent, prisons are the main sources for human pharmaceuticals to enter the
environment. Agriculture (Boxall et al. 2003; Elmund et al. 1971; Fisher & Scott
2008; Lee et al. 2007; Malintan & Mohd 2006) and aquaculture (Abedini et al. 1998;
Haug & Hals 2000; Martinsen & Horsberg 1995; Samuelsen et al. 2003) release
veterinary drugs in to the environment. Landfill sites (Barnes et al. 2004; Eckel et al.
1993; Holm et al. 1995), biosolids (Lapen et al. 2008; Rooklidge 2004; Topp et al.
2008) and STP effluents (Gros et al. 2006; Jones et al. 2007; Roberts & Thomas
2006; Schultz & Furlong 2008; Togola and Budzinski 2008; Vasskog et al. 2006;
Zhang et al. 2007; Zuccato et al. 2005) accumulate both human and veterinary
pharmaceuticals and act as pathways for pharmaceuticals to enter into the
environment. At a catchment level, source assessment takes into account variation in
population equivalents, primary industries and localised drug distribution patterns
(Chon et al. 2010). The development of localised risk assessment can identify the
catchments of most concern to the environment and assist development of catchment
model data.
To develop the catchment approach to source assessment and refinement of
environmental risk assessments, it is necessary to understand all sources that can
release pharmaceuticals to the environment, including previously understudied
sources. The results from the source characterisation study, presented in chapter 6,

162
showed that 475.36 tonnes of pharmaceutical compounds are consumed by residents
of private households and care homes every year. This equates to 17.7 per cent of
the mass of the top 100 pharmaceuticals (2684.22 tonnes) prescribed in England in
2000 (Sebastine & Wakeman 2003). The extrapolation of a representative sample
size from such a large population of UK households (equation 6) must be treated
with caution, although does provide an indication of the amount of drugs used in
households. In addition, the socio-demographic models ACORN and NS-SEC do
not take into account the age structure of the locations sampled, potentially
excluding pharmaceutical use for illnesses in the young and elderly. The relative
distribution of this mass between the two sources equates to 154.28 (32.5%) tonnes
per year from households and 321.08 (67.5%) tonnes per year from care homes.
Therefore it can be stated that care homes release more drugs into the environment
each year than households. This is confirmed through environmental risk
assessment (ERA) of the 25 drugs that were used in the two sources. Of the 10
drugs that were above the 0.01 µg L-1
EMEA phase 1 predicted environmental
concentration (PEC) trigger value, all 10 drugs were consumed in care homes while
only paracetamol PEC was above 0.01 µg L-1
for households. This result shows the
importance of understanding all source emissions. It suggests that care home
wastewater could be targeted for advanced treatment processes should environmental
concentrations of pharmaceuticals need to be reduced in the future. Understanding
care home emissions adds to the growing literature for developing a more accurate
mass balance approach to source assessment (Lin et al. 2008; Nagarnaik et al. 2010;
Nagarnaik et al. 2011; Thomas et al. 2007). However, the ratio of PEC to predicted
no-effects concentration (PNEC) from both sources were below the action limit of 1,
indicating that the combined pharmaceutical inputs are unlikely to cause harm to the

163
environment. However, this result highlights the importance of studying all sources
(hospitals, prisons, manufacturing, agriculture and aquaculture) within a catchment
to determine the total contributions to the environment. Quantifying the relative
contributions of primary sources within catchments is important for targeted
management plans to reduce significant source emissions that reduce the need for
excessive treatment costs to remove organic micropollutants from wastewater (Jones
et al. 2007).
Pharmaceuticals are continuously released into the aquatic environment and
usually persist at ng L-1
to µg L-1
levels in the surface of receiving waters and are
subject to in-stream removal. As many pharmaceuticals, including most of the
studied compounds in Chapters 7 and 8 have log KOW values < 4, partitioning to
solids is uncommon. In addition, log DOW values of the studied compounds suggest
partitioning to the aqueous phase and KOC values indicate that some drugs will sorb
to suspended solids in river sediments that has the potential to be mixed into the
aqueous phase (Jones et al. 2006). The main mechanisms for removal of
pharmaceuticals in surface waters are hydrolysis, biodegradation, direct and indirect
photodegradation and removal rates are compound specific and dependent on
environmental conditions and water composition. The release of multiple
compounds from catchments leads to the assumption that pharmaceuticals in water
matrices can exist in as a mixture of compounds that have the potential to interact
with each other. This was tested under direct photolysis conditions using the five
compounds ibuprofen, mefenamic acid, paracetamol, propranolol and salbutamol.
The results suggested that the production of free radicals during the combined
breakdown of multiple compounds results in the faster degradation of compound
mixtures than individually irradiated compounds. In the river water experiments,

164
photodegradation was the main removal mechanism for all of the studied compounds
during the 7 day exposure experiment. Degradation rates significantly correlated
with photosensitizing substances (p < 0.05). Hydrolysis was not observed for any of
the compounds and biodegradation was only responsible for minimal removal of
paracetamol. Degradation rates in high tides were faster than degradation rates in
low tides and significant differences were observed between high and low tides for
mefenamic acid (t (1) = 12.71, p = 0.032) and propranolol (t (1) = 12.71, p = 0.0062)
at Stoke Gabriel. Therefore, increased exposure of pharmaceuticals to aquatic
organisms could be a consequence of drought conditions in future climate change
scenarios. The river water conditions at Dartmouth are the most effective for the
removal of pharmaceuticals than the river water conditions at Totnes and Stoke
Gabriel. The results highlight the importance for site specific risk assessment and
management plans.
The antimicrobial compound triclosan has been detected in the aquatic
environment and has the potential to accumulate in fish species. This environmental
concern created the need for studying the degradation mechanisms responsible for
removing triclosan from river waters. Focussing on the estuarine system of the river
Tamar, the degradation mechanisms responsible for removing triclosan from surface
waters were studied at seven locations to understand the reasons behind site variation
in degradation rates. Direct photodegradation and hydrolysis were not responsible
for the degradation of triclosan. Indirect photodegradation (mediated through
secondary excited species such as dissolved organic matter, or radicals) and
microbial heterotrophic degradation were responsible for removing 48 to 86 per cent
of triclosan in the river Tamar Estuary and Plymouth Sound. Variability between
degradation rates and mechanisms were dependent on location-specific

165
environmental variables. Indirect photodegradation was the most prominent route
for triclosan removal from the estuarine water samples (51 to 87 per cent of the
overall degradation) and a significant relationship with dissolved organic carbon
(DOC) (r (5) = -0.325, p < 0.05) suggests radical mediated degradation. Microbial
heterotrophic degradation was most prominent in seawater (100 per cent of overall
degradation) and a significant relationship with dissolved oxygen; r (5) = 0.554, p <
0.05 implies the presence of phytoplankton. Further correlations between indirect
photodegradation and microbial heterotrophic degradation (r (5) = -0.861, p < 0.05)
suggest that the biological and physicochemical properties of the Tamar estuary do
not favour simultaneous abiotic and biotic degradation due to bacteria and light
absorbing humic substances competing for sunlight.
8.2. Environmental risk assessment and risk reduction policies
Environmental-risk assessment of pharmaceuticals is currently undertaken using
risk-characterisation ratios (RCRs) in environmental compartments such as air, water
and soil (EMEA 2006; REACH 2008). For example, the water-sediment
compartment is most relevant to human pharmaceuticals, whilst the soil
compartment can be important to veterinary drugs. RCR is the ratio of predicted
environmental concentration (PEC) over predicted no-effect concentration (PNEC).
If the RCRs are greater than 1, it is considered that there are potentially significant
environmental risks (FASS 2008).
At this stage, risk mitigation or reduction will be required unless the RCR can
be further refined. The sciences underlying risk assessment are multidisciplinary and
have made significant advances in recent decades, presenting great challenges to risk
assessors and regulators. In reality, risk assessment can have uncertainties that may

166
be small or large depending on information availability, i.e. uncertainty factors that
have been included in the calculation of PEC and PNEC values. First, the PBT
assessment methods for chemicals may not be suitable for pharmaceuticals, which
are usually ionic compounds with low vapour pressures. Secondly some test
methods that are recommended under REACH for chemical assessment, e.g.
phototransformation, are still not included in the current EMEA guideline.
Moreover, the EMEA guideline suggests the use of a market penetration factor (Fpen)
for environmental-risk assessment. This factor varies depending on the type and
stage the drugs have reached. For example, a cancer drug will have a much lower
Fpen than a painkiller. Similarly a new drug is likely to have lower Fpen than a
generic over-the-counter drug. The default number of Fpen, according to EMEA
guidelines, is 1 per cent; however industries are allowed to refine the Fpen based on
evidence and available data.
There are different methods of risk reduction of the pharmaceuticals over the
product life cycles, related either to reduction of their hazardous properties or
reduction of their release and exposure. Methods of risk reduction range from risk
communication/education, green product design, reduction of use and waste,
improving treatment techniques in STPs and substitution of hazardous products with
safer ones.
Eco-labelling of pharmaceuticals can be effective in communicating
information to doctors, pharmacists and consumers (FASS 2008). However, in
addition to the primary route of direct release of urine and faeces to STPs and
subsequently to surface waters, there is a secondary route of pharmaceuticals through
disposal of unwanted or leftover drugs by flushing into sewers (Daughton & Ruhoy
2009). Risk communication should also aim to reduce over-prescription and inform

167
patients that unused pharmaceuticals can be returned to hospitals and pharmacies.
This could reduce the environmental impact of pharmaceuticals and unintentional
risks to humans, and improve the quality and cost-effectiveness of health care.
Secondly, with high-throughput screening technologies coupled with
combinatorial and synthetic chemistry, greener pharmaceuticals, such as solid acids,
may be discovered, modified and developed (Clark 2002). Green product and
process design, has the potential to provide alternatives to environmentally
hazardous pharmaceuticals and to minimise pharmaceutical wastes (Taylor 2009).
However, it is challenging for pharmaceutical companies to balance human versus
environmental-safety issues, and a life-cycle-assessment approach will be needed to
address the efficiency, efficacy, reliability and safety of pharmaceuticals (Tucker
2006).
Thirdly, waste-water-treatment techniques may be improved for better
removal of pharmaceuticals from effluents. STPs were designed to remove large
amount of organic carbons and nutrients from human wastes rather than
pharmaceuticals at low concentrations. Major removal processes in STPs are
biodegradation and partitioning to sludge. However, recent development of
potentially more effective treatment techniques for pharmaceuticals include active
carbon adsorption, membrane technology, nanofiltration and various advanced
oxidation processes, such as ozone and UV oxidation. For example, dosing waste
water with ozone at concentrations of 10 mg L-1
and 15 mg L-1
reduced the
concentrations of five antibiotics (76% – 92%), five beta-blockers (72% - 93%), four
antiphlogistics (50% - 96%), two lipid-regulator metabolites (59% - 62%),
carbamazepine (98%), estrone (80%) and two polycyclic musk fragrances (50% -

168
93%) below the limit of detection in the effluent of a biological STP (Ternes et al.
2003).
As more and more pharmaceuticals are likely to be developed and enter the
global market as a result of demographic changes, improved health care and more
affluent lifestyles. With population growth and ageing populations, sales of generic
and prescription pharmaceuticals are likely to increase. Better health care will result
in a longer average lifespans and further accelerate the global demand for
pharmaceuticals. Ultimately, the potential increase in consumption may lead to
significant increase in continuous release of pharmaceuticals into aquatic and
terrestrial ecosystems. Although only endocrine disrupting chemicals (EDCs)
including natural and synthetic estrogens, phenols, plasticizers, pesticides and
diclofenac have so far showed adverse environmental effects (to sex change in fish
and death in vulture populations in India, Pakistan and Nepal, respectively), there are
increasing public concerns on the safety of other pharmaceuticals on aquatic and soil
biota and, subsequently, human health. A potentially drier climate in the future
could increase concentrations in river water, putting even more pressure on water
companies trying to provide clean, pure water. Climate change means that the
temperatures of rivers and marine waters are likely to increase, and this could have
an impact on population-level responses to pharmaceuticals in the environment. In
order to prepare for these problems, future research should be prioritised in the
following areas.
Green product design. Although few pharmaceuticals have been proved to pose
significant risks to wildlife species and human health, more pharmaceutical
companies are showing interests in green product and process design that will

169
improve the industry’s reputation through sustainability and provide an
opportunity for product and process innovation. Therefore green initiatives have
the potential to make a great contribution to the mitigation of possible risks and
enhance corporate responsibility.
Hazardous properties of pharmaceuticals. A better understanding of the
hazardous properties (PBT) of pharmaceuticals through measurements, MoA,
read-across and modelling approaches related to the environment. The emerging
issues in this area include antibacterial resistance and endocrine-disrupting
properties of some pharmaceuticals (Sumpter, 2005; Sumpter and Johnson,
2005). Some extrapolation or read-across approaches may be useful for relating
human-health endpoints to environmental species, and vice versa.
Source assessment. The development of more accurate source assessments to
detail consumption and emissions of pharmaceuticals at residential, industrial
and commercial activities at a catchment level. Building a catchment model that
quantifies relative source contributions will enable the targeted management of
pharmaceuticals at a preventative level.
Pathway reduction. Better treatment techniques for removing pharmaceuticals at
STPs, which requires not only the reduction of pharmaceutical concentrations in
effluents, but also reduction of their toxicity to wildlife species. For example, the
use of UV with ozone treatment for landfill leachate is more cost effective than
using ozone and the demand for energy is the same (Bauer and Fallmann 1997)
170
Environmental fate. Understanding the physicochemical properties of
pharmaceuticals is not enough to ascertain the environmental fate of
pharmaceuticals and it is important for further experimental testing of drugs in
natural waters to determine degradation kinetics. The composition of natural
waters is influential in determining the removal mechanisms of pharmaceuticals
and this should be studied at a site specific level for accurate risk assessment
data.
Ecotoxicity. A better understanding of exposure scenarios of pharmaceuticals in
the environment. This includes the investigation of exposure of pharmaceuticals
and their transformation products in mixtures at organism level metabolic
processes (Jones et al. 2008) as well as population responses through
epidemiological studies.
Risk assessment. The collection of source and environmental fate data to
develop a better understanding of risk-assessment uncertainties for improving
confidence in risk-characterisation ratios.

171
CHAPTER NINE: CONCLUSIONS
Administration of drugs to humans and animals leads to exposure of pharmaceuticals
to non-target organisms in soil and aquatic compartments. Source-pathway-receptor
linkages identify the risks to the environment from human-health and assist in
developing read-across approaches to define specific receptor sites associated
between target and non-target organism. More toxicological data is required to
improve the links between human-health and environmental health to develop
understanding into trophic level population responses and ecosystem function.
Pharmaceuticals are not currently considered for priority pollutant status under the
Water Framework Directive (WFD) due to limited toxicological knowledge.
However, should pharmaceuticals be granted priority pollutant status in the future, a
framework is required for source assessment to reduce pharmaceutical pollution.
Application of the WFDs principles to pharmaceutical pollution develops a holistic
approach to understand the source inputs at a catchment level for targeted
management plans of catchments of concern.
Further improvement of source assessment requires understanding of previously
understudied sources in relation to better known sources for pharmaceuticals to enter
into the environment. Care homes are predicted to release more pharmaceuticals to
the environment than residential households and could be considered as a target for
source level risk reduction strategies.

172
Many drugs are used to treat humans and animals and it is likely that
pharmaceuticals exist as mixtures in receiving waters. The conditions of receiving
waters regulate the time taken for the compound to degrade and degradation rates
can vary at a catchment level. This highlights that environmental conditions can
increase the persistence and exposure of pharmaceuticals to aquatic organisms.
Experimental fate studies also indicate that removal mechanisms (indirect
photodegradation and microbial heterotrophic degradation) are dependent on
location and the parameters of the receiving water. This highlights the importance of
fully understanding degradation mechanisms for improved environmental risk
assessment.
Source assessment at a catchment level and environmental fate in aquatic ecosystems
is important future research for the development of environmental risk assessment
and management strategies should the effects of pharmaceuticals become more
prominent in the future. This can help to reduce source inputs and understanding the
optimal conditions for removing pharmaceuticals from the environment can assist in
developing tertiary treatments for the removal of pharmaceuticals in STPs. The
source and environmental fate research in this thesis should be taken into account for
developing future water policy.

173
REFERENCES
Abb, M. et al., 2009. Phthalates in house dust. Environment International, 35(6),
pp.965-970.
Abedini, S., Namdari, R. & Law, F.C.P., 1998. Comparative pharmacokinetics and
bioavailability of oxytetracycline in rainbow trout and chinook salmon.
Aquaculture, 162(1-2), pp.23-32.
Accinelli, C. et al., 2010. Removal of oseltamivir (Tamiflu) and other selected
pharmaceuticals from wastewater using a granular bioplastic formulation
entrapping propagules of Phanerochaete chrysosporium. Chemosphere, 81(3),
pp.436-443.
Adibi, J.J. et al., 2003. Prenatal exposures to phthalates among women in New York
city and Krakow, Poland. Environmental Health Perspectives, 111, pp.1719-
1722.
Adolfsson-Erici, M. et al., 2002. Triclosan, a commonly used bactericide found in
human milk and in the aquatic environment in Sweden. Chemosphere, 46,
pp.1485-1489.
Ahmed, I. et al., 2006. Effect of light intensity and wavelengths on photodegradation
reactions of riboflavin in aqueous solution. Journal of Photochemistry and
Photobiology B: Biology, 82(1), pp.21-27.
Alderman, C.P., Moritz, C.K. & Ben-Tovim, D.I., 1992. Abnormal platelet
aggregation associated with fluoxetine therapy. The Annals of
Pharmacotherapy, 26(12), pp.1517-1519.
Alexy, R. & Kümmerer, K., 2006. Antibiotics for human use. In T. Reemtsma & M.
Jekel, eds. Organic pollutants in the water cycle. Weinheim: Wiley.
Altamura, A.C., Moro, A.R. & Percudani, M., 1994. Clinical pharmacokinetics of
fluoxetine. Clinical Pharmacokinetics, 26(3), pp.201-214.
Alvarez, D.A. et al., 2005. Comparison of a novel passive sampler to standard water-
column sampling for organic contaminants associated with wastewater effluents
entering a New Jersey stream. Chemosphere, 61(5), pp.610-622.
Andreozzi, R., Caprio, V., et al., 2003. Paracetamol oxidation from aqueous
solutions by means of ozonation and H2O2/UV system. Water Research, 37(5),
pp.993-1004.
Andreozzi, R., Raffaele, M. & Nicklas, P., 2003. Pharmaceuticals in STP effluents
and their solar photodegradation in aquatic environment. Chemosphere, 50(10),
pp.1319-1330.

174
Aranami, K. & Readman, J.W., 2007. Photolytic degradation of triclosan in
freshwater and seawater. Chemosphere, 66, pp.1052-1056.
Ashton, D., Hilton, M.J. & Thomas, K.V., 2004. Investigating the environmental
transport of human pharmaceuticals to streams in the United Kingdom. Science
of the Total Environment, 333(1-3), pp.167-184.
Attal, N. et al., 2006. EFNS guidelines on pharmacological treatment of neuropathic
pain. European Journal of Neurology, 13(11), pp.1153-1169.
Babić, S. et al., 2007. Determination of veterinary pharmaceuticals in production
wastewater by HPTLC-videodensitometry. Chromatographia, 65(1-2), pp.105-
110.
Baquero, F., Martínez, J.-L. & Cantón, R., 2008. Antibiotics and antibiotic resistance
in water environments. Current Opinion in Biotechnology, 19(3), pp.260-265.
Barnes, K.K. et al., 2004. Pharmaceuticals and other organic waste water
contaminants within a leachate plume downgradient of a municipal landfill.
Ground Water Monitoring & Remediation, 24(2), pp.119–126.
Barrett, J.R., 2005. The ugly side of beauty products. Environmental Health
Perspectives, 113(1), p.A 24.
Bartels, P. & von Tümpling, W., 2007. Solar radiation influence on the
decomposition process of diclofenac in surface waters. Science of the Total
Environment, 374(1), pp.143-155.
Bauer, R. & Fallmann, H., 1997. The photo-fenton oxidation – a cheap and efficient
wastewater treatment method. Research on Chemical Intermediates, 23(4), pp.
341-354.
Becker, K. et al., 2004. DEHP metabolites in urine of children and DEHP in house
dust. International Journal of Hygiene and Environmental Health, 207(5),
pp.409-417.
Behera, S.K. et al., 2011. Occurrence and removal of antibiotics, hormones and
several other pharmaceuticals in wastewater treatment plants of the largest
industrial city of Korea. Science of the Total Environment.
Bendz, D. et al., 2005. Occurrence and fate of pharmaceutically active compounds in
the environment, a case study: Höje River in Sweden. Journal of Hazardous
Materials, 122(3), pp.195-204.
Besse, J.-P. & Garric, J., 2008. Human pharmaceuticals in surface waters:
Implementation of a prioritisation methodology and application to the French
situation. Toxicology Letters, 176, pp.104-123.
Bester, K., 2003. Triclosan in a sewage treatment process-balances and monitoring
data. Water Research, 37(16), pp.3891-3896.

175
Björklund, H., Bondestam, J. & Bylund, G., 1990. Residues of oxytetracycline in
wild fish and sediments from fish farms. Aquaculture, 86(4), pp.359-367.
Björklund, H.V., Råbergh, C.M.I. & Bylund, G., 1991. Residues of oxolinic acid and
oxytetracycline in fish and sediments from fish farms. Aquaculture, 97(1),
pp.85-96.
Bloom, R.A., 2001. Use of veterinary pharmaceuticals in the United States. In K.
Kümmerer, ed. Pharmaceuticals in the environment: sources, fate, effects and
risks. Berlin: Springer, pp. 149-163.
Boreen, A.L. et al., 2008. Indirect photodegradation of dissolved free amino acids:
the contribution of singlet oxygen and the differential reactivity of DOM from
various sources. Environmental Science and Technology, 42(15), pp.5492-5498.
Bornehag, C.-G. et al., 2005. Phthalates in indoor dust and their association with
building characteristics. Environmental Health Perspectives, 113(10), pp.1399-
1404.
Bottoni, P., Caroli, S. & Caracciolo, A.B., 2010. Pharmaceuticals as priority water
contaminants. Toxicological and Environmental Chemistry, 92(3), pp.549-565.
Boule, P., Guyon, C. & Lemaire, J., 1982. Photochemistry and environment IV-
Photochemical behaviour of monochlorophenols in dilute aqueous solution.
Chemosphere, 11(12), pp.1179–1188.
Bound, J.P. & Voulvoulis, N., 2005. Household disposal of pharmaceuticals as a
pathway for aquatic contamination in the United Kingdom. Environmental
Health Perspectives, 113(12), pp.1705-1711.
Bound, J.P. & Voulvoulis, N., 2004. Pharmaceuticals in the aquatic environment-a
comparison of risk assessment strategies. Chemosphere, 56(11), pp.1143-1155.
Bound, J.P. & Voulvoulis, N., 2006. Predicted and measured concentrations for
selected pharmaceuticals in UK rivers: implications for risk assessment. Water
Research, 40(15), pp.2885-2892.
Boxall, A.B.A. et al., 2006. Uptake of veterinary medicines from soils into plants.
Journal of Agricultural and Food Chemistry, 54(6), pp.2288-2297.
Boxall, A.B.A. et al., 2003. Are veterinary medicines causing environmental risks.
Environmental Science and Technology, pp.286-294.
Boyd, G.R. et al., 2003. Pharmaceuticals and personal care products (PPCPs) in
surface and treated waters of Louisiana, USA and Ontario, Canada. Science of
the Total Environment, 311(1-3), pp.135-149.
British Heart Foundation, 2008. Cardiovascular disease in England: Opportunities
and challenges over the next 10 years. Cardio and Vascular Coalition.

176
Brooks, B.W. et al., 2005. Determination of select antidepressants in fish from an
effluent-dominated stream. Environmental Toxicology and Chemistry, 24(2),
pp.464-469.
Brooks, B.W. et al., 2003. Aquatic ecotoxicology of fluoxetine. Toxicology Letters,
142(3), pp.169-183.
Brown, K.D. & Thompson, R.S., 1982a. Phthalates and the aquatic environment:
Part I: The effect of di-2-ethylhexyl phthalate (DEHP) and di-isodecyl phthalate
(DIDP) on the reproduction of and observations on their bioconcentration• 1.
Chemosphere, 11(4), pp.417–426.
Brown, K.D. & Thompson, R.S., 1982b. Phthalates and the aquatic environment:
Part II: The bioconcentration and depuration of di-2-ethyl-hexyl phthalate
(DEHP) and di-isodecyl phthalate (DIDP) in mussels (Mytilus edulis).
Chemosphere, 11(4), pp.427 - 435.
Brown, K.D. et al., 2006. Occurrence of antibiotics in hospital, residential, and dairy
effluent, municipal wastewater, and the Rio Grande in New Mexico. Science of
the Total Environment, 366(2-3), pp.772-783.
Buser, H.-R., Poiger, T. & Müller, M.D., 1998. Occurrence and fate of the
pharmaceutical drug diclofenac in surface waters: rapid photodegradation in a
lake. Environmental Science and Technology, 32(22), pp.3449-3456.
Buth, J.M. et al., 2010. Dioxin photoproducts of triclosan and its chlorinated
derivatives in sediment cores. Environmental Science and Technology, 44(12),
pp.4545-4551.
CSTEE, 2001. Draft CPMP discussion paper on environmental risk assessment of
medicinal products for human use on non-genetically modified organisms
containing medicinal products for human use. Scientific Committee on Toxicity,
Ecotoxicity and the Environment (CSTEE). European Commission.
Calisto, V. & Esteves, V.I., 2009. Psychiatric pharmaceuticals in the environment.
Chemosphere, 77(10), pp.1257-1274.
Camacho-Munoz, D. et al., 2010. Occurrence, temporal evolution and risk
assessment of pharmaceutically active compounds in Donana Park (Spain).
Journal of Hazardous Materials, 183(1-3), pp.602-608.
Caminada, D., Escher, C. & Fent, K., 2006. Cytotoxicity of pharmaceuticals found in
aquatic systems: Comparison of PLHC-1 and RTG-2 fish cell lines. Aquatic
Toxicology, 79, pp.114-123.
Canonica, S. & Laubscher, H.-U., 2008. Inhibitory effect of dissolved organic matter
on triplet-induced oxidation of aquatic contaminants. Photochemical and
Photobiological Sciences, 7(5), pp.547-551.

177
Canonica, S. et al., 1995. Transformation kinetics of phenols in water:
photosensitization by dissolved natural organic material and aromatic ketones.
Environmental Science and Technology, 29(7), pp.1822-1831.
Care Home and Nursing Home UK, Care Home and Nursing Home UK.
www.carehome.co.uk.
Carlsson, C., Johansson, A.-K., Alvan, G., Bergman, K. & Kühler, T., 2006a. Are
pharmaceuticals potent environmental pollutants? Part I: Environmental risk
assessments of selected active pharmaceutical ingredients. Science of the Total
Environment, 364(1-3), pp.67-87.
Carlsson, C., Johansson, A.-K., Alvan, G., Bergman, K. & Kühler, T., 2006b. Are
pharmaceuticals potent environmental pollutants? Part II: environmental risk
assessments of selected pharmaceutical excipients. Science of the Total
Environment, 364(1-3), pp.88-95.
Castaman, G. et al., 1995. Characterization of two cases of acquired transitory von
willebrand syndrome with ciprofloxacin: evidence for heightened proteolysis of
von willebrand factor. American Journal of Hematology, 49(1), pp.83-86.
Castiglioni, S. et al., 2004. Methodological approaches for studying pharmaceuticals
in the environment by comparing predicted and measured concentrations in
River Po, Italy. Regulatory Toxicology and Pharmacology, 39(1), pp.25-32.
Chau, W.C., Wu, J.-L. & Cai, Z., 2008. Investigation of levels and fate of triclosan
in environmental waters from the analysis of gas chromatography coupled with
ion trap mass spectrometry. Chemosphere, 73, p.S13-S17.
Chen, J. et al., 2007. Development and application of real-time PCR assays for
quantification of erm genes conferring resistance to macrolides-lincosamides-
streptogramin B in livestock manure and manure management systems. Applied
and Environmental Microbiology, 73(14), pp.4407-4416.
Chen, Y. et al., 2009. Indirect photodegradation of amine drugs in aqueous solution
under simulated sunlight. Environmental Science and Technology, 43(8),
pp.2760-2765.
Chen, Z. et al., 2008. Photolytic degradation of triclosan in the presence of
surfactants. Chemical Papers, 62(6), pp.608-615.
Chiron, S., Minero, C. & Vione, D., 2006. Photodegradation processes of the
antiepileptic drug carbamazepine, relevant to estuarine waters. Environmental
Science and Technology, 40(19), pp.5977-5983.
Chon, H.-S., Ohandja, D.-G. & Voulvoulis, N., 2010. Implementation of E.U. Water
Framework Directive: source assessment of metallic substances at catchment
levels. Journal of Environmental Monitoring, 12(1), pp.36-47.

178
Clara, M. et al., 2010. Occurrence of phthalates in surface runoff, untreated and
treated wastewater and fate during wastewater treatment. Chemosphere, 78(9),
pp.1078-1084.
Clark, J.H., 2002. Solid acids for green chemistry. Accounts of Chemical Research,
35(9), pp.791-797.
Cleuvers, M., 2003. Aquatic ecotoxicity of pharmaceuticals including the assessment
of combination effects. Toxicology Letters, 142(3), pp.185-194.
Cleuvers, M., 2004. Mixture toxicity of the anti-inflammatory drugs diclofenac,
ibuprofen, naproxen, and acetylsalicylic acid. Ecotoxicology and Environmental
Safety, 59(3), pp.309-315.
Comeau, F. et al., 2008. The occurrence of acidic drugs and caffeine in sewage
effluents and receiving waters from three coastal watersheds in Atlantic
Canada. Science of the Total Environment, 396(2-3), pp.132-146.
Comoretto, L. & Chiron, S., 2005. Comparing pharmaceutical and pesticide loads
into a small Mediterranean river. Science of the Total Environment, 349(1-3),
pp.201-210.
Conner, S., 2008. Tests for drugs in tap water. The Independent.
Coogan, M.A. et al., 2007. Algal bioaccumulation of triclocarban, triclosan, and
methyl-triclosan in a North Texas wastewater treatment plant receiving stream.
Chemosphere, 67(10), pp.1911-1918.
Coyne, R. et al., 1994. Concentration and persistence of oxytetracycline in sediments
under a marine salmon farm. Aquaculture, 123(1-2), pp.31-42.
Crane, M., Watts, C. & Boucard, T., 2006. Chronic aquatic environmental risks from
exposure to human pharmaceuticals. Science of the Total Environment, 367(1),
pp.23-41.
Cunningham, V.L., 2008. Environmental exposure modeling: Application of PhATE
and GREAT-ER to human pharmaceuticals in the environment. In K.
Kümmerer, ed. Pharmaceuticals in the Environment: Sources, Fate, Effects and
Risks. Berlin: Springer, pp. 133-146.
Cunningham, V.L., 2004. Special characteristics of pharmaceuticals related to
environmental fate. In K. Kummerer, ed. Pharmaceuticals in the environment:
sources, fate, effects and risks. Berlin: Springer, pp. 13-24.
DEFRA, Disposal of sewage sludge 1991/2 to 2005. e-Digest of Environmental
Statistics. Available from
http://www.defra.gov.uk/environment/statistics/waste/download/ xls/wrtb11-
12.xls.
DEFRA, 2006. River Basin Planning Guidance.

179
Daneshvar, A., Svanfelt, J., Kronberg, L. & Weyhenmeyer, G.A., 2010. Winter
accumulation of acidic pharmaceuticals in a Swedish river. Environmental
Science and Pollution Research, 17(4), pp.908-916.
Daneshvar, A., Svanfelt, J., Kronberg, L., Prevost, M., et al., 2010. Seasonal
variations in the occurrence and fate of basic and neutral pharmaceuticals in a
Swedish river-lake system. Chemosphere, 80(3), pp.301-309.
Daughton, C.G. & Ruhoy, I.S., 2009. Environmental footprint of pharmaceuticals:
the significance of factors beyond direct excretion to sewers. Environmental
Toxicology and Chemistry, 28(12), pp.2495-2521.
Daughton, C.G. & Ternes, T.A., 1999. Pharmaceuticals and personal care products
in the environment: agents of subtle change? Environmental health
perspectives, 107 Suppl, pp.907-938.
Davies, N.M. & Anderson, K.E., 1997. Clinical pharmacokinetics of diclofenac.
Therapeutic insights and pitfalls. Clinical Pharmacokinetics, 33(3), pp.184-213.
Dietrich, S., Dammel, S., et al., 2010. Effects of a pharmaceutical mixture at
environmentally relevant concentrations on the amphipod Gammarus fossarum.
Marine and Freshwater Research, 61(2), pp.196-203.
Dietrich, S., Ploessl, F., et al., 2010. Single and combined toxicity of
pharmaceuticals at environmentally relevant concentrations in Daphnia magna--
a multigenerational study. Chemosphere, 79(1), pp.60-66.
Doll, T.E. & Frimmel, F.H., 2003. Fate of pharmaceuticals--photodegradation by
simulated solar UV-light. Chemosphere, 52(10), pp.1757-1769.
Duong, H.A. et al., 2008. Occurrence, fate and antibiotic resistance of
fluoroquinolone antibacterials in hospital wastewaters in Hanoi, Vietnam.
Chemosphere, 72(6), pp.968-973.
Dwivedi, G. & Dwivedi, S., 2007. Sushruta–the clinician–teacher par excellence.
Chest Diseases And Allied Sciences, 49(4), pp.243–244.
Dye, C.J. et al., 2007. Bronopol, Resorcinol, m-Cresol and Triclosan in the Nordic
Environment, Copenhagen.
Dzieweczynski, T.L., 2011. Short-term exposure to an endocrine disruptor affects
behavioural consistency in male threespine stickleback. Aquatic Toxicology,
105, pp.681-687.
EMEA, 2006. Guideline on the environmental risk assessment of medicinal products
for human use. Committee for Medicinal Products for Human Use.
EMEA/CHMP/SWP/4447/00, pp.1-12.
Eckel, W.P., Ross, B. & Isensee, K., 1993. Pentobarbital found in ground water.
Ground Water, 31(5), pp.801-804.

180
Edwards, M. et al., 2009. Pharmaceutical and personal care products in tile drainage
following surface spreading and injection of dewatered municipal biosolids to
an agricultural field. Science of the Total Environment, 407(14), pp.4220-4230.
El-Gindy, A., Hadad, G.M. & Mahmoud, W.M.M., 2007. High performance liquid
chromatographic determination of etofibrate and its hydrolysis products.
Journal of Pharmaceutical and Biomedical Analysis, 43(1), pp.196-203.
Ellis, L., 2000. Archaeological Method and Theory: An Encyclopedia, Taylor and
Francis Ltd.
Elmund, G.K. et al., 1971. Role of excreted chlortetracycline in modifying the
decomposition process in feedlot waste. Bulletin of Environmental
Contamination and Toxicology, 6(2), pp.129-132.
Emmanuel, E., Pierre, M.G. & Perrodin, Y., 2009. Groundwater contamination by
microbiological and chemical substances released from hospital wastewater:
health risk assessment for drinking water consumers. Environment
International, 35(4), pp.718-726.
Enright, M.C. et al., 2002. The evolutionary history of methicillin-resistant
Staphylococcus aureus (MRSA). Proceedings of the National Academy of
Sciences of the United States of America, 99(11), pp.7687-7692.
Environment Agency, 2010a. Water Framework Directive: find out about your river
basin district [Online] Available from: http://www.environment-
agency.gov.uk/research/planning/33112.aspx.
Environment Agency, 2010b. Water Framework Directive: water for lives and
livelihoods: river basin management plans [Online] Available from:
http://www.environment- agency.gov.uk/research/planning/33106.aspx.
Escher, B.I. et al., 2011. Environmental toxicology and risk assessment of
pharmaceuticals from hospital wastewater. Water Research, 45(1), pp.75-92.
Escher, B.I. et al., 2010. Mixture toxicity of the antiviral drug Tamiflu (oseltamivir
ethylester) and its active metabolite oseltamivir acid. Aquatic Toxicology, 96(3),
pp.194-202.
European Commission, 2001. Decision No 2455/2001/EC of the European
Parliament and of the Council: Establishing the list of priority substances in the
field of water policy and amending Directive 2000/60/EC. Official Journal of
the European Communities, pp.1-5.
European Commission, 2000. Directive 2000/60/EC of the European Parliament and
of the Council: Establishing a framework for Community action in the field of
water policy. Official Journal of the European Communities, pp.1-72.
European Commission, 2009. Reports from the Commission to the European
Parliament and the Council: In accordance with article 18.3 of the Water
181
Framework Directive 2000/60/EC on programmes for monitoring of water
status. Official Journal of the European Communities, pp.1-6.
FASS, 2008. Swedish environmental classification of pharmaceuticals: The Swedish
Association of the Pharmaceutical Industry. Available at: http://www.fass.se.
FDA, 1998. Guidance for industry. Environmental assessment of human drugs and
biologics applications. FDA, CDER/CBER, CMC 6, revision 1.
Fair, P.A. et al., 2009. Occurrence of triclosan in plasma of wild Atlantic bottlenose
dolphins (Tursiops truncatus) and in their environment. Environmental
Pollution, 157(8-9), pp.2248-2254.
Faust, B.C. & Hoigné, J., 1987. Sensitized photooxidation of phenols by fulvic acid
and in natural waters. Environmental Science and Technology, 21(10), pp.957-
964.
Federle, T.W. & Itrich, N.R., 1997. Comprehensive approach for assessing the
kinetics of primary and ultimate biodegradation of chemicals in activated
sludge: application to linear alkylbenzene sulfonate. Environmental Science and
Technology, 31(4), pp.1178-1184.
Felis, E. et al., 2007. Photochemical degradation of naproxen in the aquatic
environment. Water Science and Technology, 55(12), pp.281-286.
Fent, K., Weston, A.A. & Caminada, D., 2006. Ecotoxicology of human
pharmaceuticals. Aquatic Toxicology, 76(2), pp.122-159.
Ferrari, B. et al., 2004. Environmental risk assessment of six human
pharmaceuticals: are the current environmental risk assessment procedures
sufficient for the protection of the aquatic environment? Environmental
Toxicology and Chemistry, 23(5), pp.1344-1354.
Ferrari, B. et al., 2003. Ecotoxicological impact of pharmaceuticals found in treated
wastewaters: study of carbamazepine, clofibric acid, and diclofenac.
Ecotoxicology and Environmental Safety, 55(3), pp.359-370.
Fisher, P. & Scott, R., 2008. Evaluating and controlling pharmaceutical emissions
from dairy farms: a critical first step in developing a preventative management
approach. Journal of Cleaner Production, 16(14), pp.1437-1446.
Flaherty, C.M. & Dodson, S.I., 2005. Effects of pharmaceuticals on Daphnia
survival, growth, and reproduction. Chemosphere, 61(2), pp.200-207.
Fletcher, C.L. & McKay, W.A., 1993. Polychlorinated dibenzo-p-dioxins (PCDDs)
and dibenzofurans (PCDFs) in the aquatic environment - a literature review.
Chemosphere, 26(6), pp.1041-1069.
Fong, P.P., 1998. Zebra mussel spawning is induced in low concentrations of
putative serotonin reuptake inhibitors. Biological Bulletin, 194(2), pp.143-149.

182
Fono, L.J. & Sedlak, D.L., 2005. Use of the chiral pharmaceutical propranolol to
identify sewage discharges into surface waters. Environmental Science and
Technology, 39(23), pp.9244-9252.
Foran, C.M. et al., 2004. Reproductive assessment of Japanese Medaka (Oryzias
latipes) following a four-week fluoxetine (SSRI) exposure. Archives of
Environmental Contamination and Toxicology, 46(4), pp.511-517.
Fratiglioni, L., De Ronchi, D. & Agüero-Torres, H., 1999. Worldwide prevalence
and incidence of dementia. Drugs and Ageing, 15(5), pp.365-375.
Fromme, H. et al., 2007. Intake of phthalates and di(2-ethylhexyl)adipate: results of
the integrated exposure assessment survey based on duplicate diet samples and
biomonitoring data. Environment International, 33(8), pp.1012-1020.
Fromme, H. et al., 2002. Occurrence of phthalates and bisphenol A and F in the
environment. Water Research, 36(6), pp.1429-1438.
Fromme, H. et al., 2004. Occurrence of phthalates and musk fragrances in indoor air
and dust from apartments and kindergartens in Berlin (Germany). Indoor Air,
14, pp.188-195.
Furtula, V. et al., 2010. Veterinary pharmaceuticals and antibiotic resistance of
Escherichia coli isolates in poultry litter from commercial farms and controlled
feeding trials. Poultry Science, 89(1), pp.180-188.
Gamperl, A.K., Wilkinson, M. & Boutilier, R., 1994. Beta-adrenoreceptors in the
trout (Oncorhynchus mykiss) heart: characterization, quantification, and effects
of repeated catecholamine exposure. General and Comparative Endocrinology,
95, pp.259-272.
Geyer, H. et al., 1992. Bioconcentration of octachlorodibenzo-p-dioxin (OCDD) in
fish. Chemosphere, 25(7-10), pp.1257-1264.
Gielen, G.J.H.P. et al., 2009. Factors impacting on pharmaceutical leaching
following sewage application to land. Chemosphere, 74(4), pp.537-542.
Giltrow, E. et al., 2009. Chronic effects assessment and plasma concentrations of the
β-blocker propranolol in fathead minnows (Pimephales promelas). Aquatic
Toxicology, 95(3), pp.195-202.
Goiti, J.J., 1985. Calcium channel blocking agents and the heart. British Medical
Journal, 291, pp.824-824.
Gould, J.C., 1957. Origin of antibiotic resistant Staphylocci. Nature, 180, pp.282-
283.
Graham, J.P. et al., 2009. Antibiotic resistant enterococci and staphylococci isolated
from flies collected near confined poultry feeding operations. Science of the
Total Environment, 407(8), pp.2701-2710.

183
Gros, M., Petrović, M. & Barceló, D., 2006. Development of a multi-residue
analytical methodology based on liquid chromatography-tandem mass
spectrometry (LC-MS/MS) for screening and trace level determination of
pharmaceuticals in surface and wastewaters. Talanta, 70(4), pp.678-690.
Grung, M. et al., 2008. Environmental assessment of Norwegian priority
pharmaceuticals based on the EMEA guideline. Ecotoxicology and
Environmental Safety, 71(2), pp.328-340.
Guerard, J.J. et al., 2009. The role of fulvic acid composition in the photosensitized
degradation of aquatic contaminants. Aquatic Sciences, 71(2), pp.160-169.
Guidry, J.B., Ogburn, C.L. & Griffin, F.M., 1979. Fatal autoimmune hemolytic
anemia associated with ibuprofen. The Journal of the American Medical
Association, 242(1), pp.68-69.
Gurr, C.J. & Reinhard, M., 2006. Harnessing natural attenuation of pharmaceuticals
and hormones in rivers. Environmental Science and Technology, 40(9),
pp.2872-2876.
De Gusseme, B. et al., 2011. Degradation of acetaminophen by Delftia tsuruhatensis
and Pseudomonas aeruginosa in a membrane bioreactor. Water Research, 45(4),
pp.1829-1837.
Gómez, M.J. et al., 2006. Determination of pharmaceuticals of various therapeutic
classes by solid-phase extraction and liquid chromatography-tandem mass
spectrometry analysis in hospital effluent wastewaters. Journal of
Chromatography A, 1114(2), pp.224-233.
Göbel, A. et al., 2005. Extraction and determination of sulfonamides, macrolides,
and trimethoprim in sewage sludge. Journal of Chromatography A, 1085(2),
pp.179-189.
HMSO, 2005. The hazardous waste (England and Wales) regulations. Available from
http://www.legislation.gov.uk/uksi/2005/894/contents/made.
Haap, T., Triebskorn, R. & Köhler, H.-R., 2008. Acute effects of diclofenac and
DMSO to Daphnia magna: immobilisation and hsp70-induction. Chemosphere,
73(3), pp.353-359.
Haeba, M.H. et al., 2008. Selected endocrine disrupting compounds (vinclozolin ,
flutamide , ketoconazole and Dicofol): effects on survival , occurrence of males
, growth , molting and reproduction of daphnia magna. Environmental Science
and Pollution Research, 15(3), pp.222-227.
Haider, S. & Baqri, S.S., 2000. beta-adrenoceptor antagonists reinitiate meiotic
maturation in Clarias batrachus oocytes. Comparative Biochemistry and
Physiology Part A, 126(4), pp.517-525.

184
Halling-Sørensen, B. et al., 1998. Occurrence, fate and effects of pharmacetuical
substances in the environment-a review. Chemosphere, 36(2), pp.357-393.
Han, S. et al., 2010. Endocrine disruption and consequences of chronic exposure to
ibuprofen in Japanese medaka (Oryzias latipes) and freshwater cladocerans
Daphnia magna and Moina macrocopa. Aquatic Toxicology, 98(3), pp.256-264.
Hartmann, A. et al., 1998. Identification of fluoroquinolone antibiotics as the main
source of umuC genotoxicity in native hospital wastewater. Environmental
Toxicology and Chemistry, 17(3), pp.377-382.
Haug, T. & Hals, P.A., 2000. Pharmacokinetics of oxytetracyline in Arctic charr
(Salvelinus alpinus L.) in freshwater at low temperature. Aquaculture, 186(3-4),
pp.175-191.
Heberer, T., 2002a. Occurrence, fate, and removal of pharmaceutical residues in the
aquatic environment: a review of recent research data. Toxicology Letters,
131(1-2), pp.5-17.
Heberer, T., 2002b. Tracking persistent pharmaceutical residues from municipal
sewage to drinking water. Journal of Hydrology, 266(3-4), pp.175-189.
Heberer, T. & Feldmann, D.F., 2005. Contribution of effluents from hospitals and
private households to the total loads of diclofenac and carbamazepine in
municipal sewage effluents--modeling versus measurements. Journal of
Hazardous Materials, 122(3), pp.211-218.
Heberer, T. et al., 2004. Field studies on the fate and transport of pharmaceutical
residues in bank filtration. Ground Water Monitoring and Remediation, 24(2),
pp.70-77.
Hernández-Díaz, S. et al., 2009. Medications as a potential source of exposure to
phthalates in the U.S. population. Environmental health perspectives, 117(2),
pp.185-189.
Hignite, C. & Azarnoff, D.L., 1977. Drugs and drug metabolites as environmental
contaminants: chlorophenoxyisobutyrate and salicylic acid in sewage water
effluent. Life Sciences, 20(2), pp.337–342.
Hilton, M.J. & Thomas, K.V., 2003. Determination of selected human
pharmaceutical compounds in effluent and surface water samples by high-
performance liquid chromatography–electrospray tandem mass spectrometry.
Journal of Chromatography A, 1015(1-2), pp.129-141.
Hinck, J.E. et al., 2009. Widespread occurrence of intersex in black basses
(Micropterus spp.) from U.S. rivers, 1995-2004. Aquatic Toxicology, 95(1),
pp.60-70.
Hirsch, R. et al., 1999. Occurrence of antibiotics in the aquatic environment. Science
of the Total Environment, 225(1-2), pp.109-118.

185
Hoerger, C.C. et al., 2009. Environmental risk assessment for the galenical
formulation of solid medicinal products at Roche Basle, Switzerland. Integrated
Environmental Assessment and Management, 5(2), pp.331-337.
Holm, J.V. et al., 1995. Occurrence and distribution of pharmaceutical organic
compounds in the groundwater downgradient of a landfill (Grindsted,
Denmark). Environmental Science and Technology, 29(5), pp.1415-1420.
Hua, W., Bennett, E.R. & Letcher, R.J., 2005. Triclosan in waste and surface waters
from the upper Detroit River by liquid chromatography-electrospray-tandem
quadrupole mass spectrometry. Environment International, 31(5), pp.621-630.
Huggett, D.B. et al., 2002. Toxicity of select beta adrenergic receptor-blocking
pharmaceuticals (B-blockers) on aquatic organisms. Archives of Environmental
Contamination and Toxicology, 43(2), pp.229-235.
Hughes, J.A. & Sudell, W., 1983. Hemolytic anemia associated with naproxen.
Arthritis & Rheumatism, 26(8), pp.1054–1054.
ICPDR, 2009. Danube river basin district management plan: part A-basin wide
overview. , p.IC/151.
IMS, 2010. IMS forecasts global pharmaceutical market growth of 5-8% annually
through 2014; maintains expectations of 4-6% growth in 2010. IMS Health
Market Prognosis. Available from
http://www.imshealth.com/portal/site/imshealth/menuitem.a46c6d4df3db4b3d8
8f611019418c22a/?vgnextoid=4b8c410b6c718210VgnVCM100000ed152ca2R
CRD.
IMS, 2009. Total unaudited and audited global pharmaceutical market by region.
IMS Health Market Prognosis. Available from
http://imshealth.com/deployedfiles/imshealth/Global/Content/StaticFile/Top_Li
ne_Data/Global_Pharm_Market_by_Region.pdf.
IUCN, 2009. IUCN red list of threatened species. http://www.iucnredlist.org.
Jacobsen, P.A.L. & Berglind, L., 1988. Persistence of oxytetracycline in sediments
from fish farms. Aquaculture, 70, pp.365-370.
Janknegt, R., 1990. Drug interactions with quinolones. Journal of Antimicrobial
Chemotherapy, 26 Suppl D, pp.7-29.
Joakim Larsson, D.G. & Fick, J., 2009. Transparency throughout the production
chain--a way to reduce pollution from the manufacturing of pharmaceuticals?
Regulatory Toxicology and Pharmacology, 53(3), pp.161-163.
Jobling, S., 2004. Comparative responses of molluscs and fish to environmental
estrogens and an estrogenic effluent. Aquatic Toxicology, 66(2), pp.207-222.

186
Johnson, J.N. & McFarland, J., 1980. Retroperitoneal fibrosis associated with
atenolol. British Medical Journal, 281(6232), p.59.
Jones, O.A.H. et al., 2008. Metabolic profiling of Mytilus galloprovincialis and its
potential applications for pollution assessment. Marine Ecology-Progress
Series, 369, pp.169-179.
Jones, O.A.H., Green, P.G., et al., 2007a. Questioning the excessive use of advanced
treatment to remove organic micropollutants from wastewater. Environmental
Science and Technology, 41(14), pp.5085-5089. Available at:
http://www.ncbi.nlm.nih.gov/pubmed/17711227.
Jones, O.A.H., Lester, J.N. & Voulvoulis, N., 2005a. Pharmaceuticals: a threat to
drinking water? Trends in Biotechnology, 23(4), pp.163-167.
Jones, O.A.H., Voulvoulis, N. & Lester, J.N., 2003a. Analytical method
development for the simultaneous determination of five human pharmaceuticals
in water and wastewater samples by gas chromatography-mass spectrometry.
Chromatographia, 58(7), pp.471–477.
Jones, O.A.H., Voulvoulis, N. & Lester, J.N., 2002. Aquatic environmental
assessment of the top 25 English prescription pharmaceuticals. Water Research,
36(20), pp.5013-5022.
Jones, O.A.H., Voulvoulis, N. & Lester, J.N., 2001. Human pharmaceuticals in the
aquatic environment a review. Environmental Technology, 22(12), pp.1383–
1394.
Jones, O.A.H., Voulvoulis, N. & Lester, J.N., 2005b. Human pharmaceuticals in
wastewater treatment processes. Critical Reviews in Environmental Science and
Technology, 35(4), pp.401-427.
Jones, O.A.H., Voulvoulis, N. & Lester, J.N., 2006. Partitioning behavior of five
pharmaceutical compounds to activated sludge and river sediment. Archives of
Environmental Contamination and Toxicology, 50(3), pp.297-305.
Jones, O.A.H., Voulvoulis, N. & Lester, J.N., 2004. Potential ecological and human
health risks associated with the presence of pharmaceutically active compounds
in the aquatic environment. Critical Reviews in Toxicology, 34(4), pp.335-350.
Jones, O.A.H., Voulvoulis, N. & Lester, J.N., 2003b. Potential impact of
pharmaceuticals on environmental health. Bulletin of the World Health
Organization, 81(10), pp.768-9. Available at:
http://www.pubmedcentral.nih.gov/articlerender.fcgi?artid=2572330&tool=pmc
entrez&rendertype=abstract.
Jones, O.A.H., Voulvoulis, N. & Lester, J.N., 2007b. The occurrence and removal of
selected pharmaceutical compounds in a sewage treatment works utilising
activated sludge treatment. Environmental Pollution, 145, pp.738-744.

187
Kanetoshi, A. et al., 1988. Formation of polychlorinated dibenzo-p-dioxins upon
combustion of commercial textile products containing 2, 4, 4’-trichloro-2'-
hydroxydiphenyl ether (Irgasanо DP300). Journal of Chromatography A, 442,
pp.289–299.
Karatzas, K.A. et al., 2007. Prolonged treatment of Salmonella enterica serovar
Typhimurium with commercial disinfectants selects for multiple antibiotic
resistance, increased efflux and reduced invasiveness. Journal of Antimicrobial
Chemotherapy, 60, pp.947-955.
Karickhoff, S., Brown, K.D. & Scott, T., 1979. Sorption of hydrophobic pollutants
on natural sediments. Water Research, 13(3), pp.241-248.
Kasprzyk-Hordern, B., Dinsdale, R.M. & Guwy, A.J., 2008. The occurrence of
pharmaceuticals, personal care products, endocrine disruptors and illicit drugs
in surface water in South Wales, UK. Water Research, 42(13), pp.3498-3518.
Kay, P., Blackwell, P.A. & Boxall, A.B.A., 2005. Column studies to investigate the
fate of veterinary antibiotics in clay soils following slurry application to
agricultural land. Chemosphere, 60(4), pp.497-507.
Kim, S. et al., 2005. Removal of antibiotics in wastewater: Effect of hydraulic and
solid retention times on the fate of tetracycline in the activated sludge process.
Environmental Science and Technology, 39(15), pp.5816-5823.
Kim, S.-C. & Carlson, K., 2007. Temporal and spatial trends in the occurrence of
human and veterinary antibiotics in aqueous and river sediment matrices.
Environmental Science and Technology, 41(1), pp.50-57.
Kinney, C.A., Furlong, E.T., Werner, S.L., et al., 2006. Presence and distribution of
wastewater-derived pharmaceuticals in soil irrigated with reclaimed water.
Environmental Toxicology and Chemistry, 25(2), pp.317-326.
Kinney, C.A., Furlong, E.T., Zaugg, S.D., et al., 2006. Survey of organic wastewater
contaminants in biosolids destined for land application. Environmental Science
and Technology, 40(23), pp.7207-7215.
Klein, W., 1999. Revised proposal for a list of priority substances in the context of
the Water Framework Directive (COMMPS procedure). , pp.1-81.
Kolpin, D.W. et al., 2002. Pharmaceuticals, hormones, and other organic wastewater
contaminants in U.S. streams, 1999−2000: a national reconnaissance.
Environmental Science and Technology, 36(6), pp.1202-1211.
Kreuzinger, N. et al., 2004. Investigation on the behaviour of selected
pharmaceuticals in the groundwater after infiltration of treated wastewater.
Water Science and Technology, 50(2), pp.221-228.

188
Kunkel, U. & Radke, M., 2008. Biodegradation of acidic pharmaceuticals in bed
sediments: insight from a laboratory experiment. Environmental Science and
Technology, 42(19), pp.7273-7279.
Kümmerer, K., 2009a. Antibiotics in the aquatic environment - a review - part I.
Chemosphere, 75(4), pp.417-434.
Kümmerer, K., 2009b. Antibiotics in the aquatic environment - a review - part II.
Chemosphere, 75(4), pp.435-441.
Kümmerer, K., 2001. Drugs in the environment: emission of drugs, diagnostic aids
and disinfectants into wastewater by hospitals in relation to other sources--a
review. Chemosphere, 45(6-7), pp.957-969.
Kümmerer, K., 2008. Pharmaceuticals in the environment: sources, fate, effects and
risks 3rd ed., Berlin: Springer.
Kümmerer, K., 2004a. Pharmaceuticals in the environment: sources, fate, effects
and risks 2nd ed., Verlag: Springer.
Kümmerer, K., 2004b. Resistance in the environment. Journal of Antimicrobial
Chemotherapy, 54(2), pp.311-320.
Kümmerer, K., 2009c. The presence of pharmaceuticals in the environment due to
human use--present knowledge and future challenges. Journal of Environmental
Management, 90(8), pp.2354-2366.
Kümmerer, K. & Helmers, E., 1997. Hospital effluents as a source for platinum in
the environment. Science of the Total Environment, 193, pp.179-184.
Kümmerer, K. & Helmers, E., 2000. Hospital effluents as a source of gadolinium in
the aquatic environment. Environmental Science and Technology, 34(4),
pp.573-577.
Kümmerer, K. & Henninger, A., 2003. Promoting resistance by the emission of
antibiotics from hospitals and households into effluent. Clinical Microbiology
and Infection, 9(12), pp.1203-1214.
ter Laak, T.L., Wouter, A.G. & Tolls, J., 2006. The effect of pH and ionic strength
on the sorption of sulfachloropyridazine, tylosin, and oxytetracycline to soil.
Environmental Toxicology and Chemistry, 25(4), pp.904-911.
Lalumera, G.M. et al., 2004. Preliminary investigation on the environmental
occurrence and effects of antibiotics used in aquaculture in Italy. Chemosphere,
54(5), pp.661-668.
Lam, M.W. & Mabury, S.A., 2005. Photodegradation of the pharmaceuticals
atorvastatin, carbamazepine, levofloxacin, and sulfamethoxazole in natural
waters. Aquatic Sciences, 67(2), pp.177-188.

189
Lam, M.W., Tantuco, K. & Mabury, S.A., 2003. PhotoFate: a new approach in
accounting for the contribution of indirect photolysis of pesticides and
pharmaceuticals in surface waters. Environmental Science and Technology,
37(5), pp.899-907.
Langford, K.H. & Thomas, K.V., 2009. Determination of pharmaceutical
compounds in hospital effluents and their contribution to wastewater treatment
works. Environment International, 35(5), pp.766-770.
Lapen, D.R. et al., 2008. Pharmaceutical and personal care products in tile drainage
following land application of municipal biosolids. Science of the Total
Environment, 399(1-3), pp.50-65.
Larkin, M., 1999. A close look at triclosan raises questions. The Lancet, 353(9159),
pp.1160-1160.
Larsson, D.G.J. et al., 1999. Ethinyloestradiol - an undesired fish contraceptive?
Aquatic Toxicology, 45(2-3), pp.91-97.
Larsson, D.G.J., de Pedro, C. & Paxéus, N.A., 2007. Effluent from drug
manufactures contains extremely high levels of pharmaceuticals. Journal of
Hazardous Materials, 148(3), pp.751-755.
Latch, D.E. et al., 2005. Aqueous photochemistry of triclosan: Formation of 2, 4-
dichlorophenol, 2, 8-dichlorodibenzo-p-dioxin, and oligomerization products.
Environmental Toxicology and Chemistry, 24(3), pp.517–525.
Lawler, J.M. & Thomas, S.H.L., 2005. Patterns of intentional self poisoning in
adults. Clinical Toxicology, 43(4), p.367.
Lee, L.S. et al., 2007. Agricultural contributions of antimicrobials and hormones on
soil and water quality. Advances in Agronomy, 93, pp.1-68.
Leech, D.M., Snyder, M.T. & Wetzel, R.G., 2009. Natural organic matter and
sunlight accelerate the degradation of 17ss-estradiol in water. Science of the
Total Environment, 407(6), pp.2087-2092.
Lenz, K. et al., 2007. Monitoring, removal and risk assessment of cytostatic drugs in
hospital wastewater. Water Science and Technology, 56(12), pp.141-149.
Levy, C.W. et al., 1999. Molecular basis of triclosan activity. Nature, 398, pp.383-
383.
Li, D., Yang, M., Hu, J., Ren, L., et al., 2008. Determination and fate of
oxytetracycline and related compounds in oxytetracycline production
wastewater and the receiving river. Environmental Toxicology and Chemistry,
27(1), pp.80-66.

190
Li, D., Yang, M., Hu, J., Zhang, Y., et al., 2008. Determination of penicillin G and
its degradation products in a penicillin production wastewater treatment plant
and the receiving river. Water Research, 42(1-2), pp.307-317.
Lin, A.Y.-C. & Reinhard, M., 2005. Photodegradation of common environmental
pharmaceuticals and estrogens in river water. Environmental Toxicology and
Chemistry, 24(6), pp.1303–1309.
Lin, A.Y.-C. & Tsai, Y.-T., 2009. Occurrence of pharmaceuticals in Taiwan’s
surface waters: impact of waste streams from hospitals and pharmaceutical
production facilities. Science of the Total Environment, 407(12), pp.3793-3802.
Lin, A.Y.-C., Yu, T.-H. & Lateef, S.K., 2009. Removal of pharmaceuticals in
secondary wastewater treatment processes in Taiwan. Journal of Hazardous
Materials, 167(1-3), pp.1163-1169.
Lin, A.Y.-C., Yu, T.-H. & Lin, C.-F., 2008. Pharmaceutical contamination in
residential, industrial, and agricultural waste streams: risk to aqueous
environments in Taiwan. Chemosphere, 74(1), pp.131-141.
Lindberg, R.H. et al., 2006. Behavior of fluoroquinolones and trimethoprim during
mechanical, chemical, and active sludge treatment of sewage water and
digestion of sludge. Environmental Science and Technology, 40(3), pp.1042-
1048.
Lindberg, R.H. et al., 2005. Screening of human antibiotic substances and
determination of weekly mass flows in five sewage treatment plants in Sweden.
Environmental Science and Technology, 39(10), pp.3421-3429.
Lindsey, M.E., Meyer, M.T. & Thurman, E.M., 2001. Analysis of trace levels of
sulfonamide and tetracycline antimicrobials in groundwater and surface water
using solid-phase extraction and liquid chromatography/mass spectrometry.
Analytical Chemistry, 73(19), pp.4640-4646.
Lindström, A. et al., 2002. Occurrence and environmental behavior of the bactericide
triclosan and its methyl derivative in surface waters and in wastewater.
Environmental Science and Technology, 36(11), pp.2322-2329.
Liu, B.A. et al., 1996. Hyponatremia and the syndrome of inappropriate secretion of
antidiuretic hormone associated with the use of selective serotonin reuptake
inhibitors: a review of spontaneous reports. Canadian Medical Association
Journal, 155(5), pp.519-527.
Liu, Q.-T. & Williams, H.E., 2007. Kinetics and degradation products for direct
photolysis of beta-blockers in water. Environmental Science and Technology,
41(3), pp.803-810.
Liu, Q.-T., Cumming, R.I. & Sharpe, A.D., 2009a. Photo-induced environmental
depletion processes of beta-blockers in river waters. Photochemical and
Photobiological Sciences, 8(6), pp.768-777.

191
Liu, Q.-T., Williams, T.D., et al., 2009b. Comparative aquatic toxicity of propranolol
and its photodegraded mixtures: Algae and rotifer screening. Environmental
Toxicology and Chemistry, 28(12), pp.2622–2631.
Lo, M.W. et al., 1995. Pharmacokinetics of losartan, an angiotensin II receptor
antagonist, and its active metabolite EXP3174 in humans. Clinical
Pharmacology and Therapeutics, 58(6), pp.641-649.
Loos, R. et al., 2010. Pan-European survey on the occurrence of selected polar
organic persistent pollutants in ground water. Water Research, 44(14), pp.4115-
4126.
Loraine, G.A. & Pettigrove, M.E., 2006. Seasonal variations in concentrations of
pharmaceuticals and personal care products in drinking water and reclaimed
wastewater in southern California. Environmental Science and Technology,
40(3), pp.687-695.
Malintan, N.T. & Mohd, M.A., 2006. Determination of sulfonamides in selected
Malaysian swine wastewater by high-performance liquid chromatography.
Journal of Chromatography A, 1127(1-2), pp.154-160.
Manandhar, N.P., 2002. Plants and People of Nepal, Oregon: Timber Press.
Martin, O.V. & Voulvoulis, N. 2009. Sustainable risk management of emerging
contaminants in municipal wastewaters. Philosophical Transactions of the
Royal Society A - Mathematical Physical and Engineering Sciences, 367(1904),
pp. 3895-3922.
Martinez, J.L., 2009. Environmental pollution by antibiotics and by antibiotic
resistance determinants. Environmental Pollution, 157(11), pp.2893-2902.
Martinsen, B. & Horsberg, T.E., 1995. Comparative single-dose pharmacokinetics of
four quinolones, oxolinic acid, flumequine, sarafloxacin, and enrofloxacin, in
Atlantic salmon (Salmo salar) held in seawater at 10 degrees C. Antimicrobial
Agents and Chemotherapy, 39(5), pp.1059-1064.
Marttinen, S.K. et al., 2003. Removal of bis(2-ethylhexyl) phthalate at a sewage
treatment plant. Water Research, 37(6), pp.1385-1393.
Matamoros, V. et al., 2008. Photodegradation of carbamazepine, ibuprofen,
ketoprofen and 17α-ethinylestradiol in fresh and seawater. Water, Air, and Soil
Pollution, 196(1-4), pp.161-168.
McAvoy, D.C. et al., 2002. Measurement of triclosan in wastewater treatment
systems. Environmental Toxicology and Chemistry, 21(7), pp.1323-1329.
McCall, 1982. Sampling and statistics: Handbook for research, Iowa: Iowa State
University Press.

192
McClellan, K. & Halden, R.U., 2010. Pharmaceuticals and personal care products in
archived U.S. biosolids from the 2001 EPA National Sewage Sludge Survey.
Water Research, 44(2), pp.658-668.
McDermott, G. et al., 1995. Crystal structure of an integral membrane light-
harvesting complex from photosynthetic bacteria. Nature, 374(6522), pp.517–
521.
McManus, P.S. et al., 2002. Antibiotic use in plant agriculture. Annual Review of
Phytopathology, 40(18), pp.443-465.
McMurry, L.M., Oethinger, M. & Levy, S.B., 1998. Triclosan targets lipid synthesis.
Nature, 394, pp.531-532.
Meeker, J.D., Calafat, A.M. & Hauser, R., 2008. Urinary metabolites of di(2-
ethylhexyl) phthalate are associated with decreased steroid hormone levels in
adult men. Journal of Andrology, 30(3), pp.287-297.
Mennigen, J.A. et al., 2010. Waterborne fluoxetine disrupts the reproductive axis in
sexually mature male goldfish, Carassius auratus. Aquatic Toxicology, 100(4),
pp.354-364.
Metcalfe, C.D. et al., 2003. Distribution of acidic and neutral drugs in surface waters
near sewage treatment plants in the lower Great Lakes, Canada. Environmental
Toxicology and Chemistry, 22(12), pp.2881-2889.
Metzger, J.W., 2004. Drugs in municipal landfills and landfill leachates. In K.
Kümmerer, ed. Pharmaceuticals in the environment: sources, fate, effects and
risks. Berlin: Springer, pp. 149-163.
Mezcua, M. et al., 2004. Evidence of 2,7/2,8-dibenzodichloro-p-dioxin as a
photodegradation product of triclosan in water and wastewater samples.
Analytica Chimica Acta, 524(1-2), pp.241-247.
Miao, X.-S., Koenig, B.G. & Metcalfe, C.D., 2002. Analysis of acidic drugs in the
effluents of sewage treatment plants using liquid chromatography-electrospray
ionization tandem mass spectrometry. Journal of Chromatography A, 952(1-2),
pp.139-147.
Middleton, N. et al., 2001. Secular trends in antidepressant prescribing in the UK,
1975-1998. Journal of Public Health Medicine, 23(4), pp.262-267.
Minagh, E. et al., 2009. Aquatic ecotoxicity of the selective serotonin reuptake
inhibitor sertraline hydrochloride in a battery of freshwater test species.
Ecotoxicology and Environmental Safety, 72(2), pp.434-440.
Miranda, C.D. & Zemelman, R., 2001. Antibiotic resistant bacteria in fish from the
Concepción Bay, Chile. Marine Pollution Bulletin, 42(11), pp.1096-1102.

193
Mompelat, S., Le Bot, B. & Thomas, O., 2009. Occurrence and fate of
pharmaceutical products and by-products, from resource to drinking water.
Environment International, 35(5), pp.803-814.
Morasch, B. et al., 2010. Occurrence and fate of micropollutants in the Vidy Bay of
Lake Geneva, Switzerland. Part II: micropollutant removal between wastewater
and raw drinking water. Environmental Toxicology and Chemistry, 29(8),
pp.1658-1668.
Morrall, D. et al., 2004. A field study of triclosan loss rates in river water (Cibolo
Creek, TX). Chemosphere, 54, pp.653-660.
Morris, A.W. et al., 1978. Very low salinity regions of estuaries: important sites for
chemical and biological reactions. Nature, 274(5672), pp.678-680.
Mullot, J.U. et al., 2010. Modeling of hospital wastewater pollution by
pharmaceuticals: first results of Mediflux study carried out in three French
hospitals. Water Science and Technology, 61(12), pp.2912-2919.
Musa, K.A.K. & Eriksson, L.A., 2007. Theoretical study of ibuprofen phototoxicity.
The Journal of Physical Chemistry B, 111(46), pp.13345-13352.
Nagarnaik, P., Batt, A. & Boulanger, B., 2010. Concentrations and mass loadings of
cardiovascular pharmaceuticals in healthcare facility wastewaters. Journal of
Environmental Monitoring, 12(11), pp.2112-2119.
Nagarnaik, P., Batt, A. & Boulanger, B., 2011. Source characterization of nervous
system active pharmaceutical ingredients in healthcare facility wastewaters.
Journal of Environmental Management, 92(3), pp.872-877.
Naidoo, V. & Swan, G.E., 2009. Diclofenac toxicity in Gyps vulture is associated
with decreased uric acid excretion and not renal portal vasoconstriction.
Comparative Biochemistry and Physiology Part C, 149(3), pp.269-274.
Nakatani, N., Hashimoto, N. & Sakugawa, H., 2004. An evaluation of hydroxyl
radical formation in river water and the potential for photodegradation of
bisphenol A. The Geochemical Society Special Publications, 9, pp.233-242.
Oaks, J.L. et al., 2004. Diclofenac residues as the cause of vulture population decline
in Pakistan. Nature, 427(6975), pp.630-633.
Office Of Fair Trading, 2005. Care homes for older people in the UK.
Office of National Statistics, 2001. Census 2001.
Office of National Statistics, 2008. General pharmaceutical services in England and
Wales 1998-99 to 2007-08. The Health and Social Care Information Centre,
NHS, pp.1-38.

194
Oliver, R., May, E. & Williams, J., 2005. The occurrence and removal of phthalates
in a trickle filter STW. Water Research, 39(18), pp.4436-4444.
Onan, L.J. & LaPara, T.M., 2003. Tylosin-resistant bacteria cultivated from
agricultural soil. FEMS Microbiology Letters, 220(1), pp.15-20.
Ort, C. et al., 2010. Determining the fraction of pharmaceutical residues in
wastewater originating from a hospital. Water Research, 44(2), pp.605-615.
Orvos, D.R. et al., 2002. Aquatic toxicity of triclosan. Environmental Toxicology
and Chemistry, 21, pp.1338-1349.
Oteo, J.A. et al., 1994. Clarithromycin-induced thrombocytopenic purpura. Clinical
Infectious Diseases, 19(6), pp.1170-1171.
Ośmiałowska, Z. et al., 1990. Effect of nifedipine monotherapy on platelet
aggregation in patients with untreated essential hypertension. European Journal
of Clinical Pharmacology, 18, pp.403-404.
OTC BULLETIN, 2011. Prescribed OTC sector buoyant in UK. OTC MARKETS.
pp. 22-23.
Packer, J.L. et al., 2003. Photochemical fate of pharmaceuticals in the environment:
naproxen, diclofenac, clofibric acid, and ibuprofen. Aquatic Sciences, 65(4),
pp.342-351.
Paterson, G. & Metcalfe, C.D., 2008. Uptake and depuration of the anti-depressant
fluoxetine by the Japanese medaka (Oryzias latipes). Chemosphere, 74(1),
pp.125-130.
Peijnenburg, W.J.G.M. & Struijs, J., 2006. Occurrence of phthalate esters in the
environment of the Netherlands. Ecotoxicology and Environmental Safety,
63(2), pp.204-215.
Peng, Z., Wu, F. & Deng, N., 2006. Photodegradation of bisphenol A in simulated
lake water containing algae, humic acid and ferric ions. Environmental
Pollution, 144, pp.840-846.
Pereira, V.J. et al., 2007. UV degradation kinetics and modeling of pharmaceutical
compounds in laboratory grade and surface water via direct and indirect
photolysis at 254 nm. Environmental Science and Technology, 41(5), pp.1682-
1688.
Piram, A. et al., 2008. Photolysis of beta-blockers in environmental waters.
Chemosphere, 73(8), pp.1265-1271.
Poiger, T., Buser, H.-R. & Müller, M.D., 2001. Photodegradation of the
pharmaceutical drug diclofenac in a lake: pathway, field measurements, and
mathematical modeling. Environmental Toxicology and Chemistry, 20(2),
pp.256-263.

195
Post, R.M. et al., 2005. Preliminary observations on the effectiveness of
levetiracetam in the open adjunctive treatment of refractory bipolar disorder.
Journal of Clinical Psychiatry, 66(3), pp.370-374.
Pouliquen, H. & Le Bris, H., 1996. Sorption of oxolinic acid and oxytetracycline to
marine sediments. Chemosphere, 33(5), pp.801-815.
Prakash, V. et al., 2003. Catastrophic collapse of Indian white-backed Gyps
bengalensis and long-billed Gyps indicus vulture populations. Biological
Conservation, 109(3), pp.381-390.
Pérez, S. & Barceló, D., 2007. Application of advanced MS techniques to analysis
and identification of human and microbial metabolites of pharmaceuticals in the
aquatic environment. TrAC Trends in Analytical Chemistry, 26(6), pp.494-514.
Pérez, S., Eichhorn, P. & Aga, D.S., 2005. Evaluating the biodegradability of
sulfamethazine, sulfamethoxazole, sulfathiazole, and trimethoprim at different
stages of sewage treatment. Environmental Toxicology and Chemistry, 24(6),
pp.1361-1367.
Pérez-Estrada, L.A. et al., 2005. Photo-fenton degradation of diclofenac:
identification of main intermediates and degradation pathway. Environmental
Science and Technology, 39(21), pp.8300-8306.
Péry, A.R.R. et al., 2008. Fluoxetine effects assessment on the life cycle of aquatic
invertebrates. Chemosphere, 73(3), pp.300-304.
Quinn, B., Gagné, F. & Blaise, C., 2008. An investigation into the acute and chronic
toxicity of eleven pharmaceuticals (and their solvents) found in wastewater
effluent on the cnidarian, Hydra attenuata. Science of the Total Environment,
389(2-3), pp. 306-314.
Quintana, J.B. & Reemtsma, T., 2004. Sensitive determination of acidic drugs and
triclosan in surface and wastewater by ion-pair reverse-phase liquid
chromatography/tandem mass spectrometry. Rapid Communications in Mass
Spectrometry, 18(7), pp.765-774.
Quintana, J.B., Weiss, S. & Reemtsma, T., 2005. Pathways and metabolites of
microbial degradation of selected acidic pharmaceutical and their occurrence in
municipal wastewater treated by a membrane bioreactor. Water Research,
39(12), pp.2654-2664.
Randall, L.P. et al., 2007. Commonly used farm disinfectants can select for mutant
Salmonella enterica serovar Typhimurium with decreased susceptibility to
biocides and antibiotics without compromising virulence. Journal of
Antimicrobial Chemotherapy, 60, pp.1273-1280.
REACH, 2008. Regulation, Evaluation and Authorisation of CHemicals. European
Commission. http://www.hse.gov.uk/reach.

196
Rakkestad, K.E. et al., 2007. Phthalate levels in Norwegian indoor air related to
particle size fraction. Journal of Environmental Monitoring, 9(12), pp.1419-
1425.
Rashed, R., 1996. Encyclopaedia of the History of Arabic Science, London:
Routledge.
Rasmussen, K., Andersen, K. & Wang, H., 1982. Atrial fibrillation induced by
atenolol. European Heart Journal, 3(3), pp.276-281.
Razavi, B. et al., 2011. Photochemical fate of atorvastatin (lipitor) in simulated
natural waters. Water Research, 45(2), pp.625-631.
Readman, J.W. et al., 1982. Aquatic distribution and heterotrophic degradation of
polycyclic aromatic hydrocarbons (PAH) in the Tamar estuary. Estuarine,
Coastal and Shelf Science, 14, pp.369-389.
Reed, J.L. & Lyne, M., 2000. Inpatient care of mentally ill people in prison: results
of a year’s programme of semistructured inspections. British Medical Journal,
320(7241), pp.1031-1034.
Reid, S.D., Moon, T.W. & Perry, S.F., 1992. Rainbow trout hepatocyte beta-
adrenoceptors, catecholamine responsiveness, and effects of cortisol. The
American Journal of Physiology-Regulatory, Integrative and Comparative
Physiology, 262, pp.794-799.
Ricart, M. et al., 2010. Triclosan persistence through wastewater treatment plants
and its potential toxic effects on river biofilms. Aquatic Toxicology, 100(4),
pp.346-353.
Richardson, M.L. & Bowron, J.M., 1985. The fate of pharmaceutical chemicals in
the aquatic environment. The Journal of Pharmacy and Pharmacology, 37(1),
pp.1-12.
Roberts, P.H. & Thomas, K.V., 2006. The occurrence of selected pharmaceuticals in
wastewater effluent and surface waters of the lower Tyne catchment. Science of
the Total Environment, 356(1-3), pp.143-153.
Robinson, P.F. et al., 2007. Modeling the impact of direct phototransformation on
predicted environmental concentrations (PECs) of propranolol hydrochloride in
UK and US rivers. Chemosphere, 66(4), pp.757-766.
Roderick, P.J., Wilkes, H.C. & Meade, T.W., 1993. The gastrointestinal toxicity of
aspirin: an overview of randomised controlled trials. British Journal of Clinical
Pharmacology, 35, pp.219-226.
Rollof, J. & Vinge, E., 1993. Neurological adverse effects during concomitant
treatment with ciprofloxacin, NSAIDs, and chloroquine: possible drug
interaction. The Annals of Pharmacotherapy, 27(9), pp.1058-1059.

197
Rooklidge, S.J., 2004. Environmental antimicrobial contamination from
terraccumulation and diffuse pollution pathways. Science of the Total
Environment, 325(1-3), pp.1-13.
Rudel, R.A. & Perovich, L.J., 2009. Endocrine disrupting chemicals in indoor and
outdoor air. Atmospheric Environment, 43(1), pp.170-181.
Rudel, R.A. et al., 2003. Phthalates, alkylphenols, pesticides, polybrominated
diphenyl ethers, and other endocrine-disrupting compounds in indoor air and
dust. Environmental Science and Technology, 37(20), pp.4543-4553.
Ruhoy, I.S. & Daughton, C.G., 2008. Beyond the medicine cabinet: an analysis of
where and why medications accumulate. Environment International, 34(8),
pp.1157-1169.
RxList, The internet drug index. Available from http://www.rxlist.com.
Ryan, C.C., Tan, D.T. & Arnold, W.A., 2011. Direct and indirect photolysis of
sulfamethoxazole and trimethoprim in wastewater treatment plant effluent.
Water Research, 45(3), pp.1280-1286.
SCCS, 2010. Opinion on triclosan: antimicrobial resistance. European Commission,
pp.1-56.
Sabaliunas, D. et al., 2003. Environmental fate of triclosan in the River Aire Basin,
UK. Water Research, 37(13), pp.3145-3154.
Sacher, F. et al., 2001. Pharmaceuticals in groundwaters analytical methods and
results of a monitoring program in Baden-Württemberg, Germany. Journal of
Chromatography A, 938(1-2), pp.199-210.
Sakkas, V.A. et al., 2007. Heterogeneous photocatalytic degradation of the
pharmaceutical agent salbutamol in aqueous titanium dioxide suspensions.
Applied Catalysis B: Environmental, 77(1-2), pp.135-144.
Samuelsen, O.B., Bergh, O. & Ervik, A., 2003. A single-dose pharmacokinetic study
of oxolinic acid and vetoquinol, an oxolinic acid ester, in cod, Gadus morhua
L., held in sea water at 8 degrees C and in vitro antibacterial activity of oxolinic
acid against Vibrio anguillarum strains isolated from di. Journal of Fish
Diseases, 26(6), pp.339-347.
Sanchez-Prado, L. et al., 2006. Monitoring the photochemical degradation of
triclosan in wastewater by UV light and sunlight using solid-phase
microextraction. Chemosphere, 65(8), pp.1338-1347.
Sarmah, A.K., Meyer, M.T. & Boxall, A.B.A., 2006. A global perspective on the
use, sales, exposure pathways, occurrence, fate and effects of veterinary
antibiotics (VAs) in the environment. Chemosphere, 65(5), pp.725-759.

198
Sassman, S.A. & Lee, L.S., 2005. Sorption of three tetracyclines by several soils:
assessing the role of pH and cation exchange. Environmental Science and
Technology, 39(19), pp.7452-7459.
Scheytt, T. et al., 2004. Transport of pharmaceutically active compounds in saturated
laboratory columns. Ground Water, 42(5), pp.767-773.
Scholes, B. & Weiss, J., 1952. Chemical action of X-rays on nucleic acids and
related substances in aqueous systems. , 53, pp.567-578.
Scholz, N., 2003. Ecotoxicity and biodegradation of phthalate monoesters.
Chemosphere, 53(8), pp.921-926.
Schultz, M.M. & Furlong, E.T., 2008. Trace analysis of antidepressant
pharmaceuticals and their select degradates in aquatic matrixes by
LC/ESI/MS/MS. Analytical Chemistry, 80(5), pp.1756-1762.
Schultz, M.M. et al., 2010. Antidepressant pharmaceuticals in two U.S. effluent-
impacted streams: occurrence and fate in water and sediment, and selective
uptake in fish neural tissue. Environmental Science and Technology, 44(6),
pp.1918-1925.
Schwab, B.W. et al., 2005. Human pharmaceuticals in US surface waters: a human
health risk assessment. Regulatory Toxicology and Pharmacology, 42(3),
pp.296-312.
Schwaiger, J. et al., 2004. Toxic effects of the non-steroidal anti-inflammatory drug
diclofenac. Part I: histopathological alterations and bioaccumulation in rainbow
trout. Aquatic Toxicology, 68(2), pp.141-150.
Schwartz, T. et al., 2003. Detection of antibiotic-resistant bacteria and their
resistance genes in wastewater, surface water, and drinking water biofilms.
FEMS Microbiology Ecology, 43(3), pp.325-335.
Schwartz, T. et al., 2006. Real-time PCR detection of Pseudomonas aeruginosa in
clinical and municipal wastewater and genotyping of the ciprofloxacin-resistant
isolates. FEMS Microbiology Ecology, 57(1), pp.158-167.
Schweizer, H.P., 2001. Triclosan: a widely used biocide and its link to antibiotics.
Microbiology Letters, 202, pp.1-7.
Scully, F. & Hoigné, J., 1987. Rate constants for reactions of singlet oxygen with
phenols and other compounds in water. Chemosphere, 16(4), pp.681-694.
Sebastine, I.M. & Wakeman, R.J., 2003. Consumption and environmental hazards of
pharmaceutical substances in the UK. Trans IChemE, 81, pp.229-235.
Seehusen, D.A. & Edwards, J., 2006. Patient practices and beliefs concerning
disposal of medications. Journal of the American Board of Family Medicine,
19(6), pp.542-547.

199
Sharpless, C.M., Seibold, D.A. & Linden, K.G., 2003. Nitrate photosensitized
degradation of atrazine during UV water treatment. Aquatic Sciences, 65(4),
pp.359-366.
Sim, W.-J. et al., 2011. Occurrence and distribution of pharmaceuticals in
wastewater from households, livestock farms, hospitals and pharmaceutical
manufactures. Chemosphere, 82(2), pp.179-186.
Sirtori, C. et al., 2010. Effect of water-matrix composition on trimethoprim solar
photodegradation kinetics and pathways. Water Research, 44(9), pp.2735-2744.
Sirtori, C. et al., 2009. Decontamination industrial pharmaceutical wastewater by
combining solar photo-Fenton and biological treatment. Water Research, 43(3),
pp.661-668.
Snyder, S.A. et al., 2003. Pharmaceuticals, personal care products, and endocrine
disruptors in water: implications for the water industry. Environmental
Engineering Science, 20(5), pp.449-469.
Son, H.-S. et al., 2007. Effects of ultraviolet intensity and wavelength on the
photolysis of triclosan. Water Science and Technology, 55(1-2), pp.209-216.
Staples, C. et al., 1997. The environmental fate of phthalate esters: a literature
review. Chemosphere, 35(4), pp.667-749.
Stasinakis, A.S. et al., 2007. Investigation of triclosan fate and toxicity in
continuous-flow activated sludge systems. Chemosphere, 68(2), pp.375-381.
Steinemann, A., 2009. Fragranced consumer products and undisclosed ingredients.
Environmental Impact Assessment Review, 29(1), pp.32-38.
Stuer-Lauridsen, F. et al., 2000. Environmental risk assessment of human
pharmaceuticals in Denmark after normal therapeutic use. Chemosphere, 40(7),
pp.783-793.
Swan, G.E. et al., 2006. Toxicity of diclofenac to Gyps vultures. Biology Letters,
2(2), pp.279-282.
Swan, S.H. et al., 2008. Epidemiological studies of reproductive effects in humans.
In S. E. Jorgensen & B. Fath, eds. Encyclopaedia of Ecology. Oxford:
Academic Press, pp. 1383-1388.
Sweetman, S.C., 2011. Martindale: The complete drug reference. 37th ed.,
Pharmaceutical Press.
Tabak, M. et al., 2007. Effect of triclosan on Salmonella typhimurium at different
growth stages and in biofilms. FEMS Microbiology Letters, 267, pp.200-206.
200
Taylor, D., 2009. Sustainable development and production of human
pharmaceuticals. In A healthy future-pharmaceuticals in a sustainable society.
Apoteket AB, MistraPharma & Stockholm County Council, pp. 58-73.
Tekin, H. et al., 2006. Use of Fenton oxidation to improve the biodegradability of a
pharmaceutical wastewater. Journal of Hazardous Materials, 136(2), pp.258-
265.
Ternes, T.A., 2001. Analytical methods for the determination of pharmaceuticals in
aqueous environmental samples. Trends in Analytical Chemistry, 20(8), pp.419-
434.
Ternes, T.A., 1998. Occurrence of drugs in German sewage treatment plants and
rivers. Water Research, 32(11), pp.3245-3260.
Ternes, T.A., 2000. Pharmaceuticals and metabolites as contaminants of the aquatic
environment: an overview. Abstracts of Papers [American Chemical Society],
219, pp.317-318.
Ternes, T.A., Bonerz, M. & Schmidt, T., 2001. Determination of neutral
pharmaceuticals in wastewater and rivers by liquid chromatography-
electrospray tandem mass spectrometry. Journal of Chromatography A, 938(1-
2), pp.175-185.
Ternes, T.A., Herrmann, N., et al., 2004. A rapid method to measure the solid-water
distribution coefficient (K-d) for pharmaceuticals and musk fragrances in
sewage sludge. Water Research, 38(19), pp.4075-4084.
Ternes, T.A., Joss, A. & Siegrist, H., 2004. Scrutinizing pharmaceuticals and
personal care products in wastewater treatment. Environmental Science and
Technology, pp.393-399.
Ternes, T.A. et al., 2003. Ozonation: a tool for removal of pharmaceuticals, contrast
media and musk fragrances from wastewater? Water Research, 37(8), pp.1976-
1982.
The Wildlife Trust Devon, 2004. A Profile of the River Dart Catchment 2004. The
Wildlife Trust Devon, pp.1-88.
Thiele-Bruhn, S., 2003. Pharmaceutical antibiotic compounds in soils - a review.
Journal of Plant Nutrition and Soil Science, 166(2), pp.145-167.
Thomas, K.V. et al., 2007. Source to sink tracking of selected human
pharmaceuticals from two Oslo city hospitals and a wastewater treatment
works. Journal of Environmental Monitoring, 9(12), pp.1410-1418.
Tixier, C. et al., 2002. Phototransformation of triclosan in surface waters: A relevant
elimination process for this widely used biocide – laboratory studies, field
measurements and modeling. Environmental Science and Technology, 36,
pp.3482-3489.

201
Togola, A. & Budzinski, H., 2008. Multi-residue analysis of pharmaceutical
compounds in aqueous samples. Journal of Chromatography A, 1177(1),
pp.150-158.
Topp, E., Hendel, J.G., et al., 2008. Fate of the nonsteroidal anti-inflammatory drug
naproxen in agricultural soil receiving liquid municipal biosolids.
Environmental Toxicology and Chemistry, 27(10), pp.2005-2010.
Topp, E., Monteiro, S.C., et al., 2008. Runoff of pharmaceuticals and personal care
products following application of biosolids to an agricultural field. Science of
the Total Environment, 396(1), pp.52-59.
Trovó, A.G., Melo, S.A.S. & Nogueira, R.F.P., 2008. Photodegradation of the
pharmaceuticals amoxicillin, bezafibrate and paracetamol by the photo-Fenton
process - application to sewage treatment plant effluent. Journal of
Photochemistry and Photobiology A: Chemistry, 198(2-3), pp.215-220.
Tsumura, Y. et al., 2010. Di (2-ethylhexyl) phthalate contamination of retail packed
lunches caused by PVC gloves used in the preparation of foods. Food Additives
and Contaminants, 18(6), pp.569-579.
Tucker, J.L., 2006. Green chemistry, a pharmaceutical perspective. Organic Process
Research & Development, 10, pp.315-319.
Vance-Bryan, K., Guay, D.R. & Rotschafer, J.C., 1990. Clinical pharmacokinetics of
ciprofloxacin. Clinical Pharmacokinetics, 19(6), pp.434-461.
Vane, J.R. & Botting, R.M., 1998. Anti-inflammatory drugs and their mechanism of
action. Inflammation Research, 47(2), p.S78-S87.
Varga, M. et al., 2010. Investigation of acidic pharmaceuticals in river water and
sediment by microwave-assisted extraction and gas chromatography-mass
spectrometry. Microchemical Journal, 95(2), pp.353-358.
Vasskog, T. et al., 2008. Occurrence of selective serotonin reuptake inhibitors in
sewage and receiving waters at Spitsbergen and in Norway. Journal of
Chromatography A, 1185(2), pp.194-205.
Vasskog, T. et al., 2006. Selective serotonin reuptake inhibitors in sewage influents
and effluents from Tromsø, Norway. Journal of Chromatography A, 1115(1-2),
pp.187-195.
Velagaleti, R. et al., 2002. Impact of current good manufacturing practices and
emission regulations and guidances on the discharge of pharmaceutical
chemicals into the environment from manufacturing, use, and disposal.
Environmental Health Perspectives, 110(3), pp.213-220.
Verispan, 2007. Top 200 generic drugs by unit in 2007.
http://www.drugtopics.modernmedicine.com/drugtopics/Top200Drugs.

202
Verlicchi, P. et al., 2010. Hospital effluents as a source of emerging pollutants: an
overview of micropollutants and sustainable treatment options. Journal of
Hydrology, 389(3-4), pp.416-428.
Verstraeten, I.M. et al., 2005. Use of tracers and isotopes to evaluate vulnerability of
water in domestic wells to septic waste. Ground Water Monitoring and
Remediation, 25(2), pp.107-117.
Vieno, N.M., Tuhkanen, T. & Kronberg, L., 2005. Seasonal variation in the
occurrence of pharmaceuticals in effluents from a sewage treatment plant and in
the recipient water. Environmental Science and Technology, 39(21), pp.8220-
8226.
Vione, D. et al., 2009. Phototransformation of selected human-used macrolides in
surface water: kinetics, model predictions and degradation pathways. Water
Research, 43(7), pp.1959-1967.
Visvanathan, C. et al., 2007. Landfill leachate treatment using thermophilic
membrane bioreactor. Desalination, 204(1-3), pp.8-16.
Vogel, G.W., Minter, K. & Woolwine, B., 1986. Effects of chronically administered
antidepressant drugs on animal behavior. Physiology and Behavior, 36(4),
pp.659-666.
Volger, B.K. & Ernst, E., 1999. Aloe Vera: a systematic review of its clinical
effectiveness. The British Journal of General Practice, 49(447), pp.823-828.
Vos, J.G. et al., 2000. Health effects of endocrine-disrupting chemicals on wildlife,
with special reference to the European situation. Critical Reviews in Toxicology,
30(1), pp.71-133.
WHO, 2001. ATC/DDD Index. WHO collaborating centre for drug statistics
methodology. Available from http://www.whocc.no/atc_ddd_index.
WHO, 2004. The world medicines situation. , pp.1-145.
Waterman, K.C. et al., 2002. Hydrolysis in pharmaceutical formulations.
Pharmaceutical Development and Technology, 7(2), pp.113-146.
Watts, C. et al., 2007. Desk based review of current knowledge on pharmaceuticals
in drinking water and estimation of potential levels. Drinking Water
Inspectorate, pp.1-107.
Webb, S. et al., 2003. Indirect human exposure to pharmaceuticals via drinking
water. Toxicology Letters, 142(3), pp.157-167.
Weber, M.M. & Emrich, H.M., 1988. Current and historical concepts of opiate
treatment in psychiatric disorders. International Clinical Psychopharmacology,
3(3), pp.255-266.

203
Weigel, S. et al., 2004. Determination of selected pharmaceuticals and caffeine in
sewage and seawater from Tromsø/Norway with emphasis on ibuprofen and its
metabolites. Chemosphere, 56(6), pp.583-592.
Werner, J.J., McNeill, K. & Arnold, W.A., 2005. Environmental photodegradation of
mefenamic acid. Chemosphere, 58(10), pp.1339-1346.
Wilson, B. et al., 2009. The partitioning of triclosan between aqueous and particulate
bound phases in the Hudson River Estuary. Marine Pollution Bulletin, 59(4-7),
pp.207-212.
Wilson, B. et al., 2008. Short-term dynamics and retention of triclosan in the lower
Hudson Estuary. Baseline/Marine Pollution Bulletin, 56, pp.1215-1233.
Winter, M.J. et al., 2008. Defining the chronic impacts of atenolol on embryo-larval
development and reproduction in the fathead minnow (Pimephales promelas).
Aquatic Toxicology, 86(3), pp.361-369.
Wise, R., 2002. Antimicrobial resistance: priorities for action. Journal of
Antimicrobial Chemotherapy, 49, pp.585-586.
Wishart, D.J., 2007. Encyclopaedia of the Great Plains Indians, University of
Nebraska Press.
Wollenberger, L., Halling-Sørensen, B. & Kusk, K.O., 2000. Acute and chronic
toxicity of veterinary antibiotics to Daphnia magna. Chemosphere, 40(7),
pp.723-730.
Wong-Wah-Chung, P. et al., 2007. Photochemical behaviour of triclosan in aqueous
solutions: kinetic and analytical studies. Journal of Photochemistry and
Photobiology A: Chemistry, 191(2-3), pp.201-208.
Xie, Z. et al., 2008. Occurrence and distribution of triclosan in the German Bight
(North Sea). Environmental Pollution, 156(3), pp.1190-1195.
Yamamoto, H. et al., 2009. Persistence and partitioning of eight selected
pharmaceuticals in the aquatic environment: laboratory photolysis,
biodegradation, and sorption experiments. Water Research, 43(2), pp.351-362.
Yang, S.-Z., 1998. The Devine Farmer’s Materia Medica - A Translation of Shen
Nong Ben Cao Jing 1st ed., Blue Poppy Press.
Yoon, Y. et al., 2010. Occurrence of endocrine disrupting compounds,
pharmaceuticals, and personal care products in the Han River (Seoul, South
Korea). Science of the Total Environment, 408(3), pp.636-643.
Yu, J., Bouwer, E. & Coelhan, M., 2006. Occurrence and biodegradability studies of
selected pharmaceuticals and personal care products in sewage effluent.
Agricultural Water Management, 86(1-2), pp.72-80.

204
Yu, J.C., Kwong, T.Y., et al., 2006. Photocatalytic oxidation of triclosan.
Chemosphere, 65(3), pp.390-399.
Zepp, R.G., 1978. Quantum yields for reaction of pollutants in dilute aqueous
solution. Environmental Science and Technology, 12(3), pp.327-329.
Zepp, R.G. & Cline, D.M., 1977. Rates of direct photolysis in aquatic environment.
Environmental Science and Technology, 11(4), pp.359-366.
Zepp, R.G., Baughman, G.L. & Schlotzhauer, P.F., 1981. Comparison of
photochemical behaviour of various humic substances in water: sunlight
induced reactions of aquatic pollutants photosensitized by humic substances.
Chemosphere, 10, pp.109-117.
Zepp, R.G., Schlotzhauer, P.F. & Sink, R.M., 1985. Photosensitized transformations
involving electronic energy transfer in natural waters: role of humic substances.
Environmental Science and Technology, 19(1), pp.74-81.
Zhan, M. et al., 2006. Photosensitized degradation of bisphenol A involving reactive
oxygen species in the presence of humic substances. Chemosphere, 63(3),
pp.378-386.
Zhang, S. et al., 2007. Simultaneous quantification of polycyclic aromatic
hydrocarbons (PAHs), polychlorinated biphenyls (PCBs), and pharmaceuticals
and personal care products (PPCPs) in Mississippi river water, in New Orleans,
Louisiana, USA. Chemosphere, 66(6), pp.1057-1069.
Zhang, X.-X., Zhang, T. & Fang, H.H.P., 2009. Antibiotic resistance genes in water
environment. Applied Microbiology and Biotechnology, 82(3), pp.397-414.
Zhao, J.-L. et al., 2010. Occurrence and risks of triclosan and triclocarban in the
Pearl River system, South China: from source to the receiving environment.
Journal of Hazardous Materials, 179(1-3), pp.215-222.
Zuccato, E. et al., 2000. Presence of therapeutic drugs in the environment. Lancet,
355, pp.1789-1790.
Zuccato, E., Castiglioni, S. & Fanelli, R., 2005. Identification of the pharmaceuticals
for human use contaminating the Italian aquatic environment. Journal of
Hazardous Materials, 122(3), pp.205-209.
Zühlke, S., Dunnbier, U. & Heberer, T., 2004. Detection and identification of
phenazone-type drugs and their microbial metabolites in ground and drinking
water applying solid-phase extraction and gas chromatography with mass
spectrometric detection. Journal of Chromatography A, 1050(2), pp.201-209.

205
APPENDICES
APPENDIX A: DATA FOR CHAPTER FIVE
Appendix A1: Example of MAR sheet

206
APPENDIX B: DATA FOR CHAPTER SEVEN
Appendix B1: River Dart annual mean flow rates and daily flow rate for 10th
August 2009. Data recorded from Austins Bridge, Buckfastleigh.
Annual mean flow rates
Year Flow (cm/s) Year Flow (cm/s) Year Flow (cm/s) Year Flow (cm/s)
1958 8.95 1971 9.93 1984 11.9 1997 12.8
1959 14.2 1972 9.45 1985 10.4 1998 13.5
1960 14 1973 13.6 1986 11.4 1999 12.2
1961 10.5 1974 10 1987 12.6 2000 16.1
1962 10.7 1975 4.88 1988 8.06 2001 13.1
1963 10.3 1976 13.1 1989 11.2 2002 10.4
1964 10.3 1977 11.8 1990 10.4 2003 9.72
1965 14.2 1978 10.3 1991 7.53 2004 9.11
1966 11.5 1979 10.7 1992 12.3 2005 10.4
1967 12.5 1980 12.5 1993 14.8 2006 16.1
1968 11.1 1981 10.5 1994 13 2007 13.9
1969 11.4 1982 12.3 1995 9.34 2008 11.5
1970 8.54 1983 9.5 1996 9.43 2008 11.5
Table: Daily flow rates 10/08/2009
Time Flow
(cm/s) Time
Flow
(cm/s) Time
Flow
(cm/s) Time
Flow
(cm/s)
00:00:00 8.46 06:00:00 8.49 12:00:00 8.56 18:00:00 9.06
00:15:00 8.49 06:15:00 8.53 12:15:00 8.6 18:15:00 9.1
00:30:00 8.42 06:30:00 8.49 12:30:00 8.63 18:30:00 9.1
00:45:00 8.46 06:45:00 8.56 12:45:00 8.63 18:45:00 9.17
01:00:00 8.46 07:00:00 8.53 13:00:00 8.67 19:00:00 9.17
01:15:00 8.42 07:15:00 8.49 13:15:00 8.7 19:15:00 9.17
01:30:00 8.49 07:30:00 8.63 13:30:00 8.7 19:30:00 9.25
01:45:00 8.42 07:45:00 9.74 13:45:00 8.7 19:45:00 9.25
02:00:00 8.42 08:00:00 9.28 14:00:00 8.74 20:00:00 9.36
02:15:00 8.39 08:15:00 8.77 14:15:00 8.74 20:15:00 9.4
02:30:00 8.39 08:30:00 8.6 14:30:00 8.7 20:30:00 9.4

207
02:45:00 8.42 08:45:00 8.56 14:45:00 8.77 20:45:00 9.4
03:00:00 8.39 09:00:00 8.49 15:00:00 8.77 21:00:00 9.43
03:15:00 8.42 09:15:00 8.49 15:15:00 8.81 21:15:00 9.43
03:30:00 8.42 09:30:00 8.56 15:30:00 8.81 21:30:00 9.43
03:45:00 8.42 09:45:00 8.56 15:45:00 8.85 21:45:00 9.43
04:00:00 8.42 10:00:00 8.56 16:00:00 8.88 22:00:00 9.43
04:15:00 8.42 10:15:00 8.56 16:15:00 7.88 22:15:00 9.43
04:30:00 8.42 10:30:00 8.49 16:30:00 8.22 22:30:00 9.4
04:45:00 8.46 10:45:00 8.56 16:45:00 8.67 22:45:00 9.43
05:00:00 8.49 11:00:00 8.56 17:00:00 8.85 23:00:00 9.36
05:15:00 8.49 11:15:00 8.56 17:15:00 8.92 23:15:00 9.4
05:30:00 8.46 11:30:00 8.56 17:30:00 8.95 23:30:00 9.4
05:45:00 8.49 11:45:00 8.6 17:45:00 9.03 23:45:00 9.32

208
Appendix B2: Solar irradiance of Heraeus Suntest CPS Photosimulator
measured before and after each experiment with a Spectrad Spectroradiometer
Spectral irradiance measured prior to Stoke Gabriel degradation experiment on 6th
August 2009
Spectral irradiance measured after Stoke Gabriel degradation experiment on 10th
August 2009
0.00E+00
5.00E-02
1.00E-01
1.50E-01
2.00E-01
2.50E-01
3.00E-01
200 250 300 350 400 450 500 550 600 650 700 750 800
Irra
die
nce
(m
E/c
m2/d
ay/(
24
hr)
)
Wavelength (nm)
0.00E+00
5.00E-02
1.00E-01
1.50E-01
2.00E-01
2.50E-01
3.00E-01
3.50E-01
200 250 300 350 400 450 500 550 600 650 700 750 800
Irra
die
nc
e (
mE
/cm
2/d
ay/(
24h
r))
Wavelength (nm)

209
Appendix B3: Reaction vessel for the degradation experiments

210
Appendix B4: Experimental set-up for the degradation studies

211
Appendix B5: Wavelength screening for HPLC method development
Peak areas of five studied compounds at studied wavelengths (values in bold
indicate selected wavelength for degradation experiments)
Wavelength Paracetamol Ibuprofen Mefenamic acid Propranolol Salbutamol
213 2012.295 2310.446 4374.990 8292.562 1598.167
214 1823.064 2319.762 4187.782 8290.486 1628.474
222 2059.081 2302.294 3556.595 7030.967 1912.136
227 2624.651 1571.523 1940.686 6334.841 1838.814
248 4105.101 49.080 435.747 184.407 49.046
279 761.983 7.270 2056.556 1007.836 312.179
286 589.411 7.596 631.425 1137.229 246.885
291 449.337 0.547 1615.213 1187.478 64.513
343 3.082 0.009 1528.559 0.750 12.220

212
HPLC method development overview for the studied wavelengths

213
HPLC measurement parameters for the studied wavelengths

214
HPLC gradient method for the studied wavelengths

215
Chromatographs detailing peak areas of the studied compounds at selected light
wavelengths

216

217

218
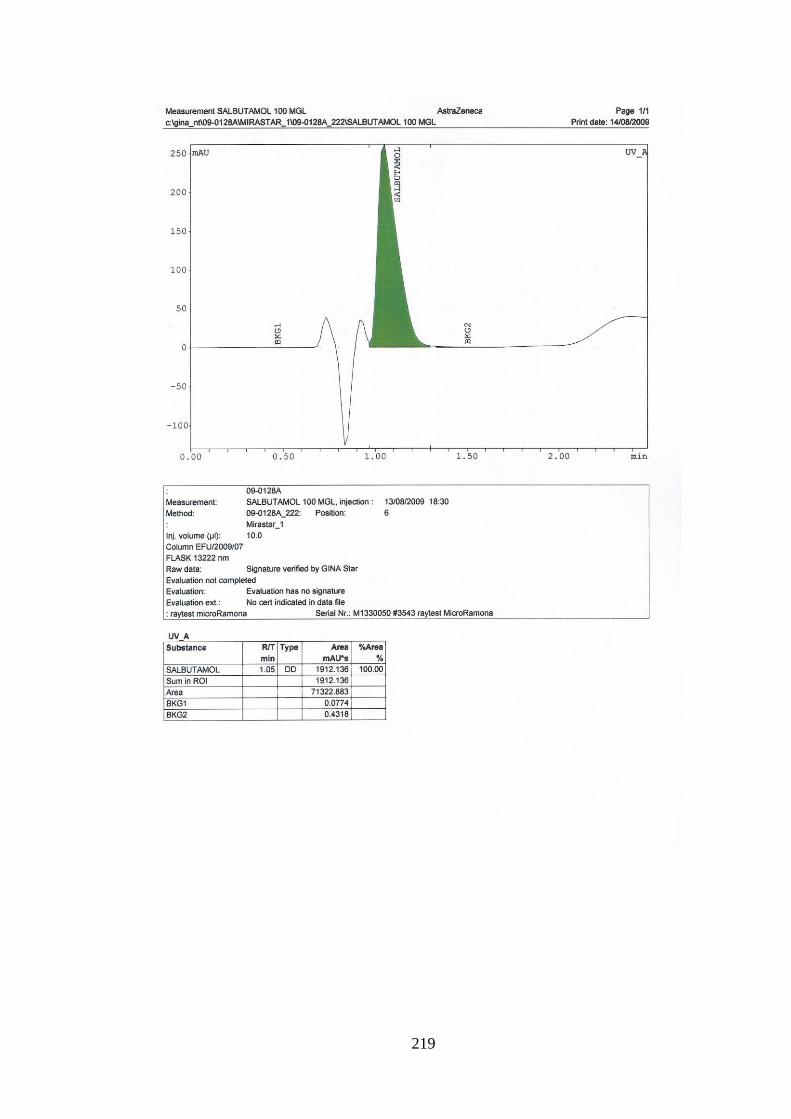
219

220
Appendix B6: Chemical analysis methodology
HPLC method overview for detection of ibuprofen, mefenamic acid, propranolol and
salbutamol at 222 nm

221
HPLC measurement parameters for detection of ibuprofen, mefenamic acid,
propranolol and salbutamol at 222 nm

222
HPLC gradient method for detection of ibuprofen, mefenamic acid, propranolol and
salbutamol at 222 nm
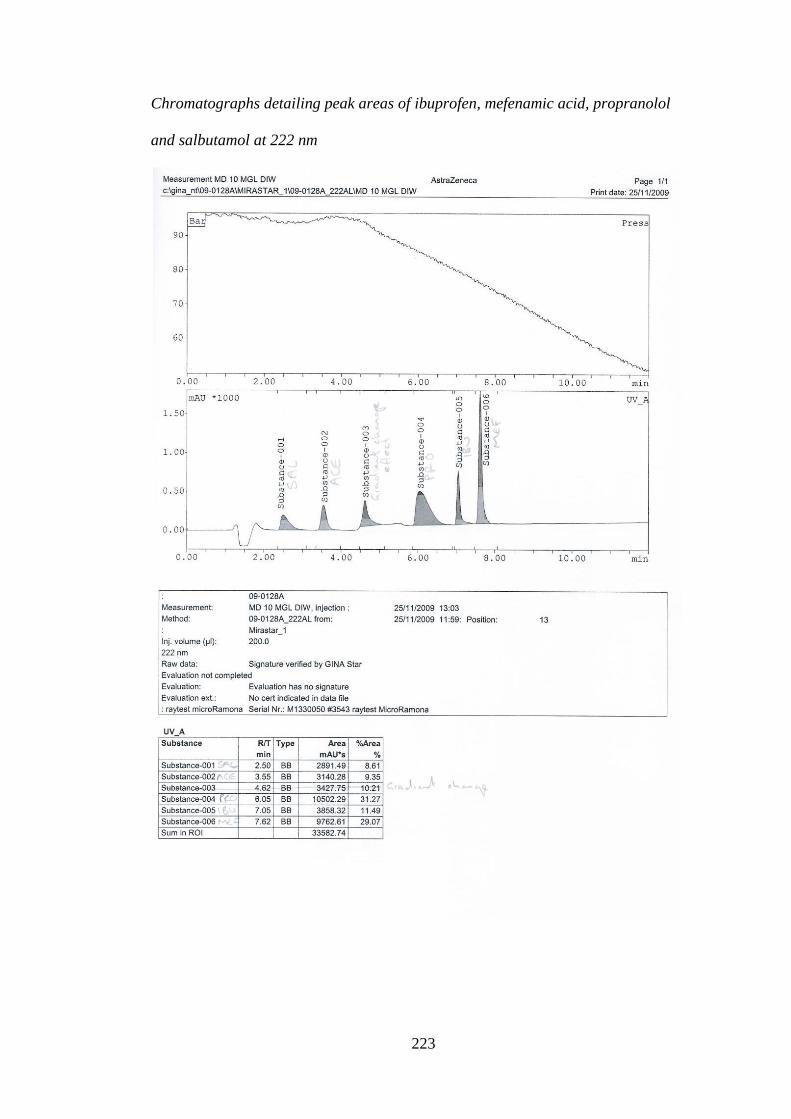
223
Chromatographs detailing peak areas of ibuprofen, mefenamic acid, propranolol
and salbutamol at 222 nm

224
HPLC method overview for detection of paracetamol at 248 nm

225
HPLC measurement parameters for detection of paracetamol at 248 nm

226
HPLC gradient method for detection of paracetamol at 248 nm

227
Chromatographs detailing peak areas of paracetamol at 248 nm

228
Appendix B7: Calibration curves and peak areas for all degradation
experiments
Calibration for degradation experiment 1: Direct photolysis of mixture and
individual compounds
Concentration (µg L-1) Paracetamol Ibuprofen Mefenamic acid Propranolol Salbutamol
1000 787.957 471.092 1464.240 1218.767 299.652
500 307.155 192.993 544.420 507.749 121.123
100 62.598 42.272 118.862 106.156 19.980
50 38.385 24.256 79.944 60.206 10.452
10 7.005 5.121 16.252 11.908
5 2.602 2.590 5.180 4.646
1 0.333 1.389 1.747
y = 0.7652x - 9.8286R² = 0.9888
y = 0.4584x - 3.4298R² = 0.9923
y = 1.4105x - 17.027R² = 0.9844
y = 1.1948x - 13.318R² = 0.9933
y = 0.3035x - 12.4R² = 0.9913
0
200
400
600
800
1000
1200
1400
1600
0 200 400 600 800 1000
Pe
ak a
rea
Concentration (µg/l)
Acetaminophen
Ibuprofen
Mefenamic acid
Propranolol
Salbutamol

229
Calibration for degradation experiment 2: Totnes high tide
Concentration (µg L-1) Paracetamol Ibuprofen Mefenamic acid Propranolol Salbutamol
1000 735.406 451.315 1464.127 1366.689 335.200
500 289.466 192.927 596.177 548.733 123.326
100 53.397 39.299 122.343 114.850 20.997
50 31.819 23.747 76.252 73.547 10.794
10 6.651 4.226 14.599 16.997 0.654
5 0.829 2.026 5.195 7.626 1
0.618 0.542
y = 0.7207x - 13.744R² = 0.9893
y = 0.4434x - 4.1063R² = 0.9948
y = 1.427x - 14.013R² = 0.992
y = 1.3274x - 11.793R² = 0.9908
y = 0.3324x - 12.168R² = 0.9838
0
200
400
600
800
1000
1200
1400
1600
0 200 400 600 800 1000
Pe
ak a
rea
Concentration (µg/l)
Acetaminophen
Ibuprofen
Mefenamic acid
Propranolol
Salbutamol

230
Calibration for degradation experiment 2: Totnes low tide
Concentration (µg L-1) Paracetamol Ibuprofen Mefenamic acid Propranolol Salbutamol
1000 723.089 501.595 1458.116 1383.358 343.011
500 280.140 191.484 593.365 558.034 118.783
100 51.801 36.333 119.344 112.495 19.837
50 29.350 25.617 76.055 68.240 10.836
10 3.889 6.263 14.614 13.136
5 0.899 1.769 5.584 6.781
1
0.061 0.546
y = 0.709x - 15.216R² = 0.9883
y = 0.4857x - 6.5865R² = 0.9868
y = 1.4213x - 14.324R² = 0.9919
y = 1.3525x - 18.308R² = 0.9909
y = 0.3468x - 19.932R² = 0.9767
0
200
400
600
800
1000
1200
1400
1600
0 200 400 600 800 1000
Pe
ak a
rea
Concentration (µg/l)
Acetaminophen
Ibuprofen
Mefanimic acid
Propranolol
Salbutamol

231
Calibration for degradation experiment 3: Stoke Gabriel high tide
Concentration (µg L-1) Paracetamol Ibuprofen Mefenamic acid Propranolol Salbutamol
1000 554.509 364.565 932.069 817.494 302.375
500 258.317 186.064 487.634 441.546 117.736
100 44.509 38.749 89.816 70.760 20.874
50 22.721 109.302 47.962 31.670 10.764
10 3.461 2.706 9.991 2.363
5 1.185 1.888 4.466 1.014
1 0.157 0.190 0.862
y = 0.5527x - 5.133R² = 0.9989
y = 0.3459x + 18.182R² = 0.9393
y = 0.9387x + 1.2647R² = 0.9995
y = 0.8346x - 4.141R² = 0.9981
y = 0.3051x - 12.911R² = 0.9879
0
100
200
300
400
500
600
700
800
900
1000
0 200 400 600 800 1000
Pe
ak a
rea
Concentration (µg/l)
Acetaminophen
Ibuprofen
Mefenamic acid
Propranolol
Salbutamol

232
Calibration for degradation experiment 3: Stoke Gabriel low tide
Concentration (µg L-1) Paracetamol Ibuprofen Mefenamic acid Propranolol Salbutamol
1000 561.578 432.022 1284.649 873.274 245.652
500 313.980 189.495 574.402 360.254 105.141
100 53.188 40.221 115.235 52.342 3.998
50 23.081 19.507 57.079 18.766 3.565
10 3.227 3.763 11.676 1.843
5 1.402 1.731 5.807 1.270
1 0.067
0.651
y = 0.5743x - 0.0416R² = 0.9967
y = 0.4262x - 3.8252R² = 0.9965
y = 1.2684x - 9.0963R² = 0.9975
y = 0.8702x - 23.532R² = 0.9932
y = 0.2595x - 17.442R² = 0.9962
0
200
400
600
800
1000
1200
1400
0 200 400 600 800 1000
Pe
ak a
rea
Concentration (µg/l)
Acetaminophen
Ibuprofen
Mefenamic acid
Propranolol
Salbutamol

233
Calibration for degradation experiment 4: Dartmouth high tide
Concentration (µg L-1) Paracetamol Ibuprofen Mefenamic acid Propranolol
1000 2277.435 2293.802 8031.304 7848.884
500 405.517 452.939 1890.905 1469.277
100 195.874 180.085 1001.168 660.216
50 37.748 32.198 234.261 120.537
10 18.134 12.755 132.813 50.186
5 3.138
54.848
1 1.352
20.544
y = 2.0809x - 75.378R² = 0.9022
y = 2.1833x - 130.51R² = 0.9083
y = 7.3721x - 130.88R² = 0.9284
y = 7.4304x - 437.07R² = 0.9006
0
1000
2000
3000
4000
5000
6000
7000
8000
9000
0 200 400 600 800 1000
Pe
ak a
rea
Concentration (µg/l)
Acetaminophen
Ibuprofen
Mefenamic acid
Propranolol

234
Calibration for degradation experiment 4: Dartmouth low tide
Concentration (µg L-1) Paracetamol Ibuprofen Mefenamic acid Propranolol
1000 2321.331 2535.042 8059.436 7719.133
500 424.899 482.148 1877.411 1575.278
100 225.848 224.181 1076.649 733.978
50 43.176 33.430 389.290 121.770
10 19.309 13.740 289.730 51.120
5 3.436
193.013
1 1.636
y = 2.119x - 70.088R² = 0.9039
y = 2.4014x - 139.56R² = 0.9022
y = 7.2833x - 40.187R² = 0.9159
y = 7.3086x - 386.21R² = 0.909
0
1000
2000
3000
4000
5000
6000
7000
8000
9000
0 200 400 600 800 1000
Pe
ak a
rea
Concentration (µg/l)
Acetaminophen
Ibuprofen
Mefenamic acid
Propranolol

235
Appendix B8: Concentration data (calculated from calibration curve equation),
r2 values, kinetics and half lives (calculated from exponential regressions) for all
degradation experiments
Degradation experiment 1: Direct photolysis of mixtures and individual compounds:
non-sterilised experiments under light and dark conditions
Matrix Drug 0h 6h 24h 48h 72h 96h 120h 144h 168h r2 k t1/2
M1a PAR 91.58 95.22 93.51 93.98 92.78 95.95 93.49 92.69 93.43
M1b PAR 93.64 70.21
92.67
M2a PAR 93.24
92.70 88.71 92.19 92.34 89.44 88.51 86.73
M2b PAR 94.30
66.63
S1a PAR 91.65 90.61 90.19 83.58 89.83 87.90 86.96
S1b PAR 63.26 67.43 89.91 90.42
M(DC) PAR 91.68
95.09 94.49 94.61 94.43 95.34 94.60 94.57
S(DC) PAR
91.48 90.37 91.47 91.46 92.92 92.22 92.53
M1a IBU 91.88 90.74 91.06 88.75
69.68 77.37 75.19 71.55 0.838 0.0016 433
M1b IBU 91.42 91.23 89.67 88.87 85.49
0.866 0.0010 693
M2a IBU 93.18 91.91 91.97 84.54 84.53 74.16 74.40 71.39 69.38 0.962 0.0019 365
M2b IBU 92.60 93.02 90.81 86.19 83.51
0.846 0.0014 495
S1a IBU 85.06 86.33 88.37 77.66 77.98 77.86 76.30 73.01 69.43 0.827 0.0011 630
S1b IBU
61.97
65.22
0.924 0.0015 462
M(DC) IBU 131.15 132.08 130.69 133.39 132.95 132.51 133.64 133.03 119.08 0.193 0.00026 2666
S(DC) IBU 128.29 132.59 131.25 132.83 131.99 134.43 133.52 132.29 118.16 0.143 0.00025 2773
M1a MEF 96.27 92.91 86.89 51.97
63.98 61.57 55.14 49.98 0.76 0.0036 193
M1b MEF 95.59 91.49 86.60 80.53 74.31
0.99 0.0033 210
M2a MEF 95.84 92.24 85.34 74.72 68.05 55.23 51.13 42.24 36.27 0.99 0.0056 124
M2b MEF 96.20 92.43 85.17 76.29 67.63
0.99 0.0046 151
S1a MEF 96.93 96.21 91.94 84.44 82.86 75.84 72.66 69.32 65.32 0.99 0.0023 301
S1b MEF 97.07 91.40
65.20
0.99 0.0026 267
M(DC) MEF 96.01
95.42 93.89 91.35 94.69 92.76 87.23 92.28 0.48 0.00036 1925
S(DC) MEF 97.07
95.28 97.86 98.26 96.93 96.86 94.41 95.46 0.19 0.00010 6931
M1a PRO 103.77 68.18 37.39 28.15
0.90 0.025 28
M1b PRO 100.83 68.08 44.49 30.26 19.50
0.96 0.020 35
M2a PRO 100.04 64.33 41.89 26.50 17.77
0.96 0.022 32
M2b PRO 97.82 65.36 41.44 27.88 17.47
0.96 0.021 33
S1a PRO 97.20 71.20 39.57 22.93 14.44
0.98 0.026 27
S1b PRO 97.34
0.64 0.044 16
M(DC) PRO 99.96
79.72 96.01 98.62 98.81 100.67 91.12 101.19 0.11 0.0005 1540
S(DC) PRO 103.39
103.80 112.00 113.41 105.02 114.44 115.29 115.59 0.59 0.0006 1083
M1a SAL 108.14 114.12 99.34 97.63
96.86 87.96 82.38 77.58 0.93 0.0019 365
M1b SAL 108.49 104.91 94.94 96.22 97.48
0.49 0.0012 578
M2a SAL 115.43 108.51
92.69 91.46 91.75 89.26
76.34 0.92 0.0022 315
M2b SAL 108.19 108.77 104.84
102.36
0.89 0.0009 770
S1a SAL 87.56 93.93 93.64 85.11 88.29 84.86
78.02 0.47 0.0007 990
S1b SAL 90.13 113.11
M(DC) SAL 91.68
95.09 94.49 94.61 94.43 95.34 94.60 94.57 0.27 0.00011 6301
S(DC) SAL 86.12
91.48 90.37 91.47 91.46 92.92 92.22 92.53 0.58 0.000311 2229

236
Degradation experiment 2: Totnes high and low tides: sterilised and non-sterilised
experiments under light and dark conditions
Matrix Drug 0h 6h 24h 48h 72h 96h 120h 144h 168h r2 k t1/2
HTa PAR 97.36 78.62 62.15 34.95
19.37 0.88 0.0089 78
HTb PAR 92.91 68.53
46.90
36.24 32.24 27.42 0.89 0.0063 110
HTa(S) PAR 88.11 70.10 57.43 42.73 31.69 26.32 23.84 21.45 19.78 0.94 0.0084 83
HTb(S) PAR 89.80 70.63 55.22 36.61 28.65 24.17 22.04 19.74 19.51 0.91 0.0087 80
LTa PAR 93.72 73.61
69.40
67.81
0.39 0.0019 365
LTb PAR 95.09 67.17 52.50 48.09
26.01 23.90 0.91 0.0070 99
LTa(S) PAR 90.53 81.73 68.27
69.17 62.57
0.37 0.0017 408
LTb(S) PAR 89.54 71.66
51.04 44.48
0.90 0.0038 182
HTa(DC) PAR 95.13
90.31
90.13 80.85 76.23 72.09 0.87 0.0016 433
HTb(DC) PAR
HTa(S)(DC) PAR 88.96
82.64
83.67 79.04 79.37 86.62 0.21 0.0003 2310
HTb(S)(DC) PAR
LTa(DC) PAR 94.40
88.63
75.46 77.65 77.34 73.27 0.88 0.0015 462
LTb(DC) PAR
LTa(S)(DC) PAR 90.03
86.23 84.89 91.53 88.93 0.00 0.0000 20387
LTb(S)(DC) PAR
HTa IBU 84.81 82.17 83.14 64.30 68.90 59.29 58.76 63.83 53.56 0.83 0.0025 277
HTb IBU 90.77 80.58 77.37 64.13 60.10 58.03 57.80 53.46 53.78 0.89 0.0031 224
HTa(S) IBU 88.92 74.61 80.94 65.04 61.95 60.13 58.35 56.48 53.79 0.89 0.0028 248
HTb(S) IBU 85.08 81.63
62.21 60.36 59.84 60.24 59.57 54.58 0.84 0.0026 267
LTa IBU 90.15 83.73 77.78 64.15 63.24 63.52 62.84 56.70 57.83 0.85 0.0026 267
LTb IBU 91.57 84.40 76.28 63.67 62.68 62.31 58.06
56.06 0.85 0.0027 257
LTa(S) IBU 90.39 80.35 75.14 66.83 63.43 61.85 61.42 67.97 59.06 0.59 0.0017 408
LTb(S) IBU 87.50 75.49 77.61 65.70 65.44 61.79 61.14 57.29 66.96 0.68 0.0019 365
HTa(DC) IBU 87.79
85.37
72.60 80.83 84.19 73.45 0.38 0.0008 866
HTb(DC) IBU
HTa(S)(DC) IBU 87.00
75.82
70.02 76.07 80.11 75.25 0.24 0.0006 1155
HTb(S)(DC) IBU
LTa(DC) IBU 90.86
69.52
79.17 74.32 74.90 82.08 0.09 0.0004 1733
LTb(DC) IBU
LTa(S)(DC) IBU 88.94
72.21
74.13 72.80 81.56 73.66 0.23 0.0006 1155
LTb(S)(DC) IBU
HTa MEF 90.78 75.43 67.29 37.31 35.58 28.89 21.75 15.95 10.71 0.98 0.0117 59
HTb MEF 90.87 71.63 64.17 35.92 31.11 28.74 25.69 22.43 20.71 0.92 0.0087 80
HTa(S) MEF 90.18 69.35 62.35 35.39 29.20 24.62 23.08 20.46 18.90 0.92 0.0093 75
HTb(S) MEF 94.15 71.31
34.42 29.72 25.67 23.36 20.55 17.89 0.92 0.0096 72
LTa MEF 101.05 78.56 78.63 41.17 35.96 35.59 33.15 23.14 25.40 0.91 0.0083 84
LTb MEF 105.11 77.37 67.11 38.38 33.98 30.67 27.91
22.88 0.89 0.0088 79
LTa(S) MEF 101.29 75.73 66.42 40.77 34.99 29.76 29.83 28.36 23.48 0.89 0.0078 89
LTb(S) MEF 97.71 72.55 64.22 41.74 34.38 32.21 29.09 24.44 25.35 0.91 0.0080 87
HTa(DC) MEF 90.82
85.38
63.67 78.96 78.18 69.82 0.43 0.0014 495
HTb(DC) MEF
HTa(S)(DC) MEF 92.16
61.16
53.42 61.55 76.43 68.43 0.11 0.0010 693
HTb(S)(DC) MEF
LTa(DC) MEF 103.08
55.57
75.91 68.05 73.07 70.68 0.15 0.0012 578
LTb(DC) MEF
LTa(S)(DC) MEF 99.50
63.99
63.38 60.72 79.65 71.99 0.18 0.0013 533
LTb(S)(DC) MEF
HTa PRO 77.58 58.27 34.76 19.05 12.69
0.98 0.0249 28
HTb PRO 75.48 57.98 34.37 18.57 12.97
0.98 0.0245 28
HTa(S) PRO 88.13 70.53 48.33 24.11 15.55
0.99 0.0242 29
HTb(S) PRO 87.41 70.73 53.08 29.82 20.56
0.99 0.0200 35
LTa PRO 75.80 60.75 35.41 19.29 16.49
0.95 0.0219 32
LTb PRO 75.71 60.49 36.01 19.72 16.82
0.95 0.0215 32
LTa(S) PRO 88.83 79.84 63.32 36.26 24.32
0.99 0.0183 38

237
LTb(S) PRO 89.14 80.79 63.47 37.30 24.80
0.99 0.0181 38
HTa(DC) PRO 77.58 74.28 85.12 66.70 70.53 80.84 80.47 80.79 61.18 0.07 0.0005 1386
HTb(DC) PRO 75.48 74.12 84.66 69.09 75.03 81.44 82.96 84.87 62.66 0.01 0.0002 3466
HTa(S)(DC) PRO 88.13 82.98 87.85 81.06 82.34 81.50 85.24 85.39 81.24 0.14 0.0002 3466
HTb(S)(DC) PRO 87.41 82.93 92.66 87.34 88.86 89.26 89.84 91.92 86.99 0.11 0.0002 3466
LTa(DC) PRO 75.80 79.33 89.50 70.14 79.76 84.85 85.27 87.76 65.49 0.01 0.0002 3466
LTb(DC) PRO 75.71 78.80 89.37 73.83 84.09 88.06 84.41 89.03 66.38 0.01 0.0001 6931
LTa(S)(DC) PRO 88.83 91.00 95.78 87.75 90.85 91.59 92.07 93.85 87.90 0.00 0.0000 69315
LTb(S)(DC) PRO 89.14 90.84 96.26 89.60 91.78 92.41 91.91 94.49 88.86 0.00 0.0000 69315
HTa SAL 102.09 93.25 79.45 69.35 52.30 44.20
0.98 0.0085 82
HTb SAL
76.82
63.08
0.81 0.0070 99
HTa(S) SAL
88.68
51.68
0.97 0.0066 105
HTb(S) SAL 101.82 88.54
66.10
42.74
0.99 0.0084 83
LTa SAL 122.57 98.51
98.04 87.42 62.79
0.77 0.0050 139
LTb SAL 131.99 119.11 94.06 95.79 81.61 78.70
0.81 0.0049 141
LTa(S) SAL 121.88 109.34 96.60 86.24 80.55 73.13 69.77
0.95 0.0045 154
LTb(S) SAL 126.62 105.12 96.28 87.86 82.41 74.94 74.77
0.90 0.0041 169
HTa(DC) SAL 97.87
99.17
106.97 104.33 87.29
0.04 0.0003 2310
HTb(DC) SAL
HTa(S)(DC) SAL 101.82
96.89
99.87 104.02 101.23 96.43 0.02 0.0001 6931
HTb(S)(DC) SAL
LTa(DC) SAL 127.28
114.53
98.47 117.84 127.26 114.83 0.02 0.0002 3466
LTb(DC) SAL
LTa(S)(DC) SAL 124.25
136.41
124.83 121.85
0.10 0.0003 2310
LTb(S)(DC) SAL

238
Degradation experiment 3: Stoke Gabriel high and low tides: sterilised and non-
sterilised experiments under light and dark conditions
Matrix Drug 0h 6h 24h 48h 72h 96h 120h 144h 168h r2 k t1/2
HTa PAR 104.29 94.83 65.08 48.16 38.72
16.73 13.04 11.06 0.99 0.0137 51
HTb PAR 91.45 92.95 63.08 40.32 27.60
12.65 10.95
0.99 0.0157 44
HTa(S) PAR 91.18 84.15 44.53 21.33 12.24
0.99 0.0291 24
HTb(S) PAR
87.49 45.68 20.60
1.00 0.0337 21
LTa PAR 85.28 80.91 62.02 43.95 25.90
0.98 0.0161 43
LTb PAR
83.35 57.41 36.67 13.85
0.96 0.0266 26
LTa(S) PAR
85.68 51.24 31.50 18.67
0.99 0.0231 30
LTb(S) PAR
84.75 47.07 25.15 11.77
1.00 0.0295 23
HTa(DC) PAR 104.29 102.63 92.27 92.04 92.17
81.83 96.27
0.39 0.0010 693
HTb(DC) PAR 91.45
HTa(S)(DC) PAR 91.18 104.38 101.74 91.40 97.09
91.81 98.64 91.85 0.23 0.0005 1386
HTb(S)(DC) PAR
LTa(DC) PAR 85.28 102.46 90.42 89.34 89.06
65.81 82.50 81.40 0.50 0.0015 462
LTb(DC) PAR 69.93
LTa(S)(DC) PAR
103.29 91.73 94.43 89.16
82.15 84.45 83.86 0.78 0.0013 533
LTb(S)(DC) PAR
HTa IBU 84.41 84.73
78.54 75.78 68.30
0.87 0.0012 578
HTb IBU 87.08 87.89 89.73 86.92 82.19 80.73 73.49 72.35 72.68 0.90 0.0014 495
HTa(S) IBU 96.97 97.59 91.11 87.38 82.51 72.46 63.89 59.59 65.49 0.92 0.0030 231
HTb(S) IBU 99.57 85.43 91.24 83.46 77.76 70.03 63.11 58.73 60.62 0.93 0.0030 231
LTa IBU 83.47 82.72 82.23
76.70 68.74 68.88
0.92 0.0014 495
LTb IBU 81.30 80.79 82.35
81.33 73.56 68.42 68.00
0.81 0.0013 533
LTa(S) IBU 96.09 82.81 85.91 69.86 63.02 60.35 56.16 52.47 49.72 0.94 0.0037 187
LTb(S) IBU 95.02 82.65 86.26 72.00 65.86 59.98 56.51 53.21 51.28 0.95 0.0036 193
HTa(DC) IBU 84.41 83.32 101.73 120.43 115.70 106.32 102.86 99.05 120.76 0.33 0.0013 533
HTb(DC) IBU 87.08 87.95 101.16 108.49 111.70 104.16 101.08 99.89 112.41 0.39 0.0010 693
HTa(S)(DC) IBU 96.97 86.68 102.24 121.70 114.32 110.08 109.03 107.11 120.92 0.41 0.0011 630
HTb(S)(DC) IBU 99.57 86.78 102.92 117.05 112.22 108.46 106.92 108.03 116.73 0.40 0.0010 693
LTa(DC) IBU 83.47 73.81 93.35 106.88 107.16 86.86 98.05 92.91 113.30 0.34 0.0013 533
LTb(DC) IBU 81.30 77.72 92.79 100.93 107.37 85.79 95.37 92.49 106.07 0.32 0.0011 630
LTa(S)(DC) IBU 96.09 95.44 99.44 92.07 91.81 96.07 94.91
93.05 0.16 0.0002 3466
LTb(S)(DC) IBU 95.02 95.91 99.16 96.40 93.09 96.21 96.19 97.51 94.49 0.02 0.0000 17329
HTa MEF 132.74 126.39 111.63 96.54 78.81 60.45 48.17 34.44 29.69 0.99 0.0091 76
HTb MEF 132.59 127.76 111.65 88.02 74.89 61.22 47.98 36.76 26.64 0.99 0.0092 75
HTa(S) MEF 125.30 115.07 91.49 70.94 50.86 34.13 21.13 14.44 10.91 0.99 0.0149 47
HTb(S) MEF 125.37 110.29 92.46 66.78 48.26 33.77 20.83 14.28 10.15 1.00 0.0150 46
LTa MEF 105.76 100.20 85.51 86.63 68.75 50.67 39.79 34.01 39.69 0.93 0.0070 99
LTb MEF 104.94 99.89 85.96 75.28 61.21 49.46 39.02 34.14 34.47 0.98 0.0073 95
LTa(S) MEF 100.81 88.91 78.29 56.76 45.02 37.69 28.22 23.34 18.78 1.00 0.0099 70
LTb(S) MEF 100.92 93.25 78.30 58.76 46.65 37.82 28.28 22.50 19.20 1.00 0.0101 69
HTa(DC) MEF 132.74 134.54 134.90 152.17 146.87 139.45 132.50 132.96 153.73 0.09 0.0003 2310
HTb(DC) MEF 132.59 136.10 135.00 147.14 144.33 137.50 132.07 132.31 145.27 0.02 0.0001 6931
HTa(S)(DC) MEF 125.30 127.05 126.71 145.48 138.36 131.02 130.64 128.22 143.96 0.17 0.0004 1733
HTb(S)(DC) MEF 125.37 126.52 127.16 139.78 135.49 129.35 128.94 128.03 138.64 0.16 0.0003 2310
LTa(DC) MEF 105.76 106.76 105.13 117.85 120.44 101.68 107.02 103.75 122.98 0.06 0.0003 2310
LTb(DC) MEF 104.94 105.33 105.17 113.56 117.24 101.82 106.91 103.58 116.59 0.06 0.0002 3466
LTa(S)(DC) MEF 100.81 101.21 101.88 94.57 93.35 95.69 96.03
93.17 0.61 0.0005 1386
LTb(S)(DC) MEF 100.92 101.46 101.66 96.23 94.68 95.59 97.23 99.98 94.50 0.35 0.0003 2310
HTa PRO 110.64 88.807 35.98 10.93 11.07
0.91 0.0351 20
HTb PRO 110.70 88.181 35.33 9.88 11.52
0.89 0.0351 20
HTa(S) PRO 125.75 123.73 84.88 37.72 15.65
0.98 0.0296 23
HTb(S) PRO 123.10 112.9 85.48 36.13 15.81
0.98 0.0289 24
LTa PRO 124.85 101.6 55.75 33.49 31.63
0.91 0.0199 35
LTb PRO 122.05 101.29 54.66 32.69 32.14
0.89 0.0196 35
LTa(S) PRO 142.23 131.89 109.98 57.70 43.80
0.97 0.0173 40

239
LTb(S) PRO 142.89 131.79 110.06 58.90 44.55
0.98 0.0171 41
HTa(DC) PRO 110.64 114.39 132.39 151.75 151.75 144.60 143.10 140.75 162.49 0.58 0.0016 433
HTb(DC) PRO 110.70 114.64 132.60 148.01 148.01 143.45 138.82 139.81 152.88 0.54 0.0014 495
HTa(S)(DC) PRO 125.75 130.49 138.27 151.63 151.63 146.13 143.90 142.81 159.39 0.53 0.0009 770
HTb(S)(DC) PRO 123.10 129.07 138.64 148.43 148.43 144.16 142.19 142.54 153.88 0.54 0.0009 770
LTa(DC) PRO 124.85 128.08 145.02 167.53 167.53 147.51 155.31 152.21 170.57 0.46 0.0013 533
LTb(DC) PRO 122.05 126.49 145.10 165.79 165.79 144.67 154.53 152.18 167.49 0.45 0.0013 533
LTa(S)(DC) PRO 142.23 145.36 156.08 147.57 147.57 151.07 149.55
146.82 0.03 0.0001 8664
LTb(S)(DC) PRO 142.89 152.72 155.91 149.22 149.22 151.23 149.75 151.69 148.97 0.01 0.0000 23105
HTa SAL
103.59 69.96 63.75 69.35 53.38
0.77 0.0065 107
HTb SAL
100.82 92.30 84.31 73.93 58.47
53.93
0.92 0.0045 154
HTa(S) SAL
90.88 66.62
51.24
0.85 0.0072 96
HTb(S) SAL
108.2 69.95 73.10 67.68
0.32 0.0040 173
LTa SAL
111.95 98.92
77.58
64.93 55.22
0.99 0.0049 141
LTb SAL
117.24 84.68
69.42
63.94
0.84 0.0046 151
LTa(S) SAL
99.316 74.98 76.87 65.61
65.70
0.72 0.0032 217
LTb(S) SAL
89.764 72.68 73.72 61.49
56.37
0.84 0.0030 231
HTa(DC) SAL
89.502 101.51 90.52 96.80
110.30 111.57 110.85 0.78 0.0013 533
HTb(DC) SAL
HTa(S)(DC) SAL
89.502 113.51 91.37 106.25
109.41 109.84 108.81 0.19 0.0006 1155
HTb(S)(DC) SAL
LTa(DC) SAL
114.46 109.26 111.01
116.41 111.34 113.92 0.31 0.0003 2310
LTb(DC) SAL
LTa(S)(DC) SAL
119.38 123.61 119.10 107.33
118.79 118.29 116.29 0.00 0.0000 34657
LTb(S)(DC) SAL

240
Degradation experiment 4: Dartmouth high and low tides: sterilised and non-
sterilised experiments under light and dark conditions
Matrix Drug 0h 6h 24h 48h 72h 96h 120h 144h 168h r2 k t1/2
HT1a PAR 107.19
92.23 83.07 69.60 60.80
52.04
0.98 0.0050 139
HT1b PAR 101.56
92.12 84.88 69.37 61.89
52.88
0.98 0.0046 151
HT2a PAR 102.80
86.17 79.45 65.08 57.66
50.63
0.97 0.0050 139
HT2b PAR 97.29
88.51 78.48 65.17 58.03 60.98 50.15
0.96 0.0046 151
HT1a(S) PAR 103.53 68.07 48.44 19.79 8.30 6.78
0.98 0.0298 23
HT1b(S) PAR 100.37 65.25 48.49 18.86 9.71 6.73
0.98 0.0289 24
HT2a(S) PAR 104.45 74.56 52.19 23.74 11.47 7.44
0.99 0.0279 25
HT2b(S) PAR 99.68 72.62 53.05 20.50 12.20 7.28
0.99 0.0277 25
LT1a PAR 101.72 79.49 85.14 71.61 57.55 51.49 53.65 40.95 45.08 0.91 0.0050 139
LT1b PAR 96.19 78.72 84.51 72.20 57.00 49.93 56.55 40.29 44.98 0.90 0.0049 141
LT2a PAR 102.80 80.51 73.62 51.30 35.62 24.15 19.07 11.93 10.67 0.99 0.0138 50
LT2b PAR 97.56
74.69 51.60 35.26 23.81 19.22 11.66 10.27 0.99 0.0141 49
LT1a(S) PAR 105.96 80.38 51.33 21.97 6.55
0.99 0.0370 19
LT1b(S) PAR 99.97 79.95 51.57 21.82 6.25
0.98 0.0372 19
LT2a(S) PAR 107.53 78.11 55.58 23.99 7.99
0.98 0.0344 20
LT2b(S) PAR 101.51 78.40 56.25 24.26 7.80
0.98 0.0342 20
HT1a(DC) PAR 107.19 107.83 97.62 109.00 103.33 108.37 91.01 89.61 82.33 0.58 0.0012 578
HT1b(DC) PAR 101.56
HT2a(DC) PAR 102.80
HT2b(DC) PAR 97.29
HT1a(S)(DC) PAR 103.53 100.85 104.44 110.53 107.13 112.31 103.94 106.66 104.47 0.12 0.0002 3466
HT1b(S)(DC) PAR 100.37
HT2a(S)(DC) PAR 104.45
HT2b(S)(DC) PAR 99.68
LT1a(DC) PAR 101.72 103.00 103.82 108.47 106.28 121.38 108.38 117.77 109.91 0.49 0.0007 990
LT1b(DC) PAR 96.19
LT2a(DC) PAR 102.80
LT2b(DC) PAR 97.56
LT1a(S)(DC) PAR 105.96 100.07 101.74 111.19 113.19 114.28 110.74 117.42
0.53 0.0007 990
LT1b(S)(DC) PAR 99.97
LT2a(S)(DC) PAR 107.53
LT2b(S)(DC) PAR 101.51
HT1a IBU 111.32
99.86 101.27
96.85
87.49 0.73 0.0010 693
HT1b IBU 125.91
105.76
98.47
85.53 0.84 0.0017 408
HT2a IBU 119.04
102.20 97.99
96.54
88.86 0.75 0.0013 533
HT2b IBU 121.98 106.69 100.03
98.58 102.91 95.62 86.70 82.38 0.74 0.0015 462
HT1a(S) IBU 116.16
100.91 96.75
95.33
89.69 0.69 0.0011 630
HT1b(S) IBU 99.55 105.82 99.84 100.22 96.02 100.98 90.56 82.04 89.97 0.65 0.0010 693
HT2a(S) IBU 110.86 104.73 96.09 92.93
93.76
86.57 0.64 0.0010 693
HT2b(S) IBU 105.67 110.77
94.00 100.50 99.66 94.82 90.47 79.76 0.76 0.0014 495
LT1a IBU 107.36
104.71 101.54
100.66
97.65 0.89 0.0005 1386
LT1b IBU 110.80 107.61 100.10
100.80
93.22
94.08 0.80 0.0009 770
LT2a IBU 119.98
102.90
98.45
95.18
90.02 0.77 0.0013 533
LT2b IBU 104.88
103.41
100.73
97.55 97.10 90.44 0.89 0.0007 990
LT1a(S) IBU 112.80
107.06 100.51
99.79 99.65 92.33 0.67 0.0007 990
LT1b(S) IBU 101.96 107.87 103.13 103.28 99.63 104.47 97.19 93.76 88.08 0.72 0.0009 770
LT2a(S) IBU 119.82
103.15
106.30
98.90
95.54 0.56 0.0009 770
LT2b(S) IBU 105.88 114.80 101.78 97.63 97.91
101.72 99.27 88.65 0.55 0.0009 770
HT1a(DC) IBU 111.32 139.72 104.27 112.56 121.28 148.93 116.52 112.66 110.86 0.03 0.00037 1873
HT1b(DC) IBU 125.91
HT2a(DC) IBU 119.04
HT2b(DC) IBU 121.98
HT1a(S)(DC) IBU 116.16 133.71 109.04 119.22 122.00 145.85 124.56 108.44 118.10 0.04 0.00038 1824
HT1b(S)(DC) IBU 99.55
HT2a(S)(DC) IBU 110.86

241
HT2b(S)(DC) IBU 105.67
LT1a(DC) IBU 107.36 139.19 104.47 119.23 118.04 138.76 122.83 133.78 114.60 0.11 0.00057 1216
LT1b(DC) IBU 110.80
LT2a(DC) IBU 119.98
LT2b(DC) IBU 104.88
LT1a(S)(DC) IBU 112.80 124.00 101.20 117.39 116.12 127.39 118.38 132.53 113.61 0.24 0.00068 1019
LT1b(S)(DC) IBU 101.96
LT2a(S)(DC) IBU 119.82
LT2b(S)(DC) IBU 105.88
HT1a MEF 240.51 246.58 180.44 187.23 162.43 79.36 65.69 81.48
0.88 0.0091 76
HT1b MEF 201.44 184.40 187.79 178.47 174.15 76.28 62.14 78.95
0.80 0.008 87
HT2a MEF 231.15 233.44 184.13 135.60 148.37 54.18 43.84 40.30
0.92 0.0129 54
HT2b MEF 194.53 205.10 165.55 177.87
63.14 57.27 33.10
0.94 0.0122 57
HT1a(S) MEF 209.01 211.52 165.26 165.38 142.53 37.77
32.24
0.84 0.0136 51
HT1b(S) MEF 202.04 206.41 173.30 162.67 152.98 47.18 26.54 28.77
0.87 0.0150 46
HT2a(S) MEF 195.35 209.83 175.34 172.95 181.55 38.89 31.85 27.99
0.81 0.0144 48
HT2b(S) MEF 204.19 204.92 182.57 167.30 165.23 54.16 30.50 27.95
0.88 0.0148 47
LT1a MEF 203.81 230.02 204.70 189.00 203.63 72.83 74.81 45.77
0.83 0.0104 67
LT1b MEF 209.84 222.41 199.88 159.16 196.47 83.26 61.39
0.79 0.0095 73
LT2a MEF 224.51 224.55 205.34 184.21 173.28 75.53 65.06 42.62
0.90 0.0112 62
LT2b MEF 216.79 216.98 200.17 167.47 181.79 58.05 63.30 45.40
0.86 0.0112 62
LT1a(S) MEF 228.04 219.53 197.73 183.15 182.83 65.28 44.23 32.60
0.88 0.0134 52
LT1b(S) MEF 194.93 176.74 194.57 181.61 180.42 48.48 56.27 43.34
0.80 0.0113 61
LT2a(S) MEF 223.82 232.00 194.48 182.41 155.81 70.89 55.22 47.73
0.92 0.0113 61
LT2b(S) MEF 216.95 189.51 196.71 185.14 122.27 60.54 59.39 60.45
0.89 0.0101 69
HT1a(DC) MEF 240.51 249.44 208.99 228.42 229.87 124.40 94.88 175.71 174.20 0.35 0.0030 231.82
HT1b(DC) MEF 201.44
HT2a(DC) MEF 231.15
HT2b(DC) MEF 194.53
HT1a(S)(DC) MEF 209.01 228.06 204.99 211.62 202.18 115.07 105.14 161.27 218.81 0.20 0.0020 346.57
HT1b(S)(DC) MEF 202.04
HT2a(S)(DC) MEF 195.35
HT2b(S)(DC) MEF 204.19
LT1a(DC) MEF 203.81 240.37 219.47 233.78 236.43 138.41 129.92 205.44 237.04 0.09 0.0011 647.8
LT1b(DC) MEF 209.84
LT2a(DC) MEF 224.51
LT2b(DC) MEF 216.79
LT1a(S)(DC) MEF 228.04 228.68 211.46 219.15 242.90 116.71 68.19 231.81 185.10 0.17 0.0027 252.97
LT1b(S)(DC) MEF 194.93
LT2a(S)(DC) MEF 223.82
LT2b(S)(DC) MEF 216.95
HT1a PRO 147.25 109.85 22.94
0.95 0.075 9
HT1b PRO 125.14 77.32 23.37
0.98 0.066 11
HT2a PRO 130.03 88.15 14.08
0.98 0.0910 8
HT2b PRO 116.13 68.98 14.08
1.00 0.0870 8
HT1a(S) PRO 80.36 77.62 23.37
0.96 0.0560 12
HT1b(S) PRO 92.37 65.55 14.08
1.00 0.0800 9
HT2a(S) PRO 133.81 74.44 21.70
0.99 0.0720 10
HT2b(S) PRO 123.75 68.02 14.08
1.00 0.0880 8
LT1a PRO 118.16 85.16 26.04
0.99 0.0610 11
LT1b PRO 103.96 76.01 23.44
1.00 0.0620 11
LT2a PRO 109.97 78.82 13.91
0.98 0.0860 8
LT2b PRO 104.57 64.93 18.66
1.00 0.0710 10
LT1a(S) PRO 112.30 75.07 18.21
0.99 0.0740 9
LT1b(S) PRO 108.20 68.22 19.61
1.00 0.0690 10
LT2a(S) PRO 111.54 80.62 13.91
0.99 0.0870 8
LT2b(S) PRO 107.22 72.15 23.33
1.00 0.0620 11
HT1a(DC) PRO 147.25 136.22 100.53 107.75 112.09 86.65 96.35 107.55 102.98 0.22 0.00123 563.53
HT1b(DC) PRO 125.14
HT2a(DC) PRO 130.03
HT2b(DC) PRO 116.13
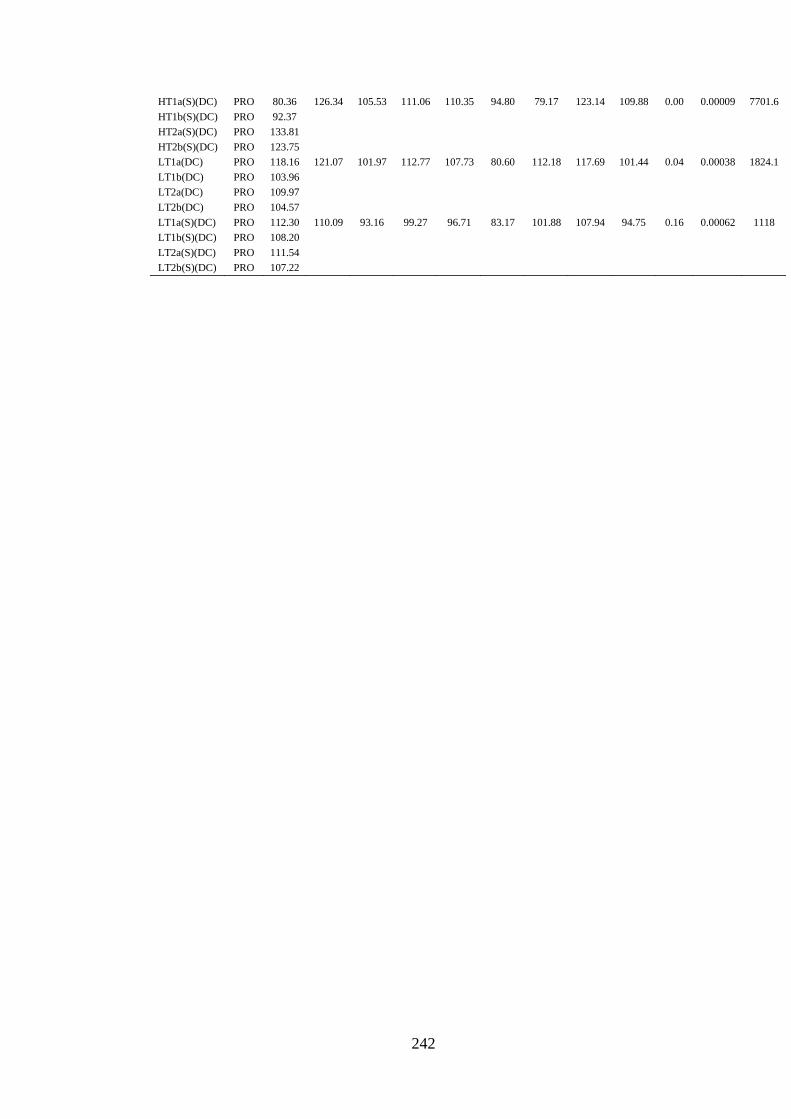
242
HT1a(S)(DC) PRO 80.36 126.34 105.53 111.06 110.35 94.80 79.17 123.14 109.88 0.00 0.00009 7701.6
HT1b(S)(DC) PRO 92.37
HT2a(S)(DC) PRO 133.81
HT2b(S)(DC) PRO 123.75
LT1a(DC) PRO 118.16 121.07 101.97 112.77 107.73 80.60 112.18 117.69 101.44 0.04 0.00038 1824.1
LT1b(DC) PRO 103.96
LT2a(DC) PRO 109.97
LT2b(DC) PRO 104.57
LT1a(S)(DC) PRO 112.30 110.09 93.16 99.27 96.71 83.17 101.88 107.94 94.75 0.16 0.00062 1118
LT1b(S)(DC) PRO 108.20
LT2a(S)(DC) PRO 111.54
LT2b(S)(DC) PRO 107.22

243
APPENDIX C: DATA FOR CHAPTER SEVEN
Appendix C1: Environmental variables field data

244

245
Appendix C2: Chromatograph showing retention time of 4-n-nonylphenol and
triclosan
4-n-nonylphenol
triclosan

246
Appendix C3: Peak areas of 4-n-nonylphenol and triclosan used for calculating
triclosan concentrations during experimental degradation studies
Acidified experiment
Peak R.T Width Area Area ratio RRF [mg L-1]
TIC: 0d5dc.D\data.ms
4-n-nonylphenol 18.739 0.029 82711502 68926251.67 1.1830335 1.1615233
Triclosan 21.091 0.051 58262301 58262301
TIC: 0d5rep1.D\data.ms
4-n-nonylphenol 18.74 0.029 67765168 56470973.33 1.9416919 0.7076925
Triclosan 21.09 0.066 29083385 29083385
TIC: 0d5rep2.D\data.ms
4-n-nonylphenol 18.74 0.029 52389003 43657502.5 1.6424435 0.836632
Triclosan 21.09 0.063 26580824 26580824
TIC: 0d5rep3.D\data.ms
4-n-nonylphenol 18.74 0.028 51665140 43054283.33 1.5867285 0.8660088
Triclosan 21.091 0.062 27133995 27133995
TIC: 0d7dc.D\data.ms
4-n-nonylphenol 18.74 0.029 33229192 27690993.33 1.4105606 0.9741665
Triclosan 21.091 0.065 19631197 19631197
TIC: 0d7rep1.D\data.ms
4-n-nonylphenol 18.74 0.029 33576638 27980531.67 1.3184315 1.0422391
Triclosan 21.091 0.059 21222590 21222590
TIC: 0d7rep2.D\data.ms
4-n-nonylphenol 18.74 0.028 44365072 36970893.33 1.3475298 1.0197332
Triclosan 21.093 0.037 27436048 27436048
TIC: 0d7rep3.D\data.ms
4-n-nonylphenol 18.74 0.028 47888751 39907292.5 1.231081 1.1161904
Triclosan 21.093 0.036 32416463 32416463
TIC: 0d9dc.D\data.ms
4-n-nonylphenol 18.739 0.031 23690883 19742402.5 1.6201239 0.8481579
Triclosan 21.089 0.063 12185736 12185736
TIC: 0d9rep1.D\data.ms
4-n-nonylphenol 18.74 0.029 34804205 29003504.17 1.4789046 0.9291477 Triclosan 21.091 0.031 19611477 19611477
TIC: 0d9rep2.D\data.ms
4-n-nonylphenol 18.74 0.029 43325483 36104569.17 1.3831115 0.9934997 Triclosan 21.091 0.067 26103875 26103875
TIC: 0d9rep3.D\data.ms
4-n-nonylphenol 18.74 0.029 51644939 43037449.17 1.3337113 1.0302986 Triclosan 21.092 0.068 32268940 32268940
TIC: 0d11dc.D\data.ms
4-n-nonylphenol 18.74 0.029 34209077 28507564.17 1.3664638 1.0056036 Triclosan 21.091 0.067 20862290 20862290
TIC: 0d11rep1.D\data.ms
4-n-nonylphenol 18.74 0.028 41734100 34778416.67 1.5214934 0.9031396 Triclosan 21.091 0.055 22858079 22858079
TIC: 0d11rep2.D\data.ms
4-n-nonylphenol 18.738 0.062 19567627 16306355.83 1.4768068 0.9304676 Triclosan 21.089 0.053 11041631 11041631
TIC: 0d11rep3.D\data.ms
4-n-nonylphenol 18.74 0.028 42337644 35281370 1.4630786 0.9391982 Triclosan 21.091 0.055 24114473 24114473
TIC: 0d13dc.D\data.ms
4-n-nonylphenol 18.741 0.031 97919942 81599951.67 0.8856668 1.55151 Triclosan 21.097 0.041 92133920 92133920
TIC: 0d13rep1.D\data.ms
4-n-nonylphenol 18.738 0.022 104698509 87248757.5 1.2208918 1.1255059 Triclosan 21.092 0.036 71463138 71463138
TIC: 0d13rep2.D\data.ms
4-n-nonylphenol 18.741 0.03 145611095 121342579.2 0.9902008 1.3877194 Triclosan 21.102 0.093 122543406 122543406
TIC: 0d13rep3.D\data.ms
4-n-nonylphenol 18.738 0.02 75640668 63033890 1.0804639 1.2717879 Triclosan 21.091 0.057 58339654 58339654
TIC: 1d1dc.D\data.ms
4-n-nonylphenol 18.74 0.028 23264231 19386859.17 1.7360828 0.7915065 Triclosan 21.09 0.052 11167013 11167013
TIC: 1d1rep1.D\data.ms

247
4-n-nonylphenol 18.739 0.029 24002510 20002091.67 2.0668118 0.6648505
Triclosan 21.089 0.053 9677752 9677752
TIC: 1d1rep2.D\data.ms
4-n-nonylphenol 18.74 0.029 26310689 21925574.17 2.0374029 0.6744473
Triclosan 21.089 0.057 10761531 10761531
TIC: 1d1rep3.D\data.ms
4-n-nonylphenol 18.74 0.028 27375058 22812548.33 1.5794637 0.8699921
Triclosan 21.09 0.064 14443224 14443224
TIC: 1d3dc.D\data.ms
4-n-nonylphenol 18.739 0.03 23990427 19992022.5 1.8607358 0.7384825
Triclosan 21.089 0.056 10744149 10744149
TIC: 1d3rep1.D\data.ms
4-n-nonylphenol 18.739 0.03 21325006 17770838.33 1.9510174 0.7043099
Triclosan 21.089 0.057 9108498 9108498
TIC: 1d3rep2.D\data.ms
4-n-nonylphenol 18.74 0.029 26131834 21776528.33 1.8589517 0.7391913
Triclosan 21.09 0.071 11714413 11714413
TIC: 1d3rep3.D\data.ms
4-n-nonylphenol 18.739 0.031 21237374 17697811.67 1.9071575 0.7205073
Triclosan 21.089 0.059 9279680 9279680
TIC: 1d5dc.D\data.ms
4-n-nonylphenol 18.739 0.091 38393388 31994490 1.2687962 1.0830115
Triclosan 21.089 0.049 25216413 25216413
TIC: 1d5rep1.D\data.ms
4-n-nonylphenol 18.739 0.051 31106723 25922269.17 2.6405541 0.5203911
Triclosan 21.089 0.029 9816981 9816981
TIC: 1d5rep2.D\data.ms
4-n-nonylphenol 18.739 0.029 23359845 19466537.5 2.0602918 0.6669545 Triclosan 21.089 0.049 9448437 9448437
TIC: 1d5rep3.D\data.ms
4-n-nonylphenol 18.739 0.029 22470435 18725362.5 1.8947676 0.7252187 Triclosan 21.089 0.06 9882670 9882670
TIC: 1d7dc.D\data.ms
4-n-nonylphenol 18.74 0.029 23388493 19490410.83 1.6754084 0.8201707 Triclosan 21.09 0.056 11633230 11633230
TIC: 1d7rep1.D\data.ms
4-n-nonylphenol 18.739 0.03 19480676 16233896.67 1.8988337 0.7236657 Triclosan 21.09 0.056 8549404 8549404
TIC: 1d7rep2.D\data.ms
4-n-nonylphenol 18.739 0.03 18553218 15461015 1.8827816 0.7298355 Triclosan 21.089 0.055 8211794 8211794
TIC: 1d7rep3.D\data.ms
4-n-nonylphenol 18.74 0.029 21363636 17803030 1.8578016 0.7396489 Triclosan 21.09 0.056 9582848 9582848
TIC: 1d9dc.D\data.ms
4-n-nonylphenol 18.738 0.058 13442695 11202245.83 1.6955032 0.8104502 Triclosan 21.089 0.061 6607033 6607033
TIC: 1d9rep1.D\data.ms
4-n-nonylphenol 18.739 0.05 16939344 14116120 1.8520231 0.7419567 Triclosan 21.089 0.052 7622000 7622000
TIC: 1d9rep2.D\data.ms
4-n-nonylphenol 18.738 0.055 31082881 25902400.83 1.6119075 0.8524812 Triclosan 21.089 0.052 16069409 16069409
TIC: 1d9rep3.D\data.ms
4-n-nonylphenol 18.736 0.06 16245942 13538285 2.2640571 0.6069285 Triclosan 21.088 0.03 5979657 5979657
TIC: 1d11dc.D\data.ms
4-n-nonylphenol 18.735 0.061 12823852 10686543.33 1.650199 0.8327001 Triclosan 21.088 0.029 6475912 6475912
TIC: 1d11rep1.D\data.ms
4-n-nonylphenol 18.739 0.058 15152238 12626865 1.7459813 0.7870193 Triclosan 21.089 0.065 7231959 7231959
TIC: 1d11rep2.D\data.ms
4-n-nonylphenol 18.738 0.071 14340618 11950515 1.5908503 0.8637651 Triclosan 21.089 0.072 7512030 7512030
TIC: 1d11rep3.D\data.ms
4-n-nonylphenol 18.739 0.066 15334694 12778911.67 2.004799 0.6854158 Triclosan 21.089 0.058 6374161 6374161
TIC: 1d13dc.D\data.ms
4-n-nonylphenol 18.738 0.062 25895856 21579880 1.3350122 1.0292947 Triclosan 21.089 0.057 16164557 16164557
TIC: 1d13rep1.D\data.ms
4-n-nonylphenol 18.738 0.03 27087291 22572742.5 1.3644756 1.0070688 Triclosan 21.089 0.054 16543163 16543163
TIC: 1d13rep2.D\data.ms

248
4-n-nonylphenol 18.739 0.029 35797143 29830952.5 0.9073096 1.5145005
Triclosan 21.089 0.065 32878470 32878470
TIC: 1d13rep3.D\data.ms
4-n-nonylphenol 18.737 0.052 89759250 74799375 1.6649416 0.8253268
Triclosan 21.088 0.064 44926124 44926124
TIC: 3d1dc.D\data.ms 18.739 0.031 39593807 32994839.17 1.7551013 0.7829297
4-n-nonylphenol 21.09 0.068 18799393 18799393
Triclosan
TIC: 3d1rep1.D\data.ms 18.74 0.028 45596036 37996696.67 1.9719211 0.6968438
4-n-nonylphenol 21.091 0.068 19268873 19268873
Triclosan
TIC: 3d1rep2.D\data.ms 18.74 0.028 49102748 40918956.67 2.5988679 0.5287383
4-n-nonylphenol 21.09 0.067 15744916 15744916
Triclosan
TIC: 3d1rep3.D\data.ms 18.74 0.029 42279133 35232610.83 1.5513212 0.8857746
4-n-nonylphenol 21.091 0.078 22711358 22711358
Triclosan
TIC: 3d3dc.D\data.ms 18.741 0.028 51562400 42968666.67 1.5738518 0.8730942
4-n-nonylphenol 21.095 0.039 27301597 27301597
Triclosan
TIC: 3d3rep1.D\data.ms 18.74 0.029 31191329 25992774.17 2.5015275 0.5493127
4-n-nonylphenol 21.09 0.055 10390761 10390761
Triclosan
TIC: 3d3rep2.D\data.ms 18.74 0.029 28386410 23655341.67 1.9426626 0.7073389
4-n-nonylphenol 21.09 0.06 12176763 12176763
Triclosan
TIC: 3d3rep3.D\data.ms 18.74 0.028 34232034 28526695 2.3182489 0.5927409
4-n-nonylphenol 21.09 0.056 12305277 12305277
Triclosan
TIC: 3d5dc.D\data.ms 18.74 0.031 34291081 28575900.83 1.0224171 1.3439925
4-n-nonylphenol 21.092 0.053 27949357 27949357
Triclosan
TIC: 3d5rep1.D\data.ms 18.739 0.03 35948760 29957300 2.8877824 0.4758395
4-n-nonylphenol 21.089 0.057 10373808 10373808
Triclosan
TIC: 3d5rep2.D\data.ms 18.74 0.028 36304141 30253450.83 2.1148154 0.6497593
4-n-nonylphenol 21.091 0.061 14305481 14305481
Triclosan
TIC: 3d5rep3.D\data.ms 18.737 0.052 10614631 8845525.833 3.0445562 0.451337
4-n-nonylphenol 21.087 0.064 2905358 2905358
Triclosan
TIC: 3d7dc.D\data.ms 18.74 0.029 19921427 16601189.17 1.4692866 0.93523
4-n-nonylphenol 21.091 0.063 11298809 11298809
Triclosan
TIC: 3d7rep1.D\data.ms 18.74 0.029 20216148 16846790 2.3302739 0.5896821
4-n-nonylphenol 21.09 0.066 7229532 7229532
Triclosan
TIC: 3d7rep2.D\data.ms 18.738 0.058 9857317 8214430.833 1.4599718 0.9411968
4-n-nonylphenol 21.09 0.064 5626431 5626431
Triclosan
TIC: 3d7rep3.D\data.ms 18.74 0.031 15119758 12599798.33 2.8006286 0.4906473
4-n-nonylphenol 21.089 0.057 4498918 4498918
Triclosan
TIC: 3d9dc.D\data.ms 18.739 0.055 8658644 7215536.667 1.3055071 1.0525572
4-n-nonylphenol 21.09 0.066 5526999 5526999
Triclosan
TIC: 3d9rep1.D\data.ms 18.738 0.032 20834786 17362321.67 1.7767719 0.7733806
4-n-nonylphenol 21.089 0.055 9771835 9771835
Triclosan
TIC: 3d9rep2.D\data.ms 18.738 0.05 12942723 10785602.5 2.5922119 0.5300959
4-n-nonylphenol 21.088 0.059 4160772 4160772
Triclosan
TIC: 3d9rep3.D\data.ms 18.739 0.031 15517103 12930919.17 2.1710263 0.6329361
4-n-nonylphenol 21.089 0.057 5956132 5956132
Triclosan
TIC: 3d11dc.D\data.ms 18.739 0.032 14345828 11954856.67 1.3175173 1.0429623
4-n-nonylphenol 21.09 0.058 9073776 9073776
Triclosan
TIC: 3d11rep1.D\data.ms 18.739 0.061 15798820 13165683.33 2.9749454 0.4618978
4-n-nonylphenol 21.089 0.067 4425521 4425521
Triclosan
TIC: 3d11rep2.D\data.ms 18.737 0.065 11568324 9640270 2.3155497 0.5934318
4-n-nonylphenol 21.088 0.055 4163275 4163275
Triclosan
TIC: 3d11rep3.D\data.ms 18.739 0.032 19964450 16637041.67 2.5821674 0.5321579

249
4-n-nonylphenol 21.089 0.062 6443053 6443053
Triclosan
TIC: 3d13dc.D\data.ms 18.737 0.063 30475186 25395988.33 0.9154469 1.5010384
4-n-nonylphenol 21.09 0.063 27741630 27741630
Triclosan
TIC: 3d13rep1.D\data.ms 18.739 0.077 37629428 31357856.67 1.6650567 0.8252697
4-n-nonylphenol 21.089 0.056 18832906 18832906
Triclosan
TIC: 3d13rep2.D\data.ms 18.739 0.045 55663674 46386395 1.027088 1.3378804
4-n-nonylphenol 21.09 0.056 45163020 45163020
Triclosan
TIC: 3d13rep3.D\data.ms 18.736 0.05 91500736 76250613.33 2.0577253 0.6677863
4-n-nonylphenol 21.089 0.059 37055778 37055778
Triclosan
TIC: 6d1dc.D\data.ms
4-n-nonylphenol 18.728 0.035 4413655 3678045.833 2.1527622 0.6383059
Triclosan 21.085 0.041 1708524 1708524
TIC: 6d1rep1.D\data.ms
4-n-nonylphenol 18.734 0.055 6302808 5252340 3.4193453 0.4018667
Triclosan 21.083 0.041 1536066 1536066
TIC: 6d1rep2.D\data.ms
4-n-nonylphenol 18.737 0.052 7423947 6186622.5 3.4933131 0.3933575
Triclosan 21.085 0.072 1770990 1770990
TIC: 6d1rep3.D\data.ms
4-n-nonylphenol 18.729 0.037 1960799 1633999.167 3.4938252 0.3932998
Triclosan 21.082 0.042 467682 467682
TIC: 6d3dc.D\data.ms
4-n-nonylphenol 18.738 0.05 9824026 8186688.333 1.8872987 0.7280887 Triclosan 21.089 0.062 4337781 4337781
TIC: 6d3rep1.D\data.ms
4-n-nonylphenol 18.732 0.041 5150404 4292003.333 3.082988 0.4457107 Triclosan 21.083 0.081 1392157 1392157
TIC: 6d3rep2.D\data.ms
4-n-nonylphenol 18.734 0.056 5089601 4241334.167 3.6927278 0.3721154 Triclosan 21.084 0.041 1148564 1148564
TIC: 6d3rep3.D\data.ms
4-n-nonylphenol 18.727 0.035 1273417 1061180.833 2.8320963 0.4851957 Triclosan 21.082 0.047 374698 374698
TIC: 6d5dc.D\data.ms
4-n-nonylphenol 18.73 0.037 10581808 8818173.333 1.3025265 1.0549658 Triclosan 21.088 0.05 6770053 6770053
TIC: 6d5rep1.D\data.ms
4-n-nonylphenol 18.731 0.038 5727312 4772760 5.1124791 0.2687778 Triclosan 21.081 0.043 933551 933551
TIC: 6d5rep2.D\data.ms
4-n-nonylphenol 18.733 0.067 6071337 5059447.5 7.8941376 0.1740685 Triclosan 21.08 0.039 640912 640912
TIC: 6d5rep3.D\data.ms
4-n-nonylphenol 18.738 0.05 10316313 8596927.5 7.9934834 0.1719051 Triclosan 21.083 0.041 1075492 1075492
TIC: 6d7dc.D\data.ms
4-n-nonylphenol 18.737 0.053 8081830 6734858.333 3.1297163 0.4390561 Triclosan 21.086 0.059 2151907 2151907
TIC: 6d7rep1.D\data.ms
4-n-nonylphenol 18.737 0.055 8006292 6671910 6.7308181 0.2041536 Triclosan 21.082 0.04 991248 991248
TIC: 6d7rep2.D\data.ms
4-n-nonylphenol 18.734 0.062 6512523 5427102.5 5.7862986 0.2374784 Triclosan 21.08 0.04 937923 937923
TIC: 6d7rep3.D\data.ms
4-n-nonylphenol 18.739 0.03 14690321 12241934.17 8.8050818 0.15606 Triclosan 21.084 0.053 1390326 1390326
TIC: 6d9dc.D\data.ms
4-n-nonylphenol 18.732 0.051 4485395 3737829.167 1.5428992 0.8906096 Triclosan 21.088 0.052 2422601 2422601
TIC: 6d9rep1.D\data.ms
4-n-nonylphenol 18.729 0.089 8714005 7261670.833 3.4974918 0.3928875 Triclosan 21.082 0.041 2076251 2076251
TIC: 6d9rep2.D\data.ms
4-n-nonylphenol 18.729 0.036 3854191 3211825.833 4.2398494 0.3240966 Triclosan 21.08 0.042 757533 757533
TIC: 6d9rep3.D\data.ms
4-n-nonylphenol 18.73 0.037 4273630 3561358.333 5.4935242 0.2501347 Triclosan 21.082 0.039 648283 648283
TIC: 6d11dc.D\data.ms

250
4-n-nonylphenol 18.73 0.038 4091484 3409570 1.5776004 0.8710196
Triclosan 21.087 0.051 2161238 2161238
TIC: 6d11rep1.D\data.ms
4-n-nonylphenol 18.731 0.038 4754705 3962254.167 4.7454987 0.289563
Triclosan 21.081 0.041 834950 834950
TIC: 6d11rep2.D\data.ms
4-n-nonylphenol 18.73 0.038 3719520 3099600 3.987942 0.3445689
Triclosan 21.083 0.038 777243 777243
TIC: 6d11rep3.D\data.ms
4-n-nonylphenol 18.728 0.037 3186304 2655253.333 5.6826157 0.2418113
Triclosan 21.08 0.039 467259 467259
TIC: 6d13dc.D\data.ms
4-n-nonylphenol 18.729 0.035 4934813 4112344.167 1.3280985 1.0346528
Triclosan 21.087 0.051 3096415 3096415
TIC: 6d13rep1.D\data.ms
4-n-nonylphenol 18.733 0.038 7568139 6306782.5 2.3382382 0.5876736
Triclosan 21.087 0.05 2697237 2697237
TIC: 6d13rep2.D\data.ms
4-n-nonylphenol 18.737 0.049 13623040 11352533.33 1.4687569 0.9355673
Triclosan 21.087 0.062 7729348 7729348
TIC: 6d13rep3.D\data.ms
4-n-nonylphenol 18.727 0.033 8625571 7187975.833 2.1249421 0.6466627
Triclosan 21.086 0.063 3382669 3382669
TIC: 9d1dc.D\data.ms
4-n-nonylphenol 18.741 0.037 565650 471375 1.9810167 0.6936443
Triclosan 21.094 0.05 237946 237946
TIC: 9d1rep1.D\data.ms
4-n-nonylphenol 18.739 0.052 2405195 2004329.167 4.4656258 0.3077107 Triclosan 21.092 0.04 448835 448835
TIC: 9d1rep2.D\data.ms
4-n-nonylphenol 18.738 0.056 2344150 1953458.333 4.0612862 0.3383462 Triclosan 21.091 0.051 480995 480995
TIC: 9d1rep3.D\data.ms
4-n-nonylphenol 18.74 0.031 4542464 3785386.667 4.1006442 0.3350988 Triclosan 21.091 0.052 923120 923120
TIC: 9d3dc.D\data.ms
4-n-nonylphenol 18.729 0.038 604572 503810 2.4355237 0.5641993 Triclosan 21.093 0.053 206859 206859
TIC: 9d3rep1.D\data.ms
4-n-nonylphenol 18.738 0.055 2711748 2259790 3.8425464 0.3576068 Triclosan 21.09 0.055 588097 588097
TIC: 9d3rep2.D\data.ms
4-n-nonylphenol 18.738 0.058 2453752 2044793.333 3.1940513 0.4302125 Triclosan 21.09 0.052 640188 640188
TIC: 9d3rep3.D\data.ms
4-n-nonylphenol 18.738 0.06 3172193 2643494.167 4.092375 0.3357759 Triclosan 21.09 0.057 645956 645956
TIC: 9d5dc.D\data.ms
4-n-nonylphenol 18.731 0.04 1654126 1378438.333 #DIV/0! 0 Triclosan
0
TIC: 9d5rep1.D\data.ms
4-n-nonylphenol
0 #DIV/0! #DIV/0!
Triclosan
0
TIC: 9d5rep2.D\data.ms
4-n-nonylphenol 18.729 0.074 606211 505175.8333 #DIV/0! 0 Triclosan
0
TIC: 9d5rep3.D\data.ms
4-n-nonylphenol 18.739 0.031 4713547 3927955.833 7.5730434 0.181449 Triclosan 21.089 0.045 518676 518676
TIC: 9d7dc.D\data.ms
4-n-nonylphenol 18.732 0.037 755013 629177.5 1.600191 0.858723 Triclosan 21.09 0.05 393189 393189
TIC: 9d7rep1.D\data.ms
4-n-nonylphenol 18.737 0.056 2319305 1932754.167 6.6216063 0.2075208 Triclosan 21.089 0.051 291886 291886
TIC: 9d7rep2.D\data.ms
4-n-nonylphenol 18.739 0.046 3586997 2989164.167 4.3691585 0.3145047 Triclosan 21.089 0.046 684151 684151
TIC: 9d7rep3.D\data.ms
4-n-nonylphenol 18.739 0.051 2862785 2385654.167 8.4604266 0.1624174 Triclosan 21.091 0.053 281978 281978
TIC: 9d9dc.D\data.ms
4-n-nonylphenol 18.733 0.065 1079202 899335 3.3918866 0.4051199 Triclosan 21.091 0.048 265143 265143
TIC: 9d9rep1.D\data.ms

251
4-n-nonylphenol 18.733 0.043 1357879 1131565.833 #DIV/0! 0
Triclosan
0
TIC: 9d9rep2.D\data.ms
4-n-nonylphenol 18.74 0.029 4021550 3351291.667 9.40336 0.1461308
Triclosan 21.09 0.048 356393 356393
TIC: 9d9rep3.D\data.ms
4-n-nonylphenol 18.74 0.028 4359747 3633122.5 10.953236 0.1254534
Triclosan 21.09 0.03 331694 331694
TIC: 9d11dc.D\data.ms
4-n-nonylphenol 18.728 0.035 309337 257780.8333 #DIV/0! 0
Triclosan
0
TIC: 9d11rep1.D\data.ms
4-n-nonylphenol 18.74 0.03 3933291 3277742.5 6.8091108 0.2018062
Triclosan 21.09 0.049 481376 481376
TIC: 9d11rep2.D\data.ms
4-n-nonylphenol 18.739 0.05 2395120 1995933.333 4.83216 0.2843699
Triclosan 21.09 0.057 413052 413052
TIC: 9d11rep3.D\data.ms
4-n-nonylphenol 18.74 0.028 6908674 5757228.333 #DIV/0! 0
Triclosan
0
TIC: 9d13dc.D\data.ms
4-n-nonylphenol 18.739 0.056 3629713 3024760.833 2.2071989 0.6225632
Triclosan 21.091 0.054 1370407 1370407
TIC: 9d13rep1.D\data.ms
4-n-nonylphenol 18.74 0.028 6582410 5485341.667 3.4909909 0.3936192
Triclosan 21.091 0.056 1571285 1571285
TIC: 9d13rep2.D\data.ms
4-n-nonylphenol 18.74 0.029 9463450 7886208.333 1.9762595 0.695314 Triclosan 21.091 0.058 3990472 3990472
TIC: 9d13rep3.D\data.ms
4-n-nonylphenol 18.732 0.04 3019368 2516140 1.6002915 0.8586691 Triclosan 21.091 0.065 1572301 1572301
Non-acidified experiment
TIC: 0dtapdc1.D\data.ms
4-n-nonylphenol 18.421 0.082 84439408 70366173.33 1.4955517 1.0173213
Triclosan 20.769 0.094 47050313 47050313
TIC: 0dtapdc2.D\data.ms
4-n-nonylphenol 18.419 0.078 100314344 83595286.67 1.3812749 1.1014871 Triclosan 20.768 0.089 60520382 60520382
TIC: 0dtap1.D\data.ms
4-n-nonylphenol 18.418 0.07 139266493 116055410.8 2.0067571 0.7581668 Triclosan 20.769 0.08 57832315 57832315
TIC: 0dtap2.D\data.ms
4-n-nonylphenol 18.419 0.079 103657385 86381154.17 1.3928436 1.0923384 Triclosan 20.77 0.097 62017843 62017843
TIC: 0dtap3.D\data.ms
4-n-nonylphenol 18.416 0.04 468883413 390736177.5 1.5562204 0.9776614 Triclosan 20.757 0.059 251080232 251080232
TIC: 3dtapdc1.D\data.ms
4-n-nonylphenol 18.431 0.094 53915514 44929595 1.9491295 0.7805826 Triclosan 20.786 0.134 23051108 23051108
TIC: 3dtapdc2.D\data.ms
4-n-nonylphenol 18.433 0.091 53849920 44874933.33 1.5009242 1.0136798
Triclosan 20.78 0.119 29898201 29898201
TIC: 3dtap1.D\data.ms
4-n-nonylphenol 18.42 0.091 91910102 76591751.67 1.776588 0.8563925
Triclosan 20.771 0.103 43111714 43111714
TIC: 3dtap2.D\data.ms
4-n-nonylphenol 18.421 0.091 89723784 74769820 1.6181659 0.9402352
Triclosan 20.772 0.106 46206524 46206524
TIC: 3dtap3.D\data.ms
4-n-nonylphenol 18.413 0.098 342126430 285105358.3 1.6160797 0.941449
Triclosan 20.754 0.061 176417884 176417884
TIC: 6dtapdc1.D\data.ms
4-n-nonylphenol 18.407 0.066 208072534 173393778.3 1.4992869 1.0147868
Triclosan 20.756 0.077 115650834 115650834
TIC: 6dtapdc2.D\data.ms
4-n-nonylphenol 18.406 0.048 481193128 400994273.3 1.1892812 1.2793077
Triclosan 20.748 0.109 337173647 337173647
TIC: 6dtap1.D\data.ms
4-n-nonylphenol 18.407 0.048 526789432 438991193.3 1.3299667 1.143981
Triclosan 20.748 0.089 330076835 330076835
TIC: 6dtap2.D\data.ms
4-n-nonylphenol 18.409 0.081 592366372 493638643.3 1.4960153 1.017006

252
Triclosan 20.749 0.085 329968986 329968986
TIC: 6dtap3.D\data.ms
4-n-nonylphenol 18.406 0.048 523626218 436355181.7 1.602629 0.9493504
Triclosan 20.749 0.108 272274601 272274601
TIC: 9dtapdc1.D\data.ms
4-n-nonylphenol 18.414 0.077 116792809 97327340.83 1.9057327 0.7983578
Triclosan 20.77 0.107 51070825 51070825
TIC: 9dtapdc2.D\data.ms
4-n-nonylphenol 18.419 0.088 81263396 67719496.67 1.689625 0.90047
Triclosan 20.772 0.112 40079602 40079602
TIC: 9dtap1.D\data.ms
4-n-nonylphenol 18.432 0.102 52461163 43717635.83 1.5395801 0.9882283
Triclosan 20.785 0.142 28395818 28395818
TIC: 9dtap2.D\data.ms
4-n-nonylphenol 18.404 0.059 186846992 155705826.7 0.9442659 1.6112586
Triclosan 20.75 0.106 164896159 164896159
TIC: 9dtap3.D\data.ms
4-n-nonylphenol 18.406 0.047 559137655 465948045.8 1.446553 1.0517807
Triclosan 20.749 0.101 322109201 322109201