annual results presentation for year ended … · 3g lte planned lte population coverage lte...
TRANSCRIPT

ANNUAL RESULTS PRESENTATION FOR YEAR ENDED 31 DECEMBER 2017

GOVERNANCE–POSTTHERE-CAPITALISATION
Jose Dos Santos Chief Executive Officer
Robert Pasley Chief Strategy Officer
Tyrone Soondarjee Chief Financial Officer
Kuben Pillay Independent Chairman
Laurence Nestadt Deputy Chairman
Mark Levy Nominated by: Blue Label Telecoms
Brett Levy Nominated by: Blue Label Telecoms
Herman Kotzé Nominated by: Net1
Chris Seabrooke
Joe Mthimunye Independent Director
Executive Directors
Non-Executive Directors
Non-Executive Directors - Shareholder Nominees

TOPMANAGEMENTSTRUCTURESTRENGTHENED
Jose Dos Santos Chief Executive Officer
Tyrone Soondarjee Chief Financial Officer
Surie Ramasary Chief Executive: Content
Dana Bakker Chief Technical Officer
Douglas Craigie Stevenson Chief Operations Officer
Björn Flormann Chief Executive: Wholesale Business
Graham Mackinnon Chief Legal Officer
Juliet Mhango Chief HR Officer
Joshua Moela Managing Executive for Government Relations
Sherhaad Kajee Chief Property & Procurement Officer
Robert Pasley Chief Strategy Officer
Michelle Beetar Chief Customer Experience Officer
Nihmal Marrie Chief Digital Officer
Key new appointments were made to strengthen top management team (CFO, CDO, COO, CHRO)
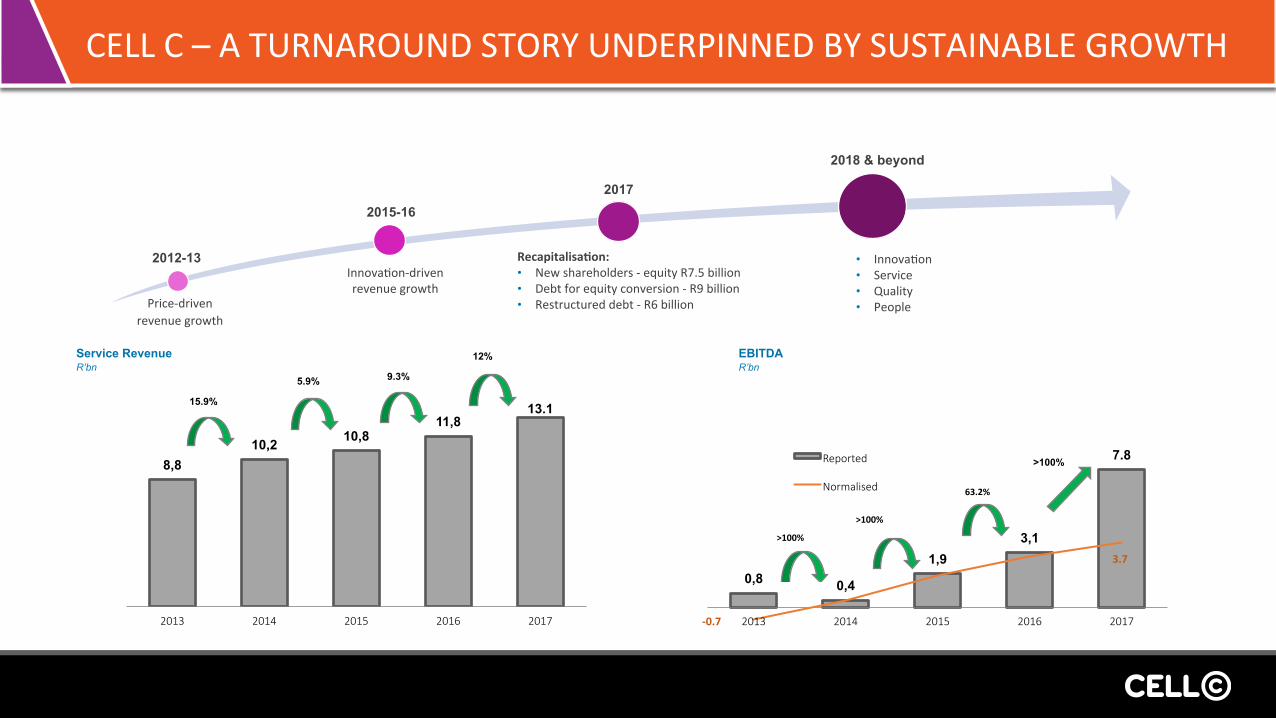
CELLC–ATURNAROUNDSTORYUNDERPINNEDBYSUSTAINABLEGROWTH
EBITDA R’bn
* 2013 reported EBITDA 0.8 vs operational EBITDA; 2017 Normalised ; 2017 forecast
63.2%
>100%
>100%
15.9%
Service Revenue R’bn
8,8 10,2 10,8
11,8 13.1
2013 2014 2015 2016 2017
>100%
5.9% 9.3%
12%
0,8 0,4
1,9 3,1
7.8
2013 2014 2015 2016 2017
Reported
Normalised
2017
Innova<on-drivenrevenuegrowth
Price-drivenrevenuegrowth
2012-13
2015-16
Recapitalisa3on:• Newshareholders-equityR7.5billion• Debtforequityconversion-R9billion• Restructureddebt-R6billion
• Innova<on• Service• Quality• People
3.7
-0.7
2018 & beyond

HIGHLIGHTS–2017KEYPERFORMANCEINDICATORS
+12%YOYServiceRevenueR13.2billion
+151%YOYEBITDA
R7.8billion
+660%Netprofita\ertax
R4.1billion
+7%YOYRevenue
R15.7billion
+29%YOYEBITDAMargin
50%
8%ofrevenueCapitalExpenditure
R1.2billion

POSITIVERESULTS
Summary of reported financial informa?on
R’m 2017 2016 %Change
Servicerevenue 13147 11752 12
Non-servicerevenue 2568 2894 11
Totalrevenue 15715 14646 7
Gross margin 8 170 7 454 10
Grossmargin% 52% 51% 1
EBITDA 7 793 3 106 >100
EBITDAmargin% 50% 21% 29
Net profit aKer tax 4 114 541 >100
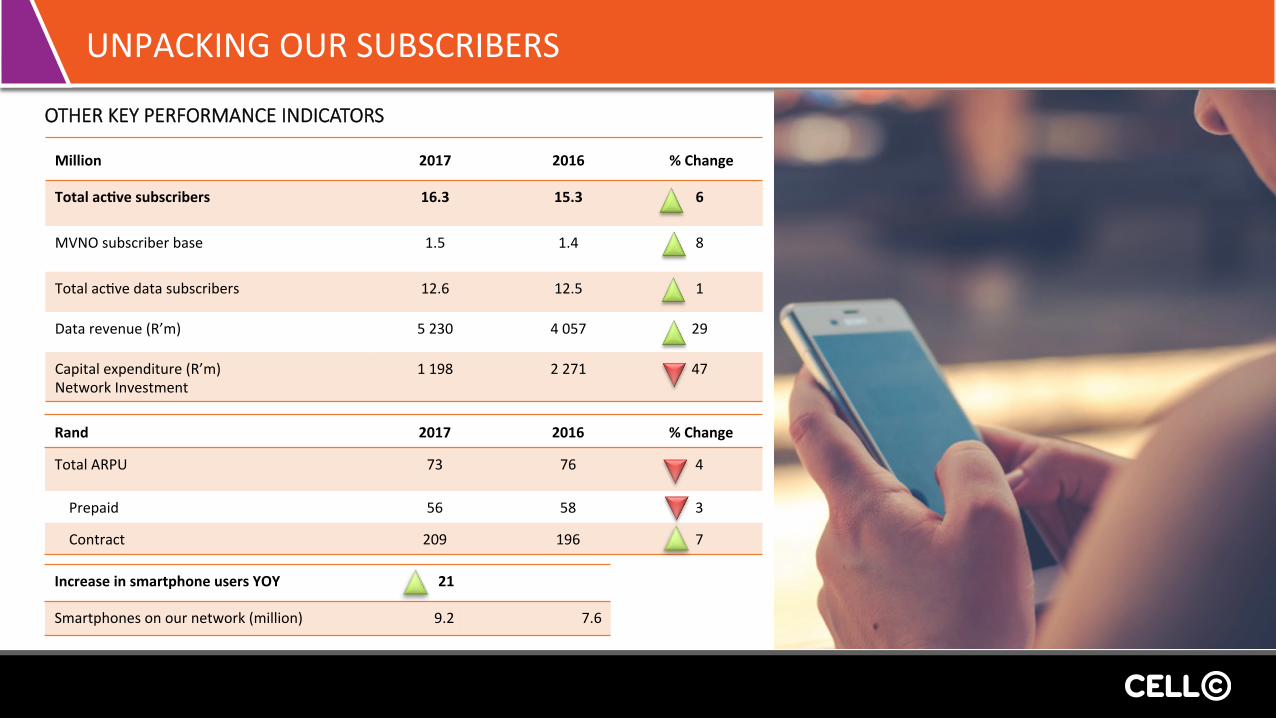
UNPACKINGOURSUBSCRIBERS
Million 2017 2016 %Change
Totalac3vesubscribers 16.3 15.3 6
MVNOsubscriberbase 1.5 1.4 8
Totalac<vedatasubscribers 12.6 12.5 1
Datarevenue(R’m) 5230 4057 29
Capitalexpenditure(R’m)NetworkInvestment
1198 2271 47
OTHER KEY PERFORMANCE INDICATORS
IncreaseinsmartphoneusersYOY 21
Smartphonesonournetwork(million) 9.2 7.6
Rand 2017 2016 %Change
TotalARPU 73 76 4
Prepaid 56 58 3
Contract 209 196 7

PRODUCTS&SERVICESATAGLANCE
DATA• Datarevenueincreased by 29% whilst datausagehasincreasedby90%YOY;• Data revenue now makes up 40%ofservicerevenuecompared to 34% a year
ago; and • The effec3vepriceofdataperMB has decreased by more than 36% YOY. VOICE• Voicerevenuedecreasedby4%YOYinlinewiththeeffec3vepriceofvoice
perminutedecreasingby4%YOY;and• VoicetrafficcarriedbyothermeanssuchasWhatsAppCallingandotherVoIP
services. WHOLESALE• Wholesalerevenue increased by R315 million (or 79%) to R717millionYOY
driven by the growth in the customer base; and • Customer data usage in this area generated the bulk of the revenue growth.
FTTH• Compe<<veproductsandpricing;and• Excep<onalorganicgrowthaidedbyacquisi<onsgoingforward.

FIBRETOTHEHOME
• LaunchedC-Fibrein2016withopenaccessFNOs–Vumatel,FrogFootandMitsol• In2017welaunchedC-FibreonOpenserve,MetrofibreandOctotelonopenaccessFibreNetworks • CellCoffersunlimited,unrestricted,unshapedsymmetricalandasymmetricalfibrepackages
• C-Fibre subscribers benefit from value added services that include a FREE Wi-Fi Router, FREEinstalla3on, FREE connec3on, personalised device set-up and 1GB LTE mobile data p/m for 12months.
• InQ22018,Cell Cwill launcha tripleplayoffer thatwill includemobile,fibreandentertainmentthroughtheblackplacorm
C-Fibre 2017 2016 Basegrowth% Revenuegrowth%
Newconnec<ons 13958 1795 >100 >100

black THE FUTURE OF ENTERTAINMNET NOW.
• Market Disruptor - First to market, on demand, multi media interactive entertainment platform
• Accessible on any network across multiple devices
• Offering Movies, Series, Music, Sport, Games, Live TV and so much more (Local & International)
• Flexible pricing from as little as R5 a day – Subscribe for a week, weekend or month
• Simple payment options – first to introduce payment via Prepaid Airtime, in addition to cards and
vouchers
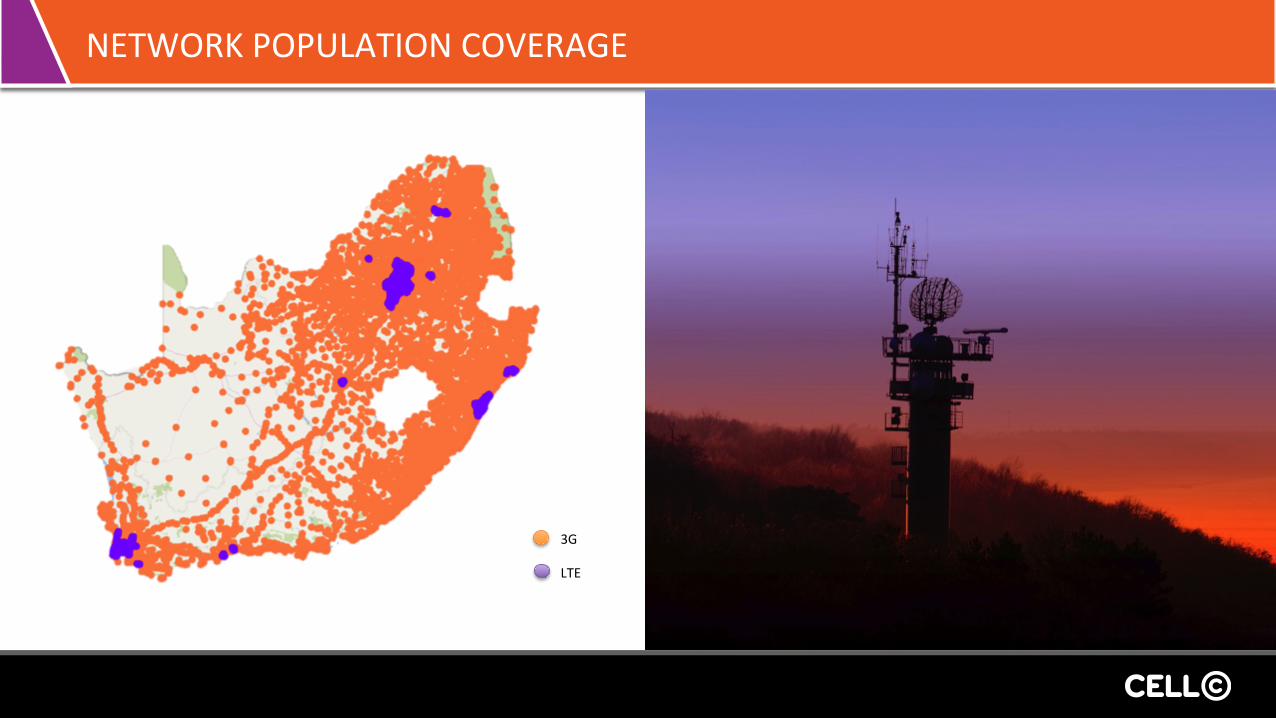
NETWORKPOPULATIONCOVERAGE
3G
LTE

PLANNEDLTEPOPULATIONCOVERAGE
LTE

FINANCIAL RESULTS
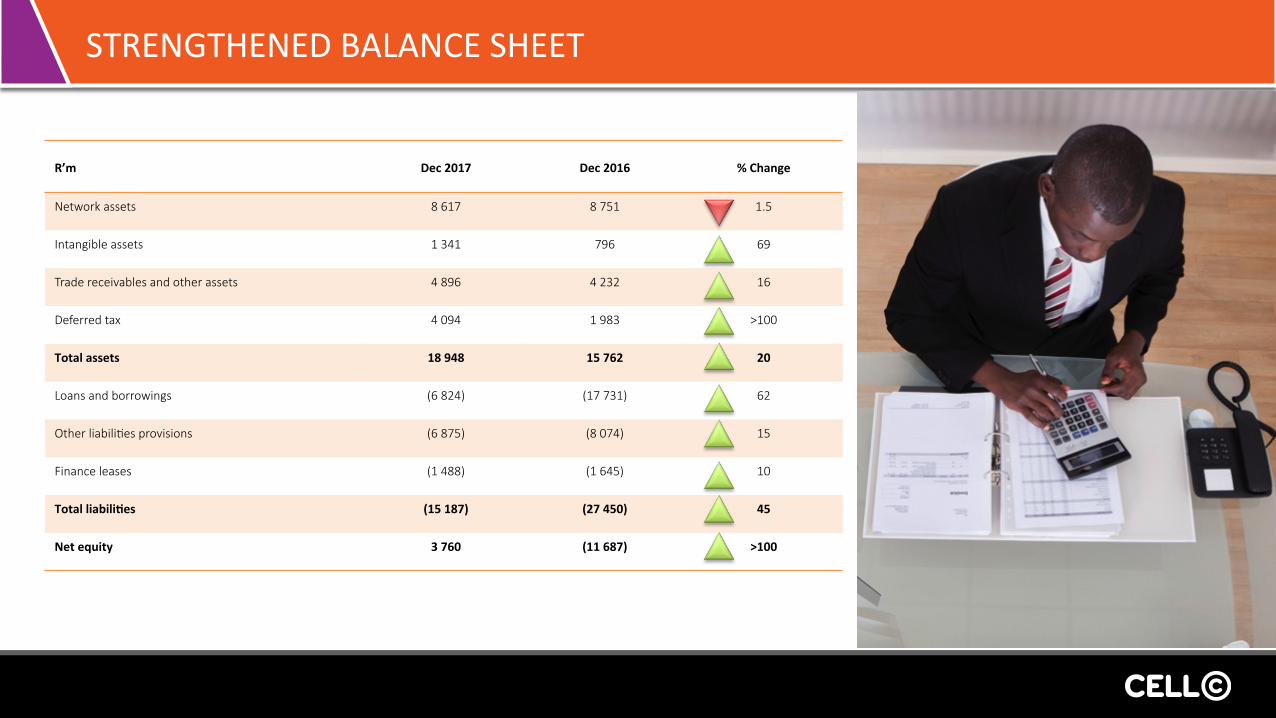
STRENGTHENEDBALANCESHEET
R’m Dec2017 Dec2016 %Change
Network assets 8 617 8 751 1.5
Intangible assets 1 341 796 69
Trade receivables and other assets 4 896 4 232 16
Deferred tax 4 094 1 983 >100
Totalassets 18948 15762 20
Loans and borrowings (6 824) (17 731) 62
Other liabili?es provisions (6 875) (8 074) 15
Finance leases (1 488) (1 645) 10
Totalliabili3es (15187) (27450) 45
Netequity 3760 (11687) >100

R’m 7months2017
Pre-recap
5months2017
Post-recap
Total2017Dec
2016Dec %Change
Totalrevenue 9013 6702 15715 14646 7
Onceoffitems - 4139 4139 214 >100
EBITDA 1960 5833 7793 3106 >100
EBIT
792 4935 5727 1335 >100
NetFinanceCosts -2661 -1064 -3725 -801 >100
Net(loss)/profitbeforetax -1869 3872 2003 541 >100
Tax - 2111 2111 - -
Net(loss)/profit
-1869 5983 4114 541 >100
2017RESULTSPRESENTATION
REPORTEDFINANCIALKEYPERFORMANCEINDICATORS

R’m 7months2017
Pre-recap
5months2017
Post-recap
Total2017Dec
2016Dec
%Change
Totalrevenue 9013 6702 15715 14646 7
NormalisedEBITDA 1960 1694 3654 2892 26
Normalised EBIT 792 796 1 588 1 121 42
Net finance costs -2 661 -1 064 -3 725 -801 >100
Normalisednet(loss)/profitbeforetax
-1869 -267 -2137 320 >100
Tax - 2 111 2 111 - -
Normalisednet(loss)/profit -1869
1844 -26 320 >100
2017RESULTSPRESENTATION
NORMALISEDFINANCIALKEYPERFORMANCEINDICATORS
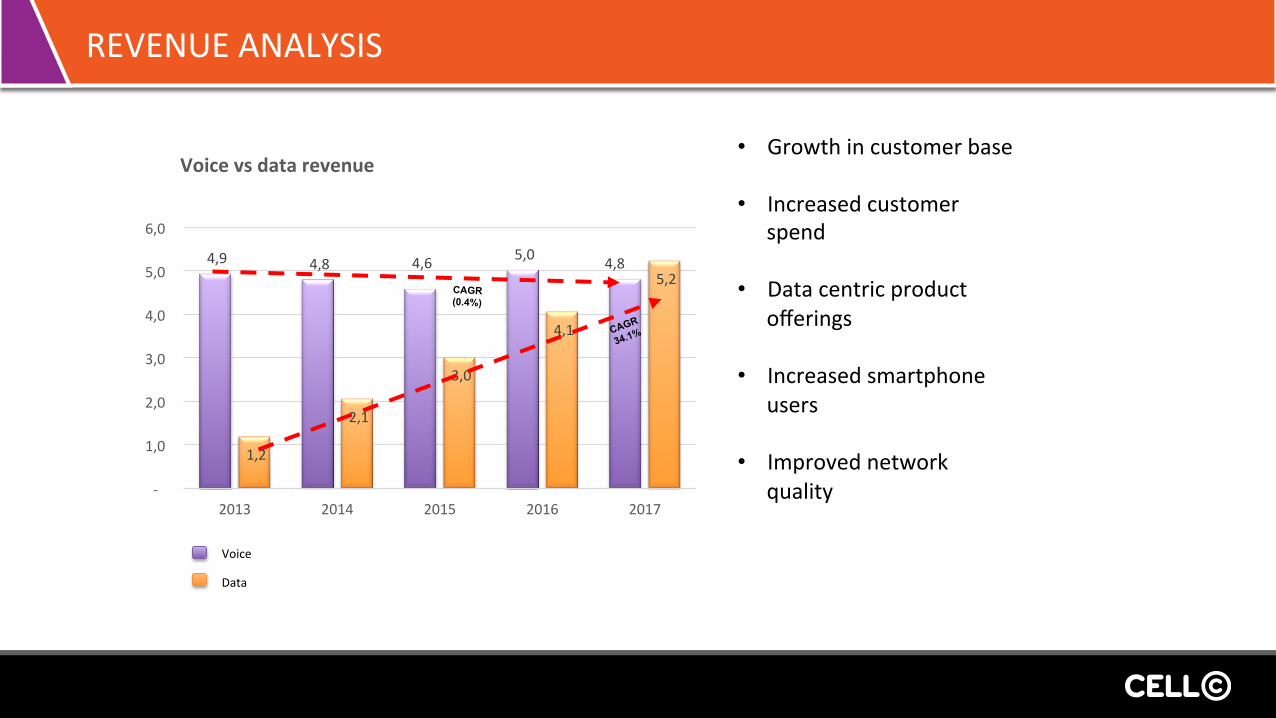
REVENUEANALYSIS
4,9 4,8 4,6 5,0 4,8
1,2
2,1
3,0
4,1
5,2
-
1,0
2,0
3,0
4,0
5,0
6,0
2013 2014 2015 2016 2017
CAGR (0.4%)
• Growthincustomerbase
• Increasedcustomerspend
• Datacentricproductofferings
• Increasedsmartphoneusers
• Improvednetworkquality
Voicevsdatarevenue
Voice
Data
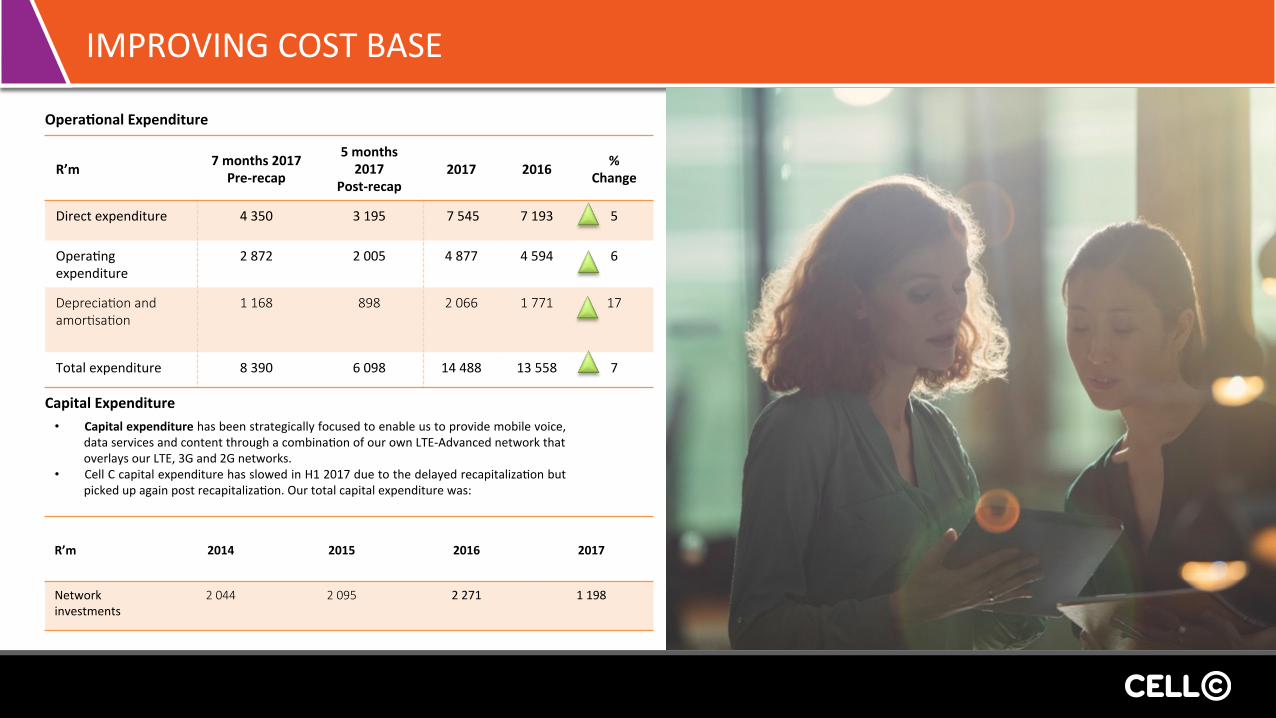
IMPROVINGCOSTBASE
R’m 7months2017
Pre-recap
5months2017
Post-recap2017 2016
%Change
Directexpenditure 4350 3195 7545 7193 5
Opera<ngexpenditure
2872 2005 4877 4594 6
Deprecia?on and amor?sa?on
1 168 898 2 066 1 771 17
Totalexpenditure 8390 6098 14488 13558 7
R’m
2014
2015
2016
2017
Networkinvestments
2 044 2 095 2271 1198
• Capitalexpenditurehasbeenstrategicallyfocusedtoenableustoprovidemobilevoice,dataservicesandcontentthroughacombina<onofourownLTE-AdvancednetworkthatoverlaysourLTE,3Gand2Gnetworks.
• CellCcapitalexpenditurehasslowedinH12017duetothedelayedrecapitaliza<onbutpickedupagainpostrecapitaliza<on.Ourtotalcapitalexpenditurewas:
CapitalExpenditure
Opera3onalExpenditure

THANK YOU