annual results announcement 2019 ar 2020 results.pdffinal dps (rmb) 0.17 - • challenging operating...
TRANSCRIPT

Annual Results Announcement 2019

This presentation and subsequent discussion contain certain forward-
looking statements with respect to the financial condition, results of
operations and business of Clear Media as well as our current
expectations, consumptions, estimates and projections about our industry.
All statements other than statements of historical fact, including the
statements under the heading “Outlook”, are forward-looking statements.
These forward-looking statements represent Clear Media’s current
expectations or beliefs concerning future events and involve known and
unknown risks and uncertainties which could cause actual results,
performance or events to differ materially from those expressed or
implied in such statements. We do not intend to update or otherwise
revise the forward-looking statements in this presentation, whether as a
result of new information, future events or otherwise. You should not
place any undue reliance on any forward-looking statements.
FORWARD-LOOKING STATEMENTS
2

INTRODUCTION Joseph Tcheng Chairman

INTRODUCTION
• Leader in bus shelter advertising industry in China
• Operate over 57,000 panels
• Nationwide network in 25 cities
• Market share of more than 70% in key cities
• More than 400 sales personnel servicing both customers and their advertising agencies
4

FY19 RESULTS HIGHLIGHTS
5
(RMB’M) FY18
FY19 YOY%
Turnover 1,804 1,446 -20%
EBITDA 718.2 810.7 +13%
EBIT 353.4 68.7 -81%
Net profit/(loss) 221 (87) N/A
Basic EPS/(LPS)
(RMB)
0.4084 (0.1606) N/A
Final DPS (RMB) 0.17 -
• Challenging operating environment
• HKFRS 16 adoption impacting costs, profitability, assets and liabilities
• Excluding HKFRS 16 effect, EBITDA would have decreased by 57%
• Excluding HKFRS 16 effect, net loss would have been RMB44 million
FINANCIAL REVIEW Tony Lam Chief Financial Officer

FY19 CONSOLIDATED INCOME STATEMENT
(RMB’M) FY18 FY19 YOY%
Turnover 1,804 1,446 -19.8%
Cost of sales, excluding amortization 750 309 -58.8%
Operating expenditure, excluding depreciation & amortization
336 326 -2.8%
EBITDA 718 811 +12.9%
Depreciation & amortization 365 742 +103.4%
EBIT 353 69 -80.6%
Net profit / (loss) 221 (87) N/A
Basic EPS / (LPS) (RMB) 0.4084 (0.1606) N/A
7

COSTS & EXPENSES
(RMB’M) FY18 FY19 YoY%
Rental 487 42 -91.4%
Maintenance 136 163 +20.0%
Electricity 66 70 +7.2%
Sales & Cultural Tax 61 34 -45.4%
Direct operating costs 750 309 -58.8%
S, G & A & other expenses 336 326 -2.8%
Total costs & expenses, excluding depreciation & amortization
1,086 635 -41.5%
8
• Decrease in rental costs mainly due to HKFRS 16 adoption
• Increase in maintenance costs due to lack of subsidy from the minority shareholder of our China JV
• Increase in electricity costs due to increase in bus shelter panels powered by electrical networks
• Decrease in S, G & A & other expenses due to lower professional fees

TRADE AND LEASE RECEIVABLES
(RMB’M) Dec 31, 2018 Dec 31, 2019
Within 6 months 773 594
6 to 12 months 85 203
1 to 1.5 years 5 10
1.5 to 2 years
Over 2 years
-
-
1
-
Total trade and lease receivables, net 863 808
Turnover days (time wt. avg.)
116 days 138 days
9

CASH FLOWS
(RMB’M) FY18
FY19
YoY%
Net cash flows from operating activities 574 625 +8.9%
Net cash flows used in investing activities (363) (334) -7.9%
Net cash flows used in financing activities (75) (497) +560.8%
Net increase in cash & cash equivalents 136 (206) N/A
Net cash & cash equivalents
at the beginning of period 337 474
effect of foreign exchange rate changes, net 1 -
At the end of year 474 267 -43.6%
10

BUSINESS REVIEW Harrison Zhang Chief Operating Officer

2019 REVIEW
12
• Uncertainties in external environment plus China’s slowing economic growth resulted in slowing consumption growth
• Total outdoor media spending declined by 19.8 % vs 2018
• Revenue from E Commerce and IT clients declined by 44 % vs 2018
• Revenue from traditional industry customers increased
• Grew revenue in food, business & consumer services, financial industry, realty and transport
• Revamped Sales Organisation to increase efficiency & effectiveness
• Total number of advertising clients increased to 762 (671 in 2018)

REVENUE BY INDUSTRY
FY18 FY19
E-commerce 30% 24%
IT digital products 29% 17%
Food 5% 13%
Business /Consumer services 4% 7%
Entertainment 6% 7%
Financial industry 2% 6%
Realty 3% 6%
Beverages 5% 6%
Transport 2% 3%
Telecommunication 4%
3%
13
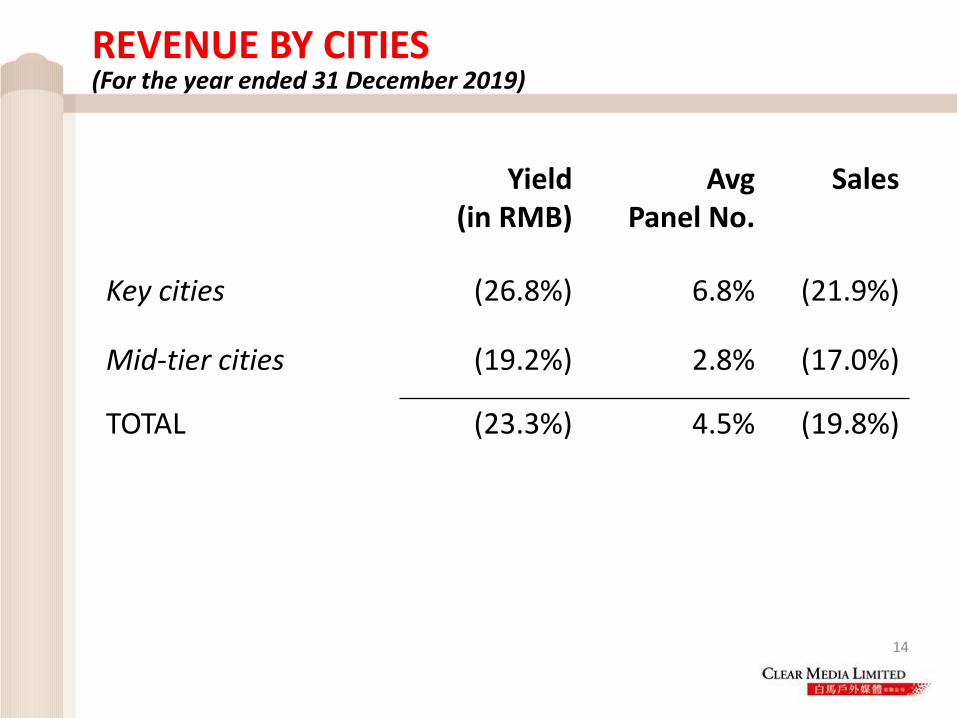
REVENUE BY CITIES
Yield (in RMB)
Avg Panel No.
Sales
Key cities (26.8%) 6.8% (21.9%)
Mid-tier cities (19.2%) 2.8% (17.0%)
TOTAL (23.3%) 4.5% (19.8%)
14
(For the year ended 31 December 2019)
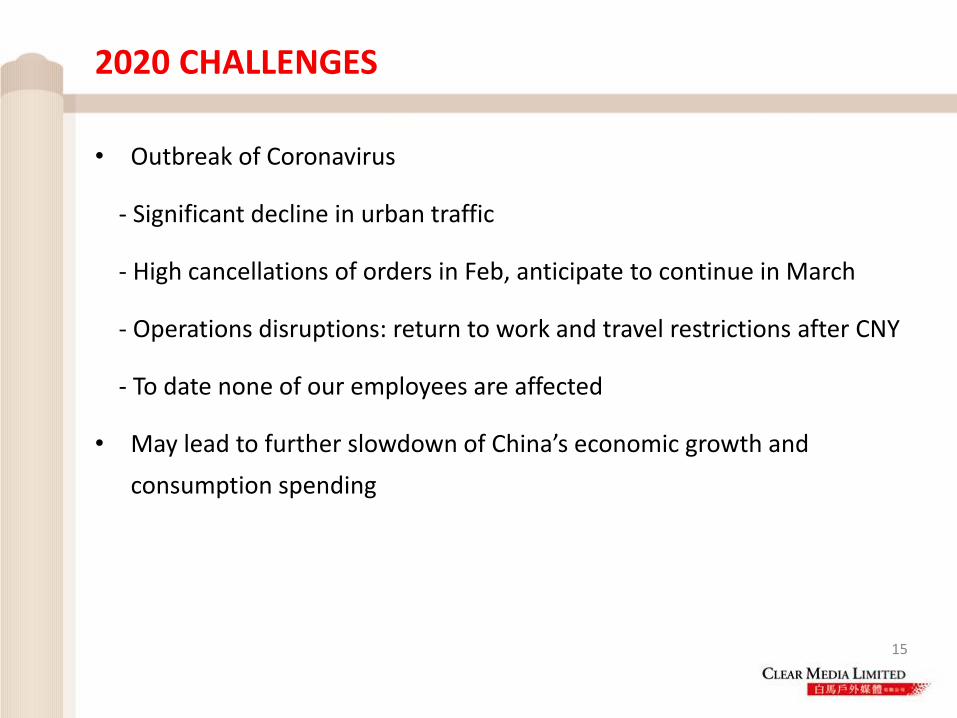
• Outbreak of Coronavirus
- Significant decline in urban traffic
- High cancellations of orders in Feb, anticipate to continue in March
- Operations disruptions: return to work and travel restrictions after CNY
- To date none of our employees are affected
• May lead to further slowdown of China’s economic growth and
consumption spending
2020 CHALLENGES
15

16
2020 STRATEGIES
• Adjust pricing in accordance with market conditions
• Intensify cost control measures – negotiate rent reductions
• Continue to broaden customer base
• Use mapping data tool for research & analysis
• Ready marketing & sales plans for eventual outdoor advertising market recovery
• Strict financial discipline on capital expenditure to maintain capital liquidity
• Test new digital technology
• Maintain high standards of internal control & compliance

17
2020 OUTLOOK
• Outbreak of Coronavirus could further slow China’s economic growth, negatively impact customers’ advertising spend
• Overall outdoor advertising market may be more challenging
• High order cancellations in February, anticipate to continue in March
• YTD February sales declined approximately 30% vs last year
• Actively implement strategies announced on 27 Feb 2020
• Company remains cautious about the operating environment in 2020

COOPERATIVE ADVERTISING WITH CUSTOMERS
• Examples from February / March • Messages of encouragement to win the war against
the Coronavirus
18

19

20
21

22

Annual Results Announcement 2019