annual report 2017files.shareholder.com/downloads/cmrg/5937450495x0x948148/... · distribution. the...
TRANSCRIPT

A N N U A L R E P O R T
2017

Dear Shareholders,
Despite the fact that the retail environment has been one of the most challenging in recent memory, we were very pleased with our continued growth in EBITDA and free cash flow in fiscal 2016. EBITDA grew nearly 35% and we were able to fund fully our DXL store expansion from free cash flow. Fiscal 2016 also marked a milestone year for our Company with the opening of our 200th DXL Men’s Apparel store.
Looking ahead, fiscal 2017 will be a year focused on customer acquisition, retention and reactivation. With over 200 DXL Men’s Apparel stores in operation, we now have the scale to reach every major market in the continental United States. We plan on leveraging the scale of our existing store base by elevating our marketing efforts and enhancing our digital engagement.
The start of fiscal 2017 was difficult from a top-line perspective, as the environment remained challenging across the retail sector. That said, we were pleased to experience acceleration in our business, registering positive comparable sales, which coincided with the reinstitution of our television advertising campaign that began on April 2nd. Aligned with our strategic initiative to grow our customer base, we are embarking on an aggressive marketing budget comprising a 40% increase over fiscal 2016, setting the stage for positive comparable sales for the balance of fiscal 2017.
Our 2017 Spring television campaign comprised ten weeks of airtime compared to six weeks last year and, although we anticipated associated lift in traffic and transactions, the response exceeded our expectations. Our marketing efforts are paying off. We are building brand awareness, driving new shoppers to the DXL Men’s Apparel brand, and our top line is trending positive. The Spring television ads will remain on air through Father’s Day; we are also committed to launching a Fall campaign that will run through the Holiday season, which compares favorably to no air time last year.
We continue to believe our greatest opportunity lies in the fact that 6 out of 10 big and tall guys still do not know the DXL Men’s Apparel brand. As a result, our top priority in 2017 is to drive brand awareness to acquire new customers, while retaining existing customers. We are attacking this opportunity with the combination of an aggressive recommitment to advertising and a redefining and improvement of our digital experience.
Under the leadership of our new Chief Digital and Information Officer, we are in the process of building an unparalleled digital experience that is aligned with today’s savvy and demanding consumer. We are committed to bringing our “white glove” store experience to our digital interactions. With our customer at the heart of every decision we make, we are evolving our digital platform to reduce transaction friction points. With that in mind, we are excited to be launching our DXL Men’s Apparel mobile app during the second quarter of fiscal 2017. The mobile app will be the first of many steps designed to deliver on our promise of providing an unparalleled experience across all channels of distribution. The e-commerce channel accounts for approximately 15% of our overall sales, and we expect our strategic initiatives to fuel solid channel growth this year.
We are in a unique position with a store fleet that affords us the scale to broadly reach customers, while also allowing us to leverage our already robust omni-channel capabilities. With
over 200 stores in operation, our DXL Men’s Apparel fleet represented 76% of the total company footprint at the end of fiscal 2016 and is expected to reach 80% by fiscal 2017 year-end. Our plan is to open approximately 20 new stores in fiscal 2017, down meaningfully from the 30 we opened in fiscal 2016. More importantly, the pace of openings will slow even more dramatically in fiscal 2018. We should also mention that we successfully opened two company-operated stores in Canada. These stores in the Toronto market are performing ahead of our expectations, with higher than expected levels of traffic and shopper conversion. Canada represents a strategic growth region for our brand and represents our number one export country, which bodes well for future growth. Our store growth plans are strategically and financially aligned with our goal of generating strong free cash flow, while continuing to expand the DXL Men’s Apparel brand reach.
Let us conclude by highlighting that, in March of 2017, our Board of Directors approved a $12 million share repurchase program. Noting that we are on track to generate positive free cash flow of $15 to $20 million in fiscal 2017, we plan to utilize a portion of that free cash flow to pay down debt and opportunistically repurchase shares in the open market. During the first quarter of fiscal 2017, we repurchased 670,000 shares of our stock, leaving $10.2 million remaining under the current authorization. We are off to a solid start in 2017, and look forward to reaping the benefits of our strategic initiatives as we further build awareness and attract new shoppers to the DXL Men’s Apparel brand.
Thanks to all associates for their dedication, hard work and commitment to DXLG and to you, our shareholders, for your continued support.
Sincerely,
David Levin President and CEO Destination XL Group, Inc.
Seymour Holtzman Executive Chairman of the Board Destination XL Group, Inc.

UNITED STATESSECURITIES AND EXCHANGE COMMISSION
WASHINGTON, D.C. 20549
FORM 10-KANNUAL REPORT PURSUANT TO SECTION 13 OR 15(d)
OF THE SECURITIES EXCHANGE ACT OF 1934For the fiscal year ended January 28, 2017
(Fiscal 2016)Commission File Number 01-34219
DESTINATION XL GROUP, INC.(Exact name of registrant as specified in its charter)
Delaware 04-2623104(State or other jurisdiction ofincorporation or organization)
(IRS EmployerIdentification No.)
555 Turnpike Street, Canton, MA 02021(Address of principal executive offices) (Zip Code)
(781) 828-9300(Registrant’s telephone number, including area code)
Securities registered pursuant to Section 12(b) of the Act:Title of each class Name of each exchange on which registered
Common Stock, $0.01 par value The NASDAQ Stock Market LLCSecurities registered pursuant to Section 12(g) of the Act:
None
Indicate by check mark if the registrant is a well-known seasoned issuer, as defined in Rule 405 of the Securities Act. Yes No
Indicate by check mark if the registrant is not required to file reports pursuant to Section 13 or Section 15(d) of the Act. Yes No
Indicate by check mark whether the registrant (1) has filed all reports required to be filed by Section 13 or 15(d) of the Securities Exchange Act of1934 during the preceding 12 months (or for such shorter period that the registrant was required to file such reports), and (2) has been subject to suchfiling requirements for the past 90 days. Yes No
Indicate by check mark whether the registrant has submitted electronically and posted on its corporate Web site, if any, every Interactive Data Filerequired to be submitted and posted pursuant to Rule 405 of Regulation S-T (§232.405 of this chapter) during the preceding 12 months (or for suchshorter period that the registrant was required to submit and post such files). Yes No
Indicate by check mark if disclosure of delinquent filers pursuant to Item 405 of Regulation S-K(§229.405 of this chapter) is not contained herein,and will not be contained, to the best of the registrant’s knowledge, in definitive proxy or information statements incorporated by reference in Part IIIof this Form 10-K or any amendment to this Form 10-K.
Indicate by check mark whether the registrant is a large accelerated filer, an accelerated filer, a non-accelerated filer, or a smaller reporting company.See the definitions of “large accelerated filer,” “accelerated filer” and “smaller reporting company” in Rule 12b-2 of the Exchange Act.Large accelerated filer Accelerated filer
Non-accelerated filer (Do not check if a smaller reporting company) Smaller reporting company
Indicate by check mark whether the registrant is a shell company (as defined in Rule 12b-2 of the Act). Yes No
As of July 30, 2016, the aggregate market value of the Common Stock held by non-affiliates of the registrant was approximately $121.6 million,based on the last reported sale price on that date. Shares of Common Stock held by each executive officer and director and by each person who owns10% or more of the outstanding Common Stock have been excluded on the basis that such persons may be deemed to be affiliates. Thisdetermination of affiliate status is not necessarily determinative for other purposes.The registrant had 49,988,655 shares of Common Stock, $0.01 par value, outstanding as of March 17, 2017.
DOCUMENTS INCORPORATED BY REFERENCEPortions of the Proxy Statement for the 2017 Annual Meeting of Stockholders are incorporated by reference into Part III.

2
DESTINATION XL GROUP, INC.
Index to Annual Report on Form 10-KYear Ended January 28, 2017
Page
PART I
Item 1. Business .......................................................................................................................................................................... 3
Item 1A. Risk Factors .................................................................................................................................................................... 12
Item 1B. Unresolved Staff Comments........................................................................................................................................... 19
Item 2. Properties ........................................................................................................................................................................ 19
Item 3. Legal Proceedings........................................................................................................................................................... 21
Item 4. Mine Safety Disclosures ................................................................................................................................................. 21
PART II
Item 5. Market for Registrant’s Common Equity, Related Stockholder Matters and Issuer Purchases of Equity Securities .... 22
Item 6. Selected Financial Data .................................................................................................................................................. 24
Item 7. Management’s Discussion and Analysis of Financial Condition and Results of Operations......................................... 27
Item 7A. Quantitative and Qualitative Disclosures About Market Risk ....................................................................................... 41
Item 8. Financial Statements and Supplementary Data .............................................................................................................. 42
Item 9. Changes in and Disagreements with Accountants on Accounting and Financial Disclosure ........................................ 71
Item 9A. Controls and Procedures ................................................................................................................................................. 71
Item 9B. Other Information ........................................................................................................................................................... 72
PART III
Item 10. Directors, Executive Officers and Corporate Governance ............................................................................................. 73
Item 11. Executive Compensation ................................................................................................................................................ 73
Item 12. Security Ownership of Certain Beneficial Owners and Management and Related Stockholder Matters ...................... 73
Item 13. Certain Relationships and Related Transactions, and Director Independence ............................................................... 73
Item 14. Principal Accounting Fees and Services ........................................................................................................................ 73
PART IV
Item 15. Exhibits, Financial Statement Schedules ........................................................................................................................ 74
Item 16. Form 10-K Summary .................................................................................................................................................... 74
Signatures ....................................................................................................................................................................... 79

3
PART I.
Certain statements contained in this Annual Report on Form 10-K (this “Annual Report”) constitute “forward-looking statements,”including forward-looking statements within the meaning of the Private Securities Litigation Reform Act of 1995. In some cases,forward-looking statements can be identified by the use of forward-looking terminology such as “may,” “will,” “estimate,” “intend,”“plan,” “continue,” “believe,” “expect” or “anticipate” or the negatives thereof, variations thereon or similar terminology. Theforward-looking statements contained in this Annual Report are generally located under the headings “Business” and “Management’sDiscussion and Analysis of Financial Condition and Results of Operations,” but may be found in other locations as well, and includestatements regarding cash flows, gross profit margins, store counts, capital expenditures, sales and earnings expectations for fiscal2017 and beyond. These forward-looking statements generally relate to plans and objectives for future operations and are based uponmanagement’s reasonable estimates of future results or trends. The forward-looking statements in this Annual Report should not beregarded as a representation by us or any other person that the objectives or plans of the Company will be achieved. Numerous factorscould cause our actual results to differ materially from such forward-looking statements, including, without limitation, risks relating tothe execution of our corporate strategy and ability to grow our market share and those risks and uncertainties, set forth below underItem 1A, Risk Factors. Readers are encouraged to review these risks and uncertainties carefully.
These forward-looking statements speak only as of the date of the document in which they are made. We disclaim any obligation orundertaking to provide any updates or revisions to any forward-looking statement to reflect any change in its expectations or anychange in events, conditions or circumstances in which the forward-looking statement is based.
Item 1. Business
Destination XL Group, Inc., together with our subsidiaries (the “Company”), is the largest specialty retailer of big & tall men’sapparel with retail and direct operations in the United States and London, England. We operate under the trade names of DestinationXL®, DXL®, DXL outlets, Casual Male XL®, Casual Male XL outlets, Rochester Clothing, ShoesXL® and LivingXL®. We operate 192DXL retail stores, 13 DXL outlet stores, 97 Casual Male XL retail stores, 36 Casual Male XL outlet stores and 5 Rochester Clothingstores. Our direct business includes our DestinationXL.com and bigandtall.com e-commerce sites which support our stores, brands andproduct extensions. Unless the context indicates otherwise, all references to “we,” “our,” “ours,” “us” and “the Company” refer toDestination XL Group, Inc. and our consolidated subsidiaries. We refer to our fiscal years ended January 28, 2017, January 30, 2016and January 31, 2015 as “fiscal 2016”, “fiscal 2015” and “fiscal 2014,” respectively.
OUR INDUSTRY
We believe that the men’s big & tall apparel market, which includes pants with a waist size of 42” and greater, as well as tops sized1XL and greater, generates approximately $3.5 billion to $4.0 billion in sales annually and represents approximately 11% of theoverall men’s apparel business. Growth in this segment has historically been driven by rapidly changing market demographics. Weestimate that our market share in fiscal 2016 was approximately 12%. We believe that we can increase our market share by catering tothe broader target market, attracting customers from various income, age and lifestyle segments and offering the widest selection ofsizes and styles that fit well. An opportunity also exists for market share growth from the lower-size range of our market, that is, menin the 38”-46” waist size. These sizes are usually at the high end of the size range for most retailers and, as a result, the selection isusually limited at such retailers.
HISTORY
Our Company was incorporated in the State of Delaware in 1976 under the name Designs, Inc. Until fiscal 1995, we operatedexclusively in Levi Strauss & Co. branded apparel mall and outlet stores. In May 2002, we acquired the Casual Male business fromCasual Male Corp. at a bankruptcy court-ordered auction. At the time of the acquisition, Casual Male was the largest specialty retailerof men’s clothing in the big & tall market in the United States. As a result of the acquisition, on August 8, 2002, we changed our nameto “Casual Male Retail Group, Inc.”
Through fiscal 2010, we primarily operated Casual Male XL retail stores, Casual Male XL outlet stores and Rochester Clothing stores,along with the associated websites and catalogs. We catered to all customers through these three store formats, from our value-oriented customer (Casual Male XL outlets) to our luxury-oriented customer (Rochester Clothing stores). During that year, we tested anew store concept, Destination XL (“DXL”). The DXL store concept merged all of our existing brands under one roof, offering ourcustomers a superior shopping environment with an extensive assortment of product and an increased presence of name brands,without having to shop multiple stores. In addition to offering our customers a wide assortment, we also wanted to provide them withan outstanding and unique shopping experience. We are focused on providing outstanding customer service through our DXL stores,with everything from larger fitting rooms to professional, trained associates providing both personal attention and on-site tailoring.With the initial success of this store format, we then made a similar change to our e-commerce business in fiscal 2011 when we

4
launched our DestinationXL.com website which, like our DXL store, merged all of our previous websites into one consolidated e-commerce site providing our customers the ability to cross-shop our brands easily.
As part of our new direction, in December 2012, we changed our NASDAQ stock ticker symbol to “DXLG” followed by a change inFebruary 2013 of our corporate name to “Destination XL Group, Inc.”
BUSINESS STRATEGY
In fiscal 2012, we began the transition from our Casual Male XL retail and Rochester Clothing stores to our DXL store format.Initially, we envisioned that this transition would take three years. Based on the performance of the initial DXL stores, we acceleratedthe pace in fiscal 2013, closing over 100 Casual Male XL and Rochester Clothing stores and opening 51 DXL stores. This acceleratedpace created unexpected hurdles for us in converting our existing customer base to the new DXL stores, which negatively impactedour sales. As a result, in fiscal 2014, we opted to revise our strategy to slow the pace of our transition to take advantage of ourexisting Casual Male XL stores to help transition our customer base. We also introduced a smaller DXL store format, which hasallowed us to penetrate smaller markets that we originally thought were too small for a DXL store, and a DXL outlet store format. Infiscal 2015, we completed a market opportunity study of our existing store portfolio, including the smaller DXL store format andoutlet store format, and believe that there is opportunity for additional growth beyond what was initially identified when we began therollout in fiscal 2012.
During fiscal 2016, we opened our 200th store and, at fiscal year end, we had 192 DXL stores and 13 DXL outlet stores, with a DXLpresence in every major metropolitan market in the continental United States.
With the bulk of the Casual Male XL to DXL store transition behind us, in addition to our efforts to maintain the strong in-storeexperience which our customers enjoy, we are now focusing our efforts on improving traffic to our stores and growing our e-commerce business with emphasis on increasing brand awareness and our customer base. Based on a market study we commissionedin 2016, 6 out of 10 potential customers do not know who we are. We also experienced a slight decrease in our brand awareness infiscal 2016 and a decrease in store traffic in the second half of fiscal 2016, which may have resulted in part from our decision not toconduct a Fall/holiday media marketing campaign. As a result, in fiscal 2017, we will be revitalizing our marketing program, througha combination of media and digital strategies, including efforts to improve communications with our existing customers throughpersonalization and more targeted mailings. We expect to increase our marketing spend in fiscal 2017 to help create and drive trafficto our stores and e-commerce sites.
While we believe market opportunity exists to support a strategy of opening 30-40 DXL stores per year, given the current weakness inthe retail environment, we are taking a more measured approach to store growth in fiscal 2017. In some markets, where a Casual MaleXL store performs well, we may look to extend its lease on a short-term basis instead of replacing it with a DXL store at expiration,allowing us time to secure the right location for a DXL store. As such, we currently expect to open 19 DXL retail stores and 1 DXLoutlet store in fiscal 2017. We currently anticipate that beyond fiscal 2017, we will continue to open stores at a slower pace for theforeseeable future.
International Growth
In addition to our Rochester Clothing store located in London, England, we also have one franchised DXL store in the Middle East atthe Symphony Mall in Kuwait City, Kuwait, which was opened in fiscal 2014 pursuant to a franchise agreement with The StandardArabian Business & Enterprises Company (SABECO).
Based on our experience to date, we believe that the international big & tall market is currently underserved and, based on the successof our DXL concept in the U.S. and the positive customer response for our Kuwait City franchised store, we see an opportunity forgrowth internationally in the future.
In the spring of fiscal 2017, we are opening two DXL stores in Toronto, Canada. These will be the first DXL brand stores operated bythe Company outside of the United States.
OUR BUSINESS
We operate as an omni-channel retailer. Through our multiple brands, which include both branded apparel and private-label, we offera broad range of merchandise at varying price points, catering from the value-oriented customer to the luxury-oriented customer. Ourobjective is to appeal to all of our customers by providing a good, better, best array of product assortments in all primary lifestyleswith multiple and convenient ways to shop.

5
Our DXL stores cater to all income demographics and offer our customers merchandise in all lifestyles from casual to business, youngto mature, in all price ranges and in all large sizes from XL and up. Our Casual Male XL stores primarily carry moderately pricedbranded and private label casual sportswear and dresswear, while our Rochester Clothing stores carry fine quality, designer andbranded menswear. We also operate Casual Male XL outlets and DXL outlets for our value-oriented consumer. In addition to ourstores, we operate our Destination XL e-commerce site which is similar to our DXL store concept and offers a brand range ofmerchandise at each price point, including a complete offering of shoes.
Another critical part of our business operation is managing the number of sizes offered to our customers and optimizing our in-stockposition throughout each season. Our best-selling pant has 57 size combinations as compared to an average retailer who may onlyhave 15 different size combinations. We maintain a consolidated inventory across all channels which enables us to manage our in-stock position of all sizes effectively, ultimately improving customer service. Moreover, our planning and allocation methodologies,with respect to store assortment planning, help to optimize each location’s market potential without excessive inventory levels.
MERCHANDISE
A vital component of our business strategy is to offer our customers a broad assortment of apparel that is appropriate to our diversecustomer base. Regardless of our customers’ age, socioeconomic status, or lifestyle preference, we are able to assemble a wardrobe tofit our customers’ apparel needs. In addition, we offer such assortments in private-label product, balanced with an array of brand namelabels. With over 5,000 styles available, we carry tops in sizes up to 8XL and 6XLT, bottoms with waist sizes 38” to 66”, and shoes insizes 10W to 18. In addition, we added to our product assortment a smaller fit XL and XLT to appeal to our target “end-of-rack”customer.
Our stores are merchandised to showcase entire outfits by lifestyle, including traditional, active, denim, dress wear and contemporary.This format allows us to merchandise key items and seasonal goods in prominent displays and makes coordinating outfits easier forthe customer while encouraging multi-item purchases. This lifestyle layout also allows us to manage store space more effectively ineach market to target local demographics. The key item strategy is also fully integrated by lifestyle, allowing us to focus onmerchandise presentation and offer our customers a compelling value proposition.
Merchandise assortments in our DXL stores are organized not only by lifestyle, but within each lifestyle, the assortments are shown ina “good”, “better”, “best” and “luxury” visual presentation, again to benefit our customers’ ease of shopping. With the “best”merchandise assortments featured most prominently in the DXL store, our customers are able to visualize current fashion trends andeasily select their wardrobes within their desired price points in a convenient manner.
We carry several well-known national brands of merchandise as well as a number of our own private-label lines within our “good”,“better”, “best” and “luxury” price points. The penetration of branded apparel in our DXL stores can range from 15% to 80%,depending on several factors, but on average, our DXL stores carry approximately 47% branded merchandise.
Higher-End Luxury Fashion Apparel -“Best” and “Luxury” Merchandise
Within this higher-end price range, we carry a broad selection of quality apparel from well-known branded manufacturers such asBogosse®, Brooks Brothers®,Gran Sasso, John Laing®,Remy, Psycho Bunny®, Derek Rose, Brioni®, Coppley, Eton®, HickeyFreeman®, Jack Victor®, Lucky, Michael Kors®, Pantherella®, Paul & Shark, JOE’S® Jeans, Robert Graham®, Robert Talbot, St.Hillaire, Ted Baker®, Tulliani, True Religion®, Turnbull & Asser® and David Donahue.
Moderate-Priced Apparel -“Better” Merchandise
We offer our customer an extensive selection of quality sportswear and dress clothing at moderate prices carrying such well-knownbrands such as: Junk Food®, Rainforest, Brooks Brothers®, O’Neill®, Retro Brand, Cutter & Buck®, Levis®, Adidas® Golf, Columbia,Berne®, Carhartt®, Callaway®, CK Jeans®, CK Sport®, Jockey®, Lacoste®, Majestic, Polo Ralph Lauren®, Tommy Bahama®, TommyHilfiger®, Tallia® and Trafalger®.
In addition, we carry several private-label lines:
Twenty Eight Degrees™ is targeted as a contemporary/modern line offering sportswear and loungewear.
Society of One is a jeanswear brand catering to the needs of the fashion denim customer.
Rochester is a line that targets traditional luxury styles. We also offer a complete selection of sportcoats, dress shirts andneckwear under our Rochester Black Label private label.
6
Value-Priced Apparel -“Good” Merchandise
For our value-oriented customers, we carry Geoffrey Beene®, Cubavera, Nautica® and Nautica Jeans®, Dockers, Lee, Perry Ellis,Wrangler, Reebok and PX Clothing. In addition we carry several private label lines:
Harbor Bay® was our first proprietary brand and it is a traditional line which continues to represent a significant portion ofour business, specifically in terms of our core basic merchandise.
Gold Series™ is our core performance offering of tailored-related separates, blazers, dress slacks, dress shirts and neckwearthat blends comfort features such as stretch, stain resistance and wrinkle-free fabrications with basic wardrobe essentials.
Synrgy™ targets the customer looking for a contemporary/modern look.
Oak Hill® is a premier line catering to those customers looking for slightly more style and quality than our Harbor Bay linebut still in a traditional lifestyle.
True Nation® is a denim-inspired line consisting of vintage-screen t-shirts and wovens and is geared towards our youngercustomers.
Island Passport® is an island-inspired line of camp shirts, printed woven shirts and relaxed island-inspired pants.
RETAIL CHANNEL
Destination XL stores (“DXL”)
Our DXL store concept brings all of our brands together in one format. Within this format, we can cater to our very diverse customergroup, with merchandise representing all price points, from our luxury brands to value-oriented brands, and all lifestyles, frombusiness to denim. The size of our current DXL stores, which contain almost triple the product assortments of a Casual Male XLstore, currently averages 8,000 square feet, but is expected to decrease closer to 7,500 square feet as we open future DXL stores. Asdiscussed above, in fiscal 2014, we began opening smaller (5,000-6,500 square feet) DXL stores. Because the size of these stores issmaller, they carry a smaller product offering than our other DXL stores but are representative of the “good, better, best” merchandisevariety. The locations of our DXL stores are also an essential aspect of our roll-out. We seek locations where our stores are highlyvisible, preferably adjacent to regional malls or other high-traffic shopping areas.
With our larger DXL store format, we are able to provide our customers a spacious store with up to three times the product offering ofa Casual Male XL store. The merchandise in our DXL stores is organized by lifestyle: active, traditional, modern and denim with arepresentation of all of our brands and price points, utilizing a “good, better, best” pricing structure. Depending on the customers ineach respective market, we can adjust the appropriate mix of merchandise, with varying selections from each of our price points, tocater to each demographic market. This larger store format also provides us the footprint necessary to carry a complete offering ofdress wear, including tailored and “made-to-measure” custom clothing, as well as a selection of shoes in extended sizes and a broadassortment of accessories such as belts, ties, and socks.
During fiscal 2016, we opened 26 DXL retail stores and 4 DXL outlet stores, bringing our store count at January 28, 2017 to 192 DXLretail stores and 13 DXL outlet stores. For fiscal 2016, the average sales per square foot for our DXL retail stores increased to $180 ascompared to $177 for fiscal 2015 and $165 for fiscal 2014. Once a DXL store matures, which we believe is five years, we expect saleswill be approximately $200-220 per square foot. For fiscal 2016, we had 49 DXL retail stores that had sales greater than $200 persquare foot. For fiscal 2017, we plan to open 19 DXL retail stores and 1 DXL outlet store resulting in approximately 225 DXL retailand outlet stores operating at the end of fiscal 2017.
Casual Male XL retail stores
At January 28, 2017, we operated 97 Casual Male XL full-price retail stores, located primarily in strip centers, power centers or stand-alone locations. The majority of the merchandise carried in our Casual Male XL stores is moderate-priced basic or fashion-neutralitems, such as jeans, casual slacks, t-shirts, polo shirts, dress shirts and suit separates. These stores also carry a full complement of our“better” private label collections. The average Casual Male XL retail store is approximately 3,500 square feet.
DXL outlet /Casual Male XL outlet stores
At January 28, 2017, we operated 36 Casual Male XL and 13 DXL outlet stores designed to offer a wide range of casual clothing forthe big & tall customer at prices that are generally 20-25% lower than our moderate-priced merchandise. Much of the merchandise inour outlet stores is offered with the purchasing interests of the value-oriented customer in mind. In addition to private-label andbranded merchandise at our “good” price tier, our outlets also carry clearance product obtained from DXL, Casual Male XL andRochester Clothing stores, offering the outlet customer the ability to purchase branded and fashion product for a reduced price. As we

7
open our DXL stores, we expect the mix of branded product flowing into the outlets to increase to approximately 30% as we moveinventory out of our DXL stores to keep it current while enhancing the branded presence in our outlets.
The average Casual Male XL outlet store is approximately 3,100 square feet and the average DXL outlet is approximately 5,000square feet.
Rochester Clothing stores
At January 28, 2017, we operated 5 Rochester Clothing stores, located in major cities in the United States and one store in London,England. The Rochester Clothing stores have a wide selection of our “best” merchandise which consists primarily of high-endmerchandise from well-recognized brands. In addition, the stores also carry a few private-label lines especially designed for our high-end customer. The average Rochester Clothing store is approximately 10,000 square feet. Although some of our Rochester Clothingstores will close over the next few fiscal years as we open DXL stores in the same geographical market, we currently expect that 3 ofour high-traffic Rochester Clothing stores will remain open.
DIRECT CHANNEL
Our direct business, which consists primarily of our e-commerce business, is a vital part of our growing omni-channel businessapproach, allowing us to service our customers whether it be in-person at a store, over the telephone, or online via a computer,smartphone or tablet. Our direct business bridges that gap for us by encouraging and expecting our store associates to use our e-commerce sites to help fulfill our customers’ clothing needs. If a wider selection of a lifestyle, color or size of an item is not availablein our store, then our store associates can order the item for our customer through our direct channel and have it shipped to the store ordirectly to the customer. Our customers also have the ability to order online and pick-up in store on the same day.
With the ability to showcase all store inventories online, we are seeing an increase in the number of transactions that are initiatedonline but are ultimately completed in store. Until fiscal 2014, our direct customer was limited to inventory available in ourcentralized distribution center but we can now fulfill from the store an item that is out-of-stock in our warehouse. This capability hasnot only resulted in incremental sales, but it has also helped us reduce clearance merchandise at the store level and improve long-termmargins.
Destination XL® E-Commerce Site
In fiscal 2013, we combined all of our then-existing web addresses: www.casualmalexl.com, www.rochesterclothing.com,www.btdirect.com, www.livingxl.com and www.shoesxl.com and redirected our users to our new comprehensive Destination XLwebsite. Similar to our DXL store concept, our www.destinationxl.com website allows our customers to shop across all of our brandsand product extensions with ease and brings all of our customers to one website. Our customers were previously classified as a“Rochester” customer or a “Casual Male” customer. Now, our customers are all “DXL” customers, which no longer limits acustomer’s ability to access our full product assortment.
From the Destination XL homepage, customers can search across all of our brands and, similar to our stores, shop merchandise fromvalue-oriented to luxury price points. In addition, a customer can tailor their search using our “size profile.” Our Destination XLwebsite also offers a complete line of men’s footwear in extended sizes, offering our customers a full range of footwear in hard-to-findsizes. Although our DXL stores all have a selection of footwear available, we are able to offer a full assortment of sizes and stylesthrough our website. The assortment is a reflection of our apparel, with a broad assortment from moderate to luxury and from casualto formal. We currently have a selection of more than 600 styles of shoes, ranging in sizes from 10W to 18M and widths up to 6E. Wecarry a number of designer brands including Cole Haan®, Allen Edmonds®, Timberland®, Calvin Klein®, Lacoste®, Donald J. Plinerand Bruno Magli®.
In addition to our Destination XL website, our customers can also access our LivingXL website directly from our homepage.LivingXL is an online-only store that specializes in the selling of select high-quality products which help larger people maintain amore comfortable lifestyle. The types of products sold on our website benefit both men and women and include chairs, outdooraccessories, travel accessories, bed and bath and fitness equipment.
In recent years, we have seen a significant increase in the number of visitors to our websites from a mobile device. Our mobileoptimized website, m.destinationxl.com, helps our customers browse products, checkout, access our loyalty program information,research inventory in a local store, and find a local store location. For our international customers, upon entering our full site, thesevisitors are identified based on where they reside globally and are able to shop in their local currency. In addition, checkout iscustomized based on their location, with local payment methods and a guaranteed cost including shipping and taxes. In fiscal 2016, welaunched an effort to ensure that our websites are accessible to the visually impaired. We also launched t.destinationxl.com, an

8
optimized site for tablet visitors to provide an improved shopping experience for all our DXL online visitors, regardless of the devicethey are using.
BigandTall.com
Our www.bigandtall.com website is separate from our Destination XL site and caters to a value-oriented customer, exclusivelyoffering an assortment of promotional and clearance merchandise.
MERCHANDISE PLANNING AND ALLOCATION
Our merchandise planning and allocation area is critical to the effective management of our inventory, store assortments, product sizesand overall gross margin profitability. The merchandise planning and allocation team has an array of planning and replenishment toolsavailable to assist in maintaining an appropriate level of inventory, in-stock positions at the store and for the direct channel, and pre-season planning for product assortments for each store and the direct channel. Additionally, in-season reporting identifiesopportunities and challenges in inventory performance. Over the past several years, we have made investments in implementing bestpractice tools and processes for our merchandise planning and allocation.
Our core basic merchandise makes up over 40% of our “better” assortment and over 20% of our “best” assortment. Our planning andallocation team estimates quantity and demand several months in advance to optimize gross margin and minimize end-of-seasonmerchandise for all seasonal merchandise. We have implemented an omni-channel approach towards our assortment planningmethodology that customizes each store’s assortment to accentuate lifestyle preferences for each store.
Our merchandising data warehouse provides the merchandising team with standardized reporting for monitoring assortmentperformance by product category and by store, identifying in-stock positions by size and generally monitoring overall inventory levelsrelative to selling. At season end, we analyze the overall performance of product categories, overall assortments and specific styles bystore to focus on the opportunities and challenges for the next season’s planning cycle.
During each season, we utilize a markdown optimization tool to monitor the selling performance of our fashion assortments andcompare against the planned selling curves. When actual selling performance significantly drops below planned selling curves, wemake in-season pricing adjustments so that we maintain planned levels of residual fashion product at season’s end.
Utilizing a set of specific universal reporting tools, we are able to fulfill the daily, weekly and monthly roles and responsibilities of themerchandise planning and allocation team. These reporting tools provide focused and actionable views of the business to optimize theoverall assortment by category and by store. We believe that by having all members of the merchandise planning and allocation teamfollow a standardized set of processes with the use of standardized reporting tools, our inventory performance will be optimized.
STORE OPERATIONS
We believe that our store associates are the key to creating the highest quality experience for our customer. Over the past severalyears, we have extensively worked to change the culture in our stores from an operationally-driven organization to a sales-driven,customer-centric organization. Our overall goal is to assist our associates in becoming less task-oriented and more focused on servingthe customer. We want our associates to help our customer meet his apparel needs through building his wardrobe; not just selling ourcustomer a single item. In order to accomplish this, we have invested in educating our associates. Our associates have been trained tobe clothing experts, capable of accommodating our customer’s style and fit needs with ready-to-wear clothing. Our stores offer on-sitetailoring in order to assist customers in receiving a perfect fit. Our training approach provides product knowledge as well as behavioraltraining. A key component to the success of this program is finding the right caliber of store associates. Our multi-unit, fieldmanagement team receives extensive training on recruiting associates with the correct fit for our stores. Our new DXL storemanagement team hires are enrolled in a training program with time spent in one of our two regional training centers.
Each new store management team member spends time in a DXL store, working with certified training managers to solidify theirtraining before they are released to their “home” store. This allows each new store management team to apply the skills learnedduring training to successfully managing their respective stores.
We are able to gauge the effectiveness of our training through measuring sales productivity at each level of the field organization,including individual sales associates. We believe these educational programs, together with monitoring sales metrics to help identifyopportunities for further training, will improve sales productivity and strengthen our customer’s brand loyalty.
Each DXL, Casual Male XL and Rochester Clothing store is staffed with a store manager, assistant managers and associates. The storemanager is responsible for achieving certain sales and operational targets. Our DXL, Casual Male XL and Rochester Clothing stores

9
have an incentive-based commission plan for managers and selling staff to encourage associates to focus on our customer’swardrobing needs and sales productivity. Our field organization of stores strives to promote from within; a culture that has beenbuilding for 7 years, with approximately 90% of the field organization’s multi-unit managers having managed one of our retailstores.
Our field organization is overseen by our Chief Sales Officer (Senior Vice President of Store Sales & Operations) and Regional SalesManagers, who provide management development and guidance to individual store managers. Each Regional Sales Manager isresponsible for hiring and developing store managers at the stores assigned to that Regional Sales Manager’s market, and for theoverall operations and profitability of those stores.
MARKETING AND ADVERTISING
We believe marketing and advertising are key drivers to increase brand awareness, and thereby increase traffic to our stores. Ourmarketing focus is on increasing the awareness of our DXL brand so that shoppers think of us when they decide to purchase men’s XLclothing or accessories. With only 4 out of every 10 men knowing who we are, we believe we have an opportunity to build ourcustomer base and increase market share. During fiscal 2016, we saw our brand awareness drop to 34% from 38% in fiscal 2015. Webelieve that our $5.4 million decrease in marketing spend in fiscal 2016 may have contributed to this drop in awareness. Due to theweakness we saw in the retail market and the lack of store traffic we started to see in September 2016, we decided not to run theFall/Holiday media campaign and instead shifted some of those funds to digital advertising. In fiscal 2017, we will be reinvesting inour marketing initiatives, increasing our marketing spend consistent with previous levels. We expect that our marketing program forfiscal 2017 will include two media campaigns; our Spring campaign, which runs up to Father’s Day, and the return of a Fall/Holidaycampaign. In the short-term, for Spring 2017 we will be reusing an older commercial which was the most productive of our previouscampaigns in driving traffic and appears to resonate more with our existing customer.
For fiscal 2016, our active customer count decreased by 2.5%. In fiscal 2017, in addition to adding back media to aid in growing thecustomer count, we plan to focus more aggressively on customer retention and reactivation programs. Our DXL retail stores haveexperienced a 28% higher retention rate of customers than our Casual Male XL retail stores. As we open more DXL retail stores andclose more Casual Male XL retail stores, we expect that our overall retention rate will continue to improve, but we will be seeking toimprove the retention rates in all store formats.
In addition to growing the active customer base within DXL stores, we also see opportunity for growth with our “end-of-rack”customer who is defined as a customer with a 38 to 46 inch waist. For fiscal 2016, the “end of rack” segment contributed twice asmuch in revenue per customer as consumers with waist sizes above 46 inches and visited us 52% more often than consumers withwaist sizes 48 inches and above.
As we close more of our Casual Male XL stores in fiscal 2017, we will continue our efforts to increase awareness of the DXL brandand convert Casual Male XL customers to our DXL stores. Our focus will continue to be on transitioning our best Casual Male XLcustomers first, followed by other very active, high-sales-contributing tiers of customers. For DXL stores opened in existing CasualMale XL markets, between fiscal 2010 and fiscal 2015, we have converted 51% of our Casual Male XL’s customers to these DXLstores by the end of fiscal 2016. This figure is up from 45% at the start of fiscal 2016.
In fiscal 2016, we decreased our marketing costs by $5.4 million from fiscal 2015. For fiscal 2017, we will be increasing ourmarketing spend to approximately $25.0 million, similar with levels in fiscal 2014 and fiscal 2015, as compared to $18.2 million forfiscal 2016.
GLOBAL SOURCING
We have strong experience in sourcing internationally, particularly in Asia, where we manufacture a significant percentage of ourprivate-label merchandise. We have established relationships with some of the leading and specialized agents and factories. Oursourcing network consists of over 50 factories in 6 countries. Currently, approximately 61% of all our product needs are sourceddirectly.
Our global sourcing strategy is a balanced approach considering quality, cost and lead time, depending on the requirements of theprogram. We believe our current sourcing structure is sufficient to meet our operating requirements and provide capacity for growth.The growth and effectiveness of our global direct sourcing program is a key component to our continued merchandise marginimprovement.
In an effort to minimize foreign currency risk, all payments to our direct sourced vendors and buying agents are made in U.S. dollarsthrough the use of letters of credit or payment on account.

10
DISTRIBUTION
All of our distribution operations are centralized at our headquarters located in Canton, Massachusetts. However, if merchandise isavailable at the store level but not available at the distribution center, our stores are capable of completing the order and shipping itdirectly to a customer.
We believe that having one centralized distribution facility minimizes the delivered cost of merchandise and maximizes the in-stockposition of our stores. We believe that the centralized distribution system enables our stores to maximize selling space by reducingnecessary levels of back-room stock carried in each store. In addition, the distribution center provides order fulfillment services forour e-commerce business.
Since 2003, we have utilized United Parcel Services (“UPS”) for all of our store shipments as well as our domestic customerdeliveries. By utilizing UPS, we are able to track all deliveries from the warehouse to our individual stores, including the status of in-transit shipments. In addition, we are able to provide our Direct-to-Consumer customers with Authorized Return Service and Weblabels, making returns more convenient for them. Our current contract with UPS is through January 5, 2020.
In order to service our International customers, we have partnered with a global e-commerce company for payment and shipmentservices. Through this service, international customers view and pay for products in their local currency. Our partner then shipsdirectly to our customer, which we believe helps avoid potential fraud and currency exchange rate risks.
Our warehousing application for our distribution center systems streamlines our distribution processes, enhances our in-transit times,and reduces our distribution costs substantially. Over the past several years, we have made improvements to our software such asautomated packing for single piece orders, barcode scanning technologies and scanning technologies for our sortation systems, inorder to improve productivity and to lower packing costs.
Our supply chain technology provides visibility for imports, giving our buyers accurate shipping information and allowing thedistribution center to plan staffing for arriving freight, resulting in reduced costs and improved receipt efficiency. In fiscal 2017, weplan on improving the domestic routing process by converting from a paper-based to a web-based system that will also help usoptimize our domestic inbound transportation costs.
In-bound calls for our direct businesses are currently handled at our Canton facility and are primarily fulfilled by our distributioncenter. If an order cannot be fulfilled by our distribution center, the order is completed at the store level.
MANAGEMENT INFORMATION SYSTEMS
The infrastructure of our management information systems has consistently been a priority to us. We believe that the investments wehave made in this regard have improved our overall efficiency and most importantly have enabled us to manage our inventory moreeffectively.
Our management information systems consist of a full range of retail merchandising and financial systems which include merchandiseplanning and reporting, distribution center processing, inventory allocation, sales reporting, and financial processing and reporting.We believe that our current infrastructure provides us the ability and capacity to process transactions more efficiently and provides ourmanagement team with comprehensive tools with which to manage our business.
Our business is supported by a POS business application that captures daily transaction information by item, color and size. The POSsystem includes a multitude of features including CRM tools that enable us to track customer buying habits and provides us with theability to target customers with specific offers and promotions.
Using a retail business intelligence solution, we are able to integrate data from several sources and provide enterprise-wide analyticsreporting. Over the past few years, we have developed a custom Assortment Suite application that leverages business intelligence andpredictive analytics to provide high impact insights into core merchandising tasks. In an effort to further improve our inventorymanagement, we have created a standardized set of “best practices” for both our merchandise planning and allocation groups.
Our direct business and retail business maintain a shared inventory system and we operate a single system platform for DXL, CasualMale XL and Rochester Clothing to deliver improved efficiencies and to make our full product assortment available to all of ourbusiness formats.
We continually work to improve our web environment. Our mobile optimized site capitalizes on the growing use of mobile devices tolook up store information, review product offerings, and complete purchases. In fiscal 2016, we completed the development and

11
implementation of a tablet optimized website to further capitalize on the continued growth of mobile e-commerce. In addition, ourcurrent website is fully integrated with a global e-commerce company to accommodate international customers by providing multi-currency pricing, payment processing, and international shipping. Functionality was also implemented to support an online customshirt program and an in-store application to support both a custom suit and custom shirt program.
COMPETITION
Our business faces competition from a variety of sources, including department stores such as Macy’s and Dillard’s, massmerchandisers, other specialty stores and discount and off-price retailers, as well as other retailers that sell big & tall merchandise.While we have successfully competed on the basis of merchandise selection, comfort and fit, customer service and desirable storelocations, there can be no assurances that other retailers, including e-commerce retailers, will not adopt purchasing and marketingconcepts similar to ours. Discount retailers with significant buying power, such as Wal-Mart and J.C. Penney, represent a source ofcompetition for us. The direct business has several competitors, including the King Size catalog and website.
The United States men’s big & tall apparel market is highly competitive with many national and regional department stores, specialtyapparel retailers, single market operators and discount stores offering a broad range of apparel products similar to ours. Besides retailcompetitors, we consider any casual apparel manufacturer operating in outlet malls throughout the United States to be a competitor inthe casual apparel market. We believe that we are the only national operator of apparel stores focused on the men’s big & tall market.
SEASONALITY
Historically, and consistent with the retail industry, we have experienced seasonal fluctuations as it relates to our operating incomeand net income. Traditionally, a significant portion of our operating income and net income is generated in the fourth quarter, as aresult of the holiday season.
TRADEMARKS/TRADEMARK LICENSE AGREEMENTS
We own several service marks and trademarks relating to our businesses, including, among others, “Destination XL®”, “DXL®”,“DXL Mens Apparel®”, “Big on Being Better®”, “Casual Male®”, “Casual Male XL®”, “Rochester Clothing®”, “Rochester Big &Tall®”, “Harbor Bay®”, “Oak Hill®”, “Comfort Zone®”, “Synrgy™”, “Twenty-Eight Degrees™”, “Society of One®” and “TrueNation®”. We also hold a U.S. patent for an extendable collar system, which is marketed as “Neck-Relaxer®” and a U.S. copyright fora no-iron hang tag.
EMPLOYEES
As of January 28, 2017, we employed approximately 2,625 associates. We hire additional temporary employees during the peak falland Holiday seasons. None of our employees is represented by any collective bargaining agreement.
AVAILABLE INFORMATION
Our corporate website is www.destinationxl.com. Our investor relations site is http://investor.destinationxl.com. We make availablethrough our website, free of charge, our Annual Reports on Form 10-K, Quarterly Reports on Form 10-Q, Current Reports on Form 8-K and all amendments to such reports filed or furnished pursuant to Section 13(a) of the Securities Exchange Act of 1934, asamended, as soon as reasonably practicable after we have electronically filed such material with, or furnished such materials to, theSecurities and Exchange Commission. The SEC maintains an internet site that contains reports, proxy and information statements, andother information for issuers that file electronically with the SEC at http://www.sec.gov.

12
Item 1A. Risk Factors
The following discussion identifies certain important factors that could affect our financial position, our actual results of operationsand our actions and could cause our financial position, results of operations and our actions to differ materially from any forward-looking statements made by or on behalf of our Company.
The following risk factors are the important factors of which we are aware that could cause actual results, performance orachievements to differ materially from those expressed in any of our forward-looking statements. We operate in a continuallychanging business environment and new risk factors emerge from time to time. Other unknown or unpredictable factors also couldhave material adverse effects on our future results, performance or achievements. We cannot assure you that our projected results orevents will be achieved or will occur.
Risks Related to Our Company and Our Industry
We may not be successful in executing our DXL strategy and growing our market share.
Through the end of fiscal 2016, we have opened over 200 DXL stores while closing several of our Casual Male XL and RochesterClothing stores. With the transition substantially complete, we currently anticipate that we will slow the pace of our store openings.However, for us to be successful in the future and maintain growth, we must be able to continue increasing our share of the men’sbig & tall apparel market. Our growth and market share are dependent on our ability to successfully continue to build upon our DXLstore concept, convert our existing Casual Male and Rochester customers into DXL customers and continue to attract new customers.Our inability to execute successfully the following factors could prevent us from growing our market share and DXL brand, whichcould have a material adverse effect on our results of operations, cash flows and financial position:
negotiate favorable lease arrangements for new DXL stores;
exit existing lease agreements on favorable terms;
effectively open and close stores within established cost parameters;
coordinate the timing of DXL store openings and Casual Male XL store closings;
hire qualified store management and store associates;
maintain an effective marketing program to build brand and store concept awareness as well as increase store traffic;
predict and respond to fashion trends, while offering our customers a broad selection of merchandise in an extended selectionof sizes;
grow our DXL e-commerce business;
maintain our existing customer base as we transition them to the DXL store format;
attract and retain new target customers;
continue to grow and then sustain number of transactions, units-per-transaction and share of wallet; and,
operate at appropriate operating margins.
Our business may be adversely affected by the failure to identify suitable store locations and acceptable lease terms. Inaddition, some of our new stores may open in locations close enough to our existing stores to negatively impact sales at thoselocations.
We currently lease all of our store locations. Identifying and securing suitable store locations at acceptable lease terms is critical to ourstore growth. We generally have been able to negotiate acceptable lease rates and extensions, as needed. However, we cannot becertain that desirable locations at acceptable lease rates and preferred lease terms will continue to be available. Once we decide on aprospective new store or new market and find a suitable location, any delays in opening new stores could impact our financial results.In addition, if we need to pay higher occupancy costs in the future to secure ideal locations, the increased cost may adversely impactour financial performance and liquidity. Recent trends toward increased landlord consolidation could also negatively affect our abilityto obtain and retain locations.
As we open additional locations in existing markets, some new stores may open in locations close enough to our existing stores toimpact sales and profitability at the store level, which may also adversely affect our profitability.

13
Our marketing programs and success in maintaining and building our brand awareness, driving traffic and converting thattraffic into an increased loyal customer base are critical to achieving market share growth within the big & tall industry.
Our ability to increase our share of the men’s big & tall apparel market is largely dependent on building and maintaining favorablebrand recognition for our DXL stores and e-commerce sites and effectively marketing our merchandise to all of our target customersin several diverse market segments so that they will become loyal shoppers who spend a greater portion of their wallet on our productofferings. In order to grow our brand recognition and our market share, we depend on the successful development of our brandthrough marketing and advertising in a variety of ways, including television and radio advertising, advertising events, direct mailmarketing, e-commerce and customer prospecting. Our business is directly impacted by the success of these efforts and those of ourvendors. Future advertising efforts by us, our vendors or our other licensors, may be costly and, if not successful, will impact ourability to increase our market share and increase revenues.
Our business is seasonal and is affected by general economic conditions.
Our business is seasonal. Historically, a significant portion of our operating income has been generated during our fourth quarter(November-January). If, for any reason, we miscalculate the demand for our products during our fourth quarter, our sales in thisquarter could decline, resulting in higher labor costs as a percentage of sales, lower margins and excess inventory, which could causeour annual operating results to suffer. In addition, our operations may be negatively affected by local, regional or national economicconditions, such as levels of disposable consumer income, consumer debt, interest rates and consumer confidence. Due to ourseasonality, the possible adverse impact from such risks is potentially greater if any such risks occur during our fourth quarter.
Our ability to operate and expand our business and to respond to changing business and economic conditions will depend onthe availability of adequate capital.
The operation of our business, the rate of our expansion and our ability to respond to changing business and economic conditionsdepend on the availability of adequate capital, which in turn depends on cash flow generated by our business and, if necessary, theavailability of equity or debt capital. We will also need sufficient cash flow to meet our obligations under our existing debtagreements.
The amount that we are able to borrow and have outstanding under our credit facility at any given time is determined using anavailability formula based on eligible assets. As a result, our ability to borrow is subject to certain risks and uncertainties, such asadvance rates and quality of inventory, which could reduce the funds available to us under our credit facility.
We cannot assure you that our cash flow from operations or cash available under our credit facility will be sufficient to meet ourneeds. If we are unable to generate sufficient cash flows from operations in the future, we may have to obtain additional financing. Ifwe incur additional indebtedness, that indebtedness may contain significant financial and other covenants that may significantlyrestrict our operations. We cannot ensure that we could obtain refinancing or additional financing on favorable terms or at all.
Our business may be adversely affected by economic and political issues abroad and changes in U.S. economic policies.
Economic and civil unrest in areas of the world where we source merchandise for our global sourcing program, as well as shippingand docking issues, could adversely impact the availability and cost of such merchandise. Disruptions in the global transportationnetwork, such as political instability, the financial instability of our suppliers, merchandise quality issues, trade restrictions, labor andport strikes, tariffs, currency exchange rates, transport capacity and costs, inflation and other factors relating to foreign trade arebeyond our control. In the event of disruptions or delays in deliveries due to economic or political conditions in foreign countries, suchdisruptions or delays could adversely affect our results of operations unless and until alternative supply arrangements could be made.These and other issues affecting our suppliers could adversely affect our business and financial performance.
In addition, the enactment of any new legislation in the U.S. that would impact current international trade regulations, exports orimports or tax policy with respect to foreign activities, or executive action affecting international trade agreements, including thereevaluation of the trading status of certain countries and/or retaliatory duties, taxes, quotas or other trade sanctions, could increase thecost of merchandise purchased from suppliers in such countries and could adversely affect our business and financial performance.
The loss of, or disruption in, our centralized distribution center could negatively impact our business and operations.
All merchandise for our stores and e-commerce operations is received into our centralized distribution center in Canton,Massachusetts, where the inventory is then processed, sorted and shipped to our stores or directly to our customers. We depend inlarge part on the orderly operation of this receiving and distribution process, which depends, in turn, on adherence to shippingschedules and effective management of the distribution center. Although we believe that our receiving and distribution process is

14
efficient and well-positioned to support our strategic plans, events beyond our control, such as disruptions in operations due to fire orother catastrophic events, employee matters or shipping problems, could result in delays in the delivery of merchandise to our stores ordirectly to our customers.
With all of our management information systems centralized in our corporate headquarters, any disruption or destruction of oursystem infrastructure could materially affect our business. This type of disaster is mitigated by our offsite storage and disasterrecovery plans, but we would still incur business interruption that may impact our business for several weeks.
Although we maintain business interruption and property insurance, we cannot be sure that our insurance will be sufficient, or thatinsurance proceeds will be timely paid to us, in the event our distribution center is shut down for any reason or if we incur higher costsand longer lead times in connection with a disruption from our distribution center.
If we are unable to develop and implement our omni-channel initiatives successfully, our market share and financial resultscould be adversely affected.
One of our strategic initiatives has been to move from being a multi-channel retailer to an omni-channel retailer. Our customer’sshopping behavior continues to evolve across multiple channels and we are working to meet his needs. While we now considerourselves an omni-channel retailer, we continue to make ongoing investments in our information technology systems to supportevolving omni-channel capabilities.
Omni-channel retailing is rapidly evolving and our success depends on our ability to anticipate and implement innovations in sales andmarketing technology and logistics in order to appeal to existing and potential customers who increasingly rely on multiple channelsto meet their shopping needs. In addition, our competitors are also investing in omni-channel initiatives, some of which may be moresuccessful than our initiatives.
If the investment in our omni-channel initiatives is not successful, our systems are unable to support such initiatives, or if ourcompetitors are more successful, our financial results and our market penetration may be adversely affected.
We rely on the continued development of e-commerce and internet infrastructure development, failure of which could disruptour business and negatively impact our sales.
We continue to have increasing levels of sales made through our e-commerce sites. Growth of our overall sales is dependent oncustomers continuing to expand their on-line purchases in addition to in-store to purchase our products. We cannot accurately predictthe rate at which online purchases will expand.
Our success in growing our e-commerce activities will depend in part upon our development of an increasingly sophisticated e-commerce experience and infrastructure. Increasing customer sophistication requires that we provide additional website features andfunctionality, in order to be competitive in the marketplace and maintain market share. We will continue to iterate our website features,but we cannot predict future trends and required functionality or our adoption rate for customer preferences. In addition, we arevulnerable to additional risks and uncertainties associated with e-commerce sales, including security breaches, cyber-attacks,consumer privacy concerns, changes in state tax regimes and government regulation of internet activities. Our failure to successfullyrespond to these risks and uncertainties could reduce our e-commerce sales, increase our costs and diminish our growth prospects,which could negatively impact our results of operations.
If our long-lived assets become impaired, we may need to record significant non-cash impairment charges.
Periodically, we review our long-lived assets for impairment whenever economic events or changes in circumstances indicate that thecarrying value of an asset may not be recoverable. Specifically, if an individual store location is unable to generate sufficient futurecash flows, we may be required to record a partial or full impairment of that store’s assets. In addition, significant negative industry orgeneral economic trends, disruptions to our business and unexpected significant changes or planned changes in our use of the assets(such as store relocations or closures) may also result in impairment charges. Any such impairment charges, if significant, couldadversely affect our financial position and results of operations.
We may not be successful expanding our business internationally.
Our future growth strategy includes plans to open stores internationally, most likely using a franchise and licensing model. Customerdemand, as well as a lack of familiarity with our brands, may differ internationally, and as a result, we may have difficulty attractingcustomers and growing brand awareness. In addition, our ability to conduct business internationally may be adversely impacted bypolitical and economic risks. Our failure to expand internationally may limit our future growth opportunities.

15
We also have risks related to identifying suitable franchisees. Our franchise arrangements will limit our direct control, such as theability of these third parties to meet their projections regarding store openings and sales, as well as their compliance with applicablelaws and regulations. As such, we cannot ensure our profitability or success in international markets. In addition, the failure of thesethird parties to operate the stores in a manner consistent with our standards may adversely affect our brands and reputation.
We are dependent on third parties for the manufacture of the merchandise we sell.
We do not own or operate any manufacturing facilities and are therefore entirely dependent on third parties for the manufacture of themerchandise we sell. Without adequate supplies of merchandise to sell to our customers in the merchandise styles and fashionsdemanded by our particular customer base, sales would decrease materially and our business would suffer. We are dependent on thesethird parties’ ability to fulfill our merchandise orders and meet our delivery terms. In the event that manufacturers are unable orunwilling to ship products to us in a timely manner or continue to manufacture products for us, we would have to rely on other currentmanufacturing sources or identify and qualify new manufacturers. We might not be able to identify or qualify such manufacturers forexisting or new products in a timely manner and such manufacturers might not allocate sufficient capacity to us in order to meet ourrequirements. Our inability to secure adequate and timely supplies of private label merchandise would negatively impact properinventory levels, sales and gross margin rates, and ultimately our results of operations.
In addition, even if our current manufacturers continue to manufacture our products, they may not maintain adequate controls withrespect to product specifications and quality and may not continue to produce products that are consistent with our standards. If we areforced to rely on manufacturers who produce products of inferior quality, then our brand recognition and customer satisfaction wouldlikely suffer. These manufacturers may also increase the cost to us of the products we purchase from them.
A significant portion of our merchandise is imported directly from other countries, and U.S. domestic suppliers who source theirgoods from other countries supply most of our remaining merchandise. If the U.S. Government imposes significant tariffs or otherrestrictions on foreign imports, we may need to increase our prices which could adversely affect our revenues and merchandisemargins.
Furthermore, in the event that commercial transportation is curtailed or substantially delayed, we may not be able to maintain adequateinventory levels of important merchandise on a consistent basis, which would negatively impact our sales and potentially erode theconfidence of our customer base, leading to further loss of sales and an adverse impact on our results of operations.
Fluctuations in the price, availability and quality of raw materials and finished goods could increase costs.
Fluctuations in the price, availability and quality of fabrics or other raw materials used in the manufacturing of our merchandise couldhave a material adverse effect on our gross margin or on our ability to meet our customers’ demands. The prices for fabrics depend ondemand and market prices for the raw materials used to produce them. To the extent that we cannot offset these cost increases withother cost reductions or efficiencies, such higher costs will need to be passed on to our customers. Such increased costs could lead toreduced customer demand, which could have a material adverse effect on our results of operations and cash flow.
Our success depends significantly on our key personnel and our ability to attract and retain additional personnel.
Our future success is dependent on the personal efforts, performance and abilities of our key management which includes ourexecutive officer as well as several significant members of our senior management. For example, the loss of the services of DavidLevin, our President and Chief Executive Officer, who is an integral part of our daily operations and is the primary decision maker inall our important operating matters, could significantly impact our business until an adequate replacement or replacements can beidentified and put in place. The loss of any of our senior management may result in a loss of organizational focus, poor operatingexecution, an inability to identify and execute strategic initiatives, an impairment in our ability to identify new store locations, and aninability to consummate possible acquisitions.
The competition is intense for the type of highly skilled individuals with relevant industry experience that we require and we may notbe able to attract and retain new employees of the caliber needed to achieve our objectives.
Our business may be negatively impacted and we may be liable if third parties misappropriate proprietary information of ourcustomers and breach our security systems.
We may be harmed by security risks we face in connection with our electronic processing and transmission of confidential customerinformation. During fiscal 2016, approximately 85% of our sales were settled through credit and debit card transactions. Any securitybreach could expose us to risks of loss, litigation and liability and could adversely affect our operations as well as cause our shoppersto stop shopping with us as a result of their lack of confidence in the security of their personally identifiable information, which could

16
have a negative impact on our sales and profitability. If third parties are able to penetrate our network security or otherwisemisappropriate the personal information or credit card information of our customers or if third parties gain unauthorized and improperaccess to such information, we could be subject to liability. These liabilities could include claims for unauthorized purchases withcredit card information, impersonation or other similar fraud claims, or claims for other misuses of personal information, includingunauthorized marketing purposes, and could ultimately result in litigation. Liability for misappropriation of this information could besignificant.
Further, if a third party were to use this proprietary customer information in order to compete with us, it could have a material adverseimpact on our business and could result in litigation.
Our business is highly competitive, and competitive factors may reduce our revenues and profit margins.
The United States men’s big & tall apparel market is highly competitive with many national and regional department stores, massmerchandisers, specialty apparel retailers and discount stores offering a broad range of apparel products similar to the products that wesell. Besides retail competitors, we consider any manufacturer of big & tall merchandise operating in outlet malls throughout the UnitedStates to be a competitor. It is also possible that another competitor, either a mass merchant or a men’s specialty store or specialty apparelcatalog, could gain market share in men’s big & tall apparel due to more favorable pricing, locations, brand and fashion assortment andsize availability. Many of our competitors and potential competitors may have substantially greater financial, manufacturing andmarketing resources than we do.
The presence in the marketplace of various fashion trends and the limited availability of shelf space also can affect competition. We maynot be able to compete successfully with our competitors in the future and could lose brand recognition and market share. A significantloss of market share would adversely affect our revenues and results of operations.
In addition, we maintain exclusivity arrangements with several of the brands that we carry. If we were to lose any of these exclusivityarrangements or brands altogether, our revenues may be adversely affected.
We may be unable to predict fashion trends and customer preferences successfully.
Customer tastes and fashion trends are volatile and tend to change rapidly. Our success depends in large part upon our ability topredict effectively and respond to changing fashion tastes and consumer demands and to translate market trends to appropriatesaleable product offerings. If we are unable to predict or respond to changing styles or trends successfully and misjudge the market forproducts or any new product lines, our sales will be impacted and we may be faced with a substantial amount of unsold inventory ormissed opportunities. In response, we may be forced to rely on additional markdowns or promotional sales to dispose of excess, slow-moving inventory, which would decrease our revenues and margins. In addition, the failure to satisfy consumer demand, specificallyin our DXL stores and websites, could have serious longer-term consequences, such as an adverse impact on our brand value and theloss of market share to our competitors.
The loss of any of our key trademarks or licenses could adversely affect demand for our products.
We own and use a number of trademarks and operate under several trademark license agreements. We believe that certain of thesetrademarks have significant value and are instrumental in our ability to create and sustain demand for and to market our products. Wecannot be certain that these trademarks and licensing agreements will remain in effect and enforceable or that any license agreements,upon expiration, can be renewed on acceptable terms or at all. In addition, any future disputes concerning these trademarks andlicenses may cause us to incur significant litigation costs or force us to suspend use of the disputed trademarks.
Acts of terrorism or a catastrophic event could negatively impact our operating results and financial condition.
Unforeseen events, including war, terrorism and other international conflicts, public health issues, and natural disasters such asearthquakes, hurricanes or other adverse weather and climate conditions, whether occurring in the U.S. or abroad, could disrupt ouroperations, or the operations of our vendors and other suppliers, or result in political or economic instability.
The continued threat of terrorism and heightened security measures in response to an act of terrorism may disrupt commerce andundermine consumer confidence which could negatively impact our sales by causing consumer spending to decline. Furthermore, anact of terrorism or war, or the threat thereof, could negatively impact our business by interfering with our ability to obtain merchandisefrom vendors or substitute suppliers at similar costs in a timely manner.

17
Our business depends on our ability to meet our labor needs.
Our success depends in part upon our ability to attract, motivate and retain a sufficient number of qualified employees, including storemanagers and sales associates, who understand and appreciate our product offerings and are able to represent our products to ourcustomers adequately. Qualified individuals of the requisite caliber and number needed to fill these positions may be in short supply insome areas, and the turnover rate in the retail industry is high. If we are unable to hire and retain sales associates capable ofconsistently providing a high level of customer service, our business could be materially adversely affected. Although none of ouremployees is currently covered by collective bargaining agreements, our employees may elect to be represented by labor unions in thefuture, which could increase our labor costs. Additionally, competition for qualified employees could require us to pay higher wagesto attract a sufficient number of adequate employees. An inability to recruit and retain a sufficient number of qualified individuals inthe future may delay the planned openings of new stores or outlets. Any such delays, any material increases in employee turnoverrates at existing stores or outlets or any increases in labor costs could have a material adverse effect on our business, financialcondition or operating results.
Failure to comply with laws, rules and regulations could negatively affect our business operations and financial performance.
Our business is subject to federal, state, local and international laws, rules and regulations, such as state and local wage and hour laws,the U.S. Foreign Corrupt Practices Act, the Employee Retirement Income Security Act (“ERISA”), securities laws, import and exportlaws (including customs regulations), privacy and information security regulations, unclaimed property laws, the Affordable Care Actand many others. The effect of some of these laws and regulations may be to increase the cost of doing business and may have amaterial impact on our earnings. In addition, the complexity of the regulatory environment in which we operate and the related cost ofcompliance are both increasing due to legal and regulatory requirements and increased enforcement. In addition, as a result ofoperating in the U.K., we must comply with that country’s laws and regulations, which may differ substantially from, and may conflictwith, corresponding U.S. laws and regulations. We may also be subject to investigations or audits by governmental authorities andregulatory agencies, which can occur in the ordinary course of business or which can result from increased scrutiny from a particularagency towards an industry, country or practice. If we fail to comply with laws, rules and regulations or the manner in which they areinterpreted or applied, we may be subject to government enforcement action, class action litigation or other litigation, damage to ourreputation, civil and criminal liability, damages, fines and penalties, and increased cost of regulatory compliance, any of which couldadversely affect our results of operations and financial performance.
The new administration may make substantial changes to fiscal, tax and international trade policies that may adversely affectour business, financial condition and results of operations.
The new administration has called for substantial change to various fiscal, tax and international trade policies. We cannot predict theimpact, if any, of these changes to our business, financial condition and results of operations. However, it is possible that thesechanges could adversely affect our business. It is likely that some policies adopted by the new administration will benefit us and otherswill negatively affect us. Until we know what changes are enacted, we will not know whether in total we benefit from, or arenegatively affected by, the changes.
Risks Related to Our Corporate Structure and Stock
Our stock price has been and may continue to be extremely volatile due to many factors.
The market price of our common stock has fluctuated in the past and may increase or decrease rapidly in the future depending on newsannouncements and changes in general market conditions. The following factors, among others, may cause significant fluctuations inour stock price:
overall changes in the economy and general market volatility;
news announcements regarding our quarterly or annual results of operations;
quarterly comparable sales;
acquisitions;
competitive developments;
litigation affecting us; or
market views as to the prospects of the retail industry generally.

18
Rights of our stockholders may be negatively affected if we issue any of the shares of preferred stock which our Board ofDirectors has authorized for issuance.
We have available for issuance up to 1,000,000 shares of preferred stock, par value $0.01 per share. Our Board of Directors isauthorized to issue any or all of these shares of preferred stock, in one or more series, without any further action on the part ofstockholders. The rights of our stockholders may be negatively affected if we issue a series of preferred stock in the future that haspreference over our common stock with respect to the payment of dividends or distribution upon our liquidation, dissolution orwinding up.
In addition, the issuance of preferred stock by our Board of Directors pursuant to our certificate of incorporation, as amended, couldhave the effect of making it more difficult for a third party to acquire, or of discouraging a third party from acquiring, a majority of theoutstanding voting stock of our Company.
State laws and our certificate of incorporation, as amended, may inhibit potential acquisition bids that could be beneficial to ourstockholders.
We are subject to certain provisions of Delaware law, which could also delay or make more difficult a merger, tender offer or proxycontest involving us. In particular, Section 203 of the Delaware General Corporation Law prohibits a Delaware corporation fromengaging in certain business combinations with any interested stockholder for a period of three years unless specific conditions are met.In addition, certain provisions of Delaware law could have the effect of delaying, deferring or preventing a change in control of us,including, without limitation, discouraging a proxy contest or making more difficult the acquisition of a substantial block of our commonstock. The provisions could also limit the price that investors might be willing to pay in the future for shares of our common stock.
In addition, our certificate of incorporation, as amended, contains provisions that restrict any person or entity from attempting totransfer our stock, without prior permission from the Board of Directors, to the extent that such transfer would (i) create or result in anindividual or entity becoming a five-percent shareholder of our stock, or (ii) increase the stock ownership percentage of any existingfive-percent shareholder. These provisions provide that any transfer that violates such provisions shall be null and void and wouldrequire the purported transferee to, upon demand by us, transfer the shares that exceed the five percent limit to an agent designated byus for the purpose of conducting a sale of such excess shares. These provisions would make the acquisition of our Company moreexpensive to the acquirer and could significantly delay, discourage, or prevent third parties from acquiring our Company without theapproval of our Board of Directors.

19
Item 1B. Unresolved Staff Comments
None.
Item 2. Properties
Our corporate offices and retail distribution center are located at 555 Turnpike Street in Canton, Massachusetts. The property consistsof a 755,992 gross square foot building located on approximately 27.3 acres. We owned the property until January 30, 2006, at whichtime we entered into a sale-leaseback transaction with Spirit Finance Corporation, a third-party real estate investment trust (“Spirit”),whereby we entered into a twenty-year lease agreement with a wholly-owned subsidiary of Spirit for an initial annual rent payment of$4.6 million, with periodic increases every fifth anniversary of the lease. In fiscal 2006, we realized a gain of approximately $29.3million on the sale of this property, which was deferred and is being amortized over the initial 20 years of the related lease agreement.Accordingly, our current annual rent expense of $5.2 million is offset by $1.5 million related to the amortization of this deferred gain.
As of January 28, 2017, we operated 192 Destination XL retail stores, 13 Destination XL outlet stores, 97 Casual Male XL retailstores, 36 Casual Male XL outlet stores and 5 Rochester Clothing stores. All of these stores are leased by us directly from owners ofseveral different types of centers, including life-style centers, shopping centers, free standing buildings, outlet centers and downtownlocations. The store leases are generally 5 to 10 years in length and contain renewal options extending their terms by between 5 and 10years. Following this discussion is a listing by state of all store locations open at January 28, 2017.
Sites for store expansion are selected on the basis of several factors, including the demographic profile of the area in which the site islocated, the types of stores and other retailers in the area, the location of the store within the center and the attractiveness of the storelayout. We also utilize financial models to project the profitability of each location using assumptions such as the center’s sales persquare foot averages, estimated occupancy costs and return on investment requirements.
See also “Management’s Discussion and Analysis of Financial Condition and Results of Operation—Liquidity and CapitalResources—Capital Expenditures.”

20
Store count by state at January 28, 2017
United StatesDXL retailDXL outlets *
Casual Male XLand RochesterClothing stores
Alabama 1 2Arizona 4 1Arkansas — 2California * 23 15Colorado 3 2Connecticut 4 2Delaware * 2 —District of Columbia — 1Florida * 10 11Georgia 3 4Idaho 1 —Illinois 11 7Indiana 5 4Iowa 2 2Kansas 3 —Kentucky 2 1Louisiana 3 1Maine * 1 1Maryland 5 5Massachusetts 5 3Michigan * 12 3Minnesota 2 2Mississippi — 2Missouri 3 6Montana 1 —Nebraska 2 —Nevada 3 —New Hampshire * 3 —New Jersey 7 8New Mexico 1 —New York * 13 10North Carolina 3 4North Dakota — 1Ohio 8 3Oklahoma 2 —Oregon 2 1Pennsylvania 8 14Rhode Island 1 —South Carolina * 4 —South Dakota — 1Tennessee * 6 1Texas 20 10Utah 2 —Vermont 1 —Virginia * 5 3Washington * 4 1West Virginia — 1Wisconsin 4 2
InternationalLondon, England — 1

21
Item 3. Legal Proceedings
From time to time, we are subject to various legal proceedings and claims that arise in the ordinary course of business. Managementbelieves that the resolution of these matters will not have a material adverse impact on our future results of operations or financialposition.
Item 4. Mine Safety Disclosure
Not applicable.

22
PART II.
Item 5. Market for Registrant’s Common Equity, Related Stockholder Matters and Issuer Purchases of Equity Securities
Market Information
Our common stock is listed for trading on the NASDAQ Global Select Market under the symbol “DXLG”.
The following table sets forth, for the periods indicated, the high and low per share sales prices for the common stock, as reported onNasdaq.
High LowFiscal Year Ended January 28, 2017First Quarter $ 5.88 $ 3.95Second Quarter 5.54 4.05Third Quarter 5.57 3.95Fourth Quarter 5.00 3.15
Fiscal Year Ended January 30, 2016First Quarter $ 5.30 $ 4.28Second Quarter 5.41 4.32Third Quarter 6.70 4.23Fourth Quarter 6.16 4.10
Holders
As of March 15, 2017, based upon data provided by the transfer agent for our common stock, there were approximately 89 holders ofrecord of our common stock. The number of holders does not include individuals or entities who beneficially own shares but whoseshares are held of record by a broker or clearing agent, but does include each such broker or clearing agency as one record holder.
Dividends
We have not paid and do not anticipate paying cash dividends on our common stock. In addition, financial covenants in our loanagreement may restrict dividend payments. For a description of these financial covenants see Note C to the Notes to the ConsolidatedFinancial Statements.
Issuer Purchases of Equity Securities
None.

23
Stock Performance Graph
The following Performance Graph compares our cumulative stockholder return with a broad market index (Standard & Poor’s 500)and one published industry index (Dow Jones U.S. Apparel Retailers) for each of the most recent five years ended January 31. Thecumulative stockholder return for shares of our common stock (“DXLG”) and each of the indices is calculated assuming that $100 wasinvested on January 31, 2012. We paid no cash dividends during the periods shown. The performance of the indices is shown on atotal return (dividends reinvested) basis. The graph lines merely connect January 31 of each year and do not reflect fluctuationsbetween those dates. In addition, we have included a chart of the annual percentage return of our common stock, the S&P 500 and theDow Jones U.S. Apparel Retailers.
Jan '12 Jan '13 Jan '14 Jan '15 Jan '16 Jan '17$-
$20.00
$40.00
$60.00
$80.00
$100.00
$120.00
$140.00
$160.00
$180.00
S&P 500 Destination XL Group, Inc. Dow Jones U.S. Apparel Retailers
Total Shareholder Returns
Years Ending
Dollars
Annual Return Percentage
Year endedCompany/Index Jan 13 Jan 14 Jan 15 Jan 16 Jan 17DXLG 37.3% 17.0% (5.6%) (15.4%) (23.3%)S&P 500 13.8% 19.0% 11.9% (2.7%) 18.3%Dow Jones U.S. Apparel Retailers 23.4% 12.1% 19.3% (2.9%) (4.5%)
Indexed Returns
Base PeriodJan 12 Jan 13 Jan 14 Jan 15 Jan 16 Jan 17
Company/IndexDXLG $ 100 $ 137.31 $ 160.60 $ 151.64 $ 128.36 $ 98.51S&P 500 $ 100 $ 113.81 $ 135.42 $ 151.56 $ 147.40 $ 174.32Dow Jones U.S. Apparel Retailers $ 100 $ 123.42 $ 138.38 $ 165.08 $ 160.36 $ 153.12
The performance graph above shall not be deemed “filed” for purposes of Section 18 of the Securities Exchange Act of 1934, asamended (the “Exchange Act”), or otherwise subject to the liability of that section. This graph will not be deemed incorporated byreference into any filing under the Securities Act of 1933, as amended, or the Exchange Act, whether made before or after the datehereof, regardless of any general incorporation language in such filing.

24
Item 6. Selected Financial Data
The following tables set forth selected consolidated financial data of our Company as of and for each of the years in the five-yearperiod ended January 28, 2017 and should be read in conjunction with “Management’s Discussion and Analysis of FinancialCondition and Results of Operations” and our accompanying Consolidated Financial Statements and Notes thereto.
We derived the selected financial data presented below for the periods or dates indicated from our consolidated financial statements.Our consolidated financial statements as of and for the years ended January 28, 2017, January 30, 2016, January 31, 2015 andFebruary 1, 2014 were audited by KPMG LLP, an independent registered public accounting firm. Our consolidated financialstatements as of and for the year ended February 2, 2013 were audited by Ernst & Young LLP, an independent registered publicaccounting firm. Our consolidated financial statements as of and for the years ended January 28, 2017, January 30, 2016 and January31, 2015 are included in this Annual Report.
For a discussion of certain factors that materially affect the comparability of the selected consolidated financial data or cause the datareflected herein not to be indicative of our future results of operations or financial condition, see Item 1A, “Risk Factors” and Item 7,“Management’s Discussion and Analysis of Financial Condition and Results of Operations.”

25
Fiscal Years Ended (1)(2)
January28, 2017
(Fiscal 2016)
January30, 2016
(Fiscal 2015)
January31, 2015
(Fiscal 2014)
February1, 2014
(Fiscal 2013)
February2, 2013
(Fiscal 2012)(In millions, except per share and operating data)
INCOME STATEMENT DATA:Sales $ 450.3 $ 442.2 $ 414.0 $ 386.5 $ 397.6Gross profit, net of occupancy costs 204.9 203.8 190.0 176.4 183.7Selling, general and administrative expenses 173.3 180.6 174.8 169.1 154.4Depreciation and amortization 30.6 (4) 28.4 24.0 (4) 20.8 (4) 15.5Operating income (loss) 1.0 (5.1) (8.8) (13.5) 13.8
Provision for income taxes 0.2 0.3 0.2 45.7 (5) 5.2Income (loss) from continuing operations $ (2.3) $ (8.4) $ (11.2) $ (60.3) $ 8.0Income (loss) from discontinued operations — — (1.1) 0.5 (1.9)Net income (loss) $ (2.3) $ (8.4) $ (12.3) $ (59.8) $ 6.1
Income (loss) from continuing operations per share - diluted $ (0.05) $ (0.17) $ (0.23) $ (1.24) $ 0.17Net income (loss) per share - diluted $ (0.05) $ (0.17) $ (0.25) $ (1.23) $ 0.13
BALANCE SHEET DATA:Working capital(6) $ 23.3 $ 28.1 $ 42.8 $ 50.6 $ 82.5Inventories 117.4 125.0 115.2 105.6 104.2Property and equipment, net 124.3 125.0 120.3 102.9 65.9Total assets(6) 269.3 274.3 259.9 236.7 245.9Long term debt, net of current portion(6) 12.1 19.0 26.2 12.0 —Stockholders’ equity 88.5 88.4 92.4 105.0 161.2
OTHER DATA:Cash flow provided by operating activities $ 35.0 $ 18.4 $ 13.8 $ 24.9 $ 29.9less: capital expenditures, infrastructure projects (9.6) (13.3) (10.5) (10.0) (6.8)Free cash flow before DXL capital expenditures(3) (Non-GAAPmeasure)
$ 25.4 $ 5.1 $ 3.3 $ 14.9 $ 23.1
less: capital expenditures for DXL stores (19.6) (20.1) (30.4) (44.1) (25.6)Free cash flow (Non-GAAP measure)(3) $ 5.8 $ (15.0) $ (27.1) $ (29.2) $ (2.5)
OPERATING DATA:Comparable sales percentage 0.6% 4.8% 6.4% 3.0% 1.5%Gross profit margins 45.5% 46.1% 45.9% 45.6% 46.2%EBITDA from continuing operations(Non-GAAP measure) (3) $ 31.6 $ 23.3 $ 15.2 $ 7.3 $ 29.3
EBITDA margin from continuing operations(Non-GAAP measure) (3)
7.0% 5.3% 3.7% 1.9% 7.4%
Operating margin 0.2% (1.2%) (2.1%) (3.5%) 3.5%Net sales per square foot (7) $ 182 $ 183 $ 179 $ 174 $ 179Number of stores open at fiscal year end 343 345 353 359 412
(1) Our fiscal year is a 52- or 53- week period ending on the Saturday closest to January 31. Except for fiscal 2012 which was a 53-week period, all fiscal years were 52-weeks. Certain columns may not foot due to rounding.
(2) During the fourth quarter of fiscal 2014, we discontinued our direct business with Sears Canada and, during the second quarterof fiscal 2012, we discontinued our European web business. Accordingly, certain prior year amounts in the Income StatementData were reclassified to discontinued operations to conform to the current year presentation.
(3) “EBITDA from continuing operations,” “EBITDA margin from continuing operations,” “Free cash flow before DXL capitalexpenditures” and “Free cash flow” are non-GAAP measures. See “Non-GAAP Reconciliations” in Item 7. “Management’sDiscussion and Analysis” for information on these non-GAAP measures and reconciliations to comparable GAAP measures,with the exception of EBITDA margin from continuing operations, which is calculated by taking EBITDA from continuingoperations and dividing it by Sales.

26
(4) Includes impairment charges of $0.4 million, $0.3 million and $1.5 million for fiscal 2016, fiscal 2014 and fiscal 2013,respectively, for the write-down of property and equipment. The impairment charges relate to stores where the carrying valueexceeds fair value. See Note A to the Notes to the Consolidated Financial Statements.
(5) In the fourth quarter of fiscal 2013, we recorded a non-cash charge of $51.3 million to establish a full valuation allowanceagainst our deferred tax assets. See Note D to the Notes to the Consolidated Financial Statements.
(6) In fiscal 2015, we elected early adoption of ASU 2015-03, “Interest-Imputation of Interest (Subtopic 835-30), Simplifying thePresentation of Debt Issuance Costs.” The guidance simplifies the presentation of debt issuance costs to be presented as adeduction from the corresponding liability. Accordingly, selected balance sheet data for fiscal 2014 and fiscal 2013 have beenadjusted to conform to the current presentation. Total unamortized debt issuance costs of $0.2 million were not reclassified forfiscal 2012, because there was no outstanding balance under our Credit Facility at February 2, 2013.
(7) “Sales per square foot” is calculated based on the built-out square footage of a store, as opposed to selling square footage.

27
Item 7. Management’s Discussion and Analysis of Financial Condition and Results of Operations
FORWARD LOOKING STATEMENTS
As noted above, this Annual Report, including, without limitation, this Item 7, contains “forward-looking statements,” includingforward-looking statements within the meaning of the Private Securities Litigation Reform Act of 1995. Actual results ordevelopments could differ materially from those projected in such statements as a result of numerous factors, including, withoutlimitation those risks and uncertainties set forth in Item 1A, Risk Factors, which you are encouraged to read. The following discussionand analysis of our financial condition and results of operations should be read in light of those risks and uncertainties and inconjunction with our accompanying Consolidated Financial Statements and Notes thereto.
Certain figures discussed below may not add due to rounding.
Segment ReportingWe report our operations as one reportable segment, Big & Tall Men’s Apparel. We consider our retail and direct businesses,especially in our growing omni-channel environment, to be similar in terms of economic characteristics, production processes andoperations, and have therefore aggregated them into a single reporting segment.
Comparable Sales Definition
Total comparable sales include our retail stores that have been open for at least 13 months and our direct business. Stores that havebeen remodeled or re-located during the period are also included in our determination of comparable sales. Stores that have beenexpanded by more than 25% are considered non-comparable for the first 13 months. If a store becomes a clearance center, it is alsoremoved from the calculation of comparable sales. The method of calculating comparable sales varies across the retail industry and,as a result, our calculation of comparable sales is not necessarily comparable to similarly titled measures reported by other retailers.
Our customer’s shopping experience continues to evolve across multiple channels and we are continually changing to meet his needs.Since fiscal 2014 the majority of our retail stores have the capability of fulfilling online orders if merchandise is not available in thewarehouse. As a result, we continue to see more transactions that begin online but are ultimately completed at the store level.Similarly, if a customer visits a store and the item is out of stock, the associate can order the item through our websites. A customeralso has the ability to order online and pick-up in store. Because this omni-channel approach to retailing is changing the boundaries ofwhere a sale originates and where a sale is ultimately settled, we do not report comparable sales separately for our retail and directbusinesses. We have continued to provide specific information on our DXL comparable store sales in connection with our ongoingroll-out. With over 200 DXL stores at the end of fiscal 2016, we are nearing the end of our rollout and for fiscal 2017 we willtransition to one comparable sales figure for the Company and will no longer provide specific information on our DXL comparablestore sales.
Non-GAAP Measures
We monitor certain non-GAAP financial measures on a regular basis in order to track the progress of our business. These measuresinclude adjusted net loss, adjusted net loss per diluted share, free cash flow before DXL capital expenditures, free cash flow, EBITDA,EBITDA from continuing operations and EBITDA margin from continuing operations. We believe these measures provide helpfulinformation with respect to the Company’s operating performance and that the inclusion of these non-GAAP measures is important toassist investors in comparing our performance in fiscal 2016 to fiscal 2015 and fiscal 2014. We also provide certain forward-lookinginformation with respect to certain of these non-GAAP financial measures. However, these measures may not be comparable tosimilar measures used by other companies and should not be considered superior to or as a substitute for net loss, loss from continuingoperations, net loss per diluted share or cash flows from operating activities in accordance with GAAP. See “Non-GAAPReconciliations” below for additional information on these non-GAAP financial measures and reconciliations to comparable GAAPmeasures.
EXECUTIVE OVERVIEW
We are pleased with our continued improvement in fiscal 2016, despite overall weakness of the retail environment. Our net loss forfiscal 2016 was $(2.3) million, or $(0.05) per diluted share, compared with a net loss of $(8.4) million, or $(0.17) per diluted share infiscal 2015. Sales growth in fiscal 2016 was 1.8% and EBITDA increased 35.8% to $31.6 million as compared to $23.3 million atfiscal 2015. Due to the intensive capital requirements associated with our DXL transition strategy, depreciation costs have increasedover the past 3 years. As a result, we believe EBITDA is a key performance indicator as to how well our strategy is working.

28
Our DXL concept has been the principal driver of our sales growth and improvement in profitability. For fiscal 2016, our 166comparable DXL retail stores had a sales increase of 2.4%, which we believe demonstrates that our store associates are able toincrease the quality of sale using our proven selling model, despite the lack of store traffic we experienced in the latter half of fiscal2016. Regionally, sales for our DXL stores located in the central part of the country, which accounted for approximately 40% of ourDXL sales during fiscal 2016, trailed sales from our DXL stores located in coastal states by approximately 600 basis points. Webelieve that this disparity is due in part to the uncertainty in the U.S. economic and political climate that impacted the retail industry,especially in the second half of fiscal 2016, and contributed to slower than expected top-line growth for us. Sales per square foot forour DXL retail stores increased to $180 in fiscal 2016 from $177 in fiscal 2015 and $165 in fiscal 2014. Of the 192 DXL retail storesopen at the end of fiscal 2016, 49 had sales per square foot in excess of $200. Overall, we are converting traffic with number oftransactions up 1.9%, dollars per transactions up 0.5% and units per transactions up 2.0% over fiscal 2015.
Over the past several years, we have relied on our Spring and Fall television and radio campaigns to build brand awareness and drivetraffic. For the Spring 2016 campaign we made the decision to air our 2015 commercial rather than invest in a new creativecampaign. We found that the Spring 2016 television campaign did not drive a meaningful improvement in traffic or customerawareness. As a result, we decided to eliminate our Fall television advertising campaign and instead redirect some of those funds intodigital advertising. There were several factors involved in our decision to eliminate the Fall campaign: (i) we believed that the regionaldifference in sales that we started to see in September was an indicator that there may be a larger macro-economic issue, (ii) webelieved that the Spring campaign did not provide the increase in store traffic that we were expecting, and (iii) there was uncertaintysurrounding the impact the political environment was having on our customer base. Subsequently, customer feedback on ourcommercial also indicated that we were not connecting on the key points necessary to drive traffic. While this decision likely had anegative impact on our top-line growth, we believed that given the current economic and political environment, eliminating the Falltelevision campaign and instead redirecting a portion of the marketing funds into digital advertising offered a better return oninvestment this fiscal year. However, we also saw an unexpected drop in customer awareness for the first time since we beganopening DXL stores and believe that this was due to the lack of media advertising. With only 4 out of 10 customers knowing who weare, brand awareness and new customer acquisition is key to our success in driving sales growth and building market share, so we willbe reinvesting in our marketing programs in fiscal 2017 and expect to spend approximately $25.0 million in fiscal 2017 to help createstore traffic and grow brand awareness.
A significant contributor to our DXL sales growth has been our “end-of-rack” customer. We define “end-of-rack” customer as anycustomer with a waist size 46 inches or less. For fiscal 2016, our end-of-rack customer represented 45.0% of our sales in bottoms,compared with 44.0% for fiscal 2015. Consistent with our overall results, we saw this growth slow during the latter half of fiscal2016, which we believe is partially attributable to our decision not to run the Fall campaign.
From a liquidity perspective, during fiscal 2016 we achieved our objective of funding the build out of our DXL stores from free cashflow. We also started to pay down our debt levels for the first time since we started our DXL rollout four years ago. Cash flow fromoperations improved by $16.6 million. This improvement, with a $4.2 million decrease in capital expenditures, resulted in a $20.8million improvement in free cash flow.
The improvement in cash flow from operations is largely due to the positive results from our inventory optimization project that weimplemented in fiscal 2016. We made several improvements to streamline operations at our distribution center, including tightercontrols over the number of merchandise weeks of supply and improvements in inventory receipt flow and procurement. This projectcontributed to inventory levels decreasing by $7.6 million at January 28, 2017 compared to January 30, 2016, which resulted insignificant improvement in working capital, thus improving free cash flow. As reflected in our “Fiscal 2017 Outlook” below, weexpect these changes to result in a more optimized inventory structure that will continue to improve our working capital positionthrough fiscal 2017. We do not believe these changes have or will jeopardize sales from out-of-stock positions in either our stores orin our direct business.
Our capital expenditures decreased slightly in fiscal 2016 due to fewer store openings, at a lower average square footage, than fiscal2015. During fiscal 2016, we opened 26 DXL retail stores and 4 DXL outlet stores. In addition, we closed 28 Casual Male XL retailstores and 4 Casual Male XL outlet stores.
Fiscal 2017 Outlook
In light of the difficult retail environment we experienced in the latter half of fiscal 2016, we are taking a watchful approach to fiscal2017. Our primary objective in fiscal 2017 is to grow our customer base through a revitalized marketing program and to maintain astrong liquidity position by continuing to improve cash flow. We will be reinvesting in our marketing initiatives to help drive brandawareness, store traffic and our digital presence by increasing our marketing plan for fiscal 2017 by approximately $6.8 million to$25.0 million. We will continue to work on our inventory optimization project which was started in fiscal 2016 and, on an annual

29
basis, our DXL store growth will be funded from operations. As a result, we expect to open 19 DXL retail stores and 1 DXL outletstore in fiscal 2017, while closing 16 Casual Male XL retail stores and 3 Casual Male XL outlet stores.
For fiscal 2017, our outlook, based on a 53-week year, is as follows:
Sales are expected to range from $470.0 million to $480.0 million, with a total company comparable sales increase ofapproximately 1.0% to 4.0%.
Gross margin rate of approximately 46.0%, an increase of 50 basis points from fiscal 2016.
Net loss, on a GAAP basis, of $(5.7) to $(11.7) million, or $(0.11) to $(0.23) per diluted share.
EBITDA of $24.0 to $30.0 million, a decrease from fiscal 2016 as a result of increased marketing costs.
Adjusted net loss of $(0.06) to $(0.14) per diluted share. Because we expect to continue providing a full valuation allowanceagainst our deferred tax assets, we do not expect to recognize any income tax benefit in fiscal 2017. This non-GAAP net losswas calculated, assuming a normal tax benefit of approximately 40%, by taking the 2017 forecasted earnings of a net loss of$(0.11) to $(0.23) per diluted share and multiplying each by 40% to calculate an estimated income tax benefit of $(0.05)-$(0.09) per diluted share, resulting in an adjusted net loss of $(0.06) to $(0.14) per diluted share.
Capital expenditures of approximately $22.0 million, $13.7 million of which will be for new DXL stores and $8.3 million ofwhich will be for infrastructure projects, partially offset by approximately $5.0 million in tenant allowances. We expect tofund our capital expenditures primarily from our operating cash flow.
At the end of fiscal 2017, we expect cash flow from operating activities of $37.0 million to $42.0 million (including tenantallowances), resulting in positive free cash flow, before DXL capital expenditures, of approximately $28.7 million to $33.7million. Free cash flow will be approximately $15.0 to $20.0 million.
As discussed more fully below under “Liquidity and Capital Resources,” subsequent to the end of fiscal 2016, our Board ofDirectors approved a stock repurchase plan, pursuant to which we can purchase up to $12.0 million of our outstanding commonstock during fiscal 2017.
Summary of Financial Results
(in millions, except for per share data) Fiscal 2016 Fiscal 2015 Fiscal 2014Operating income (loss) (GAAP) $ 1.0 $ (5.1) $ (8.8)Add back: Depreciation and amortization expense 30.6 28.4 24.0EBITDA from continuing operations $ 31.6 $ 23.3 $ 15.2EBITDA $ 31.6 $ 23.3 $ 14.1
Diluted loss per share:On a GAAP basis:Net loss from continuing operations $ (0.05) $ (0.17) $ (0.23)Loss from discontinued operations $ — $ — $ (0.02)Net loss $ (0.05) $ (0.17) $ (0.25)
On a Non-GAAP basis:Adjusted net loss from continuing operations(non-GAAP basis) $ (0.03) $ (0.10) $ (0.13)
Loss from discontinued operations $ — $ — $ (0.02)Adjusted net loss (Non-GAAP basis) $ (0.03) $ (0.10) $ (0.16)
RESULTS OF OPERATIONS
Our fiscal year is a 52- or 53-week period ending on the Saturday closest to January 31. Fiscal 2016, fiscal 2015 and fiscal 2014 wereall 52-week periods.

30
SALES
Fiscal year(in millions) 2016 2015Sales from prior year $ 442.2 $ 414.0Less prior year sales for stores that have closed (25.4) (34.6)
$ 416.8 $ 379.4
Increase in comparable sales 2.5 18.0Non-comparable sales, primarily DXL stores open less than 13months 30.5 44.2
Other, net 0.5 0.6Sales $ 450.3 $ 442.2
Sales for fiscal 2016 increased 1.8% to $450.3 million as compared to $442.2 million in fiscal 2015. The increase in sales was partlydue to sales from DXL stores opened less than 13 months of $30.5 million, offset partially by lost sales of $25.4 million from closedand converted stores. In addition, comparable sales increased $2.5 million, or 0.6%, compared to fiscal 2015.
Included in the comparable sales increase of $2.5 million, are the comparable sales from our 166 DXL retail stores, which increased2.4%, or $5.4 million in fiscal 2016 as compared to fiscal 2015. As we discussed above, store traffic was down across the retailindustry in the latter half of fiscal 2016, which we believe was due in part to the macroeconomic and political issues the country iscurrently facing. Regionally, our stores in Coastal states performed better than our stores in Central states, whose comparable saleswere, on average, 600 basis points less than our stores in Coastal states. We did, however, see positive performance from our non-comparable DXL stores which performed well against plan and our ‘return on investment’ hurdles, which is a good indicator that ourstore openings continue to perform well.
In addition to the overall weakness in the retail industry, we also believe that our decision to eliminate our Fall marketing campaign,had a negative impact on sales and on building our customer base in fiscal 2016.
Sales for fiscal 2015 increased 6.8% to $442.2 million as compared to $414.0 million in fiscal 2014. The increase of $28.2 million insales was primarily due to a comparable sales increase of 4.8%, or $18.0 million. Increase in our non-comparable sales, primarily fromour DXL stores that have been opened less than 13 months, of $44.2 million and other revenue of $0.6 million were partially offset bya reduction of $34.6 million in lost sales from closed and converted stores. Comparable sales from our 137 DXL retail storesincreased 9.7%, or $16.0 million in fiscal 2015, against a 13.7% comparable sales increase in fiscal 2014. The total number oftransactions for these comparable stores increased 6.2% and dollars per transactions increased 3.3% over fiscal 2014.
GROSS MARGIN
Gross margin rate for fiscal 2016 was 45.5% as compared to 46.1% in fiscal 2015 and 45.9% in fiscal 2014.
The gross margin decrease of 60 basis points for fiscal 2016 as compared to fiscal 2015 was driven by a decrease of 40 basis points inmerchandise margin and a 20 basis point increase in occupancy costs as a percentage of sales. The decrease in our merchandisemargin of 40 basis points was mainly due to higher markdown activity associated with increased promotional activities. The increasein occupancy costs was due to occupancy expense increasing at a greater rate than sales.
Included in the gross margin for fiscal 2014 was a $2.5 million payment we received to exit our San Francisco store prior to the end ofits lease term. This payment favorably benefited the gross margin for fiscal 2014 by 60 basis points. Excluding the impact of thatlease termination, occupancy costs for fiscal 2015 improved 40 basis points over fiscal 2014, primarily due to the growing sales baseas well as the decrease in the average size of our DXL stores. Merchandise margins for fiscal 2015 increased 40 basis points as a resultof strong initial margins, a lower markdown rate and less promotional activities.
Occupancy costs also included DXL transition costs related to preopening rent and landlord terminations of $1.1 million in fiscal2016, $1.8 million in fiscal 2015 and $2.8 million in fiscal 2014.
SELLING, GENERAL AND ADMINISTRATIVE EXPENSES
SG&A expenses as a percentage of sales for fiscal 2016, 2015 and 2014 were 38.5%, 40.8% and 42.2%, respectively.

31
SG&A expenses for fiscal 2016 decreased $7.3 million, or 4.0%, to $173.3 million as compared to $180.6 million in fiscal 2015. Thisdecrease was primarily due to a decrease in advertising expense of approximately $5.4 million as well as a reduction in incentiveaccruals, including stock compensation, of approximately $5.4 million. These decreases were partially offset by increases in storepayroll of $1.1 million, associated with the higher sales base, healthcare costs of approximately $1.4 million and other corporate andsupporting costs of $1.0 million.
SG&A expenses for fiscal 2015 increased $5.8 million, or 3.3%, to $180.6 million as compared to $174.8 million in fiscal 2014. Theincrease in SG&A expenses of $5.8 million was due to increased store payroll and other supporting store costs of approximately $5.9million, associated with the higher sales base, an increase in incentive accruals of $1.4 million, associated with the Company’s long-term incentive plans, and other corporate and supporting costs of $0.9 million. These increases were partially offset by a reduction inmarketing expenses of $2.4 million.
SG&A expenses included approximately $3.1 million, $3.8 million and $4.0 million of DXL transition costs for increased payroll-related costs, such as pre-opening payroll, training and store operations for fiscal 2016, fiscal 2015 and fiscal 2014, respectively.
DEPRECIATION AND AMORTIZATION
Depreciation and amortization expense was $30.6 million for fiscal 2016 as compared to $28.4 million for fiscal 2015 and $24.0million for fiscal 2014. The year-over-year increases in depreciation and amortization expense for both fiscal 2016 and fiscal 2015 areprimarily related to the opening of 30 DXL retail and outlet stores in fiscal 2016 and 35 stores in fiscal 2015. Included in depreciationand amortization is the amortization of our “Casual Male” trademark of $0.3 million, $0.5 million and $1.0 million for fiscal 2016,2015 and 2014, respectively.
INTEREST EXPENSE, NET
Net interest expense for fiscal 2016 was $3.1 million as compared to $3.1 million for fiscal 2015 and $2.1 million for fiscal 2014. Ourinterest costs in fiscal 2016 were flat to fiscal 2015, primarily due to our inventory initiatives undertaken to improve liquidity,EBITDA growth and lower capital expenditures. The increase from fiscal 2014 to fiscal 2015 was due to increased borrowings underour credit facility to finance our DXL store openings.
We have funded a portion of our store growth with equipment financings of $26.4 million, a $15.0 million term loan and borrowingsunder our credit facility. At January 28, 2017, our total debt, net of unamortized debt issuance costs, has decreased $5.0 million fromJanuary 30, 2016. See “Liquidity and Capital Resources” below for more discussion regarding our credit facility, equipmentfinancings and term loan as well as our future liquidity needs.
INCOME TAXES
Pursuant to accounting rules, realization of our deferred tax assets, which relate principally to federal net operating loss carryforwardsexpiring from 2022 through 2036, is dependent on generating sufficient taxable income in the near term.
At the end of fiscal 2013, we entered a three-year cumulative loss and based on all positive and negative evidence at February 1, 2014,we established a full valuation allowance against our net deferred tax assets. While we expect to return to profitability, generatetaxable income and ultimately emerge from a three-year cumulative loss, based on our results for fiscal 2016 and our earningsguidance for fiscal 2017, we believe that a full valuation allowance remains appropriate at this time.
Our tax provision for fiscal 2016, fiscal 2015 and fiscal 2014 is primarily attributable current state margin tax and foreign income tax.
DISCONTINUED OPERATIONS
During fiscal 2014, we exited our direct business with Sears Canada. The loss from discontinued operations for fiscal 2014 included acharge of approximately $0.8 million related primarily to inventory reserves and sales allowances as a result of our decision to exit thebusiness. See Note J to the Notes to the Consolidated Financial Statements for additional disclosure regarding discontinuedoperations.

32
NET LOSS
The net loss for fiscal 2016 was $(2.3) million, or $(0.05) per diluted share, as compared to $(8.4) million, or $(0.17) per diluted share,in fiscal 2015 and a net loss of $(12.3) million, or $(0.25) per diluted share, in fiscal 2014.
(Certain amounts in the following table do not foot due to rounding)
(in millions) Fiscal 2016 Fiscal 2015 Fiscal 2014Operating income (loss) $ 1.0 $ (5.1) $ (8.8)Interest expense, net (3.1) (3.1) (2.1)Loss from continuing operations, before taxes $ (2.1) $ (8.1) $ (10.9)Less: Provision for income taxes (1) 0.2 0.3 0.2Loss from continuing operations $ (2.3) $ (8.4) $ (11.2)Income (loss) from discontinued operations $ — $ — $ (1.1)Net loss $ (2.3) $ (8.4) $ (12.3)
Net loss per diluted share $ (0.05) $ (0.17) $ (0.25)
(1) Because of the full valuation allowance established in fiscal 2013 against our deferred tax assets, no income tax benefit has beenrecognized. See Note D of Notes to the Consolidated Financial Statements for complete disclosure.
SEASONALITY
A comparison of sales in each quarter of the past three fiscal years is presented below. The amounts shown are not necessarilyindicative of actual trends, because such amounts also reflect the addition of new stores and the remodeling and closing of other storesduring these periods. Consistent with the retail apparel industry, our business is seasonal. Generally, the majority of our operatingincome is generated in the fourth quarter as a result of the impact of the holiday selling season. A comparison of quarterly sales, grossprofit, and net income per share for the past two fiscal years is presented in Note L of the Notes to the Consolidated FinancialStatements.
(in millions, except percentages) Fiscal 2016 Fiscal 2015 Fiscal 2014First quarter $ 107.9 24.0% $ 104.4 23.6% $ 96.7 23.3%Second quarter 117.9 26.2% 114.2 25.8% 104.2 25.2%Third quarter 101.9 22.6% 99.6 22.5% 93.6 22.6%Fourth quarter 122.6 27.2% 124.0 28.1% 119.5 28.9%
$ 450.3 100.0% $ 442.2 100.0% $ 414.0 100.0%
EFFECTS OF INFLATION
Although our operations are influenced by general economic trends, we do not believe that inflation has had a material effect on theresults of our operations in the last three fiscal years.
LIQUIDITY AND CAPITAL RESOURCES
Our primary sources of liquidity are cash generated from operations and availability under our credit facility with Bank of America,N.A., which was most recently amended in October 2014 (“Credit Facility”). Our current cash needs are primarily for working capital(essentially inventory requirements), capital expenditures, growth initiatives, and, as discussed further below, our stock repurchaseprogram which was announced in March 2017. With over 200 DXL stores now open, improved free cash flow and excess liquidityunder our Credit Facility, we believe that the repurchase of our stock is a good investment and will enhance shareholder value.
Our capital expenditures for fiscal 2017 are expected to be approximately $22.0 million, primarily related to the planned opening ofapproximately 20 new DXL retail and outlet stores and information technology projects. However, we expect to receiveapproximately $5.0 million in tenant allowances to offset these capital expenditures.
We expect to fund our store growth and stock repurchase program in fiscal 2017 primarily through cash flow from operations, withperiodic borrowings from our Credit Facility.

33
The following table sets forth financial data regarding our liquidity position at the end of the past three fiscal years:
(in millions, except ratios) Fiscal 2016 Fiscal 2015 Fiscal 2014Cash provided by operations $ 35.0 $ 18.4 $ 13.8Total debt, net of unamortized debt issuance costs $ 63.1 $ 68.1 $ 52.3Unused excess availability under Credit Facility $ 57.1 $ 66.0 $ 77.9Working capital $ 23.3 $ 28.1 $ 42.8Current ratio 1.2:1 1.2:1 1.5:1
For fiscal 2016, cash flow from operating activities improved by $16.6 million as a result of inventory initiatives implemented in fiscal2016 to improve timing of receipts and reduce weeks of supply on hand. This improvement, along with a decrease in capitalexpenditures of $4.2 million as a result of less store openings in fiscal 2016 and an overall decrease in the average square footage of anew DXL store as compared to fiscal 2015, resulted in an improvement in free cash flow of $20.8 million to $5.8 million from $(15.0)million for fiscal 2015.
The following is a summary of our total debt outstanding at January 28, 2017, with the associated unamortized debt issuance costs:
(in thousands)Gross DebtOutstanding
Less Debt IssuanceCosts
Net DebtOutstanding
Credit facility $ 44,436 $ (339) $ 44,097Equipment financing notes 6,589 (41) 6,548Term loan, due 2019 12,750 (296) 12,454Total debt $ 63,775 $ (676) $ 63,099
Credit Facility
Our Credit Facility with Bank of America, N.A. provides for a maximum committed borrowing of $125.0 million, which, pursuant toan accordion feature, may be increased to $175.0 million upon our request and the agreement of the lender(s) participating in theincrease. The Credit Facility includes a sublimit of $20.0 million for commercial and standby letters of credit and a sublimit of up to$15.0 million for swingline loans. The maturity date of the Credit Facility is October 29, 2019. Our Credit Facility is described inmore detail in Note C to the Notes to the Consolidated Financial Statements.
Borrowings made pursuant to the Credit Facility bear interest at a rate equal to the base rate (determined as the highest of (a) Bank ofAmerica N.A.’s prime rate, (b) the Federal Funds rate plus 0.50% and (c) the annual ICE-LIBOR (“LIBOR”) rate for the respectiveinterest period) plus a varying percentage, based on our borrowing base, of 0.50%-0.75% for prime-based borrowings and 1.50%-1.75% for LIBOR-based borrowings.
We had outstanding borrowings of $44.4 million under the Credit Facility at January 28, 2017. Outstanding standby letters of creditwere $2.9 million and outstanding documentary letters of credit were $0.5 million. The average monthly borrowing outstanding underthe Credit Facility during fiscal 2016 was approximately $52.1 million, resulting in an average unused excess availability ofapproximately $57.8 million. Unused excess availability at January 28, 2017 was $57.1 million. Our obligations under the CreditFacility are secured by a lien on substantially all of our assets, excluding (i) a first priority lien held by the lenders of the Term LoanFacility described below on certain equipment of the Company and (ii) intellectual property.
Equipment Financing Loans
We have entered into twelve Equipment Security Notes (the “Notes”), whereby we borrowed an aggregate of $26.4 million. TheNotes, which were issued between September 2013 and June 2014, were issued pursuant to a Master Loan and Security Agreementwith Banc of America Leasing & Capital, LLC, dated July 20, 2007 and most recently amended September 30, 2013. The Notes aresecured by a security interest in all of our rights, title and interest in and to certain equipment. The Notes are for 48 months and accrueinterest at fixed rates ranging from 3.07% to 3.50%. Principal and interest, in arrears, are payable monthly. We are no longer subject toany prepayment penalties. The Notes are secured by a security interest in all of the Company’s rights, title and interest in and tocertain equipment.
Term Loan, Due 2019
We have a $15.0 million senior secured term loan facility with Wells Fargo Bank, National Association as administrative andcollateral agent (the “Term Loan Facility”). The Term Loan Facility bears interest at a rate per annum equal to the greater of (a) 1.00%and (b) the one month LIBOR rate, plus 6.50%. Interest payments are payable on the first business day of each calendar month, and

34
increase by 2% following the occurrence and during the continuance of an “event of default,” as defined in the Term Loan Facility.The Term Loan Facility, which matures October 29, 2019, provides for quarterly principal payments on the first business day of eachcalendar quarter, which commenced the first business day of January 2015, in an aggregate principal amount equal to $250,000,subject to adjustment, with the balance payable on the termination date.
The Term Loan Facility includes usual and customary mandatory prepayment provisions for transactions of this type that are triggeredby the occurrence of certain events. In addition, the amounts advanced under the Term Loan Facility can be optionally prepaid inwhole or part. Prepayments are subject to an early termination fee in the amount of 1% of the amount prepaid prior to October 29,2017. There is no prepayment penalty after October 29, 2017.
The Term Loan Facility is secured by a first priority lien on certain of our equipment, and a second priority lien on substantially all ofour remaining assets, excluding intellectual property.
Stock Repurchase Program
Subsequent to the end of fiscal 2016, our Board of Directors approved a stock repurchase plan. Under the stock repurchase plan, wemay purchase up to $12.0 million of our common stock through open market and privately negotiated transactions during fiscal 2017.The timing and the amount of any repurchases of common stock will be determined based on the Company’s evaluation of marketconditions and other factors. The stock repurchase program is expected to commence in the first quarter of fiscal 2017 and will expireon February 3, 2018, but may be suspended, terminated or modified at any time for any reason. We expect to finance the repurchasesfrom operating funds and/or periodic borrowings on our Credit Facility. Any repurchased common stock will be held as treasurystock.
INVENTORY
At January 28, 2017, total inventories decreased to $117.4 million from $125.0 million at January 30, 2016. The reason for the $7.6million decrease in inventory is directly attributable to inventory initiatives implemented in fiscal 2016 to improve timing of receiptsand reduce weeks of supply on hand. As a result of these initiatives, the average inventory per total built-out square footage of storesat January 28, 2017 decreased 9.5% to $55.60 per square foot as compared to $61.46 per square foot at January 30, 2016. At January28, 2017, our clearance inventory represented 7.9% of our total inventory, as compared to 8.1% at January 30, 2016.
OFF-BALANCE SHEET ARRANGEMENTS
We have no off-balance sheet arrangements as defined by 303(a)(4) of Regulation S-K.
CONTRACTUAL OBLIGATIONS
The following table summarizes our contractual obligations at January 28, 2017, and the effect such obligations are expected to haveon our liquidity and cash flows in future periods (Certain amounts in the following table do not foot due to rounding):
Payments due by period
Contractual Obligations TotalLess than 1year 1 to 3 years 3 to 5 years
More than 5years
(in millions)Operating leases (1) $ 362.3 $ 58.8 $ 98.0 $ 84.5 $ 121.0Long-term debt obligations (2) 19.3 7.1 12.3 — —Interest on long-term debt obligations (3) 2.6 1.1 1.5 — —Non-merchandise purchase obligations (4) 0.1 0.1 — — —Merchandise purchase obligations (5) 33.0 10.5 22.5 — —
Total Commitments (6) $ 417.4 $ 77.7 $ 134.3 $ 84.5 $ 121.0
(1) Includes amounts due on our lease agreement for our corporate headquarters and distribution center and operating leases for allof our current store locations and certain equipment and auto leases.
(2) At January 28, 2017, we had $44.4 million outstanding under our credit facility, which is excluded from the above table.(3) Interest on long-term obligations is estimated using the current effective rate for each of the Equipment Financing Loans and
Term Loan over the remaining term of the respective debt, taking into account scheduled repayments.(4) Non-merchandise Purchase Obligations includes amounts due pursuant to a procurement arrangement for capital purchases.

35
(5) Merchandise Purchase Obligations include amounts for which we are contractually committed to meet certain minimumpurchases. These commitments are contingent on the supplier meeting its obligations under the contract. Excluded fromMerchandise Purchase Obligations in the table above are our outstanding obligations pursuant to open purchase orders. AtJanuary 28, 2017, we had approximately $69.2 million in open purchase orders. We estimate that approximately 95% of thesepurchase orders may be considered non-cancelable.
(6) At January 28, 2017, we had an unfunded Pension Obligation of $4.7 million and obligations under our Supplemental EmployeeRetirement Plan of $0.7 million, which are not included in the table because of uncertainty over whether or when furthercontributions will be required.
CAPITAL EXPENDITURES
The following table sets forth the open stores and related square footage at January 28, 2017 and January 30, 2016 respectively:
At January 28, 2017 At January 30, 2016
Store ConceptNumber ofStores
SquareFootage
Number ofStores
SquareFootage
(square footage in thousands)DXL Retail 192 1,542 166 1,369DXL Outlet 13 66 9 45Casual Male XL Retail 97 340 125 443Casual Male XL Outlet 36 113 40 126Rochester Clothing 5 51 5 51Total Stores 343 2,112 345 2,034
Below is a summary of store openings and closings from January 30, 2016 to January 28, 2017:
Number of Stores: DXL Retail DXL OutletCasual MaleXL Retail
Casual MaleXL Outlet
RochesterClothing Total Stores
At January 30, 2016 166 9 125 40 5 345New stores(1) 2 2Replaced stores(2) 26 2 (24) (2) 2Closed retail stores(3) (4) (2) (6)
At January 28, 2017 192 13 97 36 5 343
(1) Represents stores opened in new markets.(2) Represents the total number of DXL stores opened in existing markets with the corresponding total number of Casual Male XL
stores and/or Rochester Clothing stores closed in such markets in connection with those DXL store openings. Also includes twoDXL outlet stores that replaced Casual Male XL outlets during fiscal 2016.
(3) Represents closed stores for which there were no corresponding openings of a DXL store in the same market.
Our capital expenditures for fiscal 2016 were $29.2 million, as compared to $33.4 million in fiscal 2015 and $40.9 million in fiscal2014. Approximately $19.6 million related to the opening of 26 DXL stores, 4 DXL outlets and some costs for DXL stores that arecurrently under construction that will open in fiscal 2017. In addition, we spent approximately $5.5 million in managementinformation projects, which included continued enhancements for our e-commerce sites and upgrades to our merchandise planningsystems, with the remaining $4.1 million for general capital projects in our distribution center and corporate offices.
For fiscal 2017, our capital expenditures are expected to be approximately $22.0 million and we expect to receive approximately $5.0million in tenant allowances to offset these expenditures. Our budget includes approximately $13.7 million, excluding any allowance,related to the opening of 19 DXL retail stores and 1 DXL outlet stores, and approximately $8.3 million for continued informationtechnology projects and general overhead projects. In addition, we expect to close approximately 16 Casual Male XL stores and 3Casual Male XL outlet stores, the majority of which are in connection with the opening of the DXL retail and outlet stores in the samegeographic market.
Non-GAAP Reconciliations
We monitor certain non-GAAP financial measures on a regular basis in order to track the progress of our business, including themeasures below. We believe these measures provide helpful information with respect to the Company’s operating performance toshareholders, investors and analysts, and that the inclusion of these non-GAAP measures is important to assist investors in comparingour performance in fiscal 2016 to fiscal 2015 and fiscal 2014, on a comparable basis. However, these measures may not be

36
comparable to similar measures used by other companies and should not be considered superior to or as a substitute for operating netloss, loss from continuing operations, net loss per diluted share or cash flows from operating activities in accordance with GAAP.
Adjusted Loss From Continuing Operations and Adjusted Net Loss Per Diluted Share
Adjusted loss from continuing operations and adjusted net loss reflect an adjustment assuming a normal tax rate of 40%. We havefully reserved against our deferred tax assets and, therefore, net loss is not reflective of earnings assuming a “normal” tax position.Adjusted net loss provides investors with a useful indication of the financial performance of the business, on a comparative basis,assuming a normalized tax rate of 40%.
The following table is a reconciliation of loss from continuing operations and net loss (both on a GAAP basis) to adjusted loss fromcontinuing operations and adjusted net loss (both on a non-GAAP basis). (Certain amounts do not foot due to rounding):
Fiscal 2016 Fiscal 2015 Fiscal 2014
$Per dilutedshare $
Per dilutedshare $
Per dilutedshare
(in millions, except per share data)Loss from continuing operations, on a GAAP basis $ (2.3) $ (0.05) $ (8.4) $ (0.17) $ (11.2) $ (0.23)
Add back:Actual income tax provision 0.2 — 0.3 — 0.2 —Income tax benefit, assuming normal tax rate of 40% 0.8 0.02 3.3 0.07 $ 4.4 0.09Adjusted loss from continuing operations, non-GAAPbasis $ (1.3) $ (0.03) $ (4.9) $ (0.10) $ (6.6) $ (0.13)
Loss from discontinued operations, GAAPbasis — — — — (1.1) (0.02)
Adjusted net loss, non-GAAP basis $ (1.3) $ (0.03) $ (4.9) $ (0.10) $ (7.7) $ (0.16)
Weighted average number of common sharesoutstanding on a diluted basis 49.5 49.1 48.7
Free Cash Flow
We believe free cash flow before DXL capital expenditures is another important metric because it demonstrates our ability tostrengthen liquidity while also contributing to the funding of our DXL store growth. Fiscal 2016 was a turning point for us withrespect to liquidity, as our capital expenditures for DXL stores were funded by cash flow from operations resulting in a decrease intotal debt outstanding by the end of fiscal 2016. While we expect to use funds from our revolver, by year-end we expect all DXLstore growth in fiscal 2017 will have been funded by our operations, which will enable us to reduce our debt levels.
We calculate free cash flow as cash flow provided by operating activities less capital expenditures. We calculate free cash flow beforeDXL capital expenditures as cash flow provided by operating activities less capital expenditures other than DXL capital expenditures.Free cash flow excludes the mandatory and discretionary repayment of debt.
The following table provides a reconciliation of free cash flow and free cash flow before DXL capital expenditures:
Projected(in millions) Fiscal 2016 Fiscal 2015 Fiscal 2017Cash flow from operating activities (GAAP) (1) $ 35.0 $ 18.4 $37.0-$42.0Capital expenditures, infrastructure projects (9.6) (13.3) (8.3)
Free Cash Flow before DXL capital expenditures (non-GAAP) $ 25.4 $ 5.1 $28.7-$33.7Capital expenditures for DXL stores (19.6) (20.1) (13.7)
Free Cash Flow (non-GAAP) $ 5.8 $ (15.0) $15.0-$20.0
(1) Cash flow from operating activities includes lease incentives received against our capital expenditures. Projected cash flow fromoperating activities for fiscal 2017 includes an estimated $5.0 million in lease incentives.

37
EBITDA and EBITDA from Continuing Operations
EBITDA and EBITDA from continuing operations are presented because we believe that these measures are useful to investors inevaluating our performance. With the significant capital investment associated with the DXL transformation and, therefore,increasing levels of depreciation and interest, management uses EBITDA as a key metric to measure profitability and economicproductivity.
EBITDA is calculated as earnings before interest, taxes, depreciation and amortization. EBITDA from continuing operations iscalculated as EBITDA before discontinued operations.
The following table is a reconciliation of net loss on a GAAP basis to EBITDA and EBITDA from continuing operations, on a non-GAAP basis, for each fiscal year. (Certain amounts in the following table do not foot due to rounding):
Projected(in millions) Fiscal 2016 Fiscal 2015 Fiscal 2014 Fiscal 2017Net loss, on a GAAP basis $ (2.3) $ (8.4) $ (12.3) $(5.7)-$(11.7)Add back:Provision for income taxes 0.2 0.3 0.2 0.2Interest Expense 3.1 3.1 2.1 3.0Depreciation and amortization 30.6 28.4 24.0 32.5EBITDA $ 31.6 $ 23.3 $ 14.1 $24.0-$30.0Loss from discontinued operations — — (1.1) —EBITDA from continuing operations $ 31.6 $ 23.3 $ 15.2 $24.0-$30.0
CRITICAL ACCOUNTING POLICIES; USE OF ESTIMATES
Our financial statements are based on the application of significant accounting policies, many of which require our management tomake significant estimates and assumptions (see Note A to the Notes to the Consolidated Financial Statements). We believe that thefollowing items involve some of the more critical judgments in the application of accounting policies that currently affect our financialcondition and results of operations.
Stock-Based Compensation
We measure compensation cost for all stock-based awards at fair value on date of grant and recognize compensation over the serviceperiod for awards expected to vest.
The fair value of our stock options is determined using the Black-Scholes valuation model, which requires the input of subjectiveassumptions. These assumptions include estimating the length of time employees will retain their vested stock options beforeexercising them (the “expected term”), the estimated volatility of our common stock price over the expected term and the number ofoptions that will ultimately not complete their vesting requirements (“forfeitures”). Changes in these subjective assumptions canmaterially affect the estimate of fair value of stock-based compensation and, consequently, the related amount recognized as anexpense on the Consolidated Statements of Operations. As required under the accounting rules, we review our valuation assumptionsat each grant date and, as a result, we are likely to change our valuation assumptions used to value employee stock-based awardsgranted in future periods. The values derived from using the Black-Scholes model are recognized as expense over the service period,net of estimated forfeitures. Actual results, and future changes in estimates, may differ substantially from these current estimates. Forperformance-based awards, no compensation expense is recognized until the performance targets are deemed probable. For fiscal2016, 2015 and 2014, we recognized total stock-based compensation expense of $1.3 million, $2.2 million and $3.0 million,respectively.
Long-Term Incentive Plans
During fiscal 2016, we had three active Long-Term Incentive Plans (“LTIP”s): 2013-2016 LTIP, 2016 Long-Term Incentive Wrap-Around Plan (“2016 Wrap”) and the 2016-2017 LTIP. See Note F to the Consolidated Financial Statements for a complete discussionof our LTIPs.
All time-based awards granted pursuant to our LTIPs are amortized, net of estimated forfeitures, over each LTIP’s respective vestingperiods.

38
The 2013-2016 LTIP included performance-based equity awards. Based on the Company’s performance over the performanceperiods and the improbability of achieving performance targets, no stock-based compensation expense had been recognized. AtJanuary 28, 2017, the performance targets under our 2013-2016 LTIP were not achieved, and accordingly, subsequent to year-end onMarch 15, 2017, as a result of the Compensation Committee’s review of the audited consolidated financial statements, all outstandingperformance-based awards were forfeited.
Our 2016 Wrap and 2016-2017 LTIP both contain a dollar-denominated performance-based component. Equity awards will only begranted if such performance targets are achieved. Accordingly, each quarter the Company reviews its expected achievement againstsuch performance targets to assess whether an accrual is necessary. All accruals will be recorded as a liability. If performance targetsare achieved and equity awards are granted, the related cost of those awards will be reclassed from the accrual to stock-basedcompensation.
For fiscal 2016, the Company has accrued as a liability approximately $1.9 million based on partial achievement of the performancetargets under the 2016 Wrap. Subsequent to year-end, on March 15, 2017, the Company’s Compensation Committee of the Board ofDirectors reviewed the results for fiscal 2016 and approved for awards totaling $2.3 million to be granted on March 20, 2017. Allawards are subject to further vesting through the end of the second quarter of fiscal 2017.
With respect to the performance-based component of the 2016-2017 LTIP, which approximates $1.9 million at target, RSUs will begranted at the end of the performance period if the performance targets are achieved. Through the end of fiscal 2016, we accrued, as aliability, approximately $0.3 million in expense related to the potential payout of performance awards under the 2016-2017 LTIP.
Inventory
We value inventory at the lower of cost or market, using a weighted-average cost method. We review our inventory to identify slow-moving and broken assortments. We use markdowns to clear merchandise and will record inventory reserves if the estimated futureselling price is less than cost. In addition, an inventory shrink estimate is made each period that reduces the value of inventory for lostor stolen merchandise. We perform physical inventories throughout the year and adjust the shrink reserves accordingly.
Impairment of Long-Lived Assets
We review our long-lived assets for impairment when indicators of impairment are present and the undiscounted cash flow estimatedto be generated by those assets is less than the assets’ carrying amount. We evaluate our long-lived assets for impairment at a storelevel for all our retail locations. If actual market conditions are less favorable than management’s projections, future write-offs may benecessary.
For fiscal 2016 and fiscal 2014, we recorded impairment charges of $0.4 million and $0.3 million, respectively, to write-downproperty and equipment. The impairments related to stores with carrying values which exceeded fair value. There was no materialimpairment charge for long-lived assets in fiscal 2015.
Intangibles
In accordance with ASC Topic 350, Intangibles Goodwill and Other, we evaluate our intangible assets with indefinite lives at leastannually for impairment by analyzing the estimated fair value.
In the fourth quarter of fiscal 2016, we performed our annual testing of our “Rochester” trademark for potential impairment. Utilizingan income approach with appropriate royalty rates applied, we concluded that the “Rochester” trademark, with a carrying value of$1.5 million, was not impaired.
Based on the expected closure of our Casual Male XL retail stores, at January 28, 2012, our “Casual Male” trademark was reclassifiedas a definite-lived asset. The trademark is being amortized, on an accelerated basis, through fiscal 2018, its estimated useful life. AtJanuary 28, 2017, the carrying value of the “Casual Male” trademark was $0.6 million.

39
Deferred Taxes
In accordance with ASC Topic 740, Income Taxes, on a quarterly basis, we evaluate the realizability of our deferred tax assets and, ifneeded, establish a valuation allowance against those assets if it is determined that it is more likely than not that the deferred tax assetswill not be realized.
In the fourth quarter of fiscal 2013, we entered into a three-year cumulative loss position and based on forecasts at that time, weexpected the cumulative three-year loss to increase as of the end of fiscal 2014. Management determined that this representedsignificant negative evidence at February 1, 2014 and a full valuation allowance was established against our net deferred tax assets.While we have projected that the Company will return to profitability, generate taxable income and ultimately emerge from a three-year cumulative loss, based on actual results for fiscal 2016 and our forecast for fiscal 2017, we believe that a full allowance remainsappropriate at this time.
RECENT ACCOUNTING PRONOUNCEMENTS
We have reviewed accounting pronouncements and interpretations thereof that have effective dates during the periods reported and infuture periods. We believe that the following impending standards may have an impact on our future filings. The applicability of anystandard will be evaluated by us and is still subject to our review.
In May 2014, the FASB issued ASU 2014-09, “Revenue from Contracts with Customers,” which supersedes the revenue recognitionrequirements in ASC 605, “Revenue Recognition,” as well as various other sections of the ASC, such as, but not limited to, ASC 340-20, “Other Assets and Deferred Costs - Capitalized Advertising Costs”. The core principle of ASU 2014-09 is that an entity shouldrecognize revenue in a way that depicts the transfer of promised goods or services to customers in an amount that reflects theconsideration to which the entity expects to be entitled in exchange for those goods or services. ASU 2014-09 will be effective forfiscal years, and interim periods within those years, beginning after December 15, 2017, and is to be applied either retrospectively toeach prior reporting period presented or with the cumulative effect recognized at the date of initial adoption as an adjustment to theopening balance of retained earnings (or other appropriate components of equity or net assets on the balance sheet). Early adoption ispermitted after December 15, 2016. We expect to adopt ASU 2014-09 in the first quarter of fiscal 2018 and will not adopt early. Wehave not yet selected a transition method or completed our assessment of the effect that ASU No. 2014-09 will have on ourConsolidated Financial Statements.
In July 2015, the FASB issued ASU 2015-11, "Inventory (Topic 330): Simplifying the Measurement of Inventory," which applies toinventory that is measured using first-in, first-out ("FIFO") or average cost. Under the updated guidance, an entity should measureinventory that is within scope at the lower of cost and net realizable value, which is the estimated selling price in the ordinary courseof business, less reasonably predictable costs of completion, disposal and transportation. This ASU is effective for annual and interimperiods beginning after December 15, 2016, and should be applied prospectively with early adoption permitted at the beginning of aninterim or annual reporting period. We do not expect the adoption of this pronouncement to have a material impact on ourConsolidated Financial Statements.
In February 2016, the FASB issued ASU 2016-02, “Leases (Topic 842),” which will require an entity to recognize lease assets andlease liabilities on its balance sheet and will increase disclosure requirements on its leasing arrangements. The ASU is effective forannual periods beginning after December 15, 2018, and interim periods therein. Early adoption is permitted. In the financialstatements in which the ASU is first applied, leases shall be measured and recognized at the beginning of the earliest comparativeperiod presented with an adjustment to equity. While we are still evaluating and quantifying the impact this pronouncement will haveon our Consolidated Financial Statements, we expect the adoption of this pronouncement will have a material impact on ourConsolidated Financial Statements.
In March 2016, the FASB issued ASU 2016-04, “Liabilities—Extinguishments of Liabilities: Recognition of Breakage for CertainPrepaid Stored-Value Products,” which amends exempting gift cards and other prepaid stored-value products from the guidance onextinguishing financial liabilities. Rather, they will be subject to breakage accounting consistent with the new revenue guidance inTopic 606. However, the exemption only applies to breakage liabilities that are not subject to unclaimed property laws or that areattached to segregated bank accounts (e.g., consumer debit cards). The ASU is effective for fiscal years beginning after December 15,2017, and interim periods within those fiscal years. Early adoption is permitted. We do not expect the adoption of this pronouncementto have a material impact on our Consolidated Financial Statements.
In March 2016, the FASB issued ASU 2016-09, “Compensation - Stock Compensation (Topic 718) - Improvements to EmployeeShare-Based Payment Accounting,” which simplifies several aspects of the accounting for share-based payment transactions,including the income tax consequences, classification of awards, and classification on the statement of cash flows. The standard is

40
effective for fiscal years beginning after December 15, 2016, including interim periods within those fiscal years. We do not expect theadoption of this pronouncement to have a material impact on our Consolidated Financial Statements.
In August 2016, the FASB issued ASU 2016-15, “Statement of Cash Flows (Topic 230): Classification of Certain Cash Receipts andCash Payments,” which reduces the existing diversity in practice in how certain cash receipts and cash payments are presented andclassified in the statement of cash flows under Topic 230. The ASU is effective for fiscal years beginning after December 15, 2017,and interim periods within those fiscal years. We do not expect the adoption of this pronouncement to have a material impact on ourConsolidated Financial Statements.
In October 2016, the FASB issued ASU 2016-16, “Income Taxes(Topic 740): Intra-Entity Transfer of Assets Other Than Inventory,”which reduces the existing diversity in practice in how income tax consequences of an intra-entity transfer of an asset other thaninventory should be recognized. The amendments in ASU 2016-16 require an entity to recognize such income tax consequences whenthe intra-entity transfer occurs rather than waiting until such time as the asset has been sold to an outside party. The ASU is effectivefor fiscal years beginning after December 15, 2017, and interim periods within those fiscal years. We do not expect the adoption ofthis pronouncement to have a material impact on our Consolidated Financial Statements.

41
Item 7A. Quantitative and Qualitative Disclosures About Market Risk
In the normal course of business, our financial position and results of operations are routinely subject to a variety of risks, includingmarket risk associated with interest rate movements on borrowings and foreign currency fluctuations. We regularly assess these risksand have established policies and business practices to protect against the adverse effects of these and other potential exposures.
Interest Rates
We utilize cash from our Credit Facility to fund our working capital needs. Our Credit Facility is not used for trading or speculativepurposes. In addition, we have available letters of credit as sources of financing for our working capital requirements. Borrowingsunder the Credit Facility, which expires October 29, 2019, bear interest at variable rates based on Bank of America’s prime rate orLIBOR. At January 28, 2017, we had outstanding borrowings of approximately $44.4 million, of which approximately $36.0 millionwere in LIBOR-based contracts with an interest rate of approximately 2.22%. The remainder were prime-based borrowings, with arate of 4.25%. We also have a term loan, with an outstanding balance of $12.8 million at January 28, 2017, which bears interest at avariable rate based on one-month LIBOR rates plus 6.5%.
Based upon a sensitivity analysis as of January 28, 2017, assuming average outstanding borrowings during fiscal 2016 of $52.1million under our Credit Facility and an average outstanding balance under our term loan of $13.3 million, a 50 basis point increase ininterest rates would have increased interest expense by approximately $0.3 million on an annualized basis.
Foreign Currency
Our Rochester Clothing store located in London, England conducts business in British pounds. If the value of the British poundagainst the U.S. dollar weakens, the revenues and earnings of this store will be reduced when they are translated or re-measured toU.S. dollars. Also, the value of these assets to U.S. dollars may decline. As of January 28, 2017 sales from our London RochesterClothing store were immaterial to consolidated sales. As such, we believe that movement in foreign currency exchange rates will nothave a material adverse effect on our financial position or results of operations.

42
Item 8. Financial Statements and Supplementary Data
DESTINATION XL GROUP, INC.
INDEX TO CONSOLIDATED FINANCIAL STATEMENTS
PageReport of Independent Registered Public Accounting Firm............................................................................................................... 43
Consolidated Financial Statements:
Consolidated Balance Sheets at January 28, 2017 and January 30, 2016 ................................................................................ 44
Consolidated Statements of Operations for the Fiscal Years Ended January 28, 2017, January 30, 2016 and January 31,2015 ..................................................................................................................................................................................... 45
Consolidated Statements of Comprehensive Income (Loss) for the Fiscal Years Ended January 28, 2017, January 30,2016 and January 31, 2015 ................................................................................................................................................... 46
Consolidated Statements of Changes in Stockholders’ Equity for the Fiscal Years Ended January 28, 2017, January 30,2016 and January 31, 2015 ................................................................................................................................................... 47
Consolidated Statements of Cash Flows for the Fiscal Years Ended January 28, 2017, January 30, 2016 and January 31,2015 ...................................................................................................................................................................................... 48
Notes to Consolidated Financial Statements....................................................................................................................................... 49

43
REPORT OF INDEPENDENT REGISTERED PUBLIC ACCOUNTING FIRM
The Board of Directors and ShareholdersDestination XL Group, Inc.
We have audited the accompanying consolidated balance sheets of Destination XL Group, Inc. and subsidiaries (the Company) as ofJanuary 28, 2017 and January 30, 2016 and the related consolidated statements of operations, comprehensive income (loss), changesin stockholders’ equity, and cash flows for each of the years in the three-year period ended January 28, 2017. These consolidatedfinancial statements are the responsibility of the Company’s management. Our responsibility is to express an opinion on theseconsolidated financial statements based on our audits.
We conducted our audits in accordance with the standards of the Public Company Accounting Oversight Board (United States). Thosestandards require that we plan and perform the audit to obtain reasonable assurance about whether the financial statements are free ofmaterial misstatement. An audit includes examining, on a test basis, evidence supporting the amounts and disclosures in the financialstatements. An audit also includes assessing the accounting principles used and significant estimates made by management, as well asevaluating the overall financial statement presentation. We believe that our audits provide a reasonable basis for our opinion.
In our opinion, the consolidated financial statements referred to above present fairly, in all material respects, the financial position ofDestination XL Group, Inc. and subsidiaries as of January 28, 2017 and January 30, 2016, and the results of their operations and theircash flows for each of the years in the three-year period ended January 28, 2017, in conformity with U.S. generally acceptedaccounting principles.
We also have audited, in accordance with the standards of the Public Company Accounting Oversight Board (United States),Destination XL Group, Inc.’s internal control over financial reporting as of January 28, 2017, based on criteria established in InternalControl—Integrated Framework (2013) issued by the Committee of Sponsoring Organizations of the Treadway Commission (COSO),and our report dated March 20, 2017 expressed an unqualified opinion on the effectiveness of the Company’s internal control overfinancial reporting.
/s/ KPMG LLP
Boston, MassachusettsMarch 20, 2017

44
DESTINATION XL GROUP, INC.CONSOLIDATED BALANCE SHEETSJanuary 28, 2017 and January 30, 2016
(In thousands, except share data)
January 28, 2017 January 30, 2016(Fiscal 2016) (Fiscal 2015)
ASSETSCurrent assets:Cash and cash equivalents $ 5,572 $ 5,170Accounts receivable 7,114 4,721Inventories 117,446 125,014Prepaid expenses and other current assets 8,817 8,254Total current assets 138,949 143,159
Property and equipment, net of accumulated depreciation and amortization 124,347 124,962
Other assets:Intangible assets 2,228 2,669Other assets 3,804 3,557Total assets $ 269,328 $ 274,347
LIABILITIES AND STOCKHOLDERS' EQUITYCurrent liabilities:Current portion of long-term debt $ 6,941 $ 7,155Current portion of deferred gain on sale-leaseback 1,465 1,465Accounts payable 31,258 30,684Accrued expenses and other current liabilities 31,938 33,778Borrowings under credit facility 44,097 41,984Total current liabilities 115,699 115,066
Long-term liabilities:Long-term debt, net of current portion 12,061 19,003Deferred rent and lease incentives 35,421 30,934Deferred gain on sale-leaseback, net of current portion 11,723 13,189Deferred tax liability 222 196Other long-term liabilities 5,682 7,555Total long-term liabilities 65,109 70,877
Commitments and contingencies
Stockholders' equity:Preferred stock, $0.01 par value, 1,000,000 shares authorized, none issued — —Common stock, $0.01 par value, 100,000,000 shares authorized, 61,637,164 and61,692,285 shares issued at January 28, 2017 and January 30, 2016, respectively 616 617
Additional paid-in capital 304,466 302,727Treasury stock at cost, 10,877,439 shares at January 28, 2017 and January 30, 2016 (87,977) (87,977)Accumulated deficit (122,567) (120,311)Accumulated other comprehensive loss (6,018) (6,652)Total stockholders' equity 88,520 88,404Total liabilities and stockholders' equity $ 269,328 $ 274,347
The accompanying notes are an integral part of the consolidated financial statements.

45
DESTINATION XL GROUP, INC.CONSOLIDATED STATEMENTS OF OPERATIONS
For the fiscal years ended January 28, 2017, January 30, 2016 and January 31, 2015(In thousands, except per share data)
January 28, 2017 January 30, 2016 January 31, 2015(Fiscal 2016) (Fiscal 2015) (Fiscal 2014)
Sales $ 450,283 $ 442,221 $ 414,020Cost of goods sold including occupancy costs 245,402 238,382 224,006Gross profit 204,881 203,839 190,014
Expenses:Selling, general and administrative 173,283 180,570 174,814Depreciation and amortization 30,621 28,359 24,002
Total expenses 203,904 208,929 198,816
Operating income (loss) 977 (5,090) (8,802)
Interest expense, net (3,067) (3,058) (2,132)
Loss from continuing operations before provision for income taxes (2,090) (8,148) (10,934)
Provision for income taxes 166 260 243
Loss from continuing operations (2,256) (8,408) (11,177)
Loss from discontinued operations, net of taxes — — (1,118)
Net loss $ (2,256) $ (8,408) $ (12,295)
Net loss per share - basic and diluted:Loss from continuing operations $ (0.05) $ (0.17) $ (0.23)Loss from discontinued operations $ 0.00 $ 0.00 $ (0.02)Net loss per share - basic and diluted $ (0.05) $ (0.17) $ (0.25)
Weighted-average number of common shares outstanding:Basic 49,544 49,089 48,740Diluted 49,544 49,089 48,740
The accompanying notes are an integral part of the consolidated financial statements.

46
DESTINATION XL GROUP, INC.CONSOLIDATED STATEMENTS OF COMPREHENSIVE INCOME (LOSS)
For the fiscal years ended January 28, 2017, January 30, 2016 and January 31, 2015(In thousands)
January 28, 2017 January 30, 2016 January 31, 2015(Fiscal 2016) (Fiscal 2015) (Fiscal 2014)
Net loss $ (2,256) $ (8,408) $ (12,295)
Other comprehensive income (loss) before taxes:Foreign currency translation (242) (96) (430)Pension plan 876 1,682 (3,248)Other comprehensive income (loss) before taxes 634 1,586 (3,678)
Tax provision related to items of other comprehensive income (loss) — — —Other comprehensive income (loss), net of tax 634 1,586 (3,678)Comprehensive loss $ (1,622) $ (6,822) $ (15,973)
The accompanying notes are an integral part of the consolidated financial statements.
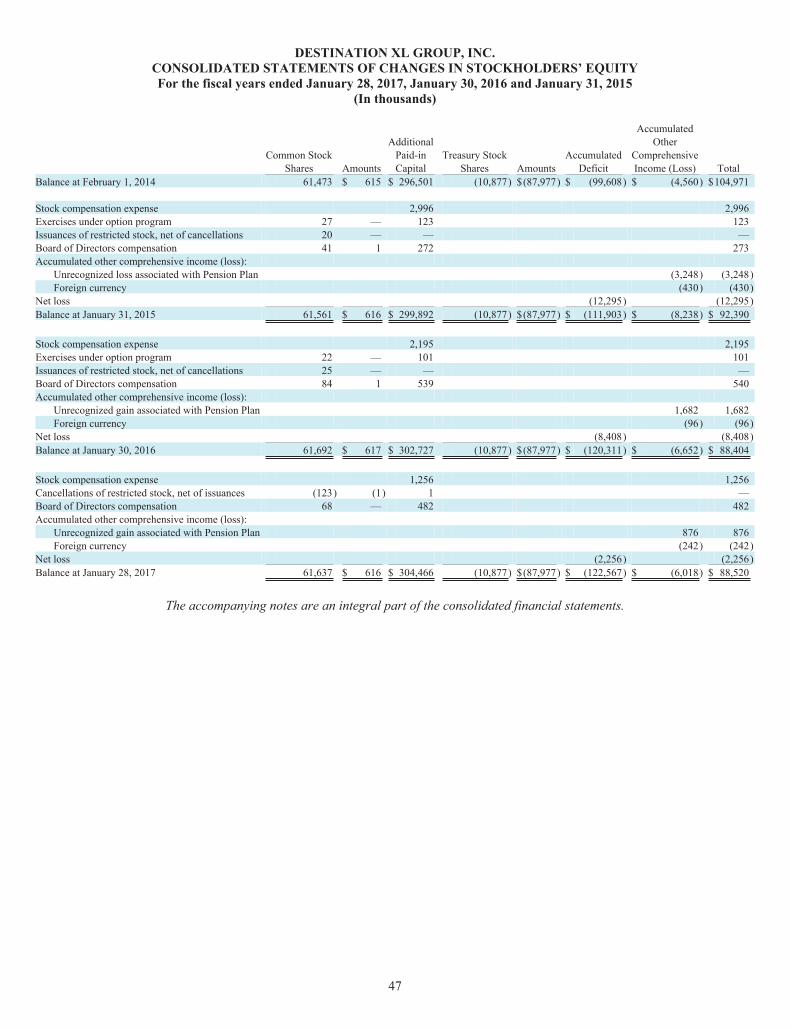
47
DESTINATION XL GROUP, INC.CONSOLIDATED STATEMENTS OF CHANGES IN STOCKHOLDERS’ EQUITYFor the fiscal years ended January 28, 2017, January 30, 2016 and January 31, 2015
(In thousands)
AccumulatedAdditional Other
Common Stock Paid-in Treasury Stock Accumulated ComprehensiveShares Amounts Capital Shares Amounts Deficit Income (Loss) Total
Balance at February 1, 2014 61,473 $ 615 $ 296,501 (10,877) $(87,977) $ (99,608) $ (4,560) $104,971
Stock compensation expense 2,996 2,996Exercises under option program 27 — 123 123Issuances of restricted stock, net of cancellations 20 — — —Board of Directors compensation 41 1 272 273Accumulated other comprehensive income (loss):
Unrecognized loss associated with Pension Plan (3,248) (3,248)Foreign currency (430) (430)
Net loss (12,295) (12,295)Balance at January 31, 2015 61,561 $ 616 $ 299,892 (10,877) $(87,977) $ (111,903) $ (8,238) $ 92,390
Stock compensation expense 2,195 2,195Exercises under option program 22 — 101 101Issuances of restricted stock, net of cancellations 25 — — —Board of Directors compensation 84 1 539 540Accumulated other comprehensive income (loss):
Unrecognized gain associated with Pension Plan 1,682 1,682Foreign currency (96) (96)
Net loss (8,408) (8,408)Balance at January 30, 2016 61,692 $ 617 $ 302,727 (10,877) $(87,977) $ (120,311) $ (6,652) $ 88,404
Stock compensation expense 1,256 1,256Cancellations of restricted stock, net of issuances (123) (1) 1 —Board of Directors compensation 68 — 482 482Accumulated other comprehensive income (loss):
Unrecognized gain associated with Pension Plan 876 876Foreign currency (242) (242)
Net loss (2,256) (2,256)Balance at January 28, 2017 61,637 $ 616 $ 304,466 (10,877) $(87,977) $ (122,567) $ (6,018) $ 88,520
The accompanying notes are an integral part of the consolidated financial statements.

48
DESTINATION XL GROUP, INC.CONSOLIDATED STATEMENTS OF CASH FLOWS
For the fiscal years ended January 28, 2017, January 30, 2016 and January 31, 2015(In thousands)
January 28, 2017 January 30, 2016 January 31, 2015(Fiscal 2016) (Fiscal 2015) (Fiscal 2014)
Cash flows from operating activities:Net loss $ (2,256) $ (8,408) $ (12,295)Adjustments to reconcile net loss to net cash provided by operatingactivities:Amortization of deferred gain on sale-leaseback (1,466) (1,465) (1,466)Amortization of deferred debt issuance costs 276 279 192Depreciation and amortization 30,621 28,359 24,002Deferred taxes, net of valuation allowance 26 105 91Stock compensation expense 1,256 2,195 2,996Issuance of common stock to Board of Directors 482 540 273
Changes in operating assets and liabilities:Accounts receivable (2,393) (1,102) 4,728Inventories 7,568 (9,794) (9,664)Prepaid expenses and other current assets (563) 659 (1,196)Other assets (247) 350 (667)Accounts payable 574 705 (2,966)Deferred rent and lease incentives 4,487 2,084 6,015Accrued expenses and other liabilities (3,405) 3,883 3,762
Net cash provided by operating activities 34,960 18,390 13,805
Cash flows from investing activities:Additions to property and equipment, net (29,239) (33,447) (40,927)
Net cash used for investing activities (29,239) (33,447) (40,927)
Cash flows from financing activities:Net borrowings under credit facility 1,993 23,044 10,373Proceeds from the issuance of long-term debt — — 23,912Principal payments on long-term debt (7,312) (7,489) (6,478)Costs associated with debt issuances — (15) (766)Proceeds from the exercise of stock options — 101 123
Net cash provided by (used for) financing activities (5,319) 15,641 27,164Net increase in cash and cash equivalents 402 584 42Cash and cash equivalents:Beginning of period 5,170 4,586 4,544End of period $ 5,572 $ 5,170 $ 4,586
The accompanying notes are an integral part of the consolidated financial statements.

49
DESTINATION XL GROUP, INC.
NOTES TO CONSOLIDATED FINANCIAL STATEMENTSJANUARY 28, 2017
A. SUMMARY OF SIGNIFICANT ACCOUNTING POLICIES
Nature of Business
Destination XL Group, Inc. (collectively with its subsidiaries referred to as the “Company”) is the largest specialty retailer in theUnited States of big & tall men’s apparel. The Company operates under the trade names of Destination XL® (DXL®), DXL Outlets®,Casual Male XL®, Casual Male XL Outlets, Rochester Clothing, ShoesXL® and LivingXL®. At January 28, 2017, the Companyoperated 192 DXL stores, 97 Casual Male XL, 36 Casual Male XL outlets, 13 DXL outlets and 5 Rochester Clothing stores locatedthroughout the United States, including one store in London, England. The Company also operates a direct business, which includesbrand mailers and an aggregated e-commerce site to support its brands and product extensions.
Basis of Presentation
The consolidated financial statements include the accounts of the Company and its subsidiaries. All significant intercompanyaccounts, transactions and profits are eliminated.
The accompanying financial statements have been prepared in accordance with accounting principles generally accepted in the UnitedStates. The preparation of financial statements in conformity with generally accepted accounting principles requires management tomake estimates and assumptions that affect the reported amounts of assets and liabilities and disclosures of contingent liabilities as ofthe date of the financial statements and the reported amounts of revenue and expenses during the reporting period. Actual results coulddiffer from estimates.
Subsequent Events
All appropriate subsequent event disclosures, if any, have been made in these Notes to the Consolidated Financial Statements.
Segment Reporting
The Company reports its operations as one reportable segment, Big & Tall Men’s Apparel, which consists of two principal operatingsegments: its retail business and its direct business. The Company considers its operating segments to be similar in terms of economiccharacteristics, production processes and operations, and have therefore aggregated them into a single reporting segment, consistentwith its omni-channel business approach. The direct operating segment includes the operating results and assets for LivingXL andShoesXL.
Fiscal Year
The Company’s fiscal year is a 52-week or 53-week period ending on the Saturday closest to January 31. Fiscal years 2016, 2015 and2014, which were 52-week periods, ended on January 28, 2017, January 30, 2016 and January 31, 2015, respectively.
Cash and Cash Equivalents
Cash and cash equivalents consist of cash in banks and short-term investments, which have a maturity of ninety days or less whenacquired. Included in cash equivalents are credit card and debit card receivables from banks, which generally settle within two to fourbusiness days.
Accounts Receivable
Accounts receivable primarily includes amounts due for tenant allowances and rebates from certain vendors. For fiscal 2016, fiscal2015 and fiscal 2014, the Company has not incurred any losses on its accounts receivable.
Fair Value of Financial Instruments
ASC Topic 825, Financial Instruments, requires disclosure of the fair value of certain financial instruments. The carrying amounts ofcash and cash equivalents, accounts receivable, accounts payable, accrued expenses and short-term borrowings approximate fair valuebecause of the short maturity of these instruments.

50
ASC Topic 820, Fair Value Measurements and Disclosures, defines fair value, establishes a framework for measuring fair value andenhances disclosures about fair value measurements.
The valuation techniques utilized are based upon observable and unobservable inputs. Observable inputs reflect market data obtainedfrom independent sources, while unobservable inputs reflect internal market assumptions. These two types of inputs create thefollowing fair value hierarchy:
Level 1 – Quoted prices in active markets for identical assets or liabilities.
Level 2 – Observable inputs other than Level 1 prices such as quoted prices for similar assets or liabilities; quoted prices inmarkets that are not active or other inputs that are observable or can be corroborated by observable market data for substantiallythe full term of the related asset or liabilities.
Level 3 – Unobservable inputs that are supported by little or no market activity and that are significant to the fair value of assetsor liabilities.
The Company utilizes observable market inputs (quoted market prices) when measuring fair value whenever possible.
The fair value of long-term debt at January 28, 2017 approximates the carrying amount based upon terms available to the Companyfor borrowings with similar arrangements and remaining maturities. See Note C, “Debt Obligations”, for more discussion.
The fair value of indefinite-lived assets, which consists of the Company’s “Rochester” trademark, is measured on a non-recurringbasis in connection with the Company’s annual impairment test. The fair value of the trademark is determined using the relief fromroyalty method based on unobservable inputs and are classified within Level 3 of the valuation hierarchy. See Intangibles below.
Retail stores that have indicators of impairment and fail the recoverability test (based on undiscounted cash flows) are measured forimpairment by comparing the fair value of the assets against their carrying value. Fair value of the assets is estimated using a projecteddiscounted cash flow analysis and is classified within Level 3 of the valuation hierarchy. See Impairment of Long-Lived Assets below.
Inventories
All inventories are valued at the lower of cost or market, using a weighted-average cost method.
Property and Equipment
Property and equipment are stated at cost. Major additions and improvements are capitalized while repairs and maintenance arecharged to expense as incurred. Upon retirement or other disposition, the cost and related depreciation of the assets are removed fromthe accounts and the resulting gain or loss, if any, is reflected in income. Depreciation is computed on the straight-line method overthe assets’ estimated useful lives as follows:
Furniture and fixtures Five to ten yearsEquipment Five to ten yearsLeasehold improvements Lesser of useful lives or related lease termHardware and software Three to seven years
Intangibles
ASC Topic 805, “Business Combinations”, requires that all business combinations be accounted for under the purchase method. Thestatement further requires separate recognition of intangible assets that meet one of two criteria set forth in the statement. Under ASCTopic 350, “Intangibles Goodwill and Other”, goodwill and intangible assets with indefinite lives are tested at least annually forimpairment. At each reporting period, management analyzes current events and circumstances to determine whether the indefinite lifeclassification for its “Rochester” trademark continues to be valid. If circumstances warrant a change to a finite life, the carrying valueof the intangible asset would then be amortized prospectively over the estimated remaining useful life. The Company’s “Casual Male”trademark is considered a finite-lived asset. Other intangible assets with defined lives are amortized over their useful lives.
At least annually, as of the Company’s December month-end, the Company evaluates its “Rochester” trademark. The Companyperforms an impairment analysis and records an impairment charge for any intangible assets with a carrying value in excess of its fairvalue.

51
In the fourth quarter of fiscal 2016, the “Rochester” trademark was tested for potential impairment, utilizing the relief from royaltymethod to determine the estimated fair value. The Company concluded that the “Rochester” trademark, with a carrying value of $1.5million at January 28, 2017, was not impaired. Although some of the Rochester locations are closing as part of the DXL expansion,the Rochester Clothing stores that will remain open as well as the Rochester brands that are sold in our DXL stores and website arecurrently expected to generate more than sufficient cash flows to support the carrying value of $1.5 million for the “Rochester”trademark.
During the fiscal 2011 annual evaluation of intangibles, the Company determined that its “Casual Male” trademark could no longer beconsidered an indefinite-lived asset. As the Company opens DXL stores, it is closing the majority of its Casual Male XL stores inthose respective markets. The carrying value of the trademark is being amortized on an accelerated basis against projected cash flowsthrough fiscal 2018, its estimated remaining useful life.
Below is a table showing the changes in the carrying value of the Company’s intangible assets from January 30, 2016 to January 28,2017:
(in thousands)January 30,2016 Additions Impairment Amortization
January 28,2017
"Rochester" trademark $ 1,500 $ — $ — $ — $ 1,500"Casual Male" trademark 940 — — (341) 599Other intangibles (1) 229 — — (100) 129Total intangible assets $ 2,669 $ — $ — $ (441) $ 2,228
(1) Other intangibles consist of customer lists, which have a finite life of 16 years based on its estimated economic useful life. AtJanuary 28, 2017, customer lists have a remaining life of 1.3 years.
The gross carrying amount and accumulated amortization of the customer lists and “Casual Male” trademark, subject to amortization,were $7.7 million and $7.0 million, respectively, at January 28, 2017 and $7.7 million and $6.5 million, respectively, at January 30,2016. Amortization expense for fiscal 2016, 2015 and 2014 was $0.4 million, $0.6 million and $1.1 million, respectively.
Expected amortization expense for the Company’s “Casual Male” trademark and customer lists, for the next five fiscal years is asfollows:
FISCAL YEAR (in thousands)2017 $ 4072018 $ 3212019 —2020 —2021 —
Pre-opening Costs
The Company expenses all pre-opening costs for its stores as incurred.
Advertising Costs
The Company expenses in-store advertising costs as incurred. Television advertising costs are expensed in the period in which theadvertising is first aired. Direct response advertising costs, if any, are deferred and amortized over the period of expected directmarketing revenues, which is less than one year. There were no deferred direct response costs at January 28, 2017 and January 30,2016. Advertising expense, which is included in selling, general and administrative expenses, was $18.2 million, $23.6 million and$26.0 million for fiscal 2016, 2015 and 2014, respectively.
Revenue Recognition
Revenue from the Company’s retail store operations is recorded upon purchase of merchandise by customers, net of an allowance forsales returns. Revenue from the Company’s e-commerce operations is recognized at the time a customer order is delivered, net of anallowance for sales returns. Revenue is recognized by the operating segment that fulfills a customer’s order. Sales tax collected fromcustomers is excluded from revenue and is included as part of accrued expenses on the Company’s Consolidated Balance Sheets.

52
Accumulated Other Comprehensive Income (Loss) – (“AOCI”)
Other comprehensive income (loss) includes amounts related to foreign currency and pension plans and is reported in the ConsolidatedStatements of Comprehensive Income (Loss). Other comprehensive income and reclassifications from AOCI for fiscal 2016, fiscal2015 and fiscal 2014 are as follows:
Fiscal 2016 Fiscal 2015 Fiscal 2014(in thousands)
PensionPlans
ForeignCurrency Total
PensionPlans
ForeignCurrency Total
PensionPlans
ForeignCurrency Total
Balance at beginning of fiscal year $ (6,113) $ (539) $ (6,652) $ (7,795) $ (443) $ (8,238) $ (4,547) $ (13) $ (4,560)
Other comprehensive income (loss)before reclassifications, net of taxes 171 (242) (71) 1,035 (96) 939 (3,506) (184) (3,690)
Amounts reclassified from accumulatedother comprehensive income (loss),net of taxes (1) 705 — 705 647 — 647 258 (246) 12
Other comprehensive income(loss) for the period 876 (242) 634 1,682 (96) 1,586 (3,248) (430) (3,678)
Balance at end of fiscal year $ (5,237) $ (781) $ (6,018) $ (6,113) $ (539) $ (6,652) $ (7,795) $ (443) $ (8,238)
(1) Includes the amortization of the unrecognized (gain)/loss on pension plans which was charged to Selling, General andAdministrative expense on the Consolidated Statements of Operations for all periods presented. The amortization of theunrecognized loss, before tax, was $705,000, $647,000 and $258,000 for fiscal 2016, fiscal 2015 and fiscal 2014, respectively.There was no corresponding tax benefit. Fiscal 2014 includes the recognition of $246,000 related to the substantial liquidationof the Company’s direct business with Sears Canada. The $246,000, with no corresponding tax provision, was recognized inDiscontinued Operations on the Consolidated Statement of Operations for fiscal 2014.
Foreign Currency Translation
At January 28, 2017, the Company has one Rochester Clothing store located in London, England. Assets and liabilities for this storeare translated into U.S. dollars at the exchange rates in effect at each balance sheet date. Stockholders’ equity is translated atapplicable historical exchange rates. Income, expense and cash flow items are translated at average exchange rates during the period.Resulting translation adjustments are reported as a separate component of stockholders’ equity.
Shipping and Handling Costs
Shipping and handling costs are included in cost of sales for all periods presented. Amounts related to shipping and handling that arebilled to customers are recorded in net sales, and the related costs are recorded in Cost of Goods Sold, Including Occupancy Costs, inthe Consolidated Statements of Operations.
Income Taxes
Deferred income taxes are provided to recognize the effect of temporary differences between tax and financial statement reporting.Such taxes are provided for using enacted tax rates expected to be in place when such temporary differences are realized. A valuationallowance is recorded to reduce deferred tax assets if it is determined that it is more likely than not that the full deferred tax assetwould not be realized. If it is subsequently determined that a deferred tax asset will more likely than not be realized, a credit toearnings is recorded to reduce the allowance.
ASC Topic 740, Income Taxes (“ASC 740”) clarifies a company’s accounting for uncertain income tax positions that are recognizedin its financial statements and also provides guidance on a company’s de-recognition of uncertain positions, financial statementclassification, accounting for interest and penalties, accounting for interim periods, and disclosure requirements. In accordance withASC 740, the Company will recognize the benefit from a tax position only if it is more likely than not that the position would besustained upon audit based solely on the technical merits of the tax position. The Company’s policy is to recognize accrued interestand penalties related to unrecognized tax benefits as income tax expense in its Consolidated Statement of Operations. The Companyhas not accrued or paid interest or penalties which were material to its results of operations for fiscal 2016, fiscal 2015 and fiscal 2014.
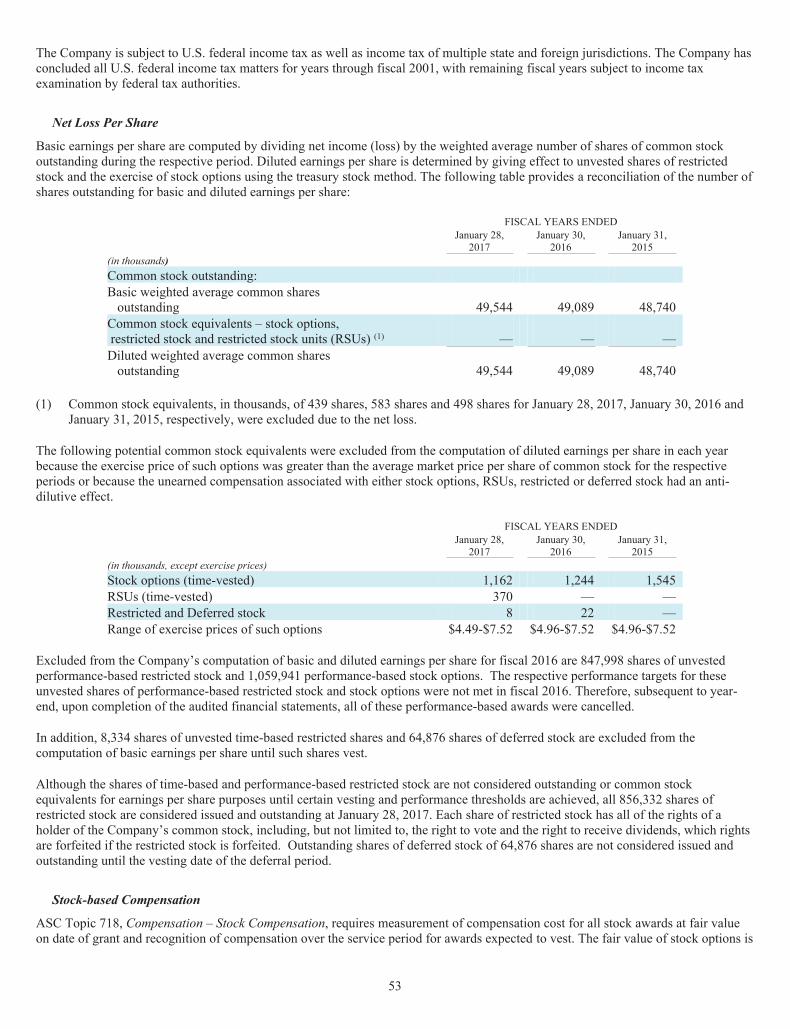
53
The Company is subject to U.S. federal income tax as well as income tax of multiple state and foreign jurisdictions. The Company hasconcluded all U.S. federal income tax matters for years through fiscal 2001, with remaining fiscal years subject to income taxexamination by federal tax authorities.
Net Loss Per Share
Basic earnings per share are computed by dividing net income (loss) by the weighted average number of shares of common stockoutstanding during the respective period. Diluted earnings per share is determined by giving effect to unvested shares of restrictedstock and the exercise of stock options using the treasury stock method. The following table provides a reconciliation of the number ofshares outstanding for basic and diluted earnings per share:
FISCAL YEARS ENDEDJanuary 28,2017
January 30,2016
January 31,2015
(in thousands)Common stock outstanding:Basic weighted average common sharesoutstanding 49,544 49,089 48,740
Common stock equivalents – stock options,restricted stock and restricted stock units (RSUs) (1) — — —Diluted weighted average common sharesoutstanding 49,544 49,089 48,740
(1) Common stock equivalents, in thousands, of 439 shares, 583 shares and 498 shares for January 28, 2017, January 30, 2016 andJanuary 31, 2015, respectively, were excluded due to the net loss.
The following potential common stock equivalents were excluded from the computation of diluted earnings per share in each yearbecause the exercise price of such options was greater than the average market price per share of common stock for the respectiveperiods or because the unearned compensation associated with either stock options, RSUs, restricted or deferred stock had an anti-dilutive effect.
FISCAL YEARS ENDEDJanuary 28,2017
January 30,2016
January 31,2015
(in thousands, except exercise prices)Stock options (time-vested) 1,162 1,244 1,545RSUs (time-vested) 370 — —Restricted and Deferred stock 8 22 —Range of exercise prices of such options $4.49-$7.52 $4.96-$7.52 $4.96-$7.52
Excluded from the Company’s computation of basic and diluted earnings per share for fiscal 2016 are 847,998 shares of unvestedperformance-based restricted stock and 1,059,941 performance-based stock options. The respective performance targets for theseunvested shares of performance-based restricted stock and stock options were not met in fiscal 2016. Therefore, subsequent to year-end, upon completion of the audited financial statements, all of these performance-based awards were cancelled.
In addition, 8,334 shares of unvested time-based restricted shares and 64,876 shares of deferred stock are excluded from thecomputation of basic earnings per share until such shares vest.
Although the shares of time-based and performance-based restricted stock are not considered outstanding or common stockequivalents for earnings per share purposes until certain vesting and performance thresholds are achieved, all 856,332 shares ofrestricted stock are considered issued and outstanding at January 28, 2017. Each share of restricted stock has all of the rights of aholder of the Company’s common stock, including, but not limited to, the right to vote and the right to receive dividends, which rightsare forfeited if the restricted stock is forfeited. Outstanding shares of deferred stock of 64,876 shares are not considered issued andoutstanding until the vesting date of the deferral period.
Stock-based Compensation
ASC Topic 718, Compensation – Stock Compensation, requires measurement of compensation cost for all stock awards at fair valueon date of grant and recognition of compensation over the service period for awards expected to vest. The fair value of stock options is

54
determined using the Black-Scholes valuation model and requires the input of subjective assumptions. These assumptions includeestimating the length of time employees will retain their vested stock options before exercising them (the “expected term”), theestimated volatility of the Company’s common stock price over the expected term and the number of options that will ultimately notcomplete their vesting requirements (“forfeitures”). As required under the accounting rules, the Company reviews its valuationassumptions at each grant date and, as a result, is likely to change its valuation assumptions used to value employee stock-basedawards granted in future periods. The values derived from using the Black-Scholes model are recognized as expense over the vestingperiod, net of estimated forfeitures. The estimation of stock awards that will ultimately vest requires judgment. Actual results, andfuture changes in estimates, may differ from the Company’s current estimates.
The Company recognized total stock-based compensation expense, with no tax effect, of $1.3 million, $2.2 million and $3.0 millionfor fiscal 2016, fiscal 2015 and fiscal 2014, respectively.
The total stock-based compensation cost related to time-vested awards not yet recognized as of January 28, 2017 is approximately$1.2 million which will be expensed over a weighted average remaining life of approximately 20 months.
The total grant-date fair value of options vested was $2.9 million, $1.0 million and $1.2 million for fiscal 2016, 2015 and 2014,respectively.
The cumulative compensation cost of stock-based awards is treated as a temporary difference for stock-based awards that aredeductible for tax purposes. If a deduction reported on a tax return exceeds the cumulative compensation cost for those awards, anyresulting realized tax benefit that exceeds the previously recognized deferred tax asset for those awards (the excess tax benefit) isrecognized as additional paid-in capital. If the amount deductible is less than the cumulative compensation cost recognized forfinancial reporting purposes, the write-off of a deferred tax asset related to that deficiency, net of the related valuation allowance, ifany, is first offset to the extent of any remaining additional paid-in capital from excess tax benefits from previous awards with theremainder recognized through income tax expense.
Valuation Assumptions for Stock Options
The fair value of each option grant is estimated on the date of grant using the Black-Scholes option-pricing model with the followingweighted-average assumptions used for grants in fiscal 2016, 2015 and 2014:
Fiscal years ended: January 28, 2017 January 30, 2016 January 31, 2015Expected volatility 39.3%-42.7% 37.0%-39.0% 46.0%Risk-free interest rate 0.78%-1.23% 0.75%-1.25% 0.79%-0.95%Expected life (in years) 2.0 1.8-4.0 2.6-3.5Dividend rate — — —Weighted average fair value of options granted $1.02 $1.44 $1.71
Expected volatilities are based on historical volatilities of the Company’s common stock; the expected life represents the weightedaverage period of time that options granted are expected to be outstanding giving consideration to vesting schedules and historicalexercise patterns; and the risk-free rate is based on the U.S. Treasury yield curve in effect at the time of grant for periodscorresponding with the expected life of the option.
Impairment of Long-Lived Assets
The Company reviews its long-lived assets for events or changes in circumstances that might indicate the carrying amount of theassets may not be recoverable. The Company assesses the recoverability of the assets by determining whether the carrying value ofsuch assets over their respective remaining lives can be recovered through projected undiscounted future cash flows. The amount ofimpairment, if any, is measured based on projected discounted future cash flows using a discount rate reflecting the Company’saverage cost of funds.
For fiscal 2016 and fiscal 2014, the Company recorded impairment charges of $0.4 million and $0.3 million, respectively, for thewrite-down of property and equipment. Impairment charges related to stores where the carrying value exceeded fair value. The fairvalue of these assets, based on Level 3 inputs, was determined using estimated discounted cash flows. The impairment charges wereincluded in Depreciation and Amortization on the Consolidated Statement of Operations for fiscal 2014 and fiscal 2016. There was nomaterial impairment of assets in fiscal 2015.

55
Unredeemed Gift Cards, Gift Certificates, and Credit Vouchers
Upon issuance of a gift card, gift certificate, or credit voucher, a liability is established for its cash value. The liability is relieved andnet sales are recorded upon redemption by the customer. Based on our historical redemption patterns, we can reasonably estimate theamount of gift cards, gift certificates, and credit vouchers for which redemption is remote, which is referred to as "breakage."Breakage is recognized over two years in proportion to historical redemption trends and is recorded as net sales in the ConsolidatedStatements of Operations. The gift card liability, net of breakage, was $2.4 million at both January 28, 2017 and January 30, 2016.
Recent Accounting Pronouncements
The Company has reviewed accounting pronouncements and interpretations thereof that have effective dates during the periodsreported and in future periods. The Company believes that the following impending standards may have an impact on its future filings.The applicability of any standard will be evaluated by the Company and is still subject to review by the Company.
In May 2014, the FASB issued ASU 2014-09, “Revenue from Contracts with Customers,” which supersedes the revenue recognitionrequirements in ASC 605, “Revenue Recognition,” as well as various other sections of the ASC, such as, but not limited to, ASC 340-20, “Other Assets and Deferred Costs - Capitalized Advertising Costs”. The core principle of ASU 2014-09 is that an entity shouldrecognize revenue in a way that depicts the transfer of promised goods or services to customers in an amount that reflects theconsideration to which the entity expects to be entitled in exchange for those goods or services. ASU 2014-09 will be effective forfiscal years, and interim periods within those years, beginning after December 15, 2017, and is to be applied either retrospectively toeach prior reporting period presented or with the cumulative effect recognized at the date of initial adoption as an adjustment to theopening balance of retained earnings (or other appropriate components of equity or net assets on the balance sheet). Early adoption ispermitted after December 15, 2016. The Company expects to adopt ASU 2014-09 in the first quarter of fiscal 2018 and will not adoptearly. The Company has not yet selected a transition method or completed its assessment of the effect that ASU 2014-09 will have onits Consolidated Financial Statements.
In July 2015, the FASB issued ASU 2015-11, "Inventory (Topic 330): Simplifying the Measurement of Inventory," which applies toinventory that is measured using first-in, first-out ("FIFO") or average cost. Under the updated guidance, an entity should measureinventory that is within scope at the lower of cost and net realizable value, which is the estimated selling price in the ordinary courseof business, less reasonably predictable costs of completion, disposal and transportation. This ASU is effective for annual and interimperiods beginning after December 15, 2016, and should be applied prospectively with early adoption permitted at the beginning of aninterim or annual reporting period. The Company does not expect the adoption of this pronouncement to have a material impact on itsConsolidated Financial Statements.
In February 2016, the FASB issued ASU 2016-02, “Leases (Topic 842),” which will require an entity to recognize lease assets andlease liabilities on its balance sheet and will increase disclosure requirements on its leasing arrangements. The ASU is effective forannual periods beginning after December 15, 2018, and interim periods therein. Early adoption is permitted. In the financialstatements in which the ASU is first applied, leases shall be measured and recognized at the beginning of the earliest comparativeperiod presented with an adjustment to equity. While the Company is still evaluating the impact this pronouncement will have on itsConsolidated Financial Statements, the Company expects the adoption of this pronouncement will have a material impact on itsConsolidated Financial Statements.
In March 2016, the FASB issued ASU 2016-04, “Liabilities—Extinguishments of Liabilities: Recognition of Breakage for CertainPrepaid Stored-Value Products,” which amends exempting gift cards and other prepaid stored-value products from the guidance onextinguishing financial liabilities. Rather, they will be subject to breakage accounting consistent with the new revenue guidance inTopic 606. However, the exemption only applies to breakage liabilities that are not subject to unclaimed property laws or that areattached to segregated bank accounts (e.g., consumer debit cards). The ASU is effective for fiscal years beginning after December 15,2017, and interim periods within those fiscal years. Early adoption is permitted. The Company does not expect the adoption of thispronouncement to have a material impact on its Consolidated Financial Statements.
In March 2016, the FASB issued ASU 2016-09, “Compensation - Stock Compensation (Topic 718) - Improvements to EmployeeShare-Based Payment Accounting,” which simplifies several aspects of the accounting for share-based payment transactions,including the income tax consequences, classification of awards, and classification on the statement of cash flows. The standard iseffective for fiscal years beginning after December 15, 2016, including interim periods within those fiscal years. The Company doesnot expect that the adoption of this pronouncement will have a material impact on its Consolidated Financial Statements.
In August 2016, the FASB issued ASU 2016-15, “Statement of Cash Flows (Topic 230): Classification of Certain Cash Receipts andCash Payments,” which reduces the existing diversity in practice in how certain cash receipts and cash payments are presented andclassified in the statement of cash flows under Topic 230. The ASU is effective for fiscal years beginning after December 15, 2017,
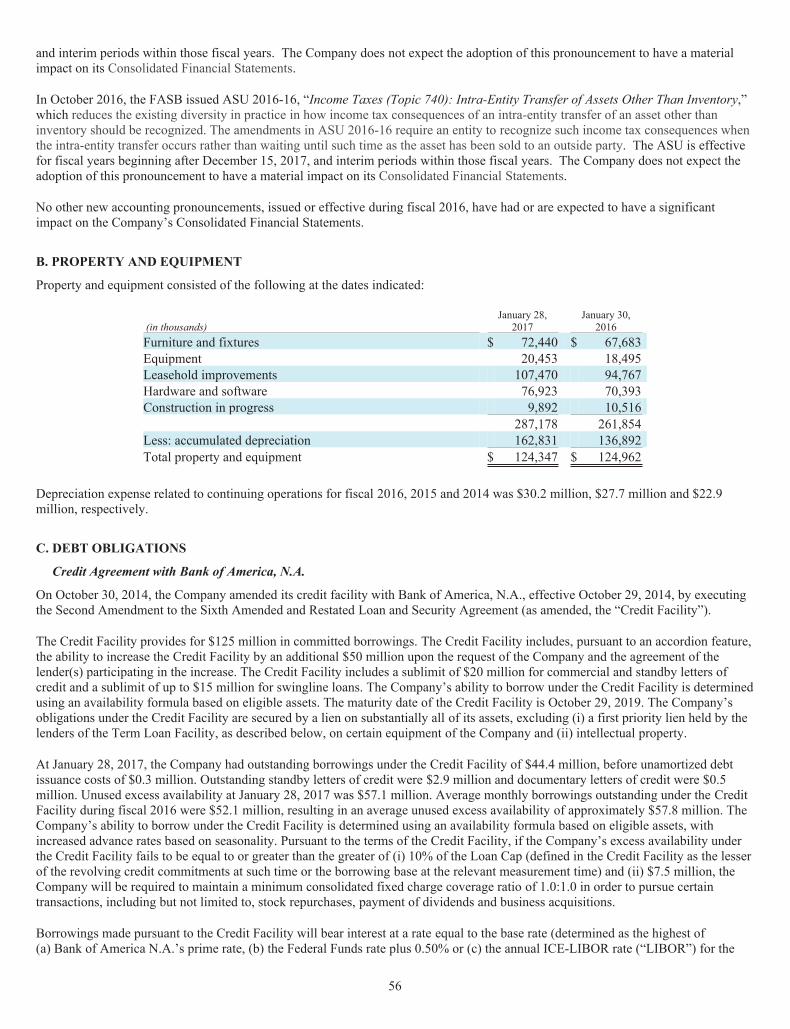
56
and interim periods within those fiscal years. The Company does not expect the adoption of this pronouncement to have a materialimpact on its Consolidated Financial Statements.
In October 2016, the FASB issued ASU 2016-16, “Income Taxes (Topic 740): Intra-Entity Transfer of Assets Other Than Inventory,”which reduces the existing diversity in practice in how income tax consequences of an intra-entity transfer of an asset other thaninventory should be recognized. The amendments in ASU 2016-16 require an entity to recognize such income tax consequences whenthe intra-entity transfer occurs rather than waiting until such time as the asset has been sold to an outside party. The ASU is effectivefor fiscal years beginning after December 15, 2017, and interim periods within those fiscal years. The Company does not expect theadoption of this pronouncement to have a material impact on its Consolidated Financial Statements.
No other new accounting pronouncements, issued or effective during fiscal 2016, have had or are expected to have a significantimpact on the Company’s Consolidated Financial Statements.
B. PROPERTY AND EQUIPMENT
Property and equipment consisted of the following at the dates indicated:
(in thousands)January 28,2017
January 30,2016
Furniture and fixtures $ 72,440 $ 67,683Equipment 20,453 18,495Leasehold improvements 107,470 94,767Hardware and software 76,923 70,393Construction in progress 9,892 10,516
287,178 261,854Less: accumulated depreciation 162,831 136,892Total property and equipment $ 124,347 $ 124,962
Depreciation expense related to continuing operations for fiscal 2016, 2015 and 2014 was $30.2 million, $27.7 million and $22.9million, respectively.
C. DEBT OBLIGATIONS
Credit Agreement with Bank of America, N.A.
On October 30, 2014, the Company amended its credit facility with Bank of America, N.A., effective October 29, 2014, by executingthe Second Amendment to the Sixth Amended and Restated Loan and Security Agreement (as amended, the “Credit Facility”).
The Credit Facility provides for $125 million in committed borrowings. The Credit Facility includes, pursuant to an accordion feature,the ability to increase the Credit Facility by an additional $50 million upon the request of the Company and the agreement of thelender(s) participating in the increase. The Credit Facility includes a sublimit of $20 million for commercial and standby letters ofcredit and a sublimit of up to $15 million for swingline loans. The Company’s ability to borrow under the Credit Facility is determinedusing an availability formula based on eligible assets. The maturity date of the Credit Facility is October 29, 2019. The Company’sobligations under the Credit Facility are secured by a lien on substantially all of its assets, excluding (i) a first priority lien held by thelenders of the Term Loan Facility, as described below, on certain equipment of the Company and (ii) intellectual property.
At January 28, 2017, the Company had outstanding borrowings under the Credit Facility of $44.4 million, before unamortized debtissuance costs of $0.3 million. Outstanding standby letters of credit were $2.9 million and documentary letters of credit were $0.5million. Unused excess availability at January 28, 2017 was $57.1 million. Average monthly borrowings outstanding under the CreditFacility during fiscal 2016 were $52.1 million, resulting in an average unused excess availability of approximately $57.8 million. TheCompany’s ability to borrow under the Credit Facility is determined using an availability formula based on eligible assets, withincreased advance rates based on seasonality. Pursuant to the terms of the Credit Facility, if the Company’s excess availability underthe Credit Facility fails to be equal to or greater than the greater of (i) 10% of the Loan Cap (defined in the Credit Facility as the lesserof the revolving credit commitments at such time or the borrowing base at the relevant measurement time) and (ii) $7.5 million, theCompany will be required to maintain a minimum consolidated fixed charge coverage ratio of 1.0:1.0 in order to pursue certaintransactions, including but not limited to, stock repurchases, payment of dividends and business acquisitions.
Borrowings made pursuant to the Credit Facility will bear interest at a rate equal to the base rate (determined as the highest of(a) Bank of America N.A.’s prime rate, (b) the Federal Funds rate plus 0.50% or (c) the annual ICE-LIBOR rate (“LIBOR”) for the

57
respective interest period) plus a varying percentage, based on the Company’s borrowing base, of 0.50%-0.75% for prime-basedborrowings and 1.50%-1.75% for LIBOR-based borrowings. The Company is also subject to an unused line fee of 0.25%. At January28, 2017, the Company’s prime-based interest rate was 4.25%.
At January 28, 2017, the Company had approximately $36.0 million of its outstanding borrowings in a LIBOR-based contract with aninterest rate of approximately 2.22%. The LIBOR-based contract expired January 31, 2017. When a LIBOR-based borrowing expires,the borrowings revert back to prime-based borrowings unless the Company enters into a new LIBOR-based borrowing arrangement.
The fair value of the amount outstanding under the Credit Facility at January 28, 2017 approximated the carrying value.
Long-Term Debt
Components of long-term debt are as follows:
(in thousands)January 28,2017
January 30,2016
Equipment financing notes $ 6,589 $ 12,901Term loan, due 2019 12,750 13,750Less: unamortized debt issuance costs (337) (493)Total long-term debt 19,002 26,158Less: current portion of long-term debt 6,941 7,155Long-term debt, net of current portion $ 12,061 $ 19,003
Equipment Financing Loans
Pursuant to a Master Loan and Security Agreement with Banc of America Leasing & Capital, LLC, dated July 20, 2007 and amendedSeptember 30, 2013 (the “Master Agreement”), the Company has entered into twelve equipment security notes (in aggregate, the“Notes”). The Company borrowed an aggregate of $26.4 million between September 2013 and June 2014. The Notes are for a term of48 months and accrue interest at fixed rates ranging from 3.07% and 3.50%. Principal and interest are paid monthly, in arrears.
The Notes are secured by a security interest in all of the Company’s rights, title and interest in and to certain equipment. TheCompany was subject to prepayment penalties through the second anniversary of each of the Notes. The Company is no longersubject to any prepayment penalties. The Master Agreement includes default provisions that are customary for financings of this typeand are similar and no more restrictive than the Company’s existing Credit Facility.
Term Loan
On October 30, 2014, the Company entered into a term loan agreement with respect to a new $15 million senior secured term loanfacility with Wells Fargo Bank, National Association as administrative and collateral agent (the “Term Loan Facility”). The effectivedate of the Term Loan Facility was October 29, 2014 (the “Effective Date”). The proceeds from the Term Loan Facility were used torepay borrowings under the Credit Facility.
The Term Loan Facility bears interest at a rate per annum equal to the greater of (a) 1.00% and (b) the one month LIBOR rate, plus6.50%. Interest payments are payable on the first business day of each calendar month, and increase by 2% following the occurrenceand during the continuance of an “event of default,” as defined in the Term Loan Facility. The Term Loan Facility provides forquarterly principal payments on the first business day of each calendar quarter, which commenced the first business day of January2015, in an aggregate principal amount equal to $250,000, subject to adjustment, with the balance payable on the termination date.
The Term Loan Facility includes usual and customary mandatory prepayment provisions for transactions of this type that are triggeredby the occurrence of certain events. In addition, the amounts advanced under the Term Loan Facility can be optionally prepaid inwhole or part. All prepayments are subject to an early termination fee in the amount of 1% of the amount prepaid prior to October 29,2017. There is no prepayment penalty after October 29, 2017.
The Term Loan Facility matures on October 29, 2019. It is secured by a first priority lien on certain equipment of the Company, and asecond priority lien on substantially all of the remaining assets of the Company, excluding intellectual property.

58
Long-term debt maturities
Annual maturities of long-term debt for the next five fiscal years are as follows:
(in thousands)Fiscal 2017 $ 7,088Fiscal 2018 1,501Fiscal 2019 10,750Fiscal 2020 —Fiscal 2021 —
The Company paid interest and fees totaling $2.8 million, $2.8 million and $2.7 million for fiscal 2016, 2015 and 2014, respectively.
D. INCOME TAXESThe Company accounts for income taxes in accordance with ASC Topic 740, Income Taxes. Under ASC Topic 740, deferred taxassets and liabilities are recognized based on temporary differences between the financial statement and tax basis of assets andliabilities using enacted tax rates in effect in the years in which the differences are expected to reverse. The accounting regulationrequires current recognition of net deferred tax assets to the extent it is more likely than not such net assets will be realized. To theextent that the Company believes its net deferred tax assets will not be realized, a valuation allowance must be recorded against thoseassets.
Since the fourth quarter of fiscal 2013, the Company has maintained a valuation allowance against its deferred tax assets. While theCompany has projected it will return to profitability, generate taxable income and ultimately emerge from a three-year cumulativeloss, based on operating results for fiscal 2016 and the Company’s forecast for fiscal 2017, the Company believes that a full allowanceremains appropriate at this time. Realization of the Company’s deferred tax assets, which relate principally to federal net operatingloss carryforwards, which expire from 2022 through 2036, is dependent on generating sufficient taxable income in the near term.
As of January 28, 2017, the Company had net operating loss carryforwards of $141.2 million for federal income tax purposes and$84.3 million for state income tax purposes that are available to offset future taxable income through fiscal year 2036. The Companyhas alternative minimum tax credit carryforwards of $2.3 million, which are available to further reduce income taxes over anindefinite period. Additionally, the Company has $0.1 million and $2.2 million of net operating loss carryforwards related to theCompany’s operations in the Hong Kong and Canada, respectively, though both are expected to expire largely unutilized.
The utilization of net operating loss carryforwards and the realization of tax benefits in future years depends predominantly uponhaving taxable income. Under the provisions of the Internal Revenue Code, certain substantial changes in the Company’s ownershipmay result in a limitation on the amount of net operating loss carryforwards and tax credit carryforwards which may be used in futureyears.
Included in the net operating loss carryforwards for both federal and state income tax is approximately $13.3 million relating to stockcompensation deductions, the tax benefit from which, if realized, will be credited to additional paid-in capital.

59
The components of the net deferred tax assets as of January 28, 2017 and January 30, 2016 are as follows (in thousands):
January 28,2017
January 30,2016
Deferred tax assets:Net operating loss carryforward $ 50,399 $ 50,199Gain on sale-leaseback 5,170 5,744Accrued Expenses and other 4,340 5,667Lease accruals 4,358 4,732Goodwill and intangibles 1,513 3,694Unrecognized loss on pension and pension expense 3,311 3,379Capital loss carryforward 3,021 3,021Inventory reserves 2,659 2,561Alternative minimum tax credit carryforward 2,292 2,292Foreign tax credit carryforward 901 963Federal wage tax credit carryforward 707 521Unrecognized loss on foreign exchange 328 234State tax credits 124 102Excess of tax over book depreciation/amortization (15,192) (19,977)Subtotal $ 63,931 $ 63,132
Valuation allowance (1) (63,931) (63,132)Net deferred tax assets $ — $ —
Deferred tax liabilities:Goodwill and intangibles $ (222) $ (196)
Deferred tax liabilities $ (222) $ (196)
(1) For fiscal 2016, the Company had total deferred tax assets of $79.1 million, total deferred tax liabilities of $15.4 million and avaluation allowance of $63.9 million.
The provision for income taxes from continuing operations consists of the following:
FISCAL YEARS ENDEDJanuary 28,2017
January 30,2016
January 31,2015
(in thousands)Current:Federal and state $ 91 $ 104 $ 97Foreign 49 51 55
140 155 152Deferred:Federal and state 23 94 91Foreign 3 11 —
26 105 91
Total provision (2) $ 166 $ 260 $ 243
(2) There was no provision (benefit) recognized on the loss from discontinued operations for fiscal 2014.

60
The following is a reconciliation between the statutory and effective income tax rates in dollars for the provision for income tax fromcontinuing operations:
FISCAL YEARS ENDEDJanuary 28,2017
January 30,2016
January 31,2015
(in thousands)Federal income tax at the statutory rate $ (732) $ (2,852) $ (3,827)State income and other taxes, net of federal tax benefit (1) (177) (72)Permanent items 225 137 141Change in uncertain tax provisions — — —Charge for valuation allowance 775 3,200 4,034Other, net (101) (48) (33)Provision for income tax from continuing operations $ 166 $ 260 $ 243
As discussed in Note A, the Company’s financial statements reflect the expected future tax consequences of uncertain tax positionsthat the Company has taken or expects to take on a tax return, based solely on the technical merits of the tax position. The liability forunrecognized tax benefits at January 28, 2017 and January 30, 2016 was approximately $3.1 million, and is associated with a prior taxposition related to exiting the Company’s direct business in Europe during fiscal 2013. The amount of unrecognized tax benefits hasbeen presented as a reduction in the reported amounts of our federal and state net operating losses (“NOL”) carryforwards. Nopenalties or interest have been accrued on this liability because the carryforwards have not yet been utilized. The reversal of thisliability would result in a tax benefit being recognized in the period in which the Company determines the liability is no longernecessary.
The Company made tax payments of $0.1 million, $0.1 million and $0.1 million for fiscal 2016, 2015 and 2014, respectively.
E. COMMITMENTS AND CONTINGENCIES
At January 28, 2017, the Company was obligated under operating leases covering store and office space, automobiles and certainequipment for future minimum rentals, merchandise purchase obligations and a non-merchandise purchase agreement as follows:
TotalFISCAL YEAR (in millions)Fiscal 2017 $ 69.4Fiscal 2018 62.9Fiscal 2019 57.6Fiscal 2020 43.2Fiscal 2021 41.3Thereafter 121.0
$ 395.4
In addition to future minimum rental payments, many of the store leases include provisions for common area maintenance, mallcharges, escalation clauses and additional rents based on a percentage of store sales above designated levels. The store leases aregenerally 5 to 10 years in length and contain renewal options extending their terms by 5 to 10 years.
Amounts charged to operations for all occupancy costs, automobile and leased equipment expense were $63.9 million, $62.0 millionand $56.8 million for fiscal 2016, fiscal 2015 and fiscal 2014, respectively.
In fiscal 2006, as part of a sale-leaseback transaction with a subsidiary of Spirit Finance Corp. (“Spirit”), the Company entered into atwenty-year lease agreement (the “Lease Agreement”) for its corporate headquarters and distribution center whereby the Companyagreed to lease the property it sold to Spirit back for an annual rent of $4.6 million. The Company realized a gain of approximately$29.3 million on the sale of this property, which has been deferred and is being amortized over the initial 20 years of the related leaseagreement. At the end of the initial term, the Company will have the opportunity to extend the Lease Agreement for six additionalsuccessive periods of five years. In addition, on February 1, 2011, the fifth anniversary of the Lease Agreement and for every fifthanniversary thereafter, the base rent will be subject to a rent increase not to exceed the lesser of 7% or a percentage based on changesin the Consumer Price Index. The Company’s current annual rent of $5.2 million will be offset each lease year by $1.5 million relatedto the amortization of this deferred gain. This lease commitment, excluding the impact of the gain, is included in the above table ofexpected future minimum rentals obligations.

61
Included in the table above, is a merchandise purchase obligation for which the Company is contractually committed to meetminimum purchases of $10.5 million in fiscal 2017, $11.0 million in fiscal 2018 and $11.5 million in fiscal 2019.
F. LONG-TERM INCENTIVE PLANS
The following is a summary of the Company’s long-term incentive plans. All equity awards granted under these long-term incentiveplans were issued from the Company’s 2006 Incentive Compensation Plan until July 31, 2016 when the 2006 Incentive CompensationPlan expired. As of August 4, 2016, all grants of equity awards are issued under the Company’s stockholder-approved 2016 IncentiveCompensation Plan. See Note G, “Stock Compensation Plans.”
2013-2016 Long-Term Incentive Plan
The 2013-2016 Long-Term Incentive Plan (the “2013-2016 LTIP”) was approved in the second quarter of fiscal 2013. Pursuant to theterms of the 2013-2016 LTIP, on the date of grant, each participant was granted an unearned and unvested award equal in value tofour times his/her annual salary multiplied by the applicable long-term incentive program percentage, which is 100% for theCompany’s Chief Executive Officer, 70% for its senior executives and 50% for other participants in the plan, which the Companyrefers to as the “Projected Benefit Amount.” Each participant was granted 50% of the Projected Benefit Amount in shares of restrictedstock, 25% in stock options and the remaining 25% in cash.
Of the total Projected Benefit Amount, 50% is subject to time-based vesting and 50% is subject to performance-based vesting. Thetime-vested portion of the award (half of the shares of restricted stock, options and cash) vests in three installments with 20% of thetime-vested portion having vested at the end of fiscal 2014, 40% having vested at the end of fiscal 2015 and the remaining 40%vesting at the end of fiscal 2016.
In order for the participants to receive 100% vesting of the performance-based awards, the Company must achieve revenue of at least$600 million and have an operating margin of not less than 8.0% in fiscal 2016. If the Company did not meet the performance targetat the end of fiscal 2016, but the Company was able to achieve revenue equal to or greater than $510 million at the end of fiscal 2016and the operating margin was not less than 8.0%, then the participants could have received a pro-rata portion of the performance-basedaward based on minimum sales of $510 million (50% payout) and $600 million (100% payout). Because the Company did notachieve minimum sales of at least $510 million or operating income of at least 8.0%, all unvested performance-based awards wereforfeited, subsequent to year-end. Because the performance targets were not considered probable during the term of the 2013-2016LTIP, no compensation expense was recognized through the end of fiscal 2016. See Note G, “Stock Compensation Plans” for asummary of the equity awards.
The Company incurred total compensation expense (cash and equity) of approximately $9.4 million related to the time-vested awards.The cost was expensed over forty-four months through January 28, 2017, based on the respective vesting dates, of which $1.1 millionwas incurred in fiscal 2016.
2016 Long-Term Incentive Wrap-Around Plan
On November 7, 2014, the Company’s Compensation Committee of the Company’s Board of Directors approved the 2016 Long-TermIncentive Wrap-Around Plan (the “2016 Wrap”). The 2016 Wrap was a supplemental performance-based incentive plan that was onlyeffective if there was no vesting of the performance-based awards under the 2013-2016 LTIP and, as a result, all performance-basedawards under the 2013-2016 LTIP were forfeited. Under the 2016 Wrap, if the target level performance metrics for fiscal 2016 weremet, participants were eligible to receive a payout equal to 80% of the dollar value of the performance-based compensation they wereeligible to receive under the 2013-2016 LTIP. If the target level performance metrics for fiscal 2016 under the 2016 Wrap wereexceeded, the greatest payout that participants were eligible to receive was 100% of the dollar value of the performance-basedcompensation they were eligible to receive under the 2013-2016 LTIP.
The performance target under the 2016 Wrap consisted of two metrics, Sales and EBITDA, with threshold (50%), target (80%) andmaximum (100%) payout levels. Each metric was weighted as 50% of the total performance target. However, in order for there to beany payout under either metric, EBITDA for fiscal 2016 must be equal to or greater than the minimum threshold.
The 2016 Wrap provided for an opportunity to receive additional shares of restricted stock if the performance targets were achievedand the Company’s closing stock price was $6.75 or higher on the day earnings for fiscal 2016 are publicly released. If the Company’sstock price was $6.75, the 50% payout in restricted shares would be increased by 20% and if the stock price was $7.25 or higher, the50% payout in restricted shares would be increased by 30%, with a pro-rata payout between $6.75 and $7.25.

62
Based on the operating results for fiscal 2016, the Company achieved 50.6% of its EBITDA target. The minimum threshold for theSales target was not achieved. Accordingly, subsequent to year-end, the Compensation Committee of the Board of Directors approvedawards totaling $2.3 million, with a grant date of March 20, 2017. On that date, the Company will grant shares of restricted stock,with a fair value of approximately $1.0 million and cash awards totaling approximately $1.3 million. All awards will vest on the lastday of the second quarter of fiscal 2017. At January 28, 2017, $1.9 million of the $2.3 million payout was accrued. Based on theCompany’s closing stock price of $3.30 at January 28, 2017, the Company does not expect that there will be any additional grant ofshares for achieving a stock price greater than $6.75 per share at the close of business on the day the Company’s earnings are publiclyreleased.
2016-2017 Long-Term Incentive Plan
With the 2013-2016 LTIP and 2016 Wrap expiring at the end of fiscal 2016, on March 15, 2016, the Compensation Committeeapproved the Destination XL Group, Inc. Long-Term Incentive Plan (the “New LTIP”).
Under the terms of the New LTIP, each year the Compensation Committee will establish performance targets which will cover a two-year performance period (each a “Performance Period”), thereby creating overlapping Performance Periods. Each participant in theplan will be entitled to receive an award based on that participant’s “Target Cash Value” which is defined as the participant’s annualbase salary (on the participant’s effective date) multiplied by his or her long-term incentive program percentage, which is 100% forthe Company’s Chief Executive Officer, 70% for its senior executives and 25% for other participants in the plan. Because of theoverlapping two-year Performance Periods, the Target Cash Value for any award is based on one year of annual salary, as opposed totwo years to avoid doubling an award payout in any given fiscal year.
For each participant, 50% of the Target Cash Value is subject to time-based vesting and 50% is subject to performance-based vesting.The time-vested portion of the award will vest in two installments with 50% of the time-vested portion vesting on April 1 followingthe fiscal year end which marks the end of the applicable Performance Period and 50% vesting on April 1 the succeeding year. Theperformance-based vesting is subject to the achievement of the performance target(s) for the applicable Performance Period. Anyperformance award granted will vest on August 31 following the end of the applicable Performance Period.
The Compensation Committee established two performance targets for the 2016-2017 Performance Period under the new LTIP (the“2016-2017 LTIP”), each weighted 50%. The first target is EBITDA for fiscal 2017, defined as earnings before interest, taxes,depreciation and amortization, and the second target is “DXL Comparable Store Marginal Cash-Over-Cash Return”, defined as theaggregate of each comparable DXL store’s four-wall cash flow for fiscal 2017 divided by the aggregate capital investment, net of anytenant allowance, for each comparable DXL store.
All awards granted under the 2016-2017 LTIP were in restricted stock units (RSUs). Assuming that the Company achieves theperformance target at target levels and all time-vested awards vest, the compensation expense associated with the 2016-2017 LTIP isestimated to be approximately $3.8 million. Approximately half of the compensation expense, or $1.9 million, relates to the time-vested RSUs, which is being expensed over thirty-six months, based on the respective vesting dates. With respect to the performance-based component, RSUs will be granted at the end of the performance period if the performance targets are achieved. Through the endof fiscal 2016, the Company has accrued approximately $0.3 million in compensation expense related to the potential payout ofperformance awards under the 2016-2017 LTIP.
G. STOCK COMPENSATION PLANS
Through the end of the second quarter of fiscal 2016, the Company’s 2006 Incentive Compensation Plan (as amended and restatedeffective as of August 1, 2013, the “2006 Plan”) was the only stockholder approved plan. The 2006 Plan expired on July 31, 2016. Atthe Company’s 2016 Annual Meeting of Stockholders held August 4, 2016, the Company’s stockholders approved the adoption of the2016 Incentive Compensation Plan (the “2016 Plan”).
2016 Plan
The share reserve under the 2016 Plan is 5,200,000 shares of our common stock. A grant of a stock option award or stock appreciationright reduces the outstanding reserve on a one-for-one basis. A grant of a full-value award, including, but not limited to, restrictedstock, restricted stock units and deferred stock, reduces the outstanding reserve by a fixed ratio of 1.9 shares for every share granted.
In addition to the initial share reserve of 5,200,000 shares, the 525,538 shares that remained available under our 2006 Plan were addedand became available for issuance under the 2016 Plan on August 4, 2016. In accordance with the terms of the 2016 Plan, any sharesoutstanding under the 2006 Plan at August 4, 2016 that subsequently terminate, expire or are canceled for any reason without havingbeen exercised or paid are added back and become available for issuance under the 2016 Plan, with options and stock appreciation

63
rights being added back on a one-for-one basis and full-value awards being added back on a 1 to1.9 basis. Accordingly, an additional588,796 shares were added to share availability under the 2016 Plan during fiscal 2016. At January 28, 2017, the Company had6,233,824 shares available under the 2016 Plan.
The 2016 Plan is administered by the Compensation Committee. The Compensation Committee is authorized to make alldeterminations with respect to amounts and conditions covering awards. Options are not granted at a price less than fair value on thedate of the grant. Except with respect to 5% of the shares available for awards under the 2016 Plan, no award will become exercisableor otherwise forfeitable unless such award has been outstanding for a minimum period of one year from its date of grant.
The following tables summarize the stock option activity and share activity for the Company’s 2006 Plan and 2016 Plan, on acombined basis, during fiscal 2016:
Stock Option Activity
The following table summarizes stock option activity under the plans for fiscal 2016:
Number ofShares
Weighted-average
exercise priceper option
Weighted-averageremaining
contractual termAggregate
intrinsic valueStock OptionsOutstanding options at beginning of year 2,728,621 $ 5.00Options granted 9,004 $ 4.44Options canceled (213,079) $ 5.24Options exercised — —
Outstanding options at end of year 2,524,546 $ 4.98 5.9 years $ 11,286Options exercisable at end of year 1,464,605 $ 4.91 5.6 years $ 11,286Vested and expected to vest at end of year 1,464,605 $ 4.91 5.6 years $ 11,286
There were no exercises of options during fiscal 2016 and the intrinsic value of options exercised during fiscal 2015 was immaterial.
Non-Vested Share Activity
The following table summarizes activity for non-vested shares under the plans for fiscal 2016:
Restrictedshares
RestrictedStockUnits (1)
Deferredshares (2)
Fully-vestedshares (3)
Total numberof shares
Weighted-averagegrant-datefair value (4)
SharesOutstanding non-vested shares at beginning ofyear 1,320,143 — 31,587 — 1,351,730 $ 5.09
Shares granted 4,168 440,125 33,289 53,725 531,307 $ 5.06Shares vested/issued (339,539) (919) — (53,725) (394,183) $ 5.05Shares canceled (128,440) (69,378) — — (197,818) $ 5.13Outstanding non-vested shares at end of year 856,332 369,828 64,876 — 1,291,036 $ 5.09Vested and expected to vest at end of year 8,334 314,354 64,876 — 387,564
(1) RSUs were granted in connection with the time-vested portion of the 2016-2017 LTIP. The RSUs will vest in two tranches withthe first 50% vesting on April 1, 2018 and the remaining vesting 50% on April 1, 2019.
(2) During fiscal 2016, the Company granted 33,289 shares of deferred stock, with a fair value of approximately $158,188, tocertain directors as compensation in lieu of cash, in accordance with their irrevocable elections. The shares of deferred stockvest three years from the date of grant or at separation of service, based on the irrevocable election of each director.
(3) During fiscal 2016, the Company granted 53,725 shares of stock, with a fair value of approximately $255,561 to certaindirectors as compensation in lieu of cash, in accordance with their irrevocable elections. Since fiscal 2015, directors arerequired to elect 50% of their quarterly retainer in equity. All shares paid to directors to satisfy this election were issued fromthe Company’s 2006 Plan through July 31, 2016 and from its 2016 Plan since August 4, 2016. Any shares in excess of the

64
minimum required election are issued from the Second Amended and Restated Non-Employee Director Stock Purchase Plan (asamended).
(4) The fair value of a restricted share, deferred share and fully-vested share is equal to the Company’s closing stock price on thedate of grant.
Total unrecognized stock compensation of $1.2 million at January 28, 2017 is expected to be recognized over a weighted-averageperiod of 20 months.
Non-Employee Director Compensation Plan
In January 2010, the Company established a Non-Employee Director Stock Purchase Plan to provide a convenient method for its non-employee directors to acquire shares of the Company’s common stock at fair market value by voluntarily electing to receive shares ofcommon stock in lieu of cash for service as a director. The substance of this plan is now encompassed within the Company’s SecondAmended and Restated Non-Employee Director Compensation Plan, most recently amended subsequent to year end.
Beginning in fiscal 2015, the non-employee directors are required to take 50% of their annual retainer, which is paid quarterly, inequity. Any shares of stock, deferred stock or stock options issued to a director as part of this 50% requirement are issued from ourequity incentive plans. Only discretionary elections of equity will be issued from the Non-Employee Director Compensation Plan.
The following shares of common stock, with the respective fair value, were issued to its non-employee directors as compensation forfiscal 2016, fiscal 2015 and fiscal 2014:
Number of shares ofcommon stock issued
Fair value ofcommon stock issued
Fiscal 2016 14,509 $ 68,456Fiscal 2015 24,947 $ 127,734Fiscal 2014 40,910 $ 213,749
H. RELATED PARTIES
Seymour Holtzman and Jewelcor Management, Inc.
Seymour Holtzman, the Executive Chairman of the Company’s Board of Directors (the “Board”), is the chairman, chief executiveofficer and president and, together with his wife, indirectly, the majority shareholder of Jewelcor Management, Inc. (“JMI”).Mr. Holtzman, who was initially appointed Chairman of the Board in April 2000, is the beneficial holder of approximately 8.8% of theoutstanding common stock of the Company at January 28, 2017.
From October 1999 through August 7, 2014, the Company had an ongoing consulting agreement with JMI to provide the Companywith services as may be agreed upon, from time to time, between JMI and the Company (the “Consulting Agreement”). In connectionwith the execution of the Employment and Chairman Compensation Agreement discussed below, on August 7, 2014, the Companyterminated the Consulting Agreement. Prior to the execution of the Employment and Chairman Compensation Agreement and throughAugust 7, 2014, Mr. Holtzman was primarily compensated by the Company for his services pursuant to this Consulting Agreement.Under the terms of the Consulting Agreement at the time of its termination, Mr. Holtzman was entitled to receive annual consultingcompensation of $372,750 and a salary of $24,000.
On August 7, 2014, the Company entered into an Employment and Chairman Compensation Agreement with Mr. Holtzman. Pursuantto the terms of the agreement, Mr. Holtzman serves as both an employee of the Company, reporting to the Board, and, in his capacityas Chairman of the Board, as Executive Chairman, with the duties of the Chairman of the Board as set forth in the Company’s FourthAmended and Restated By-Laws. The initial term of the agreement was for two years. Commencing August 7, 2015, on eachanniversary date, the agreement automatically extends for an additional one-year term. Accordingly, the current expiration date of theagreement is August 7, 2018. As compensation for the employment services, Mr. Holtzman receives an annual base salary of $24,000and, as compensation for his services as Executive Chairman, Mr. Holtzman receives annual compensation of $372,750.
John E. Kyees
John Kyees, a director of the Company since 2010, served as the Company’s interim Chief Financial Officer from February 2, 2014through May 31, 2014. Pursuant to an employment agreement, Mr. Kyees received compensation at a rate of $3,000 per day plusbenefits and reimbursement for all business and travel expenses. Mr. Kyees was also eligible to participate in the Company’s annual

65
incentive program for the period in which he served as interim Chief Financial Officer. For fiscal 2014, Mr. Kyees earned totalcompensation from the Company of $389,920 for services he provided as interim Chief Financial Officer.
I. EMPLOYEE BENEFIT PLANS
The Company accounts for its employee benefit plans in accordance with ASC Topic 715 Compensation – Retirement Benefits. ASCTopic 715 requires an employer to: (a) recognize in its statement of financial position an asset for a plan’s over-funded status or aliability for a plan’s under-funded status; (b) measure a plan’s assets and its obligations that determine its funded status as of the endof the employer’s fiscal year (with limited exceptions); and (c) recognize changes in the funded status of a defined benefitpostretirement plan in the year in which the changes occur.
These amounts will be subsequently recognized as net periodic pension cost pursuant to the Company’s historical accounting policyfor amortizing such amounts. Further, actuarial gains and losses that arise in subsequent periods and are not recognized as net periodicpension cost in the same periods will be recognized as a component of accumulated other comprehensive income (loss). Theamortization of the unrecognized loss included in accumulated other comprehensive income (loss) and expected to be recognized innet periodic pension cost in fiscal 2017 is approximately $788,000.
Noncontributory Pension Plan
In connection with the Casual Male acquisition, the Company assumed the assets and liabilities of the Casual Male NoncontributoryPension Plan “Casual Male Corp. Retirement Plan”, which was previously known as the J. Baker, Inc. Qualified Plan (the “PensionPlan”). Casual Male Corp. froze all future benefits under this plan on May 1, 1997.
The following table sets forth the Pension Plan’s funded status at January 28, 2017 and January 30, 2016:
January 28,2017
January 30,2016
in thousandsChange in benefit obligation:Balance at beginning of period $ 16,845 $ 18,927Benefits and expenses paid (733) (668)Interest costs 686 634Settlements (346) (21)Actuarial (gain) loss 4 (2,027)
Balance at end of year $ 16,456 $ 16,845
Change in fair value of plan assetsBalance at beginning of period $ 11,969 $ 12,945Actual return on plan assets 844 (433)Employer contributions — 146Settlements (346) (21)Benefits and expenses paid (733) (668)
Balance at end of period $ 11,734 $ 11,969
Reconciliation of Funded StatusProjected benefit obligation $ 16,456 $ 16,845Fair value of plan assets 11,734 11,969Unfunded Status $ (4,722) $ (4,876)
Balance Sheet ClassificationOther long-term liabilities $ 4,722 $ 4,876

66
Total plan expense and other amounts recognized in accumulated other comprehensive loss for the years ended January 28, 2017,January 30, 2016 and January 31, 2015 include the following components:
January 28,2017
January 30,2016
January 31,2015
Net pension cost: (in thousands)Interest cost on projected benefit obligation $ 686 $ 634 $ 669Expected return on plan assets (927) (1,013) (1,002)Amortization of unrecognized loss 946 1,026 591Net pension cost $ 705 $ 647 $ 258
Other changes recognized in other comprehensive loss,before taxes:
Unrecognized losses at the beginning of the year $ 8,139 $ 9,746 $ 6,614Net periodic pension cost (705) (647) (258)Employer contribution — 146 468Change in plan assets and benefit obligations (154) (1,106) 2,922Unrecognized losses at the end of year $ 7,280 $ 8,139 $ 9,746
The Company’s contribution for fiscal 2017 is estimated to be approximately $586,000.
Assumptions used to determine the benefit obligations as of January 28, 2017 and January 30, 2016 include a discount rate of 4.00%for fiscal 2016 and 4.16% for fiscal 2015. Assumptions used to determine the net periodic benefit cost for the years ended January 28,2017, January 30, 2016 and January 31, 2015 included a discount rate of 4.00% for fiscal 2016, 4.16% for fiscal 2015 and 3.42% forfiscal 2014.
The expected long-term rate of return for plan assets was assumed to be 8.00% for both fiscal 2016 and fiscal 2015. The expectedlong-term rate of return assumption was developed considering historical and future expectations for returns for each asset class.
Estimated Future Benefit Payments
The estimated future benefits for the next ten fiscal years are as follows:
TotalFISCAL YEAR (in thousands)2017 $ 8042018 8362019 8672020 9452021 9772022-2026 5,145
$ 9,574

67
Plan Assets
The fair values of the Company’s noncontributory defined benefit retirement plan assets at the end of fiscal 2016 and fiscal 2015, byasset category, were as follows:
Fair Value MeasurementJanuary 28, 2017 January 30, 2016
(in thousands)
Quoted Pricesin ActiveMarkets forIdenticalAssets(Level 1)
SignificantObservableInputs(Level 2)
SignificantUnobservable
Inputs(Level 3) Total
Quoted Pricesin ActiveMarkets
for IdenticalAssets(Level 1)
SignificantObservableInputs(Level 2)
SignificantUnobservable
Inputs(Level 3) Total
Asset category:Common Stock :U.S. $ 2,645 $ — $ — $ 2,645 $ 6,537 $ — $ — $ 6,537Foreign 210 — — 210 — — — —Mutual Funds:U.S. Equity 2,153 — — 2,153 407 — — 407International Equity 2,039 — — 2,039 1,596 — — 1,596Bond 4,418 — — 4,418 2,914 — — 2,914Real Estate Investment Trust 6 — — 6 — — — —Cash 263 — — 263 515 — — 515Total $ 11,734 $ — $ — $11,734 $ 11,969 $ — $ — $11,969
The Company’s target asset allocation for fiscal 2017 and its asset allocation at January 28, 2017 and January 30, 2016 were asfollows, by asset category:
Target Allocation Percentage of plan assets atFiscal 2017 January 28, 2017 January 30, 2016
Asset category:Equity securities 60.0% 60.1% 71.4%Debt securities 38.0% 37.7% 24.3%Cash 2.0% 2.2% 4.3%Total 100.0% 100.0% 100.0%
The target policy is set to maximize returns with consideration to the long-term nature of the obligations and maintaining a lower levelof overall volatility through the allocation of fixed income. The asset allocation is reviewed throughout the year for adherence to thetarget policy and is rebalanced periodically towards the target weights.
Supplemental Executive Retirement Plan
In connection with the Casual Male acquisition, the Company also assumed the liability of the Casual Male Supplemental RetirementPlan (the “SERP”).

68
The following table sets forth the SERP’s funded status at January 28, 2017 and January 30, 2016:
January 28,2017
January 30,2016
in thousandsChange in benefit obligation:Balance at beginning of period $ 670 $ 745Benefits and expenses paid (30) (30)Interest costs 27 25Actuarial (gain) loss (15) (70)Balance at end of year $ 652 $ 670
Change in fair value of plan assetsBalance at beginning of period $ — $ —Employer contributions 30 30Benefits and expenses paid (30) (30)Balance at end of period $ — $ —
Projected benefit obligation $ 652 $ 670
Reconciliation of Funded StatusProjected benefit obligation $ 652 $ 670Fair value of plan assets — —Unfunded Status $ (652) $ (670)
Balance Sheet ClassificationOther long-term liabilities $ 652 $ 670
Other changes recognized in other comprehensive loss, before taxes (in thousands):
January 28,2017
January 30,2016
January 31,2015
Other changes recognized in other comprehensive loss,before taxes:
in thousands
Unrecognized losses at the beginning of the year $ 178 $ 256 $ 142Net periodic pension cost (33) (34) (31)Employer contribution 30 30 30Change in benefit obligations (18) (74) 115Unrecognized losses at the end of year $ 157 $ 178 $ 256
Assumptions used to determine the benefit obligations as of January 28, 2017 and January 30, 2016 included a discount rate of 4.00%for fiscal 2016 and 4.16% for fiscal 2015. Assumptions used to determine the net periodic benefit cost for the years ended January 28,2017, January 30, 2016 and January 31, 2015 included a discount rate of 4.00% for fiscal 2016, 4.16% for fiscal 2015 and 3.42% forfiscal 2014.
Defined Contribution Plan
The Company has one defined contribution plan, the Destination XL Group, Inc. 401(k) Savings Plan (the “401(k) Plan”). Under the401(k) Plan, the Company offers a qualified automatic contribution arrangement (“QACA”) with the Company matching 100% of thefirst 1% of deferred compensation and 50% of the next 5% (with a maximum contribution of 3.5% of eligible compensation). As ofJanuary 1, 2015, employees who are 21 years of age or older are eligible to make deferrals after 6 months of employment and areeligible to receive a Company match after one year of employment and 1,000 hours.
The Company recognized $2.2 million, $2.0 million and $1.6 million of expense under this plan in fiscal 2016, fiscal 2015 and fiscal2014, respectively.

69
J. DISCONTINUED OPERATIONS
Sears Canada
In the second quarter of fiscal 2014, the Company notified Sears Canada of its intent to exit the business and began the process of anorderly wind-down. The Company ceased taking new orders and completed the run-off of operations through a final settlement withSears during the fourth quarter of fiscal 2014. The loss for fiscal 2014 includes a charge, recorded in the second quarter of fiscal 2014,of approximately $0.8 million related primarily to inventory reserves and sales allowances as a result of our decision to exit thebusiness. The following are the results of operations for fiscal 2014. There were no results of operations for this discontinuedbusiness in fiscal 2015 and fiscal 2016.
For the fiscal year ended: January 31, 2015(in thousands)
Sales $ (450)Gross margin (998)Selling, general and administrative expenses (120)Depreciation and amortization —Provision (benefit) from income taxes —Loss from discontinued operations $ (1,118)
K. SUBSEQUENT EVENT
On March 17, 2017, the Company’s Board of Directors approved a stock repurchase program. Under the stock repurchase program,the Company may repurchase up to $12.0 million of its common stock through open market and privately negotiated transactionsduring fiscal 2017.
The timing and the amount of any repurchases of common stock will be determined based on the Company’s evaluation of marketconditions and other factors. The stock repurchase program is expected to commence in the first quarter of fiscal 2017 and will expireon February 3, 2018, but may be suspended, terminated or modified at any time for any reason. The Company expects to finance therepurchases from operating funds and/or periodic borrowings on its Credit Facility. Any shares of repurchased common stock will beheld as treasury stock.
L. SELECTED QUARTERLY DATA (UNAUDITED)
(Certain columns may not foot due to rounding.)
FIRSTQUARTER
SECONDQUARTER
THIRDQUARTER
FOURTHQUARTER
FULLYEAR
(In Thousands, Except Per Share Data)FISCAL YEAR 2016Sales $ 107,891 $ 117,875 $ 101,871 $ 122,646 $ 450,283Gross profit 49,766 54,843 45,238 55,034 204,881Operating income (loss) 1,055 1,017 (3,639) 2,544 977Income (loss) before taxes 271 234 (4,418) 1,823 (2,090)Income tax provision 57 35 34 40 166Net income (loss) $ 214 $ 199 $ (4,452) $ 1,783 $ (2,256)Earnings (loss) per share – basic and diluted $ 0.00 $ 0.00 $ (0.09) $ 0.04 $ (0.05)
FISCAL YEAR 2015Sales $ 104,405 $ 114,147 $ 99,625 $ 124,044 $ 442,221Gross profit 48,239 53,883 44,864 56,853 203,839Operating income (loss) 248 (166) (4,626) (546) (5,090)Loss before taxes (513) (912) (5,409) (1,314) (8,148)Income tax provision 61 67 63 69 260Net loss $ (574) $ (979) $ (5,472) $ (1,383) $ (8,408)Earnings (loss) per share – basic and diluted $ (0.01) $ (0.02) $ (0.11) $ (0.03) $ (0.17)

70
The Company’s fiscal quarters are based on a retail cycle of 13 weeks. Historically, and consistent with the retail industry, theCompany has experienced seasonal fluctuations as it relates to its operating income and net income. Traditionally, a significant portionof the Company’s operating income and net income is generated in the fourth quarter, as a result of the holiday selling season.

71
Item 9. Changes in and Disagreements with Accountants on Accounting and Financial Disclosure
None.
Item 9A. Controls and Procedures
Management’s Conclusions Regarding the Effectiveness of Disclosure Controls and Procedures
As required by Rule 13a-15 under the Securities Exchange Act of 1934, as amended (the “Exchange Act”), our management, underthe supervision and with the participation of our Chief Executive Officer and Chief Financial Officer, evaluated the effectiveness ofour disclosure controls and procedures (as defined in Rules 13a-15(e) and 15d-15(e) under the Exchange Act) as of January 28, 2017.Based on this evaluation, our Chief Executive Officer and Chief Financial Officer concluded that, as of January 28, 2017, ourdisclosure controls and procedures were effective.
Management’s Annual Report on Internal Control Over Financial Reporting
Our management is responsible for establishing and maintaining adequate internal control over financial reporting as defined in Rule13a-15(f) under the Exchange Act. Our internal control over financial reporting is a process designed under the supervision of ourChief Executive Officer and Chief Financial Officer to provide reasonable assurance regarding the reliability of financial reportingand the preparation of financial statements for external purposes in accordance with generally accepted accounting principles. Ourinternal control over financial reporting includes those policies and procedures that:
(i) pertain to the maintenance of records that, in reasonable detail, accurately and fairly reflect the transactions anddispositions of our assets;
(ii) provide reasonable assurance that transactions are recorded as necessary to permit preparation of financial statementsin accordance with generally accepted accounting principles, and that our receipts and expenditures are being made only inaccordance with authorizations of our management and directors; and
(iii) provide reasonable assurance regarding prevention or timely detection of unauthorized acquisition, use or dispositionof assets that could have a material effect on the financial statements.
There are inherent limitations in the effectiveness of any internal control, including the possibility of human error and thecircumvention or overriding of controls. Accordingly, even effective internal controls can provide only reasonable assurances withrespect to financial statement preparation. Also, projections of any evaluation of effectiveness to future periods are subject to the riskthat controls may become inadequate because of changes in conditions, or that the degree of compliance with the policies orprocedures may deteriorate.
Management assessed the design and effectiveness of our internal control over financial reporting as of January 28, 2017. In makingthis assessment, management used the criteria set forth by the Committee of Sponsoring Organizations of the Treadway Commission(COSO) in Internal Control- Integrated Framework (2013).
Based on management’s assessment and the above mentioned criteria, management determined that we maintained effective internalcontrol over financial reporting as of January 28, 2017.
KPMG, LLP, our independent registered public accounting firm, has issued an audit report on our internal control over financialreporting as of January 28, 2017, which appears below.

72
REPORT OF INDEPENDENT REGISTERED PUBLIC ACCOUNTING FIRM
The Board of Directors and Shareholdersof Destination XL Group, Inc.
We have audited Destination XL Group, Inc.’s (the Company) internal control over financial reporting as of January 28, 2017,based on criteria established in Internal Control—Integrated Framework (2013) issued by the Committee of Sponsoring Organizationsof the Treadway Commission (COSO). Destination XL Group, Inc.’s management is responsible for maintaining effective internalcontrol over financial reporting and for its assessment of the effectiveness of internal control over financial reporting, included in theaccompanying Management’s Annual Report on Internal Control Over Financial Reporting. Our responsibility is to express anopinion on the company’s internal control over financial reporting based on our audit.
We conducted our audit in accordance with the standards of the Public Company Accounting Oversight Board (United States).Those standards require that we plan and perform the audit to obtain reasonable assurance about whether effective internal controlover financial reporting was maintained in all material respects. Our audit included obtaining an understanding of internal control overfinancial reporting, assessing the risk that a material weakness exists, and testing and evaluating the design and operating effectivenessof internal control based on the assessed risk. Our audit also included performing such other procedures as we considered necessary inthe circumstances. We believe that our audit provides a reasonable basis for our opinion.
A company’s internal control over financial reporting is a process designed to provide reasonable assurance regarding thereliability of financial reporting and the preparation of financial statements for external purposes in accordance with generallyaccepted accounting principles. A company’s internal control over financial reporting includes those policies and procedures that (1)pertain to the maintenance of records that, in reasonable detail, accurately and fairly reflect the transactions and dispositions of theassets of the company; (2) provide reasonable assurance that transactions are recorded as necessary to permit preparation of financialstatements in accordance with generally accepted accounting principles, and that receipts and expenditures of the company are beingmade only in accordance with authorizations of management and directors of the company; and (3) provide reasonable assuranceregarding prevention or timely detection of unauthorized acquisition, use, or disposition of the company’s assets that could have amaterial effect on the financial statements.
Because of its inherent limitations, internal control over financial reporting may not prevent or detect misstatements. Also,projections of any evaluation of effectiveness to future periods are subject to the risk that controls may become inadequate because ofchanges in conditions, or that the degree of compliance with the policies or procedures may deteriorate.
In our opinion, Destination XL Group, Inc. maintained, in all material respects, effective internal control over financial reportingas of January 28, 2017, based on the criteria established in Internal Control—Integrated Framework (2013) issued by the Committeeof Sponsoring Organizations of the Treadway Commission.
We also have audited, in accordance with the standards of the Public Company Accounting Oversight Board (United States), theconsolidated balance sheets of Destination XL Group, Inc. and subsidiaries as of January 28, 2017 and January 30, 2016, and therelated consolidated statements of operations, comprehensive income (loss), changes in stockholders’ equity, and cash flows for eachof the years in the three-year period ended January 28, 2017, and our report dated March 20, 2017 expressed an unqualified opinion onthose consolidated financial statements.
/s/ KPMG LLP
Boston, MassachusettsMarch 20, 2017
Changes in Internal Control Over Financial Reporting
No change in our internal control over financial reporting (as defined in Rules 13a-15(f) and 15d-15(f) under the Exchange Act)occurred during the fiscal quarter ended January 28, 2017 that has materially affected, or is reasonably likely to materially affect, ourinternal control over financial reporting.
Item 9B. Other Information.
None.

73
PART III.
Pursuant to Paragraph G(3) of the General Instructions to Form 10-K, the information required by Part III (Items 10, 11, 12, 13 and14) is being incorporated by reference herein from our definitive proxy statement (or an amendment to this Annual Report on Form10-K) to be filed with the Securities and Exchange Commission within 120 days of the end of the fiscal year ended January 28, 2017in connection with our 2017 Annual Meeting of Stockholders.
Item 10. Directors, Executive Officers and Corporate Governance
Information with respect to this item is incorporated by reference from our definitive proxy statement (or amendment to this AnnualReport on Form 10-K) to be filed with the SEC within 120 days of the end of the fiscal year ended January 28, 2017.
Item 11. Executive Compensation
Information with respect to this item is incorporated by reference from our definitive proxy statement (or amendment to this AnnualReport on Form 10-K) to be filed with the SEC within 120 days of the end of the fiscal year ended January 28, 2017.
Item 12. Security Ownership of Certain Beneficial Owners and Management and Related Stockholder Matters
Information with respect to this item is incorporated by reference from our definitive proxy statement (or amendment to this AnnualReport on Form 10-K) to be filed with the SEC within 120 days of the end of the fiscal year ended January 28, 2017.
Item 13. Certain Relationships and Related Transactions, and Director Independence
Information with respect to this item is incorporated by reference from our definitive proxy statement (or amendment to this AnnualReport on Form 10-K) to be filed with the SEC within 120 days of the end of the fiscal year ended January 28, 2017.
Item 14. Principal Accounting Fees and Services
Information with respect to this item is incorporated by reference from our definitive proxy statement (or amendment to this AnnualReport on Form 10-K) to be filed with the SEC within 120 days of the end of the fiscal year ended January 28, 2017.

74
PART IV.
Item 15. Exhibits, Financial Statement Schedules
15(a)(1) Financial Statements
The list of consolidated financial statements and notes required by this Item 15(a)(1) is set forth in the “Index to ConsolidatedFinancial Statements” on page 42 of this Annual Report.
15(a)(2) Financial Statement Schedules
All schedules have been omitted because the required information is not applicable or is not present in amounts sufficient to requiresubmission of the schedules, or because the information required is included in the financial statements or notes thereto.
15(a)(3) Exhibits
The list of exhibits required by this Item 15(a)(3) is set forth in the “Index to Exhibits” beginning on page 75 of this Annual Report.
Item 16. Form 10-K Summary
Omitted at registrant’s option.

75
Index to Exhibits
Exhibits
3.1 Restated Certificate of Incorporation of the Company (conformed copy incorporating all amendments throughFebruary 25, 2013). *
3.2 Fourth Amended and Restated By-Laws (included as Exhibit 3.1 to the Company’s Current Report on Form 8-K filedon June 18, 2015, and incorporated herein by reference).
10.1 Company’s 2006 Incentive Compensation Plan, as amended (included as Exhibit 10.3 to the Company’s AnnualReport on Form 10-K filed March 17, 2014, and incorporated herein by reference). †
10.2 Company’s 2016 Incentive Compensation Plan, as amended (included as Exhibit 10.1 to the Company’s CurrentReport on Form 8-K filed on August 8, 2016, and incorporated herein by reference). †
10.3 Form of Non-Qualified Option Agreement for Associates. *†
10.4 Form of Non-Qualified Option Agreement for Associates (pursuant to the Company’s Long-Term Incentive Plan). *†
10.5 Form of Restricted Stock Agreement for Associates. *†
10.6 Form of Restricted Stock Agreement for Associates (pursuant to the Company’s Long-Term Incentive Plan). *†
10.7 Form of Restricted Stock Unit Agreement for Associates. *†
10.8 Form of Restricted Stock Unit Agreement for Associates (pursuant to the Company’s Long-Term Incentive Plan). *†
10.9 Form of Restricted Stock Unit Agreement for Non-Employee Directors. *†
10.10 Company’s Second Amended and Restated Non-Employee Director Compensation Plan (included as Exhibit 10.1 tothe Company’s Quarterly Report on Form 10-Q filed on August 27, 2015, and incorporated herein by reference). †
10.11 First Amendment to the Company’s Second Amended and Restated Non-Employee Director Compensation Plan(included as Exhibit 10.6 to the Company’s Annual Report on Form 10-K filed on March 18, 2016, and incorporatedherein by reference). †
10.12 Second Amendment to the Company’s Second Amended and Restated Non-Employee Director Compensation Plan(included as Exhibit 10.7 to the Company’s Annual Report on Form 10-K filed on March 18, 2016, and incorporatedherein by reference). †
10.13 Third Amendment to the Company’s Second Amended and Restated Non-Employee Director Compensation Plan. *
10.14 Sixth Amended and Restated Loan and Security Agreement dated November 10, 2010, by and among Bank ofAmerica, N.A., as Administrative Agent and Collateral Agent, the Revolving Credit Lenders identified therein, theCompany, as Borrowers’ Representative, and the Company and CMRG Apparel, LLC, as Borrowers (included asExhibit 10.1 to the Company’s Current Report on Form 8-K/A filed on January 7, 2011, and incorporated herein byreference).
10.15 First Amendment to Sixth Amended and Restated Loan and Security Agreement, First Amendment to Amended andRestated Guaranty, First Amendment to Amended and Restated Security Agreement and Termination Agreementdated June 26, 2013, by and among Bank of America, N.A., as Administrative Agent and Collateral Agent, theRevolving Credit Lenders identified therein, the Company, as Borrowers’ Representative, and the Company andCMRG Apparel, LLC, as Borrowers (included as Exhibit 10.1 to the Company’s Quarterly Report on Form 10-Q filedon August 23, 2013, and incorporated herein by reference).
10.16 Second Amendment to Sixth Amended and Restated Loan and Security Agreement dated October 30, 2014, by andamong Bank of America, N.A., as Administrative Agent and Collateral Agent, the Revolving Credit Lendersidentified therein, the Company, as Borrowers’ Representative, and the Company and CMRG Apparel, LLC, asBorrowers (included as Exhibit 10.1 to the Company’s Quarterly Report on Form 10-Q filed on November 21, 2014,and incorporated herein by reference).
**
10.17 Master Loan and Security Agreement dated July 20, 2007 between the Company and Banc of America Leasing &Capital, LLC (included as Exhibit 10.1 to the Company’s Current Report on Form 8-K filed on July 23, 2007, andincorporated herein by reference).

76
Exhibits
10.18 Amendment Number 1 to Master Loan and Security Agreement dated September 30, 2013 between the Company andBanc of America Leasing & Capital, LLC. (included as Exhibit 10.2 to the Company’s Current Report on Form 8-Kfiled on October 3, 2013, and incorporated herein by reference).
10.19 Equipment Security Note Number 17608-70003 to the Master Loan and Security Agreement, as amended, datedOctober 1, 2013 between the Company and Banc of America Leasing & Capital, LLC. (included as Exhibit 10.3 to theCompany’s Current Report on Form 8-K filed on October 3, 2013, and incorporated herein by reference).
10.20 Equipment Security Note Number 17608-70004 to the Master Loan and Security Agreement, as amended, datedSeptember 30, 2013 between the Company and Banc of America Leasing & Capital, LLC. (included as Exhibit 10.4to the Company’s Current Report on Form 8-K filed on October 3, 2013, and incorporated herein by reference).
10.21 Equipment Security Note Number 17608-70005 to the Master Loan and Security Agreement, as amended, datedSeptember 30, 2013 between the Company and Banc of America Leasing & Capital, LLC. (included as Exhibit 10.5to the Company’s Current Report on Form 8-K filed on October 3, 2013, and incorporated herein by reference).
10.22 Equipment Security Note Number 17608-70006 to the Master Loan and Security Agreement, as amended, datedSeptember 30, 2013 between the Company and Banc of America Leasing & Capital, LLC. (included as Exhibit 10.6to the Company’s Current Report on Form 8-K filed on October 3, 2013, and incorporated herein by reference).
10.23 Equipment Security Note Number 17608-70007 to the Master Loan and Security Agreement, as amended, datedDecember 23, 2013 between the Company and Banc of America Leasing & Capital, LLC. (included as Exhibit 10.1 tothe Company’s Current Report on Form 8-K filed on January 8, 2014, and incorporated herein by reference).
10.24 Equipment Security Note Number 17608-70008 to the Master Loan and Security Agreement, as amended, datedDecember 23, 2013 between the Company and Banc of America Leasing & Capital, LLC. (included as Exhibit 10.2 tothe Company’s Current Report on Form 8-K filed on January 8, 2014, and incorporated herein by reference).
10.25 Equipment Security Note Number 17608-70009 to the Master Loan and Security Agreement, as amended, datedDecember 23, 2013 between the Company and Banc of America Leasing & Capital, LLC. (included as Exhibit 10.3 tothe Company’s Current Report on Form 8-K filed on January 8, 2014, and incorporated herein by reference).
10.26 Equipment Security Note Number 17608-70010 to the Master Loan and Security Agreement, as amended, datedMarch 28, 2014 between the Company and Banc of America Leasing & Capital LLC (included as Exhibit 10.1 to theCompany’s Current Report on Form 8-K filed on April 1, 2014, and incorporated herein by reference).
10.27 Equipment Security Note Number 17608-70011 to the Master Loan and Security Agreement, as amended, datedMarch 28, 2014 between the Company and Banc of America Leasing & Capital LLC (included as Exhibit 10.2 to theCompany’s Current Report on Form 8-K filed on April 1, 2014, and incorporated herein by reference).
10.28 Equipment Security Note Number 17608-70012 to the Master Loan and Security Agreement, as amended, datedMarch 28, 2014 between the Company and Banc of America Leasing & Capital LLC (included as Exhibit 10.3 to theCompany’s Current Report on Form 8-K filed on April 1, 2014, and incorporated herein by reference).
10.29 Equipment Security Note Number 17608-70013 to the Master Loan and Security Agreement, as amended, dated June23, 2014 between the Company and Banc of America Leasing & Capital LLC (included as Exhibit 10.1 to theCompany’s Current Report on Form 8-K filed on June 26, 2014, and incorporated herein by reference).
10.30 Equipment Security Note Number 17608-70014 to the Master Loan and Security Agreement, as amended, dated June23, 2014 between the Company and Banc of America Leasing & Capital LLC (included as Exhibit 10.2 to theCompany’s Current Report on Form 8-K filed on June 26, 2014, and incorporated herein by reference).
10.31 Term Loan and Security Agreement, dated October 29, 2014, by and among Wells Fargo Bank, National Association,as Administrative Agent and Collateral Agent, the Company, as Borrowers’ Representative, and the company andCMRG Apparel, LLC, as Borrowers (included as Exhibit 10.2 to the Company’s Quarterly Report on Form 10-Q filedon November 21, 2014, and incorporated herein by reference). **
10.32 Employment and Chairman Compensation Agreement, dated August 7, 2014, between the Company and SeymourHoltzman (included as Exhibit 10.1 to the Company’s Current Report on Form 8-K filed on August 12, 2014, andincorporated herein by reference). †

77
Exhibits
10.33 Revised and Restated Employment Agreement dated as of November 5, 2009 between the Company and David A.Levin (included as Exhibit 10.1 to the Company’s Current Report on Form 8-K filed on November 19, 2009, andincorporated herein by reference). †
10.34 Amended and Restated Employment Agreement between the Company and Peter H. Stratton, Jr. dated as of May 29,2014 (included as Exhibit 10.1 to the Company’s Current Report on Form 8-K filed on May 29, 2014, andincorporated herein by reference). †
10.35 Employment Agreement between the Company and Robert S. Molloy dated as of January 7, 2010 (included as Exhibit10.2 to the Company’s Current Report on Form 8-K filed on January 11, 2010, and incorporated herein by reference). †
10.36 Employment Agreement between the Company and Francis C. Chane dated as of January 8, 2010 (included as Exhibit10.34 to the Company’s Annual Report on Form 10-K filed on March 19, 2010, and incorporated herein byreference). †
10.37 Employment Agreement between the Company and Kenneth M. Ederle dated as of September 2, 2015 (included asExhibit 10.1 to the Company’s Quarterly Report on Form 10-Q filed on November 20, 2015, and incorporated hereinby reference). †
10.38 Employment Agreement between the Company and Peter E. Schmitz dated as of January 1, 2013 (included as Exhibit10.3 to the Company’s Quarterly Report on Form 10-Q filed on November 22, 2013, and incorporated herein byreference). †
10.39 Employment Agreement between the Company and Walter E. Sprague dated as of January 8, 2010 (included asExhibit 10.40 to the Company’s Annual Report on Form 10-K filed on March 19, 2010, and incorporated herein byreference). †
10.40 Employment Agreement between the Company and Brian Reaves dated as of November 10, 2014 (included as Exhibit10.38 to the Company’s Annual Report on Form 10-K filed on March 25, 2015, and incorporated herein byreference). †
10.41 Employment Agreement between the Company and Angela Chan (formerly Chew) dated as of February 1, 2015(included as Exhibit 10.40 to the Company’s Annual Report on Form 10-K filed on March 25, 2015, and incorporatedherein by reference). †
10.42 Employment Agreement between the Company and John F. Cooney dated as of May 17, 2015 (included as Exhibit10.2 to the Company’s Quarterly Report on Form 10-Q filed on August 27, 2015, and incorporated herein byreference). †
10.43 Employment Agreement between the Company and Mary Luttrell effective as of January 18, 2017. *†
10.44 Employment Agreement between the Company and Sahal S. Laher effective as of January 30, 2017 . *†
10.45 2013-2016 Destination XL Group, Inc. Long-Term Incentive Plan (included as Exhibit 10.1 to the Company’s CurrentReport on Form 8-K filed June 3, 2013, and incorporated herein by reference). †
10.46 2016 Destination XL Group, Inc. Long-Term Incentive Wrap-Around Plan (included as Exhibit 10.1 to theCompany’s Current Report on Form 8-K filed November 13, 2014, and incorporated herein by reference). †
10.47 Form of Non-Qualified Stock Option Agreement pursuant to the Company’s 2013-2016 Long-Term Incentive Plan(included as Exhibit 10.2 to the Company’s Quarterly Report on Form 10-Q filed on August 23, 2013, andincorporated herein by reference). †
10.48 Form of Restricted Stock Agreement pursuant to the Company’s 2013-2016 Long-Term Incentive Plan (included asExhibit 10.3 to the Company’s Quarterly Report on Form 10-Q filed on August 23, 2013, and incorporated herein byreference). †
10.49 Company’s Third Amended and Restated Annual Incentive Plan. *†
10.50 Company’s Amended and Restated Long-Term Incentive Plan. *†

78
Exhibits
10.51 Registration Rights Agreement dated November 18, 2003 by and between the Company and Thomas Weisel PartnersLLC (included as Exhibit 10.4 to the Company’s Quarterly Report on Form 10-Q filed on December 9, 2003, andincorporated herein by reference).
10.52 Contribution Agreement dated January 30, 2006 by and among the Company, Spirit SPE Canton, LLC and SpiritFinance Acquisitions, LLC (included as Exhibit 10.1 to the Company’s Current Report on Form 8-K filed onFebruary 3, 2006, and incorporated herein by reference).
10.53 Membership Interest Purchase Agreement dated January 30, 2006 by and between the Company and Spirit FinanceAcquisitions, LLC (included as Exhibit 10.2 to the Company’s Current Report on Form 8-K filed on February 3,2006, and incorporated herein by reference).
10.54 Lease Agreement dated February 1, 2006 by and between the Company and Spirit SPE Canton, LLC (included asExhibit 10.3 to the Company’s Current Report on Form 8-K filed on February 3, 2006, and incorporated herein byreference).
10.55 Buying Agency Agreement effective November 16, 2005 by and between Designs Apparel, Inc. and Li & Fung(included as Exhibit 10.47 to the Company’s Annual Report on Form 10-K filed March 31, 2006, and incorporatedherein by reference).
21.1 Subsidiaries of the Registrant. *
23.1 Consent of Independent Registered Public Accounting Firm. *
31.1 Certification of Chief Executive Officer of the Company pursuant to Rule 13a-14(a) under the Securities ExchangeAct of 1934. *
31.2 Certification of Chief Financial Officer of the Company pursuant to Rule 13a-14(a) under the Securities ExchangeAct of 1934. *
32.1 Certification of Chief Executive Officer pursuant to 18 U.S.C. Section 1350, as adopted pursuant to Section 906 of theSarbanes-Oxley Act of 2002. *
32.2 Certification of Chief Financial Officer pursuant to 18 U.S.C. Section 1350, as adopted pursuant to Section 906 of theSarbanes-Oxley Act of 2002. *
101 The following materials from the Company’s Annual Report on Form 10-K for the year ended January 28, 2017,formatted in XBRL (eXtensible Business Reporting Language): (i) Consolidated Balance Sheets, (ii) ConsolidatedStatements of Operations, (iii) Consolidated Statements of Changes in Stockholders’ Equity, (iv) ConsolidatedStatements of Comprehensive Income, (v) Consolidated Statements of Cash Flows, and (vi) Notes to ConsolidatedFinancial Statements. *
* Filed herewith.** Portions of this Exhibit have been omitted pursuant to a grant of confidential treatment.† Denotes management contract or compensatory plan or arrangement.

79
SIGNATURES
Pursuant to the requirements of Section 13 or 15(d) of the Securities Exchange Act of 1934, the registrant has duly caused this reportto be signed on its behalf by the undersigned, thereunto duly authorized.
DESTINATION XL GROUP, INC.March 20, 2017
By: /s/ DAVID A. LEVINDavid A. Levin
President and Chief Executive Officer
Pursuant to the requirements of the Securities Exchange Act of 1934, this report has been signed below by the following persons onbehalf of the registrant in the capacities and on the dates indicated.
Signatures Title Date
/s/ DAVID A. LEVINDavid A. Levin
President and Chief Executive Officer (Principal ExecutiveOfficer) and Director
March 20, 2017
/s/ PETER H. STRATTON, JR.Peter H. Stratton, Jr.
Senior Vice President, Chief Financial Officer andTreasurer (Principal Financial Officer)
March 20, 2017
/s/ JOHN F. COONEYJohn F. Cooney
Vice President of Finance, Chief Accounting Officer andCorporate Controller (Principal Accounting Officer)
March 20, 2017
/s/ SEYMOUR HOLTZMANSeymour Holtzman
Chairman of the Board of Directors March 20, 2017
/s/ ALAN S. BERNIKOWAlan S. Bernikow
Director March 20, 2017
/s/ JESSE H. CHOPERJesse H. Choper
Director March 20, 2017
/s/ JOHN E. KYEESJohn E. Kyees
Director March 20, 2017
/s/ WILLEMMESDAG
Willem MesdagDirector March 20, 2017
/s/ WARD K. MOONEY
Ward K. MooneyDirector March 20, 2017
/s/ GEORGE T. PORTER, JR.George T. Porter, Jr.
Director March 20, 2017
/s/ MITCHELL S. PRESSERMitchell S. Presser
Director March 20, 2017
/s/ IVY ROSSIvy Ross
Director March 20, 2017


2017ANNUALREPORT
OTHER SHAREHOLDER INFORMATIONBOARD OF DIRECTORSSeymour Holtzman Executive Chairman of the Board of Directors, Chief Executive Officer of Jewelcor Management, Inc.
Jesse H. Choper Earl Warren Professor of Public Law (Emeritus) University of California Law School
John E. Kyees Lead Independent Director
David Levin President and Chief Executive Officer
Willem Mesdag Managing Partner of Red Mountain Capital Partners LLC
Ward K. Mooney Chief Executive Officer of Crystal Financial LLC
George T. Porter
Mitchell S. Presser Partner at Freshfields Bruckhaus Deringer LLP
Ivy Ross VP Google
EXECUTIVE OFFICERDavid Levin President and Chief Executive Officer
SENIOR MANAGEMENTAngela Chan Senior Vice President, Chief Sourcing Officer and International Business Development
Francis C. Chane Senior Vice President, Distribution, Logistics and Facilities
Kenneth M. Ederle Senior Vice President and Chief Merchandising Officer - Planning and Allocation
Sahal S. Laher Senior Vice President, Chief Digital and Information Officer
Mary S. Luttrell Senior Vice President, Marketing
Robert S. Molloy Senior Vice President, General Counsel and Secretary
Brian S. Reaves Senior Vice President, Chief Sales Officer
Peter E. Schmitz Senior Vice President and Chief Real Estate Officer
Walter E. Sprague Senior Vice President, Human Resources
Peter H. Stratton, Jr. Senior Vice President, Chief Financial Officer and Treasurer
CORPORATE OFFICES555 Turnpike Street Canton, Massachusetts 02021 781.828.9300
FINANCIAL INFORMATIONRequests for financial information should be directed to our Investor Relations Department at our headquarters: Destination XL Group, Inc., 555 Turnpike Street, Canton, Massachusetts, 02021, by calling 781.828.9300 or emailing us at [email protected]. You may also visit our website at http://investor.destinationxl.com. A copy of our Annual Report on Form 10-K for the fiscal year ended January 28, 2017, filed with the Securities and Exchange Commission, may be obtained without charge upon request to the Investor Relations Department.
ANNUAL MEETINGOur 2017 Annual Meeting of Stockholders will be held on August 3, 2017.
TRANSFER AGENT AND REGISTRARInquiries regarding stock transfer requirements, address changes and lost stock certificates should be directed to: American Stock Transfer & Trust Company LLC 6201 15th Avenue Brooklyn, New York 11219 800-937-5449/718-921-8200, ext. 4801 • www.astfinancial.com
INDEPENDENT REGISTERED PUBLIC ACCOUNTING FIRM KPMG LLP Two Financial Center 60 South Street Boston, Massachusetts 02111
This Annual Report contains forward-looking statements within the meaning of the federal securities laws. You can identify these forward-looking statements by our use of the words “believes,” “anticipates,” “plans,” “expects,” “may,” “will,” “intends,” “estimates,” and similar expressions, whether in the negative or in the affirmative. Although we believe that these forward-looking statements reasonably reflect our plans, intentions and expectations, our actual results could differ materially from the plans, intentions and expectations disclosed in the forward-looking statements we make. We have included important factors in the cautionary statements under the heading “Risk Factors” under Item 1A of our Form 10-K for the year ended January 28, 2017, that we believe could cause our actual results to differ materially from the forward-looking statements that we make. Forward-looking statements contained in this Annual Report speak only as of the date of this report. Subsequent events or circumstances occurring after such date may render these incomplete or out of date. We undertake no obligation and expressly disclaim any duty to update such statements.

555 TURNPIKE ST. CANTON, MA 02021
DESTINATIONXL.COM
781.828.9300
DESTINATION XL GROUP, INC.