annual report november 30, 2011ocmgoldfund.com/wp-content/uploads/2016/01/2011-ocm-gold-fund... ·...
TRANSCRIPT

Annual Report
November 30, 2011


Dear Fellow Shareholder:
For the fiscal year ending November 30, 2011, the OCM Gold Fund Investor Class appreciated 1.70% (-2.88% after maximum sales load) while the Advisor Class gained 2.15% compared to -0.79% for the Philadelphia Gold and Silver Index (XAU)1 and 7.83% for the S&P 500 Index2. The price of gold rose 26.64% based on the London PM fix during the period. The majority of your Fund is comprised of shares of gold producers with a smaller percentage of exploration and mine development companies. This strategy led to the Fund’s outperformance of the XAU for the fiscal year and has enabled the Fund to outperform the XAU over longer time periods.
In our opinion, equities of gold mining companies failed to keep pace with gold bullion as investors focused on the business risks associated with mining during a period of general risk aversion in the capital markets. Further, talk of deflationary forces taking root led to belief in some corners of the market that gold prices may have reached a peak in the secular bull market. Consequently, historic trading multiples of gold shares collapsed. We are unwav-ering in our confidence however, that gold and gold mining shares will be the beneficiary of increased capital flows going forward as currency debasement switches into another gear in an effort to “paper over” liabilities amassed in the U.S. , European and Japanese economies.
Market CommentaryEconomic turmoil in Europe along with policy indecision in Washington set the stage for gold’s dramatic advance to record highs above $1,900 before settling back to close the fiscal year at $1,752. Additionally, elevated geo-political tensions in the Middle East and the Japanese natural disaster added safe haven buying in gold over the period. Cries of a bubble in gold were shouted by those who have failed to fully grasp the degree of monetary debasement that has transpired over the past decade, particularly since the U.S. credit crisis in 2008. It should also be noted that gold’s rise to new highs lacked the euphoria and widespread public participation typically associated with major market tops. In our opinion, the bull market in gold will run its course when there is resolution to the debt issues plaguing the U.S., Europe and Japan.
While policy makers and the market are hopeful economic growth will provide the necessary relief to avert an unraveling of the global economy, we are less optimistic considering the hurdles faced in both Europe and the U.S. We believe the struggle to rollover maturing European sovereign debt signals a new phase of the unwinding of the U.S. dollar credit cycle started in 2007. A phase, in our opinion, that promises to expose contingent liabilities (where the default of one entity causes a capital call on another) within the global financial system. With $2.6 trillion of Euro bank and Euro sovereign debt maturing in 2012, the question must be asked where is the rollover funding going to come from considering Euro banks, who are the big holders of the debt, are being asked to de-lever $3 to $5 trillion over the next three years? The European Central Bank (ECB) answer appears to be in balance sheet expansion via a new matched lending facility where technically insolvent Euro banks borrow and re-invest into bonds of technically insolvent Euro sovereigns. It is the ECB version of Quantitative Easing (QE) and in our opinion shows the ECB has started down the path of attempting to “paper over” its debt dilemma. The steady rise in inter-bank lending rates signals a quiet bank run taking place in Europe by those uneasy with the prospect of European policy makers’ ability to manage the crisis.
– 1 –

Capital flight has renewed the U.S. Dollar’s status of perceived safety, even though the U.S. is the largest net debtor nation. Contentious Washington politics make finding a solution to the explosion of U.S. debt difficult to imagine, in our eyes. Therefore, it must be kept in mind that there is no historical precedence for a nation to be a net debtor and issuer of the world’s reserve currency at the same time. Increased central bank purchases of gold during the fiscal year by China, Russia, Korea, Thailand, and Mexico, among others, highlights the growing desire of central banks to hedge against perceived long-term risk to the dollar as a store of value. The move by Switzerland’s central bank to devalue its currency through a QE program late in 2011 illustrates that no paper currency is a safe refuge in today’s interconnected global economy.
The bankruptcy of brokerage and commodities firm MF Global gave account holders a firsthand experience in the meaning of contingent liabilities when they learned the firm had dipped into client funds to use as collateral for its leveraged bet on Euro zone bonds. Central bankers are fully aware defaults by either a major bank or euro sovereign exposes the global financial system to a daisy chain of previously unexpected calls on capital. Fear of the unknown, or fear of the known as the case may be, will drive global central bankers to shy away from let-ting market forces clear the decks of bad credits, in our opinion. The remedy, as Federal Reserve Chairman Ben Bernanke most aptly pointed out in a 2002 speech about avoiding deflation, is the printing press. Understanding this underscores the investment case for owning gold and gold assets.
According to a recent Bianco Research survey of central bank activity, “Prior to the 2008 financial crisis, the eight central bank balance sheets were less than 15% the size of world stock markets and falling. In the immediate aftermath of Lehman Brothers’ failure, these eight central bank balance sheets swelled to 37% of the capitalization of the world stock market. But keep in mind that the late 2008/early 2009 peak was due to collapsing stock market values combined with balance sheet expansion via “lender of last resort” loans. Recently, the eight central bank balance sheets have spiked back to 33% of world stock market capitalization. This has come about not by lender of last resort loans, but rather by QE expansion… Central banks are ruling markets to a degree this generation has not seen. Collectively they are printing money to a degree never seen in human history”
0.0
200.0
400.0
600.0
800.0
1,000.0
1,200.0
1,400.0
1,600.0
1,800.0
2,000.0
USD
U.S. Dollar ‐ Euro Gold Price
Euro
– 2 –

Gold Mining Shares / Investment StrategyAlthough gold bullion performed well over the past fiscal year, the market failed to reward shares of gold mining companies, despite increased cash flows and dividends. We can point to several main factors for the poor perfor-mance of the mining company shares: anxiety over the prospect of the European debt crisis triggering a “Lehman Event” sent investors to the sidelines fearful a rush for liquidity would send gold shares into a similar tailspin experienced in 2008; market focus on the business risk of mining became more evident with the closing of one of Agnico-Eagle Mines Ltd.’s Canadian operations due to ground instability. Moreover, moves by gold produc-ing countries Peru and Ghana to increase taxes on gold mining added to the risk profile of increased taxation by revenue starved governments. Additionally, management risk was highlighted by Barrick Gold Corp. changing course in the eyes of the market by purchasing a copper company. Also, large hedge funds invested in the gold space were rumored to have experienced significant redemption pressure in the fourth quarter. Whether true or not, short sellers and other hedge funds moved to get in front of the trade.
Given the flight to safety in the capital markets, it is understandable investors would gravitate toward bullion first. However, we believe the market is currently mispricing business risk in shares of gold mining companies and the negative sentiment toward these companies is overdone. It is our belief as gold prices sustain current levels and move higher, the disappointments of 2011 will give way to investors placing greater appreciation of mining com-pany shares’ ability to provide returns through rising dividends and successful exploration while also attributing higher values on mining company reserves and resources in the ground. The historically wide divergence between the performance of gold shares and bullion represents an extraordinary entry point for those investors seeking gold asset exposure, in our opinion.
Your Fund outperformed the XAU for the fiscal year by concentrating on its tiered approach of owning major, intermediate/mid-tier and junior gold producers along with exploration and development companies. Two of the companies in the exploration and development category, Grayd Resources Corp. and Peregrine Metals Ltd., were acquired during the fiscal period by intermediate producers looking to add development projects for growth. The most notable disappointment in the portfolio over the period came from Agnico Eagle Mines Ltd., whose shares suffered from the unforeseen mine mishap previously mentioned. Over the next year, we see opportunities in miners that suffered operational hiccups in 2011, but have reserves that are unencumbered. We are also seeking companies demonstrating an ability to grow production and reserves on a per share basis. On the exploration and development front, we are looking for assets that are attractive additions to major and intermediate producers. Overall, we believe the market has affirmed our investment approach to the gold business over the long term.
ConclusionWe believe the unwinding of the U.S. Dollar credit cycle has reached the point of the highest degree of risk for investors. With total credit market debt 310% of GDP, we believe minor upticks in borrowing costs threaten to set off a cascading sequence of defaults and thereby exposing contingent liabilities throughout the global financial system. Central bank policy makers have no choice but to print money in hopes of papering over the problem, in our opinion. While the market might clamor for repeated rounds of QE, we see the prospect for other market forces to short circuit the effort and force a complete restructuring of the monetary system. We anticipate gold’s main monetary characteristic of not being someone else’s liability to gain wider appreciation as investors seek refuge from profligate central banks. Shares of mining companies will benefit, in our opinion, as gold in the ground will be preferable to money in the bank.
– 3 –

We appreciate your shareholding and confidence in the OCM Gold Fund and we look forward to assisting you in meeting your investment objectives. Should you have any questions regarding the Fund or gold, please contact your financial adviser or you may contact us directly at 1-800-779-4681. For questions regarding your account, please contact Shareholder Services at 1-800-628-9403.
Sincerely,
Gregory M. Orrell President and Portfolio Manager January 25, 2012
Investing in the OCM Gold Fund involves risks including the loss of principal. Many of the companies in which the Fund invests are smaller capitalization companies which may subject the fund to greater risk than securities of larger, more-established companies, as they often have limited product lines, markets or financial resources and may be subject to more-abrupt market movements. The Fund also invests in securities of gold and precious metals which may be subject to greater price fluctuations over short periods of time. The Fund is a non-diversified invest-ment company meaning it will invest in fewer securities than diversified investment companies and its performance may be more volatile. The Fund contains international securities that may provide the opportunity for greater return but also have special risks associated with foreign investing including fluctuations in currency, government regulation, differences in accounting standards and liquidity.
– 4 –

Investor Class Performance as of November 30, 2011
OCMGX (without load)
OCMGX (with load)
Philadelphia Gold and Silver Index
(XAU) S&P 500
Six Months 3.26% (-1.38%) 0.39% (-6.25%)
One Year 1.70% (-2.88%) (-0.79%) 7.83%
3 Year Annualized 37.13% 35.05% 28.26% 14.13%
5 Year Annualized 12.88% 11.85% 7.97% (-0.18%)
10 Year Annualized 23.68% 23.12% 16.13% 2.91%
Advisor Class Performance as of November 30, 2011
OCMAX
Philadelphia Gold and Silver Index
(XAU) S&P 500
Six Months 3.46% 0.39% (-6.25%)
One Year 2.15% (-0.79%) 7.83%
Since Inception Annualized* 22.75% 16.31% 6.09%
* Inception: April 1, 2010
The performance data quoted above represents past performance. Current performance may be lower or higher than the per-formance data quoted above. Past performance is no guarantee of future results. The investment return and principal value of an investment will fluctuate so that investor’s shares, when redeemed, may be worth more or less than their original cost. The Fund’s Total Annual Operating Expenses for the OCM Gold Fund Investor Class and Advisor Class are 1.93% and 1.34% respectively. Please review the Fund’s prospectus for more information regarding the Fund’s fees and expenses. For perfor-mance information current to the most recent month-end, please call toll-free 800-628-9403. The returns shown include the reinvestment of all dividends but do not reflect the deduction of taxes that a shareholder would pay on Fund distributions or the redemption of Fund shares
1 The Philadelphia Gold and Silver Index (XAU) is an unmanaged capitalization-weighted index composed of 16 companies listed on U.S. exchanges involved in the gold and silver mining industry. The index is generally considered as representative of the gold and silver share market.
2 The S&P 500 Index, a registered trademark of McGraw-Hill Co., Inc. is a market capitalization-weighted index of 500 widely held common stocks. You cannot invest directly in an index.
– 5 –

– 6 –
Shares Value
COMMON STOCKS 93.9%Major Gold Producers 32.4% 225,000 AngloGold Ashanti Ltd. ADR . . . . . . . . . . $ 10,791,000 75,000 Barrick Gold Corp. . . . . . . . . . . . . . . . . . 3,966,000 270,000 Gold Fields Ltd. ADR . . . . . . . . . . . . . . . 4,573,800 500,050 Goldcorp, Inc. . . . . . . . . . . . . . . . . . . . . . 26,847,685 500,000 Kinross Gold Corp. . . . . . . . . . . . . . . . . . 6,985,000 116,500 Newmont Mining Corp. . . . . . . . . . . . . . 8,024,520 61,188,005
Intermediate/Mid-Tier Gold Producers 36.9% 161,860 Agnico-Eagle Mines Ltd. . . . . . . . . . . . . 7,264,277 250,000 Alacer Gold Corp.* . . . . . . . . . . . . . . . . . 2,892,298 91,250 AuRico Gold, Inc.* . . . . . . . . . . . . . . . . . 914,334 500,000 Centerra Gold, Inc. . . . . . . . . . . . . . . . . . 11,157,410 550,000 Eldorado Gold Corp. . . . . . . . . . . . . . . . . 9,933,000 504,800 IAMGOLD Corp. . . . . . . . . . . . . . . . . . . . 10,186,864 200,000 New Gold, Inc.* . . . . . . . . . . . . . . . . . . . 2,218,000 140,000 Randgold Resources Ltd. ADR . . . . . . . . 14,967,400 600,000 Yamana Gold, Inc. . . . . . . . . . . . . . . . . . 10,098,000 69,631,583
Junior Gold Producers 8.4% 227,000 Argonaut Gold Ltd.* . . . . . . . . . . . . . . . . 1,533,438 250,000 Aurizon Mines Ltd.* . . . . . . . . . . . . . . . . 1,525,000 500,000 B2Gold Corp.* . . . . . . . . . . . . . . . . . . . . 1,789,304 291,200 Claude Resources, Inc.* . . . . . . . . . . . . . 548,168 305,500 Dundee Precious Metals, Inc.* . . . . . . . . 2,812,535 281,011 Kingsgate Consolidated Ltd. . . . . . . . . . . 1,890,014 146,400 Nevsun Resources Ltd. . . . . . . . . . . . . . 862,296 250,000 Perseus Mining Ltd.* . . . . . . . . . . . . . . . 762,292 500,000 Petaquilla Minerals Ltd.* . . . . . . . . . . . . 343,154 150,000 Primero Mining Corp.* . . . . . . . . . . . . . . 519,143 610,000 San Gold Corp.* . . . . . . . . . . . . . . . . . . . 1,196,137 200,000 SEMAFO, Inc.* . . . . . . . . . . . . . . . . . . . . 1,507,917 255,000 Wesdome Gold Mines Ltd. . . . . . . . . . . . 462,523 15,751,921
Shares Value
Exploration and Development Companies 6.9% 500,000 Amarillo Gold Corp.* . . . . . . . . . . . . . . . $ 637,286 240,000 Andina Minerals, Inc.* . . . . . . . . . . . . . . 204,716 400,000 Argentex Mining Corp.* . . . . . . . . . . . . . 127,600 2,190,000 Avala Resources Ltd.* . . . . . . . . . . . . . . 2,469,239 331,725 Colt Resources, Inc.* . . . . . . . . . . . . . . . 189,083 342,700 Edgewater Exploration Ltd.* . . . . . . . . . . 194,878 3,500,000 Indochine Mining Ltd.* . . . . . . . . . . . . . . 593,904 300,000 MAG Silver Corp.* . . . . . . . . . . . . . . . . . 2,514,829 275,000 Malbex Resources, Inc.*. . . . . . . . . . . . . 80,886 700,000 Millrock Resources, Inc.* . . . . . . . . . . . . 301,976 295,000 Ocean Park Ventures Corp.* . . . . . . . . . . 101,230 300,000 Rockhaven Resources Ltd.* . . . . . . . . . . 116,182 300,000 Sabina Silver Corp.* . . . . . . . . . . . . . . . . 1,182,411 350,000 South American Silver Corp.* . . . . . . . . . 542,183 350,000 Strategic Metals Ltd.* . . . . . . . . . . . . . . 531,889 3,323,045 Sutter Gold Mining, Inc.* . . . . . . . . . . . . 602,739 100,000 Tahoe Resources, Inc.*. . . . . . . . . . . . . . 1,821,658 500,000 Torex Gold Resources, Inc.* . . . . . . . . . . 857,885 13,070,574
Primary Silver Producers 5.3% 225,000 Fortuna Silver Mines, Inc.* . . . . . . . . . . . 1,522,134 48,075 Pan American Silver Corp. . . . . . . . . . . . 1,243,700 216,599 Silver Wheaton Corp. . . . . . . . . . . . . . . . 7,290,400 10,056,234
Other 4.0% 100,000 Altius Minerals Corp.* . . . . . . . . . . . . . . 1,065,738 14,800 Franco-Nevada Corp. . . . . . . . . . . . . . . . 626,709 65,000 Royal Gold, Inc. . . . . . . . . . . . . . . . . . . . 5,294,250 40,680 Stillwater Mining Co.* . . . . . . . . . . . . . . 443,819 7,430,516
Total Common Stocks (Cost $47,064,758) . . . . . . . . . . . . . . . . 177,128,833
OCM GOLD FUNDSchedule of Investments – November 30, 2011
See notes to financial statements.

Shares Value
EXCHANGE TRADED FUND 5.0% 55,000 SPDR Gold Trust* . . . . . . . . . . . . . . . . . . $ 9,357,150
Total Exchange Traded Fund (Cost $2,431,550) . . . . . . . . . . . . . . . . . 9,357,150
WARRANTS 0.1% 250,000 Amarillo Gold Corp.*†# Exercise Price 2.00 CAD, Exp. 10/29/2012 . . . . . . . . . . . . . . . . . — 33,000 Kinross Gold Corp.* Exercise Price $21.29, Exp. 9/17/2014 . . . . . . . . . . . . . . . . . . 65,356 40,000 Primero Mining Corp.* Exercise Price 8.00 CAD, Exp. 7/20/2015 . . . . . . . . . . . . . . . . . . 16,864 58,333 Silver Range Resources Ltd.* Exercise Price 0.85 CAD, Exp. 2/10/2013 . . . . . . . . . . . . . . . . . . 25,165 100,000 Yukon-Nevada Gold Corp.* Exercise Price 3.00 CAD, Exp. 6/20/2012 . . . . . . . . . . . . . . . . . . 1,225
Total Warrants (Cost $223,327) . . . . . . . . . . . . . . . . . . . 108,610
Shares Value
SHORT-TERM INVESTMENT 1.3%2,522,338 UMB Money Market Fiduciary, 0.01% . . $ 2,522,338
Total Short-Term Investment (Cost $2,522,338) . . . . . . . . . . . . . . . . . 2,522,338Total Investments (Cost $52,241,973) . . . . . . . . 100.3% 189,116,931Liabilities less Other Assets . . . . . . . . (0.3)% (484,366)TOTAL NET ASSETS . . . . . . . . . . . . 100.0% $ 188,632,565
ADR – American Depository Receipts.CAD – Canadian Dollars. * Non-income producing security. † Illiquid security. Security is valued at fair value in accordance
with procedures established by the Fund’s Board of Trustees. # Security exempt from registration under Rule 144A of the
Securities Act of 1933, as amended, or otherwise restricted. These securities may be resold in transactions exempt from registration, normally to qualified institutional buyers. The securities are valued at fair value in accordance with procedures established by the Fund’s Board of Trustees.
OCM GOLD FUNDSchedule of Investments – November 30, 2011 (Continued)
See notes to financial statements.
– 7 –
OCM GOLD FUNDSchedule of Investments – November 30, 2011 (Continued)
See notes to financial statements.
– 8 –
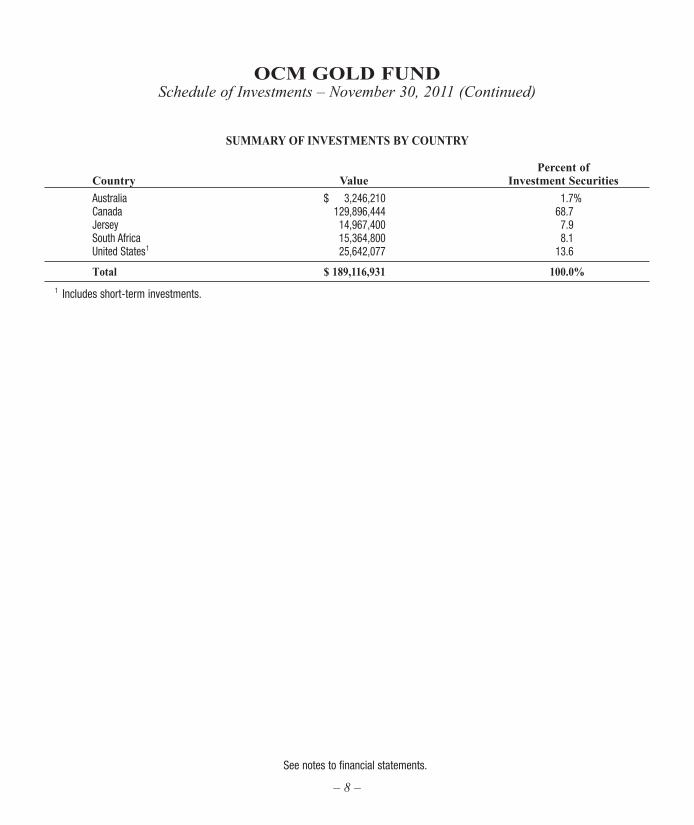
SUMMARY OF INVESTMENTS BY COUNTRY Percent of Country Value Investment Securities
Australia $ 3,246,210 1.7% Canada 129,896,444 68.7 Jersey 14,967,400 7.9 South Africa 15,364,800 8.1 United States1 25,642,077 13.6
Total $ 189,116,931 100.0%
1 Includes short-term investments.
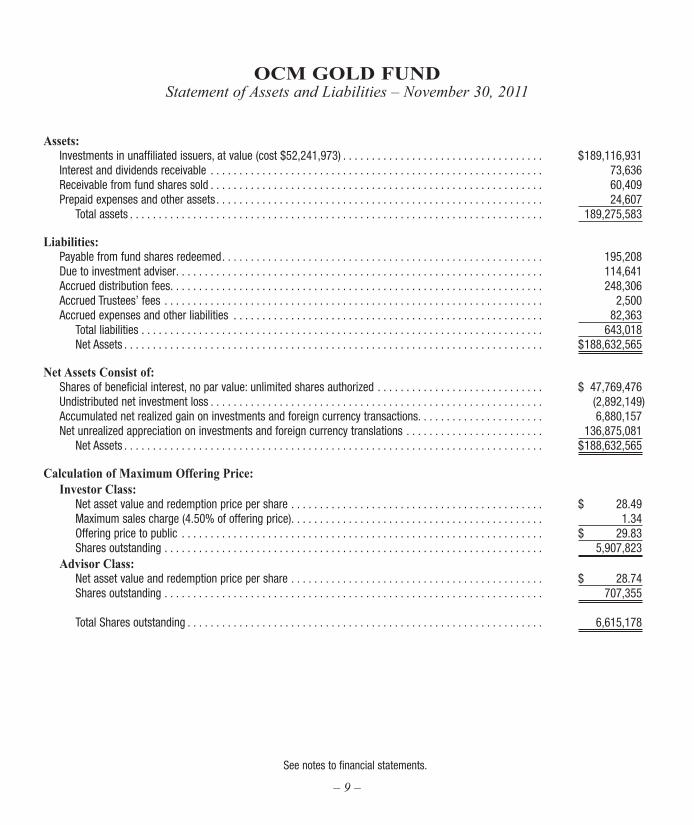
Assets: Investments in unaffiliated issuers, at value (cost $52,241,973) . . . . . . . . . . . . . . . . . . . . . . . . . . . . . . . . . . . $ 189,116,931 Interest and dividends receivable . . . . . . . . . . . . . . . . . . . . . . . . . . . . . . . . . . . . . . . . . . . . . . . . . . . . . . . . . . 73,636 Receivable from fund shares sold . . . . . . . . . . . . . . . . . . . . . . . . . . . . . . . . . . . . . . . . . . . . . . . . . . . . . . . . . . 60,409 Prepaid expenses and other assets . . . . . . . . . . . . . . . . . . . . . . . . . . . . . . . . . . . . . . . . . . . . . . . . . . . . . . . . . 24,607 Total assets . . . . . . . . . . . . . . . . . . . . . . . . . . . . . . . . . . . . . . . . . . . . . . . . . . . . . . . . . . . . . . . . . . . . . . . . 189,275,583
Liabilities: Payable from fund shares redeemed . . . . . . . . . . . . . . . . . . . . . . . . . . . . . . . . . . . . . . . . . . . . . . . . . . . . . . . . 195,208 Due to investment adviser . . . . . . . . . . . . . . . . . . . . . . . . . . . . . . . . . . . . . . . . . . . . . . . . . . . . . . . . . . . . . . . . 114,641 Accrued distribution fees . . . . . . . . . . . . . . . . . . . . . . . . . . . . . . . . . . . . . . . . . . . . . . . . . . . . . . . . . . . . . . . . . 248,306 Accrued Trustees’ fees . . . . . . . . . . . . . . . . . . . . . . . . . . . . . . . . . . . . . . . . . . . . . . . . . . . . . . . . . . . . . . . . . . 2,500 Accrued expenses and other liabilities . . . . . . . . . . . . . . . . . . . . . . . . . . . . . . . . . . . . . . . . . . . . . . . . . . . . . . 82,363 Total liabilities . . . . . . . . . . . . . . . . . . . . . . . . . . . . . . . . . . . . . . . . . . . . . . . . . . . . . . . . . . . . . . . . . . . . . . 643,018 Net Assets . . . . . . . . . . . . . . . . . . . . . . . . . . . . . . . . . . . . . . . . . . . . . . . . . . . . . . . . . . . . . . . . . . . . . . . . . $ 188,632,565
Net Assets Consist of: Shares of beneficial interest, no par value: unlimited shares authorized . . . . . . . . . . . . . . . . . . . . . . . . . . . . . $ 47,769,476 Undistributed net investment loss . . . . . . . . . . . . . . . . . . . . . . . . . . . . . . . . . . . . . . . . . . . . . . . . . . . . . . . . . . (2,892,149) Accumulated net realized gain on investments and foreign currency transactions. . . . . . . . . . . . . . . . . . . . . . 6,880,157 Net unrealized appreciation on investments and foreign currency translations . . . . . . . . . . . . . . . . . . . . . . . . 136,875,081 Net Assets . . . . . . . . . . . . . . . . . . . . . . . . . . . . . . . . . . . . . . . . . . . . . . . . . . . . . . . . . . . . . . . . . . . . . . . . . $ 188,632,565
Calculation of Maximum Offering Price: Investor Class: Net asset value and redemption price per share . . . . . . . . . . . . . . . . . . . . . . . . . . . . . . . . . . . . . . . . . . . . $ 28.49 Maximum sales charge (4.50% of offering price) . . . . . . . . . . . . . . . . . . . . . . . . . . . . . . . . . . . . . . . . . . . . 1.34 Offering price to public . . . . . . . . . . . . . . . . . . . . . . . . . . . . . . . . . . . . . . . . . . . . . . . . . . . . . . . . . . . . . . . $ 29.83 Shares outstanding . . . . . . . . . . . . . . . . . . . . . . . . . . . . . . . . . . . . . . . . . . . . . . . . . . . . . . . . . . . . . . . . . . 5,907,823 Advisor Class: Net asset value and redemption price per share . . . . . . . . . . . . . . . . . . . . . . . . . . . . . . . . . . . . . . . . . . . . $ 28.74 Shares outstanding . . . . . . . . . . . . . . . . . . . . . . . . . . . . . . . . . . . . . . . . . . . . . . . . . . . . . . . . . . . . . . . . . . 707,355 Total Shares outstanding . . . . . . . . . . . . . . . . . . . . . . . . . . . . . . . . . . . . . . . . . . . . . . . . . . . . . . . . . . . . . . 6,615,178
OCM GOLD FUNDStatement of Assets and Liabilities – November 30, 2011
See notes to financial statements.
– 9 –

Investment Income: Interest . . . . . . . . . . . . . . . . . . . . . . . . . . . . . . . . . . . . . . . . . . . . . . . . . . . . . . . . . . . . . . . . . . . . . . . . . . . . . . $ 156 Dividend (net of foreign withholding taxes of $136,857) . . . . . . . . . . . . . . . . . . . . . . . . . . . . . . . . . . . . . . . . . 1,320,602 Total investment income . . . . . . . . . . . . . . . . . . . . . . . . . . . . . . . . . . . . . . . . . . . . . . . . . . . . . . . . . . . . . . 1,320,758
Expenses: Investment advisory fees. . . . . . . . . . . . . . . . . . . . . . . . . . . . . . . . . . . . . . . . . . . . . . . . . . . . . . . . . . . . . . . . . 1,414,101 Distribution fees - Investor Class . . . . . . . . . . . . . . . . . . . . . . . . . . . . . . . . . . . . . . . . . . . . . . . . . . . . . . . . . . . 1,146,165 Distribution fees - Advisor Class . . . . . . . . . . . . . . . . . . . . . . . . . . . . . . . . . . . . . . . . . . . . . . . . . . . . . . . . . . . 49,316 Fund administration and accounting fees . . . . . . . . . . . . . . . . . . . . . . . . . . . . . . . . . . . . . . . . . . . . . . . . . . . . 262,885 Transfer agent fees and expenses . . . . . . . . . . . . . . . . . . . . . . . . . . . . . . . . . . . . . . . . . . . . . . . . . . . . . . . . . . 105,010 Professional fees . . . . . . . . . . . . . . . . . . . . . . . . . . . . . . . . . . . . . . . . . . . . . . . . . . . . . . . . . . . . . . . . . . . . . . . 63,252 Federal and state registration fees . . . . . . . . . . . . . . . . . . . . . . . . . . . . . . . . . . . . . . . . . . . . . . . . . . . . . . . . . 45,872 Custody fees . . . . . . . . . . . . . . . . . . . . . . . . . . . . . . . . . . . . . . . . . . . . . . . . . . . . . . . . . . . . . . . . . . . . . . . . . . 34,480 Chief Compliance Officer fees . . . . . . . . . . . . . . . . . . . . . . . . . . . . . . . . . . . . . . . . . . . . . . . . . . . . . . . . . . . . . 23,848 Reports to shareholders . . . . . . . . . . . . . . . . . . . . . . . . . . . . . . . . . . . . . . . . . . . . . . . . . . . . . . . . . . . . . . . . . 21,198 Trustees’ fees . . . . . . . . . . . . . . . . . . . . . . . . . . . . . . . . . . . . . . . . . . . . . . . . . . . . . . . . . . . . . . . . . . . . . . . . . 10,186 Other expenses . . . . . . . . . . . . . . . . . . . . . . . . . . . . . . . . . . . . . . . . . . . . . . . . . . . . . . . . . . . . . . . . . . . . . . . . 8,567 Total expenses . . . . . . . . . . . . . . . . . . . . . . . . . . . . . . . . . . . . . . . . . . . . . . . . . . . . . . . . . . . . . . . . . . . . . . 3,184,880 Net investment loss . . . . . . . . . . . . . . . . . . . . . . . . . . . . . . . . . . . . . . . . . . . . . . . . . . . . . . . . . . . . . . . . . . (1,864,122)
Realized and Unrealized Gain/(Loss) on Investments: Net realized gain on investments and foreign currency transactions . . . . . . . . . . . . . . . . . . . . . . . . . . . . . . . . 7,685,694 Net change in unrealized appreciation/depreciation on investments and foreign currency translations . . . . . . (2,687,603) Net gain on investments . . . . . . . . . . . . . . . . . . . . . . . . . . . . . . . . . . . . . . . . . . . . . . . . . . . . . . . . . . . . . . 4,998,091
Net increase in net assets resulting from operations . . . . . . . . . . . . . . . . . . . . . . . . . . . . . . . . . . . . . . . . . $ 3,133,969
OCM GOLD FUNDStatement of Operations – Year Ended November 30, 2011
See notes to financial statements.
– 10 –

Year ended Year ended Nov. 30, Nov. 30, 2011 2010 Operations: Net investment loss. . . . . . . . . . . . . . . . . . . . . . . . . . . . . . . . . . . . . . . . . . . . . . . . . . . . . . $ (1,864,122) $ (2,494,867) Net realized gain on investments and foreign currency transactions . . . . . . . . . . . . . . . . . 7,685,694 16,484,021 Net change in unrealized appreciation/depreciation on investments and foreign currency translations . . . . . . . . . . . . . . . . . . . . . . . . . . . . . . . . . . . . . . . . (2,687,603) 27,102,212 Net increase in net assets resulting from operations . . . . . . . . . . . . . . . . . . . . . . . . . . . . . 3,133,969 41,091,366
Distributions Paid to Shareholders: Investor Class: Distributions paid from net realized gains . . . . . . . . . . . . . . . . . . . . . . . . . . . . . . . . . . (14,401,514) (3,437,477) Total distributions from Investor Class . . . . . . . . . . . . . . . . . . . . . . . . . . . . . . . . . . . . . (14,401,514) (3,437,477) Advisor Class: Distributions paid from net realized gains . . . . . . . . . . . . . . . . . . . . . . . . . . . . . . . . . . (1,674,355) — Total distributions from Advisor Class . . . . . . . . . . . . . . . . . . . . . . . . . . . . . . . . . . . . . (1,674,355) — Total distributions . . . . . . . . . . . . . . . . . . . . . . . . . . . . . . . . . . . . . . . . . . . . . . . . . . . . (16,075,869) (3,437,477)
Fund Share Transactions: Investor Class: Net proceeds from shares sold . . . . . . . . . . . . . . . . . . . . . . . . . . . . . . . . . . . . . . . . . . 8,953,939 12,629,462 Distributions reinvested . . . . . . . . . . . . . . . . . . . . . . . . . . . . . . . . . . . . . . . . . . . . . . . . 13,629,588 3,215,985 Payment for shares redeemed 1 . . . . . . . . . . . . . . . . . . . . . . . . . . . . . . . . . . . . . . . . . . (18,367,148) (33,353,842) Net increase/(decrease) in net assets from Investor Class share transactions . . . . . . . 4,216,379 (17,508,395) Advisor Class 2: Net proceeds from shares sold . . . . . . . . . . . . . . . . . . . . . . . . . . . . . . . . . . . . . . . . . . 2,008,485 16,668,622 Distributions reinvested . . . . . . . . . . . . . . . . . . . . . . . . . . . . . . . . . . . . . . . . . . . . . . . . 1,471,590 — Payment for shares redeemed 3 . . . . . . . . . . . . . . . . . . . . . . . . . . . . . . . . . . . . . . . . . . (2,310,133) (459,104) Net increase in net assets from Advisor Class share transactions . . . . . . . . . . . . . . . . 1,169,942 16,209,518 Net increase/(decrease) in net assets from Fund share transactions . . . . . . . . . . . . . . 5,386,321 (1,298,877)
Total increase/(decrease) in net assets . . . . . . . . . . . . . . . . . . . . . . . . . . . . . . . . . . . . . . (7,555,579) 36,355,012
Net Assets, Beginning of Year . . . . . . . . . . . . . . . . . . . . . . . . . . . . . . . . . . . . . . . . . . . . . 196,188,144 159,833,132 Net Assets, End of Year . . . . . . . . . . . . . . . . . . . . . . . . . . . . . . . . . . . . . . . . . . . . . . . . . . $ 188,632,565 $ 196,188,144
OCM GOLD FUNDStatements of Changes in Net Assets
– 11 –
See notes to financial statements.
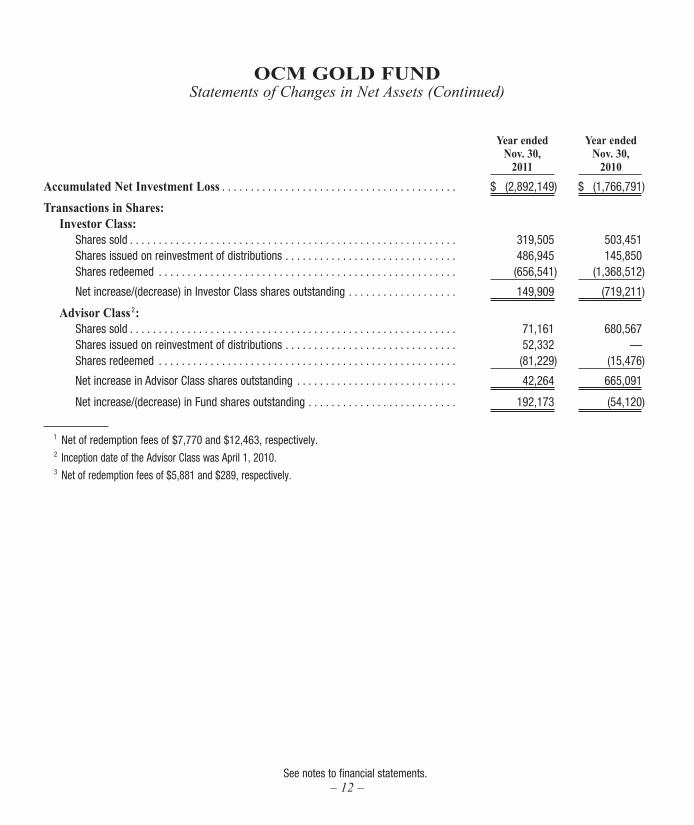
Year ended Year ended Nov. 30, Nov. 30, 2011 2010 Accumulated Net Investment Loss . . . . . . . . . . . . . . . . . . . . . . . . . . . . . . . . . . . . . . . . . $ (2,892,149) $ (1,766,791) Transactions in Shares: Investor Class: Shares sold . . . . . . . . . . . . . . . . . . . . . . . . . . . . . . . . . . . . . . . . . . . . . . . . . . . . . . . . . 319,505 503,451 Shares issued on reinvestment of distributions . . . . . . . . . . . . . . . . . . . . . . . . . . . . . . 486,945 145,850 Shares redeemed . . . . . . . . . . . . . . . . . . . . . . . . . . . . . . . . . . . . . . . . . . . . . . . . . . . . (656,541) (1,368,512) Net increase/(decrease) in Investor Class shares outstanding . . . . . . . . . . . . . . . . . . . 149,909 (719,211) Advisor Class 2: Shares sold . . . . . . . . . . . . . . . . . . . . . . . . . . . . . . . . . . . . . . . . . . . . . . . . . . . . . . . . . 71,161 680,567 Shares issued on reinvestment of distributions . . . . . . . . . . . . . . . . . . . . . . . . . . . . . . 52,332 — Shares redeemed . . . . . . . . . . . . . . . . . . . . . . . . . . . . . . . . . . . . . . . . . . . . . . . . . . . . (81,229) (15,476) Net increase in Advisor Class shares outstanding . . . . . . . . . . . . . . . . . . . . . . . . . . . . 42,264 665,091 Net increase/(decrease) in Fund shares outstanding . . . . . . . . . . . . . . . . . . . . . . . . . . 192,173 (54,120)
1 Net of redemption fees of $7,770 and $12,463, respectively.
2 Inception date of the Advisor Class was April 1, 2010.
3 Net of redemption fees of $5,881 and $289, respectively.
OCM GOLD FUNDStatements of Changes in Net Assets (Continued)
See notes to financial statements.– 12 –
– 13 –
Note 1. OrganizationOCM Mutual Fund (the “Trust”) is registered under the Investment Company Act of 1940, as amended, as an open-end management invest-
ment company. The Trust was organized as a Massachusetts business trust on January 6, 1984 and consists of the OCM Gold Fund (the “Fund”). The investment objective for the Fund is long-term growth of capital through investing primarily in equity securities of domestic and foreign companies engaged in activities related to gold and precious metals.
Note 2. Significant Accounting PoliciesThe following is a summary of significant accounting policies followed by the Fund in the preparation of its financial statements. Security Valuation – Portfolio securities that are listed on national securities exchanges are valued at the last sale price as of the close of
business of such securities exchanges, or, in the absence of recorded sales, at the average of readily available closing bid and ask prices on such exchanges. NASDAQ National Market® and SmallCap® securities are valued at the NASDAQ Official Closing Price (“NOCP”). If a NOCP is not issued for a given day, these securities are valued at the average of readily available closing bid and asked prices. Unlisted securities are valued at the average of the quoted bid and ask prices in the over-the-counter market. Short-term investments which mature in less than 60 days are valued at amortized cost (unless the Board of Trustees determines that this method does not represent fair value). Short-term investments which mature after 60 days are valued at market. Securities and other assets for which market quotations are not readily available are valued at fair value as determined in good faith by the investment adviser under procedures established by and under the general supervision and responsibil-ity of the Trust’s Board of Trustees. For each investment that is fair valued, the investment adviser considers, to the extent applicable, various factors including, but not limited to, the type of security, the financial condition of the company, comparable companies in the public market, the nature and duration of the cause for a quotation not being readily available and other relevant factors.
Under Fair Value Measurements and Disclosures, various inputs are used in determining the value of the Fund’s investments. These inputs are summarized into three broad levels as described below:
• Level1 – quotedpricesinactivemarketsforidenticalsecurities • Level2 – othersignificantobservable inputs (includingquotedprices for similar securities, interest rates,andevaluatedquotation
obtained from pricing services) • Level3 – significantunobservableinputs(includingtheFund’sownassumptionsindeterminingthefairvalueofinvestments).
OCM GOLD FUNDNotes to Financial Statements – November 30, 2011

The inputs or methodology used for valuing securities are not an indication of the risk associated with investing in those securities. The fol-lowing is a summary of the inputs used, as of November 30, 2011, in valuing the Fund’s assets:
Sector Level 1 Level 2 Level 3 Total
Common Stocks
Major Gold Producers $ 61,188,005 $ — $ — $ 61,188,005
Intermediate/Mid-Tier Gold Producers 69,631,583 — — 69,631,583
Junior Gold Producers 15,751,921 — — 15,751,921
Exploration and Development Companies 13,070,574 — — 13,070,574
Primary Silver Producers 10,056,234 — — 10,056,234
Other 7,430,516 — — 7,430,516
Exchange Traded Fund 9,357,150 — — 9,357,150
Short-Term Investment 2,522,338 — — 2,522,338
Warrants
Major Gold Producers 65,356 — — 65,356
Junior Gold Producers 18,089 — — 18,089
Exploration and Development Companies 25,165 — — 25,165
Total $ 189,116,931 $ — $ — $ 189,116,931
The Fund held one Level 2 security at November 30, 2011, which was a set of warrants fair valued by the Adviser at zero, in accordance with procedures established by and under the general supervision of the Trust’s Board of Trustees. There were no Level 3 securities as of November 30, 2011. There were no significant transfers between each of the three levels. The Fund recognizes such transfers between levels at the end of the reporting period.
Foreign Currency – Investment securities and other assets and liabilities denominated in foreign currencies are translated into U.S. dollar amounts at the date of valuation. Purchases and sales of investment securities and income and expense items denominated in foreign curren-cies are translated into U.S. dollar amounts on the respective dates of such transactions. The Fund does not isolate that portion of the results of operations resulting from changes in foreign exchange rates on investments from the fluctuations arising from changes in market prices of securities held. Such fluctuations for the year ended November 30, 2011 are included within the realized and unrealized gain/loss on investments section of the Statement of Operations.
Reported net realized foreign exchange gains or losses arise from sales of foreign currencies, currency gains or losses realized between the trade and settlement dates on securities transactions, and the difference between the amounts of dividends, interest and foreign withholding taxes recorded on the Fund’s books and the U.S. dollar equivalent of the amounts actually received or paid. Net unrealized foreign exchange gains and losses arise from changes in the fair value of assets and liabilities, other than investments in securities at fiscal period end, resulting from changes in exchange rates. Such fluctuations for the year ended November 30, 2011 are included within the realized and unrealized gain/loss on investments section of the Statement of Operations.
Federal Income Taxes – The Fund intends to comply with the requirements of the Internal Revenue Code necessary to qualify as a regulated investment company and to make the requisite distributions of income to its shareholders which will be sufficient to relieve it from all or sub-stantially all federal income taxes.
OCM GOLD FUNDNotes to Financial Statements – November 30, 2011 (Continued)
– 14 –

The Accounting for Uncertainty in Income Taxes (“Income Tax Statement”) requires an evaluation of tax positions taken (or expected to be taken) in the course of preparing a Fund’s tax returns to determine whether these positions meet a “more-likely-than-not” standard that, based on the technical merits, have a more than fifty percent likelihood of being sustained by a taxing authority upon examination. A tax position that meets the “more-likely-than-not” recognition threshold is measured to determine the amount of benefit to recognize in the financial statements. The Fund recognizes interest and penalties, if any, related to unrecognized tax benefits as income tax expense in the Statements of Operations.
The Income Tax Statement requires management of the Fund to analyze all open tax years, fiscal years 2008-2011 as defined by IRS stat-ute of limitations for all major jurisdictions, including federal tax authorities and certain state tax authorities. As of and during the year ended November 30, 2011, the Fund did not have a liability for any unrecognized tax benefits. The Fund has no examination in progress and is not aware of any tax positions for which it is reasonably possible that the total amounts of unrecognized tax benefits will significantly change in the next twelve months.
Share Classes – The Fund offers two classes of shares, Investor Class and Advisor Class. The outstanding shares of the Fund on April 1, 2010 were renamed “Investor Class shares.” The Advisor Class shares commenced operations on April 1, 2010. The two classes represent interests in the same portfolio of investments and have the same rights. Investor Class shares are subject to an annual 12b-1 fee of up to 0.99% of the Fund’s average daily net assets allocable to Investor Class shares, whereas Advisor Class shares are subject to an annual 12b-1 fee of up to 0.25% of the Fund’s average daily net assets allocable to Advisor Class shares. Income, expenses (other than expenses attributable to a specific class) and realized and unrealized gains and losses on investments are allocated to each class of shares in proportion to their relative shares outstanding.
Securities Transactions and Investment Income – Securities transactions are accounted for on a trade date basis. Realized gains and losses on sales of securities are calculated on the identified cost basis. Dividend income is recorded on the ex-dividend date and interest income is recorded on an accrual basis.
Distributions to Shareholders – The character of distributions made during the year from net investment income or net realized gains may differ from the characterization for federal income tax purposes due to differences in the recognition of income, expense or gain items for finan-cial statement and tax purposes. To the extent that these differences are attributable to permanent book and tax accounting differences, the components of net assets have been adjusted.
Redemption Fee – A 1.50% redemption fee is retained by the Fund to offset transaction costs and other expenses associated with short-term investing. The fee is imposed on redemptions or exchanges of shares held less than three months from their purchase date. The Fund records the fee as a reduction of shares redeemed and as a credit to paid-in-capital. For the year ended November 30, 2011, the Investor Class and the Advisor Class received $7,770 and $5,881 in redemption fees, respectively.
Guarantees and Indemnifications – In the normal course of business, the Fund enters into contracts with service providers that contain general indemnification clauses. The Fund’s maximum exposure under these arrangements is unknown as this would involve future claims against the Fund that have not yet occurred. Based on experience, the Fund expects the risk of loss to be remote.
Use of Estimates – The preparation of financial statements in conformity with accounting principles generally accepted in the United States of America requires management to make estimates and assumptions that affect the reported amounts of assets and liabilities and disclosure of contingent assets and liabilities at the date of the financial statements and the reported amounts of increases and decreases in net assets from operations during the reporting period. Actual results could differ from those estimates.
Derivative Instruments – Equity securities in the gold mining industry, particularly the smaller companies, may occasionally issue warrants as part of their capital structure. A warrant gives the holder the right to purchase the underlying equity at the exercise price until the expiration date of the warrant. The Fund may hold such warrants for exposure to smaller companies in the portfolio or other reasons associated with the Fund’s overall objective of long-term growth, though warrants will typically not be a significant part of the Fund’s portfolio. The Fund’s maximum risk in holding warrants is the loss of the entire amount paid for the warrants. The Fund acquired two warrants during the year ended November 30, 2011, one of which was received as part of a purchase of the same company’s common stock and the other was received as part of a corporate action. In addition, the expiration date of one warrant was extended during the fiscal year ended November 30, 2011. At November 30, 2011, the Fund held warrants as listed on the Schedule of Investments.
Subsequent Events – Management has evaluated subsequent events and determined there were no subsequent events that require recogni-tion or disclosure in the financial statements.
OCM GOLD FUNDNotes to Financial Statements – November 30, 2011 (Continued)
– 15 –

Note 3. Investment Advisory AgreementThe Fund has an investment advisory agreement with Orrell Capital Management, Inc. (“OCM”). Under the agreement, the Fund pays OCM a
fee computed daily and payable monthly, at the following annual rates based upon average daily net assets:Assets Fee Rate$0 to $50 million . . . . . . . . . . . . . . . . . . . . . . . . . . . . . . . . . . . . . . . . . . . . . . . . . . . . . 1.000%$50 million to $75 million. . . . . . . . . . . . . . . . . . . . . . . . . . . . . . . . . . . . . . . . . . . . . . . 0.875%$75 million to $100 million. . . . . . . . . . . . . . . . . . . . . . . . . . . . . . . . . . . . . . . . . . . . . . 0.750%$100 million to $150 million. . . . . . . . . . . . . . . . . . . . . . . . . . . . . . . . . . . . . . . . . . . . . 0.625%$150 million to $200 million. . . . . . . . . . . . . . . . . . . . . . . . . . . . . . . . . . . . . . . . . . . . . 0.500%Over $200 million . . . . . . . . . . . . . . . . . . . . . . . . . . . . . . . . . . . . . . . . . . . . . . . . . . . . . 0.375%
Note 4. Distribution Agreement and PlanThe Trust has adopted a Distribution Plan (the “Plan”) pursuant to Rule 12b-1 under the Investment Company Act of 1940, as amended. The
Plan authorizes the Fund to reimburse the distributor for marketing expenses incurred in distributing shares of the Fund, including the cost of printing sales material and making payments to dealers of the Fund’s Investor Class and Advisor Class, in any fiscal year, subject to limits of 0.99% and 0.25%, respectively, of the average daily net assets of each respective class. For the year ended November 30, 2011, the Investor Class and the Advisor Class accrued $1,146,165 and $49,316, respectively, in expenses under the Plan.
Note 5. Purchases and Sales of SecuritiesPurchases and sales of investment securities (excluding short-term securities and U.S. government obligations) for the year ended November 30,
2011 were $9,017,435 and $23,368,320, respectively. There were no purchases or sales of U.S. government obligations.
Note 6. Federal Income Tax InformationAt November 30, 2011, gross unrealized appreciation and depreciation of investments and foreign currency owned by the Fund, based on
cost for federal income tax purposes were as follows:Cost of investments . . . . . . . . . . . . . . . . . . . . . . $ 55,361,561 Unrealized appreciation . . . . . . . . . . . . . . . . . . . $ 137,131,171Unrealized depreciation . . . . . . . . . . . . . . . . . . . (3,375,801)Unrealized appreciation on foreign currency . . . 123 Net unrealized appreciation on investments . . . $ 133,755,493
The difference between cost amounts for financial statement and federal income tax purposes is due primarily to investments in passive foreign investment companies (“PFICs”).
The tax character of distributions paid during the fiscal years ended November 30, 2011 and 2010 was as follows: 2011 2010
Ordinary income . . . . . . . . . . . . . . . . . . . . . . . . . $ — $ —Net long-term capital gains . . . . . . . . . . . . . . . . . 16,075,869 3,437,477 Total distributions . . . . . . . . . . . . . . . . . . . . . . . . $ 16,075,869 $ 3,437,477
OCM GOLD FUNDNotes to Financial Statements – November 30, 2011 (Continued)
– 16 –
– 17 –
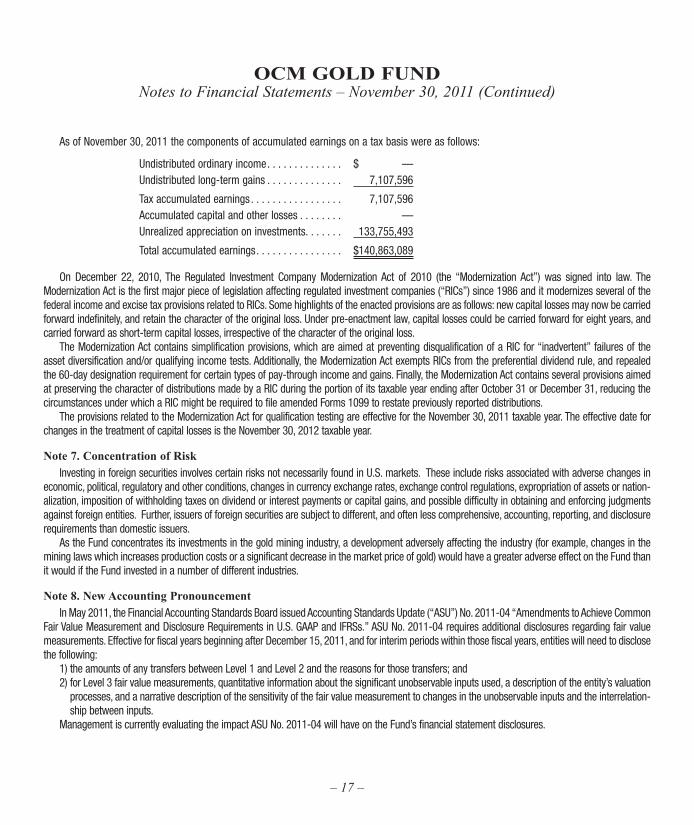
As of November 30, 2011 the components of accumulated earnings on a tax basis were as follows:
Undistributed ordinary income . . . . . . . . . . . . . . $ —Undistributed long-term gains . . . . . . . . . . . . . . 7,107,596 Tax accumulated earnings . . . . . . . . . . . . . . . . . 7,107,596Accumulated capital and other losses . . . . . . . . —Unrealized appreciation on investments. . . . . . . 133,755,493 Total accumulated earnings . . . . . . . . . . . . . . . . $ 140,863,089
On December 22, 2010, The Regulated Investment Company Modernization Act of 2010 (the “Modernization Act”) was signed into law. The Modernization Act is the first major piece of legislation affecting regulated investment companies (“RICs”) since 1986 and it modernizes several of the federal income and excise tax provisions related to RICs. Some highlights of the enacted provisions are as follows: new capital losses may now be carried forward indefinitely, and retain the character of the original loss. Under pre-enactment law, capital losses could be carried forward for eight years, and carried forward as short-term capital losses, irrespective of the character of the original loss.
The Modernization Act contains simplification provisions, which are aimed at preventing disqualification of a RIC for “inadvertent” failures of the asset diversification and/or qualifying income tests. Additionally, the Modernization Act exempts RICs from the preferential dividend rule, and repealed the 60-day designation requirement for certain types of pay-through income and gains. Finally, the Modernization Act contains several provisions aimed at preserving the character of distributions made by a RIC during the portion of its taxable year ending after October 31 or December 31, reducing the circumstances under which a RIC might be required to file amended Forms 1099 to restate previously reported distributions.
The provisions related to the Modernization Act for qualification testing are effective for the November 30, 2011 taxable year. The effective date for changes in the treatment of capital losses is the November 30, 2012 taxable year.
Note 7. Concentration of RiskInvesting in foreign securities involves certain risks not necessarily found in U.S. markets. These include risks associated with adverse changes in
economic, political, regulatory and other conditions, changes in currency exchange rates, exchange control regulations, expropriation of assets or nation-alization, imposition of withholding taxes on dividend or interest payments or capital gains, and possible difficulty in obtaining and enforcing judgments against foreign entities. Further, issuers of foreign securities are subject to different, and often less comprehensive, accounting, reporting, and disclosure requirements than domestic issuers.
As the Fund concentrates its investments in the gold mining industry, a development adversely affecting the industry (for example, changes in the mining laws which increases production costs or a significant decrease in the market price of gold) would have a greater adverse effect on the Fund than it would if the Fund invested in a number of different industries.
Note 8. New Accounting PronouncementIn May 2011, the Financial Accounting Standards Board issued Accounting Standards Update (“ASU”) No. 2011-04 “Amendments to Achieve Common
Fair Value Measurement and Disclosure Requirements in U.S. GAAP and IFRSs.” ASU No. 2011-04 requires additional disclosures regarding fair value measurements. Effective for fiscal years beginning after December 15, 2011, and for interim periods within those fiscal years, entities will need to disclose the following:
1) the amounts of any transfers between Level 1 and Level 2 and the reasons for those transfers; and2) for Level 3 fair value measurements, quantitative information about the significant unobservable inputs used, a description of the entity’s valuation
processes, and a narrative description of the sensitivity of the fair value measurement to changes in the unobservable inputs and the interrelation-ship between inputs.
Management is currently evaluating the impact ASU No. 2011-04 will have on the Fund’s financial statement disclosures.
OCM GOLD FUNDNotes to Financial Statements – November 30, 2011 (Continued)

OCM GOLD FUNDFinancial Highlights Investor Class
See notes to financial statements.
– 18 –
Year Ended Year Ended Year Ended Year Ended Year Ended Nov. 30, Nov. 30, Nov. 30, Nov. 30, Nov. 30, 2011 2010 2009 2008 2007Per Share Operating Performance(For a share outstanding throughout each year)
Net asset value, beginning of year . . . . . . . . . . . . . . . . . . . $ 30.53 $ 24.68 $ 12.35 $ 21.49 $ 20.44
Income From Investment Operations:Net investment loss . . . . . . . . . . . . . . . . . . . . . . . . . . . . . . (0.29) (0.43) (0.29) (0.31) (0.27)Net realized and unrealized gain/(loss) on investments and foreign currency transactions . . . . . . . . . . . . . . . . 0.76 6.81 12.65 (7.41) 3.06 Total from investment operations. . . . . . . . . . . . . . . . . . . . 0.47 6.38 12.36 (7.72) 2.79
Less Distributions:Dividends from net investment income . . . . . . . . . . . . . . . — — — — —Distribution from net realized gains . . . . . . . . . . . . . . . . . . (2.51) (0.53) (0.03) (1.42) (1.74) Total distributions . . . . . . . . . . . . . . . . . . . . . . . . . . . . . . . (2.51) (0.53) (0.03) (1.42) (1.74) Net asset value, end of year . . . . . . . . . . . . . . . . . . . . . . . $ 28.49 $ 30.53 $ 24.68 $ 12.35 $ 21.49
Total Return*. . . . . . . . . . . . . . . . . . . . . . . . . . . . . . . . . . 1.70% 26.70% 100.14% (38.55)% 15.64%
Ratios/Supplemental Data:Net assets, end of year (in 000’s) . . . . . . . . . . . . . . . . . . . $ 168,305 $ 175,802 $ 159,833 $ 78,652 $ 136,241Ratio of expenses to average net assets . . . . . . . . . . . . . . 1.73% 1.93% 1.94% 1.99% 1.93%Ratio of net investment loss to average net assets . . . . . . (1.03)% (1.57)% (1.59)% (1.58)% (1.51)%Portfolio turnover rate . . . . . . . . . . . . . . . . . . . . . . . . . . . . 5% 12% 6% 5% 11%
* Assumes no sales charge.

See notes to financial statements.– 19 –
OCM GOLD FUNDFinancial Highlights Advisor Class
For the Period Year Ended April 1, 2010# – Nov. 30, November 30, 2011 2010Per Share Operating Performance(For a share outstanding throughout each period) Net asset value, beginning of period . . . . . . . . . . . . . . . . . . . . . . . . . . . . $ 30.65 $ 22.24
Income From Investment Operations:Net investment loss . . . . . . . . . . . . . . . . . . . . . . . . . . . . . . . . . . . . . . . . . (0.18) (0.13)Net realized and unrealized gain/(loss) on investments and foreign currency transactions. . . . . . . . . . . . . . . . . . . . . . . . . . . . . . . . . . . . . 0.78 8.54 Total from investment operations . . . . . . . . . . . . . . . . . . . . . . . . . . . . . . 0.60 8.41
Less Distributions:Dividends from net investment income . . . . . . . . . . . . . . . . . . . . . . . . . . — —Distribution from net realized gains . . . . . . . . . . . . . . . . . . . . . . . . . . . . . (2.51) — Total distributions . . . . . . . . . . . . . . . . . . . . . . . . . . . . . . . . . . . . . . . . . . (2.51) — Net asset value, end of period . . . . . . . . . . . . . . . . . . . . . . . . . . . . . . . . . $ 28.74 $ 30.65 Total Return . . . . . . . . . . . . . . . . . . . . . . . . . . . . . . . . . . . . . . . . . . . . 2.15% 37.81%1
Ratios/Supplemental Data:Net assets, end of period (in 000’s) . . . . . . . . . . . . . . . . . . . . . . . . . . . . . $ 20,328 $ 20,386Ratio of expenses to average net assets . . . . . . . . . . . . . . . . . . . . . . . . . 1.30% 1.34%2
Ratio of net investment loss to average net assets . . . . . . . . . . . . . . . . . (0.60)% (0.98)%2
Portfolio turnover rate . . . . . . . . . . . . . . . . . . . . . . . . . . . . . . . . . . . . . . . 5% 12%1
# Inception date of Advisor Class.
1 Not annualized for periods less than one year.
2 Annualized for periods less than one year.

REPORT OF INDEPENDENT REGISTERED PUBLIC ACCOUNTING FIRM
To the Shareholders and Board of Trustees of OCM Gold Fund:
We have audited the accompanying statement of assets and liabilities, including the schedule of investments, of OCM Gold Fund (the “Fund”), as of November 30, 2011, and the related statement of operations for the year then ended, the statements of changes in net assets for each of the two years in the period then ended, and the financial highlights for each of the five years in the period then ended. These financial statements and financial highlights are the responsibility of the Fund’s management. Our responsibility is to express an opinion on these financial statements and financial highlights based on our audits.
We conducted our audits in accordance with the standards of the Public Company Accounting Oversight Board (United States). Those standards require that we plan and perform the audit to obtain reasonable assurance about whether the financial statements and financial highlights are free of material misstatement. The Fund is not required to have, nor were we engaged to perform, an audit of its internal control over financial reporting. Our audits included consideration of internal control over financial reporting as a basis for designing audit procedures that are appropriate in the circumstances, but not for the purpose of expressing an opinion on the effectiveness of the Fund’s internal control over financial reporting. Accordingly, we express no such opinion. An audit also includes examining, on a test basis, evidence supporting the amounts and disclosures in the financial statements, assessing the accounting principles used and significant estimates made by management, as well as evaluating the overall financial statement presentation. Our procedures included confirmation of securities owned as of November 30, 2011, by correspondence with the custodian. We believe that our audits provide a reasonable basis for our opinion.
In our opinion, the financial statements and financial highlights referred to above present fairly, in all material respects, the financial position of the Fund as of November 30, 2011, the results of its operations for the year then ended, the changes in its net assets for each of the two years in the period then ended, and the financial highlights for each of the five years in the period then ended, in conformity with accounting principles generally accepted in the United States of America.
Milwaukee, WisconsinJanuary 26, 2012
– 20 –
– 21 –
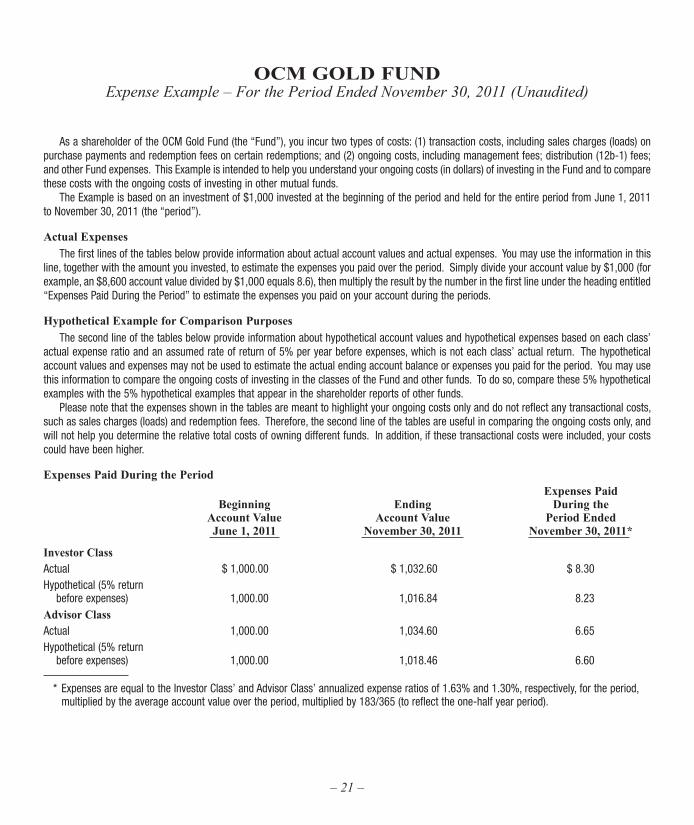
As a shareholder of the OCM Gold Fund (the “Fund”), you incur two types of costs: (1) transaction costs, including sales charges (loads) on purchase payments and redemption fees on certain redemptions; and (2) ongoing costs, including management fees; distribution (12b-1) fees; and other Fund expenses. This Example is intended to help you understand your ongoing costs (in dollars) of investing in the Fund and to compare these costs with the ongoing costs of investing in other mutual funds.
The Example is based on an investment of $1,000 invested at the beginning of the period and held for the entire period from June 1, 2011 to November 30, 2011 (the “period”).
Actual ExpensesThe first lines of the tables below provide information about actual account values and actual expenses. You may use the information in this
line, together with the amount you invested, to estimate the expenses you paid over the period. Simply divide your account value by $1,000 (for example, an $8,600 account value divided by $1,000 equals 8.6), then multiply the result by the number in the first line under the heading entitled “Expenses Paid During the Period” to estimate the expenses you paid on your account during the periods.
Hypothetical Example for Comparison PurposesThe second line of the tables below provide information about hypothetical account values and hypothetical expenses based on each class’
actual expense ratio and an assumed rate of return of 5% per year before expenses, which is not each class’ actual return. The hypothetical account values and expenses may not be used to estimate the actual ending account balance or expenses you paid for the period. You may use this information to compare the ongoing costs of investing in the classes of the Fund and other funds. To do so, compare these 5% hypothetical examples with the 5% hypothetical examples that appear in the shareholder reports of other funds.
Please note that the expenses shown in the tables are meant to highlight your ongoing costs only and do not reflect any transactional costs, such as sales charges (loads) and redemption fees. Therefore, the second line of the tables are useful in comparing the ongoing costs only, and will not help you determine the relative total costs of owning different funds. In addition, if these transactional costs were included, your costs could have been higher.
Expenses Paid During the Period Expenses Paid Beginning Ending During the Account Value Account Value Period Ended June 1, 2011 November 30, 2011 November 30, 2011*
Investor ClassActual $ 1,000.00 $ 1,032.60 $ 8.30Hypothetical (5% return before expenses) 1,000.00 1,016.84 8.23Advisor ClassActual 1,000.00 1,034.60 6.65Hypothetical (5% return before expenses) 1,000.00 1,018.46 6.60
* Expenses are equal to the Investor Class’ and Advisor Class’ annualized expense ratios of 1.63% and 1.30%, respectively, for the period, multiplied by the average account value over the period, multiplied by 183/365 (to reflect the one-half year period).
OCM GOLD FUNDExpense Example – For the Period Ended November 30, 2011 (Unaudited)

– 22 –
OCM GOLD FUNDInvestments by Sector – November 30, 2011 (Unaudited)
As a Percentage of Net Assets
A description of the Fund’s proxy voting policies and procedures and a record of the Fund’s proxy votes for the year ended June 30, 2011 are available without charge, upon request by calling toll free 1-800-779-4681 and on the Securities and Exchange Commission’s (SEC) website at http://www.sec.gov.
The Fund will file its complete schedule of investments with the SEC for the first and third quarters of each fiscal year on Form N-Q. The Fund’s Forms N-Q will be available on the EDGAR database on the SEC’s website at http://www.sec.gov. These Forms may also be reviewed and copied at the SEC’s Public Reference Room in Washington, D.C. Information about the operation of the Public Reference Room may be obtained by calling 1-800-SEC-0330.
Major GoldProducers
32.5%
Junior GoldProducers
8.4%
Exploration andDevelopmentCompanies
6.9%
Other4.0%
ExchangeTraded Fund
5.0%Primary Silver
Producers5.3%
Cash and OtherAssets1.0%
Intermediate/Mid-TierGold Producers
36.9%

Average Annual Total Returns
Investor Class
S&P 500® Index
Philadelphia Gold &
Silver Index
1 year -2.88% 7.83% -0.79%
5 year 11.85% -0.18% 7.97%
10 year 23.12% 2.91% 16.13%
The graph below compares the change in value of a $10,000 investment in the Investor Class of the OCM Gold Fund with the S&P 500® Index and the Philadelphia Gold and Silver Index since November 30, 2001.
$0
$10,000
$20,000
$30,000
$40,000
$50,000
$60,000
$70,000
$80,000
$90,000
11/30/01 11/30/02 11/30/03 11/30/04 11/30/05 11/30/06 11/30/07 11/30/08 11/30/09 11/30/10 11/30/11
Investor Class $ 80,015 S&P 500® Index $ 13,316 Philadelphia Gold & Silver Index $ 44,592
The returns shown include the reinvestment of all dividends and the maximum sales load charge, but do not reflect the deduction of taxes that a shareholder would pay on fund distributions or the redemption of fund shares. Past performance is not indicative of future results.
The Philadelphia Gold and Silver Index (XAU) is an unmanaged capitilization-weighted index composed of 16 companies listed on U.S. exchanges involved in the gold and silver mining industry. The index is generally considered as representative of the gold and silver share market.
The S&P 500® Index is a broad unmanaged index generally considered as representative of the U.S. equity market.
OCM GOLD FUND – INVESTOR CLASSPerformance Results – Year Ended November 30, 2011 (Unaudited)
(All performance measurements reflect the maximum sales load charges where applicable for each period shown.)
– 23 –

Advisor Class
S&P 500® Index
Philadelphia Gold &
Silver Index
1 year 2.15% 7.83% -0.79%
Since Inception on 4/1/10
22.75%
6.09%
16.31%
The graph below compares the change in value of a $10,000 investment in the Advisor Class of the OCM Gold Fund with the S&P 500® Index and the Philadelphia Gold and Silver Index since April 1, 2010 (inception date of Advisor Class).
$10,000
$12,500
$15,000
4/1/10 11/30/1111/30/10
Advisor Class $ 14,078 S&P 500® Index $ 11,036 Philadelphia Gold & Silver Index $ 12,867
The returns shown include the reinvestment of all dividends and the maximum sales load charge, but do not reflect the deduction of taxes that a shareholder would pay on fund distributions or the redemption of fund shares. Past performance is not indicative of future results.
The Philadelphia Gold and Silver Index (XAU) is an unmanaged capitilization-weighted index composed of 16 companies listed on U.S. exchanges involved in the gold and silver mining industry. The index is generally considered as representative of the gold and silver share market.
The S&P 500® Index is a broad unmanaged index generally considered as representative of the U.S. equity market.
OCM GOLD FUND – ADVISOR CLASSPerformance Results – Year Ended November 30, 2011 (Unaudited)
– 24 –
On October 13, 2011, the Board of Trustees of OCM Mutual Fund approved the continuation of the Fund’s investment advisory agreement with Orrell Capital Management, Inc. (the “Adviser”). Prior to approving the continuation of the agreement, the Board considered:
• thenature,extentandqualityoftheservicesprovidedbytheAdviser• theinvestmentperformanceoftheFund• thecostsoftheservicestobeprovidedandprofitstoberealizedbytheAdviserfromitsrelationshipwiththeFund• theextenttowhicheconomiesofscalewouldberealizedastheFundgrowsandwhetherfeelevelsreflectthoseeconomiesofscale• theexpenseratiooftheFund
In considering the nature, extent and quality of the services provided by the Adviser, the Board considered an oral presentation by the Adviser describing the portfolio management, shareholder communication, and regulatory compliance services provided by the Adviser to the Fund. The Trustees concluded that the Adviser was providing essential services to the Fund.
The Trustees compared the performance of the Fund to benchmark indices over various periods of time and concluded that the performance of the Fund warranted the continuation of the Investment Advisory Agreement. The Trustees noted that the Fund adhered to its investment style.
In concluding that the advisory fees payable by the Fund were reasonable, the Trustees reviewed the profits realized by the Adviser, from its relationship with the Fund and concluded that such profits were reasonable and not excessive. As part of its analysis, the Board considered the value the research the Adviser received from broker-dealers executing securities transactions for the Fund. The Trustees also reviewed reports comparing the expense ratios of each class and advisory fees paid by the Fund to those paid by other comparable mutual funds in the same category and concluded that the advisory fees paid by the Fund and the expense ratios of each class of the Fund were in the range of comparable mutual funds.
The Trustees also considered whether the Investment Advisory Agreement fee schedule should be adjusted for an increase in assets under management. They concluded that the “breakpoints” embodied in the Investment Advisory Agreement were appropriate.
Long Term Capital Gains Designation (Unaudited)
Pursuant to IRC 852(b)(3) of the Internal Revenue Code OCM Gold Fund hereby designates $16,075,869 as long-term capital gains distributed during the year ended November 30, 2011.
OCM GOLD FUNDAnnual Renewal of Investment Advisory Agreement (Unaudited)
– 25 –

OCM GOLD FUNDTrustee and Officer Information (Unaudited)
Independent Trustees*
Other Directorships Held by Term of Office Trustee or Position(s) and Length of Principal Occupation(s) Nominee for Name, Address and Age Held with Fund Service During Past 5 Years Trustee
John L. Crary 1536 Holmes Street, Livermore, California 94550Age 58
Trustee(Chairman of the Board)
IndefiniteSince 2004
Since 1999 Mr. Crary has been the managing member of Crary Enterprises, LLC, a private investment com-pany. Since 1988 Mr. Crary has been an independent corporate financial advisor and private investor in vari-ous biotechnology, software and other early stage busi-ness ventures. Mr. Crary began his business career as an investment banker with E.F. Hutton & Company Inc.
Scheid Vineyards,
Inc.
Doug Webenbauer 1536 Holmes Street,Livermore, California 94550 Age 51
Trustee
IndefiniteSince 2005
Chief Financial Officer of M.E. Fox & Company, Inc., a beer distributor, since 1999.
None
Interested Trustees and Officers**
Other Directorships Held by Term of Office Trustee or Position(s) and Length of Principal Occupation(s) Nominee for Name, Address and Age Held with Fund Service During Past 5 Years Trustee
Gregory M. Orrell 1536 Holmes Street, Livermore, California 94550Age 50
Trustee, President
IndefiniteSince 2004
President of Orrell Capital Management, Inc. since 1991.
None
Jacklyn A. Orrell*** 1536 Holmes Street, Livermore, California 94550Age 77
Secretary andTreasurer
One year termSince 2004
Secretary of Orrell Capital Management, Inc. since 1999.
N/A
N. Lynn Bowley 1536 Holmes Street,Livermore, California 94550Age 53
Chief Compliance
Officer
At discretion of the Board
Since October 2008
Compliance Officer of Northern Lights Compliance Services, LLC (01/07 – present); Vice President of Investment Support Services for Mutual of Omaha Companies (2002 – 2006).
N/A
* “Independent” trustees are trustees who are not deemed to be “interested persons” of the Fund as defined in the Investment Company Act of 1940.
** An “interested” trustee is a trustee who is deemed to be an “interested person” of the Fund, as defined in the Investment Company Act of 1940. Gregory M. Orrell is an interested person of the Fund because of his ownership in the Fund’s investment adviser.
*** Ms. Orrell is the mother of Gregory M. Orrell, the President and a trustee of the Trust.
– 26 –

This page intentionally left blank.

This page intentionally left blank.


OCM Gold FundDistributed by:
Northern Lights Distributors, LLC4020 South 147th Street
Omaha, NE 681370180-NLD-1/27/2012