annual report november 30, 2015 - ocm gold fund –...
TRANSCRIPT

Annual ReportNovember 30, 2015


– 1 –
OCM GOLD FUNDShareholder Letter – November 30, 2015
(Unaudited)
Dear Fellow Shareholders:
The uncertainty leading up to the Federal Reserve’s stated goal to lift interest rates in 2015 kept Western investment capital flows on the sidelines in gold bullion and shares of gold mining companies over the past year. For the fiscal year ending November 30, 2015, the OCM Gold Fund Investor Class declined 22.76% (-26.26% after maximum sales load) while the Advisor Class declined 22.28% for the period. In comparison, the Philadelphia Gold and Silver Share Index (XAU) posted a negative return of 31.78% over the same period, whereas the S&P 500 Index returned a gain of 2.75%. Gold bullion priced in U.S. dollars closed November 30, 2015 at $1,070.50 per ounce, based on the London PM fix, down 11.16% during the twelve-month fiscal period. The Fund’s investment strategy of focusing on management teams able to execute operational plans and exhibiting a track record of disciplined returns on capital allowed it to outperform the XAU Index over the past fiscal year.
Market Commentary
The gold market has suffered through four grueling down years since 2011 as gold assets lie in wait for gold’s monetary attributes to once again be appreciated as the risks from the fallout of relatively extreme monetary policies enacted by central banks over the past seven years become apparent to the wider market. Share prices of gold mining companies have collapsed 80% from their 2010 highs as represented by the XAU Index. As to be expected, sentiment toward the gold mining sector is plumbing record lows only a contrarian investor could appreciate.
Putting the challenges of the past couple of years aside, in our opinion, we believe the investment case for owning gold and gold assets as part of an investment portfolio remains compelling when considering the following:
• The elixir of central bank printing press money (Quantitative Easing or QE) appears to have run its course with diminishing returns as global economic weakness spreads from China and emerging markets under the weight of misallocated capital and high debt levels. With U.S. manufacturing numbers plummeting and inventories rising, the prospect of the U.S. economy being an island of economic growth in a stagnant global economy is increasingly looking like a misguided concept.
• As the U.S. economy shows signs of slipping into a recession, the likelihood of further Federal Reserve interest rate increases diminishes and in fact raises the anticipation the Fed will attempt to spur growth through another round of QE. In such a scenario, confidence in the Federal Reserve policy may be severely shaken, in our opinion.
• Decelerating earnings and leveraged balance sheets are weighing on global equity markets pushing capital away from equity markets into a more defensive posture increasing the likelihood gold will attract flight to quality flows.

– 2 –
OCM GOLD FUNDShareholder Letter – November 30, 2015 (Continued)
(Unaudited)
• China and India’s combined gold demand surpassed global newly mined gold production in 2015.
• Chinese yuan devaluation and weakness in Chinese equity markets, in our opinion, are positive developments for increased physical gold demand by Chinese investors seeking a safe haven asset amid financial uncertainty.
• Global gold production is expected to decline due to a combination of factors, most notably depletion of larger deposits, lack of exploration success in politically stable environments, new economic deposits with satisfactory returns are smaller in size, the market demanding higher return on investment hurdle rates for risk trade-off versus bullion exchange traded funds, creeping nationalization of deposits through taxation, and inelastic supply response due to long lead times of over seven years to bring high quality projects from discovery to production.
• Strong Asian physical gold demand along with central bank repatriation has drained one third of the gold bullion held in London vaults over the past four years from 9,000 tons to 6,000 tons. If Asian gold demand remains at current levels, London vaults theoretically will be completely empty within eight years. This is an unlikely scenario, in our opinion, but we do expect Asian demand to continue, resulting in higher gold prices.
• Elevated geopolitical risks in the Middle East along with renewed Cold War attitudes between Russia and the West is leading to increased geopolitically motivated buying of gold.
• Monthly purchases of gold by Russian and Chinese central banks continues the trend of central banks diversifying away from U.S. dollars in order to diversify risk. Chinese and Russian central bank purchases totaled over 243 tons over the past six months.
• U.S. dollar hegemony is under threat as an increasing number of countries move to settle trade in currencies other than the U.S. dollar.
• Global competitive currency devaluation shows no signs of ending as countries move to protect export markets and spur economic growth through currency devaluation.
• Chinese yuan devaluation is exporting deflationary forces to a highly leveraged global economy where global debt levels have increased 40% since 2008.
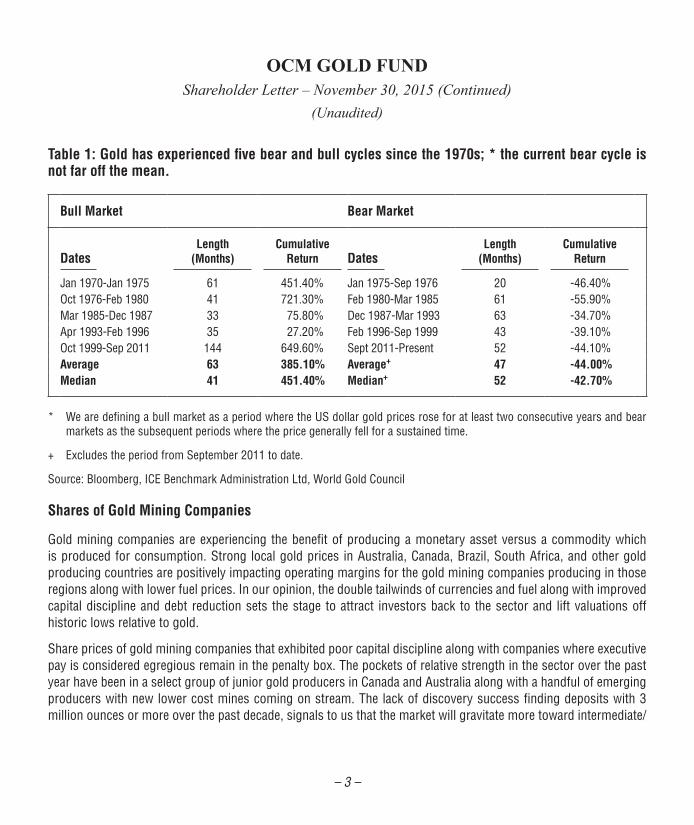
• As shown in Table 1 below, gold price correction from the 2011 highs is now at the median length of a correction when compared to past price declines according to the World Gold Council.
– 3 –
OCM GOLD FUNDShareholder Letter – November 30, 2015 (Continued)
(Unaudited)
Table 1: Gold has experienced five bear and bull cycles since the 1970s; * the current bear cycle is not far off the mean.
Bull Market Bear Market
DatesLength
(Months)Cumulative
Return DatesLength
(Months)Cumulative
Return
Jan 1970-Jan 1975 61 451.40% Jan 1975-Sep 1976 20 -46.40%Oct 1976-Feb 1980 41 721.30% Feb 1980-Mar 1985 61 -55.90%Mar 1985-Dec 1987 33 75.80% Dec 1987-Mar 1993 63 -34.70%Apr 1993-Feb 1996 35 27.20% Feb 1996-Sep 1999 43 -39.10%Oct 1999-Sep 2011 144 649.60% Sept 2011-Present 52 -44.10%Average 63 385.10% Average+ 47 -44.00%Median 41 451.40% Median+ 52 -42.70%
* We are defining a bull market as a period where the US dollar gold prices rose for at least two consecutive years and bear markets as the subsequent periods where the price generally fell for a sustained time.
+ Excludes the period from September 2011 to date.
Source: Bloomberg, ICE Benchmark Administration Ltd, World Gold Council
Shares of Gold Mining Companies
Gold mining companies are experiencing the benefit of producing a monetary asset versus a commodity which is produced for consumption. Strong local gold prices in Australia, Canada, Brazil, South Africa, and other gold producing countries are positively impacting operating margins for the gold mining companies producing in those regions along with lower fuel prices. In our opinion, the double tailwinds of currencies and fuel along with improved capital discipline and debt reduction sets the stage to attract investors back to the sector and lift valuations off historic lows relative to gold.
Share prices of gold mining companies that exhibited poor capital discipline along with companies where executive pay is considered egregious remain in the penalty box. The pockets of relative strength in the sector over the past year have been in a select group of junior gold producers in Canada and Australia along with a handful of emerging producers with new lower cost mines coming on stream. The lack of discovery success finding deposits with 3 million ounces or more over the past decade, signals to us that the market will gravitate more toward intermediate/

– 4 –
mid-tier and junior gold producers going forward out of necessity. Additionally, we believe those companies that hold equity dear, maintain capital discipline on new projects, and understand shareholders need to participate in cash flows will outperform their peers. Your Fund is being positioned accordingly.
Conclusion
It is difficult to pinpoint the moment investors coalesce around the desire or need to own gold assets for any number of reasons discussed above, but we are of the opinion the inflexion point gets closer as equity markets weaken and credit quality deteriorates. In our opinion, it will soon become evident to the market that central bankers’ efforts post-2008 were a failure needing yet another aggressive policy response with further monetary debasement in the cards. In our view, gold’s monetary appeal should attract capital flows seeking to maintain purchasing power in such an environment. We believe the current depressed valuations for shares of gold mining companies relative to the price of gold creates an opportunistic entry point for investors looking to establish positions or rebalance their portfolios.
We appreciate your shareholding and confidence in the OCM Gold Fund and we look forward to meeting the investment objective of preserving your purchasing power. Should you have any questions regarding the Fund or gold, please contact your financial adviser or you may contact us directly at 1-800-779-4681. For questions regarding your account, please contact Shareholder Service at 1-800-628-9403.
Sincerely,
Gregory M. Orrell Portfolio Manager January 21, 2016
OCM GOLD FUNDShareholder Letter – November 30, 2015 (Continued)
(Unaudited)

– 5 –
OCM GOLD FUNDShareholder Letter – November 30, 2015 (Continued)
(Unaudited)
Investing in the OCM Gold Fund involves risks including the loss of principal. Many of the companies in which the Fund invests are smaller capitalization companies which may subject the Fund to greater risk than securities of larger, more-established companies, as they often have limited product lines, markets or financial resources and may be subject to more-abrupt market movements. The Fund also invests in securities of gold and precious metals which may be subject to greater price fluctuations over short periods of time. The Fund is a non-diversified investment company meaning it will invest in fewer securities than diversified investment companies and its performance may be more volatile. The Fund contains international securities that may provide the opportunity for greater return but also have special risks associated with foreign investing including fluctuations in currency, government regulation, differences in accounting standards and liquidity.
Investor Class Performance as of November 30, 2015
OCMGX (without load)
OCMGX (with load)
Philadelphia Gold and Silver Index (XAU)1 S&P 5002
Six Months (26.03)% (29.37)% (33.43)% (0.21)%One Year (22.76)% (26.26)% (31.78)% 2.75%3 Year Annualized (28.72)% (29.81)% (34.27)% 16.09%5 Year Annualized (21.74)% (22.45)% (25.20)% 14.40%10 Year Annualized (1.71)% (2.16)% (7.54)% 7.48%
Advisor Class Performance as of November 30, 2015
OCMAX
Philadelphia Gold and Silver
Index (XAU)1 S&P 5002
Six Months (25.84)% (33.43)% (0.21)%One Year (22.28)% (31.78)% 2.75%3 Year Annualized (28.24)% (34.27)% 16.09%5 Year Annualized (21.27)% (25.20)% 14.40%Since Inception Annualized* (14.30)% (18.96)% 13.06%
* Inception: April 1, 2010
The performance data quoted above represents past performance. Current performance may be lower or higher than the performance data quoted above. Past performance is no guarantee of future results. The investment return and principal value of an investment will fluctuate so that investor’s shares, when redeemed, may be worth more or less

– 6 –
than their original cost. The Fund’s Total Annual Operating Expense Ratios for the OCM Gold Fund Investor Class and Advisor Class are 2.39% and 1.79% respectively. Please review the Fund’s prospectus for more information regarding the Fund’s fees and expenses. For performance information current to the most recent month-end, please call toll-free 800-628-9403. The returns shown include the reinvestment of all dividends but do not reflect the deduction of taxes that a shareholder would pay on Fund distributions or the redemption of Fund shares.
1 The Philadelphia Gold and Silver Index (XAU) is an unmanaged capitalization-weighted index composed of 16 companies listed on U.S. exchanges involved in the gold and silver mining industry. The index is generally considered as representative of the gold and silver share market. You cannot invest directly in an index.
2 The S&P 500 Index, a registered trademark of McGraw-Hill Co., Inc. is a market capitalization-weighted index of 500 widely held common stocks. You cannot invest directly in an index.
OCM GOLD FUNDShareholder Letter – November 30, 2015 (Continued)
(Unaudited)

– 7 –See notes to financial statements.
Shares
Value
COMMON STOCKS 89.5%Major Gold Producers 49.7%
127,250 Agnico Eagle Mines Ltd. ............ $ 3,365,762225,000 AngloGold Ashanti Ltd. ADR* ... 1,440,000400,000 Gold Fields Ltd. ADR ................. 1,012,000430,000 Goldcorp, Inc. ............................ 5,078,300358,200 Kinross Gold Corp.* .................. 687,744100,000 Newmont Mining Corp. ............. 1,841,000111,000 Randgold Resources Ltd. ADR .. 6,726,600249,750 Sibanye Gold Ltd. ADR .............. 1,316,182144,625 Yamana Gold, Inc. ..................... 303,713
21,771,301Intermediate/Mid-Tier Gold Producers 10.1%
296,998 Alamos Gold, Inc. ...................... 890,997411,200 B2Gold Corp.* ........................... 449,533150,000 Centerra Gold, Inc. ..................... 815,425360,833 Eldorado Gold Corp. .................. 1,104,149
1,200,000 Endeavour Mining Corp.* .......... 566,080113,500 Silver Standard
Resources, Inc.* ................... 595,8754,422,059
Junior Gold Producers 6.3%462,400 Argonaut Gold, Inc.* ................. 429,334177,600 Dundee Precious Metals, Inc.* .. 174,209200,000 Klondex Mines Ltd.* .................. 387,870
1,100,000 Mandalay Resources Corp. ........ 601,2731,000,000 Perseus Mining Ltd.* ................ 235,8671,000,000 Wesdome Gold Mines Ltd.* ...... 935,979
2,764,532Exploration and Development Companies 4.7%
500,000 Amarillo Gold Corp.* ................. 28,07961,500 Asanko Gold, Inc.* .................... 92,561
138,500 Asanko Gold, Inc.*^ .................. 210,520417,476 Dacian Gold Ltd.* ...................... 241,542
Shares
Value
Exploration and Development Companies 4.7% (Continued)125,000 MAG Silver Corp.* ..................... $ 868,589100,000 Premier Gold Mines Ltd.* ......... 166,979500,000 Roxgold, Inc.* ........................... 239,611
5,572,040 Sutter Gold Mining, Inc.* .......... 187,7512,035,632
Primary Silver Producers 4.6%200,000 Fortuna Silver Mines, Inc.* ........ 489,704100,000 Tahoe Resources, Inc. ............... 879,82075,000 Tahoe Resources, Inc.^ ............. 660,750
2,030,274Royalty/Streaming Companies 14.1%
76,189 AuRico Metals, Inc.* ................. 33,65914,800 Franco-Nevada Corp. ................. 711,35310,200 Franco-Nevada Corp.^ ............... 488,68260,000 Royal Gold, Inc. ......................... 2,157,000
210,000 Silver Wheaton Corp. ................. 2,759,6416,150,335
Total Common Stocks(Cost $27,622,788) ................... 39,174,133
EXCHANGE TRADED FUND 7.2%31,000 SPDR Gold Shares* .................. 3,159,520
Total Exchange Traded Fund(Cost $1,370,510) ..................... 3,159,520
RIGHTS 0.0%Exploration and Development Companies 0.0%
94,880 Dacian Gold Ltd.*#† Exercise Price 0.69 AUD, Exp. 12/5/2015 ...................... —
Total Rights(Cost $0) .................................... —
OCM GOLD FUNDSchedule of Investments – November 30, 2015

– 8 –See notes to financial statements.
Shares
Value
SHORT-TERM INVESTMENT 3.9%1,717,737 UMB Money Market
Fiduciary, 0.01% .................... $ 1,717,737Total Short-Term Investment
(Cost $1,717,737) ..................... 1,717,737
Total Investments(Cost $30,711,035) ......100.6% 44,051,390
Liabilities less Other Assets ........... (0.6)% (261,855)TOTAL NET ASSETS ........................100.0% $ 43,789,535
ADR – American Depository Receipt.
AUD – Australian Dollars.
* Non-income producing security.
^ Denoted investment is a Canadian security traded on U.S. stock exchange.
# The security is valued at fair value in accordance with procedures established by the Fund’s Board of Trustees.
† Illiquid security.
OCM GOLD FUNDSchedule of Investments – November 30, 2015 (Continued)
– 9 –See notes to financial statements.
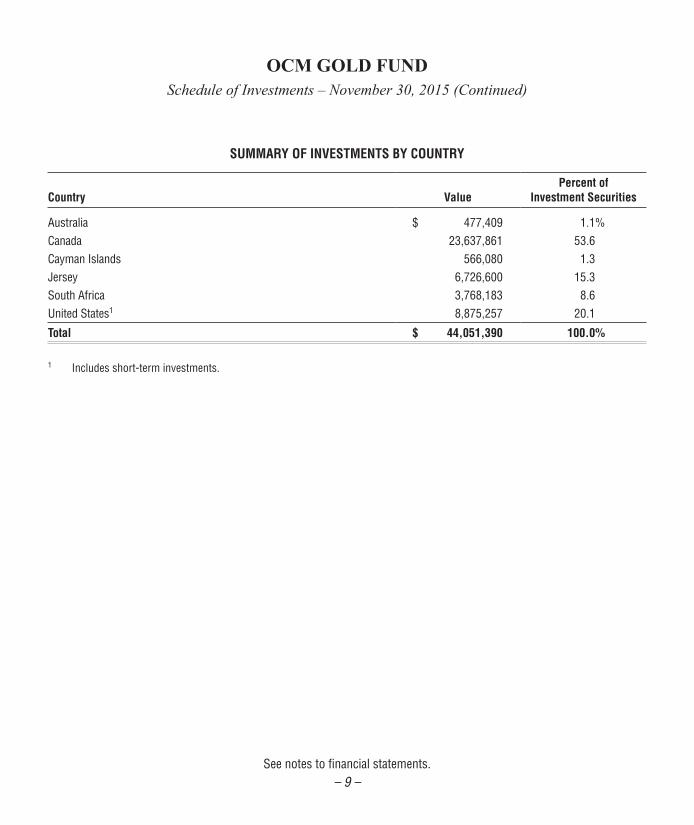
SUMMARY OF INVESTMENTS BY COUNTRY
Country ValuePercent of
Investment Securities
Australia $ 477,409 1.1%Canada 23,637,861 53.6Cayman Islands 566,080 1.3Jersey 6,726,600 15.3South Africa 3,768,183 8.6United States1 8,875,257 20.1
Total $ 44,051,390 100.0%
1 Includes short-term investments.
OCM GOLD FUNDSchedule of Investments – November 30, 2015 (Continued)

– 10 –See notes to financial statements.
Assets:Investments in unaffiliated issuers, at value (cost $30,711,035) ..................................................... $ 44,051,390Interest and dividends receivable ..................................................................................................... 21,408Receivable for fund shares sold ....................................................................................................... 47,314Prepaid expenses and other assets .................................................................................................. 20,110
Total assets .............................................................................................................................. 44,140,222
Liabilities:Investment securities purchased ...................................................................................................... 94,920Payable for fund shares redeemed ................................................................................................... 41,233Investment adviser fees ................................................................................................................... 34,479Accrued distribution fees ................................................................................................................. 100,310Accrued Trustees' fees ..................................................................................................................... 2,500Accrued audit fees ........................................................................................................................... 36,500Accrued expenses and other liabilities ............................................................................................. 40,745
Total liabilities .......................................................................................................................... 350,687Net Assets ................................................................................................................................ $ 43,789,535
Net Assets Consist of:Shares of beneficial interest, no par value: unlimited shares authorized .......................................... $ 33,265,218Undistributed net investment loss .................................................................................................... (1,816,570)Accumulated net realized loss on investments and foreign currency transactions ........................... (999,406)Net unrealized appreciation on investments and foreign currency translations ................................ 13,340,293
Net Assets ................................................................................................................................ $ 43,789,535
Calculation of Maximum Offering Price:Investor Class:
Net asset value and redemption price per share ...................................................................... $ 7.19Maximum sales charge (4.50% of offering price) .................................................................... 0.34Offering price to public ............................................................................................................ $ 7.53Shares outstanding .................................................................................................................. 3,444,220
Advisor Class:Net asset value and redemption price per share ...................................................................... $ 7.46Shares outstanding .................................................................................................................. 2,553,148Total shares outstanding .......................................................................................................... 5,997,368
OCM GOLD FUNDStatement of Assets and Liabilities – November 30, 2015

– 11 –See notes to financial statements.
Investment Income Interest ............................................................................................................................................. $ 147Dividend (net of foreign withholding taxes of $74,602) ................................................................... 596,629
Total investment income .......................................................................................................... 596,776
ExpensesInvestment advisory fees ................................................................................................................. 521,854Distribution fees - Investor Class ..................................................................................................... 288,947Fund administration and accounting fees ......................................................................................... 129,516Transfer agent fees and expenses .................................................................................................... 105,665Professional fees .............................................................................................................................. 62,467Federal and state registration fees ................................................................................................... 56,850Distribution fees - Advisor Class ...................................................................................................... 52,345Chief Compliance Officer fees .......................................................................................................... 26,690Reports to shareholders ................................................................................................................... 22,425Custody fees .................................................................................................................................... 18,052Trustees' fees ................................................................................................................................... 10,000Other expenses ................................................................................................................................ 8,234
Total expenses ......................................................................................................................... 1,303,045Net investment loss ................................................................................................................. (706,269)
Realized and Unrealized Loss on Investments:Net realized loss on investments and foreign currency transactions ................................................ (451,006)Net change in unrealized appreciation/depreciation on investments
and foreign currency translations ............................................................................................ (12,077,277)Net loss on investments ........................................................................................................... (12,528,283)
Net decrease in net assets from operations ........................................................................................... $ (13,234,552)
OCM GOLD FUNDStatement of Operations - Year Ended November 30, 2015

– 12 –See notes to financial statements.
Year Ended November 30,
2015
Year Ended November 30,
2014
Operations:Net investment loss ..................................................................................... $ (706,269) $ (852,951)Net realized loss on investments and foreign currency transactions ............ (451,006) (296,278)Net change in unrealized appreciation/depreciation on investments and
foreign currency translations ............................................................... (12,077,277) (6,550,961)Net decrease in net assets from operations ................................................. (13,234,552) (7,700,190)
Distributions Paid to ShareholdersInvestor Class:
Distributions paid from net realized gains ............................................ (615,794) (1,759,477)Total distributions from Investor Class ................................................ (615,794) (1,759,477)
Advisor Class:Distributions paid from net realized gains ............................................ (291,493) (749,894)Total distributions from Advisor Class ................................................. (291,493) (749,894)Total distributions ................................................................................ (907,287) (2,509,371)
Fund Share TransactionsInvestor Class:
Net proceeds from shares sold ............................................................ 1,751,025 1,857,972Distributions reinvested ....................................................................... 543,376 1,647,220Payment of shares redeemed1 .............................................................. (7,462,865) (10,915,835)Net decrease in net assets from Investor Class share transactions ...... (5,168,464) (7,410,643)
Advisor Class:Net proceeds from shares sold ............................................................ 16,354,937 12,167,338Distributions reinvested ....................................................................... 275,664 717,716Payment of shares redeemed2 .............................................................. (8,677,582) (4,353,883)Net increase in net assets from Advisor Class share transactions ....... 7,953,019 8,531,171Net increase in net assets from Fund share transactions ..................... 2,784,555 1,120,528
Total decrease in net assets ............................................................... (11,357,284) (9,089,033)
Net Assets, Beginning of Period ......................................................................... 55,146,819 64,235,852Net Assets, End of Period ................................................................................... 43,789,535 55,146,819
Accumulated Net Investment Loss ..................................................................... $ (1,816,570) $ (1,998,869)
OCM GOLD FUNDStatements of Changes in Net Assets

– 13 –See notes to financial statements.
OCM GOLD FUNDStatements of Changes in Net Assets (Continued)
Year Ended November 30,
2015
Year Ended November 30,
2014
Transactions in sharesInvestor Class:
Shares sold .......................................................................................... 188,952 145,125 Shares issued on reinvestment of distributions ................................... 60,712 190,210 Shares redeemed ................................................................................. (836,796) (942,822)Net decrease in Investor Class shares outstanding .............................. (587,132) (607,487)
Advisor Class: Shares sold .......................................................................................... 1,664,548 952,396 Shares issued on reinvestment of distributions ................................... 29,895 80,522 Shares redeemed ................................................................................. (880,355) (338,760)Net increase in Advisor Class shares outstanding ................................ 814,088 694,158 Net increase in Fund shares outstanding ............................................. 226,956 86,671
1 Net of redemption fees of $26 for the year ended November 30, 2015 and $79 for the year ended November 30, 2014, respectively.
2 Net of redemption fees of $11,601 for the year ended November 30, 2015 and $14,467 for the year ended November 30, 2014, respectively.

– 14 –
Note 1. Organization
OCM Mutual Fund (the “Trust”) is registered under the Investment Company Act of 1940, as amended, as an open-end management investment company. The Trust was organized as a Massachusetts business trust on January 6, 1984 and consists of the OCM Gold Fund (the “Fund”). The investment objective for the Fund is long-term growth of capital through investing primarily in equity securities of domestic and foreign companies engaged in activities related to gold and precious metals.
The Fund is an investment company and accordingly follows the investment company accounting and reporting guidance of the Financial Accounting Standards Board (“FASB”) Accounting Standard Codification Topic 946 “Financial Services—Investment Companies.”
Note 2. Significant Accounting Policies
The following is a summary of significant accounting policies followed by the Fund in the preparation of its financial statements.
Security Valuation – Portfolio securities that are listed on national securities exchanges, other than the NASDAQ Stock Market LLC, are valued at the last sale price as of the close of business of such securities exchanges, or, in the absence of recorded sales, at the average of readily available closing bid and ask prices on such exchanges. NASDAQ Global Select Market, Global Market and Capital Market securities are valued at the NASDAQ Official Closing Price (“NOCP”). If a NOCP is not issued for a given day, these securities are valued at the average of readily available closing bid and asked prices. Unlisted securities are valued at the average of the quoted bid and ask prices in the over-the-counter market. Short-term investments which mature in less than 60 days are valued at amortized cost (unless the Trust’s Board of Trustees determines that this method does not represent fair value). Short-term investments which mature after 60 days are valued at market. Securities and other assets for which market quotations are not readily available are valued at fair value as determined in good faith by the investment adviser under procedures established by and under the general supervision and responsibility of the Trust’s Board of Trustees. For each investment that is fair valued, the investment adviser considers, to the extent applicable, various factors including, but not limited to, the type of security, the financial condition of the company, comparable companies in the public market, the nature and duration of the cause for a quotation not being readily available and other relevant factors.
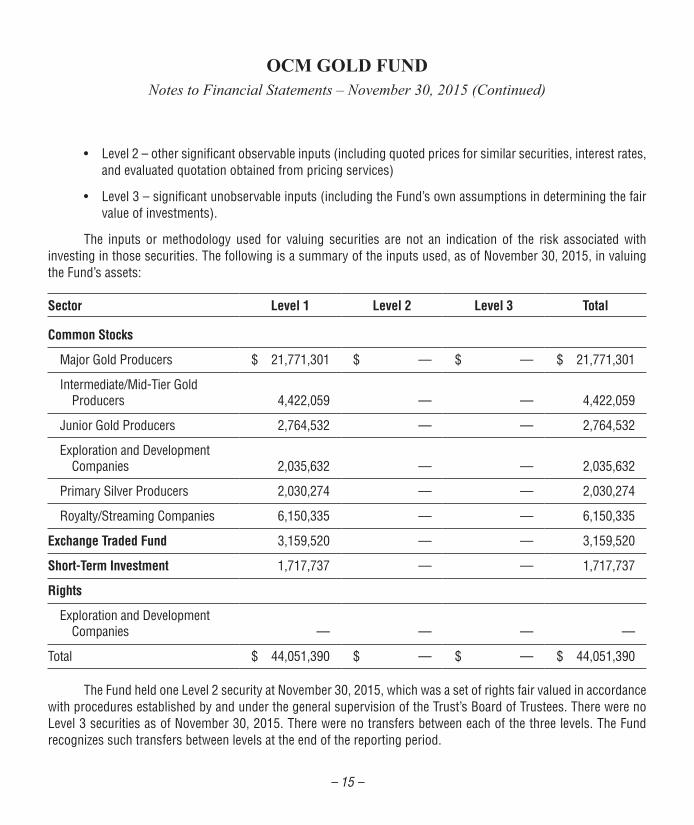
Under Fair Value Measurements and Disclosures, various inputs are used in determining the value of the Fund’s investments. These inputs are summarized into three broad levels as described below:
• Level 1 – quoted prices in active markets for identical securities
OCM GOLD FUNDNotes to Financial Statements – November 30, 2015
– 15 –
OCM GOLD FUNDNotes to Financial Statements – November 30, 2015 (Continued)
• Level 2 – other significant observable inputs (including quoted prices for similar securities, interest rates, and evaluated quotation obtained from pricing services)
• Level 3 – significant unobservable inputs (including the Fund’s own assumptions in determining the fair value of investments).
The inputs or methodology used for valuing securities are not an indication of the risk associated with investing in those securities. The following is a summary of the inputs used, as of November 30, 2015, in valuing the Fund’s assets:
Sector Level 1 Level 2 Level 3 Total
Common Stocks
Major Gold Producers $ 21,771,301 $ — $ — $ 21,771,301
Intermediate/Mid-Tier Gold Producers 4,422,059 — — 4,422,059
Junior Gold Producers 2,764,532 — — 2,764,532
Exploration and Development Companies 2,035,632 — — 2,035,632
Primary Silver Producers 2,030,274 — — 2,030,274
Royalty/Streaming Companies 6,150,335 — — 6,150,335
Exchange Traded Fund 3,159,520 — — 3,159,520
Short-Term Investment 1,717,737 — — 1,717,737
Rights
Exploration and Development Companies — — — —
Total $ 44,051,390 $ — $ — $ 44,051,390
The Fund held one Level 2 security at November 30, 2015, which was a set of rights fair valued in accordance with procedures established by and under the general supervision of the Trust’s Board of Trustees. There were no Level 3 securities as of November 30, 2015. There were no transfers between each of the three levels. The Fund recognizes such transfers between levels at the end of the reporting period.

– 16 –
OCM GOLD FUNDNotes to Financial Statements – November 30, 2015 (Continued)
Foreign Currency – Investment securities and other assets and liabilities denominated in foreign currencies are translated into U.S. dollar amounts at the date of valuation. Purchases and sales of investment securities and income and expense items denominated in foreign currencies are translated into U.S. dollar amounts on the respective dates of such transactions. The Fund does not isolate that portion of the results of operations resulting from changes in foreign exchange rates on investments from the fluctuations arising from changes in market prices of securities held. Such fluctuations for the year ended November 30, 2015 are included within the realized and unrealized gain/loss on investments section of the Statement of Operations.
Reported net realized foreign exchange gains or losses arise from sales of foreign currencies, currency gains or losses realized between the trade and settlement dates on securities transactions, and the difference between the amounts of dividends, interest and foreign withholding taxes recorded on the Fund’s books and the U.S. dollar equivalent of the amounts actually received or paid. Net unrealized foreign exchange gains and losses arise from changes in the fair value of assets and liabilities, other than investments in securities at fiscal period end, resulting from changes in exchange rates. Such fluctuations for the year ended November 30, 2015 are included within the realized and unrealized gain/loss on investments section of the Statement of Operations.
Federal Income Taxes – The Fund intends to comply with the requirements of the Internal Revenue Code necessary to qualify as a regulated investment company and to make the requisite distributions of income to its shareholders to relieve it from all or substantially all federal income taxes. Withholding taxes on foreign dividends have been provided for in accordance with the Fund’s understanding on the applicable county’s tax rules and rate.
Accounting for Uncertainty in Income Taxes (“Income Tax Statement”) requires an evaluation of tax positions taken (or expected to be taken) in the course of preparing the Fund’s tax returns to determine whether these positions meet a “more-likely-than-not” standard that, based on the technical merits, have a more than fifty percent likelihood of being sustained by a taxing authority upon examination. A tax position that meets the “more-likely-than-not” recognition threshold is measured to determine the amount of benefit to recognize in the financial statements. The Fund’s policy is to classify interest and penalties associated with underpayment of federal and state income taxes, if any, as income tax expense on the Statement of Operations. As of November 30, 2015, the Fund did not have any interest or penalties associated with the underpayment of any income taxes.
The Income Tax Statement requires management of the Fund to analyze all open tax years, fiscal years 2012-2015 as defined by IRS statute of limitations for all major jurisdictions, including federal tax authorities and certain state tax authorities. As of and during the year ended November 30, 2015, the Fund did not have a liability for any unrecognized tax benefits. The Fund has no examinations in progress and is not aware of any tax positions for which it is reasonably possible that the total amounts of unrecognized tax benefits will significantly change in the next twelve months.

– 17 –
OCM GOLD FUNDNotes to Financial Statements – November 30, 2015 (Continued)
Share Classes – The Fund offers two classes of shares, Investor Class and Advisor Class. The outstanding shares of the Fund on April 1, 2010 were renamed “Investor Class shares.” The Advisor Class shares commenced operations on April 1, 2010. The two classes represent interests in the same portfolio of investments and have the same rights. Investor Class shares are subject to an annual 12b-1 fee of up to 0.99% of the Fund’s average daily net assets allocable to Investor Class shares, whereas Advisor Class shares are subject to an annual 12b-1 fee of up to 0.25% of the Fund’s average daily net assets allocable to Advisor Class shares. Income, expenses (other than expenses attributable to a specific class) and realized and unrealized gains and losses on investments are allocated to each class of shares in proportion to their relative shares outstanding.
Securities Transactions and Investment Income – Securities transactions are accounted for on a trade date basis. Realized gains and losses on sales of securities are calculated on the identified cost basis. Dividend income is recorded on the ex-dividend date and interest income is recorded on an accrual basis.
Distributions to Shareholders – The character of distributions made during the year from net investment income or net realized gains may differ from the characterization for federal income tax purposes due to differences in the recognition of income, expense or gain items for financial statement and tax purposes. To the extent that these differences are attributable to permanent book and tax accounting differences, the components of net assets have been adjusted.
Redemption Fee – A 1.50% redemption fee is retained by the Fund to offset transaction costs and other expenses associated with short-term investing. The fee is imposed on redemptions or exchanges of shares held less than three months from their purchase date. The Fund records the fee as a reduction of shares redeemed and as a credit to shares of beneficial interest. For the year ended November 30, 2015, the Investor Class and the Advisor Class received $26 and $11,601 in redemption fees, respectively.
Guarantees and Indemnifications – In the normal course of business, the Fund enters into contracts with service providers that contain general indemnification clauses. The Fund’s maximum exposure under these arrangements is unknown as this would involve future claims against the Fund that have not yet occurred. Based on experience, the Fund expects the risk of loss to be remote.
Use of Estimates – The preparation of financial statements in conformity with accounting principles generally accepted in the United States of America requires management to make estimates and assumptions that affect the reported amounts of assets and liabilities and disclosure of contingent assets and liabilities at the date of the financial statements and the reported amounts of increases and decreases in net assets from operations during the reporting period. Actual results could differ from those estimates.

– 18 –
OCM GOLD FUNDNotes to Financial Statements – November 30, 2015 (Continued)
Derivative Instruments – Equity securities in the gold mining industry, particularly the smaller companies, may occasionally issue warrants as part of their capital structure. A warrant gives the holder the right to purchase the underlying equity at the exercise price until the expiration date of the warrant. The Fund may hold such warrants for exposure to smaller companies in the portfolio or other reasons associated with the Fund’s overall objective of long-term growth, though warrants will typically not be a significant part of the Fund’s portfolio. The Fund’s maximum risk in holding warrants is the loss of the entire amount paid for the warrants. The Fund did not acquire any warrants during the year ended November 30, 2015. The limited use of warrants by the Fund involved holding one set of warrants for Veris Gold Corp. which filed for bankruptcy, and as such were fair valued at $0 when held during the reporting period. The Veris Gold Corp. warrants had no impact on the Fund’s Statement of Operations or performance and were liquidated at $0 during the reporting period.
The Fund did acquire one set of rights in Dacian Gold Ltd., as a result of a corporate action during the year ended November 30, 2015. Rights function and have similar risks to warrants. The rights were fair valued at $0 during the period held and had no impact on the Fund’s Statement of Operations or performance during the reporting period.
Note 3. Investment Advisory Agreement and Affiliated Parties
The Fund has an investment advisory agreement with Orrell Capital Management, Inc. (“OCM”). Under the agreement, the Fund pays OCM a fee computed daily and payable monthly, at the following annual rates based upon average daily net assets:
Assets Fee Rate
$0 to $250 million .......................................................................................................................... 0.950%$250 million to $500 million .......................................................................................................... 0.800%$500 million to $1 billion ................................................................................................................ 0.700%Over $1 billion ................................................................................................................................ 0.600%
The Fund does not compensate Trustees and Officers affiliated with OCM. For the year ended November 30, 2015, the expenses accrued for Trustees who are not affiliated with OCM are reported on the Statement of Operations. The Fund pays the salary and related expenses of the Fund’s Chief Compliance Officer. The expenses incurred for the Chief Compliance Officer are reported on the Statement of Operations.

– 19 –
Note 4. Distribution Agreement and Plan
The Trust has adopted a Distribution Plan (the “Plan”) pursuant to Rule 12b-1 under the Investment Company Act of 1940, as amended. The Plan authorizes the Fund to reimburse the distributor for marketing expenses incurred in distributing shares of the Fund, including the cost of printing sales material and making payments to dealers of the Fund’s Investor Class and Advisor Class, in any fiscal year, subject to limits of 0.99% and 0.25%, respectively, of the average daily net assets of each respective class. For the year ended November 30, 2015, the Investor Class and the Advisor Class incurred $288,947 and $52,345, respectively, in expenses under the Plan.
Note 5. Purchases and Sales of Securities
Purchases and sales of investment securities (excluding short-term securities and U.S. government obligations) for the year ended November 30, 2015 were $6,007,517 and $6,386,527, respectively. There were no purchases or sales of U.S. government obligations.
Note 6. Federal Income Tax Information
At November 30, 2015, gross unrealized appreciation and depreciation of investments owned by the Fund, based on cost for federal income tax purposes were as follows:
Cost of investments ........................................................................................................................ $ 31,766,791Unrealized appreciation .................................................................................................................. $ 18,962,185Unrealized depreciation .................................................................................................................. (6,677,586)Unrealized depreciation on foreign currency .................................................................................. (62)Net unrealized appreciation on investments ................................................................................... $ 12,284,537
The difference between cost amounts for financial statement and federal income tax purposes is due primarily to investments in passive foreign investment companies (“PFICs”).
OCM GOLD FUNDNotes to Financial Statements – November 30, 2015 (Continued)
– 20 –
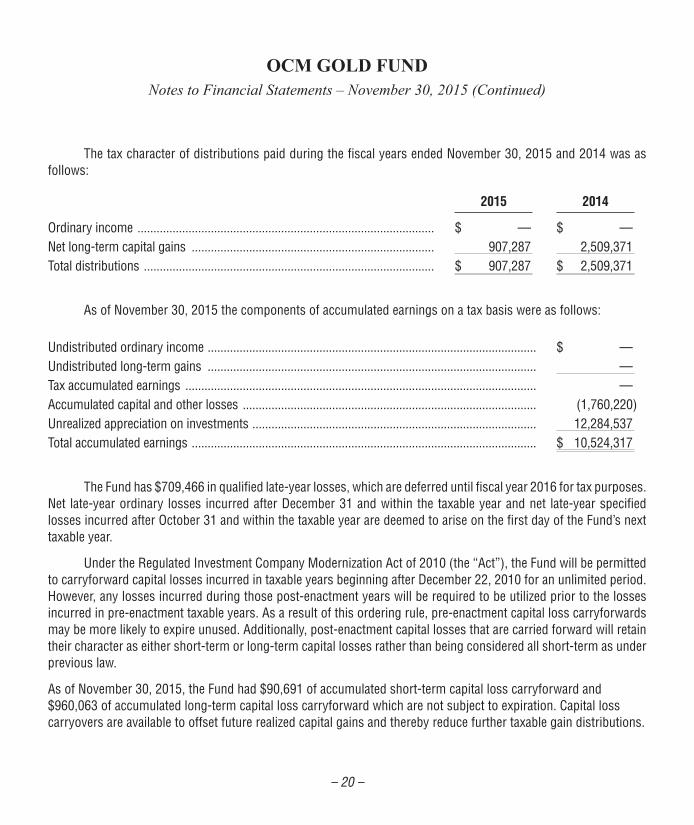
The tax character of distributions paid during the fiscal years ended November 30, 2015 and 2014 was as follows:
2015 2014
Ordinary income ............................................................................................. $ — $ —Net long-term capital gains ............................................................................ 907,287 2,509,371Total distributions ........................................................................................... $ 907,287 $ 2,509,371
As of November 30, 2015 the components of accumulated earnings on a tax basis were as follows:
Undistributed ordinary income ....................................................................................................... $ —Undistributed long-term gains ....................................................................................................... —Tax accumulated earnings .............................................................................................................. —Accumulated capital and other losses ............................................................................................ (1,760,220)Unrealized appreciation on investments ......................................................................................... 12,284,537Total accumulated earnings ............................................................................................................ $ 10,524,317
The Fund has $709,466 in qualified late-year losses, which are deferred until fiscal year 2016 for tax purposes. Net late-year ordinary losses incurred after December 31 and within the taxable year and net late-year specified losses incurred after October 31 and within the taxable year are deemed to arise on the first day of the Fund’s next taxable year.
Under the Regulated Investment Company Modernization Act of 2010 (the “Act”), the Fund will be permitted to carryforward capital losses incurred in taxable years beginning after December 22, 2010 for an unlimited period. However, any losses incurred during those post-enactment years will be required to be utilized prior to the losses incurred in pre-enactment taxable years. As a result of this ordering rule, pre-enactment capital loss carryforwards may be more likely to expire unused. Additionally, post-enactment capital losses that are carried forward will retain their character as either short-term or long-term capital losses rather than being considered all short-term as under previous law.
As of November 30, 2015, the Fund had $90,691 of accumulated short-term capital loss carryforward and $960,063 of accumulated long-term capital loss carryforward which are not subject to expiration. Capital loss carryovers are available to offset future realized capital gains and thereby reduce further taxable gain distributions.
OCM GOLD FUNDNotes to Financial Statements – November 30, 2015 (Continued)

– 21 –
Note 7. Concentration of Risk
Investing in foreign securities involves certain risks not necessarily found in U.S. markets. These include risks associated with adverse changes in economic, political, regulatory and other conditions, changes in currency exchange rates, exchange control regulations, expropriation of assets or nationalization, imposition of withholding taxes on dividend or interest payments or capital gains, and possible difficulty in obtaining and enforcing judgments against foreign entities. Further, issuers of foreign securities are subject to different, and often less comprehensive, accounting, reporting, and disclosure requirements than domestic issuers.
As the Fund concentrates its investments in the gold mining industry, a development adversely affecting the industry (for example, changes in the mining laws which increases production costs or a significant decrease in the market price of gold) would have a greater adverse effect on the Fund than it would if the Fund invested in a number of different industries.
Note 8. Illiquid Securities
The Fund may invest up to 15% of net assets in securities for which there is no readily available market (“illiquid securities”). The 15% limitation includes securities whose disposition would be subject to legal restrictions (“restricted securities”). Illiquid and restricted securities often have a market value lower than the market price of unrestricted securities of the same issuer and are not readily marketable without some time delay. This could result in the Fund being unable to realize a favorable price upon disposition of such securities and in some cases might make disposition of such securities at the time desired by the Fund impossible.
Note 9. Subsequent Events
Subsequent to November 30, 2015, the Fund's net assets and shares outstanding were reduced by approximately 30% due to redemption activity placed in the ordinary course of business. Management of the Adviser has determined that there were no other material subsequent events that would require disclosure in the Fund's financial statements.
OCM GOLD FUNDNotes to Financial Statements – November 30, 2015 (Continued)

– 22 –See notes to financial statements.
Year Ended
Nov. 30, 2015
Year Ended
Nov. 30, 2014
Year Ended
Nov. 30, 2013
Year Ended
Nov. 30, 2012
Year Ended
Nov. 30, 2011
Per Share Operating Performance(For a share outstanding throughout each period)
Net asset value, beginning of period ................................................. $ 9.47 $ 11.26 $ 21.68 $ 28.49 $ 30.53
Income from Investment Operations:Net investment loss ........................................................................... (0.14)1 (0.17)1 (0.27) (0.25) (0.29)Net realized and unrealized gain/(loss) on investments and
foreign currency transactions ........................................................ (1.98) (1.17) (9.75) (5.48) 0.76Total from investment operations ...................................................... (2.12) (1.34) (10.02) (5.73) 0.47
Less Distributions:Dividends from net investment income ............................................. — — — — —Distribution from net realized gains .................................................. (0.16) (0.45) (0.40) (1.08) (2.51)Total distributions .............................................................................. (0.16) (0.45) (0.40) (1.08) (2.51)
Redemption fee proceeds ................................................................ —2 —2 —2 —2 —2
Net asset value, end of period ......................................................... $ 7.19 $ 9.47 $ 11.26 $ 21.68 $ 28.49
Total return* ...................................................................................... (22.76)% (11.49)% (47.03)% (20.27)% 1.70%
Ratios/Supplemental Data:Net assets, end of year (in 000's) ...................................................... $ 24,750 $ 38,177 $ 52,231 $ 125,286 $ 168,305Ratio of expenses to average net assets ........................................... 2.59% 2.39% 2.22% 1.99% 1.73%Ratio of net investment loss to average net assets ........................... (1.51)% (1.34)% (0.85)% (1.04)% (1.03)%Portfolio turnover rate ....................................................................... 11% 5% 8% 1% 5%
* Assumes no sales charge.1 Based on average shares method.2 Amount represents less than $0.01 per share.
OCM GOLD FUNDFinancial Highlights Investor Class

– 23 –See notes to financial statements.
Year Ended
Nov. 30, 2015
Year Ended
Nov. 30, 2014
Year Ended
Nov. 30, 2013
Year Ended
Nov. 30, 2012
Year Ended
Nov. 30, 2011
Per Share Operating Performance(For a share outstanding throughout each period)
Net asset value, beginning of period ................................................. $ 9.76 $ 11.49 $ 22.00 $ 28.74 $ 30.65
Income from Investment Operations:Net investment income loss .............................................................. (0.09)1 (0.09)1 (0.08) (0.12) (0.18)Net realized and unrealized gain/(loss) on investments and
foreign currency transactions ....................................................... (2.06) (1.20) (10.03) (5.54) 0.78Total from investment operations ...................................................... (2.15) (1.29) (10.11) (5.66) 0.60
Less Distributions:Dividends from net investment income ............................................. — — — — —Distribution from net realized gains .................................................. (0.16) (0.45) (0.40) (1.08) (2.51)Total distributions .............................................................................. (0.16) (0.45) (0.40) (1.08) (2.51)
Redemption fee proceeds ................................................................ 0.01 0.01 —2 —2 —2
Net asset value, end of period ......................................................... $ 7.46 $ 9.76 $ 11.49 $ 22.00 $ 28.74
Total return ........................................................................................ (22.28)% (10.74)% (46.75)% (19.83)% 2.15%
Ratios/Supplemental Data:Net assets, end of year (in 000's) ...................................................... $ 19,040 $ 16,970 $ 12,005 $ 17,322 $ 20,328Ratio of expenses to average net assets ........................................... 2.01% 1.79% 1.69% 1.48% 1.30%Ratio of net investment loss to average net assets ........................... (0.92)% (0.74)% (0.31)% (0.52)% (0.60)%Portfolio turnover rate ....................................................................... 11% 5% 8% 1% 5%
1 Based on average shares method.2 Amount represents less than $0.01 per share.
OCM GOLD FUNDFinancial Highlights Advisor Class

– 24 –
To the Shareholders and Board of Trustees of OCM Gold Fund:
We have audited the accompanying statement of assets and liabilities, including the schedule of investments, of OCM Gold Fund (the “Fund”), as of November 30, 2015, and the related statement of operations for the year then ended, the statements of changes in net assets for each of the two years in the period then ended, and the financial highlights for each of the five years in the period then ended. These financial statements and financial highlights are the responsibility of the Fund’s management. Our responsibility is to express an opinion on these financial statements and financial highlights based on our audits.
We conducted our audits in accordance with the standards of the Public Company Accounting Oversight Board (United States). Those standards require that we plan and perform the audit to obtain reasonable assurance about whether the financial statements and financial highlights are free of material misstatement. The Fund is not required to have, nor were we engaged to perform, an audit of its internal control over financial reporting. Our audits included consideration of internal control over financial reporting as a basis for designing audit procedures that are appropriate in the circumstances, but not for the purpose of expressing an opinion on the effectiveness of the Fund’s internal control over financial reporting. Accordingly, we express no such opinion. An audit also includes examining, on a test basis, evidence supporting the amounts and disclosures in the financial statements, assessing the accounting principles used and significant estimates made by management, as well as evaluating the overall financial statement presentation. Our procedures included confirmation of securities owned as of November 30, 2015, by correspondence with the custodian and brokers; when replies were not received from brokers, we performed other auditing procedures. We believe that our audits provide a reasonable basis for our opinion.
In our opinion, the financial statements and financial highlights referred to above present fairly, in all material respects, the financial position of the Fund as of November 30, 2015, the results of its operations for the year then ended, the changes in its net assets for each of the two years in the period then ended, and the financial highlights for each of the five years in the period then ended, in conformity with accounting principles generally accepted in the United States of America.
Milwaukee, Wisconsin January 26, 2016
OCM GOLD FUNDReport of Independent Registered Public Accounting Firm

– 25 –
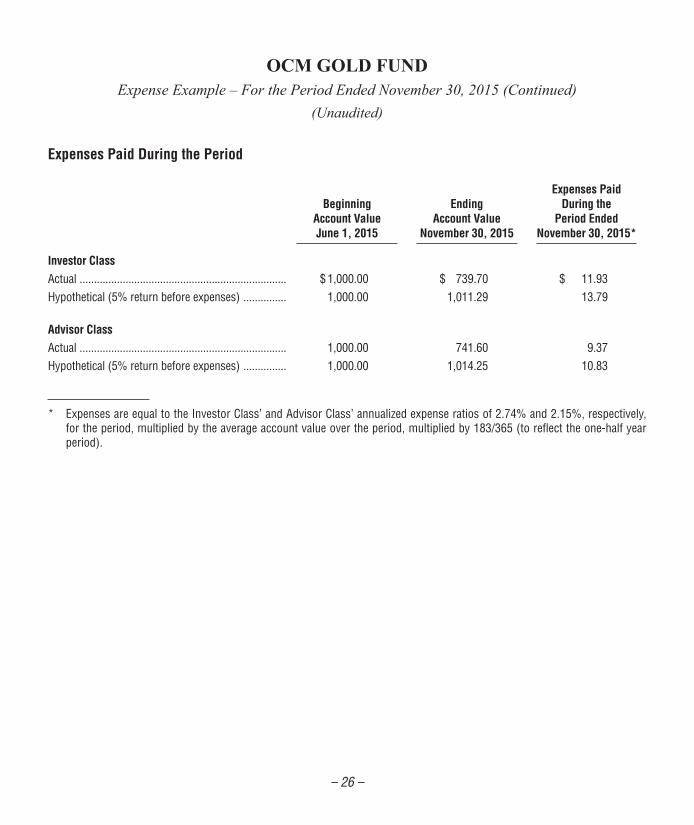
As a shareholder of the OCM Gold Fund (the “Fund”), you incur two types of costs: (1) transaction costs, including sales charges (loads) on purchase payments and redemption fees on certain redemptions; and (2) ongoing costs, including management fees; distribution (12b-1) fees; and other Fund expenses. This Example is intended to help you understand your ongoing costs (in dollars) of investing in the Fund and to compare these costs with the ongoing costs of investing in other mutual funds.
The Example is based on an investment of $1,000 invested at the beginning of the period and held for the entire period from June 1, 2015 to November 30, 2015 (the “period”).
Actual ExpensesThe row titled “Actual” in the table below provides information about actual account values and actual
expenses. You may use this information, together with the amount you invested, to estimate the expenses you paid over the period. Simply divide your account value by $1,000 (for example, an $8,600 account value divided by $1,000 equals 8.6), then multiply the result by the number in the appropriate line for your share class under the heading entitled “Expenses Paid During the Period” to estimate the expenses you paid on your account during the periods.
Hypothetical Example for Comparison PurposesThe row titled “Hypothetical” in the table below provides information about hypothetical account values and
hypothetical expenses based on each class’ actual expense ratio and an assumed rate of return of 5% per year before expenses, which is not each class’ actual return. The hypothetical account values and expenses may not be used to estimate the actual ending account balance or expenses you paid for the period. You may use this information to compare the ongoing costs of investing in the classes of the Fund and other funds. To do so, compare these 5% hypothetical examples with the 5% hypothetical examples that appear in the shareholder reports of other funds.
Please note that the expenses shown in the table are meant to highlight your ongoing costs only and do not reflect any transactional costs, such as sales charges (loads) and redemption fees. Therefore, the hypothetical lines of the table are useful in comparing the ongoing costs only, and will not help you determine the relative total costs of owning different funds. In addition, if these transactional costs were included, your costs could have been higher.
OCM GOLD FUNDExpense Example – For the Period Ended November 30, 2015
(Unaudited)
– 26 –
Expenses Paid During the Period
Beginning Account Value June 1, 2015
Ending Account Value
November 30, 2015
Expenses Paid During the
Period Ended November 30, 2015*
Investor ClassActual ........................................................................ $ 1,000.00 $ 739.70 $ 11.93Hypothetical (5% return before expenses) ............... 1,000.00 1,011.29 13.79
Advisor Class Actual ........................................................................ 1,000.00 741.60 9.37Hypothetical (5% return before expenses) ............... 1,000.00 1,014.25 10.83
* Expenses are equal to the Investor Class’ and Advisor Class’ annualized expense ratios of 2.74% and 2.15%, respectively, for the period, multiplied by the average account value over the period, multiplied by 183/365 (to reflect the one-half year period).
OCM GOLD FUNDExpense Example – For the Period Ended November 30, 2015 (Continued)
(Unaudited)

– 27 –
Investments by Sector – As of November 30, 2015 As a Percentage of Total Investments
Exploration andDevelopmentCompanies
4.6%
Royalty/StreamingCompanies
14.0%
Immediate/Mid-Tier Gold
Producers10.0%
ExchangeTraded Fund
7.2%
Junior Gold Producers
6.3%
Major Gold Producers49.4%
Short-Term Investment
3.9%
Primary Silver Producers
4.6%
The Fund will file its complete schedule of investments with the Securities and Exchange Commission (SEC) for the first and third quarters of each fiscal year on Form N-Q. The Fund's Forms N-Q will be available on the EDGAR database on the SEC's website at http://www.sec.gov. These Forms may also be reviewed and copied at the SEC's Public Reference Room in Washington, D.C. Information about the operation of the Public Reference Room may be obtained by calling 1-800-SEC-0330.
A description of the Fund's proxy voting policies and procedures and a record of the Fund's proxy votes for the year ended June 30, 2015 are available without charge, upon request by calling toll free 1-800-779-4681 and on the SEC's website at http://www.sec.gov. The Fund's proxy voting policies and procedures are also available on the Fund's website at http://www.ocmgoldfund.com.
OCM GOLD FUNDOther Information
(Unaudited)

– 28 –
Average Annual Total Returns
Investor Class S&P 500® IndexPhiladelphia
Gold & Silver Index
1 year ............................................................................... (26.26%) 2.75% (31.78%)5 year ............................................................................... (22.45%) 14.40% (25.20%)10 year ............................................................................. (2.16%) 7.48% (7.54%)
The graph below compares the change in value of a $10,000 investment in the Investor Class of the OCM Gold Fund with the S&P 500® Index and the Philadelphia Gold and Silver Index since November 30, 2005.
$0
$5,000
$10,000
$15,000
$20,000
$25,000
$30,000
11/3
0/15
11/3
0/05
11/3
0/06
11/3
0/07
11/3
0/08
11/3
0/09
11/3
0/10
11/3
0/11
11/3
0/12
11/3
0/13
11/3
0/14
$8,036
$20,574
OCM Gold Fund - Investor Class - $8,036
$4,565
S&P 500® Index - $20,574Philadelphia Gold & Silver Index - $4,565
The returns shown include the reinvestment of all dividends and the maximum sales load charge, but do not reflect the deduction of taxes that a shareholder would pay on fund distributions or the redemption of fund shares. Past performance is not indicative of future results.
The Philadelphia Gold and Silver Index (XAU) is an unmanaged capitilization-weighted index composed of 16 companies listed on U.S. exchanges involved in the gold and silver mining industry. The index is generally considered as representative of the gold and silver share market.
The S&P 500® Index is a broad unmanaged index generally considered as representative of the U.S. equity market.
OCM GOLD FUND - INVESTOR CLASSPerformance Results – Year Ended November 30, 2015
(Unaudited)

– 29 –
Average Annual Total Returns
Advisor Class S&P 500® IndexPhiladelphia
Gold & Silver Index
1 year ............................................................................... (22.28%) 2.75% (31.78%)5 year ............................................................................... (21.27%) 14.40% (25.20%)Since Inception on 4/1/10 ............................................... (14.30%) 13.06% (18.96%)
The graph below compares the change in value of a $10,000 investment in the Advisor Class of the OCM Gold Fund with the S&P 500® Index and the Philadelphia Gold and Silver Index since April 1, 2010 (inception date of Advisor Class).
$0
$5,000
$10,000
$15,000
$20,000
$25,000
11/3
0/15
4/1/
10
11/3
0/10
11/3
0/11
11/3
0/12
11/3
0/13
11/3
0/14
$4,170
$20,051
OCM Gold Fund - Advisor Class - $4,170
$3,038
S&P 500® Index - $20,051Philadelphia Gold & Silver Index - $3,038
The returns shown include the reinvestment of all dividends, but do not reflect the deduction of taxes that a shareholder would pay on fund distributions or the redemption of fund shares. Past performance is not indicative of future results.
The Philadelphia Gold and Silver Index (XAU) is an unmanaged capitilization-weighted index composed of 16 companies listed on U.S. exchanges involved in the gold and silver mining industry. The index is generally considered as representative of the gold and silver share market.
The S&P 500® Index is a broad unmanaged index generally considered as representative of the U.S. equity market.
OCM GOLD FUND - ADVISOR CLASSPerformance Results – Period Ended November 30, 2015
(Unaudited)
– 30 –
On October 22, 2015, the Board of Trustees of OCM Mutual Fund approved the continuation of the Fund’s investment advisory agreement with Orrell Capital Management, Inc. (the “Adviser”). Prior to approving the continuation of the agreement, the Board considered:
• the nature, extent and quality of the services provided by the Adviser
• the investment performance of the Fund
• the costs of the services to be provided and profits to be realized by the Adviser from its relationship with the Fund
• the extent to which economies of scale would be realized as the Fund grows and whether fee levels reflect those economies of scale
• the expense ratio of the Fund
In considering the nature, extent and quality of the services provided by the Adviser, the Board considered an oral presentation by the Adviser describing the portfolio management, shareholder communication, and regulatory compliance services provided by the Adviser to the Fund. The Trustees concluded that the Adviser appears to be providing essential services to the Fund.
The Trustees compared the performance of the Fund to benchmark indices over various periods of time. The Adviser provided information regarding and led discussions of factors impacting the performance of the Fund, outlining current market conditions and explaining the Adviser’s expectations and strategies for the future. The Trustees considered reasons for the negative performance of the Fund (noting that the Fund had outperformed its benchmark index) and the steps taken by the Adviser in an effort to improve the performance of the Fund. Based on this information, the Trustees concluded, within the context of its full deliberations, that the investment results that the Adviser had been able to achieve for the Fund were sufficient to support renewal of the Investment Advisory Agreement. Trustees noted that the Fund adhered to its investment style.
In concluding that the advisory fees payable by the Fund were reasonable, the Trustees reviewed the profits realized by the Adviser, from its relationship with the Fund and concluded that such profits were reasonable and not excessive. As part of its analysis the Board considered the value of the research the Adviser received from broker-dealers executing securities transactions for the Fund. The Trustees also reviewed reports comparing the expense ratios of each class and advisory fees paid by the Fund to those paid by other comparable mutual funds in the same category and concluded that the advisory fees paid by the Fund and the expense ratios of each class of the Fund were in the range of comparable mutual funds.
OCM GOLD FUNDAnnual Renewal of Investment Advisory Agreement
(Unaudited)

– 31 –
The Trustees also considered whether the Investment Advisory Agreement fee schedule should be adjusted for an increase in assets under management. They concluded that the existing “breakpoints” embodied in the Investment Advisory Agreement resulted in substantially lower fee rates than those of comparable mutual funds.
Long Term Capital Gains Designation (Unaudited)
Pursuant to IRC 852(b)(3) of the Internal Revenue Code OCM Gold Fund hereby designates $907,287 as long-term capital gains distributed during the year ended November 30, 2015.
OCM GOLD FUNDAnnual Renewal of Investment Advisory Agreement (Continued)
(Unaudited)

– 32 –
The business and affairs of the Funds are managed under the direction of the Board of Trustees. Information pertaining to the Trustees and Officers of the Fund is set forth below. The Fund’s Statement of Additional Information includes additional information about Trustees and is available, without charge, upon request by calling 1-800-779-4681.
Independent Trustees*
Name, Address and Age
Position(s) Held with Fund
Term of Office and Length of Service
Principal Occupation(s) During Past 5 Years
Other Directorships
Held by Trustee or Nominee
for Trustee
John L. Crary 2600 Kitty Hawk Road, Suite 119 Livermore, California 94551 Age 62
Trustee (Chairman of the
Board)
Indefinite Since 2004
Since 1999 Mr. Crary has been the managing member of Crary Enterprises, LLC, a private investment company. Since 1988 Mr. Crary has been an independent corporate financial advisor and private investor in various biotechnology, software and other early stage business ventures. Mr. Crary began his business career as an investment banker with E.F. Hutton & Company Inc.
Scheid Vineyards, Inc.
Doug Webenbauer 2600 Kitty Hawk Road, Suite 119 Livermore, California 94551 Age 55
Trustee Indefinite Since 2005
Chief Financial Officer of M.E. Fox & Company, Inc., a beer distributor, since 1999.
None
OCM GOLD FUNDTrustee and Officer Information
(Unaudited)

– 33 –
Interested Trustees and Officers**
Name, Address and Age
Position(s) Held with Fund
Term of Office and Length of Service
Principal Occupation(s) During Past 5 Years
Other Directorships
Held by Trustee or Nominee
for Trustee
Gregory M. Orrell 2600 Kitty Hawk Road, Suite 119 Livermore, California 94551 Age 54
Trustee, President, Treausrer
Indefinite Since 2004
President of Orrell Capital Management, Inc. since 1991.
None
Monica L. Baucke 2600 Kitty Hawk Road, Suite 119 Livermore, California 94551 Age 45
Secretary One year term Since 2014
Communications Manager of Orrell Capital Management, Inc. since 2014. Independent Communications and Marketing Consultant from 2009 to 2014.
N/A
Jacob M. Lindseth 2600 Kitty Hawk Road, Suite 119 Livermore, California 94551 Age 36
Chief Compliance Officer
At discretion of the Board
Since April 2014
Compliance Officer of Northern Lights Compliance Services, LLC (12/2011 – present); Staff Attorney for NorthStar Financial Services Group, LLC (2007 – 2011).
N/A
* “Independent” trustees are trustees who are not deemed to be “interested persons” of the Fund as defined in the Investment Company Act of 1940.
** An “interested” trustee is a trustee who is deemed to be an “interested person” of the Fund, as defined in the Investment Company Act of 1940. Gregory M. Orrell is an interested person of the Fund because of his ownership in the Fund’s investment adviser.
OCM GOLD FUNDTrustee and Officer Information (Continued)
(Unaudited)

OCM Gold Fund Distributed by:
Northern Lights Distributors, LLC 17605 Wright Street Omaha, NE 68130
2074-NLD-1/22/2016