annual report fy2014/2015
TRANSCRIPT

ANNUAL REPORT FY2014/2015
LIBERIA REVENUE AUTHORITY ELWA Junction, Paynesville, Monrovia, Liberia

ANNUAL REPORT FY2014/2015 | LRA I
Table of Contents
Foreword by the Commissioner General ..................................................................................................................iii
Attestations for LRA’s FY2014/2015 Annual Report .................................................................................................v
List of Abbreviations .................................................................................................................................................vii
LRA’s Mission .............................................................................................................................................................ix
LRA’s Vision ................................................................................................................................................................ix
Executive Summary .....................................................................................................................................................1
1. Economic Environment in FY2014/2015 ................................................................................................................5
2. Organizational Structure of the LRA ......................................................................................................................6
3. Activities of the Board of Directors ........................................................................................................................7
4. Domestic Tax Department.......................................................................................................................................8
5. Customs Department ........................................................................................................................................11
6. General Affairs .......................................................................................................................................................13
6.1 Professional Ethics Division ..........................................................................................................................13
6.2 Legal and Board Affairs Department .............................................................................................................14
6.3 Policy, Statistics and Strategic Planning Division .......................................................................................14
6.4 Communications, Media and Public Affairs Section ....................................................................................15
7. Technical Affairs ....................................................................................................................................................17
7.1 Enterprise Risk Management and Compliance Division ..............................................................................17
7.2 Enterprise Design, Quality Assurance and Results Division ......................................................................18
7.3 Management Information Services (MIS) Division........................................................................................18
7.4 National Revenue Accounting and Reconciliation Section .........................................................................19
7.5 Taxpayer Services Division ............................................................................................................................19
7.6 Office of Professional Responsibility Section ..............................................................................................20
8. Administrative Affairs............................................................................................................................................21
8.1 Budget and Finance Division .........................................................................................................................21
8.2 General Services Department.........................................................................................................................22
8.3 Human Resource Management Division .......................................................................................................24
8.5 Security Management Section........................................................................................................................24

ANNUAL REPORT FY2014/2015 | LRA II
9. Internal Audit Department .....................................................................................................................................25
10. Revenue Performance .........................................................................................................................................26
10.1 Domestic Revenue.........................................................................................................................................26
10.1.1 Domestic Tax Revenue ..........................................................................................................................28
10.1.2 Customs Revenue ..................................................................................................................................34
10.1.3 Trade in FY2014/2015 .............................................................................................................................38
10.2 External Resources .......................................................................................................................................44
11. Key Challenges ....................................................................................................................................................45
12. Key Achievements ...............................................................................................................................................47
13. Financial Statement .............................................................................................................................................48
14. Conclusion ...........................................................................................................................................................49
APPENDIX A: Duty Free ............................................................................................................................................50
Table A1: General Goods Waiver: Detailed Listing.................................................................................................50
Table A2: Petroleum Goods Waiver: Detailed Listing ............................................................................................63
APPENDIX B: Financial Statements .........................................................................................................................64

ANNUAL REPORT FY2014/2015 | LRA III
Foreword by the Commissioner General
The Fiscal year 2014-2015 saw the newly established Liberia
Revenue Authority (LRA) making tremendous achievements in
revenue administration and collection. Despite the challenges
posed by the Ebola pandemic, and the inadequacy of required
logistics, the revenue collection was notable, exceeding the
annual domestic revenue forecast by US$19.9M. This over-
performance was the result of several initiatives undertaken by
the LRA, including sensitization campaigns aimed at improving
voluntary compliance, the strengthening of service delivery,
various enforcement exercises, and the building of institutional
capacities.
While the main focus of the LRA is on revenue collection to support the national budget, it also prioritized in
this year the placement of old and new staff in various departments, divisions, sections and units. To this end,
the LRA inherited 822 staffers from the former Department of Revenue of whom 362 were confirmed through
an HR verification process. Of the inherited and confirmed staff, 343 were placed, while 19 were rolled over for
placement in the next fiscal year.
The Authority moved into its headquarters at the ELWA junction in Paynesville, and set up some of the
infrastructure needed to carry out its operations. In this regard, the Authority focused on maintaining
partnerships with the private sector, the public sector and the donor community, thereby yielding dividends
in gratuity of office space, and the partitioning and revamping of the IT and data center of the LRA. In its
mandate to ensure its professional and operational integrity, the LRA drafted a series of Standard Operational
Procedures (SOPs) and relevant Administrative Regulations for the various departments of the LRA. Audits
and post-clearance audits were conducted by the Authority, all of which were geared toward ensuring the
success of meeting the revenue targets for the fiscal year.
The achievements outlined in this report were realized as a direct result of the support from the Government
of Liberia, the Board of Directors, the business community, development partners and all other relevant
stakeholders. Moreover, the professional skills of the staff in their various functions made possible the
achievements of the LRA in FY2014/2015.

ANNUAL REPORT FY2014/2015 | LRA IV
In the coming Fiscal Year 2015/2016, the LRA strives to continue to serve its clients better through simplified
and improved service delivery, taxpayers’ educational schemes and personnel training programs. To this end,
we call for greater partnership, cooperation and support from all stakeholders, partners, taxpayers, the
business community, employees and the Government of Liberia, including the Legislature and the Judiciary.
Elfrieda Stewart Tamba
Commissioner General
ANNUAL REPORT FY2014/2015 | LRA V
ATTESTATION FOR LRA’S FY2014/2015 ANNUAL REPORT’S FINANCIAL INFORMATION BY
THE DEPARTMENT OF ADMINISTRATIVE AFFAIRS OF THE LIBERIA REVENUE AUTHORITY
The financial information presented in this Report has been prepared in accordance with International Public
Sector Accounting Standards (IPSAS-Cash Basis) and under internal control measures, designed to assure the
following:
1. That the financials in pages 48, 64 and 65 of this report do not contain material misstatements;
2. That the financials are a faithful representation of the underlying economic and financial reality
reported; and
3. That the financials are truthful, accurate and complete in all material aspects.

ANNUAL REPORT FY2014/2015 | LRA VI
ATTESTATION FOR THE 2014-2015 ANNUAL REPORT BY THE DOMESTIC TAX DEPARTMENT OF THE
LIBERIA REVENUE AUTHORITY
The data contained in this report on revenue collection by the Domestic Tax Department is presented in
accordance with Section 7(2)(g) of the LRA Act, and it is hereby attested that:
1. The data in pages 26 to 33 and 44 of this report contain no material misstatements;
2. The data on revenue collection is a faithful representation of the underlying tax returns of the
system; and
3. The data is truthful, accurate and complete in all material aspects.
2016 A.D.
ATTESTATION TO THE 2014-2015 ANNUAL REPORT BY CUSTOMS DEPARTMENT OF THE LIBERIA
REVENUE AUTHORITY
The data contained in this report on revenue collection by the Customs Department is presented in
accordance with Section 7(2)(g) of the LRA Act, and it is hereby attested that:
1. The data in pages 34 to 43 and 50 to 63 of this report contain no material misstatements;
2. The data on revenue collection is a faithful representation of the underlying information retrieved
from ASYCUDA; and
3. The data is truthful, accurate and complete in all material aspects.
2016 A.D.

ANNUAL REPORT FY2014/2015 | LRA VII
List of Abbreviations
AfDB African Development Bank
ASIU Anti-smuggling Intelligence Unit
ASYCUDA Automated System of Customs Data
ATAF African Tax Administration Forum
BIVAC Bureau of Inspection, Valuation, Assessment and Control
BOD Board of Directors
CBL Central Bank of Liberia
CBO Customs Business Office
CET Common External Tariff
CG Commissioner General
CIF Cost, Insurance and Freight Value
CIT Corporate Income Tax
CSP Corporate Strategic Plan
CTS Collectorate Tax Section
CUF Custom User Fees
DCGAA Deputy Commissioner General of Administrative Affairs
DCGTA Deputy Commissioner General of Technical Affairs
DTD Domestic Tax Department
ECOWAS Economic Committee of West African States
EDQARD Enterprise Design and Quality Assurance Result Division
ERMCD Enterprise Risk Management Compliance Division
EU European Union
EVD Ebola Virus Disease
FOB Free on Board
FY Fiscal Year
GDP Gross Domestic Product
GOL Government of Liberia
GSM Global System for Mobile Communication
GST Goods and Services Tax
HMRC Her Majesty’s Revenue and Customs
HRM Human Resource Management
HRMP Human Resource Management Policy
IAA Internal Audit Agency
IAD Internal Audit Division
ICT Information and Communication Technologies
IFC International Finance Corporation
IMF International Monetary Fund
IPSAS International Public Sector Accounting Standards
IT Information Technology
KRA Kenya Revenue Authority
LBDI Liberia Bank for Development and Investment

ANNUAL REPORT FY2014/2015 | LRA VIII
LD Liberian Dollar
LEC Liberia Electricity Corporation
LITP Liberia Institute of Tax Practitioners
LPRC Liberia Petroleum Refining Company
LRA Liberia Revenue Authority
LRC Liberia Revenue Code
LTD Large Tax Department
MFDP Ministry of Finance and Development Planning
MIS Management Information System
MOJ Ministry of Justice
MSMTD Micro , Small and Medium Tax Department
NASSCORP National Social Security and Welfare Corporation
NCB National Competitive Bidding
NOCAL National Oil Company of Liberia
NRARS National Revenue Accounting Reconciliation Section
NRTU Natural Resources Tax Unit
OCC Office of Chief Council
OECD Organization for Economic Cooperation and Development
OPRS Office of Professional Responsibility Section
OTA Office of Technical Affairs
PED Professional Ethics Division
PIT Personal Income Tax
RETD Real State Tax Department
PSSPD Policy, Statistics and Strategic Planning Division
SEGAL Security Expert Guard Agency of Liberia
SIGTAS Standard Integrated Government Tax Administration System
SMS Security Management Section
SMS Sector Ministries Section
SOP Standard Operating Procedure
TAS Tax Administration System
TBO Tax Business Office
TOT Training of Trainers
TPSD Taxpayer Services Division
UNDP United Nations Development Programme
USAID United States Agency for International Development
USD United Stated Dollars
ZIMRA Zimbabwe Revenue Authority

ANNUAL REPORT FY2014/2015 | LRA IX
Figure 1: LRA Headquarters, Paynesville, Monrovia. Liberia
LRA’s Mission
To professionally, fairly, transparently and effectively collect lawful revenues, and to facilitate legitimate trade
and social protection for the people of Liberia.
LRA’s Vision
To be a professional revenue administrator adhering to international standards and to serve as a model for
revenue collection and service delivery.

ANNUAL REPORT FY2014/2015 | LRA 1
Executive Summary
The Liberia Revenue Authority came into being on July 1, 2013 through a law enacted by the National
Legislature. It replaced the Department of Revenue (comprising the Bureau of Internal Revenue and the Bureau
of Customs and Excise) at the former Ministry of Finance. The LRA’s mandate is to “administer and enforce
revenue laws in accordance to the Liberia Revenue Code (and other related laws under which it is assigned
responsibility) for the purpose of assessing, collecting, auditing, and accounting for all national revenues, to
facilitate legitimate international trade and customs border management-enforcement.” In light of ensuring
the administration of its assigned responsibilities, the Liberia Revenue Authority is pleased to present its
annual report for FY2014/2015. The report highlights initiatives embarked upon by the LRA as well as
challenges faced during period.
Revenue Collection: During the first year of its operation as a semi-autonomous body, the Authority has had
commendable success along the primary avenue of its mandate, the collection of national revenues. The actual
consolidated collection of domestic revenues exceeded the corresponding forecast by US$19.9M in
FY2014/2015. To achieve the revenue target, the LRA undertook various initiatives, such as sensitization
campaigns aimed at improving voluntary compliance, strengthening of service delivery, enforcement
exercises, systematic structuring and re-engineering of internal business processes, and the execution of
various audits.
Transition of staff and facilities: The Authority also transitioned to its headquarters at the ELWA junction,
Paynesville, and fully assessed and placed 83% of the 822 staff inherited from the Department of Revenue into
suitable positions, as well as recruited 166 well-qualified personnel to fill some existing human capacity gaps
during the same period. Further, modern job tools and work spaces were provided to all LRA staff.
Fight against corruption: To preserve the integrity of the Authority, the LRA also made efforts to combat
corruption during FY2014/2015. These efforts targeted employees of the LRA who may have engaged in
unscrupulous acts, as well as the business community on account of tax evasion, smuggling, under-
declaration and other tax frauds. Extensive internal and external intelligence-gathering exercises on illegal
activities have been undertaken. The results of these undertakings range from administrative and legal actions
against the offending parties.
Strategic Management System: An effective and efficient revenue administration requires improved internal
systems based on strategic management practices. To this end, the LRA has drafted a Five-Year Corporate
Strategic Plan, an Annual business plan for FY/2015-2016, and work plans for each Department and Division
of the LRA. Monitoring the progress along these plans is crucial, and thus employee and corporate performance
measurement systems are also being implemented. These efforts were done in close collaboration with the
International Monetary Fund’s (IMF) Fiscal Affairs Department. The Corporate Strategic Plan delineates four
broad strategic goals that LRA seeks to achieve between 2016 and 2020:

ANNUAL REPORT FY2014/2015 | LRA 2
1) Goal 1: Administer Revenue Legislation in an effective, fair and transparent manner.
2) Goal 2: Maximize voluntary compliance.
3) Goal 3: Build an effective institution at all levels through excellence in leadership, accountability,
technical and real infrastructural capacities
4) Goal 4: Transform revenue administration by utilizing effective information and communication
technology (ICT)
Taxpayer Outreach Programs: During the reporting period, the management of the Revenue Authority became
aware of the generally low compliance rates across tax types, the low levels of tax awareness among taxpayers,
and the rapidly changing needs of taxpayers. Concurrently, the highest priority of the LRA for the period was
to deliver quality and efficient services to its clients. Substantial efforts were made by LRA’s Taxpayer Services
Division (TPSD) to build tax awareness among the public through various outreach programs. Informational
materials that were disseminated widely include forms, brochures, posters, billboards, radio talk shows, and
community engagements. On account of these educational and other enforcement endeavors, compliance
levels have risen substantially, with the tax base growing at 5% monthly. The tax roll currently holds almost
23,000 taxpayers, and real estate tax is being assessed on more than 10,500 properties. Further advancement is
expected in FY/2015-2016 as the TPSD anticipates stepping up the awareness campaigns, and the Domestic
Tax Department conducts additional property assessments and enforcement exercises.
Enforcement Exercises and Audits: To ensure the proper administration of the Liberia Revenue Code (LRC)
and the fair, equitable and transparent enforcement of regulations within the LRA’s jurisdiction, the Authority
conducted several audits and post-clearance audits of taxpayers based on established audit selectivity criteria.
The results of the audits enabled bills to be generated and served to the concerned clients, and enforcement
actions were undertaken to recover the assessed revenues. In addition, the LRA’s Internal Audit Department
conducted internal audits of the LRA’s business processes, customs and tax business offices to construct an
entity-wide-risk profile. This exercise produced a risk analysis that identified the weaknesses and challenges
faced by the Authority in FY2014/2015, and identified directions for LRA’s executive management to mitigate
the challenges.
Collaborative partnerships: During FY2014/2015, the LRA collaborated with a variety of local stakeholders and
external partners, including the UNDP, USAID, OECD, AfDB, IFC and others. Key partnerships include:
1) The United National Development Programme (UNDP) supported the construction of LRA’s data center,
and provided additional ICT support and equipment, which have significantly improved the LRA’s data
management processes.
2) The International Monetary Fund (IMF) provided extensive support in establishing LRA’s Strategic
Management System.
3) The United States Agency for International Development (USAID) helped upgrade the service delivery
at the revenue collection windows placed in different line ministries and agencies, and enabled the
procurement of necessary equipment at the LRA Business Offices.

ANNUAL REPORT FY2014/2015 | LRA 3
4) In the same period, the LRA began extensive research on establishing collaborative partnerships with
other Revenue Authorities, especially in Africa, to explore learning opportunities for revenue
administration. Learning missions were conducted with institutional counterparts at the Zimbabwe
Revenue Authority and (ZIMRA) and the Kenya Revenue Authority (KRA).
5) The LRA also participated in regional conferences and knowledge-sharing through the African Tax
Administration Forum (ATAF) and the Addis Tax Initiative.
Launch of LRA website: The rapid spread of information technology has crucially affected every corner of the
world. Engaging proactively with the ICT boom engenders unparalleled opportunities for informational and
other exchanges between institutions and individuals. Accordingly, the LRA developed and launched its
website (www.lra.gov.lr) in FY2014/2015. The website is continually updated to include a comprehensive
repository of taxpayer education materials, communication highlights, revenue-related regulations, rulings and
interpretations, FAQs, forms, job opportunities at the LRA, and a platform to communicate and interact with
LRA staff.
Upcoming Initiatives: In the coming year, the LRA endeavors to continue its dynamic enforcement of Liberia’s
revenue laws. Some of the upcoming initiatives in this regard include:
1) In collaboration with the MFDP, the LRA has begun reviewing the Liberia Revenue Code (LRC) in an
effort to draw up a proposal of key recommendations to enhance and simplify the Code.
2) In line with obligations to ECOWAS, the LRA will begin the transition to ECOWAS Common external
Tariff (CET) in FY/2015-2016.
3) The authority also plans to automate business processes and tax payments through enabling various
e-services, as a means of reducing compliance costs for taxpayers.
4) The LRA’s IT platforms (ASYCUDA, TAS and SIGTAS) used to collect and account for national
revenues) are not currently interfaced for the streamline exchange of revenue data. The LRA has
begun exploring opportunities to interface the systems.
5) The LRA will draft and implement the Domestic Revenue Mobilization strategy in line with the post-
2015 Sustainable Development Agenda, the Addis Ababa Action Agenda and the Corporate Strategic
Plan.
Major Challenges: Despite the impressive gains made during the first year of operations, inadequate logistical
support, the unexpected scourge of the EVD epidemic and other difficulties proved a hindrance to LRA’s
operations. Significant challenges that faced the LRA include low levels of taxpayer compliance, a vast and
hard-to-tax informal sector, limited internet connectivity, and inconsistent power supply at the Authority
Headquarters as well as its business offices in the counties. These issues need to be overcome in order to
sustain and improve future revenue outturns. Overall, addressing the funding constraints at the LRA would
enable it to invest in advanced tax administration technology and tackle the aforementioned challenges, and
in turn facilitate tax base expansion, domestic resource mobilization and the protection of legitimate trade.

ANNUAL REPORT FY2014/2015 | LRA 4
The report is structured in ten sections. Section 1 describes the economic environment of the period under
review, to provide a context to LRA’s operations. Section 2 details the organizational structure of the LRA.
Section 3 summarizes the activities of the board for FY2014/2015. Sections 4 and 5 details the operations of
Domestic Tax and Customs tax departments respectively. Sections 6, 7 and 8 describe the general, technical
and administrative affairs of the LRA in FY2014/2015 respectively. Section 9 relates to the Internal Audit
Division’s activities in the period under review. Section 10 details the revenue performance of the fiscal year.
While, Sections 11 and 12 highlight the key challenges and achievements of the LRA in this period respectively.
Section 13 presents the notes on the unaudited financial statement attached as an appendix, and Section 14
concludes.
***

ANNUAL REPORT FY2014/2015 | LRA 5
1. Economic Environment in FY2014/2015
The Liberian economic environment during the fiscal year 2014–2015 was characterized by an unfamiliar and
deadly phenomenon: the spreading pandemic of the Ebola Virus Disease (EVD) that threatened to engulf the
entire Mano River Union group of countries. The Ebola Virus was a dangerous hazard that disturbed Liberia’s
economic and social stability, and necessitated the diversion of scarce resources of human and economic
capital to the pursuit of its eradication.
As a result of the epidemic, the real Gross Domestic Product (GDP) rate plummeted. As against the predicted
rate of 8.7% (forecasted in 2013), the real GDP rate in FY2014/2015 was estimated to be 1.2%. An estimated
average inflation rate of 9.9% was observed for the fiscal year in review, mainly on account of the declining
production of domestic food crops. The nominal exchange rate (LD/USD) depreciated by 0.9%. Indeed, the
Central Bank of Liberia (CBL) aggressively pursued a sterilization and stabilization program to prevent
excessive depreciation of the exchange rate. Despite the improving terms of trade (occasioned by the
depreciating exchange rate), exports fell in FY2014/2015, caused by a slowdown in Liberian production (another
result of the devastating epidemic).
Despite these negative economic trends in the period under review, the economy experienced mixed effects
due to the welcome bilateral, multilateral and philanthropic interventions in response to the EVD epidemic. The
Liberian National Budget – passed in November, 2013 – was frontloaded by bilateral and multilateral assistance
from the donor community. The impacts of the EVD outbreak echoed through the economy as the government’s
priorities shifted to preventing the further spread of EVD, restructuring and resuming public health services,
re-igniting growth in employment prospects, and increasing household incomes. As a consequence, the
economic trajectories of the ensuing FY2015/2016 are expected to gradually return to their pre-EVD levels.
With respect to the collection of domestic revenues, actual collection (US$437.2M) exceeded the approved
Budget forecast of US$417.2M by 5%. This figure is further disaggregated in Section 10 to show the details in
underlying tax lines. As the Liberia Revenue Authority continues to pursue and improve upon the means and
methods of revenue administration, current estimates indicate that the horizon for a more robust domestic
revenue mobilization is possible in the medium term.

ANNUAL REPORT FY2014/2015 | LRA 6
2. Organizational Structure of the LRA
The Executive leadership of the LRA is comprised of five positions: the Commissioner General (CG), the
Deputy Commissioner General for Technical Affairs (DCGTA), the Deputy Commissioner General for
Administrative Affairs (DCGAA), the Commissioner of the Domestic Tax Department and the Commissioner of
the Customs Department.
The CG reports directly to the B o a r d o f D i r e c t o r s ( BOD), but retains a functional accountability to the
Ministry of Finance and Development Planning (MFDP). The CG is also the Chief Executive Officer and
Secretary to the BOD.
The Deputy Commissioner General for Technical Affairs (DCGTA) is responsible for operational risk
management, Management Information Systems (MIS) and service delivery. The Deputy Co mm i s s i o ne r
General for Administrative Affairs (DCGAA) leads the LRA in the areas of corporate affairs and administration.
The two other positions in the Executive Management are the Commissioner of Customs and the
Commissioner of Domestic Tax, who run the business delivery arms of the Authority (the Customs Department
and the Domestic Tax Department respectively). Each of the commissioners reports directly to the
Commissioner General.
Of the internal constituents of the LRA, as is the case with all G overnmental ministries and agencies,
the LRA is comprised of many functional areas. The first is the Internal Audit Department (IAD) which is
currently headed by a D i rec t o r, who reports to the Board of Directors and the Internal Audit Agency (IAA)
of the Government. The IAD head also has a functional reporting relationship to the CG.
In addition, there are four other functional areas, which all fall directly under the CG’s office:
1. The Professional Ethics Division is charged with the important responsibility of monitoring and
maintaining the integrity of the LRA staff.
2. The Policy, Statistics and Strategic Planning Division is responsible for timely data reporting, liaising
with local and international partners and economic and statistical research for policy purposes.
3. The Legal and Board Affairs Department handles the legal affairs of the LRA, including the
prosecution of non-compliant taxpayers in the tax court.
4. The Communications, Media and Public Affairs Section is in charge of liaising with the media and
maintaining LRA’s public image.

ANNUAL REPORT FY2014/2015 | LRA 7
3. Activities of the Board of Directors
Section 10(1) of the LRA Act of 2013 provides that the LRA Board shall be responsible to provide general
governance and strategic direction of the management and organization of the LRA, planning and reporting,
financial management and administrative policies, and expenditures so that the LRA’s objective can be
achieved. To carry out its mandate, the Board meets at least once every three months for the conduct of
business.
During the period under review, the Board held four (4) statutory meetings and one (1) call meeting. The
following resolutions were reached by the Board:
1) Resolution to adopt the Human Resource Management Policy of the LRA.
2) Resolution to adopt the Professional Ethics and Code of Conduct of the LRA.
3) Approval of Messrs. Saa Saamoi and Darlingston Talery as Commissioners of Customs and Domestic
Tax respectively.
4) Resolution to adopt the Liberia Revenue Authority Corporate Strategic Plan.
5) Approval of the Draft Expenditure Budget of the LRA.

ANNUAL REPORT FY2014/2015 | LRA 8
DO
ME
ST
IC T
AX
4. Domestic Tax Department
The Domestic Tax Department (DTD) is one of the core business arms of the Liberia Revenue Authority. DTD is in charge of collecting national domestic revenues. DTD is comprised of six functional areas, structured as follows:
Figure 2: Domestic Tax Department Organogram
Large Tax Division
Medium, Small and Micro Tax Division
Natural Resources Unit
Real Estate Division
Sector Ministry Section
Tax Business Offices
The main objective of the department is to increase the number of taxpayers and to control related operations. Also, DTD works to improve taxpayers’ compliance and the collection of revenue yield to the Government.
The Natural Resource Tax Unit (NRTU) was established in 2012, however until June 2014, the Unit functioned mostly in an advisory role to the Large Tax Division. Since July 2014, NRTU has been fulfilling its main objective of assessing, auditing and collecting the lawful revenues from the natural resources sector.
During the current period DTD has accomplished its 4 core functions:
1) Control of taxpayers’ returns: During the course of the fiscal year, the Department recalibrated the
function into the management of taxpayers return profile according to sectors. The objective of the new approach is to adequately control and validate taxpayers by economic sectors, i.e., manufacturing, merchandising, natural resources, inter alia. The new approach enables DTD officers to assess taxpayer’s declarations disaggregated by tax types and by sectors, and thereby inform authorities of the relative levels of performance and needed interventions. To date, the Department was successful in structuring the team management of taxpayers' profiles both by personnel and in the automated environment. However, the structure is still a work in progress.
2) Services: During the year in retrospect, the Department liaised with the Taxpayer Service Division to
host a series of tax education and awareness seminars targeting a number of economic sectors, including banking, realty management, manufacturing, diamond dealers and brokers association, and merchandising. Certain business communities such as the Chinese and Fula Communities were also specifically sought out, to extend contextually relevant taxpayer education. Additionally, the Department also reached out to the Liberia Marketing Association, the Federation of Road Transport Association, the Genuine Road Transport Association, the Association of Agriculture Concession, the Forestry Sector as well as the Mining Sector. These interactions led to increase in the compliance level of the Forestry Sector by 15%.
3) Audit: The Department has instituted a risk management program for audit, and has developed a risk criteria for selection of audit cases. To date, the Department in collaboration with the IMF/FAD, is
ANNUAL REPORT FY2014/2015 | LRA 9
finalizing the sector-specific audit program for the telecommunications and hotels sectors. For FY 2014/2015 the Audit Program contributed about 5% of revenue generation through additional assessment mainly from issue audits, i.e., withholding tax obligations.
4) Collection and enforcement: During FY 2014/2015, the department’s tax debt management program
contributed to about 10% of the revenue envelope. Debts were collected notably from the Forestry Sector as well as the banking sector as a result of additional assessment from withholding obligations. To date, the department’s debt inventory is US$ 6.3M; this excludes amounts in cases submitted for legal action (US$ 27M) as well as debt owed by State-owned Enterprise (US$ 1.8M).
The advent of LRA’s operations in July of 2014 coincided with the deadly Ebola Pandemic that affected the smooth launch of the Department's compliance programs and threatened to erode the collection of taxes. Additionally, other challenges encountered by the Department included:
1) The timely provision of logistics and supplies to the various divisions of the Department; 2) The uncertainty of staff of their status during the transitional process; 3) The constant malfunctioning of the SIGTAS system. This led to poor service delivery to our
customers, i.e., the taxpayers; 4) The insufficient number of staff allocated in some divisions of the Department.
The Department's quest to improve voluntary compliance resulted in various interventions during FY2014/2015:
1) The Department introduced a new GST Return form for the GSM sector. This has led to full disclosure of both call time and data sales on the various platforms of the service providers.
2) The Department introduced a new GST Return form for the Hotel Sector. The Form fully highlights sales and services provided by service providers and local manufactures, and brings to the lime light GST incentives for investments and well as exempt GST sales. These features were not previously seen on the erstwhile generic GST Return.
3) A new Excise Tax Return form was also introduced. The objective is to ensure full disclosure of ex- factory sales of local manufacturers.
4) There were several in-house refresher trainings conducted for auditors, enforcers and compliance analysts. The objective of these trainings is to provide continuous professional capacity development for staff that optimizes the Department’s productivity and helps it to stay on par with international best practice vis-a-vis taxation.
5) The reorganization of the Department's Audit program which now is focused in economic sectors. The objective is to create specialization and expertise of capacities of the staff that will optimize the output of the department.
The department is considering four transitional programs:
1) The Department is actively involved in the protection from tax evasion, avoidance, dodging, treaty shopping, illicit flows of capital, anti-money laundering, inter alia; ensuring that Liberia's tax base increases.
2) The Department is actively working with the World Bank Group to ensure the regulation of transfer pricing, the training of its auditors and other relevant staff in how to effectively combat transfer pricing abuses and manipulations, as well as the development of THIN Capitalization Rules which will stop aggressive interest spending by large entities via the deployment of their capital.
3) The Department is actively engaged with the OECD Global Forum on Transparency and Exchange of Information for Tax purposes to ensure that Liberia meets the last three triggers of Phase I of the Forum’s initiatives. The Department, through the Office of the Commissioner General, is on the verge

ANNUAL REPORT FY2014/2015 | LRA 10
of requesting a supplementary review of its Phase I program. This will ensure that Liberia continues the fight against money laundering, illicit capital flows, transfer pricing, etc.
4) The Department is in negotiation with the International Air Transport Association to ensure that Liberia collects its fair amount of tax revenue from the sales of airline tickets from source, i.e., from the clearing house in which all air transport operators accounts are cleared. This initiative is to improve the efficiency of billing and collection of taxes from the sales of tickets that is currently experiencing some revenue leakages as a result of sales of tickets via the internet and agencies outside Liberia.

ANNUAL REPORT FY2014/2015 | LRA 11
5. Customs Department
The mandate of the Customs Department is to administer and enforce all Customs laws of the Revenue Code of the Republic of Liberia and other laws relevant to the collection of lawful taxes and facilitation of legitimate trade. The structure of the department is as follows:
Figure 3: Customs Department Organogram
CU
ST
OM
S D
EP
AR
TM
EN
T
Policy and Technical Operations
Customs Ports Operations
Compliance and Enforcement
To effectively carry on its mandate in the face of the changing global trade environment, the Customs
Department embarked on several reform and modernization activities during the period under view. For the
period under consideration(FY2014/2015 July- June), the Department of Customs recorded US$ 177.8M as total
revenue collected against a projection of US$144.7M thereby resulting into a revenue over performance of
US$33M.
Regulatory Activities: The Department drafted nine (9) Administrative Regulations, including IPR and broker
licenses regulations, which were reviewed by customs administration, and submitted to Senior Management
and legal Department of the LRA for further review and approval. Furthermore, three (3) SOPs and five (5) MoUs
including LPRC, China Union, and APM Terminal were drafted and submitted to senior management and the legal
Department for review and comment. The Department, also in collaboration with Domestic Tax and other
Government agencies, signed a memorandum of understanding with Bea Mountain. The purposes of these
legal instruments are to institute tax measures that enhance lawful revenue collection. Nevertheless, only the
overtime administrative regulations was approved and put into effective over the period.
Dispute Settlement: The Department recorded and resolved 49 appeal and dispute cases filed by the business
community. Customs also issued a binding decision on tariff classification of goods over the period.
Bonded Goods: During period Jul- Dec, 2014 9,034 assorted products with total CIF values of US$27.02M were
bonded. This includes 8,233 bonded goods brought forward from the previous year and 801 products bonded
over the period. Out of the total bonded goods 5,555 assorted goods with corresponding CIF values of
US$11.78M were withdrew from the bonded warehouse. The balance carried forward to the current fiscal year

ANNUAL REPORT FY2014/2015 | LRA 12
totaled 3,479 with correspondent CIF values of US$15.81M. Meanwhile, the total duty paid for the withdrawal
of bonded goods for the period amounted to US$2.34M while exemption on bonded goods withdrawal
amounted to US$ 4.02M.
Transshipment: There were two (2) transshipments over the period with a total bond value of U$3,737.64 and
a bond fees of U$324.61, all were destined to Ghana.
Compliance & Enforcement Intervention: There were One Hundred and Six (106) Anti-Smuggling and
Intelligence interventions. The values of those interventions include U$264,897.12 and LD$ 10,650,000.
However, there was no case referred to legal for prosecution during the period.
Challenges: The Department continues to encounter constraints in the performance of its responsibilities.
These include but not limited to the lack of operational vehicles, inadequate manpower, lack of specialized
training and exposure of staff, lack of internet facility for many staff, etc.

ANNUAL REPORT FY2014/2015 | LRA 13
6. General Affairs
Four divisions within the LRA report directly to the Commissioner General, and comprise the general affairs
of the LRA. They are shown in the organogram below (Figure 4).
Figure 4: General Affairs Organogram
G
EN
ER
AL
AF
FA
IRS
Professional Ethics Division
Legal and Board Affairs Department
Policy, Statistics and Strategic Planning Division
Communications, Media and Public Relations Section
6.1 Professional Ethics Division
The Professional Ethics Division (PED) of the LRA has the mandate to investigate all allegations of employees’
misconduct through an unbiased and transparent investigative process. The Division’s mission is to safeguard
the integrity of the Authority to maintain public trust in the LRA. During FY2014/2015, PED performed the
following tasks:
1) Initiation of investigations on a total of 54 cases of employee misconduct. Of this total, 51 were
concluded and submitted to management for further action while three (3) cases are still pending
investigation. Consequently, management actions ranging from suspensions, warnings, clearances
and dismissals were meted out against
the reported employees.
2) The PED also collaborated with other
units within the LRA, including Anti-
Smuggling & Intelligence Unit (ASIU), in
developing legally actionable
intelligence-gathering plans and
participated in a number of successful
anti-smuggling operations with the
ASIU. Most of the cases resulted in tax-
related criminal prosecutions by LRA’s
Legal & Board Affairs Department in
conjunction with the local County
Prosecutors. Figure 5: The PED and ASIU, backed by law enforcers, nab an
alleged smuggler for bringing in 872 undeclared items

ANNUAL REPORT FY2014/2015 | LRA 14
6.2 Legal and Board Affairs Department
The Legal and Board Affairs Department is charged with representing the government in conjunction with the
Ministry of Justice (MOJ) in all revenue related matters – Civil and Criminal. It is also charged with representing
the LRA as a body corporate in all non-revenue related matters, such as those related to labor and contracts
for goods and services. Further, the Department has several educational functions, such as the publishing of
revenue procedures instructing taxpayers on the preparation of various returns and appeals, among other
things. This Department also assists with the drafting of regulations and new statutes, and amending existing
statutes. During FY2014/2015, the Legal Department rendered the following services:
1) Prosecution of ten criminal cases, six of which were completed with favorable results and the remaining
four are still ongoing.
2) Three labor cases were filed against the LRA and are still ongoing at the Ministry of Labor.
3) Litigation of five civil cases, of which three were completed with favorable results at the Supreme Court
of Liberia. In the first three and only appearances before the Supreme Court of Liberia, involving
adversaries such as a member of the judiciary, one of the largest multi-national enterprises in Liberia,
and one of the largest and most prestigious Liberian law-firms, the LRA legal team was unmatched in its
brilliant advocacy. Of the remaining two civil cases, one was won at the Civil Law Court and the ruling
is awaiting before the Tax Court for the other.
4) The Objections and Protests Panel of the Legal Department received five objections and protests from
taxpayers. The Panel heard the objections and was able to decide one and submitted the decision to the
Commissioner General (CG) for finalization. The Panel still has two objections and protests hearing
ongoing, one awaiting trial and one was withdrawn by the taxpayers after the first sitting.
5) Preparation of five regulations, fourteen legal opinions, ten memorandums of understanding, twenty-two
contracts, fourteen terms of reference for contractors, over a hundred correspondences, and conducted
two workshops.
The Department has influenced collection in domestic tax by examining international transactions intended to
avoid taxes and have been successful in the recoupment of over three million dollars – in customs and
domestic tax including real estate. This included our assistance in helping the Real Estate Tax Division to
collect over US$200,000 in two days. As the new fiscal year begins, we see our work increase four-fold or
more but expect the same excellent results.
6.3 Policy, Statistics and Strategic Planning Division
The Policy , Statistics and Strategic Planning Division (PSSPD) is responsible for coordinating donors’
technical and other assistance, advancing LRA’s domestic, regional and international partnerships, and
coordinating and leading the development of the organizational strategic vision and the concurrent
departmental business plans by articulating the Authority’s objectives and medium term outcomes. Other areas
of the Division’s mandate include conducting policy research, improving policy implementation by designing
appropriate administrative and other procedures, identifying and correcting any issues within the Liberia
Revenue Code (LRC), and conducting institutional capacity gap analysis and recommending pertinent capacity
enhancing initiatives. During FY2014/2015, the division’s key support to LRA’s institutional development lay in
the following areas:

ANNUAL REPORT FY2014/2015 | LRA 15
1) Drafting of the LRA 5-Year Corporate Strategic Plan (CSP) and the concurrent 2015/2016 Business
Plan and institutional work plans.
2) Design of the tax procedures for the Liberia Government to adopt the Millennium Challenge Compact
of US$256.7M.
3) Conducted revenue forecast in coordination with MFDP for FY/2015-2016 and as well as prudent
revenue risk profile for the FY2014/2015 budget which adequately informed revenue collection and
over-performance.
4) Conducted learning missions with
institutional counterparts in
Zimbabwe and Kenya. Lessons
from these countries have
contributed towards improvement
in defining the overall strategic and
operational direction of the
Authority.
5) Coordinated domestic partnership
with donors and development
partners including the UNDP,
USAID, OECD, AfDB, IFC and
others. The Division also initiated
international partnerships by
requesting the signing of MoUs
Figure 6: DCGTA (LRA) Ms. Decontee King-Sackie and ZIMRA Commissioner General Mr Gershem T Pasi, flanked by team members in Harare, Zimbabwe
(May, 2015)
with Kenya Revenue Authority (KRA), Zimbabwe Revenue Authority (ZIMRA), Her Majestic Revenue
and Customs (HRMC). The Division also participated in regional conferences and knowledge-sharing
through the African Tax Administration Forum (ATAF) and the Addis Tax Initiative.
6) Drafted tax proposals for generation of additional revenue from Customs User Fees (CUF), Surtax on
outbound GSM calls, alcoholic beverages, fisheries, etc.
7) Drafted the First Quaterly Revenue Outturn.
To strengthen its operational effectiveness, the division’s statistics and revenue forecasting capacity still
requires capacity improvement, which is a priority for the upcoming fiscal year.
6.4 Communications, Media and Public Affairs Section
The Communications, Media and Public Affairs (CMPA) Section of the Liberia Revenue Authority (LRA) is
responsible for disseminating factual, clear and accurate information about the LRA to the public through
media engagements. The section also regularly disseminates educational information on tax
education/collection and taxpayer responsibilities, to units, divisions and sections within the LRA. During
FY2014/2015, the Section continued building strong relations with the Liberian media through timely and
professional information dissemination, responded to queries from the media and the public, countered
misinformation and disinformation regarding the LRA, and issued press releases on LRA activities. The
section’s major achievements in FY2014/2015 lay in the following areas:
1) Developed an overarching Communications, Media and Outreach strategy.
2) Built a strong media partnership including an emergency media response team.

ANNUAL REPORT FY2014/2015 | LRA 16
3) Drafted and issued upon approval 30
press releases.
4) Published and broadcasted 45 public
service announcements, alerts and
government notices authorized by
various LRA units and sections, on at
least 30 urban and rural radio stations
across the country.
5) Expanded coverage on the LRA from
three newspapers to at least 16,
including all major newspapers.
6) Facilitated more than 15 radio talk
shows on various issues, of which 12
Figure 7: Commissioner General Elfrieda Tamba addresses the press in
June 2015
were in Monrovia and 3 were in Bong and Nimba Counties.
7) Established a partnership with the Blind School of Liberia to translate the Liberia Revenue Code into
braille as part of its taxpayers’ education campaign.
8) Strengthened internal communication processes for staff to be able to clearly articulate LRA activities to
the public. The Section ensured that each section, unit and division got a mini bulletin for internal
information dissemination.
9) Facilitated mass media coverage on 10 major events including two LRA press conferences, distribution
of vehicles, USAID donation, PED graduation, and three enforcement and seizure exercises, among
others.
10) Established an effective media monitoring mechanism of print, broadcast and social media, with weekly
reports produced and circulated to Senior Management.

ANNUAL REPORT FY2014/2015 | LRA 17
TE
CH
NIC
AL
AF
FA
IRS
7. Technical Affairs
The technical affairs of the LRA are overseen by the Deputy Commissioner General of Technical Affairs
(DCGTA). Six divisions comprise LRA’s technical affairs, as seen in the organogram below (Figure 8).
Figure 8: Technical Affairs Organogram
Enterprise Risk management and Compliance Division (ERMCD)
Enterprise Design, Quality Assurance and Result Division (EDQARD)
Management Information Systems Division (MISD)
Taxpayer Services Division
National Revenue Accounting and Reconciliation Section (NRARS)
Office of Professional Responsibility Section
7.1 Enterprise Risk Management and Compliance Division
The Enterprise Risk Management and Compliance Division (ERMCD) conducts compliance evaluations of the
LRA’s operating systems and activities to ensure that business operations are aligned with internal controls,
policies and procedures as well as applicable laws and regulations. The Division also works to prevent and/or
detect misconduct, fraud, waste, and abuse within the LRA. The ERMCD aims to establish control and oversight
to continuously monitor and improve the organization’s risk management processes in a changing
environment.
During the FY2014/2015, the Division performed the following activities:
1) SWOT analysis to identify the strengths (S), weaknesses (W), opportunities (O) and threats (T) of the
Division to enable the reengineering of businesses processes.
2) Formulation of ERMCD’s work plan to guide activities and prioritized the allocation of resources toward
high risk areas and
3) Commencement of enterprise risk assessment of all stakeholders within the LRA. The process
involved identification, assessment, mitigation and continued monitoring of existing and emerging risks
that could affect the attainment of the LRA’s objectives. All identified risks were placed into LRA’s risk
registry along with mitigation measures as well as responsible parties for implementation.
4) Drafting of LRA’s Risk Management Framework to guide the risk management activities with respect
to all taxpayers and business enterprises.
5) Compliance review for Customs and Tax audit processes covering ASYCUDA Selectivity & rerouting
processes (to ensure that importers are targeted based on Risk Management ASYCUDA selectivity
criteria). This exercise aimed to ascertain the full adherence to the regulatory framework and required
standards of audits.

ANNUAL REPORT FY2014/2015 | LRA 18
7.2 Enterprise Design, Quality Assurance and Results Division
During FY2014/2015, the Enterprise Design, Quality Assurance and Results Division (EDQARD) performed the
following tasks:
1) Review and improvement of the standard operating procedures (SOPs) for the Customs Department,
DTD, EDQARD, and Taxpayer Services Division (TPSD).
2) Development of two SOPs for Revenue Receipts management at banks and Revenue Receipts
management in the LRA business offices.
3) Development of job profile for the National Revenue Accounting Reconciliation Section (NRARS).
4) An Annual business plan for the whole institution was developed and implemented to achieve the
main goals of the LRA.
5) As part of the implementation process, field engagement exercises were conducted in the Department
of Customs with fifty six business process identified within twenty four Sections and Units.
7.3 Management Information Services (MIS) Division
The Management Information System (MIS) Division typically leads Information Technology (IT) back-office
operations, network administration, systems program development and acquisition efforts. MIS Division also
provides expertise in choosing and operating technology solutions for the Authority’s lines of business such
as Customs and Domestic Tax administration, Finance & Human resource management, and other enterprise-
wide activities such as security and business continuity planning. During the period under review, the MIS
Division performed the following tasks:
1) The upkeep and maintenance of the LRA’s IT systems and equipment, i.e., ASYCUDA and SIGTAS
used to collect and account for National
Revenue.
2) Design and launch of LRA’s website.
3) Training for users of the available
automated systems of the LRA.
Important priorities remain for the MISD to focus
on in ensuing years. They include:
1) Institutionalization of fully automated
MIS, including a management dashboard
and automated reporting for better
decision making by senior management.
2) Institutionalization of fully automated
HRM system
Figure 9: Screenshot of LRA's website on 28 Dec, 2015
(www.lra.gov.lr)
Through extended collaboration with external partners, such as Adam Smith International and USAID, the
MISD of the LRA is confident of making significant gains in these areas in the upcoming fiscal years.

ANNUAL REPORT FY2014/2015 | LRA 19
7.4 National Revenue Accounting and Reconciliation Section
The National Revenue Accounting and Reporting Section (NRARS) of the LRA is responsible for the provision
of proper revenue accounting services, accountability and protection of the National Revenue and revenue
instruments in accordance to international accounting standards. With this objective, during FY2014/2015,
NRARS successfully reconciled accounts, an exercise that resulted in fines being levied on certain commercial
banks for the failure of timely provision of GOL revenues to the Central Bank of Liberia. The Banks have
subsequently deposited the fines and levies into the General Revenue accounts at Central Bank of Liberia.
7.5 Taxpayer Services Division
The Taxpayer Services Division (TPSD) has the important responsibilities of providing information regularly
to all taxpayers, and that of responding in a timely manner to those seeking specific information from the LRA.
Additional responsibilities of the Division include the effective management of the risk of taxpayer non-
compliance and increasing the levels of voluntary compliance through taxpayer education. To effectively
execute its goals, TPSD operates two sections that support the activities of the Domestic Tax and Customs
Departments nationwide. They are:
1) Registration, Returns Processing and Bank Services Section
2) Inquiries, Complaints and Taxpayer Education Section
The two sections of the TPSD provide a menu of modern services which include quick service registrations,
returns processing, tax payments, targeted tax clinics, community registrations, awareness programs and
remote customer support via call/chat. These services are can be accessed by taxpayers across the country at
various points of service such as: one-stop-shop service centers, stand-alone service windows within
government ministries/agencies or satellite service offices in areas with high commercial trade.
During FY2014/2015, to ensure that potential taxpayers have the information they need to voluntarily comply
with the Liberia Revenue Code TPSD performed the following tasks:

ANNUAL REPORT FY2014/2015 | LRA 20
1) Awareness activities both on-site and off-site,
as well as collaborating with relevant
departments within the LRA for improvement of
revenue collection.
2) Distribution of Domestic Tax and Customs
forms, brochures, posters, flyers to clients,
and commissioning educational messages on
billboards at strategic locations.
3) For the same period, the LRA launched its new
website which is managed and populated by
this section.
Figure 10: Tax Clinic for Businesses held on September 25, 2015
in the Large Tax Division at the LRA Headquarters
7.6 Office of Professional Responsibility Section
The Office of Professional Responsibility Section (OPRS) has been newly created to deal specifically with
issues relative to tax practitioners and customs brokers. The section ensures that LRA’s policies relating to
external tax practitioners’ and customs brokers’ operations are upheld. During FY2014/2015, OPRS provided
the following services:
1) Assistance in resolving the leadership crisis within the National Customs Brokers Association of Liberia
through a number of meetings which culminated into the election of a new code of officers.
2) Commencement of engagements with the Liberia Institute of Tax Practitioners (LITP) to ensure the
review of the draft Act establishing the LITP.
3) Proper mechanisms are being put in place to govern the process of licensing customs brokers and tax
practitioners next year.
4) Drafting of regulatory instruments governing the licensing requirements for customs brokers and tax
practitioners.
5) Review of external stakeholders’ applications for ASYCUDA access, as a result of which 78 entities were
recommended for public access and 89 for private access.

ANNUAL REPORT FY2014/2015 | LRA 21
8. Administrative Affairs
The Administrative affairs of the LRA are overseen by the Deputy Commissioner General of Administrative
Affairs (DCGAA). Four divisions comprise the administrative affairs, as shown in the organogram below (Figure
11):
Figure 11: Administrative Affairs Organogram
AD
MIN
IST
RA
TIV
E A
FF
AIR
S
Budget and Finance Division
General Services Department
Human Resources Management Division
Security Management Section
8.1 Budget and Finance Division
The objective of the Budget and Finance Division is to create and monitor the overall budget of LRA through
strategic budgeting – requiring research on meeting revenue levels based on demand forecasting, cost
containment, cash flow management, procurement servicing, tax management planning and accurate record
keeping. During the inaugural year under this mandate, the Division proud to inform the public that it was
successful in a number of its endeavors, including:
1) The overall operationalization of the LRA through comprehensive financial management.
2) The transfer of 70% of LRA’s staff from the Department of Revenue at the MFDP to the LRA, to whom
outstanding salaries as well as motivational pay increases were paid.
3) The garnering of extra cash flows to the Government of Liberia Consolidated Account.
4) The institution of strong internal controls which closed domestic resource mobilization leakages,
resulting in the institution’s revenue over-performance despite the Ebola epidemic.
5) The substantial completion of partitioning work at the LRA Headquarters.
For the Fiscal Year 2014/15, the Ministry of Finance and Development Planning (MFDP) allotted and disbursed
the amount of US$13.1M and this amount represents 100% of the total LRA budget. Table 2 (below) details how
the overall budget was utilized across various expenditure categories in FY2014/2015.

ANNUAL REPORT FY2014/2015 | LRA 22
Table 1: LRA Budget Breakdown by Expenditure Categories*
Expenditure Category
Amount (US$)
% of Total
Employee Overhead Costs 8,632,178 65.85 Use of Goods & Services 3,771,739 28.77 Consumption of Fixed Capital 204,100 1.56 Special Projects 500,000 3.81 TOTAL 13,108,017 100.00
*Detailed in of pages 64 and 65
As a prospectus for the coming year, the Budget and Finance Division hopes to receive increased funding for
its priority projects, including the completed partitioning of its offices at the LRA Headquarters, and the
upgradation of the ICT infrastructure.
8.2 General Services Department
The General Services Department is charged with the responsibility to provide the requisite logistical support
to all departments, divisions, units and sections within the Authority. The General Services Department is
comprised of the Transport Management Unit, the Procurement Unit and the Logistics Management Unit.
Together, they ensure the smooth logistical functioning of the LRA. Separately, these are the results of their
work during the year in review:
8.2.1 Procurement Unit
The Procurement Unit is responsible for the systematic acquiring of all goods and services needed for the LRA
to remain sustainable, while adding value by saving time and money. During the period under review, the unit
was actively engaged in the efficient distribution of supplies upon approval. The unit endeavored and
successfully set up a management and reporting system for all Customs Business and Tax Business Offices
and other Administrative units. It also established re-ordering levels through a prepared stock utilization report
in order to identify various units’ buffer stock levels. The major accomplishments of the Procurement Unit in
FY2014/2015 include:
1) Completion of the procurement of several workshop activities – including catering services.
2) Procurement of the servicing of all LRA vehicles.
3) Procurement for the construction of shelves and window blinds for various offices.
4) Procurement of NCB Bids for fuel, office stationery, cleaning materials and travel services.
5) Preparation of LRA’s SOP for the Procurement Section.
6) Collaboration with Ministry of Transport to receive 20,700 new license plates in two installments from
the vendor Union Strong for the license registration exercise.
7) Reception from vendor Dellarue (U.K.) and subsequent distribution of 350,000 sets of revenue
Instruments / receipts i.e. 250,000 sets of USD as well as 100,000 sets of LD bearing the logo of the
LRA.
8) Reception and distribution of ICT equipment and furniture from donor partners
Challenges to the operations of the Unit in FY2014/2015 have included:

ANNUAL REPORT FY2014/2015 | LRA 23
1) The provision of appropriate office facilities for the staff of the Procurement Section.
2) Acquisition of more procurement staff commensurate with the volume of work.
3) Finding and qualifying the suppliers, and negotiating with suppliers until product/service delivery
8.2.2 Transport Management Unit
During the year in review the section was successful in a number of mandated ventures, including:
1) A total of 52 vehicles were transferred to the Authority from the erstwhile Department of Revenue and
were reassigned to sections of the
LRA.
2) Deployment and consolidation of a
transport system to meet the
immediate needs of LRA personnel
and guests.
3) Additional vehicles to meet the
transport needs of the Authority were
purchased, based on LRA’s updated
and approved 2014/2015
Procurement Plan.
4) Training of drivers on LRA driving
policy and regulations was
conducted.
Figure 12: Modern Vault in LRA HQ
5) Development of a fleet management policy and maintenance schedule to ensure the security of the
assets.
6) Identification of immediate and future transport needs.
The coming year’s agenda for the unit envisions continued progress in ferrying LRA staff with the acquisition
of additional vehicles as necessary, the upgrade of the pool of vehicles available at the LRA, and the
introduction of transport workshops to educate the Transport Unit staff.
8.2.3 Facilities Management Unit
The Facilities Management unit is charged with the effective management of all LRA owned or leased
properties, thus ensuring a clean and conducive environment for staff and customers alike. In FY2014/2015,
the section managed various projects with the purpose of modernizing the Authority’s HQ and Business
Offices. These projects included:
1) Partitioning and civil works to modify the LRA HQ.
2) Construction of a modern vault to house Revenue instruments.
3) Acquisition of furniture for the Freeport of Monrovia, Bo-Waterside, Robertsports and other
Business offices.
4) Installation of modern sign boards at the Roberts International Airport, LPRC and other Business
Offices.
5) Installation of LEC CT meter (transformer) at the LRA HQ to ensure constant power supply.

ANNUAL REPORT FY2014/2015 | LRA 24
In the upcoming fiscal year, there are plans underway to modernize other Business offices, in accordance with
our Corporate Strategic Plan (CSP).
8.3 Human Resource Management Division
The Human Resource Management (HRM) Division is principally responsible for employment and personnel
well-being within the LRA. During the first year of operations, the HR Division had the herculean task of
transitioning the transferred staff to the Authority in accordance with Section 36 of the LRA’s Act and recruiting
the capacities needed to fulfill the Authority’s mandate. The following services were rendered in FY2014/2015:
1) 822 staff were initially transferred to the LRA by the Civil Service Agency to be placed in various
departments, divisions, sections and units. To end the HR division efficiently liaised with the Liberia
Institute of Public Administration for the vetting of the rollover staff. Staff placement on payroll at their
approved pay grade and positions began in May 2015; approximately 82% has been completed.
2) Implementation of an aggressive recruitment strategy to attract additional professional services.
However, the recruitment exercise was halted due to the EVD outbreak.
3) Development and implementation of the approved Human Resource Management Policy (HRMP) and
the Professional Ethics and Code of Conduct.
4) To sustain a trained, healthy and productive workforce, the HRM Division conducted Training of
Trainers (TOT) workshop through a remote consultant that produced 19 trained employees. Following
the TOT, 35 local supervisors were trained in 3 separate trainings in June 2015. Overall, 57 staff
received capacities through local training programs while 14 received foreign training.
5) Development of strategy for capacity retention to motivate hardworking employees and cater to their
financial wellbeing.
8.5 Security Management Section
The Security Management Section (SMS) is tasked with ensuring that the assets and staff of the LRA are kept
safe with minimum obstructions in the performance of their respective functions while on the premises of the
LRA.
The primary functions of the SMS completed during the year under review were:
1) The completion of the deployment of the SEGAL Security on all floors of the LRA Headquarters.
2) The Implementation of the Access Pass Policy for all customers and employees of the LRA.
3) The completion of seven (7) cases under investigation and forwarding of the case conclusions to
LRA management.
4) The completion of the LRA Security Management Section work plan.
5) The completion of the Post Order Standard Operation Procedures (SOP) pending adoption.

ANNUAL REPORT FY2014/2015 | LRA 25
9. Internal Audit Department
The Internal Audit Department (IAD) conducted audits and reviews of the operating units and processes of the
LRA. During FY2014/2015 the IAD ascertained the extent to which the LRA administered and complied with the
Liberia Revenue Code, standard operating procedures, policies and contracts, and evaluated the effectiveness
of the governance, risk management and controls throughout the LRA. Audits and reviews were performed in
accordance with the approved risk-based operational plan that covered the period from July 1, 2014 to June
30, 2015.
IAD conducted an entity-wide risk assessment of the institution to identify high risk areas and activities for
purposes of developing a risk-based plan. Key areas covered in the FY2014/2015 audits and reviews included
various divisions and sections of the LRA (Real Estate, Human Resource Management, Enterprise Risk
Management & Compliance, Procurement and National Revenue Accounting & Reporting), the Customs
Business Offices at Roberts International Airport, the Liberia Petroleum Refinery Company, the Freeport of
Monrovia, the Rural Customs and Tax Business offices and the Urban Tax Business Offices.
Based on the audits and reviews IAD identified major control, governance and risk management issues and
provided corrective actions. In addition, IAD prepared an action plan matrix of corrective actions, following up
with responsible parties and validated the implementation of each corrective action.
Among the corrective actions, the following were highlights of the reporting period:
Development and maintenance of a comprehensive asset register;
Segregation of duties and responsibilities in Budget & Finance and creation of the committee for
budget and finance;
Creation of compliance checklist for real property taxation;
Proper documentation and records of the management system in all operating units;
Periodic staff evaluation program;
Development, approval and operationalization of standard operating procedures;
Development of a policy on the use of ICT equipment and information of the LRA;
Creation of compliance risk management functions,
Direct verification of BIVAC’s reports with physical shipments.
These corrective actions, among others, have helped improved the effectiveness of governance, risk
management and controls throughout the LRA.
ANNUAL REPORT FY2014/2015 | LRA 26
Tho
usan
d of
US
D
635,
236
643,
467
417,
238
437,
179
217,
998
206,
288
10. Revenue Performance
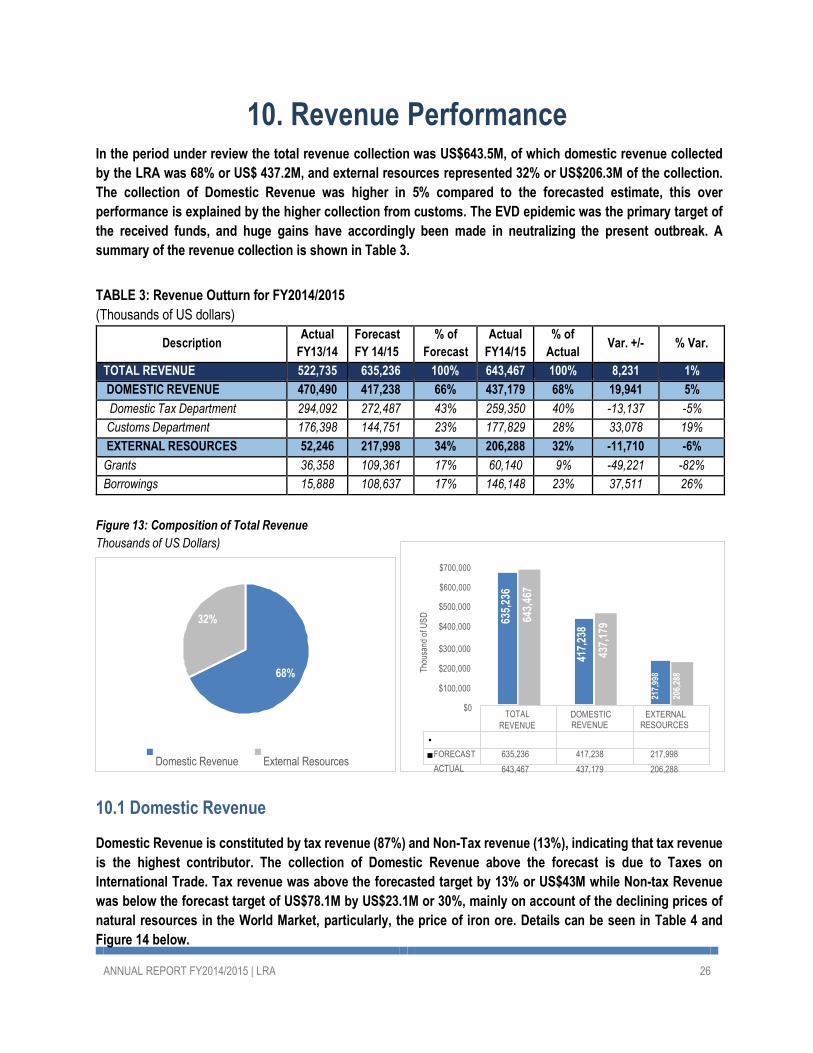
In the period under review the total revenue collection was US$643.5M, of which domestic revenue collected
by the LRA was 68% or US$ 437.2M, and external resources represented 32% or US$206.3M of the collection.
The collection of Domestic Revenue was higher in 5% compared to the forecasted estimate, this over
performance is explained by the higher collection from customs. The EVD epidemic was the primary target of
the received funds, and huge gains have accordingly been made in neutralizing the present outbreak. A
summary of the revenue collection is shown in Table 3.
TABLE 3: Revenue Outturn for FY2014/2015
(Thousands of US dollars)
Description Actual
FY13/14 Forecast
FY 14/15 % of
Forecast Actual
FY14/15 % of
Actual
Var. +/-
% Var.
TOTAL REVENUE 522,735 635,236 100% 643,467 100% 8,231 1%
DOMESTIC REVENUE 470,490 417,238 66% 437,179 68% 19,941 5%
Domestic Tax Department 294,092 272,487 43% 259,350 40% -13,137 -5%
Customs Department 176,398 144,751 23% 177,829 28% 33,078 19%
EXTERNAL RESOURCES 52,246 217,998 34% 206,288 32% -11,710 -6%
Grants 36,358 109,361 17% 60,140 9% -49,221 -82%
Borrowings 15,888 108,637 17% 146,148 23% 37,511 26%
Figure 13: Composition of Total Revenue
Thousands of US Dollars)
$700,000
$600,000
32%
$500,000
$400,000
68%
$300,000
$200,000
$100,000
$0 TOTAL
REVENUE
DOMESTIC REVENUE
EXTERNAL
RESOURCES
Domestic Revenue External Resources FORECAST 635,236 417,238 217,998
ACTUAL 643,467 437,179 206,288
10.1 Domestic Revenue
Domestic Revenue is constituted by tax revenue (87%) and Non-Tax revenue (13%), indicating that tax revenue
is the highest contributor. The collection of Domestic Revenue above the forecast is due to Taxes on
International Trade. Tax revenue was above the forecasted target by 13% or US$43M while Non-tax Revenue
was below the forecast target of US$78.1M by US$23.1M or 30%, mainly on account of the declining prices of
natural resources in the World Market, particularly, the price of iron ore. Details can be seen in Table 4 and
Figure 14 below.

ANNUAL REPORT FY2014/2015 | LRA 27
The high performance of tax categories under ‘Domestic Revenue’ can be explained by multiple factors,
including:
1) The constructive engagement between taxpayers and LRA staff.
2) Mutually supportive collaborative engagements between revenue generating agencies of the
government.
3) Comprehensive taxpayers’ education drive initiated by the LRA.
4) Strategy and enforcement methods and lessons learned with focuses on tax compliance.
5) Taxpayer services targeting businesses and individuals were prioritized.
Table 4: Domestic Revenue - Key Contributing Tax Lines (Thousands of US Dollars)
Description Forecast
FY 14/15 % of
Forecast Actual
FY14/15 % of
Actual
Var +/-
% Var
DOMESTIC REVENUE 417,238 100% 437,179 100% 19,941 5%
TAX REVENUE 339,170 81% 382,218 87% 43,048 13%
Taxes on Income and Profits 149,075 36% 147,161 34% (1,914) -1%
Personal Income Tax (PIT) 107,059 26% 115,338 26% 8,279 8%
Corporate Income Tax (CIT) 38,365 9% 29,473 7% (8,892) -23%
Other Income Taxes 3,652 1% 2,351 1% (1,301) -36%
Taxes on Property 5,384 1% 4,360 1% (1,024) -19%
Taxes on Goods and Services 45,423 11% 50,192 11% 4,768 10%
Taxes on International Trade 126,577 30% 167,754 38% 41,177 33%
Other Taxes 12,711 3% 12,752 3% 41 0%
NON-TAX REVENUE 78,068 19% 54,961 13% (23,107) -30%
Property Income 69,208 17% 39,933 9% (29,276) -42%
Administrative Fees (Sector
Ministries) 7,119 2% 11,389 3% 4,270 60%
Fines, Penalties and Forfeits 1,655 0% 3,472 1% 1,817 110%
Miscellaneous and
Unidentified Revenue 86 0% 168 0% 82 96%

ANNUAL REPORT FY2014/2015 | LRA 28
$300,000
$250,000
$200,000
$150,000
$100,000
177,829
144,751
259,350
272,487
Th
ou
san
d o
f U
SD
Figure 14: Composition of Domestic Revenue by Department
Thousands of US Dollars
41%
59%
$50,000
$0
Domestic
Tax Department
Customs Department
Domestic Tax Department
Customs Department
FORECAST 272,487 144,751
ACTUAL 259,350 177,829
10.1.1 Domestic Tax Revenue
The crucial responsibility of collecting domestic revenue is shared by two core operational arms within the
LRA, the Domestic Tax Department (DTD) and the Customs Department.
The DTD is charged with domestic tax administration and has the basic objective to increase and coordinate
control over all categories of taxpayers, and to improve taxpayers’ compliance, and thereby to increase
revenue. The Department has six operational areas: Large Tax Division, Micro, Small and Medium Tax Division,
Real Estate Tax Division, Natural Resource Tax Unit, Tax Business Offices Section, and Sector Ministries
Section. Together, these operational areas ensure the collection of domestic tax revenue due to the
Government.
The Domestic Tax Department collected US$259.4 million in FY2014/2015, or 59.3% of total Domestic Revenue,
with a negative variance of US$13.1 million compared to the forecast, while the Customs Department
contributed US$177.8 million, or 40.7% of total Domestic Revenue – recording an over performance of over
US$33.1 million. The combined performance of both Departments showed a variance of US$19.9 million over
the budget forecast.
Taxes on Income & Profits
Total actual collections of Taxes on Income and Profits for FY2014/2015 was US$147.2M, against the forecast
of US$149.1M, resulting in an underperformance of US$1.9M. This underperformance was due largely to the
downturn of business activities in the wake of the Ebola Virus Disease (EVD) epidemic. Moreover, the EVD
epidemic had ramifications that affected all sectors of the Liberian economy. For instance, most Liberians and
non-Liberian residents were not at work due to the Government’s call for only “essential workers” to report to
work, resulting in reduced taxable incomes. The slowdown also affected the inflow of “Direct Investments” –
where the Liberian economy saw a pronounced departure of investors and a fall in new direct investments.
The PIT performance was 8% or US$1.9M higher than the forecast, the tax line that performed higher than the
expected target was the withholding taxes from residents, also the collection from nonresidents was higher

ANNUAL REPORT FY2014/2015 | LRA 29
than the forecast by 30% or US$3.9M. CIT and Other Income Taxes performed below forecast due to the
difficult economic situation in the country.
Table 5: Taxes on Income and Profits
(Thousands of US Dollars)
Description Forecast
FY 14/15 % of
Forecast Actual
FY14/15 % of
Actual
Var +/-
% Var
TAXES ON INCOME AND PROFITS 149,075 100% 147,161 100% (1,914) -1%
PERSONAL INCOME TAX (PIT) 107,059 72% 115,338 78% 8,279 8%
Taxes on Residents 134,379 90% 129,294 88% (5,085) -4%
PIT Section 200A (Residents) 388 0% 70 0% (318) -82%
Withholding Taxes (Residents) 93,608 63% 98,306 67% 4,698 5%
Taxes on Non-Residents 13,063 9% 16,962 12% 3,899 30%
CORPORATE INCOME TAX (CIT) 38,365 26% 29,473 20% (8,892) -23%
OTHER INCOME TAXES 3,652 2% 2,351 2% (1,301) -36%
Presumptive Section 200C (Small Tax) 2,019 1% 1,445 1% (573) -28%
GSM annual gross margin tax 1,633 1% 905 1% (728) -45%
Taxes on Property
Taxes on Property were US$1.0M below the forecast of US$5.4M. Although the general circumstances were
similar to Taxes on Income and Profits, this underperformance was particularly due to lower revenues from
departed businesses; and whereas the re-focusing of efforts in the real estate sector was still premature, the
flow of income from this sector was still in process. The projected income from real estate had not yet borne
dividends.
Taxes on Goods & Services
At the time of this report, Liberia has not yet acceded to the Common External Tariff (CET) of ECOWAS. Taxes
on Goods and Services performed above the forecast of US$45.4M by US$4.8M. It is expected that this tax line
will yield higher revenues after the transition to the CET, with all other economic conditions remaining the
same.
Taxes on International Trade
The best performing line in the tax revenue sub-group was Taxes on International Trade, where the actual
revenue collected was US$167.8M. This was US$41.2M above the forecast figure of US$126.6M. The
performance in this tax sector was due largely to improved administrative vigilance and streamlined activities
in collection. The two lines under Taxes on International trade that resulted in the overall positive performance
were:
1) Taxes on Imports, where US$93.3M was collected against an approved Budget forecast of US$67.2M
; and
2) Other Custom Charges were US$64.1M actually collected against an approved Budget forecast value
of US$52.2M.
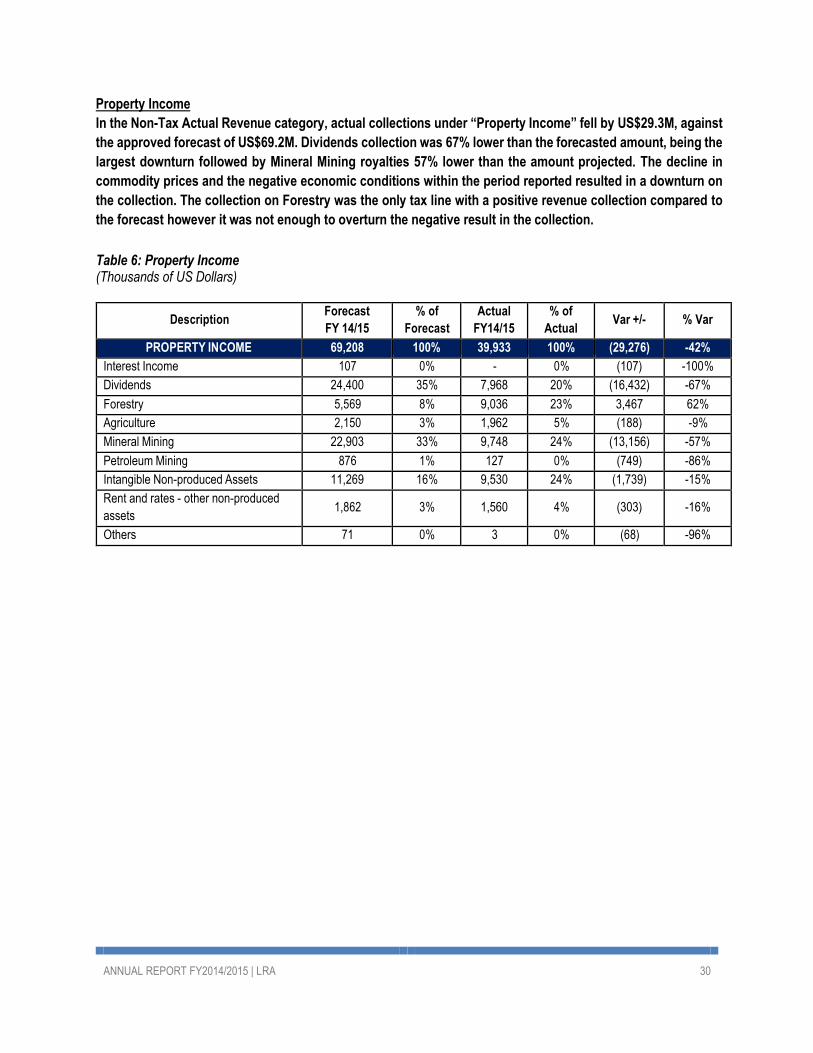
ANNUAL REPORT FY2014/2015 | LRA 30
Property Income
In the Non-Tax Actual Revenue category, actual collections under “Property Income” fell by US$29.3M, against
the approved forecast of US$69.2M. Dividends collection was 67% lower than the forecasted amount, being the
largest downturn followed by Mineral Mining royalties 57% lower than the amount projected. The decline in
commodity prices and the negative economic conditions within the period reported resulted in a downturn on
the collection. The collection on Forestry was the only tax line with a positive revenue collection compared to
the forecast however it was not enough to overturn the negative result in the collection.
Table 6: Property Income (Thousands of US Dollars)
Description Forecast
FY 14/15 % of
Forecast Actual
FY14/15 % of
Actual
Var +/-
% Var
PROPERTY INCOME 69,208 100% 39,933 100% (29,276) -42%
Interest Income 107 0% - 0% (107) -100%
Dividends 24,400 35% 7,968 20% (16,432) -67%
Forestry 5,569 8% 9,036 23% 3,467 62%
Agriculture 2,150 3% 1,962 5% (188) -9%
Mineral Mining 22,903 33% 9,748 24% (13,156) -57%
Petroleum Mining 876 1% 127 0% (749) -86%
Intangible Non-produced Assets 11,269 16% 9,530 24% (1,739) -15%
Rent and rates - other non-produced
assets
1,862
3%
1,560
4%
(303)
-16%
Others 71 0% 3 0% (68) -96%

ANNUAL REPORT FY2014/2015 | LRA 31
Administrative Fees
Revenue from Administrative Fees was US$11.4M against a forecast of US$7.1M. This positive result was due
to the enforcement of collection and remittances (into the GoL account) of withholdings of fees paid to agencies
of the Government.
Table 7: Sector Ministries Revenue (Administrative Fees) (Thousands of US Dollars)
Description Forecast
FY 14/15 % of
Forecast Actual
FY14/15 % of
Actual
Var +/-
% Var
Sector Ministries & Agencies’ Fees 7,119 100% 11,389 100% 4,270 60%
Agriculture Ministry 339 5% 198 2% (142) -42%
Bureau Of Immigration & Naturalization 1,518 21% 2,538 22% 1,020 67%
Center For National Documents And Records 114 2% 242 2% 128 112%
Commerce Ministry 2 0% 200 2% 198 11670%
Education Ministry 0 0% 5 0% 5 1969%
Foreign Affairs Ministry 1,777 25% 1,114 10% (664) -37%
Forestry Development Authority 46 1% 48 0% 2 5%
Health And Social Welfare Ministry 23 0% 166 1% 143 615%
Industrial Property Office 12 0% 21 0% 9 80%
Information Ministry 7 0% 39 0% 32 432%
Internal Affairs Ministry 47 1% 75 1% 27 58%
Justice Ministry 49 1% 59 1% 10 22%
Labor Ministry 1,762 25% 4,428 39% 2,666 151%
Lands, Mines And Energy Ministry 87 1% 126 1% 39 45%
Liberia Copyright Office 0 0% 0 0% (0) -25%
Liberia National Police 26 0% 27 0% 1 4%
Liberian Business Registry 808 11% 1,405 12% 597 74%
National Fire Service 30 0% 34 0% 3 11%
Other Ministries And Agencies 13 0% 4 0% (8) -64%
Post And Telecommunications Ministry 26 0% 53 0% 27 101%
Public Works Ministry 140 2% 403 4% 263 188%
Temple Of Justice 30 0% 22 0% (9) -28%
Transport Ministry 259 4% 182 2% (77) -30%
Youth And Sports Ministry 2 0% 0 0% (2) -99%
Fines, Penalties and Forfeits
Under this tax line the enforcement activities resulted in a positive collection above the forecast by US$1.8M
being the actual collection US$3.5M.

ANNUAL REPORT FY2014/2015 | LRA 32
Revenue from Operational Divisions
The operational divisions within the Domestic Tax Department are the Large Tax Division (LTD), Micro, Small
and Medium Tax Division (MSMTD), Real Estate Tax Division (RETD), Sector Ministries Section (SMS) and
Collectorates tax sections (CTS).The revenue collected by these operational divisions is sourced from
Montserrado County, as well as from the major Concessions companies operating in the other counties, which
pay their taxes in Monrovia. Other revenues from the remaining counties (i.e. excluding taxes paid by major
concession companies) are collected by DTD’s rural outposts and the Tax Business Offices (TBOs).
For the period under review, the two operational divisions which drove the above-target performance were
CTS and SMS:
1. Collectorate Tax Section (CTS) registered a positive variance of US$679K (70%) over its target, and
contributed 1% of DTD’s actual revenue collections.
2. Sector Ministries Section (SMS) registered a positive variance of US$6.5M (45%) over its target, and
contributed 8% of DTD’s actual revenue collections.
Table 8: Sections Contributions (Thousands of US Dollars)
Section Forecast FY14/15 % of Forecast Actual FY14/15 % of Actual Var +/- % Var LTD 190,683 70% 188,933 73% -1,750 -1%
MSMTD 61,546 23% 43,255 17% -18,292 -30%
CTS 976 0.4% 1,656 1% 679 70%
RETD 4,836 2% 4,546 2% -289 -6%
SMS 14,445 5% 20,960 8% 6,515 45%
TOTAL 272,487 100% 259,350 100% -13,137 -5%
TBOs 2,677 3,220 543 20%

ANNUAL REPORT FY2014/2015 | LRA 33
Revenue by Tax Business Offices (TBOs)
Revenues from counties other than Montserrado County are collected by 19 strategically located Tax Business
Offices (TBOs). In total, the TBOs collected US$2.6M, which exceeded their collective target by 20% or
US$543K. The detailed contribution of different Tax Business Offices (TBOs) to DTD’s revenue intake in
FY2014/2015 is shown in Table 9.
As seen in the table, the five TBOs that contributed the highest revenues in the period under review are as
follows:
1. Harper TBO contributed US$932K, or 29% of the amount contributed by all TBOs.
2. Buchanan TBO contributed US$623K, or 19% of the amount contributed by all TBOs.
3. Marshall TBO contributed US$520K, or 16% of the amount contributed by all TBOs.
4. Gbamga TBO contributed US$200K, or 6% of the amount contributed by all TBOs.
5. Cape Mount TBO contributed US$159K, or 5% of the amount contributed by all TBOs.
Table 9: Contribution by Tax Business Offices (TBOs) (Thousands of US Dollars)
TBO
Actual FY14/15 % of
Actual Forecast
FY14/15 % of
forecast
Var +/-
% Var
Buchanan/Rivercess 623 19% 401 15% 222 55%
Harper 932 29% 522 20% 409 78%
Zwedru 69 2% 176 7% -107 -61%
Webbo 22 1% 28 1% -6 -20%
Greenville/Juarzon 8 0.2% 25 1% -17 -69%
Tappita 8 0.2% 22 1% -14 -65%
Grand Kru 10 0.3% 14 1% -4 -27% Ganta 131 4% 208 8% -77 -37%
Sanniquellie 146 5% 181 7% -36 -20%
Gbarnga 200 6% 242 9% -42 -17%
Bensonville 72 2% 146 5% -73 -50%
Marshall 520 16% 285 11% 236 83%
Bomi 66 2% 65 2% 1 1%
Cape Mount 159 5% 92 3% 67 73% Kakata/Salala 140 4% 206 8% -67 -32%
Kolahun/Foya 12 0.4% 19 1% -7 -36%
Bopolu/Gbarma 12 0.4% 12 0.5% -1 -4%
Voinjama/Zorzor 91 3% 33 1% 57 173%
TOTAL 3,220 100% 2,677 100% 543 20%

ANNUAL REPORT FY2014/2015 | LRA 34
10.1.2 Customs Revenue
The Customs Department is responsible for collecting the revenues emanating from the duties levied on
international trade. During FY2014/2015, the total volume of customs revenue captured from 17 border ports
was US$177.8M, The Free Port of Monrovia was the outstanding contributor to the trade volume and customs
revenues during the period under review with US$124.3M or 70% of the collection.
Revenue from Customs Business Offices
The Customs Department’s revenue collections for FY2014/2015 disaggregated by Customs Business Offices
is shown below in Table 10.
1. The Freeport Office continues to be the lead driver as it contributed 70% or US$124.3M.
2. The LPRC Customs Business Office was the second biggest contributor at 19% or US$7.8M.
3. Overall, 96% of the Customs Department’s revenue was collected at urban ports, and only 3% at rural
ports. The underlying reason for this unequal distribution is not only that the majority of the volume of
international trade is channeled through urban ports like Freeport, but also that LRA Customs capacity
is severely limited in rural areas due to lack of automation, lack of road networks and electricity.
Table 10: Contribution to Customs Revenue by Customs Business Offices (CBOs) (Thousands of US Dollars)
DESCRIPTION FY14/15
Forecast % of
Forecast Actual
FY14/15 % of
Actual
Var +/-
Var %
TOTAL CUSTOMS 144,751 100% 177,829 100% 33,078 23%
URBAN PORTS 142,575 98% 171,413 96% 28,838 20%
FREEPORT
RIA
JSP
PARCEL POST
LMM&E
LPRC
BIVAC
96,058
2,016
2
12
16,779
26,044
1,664
66%
1%
0.001%
0.008%
12%
18%
1%
124,297
3,583
2
11
7,640
33,882
1,997
70%
2%
0.001%
0.006%
4%
19%
1%
28,239
1,567
0
-1
-9,139
7,838
333
29%
78%
0%
-8%
-54%
30%
20%
RURAL PORTS 2,176 2% 5,070 3% 2,894 133%
LOGUATUO
GANTA
BUCHANAN
GREENVILLE
TOE TOWN
HARPER
YEALLA
JORWAH
BUTUO
MENDICORMA
BO WATERSIDE
16
178
1,474
403
0
53
19
0
0
0
32
0.01%
0.12%
1.02%
0.28%
0%
0.04%
0.01%
0%
0%
0%
0.02%
157
472
3,052
418
103
233
192
69
3
44
329
0.09%
0.27%
1.72%
0.24%
0.06%
0.13%
0.11%
0.04%
0.002%
0.02%
0.19%
141
294
1578
15
103
180
173
69
3
44
297
881%
165%
107%
4%
100%
340%
911%
100%
100%
100%
928%
BACK OFFICE 0 0% 1,346 1% 1,346 100%
PCA 0 0% 1,346 1% 1,346 100%

ANNUAL REPORT FY2014/2015 | LRA 35
Duty Free Imports in FY2014/2015
Customs Duty Waivers constitute an important tool in the GoL’s public financial management repertoire. These
tax incentives are granted to concession companies, educational, medical and other institutions, NGOs,
Government MACs, organizations with diplomatic and consular privileges (including UN branches), and
individuals.
During FY2014/2015, a total of US$126.8M was recorded as duty waivers to various institutions of which General
Goods accounted for US$121.3M or 95.7%, while Petroleum Products accounted for US$5.5M or 4.3%,
respectively. The total waiver for the year amounts to 72% of total customs revenue and 43% of LRA’s domestic
tax revenue collection for the year. Table 11 and Figure 15 summarize the waiver by type.
Table 11: Summary of Duty Waived in FY2014/2015 (Thousands of US Dollars)
CATEGORY WAIVER % OF WAIVER
TOTAL WAIVERS 126,756 100.0%
General Goods 121,281 95.7%
Petroleum Products 5,475 4.3%
Figure 15: Summary of Duty Waived in FY2014/2015
4.30%
General Goods
95.70% Petroleum Products
General Good Duty Waivers in FY2014/2015
96% of duty waivers awarded in the period under review were for general goods (i.e. imports of goods other
than petroleum products). When the duty waivers for general goods are disaggregated by recipient, it is seen
that 32% of all general good waivers (317.8 US$M) are awarded for Government-related purposes (to GoL
projects, MACs, Legislature and Public Corporations), while 62% (511.1 US$M) are awarded for Non-
governmental purposes, including those waivers awarded under Concession Agreements, as Investment
Incentives and to Diplomatic Missions.
Table 12 summarizes the duty waived on general goods by Recipient Category. Table A1 in Appendix A
presents the detailed listing by beneficiary for general goods waivers in FY2014/2015.

ANNUAL REPORT FY2014/2015 | LRA 36
Table 12: General Goods Waiver by Recipient Category in FY2014/2015 (Thousands of US Dollars)
NAME
CIF VALUE
DUTY PAID
DUTY
WAIVED
% OF
WAIVER
% OF
CIF
VALUE
CONCESSIONS 333,374.08 2,366.32 46,770.26 38.56% 37.79%
GOL (MINISTRIES, AGENCIES & PUBLIC
CORPORATION)
177,216.59
13.45
26,713.15
22.03%
20.09%
DIPLOMATIC MISSIONS 96,923.12 0.00 17,144.54 14.14% 10.99%
EXECUTIVE ORDERS 138,873.04 15.13 12,315.19 10.15% 15.74%
INVESTMENT INCENTIVES 78,782.41 1,335.71 10,644.64 8.78% 8.93%
INTERNATIONAL NGO'S 46,300.66 110.48 6,235.55 5.14% 5.25%
MEDICAL INSTITUTIONS 6,309.75 9.05 721.97 0.60% 0.72%
NATIONAL LEGISLATURE 1,686.69 9.31 348.98 0.29% 0.19%
LOCAL NON-GOVERNMENTAL ORGANIZATION 930.62 6.62 145.29 0.12% 0.11%
RELIGIOUS INSTITUTIONS 1,100.62 24.99 130.74 0.11% 0.12%
EDUCATIONAL INSTITUTION 428.00 5.35 68.44 0.06% 0.05%
RETURNEE / STUDENTS 228.29 4.25 42.55 0.04% 0.03%
TOTAL 882,153.89 3,900.65 121,281.31 100.00% 100.00%
From Table 12, it is seen that the majority of general good duty waivers are awarded under Concession
Agreements (38%), followed by GoL Ministries and Agencies (20%), Government Projects (16%) and Diplomatic
Missions (11%). The amount of duty waived for the individual recipients in these recipient categories is
detailed in Table A1 (Appendix A).
Petroleum Good Duty Waiver
Similarly, when the duty waivers for petroleum goods are disaggregated by recipient category, it is seen 46%
(US$2.5M) of all waivers are awarded for Government-related purposes, and that 54% (US$2.9M) are awarded
for non-Governmental purposes.
Table 13 summarizes the duty waived on Petroleum goods by sector. Table A2 in Appendix A presents the
detailed listing of petroleum good waiver beneficiaries.
Table13: Petroleum Duty Waiver by Recipient Category (Thousands of US Dollars)
CATEGORY
PRODUCT TYPE
DUTY
WAIVED
% OF
WAIVER
AGO
PMS JET
FUEL
ATK
DIPLOMATIC MISSION 6,195,673 109,500 24,000 4,000 2,538.74 46.37%
GOL (MINISTRIES & AGENCIES) 4,538,000 - 8,000 33,000 1,831.60 33.46%
NATIONAL LEGISLATURE 369,000 1,038,000 - - 614.70 11.23%
INT'L NON-GOVERNMENTAL ORGANIZATION 425,500 500 - - 170.43 3.11%
CONCESSION 682,500 - - - 265.10 4.84%

ANNUAL REPORT FY2014/2015 | LRA 37
CATEGORY
PRODUCT TYPE
DUTY
WAIVED
% OF
WAIVER
AGO
PMS JET
FUEL
ATK
MEDICAL INSTITUTION 103,000 - - - 41.20 0.75%
INVESTMENT INCENTIVE 32,000 - - - 12.80 0.23%
TOTAL 12,345,673 1,148,000 32,000 37,000 5,475 100.00%
In Table 13, it is seen that the majority of petroleum good duty waivers are awarded to Diplomatic Missions
(46%), followed by Government of Liberia MACs (33%), and National Legislators (11%). The amount of duty
waived for the individual recipients in these recipient categories is detailed in Table A2 in Appendix A.

ANNUAL REPORT FY2014/2015 | LRA 38
10.1.3 Trade in FY2014/2015 In FY2014/2015 both the international prices and the domestic economy had an important role to play in the trade balance of Liberia’s economy. The trade balance was negative, as the total value of imports was higher than the value of exports by US$1,59B. Principal Imports in FY2014/2015 The top ten principal commodity1 groups imported in the period under review amounted to an import value of US$1.6B, or 88% of the total import value (US$1.8B), while the other goods contributed US$215M or 12% of the total imports. Mineral Products contributed 19% of total imports, followed by Machinery/Electrical equipment with 17% and Vegetable products with 14%. Transport Equipment contributed with 9%. The percentage contributions of the Principal Import Commodity groups are seen on Figure 16. Imports by Major Trading Partners Liberia’s eight major import-trading partners for FY2014/2015 supplied imports valued at US$875M which constituted 48% of total imports. As depicted in Table 15, Ivory Coast was the source of the highest value of imports at US$290.3M or 16% of total imports, followed by China at US$191.7M (11%), and India at US$163.8M (9%). Table 15 summarizes the values imported from major trading partners, as well as the key imports derived from each partner.
Figure 16: Principal Imports Composition
Mineral Products22%
Machinery/Electrical20%
Vegetable Products15%
Transportation11%
Chemicals & Allied Industries
9%
Miscellaneous7%
Metals6%
Plastics/Rubbers4%
Meat and Edible Meat Offal3%
Textiles3%
Mineral Products Machinery/Electrical Vegetable Products
Transportation Chemicals & Allied Industries Miscellaneous
Metals Plastics/Rubbers Meat and Edible Meat Offal
Textiles
Principal commodity groups refer to selected commodities grouped together to form major groups, for example, ‘Machinery and Electrical Equipment’ and ‘Vehicles and Transport Equipment’. In some cases,
when it is challenging to find a relevant grouping, and the commodities’ contributions to the total are minimal, the commodities are grouped together under the general category of ‘Others’.

ANNUAL REPORT FY2014/2015 | LRA 39
Table14: Imports in FY2014/2015
(Thousands of US Dollars)
IMPORT COMMODITY GROUP CIF %CIF
Mineral Products 347,759 19%
Machinery/Electrical 312,802 17%
Vegetable Products 245,846 14%
Transportation 168,710 9%
Chemicals & Allied Industries 151,059 8%
Miscellaneous 109,596 6%
Metals 95,611 5%
Plastics/Rubbers 61,728 3%
Meat and Edible Meat Offal 55,417 3%
Textiles 51,747 3%
PRINCIPAL COMMODITY GROUP 1,600,275 88%
Fish and Crustaceans, Mollusks & Invertebrates 24,687 1%
Wood & Wood Products 24,129 1%
Animal or Vegetables Fats & Oil 22,984 1%
Prepared Cereals, Flour Starch or Milk 22,402 1%
Miscellaneous Edible Preparation 21,670 1%
Mineral Water, Beverages, Spirits and Vinegar 19,914 1%
Dairy Product, birds eggs, Natural Honey, edible products of animal origin 14,098 1%
Stone/Glass 13,884 1%
Sugar and Sugar Confectionary 12,661 1%
Footwear/Headgear 11,675 1%
Prepared Meat, Fish, Crustaceans, mollusks or Aquatic Invertebrates 9,262 1%
Prepared Vegetable Fruits, Nuts 6,557 0%
Tobacco and Manufactured tobacco Substitutes 5,135 0%
Raw Hides, Skins, Leather, & Furs 4,684 0%
Cocoa and Cocoa Preparation 820 0%
Products of Animals origin, not elsewhere specific or included 284 0%
Prepared Animal fodder 159 0%
Live Animals 37 0%
Vegetable Products 3 0%
OTHER COMMODITY GROUP 215,046 12%
TOTAL 1,815,312 100%

ANNUAL REPORT FY2014/2015 | LRA 40
Table15: Imports by Major Trading Partners
(Thousands of US Dollars)
IMPORTS BY DESTINATION CIF %CIF
Ivory Coast 290,275 16%
Mineral Products 290,275 16%
China 191,678 11%
Machinery/Electrical 84,880 5%
Metals 33,568 2%
Transportation 22,328 1%
Chemicals & Allied Industries 17,640 1%
Miscellaneous 15,074 1%
Plastics/Rubbers 11,954 1%
Mineral Products 6,234 0.3%
India 163,800 9%
Vegetable Products 123,388 7%
Metals 16,964 1%
Chemicals & Allied Industries 14,046 1%
Transportation 9,402 1%
United States 139,895 8%
Chemicals & Allied Industries 35,104 2%
Transportation 31,961 2%
Machinery/Electrical 28,736 2%
Miscellaneous 25,961 1%
Vegetable Products 18,133 1%
Germany 59,506 3%
Machinery/Electrical 53,536 3%
Meat and Edible Meat Offal 5,970 0.3%
Belgium 29,389 2%
Miscellaneous 16,902 1%
Transportation 12,487 1%
Main Trade Partners 874,543 48%
Other Trade Partners 940,778 52%
TOTAL 1,815,321 100%

ANNUAL REPORT FY2014/2015 | LRA 41
Principal Exports in FY2014/2015 For FY2014/2015, the total value of exports was US$320.4M, of which re-export of products represented 29% of the FOB exported. The exports produced in Liberia are US$226.3M or 71% of the FOB exported, Mineral Products (Iron Ore) being the most important commodities exported at 41% (US$131.9M ), followed by Rubber at 19% (US$61.8M), and Stones/Glass and Cocoa Beans corresponded to 6% and 2% respectively of the production exported in FY2014/2015. Table 16 below summarizes the main categories of products exported during the reporting period. Figure 17 below graphs the relative percentages of the principal exported products during FY2014/2015. Exports by Major Trading Partners Total Exports for FY2014/2015 were valued at FOB US$320.4M; 70% of exports were destined for the thirteen major export partners. Exports to China ranked highest, valued at US$83.3M (26%). The United States, Ghana and Sierra Leone followed at 12% (US$37.7M), 4% (US$13.3M), and 6% (US$17.9M) respectively. Table 16 and Table 17 summarize the export profile for the period under review, and also mentions the key commodities exported to each of the major partner countries.
Figure 17: Principal Exports Composition
Mineral Products59%
Plastics/Rubbers27%
Stone/Glass9%
Cocoa and Cocoa
Preparation3%
Metals1%
Wood & Wood Products1%
Mineral Products Plastics/Rubbers Stone/Glass Cocoa and Cocoa Preparation Metals Wood & Wood Products

ANNUAL REPORT FY2014/2015 | LRA 42
Table16: Exports in FY2014/2015
Thousands of US Dollars)
EXPORT COMMODITY GROUP FOB %FOB
Mineral Products 131,976 41%
Plastics/Rubbers 61,775 19%
Stone/Glass 20,596 6%
Cocoa and Cocoa Preparation 7,432 2%
Metals 2,329 1%
Wood & Wood Products 1,050 0%
PRINCIPAL COMMODITY GROUP (COMMERCIAL EXPORT) 225,158 70%
Textiles 558 0%
Animal or Vegetables Fats & Oil 317 0%
Raw Hides, Skinds, Leather, & Furs 104 0%
Vegetable Products 49 0%
Fish and Crustaceans, Molluscs & Invertebrates 42 0%
Mineral Water, Beverages, Spirits and Vinegar 26 0%
Prepared Meat, Fish, Crustaceans, molluscs or Aquatic Invertebrates 13 0%
Miscellaneous Edible Preparation 7 0%
Chemicals & Allied Industries 3 0%
Footwear/Headgear 2 0%
Prepared Vegetable Fruits, Nuts 1 0%
Prepared Animal fodder 0 0%
Suger and Suger Confectionary 0 0%
Prepared Cereals, Flour Stach or Milk 0 0%
OTHER COMMODITY GROUP (COMMERCIAL EXPORT) 1,122 0.4%
TOTAL COMMERCIAL EXPORTS (PERMANMENT EXPORT) 226,280 71%
TOTAL NON-COMMERCIAL EXPORT (RE-EXPORT) 94,097 29%
TOTAL EXPORT 320,377 100%

ANNUAL REPORT FY2014/2015 | LRA 43
Table 17. Exports by Major Trading Partners
(In Thousands of US Dollars)
COUNTRY OF DESTINATION FOB %FOB
China 83,293 26%
Mineral Products 82,956 26%
United States 37,732 12%
Plastics/Rubbers 37,047 12%
Metals 431 0%
Ghana 13,270 4%
Stone/Glass 10,113 3%
Mineral Products 3,152 1%
Sierra Leone 17,954 6%
Plastics/Rubbers 13,306 4%
Cocoa and Cocoa Preparation 4,009 1%
Poland 23,982 7%
Mineral Products 23,982 7%
France 13,311 4%
Mineral Products 13,299 4%
United Arab Emirates 8,248 3%
Plastics/Rubbers 5,242 2%
Metals 1,566 0%
Mineral Products 1,248 0%
Israel 7,285 2%
Stone/Glass 7,285 2%
Malaysia 5,881 2%
Plastics/Rubbers 5,881 2%
Spain 3,936 1%
Mineral Products 3,936 1%
Belgium 3,450 1%
Stone/Glass 2,862 1%
Germany 3,153 1%
Mineral Products 2,870 1%
Netherlands 2,702 1%
Cocoa and Cocoa Preparation 2,677 1%
MAJOR EXPORT PARTNERS 224,199 70%
OTHER PARTNERS 2,081 1%
TOTAL COMMERCIAL EXPORTS 226,280 71%
TOTAL RE-EXPORTS 94,097 29%
TOTAL EXPORTS 320,377 100%

ANNUAL REPORT FY2014/2015 | LRA 44
10.2 External Resources
The detailed breakdown of external resources (core and contingent grants, and borrowings) is shown below
in Table 18. The primary reasons for the performance below forecast of external resources related to exchange
rate losses and the non-update of certain items such as the EU State Building Contract (worth US$40.3M). The
EVD epidemic was the primary target of the received funds, and huge gains have accordingly been made in
neutralizing the present outbreak and preventing similar disasters in the future.
Table 18. External Resources (Thousands of US$)
Description FY14/15 Forecast
% of Forecast
Actual FY14/15
% of Actual
Var +/-
Var %
Total External Resource 217,998 100% 206,288 100% (11,710) -5% Grants 109,361 50% 60,140 29% (49,221) -45%
From Norway From European Union
EU (State Building Contract) From USAID
World Bank-IDA - Grant
5,000 37,000 40,300 17,061 10,000
2% 17% 18% 8% 5%
- 37,353
- 13,089 9,698
0% 18% 0% 6% 5%
(5,000) 353
(40,300) (3,972) (302)
-100% 1%
-100% -23% -3%
Borrowings 108,637 50% 146,148 71% 37,511 35% African Development Bank
World Bank-IDA International Monetary Fund
Central Bank of Liberia
30,750 20,000 47,887 10,000
14% 9%
22% 5%
28,606 18,994 93,549 5,000
14% 9%
45% 2%
(2,144) (1,006) 45,662 (5,000)
-7% -5% 95% -50%
Grants:
1. US$5M projected grant coming from the Norwegian Government -Forest Preservation Agreement was
not paid during in the FY2014/2015 budget. The disbursement was forecasted according to the
arrangement plan (US$5M per fiscal year) and it is expected to be received next fiscal year as with the
respective grant agreed.
2. The grant received from the European Union was US$37M and comprised of US$10M for General
Budget Support and US27M for Health Sector Budget Support for the Ebola Virus. Due to exchange
rate fluctuations, the actual amount received exceeded the expected estimate.
3. The EU State Building Contract was projected to yield US$40.3M but it was not received due to
administrative constraints and requirements that were not met. This facility was earmarked for
Infrastructure projects such Liberia Electricity Corporation’s Mount Coffee Dam Project and road
building. The disbursement was stipulated to be phased over a period of three years.
4. The Health Assistance support component of the USAID grant was not received in full due to
requirements that were not met by the Health Ministry.
5. World Bank-IDA-Grants was frontloaded to FY2014/2015 due to Ebola Crisis. This amount fell short
due to exchange rate differentials.
Borrowings:
All of the loans were frontloaded to FY2014/2015 due to the Ebola crisis. An amount of US$37.5M was received
above the projections for the period.

ANNUAL REPORT FY2014/2015 | LRA 45
11. Key Challenges
The fiscal year 2014/2015 was characterized by an unprecedented health crisis in Liberia. Despite the EVD
pandemic, the LRA registered an excellent performance in domestic revenue administration. Even so, the LRA
is continuously confronted with challenges such as:
1. Liberia’s narrow tax base : The Liberian economy is characterized by a large informal sector with
significant hard-to-tax areas. Thus, domestic revenues are heavily reliant on indirect taxes, and there are
relatively few registered taxpayers. Initiatives are being taken by the LRA to actively engage new taxpayers
and enlarge the tax net; further, with the gradual economic and social development of the nation, the tax
base is expected to automatically expand.
2. Overall low compliance rates: Across the major contributing tax lines, there are low compliance rates. It
is hoped that this challenge can be overcome in upcoming fiscal years through the development and roll-
out of an active and engaged taxpayer education strategy as well as a cohesive and differentiated
compliance strategy suited to different categories of taxpayers and tax lines. External support has been
sought for these crucial exercises, and the LRA is confident that this challenge can be gradually
overcome.
3. Limited staff: The LRA has insufficient staff deployed in the critical operating units of the authority,
particularly in the Real Estate Tax Division, MIS Division, rural Customs and Tax Business Offices (TBOs).
It is hoped that new funding sources can be found to address this critical challenge.
4. Low staff capacity: With the new automation drives in various departments, there is a lack of technical
and human capacity across the LRA. Regular workshops on various venues have been conducted over
the year to address this challenge. Further, external support is being sought to establish a training center
to provide systematic training as necessary to new and old LRA staff.
5. Limited use of ASYCUDA, SIGTAS TAS platforms: There are various functionalities within these platforms
that the LRA is yet to take advantage of. In the following fiscal year, through external support, the human
and technical capacities of LRA staff are hoped to be improved and these additional features of the
automated platforms utilized.
6. Lack of effective monitoring systems for sector ministries: There are insufficient mechanisms in place to
monitor the non-tax revenue generating ministries and agencies of the Government. Some ministries and
agencies are still collecting and spending non-tax revenues generated as part of their statutory obligations.
7. Lack of interface between ASYCUDA and BIVAC pre-inspection activities: Information from BIVAC’s pre-
inspection activities is manually uploaded into ASYCUDA. While being inefficient and time-consuming, this
could also lead to error or fraud, which would adversely affect the operations of the Authority.
8. Lack of an automated customs and tax receivables management systems: This critical shortcoming,
combined with non-systematized collection and enforcement procedures, could potentially affect the
collection of tax revenues. The lack of automation severely impacts the processing times of tax collection
and reporting of tax data.
9. Electricity and Network limitations: The unreliability of the electricity and internet connections continue
to be significant challenges to the daily operations of the LRA, both at the headquarters and at rural offices.

ANNUAL REPORT FY2014/2015 | LRA 46
10. Poor Records Management System: A significant proportion of the records generated in LRA’s daily
operations as well as records inherited from the former Department of Revenue are stored manually and
poorly. While steps are now being taken to systematically archive old records and streamline records
management systems, this continues to represent a major risk and challenge to LRA operations.
To mitigate the challenges outlined above, the LRA is seeking funding and technical support from various
domestic, regional and international partners so as to improve revenue administration in Liberia. Other quirks
in the organizational and governance framework continue to be levelled out to facilitate a smooth transition
from the former Department of Revenue at the Ministry of Finance to the Liberia Revenue Authority.

ANNUAL REPORT FY2014/2015 | LRA 47
12. Key Achievements
The LRA, in carrying out its mandate, outperformed the approved domestic revenue target of the National
Budget by US$19.9M in its first year of operations. This performance was mainly on account of the enforcement
and voluntary compliance mechanisms instituted by the LRA. Other successful aspects of LRA’s operations in
FY2014/2015 include:
1. Transition from Department of Revenue (MFDP): The Authority moved to its headquarters in ELWA
Junction, Paynesville, Monrovia, and transitioned the majority of its staffers and administrative
functions too.
2. Strategic Management Framework: A Five-Year Corporate Strategic Plan (CSP) was developed,
approved and finalized. Corresponding annual business and work plans for FY/2015-2016, for each
department and section are currently under development.
3. Infrastructure Procurement: Some of the IT infrastructure has been successfully procured and housed
in the established headquarters and staff placement mechanism has been pursued.
4. Development of institutional procedures: HR Manuals to guide employee’s actions, Standard
Operation Procedures (SOPs) and other regulatory and administrative procedures have also been
developed and circulated.
5. Performance Management Framework: Employees’ grades and compensation regimes were
developed, adopted and approved by the Board of Directors as well as other logistical needs of the
customs business offices (CBOs) and Tax Business Offices (TBOs).
The key achievements during the first year of operations also included initiating innovative ways of reforming
and modernizing the tax system, investing in human resource reorganization and collaborating with domestic,
regional and international stakeholders. These efforts have been extremely beneficial to the LRA in its drive for
expanding domestic resource mobilization. However, the challenge remains of procuring adequate funding for
LRA’s various prerogatives; various partnerships with regional and international stakeholders are being
advanced to address this key challenge. We look forward to receiving greater external support and thereby
improving Liberia’s revenue administration in line with international best practices in FY2015/2016 and
beyond.

ANNUAL REPORT FY2014/2015 | LRA 48
13. Financial Statement UNAUDITED / FY2014/2015 (15 MONTHS)
The Liberia Revenue Authority (LRA) herein presents its financial statements for the fifteen (15) months ending
on June 30, 2015. The information in this report takes into account three (3) months prior to July 2014, when
the LRA became operational because there were transactions executed in the name of the entity at that time.
Funding for the reporting period represents Government of Liberia (GoL) transfers for LRA’s Implementation,
received prior to July 1, 2014, and GoL appropriation for FY 2014/2015 and budget support from APM Terminals.
The Liberia Revenue Authority falls within the Public Administration Executive Sector of the Budget. For Fiscal
Year 2014/2015, the sector received US$116,265,654, representing 23.14% of the approved total national budget
of US$502,351,347. The LRA’s budget of US$13,108,017, representing 11.27% of the Public Administration
Executive Sector budget and 2.61% of the National Budget.
For the fifteen (15) months ending on June 30, 2015, the LRA received a total of US$14,263,355 (US$1,100,000
from the Ministry of Finance & Development Planning (MFDP) as LRA Implementation Support; US$13,106,502
also from the MFDP, but as authorized allocation for FY2014/2015; and US$56,853 as Budget support from APM
Terminal). The US$13,106,502 authorized allocation for FY 2014/2015 represents 99.99% of the total LRA Budget
of US$13,108,017 approved by the National Legislature, with exchange rates differences being the reason for
less than 100% receipt.
Using the cash basis of accounting, total expenditure for the reporting period is US$8,717,169. Of this amount,
US$7,651,704 (87.78%) represents amount spent from FY 2014/2015 GoL authorized allocation for FY 2014/2015
and APM Terminal Budget Support combined; while US$1,065,465 (12.22%) represents expenses from LRA
Implementation Support received prior to July 1, 2014.
Additionally, there were liabilities of US$648,477 and commitments of US$4,795,989 as at June 30, 2015. These
liabilities are the results of deductions made against some payments, but for which there were not remittances
to various institutions (NASSCORP and GOL General Revenue Account) as at the end of the period.
Total cash balances at the end of the reporting period were US$589,866 and L$413,880,620. This translates to
a total USD Cash Equivalent of US$5,546,186. The total USD cash equivalent is broken up by sources as follow:
Balance on account of Implementation Budget (US$34,535); and Balance on account of FY2014/2015 allocation
(US$5,511,651). (See the Appendix B in Pages 64-65 for the detailed statements)
ANNUAL REPORT FY2014/2015 | LRA 49
14. Conclusion
With the mandate to “administer and enforce revenue laws in accordance to the Liberia Revenue Code (and
other related laws under which it is assigned responsibility) for the purpose of assessing, collecting, auditing,
and accounting for all national revenues to facilitate legitimate international trade and customs border
management-enforcement”, the LRA has succeeded in its inaugural campaign to meet this mandate with
assurances of a brighter future for Liberian revenue administration.
During its first year of existence as a semi-autonomous body, the Authority has performed these tasks
successfully, exceeding the revenue forecast for the year. This report highlighted the priorities, programs and
administrative regulations embarked upon by the LRA during FY2014/2015. LRA’s operations during
FY2014/2015 were executed despite logistical and other difficulties involved in transitioning to new premises,
and the unexpected scourge of the EVD epidemic. Other significant challenges that will need to be overcome
in forthcoming years include advancing Liberia’s low levels of taxpayers’ education and widening the narrow
tax base. Despite such challenges, the revenue outturn was impressive, as it exceeded the forecast by
US$19.9M during FY2014/2015.
The achievements outlined in this report were realized as a direct result of the support from the Government
of Liberia, the Board of Directors, the Ministry of Finance and Development Planning, the Liberian business
community, development partners and all other relevant stakeholders. Moreover, the professional attitudes of
the staff in their various capacities also provided an excellent impetus to the consolidated achievements of the
LRA in FY2014/2015.
In the coming Fiscal Year 2015/2016, the LRA strives to continue to serve its clients better through simplified
and improved service delivery, taxpayers’ educational schemes and personnel training programs. To this end,
we call for greater partnership, cooperation and support from all stakeholders, partners, the business
community, employees and the Government of Liberia.

ANNUAL REPORT FY2014/2015 | LRA 50
APPENDIX A: Duty Free
Table A1: General Goods Waiver: Detailed Listing (Thousands of US Dollars)
No
RECIPIENT CIF VALUE DUTY PAID DUTY WAIVED % OF WAIVER
% OF CIF VALUE
TOTAL 882,153.89 3,900.78 121,281.31 100% 100%
1
CONCESSION 333,374.08 2,366.32 46,770.26 38.56% 37.79%
ARCELOR MITTAL 224,769.02 1,123.85 32,205.22 68.86% 67.42%
BEA MOUNTAIN 43,992.86 219.96 5,871.13 12.55% 13.20%
CHINA UNION 18,536.48 92.68 2,786.09 5.96% 5.56%
ANADARCO LIBERIA CO. 9,688.25 246.99 1,463.37 3.13% 2.91%
FIRESTONE LIBERIA 10,364.84 207.45 1,362.72 2.91% 3.11%
MNG GOLD LIB. INC. 6,905.31 120.38 843.75 1.80% 2.07%
APM TERM. 4,835.84 95.58 693.35 1.48% 1.45%
GOLDEN VEROLEUM 5,153.86 99.20 568.28 1.22% 1.55%
SIME DARBY 3,316.45 66.33 290.43 0.62% 0.99%
LIBENCO OIL PALM INC. 1,378.98 27.78 144.43 0.31% 0.41%
CHEVRON LIBERIA 1,059.32 5.30 139.33 0.30% 0.32%
LIBERIA AGRICULTURAL CO. 865.60 17.31 129.28 0.28% 0.26%
MONROVIA BREWERIES INC. 360.62 9.00 94.87 0.20% 0.11%
SALALA RUBBER CO. 1,000.33 11.16 63.74 0.14% 0.30%
MARYLAND OIL PALM 395.02 7.90 39.74 0.08% 0.12%
NOVAFONE 218.99 4.38 30.88 0.07% 0.07%
CAVALA RUBBER CORP 353.96 7.08 29.06 0.06% 0.11%
LIBERIA FOREST PRODUCT 177.27 3.98 14.34 0.03% 0.05%
PUTU IRON ORE MINING 1.10 0.01 0.25 0.00% 0.00%
2
GOL (MINISTRIES, AGENCIES, PUBLIC CORPORATIONS)
177,216.59
13.56
26,713.15
22.03%
20.09%
MINISTRY OF PUBLIC WORKS 74,957.45 8.08 10,347.15 38.73% 42.30%
LIBERIA ELECTRICITY CORP. 37,732.86 5,746.71 21.51% 21.29%
NATIONAL TASK FORCE ON EBOLA 18,167.56 3,152.31 11.80% 10.25%
INCIDENT MANG. SYSTEM 8,452.69 1,890.92 7.08% 4.77%
MINISTRY OF HEALTH 10,875.42 1,786.49 6.69% 6.14%
MINISTRY OF EDUCATION 6,023.89 694.33 2.60% 3.40%
LIBERIA NATIONAL POLICE 868.26 477.06 1.79% 0.49%
NATIONAL SECURITY AGENCY 2,226.69 404.62 1.51% 1.26%
NATIONAL MALARIA CONTROL PROG. 1,954.04 265.60 0.99% 1.10%
MINISTRY OF AGRICULTURE 1,626.86 218.31 0.82% 0.92%
MINISTRY OF FOREIGN AFFAIRS 1,035.03 189.10 0.71% 0.58%

ANNUAL REPORT FY2014/2015 | LRA 51
No
RECIPIENT CIF VALUE DUTY PAID DUTY WAIVED % OF WAIVER
% OF CIF VALUE
TOTAL 882,153.89 3,900.78 121,281.31 100% 100%
MINISTRY OF FINANCE & DEV. PLANNING 1,089.05 172.50 0.65% 0.61%
MINISTRY OF COMMERCE & INDUSTRY 5,609.70 136.61 0.51% 3.17%
NATIONAL ELECTIONS COMM. 593.92 92.42 0.35% 0.34%
TEMPLE OF JUSTICE 439.27 84.31 0.32% 0.25%
MONROVIA CITY CORP 488.12 0.02 82.57 0.31% 0.28%
EXECUTIVE PROT. SERV. 299.03 62.44 0.23% 0.17%
MINISTRY OF JUSTICE 282.56 60.30 0.23% 0.16%
BUREAU OF IMMIGRATION 300.82 59.10 0.22% 0.17%
MINISTRY OF TRANSPORT 290.65 57.42 0.21% 0.16%
MINISTRY OF INTERNAL AFFAIRS 292.30 54.15 0.20% 0.16%
FORESTRY DEV. AUTHORITY 197.09 47.96 0.18% 0.11%
LIBERIA ANTI CORRUPTION COMM. 206.81 44.23 0.17% 0.12%
RURAL RENEWAL ENERGY AGENCY 200.85 41.39 0.15% 0.11%
MINISTRY OF STATE 223.49 37.11 0.14% 0.13% MINISTRY OF LANDS & MINES (WEST AFRICA
ARCHITECTURAL) 225.54 36.30 0.14% 0.13%
BENTOL CITY CORP. 121.13 35.05 0.13% 0.07%
GENERAL AUDITING COMM. 158.32 32.57 0.12% 0.09%
LIBERIA WATER & SEWER CORP. 198.37 30.87 0.12% 0.11%
LIB. POST GRAD. MEDICAL COUNCIL 153.16 30.64 0.11% 0.09%
LIBERIA REVENUE AUTHORITY 149.44 26.04 0.10% 0.08% PUBLIC PROCUREMENT & CONCESSION
CORP. 141.84 25.86 0.10% 0.08%
LIBERIA BANK FOR DEV. & INV. 188.30 3.55 23.61 0.09% 0.11%
MINISTRY OF POST & TELECOM 83.14 21.42 0.08% 0.05%
LIPA 115.34 21.03 0.08% 0.07%
NATIONAL BUREAU OF CONCESSION 55.30 16.02 0.06% 0.03%
LIBERIA FOOTBALL ASSOC. 49.14 15.06 0.06% 0.03%
SGS - LIBERIA 62.14 14.32 0.05% 0.04%
MINISTRY OF YOUTH & SPORTS 42.66 12.47 0.05% 0.02%
LACE - LIBERIA 78.49 12.21 0.05% 0.04%
LIBERIA MANUCIPAL WATER PROJECT 90.00 12.10 0.05% 0.05%
VICE PRESIDENT'S OFFICE 64.26 11.72 0.04% 0.04%
LIBERIA TELECOMMUNICATION AUTHORITY 80.46 0.88 11.47 0.04% 0.05%
ENVIRONMENT PROT. AGENCY 74.36 11.01 0.04% 0.04%
NIMBA DEV. PROJECT 40.87 9.64 0.04% 0.02%
MINISTRY OF NATIONAL DEFENSE 47.83 8.44 0.03% 0.03%
GOVERNANCE COMMISSION 45.27 8.26 0.03% 0.03%

ANNUAL REPORT FY2014/2015 | LRA 52
No
RECIPIENT CIF VALUE DUTY PAID DUTY WAIVED % OF WAIVER
% OF CIF VALUE
TOTAL 882,153.89 3,900.78 121,281.31 100% 100%
NATIONAL HOUSING AUTHORITY 39.78 7.47 0.03% 0.02%
REDEMPTION HOSPITAL /MOH 55.88 7.11 0.03% 0.03%
OFFICE OF SENATE PROTEMPORE 38.58 7.04 0.03% 0.02%
MINISTRY OF INFORMATION 36.45 6.65 0.02% 0.02%
FINANCIAL INTEL. UNIT 30.92 5.64 0.02% 0.02%
LIBERIA TELECOMMUNICATION CORP. 43.86 0.88 5.30 0.02% 0.02%
NATIONA MILLENNIUM COMPACT PROGRAM 28.58 5.21 0.02% 0.02%
OFFICE OF SENATE SEC. 28.40 5.18 0.02% 0.02%
NATIONAL TRANSIT AUTHORITY 32.76 5.10 0.02% 0.02%
LEGISLATURE (REP) 27.94 4.59 0.02% 0.02%
LIBERIA MEDICAL & DENTAL COUNCIL 28.15 4.38 0.02% 0.02%
NATATIONAL COUNCIL OF CHIEFS 16.51 4.15 0.02% 0.01%
EGIRP 42.24 4.10 0.02% 0.02%
OFFICE OF VICE PRESIDENT 11.31 2.67 0.01% 0.01% CENTER FOR NAT'L DOCUMENTS AND
RECORDS 15.49 2.49 0.01% 0.01%
LIBERIA INST. FOR PROMOTION OF ACADEMIC EXECELENCE 18.35 1.87 0.01% 0.01%
LIBERIA BROADCASTING SYSTEM 7.23 0.14 1.44 0.01% 0.00%
LICPA 9.95 1.02 0.00% 0.01%
LISGIS 4.47 0.53 0.00% 0.00%
3
DIPLOMATIC MISSIONS 96,923.12 17,144.54 14.14% 10.99%
UNMIL (LIB., MOVCON, S/FOOD) 52,146.98 9,525.53 55.52% 53.80%
US EMBASSY 13,644.68 2,863.42 16.69% 14.08%
UNICEF - MONROVIA 9,684.93 1,562.44 9.11% 9.99%
WORLD FOOD PROGRAM 10,863.92 1,444.15 8.42% 11.21%
UNDP - LIB. 2,559.66 438.29 2.56% 2.64%
ICRC 2,198.85 258.60 1.51% 2.27%
UNCHR-LIB. 1,279.00 232.96 1.36% 1.32%
WORLD HEALTH ORGANIZATION 958.63 172.20 1.00% 0.99%
FAO- LIBERIA 676.43 132.75 0.77% 0.70%
UNOPS 566.36 102.97 0.60% 0.58%
IOM -LIB 329.97 59.98 0.35% 0.34%
CHINESE EMBASSY 307.28 58.41 0.34% 0.32%
SWISS EMBASSY 243.64 45.32 0.26% 0.25%
GERMAN EMBASSY 153.93 29.74 0.17% 0.16%
NIGERIAN EMBASSY 144.80 25.87 0.15% 0.15%
WORLD BANK 108.96 23.83 0.14% 0.11%
UN WOMEN 131.48 23.73 0.14% 0.14%

ANNUAL REPORT FY2014/2015 | LRA 53
No
RECIPIENT CIF VALUE DUTY PAID DUTY WAIVED % OF WAIVER
% OF CIF VALUE
TOTAL 882,153.89 3,900.78 121,281.31 100% 100%
UNFPA 235.83 20.10 0.12% 0.24%
SIERRA LEONE EMBASSY 55.38 16.02 0.09% 0.06%
US PEACE CORPS 83.32 15.76 0.09% 0.09%
INT'L BAKN FOR RECON. & DEV. 43.47 14.97 0.09% 0.04%
UNIDO 84.21 14.01 0.08% 0.09%
BRITISH EMBASSY 63.29 12.04 0.07% 0.07%
EUROPEAN UNION 72.44 11.82 0.07% 0.07%
FRENCH EMBASSY 35.93 8.47 0.05% 0.04%
SWISS CORPORATION OFFICE 115.72 7.89 0.05% 0.12%
ECOWAS COMMISSION 35.00 6.38 0.04% 0.04%
SOUTH AFRICAN EMBASSY 36.06 6.21 0.04% 0.04%
PAE 27.60 4.29 0.03% 0.03%
INT'L FINANCE CORP. 9.11 1.67 0.01% 0.01%
ROBERT FLIGHT INFO. REGION 5.43 1.28 0.01% 0.01%
D R CONGO EMBASSY 5.42 0.99 0.01% 0.01%
UN AIDS - LIB. 3.66 0.86 0.01% 0.00%
SWEDISH EMBASSY 4.64 0.85 0.00% 0.00%
GERMAN ARMED FORCES 7.15 0.75 0.00% 0.01%
4
EXECUTIVE ORDERS 138,873.04 15.13 12,315.19 10.15% 15.74%
SUPPLY WEST AFRICA TRADING INC. 62,310.45 6,933.27 56.30% 44.87%
UNITED COMMOCITIES INC. 43,351.31 3,071.29 24.94% 31.22%
K&K TRADING 13,653.68 691.15 5.61% 9.83%
FIRESTONE LIBERIA 5,831.14 621.19 5.04% 4.20%
FOUTA CORPORATION 8,546.83 562.59 4.57% 6.15%
FLUDOR LIBERIA LTD 4,314.00 351.57 2.85% 3.11%
MANDRA FORESTRY - LIBERIA LTD 432.66 8.65 27.45 0.22% 0.31%
CALVACADE LOGISTICS 189.88 3.80 20.67 0.17% 0.14%
NATIONAL TRANSIT AUTHORITY 60.79 0.00 10.58 0.09% 0.04%
CITY CAR RENTAL LIBERIA 52.50 1.05 8.52 0.07% 0.04%
INT'L CONSULTANT CAPITAL 51.70 1.03 7.01 0.06% 0.04%
LWSC 48.15 6.21 0.05% 0.03%
AKIBA CAPITAL LIBERIA 15.50 0.31 2.52 0.02% 0.01%
ENTERPRISE HOLDING GROUP 14.45 0.29 1.19 0.01% 0.01%
5
INVESTMENT INCENTIVES 78,782.41 1,335.71 10,644.64 8.78% 8.93%
DURA PLAST 17,333.90 176.77 2,027.77 19.05% 22.00%
SETHI BROTHERS 16,032.95 162.19 1,942.80 18.25% 20.35%
FOUANI BROTHERS 9,248.90 272.47 1,348.70 12.67% 11.74%

ANNUAL REPORT FY2014/2015 | LRA 54
No
RECIPIENT CIF VALUE DUTY PAID DUTY WAIVED % OF WAIVER
% OF CIF VALUE
TOTAL 882,153.89 3,900.78 121,281.31 100% 100%
PREMIER MILLING CORP. 5,869.75 127.40 692.60 6.51% 7.45%
CCGC MINING SERVICES 4,278.11 85.56 556.34 5.23% 5.43%
TIBA INDUSTRIAL GROUP 2,554.16 54.28 484.08 4.55% 3.24%
LIPFOCO 3,733.38 68.97 477.10 4.48% 4.74%
LIBERIA SOAP & DET. CO. 1,714.47 34.29 425.64 4.00% 2.18%
LCCBC 2,215.47 44.31 399.37 3.75% 2.81%
MANCO 1,580.65 30.73 312.41 2.93% 2.01%
NB INDUSTRIAL COMPLEX 1,541.40 30.83 209.12 1.96% 1.96%
CEMENCO 1,561.13 31.22 206.44 1.94% 1.98%
MADINA ROCK CRUSHER 1,222.28 24.45 179.00 1.68% 1.55%
METALUM LIB. LTD 1,486.92 29.74 162.28 1.52% 1.89%
MANEX 1,273.62 25.47 138.63 1.30% 1.62%
RAINBOW PAINT IND. 558.35 11.17 120.91 1.14% 0.71%
MONTSERRADO GROUP OF INDUSTRIES 614.18 12.28 105.90 0.99% 0.78%
MONROVIA BREWERIES INC. 861.21 16.32 104.31 0.98% 1.09%
S S S PRIVATE LIMITED 505.61 5.48 88.12 0.83% 0.64%
ZIRCON INDUSTRIAL ENGINEERING 652.66 13.05 85.06 0.80% 0.83%
INT'L ALUMINIUM FACTORY 560.02 11.20 84.90 0.80% 0.71%
NATIONAL TOILETORIES 368.97 7.35 77.63 0.73% 0.47%
SUPREME LIBERIA 629.96 12.60 72.67 0.68% 0.80%
JUMP PHARMACEUTICALS CORP. 391.09 7.82 58.92 0.55% 0.50%
ADI CONTRACTORS 328.41 6.57 44.53 0.42% 0.42%
GOYAL FARM 212.95 4.26 43.35 0.41% 0.27%
JETTY TRADING 310.43 6.21 33.79 0.32% 0.39%
WOODWORK CONSTRUCTION & TRADING CO. 274.31 5.49 31.01 0.29% 0.35%
ROYAL GRAND HOTEL 96.18 1.92 16.21 0.15% 0.12%
MDMC EXPRESS INC. 138.05 2.76 15.03 0.14% 0.18%
ACQUARIUS BEVERAGE INC. 62.73 1.25 14.50 0.14% 0.08%
CORINA HOLTEL 53.27 1.07 14.44 0.14% 0.07%
FMG WATER INDUSTRY 83.24 1.66 14.16 0.13% 0.11%
ARROW ALLIANCE GROUP 82.61 1.65 14.16 0.13% 0.10%
LIBERIA FOAM & PLATE FACTORY 82.62 1.65 8.99 0.08% 0.10%
MILA GROUP INC. 78.90 1.58 8.59 0.08% 0.10%
LIBERIA WOODWORK CONSTRUCTION CORP. 50.80 1.02 7.95 0.07% 0.06%
NATIONAL AIR PRODUCTS 53.80 1.08 6.91 0.06% 0.07%
HOPE BAKERY 34.37 0.69 3.56 0.03% 0.04%
WEST AFRICA TELECOM 16.93 0.34 2.30 0.02% 0.02%

ANNUAL REPORT FY2014/2015 | LRA 55
No
RECIPIENT CIF VALUE DUTY PAID DUTY WAIVED % OF WAIVER
% OF CIF VALUE
TOTAL 882,153.89 3,900.78 121,281.31 100% 100%
RASA LIBERIA INC. 12.95 0.26 1.82 0.02% 0.02%
VISION INDUSTRIES INC. 10.54 0.21 1.29 0.01% 0.01%
EDGAIL INC. 8.25 0.07 1.10 0.01% 0.01%
FABRAR LIBERIA INC. 1.93 0.04 0.26 0.00% 0.00%
6
INTERNATIONAL NGO'S 46,300.66 110.49 6,235.55 5.14% 5.25%
MSF / CHAI 12,545.49 1,327.06 21.26% 27.10%
GLOBAL COMMUN ITIES/USAID 5,208.01 0.24 900.25 14.44% 11.25%
MSF /BELGIUM 5,195.64 555.53 8.91% 11.22%
AFRICARE 5,045.10 8.69 520.79 8.35% 10.90%
PAE / USAID 2,957.85 501.49 8.04% 6.39%
INT'L RESCUE C'TEE 1,802.97 23.36 378.64 6.07% 3.89%
MARY'S MEALS - LIB. 1,690.67 22.51 189.24 3.03% 3.65%
INT'L MEDICAL CORP. 1,031.02 2.51 186.50 2.99% 2.23%
FHI DEVELOPMENT 360 1,029.34 167.00 2.68% 2.22%
DAI/USAID 496.94 0.60 104.70 1.68% 1.07%
SAMARITAN'S PURSE 686.57 1.96 99.17 1.59% 1.48%
SAVE THE CHILDREN 552.38 4.27 81.67 1.31% 1.19%
FAMILY HEALTH DIVISION / USAID 564.48 78.35 1.26% 1.22%
CHRISTIAN AID MINISTRIES 483.71 9.67 69.49 1.11% 1.04%
MEDECINS DU MONDE 541.41 66.55 1.07% 1.17%
SOS CHILDREN VILLAGE 315.84 0.66 63.86 1.02% 0.68%
USAID /ACDI/VOCA INT'L 464.15 63.60 1.02% 1.00%
GERMAN INT'L CORP. (GTZ) 163.99 47.45 0.76% 0.35%
POPULATION SERVICES INT'L 211.67 0.49 45.78 0.73% 0.46%
PAE GOV'T SERVICE 270.35 43.76 0.70% 0.58%
USAID /RTI INT'L 371.68 43.60 0.70% 0.80%
CHILD FUND - LIB. 169.87 1.29 37.70 0.60% 0.37%
MERCY CORPS 204.13 3.20 34.87 0.56% 0.44%
I C R C 117.04 33.59 0.54% 0.25%
EDUCATION DEVELOPMENT CENTER 211.07 33.47 0.54% 0.46%
ACTION CONTRE LA FAIM 121.18 0.24 30.96 0.50% 0.26%
CONCERN WORLD WIDE 159.51 2.57 30.52 0.49% 0.34%
LIVING WATER INT'L 177.97 3.56 29.36 0.47% 0.38%
EHELD/RTI/USAID 269.57 27.52 0.44% 0.58%
CHRISTIAN HEALTH ASSOCIATION 196.91 3.43 26.96 0.43% 0.43%
BRAC - LIBERIA 191.75 1.05 25.68 0.41% 0.41%
CNMETU-USAID/PAE 163.06 25.57 0.41% 0.35%

ANNUAL REPORT FY2014/2015 | LRA 56
No
RECIPIENT CIF VALUE DUTY PAID DUTY WAIVED % OF WAIVER
% OF CIF VALUE
TOTAL 882,153.89 3,900.78 121,281.31 100% 100%
ADRA - LIB. 386.22 17.42 0.28% 0.83%
WINDROCK INT'L / USAID 105.33 17.25 0.28% 0.23%
MAP INT'L LIBERIA 100.49 17.24 0.28% 0.22%
INT'L RESEARCH & EXCHANGE 85.46 16.99 0.27% 0.18%
USAID/DAI/FED 149.33 16.07 0.26% 0.32%
AMERICAN REFUGEE C'TTE (ARC) 89.19 15.68 0.25% 0.19%
LAND O'LAKES LIBERIA 108.22 2.16 15.43 0.25% 0.23%
JAPAN INT'L CORPORATION AGENCY (JICA) 73.71 15.16 0.24% 0.16%
PLAN INTERNATIONAL 74.37 0.12 13.44 0.22% 0.16%
OXFAM GB 79.30 0.35 12.63 0.20% 0.17%
TEAM WORK AFRICA 83.15 1.54 12.01 0.19% 0.18%
LAST MILE HEALTH 120.61 0.69 11.40 0.18% 0.26%
ZOA - LIBERIA 66.83 1.34 10.19 0.16% 0.14%
PEACE CORPS - LIB. 64.37 10.01 0.16% 0.14%
USAID/RTI INT'L/EHELD 94.44 9.64 0.15% 0.20%
ORPHAN RELIEF & RESCUE 22.34 0.47 8.41 0.13% 0.05%
TETRA TECH ARD 45.32 8.07 0.13% 0.10%
USAID/FHI 360 LIBERIA 57.86 7.88 0.13% 0.12%
MENTOR INITIATIVE 49.69 0.99 6.74 0.11% 0.11%
IBIS LIBERIA 46.25 0.92 6.51 0.10% 0.10%
WATER OF LIFE 39.83 0.80 5.34 0.09% 0.09%
MISSION ALLIANCE 32.60 0.65 5.29 0.08% 0.07%
USAID LTTP 28.68 5.23 0.08% 0.06%
WATER HEALTH LIB 44.14 3.69 5.14 0.08% 0.10%
LUTHERAN DEV. SER. 34.89 0.70 5.11 0.08% 0.08%
LACE 30.82 0.62 5.00 0.08% 0.07%
PARTNERS IN HEALTH 30.50 4.75 0.08% 0.07%
WE CARE FOUNDATION 26.28 0.34 4.65 0.07% 0.06%
EVERY HOME FOR CHRIST 44.69 0.88 4.42 0.07% 0.10%
IBI INT'L /USAID JAM PROJ. 25.22 4.40 0.07% 0.05%
AGENCY FOR HOLISTIC EVANG. 16.32 0.33 4.40 0.07% 0.04%
USAID/IREX 17.63 4.34 0.07% 0.04%
CARTER CENTER 12.98 4.26 0.07% 0.03%
ADAM SMITH INT'L/SIDA 25.98 0.52 4.22 0.07% 0.06% DEVELOPMENT EDUCATION NETWORK
LIBERIA 36.41 4.17 0.07% 0.08%
BUILDING MARKETS 25.15 0.42 4.17 0.07% 0.05%
USAID/TETR 12.45 0.25 4.02 0.06% 0.03%

ANNUAL REPORT FY2014/2015 | LRA 57
No
RECIPIENT CIF VALUE DUTY PAID DUTY WAIVED % OF WAIVER
% OF CIF VALUE
TOTAL 882,153.89 3,900.78 121,281.31 100% 100%
AFRICAN HUMANITARIAN ACTION 32.60 3.94 0.06% 0.07%
MORE THAN ME 23.48 3.65 0.06% 0.05%
USAID /LIBERIA M&E PROGRAM 19.93 3.63 0.06% 0.04%
ALFAUT LIBERIA 41.27 0.83 3.39 0.05% 0.09%
USAID PROGRAM 20.71 2.77 0.04% 0.04%
RTI/USAID 11.82 2.41 0.04% 0.03%
CAMP DRESSER MIKET INT'L 12.22 2.14 0.03% 0.03%
IBIS W/AFRICA 13.57 2.11 0.03% 0.03%
P S I - LIBERIA 24.48 0.49 2.01 0.03% 0.05%
USAID/ LIBERIA MUNICIPAL WATER PROJECT 13.33 0.27 1.81 0.03% 0.03%
HEALTH WOMEN, HEALTH LIBERIA 9.77 0.20 1.30 0.02% 0.02%
JOHN SNOW INC. /USAID 7.08 1.29 0.02% 0.02%
C D M INTERNATIONAL INC. 11.83 1.21 0.02% 0.03%
OSIWA MONROVIA 14.28 0.29 1.17 0.02% 0.03%
USAID/GEM/ANTHONY WENDELL 6.22 1.13 0.02% 0.01%
HAMILTON A. GREEN FOUND. 17.34 0.35 1.08 0.02% 0.04%
OPPORTUNITY IND. CENTER INT'L 5.27 0.79 0.01% 0.01%
JSI RESEARCH & TRAINING 4.31 0.67 0.01% 0.01%
TETRA TECH (LMWP) 4.97 0.51 0.01% 0.01%
SIGHT SAVERS LIB. 3.91 0.40 0.01% 0.01%
USAID/JOHN SNOW INT'L 3.06 0.31 0.01% 0.01%
JOHN HOPKINS CENTER /USAID 0.86 0.11 0.00% 0.00%
7
MEDICAL INSTITUTIONS 6,309.75 9.05 721.97 0.60% 0.72%
NATIONAL DRUG SERVICE 3,179.98 0.93 324.25 44.91% 50.40%
ELWA HOSPITAL 1,798.31 3.78 240.36 33.29% 28.50%
GERLIB CLINIC 678.60 0.15 74.57 10.33% 10.75%
ST. JOSEPH CAT. HOSPITAL 419.11 2.96 50.07 6.94% 6.64%
PHEBE HOSPITAL 78.63 12.12 1.68% 1.25%
JACKSON F. DOE HOSPITAL 43.85 8.00 1.11% 0.69%
SOS CLINIC 27.84 0.56 2.47 0.34% 0.44%
LIBERIA MEDICAL & DENTAL COUNCIL 12.50 2.28 0.32% 0.20%
HEALTHLINE MEDICAL CLINIC 12.87 0.26 1.77 0.24% 0.20% SCHEKINA INC. / LIBBERIA MEDICINES &
HEALTH PRODUCTS REGULATORY AUTHORITY
14.91
1.52
0.21%
0.24%
GANTA UMC /LAC/ HOSPITAL /MOH 13.04 0.26 1.44 0.20% 0.21%
GANTA LEPROSY & TB REHAB. 13.03 1.33 0.18% 0.21%
GENERAL GOV'T HOSPITAL BOMI CO. 6.63 0.68 0.09% 0.11%

ANNUAL REPORT FY2014/2015 | LRA 58
No
RECIPIENT CIF VALUE DUTY PAID DUTY WAIVED % OF WAIVER
% OF CIF VALUE
TOTAL 882,153.89 3,900.78 121,281.31 100% 100%
SDA COOPER HOSPITAL 4.39 0.03 0.62 0.09% 0.07%
KINGDOM CARE MEDICAL CENTER 6.07 0.12 0.50 0.07% 0.10%
8
NATIONAL LEGISLATURE 1,686.69 9.31 348.98 0.29% 0.19%
HON. BALLAH G. ZAYZAY 80.55 0.40 25.45 7.29% 4.78%
HON. DANIEL NATHAN 75.40 0.38 21.44 6.14% 4.47%
HON. GEORGE M. WEAH 68.02 0.34 19.34 5.54% 4.03%
HON. HAJA FATA SIRYON 82.24 0.41 18.85 5.40% 4.88%
HON. JEREMIAH KOUNG KPAN 84.10 0.42 14.87 4.26% 4.99%
HON. J. EMMANUEL NUOQUAY 70.98 0.35 12.05 3.45% 4.21%
HON. SEKOU KANNEH 40.11 0.20 11.40 3.27% 2.38%
HON. STEPHEN S. KAFI, JR. 55.30 0.28 11.22 3.22% 3.28%
HON. GEORGE S. MULBAH 59.89 0.30 10.78 3.09% 3.55%
HON. ADOLF A. LAWRENCE 47.03 0.24 10.21 2.93% 2.79%
HON. PRINCE O. S. TOKPAH 56.80 0.78 10.08 2.89% 3.37%
HON. ZOE E. PENNUE 54.68 0.27 9.70 2.78% 3.24%
HON. SAMUEL G. KOGAH 29.99 0.15 8.53 2.44% 1.78%
HON. MAMBU M. SONII 42.39 0.21 7.73 2.22% 2.51%
HON. ISAAC W. NYENABO, II 39.76 0.20 7.05 2.02% 2.36%
HON. THOMAS S. GRUPEE 39.49 0.20 7.00 2.01% 2.34%
HON. JEFFERSON S. KARMO 39.09 0.20 6.93 1.99% 2.32%
HON. FOFI SAHR BAIMBA, SR. 44.50 0.22 6.69 1.92% 2.64%
HON. MOSES Y. KOLLIE 35.00 0.18 6.21 1.78% 2.08%
HON. ACARIUS M. GRAY 18.84 0.09 5.47 1.57% 1.12%
HON. DALLAS GUEH 28.40 0.14 5.04 1.44% 1.68%
HON. EDWARD W. KARFIAH 28.40 0.14 5.04 1.44% 1.68%
HON. HENRY W. YALLAH 28.40 0.14 5.04 1.44% 1.68%
HON. JONATHAN BANNEY 28.40 0.14 5.04 1.44% 1.68%
HON. JOSEPH N. NAGBE 28.40 0.14 5.04 1.44% 1.68%
HON. MATTHEW M. JAYE 28.40 0.14 5.04 1.44% 1.68%
HON. GERALDINE DOE SHERIFF 23.78 0.12 5.01 1.44% 1.41%
HON. J. GABRIEL NYENKAN 23.84 0.12 4.92 1.41% 1.41%
HON. JEH BYRON BROWN 27.72 0.14 4.91 1.41% 1.64%
HON. JEWEL H. TAYLOR 23.95 0.12 4.45 1.28% 1.42%
HON. EDWARD DAGOSEH 24.99 0.12 4.44 1.27% 1.48%
HON. GERTRUDE TENE LAMIN 22.15 0.11 4.32 1.24% 1.31%
HON. WILLIAM TWEHWAY 19.27 0.10 4.18 1.20% 1.14%
HON. EUGENE FALLAH KPARKA 20.05 0.10 3.75 1.07% 1.19%
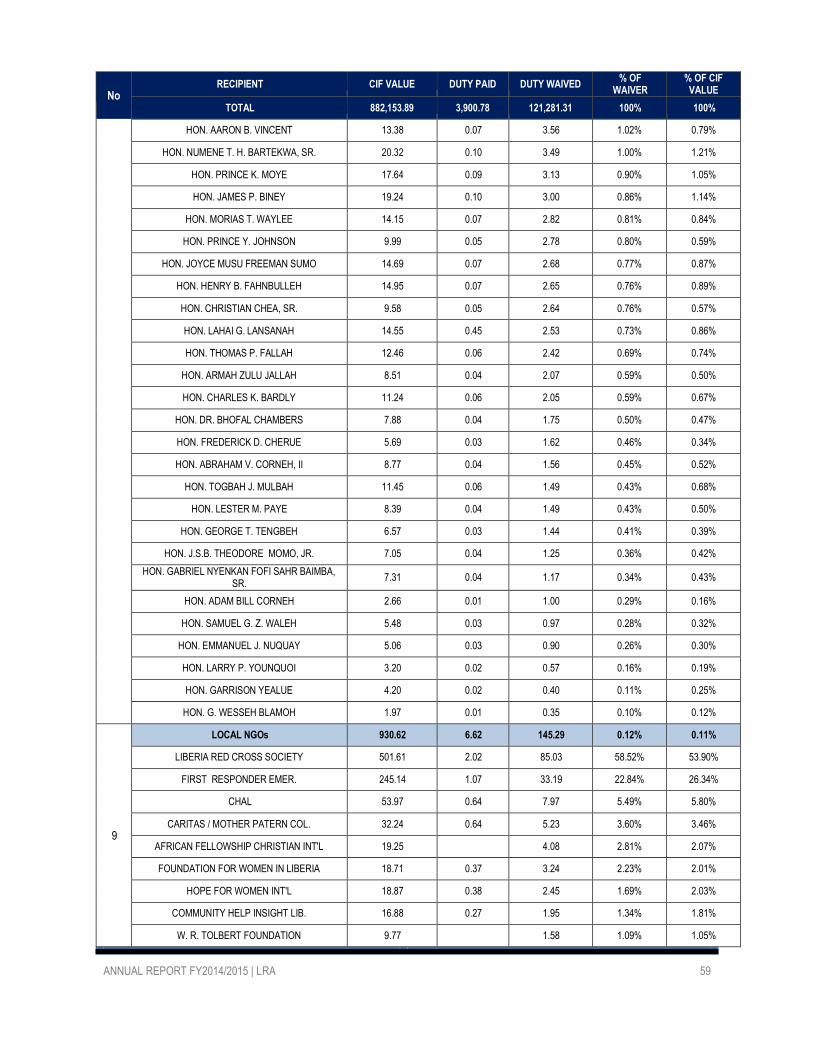
ANNUAL REPORT FY2014/2015 | LRA 59
No
RECIPIENT CIF VALUE DUTY PAID DUTY WAIVED % OF WAIVER
% OF CIF VALUE
TOTAL 882,153.89 3,900.78 121,281.31 100% 100%
HON. AARON B. VINCENT 13.38 0.07 3.56 1.02% 0.79%
HON. NUMENE T. H. BARTEKWA, SR. 20.32 0.10 3.49 1.00% 1.21%
HON. PRINCE K. MOYE 17.64 0.09 3.13 0.90% 1.05%
HON. JAMES P. BINEY 19.24 0.10 3.00 0.86% 1.14%
HON. MORIAS T. WAYLEE 14.15 0.07 2.82 0.81% 0.84%
HON. PRINCE Y. JOHNSON 9.99 0.05 2.78 0.80% 0.59%
HON. JOYCE MUSU FREEMAN SUMO 14.69 0.07 2.68 0.77% 0.87%
HON. HENRY B. FAHNBULLEH 14.95 0.07 2.65 0.76% 0.89%
HON. CHRISTIAN CHEA, SR. 9.58 0.05 2.64 0.76% 0.57%
HON. LAHAI G. LANSANAH 14.55 0.45 2.53 0.73% 0.86%
HON. THOMAS P. FALLAH 12.46 0.06 2.42 0.69% 0.74%
HON. ARMAH ZULU JALLAH 8.51 0.04 2.07 0.59% 0.50%
HON. CHARLES K. BARDLY 11.24 0.06 2.05 0.59% 0.67%
HON. DR. BHOFAL CHAMBERS 7.88 0.04 1.75 0.50% 0.47%
HON. FREDERICK D. CHERUE 5.69 0.03 1.62 0.46% 0.34%
HON. ABRAHAM V. CORNEH, II 8.77 0.04 1.56 0.45% 0.52%
HON. TOGBAH J. MULBAH 11.45 0.06 1.49 0.43% 0.68%
HON. LESTER M. PAYE 8.39 0.04 1.49 0.43% 0.50%
HON. GEORGE T. TENGBEH 6.57 0.03 1.44 0.41% 0.39%
HON. J.S.B. THEODORE MOMO, JR. 7.05 0.04 1.25 0.36% 0.42% HON. GABRIEL NYENKAN FOFI SAHR BAIMBA,
SR. 7.31 0.04 1.17 0.34% 0.43%
HON. ADAM BILL CORNEH 2.66 0.01 1.00 0.29% 0.16%
HON. SAMUEL G. Z. WALEH 5.48 0.03 0.97 0.28% 0.32%
HON. EMMANUEL J. NUQUAY 5.06 0.03 0.90 0.26% 0.30%
HON. LARRY P. YOUNQUOI 3.20 0.02 0.57 0.16% 0.19%
HON. GARRISON YEALUE 4.20 0.02 0.40 0.11% 0.25%
HON. G. WESSEH BLAMOH 1.97 0.01 0.35 0.10% 0.12%
9
LOCAL NGOs 930.62 6.62 145.29 0.12% 0.11%
LIBERIA RED CROSS SOCIETY 501.61 2.02 85.03 58.52% 53.90%
FIRST RESPONDER EMER. 245.14 1.07 33.19 22.84% 26.34%
CHAL 53.97 0.64 7.97 5.49% 5.80%
CARITAS / MOTHER PATERN COL. 32.24 0.64 5.23 3.60% 3.46%
AFRICAN FELLOWSHIP CHRISTIAN INT'L 19.25 4.08 2.81% 2.07%
FOUNDATION FOR WOMEN IN LIBERIA 18.71 0.37 3.24 2.23% 2.01%
HOPE FOR WOMEN INT'L 18.87 0.38 2.45 1.69% 2.03%
COMMUNITY HELP INSIGHT LIB. 16.88 0.27 1.95 1.34% 1.81%
W. R. TOLBERT FOUNDATION 9.77 1.58 1.09% 1.05%

ANNUAL REPORT FY2014/2015 | LRA 60
No
RECIPIENT CIF VALUE DUTY PAID DUTY WAIVED % OF WAIVER
% OF CIF VALUE
TOTAL 882,153.89 3,900.78 121,281.31 100% 100%
REAP 4.59 0.46 0.32% 0.49%
SIRLEAF ORPHANAGGE FOUNDATION LIB. 9.59 1.22 0.11 0.07% 1.03%
10
RELIGIOUS INSTITUTIONS 1,100.62 24.99 130.74 0.11% 0.12%
CATHOLIC ARCHDIOCESE OF MON. 178.78 0.58 19.38 14.82% 16.24%
UNITED METHODIST /LAC/MOH 88.27 1.11 15.29 11.69% 8.02%
CHRISTIAN CONGREGATION OF JW'S 224.64 4.08 13.96 10.68% 20.41%
LIBERIA BAPTIST CONVENTION 97.99 1.96 13.00 9.94% 8.90%
GREAT COMMISSION VICTORY MIN. 85.48 1.63 9.53 7.29% 7.77%
EPISCOPAL CHURCH OF LIBERIA 45.17 0.60 6.90 5.28% 4.10%
BIBLE SOCIETY IN LIBERIA 81.28 1.63 6.07 4.64% 7.38%
LIVING WORD COMM. CHURCH 27.80 0.26 5.07 3.88% 2.53%
CATHOLIC ARCHDIOCESE OF GBARNGA 26.73 0.53 4.34 3.32% 2.43%
CENTRAL CHURCH OF CHRIST 27.86 0.56 4.26 3.26% 2.53%
THE LORD'S PRAYER MINISTRY 13.28 0.27 3.35 2.56% 1.21%
WORLD HARVEST CHRISTIAN MINISTRY / MOH 22.14 2.75 2.10% 2.01%
PRISON FELLOWSHIP 7.68 0.15 2.59 1.98% 0.70%
ST. SIMON BAPTIST CHURCH 8.07 2.44 1.87% 0.73% ABUNDANT LIFE IN CHRIST OUTREACH
MISSION 7.28 2.11 1.61% 0.66%
EVERY HOME FOR CHRIST 10.61 0.21 1.94 1.48% 0.96%
CHRISTIAL HAEALTH ASSOCIATION 17.71 1.81 1.38% 1.61%
GREAT COMMISSION VICTORY CH. 16.57 9.42 1.73 1.33% 1.51%
LIVING WATER CHURCH 15.30 0.31 1.67 1.28% 1.39% ASSOCIATION OF INDEPENDENT CHURCHES
OF AFRICA 20.19 0.40 1.65 1.26% 1.83%
BETTER LIFE CHURCH 7.78 0.16 1.45 1.11% 0.71%
FRONT LINE CHRISTIAN ACADEMY /CHURCH 7.66 0.15 1.33 1.02% 0.70%
EVANGELICAL LUTHERAN CHURCH 7.56 0.15 1.30 1.00% 0.69%
REDEEMERS RELEIF AGENCY INT'L 0.76 1.24 0.95% 0.07%
VICTORY MIN. INT'L INC. 10.63 1.09 0.84% 0.97%
AME ZION CHURCH 3.83 0.08 0.83 0.63% 0.35%
LUTHERAN CHURCH IN LIBERIA 10.00 0.20 0.81 0.62% 0.91%
SEVEN DAY ADVENTIST 8.54 0.14 0.73 0.56% 0.78%
UNITED PENTECOSTAL CH. OF LIB. 5.83 0.12 0.61 0.46% 0.53%
CHRIST CENTER OF PRAISE 4.35 0.09 0.59 0.45% 0.40%
GREAT COMMISSION MOVEMENT OF LIBERIA 5.46 0.11 0.48 0.37% 0.50%
CHURCH AID INC. 5.40 0.11 0.44 0.34% 0.49%
11
EDUCATIONAL INSTITUTIONS
428.00
5.35
68.44
0.06%
0.05%

ANNUAL REPORT FY2014/2015 | LRA 61
No
RECIPIENT CIF VALUE DUTY PAID DUTY WAIVED % OF WAIVER
% OF CIF VALUE
TOTAL 882,153.89 3,900.78 121,281.31 100% 100%
UNIVERSITY OF LIBERIA MED. COLLEGE 172.45 31.27 45.68% 40.29%
BONG TECHNICAL COLLEGE 58.38 1.46 9.08 13.27% 13.64%
WILLIAM V S TUBMAN UNIVERSITY 44.47 8.36 12.21% 10.39%
LOTT CAREY BAPTIST MISSION 40.71 0.81 6.73 9.83% 9.51%
MONROVIA CONSOLIDATED SCH. SYS. 14.24 2.71 3.96% 3.33%
WEST AFRICAN EXAMINATION COUNCIL 8.48 2.48 3.62% 1.98%
LIBERIA POST GRADUATE MED. COL. 12.12 2.20 3.22% 2.83%
CHANGE AGENT NETWORK 20.22 2.63 2.19 3.20% 4.72%
STELLA MARIS POLYT. 41.25 1.98 2.90% 9.64%
WORLD SANCTIFIED INT'L SCHOOL 5.85 0.12 0.60 0.88% 1.37%
ISAAC A DAVID, SR. MEMORIAL SCH. 6.70 0.26 0.42 0.62% 1.57% LEAGUE OF ISLAMIC SCH. AND
PROPAGATORS 3.12 0.06 0.42 0.62% 0.73%
12
RETURNEE STUDENTS 228.29 4.25 42.55 0.04% 0.03%
JARJAR M. KAMARA / MoFA 56.26 10.92 25.65% 24.64%
L. OLANDOR - BOYCE 19.46 0.39 3.15 7.41% 8.52%
AUDRIAN S. FORBES 11.89 1.04 2.79 6.55% 5.21%
DR. JOHN F. TAMBA 17.28 0.35 2.66 6.26% 7.57%
MICHEAL BAYSAH /GOVERNANCE COMM. 14.40 0.29 2.34 5.49% 6.31%
MOHAMMED KONNEH / MOE 9.91 0.20 1.89 4.45% 4.34%
WIL BAKO FREEMAN 9.01 0.18 1.87 4.39% 3.95%
CLLR. AARON B. KPARKILLEN 13.08 0.26 1.85 4.36% 5.73%
CHARLES T. H. DENNIS, JR. 7.36 0.15 1.58 3.70% 3.22%
DR. WILFRED BOAYUE 9.33 0.19 1.51 3.56% 4.09%
MOLLEY O. KAIZOLU 5.97 0.12 0.97 2.28% 2.61%
BEDEE N. KANNEH /VINNIE 2.58 0.05 0.72 1.69% 1.13%
JASPER TAMBA CHOUWO 2.37 0.05 0.70 1.65% 1.04%
MARTIN SANDIKE 2.93 0.06 0.68 1.61% 1.28%
LENIN TOWANA 2.85 0.06 0.65 1.52% 1.25%
GABRIEL W. TARLEH 2.87 0.06 0.64 1.50% 1.26%
JOHN KAWIE ZORGAR, JR. 2.80 0.06 0.62 1.45% 1.23%
ROBERT SOLE PAYWALA 2.44 0.05 0.55 1.29% 1.07%
M0RRIS V. KARVAH 2.51 0.05 0.54 1.28% 1.10%
PRINCE P. NELSON 2.12 0.04 0.54 1.28% 0.93%
ALBERT K. JAJA 2.45 0.05 0.54 1.27% 1.07%
EMMANUEL W. WILLIAMS 2.46 0.05 0.52 1.23% 1.08%
ZARWU K. ZAYZAY 1.85 0.04 0.47 1.11% 0.81%
CHARLETY D. WESSEH 2.46 0.05 0.46 1.08% 1.08%

ANNUAL REPORT FY2014/2015 | LRA 62
No
RECIPIENT CIF VALUE DUTY PAID DUTY WAIVED % OF WAIVER
% OF CIF VALUE
TOTAL 882,153.89 3,900.78 121,281.31 100% 100%
ABIMELECH PAYE GBATU 2.17 0.04 0.44 1.05% 0.95%
BENEDICT Y. HARLEYSON 2.69 0.05 0.44 1.03% 1.18%
JOHN K. JALLAH 2.79 0.06 0.44 1.02% 1.22%
HARRIET PEAL KEAMU 2.32 0.05 0.43 1.01% 1.02%
FRANCIS WALLACE 2.63 0.05 0.39 0.92% 1.15%
ROLAND DADDY KALLON 1.35 0.03 0.35 0.82% 0.59%
STEVEN DA WONKAY 5.24 0.10 0.34 0.80% 2.30%
ALVIN TAMBA 1.53 0.03 0.31 0.74% 0.67%
CHARLOTTE PEARSON W 0.93 0.02 0.23 0.54% 0.41%

ANNUAL REPORT FY2014/2015 | LRA 63
Table A2: Petroleum Goods Waiver: Detailed Listing (Thousands of US Dollars)
NO. CATEGORIES AGO PMS JET FUEL ATK DUTY WAIVED % OF DUTY WAIVED
1
DIPLOMATIC MISSION 6,195,673 109,500 24,000 4,000 2,539 46.37% UNMIL 4,559,323 40,000 24000 4,000 1,852.93 72.99% U S EMBASSY 1,016,250 12,000 411.9 16.22% SUPREME FOOD 366,000 146.4 5.77% CHINESE EMBASSY 104,000 41.6 1.64% NIGERIAN EMBASSY 41,500 17,000 24.25 0.96% S. LEONE EMB. 16,000 30,500 20.13 0.79% LEBANESE EMBASSY 19,500 6,000 10.5 0.41% ERUOPEAN UNION 24,000 9.6 0.38% EGYPTIAN EMBASSY 15,000 4,000 7.8 0.31% PAE 12,000 4.8 0.19% UNICEF 10,000 4 0.16% UNHCR 5,100 2.04 0.08% QATAR EMBASSY 3,000 1.2 0.05% FRENCH EMBASSY 2,000 0.8 0.03% SWISS EMB./SIDA 2,000 0.8 0.03%
2
GOVERNMENT MINISTRIES & AGENCIES 3,267,500 1,307.0 23.87% L E C 2,900,500 1,160.2 88.70% LWSC 367,000 146.8 11.23%
3
GOVERNMENT RELATED PROJECTS 2,476,500 8,000 33,000 524.6 9.58% CICO180 687,000 274.8 52.38% CHICO 519,000 8,000 33,000 224 42.70% CHINA HENAN 57,000 22.8 4.00% DIA NIPPON 5,000 2 0.38% SHANXI CONST. 2,500 1 0.19%
4
NATIONAL LEGISLATURE 369,000 1,038,000 615 11.23% HOUSE OF REP. 209,000 868,000 474.2 77.14% HOUSE OF SENATE 160,000 170,000 140.5 22.86%
5
CONCESSION 682,500 265 4.84% L A C 568,500 227.4 85.78% SALALA 50,000 20 7.54% CHEVRON 24,500 9.8 3.70% SIME DARBY 39,500 7.9 2.98%
6
INVESTMENT INCENTIVE 32,000 13 0.23% DURA PLAST 27,000 10.8 84.38% SETHI BROTHERS 5,000 2 15.63%
7
MEDICAL INSTITUTIONS 103,000 41 0.75% ST. JOSEPH CAT. HOSPITAL 68,000 27.2 66.02% PHEBE HOSPITAL 30,000 12 29.13% JACKSON F. DOE HOSPITAL 4,000.00 1.6 3.88% SDA HOSPITAL 1,000.00 0.4 0.97%
8
INTERNATIONAL NGOs 425,500 500 170.43 3.11% PAE /USAID 180,000 72 42.25% PAE GOV'T SERV. 95,500 38.2 22.41% PAE / EBOLA RES. 92,500 37 21.71% ICRC 29,000 11.6 6.81% RBHS/USAID 16,500 500 6.83 4.00% PEACE CORPS 6,000 2.4 1.41% SMITH AGENCY / SIDA 4,000 1.6 0.94% SWISS AGENCY 2,000 0.8 0.47%
TOTAL 12,345,673 1,148,000 32,000 37,000 5,475 100%

ANNUAL REPORT FY2014/2015 | LRA 63
A B= A x 84 C D= C x 84 E F= E x 84 G=C-A H= G x 84 I
Description / ACCOUNT TITLE
*Actual
Amounts (US$)
* Actual Amounts
(L$)
Final Budget
(US$)
Final Budget (L$)
Original Budget
(US$)
Original Budget
(L$)
Difference: Final
Budget & Actual
(US$)
Difference: Final
Budget & Actual (L$)
Var. % INFLOWS Authorized Allocation (Subsidy from GOL) 13,106,502 1,100,946,187 13,106,502 1,100,946,187 13,108,017 1,101,073,428 - - - Other Receipts (APM Terminal) 56,853 4,775,652 56,853 4,775,652 - - - - - T ot a l re c e ipt 13, 163, 355 1, 105, 721, 839 13, 163, 355 1, 105, 721, 839 13, 108, 017 1, 101, 073, 428 - - - OUTFLOWS
Compensation of Employees Basic Salary 5,997,199 503,764,677 8,252,790 693,234,352 8,252,790 693,234,352 2,255,591 189,469,675 27.33 Overtime 25,382 2,132,106 25,382 2,132,106 2,500 210,000 - - - Residential Rental and Lease Allowance 2,900 243,600 24,920 2,093,267 24,920 2,093,267 22,020 1,849,667 88.36 Employer'S Contributions: NASSCORP 6,873 577,313 23,273 1,954,946 23,273 1,954,946 16,400 1,377,633 70.47 Incapacity, Death Benefits and Funeral Expenses 1,756 147,542 1,756 LRA Provident Fund - - 250,465 21,039,089 250,465 21,039,089 250,465 21,039,089 100.00
T ot a l C ompe nsa t ion of Employe e s 6 , 0 3 4 , 1 1 0 5 0 6 , 8 6 5 , 2 3 7 8 , 5 7 8 , 5 8 6 7 2 0 , 4 5 3 , 7 5 9 8 , 5 5 3 , 9 4 8 7 1 8 , 5 3 1 , 6 5 3 2 , 5 4 4 , 4 7 7 2 1 3 , 7 3 6 , 0 6 4 2 9 . 6 6
Consumption of Fixed Capital Transport Equipment 61,250 5,145,000 48,131,888 758,693 63,730,171 511,749 42,986,888 - Miscellaneous Office Equipment 33,130 2,782,917 559,270 46,978,659 559,270 46,978,659 526,140 44,195,742 94.08 Furniture & Fixtures 17,185 1,443,501 76,632 6,437,077 76,632 6,437,077 59,447 4,993,576 77.58 ICT Infrastructure 39,280 3,299,560 117,984 9,910,648 117,984 9,910,648 78,703 6,611,087 66.71
T ot a l C onsumpt ion of F ixe d C a pit a l 1 5 0 , 8 4 5 1 2 , 6 7 0 , 9 7 8 1 , 3 2 6 , 8 8 4 1 1 1 , 4 5 8 , 2 7 2 1 , 5 1 2 , 5 7 8 1 2 7 , 0 5 6 , 5 5 5 1 , 1 7 6 , 0 3 9 9 8 , 7 8 7 , 2 9 4 8 8 . 6 3 -
Use of Goods and Services Foreign Means Of Travel 49,860 4,188,255 54,976 4,617,979 81,776 6,869,179 5,116 429,724 9.31 Foreign Daily Subsistence Allowance 86,487 7,264,947 93,469 7,851,435 91,469 7,683,435 6,982 586,488 7.47 Foreign Incidental Allowance 5,350 449,400 7,000 588,000 3,200 268,800 1,650 138,600 23.57 Domestic Means Of Travel 6,785 569,967 26,506 2,226,513 26,506 2,226,513 19,721 1,656,546 - Domestic Daily Subsistence Allowance 36,188 3,039,754 43,567 3,659,636 23,567 1,979,636 7,380 619,881 16.94 Domestic Travel -Incidental Allowance 2,885 242,340 2,885 242,340 160 13,440 - - - Electricity 3,611 303,305 50,267 4,222,397 50,267 4,222,397 46,656 3,919,092 92.82 Water And Sewage 2,241 188,219 7,430 624,093 7,430 624,093 5,189 435,874 69.84 Telecommunication, Internet, Postgae & Courier 53,726 4,513,014 69,547 5,841,987 269,547 22,641,987 15,821 1,328,973 22.75 Residential Property Rental 14,725 1,236,900 37,308 3,133,904 37,308 3,133,904 22,583 1,897,004 60.53 Office Buildings Rental & Leases 45,528 3,824,310 59,800 5,023,200 59,800 5,023,200 14,273 1,198,890 - Fuel & Lubricants (Utility) -Vehicles 73,597 6,182,114 240,469 20,199,390 240,469 20,199,390 166,872 14,017,276 69.39
Use of G ood s a nd S e rvic e s C /F 380, 982 32, 002, 525 693, 225 58, 230, 874 891, 500 74, 885, 974 312, 242 26, 228, 349 45.04
APPENDIX B: Financial Statements Table B: FINANCIAL STATEMENTS
STA TEMENT OF C OMPA RISON OF B U DGET A ND A C TU A L
F OR THE F IF TEEN (15) MONTHS ENDED JU NE 30, 2015
64

ANNUAL REPORT FY2014/2015 | LRA 64
A B= A x 84 C D= C x 84 E F= E x 84 G=C-A H= G x 84 I Description / ACCOUNT TITLE
Actual Amounts
(US$)
Actual Amounts
(L$)
Final Budget
(US$)
Final Budget (L$)
Original Budget
(US$)
Original Budget
(L$)
Difference: Final
Budget & Actual
(US$)
Difference: Final
Budget & Actual
(US$)
% Var.
(US$) INFLOWS
Use of Good s a nd S ervices B /F 380, 982 32, 002, 349 693, 225 58, 230, 874 891, 500 74, 885, 974 312, 242 26, 228, 349 45.04 Fuel & Lubricants ( Utility) - Bikes - - 1,623 136,335 46,623 3,916,335 1,623 136,335 100.00 Fuel & Lubricants (Generators) 44,134 3,707,273 119,459 10,034,559 162,606 13,658,907 75,325 6,327,286 63.05 Repairs & Maint. Civil 21,051 1,768,266 105,460 8,858,649 105,460 8,858,649 84,409 7,090,383 80.04 Repair & Maint. Vehicles 6,423 539,518 48,715 4,092,026 48,715 4,092,026 42,292 3,552,509 86.82 Repairs & Maint. Motor Cycles 3,581 300,814 4,976 417,954 4,976 417,954 1,395 117,140 28.03 Repairs & Maint. Generators 15,212 1,277,768 15,507 1,302,600 55,507 4,662,600 296 24,832 1.91 Repairs & Maint. Of Equipment 94,918 7,973,104 94,918 7,973,104 3,129 262,844 - - - Cleaning Materials & Services 20,887 1,754,500 52,873 4,441,334 52,873 4,441,334 31,986 2,686,834 - Stationeries & Office Supplies 61,465 5,163,051 65,302 5,485,367 50,302 4,225,367 3,837 322,316 5.88 Printing & Publication Services 77,988 6,550,950 121,412 10,198,635 136,412 11,458,635 43,425 3,647,685 35.77 Newspapers, Books & Specialized Publications - - 84,047 7,059,914 84,047 7,059,914 84,047 7,059,914 - Employees ID Cards 3,552 298,368 27,001 2,268,084 27,001 2,268,084 23,449 1,969,716 86.84 Other Specialized Materials & Services/Veh. Registration 10,239 860,101 14,097 1,184,177 29,097 2,444,177 3,858 324,076 - Media relations, Intelligence and Promotions 64,946 64,946 Professional Services 48,663 4,087,653 207,932 17,466,329 207,932 17,466,329 159,270 13,378,675.80 - Board Fees and Management 21,600 1,814,400 36,000 3,024,000 36,000 3,024,000 14,400 1,209,600 - Local Training 230 19,354 4,724 396,781 4,724 396,781 4,493 377,427 - Foreign Training 34,680 2,913,155 43,680 3,669,155 28,680 2,409,155 9,000 756,000 20.60 Tax Education 1,980 166,295 27,994 2,351,529 27,994 2,351,529 26,015 2,185,233.96 92.93 Entertainment, Representations & Gifts 9,219 774,395 14,250 1,196,979 14,250 1,196,979 5,031 422,583.84 35.30 Operational Expenses 446,842 37,534,714 485,186 40,755,585 100,186 8,415,585 38,344 3,220,871.64 7.90 Int'L Organization Fees & Dues 65,035 5,462,925 67,675 5,684,685 67,675 5,684,685 2,640 221,760.00 3.90 Bank Charges and other Bank Related Costs 2,596 218,053 2,596 218,053 - - Revenue Enforcement 11,656 979,107 17,455 1,466,180 17,455 1,466,180 5,798 487,072.32 33.22 Other Compensation/Whistleblower 3,113 261,465 4,702 394,980 4,702 394,980 1,589 133,514.64 - Personnel Insurance 14,178 1,190,923 70,250 5,901,014 70,250 5,901,014 56,073 4,710,090.84 79.82 Insurance For Vehicles 1,582 132,860 60,296 5,064,839 60,296 5,064,839 58,714 4,931,978.52 97.38 Other Off. Mat. & Consumables/Notary Seals & Forms - - 2,460 206,640 2,460 206,640 2,460 206,640 - Uniforms & Specialized Clothing - - 200,640 16,853,760 200,640 16,853,760 200,640 16,853,760 100.00
Special Project
Real Estates Block Mapping and Database Project - - 500,000 42,000,000 500,000 42,000,000 500,000 42,000,000 100.00 T ota l Use of Good s a nd S ervices 1, 466, 750 117, 751, 418 3, 259, 399 268, 334, 119 3, 041, 491 255, 485, 254 1, 792, 650 150, 582, 582 55.00
GRAND TOTAL 7,651,704 637,287,633 13,164,870 1,100,246,158 13,108,017 1,101,073,471 5,513,166 463,106,067 41.88
STATEMENT OF COMPARISON OF BUDGET AND ACTUAL
F OR THE F IF TEEN (15) MONTHS ENDED JUNE 30, 2015
65
Publication Information
This report has been prepared by the Policy, Statistics and Strategic Planning Division of the Liberia Revenue
Authority.
For more information, please visit:
Liberia Revenue Authority ELWA Junction
Paynesville, Liberia
Or visit our website at:
www.lra.gov.lr
ANNUAL REPORT FY2014/2015 | LRA 66