annual report and accounts as at 31 december 2012 · stefano landi board of statutory ......
TRANSCRIPT

Clear answers for real benefits.Annual Report and Accounts as at 31 Decem
ber 2012
Annual Report and Accountsas at 31 December 2012
www.fineco.it


Annual Report and Accountsas at 31 December 2012
C ustomer testimonials are the common thread of this year’s annual report to illustrate the concrete solutions we provide every day. These true stories were told first-hand and collected by the colleagues
who worked with them to offer real benefits.
Each story lends an authentic voice to how we are having a positive impact on our stakeholders. We are making a difference by recognizing everyday challenges and opportunities, and by contributing to the economic, social and cultural well-being of the communities we serve.
This report’s creative concept reflects our commitment by displaying two pieces that fit together. This represents the union between the real-life needs of our clients and the practical solutions that we offer.
Above all, we believe that being a commercial bank means engaging in meaningful dialogue with those with whom we come into contact. This enables us to provide simple, quick and effective responses that perfectly meet customer needs.
Inside you will find some of these stories. We hope the next one will be yours.


3FinecoBank · Annual Report and Accounts as at 31 December 2012
Board of Directors and Board of Statutory Auditors 5
Report on Operations 7Introduction to the Accounts 8Summary data 9Key figures 14Business performance and main initiatives in the period 16Commercial activities and developmentof new products and services 18
On-line Trading 19On-line Banking 20Personal Financial Advisers Network 22
Operating structure 24Human resources 24Technology infrastructure 26Internal control system 27Risk management and control 28Organisational structure 30Business continuity plan (BCP) 32
Main balance sheet aggregates 33Regulatory capital and prudential requirements 42Income Statement Figures 43Transactions with Group companies 52Subsequent Events and Outlook 53Proposal for the approval of the accounts and allocation of profit for the year 54Reconciliation of condensed accounts to mandatory reporting schedule 55Report of the Board of Statutory Auditors 58Report of the External Auditors 61
Bank Financial Statements 65Balance Sheet 66Income Statement 67Statement of Comprehensive Income 67Statement of Changes in Shareholders’ Equity 68Cash Flow Statement 69
Notes to the Accounts 71Part A - Accounting Policies 73Part B - Balance Sheet 99Part C - Income Statement 133Part D - Comprehensive income 147Part E - Information on Risks and Hedging Policies 151Part F - Shareholders’ Equity 185Part G - Business Combinations 191Part H - Related-Party Transactions 193Part I - Share-based payments 201Part L - Segment reporting 207
Annex 209
Contents


5FinecoBank · Annual Report and Accounts as at 31 December 2012
Board of Directors and Board of Statutory Auditors
Board of Directors
Enrico Cotta Ramusino Chairman
Girolamo Ielo Vice Chairman
Alessandro Foti Managing Director
Alfredo Michele Malguzzi Directors Alberto Viappiani Emilio Lombardi Laura Stefania Penna Mariangela Grosoli Stefano Landi
Board of Statutory Auditors
Giancarlo Noris Gaccioli Chairman
Barbara Aloisi Statutory Auditors Francesca Muserra
Marzio Duilio Rubagotti Stand-in Statutory Auditors
KPMG S.p.A. External Auditors
Share capital€200,070,430.89 fully paid-up, divided into 606,274,033 shares with a par value of €0.33, 100.00% held by UniCredit S.p.A..
Registered officePiazza Durante 11, 20131 Milan, Italy
“FinecoBank Banca Fineco S.p.A.”in abbreviated form “FinecoBank S.p.A.”, or “Banca Fineco S.p.A.”or “Fineco Banca S.p.A.”Company controlled by UniCredit S.p.A., Gruppo Bancario UniCredito Italiano, Register of Banking Groups no. 2008.1, Member of the National Interbank Deposit Guarantee Fund, Italian Banking Association Code 03015,Tax Code and Milan Company Register no. 01392970404 - R.E.A. (Economic and Administrative Index) no. 1598155, VAT No. 12962340159
On 17 April 2012 the Director Mr. Oreste Massolini, the Statutory Auditor Mr. Gabriele Villa and Stand-in Statutory Auditor Mr. Luciano Masini submitted their resignations from their respective positions.
On the same date the Shareholders’ Meeting appointed Ms. Laura Stefania Penna as Board Director, Ms. Barbara Aloisi as Statutory Auditor and Mr. Marzio Duilio Rubagotti as Stand-in Statutory Auditor, who shall remain in office until the date of the Shareholders’ Meeting called to approve the 2013 Annual Report.
On 26 April 2012 the Statutory Auditor Mr. Aldo Milanese submitted his resignation from the position; on the same date, in accordance with the Civil Code, the Stand-in Statutory Auditor Mr. Umberto Bocchino took over the role.
On 8 May 2012 the Statutory Auditor Mr. Umberto Bocchino submitted his resignation from the position; on the same date, in accordance with the Civil Code, the Stand-in Statutory Auditor Marzio Duilio Rubagotti took over the role until the next available Shareholders’ Meeting.
On 26 June 2012 the Director and Vice Chairman Mr. Aldo Milanese submitted his resignation from the position.
On 27 June 2012 the Shareholders’ Meeting reduced the number of Board members from ten to nine and appointed Mr. Giandomenico Genta as Statutory Auditor, and Ms. Francesca Muserra and Mr. Marzio Duilio Rubagotti as new Stand-in Statutory Auditors.
On 30 November 2012 the employment relationship with the General Manager Mr. Franco Ravaglia was terminated.
On 12 December 2012, with effect from 17 December 2012, the Director Mr. Frederik Herman Geertman submitted his resignation from the position.
On 22 January 2013, following the resignation of the Director Mr. Frederik Geertman, the Board of Directors co-opted Mr. Emilio Lombardi as a new Director.
On 25 January 2013 the Statutory Auditor Mr. Genta Giandomenico submitted his resignation from the position; on the same date, in accordance with the Civil Code, the Stand-in Statutory Auditor Ms. Francesca Muserra took over the role.


7FinecoBank · Annual Report and Accounts as at 31 December 2012
Report on Operations
Introduction to the Annual Report and Accounts 8Summary data 9Key figures 14Business performance and main initiatives during the year 16Commercial activities and developmentof new products and services 18
On-line Trading 19On-line Banking 20Personal Financial Advisers Network 22
Operating structure 24Human resources 24Technology infrastructure 26Internal control system 27Risk management and control 28Organisational structure 30Business continuity plan (BCP) 32
Main balance sheet aggregates 33Regulatory capital and prudential requirements 42Income Statement Figures 43Transactions with Group companies 52Subsequent Events and Outlook 53Proposal for the approval of the accounts and allocation of profit for the year 54Reconciliation of condensed accounts to mandatory reporting schedule 55Report of the Board of Statutory Auditors 58Report of the External Auditors 61

8
Report on Operations
Annual Report and Accounts as at 31 December 2012 · FinecoBank
Introduction to the Annual Report and Accounts
The annual report and accounts as at 31 December 2012 of FinecoBank Banca Fineco S.p.A. (hereinafter referred to as FinecoBank) have been prepared, as required by Legislative Decree no. 38/2005, in accordance with the International Financial Reporting Standards and International Accounting Standards (hereinafter referred to as “IFRS”, “IAS”, or international accounting standards) issued by the International Accounting Standards Board (IASB) and the related interpretations by the International Financial Reporting Interpretations Committee (IFRIC), approved by the European Commission according to the procedure set forth under Article 6 of Community Regulation (EC) no. 1606/2002 of 19 July 2002.The Bank of Italy – whose powers already set forth by Legislative Decree no. 87/92 as regards the financial statements of banks and financial companies subject to supervision have been further confirmed by said decree – established the formats for the financial statements and for the related notes in its Circular no. 262 of 22 December 2005 as amended.
The Annual Report and Accounts include:• the Report on Operations, which contains the condensed
accounts, the main results of business areas and comments on the results for the period;
• the report of the Board of Statutory Auditors;• the report of the External Auditors;• the bank’s financial statements, presented with a comparison to
those of 2011;• the Notes to the Accounts.

9FinecoBank · Annual Report and Accounts as at 31 December 2012
Summary data
Condensed Accounts
Balance Sheet (Amounts in € thousand)
ASSETS 12.31.2012 12.31.2011
CHANGE
AMOUNT %
Cash and cash balances 7 4 3 75.0%
Financial assets held for trading 7,589 11,413 (3,824) -33.5%
Loans and receivables with banks 17,271,573 16,282,014 989,559 6.1%
Loans and receivables with customers 553,606 524,547 29,059 5.5%
Financial investments 69,430 57,784 11,646 20.2%
Hedging instruments 73,745 78,290 (4,545) -5.8%
Property, plant and equipment 8,700 9,362 (662) -7.1%
Goodwill 89,602 89,602 - -
Other intangible assets 8,177 8,718 (541) -6.2%
Tax assets 47,999 46,018 1,981 4.3%
Non-current assets and disposal groups classified as held for sale - 145 (145) -100.0%
Other assets 162,042 168,992 (6,950) -4.1%
Total assets 18,292,470 17,276,889 1,015,581 5.9%
LIABILITIES AND SHAREHOLDERS’ EQUITY 12.31.2012 12.31.2011
CHANGE
AMOUNT %
Deposits from banks 2,065,153 1,198,064 867,089 72.4%
Deposits from customers and debt securities in issue 15,339,334 15,279,318 60,016 0.4%
Financial liabilities held for trading 7,177 3,630 3,547 97.7%
Hedging instruments 73,251 75,423 (2,172) -2.9%
Provisions for risks and charges 108,976 98,361 10,615 10.8%
Tax liabilities 66,588 58,736 7,852 13.4%
Other liabilities 187,930 186,117 1,813 1.0%
Shareholders’ equity 444,061 377,240 66,821 17.7%
- capital and reserves 318,309 315,120 3,189 1.0%- revaluation reserves for available-for-sale financial assets 285 (644) 929 n.c.- net profit 125,467 62,764 62,703 99.9%Total liabilities and shareholders’ equity 18,292,470 17,276,889 1,015,581 5.9%

10
Report on Operations
Annual Report and Accounts as at 31 December 2012 · FinecoBank
Summary data (Continued)
Balance Sheet - Quarterly data (Amounts in € thousand)
ASSETS 12.31.2012 09.30.2012 06.30.2012 03.31.2012 12.31.2011
Cash and cash balances 7 8 11 10 4
Financial assets held for trading 7,589 13,691 29,008 13,572 11,413
Loans and receivables with banks 17,271,573 16,824,519 17,180,549 17,160,941 16,282,014
Loans and receivables with customers 553,606 534,224 557,692 595,644 524,547
Financial investments 69,430 59,900 63,534 60,440 57,784
Hedging instruments 73,745 104,936 121,284 113,229 78,290
Property, plant and equipment 8,700 8,651 8,999 9,177 9,362
Goodwill 89,602 89,602 89,602 89,602 89,602
Other intangible assets 8,177 7,787 8,171 8,368 8,718
Tax assets 47,999 46,060 45,044 46,926 46,018
Non-current assets and disposal groups classified as held for sale - 145 145 145 145
Other assets 162,042 163,653 146,244 120,331 168,992
Total assets 18,292,470 17,853,176 18,250,283 18,218,385 17,276,889
LIABILITIES AND SHAREHOLDERS’ EQUITY 12.31.2012 09.30.2012 06.30.2012 03.31.2012 12.31.2011
Deposits from banks 2,065,153 2,000,864 1,567,577 1,618,403 1,198,064
Deposits from customers and debt securities in issue 15,339,334 14,969,035 15,816,467 15,735,457 15,279,318
Financial liabilities held for trading 7,177 9,281 24,418 12,816 3,630
Hedging instruments 73,251 104,012 119,348 110,883 75,423
Provisions for risks and charges 108,976 102,780 98,550 101,669 98,361
Tax liabilities 66,588 73,854 52,338 81,876 58,736
Other liabilities 187,930 177,175 184,923 144,937 186,117
Shareholders’ equity 444,061 416,175 386,662 412,344 377,240
- capital and reserves 318,309 318,309 318,309 377,884 315,120- revaluation reserves for available-for-sale financial assets 285 225 (200) 264 (644)- net profit 125,467 97,641 68,553 34,196 62,764Total liabilities and shareholders’ equity 18,292,470 17,853,176 18,250,283 18,218,385 17,276,889

11FinecoBank · Annual Report and Accounts as at 31 December 2012
Income statement (Amounts in € thousand)
12.31.2012 12.31.2011
CHANGES
AMOUNT %
Net interest 243,469 133,602 109,867 82.2%
Net fees and commissions 143,611 155,127 (11,516) -7.4%
Net trading, hedging and fair value income 28,069 24,891 3,178 12.8%
Net other expenses/income (5,368) (13,722) 8,354 -60.9%
OPERATING INCOME 409,781 299,898 109,883 36.6%Payroll costs (61,022) (59,971) (1,051) 1.8%
Other administrative expenses (148,670) (135,076) (13,594) 10.1%
Recovery of expenses 31,474 30,256 1,218 4.0%
Amortisation, depreciation and impairment losses on intangible and tangible assets (8,245) (8,581) 336 -3.9%
Operating costs (186,463) (173,372) (13,091) 7.6%OPERATING PROFIT (LOSS) 223,318 126,526 96,792 76.5%Net impairment losses on loans andprovisions for guarantees and commitments (2,852) (2,794) (58) 2.1%
NET OPERATING PROFIT (LOSS) 220,466 123,732 96,734 78.2%Provisions for risks and charges (18,356) (17,381) (975) 5.6%
Net income from investments (3) 94 (97) -103.2%
PROFIT (LOSS) BEFORE TAX FROM CONTINUING OPERATIONS 202,107 106,445 95,662 89.9%Income tax for the period (76,640) (43,681) (32,959) 75.5%
PROFIT (LOSS) AFTER TAX FROM CONTINUING OPERATIONS 125,467 62,764 62,703 99.9%NET PROFIT (LOSS) FOR THE YEAR 125,467 62,764 62,703 99.9%

12
Report on Operations
Annual Report and Accounts as at 31 December 2012 · FinecoBank
Income statement - Quarterly data (Amounts in € thousand)
2012
Q4 Q3 Q2 Q1
Net interest 56.685 57.434 66.683 62.667
Net fees and commissions 36.482 36.116 31.227 39.786
Net trading, hedging and fair value income 4.689 7.391 7.747 8.242
Net other expenses/income (2.451) (2.783) (943) 809
OPERATING INCOME 95.405 98.158 104.714 111.504 Payroll costs (16.214) (14.989) (15.177) (14.642)
Other administrative expenses (36.933) (34.263) (35.978) (41.496)
Recovery of expenses 7.169 8.187 7.031 9.087
Amortisation, depreciation and impairment losses on intangible and tangible assets (2.220) (2.053) (2.005) (1.967)
Operating costs (48.198) (43.118) (46.129) (49.018)OPERATING PROFIT (LOSS) 47.207 55.040 58.585 62.486 Net impairment losses on loans andprovisions for guarantees and commitments (880) (738) (373) (861)
NET OPERATING PROFIT (LOSS) 46.327 54.302 58.212 61.625 Provisions for risks and charges (6.328) (4.682) (1.953) (5.393)
Net income from investments - - (2) (1)
PROFIT (LOSS) BEFORE TAX FROM CONTINUING OPERATIONS 39.999 49.620 56.257 56.231 Income tax for the period (12.173) (20.532) (21.900) (22.035)
PROFIT (LOSS) AFTER TAX FROM CONTINUING OPERATIONS 27.826 29.088 34.357 34.196 NET PROFIT (LOSS) FOR THE PERIOD 27.826 29.088 34.357 34.196
Summary data (Continued)

13FinecoBank · Annual Report and Accounts as at 31 December 2012
Income statement - Quarterly data (Amounts in € thousand)
2011
Q4 Q3 Q2 Q1
Net interest 44.332 34.127 29.948 25.195
Net fees and commissions 37.883 39.771 35.163 42.310
Net trading, hedging and fair value income 6.455 7.845 4.087 6.504
Net other expenses/income (1.332) (10.723) (805) (862)
OPERATING INCOME 87.338 71.020 68.393 73.147 Payroll costs (14.467) (15.167) (15.732) (14.605)
Other administrative expenses (31.838) (32.006) (33.315) (37.917)
Recovery of expenses 8.308 8.110 6.966 6.872
Amortisation, depreciation and impairment losses on intangible and tangible assets (2.341) (2.103) (2.164) (1.973)
Operating costs (40.338) (41.166) (44.245) (47.623)OPERATING PROFIT (LOSS) 47.000 29.854 24.148 25.524 Net impairment losses on loans andprovisions for guarantees and commitments (1.269) (1.143) (332) (50)
NET OPERATING PROFIT (LOSS) 45.731 28.711 23.816 25.474 Provisions for risks and charges (9.576) (1.060) (4.187) (2.558)
Net income from investments - - (1) 95
PROFIT (LOSS) BEFORE TAX FROM CONTINUING OPERATIONS 36.155 27.651 19.628 23.011 Income tax for the period (15.671) (10.902) (7.826) (9.282)
PROFIT (LOSS) AFTER TAX FROM CONTINUING OPERATIONS 20.484 16.749 11.802 13.729 NET PROFIT (LOSS) FOR THE PERIOD 20.484 16.749 11.802 13.729
Main balance sheet figures (Amounts in € thousand)
12.31.2012 12.31.2011
CHANGE
AMOUNT %
Loans and receivables with customers(1) 371,765 363,132 8,633 2.4%
Total assets 18,292,470 17,276,889 1,015,581 5.9%
Customer direct deposits(2) 12,211,250 10,660,256 1,550,994 14.5%
Customer indirect deposits(3) 27,767,418 24,418,654 3,348,764 13.7%
Total customer (direct and indirect) deposits 39,978,668 35,078,910 4,899,758 14.0%
Shareholders’ equity 444,061 377,240 66,821 17.7%
1. Ordinary loans and receivables with customers refer solely to loans granted to customers.2. Customer direct deposits include overdrawn current accounts, repos and the Cash Park deposit account.3. Indirect deposits from customers consist of the Bank’s own products and third-party products placed online or through the sales networks of FinecoBank.

14
Report on Operations
Annual Report and Accounts as at 31 December 2012 · FinecoBank
Key figures
Operating Structure
12.31.2012 12.31.2011
No. of Employees 931 910
No. of Human Resources 949 923
No. of Financial Advisers 2.317 2.305
No. of Operating financial outlets 298 285
Number of human resources: includes permanent employees, atypical employees, and Group employees seconded to FinecoBank, net of FinecoBank employees seconded to the Group.Number of operating financial stores: financial stores managed by the Bank and financial stores managed by financial advisers.
Profitability, productivity and efficiency ratios (Amounts in € thousand)
12.31.2012 12.31.2011
Net interest/Operating income 59.41% 44.55%
Income from brokerage and other income/Operating income 40.59% 55.45%
Income from brokerage and other income/Operating costs 89.19% 95.92%
Cost/income ratio 45.50% 57.81%
ROE 38.72% 19.82%
EVA 110.736 51.083
RARORAC 83.28% 41.66%
ROAC 94.36% 51.11%
Operating income/Average resources 438 329
Total customer deposits/Average resources 42.712 38.464
Total customer deposits/(Average resources + PFA) 12.312 10.882
ROE: the shareholders’ equity used for the ratio is the average figure for the period excluding dividends to be distributed and revaluation reserves for available-for-sale assets.EVA (Economic Value Added): expresses the ability to create value in monetary terms, as the difference between net operating profit and the figurative cost of the allocated capital.RARORAC (Risk Adjusted Return on Risk Adjusted Capital): is the ratio of EVA to Allocated Capital and expresses the ability to create value by risk unit as a percentage.ROAC (Return on Allocated Capital): is the ratio of Net Operating Profit and Allocated Capital and expresses the value generated by the Allocated Capital as a percentage.Allocated Capital: is the higher of internal capital (share of capital needed to cover risks, periodically provided by the Parent Company) and regulatory capital. Regulatory capital used to calculate the indicators EVA, RARORAC and ROAC is calculated on a consolidated basis, without considering the floor or the reduction of 25% for belonging to banking Groups.Income from brokerage and other income: Net fees and commissions, Net trading, hedging and fair value income and Net other expenses/income.
Balance Sheet indicators
12.31.2012 12.31.2011
Loans and receivables with ordinary customers/Total assets 2.03% 2.10%
Loans and receivables with banks/Total assets 94.42% 94.24%
Financial assets/Total assets 0.42% 0.40%
Direct deposits/Total liabilities and shareholder's equity 66.76% 61.70%
Shareholders’ equity (including profit)/Total liabilities and shareholder's equity 2.43% 2.18%
Loans and receivables with ordinary customers/Customer direct deposits 3.04% 3.41%
Solvency indicators
12.31.2012 12.31.2011
Common Equity Tier 1 ratio (CET 1 ratio) 9.34% 9.23%
Total capital ratio 9.34% 9.23%
Risk-weighted assets are calculated by multiplying total prudential requirements by 12.5 (the inverse of the minimum compulsory coefficient of 8%). FinecoBank calculates its capital requirement for operational risk using advanced approaches, supplementing total capital requirements for the floors envisaged by Bank of Italy regulations. More specifically, FinecoBank has applied a floor corresponding to the positive difference between 80% of the capital requirements calculated on the basis of the rules in force as at 31 December 2006 and the sum of the capital requirements for credit, counterparty, market and operational risks, calculated using the current provisions of Basel II.

15FinecoBank · Annual Report and Accounts as at 31 December 2012
Market share
TRADING ON ITALIAN STOCK MARKET (ASSOSIM) 12.31.2012 12.31.2011
Third party volumes traded on MTA 19.70% 20.90%
Classification of third party volumes traded on MTA* 1° 1°
No. of index futures contracts entered into for third parties 10.48% 12.89%
Classification of the no. of index futures contracts entered into for third parties 1° 1°
Third party volumes traded on Domestic MOT 4.80% 5.32%
Classification of third party volumes traded on Domestic MOT 7° 6°
Third party volumes traded on EuroMOT 5.33% 5.89%
Classification of third party volumes traded on EuroMOT 5° 6°
Third party volumes traded on EFTFPLUS 8.69% 9.23%
Classification of third party volumes traded on EFTFPLUS 2° 2°
PERSONAL FINANCIAL ADVISERS NETWORK (ASSORETI) 12.31.2012 12.31.2011
Share of Stock market 12.64% 12.32%
Stock classification 3° 3°
Share of Net Deposits market 15.84% 18.71%
Classification of Net Deposits 2° 2°
TOTAL DEPOSITS (BANK OF ITALY) 09.30.2012 12.31.2011
Share of Total Deposits market 1.18% 1.09%
Share of Direct Deposits market 0.94% 0.84%
Share of Indirect Deposits market 1.36% 1.26%
The market share of total deposits relates to 30 September 2012, the latest feedback from the Bank of Italy.* On the basis of the 2012 Assosim Report, FinecoBank ranks in 3rd place for third party volumes traded on the MTA, with a market share of 11.39% compared to 14.75% in 2011. However, considering total
volumes trading for the Italian shares segment and recalculating the market shares to take account of internalised orders (following the introduction of MIFID, financial brokers are permitted to handle orders internally, following the best execution policy), FinecoBank has again confirmed its position as the number 1 broker on the Italian market, with a share of 19.7%.

16
Report on Operations
Annual Report and Accounts as at 31 December 2012 · FinecoBank
FinecoBank is a multi-channel (web, financial advisers, branches) direct bank, which focuses almost exclusively on the retail customer segment.In addition to pursuing the consolidation of its leadership position at domestic and European level in the trading segment, FinecoBank is the UniCredit group’s Asset Gathering bank, with over 2,300 personal financial advisers dedicated to customers who prefer to deal with professionals, focused on providing advice and asset management.
In 2012, FinecoBank continued to be the leading broker In Italy1, with a total of 22.5 million transactions, as well as the leading European broker in terms of the number of orders executed and the range of the products offered in a single account.
FinecoBank holds 2nd place in the Assoreti ranking for net deposits, with a market share of 15.84%.
In terms of customer satisfaction, an excellent level of consensus was again recorded (97%)2, with a positive perception of the quality and completeness of the products and services provided, the versatility of internet banking and relations with the Bank.
In 2012 approximately 74,000 new bank accounts were opened, confirming the market’s interest in the products and services offered by Fineco.
Performance of balance sheet aggregatesTotal (direct and indirect) customer deposits reached €39,979 million, an increase of 14% on the previous year. Indirect customer
deposits as at 31 December 2012 totalled €27,767 million, recording a 13.7% increase over the €24,419 million recorded as at 31 December 2011, continuing the trend of steady growth.
The number of active bank accounts amounted to €661 thousand, with an average total deposit (direct + indirect) of over €60 thousand.
Performance of income statement aggregatesThe net profit from continuing operations amounted to €125.5 million, doubling compared to 2011.
This increase was driven by a rise in operating income, specifically a higher net interest margin, which more than offset the lower fees and commissions generated by trading and internalisation, as a result of the reduction in volumes traded and in transactions, which involved all financial markets.
The difficult market situation highlighted the success of a strategy which for years has been focused on strengthening the offer and introducing new products and services. Thanks to this positioning, customers have maintained and strengthened their relations with FinecoBank, because they have found all the products and services they need to diversify their operations and their investment and trading strategies, with the support of the related platform or through financial advisers.
Business performance and main initiatives in the period
1. According to the 2012 Assosim Report, FinecoBank ranks in 3rd place for third party volumes traded. However, considering total volumes trading for the Italian shares segment and recalculating the market shares to take account of internalised orders (following the introduction of MIFID, financial brokers are permitted to handle orders internally, following the best execution policy), FinecoBank has again confirmed its position as the number 1 broker on the Italian market, with a share of 19.7%.
2. Source TNS Infratest, report December 2012.
Stock Performance and Net Deposits 2012
35,079
12.31.2011
-666
Net assets under
administration
1,611
Net assets under
management
1,392
Net direct deposits
2,563
Market Effect
39,979
12.31.2012

17FinecoBank · Annual Report and Accounts as at 31 December 2012
Communications and external relations
The “Porta tutto in Fineco” (Bring Everything to Fineco) and “Tax Free” campaigns in 2012 offered a bonus for transferring securities and funds, generating positive effects on both the acquisition of assets from new customers and the increase in the share of wallet of existing customers. In terms of acquisition, the Member Gets Member (MGM) campaign continued to demonstrate the extraordinary strength of word-of-mouth among satisfied customers.
During the year, acquisition campaigns were conducted on the target investors and traders.In the social arena, the consolidation of actions on Twitter (where Finecobank has confirmed its position as the most followed bank in Italy) was followed by the launch of the official fan page on Facebook which generated several thousand fans without any advertising initiatives. Customer satisfaction was further increased by the app for Android and iPad, which immediately brought Finecobank to the top of the finance category, even achieving the status of iTunes as “app of the week”.
Marketing and acquisition activities were also conducted at local level, where Personal Financial Advisers implemented geo-targeted marketing actions for lead generation.In the autumn, an advertising campaign was launched to acquire new senior Personal Financial Advisers. The recruiting campaign was transmitted via radio, web and specialised print media.
Near the end of 2012, the new positioning campaign “La banca che semplifica la banca” (The Bank that Simplifies Banking) was launched, which saw an extensive presence of FinecoBank on mass communications media. The campaign, which started with an initial theme “Respiro” (Breathe), will continue throughout 2013, expanding with new themes and creative approaches, with the dual purpose of brand building and advertising the Bank’s products and services.

18
Report on Operations
Annual Report and Accounts as at 31 December 2012 · FinecoBank
Commercial activities and developmentof new products and services
The main commercial activities, products and services released in 2012, which involved all the Bank’s departments and units, within their respective areas, and consisted of feasibility studies, subsequent implementation and sale/placement, are summarised below:• extension of the “Porta titoli e fondi in Fineco” (Bring Securities
and Funds to Fineco), “Member Gets Member” and Fineco Hi-Fi” campaigns;
• activation of the “Tax free” campaign which rewarded customers with free stamp duty for the second half of 2012 and a bonus of up to €4,000 for customers activating the Portafoglio Remunerato (Portfolio Returns) service and transferring securities, funds and liquid funds to FinecoBank;
• implementation of the “Obbligazioni in scadenza” (Maturing Bonds) Event Monitor, which shows customers the details of maturing bonds starting from 15 days before maturity;
• implementation of the Fineco App for iPad on the App Store. The functionalities already available for iPhone and Android were optimised to make the most of the larger screen sizes. New functions were also added to the iPad App, for drawing trend-lines and viewing technical analysis indicators using interactive graphs, with simultaneous display of up to 4 books updated in real time using the Multibook function, and display of Indices, News, Forex and Futures in a single window;
• introduction, on the Fineco platform, of the new BTP Italia bond tool, the first Government bonds linked to Italian inflation, with six-month coupons and a four-year term, specifically designed for the needs of retail savers and investors, to guarantee returns that are always aligned to the change in the cost of living;
• introduction of the new “FinecoBank” account, a no-fee, no interest account which requires that a CashPark deposit account with the new term of one month, called CashPark Open, be opened at the same time;
• development of the “Core Series” product, introducing the new equity funds CORE All Europe, which aim for extensive geographic and currency diversification within Europe, and CORE US Strategy, which invests in equity funds focused on large cap companies and, to a lesser extent, in equity funds focused on mid and small cap companies with significant growth potential;
• development of the product “LOGOS”, introducing European Government bonds (BUND, BTP and OAT) and EUR-USD and JPY-USD exchange rates;
• activation of the online order service for MAV (payment against order) or RAV (special paying in slip issued by government collection agencies) payment orders with deadlines up to 12 months after the entry date;
• development of the Fineco App for Android, adding new functions to check CashPark investments, use the Maxi-withdrawal ATM service and top up payment cards with amounts of the customers’ choosing;
• introduction of the “CashPark Investing” product, which allows customers to open a CAP (Capital Accumulation Plan) in one of the Core Series funds at the time of entering into a CashPark Save time deposit. Under this initiative, automatic monthly transfers are made to the CAP of fixed amounts selected on subscription, transferred from the CashPark account.
The following pages contain the main indicators and results of the Business Areas into which the Bank’s operations are divided: On-line Trading, On-line Banking and Personal Financial Advisers Network.All the activities were carried out with the aim of obtaining economic results from the “industrial” management of the businesses, to minimise their financial risk. The financial management of FinecoBank is oriented towards risk management aimed at protecting the industrial returns on various businesses and not assuming risk positions on its own account.

19FinecoBank · Annual Report and Accounts as at 31 December 2012
On-line Trading
In 2012 FinecoBank further confirmed its leadership in the Italian on-line trading market, despite worsening market conditions compared to the previous year.The active traders segment continues to be adversely impacted by the reduction in volumes in its market, with a general shrinkage in operations, particularly in the domestic and US markets.
The Bank continued to pursue a strategy for completing, innovating and developing the services and products offered through ongoing analysis of customer requests, combined with monitoring of international best practices and listening to feedback from the commercial network and customer care.
These elements generating ideas for developing new products and services and improving the existing offering. Specifically, improvement of the products and services offered continued via:• the new Fineco site, with updated graphics, usability and contents.
Specifically, IT tools have been introduced so that customers can fully monitor their expenses, due dates and assets, as well as the single portfolio that includes all asset classes, new automatic orders, interactive graphics, advanced search and many more new features;
• the Fineco App for iPad, which provides access to the main functionalities of the site, simply and quickly, directly from Apple tablets. This application has been highly successful in terms of downloads, comments and use by users, in addition to being noted as the best app of the week on iTunes. New versions of the app have also been released for Android and iPhone, to further improve on the performance of the previous versions;
• enrichment of the Logos tools, with new Italian and American underlyings, increasing operating limits and improving the usability of the platform;
• introduction of futures on medium-term BTP (Italian Government bonds) and on OAT (10-year French Government bonds), with the goal of improving the range of products on Government bonds at a time of significant interest in this investment class.
In general, the results achieved confirm the success of a business model focused on offering very easy to use innovative services in a comprehensive solution for all target customers.
As a result of Fineco’s good positioning, customers have maintained and strengthened their relations with the Bank, because they have found all the products and services they need (for example, forex, multiday leverage, derivatives, bonds) to diversify their operations and their investment and trading strategies, on the relevant platform.
27,385,792
22,513,118
2011 2012
Total number executed
The total number of orders executed refers to the transactions of retail and institutional customers to buy and sell shares, bonds, derivatives, forex, DFCs, provisions and repos.
Number of orders executed on line broken down by stock market
3,00
0,00
00
6,00
0,00
0
9,00
0,00
0
12,0
00,0
00
15,0
00,0
00
18,0
00,0
00
21,0
00,0
00
Germany France USA Other MarketsItaly (MTA+AH)
2011
20122011 2012
Other markets 121,857 143,956
Italy (MTA+AH) 15,529,949 12,251,904
USA 2,294,678 1,523,324
France 240,446 209,197
Germany 329,337 235,981

20
Report on Operations
Annual Report and Accounts as at 31 December 2012 · FinecoBank
On-line Banking
BankingIn the banking area, with the aim of increasing the attractiveness of the range of bank accounts, the new Fineco Account was introduced, a no-fee, no interest account.This new bank account, replacing the interest-bearing account, features:• no fee and all main banking services free of charge (previously
included in the fee);• no lending interest, but the possibility of interest accruing on liquid
funds, due to the combined opening of the Cash Park deposit account.
Limited to this new category of accounts, the Cash Park range was expanded with a one-month deposit, useful for customers who want to manage their liquid funds for a short period.
For customers who hold the old interest-bearing bank account, an addition to their contracts has been provided, so they can ask for their accounts be converted into the new no-fee, no interest account.
During the year, a series of measures were taken to curb fraud attempts, including:• the introduction of an applications infrastructure called 3D
Secure to make transactions performed by customers on the internet safer;
• the automatic and systematic sending of Text alerts to the mobile phones of credit card holders;
• the development of new procedures aimed at identifying possible compromising situations, with a view to putting preventive measures in place for cards that risk being cloned.
In the personal loans segment, numerous promotions were implemented to increase the amounts disbursed and outstanding in a period where the market is experiencing negative growth rates.
Commercial activities and developmentof new products and services (Continued)
12.31.2011 12.31.2012
No. of current accounts and balance of direct and indirect deposits40,000
35,000
30,000
25,000
20,000
15,000
10,000
5,000
0
750,000
730,000
710,000
690,000
670,000
650,000
630,000
610,000
590,000
570,000
550,000
balance of direct depositsbalance of indirect depositsno. of currents accounts
10,660
24,419
642,571
12,211
27,767
661,389
CreditIn 2012, in line with the performance figures for last year, the indicators relating to the credit card sector showed an upward trend. Specifically, a 2.6% increase was recorded in the number of active credit card holders with full repayment of balance at term, whilst an 11.6% increase was recorded in the number of customers holding credit cards with instalment payment plans (also known as revolving credit cards).In addition, the spending figure increased by 7% compared to the previous year, for a total value of approximately €1.9 billion. The spending of revolving cards represented 2% of the total.
737,884
12.31.2012
No. of Credit Cards issued, net of expired cards
FinecoBank cards
723,431
12.31.2011
Credit Card spending (cash and revolving)
2011 2012
38,000
37,000
36,000
35,000
34,000
33,000
32,000
31,000
30,000
1,950,000
1,750,000
1,550,000
1,350,000
1,150,000
950,000
750,000
Cash spendingRevolving spending
32,468
1,698,608 1,831,908
37,010

21FinecoBank · Annual Report and Accounts as at 31 December 2012
Payment systemsWith regard to payment system services offered to customers, the comparison of the number of transactions handled during 2012 to those in 2011 shows growth in volumes as well as in the number of transactions.
In terms of optimising and expanding the range of services offered to existing customers, the F24 tax forms have been adjusted to include payment of IMU municipal tax, providing the option of revoking payment orders directly on-line up to two days before the deadline, a payment scheduler has been set up for MAV and RAV payment orders, and SEPA Direct Debits can be managed and viewed.
(Amounts in € thousand and numbers in units)
PAYMENT SYSTEMS - SERVICES OFFERED FY 2012 FY 2011 % CHANGE
Amount of outgoing bank transfers 10,672,758 10,516,271 1.5%
Number of outgoing bank transfers 5,468,770 4,752,690 15.1%
Amount of incoming bank transfers 21,114,745 20,957,322 0.8%
Number of incoming bank transfers 8,710,531 8,013,805 8.7%
Amount of preauthorised debits 1,385,891 1,366,773 1.4%
Number of preauthorised debits 6,576,181 6,060,990 8.5%
Amount of preauthorised credits 1,107,530 1,230,344 -10.0%
Number of preauthorised credits 627,172 677,555 -7.4%
Amount of ATM withdrawal transactions 2,690,317 2,556,677 5.2%
Number of ATM withdrawal transactions 14,137,552 13,183,706 7.2%
Amount of ATM cash pay-in transactions 478,877 574,010 -16.6%
Amount of POS payment transactions 1,243,922 1,086,467 14.5%
Number of POS payment transactions 22,313,552 18,804,290 18.7%
Amount of bank cheques debited from accounts other than cash accounts 2,326,657 2,858,322 -18.6%
Number of bank cheques debited from accounts other than cash accounts 981,639 1,104,754 -11.1%

22
Report on Operations
Annual Report and Accounts as at 31 December 2012 · FinecoBank
Personal Financial Advisers Network
Commercial activities and developmentof new products and services (Continued)
In 2012 the efforts linked to acquiring new customers continued, as well as actions to retain existing customers, through the promotional campaigns “Tutto in Fineco” (Bring Everything to Fineco), “Porta titoli e fondi” (Bring Securities and Funds), “Nuova liquidità” (New Liquidity), “Zero bolli” (No Stamp Duty) and “Tax Free”, and through a significant number of customer events organised throughout the country. Net deposits for 2012 reached €1,985 million and the number of new bank accounts opened during the year came to 59,519.Excellent results were achieved in terms of asset restructuring, significantly increasing net assets under management, which amounted to €1,601 million in 2012, reporting significant results for advisory services, which, as a whole, recorded net deposits of €2,221 million. More specifically:• for CORE Series, in addition to expanding the range through the
launch of new segments, new deposits for the year amounted to €1,728 million. Added to the deposits for the previous year, this brings total assets for this product to €2,715 million;
• as regards Fineco Advice, new deposits amounted to €516 million for the year, of which €23 million relating to CORE Series and included under the previous point, which brings the total amount of assets under advisory services to €1,197 million.
In 2012 a significant recruitment project was also launched, to expand the network, with the goal of making a significant jump in size in the three-year period 2013-2015, with the hiring new professionals to expand the network workforce, increasing the customer base as well as assets. During the year, 91 new financial advisers and 61 “beginners” from the “young people project” were hired.As at 31 December 2012, the network was made up of 2,317 personal financial advisers, who operate countrywide through 298 financial stores (Fineco Centres), managed directly by the Company or by the personal financial advisers themselves.
The bank has ensured its constant and continuous presence throughout the country: 860 customer events were organised, involving approximately 25,000 customers and prospective customers. In addition, in December a new “open day” format was introduced, opening Fineco Centres also at the weekends. These events were accompanied by an additional 269 local marketing events, to disseminate brand awareness throughout the country, through local initiatives, advertising and sponsorships.
Personal Financial Advisers Network - assets (Amounts in € thousand)
12.31.2012 % 12.31.2011 % CHANGE % CHANGE
Current accounts, repos and deposit account 8,207,751 25.2% 7,138,778 25.1% 1,068,973 15.0%
BALANCE DIRECT DEPOSITS 8,207,751 25.2% 7,138,778 25.1% 1,068,973 15.0%Segregated accounts 211,267 0.6% 325,446 1.1% (114,179) -35.1%
UCITS and other investment funds 14,617,192 45.0% 11,527,229 40.6% 3,089,963 26.8%
Insurance products 1,611,812 5.0% 1,861,638 6.6% (249,826) -13.4%
BALANCE ASSETS UNDER MANAGEMENT 16,440,271 50.6% 13,714,313 48.3% 2,725,958 19.9%Government securities, bonds and stocks 7,866,546 24.2% 7,541,897 26.6% 324,649 4.3%
BALANCE ASSETS UNDER ADMINISTRATION 7,866,546 24.2% 7,541,897 26.6% 324,649 4.3%BALANCE DIRECT AND INDIRECT DEPOSITS 32,514,568 100.0% 28,394,988 100.0% 4,119,580 14.5%
The table above shows the breakdown of the assets managed by the personal financial advisers network as at 31 December 2012. Total assets, amounting to €32,515 million, increased by 14.5% compared to 31 December 2011.

23FinecoBank · Annual Report and Accounts as at 31 December 2012
Personal Financial Advisers Network - total net deposits (Amounts in € thousand)
FY 2012 % FY 2011 % CHANGE % CHANGE
Current accounts, repos and deposit account 1,014,751 51.1% 659,382 30.9% 355,369 53.9%
BALANCE DIRECT DEPOSITS 1,014,751 51.1% 659,382 30.9% 355,369 53.9%Segregated accounts (140,970) -7.1% (145,846) -6.8% 4,876 -3.3%
UCITS and other investment funds 2,018,315 101.7% 251,029 11.8% 1,767,286 704.0%
Insurance products (276,573) -13.9% (203,381) -9.5% (73,192) 36.0%
BALANCE ASSETS UNDER MANAGEMENT 1,600,772 80.6% (98,198) -4.6% 1,698,970 n.c.Government securities, bonds and stocks (630,353) -31.8% 1,572,130 73.7% (2,202,483) n.c.
BALANCE ASSETS UNDER ADMINISTRATION (630,353) -31.8% 1,572,130 73.7% (2,202,483) n.c.BALANCE DIRECT AND INDIRECT DEPOSITS 1,985,170 100.0% 2,133,314 100.0% (148,144) -6.9%
Total net deposits for 2012 came to €1,985 million, with a good contribution from assets under management. The acquisition of new customers and the restructuring and diversification of assets under management, steering them towards the Core Series and Advice products, have proven to be important tools for growth.
Assets under administration and under management - Total
12.31.2012 % 12.31.2011 % CHANGE % CHANGE
Segregated accounts 212,583 0.8% 326,326 1.3% (113,743) -34.9%
UCITS and other investment funds 14,940,556 53.8% 11,784,277 48.3% 3,156,279 26.8%Insurance products 1,721,404 6.2% 1,905,053 7.8% (183,649) -9.6%
BALANCE ASSETS UNDER MANAGEMENT 16,874,543 60.8% 14,015,656 57.4% 2,858,887 20.4%Government securities, bonds and stocks 10,892,875 39.2% 10,402,998 42.6% 489,877 4.7%
BALANCE ASSETS UNDER ADMINISTRATION 10,892,875 39.2% 10,402,998 42.6% 489,877 4.7%BALANCE DIRECT AND INDIRECT DEPOSITS 27,767,418 100.0% 24,418,654 100.0% 3,348,764 13.7%
The table above shows the figures for assets under management and under administration of FinecoBank customers, including both those linked to a financial adviser and on-line customers. The figures shown refer to the Bank’s own products and to those of third parties placed on-line or through the personal financial advisers network.
% Composition of Total Stock of Assets Personal Financial Advisers Network as at 31 December 2012
49.4
5.0
50.6
0.6
45.0
Administred/DirectManaged
FundsFunds/Real Estate MgtInsurance
% Composition of Total Stock of Assets Personal Financial Advisers Network as at 31 December 2011
51.7
6.6
48.3
1.1
40.6
Administred/DirectManaged
FundsFunds/Real Estate MgtInsurance

24
Report on Operations
Annual Report and Accounts as at 31 December 2012 · FinecoBank
Human resources
At the end of 2012, FinecoBank’s workforce consisted of 949 people, compared with 923 as at 31 December 2011. The figures show that, although the market conditions remain difficult, FinecoBank has continued to expand its workforce, with an increase of approximately 3%.
The workforce can be broken down as follows:
HUMAN RESOURCES 31 DECEMBER 2012 31 DECEMBER 2011
FinecoBank employees 931 910
Workers with atypical contracts* (+) 3 2
Group employees seconded to FinecoBank (+) 9 4
FinecoBank employees seconded to the Group (-) (1) (2)
Total human resources excluding Directors 942 914Directors (+) 7 9
Total human resources 949 923
* Of which 1 is a worker on a project-based contract.
As in the previous years, in 2012 work continued on staffing, efficiency improvement and rationalisation of the workforce to meet business needs.
Specifically, in 2012 there was significant use of internal job rotation, which involved 43 people (4.6% of the workforce). This system provided cover for vacant positions in the Company, while also ensuring ongoing professional development of personnel. In addition, 46 people were hired during the year: 4 from other Group Companies and 42 from the market. Of the 42 new recruits from the market, over half were employed in the CRM area, confirming the strong, ongoing focus on young graduates, who are offered the possibility of starting a process of professional development to enable them to assume positions in the Company in the future.
In 2012 a total of 25 people left the bank, of which:• 7 due to resignations;• 6 due to transfers to Group companies;• 12 for other reasons.
The total staff turnover rate stood at 7.75% (5.05% new recruits and 2.74% dismissals).
The Bank’s workforce can be broken down as follows:
The Bank continues to focus attention on women employees, who comprise approximately 37.5% of the workforce and represent 93% of the 60 part-time employees at the Company as at 31 December 2012. The number of women among Managers and Senior Managers increased by 10% over the year.The average worker seniority was 6 years, while the average age was about 37 years and 5 months.
Employee trainingWhen suitably structured and integrated into human resource development systems, employee training is a fundamental tool for acquiring and consolidating the distinctive skills of each role, required to meet company needs. In 2012, approximately 22,000 hours of training were delivered, covering the entire company population.
The details are shown below:
TRAINING AREA HOURS OF TRAINING
Mandatory 4,646
Technical 6,698
Foreign Language 9,442
Behavioural/Managerial 1,200
Total 21,986
Technical trainingDuring the year, specialised training sessions were organised for the acquisition of the technical skills needed not only to improve company productivity, but also the level of employee specialisation.Specifically, training on the new Office 2010 package, which began in the previous year, continued in the first six months of the year, with specific training labs on Excel, which is widely used in the Bank.Specialised training for all employees continued (with specific attention to the ICT, CFO and CRO areas) aimed at ensuring constant updating of processes and procedures, as well as alignment with new legal provisions.The Bank’s Business Continuity plan was strengthened through continuous training during the entire year, which involved around 60 backup staff for a total of 970 training hours, carried out through on-the-job training, certified on company registers.
Operating structure
CATEGORY
MEN WOMEN TOTAL
12.31.12 12.31.11 12.31.12 12.31.11 12.31.12 12.31.11
Senior Managers 18 20 2 1 20 21
Managers 189 185 63 58 252 243
Professional Areas 332 328 327 318 659 646
Total 539 533 392 377 931 910

25FinecoBank · Annual Report and Accounts as at 31 December 2012
In addition, for the CRM function, with a view to maintaining high quality standards of service and constant customer focus, training courses for “new recruits” were organised on technical topics, as well as “ongoing” technical and behavioural training courses (relating to Communication and Service) for a total of around 2,900 hours.
Foreign language trainingIn 2012 FinecoBank continued its significant focus on foreign language training, also in view of the Bank’s increasingly international operating environment. Around 245 employees participated in English courses (classroom or telephone courses), in consideration of the importance of English in carrying out their work. Senior Managers received “one-to-one” training courses in Business English. Courses in German also continued during the year, as part of foreign language training, and involved about 30 employees.
Management trainingIn 2012, FinecoBank continued to invest in middle management and in specific categories of employees (Executives and Talents), with a view to supporting the development of management skills, through highly-focused courses on subjects such as leadership, team management, emotional skills, time management, and problem-solving.Training was primarily provided by UniManagement and was partially financed through FBA (Italian Banking and Insurance Fund) training programmes submitted by UniCredit.
Trade union relationsAs regards trade union relations, the Bank continued the active, constructive approach created and developed over the last few years.
During the year, the UniCredit group Strategic Plan 2010-2015 was presented and discussed with the company trade unions. The planned organisational and operational measures were examined, generally referring to the Italian area of the Group and, in particular, to the Bank’s future development and the evolution of its business.
In the area of occupational health and safety, following the swarm of earthquakes that hit the Emilia Romagna region in May 2012, the Company Trade Union Representatives and the Workers’ Safety Representatives, in cooperation with the Safety Officer, were engaged in providing specific technical training to members of the emergency teams in the Reggio Emilia offices.The goal of the day for classroom training was to provide basic instructions to be followed to ensure the safety of the Bank’s personnel.
The Joint Training Commission, established in 2008, continued to meet address and gather considerations and proposals, with a view to consultation with the trade unions, concerning company training matters.Trade Union Agreements for participation in Training Programmes funded and promoted by the Fondo Banche Assicurazioni (FBA) were discussed and ratified.

26
Report on Operations
Annual Report and Accounts as at 31 December 2012 · FinecoBank
The information system of FinecoBank is essentially comprised of six elements:• Banking application software;• On-line Trading System (dedicated applications for the real-time
sale/purchase of securities and financial instruments on the main European and American markets);
• Management system for the operations room and for institutional investors, and access to the information/order sections of numerous Italian/foreign markets;
• Management system for investment services such as Funds, SICAVs and Bank Insurance;
• Credit card management system, with the issue of cards for the VISA and MasterCard circuits;
• Personal financial advisers management system, enabling them to operate together on all FinecoBank products through a single portal.
In 2012 the ICT Area carried out its usual technological upgrading, consolidation and development of the Information System in order to provide new and more versatile added value services to customers.Specifically, from an architectural perspective, work continued on optimising infrastructure and applications, as well as the continuous improvement and fine-tuning of the applications security architecture. Finished projects include, primarily, the “New Site” project, with the resulting release of the new graphic layout of the company website and its new features.In the Banking section, the main new products and services provided to retail customers included the new “Conto Zero” (no-fee account) and the SEPA Direct Debit functions. In the Trading sections, the new Strategy Orders were offered. The Mobile channel was also enhanced with the release of the Apps for iPad and Android and the introduction of the Bank’s digital signature on new account opening contracts.
Technology infrastructure
Operating structure (Continued)

27FinecoBank · Annual Report and Accounts as at 31 December 2012
The Bank has adopted an Internal Control System consisting of four levels.
The first level controls are incorporated into operating procedures and are known as “line controls”. These controls are consequently included in the Services and Bank segments responsible for performing various work tasks by following specifically created executive procedures. To ensure efficient performance of these controls, the procedures have been formally set out in internal regulations, which have been documented and published on the Bank’s Intranet in order to facilitate access by staff to the instructions issued by the Bank. Monitoring and continuously updating these processes is entrusted to “process supervisors” who are charged with devising controls able to ensure the proper performance of daily activities by the staff concerned, as well as the observance of any delegated powers. Formal processes regard both customer contact and head office functions.
Second level controls are associated with day-to-day operations applied to quantifiable risks; they are carried out on an ongoing basis by functions separate from operating functions. The controls of market, credit and operational risks are assigned to the “Risk management” function which operates according to the instructions of the Parent Company. Controls on compliance risk are managed by the Compliance function, which operates according to a Competence Line model, centralised at the Parent Company, with a Compliance Manager on site.
Third level controls are those associated with internal auditing, culminating in on-site inspections conducted with the aim of assessing procedural flow, and incorporating paper records drawn from databases or company reports.
Lastly, institutional supervisory controls, including those of the Board of Statutory Auditors and the Supervisory Body under Legislative Decree 231/2001 will also be included.
In 2012, the following activities were carried out:• business processes continued to be published on the Bank’s
Intranet in order to complete and update the set of operating procedures indicating the related first level controls;
• the second level control functions (Compliance and CRO), each for their respective areas of responsibility, carried out the checks on correct risk management, presenting the results to the corporate bodies on a quarterly basis;
• Under a specific outsourcing contract, UniCredit Audit, which merged into UniCredit S.p.A. with effect from 1 March 2013, completed the audit plan approved by the Board of Directors, involving the examination of several of the Bank’s regulatory, business and operational areas (Antitrust and Unfair Commercial Practices, MiFID project, Execution Only, Market Abuse, Basel II - Pillar II ICAAP, Basel II – OpRisk: Data Quality and Process, Basel II – OpRisk: ORM Validation Process, Forex, Error Account Management, Internal Controls on the Financial Advisers Network, Complaint Management, Credit Cards, Transactions with Bank Officers pursuant to Article 136 of Legislative Decree 385/93, Margin-setting in Futures, Subscription and Placement, Order Receipt and Transmission by Financial Advisers, Tax Management, Access Rights Management, Personal Dealing of Relevant Persons, IT Project Management, and the Procurement Procedure) to verify the adequacy of the processes both in terms of compliance with mandatory obligations (legal, regulatory and internal) and in terms of effectiveness and efficiency. The results of these verifications were also reported on a quarterly basis to the management and control bodies.
Internal control system

28
Report on Operations
Annual Report and Accounts as at 31 December 2012 · FinecoBank
FinecoBank has organised its risk control structure in accordance with the instructions issued by the Supervisory Bodies, in collaboration with the Parent Company, adopting and implementing the guidelines issued by the latter.Risks are measured and controlled by the Risk Management function, headed by the Chief Risk Officer (CRO), who reports directly to the Managing Director. At organisational level, Risk Management is therefore separated from business and operating areas, in order to guarantee the necessary objectivity and independence of controls.
Risk Management performs second level controls, whose prime objective is to identify, measure and control the Bank’s exposure to the risks associated with its business activities.More specifically, Risk Management continuously monitors the following risks:• Credit risk• Market risk• Operational risk
Risk Management also monitors business and reputation risks.The results of the above are periodically reported to Senior Management, both through the Risks Committee and through a quarterly report submitted to the Board of Directors.
Credit riskCredit risk, defined as the probability that the counterparty to a contract becomes insolvent, is managed by monitoring the credit quality of the products issued by the Bank.
Risk Management monitors the loan portfolio by developing and maintaining adequate reports in order to understand the dynamics, the flows and the stock of the performing and non-performing portfolios. This involves portfolio reports and reports on individual products.
Risk Management also conducts periodic scenario analyses (stress tests) to estimate the credit risk of the Bank’s exposure to customers that use trading products that involve setting trading margins, in the case of market disruption events (MDE).
More details on the management policies, operating procedures, techniques, credit risk control and management adopted by the Bank are provided in the Notes to the Accounts - Part E, Section 1 - Credit risk.
Market riskMarket risk is defined as the amount of losses that may be incurred on positions in financial instruments or derivatives when changes in market conditions occur.
Market risk and interest rate risk associated with the trading and the banking book are kept at the minimum level compatible with business requirements, also by means of hedging transactions using derivative instruments.
Market risk management in FinecoBank is carried out by Risk Management, in collaboration with the CFO area, liaising with the equivalent functions of the Parent Company and advising them of strategic and operating decisions.
The Bank’s Board of Directors, through the acknowledgement and approval of the Parent Company Policy in this area, establishes the acceptable limits for market risk by measuring the maximum potential loss that may be generated by changes in market variables.
The maximum potential loss is measured, for both the banking and trading books, in terms of VaR (Value at Risk), namely the maximum loss that, with a probability of 99%, can be triggered by a portfolio, on the basis of changes in the underlying risk variables, with reference to a holding period of one day.
Market risk is measured by the Parent Company, which provides FinecoBank’s Risk Management function with the results in terms of VaR of the trading and banking books. The Risk Management function checks that the operating limits are observed and provides adequate information to Management.
The Parent Company has also provided FinecoBank with an ALM (Asset Liability Management) system, able to generate full reports and, through simulations, conduct specific analyses to identify volatility factors in the net interest margin and to calculate the expected net interest margin of a chosen scenario.
Further details on management policies, market risk (interest rate risk, price risk, exchange rate risk) and liquidity risk control and management are provided in the Notes to the Accounts - Part E, Section 2 - Market Risk and Section 3 - Liquidity Risk.
Risk management and control
Operating structure (Continued)

29FinecoBank · Annual Report and Accounts as at 31 December 2012
Operational riskOperational risk is defined as the risk of incurring losses deriving from the inadequacy or improper functioning of internal processes, the conduct of personnel (mistakes, fraud), and from the functioning of systems or external events. It also includes legal risks.
To effectively handle operational risk and with a view to complying with the changes introduced by the prudential supervision regulations, FinecoBank has established a management system for operational risk (referred to as the Framework), consisting of a set of risk measurement, control and mitigation policies and strategies.
Following authorisation from the Bank of Italy, from 30 June 2010, FinecoBank has adopted the AMA (Advanced Measurement Approach) to calculate capital requirements. Data collection and control is managed by the Bank, while the use of the calculation model is centralised for all members of the banking Group at the Parent Company.
To mitigate the operational risk associated with the placement and collection by the PFA network, FinecoBank has set up a model for remote monitoring of the operations of its financial advisers.
The model was entirely designed and developed within FinecoBank and uses the data available from Bank’s electronic databases. The controls focus on identifying potentially illegal conduct aimed at misappropriation, embezzlement or diversion of customer assets. The results are sent to the Bank departments responsible for the commercial area. These departments carry out the appropriate checks, also on the basis of recommendations provided by Risk Management.
Alongside the monitoring of the PFA network, operational risk monitoring is also carried out on other areas of the Bank where potential losses may occur, through the creation and use of KRI (Key Risk Indicators) and scenario analyses, whose purpose is to identify the presence of operational risks in systems and processes.
Analysis of KRI results enables Management to be informed promptly of any existing risks and, in collaboration with the relevant departments, to identify the appropriate risk mitigation actions to take.
More details on the processes and the methods used by the Bank to manage and measure operational risk, in accordance with the guidelines of the Parent Company, are provided in the Notes to the Accounts - Part E, Section 5, Operational risk.

30
Report on Operations
Annual Report and Accounts as at 31 December 2012 · FinecoBank
In 2012, a series of changes were made to the Bank’s organisational structure, in order to implement the new Group Organisation Guidelines issued by the Parent Company UniCredit S.p.A..The new Guidelines set out organisational principles and rules designed to ensure their uniform application across all Group Legal Entities, through:• clear organisational principles and criteria;• specific organisational documents;• suitable processes for organisational changes.
The new Group Organisation Guidelines set out structured organisational rankings on four levels (Division, Department, Unit and Team) based on their size and the organisational complexity of the operations overseen.
In addition, during the last quarter of the year, to enable the Bank to adopt a new organisational structure aimed at simplifying decision-making processes, FinecoBank’s Board of Directors approved a reorganisation of the Bank’s senior management, by eliminating the position of General Manager and merging this position’s duties with those of the Managing Director.
In view of the above, in the new organisational chart the department and units that were previously directly under the General Manager now report directly to the Managing Director. As a result, the Delegated Powers and all existing Regulations have been aligned to the new structure.Specifically, the Managing Director has been assigned the powers and responsibilities previously held by the General Manager.
Organisational ModelThe current organisational model of FinecoBank is based on a functional model which promotes economies of scale and facilitates the development of skills and vertical knowledge within each area. The model guarantees the necessary decision-making mechanisms, whist maintaining the “horizontal link” between the various functions. Although the current arrangement applies the concept of “functional” specialisation, a project-based approach is maintained for every phase of definition and release of products and services.The horizontal links are guaranteed by the work of specific committees that monitor business lines and the progress of the most important projects, also to guarantee the necessary synergies of distribution channels.
Based on the Guidelines issued by the Parent Company UniCredit, under the organisation model all structures of the Bank interact with the corresponding functions of the Parent Company through the
Group managerial/functional system, which assigns the Managers of the Parent Company departments specific responsibilities in relation to the corresponding functions of the Bank.The organisational model identifies four functional lines, which govern:• the Sales Network• Investment Services• Direct Banking• Operational Functioning
The PFA Commercial Network Department has been set up, reporting directly to the Managing Director. This Department heads the “Commercial Support”, “Territorial Coordination” and “PFA Network Hiring, Professional Development & Training” Units, with the goal of ensuring the correct flow of information on products and services and overseeing geographical coordination and the selection and training of the Sales Network.The Investment Services Department, the Direct Banking Department and the GBS Department also report to the Managing Director.
More specifically:• the Investment Services Department is responsible for
monitoring the development of products placed by the Bank and the advisory services provided to all customers;
• the Direct Banking Department is responsible for monitoring the development of new products in FinecoBank’s two core businesses (Trading and Banking) and their distribution through direct channels (internet and telephone);
• the Investment Services and Direct Banking Departments work closely with each other in order to develop a combined and synergistic offering of products and services to customers, in line with the Bank’s marketing and business strategies;
• the GBS (Global Banking Services) Department coordinates the organisational units in charge of monitoring the organisational/operating processes and the IT and logistics systems needed to ensure the effective and efficient operation of business support systems. The following Departments report to the GBS Department: ICT - Information & Communication Technology, CRM - Customer Relationship Management, Bank Organisation & Operations, Securities Trading, and Network Services.
The synergies between the distribution channels and the monitoring of cross-cutting decision-making processes are ensured by a Management Committee, which assists the Managing Director.
The Chief Financial Officer (CFO), Chief Risk Officer (CRO), Legal & Corporate Affairs Department, Human Resources Unit, Identity & Communications Team and the Compliance Manager also report to the Managing Director.Lastly, as regards audit activities, FinecoBank, in accordance with the instructions of the Parent Company, has adopted an
Organisational structure
Operating structure (Continued)

31FinecoBank · Annual Report and Accounts as at 31 December 2012
outsourcing method based on a specific service contract signed with the Group outsourcer UniCredit Audit, which merged into UniCredit S.p.A. with effect from 1 March 2013. Under that model, the Audit Committee has been established, which acts as a “liaison” between the Bank and the Group Audit Company, in addition to supporting the Board of Directors - with information,
advisory, recommendation and investigation functions - in using a risk-oriented approach to identify the guidelines for the entire internal control system and the assessment of its effectiveness and efficiency.
The organisational structure of FinecoBank is as follows:
MANAGING DIRECTOR
CHAIRMANBoard of directors
AUDIT COMMITTEE
IDENTITY & COMMUNICATIONS
UNIAUDIT
LEGAL & CORPORATE AFFAIRS CHIEF RISK OFFICEHUMAN
RESOURCESCOMPLIANCE
OFFICER COMPLAINTS
Anti-Money laundering and Anti-
Terrorism Office
Banking Complaints
Legal AffairsHead Office
Risk Function
Corporate Affairs Risk
Management
Trading Complaints
Legal PFA Network
Information Security & Fraud Mngt
Personal loans and Credit Cards
Legal Searches Loans and Head Office Branch
HR Management, Planning &
Professional Development
HR Planning, Legal/ Labor Relations &
Administration
CUSTOMER RELATIONSHIP MANAGEMENT
ICT
BANK ORGANISATION &
OPERATIONS
SEURITIES TRADING
NETWORK SERVICES
- ICT Coordination and Planning- On-line Banking Development- TLC Networking - On-line Trading Development- Back Office Development - Datawarehouse - Banking Development- Order Routing Development- Insurance Banking Development i- On-line Architectures - Windows Architectures- Legacy Systems- Data Center Management- On-line Operations- Investing and Network Development
- Customer Business Development- Market Trading Support- Customer Care
- Operational Developments - Organisation, Sizing and Process Development- Business Process Re-engineering & PMO - Payment Systems - Banking and Network Operations- Insurance and Pension Fund Operations- E-money
- Back Office Institutional Securities - Back Office Retail Securities
- Commissioning and Network Assistance
- Commercial Monitoring, Incidents and Controls
NETWORK LOGISTICS
GENERAL SERVICES
GBS DEPT.*
Territorial Coordination
Commercial Support
PFA Network Hiring, Prof. Dev. & Training
PFA Network
PFA COMMERCIAL
NETWORK DEPT.
INVESTMENT SERVICES DEPT.
Events
Investment Products and Third-Party Relations
Advice
Markets
Marketing
Products
International Projects & Business Implementation
Financial Reports and Regulatory Reporting
Administration Banking and PFA Network
Administration Trading and Intermediation
Tax Affairs
Planning and Management Control
Treasury
DIRECT BANKING DEPT.
CHIEF FINANCIAL OFFICE
-
Chairman
Managing Director
Department
Unit
Team
Network* Position held by the Deputy General Manager

32
Report on Operations
Annual Report and Accounts as at 31 December 2012 · FinecoBank
Business continuity plan (BCP)
Operating structure (Continued)
FinecoBank’s Business Continuity and Crisis Management framework includes the Business Continuity Plan (hereinafter also “BCP”), the Disaster Recovery Plan (hereinafter also “DR”), the Pandemic Management Plan and the Crisis Management Plan. These plans describe how crises are to be managed in FinecoBank and/or how the impacts on the UniCredit group are to be managed through predefined “stages”, made up of objectives, activities and expected results. As required by the applicable regulations, the Bank has adopted a model that comprises organisational units dedicated to managing Business Continuity and Crises, both in normal operating conditions and in emergency situations.
In line with the evolution of the Bank’s business and operations, the BC plans (for the strategies adopted by the Bank to guarantee service continuity in emergency situations) and DR plans (for aspects related to the recovery of applications and IT systems hit by “disaster”) were appropriately updated in 2012.
Lastly, at the beginning of 2012 test plans were drawn up aimed at demonstrating the effectiveness and adequacy of the BC and DR plans and identifying any areas for improvement. The outcomes of the resulting tests carried out during the year were positive.

33FinecoBank · Annual Report and Accounts as at 31 December 2012
Main balance sheet aggregates
(Amounts in € thousand)
ASSETS 12.31.2012 12.31.2011
CHANGES
AMOUNT %
Cash and cash balances 7 4 3 75.0%
Financial assets held for trading 7,589 11,413 (3,824) -33.5%
Loans and receivables with banks 17,271,573 16,282,014 989,559 6.1%
Loans and receivables with customers 553,606 524,547 29,059 5.5%
Financial investments 69,430 57,784 11,646 20.2%
Hedging instruments 73,745 78,290 (4,545) -5.8%
Property, plant and equipment 8,700 9,362 (662) -7.1%
Goodwill 89,602 89,602 - -
Other intangible assets 8,177 8,718 (541) -6.2%
Tax assets 47,999 46,018 1,981 4.3%
Non-current assets and disposal groups classified as held for sale - 145 (145) -100.0%
Other assets 162,042 168,992 (6,950) -4.1%
Total assets 18,292,470 17,276,889 1,015,581 5.9%
(Amounts in € thousand)
LIABILITIES AND SHAREHOLDERS’ EQUITY 12.31.2012 12.31.2011
CHANGES
AMOUNT %
Cash and cash balances 7 4 3 75.0%
Financial assets held for trading 7,589 11,413 (3,824) -33.5%
Loans and receivables with banks 17,271,573 16,282,014 989,559 6.1%
Loans and receivables with customers 553,606 524,547 29,059 5.5%
Financial investments 69,430 57,784 11,646 20.2%
Hedging instruments 73,745 78,290 (4,545) -5.8%
Property, plant and equipment 8,700 9,362 (662) -7.1%
Goodwill 89,602 89,602 - -
Other intangible assets 8,177 8,718 (541) -6.2%
Tax assets 47,999 46,018 1,981 4.3%
Non-current assets and disposal groups classified as held for sale - 145 (145) -100.0%
Other assets 162,042 168,992 (6,950) -4.1%
Total assets 18,292,470 17,276,889 1,015,581 5.9%

34
Report on Operations
Annual Report and Accounts as at 31 December 2012 · FinecoBank
Main balance sheet aggregates (Continued)
Financial assets held for tradingFinancial assets held for trading consist of:• bonds, equities and Units in investment funds classified as Fair
Value Through Profit or Loss (FVTPL), amounting to €0.7 million, held in the Bank’s portfolio as a result of trading activity, for sale in the short term;
• the positive valuation of commitments for currencies and securities to be received and delivered of €6.9 million, which correspond to negative valuations booked under item 40 Financial liabilities held for trading.
Receivables from banks (Amounts in € thousand)
12.31.2012 12.31.2011
CHANGES
AMOUNT %
1. Current accounts and demand deposits 8,473,441 7,546,448 926,993 12.3%
2. Time deposits 4,385,279 2,703,021 1,682,258 62.2%
3. Other loans:
3.1 Reverse repos 182,274 1,165 181,109 15545.8%
3.2 Other 4,672 3,936 736 18.7%
4. Debt securities
4.1 Structured securities 1,575,814 1,577,308 (1,494) -0.1%
4.2 Other debt securities 2,650,093 4,450,136 (1,800,043) -40.4%
Total 17,271,573 16,282,014 989,559 6.1%
Loans and receivables with banks for current accounts and demand deposits mainly consist of accounts held with UniCredit S.p.A., with a book value of €8,311 million and to a lesser extent, by current accounts held with non-Group Banks for transactions in securities.The time deposits recognised under assets consist of the deposit held with UniCredit S.p.A. for compulsory reserves, with a book value of €114 million, in addition to time deposits held with UniCredit S.p.A. of €4,271 million, opened to employ the funds collected through repos and CashPark transactions with retail customers and repos with credit institutions in the same time-frame.
The item “Other Loans - Other” relates to initial margins with credit institutions from derivative transactions as well as from current receivables associated with the provision of financial services.
The securities held in the portfolio are mainly represented by debt securities issued by the Parent Company, and amount to €4,226 million. They were subscribed in order to invest liquid funds and to be used for repos with retail customers.
In September debt securities held by Fineco’s and issued by UniCredit S.p.A. were sold to UniCredit S.p.A. for a book value of €1,500 million; at the same time securities issued by FinecoBank and subscribed by UniCredit S.p.A. were repurchased for the same amount. The transaction also resulted in the closure of the related hedging derivatives and the recognition through profit or loss the changes in fair value of portfolio hedged items.

35FinecoBank · Annual Report and Accounts as at 31 December 2012
Loans and receivables with customersLoans and receivables with customers, amounting to €554 million, can be broken down as follows:• €372 million in loans to ordinary customers;• €101 million in reverse repos;• €23 million in collateral deposits and initial margins with clearing
houses for derivative transactions;• €58 million relating to current receivables associated with the
provision of financial services.
Reverse repos are represented by “Multiday leverage” transactions, securities lending transactions guaranteed by sums of money readily available to the lender and which are basically the equivalent of repos on securities.
Other loans mainly consist of collateral deposits and initial margins with clearing houses for derivative transactions, mostly on behalf of third parties, as well as current receivables associated with the provision of financial services.
(Amounts in € thousand)
12.31.2012 12.31.2011
CHANGES
AMOUNT %
1. Current accounts 68,683 65,837 2,846 4.3%
2. Reverse repos 100,783 89,920 10,863 12.1%
3. Mortgages 65 57 8 14.0%
4. Credit cards and personal loans 301,766 296,753 5,013 1.7%
5. Finance leases - - - -
6. Factoring - - - -
7. Other loans 82,308 71,979 10,329 14.4%
8. Debt securities:
8.1 Structured securities - - - -
8.2 Other debt securities 1 1 - 0.0%
Total 553,606 524,547 29,059 5.5%
(Amounts in € thousand)
LOANS AND RECEIVABLES WITH CUSTOMERS(MANAGEMENT RECLASSIFICATION) 12.31.2012 12.31.2011
CHANGES
AMOUNT %
Current accounts 66,117 63,728 2,389 3.7%
Impaired current accounts 2,566 2,109 457 21.7%
Use of credit cards 193,168 179,714 13,454 7.5%
Use of impaired credit cards 134 49 85 173.5%
Impaired mortgages 65 57 8 14.0%
Personal loans 106,929 115,875 (8,946) -7.7%
Impaired personal loans 1,535 1,115 420 37.7%
Other loans 1,229 467 762 163.2%
Other impaired loans 22 18 4 22.2%
Total loans and receivables with ordinary customers 371,765 363,132 8,633 2.4%Reverse repos 100,686 89,915 10,771 12.0%
Reverse repos - impaired 97 5 92 1840.0%
Collateral deposits and initial and variation margins 22,563 19,113 3,450 18.1%
Current receivables associated with the provision of financial services 58,494 52,381 6,113 11.7%
Debt securities 1 1 - 0.0%
Total current loans and other loans 553,606 524,547 29,059 5.5%
The ordinary customer loan portfolio mainly consists of receivables for personal loans, current accounts and credit card use; overall,
ordinary customer loans increased by 2.4%, attributable to credits cards, whereas personal loans fell by 7.7%.

36
Report on Operations
Annual Report and Accounts as at 31 December 2012 · FinecoBank
Main balance sheet aggregates (Continued)
Impaired assetsThe amount of impaired loans net of impairment losses was €4.4 million, €3.1 million of which in non-performing loans, €0.4 million in doubtful loans and €0.9 million in past-due loans. Impaired loans mostly relate to current account overdrafts, credit card use and personal loans.
Impaired customer loans represent 1.19% of loans and receivables with ordinary customers, an increase of 0.92% from 31 December 2011, mainly as a result of the regulatory amendment which reduced the limit to 90 days, instead of the 180 days temporarily permitted until the end of 2011, for the determination of past-due loans and/or unauthorised exposures.
(Amounts in € thousand)
CATEGORY
BEFORE TAX IMPAIRMENT PROVISION AFTER TAX EFFECT
12.31.2012 12.31.2011 12.31.2012 12.31.2011 12.31.2012 12.31.2011
Non-performing loans 14,985 12,241 (11,852) (9,646) 3,133 2,595Doubtful loans 1,384 1,154 (948) (765) 436 389Past-due loans 1,529 854 (678) (485) 851 369Total 17,898 14,249 (13,478) (10,896) 4,420 3,353
Hedging instruments(Amounts in € thousand)
12.31.2012 12.31.2011
CHANGES
AMOUNT %
Asset hedging derivatives - positive valuations 171,550 325,127 (153,577) -47.2%Liability hedging derivatives - positive valuations 19,022 4,806 14,216 295.8%Changes in the value of assets under macro-hedge (116,827) (251,643) 134,816 -53.6%Total assets 73,745 78,290 (4,545) -5.8%of which:Positive valuations 189,468 321,473 (132,005) -41.1%Related accrued assets and liabilities 1,104 8,460 (7,356) -87.0%Adjustments to the value of hedged assets (116,827) (251,643) 134,816 -53.6%Total assets 73,745 78,290 (4,545) -5.8%
12.31.2012 12.31.2011
CHANGES
AMOUNT %
Asset hedging derivatives - negative valuations 41,881 46,208 (4,327) -9.4%Liability hedging derivatives - negative valuations 172,004 324,561 (152,557) -47.0%Adjustments to the value of assets under macro-hedge (140,634) (295,346) 154,712 -52.4%Total liabilities 73,251 75,423 (2,172) -2.9%of which:Negative valuations 213,275 365,176 (151,901) -41.6%Related accrued assets and liabilities 610 5,593 (4,983) -89.1%Adjustments to the value of hedged liabilities (140,634) (295,346) 154,712 -52.4%Total liabilities 73,251 75,423 (2,172) -2.9%
(Amounts in € thousand)
SUMMARY OF HEDGING DERIVATIVE VALUATIONS 12.31.2012 ASSETS LIABILITIES DIFFERENCE
Valuation of asset and liability hedging derivatives 189,468 213,275 (23,807)Change in fair value of hedged assets/liabilities (116,827) (140,634) 23,807Total 72,641 72,641 -
Hedged assets consist of receivables for personal loans due from retail customers and bonds issued by UniCredit S.p.A., entirely subscribed by the Parent Company, belonging to the Loans and Receivables category.
Hedged liabilities are represented by bonds issued by FinecoBank, entirely subscribed by the Parent Company, belonging to the Loans and Receivables category.
Accruals relating to asset and liability hedging derivatives amount respectively to €1.1 million and €0.6 million, and are included in the net interest margin.
Positive and negative valuations of hedging derivatives relate solely to derivative contracts that the Bank has entered into to provide a macro-hedge against interest rate risk inherent in the above-mentioned assets and liabilities, whose income statement effect is zero.

37FinecoBank · Annual Report and Accounts as at 31 December 2012
Financial investments(Amounts in € thousand)
12.31.2012 12.31.2011
CHANGES
AMOUNT %
Financial assets measured at fair value 10,516 10,409 107 1.0%
Available-for-sale financial assets 58,914 47,375 11,539 24.4%
Total 69,430 57,784 11,646 20.2%
The debt securities classified in the Available-for-sale financial assets portfolio are entirely used as collateral for bankers’ drafts or guarantees with third parties.
Financial assets at fair value through profit or loss consist solely of debt securities issued by banks with a book value of €10.5 million, of which €8.1 million of bonds issued by UniCredit S.p.A..
Available-for-sale financial assets comprise debt securities issued by the Italian Central Government, with a book value of €49 million, debt securities issued by the German Central Government, with a book value of €10 million and investments in companies in which the Bank does not exercise, either directly or through subsidiaries, control or significant influence, amounting to €5 thousand, including shares in the following group companies:• 20 shares of UniCredit Business Integrated Solutions S.C.p.A. for a
total of €172.22;• 20 shares of UniCredit Audit S.C.p.A., which merged into UniCredit
S.p.A. with effect from 1 March 2013, for a total of €220.63.
Property, plant and equipmentAs in previous financial years, investments in electronic machines were made to guarantee the ongoing update of the hardware used by all FinecoBank departments, and in particular by the IT department.
Investments in furniture, fittings and equipment are primarily intended for use in new financial stores.The book value of property, plant, and equipment includes the historical cost and the accumulated depreciation of assets obtained under finance lease, as per IAS 17.
(Amounts in € thousand)
PROPERTY, PLANT AND EQUIPMENTBALANCE
01.01.2012INVESTMENTS AS AT
12.31.2012OTHER
CHANGES-SALES
DEPRECIATION AND WRITE-DOWNS AS AT
12.31.2012BALANCE
12.31.2012
Properties 2,844 - 145 (143) 2,846
Electronic machines 3,898 1,345 64 (1,564) 3,743
Furniture and fixtures 1,075 470 1 (814) 732
Plant and machinery 1,545 309 - (475) 1,379
TOTAL 9,362 2,124 210 (2,996) 8,700

38
Report on Operations
Annual Report and Accounts as at 31 December 2012 · FinecoBank
Main balance sheet aggregates (Continued)
GoodwillImpairment testing on goodwill did not identify any impairment.
As at 31 December 2012, the goodwill recorded in the financial statements was made up as follows:
(Amounts in € thousand)
12.31.2012 12.31.2011
Goodwill relating to Fineco On Line Sim S.p.A. 16,087 16,087
Goodwill relating to the trading and banking division of Banca della Rete 2,034 2,034
Goodwill relating to PFA division formerly FinecoGroup S.p.A. 3,463 3,463
Goodwill relating to PFA division formerly UniCredit Xelion Banca S.p.A. 68,018 68,018
Total 89,602 89,602
Goodwill relating to Fineco On Line Sim S.p.A.On 3 April 2001 the merger of Fin-Eco On Line Sim S.p.A., the business division of Fin-Eco Sim S.p.A., into FinecoBank was completed.This merger was carried out on the basis of a share swap ratio of 3.7 shares of the acquiring company for each share of the acquired company, with a consequent increase in the share capital of FinecoBank. The difference between the increase in capital of the acquiring company and the amount of shareholders’ equity of the acquired company gave rise to a share swap loss recorded under goodwill.The balance, amounting to €16 million, is equal to the balance at 1 January 2004, the date of transition to IAS, plus the unamortised amount of the substitute tax, paid for recognition of the loss for tax purposes.
Goodwill relating to the Trading and Banking division of Banca della ReteOn 1 September 2003, FinecoBank acquired the “On-line Banking” and “On-line Trading” business divisions of Banca della Rete, as part of the business plan to rationalise the reorganisation of Banca della Rete, in accordance with the directives of the then Parent Company Capitalia S.p.A..The goodwill recorded in the balance sheet amounts to €2 million, equal to the amount as at 1 January 2004, the date of transition to IAS.
Goodwill relating to PFA division formerly FinecoGroup S.p.A.On 1 October 2005, FinecoBank acquired the Personal Financial Advisers business division from FinecoGroup S.p.A., which was
created from the progressive merger of three different group networks: FinecoBank S.p.A., former Bipop Carire S.p.A. and Banca Manager S.p.A..The transaction was carried out for a consideration mutually agreed by the parties and subject to a ‘fairness opinion’, leading to the recognition of €3.5 million of goodwill.
Goodwill relating to PFA division formerly UniCredit Xelion Banca S.p.A.As a result of the merger of UniCredit Xelion Banca S.p.A. into FinecoBank on 7 July 2008, FinecoBank S.p.A. recorded goodwill of €68 million under intangible assets, arising from previous extraordinary transactions carried out by UniCredit Xelion Banca S.p.A., more specifically:• Year 2000: acquisition of the personal financial advisers division,
formerly Fida SIM, by UniCreditSIM, later merged into Xelion Sim S.p.A., which then became UniCredit Xelion Banca S.p.A.. The balance, amounting to €1 million, is equal to the balance at 1 January 2004, the date of transition to IAS;
• Year 2001: merger of UniCreditSIM into Xelion Sim S.p.A., which then became UniCredit Xelion Banca S.p.A.. The balance, amounting to €13.8 million, is equal to the balance at 1 January 2004, the date of transition to IAS;
• Year 2003: spin-off of the personal financial advisers division, formerly Credit, Rolo and CRT by UniCredit Banca to UniCredit Xelion Banca S.p.A.. The balance, amounting to €19.1 million, is equal to the balance at 1 January 2004, the date of transition to IAS;
• Year 2004: acquisition of the personal financial advisers division from Ing Italia. This transaction resulted in the recognition of goodwill of €34.1 million.
It should be noted that all the goodwill (totalling €90 million) relates to acquisitions of divisions or companies carrying out trading activities or the management of personal financial advisers.These activities have been fully integrated with FinecoBank’s ordinary operations, as a result it is no longer possible to isolate the contribution of each company/business division from the Bank’s overall income; this means that to establish the reasonableness of the value of goodwill recognised in the financial statements it is necessary to take account of the Bank’s overall income. The cash generating unit (CGU) is the Bank as a whole.In fact, the specific business model adopted by FinecoBank, which envisages a high level of integration between personal financial advisers and the trading and banking platform, does not account for costs/revenues by allocating them to the business units; the personal financial advisers network is an integral part of the overall offer, which includes banking and trading services.

39FinecoBank · Annual Report and Accounts as at 31 December 2012
Other intangible assetsOther intangible assets solely include purchases and the implementation of information technology procedures with useful lives of several years, required in order to manage the
development and the constant offer of new financial products by the Bank, as well as costs incurred to create the new Fineco website.
(Amounts in € thousand)
INTANGIBLE ASSETSBALANCE
01.01.2012INVESTMENTS AS AT
12.31.2012OTHER
CHANGES-SALES
AMORTISATION AND WRITE-DOWNS AS AT
12.31.2012BALANCE
12.31.2012
Software 7,852 4,201 (32) (5,027) 6,994
Other intangible assets 866 577 (37) (223) 1,183
TOTAL 8,718 4,778 (69) (5,250) (8,177)
Deposits from banks(Amounts in € thousand)
12.31.2012 12.31.2011
CHANGES
AMOUNT %
1. Deposits from central banks - - - -
2. Deposits from banks
2.1 Current accounts and demand deposits 39,403 14,834 24,569 165.6%
2.2 Time deposits - 200,054 (200,054) -100.0%
2.3 Loans
2.3.1 Repos 2,025,627 983,132 1,042,495 106.0%
2.3.2 Other - - - -
2.4 Liabilities in respect of commitments to repurchase treasury shares
2.5 Other liabilities 123 44 79 179.5%
Total 2,065,153 1,198,064 867,089 72.4%
The item current accounts and demand deposits mainly consists of reciprocal current accounts and loans with UniCredit group companies, with a book value of €37.5 million, as well as reciprocal current accounts and loans with banks outside the Group of €1.9 million.
Repos include €1,909 million of transactions performed with the Parent Company UniCredit S.p.A. and €14 million of transactions carried out with UniCredit AG Milan branch.

40
Report on Operations
Annual Report and Accounts as at 31 December 2012 · FinecoBank
Main balance sheet aggregates (Continued)
Deposits from customers and debt securities in issue
The balance of direct deposits from customers, raised through bank accounts, the Cash Park deposit account and repos with retail and institutional customers, totalled €12,211 million, an increase of 14.5% compared to 31 December 2011.
(Amounts in € thousand)
12.31.2012 12.31.2011
CHANGES
AMOUNT %
1. Current accounts and demand deposits 9,551,550 8,822,354 729,196 8.3%
2. Time deposits 2,277,460 789,846 1,487,614 188.3%
3. Loans
3.1 Repos 382,241 1,048,058 (665,817) -63.5%
3.2 Other - - - -
4. Liabilities in respect of commitments to repurchase treasury shares - - - -
5. Other liabilities 52,291 41,774 10,517 25.2%
Total Deposits from customers 12,263,542 10,702,032 1,561,510 14.6%Of which direct customer deposits 12,211,250 10,660,256 1,550,994 14.5%Debt securities in issue 3,075,792 4,577,286 (1,501,494) -32.8%Deposits from customers and debt securities in issue 15,339,334 15,279,318 60,016 0.4%
In September securities issued by FinecoBank and subscribed by UniCredit S.p.A. were repurchased for a book value of €1,500 million. At the same time debt securities held by Fineco’s and issued by UniCredit S.p.A. were sold to UniCredit S.p.A. for the same amount. The transaction also resulted in the closure of the related hedging derivatives and the recognition through profit or loss the changes in fair value of portfolio hedged items.
Financial liabilities held for tradingFinancial liabilities held for trading comprise the negative valuation of commitments for currencies and securities to be received and delivered of €7.2 million, which correspond to negative valuations booked under item 20 “Financial assets held for trading”, as the
Bank does not assume risk positions on its own account, in addition to technical overdrafts classified under the FVTPL category, held in the Bank’s portfolio as a result of trading activity, for an immaterial amount.
Provisions for risks and chargesProvisions for risks and charges include allowances for a total of €109 million, for which, given a liability of uncertain amount and expiry, a current obligation was identified as the result of a past event and it was possible to make a reliable estimate of the amount resulting from the fulfilment of said obligation.The disbursements, with estimated maturity exceeding 18 months, were discounted to present value using a rate equal to the time value of money.
(Amounts in € thousand)
PROVISIONS FOR RISKS AND CHARGES 12.31.2011OTHER
CHANGESUTILISATIONS
2012EFFECT OF
DISCOUNTING
NETALLOCATIONS
2012* 12.31.2012
Legal disputes - disputes with customers and PFA 50,569 580 (5,823) 692 5,755 51,773
Other - additional customer expenses 32,856 - (768) - 2,697 34,785
- other provisions 14,936 (580) (2,031) - 10,093 22,418
Total provisions for risks and charges - other provisions 98,361 - (8,622) 692 18,545 108,976
* Net provisions for 2012 include €0.9 million recorded under Other administrative expenses.

41FinecoBank · Annual Report and Accounts as at 31 December 2012
Shareholders’ equityAs at 31 December 2012, the Bank’s share capital came to €200 million, and was divided into 606,274,033 shares with a par value of €0.33 each. Reserves are represented by the legal reserve, amounting to €22.5 million, and the extraordinary reserve, amounting to €93.8 million and unavailable retained earnings, for an amount of €0.005 million.The Bank does not hold any treasury shares in the portfolio.
Following the Shareholders’ Meeting resolution of 17 April 2012, the 2011 profit before tax of €62.8 million was allocated as follows:• €3.1 million to the legal reserve;• €0.05 million to the extraordinary reserve;• €0.005 million to the unavailable retained earnings;• €59.1 million to the sole shareholder;• €0.5 million to charitable donations.
Shareholders’ equity(Amounts in € thousand)
ITEM/AMOUNT 12.31.2012 12.31.2011
CHANGES
AMOUNT %
1. Share capital 200.070 200.070 - -
2. Share premium reserve 1.934 1.934 - -
3. Reserves -
- Legal reserve 22.527 19.389 3.138 16.2%
- Extraordinary reserve 93.773 93.727 46 0.0%
- Other reserves 5 - 5 -
4. (Treasury shares) - - - -
5. Revaluation reserves 285 (644) 929 n.c.
6. Equity instruments - - - -
7. Retained Profit (Loss) - - - -
8. Net Profit (Loss) for the year 125.467 62.764 62.703 99.9%
Total 444.061 377.240 66.821 17.7%

42
Report on Operations
Annual Report and Accounts as at 31 December 2012 · FinecoBank
(Amounts in € thousand)
12.31.2012 12.31.2011
Common Equity Tier 1 - CET1 251.095 237.733
Additional Tier 1 - AT1 - -
Items to be deducted - -
Total own funds 251.095 237.733Prudential requirements 215.064 206.068
Risk-weighted assets 2.688.301 2.575.852
Common Equity Tier 1 ratio (CET1 ratio) 9,34% 9,23%
Tier 2 - T2 0,00% 0,00%
Total capital ratio 9,34% 9,23%
Regulatory capital and prudential requirements
As at 31 December 2012, the regulatory capital amounted to €251 million.Risk-weighted assets were calculated by multiplying total prudential requirements by 12.5 (the inverse of the minimum compulsory coefficient of 8%), using the traditional standardised approach set forth in the Basel II supervisory provisions.FinecoBank calculates its capital requirement for operational risk using advanced approaches, integrating total capital requirements for the floor set by Bank of Italy regulations. More specifically, FinecoBank has applied a floor corresponding to the positive difference between 80%
of the capital requirements calculated on the basis of the rules in force as at 31 December 2006 and the sum of the capital requirements for credit, counterparty, market and operational risks, calculated using the current provisions of Basel II. As at 31 December 2012, the floor was €98 million, net of the 25% reduction granted to banks belonging to a Banking group.Tier 1 capital includes the share of the net profit, which the Bank’s bodies responsible for strategic supervision and management have allocated to increasing the value of reserves, corresponding to €11.4 million.

43FinecoBank · Annual Report and Accounts as at 31 December 2012
Condensed Income Statement(Amounts in € thousand)
12.31.2012 12.31.2011
CHANGES
AMOUNT %
Net interest 243,469 133,602 109,867 82.2%
Net fees and commissions 143,611 155,127 (11,516) -7.4%
Net trading, hedging and fair value income 28,069 24,891 3,178 12.8%
Net other expenses/income (5,368) (13,722) 8,354 -60.9%
OPERATING INCOME 409,781 299,898 109,883 36.6%Payroll costs (61,022) (59,971) (1,051) 1.8%
Other administrative expenses (148,670) (135,076) (13,594) 10.1%
Recovery of expenses 31,474 30,256 1,218 4.0%
Amortisation, depreciation and impairment losses on intangible and tangible assets (8,245) (8,581) 336 -3.9%
Operating costs (186,463) (173,372) (13,091) 7.6%OPERATING PROFIT (LOSS) 223,318 126,526 96,792 76.5%Net impairment losses on loansprovisions for guarantees and commitments (2,852) (2,794) (58) 2.1%
NET OPERATING PROFIT (LOSS) 220,466 123,732 96,734 78.2%Provisions for risks and charges (18,356) (17,381) (975) 5.6%
Net income from investments (3) 94 (97) -103.2%
PROFIT (LOSS) BEFORE TAX FROM CONTINUING OPERATIONS 202,107 106,445 95,662 89.9%Income tax for the period (76,640) (43,681) (32,959) 75.5%
PROFIT (LOSS) AFTER TAX FROM CONTINUING OPERATIONS 125,467 62,764 62,703 99.9%NET PROFIT (LOSS) FOR THE YEAR 125,467 62,764 62,703 99.9%
Income statement figures

44
Report on Operations
Annual Report and Accounts as at 31 December 2012 · FinecoBank
Income statement figures (Continued)
Net interest marginThe net interest margin as at 31 December 2012 was €243 million, up 82.2% compared to the same period of 2011 thanks to an increase cash and the remuneration of deposits held with the Parent Company.
(Amounts in € thousand)
INTEREST INCOME 12.31.2012 12.31.2011
CHANGES
AMOUNT %
1. Financial assets held for trading 8 321 (313) -97.5%
2. Available-for-sale financial assets 1,653 716 937 130.9%
3. Held-to-maturity investments - - - -
4. Loans and receivables with banks 406,015 241,029 164,986 68.5%
5. Loans and receivables with customers 25,794 32,681 (6,887) -21.1%
6. Financial assets at fair value through profit or loss 243 5 238 4760.0%
7. Hedging derivatives - - - -
8. Other assets 26 27 (1) -3.7%
Total interest income 433,739 274,779 158,960 57.9%
(Amounts in € thousand)
INTEREST EXPENSE 12.31.2012 12.31.2011
CHANGES
AMOUNT %
1. Deposits from banks (13,191) (9,989) (3,202) 32.1%
2. Deposits from customers (119,238) (105,625) (13,613) 12.9%
3. Debt securities in issue (6,019) (46,681) 775.6%
4. Financial liabilities held for trading - - - -
5. Financial liabilities at fair value through profit and loss - - - -
6. Financial liabilities associated with assets sold but not de-recognised - - - -
6. Other liabilities (4) (15) 11 -73.3%
7. Hedging derivatives (5,137) (19,529) 14,392 -73.7%
Total interest expense (190,270) (141,177) (49,093) 34.8%Net interest 243,469 133,602 109,867 82.2%

45FinecoBank · Annual Report and Accounts as at 31 December 2012
The following table provides a breakdown of interest income associated with banks and customers:
(Amounts in € thousand)
BREAKDOWN OF INTEREST INCOME 12.31.2012 12.31.2011
CHANGES
AMOUNT %
Interest income on loans and receivables with banks 406,015 241,029 164,986 68.5%- current accounts 168,267 142,541 25,726 18.0%
- reverse repos 1,022 1,708 (686) -40.2%
- demand deposits - 101 (101) -100.0%
- time deposits for compulsory reserve 938 2,376 (1,438) -60.5%
- time deposits 160,079 27,133 132,946 490.0%
- other loans 16 35 (19) -54.3%
- debt securities 75,693 67,135 8,558 12.7%
Interest income on loans and receivables with customers 25,794 32,681 (6,887) -21.1%- current accounts 3,139 2,800 339 12.1%
- reverse repos 9,962 16,989 (7,027) -41.4%
- mortgages - 7 (7) -100.0%
- credit cards 2,986 2,732 254 9.3%
- personal loans 9,589 9,833 (244) -2.5%
- other loans 118 320 (202) -63.1%
Interest income on loans and receivables with banks as at 31 December 2012 was €406 million, up €165 million compared to 31 December 2011, thanks to an increase cash and the remuneration of deposits held with the Parent Company.
Interest income on loans and receivables with customers came to €26 million, with a decrease of €7 million compared to 31 December 2011, mainly due to lower interest accrued on Multiday Leverage securities lending transactions guaranteed by cash amounts.

46
Report on Operations
Annual Report and Accounts as at 31 December 2012 · FinecoBank
Income statement figures (Continued)
The following table provides a breakdown of interest expense related to banks and customers:
(Amounts in € thousand)
BREAKDOWN OF INTEREST EXPENSE 12.31.2012 12.31.2011
CHANGES
AMOUNT %
Interest expense on deposits from banks (13,191) (9,989) (3,202) 32.1%- current accounts (82) (2,016) 1,934 -95.9%
- time deposits (119) (2,501) 2,382 -95.2%
- other loans (26) (55) 29 -52.7%
- reverse repos (12,964) (5,417) (7,547) 139.3%
Interest expense on deposits from customers (119,238) (105,625) (13,613) 12.9%- current accounts (35,534) (86,100) 50,566 -58.7%
- demand deposits (16) - (16) n.c.
- time deposits (65,804) (2,798) (63,006) 2251.8%
- reverse repos (17,884) (16,727) (1,157) 6.9%
Interest expense on deposits from banks amounted to €13 million, recording an increase of €3 million compared to 31 December 2011, due to the interest accrued on reverse repos undertaken with UniCredit S.p.A., as a result of higher volumes, partly compensated by interest paid on funding through current accounts and time deposits.
Interest expenses on deposits from customers came to €119 million an increase, compared to 31 December 2011, of €14 million due to the higher interest paid to subscribers of the CashPark deposit in which customers have invested part of their available current account cash or have previously invested in repos. It is worth noting that the remuneration rate for bank accounts decreased significantly as it is linked to the Euribor rate.
Income from brokerage and other income(Amounts in € thousand)
12.31.2012 12.31.2011
CHANGES
AMOUNT %
Net interest 243,469 133,602 109,867 82.2%Net fees and commissions 143,611 155,127 (11,516) -7.4%
Net trading, hedging and fair value income 28,069 24,891 3,178 12.8%
Net other expenses/income (5,368) (13,722) 8,354 -60.9%
Operating income 409,781 299,898 109,883 36.6%

47FinecoBank · Annual Report and Accounts as at 31 December 2012
Net fees and commissions(Amounts in € thousand)
MANAGEMENT RECLASSIFICATION 12.31.2012 12.31.2011
CHANGES
AMOUNT %
Management, brokerage and consultancy services:
1. trading and order collection financial instruments 72.539 86.514 (13.975) -16,2%
2. currency trading (302) (612) 310 -50,7%
3. custody and administration of securities (2.701) (2.637) (64) 2,4%
4. placement of securities, investment fund units and segregated accounts 87.752 75.363 12.389 16,4%
6. investment advisory services 429 302 127 42,1%
7. distribution of insurance products 12.587 10.972 1.615 14,7%
8. distribution of other products 12 491 (479) -97,6%
Collection and payment services 9.170 6.610 2.560 38,7%
Holding and management of current/deposit accounts (7.378) (2.281) (5.097) 223,5%
Other fee expense personal financial advisers (21.394) (18.687) (2.707) 14,5%
Securities lending (10.978) (4.681) (6.297) 134,5%
Other Services 3.875 3.773 102 2,7%
Total 143.611 155.127 (11.516) -7,4%
Net fees and commissions amounted to €144 million, recording a decrease of 7.4% compared to the same period of the previous year.This increase was mainly attributable to the decline in net fees and commissions from trading and order collection for financial instruments, as a result of the reduction in orders and the average order amount, and the increase in fee and commission expense for securities borrowing and current accounts and deposit account management, partially offset by higher fee and commission income for the placement and management of securities, units in investment funds and segregated accounts thanks to the increase in assets under management.
The increase in fee and commission expense for securities borrowing was offset by higher revenues recorded in the net interest margin, thanks to interest accrued on the funding generated from reverse repos carried out with borrowed securities.
The increase in Net trading, hedging and fair value income is mainly attributable to gains realised from securities and currency trading.

48
Report on Operations
Annual Report and Accounts as at 31 December 2012 · FinecoBank
Income statement figures (Continued)
Operating costs(Amounts in € thousand)
BREAKDOWN OF OPERATING COSTS 12.31.2012 12.31.2011
CHANGES
AMOUNT %
Payroll costs (61,022) (59,971) (1,051) 1.8%
Other administrative expenses (148,670) (135,076) (13,594) 10.1%
Recovery of expenses 31,474 30,256 1,218 4.0%
Amortisation, depreciation and impairment losses on intangible and tangible assets (8,245) (8,581) 336 -3.9%
Total operating costs (186,463) (173,372) (13,091) 7.6%
(Amounts in € thousand)
PAYROLL COSTS 12.31.2012 12.31.2011
CHANGES
AMOUNT %
1) Employees (59,220) (56,893) (2,327) 4.1% a) wages and salaries (40,522) (39,832) (690) 1.7%
b) social security contributions (10,609) (10,739) 130 -1.2%
c) severance pay (2,172) (2,445) 273 -11.2%
d) social security costs - - - n.c.
e) allocation to employee severance pay provision (165) (178) 13 -7.3%
f) payments to external - n.c.
pension funds: - n.c.
- defined contribution - - - n.c.
- defined benefit - - - n.c.
g) payments to external - n.c.
pension funds: - n.c.
- defined contribution (742) (761) 19 -2.5%
- defined benefit - - - n.c.
h) costs related to - n.c.
share-based payments (588) (487) (101) 20.7%
i) other employee benefits (4,422) (2,451) (1,971) 80.4%
2) Other staff (97) (267) 170 -63.7%3) Directors and statutory auditors (764) (686) (78) 11.4%4) Early retirement costs - - - n.c.5) Recovery of expenses for employees seconded
to other companies 91 192 (101) -52.6%6) Recovery of expenses for employees seconded
to the Company (1,032) (2,317) 1,285 -55.5%Total (61,022) (59,971) (1,051) 1.8%
Payroll costs as at 31 December 2012 show an increase of 1.8%.
Note that item h) “costs resulting from share-based payments”, refers to the costs incurred by FinecoBank for share-based payments issued by UniCredit S.p.A..
There were no significant changes compared to the previous year in other administrative expenses net of indirect taxes and duties, recovery of taxes and advertising expenses - Marketing and communication.
Indirect taxes and duties net of recovery of taxes show an increase of €7 million due to the promotion implemented by the Bank during 2012 which offers free stamp duty on securities accounts for all customers who activate the Portafoglio Remunerato (remunerated portfolio) service.

49FinecoBank · Annual Report and Accounts as at 31 December 2012
(Amounts in € thousand)
OTHER ADMINISTRATIVE EXPENSES AND RECOVERY OF EXPENSES 12.31.2012 12.31.2011
CHANGES
AMOUNT %
1) INDIRECT TAXES AND DUTIES (39,306) (31,174) (8,132) 26.1%2) MISCELLANEOUS COSTS AND EXPENSESA) Advertising expenses - Marketing and communication (16,891) (14,770) (2,121) 14.4% Mass media campaigns (12,491) (10,608) (1,883) 17.8%
Marketing and promotions (4,303) (4,059) (244) 6.0%
Sponsorships (65) (70) 5 -7.1%
Conventions and internal communications (32) (33) 1 -3.0%
B) Expenses related to credit risk (739) (600) (139) 23.2% Credit recovery expenses (431) (266) (165) 62.0%
Commercial information and company searches (308) (334) 26 -7.8%
C) Expenses related to personnel (12,373) (12,405) 32 -0.3% Personnel training (408) (397) (11) 2.8%
Car rental and other payroll costs (40) (45) 5 -11.1%
Personal financial adviser expenses (11,321) (11,407) 86 -0.8%
Travel expenses (512) (457) (55) 12.0%
Premises rentals for personnel (92) (99) 7 -7.1%
D) ICT expenses (29,674) (30,203) 529 -1.8% Lease of ICT equipment and software (6,069) (6,459) 390 -6.0%
Software expenses: lease and maintenance (5,639) (5,490) (149) 2.7%
ICT communication systems (3,673) (3,941) 268 -6.8%
ICT services: external personnel/outsourced services (6,778) (6,680) (98) 1.5%
Financial information providers (7,515) (7,633) 118 -1.5%
E) Consulting and professional services (3,468) (3,670) 202 -5.5% Consultancy for ordinary operations (764) (1,089) 325 -29.8%
Consultancy for strategy, business development and organisational optimisation (34) (5) (29) 580.0%
Legal expenses (56) (11) (45) 409.1%
Legal disputes (2,614) (2,565) (49) 1.9%
F) Real estate expenses (21,112) (19,700) (1,412) 7.2% Real estate services (671) (671) - 0.0%
Repair and maintenance of furniture, machinery, and equipment (157) (580) 423 -72.9%
Maintenance of premises (1,155) (1,016) (139) 13.7%
Premises rentals (15,457) (14,911) (546) 3.7%
Cleaning of premises (549) (394) (155) 39.3%
Utilities (3,123) (2,128) (995) 46.8%
G) Other functioning costs (25,107) (22,554) (2,553) 11.3% Surveillance and security services (105) (95) (10) 10.5%
Money counting services and transport (2) (2) - 0.0%
Postage and transport of documents (2,617) (2,349) (268) 11.4%
Administrative and logistic services (13,536) (12,235) (1,301) 10.6%
Insurance (2,766) (2,620) (146) 5.6%
Printing and stationery (651) (665) 14 -2.1%
Association dues and fees (5,212) (4,362) (850) 19.5%
Other administrative expenses (218) (226) 8 -3.5%
H) Recovery of costs 31,474 30,256 1,218 4.0% Recovery of ancillary expenses 407 348 59 17.0%
Recovery of taxes 31,067 29,908 1,159 3.9%
Total (117,196) (104,820) (12,376) 11.8%

50
Report on Operations
Annual Report and Accounts as at 31 December 2012 · FinecoBank
Income statement figures (Continued)
Impairment losses on intangible assets relate mainly to the amortisation of the costs incurred for computer software with a long-term useful life and did not show any significant change with respect to the previous year.
Impairment losses on tangible assets refer to the depreciation applied to electronic machines, plant and machinery, furniture and fittings and did not show any significant change with respect to the previous year.
Profit (loss) before tax from continuing operations(Amounts in € thousand)
12.31.2012 12.31.2011
CHANGES
AMOUNT %
Operating profit (loss) 223,318 126,526 96,792 76.5%Net impairment losses on loans andprovisions for guarantees and commitments (2,852) (2,794) (58) 2.1%
Net operating profit (loss) 220,466 123,732 96,734 78.2%Provisions for risks and charges (18,356) (17,381) (975) 5.6%
Net income from investments (3) 94 (97) -103.2%
Profit before tax 202,107 106,445 95,662 89.9%
There were no significant changes in net impairment losses on loans and provisions for risks and charges compared to 31 December 2011.
Net income from investments as at 31 December 2011 included the gain from the sale of shares held in Monte Titoli S.p.A. to Borsa Italiana S.p.A..
Profit (loss) before tax from continuing operations came to €202 million, an increase of 89.9% compared to 31 December 2011.

51FinecoBank · Annual Report and Accounts as at 31 December 2012
Tax expense (income) for the period(Amounts in € thousand)
BREAKDOWN OF TAXES FOR THE YEAR 12.31.2012 12.31.2011
CHANGES
AMOUNT %
Current IRES income tax charges (57,120) (31,237) (25,883) 82.9%
Current IRAP corporate tax charges (16,402) (11,379) (5,023) 44.1%
Adjustment to current tax of prior years (4,000) - (4,000) n.c.
Total current taxes (77,522) (42,616) (34,906) 81.9%Change in deferred tax assets 2,712 805 1,907 236.9%
Change in deferred tax liabilities (1,384) (1,424) 40 -2.8%
Total deferred tax liabilities 1,328 (619) 1,947 n.c.Gain from substitute tax exemption (446) (446) - -
Income tax for the year (76,640) (43,681) (32,959) 75.5%
Current income taxes were calculated according to the legal provisions introduced by Legislative Decree no. 38 of 28 January 2005, issued following the incorporation of IAS/IFRS into Italian legislation and of Decree no. 48 of 1 April 2009, which established provisions for the implementation and coordination of tax requirements for IAS Adopter parties.The amount of taxes was influenced by the provisions contained in the Law Decree 201/2011 which introduced, with effect from the tax period under way at 31 December 2012, the deductibility for Income tax purposes of the IRAP corporate tax relating to the taxable portion of the employed payroll costs.This deduction can also be applied to previous tax periods by submitting an application for the refund of the additional tax paid from 28 December 2007.In accordance with the Parent Company’s instructions, a tax credit was recognised for the additional tax paid in the tax periods from 2007 to 2011 for which a refund application has been made.Law no. 28/2009 introduced the option, through the payment of a substitute tax, to recalculate the tax deductible amounts of goodwill. On the instructions of the Parent Company, FinecoBank realigned the goodwill recognised following the merger of UniCredit Xelion Sim into UniCredit Xelion Banca S.p.A..
The redeemed goodwill may be amortised off the books for an amount not exceeding one ninth for 2010 and one tenth from 2011 onwards.As per the instructions of the Parent Company, in 2008, the tax benefit expected from the future deductibility of off-the-book amortisation, corresponding to €4 million, was recognised in the accounts. A tenth of this amount will be recognised through profit or loss for each year of the tax deduction of tax-related amortisation of goodwill.For the three-year period 2010-2012 FinecoBank is subject, as a consolidated company, to what is known as “National tax consolidation” - introduced by Legislative Decree no. 344 of 12 December 2003 - which will be performed by the Parent Company UniCredit S.p.A..
Net Profit (Loss) for the year Net profit recorded an increase of 100%, amounting to €125.5 million, compared to €62.8 million recorded in the same period of the previous year.
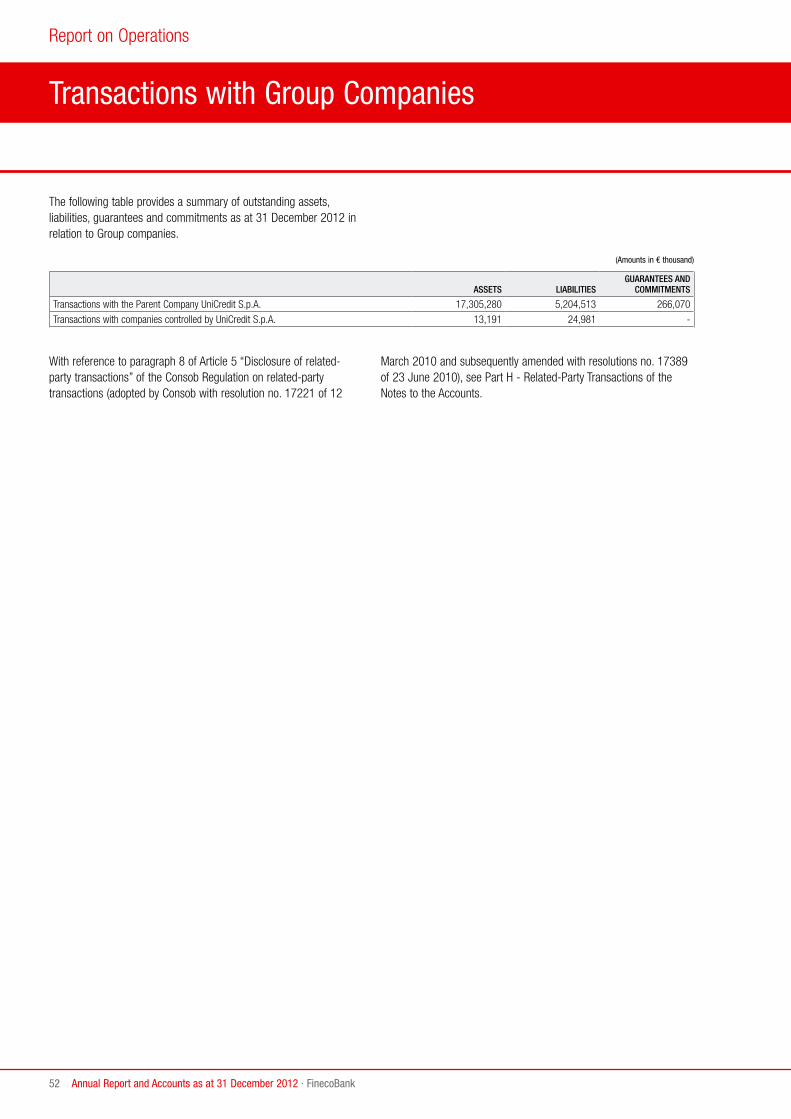
52
Report on Operations
Annual Report and Accounts as at 31 December 2012 · FinecoBank
Transactions with Group Companies
The following table provides a summary of outstanding assets, liabilities, guarantees and commitments as at 31 December 2012 in relation to Group companies.
(Amounts in € thousand)
ASSETS LIABILITIESGUARANTEES AND
COMMITMENTS
Transactions with the Parent Company UniCredit S.p.A. 17,305,280 5,204,513 266,070
Transactions with companies controlled by UniCredit S.p.A. 13,191 24,981 -
With reference to paragraph 8 of Article 5 “Disclosure of related-party transactions” of the Consob Regulation on related-party transactions (adopted by Consob with resolution no. 17221 of 12
March 2010 and subsequently amended with resolutions no. 17389 of 23 June 2010), see Part H - Related-Party Transactions of the Notes to the Accounts.

53FinecoBank · Annual Report and Accounts as at 31 December 2012
Subsequent Events and Outlook
Outlook and main risks and uncertainties
In line with the strategies shared with the UniCredit group3, FinecoBank has planned ambitious projects for 2013, to be achieved through considerable investment in advertising and marketing and with the support of the growth of the personal financial advisers network. The objective is to extend the customer base and improve the quality of customer relations, while maintaining the highest possible level of customer satisfaction.FinecoBank intends harness the opportunities resulting from its excellent strategic positioning on the Italian market in order to develop its business in foreign markets, building on its membership of a major European banking Group in the form of UniCredit.At national level, the bank faces two major challenges: to support the process of globalisation of the trading activities of its more sophisticated customers, and, through wealth management, to provide the best services to one of the world’s largest savings markets, with a view to providing a truly 360° advisory service.At European level, FinecoBank will seek to replicate its business model by adopting a “white labelling” approach to major trading and banking activities in several of the Group’s foreign banks.
Number of treasury shares of the Parent Company
FinecoBank does not hold treasury shares or shares of the Parent Company, even through other companies or third parties.
3. In the UniCredit group’s organisation chart, FinecoBank is a Legal Entity (LE) that is part of the Asset Gathering (AG) Global Business Line (BL). The AG Business Line is under the General Manager of the UniCredit group.

54
Report on Operations
Annual Report and Accounts as at 31 December 2012 · FinecoBank
Dear Shareholder,We hereby submit the accounts as at 31 December 2012 comprising the Balance sheet, Income Statement and the Notes to the Accounts for the year 2012, as well as the Directors’ Report on Operations, for your approval.
We also recommend the following allocation of the net profit for the year:
Proposal for the approval of the accounts and allocation of profit for the year
(Amounts in €)
Net profit for the year 125,466,684.84
to the legal reserve (5% of the profit for the year pursuant to Article 35 of the Articles of association) 6,273,334.24
to the shareholder, allocating to the 606,274,033 shares, representing the entire share capital, a dividend per share of €0.1845 111,857,559.09
to charitable donations 2,200,000.00
to unavailable retained earnings (Article 6, paragraph 2 of Legislative Decree 38/2005) 165,691.50
to retained earnings 4,970,100.01
If the accounts and the allocation of the profit for the year obtain your approval, the shareholders’ equity will be as follows:
(Amounts in €)
Share capital 200,070,430.89
Legal reserve 28,800,462.10
Share premium reserve 1,934,112.62
Unavailable retained earnings (Article 6, paragraph 2 of Legislative Decree 38/2005) 169,961.57
Retained earnings 98,743,423.13
Shareholders’ equity 329,718,390.31
We also propose to pay the aforesaid dividend amount, in accordance with legal regulations, as of 16 April 2013.
Milan, 12 March 2013
FinecoBank S.p.A. FinecoBank S.p.A. Managing Director Chairman Alessandro Foti Enrico Cotta Ramusino

55FinecoBank · Annual Report and Accounts as at 31 December 2012
(Amounts in € thousand)
ASSETS 12.31.2012 12.31.2011
Cash and cash balances = item 10 7 4
Financial assets held for trading = item 20 7,589 11,413
Loans and receivables with banks = item 60 17,271,573 16,282,014
Loans and receivables with customers = item 70 553,606 524,547
Financial investments 69,430 57,784
30. Financial assets at fair value through profit or loss 10,516 10,409 40. Available-for-sale financial assets 58,914 47,375Hedging instruments 73,745 78,290
80. Hedging derivatives 190,572 329,933 90. Changes in fair value of portfolio hedged items (116,827) (251,643)Property, plant and equipment = item 110 8,700 9,362
Goodwill = item 120. Intangible assets of which: goodwill 89,602 89,602
Other intangible assets = item 120 net of goodwill 8,177 8,718
Tax assets = item 130 47,999 46,018
Non-current assets and disposal groups classified as held for sale = item 140 - 145
Other assets = item 150 162,042 168,992
Total assets 18,292,470 17,276,889
(Amounts in € thousand)
LIABILITIES AND SHAREHOLDERS’ EQUITY 12.31.2012 12.31.2011
Deposits from banks = item 10 2,065,153 1,198,064
Deposits from customers and debt securities in issue 15,339,334 15,279,318
20. Deposits from customers 12,263,542 10,702,032 30. Debt securities in issue 3,075,792 4,577,286Financial liabilities held for trading = item 40 7,177 3,630
Hedging instruments 73,251 75,423
60. Hedging derivatives 213,885 370,769 70. Changes in fair value of portfolio hedged items (140,634) (295,346)Provisions for risks and charges = item 120 108,976 98,361
Tax liabilities = item 80 66,588 58,736
Other liabilities 187,930 186,117
100. Other liabilities 184,805 182,981 110. Employee severance pay provision 3,125 3,136Shareholders’ equity 444,061 377,240
- capital and reserves 318,309 315,120
160. Reserves 116,305 113,116 170. Share premium reserve 1,934 1,934 180. Share capital 200,070 200,070- revaluation reserves for available-for-sale financial assets 285 (644)
130. Revaluation reserves of which: Available-for-sale financial assets 285 (644)- net profit = item 200 125,467 62,764
Total liabilities and shareholders’ equity 18,292,470 17,276,889
Reconciliation of condensed accounts to mandatory reporting schedule

56
Report on Operations
Annual Report and Accounts as at 31 December 2012 · FinecoBank
(Amounts in € thousand)
INCOME STATEMENT 12.31.2012 12.31.2011
Net interest 243,469 133,602
30. Net interest margin 243,469 133,602 Dividends and other income from equity investments - -
70. Dividend income and similar revenue 1 13 less: dividends from held for trading equity instruments included in item 70 (1) (13)Net fees and commissions = item 60 143,611 155,127
60. Net fees and commissions 143,611 155,127 Net trading, hedging and fair value income 28,069 24,891
80. Gains (losses) on financial assets and liabilities held for trading 26,264 26,429 + dividends from held for trading equity instruments (from item 70) 1 13 90. Fair value adjustments in hedge accounting - - 110. Gains (losses) on assets and liabilities at fair value through profit and loss 1,804 (1,553)Net other expenses/income (5,368) (13,722)
190. Other net operating income 26,107 27,294 100. Gains (losses) on disposal or repurchase of: a) loans and receivables (from December 2010) 56,984 (10,760) less: other operating income - of which: recovery of costs (31,474) (30,256) 100. Gains (losses) on disposal or repurchase of: d) financial liabilities (56,985) -OPERATING INCOME 409,781 299,898 Payroll costs (61,022) (59,971)
150. Administrative costs - a) payroll costs (61,022) (59,971)Other administrative expenses (148,670) (135,076)
150. Administrative costs - b) other administrative expenses (148,670) (135,076)Recovery of expenses 31,474 30,256
190. Other net operating income - of which: recovery of costs 31,474 30,256 Amortisation, depreciation and impairment losses on intangible and tangible assets (8,245) (8,581)
170. Impairment/write-backs on property, plant and equipment (2,996) (3,114) 180. Impairments/write-backs on intangible assets (5,249) (5,467) Operating costs (186,463) (173,372)OPERATING PROFIT (LOSS) 223,318 126,526
Reconciliation of condensed accounts to mandatory reporting schedule (Continued)

57FinecoBank · Annual Report and Accounts as at 31 December 2012
Continued: Income Statement (Amounts in € thousand)
INCOME STATEMENT 12.31.2012 12.31.2011
Net impairment losses on loans and provisions for guarantees and commitments (2,852) (2,794)
130. Impairment losses/write-backs on:a) loans and receivables (2,852) (2,559) 130. Impairment losses/write-backs on:d) other financial assets - (235)NET OPERATING PROFIT (LOSS) 220,466 123,732 Provisions for risks and charges (18,356) (17,381)
160. Provisions for risks and charges (18,356) (17,381)Net income from investments (3) 94
100. Gains (losses) on disposal or repurchase of: b) available-for-sale financial assets - 95 240. Gains (losses) on disposal of investments (3) (1)PROFIT (LOSS) BEFORE TAX FROM CONTINUING OPERATIONS 202,107 106,445 Income tax for the period (76,640) (43,681)
260. Income tax on profit or loss from continuing operations (76,640) (43,681)PROFIT (LOSS) AFTER TAX FROM CONTINUING OPERATIONS 125,467 62,764 NET PROFIT (LOSS) FOR THE YEAR 125,467 62,764

58
Report on Operations
Annual Report and Accounts as at 31 December 2012 · FinecoBank
Dear Shareholder. Pursuant to Article 2429, paragraph 2, of the Civil Code and Article 153 of Legislative Decree no. 58 of 24 February 1998, as amended, the Board reports on its supervisory activity performed in the financial year ended as at 31 December 2012.
The Board carried out its supervisory activity prescribed by the law in force, in accordance with the instructions issued by the Bank of Italy and Consob, and in compliance with its own role.On the basis of its schedule, the Board held numerous meetings with Senior Management and the Heads of the operational areas, examining in depth all the principal issues concerning the Company’s management and organisation and overseeing the adequacy of the organisational structure and its proper operation. In particular, an analysis was conducted not only of the processes relating to the internal control system and the administrative-accounting system, but also the issues concerning credit, investment services, organisation and commercial activity as well as the Company’s business plans.Said supervisory activities, and the information requested and received from the Company did not reveal any facts or irregularities worthy of mention or such that they required to be reported to the competent Authorities or Supervisory and Control Bodies.Pursuant to the indications given by Consob in communication DEM 1025564 of 6 April 2001, we also specify the following.
Correct management practicesThe Board oversaw proper compliance with the law and the Articles of Association as well as correct management practices both at meetings of the Board of Directors and of the other bodies, which it attended, and at the meetings with the Senior Management and the Heads of the various Areas and Functions of the Bank.The Board can assert that, on the basis of the information obtained, the resolutions passed comply with legal regulations and with the Articles of Association, do not appear to be in conflict of interest, are in line with administrative prudence and do not jeopardise the Bank’s financial stability.Our examinations did not reveal that the Bank entered into blatantly risky or irresponsible transactions or transactions which may prejudice the integrity of the Company’s capital. Organisational structureThe Board of Statutory auditors assessed the adequacy of the organisational structure and its proper functioning through various meetings with top management and with the heads of the various areas and functions. No organisational shortcomings emerged from said assessment.Specifically, in 2012, the Board supervised initiatives aimed at improving the business management and took note of the amendments made to the Bank’s central management and network structures, to the organisational chart, which clearly identifies functions, tasks and lines of responsibility, and to the Bank’s internal regulations, also with a view to compliance with Bank of Italy provisions containing implementation
instructions on the organisation, procedures and internal controls needed to prevent and identify money laundering and the funding of terrorist activities. We specifically note the verifications conducted by the Board of Statutory Auditors on the measures adopted on 12 November 2012 by the Board of Directors to eliminate the position of the General Manager.The Board took note of the continuous implementation of the Guidelines issued by the Parent Company - which plays a management and coordination role vis-à-vis the Bank - and of the consequent organisational changes made by the Bank to improve the effectiveness and efficiency of its management as well as to align its structure to the target organisational model of the Group.The Board of Statutory Auditors also assessed the adequacy of the Bank’s organisational structure as regards the internalisation of trading orders for some financial instruments and currencies, implemented as part of a specific internal policy containing adequate limits - which have always been observed - to mitigate the relative risks.The Board acknowledges the effective activation of the Bank’s Business Continuity Plan (BCP) as a result of the earthquakes that hit the Emilia-Romagna region in May 2012, and the testing of the Disaster Recovery Plan with a successful outcome.
Internal control systemThe Board reports that Internal Audit operations were conducted in 2012 through outsourcing to UniCredit Audit S.C.p.A., a wholly-owned subsidiary of UniCredit S.p.A., which merged into the latter with effect from 1 March 2013. On 10 November 2011 the FinecoBank’s Board of Directors also adopted the “Group’s Audit Mandate”, which - along with the subsequent Group audit policy - establishes the mission, responsibilities, independence, tasks and authority of the Group Internal Audit belonging to FinecoBank.During its assessment, the Board verified compliance with the Audit Plan - in terms of both central structures and processes as well as Network structures - originally established also based on recommendations of the Board, and approved by the Board of Directors as part of the acknowledgement of the Guidelines issued by the Audit Department of the Parent Company.The Board has successfully and systematically interacted with the Chief Audit Executive (CAE), the head of the internal audit function. The meetings held assessed, inter alia, the interim/quarterly and annual reports specifically drawn up for the Board of Directors and the Board of Statutory auditors. Based on its supervisory activities, the Board expressed a positive opinion on the internal auditing, deemed the internal control system and the work carried out by the persons in charge of internal control to be adequate.The Company also possesses an active Chief Risk Office Department (CRO) - to which, inter alia, the offices belonging to the Receivables Area and the “Operational Risk Management” organisational unit report. The CRO was established to evaluate and monitor the adequacy of operational risk measurement, control and management systems and to verify that the Bank takes measures to mitigate business risks (risk management). During its assessment, the Board met the Head of the CRO Area on a number of occasions to evaluate, among other things, its operations and to examine the quarterly reports prepared by the same. The Board expressed a positive
Report of the Board of Statutory Auditors

59FinecoBank · Annual Report and Accounts as at 31 December 2012
opinion on the work carried out by the Head of the Chief Risk Office Area, noting that the “Annual Report on FinecoBank’s Risk Exposure as at 31 December 2012”, presented by the “CRO Risk Management Department” also acknowledges, inter alia, that for the Bank’s internalisation operations the various expected loss limits were never overrun in 2012.As part of its assessment, the Board met frequently with the Bank’s Compliance Manager - compliance services rendered on the basis of the relative outsourcing contract - and expressed a positive opinion on the reports, plans and work of the same, focusing in particular on compliance with the deadlines envisaged in the periodic C.A.M.P. (Compliance Assessment Mapping & Planning) to conclude the corrective measures identified on each occasion. Specifically, the Board also assessed - with the support of results from the specific monitoring carried out by the Bank’s structures and taking on board any suggestions relating to the most significant findings of the Audit Reports regularly examined by the Board and followed by the implementation of the recommended measures - compliance with anti-money laundering and counter-terrorism legislation, the process to grant specific powers to a Single Group Delegate relating to suspicious transactions and compliance with said process, compliance with MIFID legislation and with regulations relating to Market Abuse. The Board also examined reports received from the Bank of Italy by the Bank’s Compliance function regarding claims and/or complaints sent by FinecoBank customers, and met with the function to provide clarification and details in this regard.The Board attended the meetings of the Audit Committee, with which it has worked closely, given the common objectives of the two entities. It awaits the issue of the conduct guidelines, also in application of Parent Company instructions, to implement the provisions of Article 19 of Legislative Decree no. 39/2010.The Board of Statutory Auditors also supervised the effective functioning of the Products Committee - which reports to the Board of Directors, set up with the objective of guaranteeing compliance with legislation and preventing the reputational risks linked to the distribution of the Bank’s products and services - and of the Risks Committee.Furthermore, the Board of Statutory Auditors attended the meetings of the Supervisory Body set up pursuant to Legislative Decree no. 231 of 2001 and to this end, under the Organisation and Management Model approved in 2011 by the Supervisory Body and by the Board of Directors, and the relative Decision protocols, deems the assessments and the recommendations of the Supervisory Body appropriate and adequate. The “Report on the Activities Performed by the Supervisory Body pursuant to Legislative Decree no. 231 of 8 June 2011, as at 31 December 2012” states that the identification of sensitive activities can be considered completed for all of the Bank’s structures.The Board assessed compliance with current legislation on occupational health and safety, including therein the locations where FinecoBank’s Personal Financial Advisers are based.
Administrative-Accounting SystemThe Board oversaw - also by visiting the Functions and by holding regular meetings with the officers in charge - the administrative-accounting system and verified that it was adequate and reliable to provide a correct, complete and timely view of the Company’s business activity.
The Board acknowledges that the financial statements as at 31 December 2012 have been drawn up in accordance with the accounting standards issued by the International Accounting Standards Board (IASB), including the SIC and IFRIC interpretation documents, approved by the European Commission as established by European Union Regulation no. 1606 of 19 July 2002, implemented in Italy through Legislative Decree no. 38 of 28 February 2005, up to 31 December 2012. Furthermore, for the Annual Report and Accounts as at 31 December 2012 the Bank adopted the formats for the financial statements and notes, as well as the provisions set forth by the Bank of Italy through Circular no. 262 of 22 December 2005, as amended, without any exceptions, and providing due evidence and disclosure of the reclassifications carried out. The financial statements have also been prepared in compliance with the technical note dated 2 March 2011 issued by the Bank of Italy, and the clarification issued by the same on 14 February 2012 regarding securities lending transactions without cash guarantees.As at 31 December 2012 FinecoBank S.p.A. had no subsidiaries.The Board of Statutory Auditors also assessed compliance with legislative provisions set forth in Law no. 262/2005 regarding the internal control procedures and the internal control system implemented in terms of financial reporting and the truthful representation of operational events, and found that the “Report on the Internal Control System for Financial Reporting, in compliance with Law no. 262/2005 (known as the Savings Law)”, approved by the Board of Directors on 12 March 2013, confirms that the administrative and accounting procedures are adequate and effectively applied.
Related-Party Transactions and atypical and/or unusual transactionsFinecoBank belongs to the UniCredit S.p.A. group and is subject to the management and coordination of UniCredit S.p.A.. In 2010, the Bank renewed the option for national tax consolidation for 2010-2012.Transactions with Group companies and information on transactions with other related parties are clearly specified in the Annual Report and Accounts, especially in the Notes to the Accounts and in the Report on Operations, pursuant to legislative and regulatory provisions in force, including accounting standard IAS 24 and the CONSOB Regulation adopted with resolution no. 17221 of 12 March 2010, as amended by resolution no. 17839 of 23 June 2012.On 26 June 2012 the Board of Statutory Auditors expressed its opinion that the procedures of FinecoBank to achieve the objectives of the Regulations for the management of risk assets and conflicts of interest in relation to related parties, in compliance with the 9th update of the “New regulations for the prudential supervision of banks” set out by Bank of Italy Circular no. 263/2006, were suitable on the whole. On 2 August 2012 the Shareholders’ Meeting of FinecoBank approved the Group Remuneration Policy.The Board also notes that the obligations set out in relation to parties that perform administrative, management and control functions were the subject of resolutions, pursuant to the provisions of Article 36 of Legislative Decree no. 385/1993 (TUB - Consolidated Law on Banking).No atypical and/or unusual transactions are reported.

60
Report on Operations
Annual Report and Accounts as at 31 December 2012 · FinecoBank
Relations with the External AuditorsIn accordance with Article 150, paragraph 3, of Legislative Decree no. 58/98, and the provisions of Legislative Decree 39/2010, the Board held periodic meetings with the External Auditors - promptly exchanging any data or information that could be used in their respective assignments - which did not highlight any particular facts worthy of notice or considered reprehensible pursuant to Article 155, paragraph 2, of Legislative Decree no. 58/98. Auditing fees are disclosed in an annex to the financial statements, pursuant to Article 160 paragraph 1 bis of Legislative Decree 58/98.The Board notes that KPMG has correctly fulfilled its assignment to audit the Company’s financial statements, to ensure that the Company’s accounts are kept in order, and to ensure that any facts relating to management, the certification of tax returns and the abbreviated auditing of the interim financial statements are correctly reported.The Board acknowledges that it received the Report of the External Auditors pursuant to Articles 14 and 16 of Legislative Decree 39/2010 and Article 165 of the TUF (Consolidated Law on Finance), which concluded that “the separate financial statements of FinecoBank Banca Fineco S.p.A. as at 31 December 2012 comply with the International Financial Reporting Standards adopted by the European Union, as well as with the provisions issued in implementation Article 9 of Legislative Decree no. 38/05. Therefore, the financial statements are drawn up clearly and provide a true and fair view of the statement of financial position, income statement result and cash flows of FinecoBank Banca Fineco S.p.A. for the year ended as at that date”.The Board also acknowledges that it has received written confirmation from the External Auditors, pursuant to Article 17, paragraph 9 of Legislative Decree no. 39/2010, of its independence in the period from 1 January 2012 to 29 March 2013 and confirmation that it has not provided the Bank with non-auditing services, even through companies belonging to its Group, in the same period.Lastly, the Board acknowledges that it received the Report required by Article 19, paragraph 3 of Legislative Decree no. 39/2010, which concludes by affirming that “the statutory audit conducted did not show any significant gaps in the internal control system in relation to the financial reporting process to be brought to the attention of the internal control and auditing committee.”The assignment to audit the accounts, granted by FinecoBank for the years 2008 to 2012, will end upon approval of the accounts as at 31 December 2012. Concurrent to the issue of this Report, the Board of Statutory Auditors has filed at the Registered Office of FinecoBank its justified proposal for assignment to audit the accounts for the years 2013-2021.
Complaints pursuant to Article 2408 of the Civil Code - ReportsIn 2012 no complaints were filed pursuant to Article no. 2408 of the Civil Code, nor were any reports filed by third parties.On 20 December 2012, the inspection conducted by the Supervisory Inspectorate of the Bank of Italy at FinecoBank, started on 11 September 2012, was completed. The tax assessment had partially favourable
results. The findings highlighted in the report delivered and illustrated to the Bank’s Board of Directors and the Board of Statutory Auditors on 12 March 2012 were all operational in nature, without any sanctions imposed. Opinions issued in accordance with the lawExcept where indicated above, the Board has not issued any opinions in accordance with the law, as the need for the same did not arise. Meetings held by the Shareholders, the Board of Directors, the Audit Committee and the Supervisory BodyIn 2012, the Board of Statutory Auditors in office attended 3 Shareholders’ Meetings, 11 Board of Directors’ meetings and 9 Audit Committee meetings. Attendance of said meetings enabled the Board, among other things, to ensure that the delegated parties had reported on transactions performed within the powers awarded to the same.The Board of Statutory Auditors met 23 times, in addition to a number of meetings held by the Board with the managers of several of the Bank’s Organisational Units.The Statutory Auditors participated in the meetings of the Supervisory Body established pursuant to Legislative Decree 231 of 2001.
Conclusions - Observations on the financial statements and on the proposed allocation of profit or loss as at 31 December 2012The Board, based on the supervisory activity performed, can reasonably state that the business activities carried out by FinecoBank S.p.A. were conducted in accordance with the Law and the Articles of Association.Moreover, the Board underlines that in the performance of its duties it did not notice any irregularities pursuant to Article 149, paragraph 3, of Legislative Decree no. 58/98, or omissions and/or facts worthy of mention pursuant to Article 153, paragraph 1, of the same Legislative Decree no. 58/98.Having received the Annual Report and Accounts as at 31 December 2012 and the Report on Operations by the legal deadline; having acknowledged the results stated in the Annual Report and Accounts, the compliance of their structure with the applicable provisions, the inclusion of the mandatory content in the report on operations and the specific independent and advance approval by the Management Body of the impairment procedure relating to goodwill recognised in the Accounts and confirming their sustainability; and having also received the Report of the External Auditors which contained no reservations or remarks, the Board expresses its favourable opinion on the approval of the Annual Report and Accounts and the proposal for the allocation of the profit or loss for the year expressed by the Board of Directors.
Milan, 29 March 2013
The Statutory Auditors Gaccioli Gian-Carlo Noris - Chairman Aloisi Barbara Muserra Francesca
Report of the Board of Statutory Auditors (Continued)
61FinecoBank · Annual Report and Accounts as at 31 December 2012
Report of the External Auditors


65FinecoBank · Annual Report and Accounts as at 31 December 2012
Bank Financial Statements
Balance sheet 66Income statement 67Statement of comprehensive income 67Statement of changes in shareholders’ equity 68Cash flow statement 69

66
Bank Financial Statements
Annual Report and Accounts as at 31 December 2012 · FinecoBank
ASSETS 12.31.2012 12.31.2011
10. Cash and cash balances 7,002 4,293
20. Financial assets held for trading 7,589,438 11,412,852
30. Financial assets at fair value through profit or loss 10,515,659 10,408,821
40. Available-for-sale financial assets 58,914,664 47,375,205
60. Loans and receivables with banks 17,271,572,800 16,282,014,240
70. Loans and receivables with customers 553,605,715 524,546,989
80. Hedging derivatives 190,572,506 329,933,295
90. Changes in fair value of
portfolio hedged financial assets (+/-) (116,827,012) (251,643,402)
110. Property, plant and equipment 8,700,120 9,361,514
120. Intangible assets 97,779,193 98,320,498
of which- goodwill 89,601,768 89,601,768
130. Tax assets 47,999,448 46,018,071
a) current tax assets 3,069,769 3,515,381b) deferred tax assets 44,929,679 42,502,690 b1) out of which for purposes of Law 214/2011 3,158,837 2,978,064
140. Non-current assets and disposal groups classified as held for sale - 144,608
150. Other assets 162,040,083 168,991,660
Total assets 18,292,469,616 17,276,888,644
LIABILITIES AND SHAREHOLDERS’ EQUITY 12.31.2012 12.31.2011
10. Deposits from banks 2,065,152,551 1,198,063,579
20. Deposits from customers 12,263,541,879 10,702,031,729
30. Debt securities in issue 3,075,792,027 4,577,285,725
40. Financial liabilities held for trading 7,177,382 3,630,319
60. Hedging derivatives 213,885,004 370,769,519
70. Changes in fair value of portfolio hedged financial liabilities (+/-) (140,633,867) (295,346,384)
80. Tax liabilities 66,588,492 58,735,710
a) current tax liabilities 47,268,875 40,875,739b) deferred tax liabilities 19,319,617 17,859,971
100. Other liabilities 184,804,492 182,982,044
110. Allocation to employee severance pay provision 3,125,356 3,136,349
120. Provisions for risks and charges 108,975,660 98,360,539
b) other reserves 108,975,660 98,360,539130. Revaluation reserves 284,690 (644,752)
160. Reserves 116,304,721 113,116,020
170. Share premium reserve 1,934,113 1,934,113
180. Share capital 200,070,431 200,070,431
200. Net Profit (Loss) for the year 125,466,685 62,763,703
Total liabilities and shareholders' equity 18,292,469,616 17,276,888,644
Balance sheet

67FinecoBank · Annual Report and Accounts as at 31 December 2012
Income statement
INCOME STATEMENT 12.31.2012 12.31.2011
10. Interest income and similar revenues 433,738,493 274,779,536
20. Interest expenses and similar charges (190,269,926) (141,177,262)
30. Net interest income 243,468,567 133,602,27440. Fee and commission revenues 324,378,253 312,010,651
50. Fee and commission expenses (180,767,687) (156,883,852)
60. Net fees and commissions income 143,610,566 155,126,79970. Dividend income and similar revenue 1,091 13,212
80. Gains (losses) on financial assets and liabilities held for trading 26,264,072 26,430,346
90. Fair value adjustments in hedge accounting - -
100. Gains (losses) from disposal or repurchase of: (793) (10,665,505)
a) loans and receivables 56,984,452 (10,760,083)b) available-for-sale financial assets - 94,578d) financial liabilities (56,985,245) -
110. Gains (losses) on financial assets/liabilities at fair value through profit or loss 1,804,235 (1,552,714)
120. Operating income 415,147,738 302,954,412130. Impairment losses on: (2,851,632) (2,793,967)
a) loans and receivables (2,851,632) (2,559,192)d) other financial assets - (234,775)
140. Net profit from financial activities 412,296,106 300,160,445150. Administrative costs (209,691,852) (195,047,516)
a) payroll costs (61,022,097) (59,971,339)b) other administrative expenses (148,669,755) (135,076,177)
160. Net provisions for risks and charges (18,355,623) (17,380,624)
170. Impairment/write-backs on property, plant and equipment (2,995,769) (3,114,085)
180. Impairment/write-backs on intangible assets (5,249,629) (5,467,168)
190. Other net operating income 26,106,460 27,294,137
200. Operating costs (210,186,413) (193,715,256)240. Gains (losses) on disposal of investments (2,623) (736)
250. Total profit (loss) before tax from continuing operations 202,107,070 106,444,453260. Income tax on profit or loss from continuing operations (76,640,385) (43,680,750)
270. Total profit (loss) after tax from continuing operations 125,466,685 62,763,703290. Net Profit (Loss) for the year 125,466,685 62,763,703
Statement of comprehensive income
12.31.2012 12.31.2011
10. Net Profit (Loss) for the year 125,466,685 62,763,703Other comprehensive income after tax without reclassification through profit or loss20. Available-for-sale financial assets 929,442 (611,552)
110. Total Other comprehensive income after tax 929,442 (611,552)120. Comprehensive income (item 10+110) 126,396,127 62,152,151

68
Bank Financial Statements
Annual Report and Accounts as at 31 December 2012 · FinecoBank
Statement of Changes in Shareholders’ Equity as at 12.31.2012
BALA
NCE
AS A
T 12
.31.
2011
CHAN
GE IN
OPE
NING
BAL
ANCE
BALA
NCE
AS A
T 01
.01.
2012
ALLOCATION OF PROFIT FROM PREVIOUS YEAR
CHANGE DURING THE YEAR
SHAR
EHOL
DERS
’ EQU
ITY
AT 1
2.31
.201
2
CHAN
GES
IN R
ESER
VES
SHAREHOLDERS’ EQUITY TRANSACTIONS
COM
PREH
ENSI
VE IN
COM
E AS
AT
12.3
1.20
12
RESE
RVES
DIVI
DEND
S AN
D OT
HER
DIST
RIBU
TION
S
ISSU
ES O
F NE
W S
HARE
S
PURC
HASE
OF
OWN
SHAR
ES
DIST
RIBU
TION
OF
EXTR
AORD
INAR
Y DI
VIDE
ND
CHAN
GES
IN E
QUIT
Y IN
STRU
MEN
TS
OWN
SHAR
E DE
RIVA
TIVE
S
STOC
K OP
TION
S
Share capital:
a) ordinary shares 200,070,431 200,070,431 200,070,431
b) other shares
Share premium reserve 1,934,113 1,934,113 1,934,113
Reserves:
a) from profits 113,116,020 113,116,020 3,188,361 340 116,304,721
b) other
Revaluation reserves:
a) available-for-sale (644,752) (644,752) 929,442 284,690
b) cash flow hedges
c) other
Equity instruments
Treasury shares
Net Profit (Loss) for the period 62,763,703 62,763,703 (3,188,361) (59,575,342) 125,466,685 125,466,685
Shareholders’ equity 377,239,515 - 377,239,515 - (59,575,342) 340 - - - - - - 126,396,127 444,060,640
Statement of Changes in Shareholders’ Equity as at 12.31.2011
BALA
NCE
AS A
T 12
.31.
2010
CHAN
GE IN
OPE
NING
BAL
ANCE
BALA
NCE
AS A
T 01
.01.
2011
ALLOCATION OF PROFIT FROM PREVIOUS YEAR
CHANGE DURING THE YEAR
SHAR
EHOL
DERS
’ EQU
ITY
AT 1
2.31
.201
1
CHAN
GES
IN R
ESER
VES
SHAREHOLDERS’ EQUITY TRANSACTIONS
COM
PREH
ENSI
VE IN
COM
E AS
AT
12.3
1.20
11
RESE
RVES
DIVI
DEND
S AN
D OT
HER
DIST
RIBU
TION
S
ISSU
ES O
F NE
W S
HARE
S
PURC
HASE
OF
OWN
SHAR
ES
DIST
RIBU
TION
OF
EXTR
AORD
INAR
Y DI
VIDE
ND
CHAN
GES
IN E
QUIT
Y IN
STRU
MEN
TS
OWN
SHAR
E DE
RIVA
TIVE
S
STOC
K OP
TION
S
Share capital:
a) ordinary shares 200,070,431 200,070,431 200,070,431
b) other shares
Share premium reserve 1,934,113 1,934,113 1,934,113
Reserves:
a) from profits 110,137,080 110,137,080 2,978,940 113,116,020
b) other
Revaluation reserves:
a) available-for-sale (33,200) (33,200) (611,552) (644,752)
b) cash flow hedges
c) other
Equity instruments
Treasury shares
Net Profit (Loss) for the period 51,880,863 51,880,863 (2,978,940) (48,901,923) 62,763,703 62,763,703
Shareholders’ equity 363,989,287 - 363,989,287 - (48,901,923) - - - - - - - 62,152,151 377,239,515
Statement of changes in shareholders’ equity

69FinecoBank · Annual Report and Accounts as at 31 December 2012
Indirect method
A. OPERATING ACTIVITIES 12.31.2012 12.31.2011
1. Operations 163,504,816 126,332,251- net profit (loss) for the year 125,466,685 62,763,703
- capital gains/losses on financial assets/liabilities held for trading and on assets/liabilities at fair value through profit and loss (1,488,544) 1,165,172
- capital gains/losses on hedging operations - -
- net write-offs/write-backs due to impairment 2,926,862 3,461,604
- net write-offs/write-backs on tangible and intangible assets 8,245,398 8,581,253
- provisions and other income/expenses 19,381,783 18,983,685
- tax not paid 36,588,520 33,989,372
- other adjustments (27,615,888) (2,612,538)
2. Cash flows from/used by financial assets 388,269,828 (4,270,315,588)- financial assets held for trading 10,761,441 3,049,519
- financial assets at fair value through profit or loss 1,586,766 -
- available-for-sale financial assets (9,841,650) (42,783,338)
- loans and receivables with banks: other loans and receivables 407,718,763 (4,453,295,785)
- loans and receivables with customers (31,951,695) 215,564,546
- other assets 9,996,203 7,149,470
3. Cash flows from/used by financial liabilities 1,022,772,480 5,917,462,400- deposits from banks: other payables 1,036,932,074 741,311,149
- deposits from customers 1,529,308,125 582,835,470
- debt securities in issue (1,500,000,000) 4,577,285,725
- financial liabilities held for trading (3,623,090) (6,716,830)
- other liabilities (39,844,629) 22,746,886
Net cash flows from/used in operating activities 1,574,547,124 1,773,479,063B. INVESTMENT ACTIVITIES1. Cash flows from- sales of tangible assets 82 4,613
2. Cash flows used in- purchases of tangible assets (2,124,504) (3,317,346)
- purchases of intangible assets (4,778,170) (5,362,054)
Net cash flows from/used in investing activities (6,902,592) (8,674,787)C. FINANCING ACTIVITIES- dividends and other distributions (59,575,342) (48,901,923)
Net cash flows from/used in financing activities (59,575,342) (48,901,923)NET CASH FLOWS FROM/USED DURING THE YEAR 1,508,069,190 1,715,902,353
ReconciliationBALANCE SHEET ITEMS
Cash and cash balances at the beginning of the year 7,797,344,602 6,081,442,249
Liquidity generated/absorbed during the period 1,508,069,190 1,715,902,353
Cash and cash equivalents: effect of changes in exchange rates - -
Cash and cash equivalents at the end of the year 9,305,413,792 7,797,344,602
The term “cash and cash balances” means cash recorded under item 10 of assets “cash and cash balances” and the cash balances represented by short-term financial investments and other cash recorded under item 60 of assets “Loans and receivables with banks” and item 10 of liabilities “Deposits from banks”.
Cash flow statement


71FinecoBank · Annual Report and Accounts as at 31 December 2012
Part A - Accounting Policies 73 Part B - Balance Sheet 99 Part C - Income Statement 133 Part D - Comprehensive Income 147 Part E - Information on risks and related
risk management policies 151 Part F - Shareholders’ Equity 185 Part G - Business Combinations 191 Part H - Related-Party Transactions 193 Part I - Share-Based Payment 201 Part L - Segment Reporting 207
Notes to the Accounts


73FinecoBank · Annual Report and Accounts as at 31 December 2012
A.1 General 74A.2 The main items of the accounts 76A.3 Information on fair value 94
Part A - Accounting Policies

74
Notes to the Accounts
Annual Report and Accounts as at 31 December 2012 · FinecoBank
A.1 General
Section 1 - Statement of Compliance with IFRSThese Accounts have been prepared in accordance with the IFRS issued by the International Accounting Standards Board (IASB), including the interpretation documents issued by the SIC and the IFRIC, and endorsed by the European Commission up to 31 December 2012, pursuant EU regulation 1606/2002, which was incorporated into Italian legislation through the Legislative Decree 38 of 28 February 2005 (see Section 4 - Other matters).
In its circular 262 of 22 December 2005 (first amendment of 18 November 2009 and further amendments issued through subsequent circular letters) the Bank of Italy - whose powers regarding the accounts of banks and regulated financial companies, previously established under Legislative Decree 87/92, were confirmed in the above mentioned Legislative Decree 38/05 - laid down the formats for the financial statements and notes to the accounts used to prepare this Annual Report and Accounts.
Section 2 - Preparation criteriaAs mentioned above, these Accounts have been prepared in accordance with the IFRS endorsed by the European Commission.
The following documents have been used to interpret and support the application of IFRS, even though they have not all been endorsed by the European Commission:• Framework for the Preparation and Presentation of Financial Statements issued by the IASB in 2001;• Implementation Guidance, Basis for Conclusions, IFRICs and any other documents prepared by the IASB or International Financial Reporting
Interpretations Committee (IFRIC) supplementing the IFRS;• Interpretative documents on the application of IFRS in Italy prepared by the Organismo Italiano di Contabilità (OIC) and Associazione Bancaria
Italiana (ABI);• European Securities and Markets Authority (ESMA) and Consob documents on the application of specific IFRS provisions.
The Annual Report and Accounts comprise the Balance Sheet, the Income Statement, the Statement of Comprehensive Income, the Statement of Changes in Shareholders’ Equity, the Cash Flow Statement (compiled using the indirect method), the Notes to the Accounts and Annexes, together with the Directors’ Report on Operations.
Figures in the financial statements and Notes to the Accounts are given in thousands of euros, unless otherwise specified. In accordance with the Bank of Italy Circular 262/2005, items and tables for which there is no significant information to be disclosed are not included in these Notes.
These Accounts have been prepared on the assumption that the business is a going concern. Indeed, at present, there is no uncertainty as to the Company’s ability to continue its business operations as envisaged by IAS 1. The measurement criteria adopted are therefore consistent with this assumption and with the principles of accrual based accounting, the relevance and materiality of accounting information, and the prevalence of economic substance over legal form. These criteria have not changed with respect to the previous year.
Risks and uncertainties related to the use of estimatesUnder the IFRS, management provides valuations, estimates and assumptions that affect the application of accounting principles and the amounts of assets and liabilities and income and expenses reported in the accounts, as well as the disclosure concerning potential assets and liabilities. Estimates and related assumptions are based on previous experience and other factors considered reasonable under the circumstances and have been used to estimate the carrying values of assets and liabilities not readily available from other sources.
Estimated figures have been used for the recognition of some of the largest value-based items in the Accounts at 31 December 2012, as required by the accounting standards and regulations described above.
These estimates are largely based on calculations of future recoverability of the values recognised in the accounts according to the rules laid down in current legislation and have been made on the assumption of a going concern, i.e. without contemplating the possibility of the forced sale of the items measured.
The processes adopted support the carrying values at 31 December 2012.
The parameters and information used to check the above-mentioned values are therefore significantly affected by such factors, which could change rapidly in ways that are currently unforeseeable, such that further effects on future carrying values cannot be ruled out.
Part A - Accounting Policies

75FinecoBank · Annual Report and Accounts as at 31 December 2012
Estimates and assumptions are regularly reviewed. Any changes resulting from these reviews are recognised in the period in which the review was carried out, provided the change only concerns that period. If the revision concerns both current and future periods it is recognised accordingly in both current and future periods.
Uncertainty affecting estimates is generally inherent in the determination of:• fair value of financial instruments not listed in active markets;• loans and receivables, and financial assets in general;• severance pay (Italy) and other employee benefits;• provisions for risks and charges;• goodwill and other intangible assets;• assets and liabilities related to insurance contracts;• deferred tax assets.
This is because the quantification of these items is mainly dependent both on the evolution of domestic and international socio-economic conditions and on the performance of the financial markets which affect interest rates, price fluctuations, actuarial assumptions and, more generally, the creditworthiness of borrowers and counterparties.
Section 3 - Subsequent eventsNo significant events have occurred after the balance sheet date that would make it necessary to change any of the information given in the Accounts as at 31 December 2012. Further details and information are presented in the Report on Operations.
Section 4 - Other MattersIn 2012 the amendments to IFRS 7 - Financial Instruments: Disclosures - Transfers of Financial Assets (EU Regulation 1205/2011) entered into force. These amendments require the disclosure of more information in the Annual Reports about financial assets transferred, but not de-recognised, and on continuing involvement. They therefore do not have any impact on the figures in the balance sheet and Income Statement. The Bank of Italy incorporated these amendments through its circular letter that amended the above-mentioned Circular 262.
The European Commission also endorsed the following accounting principles that became effective after 31 December 2012:• Amendment to IAS 1 - Presentation of Financial Statements: Presentation of Items of Other Comprehensive Income (EU Regulation 475/2012);• Amendment to IAS 12 - Deferred Tax: Recovery of Underlying Assets (EU Regulation 1255/2012);• Amendment to IAS 19 - Employee Benefits (EU Regulation 475/2012).
The amended IAS 19 will be applicable for reporting periods starting on or after 1 January 2013. The main amendments to IAS 19 introduced by the above-mentioned Regulation principally affect the treatment of “post employees benefits”(including severances), specifically:- the elimination of the “corridor method”; as a consequence, the actuarial gains/losses resulting from the valuation of the obligation shall be
immediately recognised in the financial statements and accounted for as a contra item to revaluation reserves;- revaluation reserve changes must be disclosed in the “Statement of Comprehensive Income”;- the replacement of “interest expense” and “expected return on plan assets” concepts, with “net interest” concept;- the request for more detailed and extended disclosures in the appropriate table of the Notes to the Accounts. More specifically, a sensitivity
analysis of the Defined Benefit Obligation shall be provided every time key actuarial assumptions change, describing the methods and assumptions used to measure the commitments.
For more qualitative and quantitative information, see Part B - Section 12.3 Pensions and other post-retirement defined-benefit obligations.• Amendments to IFRS1 - Severe Hyperinflation and Removal of Fixed Dates for First-Time Adopters (EU Regulation 1255/2012);• Amendments to IFRS 7 - Financial Instruments: Disclosures - Offsetting Financial Assets and Financial Liabilities (EU Regulation 1256/2012);• IFRS 13 - Fair value measurement (EU Regulation 1255/2012). The concept of fair value remains unchanged, but specific guidelines have been
introduced concerning its determination, and additional disclosure will be required starting from 2013;• IFRIC 20: Stripping Costs in the Production Phase of a Surface Mine (EU Regulation 1255/2012).
The European Commission endorsed the following accounting principles and interpretations that will be applicable for reporting periods beginning on or after 1 January 2014:• Amendments to IAS 32 - Offsetting Financial Assets and Financial Liabilities (EU Regulation 1256/2012);• IAS 27 revised - Separate Financial Statements (EU Regulation 1254/2012);• IAS 28 revised - Investments in Associates and Joint Ventures (EU Regulation 1254/2012);• IFRS 10 - Consolidated Financial Statement (EU Regulation 1254/2012);• IFRS 11 - Joint Arrangements (EU Regulation 1254/2012);• IFRS 12 - Disclosure of Interests in Other Entities (EU Regulation 1255/2012);

76
Part A - Accounting Policies (Continued)
Notes to the Accounts
Annual Report and Accounts as at 31 December 2012 · FinecoBank
At 31 December 2012 the IASB had issued the following standards, amendments, interpretations or revisions:• Improvements to IFRSs (2009-2011) (May 2012);• Amendments to IFRS1 - Government Loans (March 2012);• IFRS 9 - Financial Instruments (November 2009) and subsequent amendments ( to IFRS 9 - Mandatory Effective Date and Transition - December
2011)• Transition Guidance (Amendments to IFRS 10, IFRS 11 and IFRS 12) (June 2012);• Investment Entities (Amendments to IFRS 10, IFRS 12 and IAS 27) (October 2012).
However, the application to these principles by the Bank is subject to their transposition by the European Commission.
Lastly, it should be noted that for the purpose of calculating regulatory capital, since 30 June 2010 FinecoBank has exercised the option (granted by the Bank of Italy by order of 18 May 2010) to deduct all capital gains and losses arising out of changes in fair value recognised after 31 December 2009 in revaluation reserves for debt securities issued by the Central governments of EU Countries and held as “available-for-sale financial assets”.
These Accounts are audited by KPMG S.p.A. pursuant to Legislative Decree no.39 of 27 January 2010 and the resolution passed by the Shareholders’ Meeting on 14 April 2008.
The Annual Accounts were approved by the Board of Directors meeting of 12 March 2013, which authorised their publication.
The entire document is lodged with the competent offices and entities as required by law.
A.2 The main items of the accounts
1 - Financial Assets held for trading (HfT)A financial asset is classified as held for trading if it is:• acquired or incurred principally for the purpose of selling or repurchasing it in the near term;• part of a portfolio of identified financial instruments that are managed together and for which there is evidence of a recent actual pattern of short-
term profit-taking;• a derivative (except for derivatives which constitute financial guarantees, see Section 17, and derivatives designated as hedges - see Section 6).
Like other financial instruments, on initial recognition, at settlement date, a held-for-trading financial asset is measured at its fair value, usually equal to the amount paid, excluding transaction costs and income, which are recognised through profit or loss even when directly attributable to the financial assets. Trading book derivatives are recognised on trade date.
After initial recognition these financial assets are measured at their fair value through profit or loss. An exception is represented by derivatives settled by delivery of an unlisted equity instrument whose fair value cannot be reliably measured, and which are therefore measured at cost.
A gain or loss arising from sale or redemption or a change in the fair value of a HfT financial asset is recognised in profit or loss in item 80 “Gains (losses) on financial assets and liabilities held for trading”, with the exception of financial derivatives relating to a fair value option of which gains and losses, whether realised or measured, are booked in item 110 “Gains (losses) on financial assets/liabilities at fair value through profit and loss” (see Section 5). If the fair value of a financial asset falls below zero, which may happen with derivative contracts, it is recognised in item 40 “Financial liabilities held for trading”.
A derivative is a financial instrument or other contract with all three of the following characteristics:• its value changes in response to the change in a specified interest rate, financial instrument price, commodity price, foreign exchange rate, index
of prices or rates, credit rating or credit index, or other variable (usually called the “underlying”);• it requires no initial net investment or an initial net investment that is smaller than would be required for other types of contracts that would be
expected to have a similar response to changes in market factors;• it is settled at a future date.
An embedded derivative is a component of a hybrid (combined) instrument that also includes a non-derivative host contract, with the effect that some of the cash flows of the combined instrument vary in a way similar to a stand-alone derivative. A derivative that is attached to a financial instrument but is contractually transferable independently of that instrument, or has a different counterparty from that instrument, is not an embedded derivative, but a separate financial instrument.
An embedded derivative is separated from the host contract and recognised as a derivative if:• the economic characteristics and risks of the embedded derivative are not closely related to those of the host contract;

77FinecoBank · Annual Report and Accounts as at 31 December 2012
• a separate instrument with the same terms as the embedded derivative would meet the definition of a derivative;• the hybrid (combined) instrument is not measured entirely at fair value through profit or loss.
If it is necessary to separate an embedded derivative from its host contract, but it is not possible to measure the embedded derivative separately either at acquisition or at a subsequent financial reporting date, the entire combined contract is treated as a financial asset or financial liability at fair value through profit or loss.
When an embedded derivative is separated, the host contract is recognised according to its accounting classification.
2 - Available-for-sale Financial Assets (AfS)Available-for-sale financial assets are those non-derivative financial assets that are designated as available for sale or are not classified as loans and receivables, held-to-maturity investments, financial assets held for trading or financial assets at fair value through profit or loss. These assets are held for an indefinite period of time and meet the need to ensure liquidity and face changes in interest rates, exchange rates and prices.
AfS financial assets are money market instruments, other debt instruments or equity instruments; they include shares held as minority stakes where these do not constitute controlling or associate interests, or joint control.
On initial recognition, at settlement date, an AfS financial asset is measured at fair value, which is usually equal to the consideration of the transaction, plus transaction costs and income directly attributable to the instrument.The interest accrued on interest-bearing instruments is accounted for at amortised cost, using the effective interest rate method.
In subsequent periods AfS assets are measured at fair value, the interest on interest-bearing instruments being recognised at amortised cost in the Income Statement. Gains or losses arising out of changes in fair value are recognised in equity item 130. “Revaluation reserves” - except losses due to impairment and exchange rate gains or losses on monetary items (debt instruments) which are recognised under item 130.b) “Impairment losses on AfS financial assets” and item 80. “Gains (losses) on financial assets and liabilities held for trading” respectively - until the financial assets are sold, at which time cumulative gains and losses presented in Revaluation reserves are recognised in profit or loss in item 100.b) “Gains (losses) on disposal or repurchase of AfS financial assets”.
The fair value changes recorded in item 130. “Revaluation reserves” are reported in the Statement of Comprehensive Income.
With reference to revaluation reserves arising from debt instruments issued by Central governments of EU member countries, on 18 May 2010 the Bank of Italy recognised the possibility, for the purposes of the calculation of regulatory capital (prudential filters), of completely neutralising capital gains and losses arising in the revaluation reserves after 31 December 2009 (“symmetric” approach). The Bank adopted this method starting from the regulatory capital calculation made in June 2010 and thereby replaced the “asymmetric” approach previously used (see also Part F - Shareholders’ Equity).
Equity instruments (shares) not listed in an active market and whose fair value cannot be reliably determined are valued at cost.
If there is objective evidence of an impairment loss on an available-for-sale financial asset, the cumulative loss that had been recognised directly in equity item 130 “Revaluation reserves”, is removed from equity and recognised in profit or loss under item 130.b) “Impairment losses on available-for-sale financial assets”.
In respect of debt instruments, any circumstances indicating that the borrower is experiencing financial difficulties which could prejudice the collection of the principal or interest, represent an impairment loss.
Lasting loss of value of equity instruments is assessed on the basis of indicators such as fair value below cost and adverse changes in the environment in which the company operates, as well as the issuer’s debt service difficulties.
The loss of value is normally considered lasting if fair value falls to less than 50% of cost or lasts for more than 18 months.
If, however, the fall in the fair value of the instrument is over 20% but less than or equal to 50% or continues for no less than 9 but no longer than 18 months, the Bank reviews further income and market indicators. If the results of the review are such as to prejudice the recovery of the amount originally invested, a lasting loss of value is recognised.
The amount taken to profit and loss is therefore the difference between the carrying amount (value of initial recognition less any impairment loss already recognised in profit or loss) and current fair value.Where instruments are valued at cost, the amount of the loss is determined as the difference between their carrying value and the present value of estimated future cash flows, discounted at the current market yield on similar financial assets.

78
Part A - Accounting Policies (Continued)
Notes to the Accounts
Annual Report and Accounts as at 31 December 2012 · FinecoBank
If, in a subsequent period, the fair value of a debt instrument increases and the increase can be objectively related to an event occurring after the impairment loss was recognised in profit or loss, the impairment loss is reversed and the amount of the reversal is recognised in the same profit or loss item. The reversal cannot result in a carrying amount of the financial asset that exceeds the amortised cost would have been had the impairment not been recognised.
Impairment losses recognised in profit or loss for an investment in an equity instrument classified as available for sale are not reversed through profit or loss, but recognised at equity.
3 - Held-to-Maturity Investments (HtM)Held-to-maturity investments are non-derivative financial assets with fixed or determinable payments and fixed maturity for which there is the positive intention and ability to hold them to maturity.
If, during the financial year, more than an insignificant amount of held-to-maturity investments are sold or reclassified before maturity, the remaining HtM financial assets shall be reclassified as available-for-sale and no financial assets shall be classified as HtM investments for the two following financial years, unless the sales or reclassifications:• are so close to maturity or the financial asset’s call date that changes in the market rate of interest would not have a significant effect on the
financial asset’s fair value;• occur after substantially all of the financial asset’s original principal has been collected through scheduled payments or prepayments;• are attributable to an isolated event that is beyond the reporting entity’s control, is non-recurring and could not have been reasonably anticipated.
After initial recognition at its fair value, which will usually be the price paid including transaction costs and income directly attributable to the acquisition or provision of the financial asset (even if not yet settled), a held-to-maturity financial asset is measured at amortised cost using the effective interest method. A gain or loss is recognised in profit or loss in item 100 c) “Gains (losses) on disposal of HtM financial assets” when the financial asset is de-recognised.If there is objective evidence that a held-to-maturity investment is impaired, the impairment loss is measured as the difference between the asset’s carrying amount and the present value of the estimated future cash flows discounted using the original effective interest rate of the financial asset. The carrying amount of the asset is reduced accordingly and the loss is recognised in profit or loss under item 130(c) “Impairment losses on held-to-maturity investments”.If, in a subsequent period, the amount of an impairment loss decreases and the decrease can be related objectively to an event occurring after the impairment loss was recognised (such as an improvement in the debtor’s credit rating), the previously recognised impairment loss is reversed. The reversal cannot result in a carrying amount of the financial asset that exceeds what the amortised cost would have been had the impairment not been recognised. The amount of the reversal is recognised in the same profit or loss item.Held-to-maturity investments cannot be hedged for other than the credit/non performance risk.
At the balance sheet date the Bank did not hold any financial assets classified as “Held-to-maturity investments”.
4 - Loans and ReceivablesLoans and AdvancesLoans and receivables are non-derivative financial assets with fixed or determinable payments that are not quoted in an active market. Loans and receivables are recognised on the date of contract signing, which normally coincides with the date of disbursement to the borrower.These items include debt instruments, recognised on settlement date, with the above characteristics or those subject to portfolio reclassification in accordance with the rules of IAS 39 (see Part A.3.1 below - Transfers between portfolios).
After initial recognition at fair value, which is usually the price paid including transaction costs and income directly attributable to the acquisition or issuance of the financial asset (even if not yet paid), a loan or receivable is measured at amortised cost, using the effective interest method, which can be adjusted to consider any write-downs/write-backs resulting from the valuation process.
A gain or loss on loans and receivables, where not hedged, is recognised in profit or loss:• when a loan or receivable is de-recognised: in item 100 (a) “Gains (losses) on disposal”;or:• when a loan or receivable is impaired: in item 130 (a) “Impairment losses on loans and receivables”.
Interest on loans and receivables is recognised in profit or loss on an accrual basis by using the effective interest rate method under item 10 “Interest income and similar revenue”.

79FinecoBank · Annual Report and Accounts as at 31 December 2012
Delay interest is taken to the Income Statement on collection or receipt.
Loans and receivables are reviewed in order to identify those that, following events occurring after initial recognition, show objective evidence of possible impairment. These impaired loans are reviewed and analysed periodically at least once a year.
A loan or receivable is deemed impaired when it is considered that it will probably not be possible to recover all the amounts due according to the contractual terms, or equivalent value.
Allowances for impairment of loans and receivables are based on the present value of expected cash flows of principal and interest; in determining the present value of future cash flows, the basic requirement is the identification of estimated collections, the timing of payments and the rate used.
The amount of the loss on impaired exposure classified as non-performing, doubtful or restructured according to the categories specified below, is the difference between the carrying value and the present value of estimated cash flows discounted at the original interest rate of the financial asset.
For all fixed-rate positions, the rate determined in this manner was also held constant in future years.
If the original interest rate of a financial asset being discounted cannot be found, or if finding it would be excessively onerous, the average rate recorded for positions with similar characteristics is applied. With reference to variable-rate positions for which a change in interest rate occurred during the period, an average rate recorded for these positions at the reference date is applied.
Recovery times are estimated on the basis of any repayment schedules agreed with the borrower or included in a business plan or in forecasts based on historical recovery experience observed for similar classes of loans, taking into account the type of loan, the geographical location, the type of security and any other factors considered relevant.
Any subsequent change with respect to initial expectations of the amount or timing of expected cash flows of principal and interest causes a change in allowances for impairment and is recognised in profit or loss in item 130. (a) “Impairment losses on loans and receivables”.In the Notes to the Accounts, write-downs of impaired loans are classified as specific in the relevant Income Statement item even when the calculation is flat-rate or statistical, as indicated below.
When the reasons for the impairment no longer exist, and this assessment is objectively attributable to an event occurred after the impairment, a reversal is made in the same profit or loss item, within the amount of the amortised cost that there would have been if there had been no impairments.
A loan or receivable is fully de-recognised when the loan or receivable is deemed to be irrecoverable or is written off. Write-offs are recognised directly in profit or loss under item 130(a) “Impairment losses on loans and receivables” and reduce the amount of the principal of the loan or receivable. Reversals of all or part of amounts previously written off are recognised in the same item.
According to Bank of Italy regulations, impaired loans and receivables are classified into the following categories:• Non-performing loans - formally impaired loans, being exposure to insolvent borrowers, even if the insolvency has not been recognised in a
court of law, or borrowers in a similar situation. Measurement is generally on a loan-by-loan basis or, for loans singularly not significant, on a portfolio basis for homogeneous categories of loans;
• Doubtful loans - exposure to borrowers experiencing temporary difficulties, which the Group believes may be overcome within a reasonable period of time. Doubtful loans also include loans not classified as non-performing granted to borrowers other than government entities where the following conditions are met:
- they have fallen due and remained unpaid for more than 270 days (or for more than 150 or 180 days for consumer credit exposure with an original term of less than 36 months, or 36 months or over, respectively);
- the amount of the above exposure to the same borrower and other defaulted payments that are less than 270 days overdue, is at least 10% of the total exposure to that borrower.
Doubtful loans are valued individually when special elements make this advisable or by individually applying flat percentages on a historical or stochastic basis in the remaining cases;• restructured loans, - exposure to borrowers with whom a rescheduling agreement has been entered into including renegotiated pricing at
interest rates below market, the conversion of part of a loan into shares and/or reduction of principal; measurement is on a loan-by-loan basis, including discounted cost due to renegotiation of the interest rate at a rate lower than the original contractual rate. Restructured exposures can be reclassified under unimpaired loans only after two years have passed from the date of signing of the restructuring agreement and a resolution has been adopted by the competent corporate bodies declaring that the debtor’s full solvency has been restored and that there are no outstanding balances on all existing lines of credit.

80
Part A - Accounting Policies (Continued)
Notes to the Accounts
Annual Report and Accounts as at 31 December 2012 · FinecoBank
• past-due loans - total exposure to any borrower not included in the other categories, which at the balance-sheet date has expired facilities or unauthorised overdrafts that are more than 90 days past due and meet the requirements set out by supervisory regulations (ref. Bank of Italy’s Circular No. 263 of 27 December 2006 “New regulations for the prudential supervision of banks”) for their classification under the “past due exposures” category (TSA banks).
Total exposure is recognised in this category if, at the balance-sheet date, either:• the expired or unauthorised borrowing;or:• the average daily amount of expired or unauthorised borrowings during the last preceding quarter is equal to or exceeds 5% of total exposure.
Past-due exposures are valued using a statistical approach based on historical data, applying where available the degree of risk as measured by the risk factor used for Basel II reporting (loss given default).
Collective assessment is used for groups of loans to which, even though objective evidence of impairment has not been identified individually, latent impairment can be attributed, according to the method described below, also on the basis of the risk factors used under Basel II.
Each loan with similar characteristics in terms of credit risk - in relation to loan type, the borrower’s sector of economic activity, geographical location, type of security or other relevant factors - is assessed in terms of its probability of default and a loss given default; these are uniform for each class of loan.
The methods used combine Basel II recommendation and IFRS. The latter exclude future loan losses not yet sustained, but instead include losses already sustained even if they were not manifest at the time of measurement, on the basis of past experience of losses on assets having a similar risk profile to the assets being measured.
The parameter for the average period from deterioration of a borrower’s financial condition and its classification as an impaired loan is the Loss Confirmation Period (LCP).
The portfolio valuation is the product of the risk factors derived from the parameters used under Basel II requirements (with a one-year time horizon) and the above loss confirmation periods expressed as part of a year and diversified according to asset class on the basis of the characteristics and development level of the credit processes.
If these indicators are not available, estimated value and standard loss percentages, based on internal historical series and sectoral studies, shall be used.
Allowances for unsecured loans to residents of countries experiencing debt service difficulties, where the transfer risk is not included in the rating system applied, are generally determined, country by country, with the aim of attributing latent impairment on the basis of shared parameters.
Allowances for impairment reduce the loan or receivable’s carrying amount.
Guarantees, etc.These include all personal or real guarantees issued by the bank to secure third-party obligations.
This portfolio is valued on the basis of impairment losses due to a worsening of the solvency of the guaranteed party calculated on a case-by-case basis in respect of guarantees given on behalf of debtors classified as non-performing or restructured. Impairment of guarantees given on behalf of debtors classified as doubtful is calculated in the same way as for loans and advances.
In respect of guarantees issued on behalf of debtors classified as “Impaired Past due exposures”, expected loss is estimated on the basis of the riskiness of the type of guarantee and underlying risk mitigation instruments.
Risk arising from off-balance sheet items, e.g. loan commitments, is recognised in profit and loss under item 130.d) “Impairment Losses on other financial assets” contra liability item 120 .b) “Provisions for risks and charges - other provisions” (except for impairment losses on guarantees given and derivatives considered similar by IAS 39, which are written down or back contra liability item 100. “Other Liabilities”).
Subsequent write-backs may not exceed the amount of write-downs (whether individual or generic) previously recognised due to impairment.

81FinecoBank · Annual Report and Accounts as at 31 December 2012
5 - Financial Instruments at Fair Value through Profit or Loss (FIaFV)Any financial asset may be designated, in accordance with the provisions of IAS 39 as a financial instrument measured at fair value through profit and loss on initial recognition, except for the following:- investments in equity instruments for which there is no price quoted in active markets and whose fair value cannot be reliably determined;- derivatives.
FIaFV includes financial assets:• not belonging to regulatory trading book, whose risk is: - connected with debt positions measured at fair value (see also section 15 “Financial liabilities at fair value through profit and loss”); and - managed by the use of derivatives not treatable as accounting hedges.• represented by hybrid (combined) instruments containing embedded derivatives that otherwise should have been separated from the host contract.
FIaFV are accounted for in a similar manner to HfT financial assets (see Section 1), however gains and losses, whether realised or unrealised, are recognised in item 110 “Gains (losses) on financial assets and liabilities measured at fair value”.
6 - Hedge AccountingHedging derivatives are those created to hedge market risks (interest-rate, currency and price) to which the hedged positions are exposed. They may be described as follows:• Fair value hedge: a hedge of the exposure to changes in fair value of a recognised asset or liability, or an identifiable portion of such an asset or liability;• Cash flow hedge: a hedge of the exposure to variability in cash flows that is attributable to a particular risk associated with a recognised asset or
liability or a highly probable forecast transaction which could affect profit or loss;• Hedge of a net investment in a foreign entity whose operations are located or run in a non-EU country or whose transactions are carried out in a
currency other than the euro.
Hedging derivatives are initially recognised on trade date and are valued at their fair value.
A hedging relationship qualifies for hedge accounting if there is formal designation and documentation of the hedging relationship including the risk management objective, the strategy for undertaking the hedge, and how the hedging instrument’s prospective and retrospective effectiveness will be assessed. It is necessary to assess the hedge’s effectiveness, at inception and in subsequent periods, in offsetting the exposure to changes in the hedged item’s fair value or cash flows attributable to the hedged risk.
A hedge is regarded as highly effective if, at the inception of the hedge and in subsequent periods, it is determined prospectively to remain highly effective, i.e. that the hedge ratio is within a range of 80-125 per cent. The hedge is assessed on an ongoing basis and thus must prospectively remain highly effective throughout the financial reporting periods for which the hedge has been designated.
The assessment of effectiveness is made at each balance-sheet date or other reporting date. If the assessment does not confirm the effectiveness of the hedge, from that time on hedge accounting is discontinued in respect of the hedge and the hedging derivative is reclassified as a held-for-trading instrument.In addition, the hedging relationship ceases when the hedging instrument expires or is sold, terminated or exercised; the hedged item is sold, expires or is repaid; or it is no longer highly probable that the forecast transaction will occur.
Hedging derivatives are measured at fair value. Specifically:• Fair Value hedging - an effective fair value hedge is accounted for as follows: the gain or loss from remeasuring the hedging instrument at
fair value is recognised through profit or loss in item 90. “Fair value adjustments in hedge accounting”; the gain or loss on the hedged item attributable to the hedged risk adjusts the carrying amount of the hedged item and is recognised through profit or loss in the same item. If the hedging relationship is terminated for reasons other than the sale of the hedged item, this is measured according to the original criterion dictated by the accounting standard applied to the relevant portfolio. In the case of interest-bearing instruments, the difference between the carrying amount of the hedged item on termination of the hedging and the carrying amount it would have had if the hedge had never existed, is recognised through profit or loss in interest receivable or payable over the residual life of the original hedge. The difference in fair value of the hedging derivative since the latest effectiveness testing date is recognised in profit or loss under item 90 “Fair value adjustments in hedge accounting”. If the hedged item is sold or repaid, the portion of fair value which is still unamortised is at once recognised through profit or loss in the item 100. “Gains (losses) on disposal or repurchase”;
• Cash Flow Hedging - hedges are valued at fair value Change in the fair value of a hedging instrument that is considered effective is recognised in equity item 130 “Revaluation reserves”. The ineffective portion of the gain or loss is recognised through profit or loss in item 90 “Fair value adjustments in hedge accounting”. If a cash flow hedge is determined to be no longer effective or the hedging relationship is terminated, the cumulative gain or loss on the hedging instrument that remains recognised in “Revaluation reserves” from the period when the hedge was effective remains separately recognised in “Revaluation reserves” until the forecast hedged transaction occurs or is determined to be no longer possible; in the

82
Part A - Accounting Policies (Continued)
Notes to the Accounts
Annual Report and Accounts as at 31 December 2012 · FinecoBank
latter case gains or losses are transferred through profit or loss to item 80. “Gains (losses) on financial assets and liabilities held for trading”. The fair value changes recorded in item 130 “Revaluation reserves” are also disclosed in the Statement of Comprehensive Income.
• Hedging a Net Investment in a Foreign Company - hedges of a net investment in a company whose operations are located or managed in a foreign country or in a currency other than the euro are accounted for similarly to cash flow hedges.
The gain or loss on the hedging instrument relating to the effective portion of the hedge that has been recognised directly in equity is recognised through profit or loss on disposal of the foreign company. The fair value changes recorded in item 130 “Revaluation reserves” are reported in the Statement of Comprehensive Income also.
The ineffective portion of the gain or loss is recognised through profit or loss in item 90 “Fair value adjustments in hedge accounting”;• Macro-hedged Financial Assets (Liabilities) - IAS 39 allows a fair-value item hedged against interest rate fluctuations to be not only a single
asset or liability but also a monetary position contained in a number of financial assets or liabilities (or parts of them); accordingly, a group of derivatives can be used to offset fair-value fluctuations in hedged items due to changes in market rates. Macro hedging may not be used for net positions resulting from the offsetting of assets and liabilities. As for fair value micro hedging, macro hedging is considered highly effective if, at the inception of the hedge and in subsequent periods, changes in the fair value attributable to the hedged position are offset by changes in fair value of the hedging instrument and if the hedge ratio is retrospectively assessed falling within the range of 80-125 per cent. Net changes - gains or losses - in the value of the macro-hedged assets and liabilities attributable to the hedged risk are recognised in asset item 90 and liability item 70 respectively and offset the profit and loss item 90 “Fair value adjustments in hedge accounting”.
The ineffectiveness of the hedging arises to the extent that the change in the fair value of the hedging item differs from the change in the fair value of the hedged monetary position. The extent of hedge ineffectiveness is in any case recognised in profit and loss item 90. “Fair value adjustments in hedge accounting”.
If the hedging relationship is terminated, for reasons other than the sale of the hedged items, cumulative gain or loss in items 90 (Assets) and 70 (Liabilities) is recognised through profit or loss in interest income or expenses, along the residual life of the hedged financial assets or liabilities.
If the latter are sold or repaid, unamortised fair value is at once recognised through profit and loss in item 90. “Fair value adjustments in hedge accounting”.
As of the balance sheet date, the Bank only had macro-hedges against interest rate risk in place.
7 - Equity InvestmentsEquity investments are equity instruments and consequently defined as financial instruments under IAS 32.
Investments in equity instruments made with the intention of establishing or maintaining a long-term operational relationship with the investee are strategic investments.The following are the types of equity investment:
SubsidiariesSubsidiaries are entities of which:• The Parent owns, directly or indirectly through subsidiaries, more than half of the voting power unless, in exceptional circumstances, it can be
clearly demonstrated that such ownership does not constitute control.• The Parent owns half or less of the voting power and has:- power over more than half of the voting rights by virtue of an agreement with other investors;- power to govern the financial and operating policies of the entity under a statute or an agreement;- power to appoint or remove the majority of the members of the board of directors or equivalent governing body and control of the entity is by that
board or body;- power to cast the majority of votes at meetings of the board of directors or equivalent governing body and control of the entity is by that board or
body.
The existence and effect of potential voting rights that are currently exercisable or convertible, are considered when assessing whether an entity has the power to govern the financial and operating policies of another entity.
At the balance sheet date, the Bank held no investments in subsidiaries.

83FinecoBank · Annual Report and Accounts as at 31 December 2012
AssociatesAn associate is a company over which the investor has significant influence and which are not subsidiaries or joint ventures. If an investor holds, directly or indirectly, 20 per cent or more of the voting power of another company, it is presumed that the investor has significant influence, unless it can be clearly demonstrated that this is not the case.
If the investor holds, directly or indirectly, less than 20 per cent of the voting power of the investee, it is presumed that the investor does not have significant influence unless it can be clearly demonstrated through:• representation on the board of directors or equivalent governing body of the investee;• participation in policy-making process, including participation in decisions about dividends or other distributions;• material transactions between the investor and the investee;• interchange of managerial personnel;• provision of essential technical information.
A substantial or majority ownership by another investor does not necessarily preclude an investor from having significant influence.
At the balance sheet date, the Bank held no investments in associates.
Joint venturesA joint venture is a contractual arrangement whereby two or more parties undertake an economic activity that is subject to joint control. Joint control exists only when the strategic financial and operating decisions relating to the activity require the unanimous consent of the parties sharing control.
At the balance sheet date, the Bank held no investments in joint ventures.Investments in subsidiaries, associates and joint ventures are measured at cost.
The purchase price of an equity investment is the sum of:• the fair value, at the date of acquisition, of the assets sold, liabilities assumed and equity instruments issued by the purchaser in exchange for
control of the investee;and• any cost directly attributable to the acquisition.
If there is evidence that an equity investment may have become impaired, its carrying value is compared with its recoverable value, which is determined on the basis of its value in use, in turn calculated by means of valuation models in general use in financial business, which discount expected future cash flow from the equity investment.
If it is not possible to obtain sufficient information the value in use is considered to be the net worth of the company.
If the recovery value is less than the carrying value, the difference is recognised through profit or loss in item 210. “Profit (loss) of associates”. If the reasons for impairment are removed following a subsequent event occurring after the recognition of impairment, write-backs are made through same profit or loss item.
Equity investments considered strategic investments not covered by the above definitions and not recognised in item 140. “Non-current assets and disposal groups classified as held for sale” or item 90. “ Liabilities included in disposal groups classified as held for sale” (see Section 10), are classified as available-for-sale financial assets or financial assets at fair value through profit or loss, and treated accordingly (see Sections 2 and 5).
8 - Property, Plant and Equipment (Tangible Assets)The item includes:• land• buildings• furniture and fixtures• plant and machinery• other machinery and equipment

84
Part A - Accounting Policies (Continued)
Notes to the Accounts
Annual Report and Accounts as at 31 December 2012 · FinecoBank
and is divided between:• assets used in the business;• assets held as investments.
Assets used in the business are held for use in the production or supply of goods or services or for administrative purposes and are expected to be used during more than one period.
This item includes also assets used by the Bank as lessor through finance lease contracts.
Property, plant and equipment also include leasehold improvements relating to assets which can be which can be separately identified. They are classified according to the specific sub-items relating to the asset type (e.g. plants). Leasehold improvements are usually borne in order to make leased premises fit for the expected use. Improvements and additional expenses relating to property, plant and equipment identifiable but not separable are recognised in item 150 “Other assets”.
Assets held for investment purposes are properties covered by IAS 40, i.e. properties held (owned or under a finance lease) in order to derive rentals and/or a capital gain.
Property, plant and equipment are initially recognised at cost including all costs directly attributable to bringing the asset into use (transaction costs, professional fees, direct transport costs incurred in bringing the asset to the desired location. installation costs and dismantling costs).
Subsequent costs are added to the carrying amount or recognised as a separate asset only when it is probable that there will be future economic benefits in excess of those initially foreseen and the cost can be reliably measured.
Other expenses borne at a later time (e.g. normal maintenance costs) are recognised in the year they are incurred in profit and loss items:• 150. b) “Other administrative expenses”, if they refer to assets used in the business;or:• 190. “Other net operating income”, if they refer to property held for investment.
After being recognised as an asset, an item of property, plant and equipment is carried at cost less any accumulated depreciation and any cumulative impairment losses.
An item with a finite useful life is subject to straight-line depreciation.
The depreciation rates used for the main categories of property, plant and equipment are as follows:• Furniture 12 percent• Fittings 15 percent• Ordinary office equipment 12 percent• Miscellaneous machines, devices and equipment 15 percent• Alarm systems and camera and television circuits 30 percent• Electronic machines 20 percent• Hoisting systems and equipment 7.5 percent• Motor vehicles 25 percent• Buildings 3 percent
An item with an indefinite useful life is not depreciated.Land and buildings, if separately quantifiable, are recognised separately, even if acquired together. Land is not depreciated since it usually has an indefinite useful life. Buildings, conversely, have a finite useful life and are therefore subject to depreciation.The estimate of the useful life of an asset is reviewed at least at each accounting period-end on the basis inter alia of the conditions of use of the asset, of maintenance conditions and expected obsolescence, and, if expectations differ from previous estimates, the depreciation amount for the current and subsequent financial years is adjusted accordingly.
If there is objective evidence that an asset has been impaired, the carrying amount of the asset is compared with its recoverable value, equal to the greater of its fair value less selling cost and its value in use, i.e. the present value of future cash flows expected to originate from the asset. Any value adjustment is recognised in profit and loss item 170. “Impairment/ write-backs on property, plant and equipment”.
If the value of a previously impaired asset is restored, its increased carrying amount cannot exceed the net carrying amount it would have had if there had been no losses recognised on the prior-year impairment.
An item of Property, plant and equipment is de-recognised from the Balance sheet upon disposal or when no further economic benefits are expected to be generated by its use or its disposal and any difference between the disposal or recoverable value and the book value is recognised in the Income Statement under item 240 “Gains (losses) on disposal of investments”.

85FinecoBank · Annual Report and Accounts as at 31 December 2012
9 - Intangible assetsIntangible assets are non-monetary assets for long-term use that are identifiable, although not physically tangible and which are likely to produce future economic benefits.
Intangible assets consist of goodwill, software and costs incurred for the creation of the new Fineco website.
Intangible assets other than goodwill are recognised at purchase cost, i.e. including any cost incurred to bring the asset into use, less accumulated amortisation and impairment losses.Costs sustained after purchase are:• added to initial cost, provided they increase future economic benefits arising from the underlying asset (i.e. if they increase its value or productive
capacity);• in other cases (i.e. when they do not increase the asset’s original value, but are intended merely to preserve its original functionality) are taken to
profit or loss in a single amount in the year in which they have been borne.
An intangible asset with a finite life is subject to straight-line amortisation over its estimated useful life.
Residual useful life is usually assessed as follows:- software maximum 3 years;- other intangible assets maximum 5 years.
Intangible assets with an indefinite life are not amortised.
If there is objective evidence that an asset has been impaired, the carrying amount of the asset is compared with its recoverable value, equal to the greater of its fair value less selling cost and its value in use, i.e. the present value of future cash flows expected to originate from the asset. Any impairment loss is recognised in profit and loss item 180 “Impairment/ write-backs on intangible assets”.
For an intangible asset with indefinite life even if there are no indications of impairment, the carrying amount is compared annually with its recoverable value. If the carrying amount is greater than the recoverable value, the difference is recognised in profit and loss item 180 “Impairment/write-backs on intangible assets”.
If the value of a previously impaired intangible asset, other than goodwill is restored, its increased carrying amount cannot exceed the net carrying amount it would have had if there were no losses recognised on the prior-year impairment.
An intangible asset is de-recognised on disposal or when no future economic benefits are expected from its use or sale in the future and any difference between sale proceeds or recoverable value and carrying value is recognised in the profit and loss item 240 “Gains (losses) on disposal of investments”.
GoodwillIn accordance with IFRS3, goodwill is the excess of the cost of a business combination, involving the acquisition of a business or business units, over the net fair value of the assets and liabilities of a acquired at the acquisition date.Goodwill arising from the acquisition of companies through merger or absorption is recognised as an intangible asset, whereas goodwill arising from the acquisition of subsidiaries, associates and joint ventures included in the carrying amount of the investments in subsidiaries, associates and joint ventures.
At a subsequent financial reporting date, goodwill is recognised net of any cumulative impairment losses and is not amortised.
Goodwill is tested for impairment annually, as for other intangible assets with an indefinite useful life.
It is worth underlining that all the goodwill relates to acquisitions of divisions or companies carrying out trading activities or the management of personal financial advisers. These activities have been fully integrated with FinecoBank’s ordinary operations, as a result it is no longer possible to isolate the contribution of each company/business division from the Bank’s overall income; this means that to establish the reasonableness of the value of goodwill recognised in the financial statements it is necessary to take account of the Bank’s overall income. The cash generating unit (CGU) is the Bank as a whole.

86
Part A - Accounting Policies (Continued)
Notes to the Accounts
Annual Report and Accounts as at 31 December 2012 · FinecoBank
In fact, the specific business model adopted by FinecoBank, which envisages a high level of integration between personal financial advisers and the trading and banking platform, does not account costs/revenues by allocating them to the business units; the personal financial advisers network is an integral part of the overall offer, which includes banking and trading services.Impairment losses on goodwill are recognised in profit and loss item 230 “Impairment losses on goodwill”. In respect of goodwill, no write-backs are allowed.Please see Section 12.3 Intangible assets - Other information in Part B below for further information on goodwill and related impairment tests.
10 - Non-current assets classified as held for saleNon-current assets or groups of associated assets/liabilities (i.e. a group of units generating financial cash flow) whose sale is highly probable, are recognised in item 140. “Non-current assets and disposal groups as held for sale” and item 90. “Liabilities included in disposal groups classified as held for sale” respectively at the lesser of the carrying amount and fair value net of disposal costs.The balance of revenue and expense relating to discontinued assets and liabilities (dividends, interest, etc.) and the measurement as determined above of disposal groups held for sale disclosed in this balance sheet item, net of current and deferred tax liabilities, is recognised in the item 280 “ Profit (loss) after tax from discontinued operations”.
The revaluation reserves relating to Non-current assets classified as held for sale, which are recorded as a contra item to changes in value relevant for this purpose), are reported separately in the Statement of Comprehensive Income (see Part D - Comprehensive Income).
11 - Current and Deferred TaxTax assets and tax liabilities are recognised in the Balance Sheet respectively in item 130. of assets (“Tax assets”) and item 80. of liabilities (“Tax liabilities”).
In compliance with the “Balance sheet liability method”, current and deferred tax liabilities items are:• current tax assets, i.e. amount of tax paid in excess of income tax due in accordance with current tax regulations on business income;• current tax liabilities, i.e. amounts of corporate tax due in accordance with current tax regulations on business income;• deferred tax assets, i.e. amounts of income tax recoverable in future fiscal years as a consequence of: - deductible temporary differences (represented mainly by charges deductible in the future according to current tax regulations on business income); - the carry-forward of unused tax losses; - the carry-forward of unused tax credits;• deferred tax liabilities, i.e. the amounts of income tax due in future fiscal years in respect of taxable temporary differences (mainly represented by the
deferral of the taxation of revenues or the anticipation of the deduction of charges according to the current tax regulations on business income.
Current and deferred tax assets and tax liabilities are calculated using the current tax rates and are recognised in profit or loss on an accrual basis. More specifically, for current IRES income tax, a rate of 27.50% has been calculated; for IRAP corporate tax, the rate applied was 5.57% (including the additional regional tax in force).
In general, deferred tax assets and liabilities arise when there is a difference between the accounting treatment and the tax treatment of the carrying amount of an asset or liability.
Deferred tax assets and liabilities are recognised applying tax rates that at the balance sheet date are expected to apply in the period when the carrying amount of the asset will be recovered or the liability will be settled on the basis of tax regulations in force, and are periodically reviewed in order to reflect any changes in regulations.
Deferred tax assets are booked to the accounts only if they are likely to be recovered through future expected taxable income, measured on the basis of the Bank’s ability, by virtue of the “tax consolidation” option, to generate taxable income in future years. Deferred tax liabilities are always recognised in the accounts. In accordance with the provisions of IAS12, the probability that sufficient future taxable profit against which the deferred tax assets can be utilised will be available is reviewed periodically. The carrying amount of deferred tax assets should be reduced to the extent that it is not probable that sufficient taxable profit will be available.
Current and deferred taxes are recognised in profit and loss item 260. “Tax expense (income) related to profit or loss from continuing operations”, except for tax referred to items that in the same or in another fiscal year are credited or charged directly to equity, such as those relating to gains or losses on available-for-sale financial assets and those relating to changes in the fair value of cash flow hedging instruments, whose changes in value are recognised directly in the Statement of Comprehensive Income - Valuation reserves net of tax.
Current IRES income tax is calculated on the basis of the “tax consolidation” introduced by Legislative Decree 344/03. FinecoBank S.p.A., as a consolidated company, has opted to adhere to the National Tax Consolidation of the UniCredit group for the three year period 2010-2012 (see also Part B of the Notes to the Accounts - Section 13.7 - other information).

87FinecoBank · Annual Report and Accounts as at 31 December 2012
12 - Provisions for risks and chargesRetirement Payments and Similar ObligationsRetirement provisions - i.e. provisions for employee benefits paid after leaving employment - are defined as defined contribution plans or defined benefit plans according to the economic nature of the plan.In detail:• Defined-benefit plans provide a series of benefits depending on factors such as age, years of service and compensation needs. Under this type of
plan actuarial and investment risks are borne by the company;• Defined contribution plans are plans under which the company makes fixed contributions. Benefits are the result of the amount of contributions
paid and return on contributions invested. The employer bears no actuarial and/or investment risks connected with this type of benefit as it has no legal or implicit obligation to make further contributions, should the plan not be sufficient to provide benefit to all employees.
Defined-benefit plans are present-valued by an external actuary using the unit credit projection method.This method distributes the cost of the benefit evenly over the employee’s working life. The liability is determined as the present value of average future payments adjusted according to the ratio of years of service to total years of service at the time of payment of the benefit.
The amount recognised as a liability in item 120.a) Provisions for risks and charges - Post retirement benefit obligations is the present value of the obligation at the balance sheet date, less the fair value of plan assets (if any) out of which the obligations are to be settled directly, minus any actuarial gains or losses not recognised in the Accounts under the ‘corridor’ method, which permits non-recognition of these when they do not exceed the greater of (i) 10% of the present value of the obligation or (ii) 10% of the fair value of any plan assets, less any pension charges relating to benefits already provided but not recognised, less the fair value at the Balance Sheet Date of plan assets due to settle the obligations directly.
The discount rate used to present-value obligations (whether financed or not) relating to benefits to be provided after retirement is determined on the basis of market yield at the Balance Sheet Date of prime issuers’ bonds with an average life in keeping with that of the relevant liability.
At the balance sheet date, the Bank did not have provisions for retirement payments and similar obligations.
Other provisionsProvisions for risks and charges are recognised when:• the entity has a present obligation (legal or constructive) as a result of a past event;• it is probable that an outflow of resources embodying economic benefits will be required to settle the obligation; and• a reliable estimate can be made of the amount of the obligation.
The amounts recognised as provisions are the best estimate of the expenditure required to settle the present obligation. The risks and uncertainties that inevitably surround the relevant events and circumstances are taken into account in reaching the best estimate of a provision.Where the effect of the time value of money is significant (usually when the expense is expected to materialise more than 18 months after its recognition), the amount of the provision should be the present value of the best estimate of the cost required to settle the obligation. The discount rate used reflects the current market assessments.
Provisions are reviewed periodically and adjusted to reflect the current best estimate. If it becomes clear that it is no longer probable that an outflow of resources embodying economic benefits will be required to settle the obligation, the provision is reversed.
Provisions are used only for expenses for which they were originally recognised.
Allocations made in the year are recognised in profit and loss item 160. “Provisions for risks and charges” and include increases due to the passage of time; they are also net of any re-attributions.“Other provisions” also include obligations relating to benefits due to agents, specifically supplementary customer portfolio payments, contractual payments and payments under non-competition agreements, which are measured as per defined benefit plans; accordingly these obligations are calculated using the unit credit projection method (see above under “Retirement Payments and Similar Obligations”).
In certain cases, provisions for risks and charges (e.g. fiscal charges or charges relating to payroll costs) have been classified under their own item to better reflect their nature.

88
Part A - Accounting Policies (Continued)
Notes to the Accounts
Annual Report and Accounts as at 31 December 2012 · FinecoBank
13 - Liabilities, Securities in Issue and Subordinated LoansThe items Deposits with banks, Deposits with customers and Debt securities in issue are used for all forms of third-party funding other than trading liabilities or those valued at fair value.
These financial liabilities are recognised on the settlement date principle initially at fair value, which is normally the consideration received less transaction costs directly attributable to the financial liability. Subsequently these instruments are measured at amortised cost using the effective interest method.
Hybrid debt instruments relating to equity instruments, foreign exchange, credit instruments or indexes, are treated as structured instruments. The embedded derivative is separated from the host contract and recognised as a derivative, provided that separation requirements are met, and recognised at fair value. The embedded derivative is recognised at fair value and subsequently evaluated. Any subsequent changes in fair value are recognised in profit and loss item 80. “Gains (losses) on financial assets and liabilities held for trading”.
The difference between the total amount received and the initial fair value of the embedded derivative is attributed to the host contract.
Instruments convertible into treasury shares entail the recognition, at the issuing date, of a financial liability and of an equity component, recognised in item 150 “Equity instruments”, whenever contractual terms provide for physical delivery.
The equity component is measured at the residual value, i.e., the overall value of the instrument less the separately determined value of a financial liability with no conversion clause and the same cash flow.
The financial liability is recognised at amortised cost using the effective interest method.
Debt securities in issue are recognised net of repurchased amounts; the difference between the book value of the liability and the amount paid to purchase it is recorded in the Income Statement under item 100.d) “Gains (losses) on repurchase of financial liabilities”. Subsequent disposal by the issuer is considered as a new issue which does not produce gains or losses.
The Bank’s debts do not include covenants that would cause default or restructuring events. There are no debt instruments involving convertibility to equity instruments (under IASB IFRIC 19 Extinguishing Financial Liabilities with Equity Instruments).
14 - Financial liabilities held for tradingFinancial liabilities held for trading include:• derivatives that are not designated as hedging instruments;• obligations to deliver financial assets borrowed by a short seller (i.e., an entity that sells financial assets it does not yet own);• financial liabilities issued with an intention to repurchase them in the near term;• financial liabilities that are part of a portfolio of financial instruments considered as a unit and for which there is evidence of a recent pattern of
trading.
An HfT liability, including a derivative, is measured at fair value initially and for the life of the transaction, except for a derivative liability settled by delivery of an unlisted equity instrument whose fair value cannot reliably be measured, and which is therefore measured at cost.
15 - Financial Liabilities at Fair Value through Profit and LossAccording to IAS 39, financial liabilities, as well as financial assets, may also be designated on initial recognition as measured at fair value, provided that:• this designation eliminates or considerably reduces the discrepancy that could arise from the application of different methods of measurement of
assets and liabilities and related gains or losses;or:• a group of financial assets, financial liabilities or both are managed and measured at fair value under risk management or investment strategy
which is internally documented with the entity’s Board of Directors or equivalent body.
This category may also include financial liabilities represented by hybrid (combined) instruments containing embedded derivatives that otherwise should have been separated from the host contract.
These transactions are recognised in the same way as HfT financial liabilities, with any gains and losses, whether realised or not, being recognised in item 110 “Gains (losses) on financial assets and liabilities measured at fair value”.
At the balance sheet date the Bank did not hold any financial assets classified as “Financial liabilities at fair value through profit and loss”.

89FinecoBank · Annual Report and Accounts as at 31 December 2012
16 - Foreign currency transactionsA foreign currency transaction is recognised at the spot exchange rate of the transaction date.
Foreign currency monetary assets and liabilities are translated at the closing rate of the period.
Exchange differences arising from settlement of monetary items at rates different from those of the transaction date and unrealised exchange rate differences on foreign currency assets and liabilities not yet settled, other than assets and liabilities designated as measured at fair value and hedging instruments, are recognised in profit and loss item 80. “Gains (losses) on financial assets and liabilities held for trading”.
Exchange differences arising on a monetary item that forms part of an entity’s net investment in a foreign operation whose assets are located or managed in a country or currency other than the euro are initially recognised in the entity’s equity, and recognised in profit or loss on disposal of the net investment.
Non-monetary assets and liabilities recognised at historical cost in a foreign currency are translated using the exchange rate at the date of the transaction. Non-monetary items that are measured at fair value in a foreign currency are translated at the closing rate. The exchange differences are recognised:• in profit and loss if the financial asset is HfT;• in revaluation reserves if the financial asset is AfS.
Hedges of a net investment in a foreign operation are recognised similarly to cash flow hedges. On the disposal of a foreign operation, the cumulative amount of the exchange differences, classified in an Equity reserve, is reclassified in profit or loss in the year of disposal of the foreign operation.All exchange differences recorded under revaluation reserves in shareholders’ equity are also reported in the Statement of Comprehensive Income.
17 - Other informationBusiness CombinationsA business combination is a transaction through which an entity obtains control of a of a business division, thus bringing together different businesses into one reporting entity.
A business combination may result in a Parent-subsidiary relationship in which the acquirer is the Parent and the acquiree a subsidiary of the acquirer. A business combination may involve the purchase of the net assets of another entity - in which case goodwill can arise - or the purchase of the equity of the other entity (mergers).IFRS 3 requires that all business combinations shall be accounted for by applying the purchase method, that involves the following steps:• identifying an acquirer;• measuring the cost of the business combination;and:• allocating, at the acquisition date, the cost of the business combination to the assets acquired and liabilities and contingent liabilities assumed.
The cost of a business combination is the aggregate of the fair value, at the date of exchange, of assets given, liabilities incurred or assumed and equity instruments issued by the acquirer, in exchange for control of the acquiree.
The acquisition date is the date on which the acquirer effectively obtains control of the acquiree. When this is achieved through a single exchange transaction, the date of exchange coincides with the acquisition date.
A business combination may involve more than one exchange transaction; nevertheless, the cost of the business combination remains equal to the fair value of the amount paid at the acquisition date. This involves the revaluation at fair value - and the recognition of the effects in the Income Statement - of the equity investments previously held in the acquired entity.
The cost of a business combination is allocated by recognising the assets, the liabilities and the identifiable contingent liabilities of the acquired company at their acquisition-date fair value. Exceptions to this principle are deferred income tax assets and liabilities, employee benefits, indemnification assets, reacquired rights, non-current assets held for sale, and share-based payment transactions that are subject to review in accordance with the principle applicable to them.

90
Part A - Accounting Policies (Continued)
Notes to the Accounts
Annual Report and Accounts as at 31 December 2012 · FinecoBank
Positive difference between the cost of the business combination and the net fair value of the identifiable assets, liabilities and contingent liabilities so recognised is accounted for as goodwill.
After initial recognition, goodwill is tested for impairment at least annually.
If the acquirer’s interest in the net fair value of the identifiable assets, liabilities and contingent liabilities exceeds the cost of the business combination, the acquirer shall reassess the fair values and recognise immediately any excess remaining after that reassessment in profit or loss.
Business combinations that result in Parent-subsidiary relationship in which the acquirer is the Parent and the acquiree a subsidiary of the acquirer are recorded by recognising the equity investment at cost.
De-recognition of financial assetsDe-recognition is the removal of a previously recognised financial asset or financial liability from an entity’s balance sheet.
Before evaluating whether, and to what extent, de-recognition is appropriate, under IAS 39 an entity should determine whether the relevant conditions apply to a financial asset in its entirety or to a part of a financial asset. The standard is applied to a part of financial assets being transferred if, and only if, the part being considered for de-recognition meets one of the following conditions:• the part comprises only specifically identified cash flows from a financial asset (or a group of assets), e.g. interest cash flows from an asset;• the part comprises a clearly identified percentage of the cash flows from a financial asset, e.g., a 90 per cent share of all cash flows from an
asset;• the part comprises only a fully proportionate (pro rata) share of specifically identified cash flow, e.g. 90 per cent share of interest cash flows from
an asset.
In all other cases, the standard is applied to the financial asset in its entirety (or to the group of similar financial assets in their entirety).
An entity shall de-recognise a financial asset when the contractual rights to the cash flows from the financial asset expire or it transfers the contractual rights to receive the cash flows of the financial asset to an external counterparty.Rights to cash flow are considered to be transferred even if contractual rights to receive the asset’s cash flow are retained but there is an obligation to pay this cash flow to one or more entities and all the following conditions are fulfilled (pass-through agreement):• there is no obligation to pay any uncollected amounts associated with the original asset;• sale or pledge of the original asset is not allowed, unless it secures the obligation to pay cash flow;• there is an obligation to transfer forthwith all cash flows received and may not invest them, except for liquidity invested for the short period
between the date of receipt and that of payment, provided that the interest accrued in that period is paid on.
Recognition is also subject to verification of effective transfer of all the risks and rewards of ownership of the financial asset. If the entity transfers substantially all the risks and rewards of ownership of the financial asset, the entity shall de-recognise the asset (or group of assets) and recognise separately as assets or liabilities any rights and obligations created or retained in the transfer.
Conversely, if the entity substantially retains all the risks and rewards of ownership of the asset (or group of assets), the entity shall continue to recognise the transferred asset(s). In this case it is necessary to recognise a liability corresponding to the amount received under the transfer and subsequently recognise all income accruing on the asset or expense accruing on the liability.
The main transactions that do not allow, under the above rules, total de-recognition of a financial asset are securitisations, repurchase transactions (buy-ins) and stock lending.
In the case of securitisations the Bank does not de-recognise the financial asset on purchase of the equity tranche or provision of other forms of support of the structure which result in retention of the credit risk of the securitised portfolio.
In the case of repurchase transactions and stock lending, the assets transacted are not de-recognised since the terms of the transaction entail the retention of all their risks and rewards.
Lastly, it should be noted that securities lending transactions collateralised by other securities or not collateralised were recorded as off-balance sheet items.

91FinecoBank · Annual Report and Accounts as at 31 December 2012
Treasury sharesThe Bank does not hold any treasury shares.
ReposSecurities received in a transaction that entails a contractual obligation to sell them at a later date or delivered under a contractual obligation to repurchase are neither recognised nor de-recognised. In respect of securities purchased under an agreement to resell, the consideration is recognised as a loan to customers or banks. In respect of securities held in a repurchase agreement, the liability is recognised as due to banks or customers. Revenue from these loans, being the coupons accrued on the securities and the difference between the sale/purchase and resale/repurchase prices, is recognised in profit or loss through interest income and expenses on an accruals basis.
These transactions can only be offset if, and only if, they are carried out with the same counterparty and provided that such offset is provided for in the underlying contracts.
The same rules apply to securities lending transactions with the exception transactions collateralised by other securities or not collateralised. Counterparty risk related to such transactions is shown under item “E. Other” of the tables of Part E - Section 1 - Credit risk - A.2. External ratings.
Italian Staff Severance Pay (Trattamento di fine rapporto - “TFR”)The “TFR” provision for Italy-based employee benefits is to be construed as a “post-retirement defined benefit”. It is therefore recognised on the basis of an actuarial estimate of the amount of benefit accrued by employees discounted to present value. This benefit is calculated by an external actuary using the unit credit projection method (see Section 12 under Retirement Payments and Similar Obligations). This method distributes the cost of benefits uniformly over the employee’s working life. The liability is determined as the present value of average future payments adjusted according to the ratio of years of service to total years of service at the time of payment of the benefit.
Following pension reform by Legislative Decree no. 252 of 5 December 2005, TFR instalments accrued to 12.31.2006 (or to the date between 01.01.2007 and 30.06.2007 on which the employee opted to devolve their TFR to a supplementary pension fund) stay in the employer and are considered a post-employment defined benefit plan therefore incurring actuarial valuation, though with simplified actuarial assumptions, i.e., forecast future pay rises are not considered.
TFR instalments accrued since 1 January 2007 (date of effectiveness of Law 252) (or since the date between 1 January 2007 and 30 June 2007) are, at the employee’s discretion, either paid into a pension fund or left in the company and (where the company has in excess of 50 employees) paid into an INPS Treasury fund by the employer, and are considered a defined-contribution plan.
Costs relating to TFR accrued during the year are taken to Income Statement item 150.a) “Administrative costs: payroll costs” and include the interest accrued in the year (interest cost) on the obligation already in place at the date of the reform. The amounts accrued in the year and paid to the supplementary pension plans or the INPS Treasury Fund are recognised under “Employee Severance Pay Provision”.
Actuarial gains (losses), i.e., the difference between the liabilities’ carrying value and the present value of the obligation at the end of the period are recognised according to the “corridor” method, i.e., only when they exceed 10% of the present value of the obligation at the period-end. Any surplus is taken to the Income Statement and amortised over the residual working life of the employees who are members of the plan, as from the following financial year.
Share-Based PaymentEquity-settled payments made to employees in consideration of services rendered, using equity instruments of the Parent Company comprise:• Stock options• Performance shares (i.e. awarded on attainment of certain objectives)• Restricted shares (i.e. subject to a lock-up period).
Considering the difficulty of reliably measuring the fair value of the services acquired against equity-settled payments, reference is made to the fair value of the instruments themselves, measured at the date of the allocation.The fair value of a cash-settled share-based payment, the services acquired and the liability incurred are measured at the fair value of the liability, recognised in item 100 “Other liabilities”. The fair value of the liability, as long as it remains unsettled, is remeasured at each balance sheet date and all changes in fair value are recognised in profit and loss item 150 “Administrative costs”.
Other Long-term Employee BenefitsLong-term employee benefits - e.g. long-service bonuses, paid on reaching a predefined number of years’ service - are recognised in item 100 “Other liabilities” on the basis of the measurement at the Balance Sheet Date of the liability, also in this case determined by an external actuary using the unit credit projection method (see Section 12 - Provisions for risks and charges - retirement payments and similar obligations). Gains (losses) on this type of benefit are recognised at once through profit or loss, without using the “corridor” method.
92
Part A - Accounting Policies (Continued)
Notes to the Accounts
Annual Report and Accounts as at 31 December 2012 · FinecoBank
Credit derivatives treated as financial guarantees givenCredit derivatives are treated as financial guarantees given, in accordance with IAS 39, when they require the issuer to make specified payments to the holder to indemnify the latter for actual losses borne due to the default of a specific debtor on payment at a maturity set by a debt instrument.
The value of initial recognition is equal to their fair value, which is usually the amount received when the guarantee is issued, and is booked under item 100 “Other liabilities”.
The effects of valuation, related to any impairment of the underlying, are recognised in the same balance-sheet item contra item 130.d “Write-downs and write-backs due to impairment of other financial transactions” in the Income Statement.
RECOGNITION OF INCOME AND EXPENSES
Interest Income and ExpenseInterest income and expense and similar income and expense items relate to monetary items - i.e., liquidity and debt , financial instruments held for trading, measured at fair value through profit or loss or available for sale-, HtM financial assets, loans and receivables, deposits, and debt securities in issue.
Interest income and expense are recognised through profit or loss with respect to all instruments measured at amortised cost, using the effective interest method.
Interest also includes the net credit or debit balance of differentials and margins on financial derivatives:• hedging interest-bearing assets and liabilities;• HfT but linked for business purposes to assets and liabilities designated as measured at fair value (fair value option);• linked for business purposes to HfT assets and liabilities paying differentials or margins on different maturities.
Fees and CommissionsFees and commissions are recognised according to the provision of the services from which they have arisen.Securities trading commissions are recognised at the time the service is rendered. Investment portfolio management fees, advisory fees and investment fund management fees are recognised on a pro-rata temporis basis.Fees included in amortised cost used to calculate effective interest rates are not included under fees and commissions, since they are part of the effective interest rate.
DividendsDividends are recognised in profit or loss in the financial year in which their distribution has been approved.
RELEVANT IFRS DEFINITIONSThe main definitions introduced by IFRS are described below, other than those dealt with in previous sections.
Amortised costThe amortised cost of a financial asset or financial liability is the amount at which the financial asset or financial liability is measured at initial recognition minus principal repayments, plus or minus the cumulative amortisation using the effective interest method of any difference between that initial amount and the maturity amount, and minus any reduction (directly or through the use of an allowance account) for impairment or uncollectibility.
The effective interest method is a method of allocating the interest income or interest expense over the life of a financial asset or liability. The effective interest rate is the rate that exactly discounts estimated future cash payments or receipts through the expected life of the financial instrument to the net carrying amount of the financial asset or financial liability. The calculation includes all fees and points paid or received between parties to the contract that are an integral part of the effective interest rate, transaction costs, and all other premiums or discounts.
Commissions forming an integral part of the effective interest rate include loan draw-down fees or underwriting fees relating to a financial asset not designated at fair value, e.g., fees received as compensation for the assessment of the issuer’s or borrower’s financial situation, for valuation and registration of security, and generally for the completion of the transaction (management fees).
Transaction costs include fees and commissions paid to agents (including employees acting as selling agents), advisers, brokers and dealers, levies by regulatory agencies and securities exchanges, and transfer taxes and duties. Transaction costs do not include debt premiums or discounts, financing costs or internal administrative or holding costs.

93FinecoBank · Annual Report and Accounts as at 31 December 2012
Impairment of financial assetsAt each balance sheet date an entity assesses whether there is any objective evidence that a financial asset or group of financial assets is impaired.
A financial asset or a group of financial assets is impaired and impairment losses are incurred if, and only if, there is objective evidence of impairment as a result of one or more events that occurred after the initial recognition of the asset (a “loss event”) and that loss event (or events) has an impact on the estimated future cash flows of the financial asset or group of financial assets that can be reliably estimated.It may not be possible to identify a single, discrete event that caused the impairment. Rather the combined effect of several events may have caused the impairment.
Losses expected as a result of future events, no matter how likely, are not recognised.
Objective evidence that a financial asset or group of assets is impaired includes observable data that comes to our attention about the following loss events:• significant financial difficulty of the issuer or obligor;• a breach of contract, such as a default or delinquency in interest or principal payments;• the lender, for economic or legal reasons relating to the borrower’s financial difficulty, granting a concession to the borrower which the lender
would not otherwise consider;• it becoming probable that the borrower will enter bankruptcy or other financial reorganisation;• the disappearance of an active market for that financial asset because of financial difficulties; however, the disappearance of an active market due
to the fact that a company’s financial instruments are no longer traded publicly is no evidence of impairment;• observable data indicating that there is a measurable decrease in the estimated future cash flows from a group of financial assets since the initial
recognition of those assets, although the decrease cannot yet be identified with the individual financial assets in the group, including: - adverse changes in the payment status of borrowers in the group; or - national or local economic conditions that correlate with defaults on the assets in the group.
Objective evidence of impairment for an investment in an equity instrument includes information about significant changes with an adverse effect that have taken place in the technological, market, economic or legal environment in which the issuer operates, and indicates that the cost of the investment may not be recovered. A significant or prolonged decline in the fair value of an investment in an equity instrument below its cost is also objective evidence of impairment (see also section 2).
If there is objective evidence that an impairment loss on loans and receivables or held-to-maturity investments carried at amortised cost has been incurred. the amount of the loss is measured as the difference between the asset’s carrying amount and the present value of estimated future cash flows (excluding future credit losses that have not been incurred) discounted at the financial asset’s original effective interest rate. The amount of the loss is recognised in profit and loss item 130 “Impairment losses” and the asset’s carrying value is reduced.If the terms of a loan, receivable or held-to-maturity investment are renegotiated or otherwise modified because of financial difficulties of the borrower or issuer, impairment is measured using the original effective interest rate before the modification of terms. Cash flows relating to short-term receivables are not discounted if the effect of discounting is immaterial. If a loan, receivable or held-to-maturity investment has a variable interest rate, the discount rate for measuring any impairment loss is the current effective interest rate determined under the contract.
The calculation of the present value of the estimated future cash flows of a collateralised financial asset reflects the cash flows that may result from foreclosure less costs for obtaining and selling the collateral, whether or not foreclosure is probable.
A reduction in the fair value of a financial asset below its cost or amortised cost is not necessarily an indication of impairment (e.g. reduction in the fair value of an investment in a debt instrument resulting from an increase in the risk-free interest rate).
Objective evidence of impairment is initially assessed individually; however, if it is determined that there is no objective evidence of individual impairment, the asset is included in a group of financial assets with similar credit risk characteristics and assessed collectively.
Formula-based approaches and statistical methods may be used to assess impairment losses on a group of financial assets. Models used incorporate the time value of money, and consider cash flows over the entire residual life of the asset (not just the following year) and do not give rise to an impairment loss on initial recognition of a financial asset. They take into account losses already sustained but not manifest in the group of financial assets at the time of measurement, on the basis of past experience of losses on assets having a similar credit risk to the group of assets being measured.
The process of estimating impairment losses considers all credit exposures, not only those of low credit quality, which reflect a serious impairment.

94
Part A - Accounting Policies (Continued)
Notes to the Accounts
Annual Report and Accounts as at 31 December 2012 · FinecoBank
Reversals of impairment lossesIf, in a subsequent period, the amount of an impairment loss decreases and the decrease can be related objectively to an event occurring after the impairment loss was recognised ( such as an improvement in the debtor’s credit worthiness), the previously recognised impairment loss is reversed and the amount of the reversal is recognised in profit and loss item 130 “Impairment losses” except in the case of AfS equity instruments (see Section 2 above).The reversal shall not result - at the date the impairment is reversed - in a carrying amount of the financial asset that exceeds what the amortised cost would have been had the impairment not been recognised.
A.3 Information on fair valueThis section presents a disclosure of reclassified financial instruments according to IAS 39 and information on fair value hierarchy as required by IFRS 7.
Fair value is the amount for which an asset could be exchanged, or a liability settled, between knowledgeable, willing parties in an arm’s length transaction.
The fair value of a financial liability with a demand feature (e.g. a demand deposit) is not less than the amount payable on demand, discounted from the first date that the amount could be required to be paid.
For financial instruments listed in active markets, fair value is determined on the basis of official prices in the most advantageous market to which the FinecoBank has access (Mark to Market).
A financial instrument is regarded as quoted in an active market if quoted prices are readily and regularly available from a pricing service, dealer, broker, agency that determines prices or regulatory agency, and those prices represent actual and regularly occurring market transactions on an arm’s length basis. If a published price quotation in an active market does not exist for a financial instrument in its entirety, but active markets exist for its component parts, fair value is determined on the basis of the relevant market prices for the component parts.
If market quotations are not available, the Group uses valuation models (Mark to Model) in keeping with the methods generally accepted and used by the market. Valuation models include techniques based on the discounting of future cash flows and on volatility estimates, and they are subject to revision both during their development and periodically in order to ensure their continued consistency with the objectives of the valuation.
These methods use inputs based on prices set in recent transactions for the instrument being valued and/or prices/quotations for instruments having similar characteristics in terms of risk profile.Indeed, these prices/quotations are relevant for determining significant parameters in terms of the credit risk, liquidity risk and price risk of the instrument being valued.
Reference to these “market” parameters makes it possible to limit the discretionary nature of the valuation, and ensures that the resulting fair value can be verified.
If, for one or more risk factors it is not possible to refer to market data, the valuation models employed use estimates based on historical data as inputs.
A.3.1 Transfers between PortfoliosThe amendments to IAS 39 and to IFRS 7 “Reclassification of financial assets” approved by the IASB in 2008 make it possible to reclassify certain financial assets, after their initial recognition, out of the HfT and AfS portfolios.In particular, the following may be reclassified:• those HfT or AfS financial assets that would have satisfied the definition specified by the international accounting standards for the loan
portfolio (if such assets were not classified as HfT or AfS respectively on initial recognition) if the entity intends, and is able, to hold them for the foreseeable future or until maturity;
• “only in rare circumstances” those HfT financial assets which, at the time of their recording, did not satisfy the definition of loans.
FinecoBank has not reclassified any financial assets from the “held or trading” or the “available-for-sale” portfolios to the loan portfolio.

95FinecoBank · Annual Report and Accounts as at 31 December 2012
A.3.1.1 Reclassified financial assets: book value, fair value and effects on comprehensive incomeNo data to report.
A.3.1.2 Reclassified financial assets: Impact on comprehensive income before transferNo data to report.
A.3.1.3 Transfer of financial assets held for tradingNo data to report.
A.3.1.4 Effective interest rate and cash flows expected from reclassified assetsNo data to report.
A.3.2 Fair Value HierarchyIFRS 7 calls for classifying instruments being measured at fair value as a function of the ability to observe the inputs used for pricing.Three levels have been established:• Level 1: the fair value of instruments classified in this level is determined based on quotation prices observed in active markets;• Level 2: the fair value of instruments classified in this level is determined based on valuation models that use inputs that can be observed in the
market;• Level 3: the fair value of instruments classified in this level is determined based on valuation models that primarily use inputs that cannot be
observed in the market.
The following tables show a breakdown of financial assets and liabilities designated at fair value according to the above-mentioned levels, as well as the annual changes of Level 3 assets or liabilities.
(Amounts in € thousand)
ASSETS/LIABILITIES MEASURED AT FAIR VALUE THROUGH PROFIT AND LOSS
TOTAL 12.31.2012 TOTAL 12.31.2011
L1 L2 L3 L1 L2 L3
1. Financial assets held for trading 5.043 2.532 14 8.693 2.713 7
2. Financial assets at fair value through profit or loss 10.516 - - 10.409 - -
3. Available-for-sale financial assets 58.909 - 5 47.370 - 5
4. Hedging derivatives - 190.573 - - 329.933 -
Total 74.468 193.105 19 66.472 332.646 121. Financial liabilities held for trading 4.529 2.648 - 1.342 2.288 -
2. Financial liabilities at fair value through profit and loss - - - - - -
3. Hedging derivatives - 213.885 - - 370.770 -
Total 4.529 216.533 - 1.342 373.058 -
Key:L1 = Level 1L2 = Level 2L3 = Level 3

96
Part A - Accounting Policies (Continued)
Notes to the Accounts
Annual Report and Accounts as at 31 December 2012 · FinecoBank
A.3.2.2 Annual changes in financial assets at fair value (level 3) (Amounts in € thousand)
FINANCIAL ASSETS
HELD FOR TRADING
AT FAIR VALUE THROUGH P&L
AVAILABLE FOR SALE
HEDGING DERIVATIVES
1. Opening balances 7 - 5 -2. Increases 2.1 Purchases 1.682 - - -
2.2 Profits recognised in:
2.2.1 Income Statement 7 - - -
- of which unrealised gains 7 - - -
2.2.2 Equity - -
2.3 Transfers from other levels 18 - - -
2.4 Other increases 13 - - -
3. Decreases 3.1 Sales (1.710) - - -
3.2 Redemptions - - - -
3.3 Losses recognised in:
3.3.1 Income Statement (3) - - -
- of which unrealised losses (3) - - -
3.3.2 Equity - -
3.4 Transfers to other levels - - - -
3.5 Other decreases - - - -
4. Closing balances 14 - 5 -
A.3.2.3 Annual changes in financial liabilities at fair value (level 3)No data to report.
A.3.3 Day One Profit/LossThe value at which financial instruments are recognised is equal to their fair value on the same date.
The fair value of financial instruments, other than those designated at fair value through profit or loss, at their recognition date is usually assumed to be equal to the amount collected or paid. For financial instruments held for trading (see sections 1 and 14 of Part A.2 above) and instruments designated at fair value (see sections 5 and 15 of Part A.2 above), any difference from the amount collected or paid is posted under the appropriate items of the Income Statement.

97FinecoBank · Annual Report and Accounts as at 31 December 2012


99FinecoBank · Annual Report and Accounts as at 31 December 2012
Assets 100Section 1 - Cash and cash balances - Item 10 100Section 2 - Financial assets held for trading - Item 20 100Section 3 - Financial assets at fair value through profit or loss - Item 30 102Section 4 - Available-for-sale financial assets - Item 40 103Section 5 - Held-to-maturity investments - Item 50 105Section 6 - Loans and receivables with banks - Item 60 105Section 7 - Loans and receivables with customers - Item 70 106Section 8 - Hedging derivatives - Item 80 107Section 9 - Changes in fair value of portfolio hedged items - Item 90 108Section 10 - Investments in associates and joint ventures - Item 100 108Section 11 - Property, plant and equipment - Item 110 109Section 12 - Intangible assets - Item 120 112Section 13 - Tax Assets and Tax Liabilities - Asset item 130 and liability item 80 115Section 14 - Non-current assets and disposal groups classified as held for sale and associated liabilities - Assets item 140 and liabilities item 90 119Section 15 - Other assets - Item 150 120
Liabilities 121Section 1 - Deposits from banks - Item 10 121Section 2 - Deposits from customers - Item 20 121Section 3 - Debt securities in issue - Item 30 122Section 4 - Financial liabilities held for trading - Item 40 122Section 5 - Financial liabilities at fair value through profit and loss - Item 50 123Section 6 - Hedging derivatives - Item 60 123Section 7 - Changes in fair value of portfolio hedged items - Item 70 124Section 8 - Tax liabilities - Item 80 124Section 9 - Liabilities included in disposal groups classified as held for sale - Item 90 124Section 10 - Other liabilities - Item 100 125Section 11 - Allocation to employee severance pay provision - Item 110 125Section 12 - Provisions for risks and charges - Item 120 126Section 13 - Redeemable shares - Item 140 127Section 14 - Bank’s shareholders’ equity - Items 130, 150, 160, 170, 180, 190 and 200 128Section 15 - Other information 130
Part B - Balance Sheet

100
Notes to the Accounts
Annual Report and Accounts as at 31 December 2012 · FinecoBank
Part B - Balance Sheet(Amounts in € thousand)
AssetsSection 1 - Cash and cash balances - Item 10
1.1 Cash and cash balances: breakdown
TOTAL 12.31.2012 TOTAL 12.31.2011
(a) Cash 7 4
(b) Demand deposits with Central Banks - -
Total 7 4
Section 2 - Financial assets held for trading - Item 20
2.1 Financial assets held for trading: breakdown by category
ITEM/AMOUNT
TOTAL 12.31.2012 TOTAL 12.31.2011
LEVEL 1 LEVEL 2 LEVEL 3 LEVEL 1 LEVEL 2 LEVEL 3
A. On-balance sheet assets1. Debt securities
1.1 Structured securities 6 117 - 4 127 -
1.2 Other debt securities 93 71 1 161 20 -
2. Equity instruments 354 - 13 143 - 7
3. Units in investment funds. 1 - - 6,970 - -
4. Loans
4.1 Reverse repos - - - - - -
4.2 Other - - - - - -
Total A 454 188 14 7,278 147 7B. Derivative instruments1. Financial derivatives
1.1 trading derivatives 4,589 2,344 - 1,415 2,566 -
1.2 related to the fair value option - - - - - -
1.3 other - - - - - -
2. Credit derivatives
2.1 trading derivatives - - - - - -
2.2 related to the fair value option - - - - - -
2.3 other - - - - - -
Total B 4,589 2,344 - 1,415 2,566 -Total (A+B) 5,043 2,532 14 8,693 2,713 7
Trading financial derivatives relate to the positive valuation of commitments for currencies and securities to be received and delivered, which correspond to negative valuations booked under item 40 Financial liabilities held for trading.

101FinecoBank · Annual Report and Accounts as at 31 December 2012
2.2 Financial assets held for trading: breakdown by debtors/issuers
ITEM/AMOUNT TOTAL 12.31.2012 TOTAL 12.31.2011
A. ON-BALANCE SHEET ASSETS1. Debt securities a) Governments and Central Banks 67 99
b) Other public entities - -
c) Banks 197 132
d) Other issuers 24 81
2. Equity instruments a) Banks 153 72
b) Other issuers:
- insurance companies - -
- financial companies 1 -
- non-financial companies 213 78
- other - -
3. Units in investment funds 1 6,9704. Loans a) Governments and Central Banks - -
b) Other public entities - -
c) Banks - -
d) Other entities - -
Total A 656 7,432B. DERIVATIVE INSTRUMENTS a) Banks
- fair value 1,152 955
b) Customers
- fair value 5,781 3,026
Total B 6,933 3,981Total (A+B) 7,589 11,413
2.3 On-balance sheet financial assets held for trading: annual changesAs at 12.31.2012
DEBT SECURITIES
EQUITY INSTRUMENTS
UNITS IN INVESTMENT FUNDS LOANS TOTAL
A. Opening balance 312 150 6,970 - 7,432B. Increases B1. Purchases 280,860 30,681,057 7,300 - 30,969,217
B2. Positive changes in fair value 5 8 - - 13
B3. Other changes 312 10,051 634 - 10,997
C. Decreases C1. Sales (280,410) (30,690,664) (14,887) - (30,985,961)
C2. Redemptions (675) - - - (675)
C3. Negative changes in fair value (3) (9) - - (12)
C4. Transfers to other portfolios - - - - -
C5. Other changes (113) (226) (16) - (355)
D. Closing balance 288 367 1 - 656
Other increases and decreases include the variation in interest accrued relating to Financial assets held for trading, the gains or losses made, and any technical overdrafts relating to the end and beginning of the period.

102
Part B - Balance Sheet - Assets (Continued)
Notes to the Accounts
Annual Report and Accounts as at 31 December 2012 · FinecoBank
As at 12.31.2011
DEBT SECURITIES
EQUITY INSTRUMENTS
UNITS IN INVESTMENT FUNDS LOANS TOTAL
A. Opening balance 15,402 55 6 - 15,463B. Increases B.1 Purchases 222,904 30,349,564 15,070 - 30,587,538
B.2 Positive changes in fair value 3 72 18 - 93
B.3 Other changes 423 10,820 8 - 11,251
C. Decreases C.1 Sales (222,381) (30,359,984) (8,104) - (30,590,469)
C.2 Redemptions (3,862) - - - (3,862)
C.3 Negative changes in fair value (11) (17) (24) - (52)
C.4 Transfers to other portfolios - - - - -
C.5 Other changes (12,166) (360) (4) - (12,530)
D. Closing balance 312 150 6,970 - 7,432
In 2011, bonds belonging to the Fair value through profit or loss (FVTPL) category were reclassified from the Financial assets held for trading portfolio to the Financial assets at fair value through profit or loss portfolio, following a change in the Bank’s short-term strategy; the reclassified amount, corresponding to €11,912 thousand, is indicated under item C5.
Section 3 - Financial assets at fair value through profit or loss - Item 30
3.1. Financial assets at fair value through profit or loss: breakdown by category
ITEM/AMOUNT
TOTAL 12.31.2012 TOTAL 12.31.2011
LEVEL 1 LEVEL 2 LEVEL 3 LEVEL 1 LEVEL 2 LEVEL 3
A. On-balance sheet assets1. Debt securities
1.1 Structured securities 8,244 - - 7,250 - -
1.2 Other debt securities 2,272 - - 3,159 - -
2. Equity instruments - - - - - -
3. Units in investment funds. - - - - - -
4. Loans
4.1 Structured - - - - - -
4.2 Other - - - - - -
Total 10,516 - - 10,409 - -Cost 10,903 - - 12,619 - -
3.2. Financial assets at fair value through profit or loss: breakdown by debtors/issuers
ITEM/AMOUNT TOTAL 12.31.2012 TOTAL 12.31.2011
1. Debt securities a) Governments and Central Banks - -
b) Other public entities - -
c) Banks 10,516 10,409
d) Other issuers - -
2. Equity instruments a) Banks - -
b) Other issuers:
- insurance companies - -
- financial companies - -
- non-financial companies - -
- other - -
3. Units in investment funds - -4. Loans a) Governments and Central Banks - -
b) Other public entities - -
c) Banks - -
d) Other entities - -
Total 10,516 10,409

103FinecoBank · Annual Report and Accounts as at 31 December 2012
3.3 Financial assets at fair value through profit or loss: annual changesAs at 12.31.2012
DEBT SECURITIESEQUITY
INSTRUMENTS
UNITS IN INVESTMENT
FUNDS LOANS TOTAL
A. Opening balance 10,409 - - - 10,409B. Increases B.1 Purchases - - - - -
B.2 Positive changes in fair value 1,725 - - - 1,725
B.3 Other changes 80 - - - 80
C. Decreases C.1 Sales (1,667) - - - (1,667)
C.2 Redemptions - - - - -
C.3 Negative changes in fair value - - - - -
C.4 Other changes (31) - - - (31)
D. Closing balance 10,516 - - - 10,516
Other increases and decreases include the variation in interest accrued relating to Financial assets held for trading and the realised trading income.
As at 12.31.2011
DEBT SECURITIESEQUITY
INSTRUMENTS
UNITS IN INVESTMENT
FUNDS LOANS TOTAL
A. Opening balance - - - - -B. Increases B.1 Purchases - - - - -
B.2 Positive changes in fair value 6 - - - 6
B.3 Other changes 11,962 - - - 11,962
C. Decreases C.1 Sales - - - - -
C.2 Redemptions - - - - -
C.3 Negative changes in fair value (1,559) - - - (1,559)
C.4 Other changes - - - - -
D. Closing balance 10,409 - - - 10,409
In 2011, bonds belonging to the Fair value through profit or loss (FVTPL) category were reclassified from the Financial assets held for trading portfolio to the Financial assets at fair value through profit or loss portfolio, following a change in the Bank’s short-term strategy; the reclassified amount, corresponding to €11,912 thousand, is indicated under item B3. Other increases.
Section 4 - Available-for-sale financial assets - Item 40
4.1 Available-for-sale financial assets: breakdown by category
ITEM/AMOUNT
TOTAL 12.31.2012 TOTAL 12.31.2011
LEVEL 1 LEVEL 2 LEVEL 3 LEVEL 1 LEVEL 2 LEVEL 3
1. Debt securities
1.1 Structured securities - - - - - -
1.2 Other debt securities 58,909 - - 47,370 - -
2. Equity instruments
2.1 Carried at fair value - - - - - -
2.2 Carried at cost - - 5 - - 5
3. Units in investment funds. - - - - - -
4. Loans - - - - - -
Total 58,909 - 5 47,370 - 5
As at 31 December 2012, Available-for-sale financial assets consisted of investments in companies where the Bank does not exercise either control or significant influence, and amounted to €5 thousand, in addition to the debt securities issued by the Italian Central Government amounting to €48,736 thousand and debt securities issued by the German Central Government amounting to €10,173 thousand.

104
Part B - Balance Sheet - Assets (Continued)
Notes to the Accounts
Annual Report and Accounts as at 31 December 2012 · FinecoBank
The debt securities classified in the Available-for-sale financial assets portfolio are entirely used as collateral for bankers’ drafts or guarantees with third parties.
4.2 Available-for-sale financial assets: breakdown by debtors/issuers
ITEM/AMOUNT TOTAL 12.31.2012 TOTAL 12.31.2011
1. Debt securities a) Governments and Central Banks 58,909 47,370
b) Other public entities - -
c) Banks - -
d) Other issuers - -
2. Equity instruments a) Banks - -
b) Other issuers:
- insurance companies - -
- financial companies - -
- non-financial companies 5 5
- other - -
3. Units in investment funds - -4. Loans a) Governments and Central Banks - -
b) Other public entities - -
c) Banks - -
d) Other entities - -
Total 58,914 47,375
4.3 Available-for-sale financial assets subject to micro-hedgingNo data to report.
4.4 Available-for-sale financial assets: annual changesAs at 12.31.2012
DEBT SECURITIESEQUITY
INSTRUMENTS
UNITS IN INVESTMENT
FUNDS LOANS TOTAL
A. Opening balance 47.370 5 - - 47.375B. Increases B.1 Purchases 24.768 - - - 24.768
B.2 Increases in FV 1.574 - - - 1.574
B.3 Write-backs
- through profit or loss - - - - -
- in equity - - - - -
B.4 Transfers from other portfolios - - - - -
B.5 Other changes 594 - - - 594
C. Decreases C.1 Sales - - - - -
C.2 Redemptions (15.000) - - - (15.000)
C.3 Decreases in FV (185) - - - (185)
C.4 Impairment
- through profit or loss - - - - -
- in equity - - - - -
C.5 Transfers to other portfolios - - - - -
C.6 Other changes (212) - - - (212)
D. Closing balance 58.909 5 - - 58.914
Other increases and decreases of Debt securities include the variation in interest accrued and amortised cost relating to Available-for-sale financial assets.

105FinecoBank · Annual Report and Accounts as at 31 December 2012
As at 12.31.2011
DEBT SECURITIESEQUITY
INSTRUMENTS
UNITS IN INVESTMENT
FUNDS LOANS TOTAL
A. Opening balance 47,370 5 - - 47,375B. Increases B1. Purchases 24,768 - - - 24,768
B2. Increases in FV 1,574 - - - 1,574
B3. Write-backs
- through profit or loss - - - - -
- in equity - - - - -
B4. Transfers from other portfolios - - - - -
B5. Other changes 594 - - - 594
C. Decreases C1. Sales - - - - -
C2. Redemptions (15,000) - - - (15,000)
C3. Decreases in FV (185) - - - (185)
C4. Impairment
- through profit or loss - - - - -
- in equity - - - - -
C5. Transfers to other portfolios - - - - -
C6. Other changes (212) - - - (212)
D. Closing balance 58,909 5 - - 58,914
The Other Increases in Equity Instruments refer to the profit made on the sale of shares held in Monte Titoli S.p.A..
Section 5 - Held-to-maturity investments - Item 50FinecoBank did not recognise any financial assets under “Held-to-maturity investments”.
Section 6 - Loans and receivables with banks - Item 60
6.1 Loans and receivables with banks: breakdown by category
TYPE OF TRANSACTION/AMOUNT TOTAL 12.31.2012 TOTAL 12.31.2011
A. Loans and receivables with Central Banks - - 1. Time deposits - -
2. Compulsory reserves - -
3. Reverse repos - -
4. Other - -
B. Loans and receivables with banks 17,271,573 16,282,014 1. Current accounts and demand deposits 8,473,441 7,546,448
2. Time deposits 4,385,279 2,703,021
3. Other loans:
3.1 Reverse repos 182,274 1,165
3.2 Finance leases - -
3.3 Other 4,672 3,936
4. Debt securities
4.1 Structured securities 1,575,814 1,577,308
4.2 Other debt securities 2,650,093 4,450,136
Total (book value) 17,271,573 16,282,014Total (fair value) 17,172,204 15,113,609
Loans and receivables with banks in the form of current accounts and demand deposits mainly consist of loan accounts held with UniCredit S.p.A., with a book value of €8,311,279 thousand and to a lesser extent, of current accounts held with non-Group Banks for transactions in securities.The time deposits recognised under assets consist of the deposit held with UniCredit S.p.A. for compulsory reserves, with a book value of €113,835 thousand, in addition to time deposits held with UniCredit S.p.A. of €4,271,444 thousand, opened to use the funds collected through repos and Cash Park transactions with retail customers and repos with credit institutions in the same timeframe.

106
Part B - Balance Sheet - Assets (Continued)
Notes to the Accounts
Annual Report and Accounts as at 31 December 2012 · FinecoBank
The securities held in the portfolio mainly consist of debt securities issued by the Parent Company, and amount to €4,225,804 thousand. They were subscribed in order to invest liquidity and to be used for repos with retail customers.
In September debt securities held by Fineco and issued by UniCredit S.p.A. were sold to UniCredit S.p.A. for a book value of €1,500,000 thousand; at the same time securities issued by FinecoBank and subscribed by UniCredit S.p.A. were repurchased for the same amount. The transaction also resulted in the closure of the related hedging derivatives and the recognition in the income statement of changes in fair value of portfolio hedged items.
6.2 Loans and receivables with banks: assets subject to micro-hedgingNo data to report.
6.3 Finance leasesNo data to report.
Section 7 - Loans and receivables with customers - Item 70
7.1 Loans and receivables with customers: breakdown by category
TYPE OF TRANSACTION/AMOUNT
TOTAL 12.31.2012 TOTAL 12.31.2011
PERFORMING
PURCHASEDIMPAIRED
OTHER PERFORMING
PURCHASEDIMPAIRED
OTHER
1. Current accounts 66,117 - 2,567 63,728 - 2,109
2. Reverse repos 100,686 - 97 89,915 - 5
3. Mortgages - - 65 - - 57
4. Credit cards, personal loans, and wage assignment loans 300,097 - 1,669 295,589 - 1,164
5. Finance leases - - - - - -
6. Factoring - - - - - -
7. Other loans 82,285 - 22 71,961 - 18
8. Debt securities:
8.1 Structured securities - - - - - -
8.2 Other debt securities 1 - - 1 - -
Total (book value) 549,186 - 4,420 521,194 3,353Total (fair value) 569,310 - 4,420 539,086 3,353
7.2 Loans and receivables with customers: breakdown by debtors/issuers
TYPE OF TRANSACTION/AMOUNT
TOTAL 12.31.2012 TOTAL 12.31.2011
PERFORMING
PURCHASEDIMPAIRED
OTHER PERFORMING
PURCHASEDIMPAIRED
OTHER
1. Debt securities a) Governments - - - - - -
b) Other public entities 1 - - 1 - -
c) Other issuers:
- non-financial companies - - - - - -
- financial companies - - - - - -
- insurance companies - - - - - -
- other - - - - - -
2. Loans to: a) Governments - - - - - -
b) Other public entities - - - - - -
c) Other entities:
- non-financial companies 7,582 - 21 6,589 - 18
- financial companies 75,335 - 18 65,437 - 17
- insurance companies 5,074 - - 4,653 - -
- other 461,194 - 4,381 444,514 - 3,318
Total 549,186 - 4,420 521,194 - 3,353

107FinecoBank · Annual Report and Accounts as at 31 December 2012
7.3 Loans and receivables with customers: assets subject to micro-hedgingNo data to report.
7.4 Finance leasesNo data to report.
Section 8 - Hedging derivatives - Item 80
8.1 Hedging derivatives: breakdown by type of hedge and by hierarchical level (Amounts in € thousand)
ITEM/AMOUNT
FV 12.31.2012 NV12.31.2012
FV 12.31.2011 NV12.31.2011L1 L2 L3 L1 L2 L3
A. Financial derivatives
1) Fair value - 190,573 - 3,075,792 - 329,933 - 4,577,286
2) Cash flows - - - - - - - -
3) Net investment in foreign subsidiaries - - - - - - - -
B. Credit derivatives 1) Fair value - - - - - - - -
2) Cash flows - - - - - - - -
Total - 190,573 - 3,075,792 - 329,933 - 4,577,286
Key:NA = notional amountL1 = Level 1L2 = Level 2L3 = Level 3
8.2 Hedging derivatives: breakdown by portfolios hedged and by type of hedgeAs at 31 December 2012
TRANSACTION/TYPE OF HEDGE
FAIR VALUE CASH FLOWSNET
INVESTMENT IN FOREIGN
SUBSIDIARIES
MICRO
MACRO MICRO MACROINTEREST
RATE RISKCURRENCY
RISK CREDIT RISK PRICE RISKMULTIPLE
RISK
1. Available-for-sale financial assets - - - - - -
2. Loans and receivables - - - - -
3. Held-to-maturity investments - - - -
4. Portfolio 171,551 -
5. Other transactions - - - - - - -
Total assets - - - - - 171,551 - - -1. Financial liabilities - - - - -
2. Portfolio 19,022 -
Total liabilities - - - - - 19,022 - - -1. Expected transactions -
2. Financial assets and financial liabilities - - -

108
Part B - Balance Sheet - Assets (Continued)
Notes to the Accounts
Annual Report and Accounts as at 31 December 2012 · FinecoBank
As at 31 December 2011
TRANSACTION/TYPE OF HEDGE
FAIR VALUE CASH FLOWSNET
INVESTMENT IN FOREIGN
SUBSIDIARIES
MICRO
MACRO MICRO MACROINTEREST
RATE RISKCURRENCY
RISK CREDIT RISK PRICE RISKMULTIPLE
RISK
1. Available-for-sale financial assets - - - - - -
2. Loans and receivables - - - - -
3. Held-to-maturity investments - - - -
4. Portfolio 171.551 -
5. Other transactions - - - - - - -
Total assets - - - - - 171.551 - - -1. Financial liabilities - - - - -
2. Portfolio 19.022 -
Total liabilities - - - - - 19.022 - - -1. Expected transactions -
2. Financial assets and financial liabilities - - -
Section 9 - Changes in fair value of portfolio hedged items - Item 90
9.1 Adjustments to the value of hedged financial assets: breakdown of hedged portfolios
CHANGES IN THE VALUE OF HEDGED ASSETS/AMOUNT TOTAL 12.31.2012 TOTAL 12.31.2011
1. Positive changes1.1 of specific portfolios
a) loans and receivables 47,968 56,462
b) available-for-sale financial assets sales - -
1.2 overall - -
2. Negative changes2.1 of specific portfolios
a) loans and receivables (164,795) (308,105)
b) available-for-sale financial assets sales - -
2.2 overall - -
Total (116,827) (251,643)
9.2 Assets macro-hedged against interest rate risk
HEDGED ASSETS 12.31.2012 12.31.2011
1, Loans and receivables 4,331,093 6,139,297
2, Available-for-sale financial assets - -
3, Portfolio - -
Total 4,331,093 6,139,297
Receivables subject to macro-hedging against interest rate risk consist of fixed-rate personal loans and debt securities issued by UniCredit S.p.A. and classified as Loans and Receivables. The value stated corresponds to the residual contractual debt on the balance sheet date.
Section 10 - Investments in associates and joint ventures - Item 100No data to report.

109FinecoBank · Annual Report and Accounts as at 31 December 2012
Section 11 - Property, plant and equipment - Item 110
11.1 Property, plant and equipment: breakdown of assets carried at cost
ASSET/AMOUNT TOTAL 12.31.2012 TOTAL 12.31.2011
A. Assets used in the business 1.1 Owned assets a) land - -
b) buildings - -
c) office furniture and fittings 732 1,075
d) electronic systems 3,743 3,898
e) other 1,379 1,545
1.2 Assets under financial lease a) land - -
b) buildings - -
c) office furniture and fittings - -
d) electronic systems - -
e) other - -
Total A 5,854 6,518B. Assets held as investments 2.1 Owned assets a) land - -
b) buildings 2,846 2,844
2.2 Assets under financial lease a) land - -
b) buildings - -
Total B 2,846 2,844Total (A+B) 8,700 9,362
A description of the methods used to calculate depreciation is provided in Section 11 of the income statement.
11.2 Property, plant and equipment: breakdown of assets designed at fair value or revaluedNo data to report.

110
Part B - Balance Sheet - Assets (Continued)
Notes to the Accounts
Annual Report and Accounts as at 31 December 2012 · FinecoBank
11.3 Property, plant and equipment used in the business: annual changesAs at 31 December 2012
LAND BUILDINGSOFFICE FURNITURE
AND FITTINGSELECTRONIC
SYSTEMS OTHER TOTAL
A. Gross opening balance - - 11,629 23,360 9,034 44,023 A.1 Total net reduction in value - - (10,554) (19,462) (7,489) (37,505)
A.2 Net opening balance - - 1,075 3,898 1,545 6,518B. Increases: B.1 Purchases - - - - - -
B.2 Capitalised expenditure on improvements - - 470 1,345 309 2,124
B3. Write-backs - - - - - -
B.4 Increase in fair value: - - - - - -
a) in equity - - - - - -
b) through profit or loss - - - - - -
B.5 Positive Exchange differences - - - - - -
B.6 Transfers from properties held for investment - - - - - -
B.7 Other increases - - 3 66 5 74
C. Decreases: C.1 Sales - - - - - -
C.2 Depreciation - - (776) (1,562) (470) (2,808)
C.3 Impairment losses recognised
a) in equity - - - - - -
b) through profit or loss - - (38) (2) (5) (45)
C.4 Negative changes in fair value:
a) in equity - - - - - -
b) through profit or loss - - - - - -
C.5 Negative exchange differences - - - - - -
C.6 Transfers to:
a) property, plant and equipment held for investment - - - - - -
b) assets held for sale - - - - - -
C.7 Other decreases - - (2) (2) (5) (9)
D. Net closing balance - - 732 3,743 1,379 5,854 D.1 Total net reduction in value - - (10,965) (20,805) (7,835) (39,605)
D.2 Gross closing balance - - 11,697 24,548 9,214 45,459E. Carried at cost - - 732 3,743 1,379 5,854

111FinecoBank · Annual Report and Accounts as at 31 December 2012
As at 31 December 2011
LAND BUILDINGSOFFICE FURNITURE
AND FITTINGSELECTRONIC
SYSTEMS OTHER TOTAL
A. Gross opening balance - - 11,335 22,058 9,014 42,407 A.1 Total net reduction in value - - (9,910) (18,980) (7,343) (36,233)
A.2 Net opening balance - - 1,425 3,078 1,671 6,174B. Increases: B.1 Purchases - - - - - -
B.2 Capitalised expenditure on improvements - - 654 2,341 322 3,317
B3. Write-backs - - - - - -
B.4 Positive changes in fair value: - - - - - -
a) in equity - - - - - -
b) through profit or loss - - - - - -
B.5 Positive Exchange differences - - - - - -
B.6 Transfers from properties held for investment - - - - - -
B.7 Other increases - - 2 - 43 45
C. Decreases: C.1 Sales - - (2) - (2) (4)
C.2 Depreciation - - (974) (1,521) (472) (2,967)
C.3 Impairment losses -
a) in equity - - - - - -
b) through profit or loss - - (22) - (17) (39)
C.4 Negative changes in fair value:
a) in equity - - - - - -
b) through profit or loss - - - - - -
C.5 Negative exchange differences - - - - - -
C.6 Transfers to:
a) property, plant and equipment held for investment - - - - - -
b) assets held for sale - - - - - -
C.7 Other decreases - - (8) - - (8)
D. Net closing balance - - 1,075 3,898 1,545 6,518 D.1 Total net reduction in value - - (10,554) (19,462) (7,489) (37,505)
D.2 Gross closing balance - - 11,629 23,360 9,034 44,023E. Carried at cost - - 1,075 3,898 1,545 6,518

112
Part B - Balance Sheet - Assets (Continued)
Notes to the Accounts
Annual Report and Accounts as at 31 December 2012 · FinecoBank
11.4 Property, plant and equipment held for investment purposes: annual changes
TOTAL 12.31.2012 TOTAL 12.31.2011
LAND BUILDINGS LAND BUILDINGS
A. Opening balance - 2,844 - 2,952B. Increases: B.1 Purchases - - - -
B.2 Capitalised expenditure on improvements - - - -
B.3 Net increases in fair value - - - -
B.4 Write-backs - - - -
B.5 Positive exchange differences - - - -
B.6 Transfer from properties used in the business - - - -
B.7 Other increases - 145 - -
C. Decreases: C.1 Sales - - - -
C.2 Depreciation - (143) - (108)
C.3 Negative changes in fair value - - - -
C.4 Impairment losses - - - -
C.5 Negative exchange differences - - - -
C.6 Transfers to other asset portfolios
a) properties used in the business - - - -
b) non-current assets classified as held for sale - - - -
C.7 Other decreases - - - -
D. Closing balance - 2,846 - 2,844E. Fair value measurement - 4,810 - 4,650
11.5 Commitments to purchase property, plant and equipmentAs at 31 December 2012 the Bank had contractual commitments to purchase property, plant and equipment amounting to €211 thousand.
Section 12 - Intangible assets - Item 120
12.1 Intangible assets: breakdown
ASSET/AMOUNT
TOTAL 12.31.2012 TOTAL 12.31.2011
FINITE LIFE INDEFINITE LIFE FINITE LIFE INDEFINITE LIFE
A.1 Goodwill 89.602 89.602
A.2 Other Intangible assets 8.177 8.718
A.2.1 Assets carried at cost:
a) Intangible assets generated internally - - - -
b) Other assets 8.177 - 8.718 -
A.2.2 Assets valued at fair value:
a) Intangible assets generated internally - - - - b) Other assets - - - -
Total 8.177 89.602 8.718 89.602

113FinecoBank · Annual Report and Accounts as at 31 December 2012
12.2 Intangible assets: annual changesAs at 31 December 2012
GOODWILL
OTHER INTANGIBLE ASSETS: GENERATED INTERNALLY
OTHER INTANGIBLE ASSETS: OTHER
TOTALFIN INDEF FIN INDEF
A. Gross opening balance 124,729 - - 51,167 - 175,896 A.1 Total net reduction in value (35,127) - - (42,449) - (77,576)
A.2 Net opening balance 89,602 - - 8,718 - 98,320B. Increases B.1 Purchases - - - 4,778 - 4,778
B.2 Increases in internal intangible assets - - - - -
B3. Write-backs - - - - -
B.4 Positive changes in fair value:
- in equity - - - - -
- through profit or loss - - - - -
B.5 Positive exchange differences - - - - - -
B.6 Other increases - - - 140 - 140
C. Decreases C.1 Sales - - - - - -
C.2 Write-downs
- Amortisation - - (5,209) - (5,209)
- Write-downs
+ in equity - - - - -
+ through profit or loss - - - (41) - (41)
C.3 Negative changes in fair value
- in equity - - - - -
- through profit or loss - - - - -
C.4 Transfers to non-current assets classified as held for sale - - - - - -
C.5 Negative exchange differences - - - - - -
C.6 Other decreases - - - (209) - (209)
D. Net closing balance 89,602 - - 8,177 - 97,779 D.1 Total net impairment losses (35,127) - - (47,584) - (82,711)
E. Gross closing balance 124,729 - - 55,761 - 180,490F. Carried at cost 89,602 - - 8,177 - 97,779
KeyFIN: finite lifeIND: indefinite life

114
Part B - Balance Sheet - Assets (Continued)
Notes to the Accounts
Annual Report and Accounts as at 31 December 2012 · FinecoBank
As at 31 December 2011
GOODWILL
OTHER INTANGIBLE ASSETS: GENERATED INTERNALLY
OTHER INTANGIBLE ASSETS: OTHER
TOTALFIN INDEF FIN INDEF
A. Gross opening balance 124,729 - - 45,838 - 170,567 A.1 Total net reduction in value (35,127) - - (36,981) - (72,108)
A.2 Net opening balance 89,602 - - 8,857 - 98,459B. Increases B.1 Purchases - - - 5,363 - 5,363
B.2 Increases in internal intangible assets - - - - -
B3. Write-backs - - - - -
B.4 Positive changes in fair value:
- in equity - - - - -
- through profit or loss - - - - -
B.5 Positive exchange differences - - - - - -
B.6 Other increases - - - 141 - 141
C. Decreases C.1 Sales - - - - - -
C.2 Write-downs
- Amortisation - - (5,467) - (5,467)
- Write-downs
+ in equity - - - - -
+ through profit or loss - - - - - -
C.3 Negative changes in fair value
- in equity - - - - -
- through profit or loss - - - - -
C.4 Transfers to non-current assets classified as held for sale - - - - - -
C.5 Negative exchange differences - - - - - -
C.6 Other decreases - - - (176) - (176)
D. Net closing balance 89,602 - - 8,718 - 98,320 D.1 Total net impairment losses (35,127) - - (42,449) - (77,576)
E. Gross closing balance 124,729 - - 51,167 - 175,896F. Carried at cost 89,602 - - 8,718 - 98,320
12.3 Other informationThe useful life of software, considered for the calculation of amortisation, is 3 years, while the useful life of property, plant and equipment, for the calculation of depreciation, is 5 years. A description of the methods used to calculate amortisation and depreciation is provided in section 12 of the income statement.
As at 31 December 2012, the Bank had no contractual commitments to purchase intangible assets.
Other information - GoodwillAll goodwill relates to acquisitions of divisions or companies engaged in trading activities or the management of personal financial advisers. These activities have been fully integrated within FinecoBank’s ordinary operations, as a result it is no longer possible to isolate the contribution of each company/business division from the Bank’s overall income; this means that to establish the reasonableness of the value of goodwill recognised in the financial statements it is necessary to take account of the Bank’s overall income. The cash generating unit (CGU) is the Bank as a whole.The specific business model adopted by FinecoBank, which envisages a high level of integration between personal financial advisers and the trading and banking platform, does not recognise costs/revenues by allocating them to the business units; the personal financial advisers network is an integral part of the overall offer, which includes banking and trading services.Impairment testing is conducted by UniCredit S.p.A. through the calculation of the value in use of the cash generation unit (CGU) and includes both intangible assets with an indefinite useful life (goodwill) and intangible assets with a finite useful life (core deposits and customer relationships) where the loss indicators envisaged by the standard apply, on the basis that core deposits and customer relationships cannot independently tested for impairment because they do not generate cash flows separate to those of other assets.
To determine the value in use of intangible assets subject to impairment testing, IAS 36 requires that reference be made to cash flows for the assets under conditions that were current on the test date.

115FinecoBank · Annual Report and Accounts as at 31 December 2012
For the impairment testing, the value in use of the Cash Generating Units (CGUs) to which these intangible assets are assigned must be calculated taking into account the cash flows for all assets and liabilities included in the CGUs and not only those for which goodwill and/or the intangible asset were recorded when applying IFRS 3.
Under IAS 36, impairment testing of intangible assets with indefinite lives must be performed at least annually and, in any case, whenever there is objective evidence of the occurrence of events that may have reduced their value. Recoverable value is the greater of the value in use (present value of future cash flows generated by the asset being valued) and the associated fair value, net of sales costs.
The recoverable value of intangible assets subject to impairment testing must be determined for the individual assets, unless both the following conditions exist:• the value in use of the asset is not estimated to be close to the fair value net of selling costs;• the asset does not generate incoming cash flows that are largely independent to those generated by other assets.
Estimating cash flows to determine the value in use of the CGUsThe applicable accounting principles require that the impairment test be carried out by comparing the book value to the recoverable value. When the latter proves to be less than the book value, a write-down must be recorded in the financial statements. The recoverable value is the greater of its fair value (net of sales costs) and the related value in use.
The recoverable amount of the CGU is the greater of its fair value (net of costs to sell) and the related value in use.
The calculation of the value in use for the purposes of impairment testing is made using a discounted cash flow (DCF) model. The cash flows are determined by subtracting the annual capital requirement generated by the change in the risk-weighted assets from net profit. The capital requirement is calculated considering the level of capitalisation that the unit intends to reach in the long-term.
The Discounted Cash Flow model used is based on three stages:• first stage - from 2013 to 2017 - which uses the internal financial projections (2013 budget figures and forecasts produced internally by the Parent
Company based on an updated macro and banking scenario for the subsequent years);• interim period between 2018 and 2022, for which forecasts of cash flows are extrapolated starting from the last period of explicit forecast (2017)
using reducing growth rates up to those of the “terminal value”; • “terminal value”, based on the expected cash flow in 2022, which represents the CGU’s ability to generate further future cash flows. Based on the
adopted methodology, Terminal Value is calculated as a perpetual income estimated on the basis of a normalised, economically sustainable cash flow, consistent with a constant or decreasing long-term growth rate (“g”), as required by the IAS/IFRS accounting standards.
Discount rates of cash flowsThe value in use is determined by discounting the financial flows at a rate that takes into account present market rates and the specific risks of the asset.
In particular, the cost of capital for the Company is the sum of the following:• Risk-free rate: the average over the last six years of the five-year Bund. The six-year horizon was adopted in line with the average economic cycle in the
eurozone;• Debt risk premium: the average over the last six years of the Credit Default Swap paid by UniCredit;• Risk premium on own equity: calculated using the option-based model, based on the average volatility over the last six years of the share price of banks
operating primarily in the same sector.
The cost of capital as defined above, converges in a linear fashion to the cost of capital of the Terminal Value, over the 10 years envisaged in the model. Impairment test resultsFor the purpose of impairment testing, the book value was compared to the value in use calculated using the above-illustrated method. The result of the test conducted as at 31 December 2012 confirms the sustainability of goodwill.
Section 13 - Tax Assets and Tax Liabilities - Asset item 130 and liability item 80
General aspectsThe item “Tax assets” amounting to €47,999 thousand comprises:- “Deferred tax assets” of €43,548 thousand recognised as a balancing entry in the income statement;- “Deferred tax assets” of €1,382 thousand as the balancing entry of Shareholders’ equity, mainly associated with the loss resulting from the
assignment of non-performing receivables to Aspra Finance S.p.A., recorded in a negative reserve under shareholders’ equity;- “Current tax assets” of €3,069 thousand.

116
Part B - Balance Sheet - Assets (Continued)
Notes to the Accounts
Annual Report and Accounts as at 31 December 2012 · FinecoBank
The item “Tax liabilities” amounting to €66,588 thousand comprises:- “Current tax liabilities” of €47,269 thousand; - “Deferred tax liabilities” of €19,172 thousand recognised as a balancing entry in the income statement;- “Deferred tax liabilities” of €148 thousand recognised as a balancing entry of shareholders’ equity.
The calculation of the aforementioned asset and liability items was affected by the impact of the adoption of “national tax consolidation” and the application of IAS/IFRS.
National tax consolidationFor the three-year period 2010-2012, FinecoBank, in its capacity as consolidated company, was subject to “national tax consolidation”, as established by Legislative Decree no. 344 of 12 December 2003, which was carried out by the Parent Company, UniCredit S.p.A..
Prepaid/deferred tax assets/liabilitiesIn accordance with the law and regulations currently in force:- the valuation of deferred tax assets for IRES income tax purposes takes into account the expected income figures for future years, according to the
decisions made by the competent company bodies;- the valuation of deferred tax assets for IRAP corporate tax purposes takes place on the basis of the Company’s expected income figures for future
years, and takes into account changes in the legal context;- deferred tax liabilities are recognised whenever the relevant requirements are satisfied.
Deferred tax assets and liabilities were determined assuming an IRES income tax rate of 27.5% and an IRAP corporate tax rate of 5.57%.
More detailed information on “Deferred tax assets” is provided in sections 13.1, 13.3 and 13.5 below. Similar information concerning “Deferred tax liabilities” is provided in sections 13.2, 13.4 and 13.6 below.
13.1 Deferred tax assets: breakdown
ASSET/AMOUNT TOTAL 12.31.2012 TOTAL 12.31.2011
Allocations through equity 35,982 37,759
Allocations through equity 1,382 1,766
Impairments losses on loans 7,566 2,978
Total 44,930 42,503
13.2 Deferred tax liabilities: breakdown
ASSET/AMOUNT TOTAL 12.31.2012 TOTAL 12.31.2011
Property plant and equipment/Intangible assets 19,172 17,787
Other financial instruments/assets/liabilities 148 73
Total 19,320 17,860
13.3 Changes in deferred tax assets (through profit or loss)
TOTAL 12.31.2012 TOTAL 12.31.2011
1. Opening balance 40,737 40,9812. Increases2.1 Deferred tax assets recognised in the year 8,098 7,720
a) relating to previous years - -
b) due to changes in accounting policies - -
c) write-backs - -
d) other 8,098 7,720
2.2 New taxes or increases in tax rates - 123
2.3 Other increases 99 -
3. Decreases3.1 Deferred tax assets cancelled in the year (5,386) (7,037)
a) reversals of temporary differences (5,386) (7,037)
b) write-downs of non-recoverable items - -
c) due to changes in accounting policies - -
d) other - -
3.2 Reduction in tax rates - -
3.3 Other decreases - (1,050)
4. Closing balance 43,548 40,737

117FinecoBank · Annual Report and Accounts as at 31 December 2012
Increases in deferred tax assets recorded in the financial year through profit or loss refer to the following main items:- allocations to provisions for risks and charges;- provisions for reward schemes;- future personnel costs.- impairment losses on loans and receivables.
Decreases in deferred tax assets recorded in the financial year as a balancing item of the income statement refer to the following main items:- tax recovery for deferred expenses;- use of provisions for future personnel costs;- use of provisions for risks and charges.
13.3.1 Changes in deferred tax assets under Law 214/2011 (through profit or loss)
TOTAL 12.31.2012 TOTAL 12.31.2011
1. Opening balance 2,978 2,9552. Increases 181 233. Decreases3.1 Reversals - -
3.2 Conversion into tax credits
a) resulting from operating losses - -
b) resulting from tax losses - -
3.3 Other decreases - -
4. Closing balance 3,159 2,978
13.4 Changes in deferred tax liabilities (through profit or loss)
TOTAL 12.31.2012 TOTAL 12.31.2011
1. Opening balance 17,787 16,5392. Increases2.1 Deferred tax liabilities arising during the year 1,429 1,470
a) relating to previous years - -
b) due to changes in accounting policies - -
c) other 1,429 1,470
2.2 New taxes or increases in tax rates - -
2.3 Other increases - -
3. Decreases3.1 Deferred tax liabilities de-recognised during the year (44) (45)
a) reversals of temporary differences (44) (45)
b) due to changes in accounting policies - -
c) other - -
3.2 Reduction in tax rates - -
3.3 Other decreases - (177)
4. Closing balance 19,172 17,787
Increases in deferred tax liabilities recorded in the financial year as a balancing item of the income statement refer to the recognition of deferred tax liabilities resulting from the accounting and tax treatment of goodwill.Decreases in deferred tax liabilities recorded in the financial year through profit or loss refer mainly to the tax recovery of amortisation.

118
Part B - Balance Sheet - Assets (Continued)
Notes to the Accounts
Annual Report and Accounts as at 31 December 2012 · FinecoBank
13.5 Changes in deferred tax assets (through equity)
TOTAL 12.31.2012 TOTAL 12.31.2011
1. Opening balance 1,766 1,4562. Increases2.1 Deferred tax assets recognised in the year 8 383
a) relating to previous years - -
b) due to changes in accounting policies - -
c) other 8 383
2.2 New taxes or increases in tax rates - -
2.3 Other increases - -
3. Decreases3.1 Deferred tax assets cancelled in the year (392) (73)
a) reversals of temporary differences - -
b) write-downs of non-recoverable items - -
c) due to changes in accounting policies - -
d) other (392) (73)
3.2 Reduction in tax rates - -
3.3 Other decreases - -
4. Closing balance 1,382 1,766
Increases in deferred tax assets recorded in the financial year as a balancing item of the balance sheet refer to the recognition of deferred tax assets resulting from the fair value measurement of debt securities classified as “Available-for-sale financial assets”. 13.6 Changes in deferred tax liabilities (through equity)
TOTAL 12.31.2012 TOTAL 12.31.2011
1. Opening balance 73 -2. Increases2.1 Deferred tax liabilities arising during the year 148 73
a) relating to previous years - -
b) due to change in accounting policies - -
c) other 148 73
2.2 New taxes or increases in tax rates - -
2.3 Other increases - -
3. Decreases3.1 Deferred tax liabilities de-recognised during the year (73) -
a) reversals of temporary differences - -
b) due to change in accounting policies - -
c) other (73) -
3.2 Reduction in tax rates - -
3.3 Other decreases - -
4. Closing balance 148 73
Increases in deferred tax liabilities recorded in the financial year as a balancing item of the balance sheet refer to the recognition of deferred tax liabilities resulting from the fair value measurement of debt securities classified as “Available-for-sale financial assets”.
13.7 Other informationNo information to report.

119FinecoBank · Annual Report and Accounts as at 31 December 2012
Section 14 - Non-current assets and disposal groups classified as held for sale and associated liabilities - Assets item 140 and liabilities item 90
14.1 Non-current assets and disposal groups classified as held for sale: breakdown by type of asset
TOTAL 12.31.2012 TOTAL 12.31.2011
A. Individual assets A.1 Financial assets
A.2 Equity investments - -
A.3 Property, plant and equipment - 145
A.4 Intangible assets - -
A.5 Other non-current assets - -
Total A - 145B. Groups of assets (operating units sold) B.1 Financial assets held for trading - -
B.2 Financial assets at fair value through profit or loss - -
B.3 Available-for-sale financial assets - -
B.4 Held-to-maturity investments - -
B.5 Loans and receivables with banks - -
B.6 Loans and receivables with customers - -
B.7 Equity investments - -
B.8 Property, plant and equipment - -
B.9 Intangible assets - -
B.10 Other assets - -
Total B - -C. Liabilities associated with assets classified as held for sale C.1 Payables - -
C.2 Securities - -
C.3 Other liabilities - -
Total C - -D. Liabilities included in disposal groups classified as held for sale D.1 Deposits from banks - -
D.2 Deposits from customers - -
D.3 Debt securities in issue - -
D.4 Financial liabilities held for trading - -
D.5 Financial liabilities at fair value through profit and loss - -
D.6 Funds - -
D.7 Other liabilities - -
Total D - -
14.2 Other informationNo information to report.
14.3 Information on equity investments in companies subject to significant influence not valued according to the equity methodNo information to report.

120
Part B - Balance Sheet - Assets (Continued)
Notes to the Accounts
Annual Report and Accounts as at 31 December 2012 · FinecoBank
Section 15 - Other assets - Item 150
15.1 Other assets: breakdown
TOTAL 12.31.2012 TOTAL 12.31.2011
Items in transit not allocated to relevant accounts 7 15
Items in processing:
- notes, cheques and other documents 13,664 15,370
- POS and ATM cards 677 348
- other items in processing 6 1
Current receivables not related
to the provision of financial services 2,827 3,204
Definitive items not recognised under other items:
- securities and coupons to be settled 608 6,408
- fees to be charged to customers 12,618 1,028
- amounts to be settled via clearing houses 2,365 5,525
- other transactions 24,646 18,949
Tax items other than those recognised under item 140:
- tax advances 77,872 96,392
- tax credit 9,276 594
- tax advances on employee severance indemnities 20 20
Receivables due to disputed items not deriving from lending 119 119
Prepayments 6,868 9,888
Improvement and incremental expenses incurred on leasehold assets 10,467 11,131
Total 162,040 168,992

121FinecoBank · Annual Report and Accounts as at 31 December 2012
LiabilitiesSection 1 - Deposits from banks - Item 10
1.1 Deposits from banks: breakdown by category
TYPE OF TRANSACTION/AMOUNT TOTAL 12.31.2012 TOTAL 12.31.2011
1. Deposits from central banks - -2. Deposits from banks2.1 Current accounts and demand deposits 39,403 14,834
2.2 Time deposits - 200,054
2.3 Loans
2.3.1 Repos 2,025,627 983,132
2.3.2 Other - -
2.4 Liabilities in respect of commitments to repurchase treasury shares - -
2.5 Other liabilities 123 44
Total 2,065,153 1,198,064Fair value 2,065,153 1,198,064
1.2 Breakdown of item 10 “Deposits from banks”: subordinated debtsNo data to report.
1.3 Breakdown of item 10 “Deposits from banks”: structured debtsNo data to report.
1.4 Deposits from banks subject to micro-hedgingNo data to report.
1.5 Amounts payable under finance leasesNo data to report.
Section 2 - Deposits from customers - Item 20
2.1 Deposits from customers: breakdown by category
TYPE OF TRANSACTION/AMOUNT TOTAL 12.31.2012 TOTAL 12.31.2011
1. Current accounts and demand deposits 9,551,550 8,822,354
2. Time deposits 2,277,460 789,846
3. Loans
3.1 Repos 382,241 1,048,058
3.2 Other - -
4. Liabilities in respect of commitments to repurchase treasury shares - -
5. Other liabilities 52,291 41,774
Total 12,263,542 10,702,032Fair value 12,295,879 10,702,032
2.2 Breakdown of item 20 “Deposits from customers”: subordinated debtsNo data to report.
2.3 Breakdown of item 20 “Deposits from customers”: structured debtsNo data to report.
2.4 Deposits from customers subject to micro-hedgingNo data to report.
2.5 Amounts payable under finance leasesNo data to report.
Part B - Balance Sheet

122
Part B - Balance Sheet - Liabilities (Continued)
Notes to the Accounts
Annual Report and Accounts as at 31 December 2012 · FinecoBank
Section 3 - Debt securities in issue - Item 30
3.1. Debt securities in issue: breakdown by category
TYPE OF TRANSACTION/AMOUNT
TOTAL 12.31.2012 TOTAL 12.31.2011
BOOK VALUEFAIR VALUE
BOOK VALUEFAIR VALUE
LEVEL 1 LEVEL 2 LEVEL 3 LEVEL 1 LEVEL 2 LEVEL 3A. Securities1. Bonds 1.1 structured - - - - - - - - 1.2 other 3,075,792 - 3,043,081 - 4,577,286 - 3,756,365 -2. Other securities 2.1 structured - - - - - - - - 2.2 other - - - - - - - -Total 3,075,792 - 3,043,081 - 4,577,286 - 3,756,365 -
In 2011, FinecoBank issued bond loans on equal terms for a total of €4,500,000 thousand and $100,000 thousand, €75,792 as at 31 December 2012, which were entirely subscribed by the Parent Company UniCredit S.p.A..In September securities were repurchased for a book value of €1,500,000 thousand; at the same time debt securities held by Fineco’s and issued by UniCredit S.p.A. were sold to UniCredit S.p.A. for the same amount. The transaction also resulted in the closure of the related hedging derivatives and the recognition in the income statement of the changes in fair value of portfolio hedged items.
3.2 Breakdown of item 30 “Debt securities in issue”: subordinated securitiesNo data to report.
3.3. Debt securities in issue subject to micro-hedgingNo data to report.
Section 4 - Financial liabilities held for trading - Item 40
4.1 Financial liabilities held for trading: breakdown by category
TYPE OF TRANSACTION/AMOUNT
TOTAL 12.31.2012 TOTAL 12.31.2011
NVFV
FV* NVFV
FV*L1 L2 L3 L1 L2 L3A. On-balance sheet liabilities1. Deposits from banks - - - - - - 1 - - 12. Deposits from customers 808 6 - - 6 1,030 - - - -3. Debt securities 3.1 Bonds 3.1.1 Structured - - - - - - - - 3.1.2 Other bonds - - - - - - - - 3.2 Other securities 3.2.1 Structured - - - - - - - - 3.2.2 Other - - - - - - - -Total A 808 6 - - 6 1,030 1 - - 1B. Derivative instruments1. Financial derivatives 1.1 Trading derivatives 4,523 2,648 - 1,341 2,288 - 1.2 Related to fair value option - - - - - - 1.3 Other - - - - - -2. Credit derivatives 2.1 Trading derivatives - - - - - - 2.2 Related to fair value option - - - - - - 2.3 Other - - - - - -Total B 4,523 2,648 - 1,341 2,288 -Total (A+B) 808 4,529 2,648 - 6 1,030 1,342 2,288 - 1
Trading financial derivatives relate to the negative valuation of commitments for currencies and securities to be received and delivered, which correspond to positive valuations booked under item 20 Financial assets held for trading.
KeyFV = fair valueFV* = Fair value calculated excluding the changes in value due to the change in the issuer’s credit rating since the issue dateNV = nominal or notional valueL1 = Level 1 L2 = Level 2 L3 = Level 3

123FinecoBank · Annual Report and Accounts as at 31 December 2012
4.2 Item 40 “Financial liabilities held for trading”: subordinated liabilitiesNo data to report.
4.3 Item 40 “Financial liabilities held for trading”: structured debtsNo data to report.
4.4 On-balance sheet financial liabilities (excluding “technical overdrafts”) held for trading: annual changesNo data to report.
Section 5 - Financial liabilities at fair value through profit and loss - Item 50FinecoBank has not booked any financial liabilities under the item “Financial liabilities at fair value through profit and loss”.
Section 6 - Hedging derivatives - Item 60
6.1 Hedging derivatives: breakdown by type of hedge and by hierarchical level
ITEM/AMOUNT
FAIR VALUE 12.31.2012 NV12.31.2012
FAIR VALUE 12.31.2011 NV12.31.2011L1 L2 L3 L1 L2 L3
A. Financial derivatives 1) Fair value - 213,885 - 4,313,475 - 370,770 - 6,156,955
2) Cash flows - - - - - - - -
3) Net investment in foreign subsidiaries - - - - - - - -
B. Credit derivatives 1) Fair value - - - - - - - -
2) Cash flows - - - - - - - -
Total - 213,885 - 4,313,475 - 370,770 - 6,156,955
Key:NA = notional amountL1 = Level 1L2 = Level 2L3 = Level 3
6.2 Hedging derivatives: breakdown by portfolios hedged and by type of hedgeAs at 31 December 2012
TRANSACTION/TYPE OF HEDGE
FAIR VALUE CASH FLOWSNET
INVESTMENT IN FOREIGN
SUBSIDIARIES
MICRO
MACRO MICRO MACROINTEREST
RATE RISKCURRENCY
RISKCREDIT
RISKPRICE RISK
MULTIPLE RISK
1. Available-for-sale financial assets - - - - - -
2. Loans and receivables - - - - -
3. Held-to-maturity investments - - - -
4. Portfolio 41,881 -
5. Other transactions - - - - - - -
Total assets - - - - - 41,881 - - -1. Financial liabilities - - - - -
2. Portfolio 172,004 -
Total liabilities - - - - - 172,004 - - -1. Expected transactions -
2. Financial assets and financial liabilities - - -

124
Part B - Balance Sheet - Liabilities (Continued)
Notes to the Accounts
Annual Report and Accounts as at 31 December 2012 · FinecoBank
As at 31 December 2011
TRANSACTION/TYPE OF HEDGE
FAIR VALUE CASH FLOWSNET
INVESTMENT IN FOREIGN
SUBSIDIARIES
MICRO
MACRO MICRO MACROINTEREST
RATE RISKCURRENCY
RISKCREDIT
RISKPRICE RISK
MULTIPLE RISK
1. Available-for-sale financial assets - - - - - -
2. Loans and receivables - - - - -
3. Held-to-maturity investments - - - -
4. Portfolio 46,209 -
5. Other transactions - - - - - - -
Total assets - - - - - 46,209 - - -1. Financial liabilities - - - - -
2. Portfolio 324,561 -
Total liabilities - - - - - 324,561 - - -1. Expected transactions -
2. Financial assets and financial liabilities - - -
Section 7 - Changes in fair value of portfolio hedged items - Item 70
7.1 - Adjustments to the value of hedged financial liabilities
CHANGES TO HEDGED FINANCIAL LIABILITIES/AMOUNTS TOTAL 12.31.2012 TOTAL 12.31.2011
1. Positive changes to financial liabilities 24,673 13,367
2. Negative changes to financial liabilities (165,307) (308,713)
Total (140,634) (295,346)
7.2 Financial liabilities subject to macro-hedging of interest rate risk: breakdown
HEDGED LIABILITIES TOTAL 12.31.2012 TOTAL 12.31.2011
1. Debt securities in issue 3,075,792 4,577,286
Total 3,075,792 4,577,286
Liabilities subject to macro-hedging of interest rate risk consist of debt securities issued by FinecoBank. The value indicated corresponds to the residual contractual debt on the balance sheet date.
Section 8 - Tax liabilities - Item 80See section 13 of assets.
Section 9 - Liabilities included in disposal groups classified as held for sale - Item 90See section 14 of assets.

125FinecoBank · Annual Report and Accounts as at 31 December 2012
Section 10 - Other liabilities - Item 100
10.1 Other liabilities: breakdown
TOTAL 12.31.2012 TOTAL 12.31.2011
Accrued expenses other than those to be capitalised
for the financial liabilities concerned 857 152
Other liabilities relative to employees 14,059 13,069
Other liabilities relative to other personnel 14 -
Other liabilities due to Directors and Statutory Auditors 166 142
Items in transit not allocated to relevant accounts - -
Sums available to be paid to customers 178 563
Items in processing:
- incoming bank transfers 3,703 8,357
- outgoing bank transfers 39,023 37,869
- POS and ATM cards 409 3,744
- other items in processing 10,806 4,172
Current payables not related
to the provision of financial services 20,094 17,837
Definitive items not recognised under other items:
- securities and coupons to be settled 1,537 9,221
- other items 21,574 20,848
Adjustments for illiquid portfolio items 7,067 3,377
Tax items other than those included in item 80:
- sums withheld from third parties as withholding agent 21,875 29,209
- other 38,438 30,311
Prepayments 305 -
Social security contributions to be paid 4,699 4,111
Total 184,804 182,982
Section 11 - Allocation to employee severance pay provision - Item 110
11.1 Provision for employee severance pay: annual changes
TOTAL 12.31.2012 TOTAL 12.31.2011
A. Opening balance 3,136 3,194B. Increases B.1 Provisions for the year 144 178
B.2 Other increases 27 328
C. Decreases C.1 Payments made (133) (70)
C.2 Other decreases (49) (494)
D. Closing balance 3,125 3,136
The affect on profit or loss for 2012, shown under item B.1 “Allocations during the year” amounting to a total of €144 thousand, includes the “Interest Cost” (financial charges or interest accrued over the year on the obligation).
11.2 Other informationThe “TFR” provision for Italy-based employee benefits is considered to be a “post-retirement defined benefit”. It is therefore recognised on the basis of an actuarial estimate of the amount of benefit accrued by employees discounted to present value. This benefit is calculated by an external actuary using the unit credit projection method (see Part A.2 - The Main Items of the Accounts).
The Provision for employee severance pay covers the amount of the rights accrued in that respect up to 31 December 2012 by employees, under current legal regulations, as well as national collective bargaining agreements and supplementary company agreements.
The financial year under review was characterised by:1) normal events relating to the employee severance pay provision in accordance with legal provisions and company agreements in force;2) changes associated with employment contracts pursuant to Article 1406 and following of the Civil Code dealing with individual mobility within the
Group.

126
Part B - Balance Sheet - Liabilities (Continued)
Notes to the Accounts
Annual Report and Accounts as at 31 December 2012 · FinecoBank
In 2007, the new supplementary pension reform pursuant to Legislative Decree no. 252/2005 became effective and, as a result the amounts accrued up to 31 December 2006 were kept with the Company, whilst the amounts of employee severance pay provision accruing as of 1 January 2007 were transferred to the supplementary pension funds or the INPS Treasury fund according to the option adopted by the employees (within 30 June 2007). The result is that:- the employee severance fund accrued up to 31 December 2006 (or until the date of the option - falling between 1 January 2007 and 30 June 2007
- adopted by the employees if the they decided to transfer their employee severance pay provision to a supplementary pension fund) continues to be a“defined-benefit” plan and therefore subject to actuarial valuation, although based on simplified actuarial assumptions which no longer take account of estimated future pay rises;
- the amounts accrued from 1 January 2007 (or from the date of the option - falling between 1 January 2007 and 30 June 2007 - by the employees if they decided to transfer their employee severance pay provision to a supplementary pension fund), were considered as a “defined-benefit” plan (as the Company’s liability ceases at the time it pays the employee severance pay provision accrued to the pension fund chosen by the employee) and therefore the related cost for the period is equal to the amounts paid to the Supplementary Pension fund or the INPS Treasury fund.
As at 31 December 2012, the employee severance pay provision recalculated in accordance with IAS 19 represented a liability of €3,125 thousand.The table below shows the reconciliation of the present value of the employee severance pay provision (calculated by an independent actuary appointed by the Parent Company UniCredit S.p.A. for that specific purpose) and the related liability stated in the financial statements, as well as the main actuarial assumptions used.
Reconciliation between the present value of the provision and liabilities recognised in the balance sheet
Present value of the defined benefit plan - TFR severance pay 3,909
Unrecognised actuarial gains (losses) (784)
Net liability 3,125
Description of the main actuarial assumptions
Discount rate 3.30%
Expected inflation rate 2.00%
With regard to the discounting rate in particular, in order to increase its representativeness for medium/long-term maturities, the basket contains a number of “investment grade” securities with a rating of less than AA for which an adjustment is made to produce an “AA equivalent” rate of return.From 1 January 2013, following the entry into force of the amendments to IAS 19 (“IAS 19R”), the elimination of the “corridor” method will result in an impact on shareholders’ equity related to the recognition in the “revaluation reserves” of actuarial gains or losses not previously recognised when this “method” was applied.
Section 12 - Provisions for risks and charges - Item 120
12.1 - Provisions for risks and charges: breakdown
ITEM/AMOUNT TOTAL 12.31.2012 TOTAL 12.31.2011
1. Pensions and other post-retirement benefit obligations - -
2. Other provisions for risks and charges
2.1 legal disputes 51,773 50,569
2.2 staff expenses - -
2.3 other 57,203 47,792
Total 108,976 98,361
The other provisions for risks and charges under point 2.3 includes the Provision for additional customer expenses amounting to €34,785 thousand, versus €32,856 thousand as at 31 December 2011.

127FinecoBank · Annual Report and Accounts as at 31 December 2012
12.2 Provisions for risks and charges: annual changesAs at 31 December 2012
PENSION FUNDS OTHER PROVISIONS TOTAL
A. Opening balance - 98,361 98,361B. Increases B.1 Provisions for the year - 18,169 18,169
B.2 Changes due to the passage of time - 816 816
B.3 Changes due to variations in the discount rate - 252 252
B.4 Other increases - - -
C. Decreases C.1 Amounts used in the year - (8,622) (8,622)
C.2 Changes due to variations in the discount rate - - -
C.3 Other decreases - - -
D. Closing balance - 108,976 108,976
Allocations during the year include €882 thousand recorded under Other administrative expenses.
As at 31 December 2011
PENSION FUNDS OTHER PROVISIONS TOTAL
A. Opening balance - 97,872 97,872B. Increases B.1 Provisions for the year - 18,362 18,362
B.2 Changes due to the passage of time - 848 848
B.3 Changes due to variations in the discount rate - - -
B.4 Other increases - - -
C. Decreases C.1 Amounts used in the year - (18,317) (18,317)
C.2 Changes due to variations in the discount rate - (404) (404)
C.3 Other decreases - - -
D. Closing balance - 98,361 98,361
12.3 Pensions and other post-retirement defined-benefit obligationsNo data to report.
12.4 Provisions for risks and charges - other provisions
PROVISIONS FOR RISKS AND CHARGES 12.31.2011OTHER
CHANGESUTILISATIONS
2012EFFECT OF
DISCOUNTING
NETALLOCATIONS
2012* 12.31.2012
Legal disputes - disputes with customers and PFA 50,569 580 (5,823) 692 5,755 51,773
Other - provision for additional customer expenses 32,856 - (768) - 2,697 34,785
- other provisions for risk and charges 14,936 (580) (2,031) - 10,093 22,418
Total provisions for risks and charges 98,361 - (8,622) 692 18,545 108,976
The column “Effects of discounting” includes the variations due to the change in the discount rate, the passage of time and the change in the payment timeline.
* Net provisions for the year include €882 thousand recorded under Other administrative expenses.
Section 13 - Redeemable shares - Item 140
13.1 Redeemable shares: breakdownNo data to report.

128
Part B - Balance Sheet - Liabilities (Continued)
Notes to the Accounts
Annual Report and Accounts as at 31 December 2012 · FinecoBank
Section 14 - Bank’s shareholders’ equity - Items 130, 150, 160, 170, 180, 190 and 200
14.1 “Share capital” and “Treasury shares”: breakdownShare capital amounts to €200,070,430.89, and is comprised of 606,274,033 authorised and fully paid up ordinary shares with a nominal value of €0.33.The Bank does not hold any of its own shares in the portfolio.
ITEM/AMOUNT TOTAL 12.31.2012 TOTAL 12.31.2011
1. Share capital 200,070 200,070
2. Share premium reserve 1,934 1,934
3. Reserves
- Legal reserve 22,527 19,389
- Extraordinary reserve 93,773 93,727
- Other reserves 5 -
4. (Treasury shares) - -
5. Revaluation reserves 285 (644)
6. Equity instruments - -
7. Net Profit (Loss) for the year 125,467 62,764
Total 444,061 377,240
14.2 Share capital - Number of shares: annual changes
ITEMS/TYPE
TOTAL 12.31.2012
ORDINARY OTHER
A. Shares outstanding at the beginning of the year - fully paid 606,274,033 -
- not fully paid - -
A.1 Treasury shares (-) - -
A.2 Shares outstanding: opening balance 606,274,033 -B. IncreasesB.1 New issues
- against payment:
- business combinations - -
- bonds converted - -
- warrants exercised - -
- other - -
- free
- to employees - -
- to directors - -
- other - -
B.2 Sale of treasury shares - -
B.3 Other changes - -
C. DecreasesC.1 Cancellation - -
C.2 Purchase of treasury shares - -
C.3 Business transfers - -
C.4 Other changes - -
D. Shares outstanding: closing balance 606,274,033 -D.1 Treasury shares (+) -
D.2 Shares outstanding as at the end of the year - -
- fully paid 606,274,033 -
- not fully paid - -
14.3 Share capital: other informationOrdinary shares have a nominal value of €0.33.The Bank does not hold any of its own shares in the portfolio. The shares are not subject to any right, privilege or constraint; there are no shares reserved for issue under option and sales contracts.

129FinecoBank · Annual Report and Accounts as at 31 December 2012
14.4 Reserves of profit: other informationReserves are represented by the legal reserve, amounting to €22,527 thousand, and the extraordinary reserve, amounting to €93,773 thousand, and the unavailable retained earnings, amounting to €5 thousand.
Information on the availability and distribution of shareholders’ equityFollowing the modification of Article 2427 of the Civil Code, due to the effect of the new provisions of Legislative Decree no. 6 of 17 January 2003, and in accordance with document no. 1 issued on 25 October 2004 by the Italian Accounting Board, the following table provides details of the individual items of shareholders’ equity, showing their availability, distribution, and any utilisation during the past three years.
TYPE/DESCRIPTION AMOUNT POSSIBLE USEAVAILABLE FOR
DISTRIBUTION
SUMMARY OF THE AMOUNTS USED IN THE PAST THREE YEARS
TO COVER LOSSESFOR OTHER
REASONS
Share capital 200.070 - - - -Share capital reserve:Share premium reserve 1,934 A, B, C - (1) - -
Retained earnings: -Legal reserve 22,527 B - - -
Extraordinary reserve 93,773 A, B, C 93,773 (2) - -
Reserve for merger outstandings - A, B, C - - -
Unavailable reserve (Article 6 Leg Dec. 38/2005) 5 D
Other reserves - A, B, C - - -
Revaluation reserves:Valuation reserve for available-for-sale financial assets 285 D - - -
TOTAL 318,594 93,773 - -Undistributable amount
Distributable amount 93,773 - -
KeyA: for capital increase. B: to cover losses. C: for distribution to shareholders.D: availability and distribution limit prescribed by Article 6 of Legislative Decree no. 38/2005.
Notes:1. Pursuant to Article 2431 of the Civil Code, the sum total of this reserve may be distributed only on condition that the legal reserve has reached the limit set in Article 2430 of the Civil Code.2. It cannot be distributed until the book value of intangible assets, Article 2426 no. 5 of the Civil Code, has been covered.
14.5 Equity instruments: breakdown and annual changesNo data to report.
14.6 Other informationNo data to report.

130
Part B - Balance Sheet - Liabilities (Continued)
Notes to the Accounts
Annual Report and Accounts as at 31 December 2012 · FinecoBank
Section 15 - Other information
1 Guarantees given and commitments
TRANSACTIONS TOTAL 12.31.2012 TOTAL 12.31.2011
1) Financial guarantees given
a) Banks 302,130 40,468
b) Customers 382 -
2) Commercial guarantees given
a) Banks 4 65
b) Customers - 581
3) Irrevocable commitments to lend funds
a) Banks
i) certain to be called on 278 192
ii) not certain to be called on - -
b) Customers
i) certain to be called on 368,531 140,324
ii) not certain to be called on - -
4) Commitments underlying credit derivatives: protection sales - -
5) Assets given as collateral for third-party obligations
6) Other commitments - -
Total 671,325 181,630
2. Assets given as collateral for own liabilities and commitments
PORTFOLIOS TOTAL 12.31.2012 TOTAL 12.31.2011
1. Financial assets held for trading - -
2. Financial assets at fair value through profit or loss - -
3. Available-for-sale financial assets - -
4. Held-to-maturity investments - -
5. Loans and receivables with banks 255,892 998,532
6. Loans and receivables with customers - -
7. Property, plant and equipment - -
Total 255,892 998,532
The assets given as collateral shown above relate to bond issues of UniCredit S.p.A., belonging to the Loans and Receivables category, carried out to conduct reverse repos with the obligation for the buyer to resell at the end of the activities object of the transaction.
Furthermore, the Bank has committed debt securities issued by the Italian Central Government and the German Central Government classified in the Available-for-sale financial assets portfolio, with a book value of €58,909 thousand, as collateral for bankers’ drafts or guarantees with third parties.
With regard to financing transactions secured by securities not recorded under assets in the balance sheet, as at 31 December 2012, the Bank had repos and securities lending transactions guaranteed by cash amounts readily available to the lender recorded in the loan portfolio (item 60 Loans and receivables with banks and item 70 Loans and receivables with customers) with a book value of €283,057 thousand, whose underlying securities have a nominal value of €285,826 thousand and have been assigned through repos for €216,644 thousand.

131FinecoBank · Annual Report and Accounts as at 31 December 2012
FinecoBank also has securities lending transactions in place not guaranteed by cash amounts which are not shown in the balance sheet assets; the nominal value of the underlying securities not recorded is a total of €2,039,910 thousand, broken down as follows:
SECURITIES RECEIVED ON LOAN FROM:
TYPE OF SECURITIES (NOMINAL VALUE AT 31 DECEMBER 2012)
SOLD SOLD IN REPOS OTHER PURPOSES
Banks - - -
Financial companies 11 23,222 -
Insurance companies - - -
Non-financial companies - 19,119 -
Other entities 797 1,996,742 19
Total nominal value 808 2,039,083 19
FinecoBank has been conducting securities lending transactions on a continuous and systematic basis since 2001, with the objective of optimising the returns of customer portfolios, satisfying the requests of institutional counterparties and obtaining a profit for the Bank. FinecoBank operates as the borrower, borrowing the securities of its customers and using them in reverse repos and securities lending transactions guaranteed by cash amounts with retail and institutional customers interested in the temporary ownership of the securities.
FinecoBank has also deposited debt securities issued by UniCredit S.p.A. in a dedicated portfolio held at the Custodian bank, representing an amount higher than that of the securities borrowed from customers, in order to provide a collective guarantee.
3. Information on operating leasesFinecoBank has signed a number of operating lease contracts relating to electronic machine rentals. Future lease instalments amount to:- €2,965 thousand within one year;- €2,160 thousand from one to five years.
No subleasing transactions were undertaken.
4. Administration and brokerage for third partiesTYPE OF SERVICE AMOUNT 12.31.2012 AMOUNT 12.31.2011
1. Execution of orders for customers Securities a) Purchases 1. Settled 43,614,256 81,106,555 2. Unsettled 804,650 452,768 b) Sales 1. Settled 44,353,146 79,183,015 2. Unsettled 770,090 445,748 Derivative contracts a) Purchases 1. Settled 88,264,862 101,673,437 2. Unsettled 181,678 123,769 b) Sales 1. Settled 88,329,771 101,653,795 2. Unsettled 154,413 132,6902. Segregated accounts a) individual - - b) collective - -3. Custody and administration of securities a) third party securities on deposits: relating to depositary bank activities (excluding segregated accounts) 1. securities issued by the bank preparing the accounts - - 2. other securities - - b) third party securities held in deposits (excluding segregated accounts): other 11,287,466 10,436,599 1. securities issued by the bank preparing the accounts - - 2. other securities 11,287,466 10,436,599 c) third-party securities deposited with third parties 11,287,466 10,436,599 d) own securities deposited with third parties 4,308,794 6,100,2514. Other transactions Order receipt and transmission a) Purchases 6,952,733 2,686,254 b) Sales 6,869,421 2,594,599


133FinecoBank · Annual Report and Accounts as at 31 December 2012
Section 1 - Interest - Items 10 and 20 134Section 2 - Commissions - Items 40 and 50 135Section 3 - Dividends and similar income - Item 70 136Section 4 - Net income from trading activities - Item 80 136Section 5 - Net income from hedging activities - Item 90 137Section 6 - Profit (Loss) from sale/repurchase - Item 100 138Section 7 - Net income from financial assets and liabilities at fair value - Item 110 138Section 8 - Net adjustments/writebacks for impairment - Item 130 139Section 9 - Administrative expenses - Item 150 140Section 10 - Net provisions for risks and charges - Item 160 141Section 11 - Net value adjustments to property, plant and equipment - Item 170 142Section 12 - Net value adjustments to intangible assets - Item 180 142Section 13 - Other operating income and expense - Item 190 143Section 14 - Gains (losses) from investments - Item 210 143Section 15 - Net income from the fair value measurement of property, plant and equipment and intangible assets - Item 220 143Section 16 - Value adjustments to goodwill - Item 230 143Section 17 - Profit (Loss) from sale of investments - Item 240 144Section 18 - Income taxes on continuing operations - Item 260 144Section 19 - Profit (Loss) from discontinued operations after tax - Item 280 144Section 20 - Other information 144Section 21 - Earnings per share 145
Part C - Income statement

134
Notes to the Accounts
Annual Report and Accounts as at 31 December 2012 · FinecoBank
Part C - Income statement(Amounts in Euro/000)
Section 1 - Interest income and expense - Items 10 and 20
1.1 Interest income and similar revenues: breakdown
ITEMS/TYPEDEBT
SECURITIES LOANSOTHER
TRANSACTIONSTOTAL
12.31.2012TOTAL
12.31.2011
1. Financial assets held for trading 8 - - 8 321
2. Available-for-sale financial assets 1,653 - - 1,653 716
3. Held-to-maturity investments - - - - -
4. Loans and receivables with banks 75,693 330,322 - 406,015 241,029
5. Loans and receivables with customers - 25,794 - 25,794 32,681
6. Financial assets at fair value through profit or loss 243 - - 243 6
7. Hedging derivatives - - - - -
8. Other assets - - 26 26 27
Total interest income 77,597 356,116 26 433,739 274,780
1.2 Interest income and similar revenues: hedging differentialsThis table has been omitted as the balance of hedging differentials is negative.
1.3 Interest income and similar revenues: other informationNo information to report.
1.3.1 Interest income on foreign currency financial assets
ITEMS/TYPE 12.31.2012 12.31.2011
Interest income on foreign currency financial assets 7,759 4,532
1.3.2 Interest income on finance lease transactionsNo data to report.
1.4 Interest expenses and similar charges: breakdown
ITEMS/TYPE PAYABLES SECURITIESOTHER
TRANSACTIONSTOTAL
12.31.2012TOTAL
12.31.2011
1. Deposits from central banks - - - - -
2. Deposits from banks (13,191) - - (13,191) (9,989)
3. Deposits from customers (119,238) - - (119,238) (105,625)
4. Debt securities in issue - (52,700) - (52,700) (6,019)
5. Financial liabilities held for trading - - - - -
6. Financial liabilities at fair value through profit and loss - - - - -
7. Other liabilities and provisions - - (4) (4) (15)
8. Hedging derivatives - - (5,137) (5,137) (19,529)
Total (132,429) (52,700) (5,141) (190,270) (141,177)
1.5 Interest expenses and similar charges: hedging differentials
ITEMS 12.31.2012 12.31.2011
A. Positive hedging differentials 275,462 200,844
B. Negative hedging differentials (280,599) (220,373)
C. Balance (A-B) (5,137) (19,529)
1.6 Interest expenses and similar charges: other informationNo information to report.
1.6.1 Interest expense on liabilities denominated in currency
ITEMS/TYPE 12.31.2012 12.31.2011
Interest expense on liabilities denominated in currency (776) (1.804)
1.6.2 Interest expense on finance leasesNo data to report.

135FinecoBank · Annual Report and Accounts as at 31 December 2012
Section 2 - Fee and commission income and expense - Items 40 and 50
2.1 Fee and commission income: breakdown
TYPE OF SERVICE/AMOUNT TOTAL 12.31.2012 TOTAL 12.31.2011
(a) guarantees given 43 2
(b) credit derivatives - -
(c) management, brokerage and consulting services:
1. securities trading 72,385 95,038
2. currency trading - -
3. portfolio management
3.1. individual - -
3.2. collective - -
4. custody and administration of securities 1,065 972
5. custodian bank - -
6. placement of securities 174,060 149,232
7. reception and transmission of orders 8,520 258
8. advisory services
8.1. related to investments 7,032 4,039
8.2. related to financial structure - -
9. distribution of third-party services:
9.1. portfolio management 4,446 6,007
9.1.1 individual 3,604 5,338
9.1.2 collective 842 669
9.2. insurance products 21,484 22,916
9.3. other products 27 911
(d) collection and payment services 24,276 21,443
(e) securitisation servicing - -
(f ) factoring - -
(g) tax collection services - -
(h) management of multilateral trading systems - -
(i) management of current accounts 6,829 7,029
(j) other services 4,211 4,164
Total 324,378 312,011
2.2 Fee and commission income: distribution channels for products and services
CHANNEL/AMOUNT TOTAL 12.31.2012 TOTAL 12.31.2011
(a) at own branches:
1. portfolio management - -
2. placement of securities - -
3. third-party services and products - -
(b) cold-calling:
1. portfolio management 4.446 6.007
2. placement of securities 125.025 95.210
3. third-party services and products 21.357 23.520
(c) other distribution channels:
1. portfolio management - -
2. placement of securities 49.035 54.022
3. third-party services and products 154 307
Total 200.017 179.066
Commissions for the placement of securities through “other distribution channels” refer to commissions collected on subscriptions of shares and bonds with advance subscription, of units in investment funds and of SICAVs carried out directly by customers online.

136
Part C - Income statement (Continued)
Notes to the Accounts
Annual Report and Accounts as at 31 December 2012 · FinecoBank
2.3 Fee and commission expense: breakdown
SERVICE/AMOUNT TOTAL 12.31.2012 TOTAL 12.31.2011
(a) guarantees received (30) (31)
(b) credit derivatives - -
(c) management and brokerage services:
1. securities trading (5,833) (6,659)
2. currency trading (302) (612)
3. portfolio management
3.1 own - -
3.2 delegated to third parties - -
4. custody and administration of securities (3,766) (3,609)
5. placement of financial instruments - -
6. cold-calling to offer securities, products and services (146,309) (126,097)
(d) collection and payment services (15,106) (14,833)
(e) other services (350) (362)
(f) securities lending transactions (9,072) (4,681)
Total (180,768) (156,884)
Section 3 - Dividend income and similar revenue - Item 70
3.1 Dividend income and similar revenue: breakdown
ITEM/INCOME
TOTAL 12.31.2012 TOTAL 12.31.2011
DIVIDENDS
INCOME FROM UNITS IN
INVESTMENT FUNDS DIVIDENDS
INCOME FROM UNITS IN
INVESTMENT FUNDS
A. Financial assets held for trading 1 - 13 -
B. Available-for-sale financial assets - - - -
C. Financial assets at fair value through profit or loss - - - -
D. Equity Investments - -
Total 1 - 13 -
Section 4 - Gains (losses) on financial assets and liabilities held for trading - Item 80
4.1 Gains (losses) on financial assets and liabilities held for trading: breakdown As at 31 December 2012
TRANSACTION/INCOME ITEMUNREALISED GAINS
(A)REALISED
PROFITS (B)UNREALISED LOSSES
(C)REALISED
LOSSES (D)NET PROFIT
[(A+B)-(C+D)]
1. Financial assets held for trading
1.1 Debt securities 4 226 (3) (33) 194
1.2 Equity instruments 8 121,846 (8) (112,009) 9,837
1.3 Units in investment funds - 636 - (18) 618
1.4 Loans - - - - -
1.5 Other - 10,453 - - 10,453
2. Financial liabilities held for trading
2.1 Debt securities - - - - -
2.2 Payables - - - - -
2.3 Other 1 96 - - 97
3. Other financial assets and liabilities: exchange differences 3,463
4. Derivatives
4.1 Financial derivatives:
- On debt securities and interest rates 11 25 (10) (5) 21
- On equity securities and share indices 4,579 3,371 (4,513) (1,567) 1,870
- On currency and gold (303)
- Other - 40 - (26) 14
4.2 Credit derivatives - - - - -
Total 4,603 136,693 (4,534) (113,658) 26,264

137FinecoBank · Annual Report and Accounts as at 31 December 2012
As at 31 December 2011
TRANSACTION/INCOME ITEMUNREALISED GAINS
(A)REALISED
PROFITS (B)UNREALISED LOSSES
(C)REALISED
LOSSES (D)NET PROFIT
[(A+B)-(C+D)]
1. Financial assets held for trading
1.1 Debt securities 4 278 (11) (41) 230
1.2 Equity instruments 72 141,462 (17) (131,167) 10,350
1.3 Units in investment funds 18 8 (23) (4) (1)
1.4 Loans - - - - -
1.5 Other - 11,747 - - 11,747
2. Financial liabilities held for trading
2.1 Debt securities - - - - -
2.2 Payables - - - - -
2.3 Other - - - (1) (1)
3. Other financial assets and liabilities: exchange differences 3,430
4. Derivatives
4.1 Financial derivatives:
- On debt securities and interest rates 15 31 (14) (34) (2)
- On equity securities and share indices 1,404 1,048 (1,335) (727) 390
- On currency and gold 276
- Other - 26 - (15) 11
4.2 Credit derivatives - - - - -
Total 1,513 154,600 (1,400) (131,989) 26,430
Section 5 - Fair value adjustments in hedge accounting - Item 90
5.1 Fair value adjustments in hedge accounting: breakdown
INCOME ITEM/AMOUNT TOTAL 12.31.2012 TOTAL 12.31.2011
A. Gains on: A.1 Fair value hedging instruments 223,041 362,755
A.2 Hedged asset items (in fair value hedge relationship) 154,665 16,669
A.3 Hedged liability items (in fair value hedge relationship) - 308,714
A.4 Cash-flow hedging derivatives - -
A.5 Assets and liabilities denominated in currency - -
Total gains on hedging activities (A) 377,706 688,138B. Losses on: B.1 Fair value hedging instruments (203,145) (347,041)
B.2 Hedged asset items (in fair value hedge relationship) (19,849) (327,730)
B.3 Hedged liability items (in fair value hedge relationship) (154,712) (13,367)
B.4 Cash-flow hedging derivatives - -
B.5 Assets and liabilities denominated in currency - -
Total losses on hedging activities (B) (377,706) (688,138)C. Fair value adjustments in hedge accounting (A-B) - -

138
Part C - Income statement (Continued)
Notes to the Accounts
Annual Report and Accounts as at 31 December 2012 · FinecoBank
Section 6 - Gains (Losses) on disposals/repurchases - Item 100
6.1 Gains (Losses) on disposals/repurchases: breakdown
ITEM/INCOME ITEM
TOTAL 12.31.2012 TOTAL 12.31.2011
PROFIT LOSS NET PROFIT PROFIT LOSS NET PROFIT
Financial assets1. Loans and receivables with banks 56,985 (1) 56,984 8 (10,768) (10,760)
2. Loans and receivables with customers - - - - - -
3. Available-for-sale financial assets
3.1 Debt securities - - - - - -
3.2 Equity instruments - - - 95 - 95
3.3 Units in investment funds - - - - - -
3.4 Loans - - - - - -
4. Held-to-maturity investments - - - - - -
Total assets 56,985 (1) 56,984 103 (10,768) (10,665)Financial liabilities1. Deposits from banks - - - - - -
2. Deposits from customers - - - - - -
3. Debt securities in issue - (56,985) (56,985) - - -
Total liabilities - (56,985) (56,985) - - -
Section 7 - Gains (losses) on financial assets and liabilities measured at fair value - Item 110
7.1 Financial liabilities at fair value through profit and loss: breakdownAs at 31 December 2012
TRANSACTION/INCOME ITEMUNREALISED GAINS
(A)REALISED
PROFITS (B)UNREALISED LOSSES
(C)REALISED
LOSSES (D)NET GAIN (LOSS)
[(A+B)-(C+D)]
1. Financial assets
1.1 Debt securities 1,724 80 - - 1,804
1.2 Equity instruments - - - - -
1.3 UCIT Units - - - - -
1.4 Loans - - - - -
2. Financial liabilities
2.1 Debt securities - - - - -
2.2 Deposits from banks - - - - -
2.3 Deposits from customers - - - - -
3. Other financial assets and liabilities: exchange differences -
4. Credit and financial derivatives - - - -
Total 1,724 80 - - 1,804
As at 31 December 2011
TRANSACTION/INCOME ITEMUNREALISED GAINS
(A)REALISED
PROFITS (B)UNREALISED LOSSES
(C)REALISED
LOSSES (D)NET GAIN (LOSS)
[(A+B)-(C+D)]
1. Financial assets
1.1 Debt securities 6 - (1,559) - (1,553)
1.2 Equity instruments - - - - -
1.3 UCIT Units - - - - -
1.4 Loans - - - - -
2. Financial liabilities
2.1 Debt securities - - - - -
2.2 Deposits from banks - - - - -
2.3 Deposits from customers - - - - -
3. Other financial assets and liabilities: exchange differences -
4. Credit and financial derivatives - - - -
Total 6 - (1,559) - (1,553)

139FinecoBank · Annual Report and Accounts as at 31 December 2012
Section 8 - Impairment losses - Item 130
8.1 Impairment losses on loans and receivables: breakdown
TRANSACTION/ INCOME ITEM
IMPAIRMENTS (1) WRITE-BACKS (2)
TOTAL 12.31.2012
TOTAL 12.31.2011
MICRO
MACRO
MICRO MACRO
WRITE-OFFS OTHER A B A B
A. Loans and receivables with banks
- Loans - - - - - - - - -
- Debt securities - - - - - - - - -
B. Loans and receivables with customers
Impaired related to purchase agreements
- Loans - - - - - - - - -
- Debt securities - - - - - - - - -
Other loans
- Loans (378) (4,080) (313) 189 904 - 826 (2,852) (2,559)
- Debt securities - - - - - - - - -
C. Total (378) (4,080) (313) 189 904 - 826 (2,852) (2,559)
KeyA = From interest B = Other
8.2 Impairment losses on available for sale financial assets: breakdownNo data to report.
8.3 Impairment losses on held-to-maturity investments: breakdownNo data to report.
8.4 Impairment losses on other financial transactions: breakdown
TRANSACTION/INCOME ITEM
IMPAIRMENTS (1) WRITE-BACKS (2)
TOTAL 12.31.2012
TOTAL 12.31.2011
MICRO
MACRO
MICRO MACRO
WRITE-OFFS OTHER A B A B
A. Guarantees given - - - - - - - - -
B. Credit derivatives - - - - - - - - -
C. Commitments to disburse funds - - - - - - - - -
D. Other transactions - - - - - - - - (235)
E. Total - - - - - - - - (235)
KeyA = From interest B = Other

140
Part C - Income statement (Continued)
Notes to the Accounts
Annual Report and Accounts as at 31 December 2012 · FinecoBank
Section 9 - Administrative costs - Item 150
9.1 Payroll costs: breakdown
TYPE OF EXPENSE/AMOUNT TOTAL 12.31.2012 TOTAL 12.31.2011
1) Employees (59,220) (56,893) a) wages and salaries (40,522) (39,832)
b) social security contributions (10,609) (10,739)
c) employee severance fund (2,172) (2,445)
d) pension costs - -
e) allocation to employee severance pay provision (165) (178)
f) provision for retirements and similar provisions:
- defined contribution - -
- defined benefit - -
g) payments to external pension funds:
- defined contribution (742) (761)
- defined benefit - -
h) costs related to share-based payments (588) (487)
i) other employee benefits (4,422) (2,451)
2) Other staff (97) (267)3) Directors and statutory auditors (764) (686)4) Early retirement costs - -5) Recovery of expenses for employees seconded to other companies 91 1926) Recovery of expenses for employees seconded to the Company (1,032) (2,317)Total (61,022) (59,971)
Item h) costs related to share-based payments, includes costs booked to the income statement resulting from share-based payments of the Parent Company UniCredit S.p.A..
9.2 Average number of employees by category
TOTAL 12.31.2012 TOTAL 12.31.2011
Employees 919 881(a) executives 21 21
(b) managers 250 240
(c) remaining employees 648 620
Other personnel 16 42
9.3 Defined benefit pensions and other post-retirement benefit obligations: total costNo data to report.
9.4 Other employee benefits
TYPE OF EXPENSE/AMOUNT TOTAL 12.31.2012 TOTAL 12.31.2011
Leaving incentives (1,773) (57)
Medical plan (648) (763)
Luncheon vouchers (761) (753)
Other (1,240) (878)
Total (4,422) (2,451)

141FinecoBank · Annual Report and Accounts as at 31 December 2012
9.5 Other administrative expenses: breakdown
TOTAL 12.31.2012 TOTAL 12.31.2011
1) INDIRECT TAXES AND DUTIES (39,306) (31,174)2) MISCELLANEOUS COSTS AND EXPENSESA) Advertising expenses - Marketing and communication (16,891) (14,770) Mass media campaigns (12,491) (10,608) Marketing and promotions (4,303) (4,059)
Sponsorships (65) (70)
Conventions and internal communications (32) (33)
B) Expenses related to credit risk (739) (600) Credit recovery expenses (431) (266)
Commercial information and company searches (308) (334)
C) Expenses related to personnel (12,373) (12,405) Personnel training (408) (397)
Car rental and other payroll costs (40) (45)
Personal financial adviser expenses (11,321) (11,407)
Travel expenses (512) (457)
Premises rentals for personnel (92) (99)
D) ICT expenses (29,674) (30,203) Lease of ICT equipment and software (6,069) (6,459)
Software expenses: lease and maintenance (5,639) (5,490)
ICT communication systems (3,673) (3,941)
ICT services: external personnel/outsourced services (6,778) (6,680)
Financial information providers (7,515) (7,633)
E) Consulting and professionals services (3,468) (3,670) Consultancy for ordinary operations (764) (1,089)
Consultancy for strategy, business development and organisational optimisation (34) (5)
Legal expenses (56) (11)
Legal disputes (2,614) (2,565)
F) Real estate expenses (21,112) (19,700) Real estate services (671) (671)
Repair and maintenance of furniture, machinery, and equipment (157) (580)
Maintenance of premises (1,155) (1,016)
Premises rentals (15,457) (14,911)
Cleaning of premises (549) (394)
Utilities (3,123) (2,128)
G) Other functioning costs (25,107) (22,554) Surveillance and security services (105) (95)
Money counting services and transport (2) (2)
Postage and transport of documents (2,617) (2,349)
Administrative and logistic services (13,536) (12,235)
Insurance (2,766) (2,620)
Printing and stationery (651) (665)
Fees, dues and contributions to associations (5,212) (4,362)
Other administrative expenses (218) (226)
Total (148,670) (135,076)
Section 10 - Net provisions for risks and charges - Item 160
10.1 Net provisions for risks and charges: breakdown
TOTAL 12.31.2012 TOTAL 12.31.2011
Disputes with customers and PFA (6,447) (13,202)
Provision for additional customer expenses (2,697) (3,331)
Other provisions for risks and charges (9,212) (848)
Total (18,356) (17,381)

142
Part C - Income statement (Continued)
Notes to the Accounts
Annual Report and Accounts as at 31 December 2012 · FinecoBank
Section 11 - Impairments/write-backs on property, plant and equipment - Item 170
11.1 Impairment/write-backs on property, plant and equipment: breakdownAs at 31 December 2012
ASSET/INCOME ITEMDEPRECIATION
(A)WRITE-DOWNS DUE TO
IMPAIRMENT (B)WRITE-BACKS
(C)NET GAIN (LOSS)
(A+B-C)
A. Property, plant and equipment
A.1 Owned
- Used in the business (2,808) (45) - (2,853)
- Held for investment (143) - - (143)
A.2 Finance lease
- Used in the business - - - -
- Held for investment - - - -
Total (2,951) (45) - (2,996)
As at 31 December 2011
ASSET/INCOME ITEMDEPRECIATION
(A)WRITE-DOWNS DUE TO
IMPAIRMENT (B)WRITE-BACKS
(C)NET GAIN (LOSS)
(A+B-C)
A. Property, plant and equipment
A.1 Owned
- Used in the business (2,968) (38) - (3,006)
- Held for investment (108) - - (108)
A.2 Finance lease
- Used in the business - - - -
- Held for investment - - - -
Total (3,076) (38) - (3,114)
Percent depreciation rates applied during the reporting period:• 3% instrumental properties• 15% fittings• 15% miscellaneous plant and equipment• 12% furniture and ordinary machines• 20% EDP machines• 20% mobile phones and television camera systems• 30% alarm and security systems• 7.5% hoisting equipment and systems• 25% motor vehicles
Section 12 - Impairment/write-backs on intangible assets - Item 180
12.1 Impairment on intangible assets: breakdown As at 31 December 2012
ASSET/INCOME ITEMAMORTISATION
(A)WRITE-DOWNS DUE TO
IMPAIRMENT (B)WRITE-BACKS
(C)NET GAIN (LOSS)
(A+B-C)
A. Intangible assets
A.1 Owned
- Generated internally by the Company - - - -
- Other (5,209) (41) - (5,250)
A.2 Finance lease
Total (5,209) (41) - (5,250)
Impairments on intangible assets relate to software, amortised over three years and the costs incurred to create the new Fineco website, amortised over 5 years.

143FinecoBank · Annual Report and Accounts as at 31 December 2012
As at 31 December 2011
ASSET/INCOME ITEMAMORTISATION
(A)WRITE-DOWNS DUE TO
IMPAIRMENT (B)WRITE-BACKS
(C)NET GAIN (LOSS)
(A+B-C)
A. Intangible assets
A.1 Owned
- Generated internally by the Company - - - -
- Other (5,467) - - (5,467)
A.2 Finance lease
Total (5,467) - - (5,467)
Section 13 - Other net operating income - Item 190
13.1 Other operating expense: breakdown
TYPE/AMOUNT TOTAL 12.31.2012 TOTAL 12.31.2011
Refunds and allowances (431) (339)
Penalties, fines and unfavourable rulings (3,310) (2,597)
Improvements and incremental expenses incurred on leasehold properties (2,678) (2,519)
Improvements and incremental expenses incurred on group properties (13) (14)
Exceptional write-downs (599) (811)
Other operating expense (1,209) (1,140)
Total (8,240) (7,420)
Exceptional write-downs of assets include costs incurred for credit card fraud of €497 thousand.
13.2 Other operating income: breakdown
TYPE/AMOUNT TOTAL 12.31.2012 TOTAL 12.31.2011
Recovery of costs:
- ancillary expenses - other 407 348
- taxes 31,067 29,908
Other income from current year 2,872 4,458
Total 34,346 34,714
Section 14 - Profit (loss) of associates - Item 210
14.1 Profit (loss) of associates: breakdownNo data to report.
Section 15 - Gains (losses) on tangible and intangible assets measured at fair value - Item 220
15.1 Net gains (losses) on property, plant and equipment and intangible assets measured at fair value: breakdown No data to report.
Section 16 - Impairment of goodwill - Item 230
16.1 Impairment of goodwill: breakdownNo data to report.

144
Part C - Income statement (Continued)
Notes to the Accounts
Annual Report and Accounts as at 31 December 2012 · FinecoBank
Section 17 - Gains (losses) on disposal of investments - Item 240
17.1 Gains (losses) on disposal of investments: breakdownINCOME ITEM/AMOUNT TOTAL 12.31.2012 TOTAL 12.31.2011
A. Properties - Gains on disposal - - - Losses on disposal - -B. Other assets - Gains on disposal - 3 - Losses on disposal (3) (4)Net gain (loss) (3) (1)
Section 18 - Tax expense (income) related to profit or loss from continuing operations - Item 260
18.1 Tax expense (income) related to profit or loss from continuing operations: breakdownINCOME ITEM/AMOUNT TOTAL 12.31.2012 TOTAL 12.31.2011
1. Current tax (-) (73,968) (43,062)2. Adjustment to current tax of prior years (+/-) (4,000) -3. Reduction of current tax for the year (+) - -4. Changes in deferred tax assets (+/-) 2,712 8055. Changes in deferred tax liabilities (+/-) (1,384) (1,424)6. Tax expense for the year (-) (-1+/-2+3+/-4+/-5) (76,640) (43,681)
Current taxes were influenced by the provisions contained in the Law Decree 201/2011 which introduced the deductibility for income tax purposes, with effect from the tax period under way at 31 December 2012, of the IRAP corporate tax relating to the taxable portion of the employed payroll costs. The benefit from the recognition of tax credit resulting from the above-mentioned deductibility, is €3,040 thousand.
18.2 Reconciliation of theoretical tax charge to actual tax charge
Profit before tax 125,467
IRES INCOME TAX IRAP CORPORATE TAX TOTAL
Amount corresponding to theoretical tax rate 55,580 11,257 66,837+ Tax effects of charges not relevant to the calculation of taxable income 4,580 5,146 9,726- Tax effects of income not relevant to the calculation of taxable income - - -- Tax effects deriving from the use of tax losses from previous years - - -- Tax effects deriving from the application of substitute taxes 445 - 445Amount corresponding to actual tax rate 60,605 16,403 77,008
Section 19 - Profit (Loss) after tax from discontinued operations - Item 280
19.1 Profit (Loss) after tax from discontinued operations: breakdown No data to report.
19.2 Breakdown of tax on discontinued operationsNo data to report.
Section 20 - Other information
1.1 Designation of Parent CompanyUniCredit S.p.A.Rome Register of CompaniesRegistered in the Register of Banking Groups and Parent Company of the Banking Group UniCredito ItalianoRegister of Banking Groups no. 2008.1
1.2 Registered Office of Parent CompanyRegistered Office: Rome, Via A. Specchi, 16 -Head Office: Milan, Piazza Cordusio

145FinecoBank · Annual Report and Accounts as at 31 December 2012
1.3 Key figures for the Parent Company (income statement, balance sheet, structure)UniCredit S.p.A. - Reclassified balance sheet as at 31 December 2011ASSETS 12.31.2011Cash and cash balances 5,753Financial assets held for trading 11,480Loans and receivables with banks 29,634Loans and receivables with customers 256,251Financial investments 89,950Hedging instruments 7,158Property, plant and equipment 246Goodwill 2,812Other intangible assets 29Tax assets 8,048Non-current assets and disposal groups classified as held for sale 7Other assets 5,654Total assets 417,022
LIABILITIES AND SHAREHOLDERS’ EQUITY 12.31.2011Deposits from banks 63,335Deposits from customers and debt securities in issue 273,166Financial liabilities held for trading 10,292Financial liabilities at fair value through profit and loss -Hedging instruments 7,759Provisions for risks and charges 1,882Tax liabilities 626Liabilities included in disposal groups classified as held for sale -Other liabilities 10,313Shareholders' equity 49,649- capital and reserves 56,869- available-for-sale assets fair value reserve and cash-flow hedging reserve (871)- net profit (loss) (6,349)Total liabilities and shareholders' equity 417,022
UniCredit S.p.A. - Condensed Income Statement 201112.31.2011
Net interest 4,704 Dividends and other income from equity investments 2,274 Net fees and commissions 3,406 Net trading, hedging and fair value income 164 Net other expenses/income (104)OPERATING INCOME 10,444 Payroll costs (3,552)Other administrative expenses (3,017)Recovery of expenses 416 Amortisation, depreciation and impairment losses on intangible and tangible assets (77) Operating costs (6,230)GROSS OPERATING PROFIT (LOSS) 4,214 Net write-downs of loans and provisions for guarantees and commitments (3,966)NET OPERATING PROFIT (LOSS) 248 Provisions for risks and charges (304)Integration costs (113)Net income from investments (1,366)GROSS PROFIT (LOSS)FROM CURRENT OPERATIONS (1,535)Income tax for the year 80 Goodwill impairment (4,894)PROFIT (LOSS) ATER TAX (6,349)
Section 21 - Earnings per share
21.1 Average number of diluted sharesNo data to report.
21.2 Other informationNo information to report.


147FinecoBank · Annual Report and Accounts as at 31 December 2012
Part D - Comprehensive income

148
Notes to the Accounts
Annual Report and Accounts as at 31 December 2012 · FinecoBank

149FinecoBank · Annual Report and Accounts as at 31 December 2012
Statement of Comprehensive Income
ITEMS GROSS AMOUNT INCOME TAX NET AMOUNT
10. Net Profit (Loss) for the year 125,466,685Other comprehensive income20. Available-for-sale financial assets
a) fair value changes 1,398,850 (462,600) 936,250
b) reclassification through profit or loss
- due to impairment - -
- gains/losses on disposals (10,172) 3,364 (6,808)
c) other changes - - -
30. Property, plant and equipment - - -
40. Intangible assets - - -
50. Hedges of net investment in foreign subsidiaries:
a) fair value changes - - -
b) reclassification through profit or loss - - -
c) other changes - - -
60. Cash flow hedges:
a) fair value changes - - -
b) reclassification through profit or loss - - -
c) other changes - - -
70. Exchange differences:
a) changes in values - - -
b) reclassification through profit or loss - - -
c) other changes - - -
80. Non-current assets classified as held for sale:
a) fair value changes - - -
b) reclassification through profit or loss - - -
c) other changes - - -
90. Actuarial gains (losses) on defined benefits plans - - -
100. Valuation reserves from investments accounted for using the equity method:
a) fair value changes - - -
b) reclassification through profit or loss
- due to impairment - - -
- gains/losses on disposals - - -
c) other changes - - -
110. Total other comprehensive income 1,388,678 (459,236) 929,442120. Comprehensive income (item 10+110) 126,396,127
Part D - Comprehensive income


151FinecoBank · Annual Report and Accounts as at 31 December 2012
Section 1 - Credit risk 152Section 2 - Market risk 154Section 3 - Liquidity risk 177Section 4 - Operational risk 181Section 5 - Other risks 183
Part E - Information on Risks and Hedging Policies

152
Notes to the Accounts
Annual Report and Accounts as at 31 December 2012 · FinecoBank
The responsibility for the development and definition of the methods used to measure risks, the activity of controlling risks company-wide, and the strategic management of these risks is centralised with the Parent Company. Group companies are responsible for first and second-level monitoring, especially for verifying that the risk level of individual companies is compatible with the guidelines set by the Parent Company, individual company equity, and prudential supervisory rules. In order to ensure efficient management of risks, the risk management process is structured in accordance with the organisational choices made for the Group and the provisions of the Supervisory Instructions for Banks pertaining to the internal control system.
Section 1 - Credit Risk
QUALITATIVE INFORMATION
1. General aspectsFinecoBank’s objective is to provide an adequate range of products able to satisfy and encourage loyalty among customers, through a competitive and complete offer. The development of the products and of the product line must also seek to maintain portfolio quality and, in any event, adequate processes to monitor profitability.Lending is expanded through the development of new products, or modification of existing ones, as well as through the protection of market share achieved. The factors that generate credit risk are determined by acceptance policies that assess creditworthiness, which are always adequately correlated to the risk/return ratio, and therefore remuneration of the product.
The quality of the loan portfolio, which is constantly monitored and supported by risk mitigation instruments, is protected by scoring models that contribute to evaluation during the approval process, ensuring that it is consistent and controlled. In addition to adequate coverage of the risk levels, monitoring of the portfolio and its segmentation by product and seniority allow a better understanding of the best loan issue strategies. The identification of any high-risk areas permits intervention on the automated measurement systems as well as on disbursement standards, with the possibility to take measures to limit credit risk in advance.In 2012, lending activity continued to focus on granting credit lines, mostly backed by assets, issuing credit cards with full payment of the balance at term to current account holders, and granting personal loans.
Choices concerning the investment of the Bank’s liquidity are governed by a prudential approach aimed at containing credit risk and mainly involve the deposit of liquid funds in reciprocal current accounts at the Parent Company and the subscription of bonds issued by the Parent Company.
2. Risk management policies2.1 Organisational aspectsThe credit process can be broken down into the following stages:• assessment of creditworthiness;• granting/disbursement of credit;• credit monitoring;• management of impaired loans;• risk measurement and control.
The assessment of creditworthiness entails ascertaining the ability of the borrower to repay. It is performed by specific centralised and specialist operating units in the various product lines disbursed to customers (personal loans, credit cards, credit lines). On receipt of the request, the offices in question assess the reliability of documentation, evaluate the equity and income situation, and gather information, also by consulting public records, private banks and system data such as the information contained in the Bank of Italy’s risk centre and in the Group archives.
To grant the credit, in addition to an assessment of creditworthiness, dedicated functions assess the compatibility of the request with the customer’s overall situation, based on the amount of the request, where necessary agreeing a new application with the customer, and evaluate any guarantees, finalise them, link them to credit lines and record in accordance with the associated processes. Lastly, the decision-making parties approve or reject the application on the basis of their powers or send the application to a higher decision-making body.
Credit monitoring is carried out on credit lines to check that the economic situation of the customer and of the guarantor that resulted in the approval has not changed. This check may entail collecting updated system data and information, as well as information from private banks. Checks are carried out according to established processes at set intervals, and may vary according to the amount of the credit line granted.In line with the general principles laid down by the Supervisory Body, receivables are classified on the basis of the level of impairment, which may be established on the basis of qualitative or quantitative criteria.
Part E - Information on Risks and Hedging Policies (Amounts in Euro/000)

153FinecoBank · Annual Report and Accounts as at 31 December 2012
The management of impaired loans entails taking all action necessary to restore them to normality or to recover the credits in situations where the relationship cannot be continued. All of these measures are established by specific processes based on the type, the amount, the past-due period and the presence of financial assets of the customer, which may be offered as collateral. Credit collection is performing by means of dunning carried out directly by Finecobank, both through dunning letters and debt collection carried out by specialised, authorised external companies.Lastly, management also entails forecasting losses on an individual basis, which is continuously updated based on the progress of recovery actions for the amounts due or based on information collected during the recovery actions. The measurement and control of credit risk takes place at the assessment stage with the support of scoring tools that analyse the customers’ socio-demographic profiles, making an assessment of individual counterparties on a statistical basis and supplementing the assessment, on one hand, with the support of credit bureaus for a better knowledge of public and private data and on the other hand, with information contained in the Bank of Italy’s risk centre.Credit risk control is also performed through the systematic assessment of the performance of credit portfolios in order to estimate expected losses and intervene on disbursement policies where necessary.
2.2 Management, measurement and control systemThe measurement of credit risk during the issue process is supported by automated assessment systems (so-called credit scoring systems). These systems also incorporate all available information and facts: public and private data provided by Credit rating bureaus, Risk Centre data flows or information requests submitted to the Bank of Italy, Group archives with data relating to positions shared with other Group banks and other performance information on customers, historicised by Finecobank. During the loan application process, attention is always focused on the possibility of optimising all information concerning customers that has been provided by the Bank, the Group and the System.The collection of any guarantees, their assessment and the margins between the fair value of the guarantee and the amount of the loan granted are a simple kind of support to risk mitigation, but there is no relevant positive correlation between the value of the financial guarantee and the applicant’s creditworthiness.
The collective writedowns of the “performing” loan portfolio are determined using migration rates, through transition matrices, both from performing loans to non-performing loans and for each classification status (past due, doubtful, non-performing) by combining the default rates with the expected recovery rates individually calculated for non-performing loans and taking account of any supporting guarantees.
The global assessment of portfolio risks in order to identify the sustainability of the asset and the remuneration margins is made both with the assistance of a tool shared with the Parent Company (Credit Tableau de Bord), which contains all the main risk indicators and the largest receivables of those listed, and with the support of specific product reports that identify the trend of default rates, broken down by disbursement period and default level.
The monitoring of credit risk as part of the management of the trading book is conducted by breaking it down into rating class and issuer sector, which determine the implicit risk of contracts. With specific reference to trading in over-the-counter derivatives, the Treasury Department deals exclusively with bank counterparties.
2.3 Credit risk mitigation techniquesIn order to mitigate risk when granting the different types of credit facilities, various types of collateral are obtained: liens on shares, bonds or investment funds, insurance contracts and government bonds are used to guarantee current account overdraft facilities, whilst the registration of first mortgages is quite rare.
2.4 Impaired financial assetsLoans are classified as past due, doubtful or non-performing in accordance with the criteria set forth by the Bank of Italy and the thresholds established by the Parent Company, with methods differing according to product type. Generally speaking, the classification of problem loans is usually objective, while the classification as non-performing, linked to the customer’s insolvency, is always individual and defined on the basis of the progress of debt recovery actions.The loss estimate for classified positions is also individual.The classification criterion used for overdrawn accounts is related to the performance of debt recovery activity or the forced sale of securities to cover debts. The restructuring of loans is only authorised if the amount past due has been paid in full in observance of the original payment schedule, or if considerable payments have been made leading the Bank to believe the debt exposure is very likely to be repaid.The procedure for the management of irregularly performing loans involves actions that may be taken to recover debts by ranking them by seniority of expiration.

154
Part E - Information on Risks and Hedging Policies (Continued)
Notes to the Accounts
Annual Report and Accounts as at 31 December 2012 · FinecoBank
QUANTITATIVE INFORMATION
A. Credit quality
A.1 Impaired and performing loans: amounts, write-downs, changes, distribution by business activity/region
A.1.1 Breakdown of financial assets by portfolio and credit quality (carrying value)
PORTFOLIO/QUALITYNON-PERFORMING
LOANSDOUBTFUL
LOANS RESTRUCTURED PAST-DUEOTHER
ASSETS TOTAL
1. Financial assets held for trading - - - 1 7,221 7,222
2. Available-for-sale financial assets - - - - 58,909 58,909
3. Held-to-maturity investments - - - - - -
4. Loans and receivables with banks - - - - 17,271,573 17,271,573
5. Loans and receivables with customers 3,133 436 - 851 549,186 553,606
6. Financial assets at fair value through profit or loss - - - - 10,516 10,516
7. Financial instruments classified as held for sale - - - - - -
8. Hedging derivatives - - - - 190,573 190,573
Total 31 December 2012 3,133 436 - 852 18,087,978 18,092,399Total 31 December 2011 2,595 389 - 369 17,195,213 17,198,566
A.1.2 Breakdown of exposures by portfolio and credit quality (gross and net values)
PORTFOLIO/QUALITY
IMPAIRED ASSETS PERFORMING
TOTAL (NET EXPOSURE)
GROSSEXPOSURE
SPECIFICIMPAIRMENT
NETEXPOSURE
GROSSEXPOSURE
PORTFOLIOIMPAIRMENT
NETEXPOSURE
1. Financial assets held for trading 1 - 1 7,221 7,222
2. Available-for-sale financial assets - - - 58,909 - 58,909 58,909
3. Held-to-maturity investments - - - - - - -
4. Loans and receivables with banks - - - 17,271,573 - 17,271,573 17,271,573
5. Loans and receivables with customers 17,898 (13,478) 4,420 556,681 (7,495) 549,186 553,606
6. Financial assets at fair value through profit or loss - - - 10,516 10,516
7. Financial instruments classified as held for sale - - - - - - -
8. Hedging derivatives - - - 190,573 190,573
Total 31 December 2012 17,899 (13,478) 4,421 17,887,163 (7,495) 18,087,978 18,092,399Total 31 December 2011 14,249 (10,896) 3,353 16,860,747 (10,169) 17,195,213 17,198,566
As at 31 December 2012, exposures relating to customers with performing loans renegotiated under collective agreements amounted to €266 thousand.
Net performing customer loans, amounting to €549,186 thousand, can be broken down by seniority of expiration as follows:- not past due of €531,216 thousand;- non-impaired, past due between 1 day and 90 days of €17,857 thousand;- non-impaired, past due between 90 and 180 days of €110 thousand;- non-impaired, past due between 180 days and 1 year of €2 thousand;- non-impaired, past due over 1 year of €1 thousand.
The other performing loans shown in table A.1.2 are all not past due.

155FinecoBank · Annual Report and Accounts as at 31 December 2012
A.1.3 On-balance sheet and off-balance-sheet exposures to banks: gross and net values
TYPE OF EXPOSURE/AMOUNTEXPOSURE
GROSSSPECIFIC
IMPAIRMENTSPORTFOLIO
IMPAIRMENTSNET
EXPOSURE
A. On-balance sheet exposures a) Non-performing loans - - -
b) Doubtful loans - - -
c) Restructured loans - - -
d) Past-due loans - - -
e) Other assets 17,282,286 - 17,282,286
Total A 17,282,286 - - 17,282,286B. Off-balance sheet exposures a) Impaired - - -
b) Other 1,133,378 - 1,133,378
Total B 1,133,378 - - 1,133,378Total A+B 18,415,664 - - 18,415,664
In the above table, item B. “Off-balance sheet exposures” includes the counterparty risk related to securities lending transactions collateralised by securities or without cash guarantees and to repos that can be classified as “Securities Financing Transactions” (SFT) defined in prudential regulations (Circular no. 263 “New prudential regulatory provisions for banks”), amounting to €639,520 thousand.
A.1.4 On-balance sheet exposures to banks: trend of gross impaired exposures: No data to report.
A.1.5 On-balance sheet exposures to banks: trend in total impairments No data to report.
A.1.6 On-balance sheet and off-balance-sheet exposures to customers: gross and net values
TYPE OF EXPOSURE/AMOUNTEXPOSURE
GROSSSPECIFIC
IMPAIRMENTSPORTFOLIO
IMPAIRMENTSNET
EXPOSURE
A. On-balance sheet exposures a) Non-performing loans 14,985 (11,852) 3,133
b) Doubtful loans 1,384 (948) 436
c) Restructured loans - - -
d) Past-due loans 1,529 (678) 851
e) Other assets 615,681 (7,495) 608,186
Total A 633,579 (13,478) (7,495) 612,606B. Off-balance sheet exposures a) Impaired 1 - 1
b) Other 769,807 - 769,807
Total B 769,808 - - 769,808Total A+B 1,403,387 (13,478) (7,495) 1,382,414
In the above table, item B. “Off-balance sheet exposures” includes the counterparty risk related to securities lending transactions collateralised by securities or without cash guarantees and to reverse repos that can be classified as “Securities Financing Transactions” (SFT) defined in prudential regulations (Circular no. 263 “New prudential regulatory provisions for banks”), amounting to €763,018 thousand.

156
Part E - Information on Risks and Hedging Policies (Continued)
Notes to the Accounts
Annual Report and Accounts as at 31 December 2012 · FinecoBank
A.1.7 On-balance sheet exposures to customers: trend of gross impaired exposures:
SOURCE / CATEGORIESNON-PERFORMING
LOANS DOUBTFUL
LOANSRESTRUCTURED
LOANSPAST-DUE
LOANS
A. Opening balance - gross exposure 12.241 1.154 - 854 of which: assets sold but not derecognised - - - -
B. Increases B.1 inflows from performing loans 213 1.433 - 9.318
B.2 transfers from other categories of impaired exposures 4.016 3.532 - -
B.3 other increases 346 803 - 797
C. Decreases C.1 outflows to performing loans - (476) - (895)
C.2 de-recognitions (736) (284) - (1)
C.3 collections (737) (776) - (4.959)
C.4 disposals - - - -
C.5 transfers to other categories of impaired exposures - (3.999) - (3.549) C.6 other decreases (358) (3) - (36)
D. Gross exposure closing balance 14.985 1.384 - 1.529 of which: assets sold but not derecognised - - - -
A.1.8 On-balance sheet exposures to customers: trend in total impairments
SOURCE / CATEGORIESNON-PERFORMING
LOANS DOUBTFUL
LOANSRESTRUCTURED
LOANSPAST-DUE
LOANS
A. Total opening impairment (9.646) (765) - (485) of which: assets sold but not derecognised - - - -
B. Increases B.1 impairment (2.933) (1.088) - (631)
B.1.a losses on disposal - - - -
B.2 transfers from other categories of impaired exposures (601) (73) - -
B.3 other increases (49) - - -
C. Decreases C.1 write-backs from assessments 404 96 - 140
C.2 write-backs from recoveries 237 43 - 178
C.2.a gains on disposal - - - -
C.3 de-recognitions 736 284 - 1
C.4 transfers to other categories of impaired exposures - 555 - 119 C.5 other decreases - - -
D. Final overall impairment (11.852) (948) - (678) of which: assets sold but not derecognised - - - -

157FinecoBank · Annual Report and Accounts as at 31 December 2012
A.2 Internal and external ratings
A.2.1 Breakdown of on-balance sheet and off-balance sheet exposures by external rating class
EXPOSURES
EXTERNAL RATING CLASSES NO RATING TOTALCLASS 1 CLASS 2 CLASS 3 CLASS 4 CLASS 5 CLASS 6
A. On-balance sheet exposures - 17,330,702 1,474 1 4 - 562,711 17,894,892
B. Derivatives B.1 Financial
derivatives - 191,709 - - - - 5,796 197,505
B.2 Credit derivatives - - - - - - - -
C. Guarantees given - 266,070 - - - - 36,446 302,516D. Other commitments
to disburse funds - 428 42 - - - 156 626E. Other - 606,085 35,663 1,625 - - 759,165 1,402,538Total - 18,394,994 37,179 1,626 4 - 1,364,274 19,798,077
The table below shows the breakdown of on-balance sheet and off-balance-sheet exposures to counterparties with an external rating. Rating agencies provide a summary assessment on the creditworthiness of different type of counterparties: Countries, Banks, Public Bodies, Insurance Companies and Businesses, usually large-scale.The table refers to the classification set forth in the Bank of Italy Circular no. 262/2005 regarding external ratings, which envisages 6 classes of creditworthiness.The above disclosure refers to Standard and Poor’s ratings, together with those of the other two principal agencies, Moody’s and Fitch. If there is more than one external rating for a counterparty, the most prudential assessment is used.FinecoBank establishes the regulatory requirements by applying the Basel II Traditional Standardised Approach which involves the subdivision of the exposures into different classes (“portfolios”) according to the status of counterparty, i.e. the technical characteristics of the relationship or the methods adopted to manage the relationship and the application of different weighting ratios to each portfolio. In order to determine credit risk, FinecoBank only uses the ratings of agencies specific to individual countries, which lead to the weighting of the “Central governments and central banks”, “Supervised Intermediaries” and “Public-sector entities” portfolios; in general, a weighting factor of 100 percent is applied to the remaining credit exposures, without prejudice to the main exceptions established by Circular letter no. 263 of the Bank of Italy. As at 31 December 2012, credit exposure to retail customers was limited to personal loans, credit cards spending (full payment of balance or instalment plans) and unsecured and secured loans. Exposures to non-retail customers mainly derive from amounts due to the Parent Company for treasury activities and for hedging banking book positions through interest-rate derivatives.The remaining exposures regard receivables relating to customer trading, whose counterparties are leading banks with a high credit rating.
In the above table, item E “Other” includes the counterparty risk related to securities lending transactions collateralised by securities or without cash guarantees and to repos.In the above table, equity instruments have been excluded whereas units in investment funds have been included, unlike the previous tables in this section in which both were excluded.
A.2.2 Breakdown of on-balance sheet and off-balance-sheet exposures by internal rating classThis table has not been included because internal ratings are not used to managed credit risk.

158
Part E - Information on Risks and Hedging Policies (Continued)
Notes to the Accounts
Annual Report and Accounts as at 31 December 2012 · FinecoBank
A.3 Breakdown of secured exposures by type of collateralA.3.1 Secured exposures to banks
NET EXPOSURE
VALUE
REAL GUARANTEES (1) PERSONAL GUARANTEES (2)
TOTAL (1)+(2)
PROPERTIES- MORTGAGES
PROPERTIES- FINANCE
LEASE SECURITIES
OTHER REAL
GUARANTEES
CREDIT DERIVATIVES GUARANTEES, ETC.
CLN
OTHER DERIVATIVES
GOVERNMENTS AND CENTRAL
BANKS
OTHER PUBLIC
ENTITIES BANKSOTHER
ENTITIES
GOVERNMENTS AND CENTRAL
BANK
OTHER PUBLIC
ENTITIES BANKSOTHER
ENTITIES
1. Secured on-balance sheet exposures: 1.1 totally secured 182,274 - - 183,679 - - - - - - - - - - 183,679 - of which impaired - - - - - - - - - - - - - - - 1.2 partially secured - - - - - - - - - - - - - - - - of which impaired - - - - - - - - - - - - - - -2. Secured off- Balance Sheet credit exposures: 2.1 totally secured - - - - - - - - - - - - - - - - of which impaired - - - - - - - - - - - - - - - 2.2 partially secured - - - - - - - - - - - - - - - - of which impaired - - - - - - - - - - - - - - -
A.3.2 Secured exposures to customers
NET EXPOSURE
VALUE
REAL GUARANTEES (1) PERSONAL GUARANTEES (2)
TOTAL (1)+(2)
PROPERTIES- MORTGAGES
PROPERTIES- FINANCE
LEASE SECURITIES
OTHER REAL
GUARANTEES
CREDIT DERIVATIVES GUARANTEES, ETC.
CLN
OTHER DERIVATIVES
GOVERNMENTS AND CENTRAL
BANKS
OTHER PUBLIC
ENTITIES BANKSOTHER
ENTITIES
GOVERNMENTS AND CENTRAL
BANK
OTHER PUBLIC
ENTITIES BANKSOTHER
ENTITIES
1. Secured on-balance sheet exposures: 1.1 totally secured 137,351 544 - 174,310 27,588 - - - - - - - - 28 202,470 - of which impaired 125 344 - 134 - - - - - - - - - - 478 1.2 partially secured 151 - - 106 - - - - - - - - - 53 159 - of which impaired 23 - - - - - - - - - - - - 53 532. Secured off- Balance Sheet credit exposures: 2.1 totally secured 257 - - 364 - - - - - - - - - - 364 - of which impaired - - - - - - - - - - - - - - - 2.2 partially secured 40 - - 39 - - - - - - - - - - 39 - of which impaired - - - - - - - - - - - - - - -
B. Distribution and concentration of credit exposuresB.1 Breakdown of on-balance sheet and off-balance-sheet exposures to customers by sector (carrying value)
EXPOSURE/COUNTERPARTY
GOVERNMENTS OTHER PUBLIC ENTITIES FINANCIAL COMPANIES INSURANCE COMPANIES NON-FINANCIAL COMPANIES OTHER ENTITIES
NET EXPOSURE
SPECIFIC IMPAIRMENTS
PORTFOLIO IMPAIRMENTS
NET EXPOSURE
SPECIFIC IMPAIRMENTS
PORTFOLIO IMPAIRMENTS
NET EXPOSURE
SPECIFIC IMPAIRMENTS
PORTFOLIO IMPAIRMENTS
NET EXPOSURE
SPECIFIC IMPAIRMENTS
PORTFOLIO IMPAIRMENTS
NET EXPOSURE
SPECIFIC IMPAIRMENTS
PORTFOLIO IMPAIRMENTS
NET EXPOSURE
SPECIFIC IMPAIRMENTS
PORTFOLIO IMPAIRMENTS
A. On-balance sheet exposuresA.1 Non-performing loans - - - - 15 (48) - - 18 (65) 3,099 (11,739)
A.2 Doubtful loans - - - - 2 (3) - - 1 (1) 434 (944)
A.3 Restructured loans - - - - - - - - - - - -
A.4 Past-due loans - - - - 1 - - - 2 (3) 848 (675)
A.5 Other exposures 58,977 - 1 - 73,355 (161) 5,074 - 7,584 (3,548) 461,195 (3,787)
Total A 58,977 - - 1 - - 75,373 (51) (161) 5,074 - - 7,605 (69) (3,548) 465,576 (13,358) (3,787)B. Off-balance sheet exposuresB.1 Non-performing loans - - - - - - - - - - - -
B.2 Doubtful loans - - - - - - - - - - - -
B.3 Other impaired assets - - - - - - - - - - 1 -
B.4 Other exposures - - - - 220 - - - 580 - 5,989 -
Total B - - - - - - 220 - - - - - 580 - - 5,990 - -TOTAL A + B 31 December 2012 58,977 - - 1 - - 75,593 (51) (161) 5,074 - - 8,185 (69) (3,548) 471,566 (13,358) (3,787)TOTAL A + B 31 December 2011 49,070 - - 1 - - 67,698 (48) (237) 4,653 - - 7,563 (65) (4,706) 543,175 (10,783) (5,226)

159FinecoBank · Annual Report and Accounts as at 31 December 2012
A.3 Breakdown of secured exposures by type of collateralA.3.1 Secured exposures to banks
NET EXPOSURE
VALUE
REAL GUARANTEES (1) PERSONAL GUARANTEES (2)
TOTAL (1)+(2)
PROPERTIES- MORTGAGES
PROPERTIES- FINANCE
LEASE SECURITIES
OTHER REAL
GUARANTEES
CREDIT DERIVATIVES GUARANTEES, ETC.
CLN
OTHER DERIVATIVES
GOVERNMENTS AND CENTRAL
BANKS
OTHER PUBLIC
ENTITIES BANKSOTHER
ENTITIES
GOVERNMENTS AND CENTRAL
BANK
OTHER PUBLIC
ENTITIES BANKSOTHER
ENTITIES
1. Secured on-balance sheet exposures: 1.1 totally secured 182,274 - - 183,679 - - - - - - - - - - 183,679 - of which impaired - - - - - - - - - - - - - - - 1.2 partially secured - - - - - - - - - - - - - - - - of which impaired - - - - - - - - - - - - - - -2. Secured off- Balance Sheet credit exposures: 2.1 totally secured - - - - - - - - - - - - - - - - of which impaired - - - - - - - - - - - - - - - 2.2 partially secured - - - - - - - - - - - - - - - - of which impaired - - - - - - - - - - - - - - -
A.3.2 Secured exposures to customers
NET EXPOSURE
VALUE
REAL GUARANTEES (1) PERSONAL GUARANTEES (2)
TOTAL (1)+(2)
PROPERTIES- MORTGAGES
PROPERTIES- FINANCE
LEASE SECURITIES
OTHER REAL
GUARANTEES
CREDIT DERIVATIVES GUARANTEES, ETC.
CLN
OTHER DERIVATIVES
GOVERNMENTS AND CENTRAL
BANKS
OTHER PUBLIC
ENTITIES BANKSOTHER
ENTITIES
GOVERNMENTS AND CENTRAL
BANK
OTHER PUBLIC
ENTITIES BANKSOTHER
ENTITIES
1. Secured on-balance sheet exposures: 1.1 totally secured 137,351 544 - 174,310 27,588 - - - - - - - - 28 202,470 - of which impaired 125 344 - 134 - - - - - - - - - - 478 1.2 partially secured 151 - - 106 - - - - - - - - - 53 159 - of which impaired 23 - - - - - - - - - - - - 53 532. Secured off- Balance Sheet credit exposures: 2.1 totally secured 257 - - 364 - - - - - - - - - - 364 - of which impaired - - - - - - - - - - - - - - - 2.2 partially secured 40 - - 39 - - - - - - - - - - 39 - of which impaired - - - - - - - - - - - - - - -
B. Distribution and concentration of credit exposuresB.1 Breakdown of on-balance sheet and off-balance-sheet exposures to customers by sector (carrying value)
EXPOSURE/COUNTERPARTY
GOVERNMENTS OTHER PUBLIC ENTITIES FINANCIAL COMPANIES INSURANCE COMPANIES NON-FINANCIAL COMPANIES OTHER ENTITIES
NET EXPOSURE
SPECIFIC IMPAIRMENTS
PORTFOLIO IMPAIRMENTS
NET EXPOSURE
SPECIFIC IMPAIRMENTS
PORTFOLIO IMPAIRMENTS
NET EXPOSURE
SPECIFIC IMPAIRMENTS
PORTFOLIO IMPAIRMENTS
NET EXPOSURE
SPECIFIC IMPAIRMENTS
PORTFOLIO IMPAIRMENTS
NET EXPOSURE
SPECIFIC IMPAIRMENTS
PORTFOLIO IMPAIRMENTS
NET EXPOSURE
SPECIFIC IMPAIRMENTS
PORTFOLIO IMPAIRMENTS
A. On-balance sheet exposuresA.1 Non-performing loans - - - - 15 (48) - - 18 (65) 3,099 (11,739)
A.2 Doubtful loans - - - - 2 (3) - - 1 (1) 434 (944)
A.3 Restructured loans - - - - - - - - - - - -
A.4 Past-due loans - - - - 1 - - - 2 (3) 848 (675)
A.5 Other exposures 58,977 - 1 - 73,355 (161) 5,074 - 7,584 (3,548) 461,195 (3,787)
Total A 58,977 - - 1 - - 75,373 (51) (161) 5,074 - - 7,605 (69) (3,548) 465,576 (13,358) (3,787)B. Off-balance sheet exposuresB.1 Non-performing loans - - - - - - - - - - - -
B.2 Doubtful loans - - - - - - - - - - - -
B.3 Other impaired assets - - - - - - - - - - 1 -
B.4 Other exposures - - - - 220 - - - 580 - 5,989 -
Total B - - - - - - 220 - - - - - 580 - - 5,990 - -TOTAL A + B 31 December 2012 58,977 - - 1 - - 75,593 (51) (161) 5,074 - - 8,185 (69) (3,548) 471,566 (13,358) (3,787)TOTAL A + B 31 December 2011 49,070 - - 1 - - 67,698 (48) (237) 4,653 - - 7,563 (65) (4,706) 543,175 (10,783) (5,226)

160
Part E - Information on Risks and Hedging Policies (Continued)
Notes to the Accounts
Annual Report and Accounts as at 31 December 2012 · FinecoBank
B.2 Breakdown of on-balance sheet and off-balance-sheet exposures to customers by geographical area (carrying value)
EXPOSURE/GEOGRAPHICAL AREA
ITALYOTHER EUROPEAN
COUNTRIES AMERICA ASIA REST OF THE WORLD
NET EXPOSURE
TOTAL IMPAIRMENT
NET EXPOSURE
TOTAL IMPAIRMENT
NET EXPOSURE
TOTAL IMPAIRMENT
NET EXPOSURE
TOTAL IMPAIRMENT
NET EXPOSURE
TOTAL IMPAIRMENT
A. On-balance sheet exposures
A.1 Non-performing loans 3,133 (11,852) - - - - - - - -
A.2 Doubtful loans 436 (948) - - - - - - - -
A.3 Restructured loans - - - - - - - - - -
A.4 Past-due loans 851 (678) - - - - - - - -
A.5 Other exposures 563,872 (7,495) 44,234 (1) 69 - 7 - 3 -
TOTAL 568,292 (20,973) 44,234 (1) 69 - 7 - 3 -B. Off-balance-sheet
exposures B.1 Non-performing loans - - - - - - - - - -
B.2 Doubtful loans - - - - - - - - - -
B.3 Other impaired assets 1 - - - - - - - - -
B.4 Other exposures 6,141 - 568 - 80 - - - - -
TOTAL 6,142 - 568 - 80 - - - - -TOTAL 31 December 2012 574,434 (20,973) 44,802 (1) 149 - 7 - 3 -TOTAL 31 December 2011 635,067 (21,065) 36,883 - 182 - 19 - 9 -
EXPOSURE/GEOGRAPHICAL AREA
NORTHWEST ITALY NORTH-EAST ITALY CENTRAL ITALY SOUTHERN ITALY AND ISLANDS
NET EXPOSURE
TOTAL IMPAIRMENT
NET EXPOSURE
TOTAL IMPAIRMENT
NET EXPOSURE
TOTAL IMPAIRMENT
NET EXPOSURE
TOTAL IMPAIRMENT
A. On-balance sheet exposures A.1 Non-performing loans 736 (2,999) 393 (1,569) 592 (2,255) 1,411 (5,028)
A.2 Doubtful loans 127 (281) 36 (72) 99 (217) 175 (378)
A.3 Restructured loans - - - - - - - -
A.4 Past-due loans 236 (167) 171 (128) 216 (165) 227 (218)
A.5 Other exposures 170,897 (2,389) 70,392 (1,084) 205,858 (2,348) 116,725 (1,673)
TOTAL 171,996 (5,836) 70,992 (2,853) 206,765 (4,985) 118,538 (7,297)B. Off-balance-sheet exposures B.1 Non-performing loans - - - - - - - -
B.2 Doubtful loans - - - - - - - -
B.3 Other impaired assets - - - - - - - -
B.4 Other exposures 3,145 - 989 - 1,240 - 767 -
TOTAL 3,145 - 989 - 1,240 - 767 -TOTAL 31 December 2012 175,141 (5,836) 71,981 (2,853) 208,005 (4,985) 119,305 (7,297)TOTAL 31 December 2011 207,734 (5,528) 84,975 (2,956) 209,923 (5,609) 132,435 (6,972)

161FinecoBank · Annual Report and Accounts as at 31 December 2012
B.3 Breakdown of on-balance sheet and off-balance-sheet exposures to banks by geographical area
EXPOSURE/GEOGRAPHICAL AREA
ITALYOTHER EUROPEAN
COUNTRIES AMERICA ASIA REST OF THE WORLD
NET EXPOSURE
TOTAL IMPAIRMENT
NET EXPOSURE
TOTAL IMPAIRMENT
NET EXPOSURE
TOTAL IMPAIRMENT
NET EXPOSURE
TOTAL IMPAIRMENT
NET EXPOSURE
TOTAL IMPAIRMENT
A. On-balance sheet exposures
A.1 Non-performing loans - - - - - - - - - -
A.2 Doubtful loans - - - - - - - - - -
A.3 Restructured loans - - - - - - - - - -
A.4 Past-due loans - - - - - - - - - -
A.5 Other exposures 17,268,646 - 13,636 - 1 - - - 3 -
TOTAL 17,268,646 - 13,636 - 1 - - - 3 -B. Off-balance-sheet
exposures B.1 Non-performing loans - - - - - - - - - -
B.2 Doubtful loans - - - - - - - - - -
B.3 Other impaired assets - - - - - - - - - -
B.4 Other exposures 492,706 - 1,152 - - - - - - -
TOTAL 492,706 - 1,152 - - - - - - -TOTAL 31 December 2012 17,761,352 - 14,788 - 1 - - - 3 -TOTAL 31 December 2011 16,690,055 - 9,838 - 25 - - - 3 -
EXPOSURE/GEOGRAPHICAL AREA
NORTHWEST ITALY NORTH-EAST ITALY CENTRAL ITALY SOUTHERN ITALY AND ISLANDS
NET EXPOSURE
TOTAL IMPAIRMENT
NET EXPOSURE
TOTAL IMPAIRMENT
NET EXPOSURE
TOTAL IMPAIRMENT
NET EXPOSURE
TOTAL IMPAIRMENT
A. On-balance sheet exposures A.1 Non-performing loans - - - - - - - -
A.2 Doubtful loans - - - - - - - -
A.3 Restructured loans - - - - - - - -
A.4 Past-due loans - - - - - - - -
A.5 Other exposures 158,590 - - - 17,110,055 - - -
TOTAL 158,590 - - - 17,110,055 - - -B. Off-balance-sheet exposures B.1 Non-performing loans - - - - - - - -
B.2 Doubtful loans - - - - - - - -
B.3 Other impaired assets - - - - - - - -
B.4 Other exposures - - - - 492,706 - - -
TOTAL - - - - 492,706 - - -TOTAL 31 December 2012 158,590 - - - 17,602,761 - - -TOTAL 31 December 2011 23,954 - 10 - 16,666,091 - - -
B.4 Significant exposuresThe Bank of Italy Circular 263 defines “significant exposures” as those whose amount is equal to or exceeds 10% of regulatory capital, where “exposure” means the sum of the on-balance sheet and off-balance-sheet assets of a customer or a group of related customers, as defined by the regulations on credit and counterparty risk.
As at 31 December 2012, the on-balance sheet and off-balance-sheet exposures of customers or groups of related customers that represent “significant exposures” for FinecoBank amount to 6, whose exposure totalled €20,006,165 thousand, with a relative weighted value of €39,423 thousand.The “significant exposures” include on-balance sheet and off-balance-sheet exposures of the UniCredit group, namely an exposure of €19,713,227 thousand, with a weighted value of zero.

162
Part E - Information on Risks and Hedging Policies (Continued)
Notes to the Accounts
Annual Report and Accounts as at 31 December 2012 · FinecoBank
C. Securitisation and asset transfer transactionsC.1 Securitisation transactionsNo data to report.
C.2 Disposals
A. Financial assets sold and partially derecognised
QUALITATIVE INFORMATION
FinecoBank undertakes reverse repos on securities not recognised in the balance sheet, received through repos and securitised lending, on securities in the Bank’s portfolio.With regard to the transactions on securities in the Bank’s portfolio, the financial assets transferred are bonds issued by UniCredit S.p.A., recognised under Loans and Receivables, which have not been derecognised because FinecoBank undertakes reverse repos with the obligation for the buyer to resell at the end of the activities object of the transaction and maintains all the risks associated with ownership of the securities.
QUANTITATIVE INFORMATION
C.2.1 Financial assets sold but not derecognised: book value and full value
TYPE/PORTFOLIO
FINANCIAL ASSETS HELD FOR TRADING
FINANCIAL ASSETS AT FAIR VALUE THROUGH
PROFIT OR LOSSAVAILABLE-FOR-SALE
FINANCIAL ASSETSHELD-TO-MATURITY
INVESTMENTSLOANS AND RECEIVABLES
WITH BANKSLOANS AND RECEIVABLES
WITH CUSTOMERS TOTAL
A B C A B C A B C A B C A B C A B C 12.31.2012 12.31.2011
A. On-balance sheet assets1. Debt securities - - - - - - - - - - - - 255,892 - - - - - 255,892 998,532
2. Equity instruments - - - - - - - - - - -3. Units in investment funds - - - - - - - - - - -4. Loans - - - - - - - - - - - - - - - - - - - -B. Derivative instrumentsTotal 31 December 2012 - - - - - - - - - - - - 255,892 - - - - - 255,892of which impaired - - - - - - - - - - - - - - - - - - -Total 31 December 2011 - - - - - - - - - - - - 998,532 - - - - - 998,532of which impaired - - - - - - - - - - - - - - - - - - -
Key:A = financial assets sold and fully recognised (book value)B = financial assets sold and partially recognised (book value)C = financial assets sold and partially recognised (entire value)
C.2.2 Financial liabilities from financial assets sold but not derecognised: book value
LIABILITY/ASSET PORTFOLIOFINANCIAL ASSETS HELD FOR TRADING
FINANCIAL ASSETS AT FAIR VALUE THROUGH
PROFIT OR LOSSAVAILABLE-FOR-SALE
FINANCIAL ASSETSHELD-TO-MATURITY
INVESTMENTSLOANS AND RECEIVABLES
WITH BANKSLOANS AND RECEIVABLES
WITH CUSTOMERS TOTAL
1. Deposits from customers a) from fully-recognised assets - - - - 258,827 - 258,827
b) from partially-recognised assets - - - - - - -
2. Deposits from banks a) from fully-recognised assets - - - - 291 - 291
b) from partially-recognised assets - - - - - - -
Total 31 December 2012 - - - - 259,118 - 259,118Total 31 December 2011 - - - - 1,008,351 - 1,008,351

163FinecoBank · Annual Report and Accounts as at 31 December 2012
C.2.1 Financial assets sold but not derecognised: book value and full value
TYPE/PORTFOLIO
FINANCIAL ASSETS HELD FOR TRADING
FINANCIAL ASSETS AT FAIR VALUE THROUGH
PROFIT OR LOSSAVAILABLE-FOR-SALE
FINANCIAL ASSETSHELD-TO-MATURITY
INVESTMENTSLOANS AND RECEIVABLES
WITH BANKSLOANS AND RECEIVABLES
WITH CUSTOMERS TOTAL
A B C A B C A B C A B C A B C A B C 12.31.2012 12.31.2011
A. On-balance sheet assets1. Debt securities - - - - - - - - - - - - 255,892 - - - - - 255,892 998,532
2. Equity instruments - - - - - - - - - - -3. Units in investment funds - - - - - - - - - - -4. Loans - - - - - - - - - - - - - - - - - - - -B. Derivative instrumentsTotal 31 December 2012 - - - - - - - - - - - - 255,892 - - - - - 255,892of which impaired - - - - - - - - - - - - - - - - - - -Total 31 December 2011 - - - - - - - - - - - - 998,532 - - - - - 998,532of which impaired - - - - - - - - - - - - - - - - - - -
Key:A = financial assets sold and fully recognised (book value)B = financial assets sold and partially recognised (book value)C = financial assets sold and partially recognised (entire value)
C.2.2 Financial liabilities from financial assets sold but not derecognised: book value
LIABILITY/ASSET PORTFOLIOFINANCIAL ASSETS HELD FOR TRADING
FINANCIAL ASSETS AT FAIR VALUE THROUGH
PROFIT OR LOSSAVAILABLE-FOR-SALE
FINANCIAL ASSETSHELD-TO-MATURITY
INVESTMENTSLOANS AND RECEIVABLES
WITH BANKSLOANS AND RECEIVABLES
WITH CUSTOMERS TOTAL
1. Deposits from customers a) from fully-recognised assets - - - - 258,827 - 258,827
b) from partially-recognised assets - - - - - - -
2. Deposits from banks a) from fully-recognised assets - - - - 291 - 291
b) from partially-recognised assets - - - - - - -
Total 31 December 2012 - - - - 259,118 - 259,118Total 31 December 2011 - - - - 1,008,351 - 1,008,351
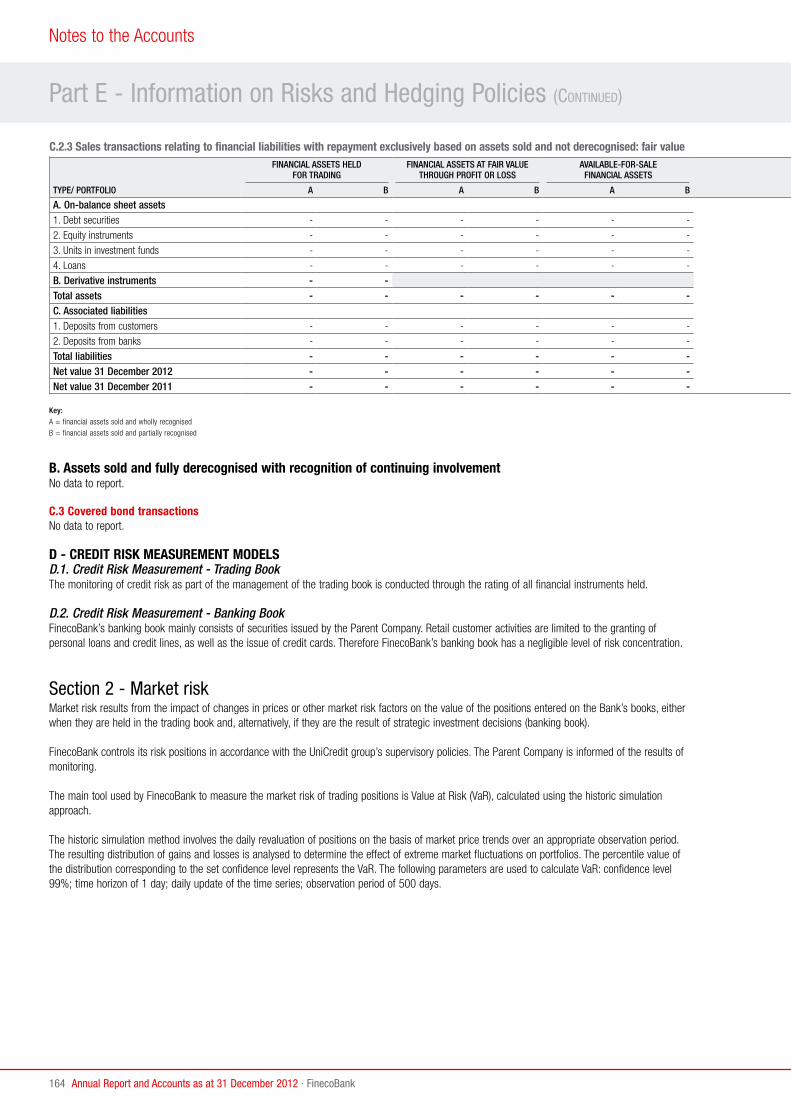
164
Part E - Information on Risks and Hedging Policies (Continued)
Notes to the Accounts
Annual Report and Accounts as at 31 December 2012 · FinecoBank
C.2.3 Sales transactions relating to financial liabilities with repayment exclusively based on assets sold and not derecognised: fair value
TYPE/ PORTFOLIO
FINANCIAL ASSETS HELD FOR TRADING
FINANCIAL ASSETS AT FAIR VALUE THROUGH PROFIT OR LOSS
AVAILABLE-FOR-SALE FINANCIAL ASSETS
HELD-TO-MATURITY INVESTMENTS (FAIR VALUE)
LOANS AND RECEIVABLES WITH BANKS (FAIR VALUE)
LOANS AND RECEIVABLES WITH CUSTOMERS (FAIR VALUE) TOTAL
A B A B A B A B A B A B 12.31.2012 12.31.2011
A. On-balance sheet assets1. Debt securities - - - - - - - - 255,116 - - - 255,116 869,889
2. Equity instruments - - - - - - - -
3. Units in investment funds - - - - - - - -
4. Loans - - - - - - - - - - - - - -
B. Derivative instruments - - - -Total assets - - - - - - - - 255,116 - - - 255,116 869,889C. Associated liabilities1. Deposits from customers - - - - - - - - 258,827 - - - 258,827 1,008,351
2. Deposits from banks - - - - - - - - 291 - - - 291 -
Total liabilities - - - - - - - - 259,118 - - - 259,118 1,008,351Net value 31 December 2012 - - - - - - - - (4,002) - - - (4,002)Net value 31 December 2011 - - - - - - - - (138,462) - - - (138,462)
Key:A = financial assets sold and wholly recognisedB = financial assets sold and partially recognised
B. Assets sold and fully derecognised with recognition of continuing involvementNo data to report.
C.3 Covered bond transactionsNo data to report.
D - CREDIT RISK MEASUREMENT MODELSD.1. Credit Risk Measurement - Trading BookThe monitoring of credit risk as part of the management of the trading book is conducted through the rating of all financial instruments held.
D.2. Credit Risk Measurement - Banking BookFinecoBank’s banking book mainly consists of securities issued by the Parent Company. Retail customer activities are limited to the granting of personal loans and credit lines, as well as the issue of credit cards. Therefore FinecoBank’s banking book has a negligible level of risk concentration.
Section 2 - Market riskMarket risk results from the impact of changes in prices or other market risk factors on the value of the positions entered on the Bank’s books, either when they are held in the trading book and, alternatively, if they are the result of strategic investment decisions (banking book).
FinecoBank controls its risk positions in accordance with the UniCredit group’s supervisory policies. The Parent Company is informed of the results of monitoring.
The main tool used by FinecoBank to measure the market risk of trading positions is Value at Risk (VaR), calculated using the historic simulation approach.
The historic simulation method involves the daily revaluation of positions on the basis of market price trends over an appropriate observation period. The resulting distribution of gains and losses is analysed to determine the effect of extreme market fluctuations on portfolios. The percentile value of the distribution corresponding to the set confidence level represents the VaR. The following parameters are used to calculate VaR: confidence level 99%; time horizon of 1 day; daily update of the time series; observation period of 500 days.

165FinecoBank · Annual Report and Accounts as at 31 December 2012
C.2.3 Sales transactions relating to financial liabilities with repayment exclusively based on assets sold and not derecognised: fair value
TYPE/ PORTFOLIO
FINANCIAL ASSETS HELD FOR TRADING
FINANCIAL ASSETS AT FAIR VALUE THROUGH PROFIT OR LOSS
AVAILABLE-FOR-SALE FINANCIAL ASSETS
HELD-TO-MATURITY INVESTMENTS (FAIR VALUE)
LOANS AND RECEIVABLES WITH BANKS (FAIR VALUE)
LOANS AND RECEIVABLES WITH CUSTOMERS (FAIR VALUE) TOTAL
A B A B A B A B A B A B 12.31.2012 12.31.2011
A. On-balance sheet assets1. Debt securities - - - - - - - - 255,116 - - - 255,116 869,889
2. Equity instruments - - - - - - - -
3. Units in investment funds - - - - - - - -
4. Loans - - - - - - - - - - - - - -
B. Derivative instruments - - - -Total assets - - - - - - - - 255,116 - - - 255,116 869,889C. Associated liabilities1. Deposits from customers - - - - - - - - 258,827 - - - 258,827 1,008,351
2. Deposits from banks - - - - - - - - 291 - - - 291 -
Total liabilities - - - - - - - - 259,118 - - - 259,118 1,008,351Net value 31 December 2012 - - - - - - - - (4,002) - - - (4,002)Net value 31 December 2011 - - - - - - - - (138,462) - - - (138,462)
Key:A = financial assets sold and wholly recognisedB = financial assets sold and partially recognised
2.1 Interest rate risk and price risk - regulatory trading book
QUALITATIVE INFORMATION
A. General aspectsThe “trading book” is used to hold debt securities (ordinary and subordinated, structured and plain vanilla), equity instruments, and listed certificates that are not related to brokerage activities with retail customers.The Bank aims to protect itself against interest rate risk potentially arising from the trading book by entering into listed derivative contracts.Although the share component of the trading book is negligible, listed derivative instruments are also used to hedge equity risk inherent in positions.
B. Processes for managing and methods for measuring interest rate risk and price riskRisk MeasurementMarket risk measurement involves establishing indicative measurements of the risks resulting from investments in financial instruments.
The exposure to market risks associated with the management of the Bank’s trading book is measured and monitored using the results of the VaR model.
With regard to interest rate risk factors in particular, the VaR Interest Rate indicator is calculated to measure the maximum potential loss attributable to adverse changes in the structure of interest rates.
With regard to price risk, the Equity VaR is calculated, which measures the maximum loss attributable to changes in the prices of equity instruments and hedging derivatives present in the portfolio.
Risk controlSecond level interest rate and price risk are controlled continuously by Risk Management in collaboration with the Parent Company to verify that the operating thresholds set in terms of maximum permitted loss are respected (VaR Value at Risk).

166
Part E - Information on Risks and Hedging Policies (Continued)
Notes to the Accounts
Annual Report and Accounts as at 31 December 2012 · FinecoBank
QUANTITATIVE INFORMATION
1. Regulatory trading book: distribution by maturity (repricing date) of on-balance sheet financial assets and liabilities and financial derivatives - Currency: Euro
TYPE/UNEXPIRED TERM ON DEMANDUP TO 3
MONTHS
BETWEEN 3 AND 6
MONTHS
BETWEEN 6 MONTHS
AND 1 YEARBETWEEN 1
AND 5 YEARSBETWEEN 5
AND 10 YEARSOVER
10 YEARSINDEFINITE DURATION
1. On-balance sheet assets 1.1 Debt securities
- with early redemption option - - - - - - - -
- other 22 128 105 20 2 1 5 -
1.2 Other assets - - - - - - - -
2. On-balance sheet liabilities 2.1 Repos - - - - - - - -
2.2 Other liabilities - - - - - - - -
3. Financial derivatives 3.1 With underlying security
- Options
+ Long positions - - - - - - - -
+ Short positions - - - - - - - -
- Other derivatives
+ Long positions - 286,472 - 19 17 47 179 -
+ Short positions - 285,691 31 19 22 47 172 -
3.2 Without underlying security
- Options
+ Long positions - - - - - - - -
+ Short positions - - - - - - - -
- Other derivatives
+ Long positions - 833,060 - - - - - -
+ Short positions - 795,855 - - - - - -
Currency: US dollar
TYPE/UNEXPIRED TERM ON DEMANDUP TO 3
MONTHS
BETWEEN 3 AND 6
MONTHS
BETWEEN 6 MONTHS
AND 1 YEARBETWEEN 1
AND 5 YEARSBETWEEN 5
AND 10 YEARSOVER
10 YEARSINDEFINITE DURATION
1. On-balance sheet assets 1.1 Debt securities
- with early redemption option - - - - - - - -
- other - - - - - - 1 -
1.2 Other assets - - - - - - - -
2. On-balance sheet liabilities 2.1 Repos - - - - - - - -
2.2 Other liabilities - - - - - - - -
3. Financial derivatives 3.1 With underlying security
- Options
+ Long positions - - - - - - - -
+ Short positions - - - - - - - -
- Other derivatives
+ Long positions - 83,345 - - - - - -
+ Short positions - 83,287 - - - - - -
3.2 Without underlying security
- Options
+ Long positions - - - - - - - -
+ Short positions - - - - - - - -
- Other derivatives
+ Long positions - 519,211 - - - - - -
+ Short positions - 536,805 - - - - - -

167FinecoBank · Annual Report and Accounts as at 31 December 2012
Currency: other currencies
TYPE/UNEXPIRED TERM ON DEMANDUP TO 3
MONTHS
BETWEEN 3 AND 6
MONTHS
BETWEEN 6 MONTHS
AND 1 YEARBETWEEN 1
AND 5 YEARSBETWEEN 5
AND 10 YEARSOVER
10 YEARSINDEFINITE DURATION
1. On-balance sheet assets 1.1 Debt securities
- with early redemption option - - - - - - - -
- other - - - - - - - -
1.2 Other assets - - - - - - - -
2. On-balance sheet liabilities 2.1 Repos - - - - - - - -
2.2 Other liabilities - - - - - - - -
3. Financial derivatives 3.1 With underlying security
- Options
+ Long positions - - - - - - - -
+ Short positions - - - - - - - -
- Other derivatives
+ Long positions - 44 - - 43 - - -
+ Short positions - 44 - - 43 - - -
3.2 Without underlying security
- Options
+ Long positions - - - - - - - -
+ Short positions - - - - - - - -
- Other derivatives
+ Long positions - 791,999 - - - - - -
+ Short positions - 811,914 - - - - - -
2. Regulatory trading book: distribution of exposures in equity instruments and share indices for the main stock market countries
TYPE OF TRANSACTION/LISTING INDEX
LISTED
UNLISTEDUSA NETHERLANDS ITALY CANADA LUXEMBOURG OTHER
A. Equity instruments - Long positions 144 - 1 - - 214 9
- Short positions - - - - - - 6
B. Unsettled transactions on equity instruments
- Long positions 83.762 4.132 277.677 2.254 1.777 619 6
- Short positions 83.789 4.132 278.199 2.254 1.777 826 -
C. Other derivatives on equity instruments
- Long positions - - 1 - - - -
- Short positions - - - - - - -
D. Derivatives on share indices
- Long positions - - - - - - -
- Short positions - - - - - - -
3. Regulatory trading book: internal models and other methods of sensitivity analysisFinecoBank monitors the VaR of the Trading Book daily.As at 31 December 2012, the daily VaR of Trading Book was €36 thousand, and the items contributing to it were: the Interest Rate VaR, amounting to €0.1 thousand, the Equity VaR of €4.2 thousand, and the Forex VaR of €39.8 thousand.
Daily VaR - trading book
31 DECEMBER 2012
2012
AVERAGE MAXIMUM MINIMUM
FinecoBank S.p.A. 36 58 195 5

168
Part E - Information on Risks and Hedging Policies (Continued)
Notes to the Accounts
Annual Report and Accounts as at 31 December 2012 · FinecoBank
2.2 Interest rate risk and price risk - banking book
QUALITATIVE INFORMATION
A. General aspects, management processes and measurement methods for interest rate risk and price riskA. General aspectsThe banking book highlights the interest rate and liquidity risks generated by deposit and loan transactions that are part of the Bank’s normal business activities.To manage these risks, on a daily basis, the Risk Management office uses the Asset Liability and Management system provided by the Parent Company.The objectives and the strategies underlying the management of the banking book aim to optimise and maximise the economic contribution made by the Bank’s normal business activities over time, in line with the limits and the centralised policies established in the Group’s business plan.
A.2.1 Organisational aspectsIn line with the strategic risk management process established by the Parent Company’s Board of Directors, the interest rate risk profile is managed at consolidated level in order to exploit the natural diversification existing between the deposit and loan positions of the various subsidiary banks.
Risk AssumptionThe exposure thresholds relating to structural interest rate risk are established, within a pre-set time horizon and considering the business activities of the Bank, on the basis of the maximum exposure permitted in relation to the structural interest rate risk, in terms of the variation of the net interest margin/risk capital to the permitted variance with respect to the above-mentioned exposure.
Risk controlSecond level interest rate and price risk are controlled continuously by Risk Management in collaboration with the Parent Company to verify that the operating thresholds set in terms of maximum permitted loss are respected (VaR Value at Risk) and to verify the income effects of changes in the net interest margin (current profits) or on equity (economic value).
A.2.2 Methodological aspectsThe ALM (Asset&Liability Management) system used by the Bank measures its exposure to structural interest rate risk. Exposure to interest rate risk is estimated periodically, using a gap analysis approach, from a short-term perspective, using a scenario of interest rate curve shift of +/- 100 basis points and according to the economic value of shareholders’ equity approach, from a medium-long term perspective, using a scenario of interest rate change of + 200 basis points.
A.2.2.1 Methodological aspects - Gap analysisThe approach based on current profits (gap analysis) envisages making a deterministic estimate of the impact of a change in interest rates on the Bank’s risk-sensitive asset and liability items (with maturities equal to the repricing date within specific time buckets). The methods used are the “incremental gap”, “incremental beta gap” and “shifted beta gap”.The Bank’s exposure to a change of +/- 100 basis points in the interest rate is measured, as illustrated above, considering the repricing date of the asset and liability items sensitive to interest rate risk.
A.2.2.2 Methodological aspects - Economic value of Shareholders’ equityThe approach based on the economic value of shareholders’ equity (duration gap and sensitivity analysis) envisages estimating the impact of a change of +1 basis point and +/- 200 basis points in the interest rate on the market value of shareholders’ equity.
A.2.2.3 Methodological aspects - Economic value of Shareholders’ equity using VaRIn addition to the deterministic approach of the shock of +/- 200 basis points (or + 1 basis point) described in the paragraph above and based on Basel Committee regulations, FinecoBank also uses a VaR model to measure the changes in the economic value of shareholders’ equity.
The maximum potential loss is measured in terms of VaR, namely the maximum loss, that with a probability of 99% can be triggered by a portfolio, on the basis of changes in prices that are sensitive to changes in interest rates and with reference to a holding period of one day. In other words, the VaR is determined by the sensitivity of the value of the asset and liability items to changes in one basis point of interest rates (sensitivity), multiplied by the observed volatility, on a time series of 500 observations of market interest rates, eliminating the last percentile.
The choice to maintain the VaR calculation for a time horizon of one day permits a more accurate control of risk.
B. Fair value hedging activitiesThe specific purpose of the hedges set in place is to maintain the risk of maximum loss within the set thresholds, considering the Bank’s entire portfolio of fixed-rate interest-bearing assets and liabilities.

169FinecoBank · Annual Report and Accounts as at 31 December 2012
The portfolio of “derivative contracts to hedge risk” holds the derivative instruments used by the Bank, mainly IRS (Interest Rate Swaps), with the aim of mitigating or eliminating the interest rate risk of the banking book to which the protected asset positions are exposed.
These are “macro-hedging” portfolio transactions, the objective of which is to reduce the variability of the economic value of financial assets and liabilities with fixed interest rates.
In particular, as at 31 December 2012, derivative positions were in place to hedge the fixed-rate personal loan portfolio. Furthermore, the effects of several asset swap hedges on instruments issued by UniCredit and on bond loans issued by FinecoBank were recognised (having verified the effectiveness of the hedge, the securities and the related swaps were recorded in the banking book).
C. Cash flow hedging activityThere are currently no cash flow hedges generated by FinecoBank business operations.
QUANTITATIVE INFORMATION
1. Banking book: distribution by maturity (repricing date) of financial assets and liabilities - Currency: Euro
TYPE/UNEXPIRED TERMON
DEMANDUP TO 3
MONTHS
BETWEEN 3 AND 6
MONTHS
BETWEEN 6 MONTHS
AND 1 YEAR
BETWEEN 1 AND 5
YEARS
BETWEEN 5 AND 10
YEARSOVER 10
YEARSINDEFINITE DURATION
1. On-balance sheet assets 1.1 Debt securities - with early redemption option - - - - - - - - - other 10,167 18,347 1,534,777 1,156,249 1,500,000 - - - 1.2 Loans to banks 8,133,578 1,178,174 981,459 1,873,406 522,906 - - - 1.3 Loans to customers - current accounts 66,386 31 62 319 1,485 - - - - other loans - with early redemption option 3,003 18,185 15,630 25,023 71,161 4,147 - - - other 26,907 300,195 88 322 2,791 42 118 - 2. On-balance sheet liabilities 2.1 Deposits from customers - current accounts 9,198,294 - - - - - - - - other payables - with early redemption option - - - - - - - - - other 59,746 752,458 439,210 904,649 543,317 - - - 2.2 Deposits from banks - current accounts 39,205 - - - - - - - - other payables 121 452,537 684,602 888,263 - - - - 2.3 Debt securities - with early redemption option - - - - - - - - - other - - 1,500,000 - 1,500,000 - - - 2.4 Other liabilities - with early redemption option - - - - - - - - - other - - - - - - - - 3. Financial derivatives 3.1 With underlying security - Options + Long positions - - - - - - - - + Short positions - - - - - - - - - Other derivatives + Long positions - - - - - - - - + Short positions - - - - - - - - 3.2 Without underlying security - Options + Long positions - - - - - - - - + Short positions - - - - - - - - - Other derivatives + Long positions - 4,237,683 1,500,000 - 1,500,061 - - - + Short positions - 3,006,923 1,506,236 1,164,217 1,560,368 - - - 4. Other off-balance sheet
transactions + Long positions - - - - - - - - + Short positions - - - - - - - -

170
Part E - Information on Risks and Hedging Policies (Continued)
Notes to the Accounts
Annual Report and Accounts as at 31 December 2012 · FinecoBank
Currency: US dollar
TYPE/UNEXPIRED TERMON
DEMANDUP TO 3
MONTHS
BETWEEN 3 AND 6
MONTHS
BETWEEN 6 MONTHS
AND 1 YEAR
BETWEEN 1 AND 5
YEARS
BETWEEN 5 AND 10
YEARSOVER 10
YEARSINDEFINITE DURATION
1. On-balance sheet assets 1.1 Debt securities - with early redemption option - - - - - - - - - other - - 75,792 - - - - - 1.2 Loans to banks 283,004 11,374 - 343 - - - - 1.3 Loans to customers - current accounts 395 - - - - - - - - other loans - with early redemption option - - - - - - - - - other 387 14,610 252 216 38 - - - 2. On-balance sheet liabilities 2.1 Deposits from customers - current accounts 281,670 - - - - - - - - other payables - with early redemption option - - - - - - - - - other 3,774 7,656 4,943 4,684 - - - - 2.2 Deposits from banks - current accounts - - - - - - - - - other payables 2 - - 225 - - - - 2.3 Debt securities - with early redemption option - - - - - - - - - other - - 75,792 - - - - - 2.4 Other liabilities - with early redemption option - - - - - - - - - other - - - - - - - - 3. Financial derivatives 3.1 With underlying security - Options + Long positions - - - - - - - - + Short positions - - - - - - - - - Other derivatives + Long positions - - - - - - - - + Short positions - - - - - - - - 3.2 Without underlying security - Options + Long positions - - - - - - - - + Short positions - - - - - - - - - Other derivatives + Long positions - 75,792 75,792 - - - - - + Short positions - 75,792 75,792 - - - - -4. Other off-balance sheet
transactions + Long positions - - - - - - - - + Short positions - - - - - - - -

171FinecoBank · Annual Report and Accounts as at 31 December 2012
Currency: other currencies
TYPE/UNEXPIRED TERMON
DEMANDUP TO 3
MONTHS
BETWEEN 3 AND 6
MONTHS
BETWEEN 6 MONTHS
AND 1 YEAR
BETWEEN 1 AND 5
YEARS
BETWEEN 5 AND 10
YEARSOVER 10
YEARSINDEFINITE DURATION
1. On-balance sheet assets 1.1 Debt securities - with early redemption option - - - - - - - - - other - - - - - - - - 1.2 Loans to banks 61,296 8 - 117 - - - - 1.3 Loans to customers - current accounts 5 - - - - - - - - other loans - with early redemption option - - - - - - - - - other 1,048 751 - - 6 - - - 2. On-balance sheet liabilities 2.1 Deposits from customers - current accounts 59,341 - - - - - - - - other payables - with early redemption option - - - - - - - - - other 9 322 - - - - - - 2.2 Deposits from banks - current accounts 198 - - - - - - - - other payables - - - - - - - - 2.3 Debt securities - with early redemption option - - - - - - - - - other - - - - - - - - 2.4 Other liabilities - with early redemption option - - - - - - - - - other - - - - - - - - 3. Financial derivatives 3.1 With underlying security - Options + Long positions - - - - - - - - + Short positions - - - - - - - - - Other derivatives + Long positions - - - - - - - - + Short positions - - - - - - - - 3.2 Without underlying security - Options + Long positions - - - - - - - - + Short positions - - - - - - - - - Other derivatives + Long positions - - - - - - - - + Short positions - - - - - - - - 4. Other off-balance sheet
transactions + Long positions - - - - - - - - + Short positions - - - - - - - -

172
Part E - Information on Risks and Hedging Policies (Continued)
Notes to the Accounts
Annual Report and Accounts as at 31 December 2012 · FinecoBank
2. Banking book: internal models and other methods of sensitivity analysisThe following table provides the results of the analyses conducted.
VALUE ANALYSIS (SHIFT + 100 BP)
VALUE ANALYSIS (SHIFT - 100 BP)
VALUE ANALYSIS (SHIFT + 200 BP)
VALUE ANALYSIS (SHIFT - 200 BP)
VALUE ANALYSIS (SHIFT + 1 BP) IRVAR*
14,052 -9,169 28,072 -40,218 147 1,369
* 1 day holding period, 99% confidence level%.
The sensitivity analysis on the net interest margin, which was conducted assuming a shift of + 100 basis points on the euro interest rate curve, highlighted an impact of €14,052 thousand as at 31 December 2012. A shift of –100 basis points showed an impact of - €9,169 thousand.The sensitivity analysis on the value of shareholders’ equity, which was conducted assuming a shift of + 200 basis points on the euro interest rate curve, showed an impact of €28,072 thousand. A shift of - 200 basis point showed an impact of - €40,218 thousand.The sensitivity analysis on the value of shareholders’ equity, which was conducted assuming a shift of + 1, showed an overall impact of €147 thousand.The interest rate VaR figure for FinecoBank came to approximately €1,369 thousand.
Daily VaR banking book
31 DECEMBER 2012
2012
AVERAGE MAXIMUM MINIMUM
FINECOBANK S.P.A 1,369 543 1,369 230
2.3 Exchange rate risk
QUALITATIVE INFORMATION
A. General aspects, management processes and measurement methods for exchange rate riskAs part of its treasury activities, FinecoBank collects deposits in foreign currencies, mainly in US dollars, through customer current account overdrafts and reverse repos, using the funds collected in current accounts and by entering into time deposits in the same currency with the Parent Company.The impact on the value of balance sheet items is estimated using the Forex VaR indicator.
B. Exchange rate risk hedgingExchange rate risk is hedged through the matching of assets and liabilities denominated in currency or through spot transactions in foreign currencies. The component of exchange rate risk that contributes to the formation of the overall VaR is usually tied to the temporal mismatch between assets and liabilities in US dollars.

173FinecoBank · Annual Report and Accounts as at 31 December 2012
QUANTITATIVE INFORMATION
1. Breakdown of assets, liabilities and derivatives by currency of denomination
ITEMS
CURRENCIES
US DOLLAR
POUND STERLING
SWISS FRANC YEN
CANADIAN DOLLAR
OTHER CURRENCIES
A. Financial assets 386,558 27,661 32,009 114 643 2,811 A.1 Debt securities 75,793 - - - - -
A.2 Equity instruments 145 3 - 4 - -
A.3 Loans to banks 294,721 26,925 31,374 50 361 2,711
A.4 Loans to customers 15,899 733 635 60 282 100
A.5 Other financial assets - - - - - -
B. Other assets 512 77 - - - 1C. Financial liabilities 378,752 27,389 31,814 28 445 194 C.1 Deposits from banks 227 - - 28 - 170
C.2 Deposits from customers 302,733 27,389 31,814 - 445 24
C.3 Debt securities 75,792 - - - - -
C.4 Other financial liabilities - - - - - -
D. Other liabilities 205 83 - - - 159E. Financial derivatives - Options
+ Long positions - - - - - -
+ Short positions - - - - - -
- Other derivatives
+ Long positions 519,211 62,694 122,934 387,313 14,992 204,065
+ Short positions 536,805 64,992 114,234 415,927 12,975 203,786
Total assets 906,281 90,432 154,943 387,427 15,635 206,877Total liabilities 915,762 92,464 146,048 415,955 13,420 204,139Imbalance (9,481) (2,032) 8,895 (28,528) 2,215 2,738
2. Internal models and other methods of sensitivity analysisAs at 31 December 2012, the daily Forex VaR of the overall portfolio (banking and trading books) was approximately €144 thousand.

174
Part E - Information on Risks and Hedging Policies (Continued)
Notes to the Accounts
Annual Report and Accounts as at 31 December 2012 · FinecoBank
2.4 Derivative instruments
A. Financial derivativesA.1 Regulatory trading book: period-end and average notional amounts
UNDERLYING ASSET/TYPE OF DERIVATIVE
TOTAL 12.31.2012 TOTAL 12.31.2011
OVER THE COUNTER
CENTRAL COUNTER-PARTIES
OVER THE COUNTER
CENTRAL COUNTER-PARTIES
1. Debt securities and interest rate indexes a) Options - - - -
b) Swaps - - - -
c) Forwards - - - -
d) Futures - - - 220
e) Other - - - -
2. Equity instruments and share indices a) Options - - - -
b) Swaps - - - -
c) Forwards - - - -
d) Futures - - - 53
e) Other - 5 - 148
3. Currencies and gold a) Options - - - -
b) Swaps - - - -
c) Forwards - - - -
d) Futures - - - -
e) Other - - - -
4. Commodities - - - -5. Other underlying assets - - - -Total - 5 - 421Average amounts 33 213 3 505
A.2 Banking book: period-end and average notional amountsA.2.1 Hedging instruments
UNDERLYING ASSET/TYPE OF DERIVATIVE
TOTAL 12.31.2012 TOTAL 12.31.2011
OVER THE COUNTER
CENTRAL COUNTER-PARTIES
OVER THE COUNTER
CENTRAL COUNTER-PARTIES
1. Debt securities and interest rate indexes a) Options - - - -
b) Swaps 7,389,267 - 10,734,241 -
c) Forwards - - - -
d) Futures - - - -
e) Other - - - -
2. Equity instruments and share indices a) Options - - - -
b) Swaps - - - -
c) Forwards - - - -
d) Futures - - - -
e) Other - - - -
3. Currencies and gold a) Options - - - -
b) Swaps - - - -
c) Forwards - - - -
d) Futures - - - -
e) Other - - - -
4. Commodities - - - -5. Other underlying assets - - - -Total 7,389,267 - 10,734,241 -Average amounts 7,518,647 - 3,453,032 -
A.2.2 Other derivativesNo data to report.

175FinecoBank · Annual Report and Accounts as at 31 December 2012
A.3 Financial derivatives: gross positive fair value - breakdown by product
TRANSACTION TYPES/UNDERLYINGS
POSITIVE FAIR VALUE
12.31.2012 12.31.2011OVER THE COUNTER
CENTRAL COUNTER-PARTIES
OVER THE COUNTER
CENTRAL COUNTER-PARTIES
A. Regulatory trading book a) Options - - - - b) Interest rate swaps - - - - c) Cross currency swaps - - - - d) Equity swaps - - - - e) Forwards - - - - f) Futures - - - - g) Other - 1 - 1B. Banking book - hedges a) Options - - - - b) Interest rate swaps 190,573 - 329,933 - c) Cross currency swaps - - - - d) Equity swaps - - - - e) Forwards - - - - f) Futures - - - - g) Other - - - -C. Banking book - other derivatives a) Options - - - - b) Interest rate swaps - - - - c) Cross currency swaps - - - - d) Equity swaps - - - - e) Forwards - - - - f) Futures - - - - g) Other - - - -Total 190,573 1 329,933 1
A.4 Financial derivatives: negative fair value - breakdown by product
TRANSACTION TYPES/UNDERLYINGS
POSITIVE FAIR VALUE
12.31.2012 12.31.2011OVER THE COUNTER
CENTRAL COUNTER-PARTIES
OVER THE COUNTER
CENTRAL COUNTER-PARTIES
A. Regulatory trading book a) Options - - - - b) Interest rate swaps - - - - c) Cross currency swaps - - - - d) Equity swaps - - - - e) Forwards - - - - f) Futures - - - 1 g) Other - - - -B. Banking book - hedges a) Options - - - - b) Interest rate swaps 213,885 - 370,770 - c) Cross currency swaps - - - - d) Equity swaps - - - - e) Forwards - - - - f) Futures - - - - g) Other - - - -C. Banking book - other derivatives a) Options - - - - b) Interest rate swaps - - - - c) Cross currency swaps - - - - d) Equity swaps - - - - e) Forwards - - - - f) Futures - - - - g) Other - - - -Total 213,885 - 370,770 1

176
Part E - Information on Risks and Hedging Policies (Continued)
Notes to the Accounts
Annual Report and Accounts as at 31 December 2012 · FinecoBank
A.5 Over the counter financial derivatives - regulatory trading book: notional values, positive and negative gross fair values by counterparty - contracts not covered by clearing agreementsNo data to report.
A.6 Over the counter financial derivatives - regulatory trading book: notional values, positive and negative gross fair values by counterparty - contracts not covered by clearing agreementsNo data to report.
A.7 Over the counter financial derivatives - banking book: notional values, positive and negative gross fair values by counterparty - contracts not covered by clearing agreements
CONTRACTS INCLUDED IN NETTING AGREEMENT
GOVERNMENTS AND CENTRAL
BANKSOTHER PUBLIC
ENTITIES BANKSFINANCIAL
COMPANIESINSURANCE COMPANIES
NON-FINANCIAL COMPANIES
OTHER ENTITIES
1. Debt securities and interest rate indexes - notional value - - 7,389,267 - - - -
- positive fair value - - 190,573 - - - -
- negative fair value - - 213,885 - - - -
- future exposure - - 302 - - - -
2. Equity instruments and share indices - notional value - - - - - - -
- positive fair value - - - - - - -
- negative fair value - - - - - - -
- future exposure - - - - - - -
3. Currencies and gold - notional value - - - - - - -
- positive fair value - - - - - - -
- negative fair value - - - - - - -
- future exposure - - - - - - -
4. Other instruments - notional value - - - - - - -
- positive fair value - - - - - - -
- negative fair value - - - - - - -
- future exposure - - - - - - -
A.8 Over the counter financial derivatives - banking book: notional values, positive and negative gross fair values by counterparty - contracts not covered by clearing agreementsNo data to report.
A.9 Residual life of over-the-counter financial derivatives: notional values
UNDERLYING/UNEXPIRED TERMUP TO
1 YEARBETWEEN 1
AND 5 YEARSOVER
5 YEARS TOTAL
A. Regulatory trading book A.1 Financial derivatives on debt securities and interest rates - - - -
A.2 Financial derivatives on equity instruments and share indices - - - -
A.3 Financial derivatives on exchange rates and gold - - - -
A.4 Financial derivatives on other instruments - - - -
B. Banking book B.1 Financial derivative contracts on debt securities
and interest rates 177,315 7,211,952 - 7,389,267
B.2 Financial derivatives on equity instruments and share indices - - - -
B.3 Financial derivatives on exchange rates and gold - - - -
B.4 Financial derivatives on other instruments - - - -
Total 31 December 2012 177,315 7,211,952 - 7,389,267Total 31 December 2011 341,986 10,092,255 300,000 10,734,241
A.10 Over the counter financial derivatives: Counterparty risk/financial risk - Internal modelsNo data to report.
B. Credit derivativesNo data to report.

177FinecoBank · Annual Report and Accounts as at 31 December 2012
C. Financial and credit derivatives
C.1 Over the counter financial and credit derivatives: net fair values and future exposures by counterpartyNo data to report.
Section 3 - Liquidity Risk
QUALITATIVE INFORMATION
A. General aspects, management processes and measurement methods for liquidity riskLiquidity risk can be broken down into:• Liquidity Mismatch Risk, namely the risk that amounts and/or the timing of incoming and outgoing flows do not match;• Liquidity Contingency Risk, namely the risk that unexpected future events could require an amount of liquidity above that envisaged as necessary by
the Bank. This risk may be generated by events such as the non-repayment of loans, the need to fund new assets or to obtain new loans in times of liquidity crisis;
• Market Liquidity Risk, namely the risk of FinecoBank incurring losses on the disposal of liquid assets to cover liquidity crises caused by systemic factors or by factors specific to the bank.
The UniCredit group manages liquidity risk at centralised level and on a consolidated basis, in line with the regulations of the local Supervisory Authorities and with business requirements. The Bank is responsible for the correct implementation and observation of liquidity policies within the guidelines issued by the Parent Company, adjusting the net of its cash flows and transferring the surplus/shortfall to the Parent Company on a daily basis.
The Liquidity Policy issued by the Parent Company illustrates the methods used to manage the quantitative assets of liquidity risk and the quantification of the levels to be observed.The primary goal of the Liquidity Policy is to observe short-term liquidity levels (operating liquidity) so that the bank is able to meet its ordinary/extraordinary payment commitments.
Risk MeasurementLiquidity risk, meaning the availability of the cash resources needed to cover financial outlays, is measured by means of the liquidity gap, given by the difference between liquid assets and variable sources. In addition to the liquidity risk as defined above, the costs to adjust the liquidity deficit are calculated. The classification criteria of balance sheet items for the construction of the gap is based on distinguishing between sensitive assets and liabilities, taking into account both the effective maturity of the asset or liability and the possibility of converting it into cash if needed. In estimating the net liquidity position, the level of effective liquidity of individual balance sheet items is analysed in order to determine, on a continual basis, the deficit and surplus profile resulting from the offsetting of cash inflows and outflows. Calculating the aggregate figure for net liquid assets (liquidity gap) and, therefore, correctly identifying and quantifying liquid assets and variable sources, must be carried out based on:• the present value of net interbank exposure;• the present value of securities held and their respective contractual maturities;• the value of loans and property, plant and equipment;• the residual effective maturity of each balance-sheet item, as well as the time profile of the cash flows generated by them;• the sensitivity of demand items to changes in financial values able to influence the trend (interest rates);• forecasts on the trends of the above financial values, as well as their volatility in a given reference time horizon.
The measurement of liquidity risk is carried out both from a static perspective (aimed at identifying the effective liquidity tensions related to the characteristics of balance sheet items, through the construction, for each time period identified, of the corresponding gap indicator), and from a dynamic perspective (through estimating techniques and simulations, aimed at defining the most likely scenarios following changes in the financial values capable of influencing the time profile of liquidity).
Risk controlRisk control is carried out by the Parent Company to verify compliance with the limits set for variances in assets and liabilities. All data is provided by the ALMPro (Asset Liability Management - Prometeia) application through a report that summarises the Bank’s overall position and highlights any structural deficit, with details of the reference bucket as well as the structural surplus.Based on the results of the report, the Parent Company identifies what action could be taken to “rebalance” the situation.
Methodological aspectsThe ALM (Asset&Liability Management) system used by the Bank measures both its exposure to interest rate risk and to liquidity risk.

178
Part E - Information on Risks and Hedging Policies (Continued)
Notes to the Accounts
Annual Report and Accounts as at 31 December 2012 · FinecoBank
QUANTITATIVE INFORMATION
1. Time breakdown by contractual residual maturity of financial assets and liabilities - Currency: Euro
ITEM/TIME BRACKETSON
DEMAND
BETWEEN 1 AND 7
DAYS
BETWEEN 7 AND
15 DAYS
BETWEEN 15 DAYS
AND 1 MONTH
BETWEEN 1 AND 3
MONTHS
BETWEEN 3 AND 6
MONTHS
BETWEEN 6 MONTHS
AND 1 YEAR
BETWEEN 1 AND 5
YEARSOVER 5 YEARS
INDEFINITE DURATION
On-balance sheet assetsA.1 Government securities 163 - - - 94 12,979 15,156 31,501 4 -
A.2 Debt securities 22 - 2 29 92 18,846 162,557 4,010,876 7 -
A.3 Units in investment funds - - - - - - - - - -
A.4 Loans
- Banks 8,133,578 97,200 21,231 133,433 815,986 994,775 1,912,300 515,000 - 113,788
- Customers 97,002 32,715 167,186 54,454 63,227 18,260 29,983 83,563 4,904 -
On-balance sheet liabilitiesB.1 Deposits and current
accounts
- Banks 39,205 - - - - - - - - -
- Customers 9,224,725 44,573 57,762 157,800 307,381 375,035 797,461 535,479 - -
B.2 Debt securities - - - - - 18,565 - 3,000,000 - -
B.3 Other liabilities 48,630 59,190 6,832 106,960 462,735 753,136 1,010,894 - - -
Off-balance sheet transactionsC.1 Financial derivatives
with exchange of capital
- Long positions - 1,119,288 - - - - 4 190 349 -
- Short positions - 1,081,273 - - - 31 4 225 344 -
C.2 Financial derivatives without exchange of capital
- Long positions - - - 636 30,920 14,550 69,877 - - -
- Short positions - - 85 - 30,323 11,932 75,587 - - -
C.3 Deposits and loans to be collected
- Long positions - - - - - - - - - -
- Short positions - - - - - - - - - -
C.4 Irrevocable commitments to lend funds
- Long positions - - - - - - - 61 - -
- Short positions - - - 61 - - - - - -
C.5 Financial guarantees given - - - - - - - - - -
C.6 Financial guarantees received - - - - - - - - - -
C.7 Credit derivatives with exchange of capital
- Long positions - - - - - - - - - -
- Short positions - - - - - - - - - -
C.8 Credit derivatives without exchange of capital
- Long positions - - - - - - - - - -
- Short positions - - - - - - - - - -

179FinecoBank · Annual Report and Accounts as at 31 December 2012
Currency: US dollar
ITEM/TIME BRACKETSON
DEMAND
BETWEEN 1 AND 7
DAYS
BETWEEN 7 AND
15 DAYS
BETWEEN 15 DAYS
AND 1 MONTH
BETWEEN 1 AND 3
MONTHS
BETWEEN 3 AND 6
MONTHS
BETWEEN 6 MONTHS
AND 1 YEAR
BETWEEN 1 AND 5
YEARSOVER 5 YEARS
INDEFINITE DURATION
On-balance sheet assetsA.1 Government securities - - - - - - - - 2 -
A.2 Debt securities - - - - - 1.325 - 75.792 - -
A.3 Units in investment funds 1 - - - - - - - - -
A.4 Loans
- Banks 283.004 - - - 11.398 - 343 - - -
- Customers 877 3.492 221 1.127 9.693 252 216 39 - -
On-balance sheet liabilitiesB.1 Deposits and current
accounts
- Banks - - - - - - - - - -
- Customers 281.670 - - - - - - - - -
B.2 Debt securities - - - - - 1.320 - 75.792 - -
B.3 Other liabilities 3.775 1.560 363 1.137 4.621 4.980 5.018 - - -
Off-balance sheet transactionsC.1 Financial derivatives
with exchange of capital
- Long positions - 602.555 - - - - - - - -
- Short positions - 620.092 - - - - - - - -
C.2 Financial derivatives without exchange of capital
- Long positions - - - - 1.555 68 3.528 - - -
- Short positions - - - - 1.519 111 3.510 - - -
C.3 Deposits and loans to be collected
- Long positions - - - - - - - - - -
- Short positions - - - - - - - - - -
C.4 Irrevocable commitments to lend funds
- Long positions - - - - - - - - - -
- Short positions - - - - - - - - - -
C.5 Financial guarantees given - - - - - - - - - -
C.6 Financial guarantees received - - - - - - - - - -
C.7 Credit derivatives with exchange of capital
- Long positions - - - - - - - - - -
- Short positions - - - - - - - - - -
C.8 Credit derivatives without exchange of capital
- Long positions - - - - - - - - - -
- Short positions - - - - - - - - - -

180
Part E - Information on Risks and Hedging Policies (Continued)
Notes to the Accounts
Annual Report and Accounts as at 31 December 2012 · FinecoBank
Currency: other currencies
ITEM/TIME BRACKETSON
DEMAND
BETWEEN 1 AND 7
DAYS
BETWEEN 7 AND
15 DAYS
BETWEEN 15 DAYS
AND 1 MONTH
BETWEEN 1 AND 3
MONTHS
BETWEEN 3 AND 6
MONTHS
BETWEEN 6 MONTHS
AND 1 YEAR
BETWEEN 1 AND 5
YEARSOVER 5 YEARS
INDEFINITE DURATION
On-balance sheet assetsA.1 Government securities - - - - - - - - 2 -
A.2 Debt securities - - - - - 1,325 - 75,792 - -
A.3 Units in investment funds 1 - - - - - - - - -
A.4 Loans
- Banks 283,004 - - - 11,398 - 343 - - -
- Customers 877 3,492 221 1,127 9,693 252 216 39 - -
On-balance sheet liabilitiesB.1 Deposits and current
accounts
- Banks - - - - - - - - - -
- Customers 281,670 - - - - - - - - -
B.2 Debt securities - - - - - 1,320 - 75,792 - -
B.3 Other liabilities 3,775 1,560 363 1,137 4,621 4,980 5,018 - - -
Off-balance sheet transactionsC.1 Financial derivatives
with exchange of capital
- Long positions - 602,555 - - - - - - - -
- Short positions - 620,092 - - - - - - - -
C.2 Financial derivatives without exchange of capital
- Long positions - - - - 1,555 68 3,528 - - -
- Short positions - - - - 1,519 111 3,510 - - -
C.3 Deposits and loans to be collected
- Long positions - - - - - - - - - -
- Short positions - - - - - - - - - -
C.4 Irrevocable commitments to lend funds
- Long positions - - - - - - - - - -
- Short positions - - - - - - - - - -
C.5 Financial guarantees given - - - - - - - - - -
C.6 Financial guarantees received - - - - - - - - - -
C.7 Credit derivatives with exchange of capital
- Long positions - - - - - - - - - -
- Short positions - - - - - - - - - -
C.8 Credit derivatives without exchange of capital
- Long positions - - - - - - - - - -
- Short positions - - - - - - - - - -

181FinecoBank · Annual Report and Accounts as at 31 December 2012
Section 4 - Operational risk
QUALITATIVE INFORMATIONA. General aspects, operational processes and methods for measuring operational riskA.1 Operational riskOperational risk is defined as the risk of losses due to errors, violations, interruptions, or damage caused by internal processes, personnel, systems or by external events. This definition includes legal and compliance risk, but not strategic and reputational risk.For example, losses arising from the following can be defined as operational: internal or external fraud, employment practices and workplace safety, customer claims, product distribution, fines and penalties for regulatory breaches, damage to the Company’s physical assets, business disruption and system failures, and management of processes.
A.2 Group operational risk frameworkThe recognition, measurement, control and management of operational risk are carried out according to the principles established by Basel II in the “New Basel agreement on Capital” and in line with the “New regulations for the prudential supervision of banks” (Bank of Italy Circular no. 263 of 27 December 2006 as amended), which incorporate instructions on international convergence for the measurement of capital and of capital ratios. These principles and provisions have been set out in the Group Framework for the management of operational risk and adopted in FinecoBank’s Operational Risk Manual approved by the Board of Directors. FinecoBank has obtained the approval of the Bank of Italy for the use of advanced approaches (AMA) to calculate its capital requirement for operational risk with effect from 30 June 2010.
A.3 Organisational StructureThe Strategic Direction Body is responsible for approving all aspects relating to the Group operational risk framework and verifying the adequacy of the measurement and control system and is regularly updated on changes to the risk profile and operational risk exposure, with support from the appropriate risk committees if required.In addition to the Strategic Direction Body, the corporate governance structure for operational risk consists of the Risks Committee - introduced from 24 June 2009 - which examines all risk issues submitted to it, and approves and validates the internal procedures and operating manuals for operational risk.The reports produced by Risk Management for the Risks Committee and for the Board of Directors ensure that management and the control bodies are constantly updated on the trend in operational risk within the Bank and can actively intervene in the management and mitigation of the risks. The Chief Risk Officer’s participation in the products committee ensures oversight of the operational risk associated with the Bank’s new business activities. The Operational Risk Management (ORM) team is part of the broader Risk Management office which reports to the Chief Risk Officer of FinecoBank who in turn reports directly to the Managing Director.The main activities carried out by the Risk Management office in terms of operational risk are:• recognition, classification, validation and reporting of operating losses with consequent identification of problem areas;• assessment of potential risks through scenario analyses and risk indicators (Key Risk Indicator-KRI);• monitoring and optimisation of the internal control system;• policies to mitigate and transfer risk through insurance cover;• development of an operational risk culture within the Bank;• generating reports for senior management on risk trends.
A.4 Internal validation processThe use of the Advanced Measurement Approach (AMA) to calculate regulatory capital requires the preparation of an annual report on the management and control system for operational risk by the Operational Risk team. This annual report contains a self-assessment of the system and a detailed examination of the governance structure, the process for collecting data on losses, the scenario analyses and internal control system, as well as the operational use of the measurement system.The report is submitted to the approval of the Board of Directors and is validated by the Internal Audit department and Group GIV (Group Internal Validation). For 2012, the Internal Audit department and Group GIV confirmed that the level of risk monitoring was good, as well as the adequacy of the existing management and control system.
A.5 Operational risk managementIn addition to the Risks Committee and the Product Committee, from September 2011, a Permanent Work Group (PWG) has been introduced whose members include the CRO, the Risk Manager and the Organisation function aimed at sharing their respective expertise in relation to the projects planned or in under way, new processes and products, or changes to them, and anything else that may affect the Bank’s risk profile. The PWG’s ultimate objective is to identify and then develop new mitigation measures.As part of the prevention of operational risk and to control sales channels remotely, the Risk Management office has focused on fraud prevention measures. The development of remote monitoring to prevent fraud has led to the creation of a system called System of Fraud Identification and Analysis (SoFIA). This system enables a larger amount of data and information on individual indicators to be analysed at the same time and enables possible irregularities to be detected on a daily basis through an alert system.In this way, all of the names put forward to be checked are assessed at the same time with regard to all remote indicators (30 indicators).On the basis of qualitative and quantitative assessments of these indicators, the relevant staff select any cases that need to be reported to the

182
Part E - Information on Risks and Hedging Policies (Continued)
Notes to the Accounts
Annual Report and Accounts as at 31 December 2012 · FinecoBank
Incidents and Controls O.U. for subsequent follow-up.In addition to fraud prevention activities, the Risk Management Office has developed a series of (“trend”) indicators through which it continues to provide information to the sales network both in terms of the compliance of the PFA network with regulations and as regards more strictly commercial matters.Moreover, the Operational Risk team is updated annually on the results of the tests conducted in accordance with the Business Continuity and Disaster Recovery plans.
A.5 Risk capital measurement and allocation mechanismOperational risk is measured internally by means of:• collecting data on losses;• monitoring Key Risk Indicators (KRI);• remote control of sales channels;• scenario analyses.
The collection and classification of operating losses is managed by a Group system called Application for Risk Gauging On line (ARGO).In addition to internal prevention and improvement, the information gathered is used to calculate Pillar I and II capital requirements.In terms of key risk indicators, there are currently 38 risk indicators split into nine control areas (Legal, Claims, Credit Cards, Back Office, PFA, IT systems, Payment Systems, Current Accounts, HR) which the Bank uses to measure its exposure to operational risk. If an indicator shows an irregular value, this may be related to changes in the exposure to operational risk. Scenario analyses enable FinecoBank’s exposure to operational risk, characterised by low frequency but high potential impact, to be estimated. The scenarios are identified by analysing internal losses, external events, risk indicator trends, critical processes, products and risk classes.
The inclusion of the data generated through scenario analyses and of the trend of risk indicators are a forward-looking element of the risk capital calculation model.
Data collection and control is managed at local level, while the management and maintenance of the model to calculate regulatory capital is centralised for all Legal Entities of the Group at the Parent Company.The risk capital for operational risk used for regulatory purposes as at 31 December 2012, calculated at a confidence level of 99.97%, amounts to €58,515 thousand. QUANTITATIVE INFORMATIONInternal operating loss data is the main component used to calculate capital requirements against operational risk. Loss analyses enable the ORM team to make assessments on FinecoBank’s exposure to operational risk and to identify any critical areas.As at 31 December 2012, operating losses recorded in the accounts amounted to €15 million. The breakdown of operating losses by the event types established in the New Basel II Agreement, which generated them, is shown below:
• Internal fraud: losses due to unauthorised activities, fraud, embezzlement or infringement of laws, regulations or company directives that involve at least one internal staff member of the bank or a resource hired under an agency contract.
• External fraud: losses owing to fraud, embezzlement or violation of laws by subjects external to the bank;
• Employment practices and workplace safety: losses due to actions not compliant with the law or to agreements regarding employment, health and safety, to the payment of compensation for bodily harm, or to cases of discrimination or non-application of equality conditions;
• Customers, products and professional practices: losses arising from non-fulfilment of professional obligations towards customers or from the nature or characteristics of the products or services provided;
• Damage from external events: losses arising from external events, including natural disasters, acts of terrorism and vandalism;• Business disruption and system failures: losses owing to business disruption and system failures or interruptions;• Process management, execution and delivery: losses due to deficiencies in the completion of transactions or management of processes, as well
as losses due to relations with commercial counterparties, vendors and suppliers.
Internal fraudExternal fraudBusiness disruption and system failuresEmployment practices and workplace safety
Customers, products and professional practicesProcess management, execution and deliveryDamage from external events
Breakdown of operating losses 2012 (mln)
-5.6
0.0 -0.1-1
-8.4
0.4
-0.6
-9-8-7-6-5-4-3-2-101

183FinecoBank · Annual Report and Accounts as at 31 December 2012
In 2012, the main sources of operating loss were related to Internal fraud and Customers, products and professional practices. Those events are attributable to provisions or losses expenses relating to complaints and legal action against the Bank associated with the behaviour of personal financial advisers and other company disputes. In particular, the disputed activities relate to the placement of products that were inappropriate to the customer’s risk profile and, in some cases, embezzlement.
Section 5 - Other risksAlthough the types of risk described above represent the main categories, there are, other types that FinecoBank considers important. As part of the provisions of the Second Pillar of Basel, FinecoBank - with the support of the Parent Company - has identified other types of risk in addition to the credit, market, operational and liquidity risk described above:• Business risk, which results from a fall in margins not due to market, credit or operational risk, but to changes in the competitive scenario or in
customer behaviour. More specifically, it focuses on future changes in margins and their impact on value and on the Group’s level of capitalisation;• Strategic risk, which depends on unexpected changes in the market or the failure to recognise trends underway in the banking industry, or
inappropriate assessments of those trends. It also considers the impact of decisions that are disadvantageous to long-term objectives and that can be difficult to reverse;
• Reputational risk, which represents the current or future risk of a fall in profits resulting from a negative perception of the Bank’s image by customers, counterparties, shareholders, investors or Supervisory Authorities.
FinecoBank has not included Real Estate Risk within the Bank’s scope of risk, because it does not hold significant positions in real estate, nor does it include Financial Investment Risk, as it does not possess large non-speculative financial investments in companies external to the Group.
Following the identification of the significant risks, the Parent Company establishes the best way to analyse them in qualitative and quantitative terms. The quantitative measurement is carried out by the Parent Company using data sent by FinecoBank and is used to calculate the Economic capital. Economic capital is the capital that the Bank has to hold to sustain the risks relating to its positions and assets and is calculated both for individual types of risk and for risks as a whole in line with the target rating established by the Group. More specifically, business risk, measured through economic capital, helps to address potential losses. Strategic and reputational risk, on the other hand, are measured through a qualitative approach.The multi-dimensional nature of risk means that the measurement of economic capital needs to be combined with stress testing, not only to estimate losses in some scenarios, but also to understand the impact of the causes determining the losses. Stress tests are conducted both on individual types of risk and on risks as a whole by simulating combined changes in risk factors, in order to support the estimate of aggregate economic capital. The estimate of the Stress test aggregate considers the amount of individual risks in stress scenarios and the lesser benefit of diversification in times of crisis.
ICAAP - Internal Capital Adequacy Assessment ProcessIn line with the provisions of Basel II, risk profiling is a fundamental element of the capital adequacy process. The Group approach to assessing capital adequacy involves five stages: • Risk Governance; • Defining the scope and identifying the risks; • Assessing the risk profile;• Defining risk appetite and capital allocation; • Monitoring and reporting.
The governance underlying the capital adequacy process has two levels: • within each Legal Entity; • in relations between each Legal Entity and the Parent Company.
The capital adequacy process is of fundamental importance within the Group and therefore requires an adequate system of risk governance to ensure the involvement of Senior Management and the appropriate allocation of ICAAP activities to organisational functions.In practice, the Board of Directors is ultimately responsible, as the capital adequacy process entails determining risk appetite and defining guidelines for the correct allocation of available capital resources.Senior Management identifies the principal bodies/structures that will be part of the process and takes decisions on the reporting to the competent decision-making body.UniCredit guidelines establish that medium-sized companies belonging to the Group - such as FinecoBank - must measure their risk profiles through internal capital. Internal capital is equal to the sum of the economic capital relating to the risks described net of the benefits of diversification plus a cushion that takes into account the variability of the economic cycle and the risk model, in terms of data quality and model accuracy.

184
Part E - Information on Risks and Hedging Policies (Continued)
Notes to the Accounts
Annual Report and Accounts as at 31 December 2012 · FinecoBank
The capital planning process regards the allocation of capital to achieve value-creation objectives on the basis of the risk appetite. Risk appetite can be defined as the variance, in terms of both short-term and long-term results, that Senior Management is willing to accept to sustain a specific strategy.With regard to adopting UniCredit policies, FinecoBank uses a reference framework made up of three areas:• capital adequacy;• profitability and risk;• liquidity and funding.
Capital adequacy is meant as a balance between capital and risks undertaken, with a view to both the First and Second Pillar, where it is measured respectively by the Core Tier 1 Ratio, Total Capital Ratio and Risk Taking Capacity. The latter is the ratio of available financial resources (AFR) to internal capital.AFR are the resources that can be used to safeguard the bank from insolvency. These resources must be committed and defined on a contractual basis, so that they can be relied upon in times of crisis. As losses impact AFR, the AFR can also be defined as the amount of losses that can be absorbed before the Bank becomes insolvent.The measurements of internal economic capital and the consequent Risk Taking Capacity indicate an adequate level of capitalisation of the Bank. Internal capital is lastly calculated at consolidated level based on the divisional structure, a cornerstone of the Group’s business strategy.
Stress testing on risks is supplemented with a view to capital adequacy by considering the impact of the scenario on available capital, therefore providing an idea of the Group’s ability to withstand further losses in conditions of stress.Risk appetite and the objectives set are monitored and reports are generated on them as part of the governance for the process.

185FinecoBank · Annual Report and Accounts as at 31 December 2012
Section 1 - Bank’s shareholders’ equity 186Section 2 - Regulatory capital and ratios 187
Part F - Shareholders’ Equity

186
Notes to the Accounts
Annual Report and Accounts as at 31 December 2012 · FinecoBank
Section 1 - Bank’s shareholders’ equity
A. QUALITATIVE INFORMATIONThe management and allocation of capital (regulatory and economic), aimed at ensuring that the amount of capital and the related ratios are consistent with the risk profile assumed and comply with regulatory provisions, is carried out at Group level, given that the quality and the amount of capital resources of the individual Group companies are established on the basis of more general Group objectives.The purpose of capital management is to define the target level of capitalisation of the Group and of its companies in compliance with regulatory constraints and risk appetite. As regards dynamic capital management, the Parent Company draws up a financial plan and monitors the capital and regulatory ratios, anticipating any appropriate action needed to reach the objectives. Monitoring refers, on one hand, to both shareholders’ equity and the composition of regulatory capital and, on the other hand, to the planning and performance of risk-weighted assets (RWA).
B. QUANTITATIVE INFORMATION
B.1 Bank’s shareholders’ equity: breakdown
12.31.2012 12.31.2011
1. Share capital 200.070 200.070
2. Share premium reserve 1.934 1.934
3. Reserves
- from profits
a) legal 22.527 19.389
b) statutory - -
c) treasury shares - -
d) other 93.778 93.727
- other - -
4. Equity instruments - -
5. (Treasury shares) - -
6. Revaluation reserves
- Available-for-sale financial assets 285 (644)
- Property, plant and equipment - -
- Intangible assets - -
- Hedging instruments of foreign investments - -
- Cash flow hedges - -
- Exchange differences - -
- Non-current assets classified as held for sale - -
- Actuarial gains (losses) on - -
defined benefits plans - -
- Revaluation reserves for - -
associates carried at equity - -
- Special revaluation laws
7. Net Profit (Loss) for the year 125.467 62.764
Total 444.061 377.240
B.2 Revaluation reserves for available-for-sale financial assets: breakdown
ASSET/AMOUNT
TOTAL 12.31.2012 TOTAL 12.31.2011
POSITIVE RESERVE NEGATIVE RESERVE POSITIVE RESERVE NEGATIVE RESERVE
1. Debt securities 300 (15) 149 (793)
2. Equity instruments - - - -
3. Units in investment funds. - - - -
4. Loans - - - -
Total 300 (15) 149 (793)
Part F - Shareholders’ Equity(Amounts in Euro/000)

187FinecoBank · Annual Report and Accounts as at 31 December 2012
B.3 Revaluation reserves for available-for-sale financial assets: annual changesDEBT
SECURITIESEQUITY
INSTRUMENTSUNITS IN
INVESTMENT FUNDS LOANS
1. Opening balances (644) - - -2. Increases2.1 Fair value increases 1.036 - - -
2.2 Reclassification through profit or loss of negative reserves
- from impairment - - - -
- from disposal 18 - - -
2.3 Other increases - - - -
3. Decreases3.1 Fair value reductions (100) - - -
3.2 Impairment losses - - - -
3.3 Reclassification through profit or loss of positive reserves
- from disposal (25) - - -
3.4 Other increases - - - -
4. Closing balance 285 - - -
Section 2 - Regulatory capital and ratios
2.1 Regulatory capitalRegulatory capital is calculated on a quarterly basis in accordance with supervisory regulations by the Supervisory Body Reporting department. The results are reported to the Parent Company’s Board of Directors. As at 31 December 2012, the Bank’s regulatory capital stood at €251,095 thousand and satisfied the mandatory prudential requirements established by current Bank of Italy regulations. Regulatory capital and total risk-weighted assets were calculated by applying current supervisory provisions on the basis of accounting figures prepared in accordance with international accounting standards.
A. QUALITATIVE INFORMATION
12.31.2012 12.31.2011
Tier 1 capital 251,095 237,733
Tier 2 capital - -
Items to be deducted - -
Regulatory capital 251,095 237,733
1. Tier 1 capitalThe positive elements of Tier 1 capital are represented by the share capital, made up of no. 606,274,033 ordinary shares of a nominal value of €0.33 each, the reserves, and the share of the profit for 2012, amounting to €11,409 thousand, which the Bank’s strategic supervisory and management bodies intend to allocate to reserves.The negative elements of Tier 1 capital are represented by the book value of goodwill, less any deferred tax liabilities, and other intangible assets.
2. Tier 2No data to report.
3. Tier 3 capitalNo data to report.
The Bank, having informed the Bank of Italy of its decision on 28 June 2010 through the Parent Company UniCredit, has opted to fully neutralise the gains and the losses recognised in the revaluation reserves relating to debt securities held in the “Available-for-sale financial assets” portfolio subsequent to 31 December 2009, solely for debt securities issued by the Central governments of European Union Member States.

188
Part F - Shareholders’ Equity (Continued)
Notes to the Accounts
Annual Report and Accounts as at 31 December 2012 · FinecoBank
B. QUANTITATIVE INFORMATION
12.31.2012 12.31.2011
A. Tier 1 capital before prudential filters 251,095 237,733B. Tier 1 prudential filters
B.1 Positive IAS/IFRS prudential filters (+) - -
B.2 Negative IAS/IFRS prudential filters (-) - -
C. Tier 1 capital gross of items to be deducted (A+B) 251,095 237,733D. Items to be deducted from Tier 1 capital - -
E. Total TIER 1 (C - D) 251,095 237,733F. Tier 2 before prudential filters - -G. Tier 2 prudential filters:
G.1 Positive IAS/IFRS prudential filters (+) - -
G.2 Negative IAS/IFRS prudential filters (-) - -
H. Tier 2 capital gross of items to be deducted (F+G) - -I. Items to be deducted from Tier 2 capital - -
L. Total TIER 2 (H - I) - -M. Items to be deducted Tier 1 and Tier 2 capital - -
N. Regulatory capital (E + L - M) 251,095 237,733O. Tier 3 capital - -
P. Regulatory capital including Tier 3 (N + O) 251,095 237,733 2.2 Capital adequacy
A. QUALITATIVE INFORMATIONPrudential regulatory requirements have been established by applying the current provisions of the Basel II Traditional Standardised Approach. FinecoBank calculates its capital requirement for operational risk using advanced approaches, supplementing total capital requirements for the floors envisaged by Bank of Italy regulations. More specifically, FinecoBank has applied a floor corresponding to the positive difference between 80% of the capital requirements calculated on the basis of the rules in force as at 31 December 2006 and the sum of the capital requirements for credit, counterparty, market and operational risks, calculated by applying the current provisions of the standardised Basel II Traditional Standardised Approach. As at 31 December 2012, the floor was €98,409 thousand, net of the 25% reduction granted to banks belonging to a Banking group.

189FinecoBank · Annual Report and Accounts as at 31 December 2012
B. QUANTITATIVE INFORMATION
CATEGORY/AMOUNT
NON-WEIGHTED ASSETS WEIGHTED ASSETS
12.31.2012 12.31.2011 12.31.2012 12.31.2011
A. RISK ASSETSA.1 Credit and counterparty risk 19,782,877 17,538,317 1,170,572 561,714 1. Traditional standardised approach 19,782,877 17,538,317 1,170,572 561,714
2. Internal rating method - - - -
2.1 Basic - - - -
2.2 Advanced - - - -
3. Securitisations - - - -
B. REGULATORY CAPITAL REQUIREMENTSB.1 Credit and counterparty risk 93,646 44,937B.2 Market risk 3,379 5,664 1. Traditional standardised approach 3,379 5,664
2. Internal models - -
3. Concentration risk - -
B.3 Operational risk 58,515 46,703 1. Basic method - -
2. Traditional standardised approach - -
3. Advanced measurement approach 58,515 46,703
B.4 Other prudential requirements - -B.5 Other calculation elements 59,524 108,764B.6 Total prudential requirements 215,064 206,068C. RISK ASSETS AND CAPITAL RATIOS C.1 Risk-weighted assets 2,688,301 2,575,852
C.2 Tier 1 capital/Risk-weighted assets (Tier 1 capital ratio) 9.34% 9.23%
C.3 Regulatory capital including Tier 3/ Risk-weighted assets (Total capital ratio) 9.34% 9.23%
Risk-weighted assets have been calculated by multiplying the total of prudential requirements by 12.5 (the inverse of the minimum compulsory coefficient of 8%).


191FinecoBank · Annual Report and Accounts as at 31 December 2012
Part G - Business combinations
Section 1 - Business combinations completed during the yearNo information to report.
Section 2 - Business combinations completed after year-endNo information to report.
Section 3 - Retrospective adjustmentsNo information to report.


193FinecoBank · Annual Report and Accounts as at 31 December 2012
1. Details of Top Managers’ Compensation 1942. Related-party transactions 194
Part H - Related-party transactions

194
Notes to the Accounts
Annual Report and Accounts as at 31 December 2012 · FinecoBank
Information on the fees paid to key management personnel and on related-party transactions, pursuant to IAS 24 is shown below.
1. Details of Top Managers’ CompensationKey management personnel are persons having authority and responsibility for planning, directing, and controlling FinecoBank’s activities, directly or indirectly. Key management personnel include the Senior Management and the other members of the Board of Directors and the members of the Board of Statutory Auditors, in accordance with the provisions of Bank of Italy Circular no. 262 of 22 December 2005.
12.31.2012 12.31.2011
Fees paid to “Key Management Personnel”, Directors and the Board of Statutory Auditors
a) short-term benefits 2,309 2,234
b) post-employment benefits 127 84
of which under defined benefit plans - - of which under defined contribution plans 127 84c) other long-term employee benefits - 6
d) termination benefits 1,400 -
e) share-based payments 243 143
TOTAL 4,079 2,467
2. Related-party transactionsIn order to ensure full compliance with current legislative and regulatory provisions on disclosure of related-party transactions, on 13 December 2010, the Company’s Board of Directors approved the new provisions for related-party transactions, in compliance with the provisions of the Consob Regulation, approved by Resolution No. 17221 of 12 March 2010 and subsequently amended by Resolution No. 17389 of 23 June 2010.In accordance with the instructions given by the Parent Company, the criteria for identifying the transactions completed with related parties were defined, in line with the instructions of the above-mentioned Supervisory Body.
Individual transactions were carried out on the same terms as those applied to transactions entered into with independent third parties.
With the regard to transactions of significant operating, capital and financial importance, we note that, upon request by UniCredit S.p.A., FinecoBank S.p.A. has issued 5 bank guarantees in favour of the Italian Revenue Agency, with indefinite duration, for a total amount of €256,065 thousand, plus interest accrued until request for payment from the Italian Revenue Agency. The bank guarantees have been issued to secure the obligations assumed by UniCredit S.p.A. in relation to five VAT refund suspension orders issued by the Italian Revenue Agency and entail the assumption by FinecoBank S.p.A. of an irrevocable payment commitment on demand, within 30 days and without any exceptions.
The following statement shows the outstanding assets, liabilities, guarantees and commitments as at 31 December 2012, for each group of related parties pursuant to IAS 24:
BALANCES AT 31 DECEMBER 2012
JOINT VENTURES NOT CONSOLIDATED ASSOCIATES
DIRECTORS AND KEY PERSONNEL
OTHER RELATED PARTIES
Financial assets held for trading - - - -
Financial assets at fair value through profit or loss - - - 289
Loans and receivables with banks - - - 6
Loans and receivables with customers - - 4 4,061
Other assets - - - -
Total assets - - 4 4,356Deposits from banks - - - -
Deposits from customers - - 325 14,799
Financial liabilities held for trading - - - -
Tax liabilities - - - -
Other liabilities - - - 42
Total liabilities - - 325 14,841Guarantees given and commitments - - - -
Part H - Related-party transactions(Amounts in Euro/000)
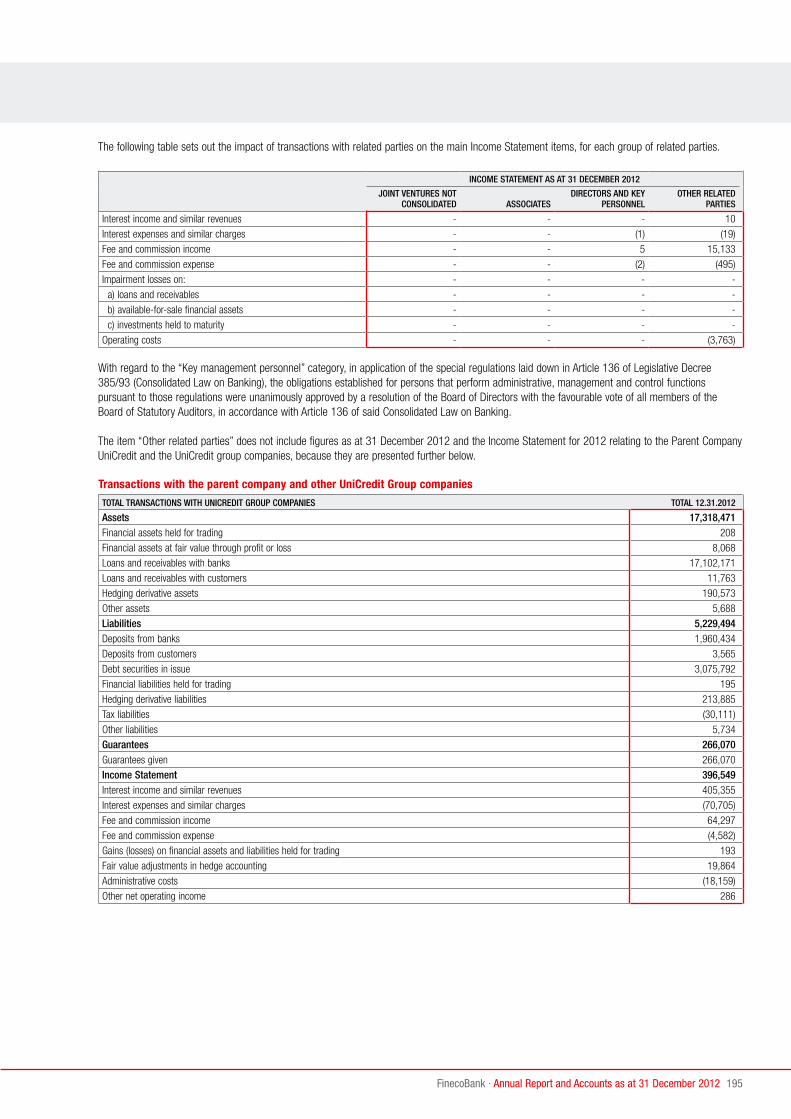
195FinecoBank · Annual Report and Accounts as at 31 December 2012
The following table sets out the impact of transactions with related parties on the main Income Statement items, for each group of related parties.
INCOME STATEMENT AS AT 31 DECEMBER 2012
JOINT VENTURES NOT CONSOLIDATED ASSOCIATES
DIRECTORS AND KEY PERSONNEL
OTHER RELATED PARTIES
Interest income and similar revenues - - - 10
Interest expenses and similar charges - - (1) (19)
Fee and commission income - - 5 15,133
Fee and commission expense - - (2) (495)
Impairment losses on: - - - -
a) loans and receivables - - - -
b) available-for-sale financial assets - - - -
c) investments held to maturity - - - -
Operating costs - - - (3,763) With regard to the “Key management personnel” category, in application of the special regulations laid down in Article 136 of Legislative Decree 385/93 (Consolidated Law on Banking), the obligations established for persons that perform administrative, management and control functions pursuant to those regulations were unanimously approved by a resolution of the Board of Directors with the favourable vote of all members of the Board of Statutory Auditors, in accordance with Article 136 of said Consolidated Law on Banking.
The item “Other related parties” does not include figures as at 31 December 2012 and the Income Statement for 2012 relating to the Parent Company UniCredit and the UniCredit group companies, because they are presented further below.
Transactions with the parent company and other UniCredit Group companies
TOTAL TRANSACTIONS WITH UNICREDIT GROUP COMPANIES TOTAL 12.31.2012
Assets 17,318,471Financial assets held for trading 208
Financial assets at fair value through profit or loss 8,068
Loans and receivables with banks 17,102,171
Loans and receivables with customers 11,763
Hedging derivative assets 190,573
Other assets 5,688
Liabilities 5,229,494Deposits from banks 1,960,434
Deposits from customers 3,565
Debt securities in issue 3,075,792
Financial liabilities held for trading 195
Hedging derivative liabilities 213,885
Tax liabilities (30,111)
Other liabilities 5,734
Guarantees 266,070Guarantees given 266,070
Income Statement 396,549Interest income and similar revenues 405,355
Interest expenses and similar charges (70,705)
Fee and commission income 64,297
Fee and commission expense (4,582)
Gains (losses) on financial assets and liabilities held for trading 193
Fair value adjustments in hedge accounting 19,864
Administrative costs (18,159)
Other net operating income 286

196
Part H - Related-Party Transactions (Continued)
Notes to the Accounts
Annual Report and Accounts as at 31 December 2012 · FinecoBank
The following table summarises transactions with UniCredit group companies as at 31 December 2012:
COMPANY ASSETS LIABILITIESGUARANTEES AND
COMMITMENTS INCOME STATEMENT
UniCredit S.p.A. 17,305,281 5,204,513 266,070 354,285
Unicredit Bank AG 161 - - 718
Unicredit Bank AG Milan 37 15,505 - 171
Direktanlage.AT AG 15 909 - (37)
Unicredit Audit S.C.p.A. 140 62 - (2,322)
Unicredit Credit Management Bank S.p.A. - 15 - (51)
Unicredit Leasing S.p.A. - - - (8)
Localmind S.p.A. 28 2,881 - (194)
Unicredit Luxemburg Finance SA - - - 22
Unimanagement S.c.a.r.l. - 9 - (26)
Unicredit Global Information Services S.C.p.A. 856 790 - (12,579)
Pioneer Investment Management S.g.r. S.p.A. 1,933 - - 13,555
Fineco Leasing S.p.A. - 756 - 690
Dab Bank AG 186 3,959 - (2)
Cordusio Società Fiduciaria per Azioni 211 95 - (16)
Pioneer Asset Management SA Luxemburg 9,620 - - 42,337
Unicredit Bank Austria AG 1 - - 3
Unicredit Bank Czech Republic A.S. 1 - - 1
Unicredit Bank Hungary Zrt 1 - - 1
Unicredit BulBank AD - - - 1
Total 17,318,471 5,229,494 266,070 396,549
The following tables contain a breakdown of the items relating to Assets, Liabilities, Costs and Revenue for each individual Group company.
Transactions with parent companies
TRANSACTIONS WITH UNICREDIT S.P.A. TOTAL 12.31.2012
Assets 17,305,281Financial assets at fair value through profit or loss 8,068
Loans and receivables with banks 17,101,984
Hedging derivative assets 190,573
Other assets 4,656
Liabilities 5,204,513Deposits from banks 1,941,745
Debt securities in issue 3,075,792
Hedging derivative liabilities 212,397
Tax liabilities (30,111)
Other liabilities 4,690
Guarantees 266,070Guarantees given 266,070
Income Statement 354,285Interest income and similar revenues 405,235
Interest expenses and similar charges (69,457)
Fee and commission income 5,507
Fee and commission expense (3,987)
Fair value adjustments in hedge accounting 19,723
Administrative costs (2,755)
Other net operating income 19

197FinecoBank · Annual Report and Accounts as at 31 December 2012
Transactions with companies controlled by UniCredit S.p.A.
TRANSACTIONS WITH UNICREDIT BANK AG TOTAL 12.31.2012
Assets 161Financial assets held for trading 7
Loans and receivables with banks 150
Other assets 4
Income Statement 718Fee and commission income 718
TRANSACTIONS WITH UNICREDIT BANK AG, MILAN TOTAL 12.31.2012
Assets 37Loans and receivables with banks 37
Liabilities 15,505Deposits from banks 14,017
Hedging derivative liabilities 1,488
Income Statement 171Interest income and similar revenues 120
Interest expenses and similar charges (1,180)
Fee and commission income 1,103
Fee and commission expense (14)
Fair value adjustments in hedge accounting 142
TRANSACTIONS WITH DIREKTANLAGE.AT AG TOTAL 12.31.2012
Assets 15Financial assets held for trading 15
Liabilities 909Deposits from banks 890
Financial liabilities held for trading 19
Income Statement (37)Interest expenses and similar charges (3)
Fee and commission income 13
Fee and commission expense (55)
Gains (losses) on financial assets and liabilities held for trading 8
TRANSACTIONS WITH UNICREDIT AUDIT S.C.P.A. TOTAL 12.31.2012
Assets 140Other assets 140
Liabilities 62Other liabilities 62
Income Statement (2,322)Administrative costs (2,322)
TRANSACTIONS WITH UNICREDIT CREDIT MANAGEMENT BANK S.P.A. TOTAL 12.31.2012
Liabilities 15Other liabilities 15
Income Statement (51)Administrative costs (51)
TRANSACTIONS WITH UNICREDIT LEASING S.P.A. TOTAL 12.31.2012
Income Statement (8)Fee and commission income 1
Administrative costs (9)

198
Part H - Related-Party Transactions (Continued)
Notes to the Accounts
Annual Report and Accounts as at 31 December 2012 · FinecoBank
TRANSACTIONS WITH LOCALMIND S.P.A. TOTAL 12.31.2012
Assets 28Other assets 28
Liabilities 2,881Deposits from customers 2,809
Other liabilities 72
Income Statement (194)Interest expenses and similar charges (54)
Administrative costs (180)
Other net operating income 40
TRANSACTIONS WITH UNICREDIT LUXEMBOURG FINANCE SA TOTAL 12.31.2012
Income Statement 22Fee and commission income 22
TRANSACTIONS WITH UNIMANAGEMENT S.C.A.R.L. TOTAL 12.31.2012
Liabilities 9Other liabilities 9
Income Statement (26)Administrative costs (26)
TRANSACTIONS WITH UNICREDIT GLOBAL INFORMATION SERVICES S.C.P.A. TOTAL 12.31.2012
Assets 856Other assets 856
Liabilities 790Other liabilities 790
Income Statement (12,579)Fee and commission income 9
Administrative costs (12,814)
Other net operating income 226
TRANSACTIONS WITH PIONEER INVESTMENT MANAGEMENT S.G.R. S.P.A. TOTAL 12.31.2012
Assets 1,933Loans and receivables with customers 1,933
Income Statement 13,555Fee and commission income 13,755
Fee and commission expense (200)
TRANSACTIONS WITH FINECO LEASING S.P.A. TOTAL 12.31.2012
Liabilities 756Deposits from customers 756
Income Statement 690Interest expenses and similar charges (4)
Fee and commission income 694

199FinecoBank · Annual Report and Accounts as at 31 December 2012
TRANSACTIONS WITH DAB BANK AG TOTAL 12.31.2012
Assets 186Financial assets held for trading 186
Liabilities 3,959Deposits from banks 3,783
Financial liabilities held for trading 176
Income Statement (2)Interest expenses and similar charges (8)
Fee and commission income 68
Fee and commission expense (247)
Gains (losses) on financial assets and liabilities held for trading 185
TRANSACTIONS WITH CORDUSIO SOCIETÀ FIDUCIARIA PER AZIONI TOTAL 12.31.2012
Assets 211Loans and receivables with customers 211
Liabilities 95Other liabilities 95
Income Statement (16)Fee and commission income 63
Fee and commission expense (79)
TRANSACTIONS WITH PIONEER ASSET MANAGEMENT SA LUXEMBOURG TOTAL 12.31.2012
Assets 9,620Loans and receivables with customers 9,620
Income Statement 42,337Fee and commission income 42,337
TRANSACTIONS WITH UNICREDIT BANK AUSTRIA AG TOTAL 12.31.2012
Assets 1Other assets 1
Income Statement 3Fee and commission income 3
TRANSACTIONS WITH UNICREDIT BANK CZECH REPUBLIC A.S. TOTAL 12.31.2012
Assets 1Other assets 1
Income Statement 1Fee and commission income 1
TRANSACTIONS WITH UNICREDIT BANK HUNGARY ZRT TOTAL 12.31.2012
Assets 1Other assets 1
Income Statement 1Fee and commission income 1
TRANSACTIONS WITH UNICREDIT BULBANK AD TOTAL 12.31.2012
Income Statement 1Fee and commission income 1


201FinecoBank · Annual Report and Accounts as at 31 December 2012
A. Qualitative information 202B. Quantitative information 204
Part I - Share-based payments

202
Notes to the Accounts
Annual Report and Accounts as at 31 December 2012 · FinecoBank
Part I - Share-based payments (Amounts in Euro/000)
A. QUALITATIVE INFORMATION
1. Description of share-based payments
1 Outstanding instrumentsThe Company’s Medium & Long Term Incentive Plans for its employees includes Equity-Settled Share Based Payments, which entail the award of equity instruments of the Parent Company, UniCredit S.p.A..
This category includes the following:• Stock Options allocated to selected Top & Senior Managers and Key Talents and represented by rights to subscribe UniCredit shares;• Performance Stock Options & Performance Shares allocated to selected Top & Senior Managers and Key Talents of the Group and represented
respectively by Options and free UniCredit ordinary shares that the Parent Company undertakes to grant, conditional upon achieving performance targets approved by the Parent Company’s Board of Directors;
• Employee Share Ownership Plan (ESOP), which offers eligible Company employees the possibility to buy UniCredit ordinary shares with the following advantages: granting of free ordinary shares (“Discount Shares” and “Matching Shares” or, for the second category, rights to receive them) measured on the basis of the shares purchased by each Participant (“Investment Shares”) during the “Enrolment Period”. The granting of free ordinary shares is subordinated to vesting conditions (other than market conditions) stated in the Plan Rules;
• Group Executive Incentive System that offers to eligible Group Executive a variable remuneration for which payment will be made over several years and provides for payments in cash and in ordinary shares of UniCredit, related to the achievement of individual and Group performance conditions stated in the Plan Rules;
• Share For Talent that offers free eligible key talents UniCredit ordinary shares that the Parent Company undertakes to grant, conditional upon achieving performance targets established by the Parent Company’s Board of Directors.
2 Measurement model
2.1 Stock Options and Performance Stock OptionsThe Hull and White Evaluation Model has been adopted to measure the economic value of Stock Options and Performance Stock Options.This model is based on a trinomial tree price distribution using the Boyle’s algorithm and estimates the early exercise probability on the basis of a deterministic model connected to:• reaching a Market Share Value equal to an exercise price-multiple (M);• probability of beneficiaries’ early exit (E) after the end of the Vesting Period.
2012-2015 Performance Stock OptionsThe following table shows the values and the parameters for the Performance Stock Options allocated to senior personnel in 2012.
2012 PERFORMANCE STOCK OPTIONS
Exercise price [€] 4.01
UniCredit Share Market Price [€] 4.01
Date of granting Board resolution (Grant Date) 27-Mar-2012
Vesting Period Start Date 1-Jan-2012
Vesting Period End Date 31-Dec-2015
Expiry Date 31-Dec-2022
Exercise price Multiple (M) 1.5
Post Vesting Exit Rate (E) 3.73%
Dividend Yield 2%
Volatility 56.5%
Risk Free Rate 2.5%
Performance Stock Options’ Fair Value per unit @ Grant Date [€] 1.867
Parameters are calculated as follows:- Exit Rate: annual percentage of Stock Options forfeited due to termination;- Dividend Yield: next four years average dividend-yield;- Volatility: historical daily average volatility for a period equals to four years; - Exercise price: arithmetic mean of the official market price of UniCredit shares during the month preceding the granting Board of Directors resolution;- UniCredit Share Market Price: set equal to the Exercise Price, in consideration of the “at-the-money” allocation of Stock Options at the date of the grant.

203FinecoBank · Annual Report and Accounts as at 31 December 2012
2.2 Other equity instruments (Performance Shares) - Share For TalentThe Share for Talent plan offers three payment plans based on UniCredit ordinary shares, with subsequent annual vesting, to selected beneficiaries.The economic value of Performance Shares is measured considering the share market price at the grant date less the present value of the future dividends during the performance period. Parameters are estimated by applying the same model used for Stock Options measurement.
The following table shows the measurements and parameters used in relation to the Performance Shares granted in 2012.
SHARE FOR TALENT
MEASUREMENT SHARE FOR TALENT (PERFORMANCE SHARES) 20121ST INSTALMENT
(2013)2ND INSTALMENT
(2014)3RD INSTALMENT
(2015)
Date of granting Board resolution (Grant Date) 27-Mar-2012 27-Mar-2012 27-Mar-2012
Vesting Period Start Date 1-Jan-2012 1-Jan-2013 1-Jan-2014
Vesting Period End Date 31-Dec-2012 31-Dec-2013 31-Dec-2014
UniCredit Share Market Price [€] 4.01 4.01 4.01
Economic value of vesting conditions - -0.08 -0.15
Performance Shares’ Fair Value per unit @ Grant Date [€] 4.01 3.93 3.86
2.3 Group Executive Incentive SystemThe amount of the incentive will be determined on a basis of the achievement of quantitative and qualitative goals stated by the plan. In particular, the overall evaluation is expressed as a percentage, from a minimum of 0% to a maximum of 150% (non market vesting conditions). This percentage, adjusted by the application of a risk/opportunity factor - Group Gate - at first payment, multiplied by the incentive will determine the effective amount that will be paid to the beneficiary.The Economic and Equity effects will be receipt on a basis of instrument vesting period.
2.3.1 Group Executive Incentive System 2011 - SharesThe economic value of shares granted is measured considering the share market price at the grant date less the present value of the future dividends during the performance period. Parameters are estimated by applying the same model used for Stock Options measurement.
SHARES RELATED TO GROUP EXECUTIVE INCENTIVE SYSTEM 2011
1ST INSTALMENT (2014)
2ND INSTALMENT (2015)
Bonus Opportunity Economic Value - (Grant Date) 22-Mar-2011 22-Mar-2011
Number of Shares - Date of Board resolution 27-Mar-2012 27-Mar-2012
Vesting Period Start Date 1-Jan-2011 1-Jan-2011
Vesting Period End Date 31-Dec-2013 31-Dec-2014
UniCredit Share Market Price [€] 4.01 4.01
Average Economic Value of Vesting conditions [€] -0.34 -0.50
Average Performance Shares’ Fair Value per unit at Grant Date [€] 3.67 3.51
The profit and loss and net equity effects will be recognised on the basis of the instruments’ vesting period.
2.3.2 Group Executive Incentive System 2012The variable incentive related to 2012 will be defined on the basis of:• individual performance, as well as results at business level and, where applicable, at country or group level;• establishment of a balanced structure of upfront (following the performance evaluations) and deferred payments, in cash and in shares;• Bank of Italy rules that, for share payments, require a retention period of two years for upfront payments and one year for deferred shares;• application of an overall risk/sustainability factor, related to annual Group profitability, solidity and liquidity results (“Group Gate”), as well as a Zero
Factor related to future Group profitability, solidity and liquidity results.
2.4 Employee Share Ownership Plan (Let’s Share 2011)For Free Shares (or rights to receive them) the fair value is measured at the end of the Enrolment Period according to the weighted average price paid by Participants to buy the Investment Shares on the market.
The following tables show the measurements and parameters used in relation to Free Shares (or rights to receive them) connected to the “Employee Share Ownership Plan” approved in 2011.

204
Part I - Share-based payments (Continued)
Notes to the Accounts
Annual Report and Accounts as at 31 December 2012 · FinecoBank
Measurement of Free Shares ESOP 2011
FREE SHARE
Date of Free Shares delivery to employees 15-Jan-2013
Vesting Period Start Date 1-Jan-2012
Vesting Period End Date 31-Dec-2014
Discount Shares’ Fair Value per unit [€] 3.364
3. Other information
Employee Share Ownership Plan 2012 (Let’s Share 2012)In May 2012 the Ordinary Shareholders’ Meeting approved the “UniCredit group Employee Share Ownership Plan 2012” (“Let’s Share 2012”) that offers eligible Group employees the opportunity to purchase UniCredit ordinary shares at favourable conditions, starting from January 2013, in order to strengthen employee loyalty and commitment to achieve the corporate goals.
Let’s Share 2012 is a broad based share plan under which:1. during the “Enrolment Period” (from January 2013 to December 2013) the Participants can buy UniCredit ordinary shares (“Investment Shares”)
by means of monthly or one-off contributions (via one instalment in January 2013 and or/July 2013) taken from their Current Account. If, during this Enrolment Period, a Participant leaves the Plan, they will lose the right to receive any free ordinary shares at the end of the Enrolment Period;
2. at the first month of the Enrolment Period (January 2013 or July 2013), each Participant will receive a discount of 25% on overall amount of shares purchased; the Free Shares will be locked up for one year. The Participants will lose the entitlement to the Free Share if, during the holding period, they are no longer an employee of a UniCredit group Company unless the employment has been terminated for one of the reasons allowed in the Plan Rules of the Plan. In some countries, for tax reasons, it will not be possible to grant the Free Shares at the end of the Enrolment Period: in that case an alternative structure is offered that provides the Participants of those countries the right to receive the Free Shares at the end of the Holding Period (“Alternative Structure”);
3. during the “Holding Period” (from January 2013 to January 2014 or from July 2013 to July 2014), the Participants can sell the Investment Shares purchased at any time, but will lose the corresponding Free Shares (or right to receive them).
The Free Shares are classed as “Equity Settled Share-based Payments” because the Participants, under the Plan Rules, will receive UniCredit Equity Instruments as consideration for the services rendered to the legal entity where they are employed. For Free Shares (or rights to receive them) the fair value is measured at the end of the Enrolment Period according to the weighted average price paid by Participants to buy the Investment Shares on the market.All profit and loss and net equity effects related to Let’s Share 2012 will be booked during the period 2013-2014.
B. QUANTITATIVE INFORMATION
Effects on Profit and LossAll Share-Based Payment granted after 7 November 2002 which vesting period ends after 1 January 2005 are included within the scope of IFRS 2.
Financial statement presentation related to share based payments
12.31.2012 12.31.2011
TOTAL VESTED PLANS TOTAL VESTED PLANS
Costs - 487
- connected to Equity Settled Plans 588 487 - connected to Cash Settled Plans - -Debts paid to UniCredit S.p.A. for vested plans 372 69
Debts due to UniCredit S.p.A.1 1,039 823
1. Amount equal to the economic value accrued for services rendered by employees that are the beneficiaries of the plans that grant UniCredit shares.

FinecoBank · Annual Report and Accounts as at 31 December 2012


207FinecoBank · Annual Report and Accounts as at 31 December 2012
The Bank does not provide information on segment reporting as this information is not requested for the individual financial statements of unlisted companies.
Part L - Segment Reporting


209FinecoBank · Annual Report and Accounts as at 31 December 2012
Disclosure of Auditing Fees pursuant to art. 160 paragraph 1 bis of Legislative Decree 58/98 211
Annex

210 Annual Report and Accounts as at 31 December 2012 · FinecoBank

211FinecoBank · Annual Report and Accounts as at 31 December 2012
The table below provides details of the fees paid to the auditing firm KPMG S.p.A. and entities within the network that the auditing firm belongs to:
FINANCIAL STATEMENTS as at 31 December 2012 (fees net of VAT and expenses) (Amounts in euro)
TYPE OF SERVICEENTITY PROVIDING
THE SERVICE FEES
Auditing KPMG S.p.A. 275,090
Certification of tax models KPMG S.p.A. 10,140
285,230
Disclosure of Auditing Fees pursuant to art. 160 paragraph 1 bis of Legislative Decree 58/98
Annex

Sorter pages: UniCreditCreative concept: Orange 021
Graphic development and Composition:MERCURIO GP - Milan
Printed: CPZ S.p.A. (Bergamo) May 2013


Clear answers for real benefits.Annual Report and Accounts as at 31 Decem
ber 2012
Annual Report and Accountsas at 31 December 2012
www.fineco.it