2007library.corporate-ir.net/.../64242/items/282635/2007annualreportf.pdf2007 annual report. about...
TRANSCRIPT

2007
Annual Report

About Us
National City Corporation (NYSE: NCC), headquartered in Cleveland,
Ohio, is one of the nation’s largest financial holding companies.
The company, through its principal subsidiary National City Bank,
operates an extensive banking network in Ohio, Florida, Illinois,
Indiana, Kentucky, Michigan, Missouri, Pennsylvania and Wisconsin,
and also serves customers in selected markets nationally. Primary
business activities include commercial and retail banking, mortgage
and asset management. Visit NationalCity.com for more information.
Contents
Financial Highlights i
Chairman’s Letter ii
Board of Directors and Officers iv
Form 10-K
Corporate Information Inside Back Cover

i
For the Year 2007 2006 2005
Revenue
Tax-equivalent Net Interest Income $4,425 $4,634 $4,727
Noninterest Income 2,606 4,019 3,304
Total Revenue $7,031 $8,653 $8,031
Net Income $314 $2,300 $1,985
Net Income Per Common Share
Basic $.51 $3.77 $3.13
Diluted .51 3.72 3.09
Dividends Paid Per Common Share 1.60 1.52 1.44
Return on Average Common Equity 2.36% 17.98% 15.54%
Return on Average Assets .22 1.66 1.40
Net Interest Margin 3.49 3.75 3.74
Efficiency Ratio 75.46 54.45 58.95
Average Shares – Basic 606,388,766 609,316,070 633,431,660
Average Shares – Diluted 612,236,659 617,671,507 641,600,969
At Year End
Assets $150,374 $140,191 $142,397
Portfolio Loans 116,022 95,492 106,039
Earning Assets 131,450 123,723 125,990
Core Deposits 87,536 73,375 68,408
Stockholders’ Equity 13,408 14,581 12,613
Book Value Per Common Share 21.15 23.06 20.51
Market Value Per Common Share 16.46 36.56 33.57
Equity to Assets Ratio 8.92% 10.40% 8.86%
Common Shares Outstanding 633,945,720 632,381,603 615,047,663
Common Stockholders of Record 63,841 64,277 62,966
Full-time Equivalent Employees 32,064 31,270 34,270
2006 results include a pretax gain of $984 million, equivalent to $1.01 per diluted share after-tax, from the sale of First Franklin.
Financial Highlights(Dollars In Millions, Except Per Share Amounts)

ii
To Our Stockholders
As you know, 2007 turned out to be a very difficult year for National City. Severe disruption in the
mortgage, housing and credit markets that developed throughout the second half of the year led to
significant losses in our mortgage business, which dramatically weakened results for the company overall.
While the environment is the most difficult we have ever experienced, our results have certainly been
affected by our significant exposure to residential real estate.
In this letter, I’ll discuss the actions we’ve taken in response to the challenging environment, and review progress of our core retail,
commercial and asset management businesses. Our mortgage business came under considerable pressure starting in late July
and early August 2007 with the near-total stoppage in the mortgage capital markets. While we ceased broker production of new
national home equity originations immediately, we had a warehouse of loans held for sale for which there were no buyers, as well
as a pipeline of approved applications awaiting funding. The retention of these loans increased the size of our balance sheet above
where we had planned it to be, and also drove losses in the third and fourth quarters as we marked loans down to their current
value. Other than conforming, agency-eligible mortgages, the market for virtually all other types of mortgage loans continues to
be illiquid to non-existent. Therefore, we have further downsized and restructured our mortgage business, exiting all wholesale
production channels and narrowing our mortgage product set to agency-eligible mortgages and a small amount of high-quality
“jumbo” mortgages.
At the same time, the broad-based decline in housing prices and the reduced availability of mortgage credit has affected other
housing-related portfolios, such as loans to residential real estate developers, construction loans to individuals, and the residual
non-prime First Franklin portfolio remaining on our balance sheet following the sale of that business in late 2006. We are devoting
significant resources to managing these portfolios, and we have built reserves in anticipation of continued difficult conditions in the
residential housing arena.
The combination of a larger balance sheet, further disruption in the capital markets, mortgage-driven losses, and other developments
in the last two months of the year has taken the company’s year-end capital position below its target range. For that reason, we
announced in early January plans to raise non-dilutive Tier 1 capital, as well as our Board’s decision to reduce the dividend by
49 percent. We did add $650 million of Tier 1 capital in January, exceeding our objective for that transaction. I can assure you
that the decision to reduce the dividend was not taken lightly. However, it was and is an important step, in conjunction with the
aforementioned capital issuance, to increase capital to the higher end of our announced target ranges: 5 to 6 percent for tangible
common equity and 7 to 8 percent for Tier 1 risk-based capital. We have also embarked on an aggressive program to manage the
size of the balance sheet to further accelerate the increase of these ratios to desired levels. A strong balance sheet is the foundation
which will see us through difficult times.
Unfortunately overshadowed by the mortgage-related losses, but crucial to long-term success, was the performance of our
core banking businesses, which are based on direct customer relationships and the opportunity to expand them over time.

iii
David A. Daberko Retired Chairman and Chief Executive Officer
Dave’s career with National City began in 1968 when he joined the company as a management
trainee. He subsequently served in a variety of positions in the investments, planning and
corporate lending groups, and in the mid-1980s, led the integration of Columbus-based BancOhio
National Bank into National City, an acquisition that doubled the size of the company at the time.
Following his return to Cleveland, he became deputy chairman, and later was appointed president
and chief operating officer. In 1995, he was appointed chairman and CEO.
Under Dave’s leadership, the National City banking footprint expanded from just three states to the current nine states; the
Brand Promise – At National City, We Care About Doing What’s Right For Our Customers – was installed as the foundation of
the corporate culture; and significant investments were made in the core banking businesses to help assure their long-term
competitiveness. Beyond the business accomplishments, Dave was also deeply committed to the community, on a personal
as well as corporate level. Leading by example, Dave encouraged and fostered employee and corporate participation in civic,
charitable and educational causes to help make our communities better places to live and work.
Dave, thank you for 39 years of unparalleled service and dedication to National City.
These businesses delivered solid results in 2007. With a continued focus on growing the number of households we serve, our
retail bank grew households at close to a two percent rate, far surpassing the growth rate of our footprint. Household growth
and improved cross sell drove an 8.5 percent increase in core deposits and a 7 percent rise in loans, excluding the impact of
acquisitions. In corporate banking, average loans and deposits rose by 12 percent and 6 percent, respectively, reflecting a
consistent and aggressive focus on cross selling. Finally, our asset management business delivered one of its best years, with
asset growth of 5 percent, a 28 percent increase in deposits and overall revenue growth of 7 percent. The strong results of these
businesses exemplify the strength of our direct and integrated business model. And, they demonstrate our ability to compete and
win in all our markets, including Chicago, where we recently became the fourth largest bank following our acquisition of MAF
Bancorp, a transaction that also marked our entry into Milwaukee. We also continue to make progress in Florida, especially in the
areas of small business banking and wealth management, despite the negative impacts of the real estate slowdown.
Our plans for 2008 assume the continuation of difficult operating conditions, not just in mortgage, but broadly across the banking
business. That said, we believe we have taken the unpleasant but appropriate actions to deal with these challenges, and to rebuild
the value of the investment you have entrusted to us. In that regard, I would be remiss if I did not recognize the efforts of thousands
of National City employees who have truly risen to the occasion to help this great company during a difficult time. I thank them, and
you, the stockholders, for your ongoing support and investment in National City.
Peter E. Raskind Chairman, President and Chief Executive Officer

iv
Board of Directors
Jon E. Barfield (1,4)
Chairman and President The Bartech Group, Inc.
James S. Broadhurst (1,3,4)
Chairman and CEO Eat’n Park Hospitality Group, Inc.
Christopher M. Connor (2,4)
Chairman and CEO The Sherwin-Williams Company
Bernadine P. Healy, M.D. (2,3,5)
Medical Columnist and Health Editor U.S. News and World Report
Jeffrey D. Kelly
Vice Chairman and CFO National City Corporation
Allen H. Koranda
Retired Chairman and CEO MAF Bancorp
Michael B. McCallister (1,5)
President and CEO Humana, Inc.
Paul A. Ormond (2,5)
Chairman, President and CEO HCR ManorCare, Inc.
Peter E. Raskind
Chairman, President and CEO National City Corporation
Gerald L. Shaheen (2,5)
Retired Group President Caterpillar, Inc.
Jerry Sue Thornton, Ph.D. (1,3,5)
President Cuyahoga Community College
Morry Weiss (1,3,4)
Chairman American Greetings Corporation
Office of the Chairman
Peter E. Raskind
Chairman, President and CEO
Jeffrey D. Kelly
Vice Chairman and CFO
Officers
Executive Vice Presidents
Daniel J. Frate
Jon L. Gorney
Timothy J. Lathe
Philip L. Rice
Dale Roskom
Shelley J. Seifert
Jeffrey J. Tengel
David L. Zoeller General Counsel
and Secretary
Senior Vice Presidents
Kristen Baird Adams
Robert B. Crowl
Richard J. DeKaser
J. Andrew Dunham
Mary H. Griffith
James P. GulickGeneral Auditor
Gregory M. Jelinek
Clark H. KhayatFinance and Strategy
Janis E. Lyons
W. Robert Manning, Jr.
Joseph T. McCartin
Bruce A. McCrodden
Thomas A. RichlovskyTreasurer and Principal
Accounting Officer
Robert C. Rowe
Timothy J. Yanoti
State/Regional Market Presidents
Florida
J. Hal RobertsNortheast/Central Florida
Joseph B. Shearouse IIISoutheast Florida
Illinois
Joseph A. Gregoire
Indiana
Stephen A. Stitle
Kentucky/Tennessee
Charles P. Denny
Michigan/Northwest Ohio
David P. Boyle
Missouri
Shaun R. Hayes
Ohio
Paul G. Clark Northern Ohio
Michael GonsiorowskiCentral Ohio
Michael P. McCuen Southern Ohio
Pennsylvania
Todd C. Moules
Wisconsin
Beth Wnuk
Committees
(1) Audit(2) Compensation
(3) Dividend(4) Risk and Public Policy
(5) Nominating

UNITED STATESSECURITIES AND EXCHANGE COMMISSION
Washington, D.C. 20549
FORM 10-K
¥ Annual Report Pursuant to Section 13 or 15(d) of the Securities Exchange Act of 1934For the fiscal year ended December 31, 2007
Commission File Number 1-10074
NATIONAL CITY CORPORATION
(Exact Name of Registrant as Specified in Its Charter)
Delaware 34-1111088
(State or Other Jurisdiction ofIncorporation or Organization)
(I.R.S. Employer Identification No.)
1900 East Ninth Street, Cleveland, Ohio 44114-3484
(Address of Principal Executive Offices) (ZIP Code)
Registrant’s telephone number, including area code: 216-222-2000Securities registered pursuant to Section 12(b) of the Act:
Title of ClassName of Each Exchangeon Which Registered
National City Corporation Common Stock, $4.00 Per Share New York Stock Exchange9.875% Fixed-to-Floating Rate Non-Cumulative Preferred Stock, Series F New York Stock Exchange12.000% Fixed-to-Floating Rate Normal APEX New York Stock Exchange8.000% Trust Preferred Securities (issued by National City Capital Trust IV) New York Stock Exchange6.625% Trust Preferred Securities (issued by National City Capital Trust III) New York Stock Exchange6.625% Trust Preferred Securities (issued by National City Capital Trust II) New York Stock Exchange
Securities registered pursuant to Section 12(g) of the Act: none
Indicate by check mark if the registrant is a well-known seasoned issuer, as defined in Rule 405 of the Securities Act.YES ¥ NO n
Indicate by check mark if the registrant is not required to file reports pursuant to Section 13 or Section 15(d) of the Act.YES n NO ¥
Indicate by check mark whether the registrant (1) has filed all reports required to be filed by Section 13 or 15(d) of the SecuritiesExchange Act of 1934 during the preceding 12 months (or for such shorter period that the registrant was required to file suchreports), and (2) has been subject to such filing requirements for the past 90 days. YES ¥ NO n
Indicate by check mark if disclosure of delinquent filers pursuant to Item 405 of Regulation S-K is not contained herein, and will notbe contained, to the best of registrant’s knowledge, in definitive proxy or information statements incorporated by reference inPart III of this Form 10-K or any amendment to this Form 10-K. n
Indicate by check mark whether the registrant is a large accelerated filer, an accelerated filer, a non-accelerated filer, or a smallerreporting company. See the definitions of “large accelerated filer,” “accelerated filer” and “smaller reporting company” in Rule12b-2 of the Exchange Act. (Check one):
Large accelerated filer ¥ Accelerated filer n Non-accelerated filer n
(Do not check if a smaller reporting company)Smaller reporting company n
Indicate by check mark whether the registrant is a shell company (as defined in Rule 12b-2 of the Exchange Act). YES n NO ¥
The aggregate market value of the registrant’s outstanding voting common stock held by nonaffiliates on June 30, 2007, determinedusing a per share closing price on that date of $33.32, as quoted on the New York Stock Exchange, was $17,818,655,592.
The number of shares outstanding of each of the registrant’s classes of common stock, as of December 31, 2007:
Common Stock, $4.00 Per Share — 633,945,720
Documents Incorporated By Reference:
Portions of the registrant’s Proxy Statement (to be dated approximately March 7, 2008) are incorporated by reference into Item 10.Directors, Executive Officers and Corporate Governance; Item 11. Executive Compensation; Item 12. Security Ownership ofCertain Beneficial Owners and Management and Related Stockholder Matters; Item 13. Certain Relationships and RelatedTransactions, and Director Independence; and Item 14. Principal Accountant Fees and Services, of Part III.

PART I
Item 1. BUSINESS
Description of Business
National City Corporation (National City or the Corporation), successor to a banking business founded on May 17,1845, is a $150 billion financial holding company headquartered in Cleveland, Ohio. National City operates through anextensive distribution network in Ohio, Florida, Illinois, Indiana, Kentucky, Michigan, Missouri, Pennsylvania, andWisconsin, and also conducts selected lending and other financial services businesses on a nationwide basis. Theprimary source of National City’s revenue is net interest income from loans and deposits, revenue from loan sales andservicing, and fees from financial services provided to customers. Business volumes tend to be influenced by overalleconomic factors, including market interest rates, business spending, the housing market, consumer confidence, as wellas competitive conditions within the marketplace. Operations are primarily conducted through more than 1,400 branchbanking offices located within National City’s nine-state footprint. In addition, National City operates over 410 retailmortgage offices throughout the United States.
The Corporation’s businesses are organized by product and service offerings as well as the distribution channelsthrough which these products and services are offered. The Corporation has organized its operations into fivebusinesses: Retail Banking, Commercial Banking-Regional, Commercial Banking-National, Mortgage Banking, and AssetManagement.
Retail Banking provides banking services to consumers and small businesses within National City’s nine-state footprint.In addition to deposit gathering and direct lending services provided through the retail bank branch network, callcenters, and the Internet, Retail Banking’s activities also include small business banking services, education finance,retail brokerage, and lending-related insurance services. Consumer lending products include home equity, governmentor privately guaranteed student loans, and credit cards and other unsecured personal and small business lines of credit.Significant revenue sources include net interest income on loan and deposit accounts, deposit account service fees,debit and credit card interchange and service fees, and ATM surcharge and net interchange fees.
Commercial Banking-Regional provides products and services to large- and medium-sized corporations within NationalCity’s nine-state footprint. Major products and services include: lines of credit, term loans, leases, investment real estatelending, asset-based lending, treasury management, stock transfer, international services and dealer floorplan financing.Significant revenue sources are net interest income on loan and deposit accounts, brokerage revenue, leasing revenueand other fee income. A major source of revenue is from companies with annual sales in the $5 million to $500 millionrange across a diverse group of industries.
Commercial Banking-National provides products and services to select customers in certain industries or distributionchannels, as well as customers outside of National City’s footprint. Major products and services include: loan sales andsecuritization, structured finance, syndicated lending, commercial leasing, equity and mezzanine capital, derivatives,public finance, investment banking, correspondent banking, multifamily real estate lending and commercial real estatelending in selected national markets. Significant revenue sources are loan sales revenue, principal investment gains, andother fee income.
Mortgage Banking originates residential mortgage, home equity lines and loans both within National City’s bankingfootprint and on a nationwide basis. Mortgage loans generally represent loans collateralized by one-to-four-familyresidential real estate and are made to borrowers in good credit standing. These loans are typically sold to primarymortgage market aggregators (Fannie Mae, Freddie Mac, Ginnie Mae, or the Federal Home Loan Banks) and otherthird-party investors. Mortgage Banking’s business activities also include servicing mortgage loans, home equity loans,and home equity lines of credit for third-party investors. Significant revenue streams include net interest income earnedon portfolio loans and loans held for sale, as well as loan sale and servicing revenue.
The Asset Management business includes both institutional asset and personal wealth management. Institutional assetmanagement services are provided by two business units – Allegiant Asset Management Group and Allegiant Asset
2

Management Company. These business units provide investment management, custody, retirement planning services,and other corporate trust services to institutional clients, and act as the investment advisor for the Allegiant» mutualfunds. The clients served include publicly traded corporations, charitable endowments and foundations, as well asunions, residing primarily in National City’s banking footprint and generally complementing its corporate bankingrelationships. Personal wealth management services are provided by two business units � Private Client Group andSterling. Products and services include private banking services and tailored credit solutions, customized investmentmanagement services, brokerage, financial planning, as well as trust management and administration for individualsand families. Sterling offers financial management services for high-net-worth clients.
At December 31, 2007 National City and its subsidiaries had 32,064 full-time-equivalent employees. Additionalinformation regarding the business segments is included in the Line of Business Results section of Item 7 Management’sDiscussion and Analysis of Financial Condition and Results of Operations, and Note 27 to the Consolidated FinancialStatements.
Competition
The financial services business is highly competitive. National City and its subsidiaries compete actively with nationaland state banks, thrift institutions, securities dealers, mortgage bankers, finance companies, insurance companies, andother financial service entities.
Recent Acquisitions and Divestitures
The Corporation has completed several acquisitions in the past three years. On September 1, 2007, the Corporationcompleted its acquisition of MAF Bancorp, Inc. (MAF), a banking company operating 82 branches throughout Chicagoand Milwaukee and surrounding areas. On January 5, 2007, the Corporation completed its acquisition of FidelityBankshares, Inc. (Fidelity), a banking company operating 52 branches along Florida’s southeast coast through itssubsidiary Fidelity Federal Bank & Trust. On December 1, 2006, the Corporation completed its acquisition of HarborFlorida Bancshares, Inc. (Harbor), a banking company operating 42 branches along the central east coast of Floridathrough its subsidiary Harbor Federal Savings Bank. On May 1, 2006, the Corporation completed its acquisition ofForbes First Financial Corporation (Pioneer), a privately held bank holding company operating eight branches in theSt. Louis, Missouri, metropolitan area through its subsidiary Pioneer Bank.
On December 30, 2006, the Corporation completed the sale of its First Franklin nonprime mortgage origination andsale business and related servicing platform. In 2005, the Corporation sold Madison Bank & Trust, an Indiana statechartered bank, including six branches, and from time to time has sold individual branches or groups of branchesdeemed nonstrategic.
Additional information on acquisition and divestiture activities is included in Note 3 to the Consolidated FinancialStatements.
Supervision and Regulation
National City is a financial holding company and, as such, is subject to regulation under the Bank Holding CompanyAct of 1956, as amended (the BHC Act). The BHC Act requires the prior approval of the Federal Reserve Board for afinancial holding company to acquire or hold more than a 5% voting interest in any bank, and restricts interstatebanking activities. The BHC Act allows interstate bank acquisitions anywhere in the country and interstate branching byacquisition and consolidation in those states that had not opted out by January 1, 1997.
The BHC Act restricts National City’s nonbanking activities to those which are determined by the Federal Reserve Boardto be financial in nature, incidental to such financial activity, or complementary to a financial activity. The BHC Act doesnot place territorial restrictions on the activities of nonbank subsidiaries of financial holding companies. National City’sbanking subsidiaries are subject to limitations with respect to transactions with affiliates.
3

The Graham-Leach-Bliley Act of 1999 (the GLB Act) removed large parts of a regulatory framework that had its originsin the Depression Era of the 1930s. Effective March 11, 2000, new opportunities became available for banks, otherdepository institutions, insurance companies, and securities firms to enter into combinations that permit a singlefinancial services organization to offer customers a more complete array of financial products and services. The GLB Actprovides a new regulatory framework for regulation through the financial holding company, which has as its umbrellaregulator the Federal Reserve Board. Functional regulation of the financial holding company’s separately regulatedsubsidiaries is conducted by their primary functional regulator. The GLB Act requires “satisfactory” or higherCommunity Reinvestment Act compliance for insured depository institutions and their financial holding companies inorder for them to engage in new financial activities. The GLB Act provides a federal right to privacy of nonpublicpersonal financial information of individual customers. National City and its subsidiaries are also subject to certain statelaws that deal with the use and distribution of nonpublic personal information.
A substantial portion of the holding company’s cash is derived from dividends paid by National City Bank. Thesedividends are subject to various legal and regulatory restrictions as summarized in Note 18 to the Consolidated FinancialStatements.
National City Bank is subject to the provisions of the National Bank Act, is under the supervision of, and is subject toperiodic examination by, the Comptroller of the Currency (the OCC), is subject to the rules and regulations of the OCC,Board of Governors of the Federal Reserve System, and the Federal Deposit Insurance Corporation (FDIC).
National City Bank is also subject to certain laws of each state in which it is located. Such state laws may restrictbranching of banks within the state.
The Financial Reform, Recovery and Enforcement Act of 1989 (FIRREA) provided that a holding company’s controlledinsured depository institutions are liable for any loss incurred by the FDIC in connection with the default of any FDIC-assisted transaction involving an affiliated insured bank or savings association.
The monetary policies of regulatory authorities, including the Federal Reserve Board and the FDIC, have a significanteffect on the operating results of banks and holding companies. The nature of future monetary policies and the effectof such policies on the future business and earnings of National City and its subsidiaries cannot be predicted.
The Sarbanes-Oxley Act of 2002 addresses, among other issues, corporate governance, auditing and accounting,executive compensation, and enhanced and timely disclosure of corporate information. The Corporation is also subjectto New York Stock Exchange corporate governance rules.
As directed by Section 302(a) of Sarbanes-Oxley, National City’s chief executive officer and chief financial officer areeach required to certify that National City’s Quarterly and Annual Reports do not contain any untrue statement of amaterial fact. The rules have several requirements, including having these officers certify that: they are responsible forestablishing, maintaining, and regularly evaluating the effectiveness of National City’s internal controls; they have madecertain disclosures to National City’s auditors and the audit committee of the Board of Directors about National City’sinternal controls; and they have included information in National City’s Quarterly and Annual Reports about theirevaluation and whether there have been significant changes in National City’s internal controls or in other factors thatcould significantly affect internal controls subsequent to the evaluation.
National City maintains strong corporate governance practices, and the board of directors reviews National City’scorporate governance practices on a continuing basis including National City’s Code of Ethics, Code of Ethics for SeniorFinancial Officers, Corporate Governance Guidelines and charters for the Audit, Compensation and Organization,Nominating and Board of Directors Governance, and Risk and Public Policy Committees. More information aboutNational City’s corporate governance practices is available on the National City Website at: NationalCity.com.
Available Information
All reports, including the Annual Report on Form 10-K, quarterly reports on Form 10-Q, and current event reports onForm 8-K, as well as any amendments to those reports, filed or furnished pursuant to Section 13(a) and 15(d) of the
4

Exchange Act by National City Corporation with the United States Securities and Exchange Commission (SEC), areaccessible at no cost on the Corporation’s Web site at NationalCity.com as soon as reasonably practicable after theCorporation has electronically filed such material with, or furnished it to the SEC. These filings are also accessible onthe SEC’s Web site at www.sec.gov. The public may read and copy any materials the Company files with the SEC at theSEC Public Reference Room at 100F Street, NE, Washington, DC 20549. The public may also obtain information on theoperation of the Public Reference Room by calling the SEC at 1-800-SEC-0330.
Item 1A. RISK FACTORS
Investments in National City common stock involve risk.
The market price of National City common stock may fluctuate significantly in response to a number of factors,including:
Weakness in the real estate market, including the secondary residential mortgage loan markets has adverselyaffected National City and may continue to do so.
Significant ongoing disruptions in the secondary market for residential mortgage loans have limited the market for andliquidity of most mortgage loans other than conforming Fannie Mae and Freddie Mac loans. At December 31, 2007,National City held approximately $1.0 billion of loans available for sale that were not eligible for purchase by theseagencies. The effects of ongoing mortgage market challenges, combined with the ongoing correction in residential realestate market prices and reduced levels of home sales, could result in further price reductions in single family homevalues, adversely affecting the value of collateral securing mortgage loans held, mortgage loan originations and gainson sale of mortgage loans. Declining real estate prices and higher interest rates have caused higher delinquencies andlosses on certain mortgage loans, particularly second lien mortgages and home equity lines of credit and especiallythose that have been sourced from brokers that are outside National City’s banking footprint. These trends couldcontinue. These conditions have resulted in losses, write downs and impairment charges in the mortgage business,especially in the fourth quarter of 2007, and we have curtailed various product offerings and limited our mortgageoriginations generally to Fannie Mae and Freddie Mac eligible mortgages. Continued declines in real estate values,home sales volumes and financial stress on borrowers as a result of job losses, interest rate resets on adjustable ratemortgage loans or other factors could have further adverse effects on borrowers that result in higher delinquencies andgreater charge-offs in future periods, which would adversely affect financial condition or results of operations. In theevent the allowance for loan losses is insufficient to cover such losses, earnings, capital and parent company liquiditycould be adversely affected.
National City’s real estate portfolios are exposed to weakness in the U.S. housing markets and the overallstate of the economy.
The declines in home prices in many markets across the U.S., along with the reduced availability of mortgage credit,have resulted in sharp increases in delinquencies and losses in National City’s portfolios of broker-originated, out-of-footprint home equity lines and loans, nonprime mortgages, and loans related to residential real estate constructionand development. Further declines in home prices coupled with an economic recession and associated rises inunemployment levels could drive losses beyond that which is provided for in the allowance for loan losses. In thatevent, National City’s earnings and capital could be adversely affected.
The residential mortgage loan market and business have adversely affected National City’s credit ratings.
On November 6, 2007, Fitch Ratings reduced National City’s long-term issuer default rating to A+ (outlook negative)from AA-, and the short-term issuer default rating to F-1 from F-1+, due to exposure to mortgage, home equity andconstruction lending. On January 8, 2008, Moody’s Investors Service, Inc., while affirming National City Bank’s topshort-term rating of P-1, placed virtually all of the long-term debt and financial strength ratings of National CityCorporation and its subsidiaries on review for possible downgrade pending the rating agency’s assessment as to theability to absorb potential losses in the residential and commercial mortgage sectors. The decrease, and potentialdecreases, in credit ratings could limit access to the capital markets, increase the cost of debt and adversely affectliquidity and financial condition. Further downgrades of credit ratings could adversely affect the market value of the
5

Depositary Shares and debt securities. Also, on November 12, 2007, Fitch Ratings reduced National City’s residentialmortgage servicer rating one notch from RPS1- to RPS2+ with respect to prime and alt-a mortgages. This decrease inservicer rating is not expected to adversely affect the terms of future residential mortgage securitizations or NationalCity’s continuing role as a mortgage servicer in existing transactions, but further decreases in the servicer rating couldcause such an adverse effect on future securitizations and the loss of mortgage servicing rights.
The allowance for loan losses may prove inadequate or be negatively affected by credit risk exposures.
National City’s business depends on the creditworthiness of its customers. The Corporation periodically reviews theallowance for loan losses for adequacy considering economic conditions and trends, collateral values and credit qualityindicators, including past charge-off experience and levels of past due loans and nonperforming assets. There is nocertainty that the allowance for loan losses will be adequate over time to cover credit losses in the portfolio because ofunanticipated adverse changes in the economy, market conditions or events adversely affecting specific customers,industries or markets. If the credit quality of the customer base materially decreases, if the risk profile of a market,industry or group of customers changes materially, or if the allowance for loan losses is not adequate, the business,financial condition, liquidity, capital, and results of operations could be materially adversely affected.
If Visa Inc. is unable to consummate its initial public offering on the terms currently contemplated, NationalCity will not receive expected proceeds from such offering.
Visa Inc. (“Visa”) filed a registration statement with the Securities and Exchange Commission on November 9, 2007 tosell its common stock in an initial public offering. If Visa’s offering is successfully completed, management currentlyanticipate that National City, as a selling stockholder, will receive proceeds from the offering. However, there is noassurance that Visa will be able to complete an initial public offering on the terms currently contemplated by itsregistration statement or at all. If the number of shares or the price per share of Visa’s offering are less than Visacurrently anticipates selling or if the Visa offering is not completed, National City may not realize proceeds sufficient tocover the indemnity liabilities accrued in 2007 in respect of Visa litigation matters.
National City could experience difficulties in managing growth and effectively integrating acquisitions.
National City regularly reviews potential acquisition opportunities. The Corporation acquired Harbor Florida Bancshares,Inc. and Fidelity Bankshares, Inc. in December 2006 and January 2007, respectively, and acquired MAF Bancorp inClarendon Hills, Illinois in September 2007. There is no certainty that National City will be able to manage growthadequately and profitably or to integrate the operations of Harbor, Fidelity, MAF Bancorp or any other acquisitioneffectively. Risks commonly associated with acquisitions include, without limitation, potential exposure to liabilities ofthe acquired entity, the difficulty and expense of integrating the operations and personnel of the acquired entity,potential disruption to the business of the acquired entity, potential diversion of management time and attention fromother matters and impairment of relationships with, and the possible loss of, key employees and customers of theacquired entity.
If National City does not adjust to rapid changes in the financial services industry, financial performance maysuffer.
National City’s ability to compete and its profitability depend in part on the ability to provide a range of financialservices through a variety of distribution channels to customers. Many competitors, with whom National City competeswith to attract and retain customers for traditional banking services, offer one-stop financial services shopping, whichincludes securities dealers, brokers, mortgage bankers, investment advisors and finance and insurance companies. Theincreasingly competitive environment primarily is a result of changes in regulation, changes in technology and productdelivery systems and the accelerating pace of consolidation among financial service providers.
Future governmental regulation and legislation could limit future growth.
National City and subsidiaries are subject to extensive state and federal regulation, supervision and legislation thatgovern almost all aspects of operations of both the holding Company and subsidiaries. These laws may change fromtime to time and are, together with banking regulation and supervision, primarily intended for the protection of
6

consumers, depositors and the deposit insurance funds. The effects of any changes to these laws may negatively affectthe cost and manner of providing services and related profitability.
Changes in interest rates could reduce income and cash flows.
National City’s income and cash flows depend to a great extent on the difference between the interest rates earned oninterest-earning assets such as loans and investment securities, and the interest rates paid on interest-bearing liabilitiessuch as deposits and other borrowings. These rates are highly sensitive to many factors outside of National City’scontrol, including general economic conditions and the fiscal and monetary policies of various governmental agencies,in particular, the Federal Reserve. Changes in monetary policy and changes in interest rates will affect loan originationvalues, the values of investments and other assets, the volume of deposits and other borrowings and the rates receivedon loans and investment securities and the rates paid on deposits and other borrowings and the resulting margin.Fluctuations in these areas may have an adverse effect.
National City’s results of operations and ability to make distributions to securities holders depend upon theresults of operations of subsidiaries.
National City Corporation is a holding company that is a separate and distinct entity from its subsidiaries. With limitedexceptions, substantially all operations are conducted through National City Bank, the Corporation’s principal subsidiarybank, and other subsidiaries. Federal banking laws limit the amount of dividends that may be paid by national banks tothe earnings of the current year and the last two years without prior regulatory approval. National City Bank and othersubsidiaries must also meet applicable capital requirements. At December 31, 2007, National City Bank could pay theholding company an aggregate of approximately $106 million in dividends without prior regulatory approval, comparedto $954 million at December 31, 2006 and $1.9 billion at December 31, 2005.
Additional risks and uncertainties could have a negative effect on financial performance.
Additional factors could negatively affect the financial condition and results of operations, securities issued by NationalCity and its common stock. Such factors include, without limitation, changes in general economic, financial and othermarket conditions, changes in securities analysts’ estimates of financial performance, volatility of securities marketprices and volumes, rumors or erroneous information, changes in market valuations of similar companies, changes ininterest rates, new developments or exceptions regarding the financial services banking industry, changes in quarterly orannual operating results or outlook, changes in competitive conditions, continuing consolidation in the financial servicesindustry, new litigation or changes in existing litigation, regulatory actions and changes in rules or policies, changes inaccounting policies and procedures, losses and customer bankruptcies, claims and assessments.
Item 1B. UNRESOLVED STAFF COMMENTS
None
Item 2. PROPERTIES
National City owns its corporate headquarters building, National City Center, located in Cleveland, Ohio. TheCorporation also owns freestanding operations centers in Columbus, Cincinnati, and Cleveland, Ohio, Fort Pierce,Florida, and Kalamazoo and Royal Oak, Michigan. Certain of National City’s business units occupy offices under long-term leases. The Corporation also leases operations centers in Cleveland and Miamisburg, Ohio, Pittsburgh,Pennsylvania, and Chicago, Illinois. Branch office locations are variously owned or leased.
Item 3. LEGAL PROCEEDINGS
National City and its subsidiaries are involved in a number of legal proceedings arising out of their businesses andregularly face various claims, including unasserted claims, which may ultimately result in litigation. For additionalinformation on litigation, contingent liabilities, and guarantees, refer to Note 22 to the Consolidated FinancialStatements in Item 8 of this Form 10-K.
7

These proceedings include claims brought against the Corporation and its subsidiaries where National City acted asdepository bank, lender, underwriter, fiduciary, financial advisor, broker, or other business activities. Reserves areestablished for legal claims when losses associated with the claims are judged to be probable, and the loss can bereasonably estimated. In many lawsuits and arbitrations, including almost all of the class action lawsuits, it is notpossible to determine whether a liability has been incurred or to estimate the ultimate or minimum amount of thatliability until the case is close to resolution, in which case a reserve will not be recognized until that time.
On or about November 22, 2002, a claim was asserted in the Marion County Probate Court (Indiana) against NationalCity Bank of Indiana, a subsidiary of the Corporation since merged into National City Bank, concerning management ofinvestments held in a trust for the benefit of the Americans for the Arts and The Poetry Foundation. The claim allegedfailure to adequately and timely diversify investments held in this trust, which resulted in investment losses. Thebeneficiaries were seeking damages of as much as $100 million. In December 2005, the court entered an ordergranting National City Bank of Indiana’s motion for summary judgment, and the beneficiaries filed an appeal. OnOctober 19, 2006, the Indiana Court of Appeals, in a unanimous decision, affirmed the order granting National CityBank of Indiana’s motion for summary judgment. By order dated March 8, 2007, the Indiana Supreme Courtunanimously denied the beneficiaries’ motion to transfer the appeal to the Indiana Supreme Court. The beneficiarieshave no further appeals as a matter of right.
Beginning on June 22, 2005, a series of antitrust class action lawsuits were filed against Visa», MasterCard», andseveral major financial institutions, including eight cases naming the Corporation and its subsidiary, National City Bankof Kentucky, since merged into National City Bank. The plaintiffs, merchants operating commercial businessesthroughout the U.S. and trade associations, claim that the interchange fees charged by card-issuing banks areunreasonable and seek injunctive relief and unspecified damages. The cases have been consolidated for pretrialproceedings in the United States District Court for the Eastern District of New York. On July 1, 2007, the Corporationand National City Bank entered into a Judgment Sharing Agreement (JSA) with respect to this litigation. This litigation isalso subject to the Visa USA bylaws and the Loss Sharing Agreement discussed in Note 22 to the Consolidated FinancialStatements. On September 7, 2007, the Magistrate Judge recommended to the District Court that all claims thatpredate January 1, 2004 should be dismissed. Given the preliminary stage of the remaining suits, it is not possible formanagement to assess the probability of a material adverse outcome, or reasonably estimate the amount of potentialloss.
On March 31, 2006, the Corporation and National City Bank were served with a patent infringement lawsuit filed inthe United States District Court for the Eastern District of Texas. The plaintiff, Data Treasury Corporation, claims thatthe Corporation, as well as over 50 other financial institutions or check processors, infringed on its patents involvingcheck imaging, storage and transfer. The plaintiff seeks damages and injunctive relief. On January 6, 2006, the USPatent and Trademark Office (USPTO) ordered a re-examination of certain of the patents (the Ballard Patents) and theCourt stayed the litigation as to those patents. Subsequently, the USPTO confirmed the patentability of all claims of theBallard patents under re-examination and the Plaintiff has now indicated its intention to ask the court to lift the stay.On or about July 27, 2007, the USPTO granted re-examination of the other patents in suit (the Huntington Patents) andthe Court stayed the litigation as to those patents. At this stage of this lawsuit, it is not possible for management toassess the probability of a material adverse outcome, or reasonably estimate the amount of potential loss.
On December 19, 2005, a class action suit was filed against National City Mortgage Co. in the U.S. District Court forthe Southern District of Illinois. The lawsuit alleges that National City Mortgage loan originators were improperlydesignated as exempt employees and seeks monetary damages. On June 21, 2007, the court conditionally certified anopt-in class of loan originators. On November 6, 2007, a settlement in principle was reached to resolve all wage andhour claims of the loan originators employed during the class period that opt-in to the settlement class. This settlementis subject to court approval. At December 31, 2007, the Corporation has a $25 million reserve accrued for this matter.
On January 10 and January 17, 2008, two putative class action lawsuits were filed in the United States District Courtfor the Northern District of Ohio against National City Corporation, the Administrative Committee for the National CitySavings and Investment Plan and certain current and former officers and directors of the Corporation. The complaintsallege violations under of the Employee Retirement Income Security Act (ERISA) relating to the Corporation’s stockbeing offered as an investment alternative for participants in the Plan. The complaints seek unspecified money damages
8

and equitable relief. At this stage of these lawsuits, it is not possible for management to assess the probability of amaterial adverse outcome, or reasonably estimate the amount of any potential loss.
On January 18 and January 28, 2008, two shareholder derivative complaints were filed in the United States DistrictCourt for the Northern District of Ohio against certain current and former officers and directors of the Corporationalleging breach of fiduciary duty, waste of corporate assets, unjust enrichment and violations of the Securities ExchangeAct of 1934. On February 6, 2008, two shareholder derivative actions were filed in Chancery Court for the state ofDelaware against certain current and former officers and directors of the Corporation alleging breach of fiduciary dutyand unjust enrichment. On February 11, 2008, a shareholder derivative action was filed in Common Pleas Court inCuyahoga County, Ohio against certain current and former officers and directors of the Corporation alleging breach offiduciary duty and unjust enrichment. All of these shareholder derivative lawsuits make substantially identical allegationsagainst substantially identical parties. The complaints seek unspecified money damages and equitable relief. At thisstage of these lawsuits, it is not possible for management to assess the probability of a material adverse outcome, orreasonably estimate the amount of potential loss.
On January 24, 2008, a putative class action lawsuit was filed in the United States District Court for the NorthernDistrict of Ohio against National City Corporation and certain current and former officers and directors of theCorporation. The complaint alleges violations of federal securities laws and seeks unspecified damages and equitablerelief on behalf of purchasers of the Corporation’s stock during the period April 30, 2007 to January 2, 2008. At thisstage of the lawsuit, it is not possible for management to assess the probability of a material adverse outcome, orreasonably estimate the amount of any potential loss.
Based on information currently available, consultation with counsel, available insurance coverage and establishedreserves, management believes that the eventual outcome of all claims against the Corporation and its subsidiaries willnot, individually or in the aggregate, have a material adverse effect on consolidated financial position or results ofoperations. However, it is possible that the ultimate resolution of these matters, if unfavorable, may be material to theresults of operations for a particular period.
The Corporation and its subsidiaries are involved in other administrative and judicial proceedings brought bygovernmental or other regulatory agencies. The outcome of these proceedings could result in litigation, fines, penaltiesor sanctions against the Corporation or its subsidiaries. The most significant proceedings are described below.
On October 11, 2006, Allegiant Asset Management Company (Allegiant), a registered investment adviser and anindirect subsidiary of National City Corporation, was notified that the Pacific Regional Office of the Securities andExchange Commission (SEC) was conducting an examination concerning marketing arrangements Allegiant had withentities that provide administrative services to the Allegiant Funds. On January 12, 2007, Allegiant submitted a writtenresponse to the SEC’s inquiries and subsequently provided follow-up written responses. On November 9, 2007, theCorporation was notified by the SEC that they have completed their investigation of this matter.
On August 23, 2005, the Office of Inspector General issued its final audit concerning late submitted requests to theDepartment of Housing and Urban Development for FHA insurance made between May 1, 2002 and April 30, 2004 byNational City Mortgage Co., a subsidiary of National City Bank. One of the recommendations contained in the finalaudit was for a determination to be made as to the legal sufficiency of possible remedies under the Program Fraud CivilRemedies Act. In late 2006, the Department of Housing and Urban Development referred the matter to theDepartment of Justice’s Civil Division to determine if possible civil claims exist under the Program Fraud Civil RemediesAct and the False Claims Act. The Company is cooperating with the Department of Justice in its civil claimsinvestigation. The nature and amount of any liabilities that might arise from this investigation are not determinable atthis time.
Item 4. SUBMISSION OF MATTERS TO A VOTE OF SECURITY HOLDERS
There were no matters submitted to a vote of shareholders during the quarter ended December 31, 2007.
9

PART II
Item 5. MARKET FOR REGISTRANT’S COMMON EQUITY AND RELATED STOCKHOLDERSMATTERS AND ISSUER PURCHASES OF EQUITY SECURITIES
National City common stock is traded on the New York Stock Exchange under the symbol “NCC.” At December 31,2007, there were 63,841 shareholders of record. The following table is a summary of historical price information anddividends paid per common share for all quarters of 2007 and 2006.
FirstQuarter
SecondQuarter
ThirdQuarter
FourthQuarter
FullYear
2007Dividends paid $ .39 $ .39 $ .41 $ .41 $ 1.60High 38.94 38.32 34.30 27.21 38.94Low 34.82 33.08 24.88 15.76 15.76Close 37.25 33.32 25.09 16.46 16.46
2006Dividends paid $ .37 $ .37 $ .39 $ .39 $ 1.52High 36.25 38.04 37.42 37.47 38.04Low 33.26 34.38 34.50 35.29 33.26Close 34.90 36.19 36.60 36.56 36.56
On January 2, 2008, the Board of Directors declared a dividend of $.21 per common share, payable on February 1,2008, representing a 49% decrease from the preceding quarter. Quarterly share repurchase activity for the quarterended December 31, 2007 is included in the “Capital” section of Item 7 of this Form 10-K, and incorporated herein byreference. Information regarding restrictions on dividends is included in the “Capital” section of Item 7 of thisForm 10-K, and incorporated herein by reference. Securities authorized for issuance under equity compensation plans isincluded in Item 12 of this Form 10-K, and incorporated herein by reference.
There have been no recent sales of unregistered securities.
10

Stockholder Return Performance
Set forth below is a line graph comparing the five-year cumulative total return of National City common stock, basedon an initial investment of $100 on December 31, 2002 and assuming reinvestment of dividends, with that of theStandard & Poor’s 500 Index (the “S&P 500”) and the KBW50 Index (the “KBW50”). The KBW50 is a market-capitalization weighted bank stock index developed and published by Keefe, Bruyette & Woods, Inc., a nationallyrecognized brokerage and investment banking firm specializing in bank stocks. The index is composed of 50 of thenation’s largest banking companies.
Five-Year Cumulative Total Return12/2002-12/2007National City vs. S&P 500 and KBW50 Index
$0
$20
$40
$60
$80
$100
$120
$140
$160
$180
$200
200720062005200420032002
KBW50 IndexS&P 500National City
2002 2003 2004 2005 2006 2007National City 100.00 129.42 148.40 138.44 157.23 75.38S&P 500 100.00 128.63 142.58 149.57 173.14 182.63KBW50 Index 100.00 134.03 147.50 149.23 178.18 137.16
11

Item 6. SELECTED FINANCIAL DATA
Consolidated Statements of Income and Selected Financial Data(a)
(In Millions, Except Per ShareAmounts) 2007(b) 2006(c) 2005 2004(d) 2003 2002 2001 2000 1999 1998 1997
For the Calendar Year
Statements of IncomeInterest income:
Loans $ 8,570 $ 8,352 $ 7,239 $ 5,560 $ 5,553 $ 5,319 $ 5,857 $ 5,793 $ 4,938 $ 4,812 $ 4,487Securities 419 414 382 377 355 519 492 715 895 861 825Other 196 168 111 89 57 63 59 62 80 84 51
Total interest income 9,185 8,934 7,732 6,026 5,965 5,901 6,408 6,570 5,913 5,757 5,363Interest expense:
Deposits 2,990 2,420 1,605 896 892 1,148 1,778 1,937 1,636 1,846 1,813Borrowings and long-term
debt 1,799 1,910 1,431 697 738 762 1,198 1,671 1,277 999 739Total interest expense 4,789 4,330 3,036 1,593 1,630 1,910 2,976 3,608 2,913 2,845 2,552
Net interest income 4,396 4,604 4,696 4,433 4,335 3,991 3,432 2,962 3,000 2,912 2,811Provision for loan losses 1,326 489 300 339 628 661 618 262 250 201 225
Net interest income afterprovision for loan losses 3,070 4,115 4,396 4,094 3,707 3,330 2,814 2,700 2,750 2,711 2,586
Noninterest income 2,606 4,019 3,304 4,440 3,593 2,548 2,685 2,481 2,381 2,314 1,847Noninterest expense 5,305 4,711 4,735 4,456 4,063 3,709 3,332 3,209 2,983 3,377 2,793
Income before income taxes 371 3,423 2,965 4,078 3,237 2,169 2,167 1,972 2,148 1,648 1,640Income taxes 57 1,123 980 1,298 1,120 722 779 670 743 577 518Net income $ 314 $ 2,300 $ 1,985 $ 2,780 $ 2,117 $ 1,447 $ 1,388 $ 1,302 $ 1,405 $ 1,071 $ 1,122
Per Common ShareDiluted net income $ .51 $ 3.72 $ 3.09 $ 4.31 $ 3.43 $ 2.35 $ 2.27 $ 2.13 $ 2.22 $ 1.61 $ 1.71Dividends declared 1.60 1.52 1.44 1.34 1.25 1.20 1.16 .855 1.085 .97 .86Dividends paid 1.60 1.52 1.44 1.34 1.25 1.20 1.16 1.14 1.06 .94 .84Average diluted shares 612.24 617.67 641.60 645.51 616.41 616.17 611.94 612.63 632.45 665.72 655.47Book value $ 21.15 $ 23.06 $ 20.51 $ 19.80 $ 15.39 $ 13.35 $ 12.15 $ 11.06 $ 9.39 $ 10.69 $ 9.75Tangible book value 12.03 16.73 14.85 14.36 13.47 11.46 10.23 9.09 7.23 8.96 8.86Market value (close) 16.46 36.56 33.57 37.55 33.94 27.32 29.24 28.75 23.69 36.25 32.88
Financial RatiosReturn on average common
equity 2.36% 17.98% 15.54% 24.56% 23.60% 18.14% 19.94% 21.29% 22.64% 15.40% 18.20%Return on average total equity 2.38 18.00 15.55 24.57 23.60 18.14 19.90 21.21 22.56 15.37 18.20Return on average assets .22 1.66 1.40 2.23 1.79 1.40 1.49 1.52 1.67 1.34 1.56Average stockholders’ equity
to average assets 9.19 9.21 9.02 9.10 7.57 7.70 7.49 7.17 7.39 8.70 8.57Dividend payout ratio 313.73 40.86 46.60 31.09 36.44 51.06 51.10 40.14 48.87 60.25 50.29Net interest margin 3.49 3.75 3.74 4.02 4.08 4.33 4.08 3.85 3.99 4.11 4.37Net charge-offs to average
portfolio loans .64 .44 .36 .39 .80 .83 .68 .46 .43 .37 .44Efficiency ratio 75.46 54.45 58.95 50.06 51.07 56.46 54.17 58.60 55.06 64.13 59.42
At Year EndAssets $150,374 $140,191 $142,397 $139,414 $114,102 $118,153 $105,905 $88,618 $87,121 $88,246 $75,779Portfolio loans 116,022 95,492 106,039 100,271 79,344 72,174 68,058 65,603 60,204 58,011 51,994Loans held for sale or
securitization 4,290 12,853 9,667 12,430 15,368 24,501 16,831 3,439 2,731 3,508 1,250Securities 8,731 7,509 7,875 8,765 6,525 8,675 9,479 9,597 14,565 15,813 13,651Deposits 97,555 87,234 83,986 85,955 63,930 65,119 63,130 55,256 50,066 58,247 52,617Long-term debt 27,892 26,356 30,970 28,696 23,666 22,730 17,316 18,145 15,038 9,689 6,297Total stockholders’ equity 13,408 14,581 12,613 12,804 9,329 8,161 7,381 6,770 5,728 7,013 6,158Common shares outstanding 633.95 632.38 615.05 646.75 606.00 611.49 607.35 609.19 607.06 652.65 631.39
(a) Years prior to 2000 reflect restatements, where applicable, for stock splits and pooling-of-interests business combinations.
(b) Results for 2007 include the acquisitions of Fidelity Bankshares, Inc. and MAF Bancorp, Inc. Refer to Note 3 of the Consolidated Financial Statements for further details.
(c) Results for 2006 include the acquisitions of Forbes First Financial Corporation and Harbor Florida Bancshares, Inc., and the sale of First Franklin. Refer to Note 3 of theConsolidated Financial Statements for further details.
(d) Results for 2004 include the acquisitions of Allegiant Bancorp Inc., Provident Financial Group Inc., and Wayne Bancorp, and the sale of National Processing, Inc.
12

Item 7. MANAGEMENT’S DISCUSSION AND ANALYSIS OF FINANCIAL CONDITION ANDRESULTS OF OPERATIONS
This section discusses the financial condition and results of operations of National City Corporation (the Corporation orNational City) for each of the past three years and should be read in conjunction with the accompanying ConsolidatedFinancial Statements and notes on pages 60 through 137.
Forward-Looking Statements
This Annual Report contains forward-looking statements. Forward-looking statements provide current expectations orforecasts of future events and are not guarantees of future performance, nor should they be relied upon asrepresenting management’s views as of any subsequent date. The forward-looking statements are based onmanagement’s expectations and are subject to a number of risks and uncertainties. Although management believesthat the expectations reflected in such forward-looking statements are reasonable, actual results may differ materiallyfrom those expressed or implied in such statements. Risks and uncertainties that could cause actual results to differmaterially include, without limitation, management’s ability to effectively execute its business plans; changes in generaleconomic and financial market conditions, including the stock market and residential and commercial real estatemarkets; changes in interest rates; the timing, pricing, and effects on National City of Visa’s initial public offering;changes in the competitive environment; continuing consolidation in the financial services industry; new litigation orchanges in existing litigation; losses, customer bankruptcy, claims and assessments; changes in banking regulations orother regulatory or legislative requirements affecting the Corporation’s business; and changes in accounting policies orprocedures as may be required by the Financial Accounting Standards Board or other regulatory agencies. Managementmay elect to update forward-looking statements at some future point; however, it specifically disclaims any obligationto do so.
Overview
Other than mortgage banking, the Corporation’s businesses — commercial banking, retail banking, and wealthmanagement — performed well in 2007. Core deposit and loan growth were strong, as were most fee incomecategories. Mortgage results were adversely affected by market conditions as well as declining credit quality inresidential real estate loan portfolios. Restructuring and other nonrecurring charges also affected 2007 results.
Declining real estate values put pressure on certain consumers with loans or lines of credit secured by residential realestate. Higher levels of delinquencies, nonperforming assets and charge-offs occurred in loans secured by residentialreal estate, particularly nonprime mortgage loans, broker-sourced home equity loans and residential construction loans.These factors led to higher actual and expected probable losses on these loans. The provision for loan losses was$1.3 billion in 2007 versus $489 million in 2006 and $300 million in 2005. Management believes the weakness in thehousing market will likely persist into 2008. As such, these credit trends are expected to continue in the near term.
In the last half of 2007, the capital markets for sale of mortgage loans and lines of credit experienced severe disruption. As aresult, the Corporation was unable to sell certain mortgage loans that had been originated for sale. Fair value write-downsoccurred on these loans due to declines in market values, failed trades and trade fallout. As a result, a net loan sale loss of$(38) million was recognized in 2007 versus loan sale revenues of $766 million in 2006 and $808 million in 2005. In responseto these conditions, management restructured its mortgage business, transferred nonsalable loans to its loan portfolio, andscaled back origination of certain products and staffing levels. Severance and other restructuring costs were incurred in 2007to complete these actions. As a result, the mortgage business will be smaller, but likely more stable, in future periods.
National City, as a member of the Visa network, is obligated to indemnify Visa for certain litigation losses. In 2007, theCorporation recognized indemnity charges of approximately $289 million related to this obligation. Visa is preparing foran initial public offering (IPO) of its common stock in 2008. Upon the anticipated completion of the IPO in 2008, theCorporation expects to recognize gains on its interest in Visa which should more than exceed the charges taken in2007.
The size of the Consolidated Balance Sheet grew in 2007, as loans originally intended for sale were transferred toportfolio. The larger balance sheet, combined with the losses in the mortgage business, restructuring and other unusualcharges, reduced the capital position below management’s internal target ranges. Management has initiated a plan toincrease liquidity and the Corporation’s capital levels in 2008. See further discussion in the Liquidity Risk section.
13

Consolidated Average Balance Sheets
(Dollars in Millions) 2007 2006 2005 2004 2003
Daily Average Balance
AssetsEarning Assets:Loans(a):
Commercial $ 28,519 $ 25,458 $ 23,748 $ 20,107 $ 19,865Commercial leases 4,168 3,566 3,171 2,024 1,538Commercial construction 8,151 6,286 4,264 3,062 2,383Commercial real estate 13,800 12,173 12,231 11,326 9,483Residential real estate 34,877 37,491 41,488 40,395 45,932Home equity lines of credit 17,533 19,533 21,122 14,743 9,293Credit card and other unsecured lines of credit 3,376 2,750 2,523 2,286 2,155Other consumer 4,908 5,680 7,818 7,659 8,059
Total loans 115,332 112,937 116,365 101,602 98,708Securities available for sale, at amortized cost
Taxable 7,471 7,270 7,134 7,033 6,195Tax-exempt 409 531 625 665 669Total securities available for sale 7,880 7,801 7,759 7,698 6,864
Federal funds sold and security resale agreements,and other investments 3,397 2,803 2,100 1,621 1,326Total earning assets/total interest income/rates 126,609 123,541 126,224 110,921 106,898
Allowance for loan losses (1,192) (1,007) (1,143) (1,101) (1,028)Fair value (depreciation) appreciation of securities
available for sale (22) (68) 72 150 257Nonearning assets 18,164 16,212 16,403 14,433 12,398
Total Assets $143,559 $138,678 $141,556 $124,403 $118,525Liabilities and stockholders’ equity
Interest bearing liabilities:NOW and money market $ 34,769 $ 28,900 $ 28,589 $ 28,897 $ 25,378Savings 2,540 1,970 2,361 2,583 2,423Consumer time deposits 26,632 21,711 18,662 14,875 13,729Other deposits 3,590 5,512 6,087 3,062 2,752Foreign deposits 8,095 8,553 8,787 8,946 7,002Federal funds borrowed 1,894 2,886 4,021 4,920 7,895Security repurchase agreements 4,133 3,487 3,317 2,918 3,013Borrowed funds 2,185 2,201 2,253 1,477 1,556Long-term debt 25,657 30,013 32,752 24,028 24,854
Total interest bearing liabilities/total interestexpense/rates 109,495 105,233 106,829 91,706 88,602
Noninterest bearing deposits 16,824 16,814 18,257 17,763 17,203Accrued expenses and other liabilities 4,040 3,852 3,705 3,618 3,748
Total liabilities 130,359 125,899 128,791 113,087 109,553Total stockholders’ equity 13,200 12,779 12,765 11,316 8,972Total liabilities and stockholders’ equity $143,559 $138,678 $141,556 $124,403 $118,525
Net interest income
Interest spreadContribution of noninterest bearing sources of fundsNet interest margin
(a) Includes both portfolio loans and loans held for sale or securitization.
14

2007 2006 2005 2004 2003 2007 2006 2005 2004 2003
Interest Average Rate
$2,151 $1,927 $1,388 $ 809 $ 733 7.54% 7.57% 5.84% 4.02% 3.69%289 231 201 127 85 6.94 6.49 6.35 6.28 5.54617 490 272 141 107 7.56 7.79 6.38 4.62 4.50982 880 778 648 581 7.12 7.23 6.36 5.72 6.13
2,493 2,699 2,678 2,569 2,960 7.15 7.20 6.45 6.36 6.441,339 1,455 1,194 581 355 7.64 7.45 5.65 3.94 3.81
381 308 251 200 173 11.28 11.19 9.93 8.73 8.01337 378 493 496 569 6.86 6.65 6.31 6.48 7.07
8,589 8,368 7,255 5,571 5,563 7.45 7.41 6.23 5.48 5.64
399 389 352 345 322 5.34 5.35 4.93 4.90 5.1929 37 45 49 51 7.07 7.07 7.27 7.36 7.68
428 426 397 394 373 5.43 5.47 5.12 5.11 5.43
197 170 111 88 58 5.79 6.05 5.28 5.46 4.35$9,214 $8,964 $7,763 $6,053 $5,994 7.28% 7.26% 6.15% 5.46% 5.61%
$1,092 $ 798 $ 488 $ 252 $ 257 3.14% 2.76% 1.71% .87% 1.01%32 11 10 9 11 1.26 .59 .44 .35 .45
1,291 936 642 467 506 4.85 4.31 3.44 3.14 3.69189 276 203 50 34 5.26 5.00 3.33 1.64 1.23386 399 261 118 84 4.77 4.66 2.97 1.32 1.2098 147 134 71 114 5.18 5.08 3.34 1.45 1.44
174 138 76 23 19 4.22 3.96 2.28 .78 .63109 103 68 15 18 4.97 4.67 3.01 1.03 1.20
1,418 1,522 1,154 588 587 5.52 5.07 3.52 2.45 2.36$4,789 $4,330 $3,036 $1,593 $1,630 4.37% 4.11% 2.84% 1.74% 1.84%
$4,425 $4,634 $4,727 $4,460 $4,364
2.91% 3.15% 3.31% 3.72% 3.77%.58 .60 .43 .30 .31
3.49% 3.75% 3.74% 4.02% 4.08%
15

Net Interest Income
Net interest income is the difference between interest income on earning assets, such as loans and securities, andinterest expense on liabilities used to fund those assets, including interest bearing deposits and other borrowings. Theamount of net interest income is affected by both changes in the level of interest rates and the amount andcomposition of earning assets and interest bearing liabilities. Net interest income is evaluated through twostatistics – interest spread and net interest margin. The difference between the yields on earning assets and the ratespaid on interest bearing liabilities represents the interest spread. The net interest margin is the percentage of netinterest income to average earning assets. Because noninterest bearing sources of funds, principally demand depositsand stockholders’ equity, also support earning assets, the net interest margin exceeds the interest spread.
To compare the tax-exempt asset yields to taxable yields, amounts are adjusted to the pretax-equivalent amounts basedon the marginal corporate Federal tax rate of 35%. The tax-equivalent adjustments to net interest income for 2007,2006, and 2005 were $29 million, $30 million, and $31 million, respectively. Average outstanding loan balances includenonperforming loans and loans held for sale or securitization. Average outstanding securities balances are computedbased on amortized cost and exclude unrealized gains and losses on securities available for sale.
In order to manage exposure to changes in interest rates, the Corporation uses various types of derivative instruments.The effects of derivative instruments used to manage interest-rate risk associated with earning assets and interestbearing liabilities are included in interest income or expense of the hedged item and consequently affect the yields onthose assets and liabilities. Further discussion of derivative instruments is included in Notes 1 and 25 to theConsolidated Financial Statements. A discussion of the effects of changing interest rates is included in the Market Risksection beginning on page 42.
Net interest income and net interest margin are also affected by amortization of fair value premiums and discountsrecognized on earning assets and interest bearing liabilities of acquired businesses. Refer to Note 3 to the ConsolidatedFinancial Statements for further discussion on acquisitions. These adjustments are amortized into interest income andexpense based upon the estimated remaining lives of the assets and liabilities acquired.
The decrease in net interest income in 2007 compared to 2006 is a result of a lower margin partially offset by higheraverage earning assets. The lower margin in 2007 compared to 2006 reflects higher funding costs, primarily LIBOR-basedfunding, associated with a larger than expected balance sheet, narrower spreads on commercial and consumer loans, andlower levels of noninterest bearing funds. The decrease in net interest income in 2006 compared to 2005 resultedprimarily from a decrease in average earning assets as a result of the decision to originate and sell out-of-footprint,broker-sourced nonprime mortgage loans and home equity lines and loans. The net interest margin in 2006 was relativelyconsistent with the prior year despite pressure on lending and deposit spreads due to a higher contribution fromnoninterest bearing sources of funds.
Further discussion of trends in the loan and securities portfolios and detail on the mix of funding sources is included inthe Financial Condition section.
16

The following table shows changes in tax-equivalent interest income, interest expense, and tax-equivalent net interestincome arising from volume and rate changes for major categories of earning assets and interest bearing liabilities. Thechange in interest not solely due to changes in volume or rates has been allocated in proportion to the absolute dollaramounts of the change in each.
(In Millions) Volume Rate Net Change Volume Rate Net Change2007 vs 2006 2006 vs 2005
Increase (decrease) in tax-equivalentinterest income
Loans:Commercial $ 233 $ (9) $ 224 $ 100 $ 439 $ 539Commercial leases 39 19 58 25 5 30Commercial construction 146 (19) 127 129 89 218Commercial real estate 117 (15) 102 (4) 106 102Residential real estate (189) (17) (206) (236) 257 21Home equity lines of credit (149) 33 (116) (90) 351 261Credit card and other unsecured
lines of credit 70 3 73 23 34 57Other consumer (51) 10 (41) (134) 19 (115)Securities available for sale 8 (6) 2 2 27 29Federal funds sold, security resale
agreements, and other investments 36 (9) 27 37 22 59Total $ 260 $ (10) $ 250 $(148) $1,349 $1,201Increase (decrease) in interest expenseDeposits:
NOW and money market accounts $ 162 $132 $ 294 $ 5 $ 305 $ 310Savings accounts 3 18 21 (2) 3 1Consumer time deposits 211 144 355 105 189 294Purchased deposits (114) 14 (100) (25) 236 211
Federal funds borrowed, securityrepurchase agreements, andborrowed funds (19) 12 (7) (29) 139 110
Long-term debt (217) 113 (104) (96) 464 368Total $ 26 $433 $ 459 $ (42) $1,336 $1,294Decrease in tax-equivalent net
interest income $(209) $ (93)
Noninterest Income
Details of noninterest income follow:
(In Millions) 2007 2006 2005
Deposit service charges and fees $ 905 $ 818 $ 740Loan sale revenue (38) 766 808Loan servicing revenue 402 91 399Trust and investment management fees 318 301 296Brokerage revenue 189 158 159Leasing revenue 178 228 267Other service fees 143 139 129Insurance revenue 133 129 103Card-related fees 125 109 105Principal investment gains, net 96 118 57Securities gains 22 — 27Derivatives (losses)/gains — (7) 64Gain on divestitures 16 984 16Other 117 185 134Total noninterest income $2,606 $4,019 $3,304
17

Deposit service revenue increased by $87 million, or 11%, compared to 2006 and by $165 million, or 22%, comparedto 2005. The growth in deposit service revenue reflects growth in deposit accounts and fee-generating transactionsincluding customer overdraft, nonsufficient funds, and debit card fees. Core deposits, excluding escrow funds, grew to$84.1 billion at December 31, 2007, up from $69.6 billion at December 31, 2006, and $64.8 billion at December 31,2005. The increase reflects both internal growth and acquisitions.
Loan sale revenue includes gains/(losses) realized upon loan sale or securitization, fair value write-downs on loans heldfor sale, and derivative gains/(losses) for hedges of mortgage loans and mortgage loan commitments. Revenue by loantype is shown below:
(In Millions) 2007 2006 2005
Residential real estate $(85) $590 $752Commercial loans 46 90 47Other consumer loans 1 86 9Total loan sale revenue $(38) $766 $808
During the last half of 2007, the markets for sale of many mortgage and home equity loans were disrupted. Potentialbuyers withdrew from the market given heightened concerns over credit quality of borrowers and continueddeterioration in the housing markets. In response to these conditions, management curtailed the production of non-agency eligible mortgage and home equity products and transferred certain nonsalable loans to portfolio. Residentialreal estate loan production is now limited to agency-eligible mortgages.
Residential real estate loan sales produced a loss in 2007 due to net losses realized upon sale and fair value write-downs onloans held for sale. Profitability of residential real estate loan sales was adversely affected by a market imbalance betweensupply and demand for certain types of mortgage loans, higher trade fallout, and higher losses on scratch and dent sales.Margins realized on sales of prime mortgage loans were (.07)% in 2007 versus 1.01% in 2006 and .85% in 2005. Fairvalue write-downs recognized on mortgage loans held for sale were $216 million in 2007 and $67 million in 2006, with nosuch write-downs in 2005. Fair value was estimated based on market prices for recent sales of similar loans, along withpricing information received from potential third-party investors, taking into consideration loan specific delinquency andunderwriting deficiencies, as well as other market observations. Residential real estate loans originated for sale decreased in2007 due to the above factors, as well as the sale of the former First Franklin nonprime mortgage unit in late 2006. Loansale revenue associated with First Franklin was $201 million in 2006 and $264 million in 2005, respectively.
Commercial loan sale revenue decreased in 2007 due to a lower volume of sales, as well as a $27 million nonrecurringgain on sale of certain commercial leases in the prior year.
Other consumer loan sales include home equity lines of credit, credit card, and student loans. Other consumer loan revenuedecreased in 2007 compared to 2006 due to net losses on sales of home equity lines of credit. The markets for sale of homeequity lines of credit were disrupted in 2007 as described above. As a result, the Corporation ceased production of homeequity lines of credit through brokers. As of December 31, 2007, all home equity lines of credit that had been originated forsale had either been sold or transferred to portfolio. Prior to such transfer, fair value write-downs of $9 million wererecognized to reduce the carrying value of these lines to their estimated market value. Other consumer loan revenue increasedin 2006 compared to 2005 due to the decision made during 2005 to begin selling all new production of out-of-footprint,broker-originated home equity lines of credit. In addition, other consumer loan sale revenue for 2005 included a $29 millionloss on the securitization of indirect automobile loans. The Corporation no longer originates indirect automobile loans.
Loan servicing revenue includes net contractual servicing fees, late fees, ancillary fees, servicing asset valuationadjustments, and gains/(losses) on derivatives and securities utilized to hedge mortgage servicing assets. Thecomponents of loan servicing revenue by product type follow:
(In Millions) 2007 2006 2005
Residential real estate $226 $ (73) $302Other consumer loans 164 154 86Commercial 12 10 11Total loan servicing revenue $402 $ 91 $399
18

The components of residential real estate loan servicing revenue/(loss) were as follows:
(In Millions) 2007 2006 2005
Net contractual servicing fees $ 534 $ 625 $ 532Servicing asset time decay and payoffs(a) (344) (404) (505)MSR hedging gains (losses):
Servicing asset valuation changes 60 (2) 472Losses on hedging instruments (24) (292) (197)Net MSR hedging gains (losses) 36 (294) 275
Total residential real estate servicing revenue (loss) $ 226 $ (73) $ 302
(a) Prior to January 1, 2006, time decay and payoffs were characterized as amortization of servicing assets.
The Corporation typically retains the right to service the mortgage loans it sells. Upon sale, the Corporation recognizes amortgage servicing right (MSR), which represents the present value of the estimated net servicing cash flows to be realizedover the estimated life of the underlying loan. The carrying value of MSRs was $2.5 billion at December 31, 2007 and$2.1 billion at December 31, 2006, respectively. On December 30, 2006, the Corporation’s nonprime mortgage servicingplatform, National City Home Loan Services (NCHLS) and associated servicing assets of $223 million were sold. Residentialreal estate servicing revenue included NCHLS servicing revenue of $64 million in 2006 and $19 million in 2005.
Net contractual servicing fees decreased in 2007 as the 2006 amount included $126 million of fees associated with theNCHLS servicing platform. Excluding fees associated with NCHLS, net contractual servicing fees increased as comparedto 2006 due to growth in the mortgage loan portfolio serviced for others. The unpaid principal balance associated withNational City Mortgage (NCM) loans serviced for others was $179.4 billion and $162.3 billion at December 31, 2007and 2006, respectively. Servicing asset time decay and payoffs represent the decrease in the MSR value due to thepassage of time from both payoffs and regularly scheduled loan principal payments. Payoffs slowed in 2007 comparedto prior years due to rising interest rates.
Net MSR hedging gains were $36 million in 2007, compared to losses of $294 million in 2006, and gains of$275 million in 2005. In 2006, the Corporation implemented a new prepayment forecasting model, which increasednet MSR hedging losses by $56 million. In prior periods, a third-party model was utilized to forecast loan prepayments.Both models utilize empirical data drawn from the historical performance of the Corporation’s managed portfolio.However, the new model considers more loan characteristics in estimating future prepayment rates. In 2005, changesin the MSR valuation model increased loan servicing income by $39 million. Net MSR hedging gains and lossesassociated with the NCHLS servicing assets were not significant.
The value of MSRs is sensitive to changes in interest rates. In a low rate environment, mortgage loan refinancings typicallyincrease, causing actual and expected loan prepayments to increase, which drives down the value of existing MSRs.Conversely, as interest rates rise, mortgage loan refinancings typically decline, causing actual and expected loanprepayments to decrease, which drives up the value of MSRs. The Corporation manages the risk associated with declinesin the value of MSRs using derivative instruments and securities. Unrealized net gains associated with derivatives utilizedto hedge MSRs were $146 million as of December 31, 2007. The ultimate realization of these gains can be affected bychanges in interest rates, which may increase or decrease the ultimate cash settlement of these instruments.
Other consumer loans servicing revenue increased in 2007 compared to the prior two years due to growth in theserviced portfolio resulting primarily from recent loan sales and securitizations where the Corporation retained servicingrights. The Corporation began selling home equity lines of credit and home equity loans, on a servicing retained basis,in late 2005 and mid 2006, respectively. Servicing revenue was low in 2005 due to the effect of consumer bankruptcieson securitized credit cards.
Brokerage revenue increased compared to the prior two years due to higher commissions and lower trading losses.Leasing revenue declined in 2007 due to continued runoff of the leased automobile portfolio, which more than offsetgrowth in the commercial leasing portfolio.
19

Card-related fees for 2007 increased by 15% compared to 2006 and 19% compared to 2005, mainly due tointerchange fees driven by higher transaction volumes.
Principal investments represent direct investments in private and public companies and indirect investments in privateequity funds. Principal investment gains include both market value adjustments and realized gains from sales of theseinvestments, and can vary from year to year due to changes in fair value and decisions to sell versus hold variousinvestments. Principal investment gains were lower in 2007 compared to the prior year due to a decrease inperformance and lower realized gains on sale. Principal investment gains were higher in 2006 than 2005 due to betterperformance and higher realized gains on sale.
Derivative gains/(losses) include certain ineffective hedge gains/(losses) on derivatives designated as SFAS 133 qualifyinghedges, and fair value adjustments on derivatives not designated as SFAS 133 qualifying hedges. These derivatives areheld for trading purposes, to hedge the fair value of certain recognized assets and liabilities, and to hedge certainforecasted cash flows. Derivatives used to hedge mortgage loans held for sale and MSRs are presented within loan salerevenue and loan servicing revenue, respectively. In 2007 net gains were recognized on derivatives held for tradingpurposes. These net gains were offset by net losses due to fair value write-downs recognized on derivatives held forinterest-rate risk management purposes which are not designated as SFAS 133 qualifying hedges.
Gain on divestitures for 2007 reflects the sale of three branches located in western Illinois. In 2006, the Corporationsold its First Franklin nonprime mortgage origination and related servicing platform for a realized gain of $984 million.The 2005 amount reflects the sale of Madison Bank & Trust.
Net security gains/(losses) and their effect on diluted net income per share are shown in the following table:
(In Millions, Except Per Share Amounts) 2007 2006 2005
Net gains/(losses):Equity securities $ (4) $ 5 $ 13Debt securities 26 (5) 14
Net pretax gains 22 — 27Tax provision 8 — 7Effect on net income $ 14 $— $ 20Effect on diluted net income per share $.02 $— $.03
In 2007, the loss on equity securities represents an other-than-temporary impairment on FNMA and FHLMC perpetualpreferred securities. In prior years, equity securities gains were primarily associated with an internally managed portfolioof bank and thrift common stock investments. Debt securities gains/(losses) arise from the fixed income investmentportfolio maintained for balance sheet management purposes. During 2007, certain fixed income investments used forbalance sheet management purposes were sold, resulting in a realized gain.
There were no significant unusual items in other noninterest income in 2007 or 2005. Other noninterest income for2006 included $36 million of income related to the release of a chargeback guarantee liability associated with a now-terminated credit card processing agreement.
20

Noninterest Expense
Details of noninterest expense follow:
(In Millions) 2007 2006 2005
Salaries, benefits, and other personnel $2,580 $2,604 $2,560Impairment, fraud & other losses 614 51 91Third-party services 357 352 332Equipment 335 326 303Net occupancy 315 298 316Marketing and public relations 157 148 165Postage and supplies 146 140 143Leasing expense 119 165 179Insurance 89 112 60Intangible asset amortization 81 47 52State and local taxes 77 51 74Travel and entertainment 77 77 85Telecommunications 70 75 82Card processing 32 28 21Other 256 237 272Total noninterest expense $5,305 $4,711 $4,735
Comparisons of 2007 to prior years are affected by acquisitions which resulted in higher personnel costs, intangiblesamortization and integration costs, as well as other unusual items discussed below. Acquisition integration costs were$68 million in 2007, $12 million in 2006, and $45 million in 2005.
Details of salaries, benefits, and other personnel expense follow:
(Dollars in Millions) 2007 2006 2005
Salaries and wages $ 1,434 $ 1,424 $ 1,422Incentive compensation 696 811 809Deferred personnel costs (302) (403) (457)Contract labor 157 172 199Payroll taxes 150 161 156Medical and other benefits 137 154 144Retirement plans 116 110 113Stock-based compensation 76 68 57Deferred compensation (1) 42 16Severance 83 30 61Other personnel costs 34 35 40Total salaries, benefits, and other personnel $ 2,580 $ 2,604 $ 2,560Full-time-equivalent employees at year end 32,064 31,270 34,270
Salaries, benefits, and other personnel costs decreased slightly in 2007 compared to 2006. Incentive compensationdecreased based on lower mortgage loan originations, primarily from the sale of the First Franklin nonprime mortgageorigination unit at the end of 2006. Deferred personnel costs decreased for the same reasons. Deferred compensationcosts, which represent market value adjustments on deferred compensation liabilities, decreased in 2007 due to adecrease in the investment indices used to value these obligations. Severance costs increased in 2007 as a result ofmortgage restructuring actions and reductions in corporate staff units. Contract labor decreased in 2007 from 2006 asa result of reduced mortgage production and general cost cutting. Medical and other benefits decreased in 2007compared to 2006 as a result of a reduction in claims processed due to reduced staffing and the introduction of highdeductible plans.
Salaries, benefits, and other personnel costs were relatively flat in 2006 compared to 2005. Deferred personnel costsdecreased as a result of lower mortgage loan originations, which more than offset the increase in capitalized labor forinternally developed software. Contract labor costs were lower in 2006 versus 2005 as the prior year included expensesrelated to contract programmers hired to develop new systems and temporary help engaged in acquisition integration
21

activities. Market valuation adjustments on deferred compensation liabilities increased compared to 2005 due toincreases in the investment indices used to value these obligations. Severance costs were lower in 2006 as 2005included a $43 million charge related to the elimination of a number of management positions.
Impairment, fraud, and other losses increased in 2007 compared to 2006 and 2005. The Corporation recorded$289 million in indemnification charges in 2007 for its obligation as a Visa member with respect to Visa’s third-partylitigation. The restructuring and downsizing of the mortgage business led to a goodwill impairment charge of$181 million and asset impairment charges of $44 million in 2007. A litigation settlement for $25 million alsocontributed to higher losses in 2007. There were no unusual items recorded in 2006. Impairment, fraud and otherlosses for 2005 included an $18 million impairment charge on several underutilized buildings which were sold.
Equipment costs increased in 2007 compared to 2006 due to technology and software upgrades as well as costsassociated with recent acquisitions. Equipment costs increased in 2006 compared to 2005 due to increases inmaintenance contract costs, software license fees, and technology upgrade costs.
Net occupancy costs increased in 2007 compared to 2006 due to higher depreciation expense, building operating costs,and maintenance expenses as a result of recent acquisitions. Net occupancy expense decreased in 2006 compared tothe prior year due to a $29 million one-time adjustment for lease accounting in 2005.
Marketing and public relations increased in 2007 compared to 2006 as a result of increased Internet advertising, as wellas print, radio and outdoor advertisements in new markets, primarily Florida. Marketing and public relations decreasedin 2006 as 2005 included contributions of appreciated securities to the Corporation’s charitable foundation in theamount of $30 million, with no similar contributions in either 2007 or 2006. Partially offsetting this decrease werehigher advertising costs during 2006 associated with promoting loan and deposit products, along with the points fromNational City» rewards program. Leasing expense decreased in 2007 compared to 2006 and 2005 as a result of alower portfolio of equipment leased to others. The leased automobile portfolio continues to liquidate.
Insurance expense decreased in 2007 compared to 2006 due to lower private mortgage insurance costs on liquidatingresidential real estate and consumer loan portfolios. Insurance expense increased in 2006 compared to 2005 due to anincreased percentage of insured mortgage and consumer loans.
Intangible asset amortization increased in 2007 compared to 2006 and 2005 related to core deposits amortizationrelated to recent acquisitions, primarily Fidelity and MAF. Intangible asset amortization decreased in 2006 compared to2005 as certain intangible assets reached the end of their amortization period.
State and local nonincome tax expense was lower in 2006 than either 2007 or 2005 mainly to reversals of previouslyestablished reserves that were no longer required.
The increase in other noninterest expense in 2007 compared to 2006 was due to higher costs associated withforeclosure properties of $55 million due to fair value write-downs and losses on disposition as well as, increasedforeclosure expenses. Other noninterest expense decreased in 2006 compared to the prior year due to $24 million oflower foreclosure losses and $9 million of lower minority ownership expenses.
The efficiency ratio, equal to noninterest expense as a percentage of tax-equivalent net interest income and total feesand other income, was 75.46% in 2007, 54.45% in 2006, and 58.95% in 2005. The higher efficiency ratio in 2007compared to 2006 was the result of the large impairment and other losses mentioned above, combined with lowernoninterest income, driven by lower loan sale revenues and lower gains on divestitures. The lower efficiency ratio in2006 was primarily related to higher noninterest income which reflects higher loan sale revenue and the gain on sale ofFirst Franklin.
Income Taxes
The effective tax rate was 15% in 2007 versus 33% in both 2006 and 2005. The lower tax rate in 2007 resulted fromfixed amounts of favorable tax credits and other adjustments representing a larger percentage of income tax expense in
22

2007 due to lower earnings. The tax provisions for 2007, 2006, and 2005 included net tax benefits of $5 million,$23 million and $7 million, respectively, related to the reorganization of certain subsidiaries, the resolution of certaintax contingencies as well as federal and state audit claims, and provision true-ups associated with the completion ofthe actual tax returns. A reconciliation of the effective tax rate to the statutory rate is included in Note 21.
Line of Business Results
The Corporation’s businesses are organized by product and service offerings as well as the distribution channelsthrough which these products and services are offered. Effective January 1, 2007, the Corporation implemented areorganization of its management structure resulting in the following five reportable segments: Retail Banking,Commercial Banking-Regional, Commercial Banking-National, Mortgage Banking, and Asset Management. Furtherdiscussion of the activities of each of these businesses is presented in Note 27. All revenues and expenses not directlyassociated with or allocated to these segments are reported within Parent and Other. Parent and Other also includesrevenues and expenses associated with discontinued products or services and exited businesses, including the formerFirst Franklin unit and the related liquidating portfolio.
Summary results of operations and related discussion for each business follows. Net interest income is presented on atax-equivalent basis in the tables below. Comparisons of current year results to prior periods are affected by recentacquisition and divestiture activities, as well as unusual or nonrecurring transactions as described below.
Retail Banking: This business provides banking products and services to consumers and small businesses withinNational City’s nine-state footprint.
(In Millions) 2007 2006 2005
Net interest income $2,304 $1,996 $1,906Provision for loan losses 289 183 252Noninterest income 1,189 1,060 955Noninterest expense 2,020 1,733 1,607Net income 716 700 616
Net interest income increased in 2007 due to growth in average outstanding loans and deposits, partially offset bylower loan spreads. Average loans outstanding were $25.1 billion in 2007, $21.9 billion in 2006 and $21.4 billion in2005. Average core deposits were $65.9 billion for 2007, $55.2 billion for 2006, and $52.6 billion for 2005. Both loansand deposits grew from expansion of customer relationships, new customers, and acquisitions. Net interest margin was3.23% in 2007, down compared to the prior two years due primarily to narrower spreads on loans. The provision forloan losses increased compared to 2006 due primarily to growth in the loan portfolio. In addition, 2006 benefited fromlower credit losses following the change in consumer bankruptcy laws in late 2005, as well as enhancements to theprocess of estimating losses on other consumer revolving credit. Noninterest income increased in 2007 due to higherdeposit and other service fees, as well as higher brokerage revenue. The growth in deposit service fees reflects a highervolume of fee-generating transactions due to household growth and acquisitions. The increase in brokerage revenuereflects higher business volumes. Noninterest income for 2007 included a $16 million gain realized on the sale of threebranches. A similar gain was realized on branch sales in 2005. Noninterest expense increased in 2007 due to higherpersonnel and other operating expenses associated with increased business volumes.
Commercial Banking-Regional: This business provides banking products and services to large- and medium-sizedcompanies within National City’s nine-state footprint.
(In Millions) 2007 2006 2005
Net interest income $1,099 $1,076 $1,034Provision (benefit) for loan losses 134 68 (11)Noninterest income 234 222 216Noninterest expense 547 513 474Net income 402 443 486
23

Net interest income increased compared to the prior two years due to growth in loans outstanding. Average loansoutstanding were $33.2 billion in 2007, $29.9 billion in 2006, and $28.2 billion in 2005. Net interest margin was3.02% in 2007, down from the prior two years due to narrower loan spreads. The provision for loan losses increased in2007 primarily due to growth in the loan portfolio and higher probable credit losses associated with loans to regionalresidential real estate developers. Noninterest income increased compared to the prior two years due primarily to higherdeposit and commercial card fees. Noninterest expense increased in 2007 compared to the prior two years primarilydue to higher personnel costs and other expenses associated with higher business volumes.
Commercial Banking-National: This business provides banking products and services to targeted customer segmentsin selected industries or distribution channels, as well as to corporate customers outside of National City’s branchfootprint.
(In Millions) 2007 2006 2005
Net interest income $474 $456 $452Provision for loan losses 59 3 2Noninterest income 472 525 385Noninterest expense 432 406 330Net income 286 372 316
Net interest income increased in 2007 on higher loans outstanding. Average loans outstanding were $15.4 billion in2007, $13.0 billion in 2006 and $10.9 billion in 2005. Net interest margin was 2.68% in 2007, down compared to theprior two years due to narrower spreads on loans. The provision for loan losses increased in 2007 which largely reflectshigher probable credit losses for national residential real estate developers, as well as growth in the portfolio.Noninterest income decreased in 2007 compared to 2006 due to lower loan sales and principal investment gains,partially offset by higher brokerage revenue. Loan sale revenue for 2006 included a $27 million gain on sale ofcommercial leases. Principal investments gains were $96 million in 2007 compared to $122 million in 2006. Noninterestincome increased compared to 2005 due primarily to higher business volumes and the aforementioned principalinvestment gains. Noninterest expense increased in 2007 compared to the prior year due to higher personnel costs andoperating expenses associated with new business.
Mortgage Banking: This business originates residential mortgages, home equity loans, and home equity lines of creditwithin National City’s banking footprint and on a nationwide basis. During 2007, unprecedented disruption occurred inthe capital markets resulting in an inability to sell many nonagency eligible mortgage and home equity products. Inresponse to these conditions, management ceased production of mortgage loans, home equity loans and home equitylines of credit originated by brokers. Nonsalable mortgage loans, previously held for sale, were transferred to portfolio.The Mortgage Banking segment reported a net loss in 2007 due to these adverse market conditions, restructuringactivities, and the settlement of certain litigation.
(In Millions) 2007 2006 2005
Net interest income $ 663 $607 $720Provision for loan losses 579 75 58Noninterest income 211 365 833Noninterest expense 1,086 805 843Net (loss) income (541) 58 419
Net interest income increased in comparison to 2006 due to higher average loans outstanding, but decreasedcompared to 2005 due to lower loan spreads and higher nonperforming assets. Average loans outstanding were$28.1 billion in 2007, $22.6 billion in 2006 and $25.6 billion in 2005. Average loans outstanding grew in 2007 due todisruptions in the markets for certain mortgage products which resulted in the transfer of $7.2 billion of formerly heldfor sale loans to portfolio. Net interest margin was 2.10% in 2007, down compared to the prior two years due tonarrower loan spreads. The higher provision for loan losses in 2007 reflects higher estimated probable credit losses,particularly for residential construction loans and broker-sourced home equity loans and lines of credit. Delinquencies,nonperforming assets and net charge-offs have all increased in comparison to prior years. Declining real estate valueshave adversely affected the ability of these borrowers to repay their loans.
24

Noninterest income decreased in comparison to the prior two years due to adverse mortgage market conditions. Netloan sale losses were $(90) million in 2007, versus loan sale revenue of $441 million in 2006 and $551 million in 2005.Fair value write-downs of $197 million were recognized in 2007 on loans held for sale due to deteriorating marketvalues, failed trades and trade fallout. Loan servicing revenue/(loss) was $276 million in 2007, compared to$(109) million in 2006, and $283 million in 2005. The unpaid principal balance associated with loans serviced for othersgrew to $189.4 billion at December 31, 2007, up from $169.4 billion at December 31, 2006 and $160.9 billion atDecember 31, 2005. Included within loan servicing revenue were net MSR hedging gains/(losses) of $36 million in2007, $(276) million in 2006 and $286 million in 2005. Net MSR hedging results are affected by changes in therelationship between mortgage rates, which affect the value of MSRs, and swap rates, which affect the value of someof the derivatives used to hedge MSRs. During 2007, this spread widened in comparison to the prior year. In 2006,net MSR hedging losses for 2006 included a $56 million fair value write-down associated with implementing a newprepayment model. In 2005, changes in the MSR valuation model increased net MSR hedging gains by $39 million.
Noninterest expense increased in 2007 due to goodwill and other asset impairment charges of $224 million, severancecosts of $36 million, and settlement of litigation for $25 million. In the last half of 2007, restructuring of this businessreduced staffing to 5,859 employees down from 7,289 employees a year ago.
Effective January 1, 2006, the Corporation prospectively changed its internal methodology for assigning interest crediton mortgage escrow accounts from a short-term rate to a longer-term swap rate to better reflect the duration of theseaccounts. Had this same methodology been applied in 2005, net income would have been higher by approximately$16 million.
Asset Management: This segment includes both institutional asset management and personal wealthmanagement services.
(In Millions) 2007 2006 2005
Net interest income $139 $130 $118Provision for loan losses 12 3 8Noninterest income 376 353 344Noninterest expense 343 322 326Net income 100 98 80
Net interest income increased compared to 2006 and 2005 due to higher average loans and deposits. Averageoutstanding loans were $3.8 billion in 2007, $3.4 billion in 2006, and $3.1 billion in 2005. Average core deposits were$2.8 billion in 2007, $2.0 billion in 2006, and $1.9 billion in 2005. Net interest margin was 3.36% for 2007, downcompared to the prior two years due to narrower spreads on both loans and deposits. The provision for loan lossesincreased in 2007 due to a few problem accounts and higher loan balances. In addition, the 2006 provision for loanlosses was low due to enhancements in the process of estimating credit losses on consumer revolving loans.Noninterest income increased in 2007 due to higher trust and investment management fees, and to a lesser extent,higher brokerage revenues. Noninterest expense increased in 2007 on higher personnel costs associated with increasedbusiness volumes. Assets under administration grew to $114.8 billion at December 31, 2007, up from $112.2 billion atDecember 31, 2006.
Parent and Other: Parent and Other includes the results of investment funding activities, liquidating portfoliosassociated with certain discontinued businesses, unallocated corporate income and expense, intersegment revenue andexpense eliminations, and reclassifications. Parent and Other also includes the historical operating results of the formerFirst Franklin nonprime mortgage origination and servicing platform, as well as acquisition integration costs and otherunusual or infrequently occurring items.
25

(In Millions) 2007 2006 2005
Net interest (expense) income $(254) $ 369 $ 496Provision (benefit) for loan losses 252 156 (9)Noninterest income 124 1,494 571Noninterest expense 878 933 1,154Net (loss) income (649) 629 68
Net interest expense occurred in 2007 versus net interest income in the prior two years due to higher debt and fundingcosts exceeding the net interest income from liquidating portfolios. Average loans outstanding were $9.8 billion in2007, $22.1 billion in the preceding year, and $27.3 billion two years ago. The provision for loan losses in this segmentincludes estimated probable credit losses on the nonprime mortgage loan portfolio, eliminations of provisionsrecognized in other segments on securitized loans, and the reclassification of the provision for reinsurance losses whichis recorded in noninterest expense within the Retail Banking segment. The higher provision for credit losses in 2007reflects continued deterioration in the credit quality of the nonprime mortgage loan portfolio.
Noninterest income for 2006 included a $984 million pretax gain on the sale of the Corporation’s former First Franklinunit. In addition, First Franklin contributed $264 million and $283 million to noninterest income in 2006 and 2005,respectively. There was no similar revenue in 2007 results as this unit was sold in late 2006. Fair value write-downs onnonprime mortgage loans held for sale were $23 million in 2007, $85 million in 2006, with no such losses in 2005. Therelease of a chargeback guarantee liability in 2006 benefited noninterest income by $36 million while the securitizationof indirect automobile loans in 2005 reduced noninterest income by $29 million.
Noninterest expense in 2007 included $289 million of Visa indemnification losses. Otherwise, expenses were lower in2007 due to the sale of First Franklin in late 2006 which accounted for $524 million and $444 million of noninterestexpense in 2006 and 2005, respectively. Noninterest expense benefited from a $48 million and $79 millionreclassification of Retail Banking’s reinsurance losses to the provision for credit losses in 2007 and 2006, respectively.Noninterest expense for 2005 included net nonrecurring charges of $55 million for charitable contributions, impairmentcharges and other matters. Severance costs were $62 million in 2007, $33 million in 2006, and $68 million in 2005.Net income tax benefits/(provision) were $5 million, $13 million, and $(6) million in 2007, 2006, and 2005, respectively,from return-to-provision true-ups, the reorganization of certain subsidiaries, as well as the resolution of taxcontingencies.
26

Financial Condition
Portfolio Loans: End-of-period and average portfolio loan balances by category follow:
(In Millions) 2007 2006 2005 2004 2003As of December 31:Commercial $ 30,914 $26,969 $ 24,026 $ 22,324 $17,737Commercial leases 4,437 4,083 3,546 2,836 1,427Commercial construction 9,051 7,160 5,344 3,483 2,766Commercial real estate 14,883 12,436 12,407 12,193 9,828Residential real estate 30,243 21,882 30,846 29,838 26,917Home equity lines of credit 18,080 14,595 21,439 19,018 11,016Credit card and other unsecured lines of credit 3,915 3,007 2,612 2,414 2,324Other consumer 4,499 5,360 5,819 8,165 7,329Total portfolio loans $116,022 $95,492 $106,039 $100,271 $79,344
Average:Commercial $ 28,440 $25,417 $ 23,730 $ 20,079 $19,852Commercial leases 4,168 3,566 3,171 2,024 1,538Commercial construction 8,151 6,286 4,264 3,062 2,383Commercial real estate 13,522 12,062 12,033 11,162 9,483Residential real estate 26,035 26,632 30,941 28,324 23,261Home equity lines of credit 15,488 17,128 21,118 14,743 9,293Credit card and other unsecured lines of credit 3,285 2,626 2,381 2,286 2,155Other consumer 4,907 5,673 7,637 7,527 7,906Total portfolio loans $103,996 $99,390 $105,275 $ 89,207 $75,871
National City’s commercial and commercial real estate portfolios represent a broad and diverse customer basecomprising over 900 different standard industrial classifications. The customer base is geographically dispersed withinNational City’s nine-state footprint and in selected national accounts. The Corporation has no loans to borrowers insimilar industries that exceed 10% of total loans. The following table summarizes the major industry categories andexposure to individual borrowers for commercial, commercial leases, commercial construction, and commercial realestate as of December 31, 2007.
(Dollars in Millions)Outstanding
Balance% ofTotal
Average Loan BalancePer Obligor
Largest Loan to a SingleObligor
Real estate $19,553 33% $1.1 $ 67Consumer cyclical 9,604 16 1.1 96Industrial 7,574 13 1.5 171Consumer noncyclical 6,511 11 .6 46Basic materials 4,108 7 1.8 67Financial 4,154 7 2.3 150Services 2,138 3 .5 56Energy and utilities 1,103 2 1.4 35Technology 575 1 3.6 45Miscellaneous 3,965 7 .3 105Total $59,285 100%
Commercial: The commercial loan category includes loans to a wide variety of businesses across many industries andregions. Included in this category are loans directly originated by National City and syndicated transactions originatedby other financial institutions. The Corporation’s commercial lending policy requires each loan, regardless of whether itis directly originated or purchased through syndication, to have viable repayment sources. The risks associated withloans in which National City participates as part of a syndicate of financial institutions are similar to those of directlyoriginated commercial loans; however, additional risks may arise from National City’s limited ability to control actions ofthe syndicate.
27
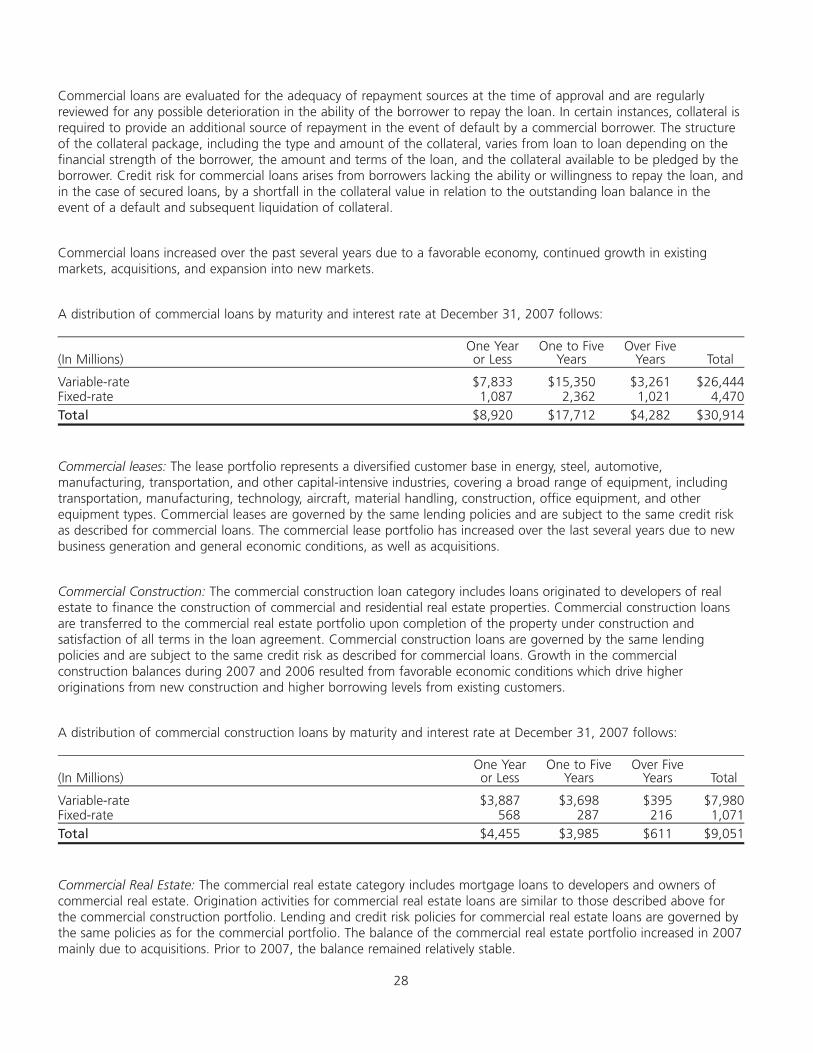
Commercial loans are evaluated for the adequacy of repayment sources at the time of approval and are regularlyreviewed for any possible deterioration in the ability of the borrower to repay the loan. In certain instances, collateral isrequired to provide an additional source of repayment in the event of default by a commercial borrower. The structureof the collateral package, including the type and amount of the collateral, varies from loan to loan depending on thefinancial strength of the borrower, the amount and terms of the loan, and the collateral available to be pledged by theborrower. Credit risk for commercial loans arises from borrowers lacking the ability or willingness to repay the loan, andin the case of secured loans, by a shortfall in the collateral value in relation to the outstanding loan balance in theevent of a default and subsequent liquidation of collateral.
Commercial loans increased over the past several years due to a favorable economy, continued growth in existingmarkets, acquisitions, and expansion into new markets.
A distribution of commercial loans by maturity and interest rate at December 31, 2007 follows:
(In Millions)One Yearor Less
One to FiveYears
Over FiveYears Total
Variable-rate $7,833 $15,350 $3,261 $26,444Fixed-rate 1,087 2,362 1,021 4,470Total $8,920 $17,712 $4,282 $30,914
Commercial leases: The lease portfolio represents a diversified customer base in energy, steel, automotive,manufacturing, transportation, and other capital-intensive industries, covering a broad range of equipment, includingtransportation, manufacturing, technology, aircraft, material handling, construction, office equipment, and otherequipment types. Commercial leases are governed by the same lending policies and are subject to the same credit riskas described for commercial loans. The commercial lease portfolio has increased over the last several years due to newbusiness generation and general economic conditions, as well as acquisitions.
Commercial Construction: The commercial construction loan category includes loans originated to developers of realestate to finance the construction of commercial and residential real estate properties. Commercial construction loansare transferred to the commercial real estate portfolio upon completion of the property under construction andsatisfaction of all terms in the loan agreement. Commercial construction loans are governed by the same lendingpolicies and are subject to the same credit risk as described for commercial loans. Growth in the commercialconstruction balances during 2007 and 2006 resulted from favorable economic conditions which drive higheroriginations from new construction and higher borrowing levels from existing customers.
A distribution of commercial construction loans by maturity and interest rate at December 31, 2007 follows:
(In Millions)One Yearor Less
One to FiveYears
Over FiveYears Total
Variable-rate $3,887 $3,698 $395 $7,980Fixed-rate 568 287 216 1,071Total $4,455 $3,985 $611 $9,051
Commercial Real Estate: The commercial real estate category includes mortgage loans to developers and owners ofcommercial real estate. Origination activities for commercial real estate loans are similar to those described above forthe commercial construction portfolio. Lending and credit risk policies for commercial real estate loans are governed bythe same policies as for the commercial portfolio. The balance of the commercial real estate portfolio increased in 2007mainly due to acquisitions. Prior to 2007, the balance remained relatively stable.
28

A distribution of commercial real estate loans by maturity and interest rate at December 31, 2007 follows:
(In Millions)One Yearor Less
One to FiveYears
Over FiveYears Total
Variable-rate $1,747 $4,004 $2,249 $ 8,000Fixed-rate 719 4,048 2,116 6,883Total $2,466 $8,052 $4,365 $14,883
Residential Real Estate: The residential real estate category includes consumer loans secured by residential real estate,including home equity installment loans. The Corporation’s residential real estate lending policies require all loans tohave viable repayment sources. Residential real estate loans are evaluated for the adequacy of these repayment sourcesat the time of approval, using such factors as credit scores, debt-to-income ratios, and collateral values. Credit risk forresidential real estate loans arises from borrowers lacking the ability or willingness to repay the loans, or by a shortfallin the value of the residential real estate in relation to the outstanding loan balance in the event of a default andsubsequent liquidation of the real estate collateral. These loans were originated by National City Mortgage as well asthe former National Home Equity and First Franklin units. Residential real estate loans are categorized as primemortgages, nonprime mortgages, or home equity installment loans.
End-of-period and average residential real estate portfolio loan balances by category follow:
(In Millions) 2007 2006 2005As of December 31:Prime mortgages $15,349 $ 7,963 $ 5,646Nonprime mortgages 6,012 7,486 18,688Home equity installment 8,882 6,433 6,512Total residential real estate portfolio loans $30,243 $21,882 $30,846
Average:Prime mortgages $11,570 $ 5,883 $ 6,000Nonprime mortgages 7,086 14,396 18,889Home equity installment 7,379 6,353 6,052Total residential real estate portfolio loans $26,035 $26,632 $30,941
Prime mortgage loans principally reflect mortgage loans originated in accordance with underwriting standards set forthby the government-sponsored entities (GSEs) of the Federal National Mortgage Association (FNMA), the Federal HomeLoan Mortgage Corporation (Freddie Mac), and the Government National Mortgage Association (GNMA). Primemortgage production is generally sold in the secondary mortgage market primarily to the GSEs, the Federal Home LoanBanks (FHLB), and third-party loan investors. These loans are generally collateralized by one-to-four-family residentialreal estate, have loan-to-collateral value ratios of 80% or less, and are made to borrowers in good credit standing. TheCorporation originates prime loans through retail mortgage offices located throughout the United States and throughNational City Bank branches located within the Corporation’s nine-state footprint. In 2007, the Corporation terminatedbroker-based wholesale mortgage lending.
In the last half of 2007, certain prime mortgage loans, including jumbo mortgage loans and loans with nonstandarddocumentation, were not readily salable as concerns about the credit quality of subprime mortgages spread to othermortgage products. The increase in prime mortgage loans during 2007 reflects loans added with recent acquisitionsand transfers of formerly held for sale mortgages of $1.8 billion to portfolio.
Nonprime mortgage loans, which include both first and second lien mortgages, were originated by the Corporation’sformer First Franklin unit which was sold in late 2006. Nonprime mortgage loans were generally not readily salable inthe secondary market to the GSEs for inclusion in mortgage-backed securities due to the credit characteristics of theborrower, the underlying documentation, the loan-to-value ratio, or the size of the loan, among other factors.However, prior to 2007, these loans were generally salable to other third-party investors. Nonprime mortgage loansincluded interest-only loans and loans with various borrower documentation levels. The Corporation has never offeredmortgages with negative amortization. Third-party credit scores were incorporated into the lending guidelines alongwith loan amount, loan-to-value, and loan purpose. These loans were originated principally through wholesale
29

channels, including a national network of brokers and mortgage bankers. Loan production was primarily located in theWest Coast and East Coast markets.
The decrease in the nonprime mortgage portfolio in 2007 resulted from ongoing pay downs and payoffs, partiallyoffset by the transfer back to portfolio of approximately $1.6 billion of such loans previously held for sale. Managementforecasts that the average runoff of this portfolio will approximate $150-200 million per month in 2008. As ofDecember 31, 2007, interest-only and second-lien loans comprised 21% and 25% of the portfolio, respectively. Theaverage FICO scores associated with first-lien and second-lien loans were 616 and 637, respectively, at December 31,2007. Credit risk related to these loans is mitigated through the use of lender-paid mortgage insurance and a credit risktransfer agreement. As of December 31, 2007, approximately 70% of the remaining nonprime mortgage loan portfoliowas covered by some form of credit protection. See Credit Risk discussion on page 35.
The residential real estate portfolio also includes prime-quality home equity installment loans. These loans wereoriginated through the National City Bank branch network, and on a nationwide basis via mortgage offices and theformer National Home Equity unit. The Corporation does not originate interest-only or pay-option ARM installmentloans. Since late 2005, all originations of broker-sourced home equity loans were for sale. In late 2007, the Corporationhalted originations of broker-sourced home equity loans and transferred $2.4 billion of such loans to portfolio. Duringboth 2007 and 2006, $2.3 billion of broker-sourced home equity loans were sold. As of December 31, 2007, broker-sourced loans represented $3.7 billion of the home equity portfolio, with the top five states being: California (31%),Florida (7%), New York (6%), Washington (5%), and Arizona (5%). The average borrower FICO score of broker-sourced home equity loans was 725 at December 31, 2007. The home equity installment loan portion of the portfolioincreased during 2007 as $2.4 billion of broker-sourced loans were transferred to portfolio from held for sale due tounfavorable market conditions in late 2007. Management forecasts that the average runoff of the remaining portfoliowill approximate $100 million per month in 2008.
Home Equity Lines of Credit: The home equity category consists mainly of revolving lines of credit secured by residentialreal estate. Home equity lines of credit are generally governed by the same lending policies and subject to credit risk asdescribed above for prime mortgage loans. These loans were originated directly through National City Bank branches,as well as on a nationwide basis through mortgage offices and by the former National Home Equity unit. As describedabove, originations of broker-sourced home equity lines of credit ceased in August 2007. Broker-sourced linesrepresented $7.5 billion of the home equity line of credit portfolio at December 31, 2007 with California (29%), NewYork (10%), Florida (6%), Maryland (5%), and Virginia (5%) representing the top five lending states. The averageborrower FICO score for broker-sourced lines was 725 as of December 31, 2007. The portfolio of home equity lines ofcredit increased during 2007 as $3.0 billion of this product was transferred to portfolio from held for sale due tounfavorable market conditions in the last half of 2007. Management expects this portfolio to decrease in future periodsas the broker-sourced portion of the portfolio runs off. The average run-off of this portfolio is expected to approximate$70-75 million per month in 2008. Prior to 2006, the home equity line of credit portfolio increased annually assubstantially all production was originated for portfolio, and favorable interest rates spurred record production levels.
Credit Cards and Other Unsecured Lines of Credit: This category includes the outstanding balances on open-endedcredit card accounts and unsecured personal and business lines of credit. Credit card loans are typically unsecured andare generally governed by similar lending policies and credit risk as described for residential real estate and consumerloans. The increase in credit cards and other unsecured lines of credit over the past two years was reflective of newproducts, targeted marketing through the branch network, and greater usage.
Other Consumer: Other consumer loans include indirect installment loans, automobile leases, and student loans. Theseloans are generally governed by the same lending policies as described for residential real estate. Credit risk forconsumer loans arises from borrowers lacking the ability or willingness to repay the loan, and in the case of securedloans, by a shortfall in the value of the collateral in relation to the outstanding loan balance in the event of a defaultand subsequent liquidation of collateral. The primary reason for the decline in other consumer loans in 2007 was thecontinued run-off of liquidating portfolios which include indirect automobile loans, automobile leases, and otherrecreational vehicle loans. The decline in other consumer loans in 2006 and 2005 was primarily the result of thesecuritization of automobile loans of $2.2 billion in late 2005 and $890 million in 2004.
30

Loans Held for Sale or Securitization: End-of-period and average loans held for sale or securitization follow:
(In Millions) 2007 2006 2005 2004 2003
As of December 31:Commercial $ 41 $ 34 $ 11 $ 24 $ 16Commercial real estate 508 177 35 546 —Residential real estate 3,741 9,328 9,192 11,860 14,497Automobile — — — — 854Credit card — 425 425 — —Student loans — 1 4 — —Home equity lines of credit — 2,888 — — —Total loans held for sale or securitization $ 4,290 $12,853 $ 9,667 $12,430 $15,367
Average:Commercial $ 79 $ 41 $ 18 $ 28 $ 13Commercial real estate 278 111 198 164 —Residential real estate 8,842 10,859 10,547 12,071 22,671Automobile — — 179 132 153Credit card 91 124 142 — —Student loans 1 7 2 — —Home equity lines of credit 2,045 2,405 4 — —Total loans held for sale or securitization $11,336 $13,547 $11,090 $12,395 $22,837
In the last half of 2007, the markets for sale of mortgage loans were severely disrupted. As a result, the Corporationwas unable to sell certain nonagency-eligible mortgage loans and home equity loans and lines of credit that had beenoriginated for sale, and these loans were transferred into portfolio. Substantially all originations of residential real estatemortgages other than agency-eligible products have been curtailed. During 2007, the Corporation transferred intoportfolio $5.8 billion of residential real estate loans and $3.0 billion of home equity lines of credit. At December 31,2007, $1.1 billion of nonagency-eligible mortgages loans remained in residential real estate loans held for sale and aredeemed readily salable. The decrease in loans held for sale or securitization was also due to the sale of the First Franklinnonprime mortgage origination and sales platform during late 2006.
The Corporation has originated certain nontraditional interest-only and payment option adjustable-rate mortgage(ARM) loans, which allow borrowers to exchange lower payments during an initial period for higher payments later.The loans were made to prime borrowers and underwritten in accordance with bank regulatory guidelines, whichinclude evaluating borrower repayment capacity based on the fully indexed rate and a fully amortizing repaymentschedule. In 2007, originations of interest-only loans represented approximately 28% of total production, and payment-option ARMs less than one percent. All interest-only and payment option ARM production is sold into the secondarymortgage market.
As of December 31, 2006 and 2005, $425 million of credit card loans were classified as held for saleawaiting securitization.
During 2007, 2006, and 2005, the Corporation sold $3.4 billion, $5.5 billion, and $1.4 billion, respectively, of broker-sourced home equity lines of credit. Prior to 2005, all such loans were originated for portfolio. The increase in averageloans held for sale or securitization in 2006 was primarily due to the implementation of the originate-and-sell strategyfor nonprime mortgage loans and home equity lines and loans. Also, in 2006, the Corporation made a strategicdecision to sell a large pool of nonprime mortgage loans from portfolio. At December 31, 2006, $1.6 billion of theseloans remained in held for sale pending the resolution of documentation defects identified during due diligence bypotential purchasers. During early 2007, these loans were transferred back into portfolio due to poor marketconditions.
The decrease in average loans held for sale or securitization in 2005 and 2004 was primarily the result of lowermortgage production.
31

Securities: Securities balances at December 31 follow:
(In Millions) 2007 2006 2005 2004 2003
U.S. Treasury $1,056 $1,051 $ 993 $ 410 $ 625Federal agency 262 250 181 243 12Mortgage-backed securities 6,610 5,306 5,437 6,309 3,928Asset-backed and corporate debt securities 204 175 246 510 931States and political subdivisions 382 500 608 705 672Other securities 194 221 416 423 154Total amortized cost $8,708 $7,503 $7,881 $8,600 $6,322
Total fair value $8,731 $7,509 $7,875 $8,765 $6,525
The increase in the securities portfolio in 2007 resulted primarily from recent acquisitions. The decrease in the securitiesportfolio in 2006 and 2005 resulted from sales and principal pay downs of mortgage-backed securities, state andpolitical subdivision securities, and asset-backed securities, partially offset by increases in U.S. Treasury securities. In2006, $737 million of mortgage-backed securities were sold as part of a program to reduce interest-rate risk associatedwith optionality embedded in other balance sheet products, including securities, loans and deposits. At December 31,2007, the securities portfolio had net unrealized gains of $23 million. The weighted-average yield of debt securitiesincluded in the portfolio at December 31, 2007 and 2006 was 5.31% and 5.11%, respectively, computed on a tax-equivalent basis.
Funding: Detail of average deposit and borrowed funds balances follows:
(In Millions) 2007 2006 2005 2004 2003
Noninterest bearing $ 16,824 $ 16,814 $ 18,257 $ 17,763 $ 17,203NOW and money market 34,769 28,900 28,589 28,897 25,378Savings 2,540 1,970 2,361 2,583 2,423Consumer time 26,632 21,711 18,662 14,875 13,729
Core deposits 80,765 69,395 67,869 64,118 58,733Other deposits 3,590 5,512 6,087 3,062 2,752Foreign deposits 8,095 8,553 8,787 8,946 7,002
Purchased deposits 11,685 14,065 14,874 12,008 9,754Total deposits 92,450 83,460 82,743 76,126 68,487
Short-term borrowings 8,212 8,574 9,591 9,315 12,464Long-term debt 25,657 30,013 32,752 24,028 24,854Total deposits and borrowed funds $126,319 $122,047 $125,086 $109,469 $105,805
Average funding balances increased in 2007 due to growth in the loan portfolio. In 2006, average funding balancesdecreased due to lower loan portfolio balances resulting from the originate-and-sell strategy.
Interest bearing core deposits, such as NOW and money market deposits and consumer time deposits, have increasedas a percentage of total core deposits due to recent acquisitions and consumer preferences for interest bearingproducts in a higher rate environment. Consumer time deposits consist primarily of certificates of deposit sold to retailbanking customers.
The growth in core deposits during 2007 and 2006 includes deposit balances from acquisitions. In addition, coredeposit growth over the past few years reflects household growth and expansion of relationships per household.Mortgage banking-related escrow deposits averaged $3.7 billion, $4.1 billion, and $4.6 billion in 2007, 2006, and2005, respectively.
32

Other deposits consist principally of deposits acquired through third-party brokers and other noncore certificates ofdeposit. Other certificates of deposit are issued primarily to commercial customers, including trusts and state andpolitical subdivisions. The need for brokered deposits decreased in 2007 and 2006 due to strong core deposit growth.
Certificates of deposit of $100,000 or more totaled $10.4 billion at December 31, 2007, of which $4.2 billion maturewithin three months, $2.5 billion mature between three and six months, $2.2 billion mature between six months andone year, and $1.5 billion mature beyond one year.
Foreign deposits primarily represent U.S. dollar deposits in the Corporation’s Grand Cayman branches from institutionalmoney managers and corporate customers. A small portion of these balances also represents deposits denominated inCanadian dollars associated with National City’s Canadian branch office.
Short-term borrowings are comprised mainly of Federal funds purchased, securities sold under agreements torepurchase, U.S. Treasury demand notes, commercial paper, and short-term senior bank notes. At December 31, 2007and 2006, short-term borrowings included $1.2 billion and $812 million, respectively, of commercial paper. Commercialpaper is issued by the Corporation’s subsidiary, National City Credit Corporation, to support short-term cashrequirements of the holding company and nonbank subsidiaries. Short-term borrowings included $500 million and$434 million, respectively, of U.S. Treasury demand notes at December 31, 2007 and 2006. The amount of the notesheld at any given time can fluctuate significantly depending on the U.S. Treasury’s cash needs. Replacement fundingthrough other short-term channels is available in the event the notes are called. Short-term borrowings have decreaseddue to growth in core deposits.
Long-term debt includes senior and subordinated debt issued by the Corporation or National City Bank and debtobligations related to capital securities issued by subsidiary trusts. A wholesale funding policy governs the fundingactivity of National City Bank. The policy identifies eligible funding instruments and applicable constraints for gatheringdiscretionary liabilities. This policy requires compliance with Section 301 of the FDIC Improvement Act of 1991regarding the issuance of brokered deposits. The Corporation conducts its funding activities in compliance with theBank Secrecy Act and other regulations relating to money laundering activity. Long-term debt decreased during 2007due to strong core deposit growth resulting in a decreased need for other funding sources. The decrease in long-termdebt balances during 2006 was reflective of strong deposit growth together with the reduced need for funding as aresult of lower loan portfolio balances.
Capital
The Corporation maintains regulatory capital at or above regulatory standards for “well-capitalized” institutions. Furtherdetail on capital and capital ratios is included in Notes 18 and 19 to the Consolidated Financial Statements. Informationon stockholders’ equity is presented in the following table.
(Dollars in Millions, Except Per Share Amounts) December 31, 2007 December 31, 2006
Stockholders’ equity $13,408 $14,581Equity as a percentage of assets 8.92% 10.40%Book value per common share $ 21.15 $ 23.06
The following table summarizes share repurchase activity for the fourth quarter of 2007.
Period
Total Numberof Shares
Purchased(a)
AveragePrice PaidPer Share
Total Number ofShares Purchased Under
Publicly AnnouncedShare RepurchaseAuthorizations(b)
Maximum Number ofShares that May Yet BePurchased Under the
Share RepurchaseAuthorizations
Oct 1 to Oct 31, 2007 128,001 $26.21 100,000 37,624,400Nov 1 to Nov 30, 2007 15,337 22.40 — 37,624,400Dec 1 to Dec 31, 2007 47,287 16.67 — 37,624,400
Total 190,625 $23.54 100,000
33

(a) Includes shares repurchased under the April 24, 2007 share repurchase authorizations, and shares acquired underthe Corporation’s Long-term Cash and Equity Compensation Plan (the Plan). Under the terms of the Plan, theCorporation accepts common shares from employees when they elect to surrender previously owned shares uponexercise of stock options or awards to cover the exercise price of the stock options or awards or to satisfy taxwithholding obligations associated with the stock options or awards.
(b) Included in total number of shares purchased [column (a)].
The Corporation’s Board of Directors has authorized the repurchase of up to 40 million shares of National City commonstock subject to an aggregate purchase limit of $1.6 billion. This authorization, which has no expiration date, wasincremental to previous authorizations. Repurchased shares are held for reissue in connection with compensation plansand for general corporate purposes. During 2007, 2006, and 2005, 45.9 million, 20.1 million, and 43.5 million sharesof common stock were repurchased, respectively. Share repurchase activity was curtailed during the fourth quarter of2007, with no current plans to resume in 2008, to allow capital ratios to build toward the top of their target ranges.
On January 25, 2007, the Corporation’s Board of Directors authorized a modified “Dutch auction” tender offer topurchase up to 75 million shares of its outstanding common stock, at a price range not greater than $38.75 per sharenor less than $35.00 per share, for a maximum aggregate repurchase price of $2.9 billion. On March 7, 2007, theCorporation accepted for purchase 40.3 million shares of its common stock at $38.75 per share for an aggregate priceof $1.6 billion. The share repurchase authorizations described above were unaffected by the tender offer.
Dividends per common share were $1.60 in 2007 and $1.52 in 2006. National City has paid dividends in every yearsince its founding except 1868, 1934 and 1935. The dividend payout ratio, representing dividends per share divided byearnings per share, was 313.7% and 40.9% for the years 2007 and 2006, respectively. The unusually high dividendpayout ratio in 2007 reflects the Corporation’s lower earnings. The dividend payout ratio is continually reviewed bymanagement and the Board of Directors, and the current intention is to pay out approximately 45% of earnings individends over time. The decision to pay dividends considers the recent trends and current outlook for earnings,liquidity, and capital adequacy, as well as applicable regulatory guidance. Refer to the Liquidity Risk section for furtherdiscussion regarding the subsidiary bank’s dividend to the holding company. On January 2, 2008, the Board of Directorsdeclared a dividend of $.21 per common share, payable on February 1, 2008, representing a 49% decrease from thepreceding quarter.
At December 31, 2007, the Corporation’s market capitalization was $10 billion. National City common stock is tradedon the New York Stock Exchange under the symbol “NCC.”
Enterprise Risk Management
Risk is an inherent part of National City’s business activities. The major risk types to which the Corporation is exposedinclude credit, market, liquidity, operational, legal, technology, regulatory, financial reporting, private equity, strategic,and reputation risk. The enterprise risk management function establishes a framework for identifying, measuring,controlling and monitoring the risks on an integrated basis in support of sustainable, profitable performance.
The Board of Directors is responsible for ensuring that the Corporation’s risks are managed in a sound manner anddelegates oversight of the risk governance process to the Risk and Public Policy Committee and Audit Committee ofthe Board of Directors. The Board of Directors delegates the day-to-day management of risk to executive management.
There are four components of risk governance in the Corporation: the lines of business and functional units; anindependent risk management function; internal audit; and risk committees.
The business and functional units are primarily accountable for the identification, quantification, mitigation andmanagement of risk. Business unit management develops strategies and is expected to take action to manage andmitigate risks that arise from executing those strategies. Management processes, structure and policies help to complywith laws and regulations, and provide clear lines of sight for decision-making and accountability.
34

The risk management organization provides objective oversight of risk-taking activities and sets specific risk limits. Riskmanagement works with the business units and functional areas to establish appropriate standards and monitorsbusiness practices in relation to those standards. Also, risk management works with the businesses and seniormanagement to focus on key risks and emerging trends that may change the Corporation’s risk profile.
The internal audit function, reporting directly to the Audit Committee of the Board of Directors, provides an objectiveassessment of the design and execution of the Corporation’s internal control system including the managementsystems, risk governance, and policies and procedures. Internal audit activities are designed to provide reasonableassurance that resources are safeguarded; that significant financial, managerial, and operating information is complete,accurate and reliable; and that employee actions comply with policies and applicable laws and regulations.
The risk committees provide a mechanism to bring together the perspectives of the management team to discussemerging risk issues, monitor risk-taking activities and evaluate specific transactions and exposures. The Enterprise RiskCommittee, comprised of executive management, reports to the Board’s Risk & Public Policy Committee and is chargedwith focused oversight of risk management at the executive level. The Enterprise Risk Committee directly oversees theactivities of all key risk management committees, including but not limited to: Corporate Credit Policy and StrategyCommittee, Asset and Liability Committee, Corporate Operational Risk Committee, and New Initiatives ReviewCommittee.
Credit Risk
Credit risk is the risk to earnings or capital resulting from an obligor’s failure to meet the terms of any contract with theCorporation or other failure to perform as agreed. Credit risk is found in all activities where completion depends oncounterparty, issuer, or borrower performance.
The Corporation manages credit risk through a risk management framework. Authority for oversight of credit policyand overall credit risk is delegated to the Corporate Credit Policy and Strategy Committee. The Chief Credit Officer isdelegated the day-to-day management of credit risk activities. The lines of business, under the guidance of the creditrisk framework, have direct and primary responsibility and accountability for identifying, controlling and monitoringcredit risks embedded in their business activities. The Corporation’s internal loan review function reviews and assessesthe credit risk within the loan portfolio.
In 2007, certain consumers began experiencing difficulty making timely payments on their mortgage or home equityloans. Borrowers facing interest-rate resets on their loans, have in many cases been unable to refinance their loans dueto a range of factors including declining property values. As a result, the Corporation has experienced higherdelinquencies, nonperforming assets and charge-offs in its residential real estate loan portfolios, as well as incommercial construction loans to residential real estate developers. It is not known when the housing market willstabilize. As additional mortgage loans reach interest-rate reset dates during 2008, management expects that recenttrends in residential real estate delinquencies, nonperforming assets and charge-offs will persist.
Portfolio Loans: The composition of portfolio loans at December 31 for each of the last five years follows:
(In Millions) 2007 2006 2005 2004 2003
Commercial loans and leases $ 35,352 $31,052 $ 27,572 $ 25,160 $19,164Commercial construction and real estate 23,934 19,596 17,751 15,676 12,594Residential real estate 30,243 21,882 30,846 29,838 26,917Home equity lines of credit 18,079 14,595 21,439 19,018 11,016Credit card and other unsecured lines of credit 3,915 3,007 2,612 2,414 2,324Other consumer loans 4,499 5,360 5,819 8,165 7,329Total portfolio loans $116,022 $95,492 $106,039 $100,271 $79,344
35

The following summarizes each product type as a percentage of the overall loan portfolio:
2007 2006 2005 2004 2003
Commercial loans and leases 30.5% 32.5% 26.0% 25.1% 24.2%Commercial construction and real estate 20.6 20.5 16.7 15.6 15.9Residential real estate 26.0 22.9 29.1 29.8 33.9Home equity lines of credit 15.6 15.3 20.2 19.0 13.9Credit card and other unsecured lines of credit 3.4 3.2 2.5 2.4 2.9Other consumer loans 3.9 5.6 5.5 8.1 9.2Total 100.0% 100.0% 100.0% 100.0% 100.0%
The overall loan portfolio balance has grown over the past five years with higher lending volumes and expansion of thebanking footprint through acquisitions. Commercial loans and leases represent a smaller percentage of total portfolioloans compared to 2006, due to the larger residential real estate portfolio at December 31, 2007. All types ofcommercial loans, including construction and real estate, have grown due to higher business volumes andrecent acquisitions.
Residential real estate increased compared to 2006 due to the disruption in the mortgage markets in the last half of2007. The Corporation was unable to sell certain nonagency eligible mortgage and home equity loans. As a resultthese nonsalable loans were transferred to portfolio, and management has no intent to sell them for the foreseeablefuture. Transfers of formerly held for sale loans to portfolio were $5.8 billion during 2007. The decrease in theresidential real estate portfolio in 2006 compared to the prior two years principally reflects the decision to originate forsale all broker-sourced residential real estate. In prior periods, some of these loans were originated for portfolio.
Home equity lines of credit increased in 2007 compared to the prior year due to transfers of $3.0 billion of formerlyheld for sale lines to portfolio. Home equity lines of credit declined in 2006 compared to the prior years due to thesame originate for sale strategy described above. Credit card and other unsecured lines increased in comparison to priorperiods due to growth in the number of credit card customers. Other consumer loans declined in 2007 as theCorporation ceased originating indirect automobile loans in 2005.
Management considers certain segments of the loan portfolio to pose a higher risk of credit loss. These portfoliosconsist of construction loans to residential real estate developers and consumers, nonprime mortgage loans, andbroker-sourced home equity loans and lines of credit. These borrowers have been adversely affected by the decline inthe housing markets. The outstanding balance at December 31 for each of these portfolios follows.
(In Millions) 2007 2006
Commercial construction:Residential real estate developers $ 4,491 $ 3,915
Residential real estate:Nonprime mortgage 6,012 7,480Broker-sourced home equity loans 3,732 1,412Residential construction 3,062 2,564
Home equity lines of credit:Broker-sourced home equity lines 7,475 5,928Total higher risk loan portfolios $24,772 $21,299
Loans to residential real estate developers incurred higher losses in 2007 due to weakness in the housing markets,particularly in Florida and Michigan. Approximately 25% of the construction loans to residential developers areproperties located in these states.
Nonprime mortgage loans, broker-sourced home equity loans and lines of credit are all liquidating portfolios. Theseloans were originated by the former First Franklin and National Home Equity business units. Performance of theseliquidating portfolios is worse than the rest of the consumer portfolio due to a range of factors, including the decline inthe housing market. Paydowns on the nonprime mortgage loans have reduced the outstanding balance of this portfolio
36

in the past year. Broker-sourced home equity portfolios have increased compared to a year ago due to transfers offormerly held for sale loans and lines of credit to portfolio in 2007. With new production stopped in the latter part of2007, management expects the portfolio to decline throughout 2008.
Residential construction loans exhibited higher risk in 2007 with some borrowers abandoning their construction plansand defaulting on their loans due to a range of factors including declining real estate values. Approximately 45% ofthe residential construction loans relate to properties located in either Florida or California. Management tightenedunderwriting standards for residential construction loans beginning in late 2006 which is expected to significantlyreduce production volume in 2008.
Risk Mitigation Strategies: The Corporation’s lending activities are subject to varying degrees of credit risk. Credit riskis mitigated through credit policies and underwriting guidelines, collateral protection, portfolio diversification,management of industry and client exposure levels, and credit risk transfer strategies.
A credit risk transfer agreement has been executed on certain nonprime mortgage loans to provide protection againstunexpected catastrophic credit losses. The Corporation bears the risk of credit losses on this pool up to the first lossposition, estimated at 3.5% of the initial pool balance. The counterparty to this arrangement would bear the risk ofadditional credit losses up to $263 million, subject to adjustment as the portfolio pays down. As of December 31,2007, credit losses on this portfolio have not and are not expected to exceed the Corporation’s first loss position.Estimated probable credit losses are included in the determination of credit losses.
The Corporation has also purchased mortgage insurance on certain nonprime mortgage loans, as well as certain homeequity loans originated in the branch network. These policies provide varying levels of coverage, deductibles, and stoploss limits. Credit losses covered by third-party insurance arrangements are excluded from the determination of theallowance for loan losses to the extent an insurance recovery is deemed probable. Certain of these insurancearrangements are subject to reinsurance by a wholly owned subsidiary of the Corporation. Expected reinsurance lossesare included within the provision for loan losses and the related reinsurance reserves are included in the allowance forloan losses in the Consolidated Financial Statements. The provision for credit losses includes estimated losses fromclaims disputed by third-party insurers. See Note 22 in the Consolidated Financial Statements for further information onreinsurance arrangements.
A summary of the credit risk transfer strategies in place at December 31 on the nonprime mortgage loanportfolio follows:
(In Millions) 2007 2006
First lien mortgage loans:Subject to credit risk transfer agreement $1,402 $2,376Subject to lender paid mortgage insurance 1,374 1,868Uninsured 1,717 1,036
Second lien mortgage loans:Subject to lender paid mortgage insurance 1,462 2,148Uninsured 57 52
Total nonprime mortgage loans $6,012 $7,480
Uninsured first lien mortgage loans increased in 2007 as $1.5 billion of formerly held for sale loans were transferred tothe nonprime portfolio during the year. Uninsured second lien mortgage loans increased for the same reason. Thesecond lien mortgages pose a higher risk of loss as the underlying collateral associated with these mortgages will befirst applied to satisfy the first lien mortgage.
In order to minimize credit losses, management monitors mortgage loans which are approaching an interest-rate resetdate. Borrowers are contacted in advance of reset dates to identify whether they have the ability to meet their paymentobligations after the interest rate reset. For borrowers who are experiencing financial difficulty, management assesseswhether the loan’s interest rate or repayment terms should be modified, in order to maximize collectibility. Most ofthese initial rate resets for the nonprime mortgage loans will have occurred by May 2008.
37

Troubled debt restructurings, where management has granted a concession to a borrower experiencing financialdifficulty, were $497 thousand as of December 31, 2007. The Corporation has no commitments to lend additionalfunds to borrowers with restructured loans.
Delinquent Loans: Detail of loans 90 days past due accruing interest, excluding insured loans, follows:
(In Millions) 2007 2006 2005 2004 2003
Commercial $ 38 $ 31 $ 35 $ 43 $ 20Commercial leases — — 1 1 —Commercial construction 87 13 12 12 3Commercial real estate 51 18 9 29 32Residential real estate:
Nonprime 808 567 392 298 288Construction 302 4 — — —Other 446 133 111 169 140
Home equity lines of credit 102 37 23 10 15Credit card and other unsecured lines of credit 46 35 20 21 18Other consumer 17 11 17 13 12Mortgage loans held for sale and other 16 89 16 25 37Total loans 90 days past due accruing interest $1,913 $938 $636 $621 $565
The above table excludes loans which are insured by GNMA as these loans are deemed to be fully collectible. Loans90 days past due which are insured totaled $646 million in 2007, $593 million in 2006, $404 million in 2005,$465 million in 2004 and $487 million in 2003.
Commercial loan credit risk was stable in 2007. The higher delinquencies compared to 2006 were principally due togrowth in the portfolio. Sectors displaying increasing risk trends include residential real estate related areas such ashome building products and mortgage banking. Commercial construction and commercial real estate delinquenciesincreased in 2007 due primarily to delinquent accounts added with recent acquisitions, as well as defaults amongresidential real estate developers.
Residential real estate delinquencies have increased significantly as many borrowers have been unable to make theirpayments due to a range of factors including interest-rate resets or declining home values. Residential constructionloans, nonprime mortgage loans, and broker-sourced home equity loans have experienced the largest growth indelinquencies. Higher delinquencies were also driven by the deteriorating performance of accounts added with recentacquisitions and loans transferred from held for sale to portfolio, and higher volumes of repurchased loans partiallyoffset by the decline in delinquent mortgage loans held for sale.
Home equity line of credit delinquencies have also increased principally due to the deteriorating performance offormerly held for sale lines transferred to portfolio. Delinquent credit card and other unsecured lines of credit increasedcompared to a year ago as fewer defaults occurred in these consumer loans immediately following the change inconsumer bankruptcy laws in late 2005.
38

Nonperforming Assets: Note 1 to the Consolidated Financial Statements describes the Corporation’s policies forclassifying a loan as nonperforming and recognizing charge-offs. The Corporation’s policies are consistent withregulatory standards. A summary of nonperforming assets as of December 31 follows:
(Dollars in Millions) 2007 2006 2005 2004 2003
Commercial $ 149 $ 92 $ 96 $117 $242Commercial leases 6 32 85 44 15Commercial construction 301 109 29 12 7Commercial real estate 189 111 114 102 67Residential real estate
Nonprime 119 65 52 54 101Construction 145 6 8 1 —Other 162 85 106 133 118
Home equity lines of credit 19 — — — —Total nonperforming loans 1,090 500 490 463 550Other real estate owned (OREO):
Secured by GNMA 58 60 — — —Nonprime 242 116 58 47 54Other 124 53 39 42 45
Mortgage loans held for sale and other 9 3 9 11 8Total nonperforming assets $1,523 $732 $596 $563 $657
Nonperforming assets as a percentage of:Period-end portfolio loans and other nonperforming assets 1.31% .76% .56% .56% .83%Period-end total assets 1.01 .52 .42 .40 .58
Nonperforming commercial loans increased compared to the prior two years due to growth in the portfolio, as well asa few larger problem loans in diverse industries and regions. Nonperforming commercial leases decreased compared to2006 due to charge-offs of passenger airline leases. Nonperforming commercial construction and commercial realestate loans have increased due to deteriorating credit quality of residential real estate developers as a result ofweakness in the housing markets.
Nonperforming residential real estate loans have increased due to a larger portfolio balance and more delinquent loansbeing placed on nonaccrual status. Residential construction loans in particular have been adversely affected byweakness in the housing markets. Borrowers with nonprime mortgages have also been adversely affected by a range offactors including interest-rate resets.
Certain home equity lines of credit are now classified as nonperforming due to a change in the charge-off policy during2007. In prior years, home equity lines of credit were fully charged off at the date that they reached nonaccrual status.In 2007, charge-offs are only recognized to the extent the outstanding loan balance exceeds the estimated netrealizable value of the collateral. The remaining collateralized loan balance is now classified as a nonperforming loan.
Other real estate owned (OREO) increased due to more nonperforming loans progressing to foreclosure and a longertime period to sell properties due to the weak housing market. OREO associated with mortgage loans secured byGNMA are deemed fully collectible as any loss on foreclosure will be reimbursable from either the FHA or theDepartment of Veterans Affairs. Prior to January 1, 2006, OREO mortgage loans secured by GNMA were not classifiedas nonperforming loans.
At December 31, 2007, the Corporation had commitments to lend an additional $67 million to borrowers whose loanswere classified as nonperforming. None of these individual commitments exceed $10 million.
Allowance for Loan Losses and Allowance for Losses on Lending-Related Commitments: To provide for the riskof loss inherent in extending credit, National City maintains an allowance for loan losses and an allowance for losses onlending-related commitments. The determination of the allowance for loan losses is based upon the size and riskcharacteristics of the loan portfolio and includes an assessment of individual impaired loans, historical loss experience
39

on pools of homogeneous loans, specific environmental factors, and factors to account for estimated imprecision inforecasting losses. The allowance for losses on lending-related commitments is computed using a methodology similarto that used to determine the allowance for loan losses, modified to take into account the probability of drawdown onthe commitment.
A summary of the changes in the allowance for loan losses follows:
(Dollars in Millions) 2007 2006 2005 2004 2003
Balance at beginning of year $1,131 $1,094 $1,188 $1,023 $1,006Provision for loan losses 1,326 489 300 339 628Charge-offs:
Commercial 86 93 104 136 306Commercial leases 58 57 56 34 22Commercial construction 38 18 6 12 3Commercial real estate 32 20 32 23 31Residential real estate 316 220 132 126 152Home equity lines of credit 121 79 42 27 24Credit card and other unsecured lines of credit 128 94 130 109 98Other consumer 65 64 100 104 121
Total charge-offs 844 645 602 571 757Recoveries:
Commercial 23 36 75 92 40Commercial leases 19 18 22 9 4Commercial construction — 1 4 2 —Commercial real estate 10 8 10 13 5Residential real estate 61 67 54 51 37Home equity lines of credit 28 18 8 10 7Credit card and other unsecured lines of credit 16 16 12 8 8Other consumer 26 39 37 40 47
Total recoveries 183 203 222 225 148Net charge-offs 661 442 380 346 609Other(a) (34) (10) (14) 172 (2)Balance at end of year $1,762 $1,131 $1,094 $1,188 $1,023
Allowance as a percentage of:Portfolio loans 1.52% 1.18% 1.03% 1.19% 1.29%Nonperforming loans 161.6 226.1 223.1 256.9 186.1Net charge-offs 266.5 256.2 287.3 343.8 167.8
(a) Other includes the allowance for loan losses associated with acquisitions, portfolio loans transferred to held forsale, and reinsurance claims paid to third parties.
A summary of the changes in the allowance for losses on lending-related commitments follows.
(In Millions) 2007 2006 2005 2004 2003
Balance at beginning of year $ 78 $84 $100 $102 $ 92Net provision for losses on lending-related commitments (13) (6) (16) (16) 10Allowance related to commitments acquired — — — 14 —Balance at end of year $ 65 $78 $ 84 $100 $102
40

Annualized net charge-offs as a percentage of average portfolio loans follow:
2007 2006 2005 2004 2003
Commercial .22% .22% .12% .22% 1.35%Commercial leases .93 1.12 1.07 1.24 1.14Commercial construction .47 .26 .05 .33 .11Commercial real estate .16 .11 .18 .09 .27Residential real estate .98 .57 .25 .26 .49Home equity lines of credit .60 .36 .16 .11 .18Credit card and other unsecured lines of credit 3.42 2.96 4.96 4.41 4.21Other consumer .81 .44 .83 .85 .94Total net charge-offs to average portfolio loans .64% .44% .36% .39% .80%
The net charge-off ratio for commercial loans was unchanged from 2006 as the credit quality of this portfolio has beenstable. The net charge-off ratio for commercial leases improved in 2007 as prior years included larger charge-offs forpassenger airline leases. The net charge-off ratio for commercial construction increased in 2007 due to higher losses onresidential real estate developer loans.
The net charge-off ratio for residential real estate and home equity lines of credit increased in 2007 compared to prioryears due to more borrowers being unable to make their payments in the current environment. In 2007, charge-offsincreased by $109 million in liquidating portfolios and $33 million in the construction loan portfolio versus a yearearlier. In addition, a change in charge-off practices for insured mortgage loans, which assumes no insurance recoveryon disputed claims, contributed to higher charge-offs in 2007. Collection efforts on disputed claims continues, andsubsequent insurance recoveries are recognized in the period they are received.
The net charge-off ratio for credit card, other unsecured lines of credit, and other consumer loans increased comparedto 2006. Net charge-offs for these products were unusually low in 2006 due to the large number of consumers whofiled bankruptcy in 2005.
An allocation of the allowance for loan losses and allowance for losses on lending-related commitments by portfoliotype is shown below.
(In Millions) 2007 2006 2005 2004 2003
Allowance for loan losses:Commercial loans and leases $ 461 $ 459 $ 494 $ 572 $ 283Commercial construction and real estate 263 161 141 147 57Residential real estate 597 259 169 184 122Home equity lines of credit and other consumer loans 278 102 131 127 94Credit card and other unsecured lines of credit 163 150 159 158 129Unallocated — — — — 338Total $1,762 $1,131 $1,094 $1,188 $1,023
Allowance for losses on lending-related commitments:Commercial $ 65 $ 78 $ 84 $ 100 $ 102
The total allowance for loan losses increased compared to a year ago primarily due to higher probable credit losses forloans secured by residential real estate. Recent acquisitions also increased the allowance for loan losses in 2007. In2004, the Corporation refined its allocation methodology which enabled the allowance for loan losses to be fullyallocated to loan portfolios. Accordingly, the allocation of the allowance for 2003 is not directly comparable tosubsequent periods.
The allowance allocated to commercial loans and leases was flat compared to 2006 which reflects the stable creditquality of this portfolio. The allowance allocated to commercial loans and leases is lower than 2005 and 2004, despitea larger loan portfolio, due to relatively stronger credit quality of the portfolio. The allowance allocated to commercialconstruction and commercial real estate has increased significantly compared to prior periods due to higher probable
41

credit losses on construction loans to residential real estate developers. The portfolio has also grown with recentacquisitions.
The allowance allocated to both the residential real estate and home equity lines of credit portfolios increasedcompared to prior periods due to higher portfolio balances, combined with deteriorating credit quality of theseportfolios. Portfolio loan balances increased due to recent acquisitions, as well as transfers of formerly held for salemortgage and home equity loans and lines of credit to portfolio in 2007. Performance of these transferred loans hasgenerally been worse than for loans originated within our branch network for portfolio. Deteriorating credit trendshave also occurred principally in the higher-risk portfolios previously described. The allowance allocated to credit cardand other unsecured lines of credit increased compared to 2006 due to growth in the portfolio. The credit quality ofthis portfolio has been stable.
The allowance for losses on lending-related commitments reflects the stable credit quality of the commercial portfolio.Refer to the Application of Critical Accounting Policies section for further discussion of the allowance for loan losses.
Market Risk
Market risk is the potential for loss arising from adverse changes in the fair value of financial instruments due tochanges in interest rates, currency exchange rates, or equity prices. Interest-rate risk is National City’s primary marketrisk and results from timing differences in the repricing of assets and liabilities, changes in relationships between rateindices, and the potential exercise of explicit or embedded options. The Asset/Liability Committee (ALCO) is responsiblefor reviewing the interest-rate-sensitivity position and establishing policies to monitor and limit exposure to interest-raterisk. The guidelines established by ALCO are reviewed by the Risk and Public Policy Committee of the Corporation’sBoard of Directors and the Enterprise Risk Committee. The Corporation does not currently have any material equityprice risk or foreign currency exchange rate risk.
Asset/Liability Management: The primary goal of asset/liability management is to maximize the net present value offuture cash flows and net interest income within authorized risk limits. Interest-rate risk is monitored primarily throughmodeling of the market value of equity and secondarily through earnings simulation. Both measures are highlyassumption dependent and change regularly as the balance sheet and business mix evolve; however, taken togetherthey represent a reasonably comprehensive view of the magnitude of interest-rate risk, the distribution of risk along theyield curve, the level of risk through time, and the amount of exposure to changes in certain interest-rate relationships.The key assumptions employed by these measures are analyzed regularly and reviewed by ALCO.
Interest-rate Risk Management: Financial instruments used to manage interest-rate risk include investment securitiesand interest-rate derivatives, which include interest-rate swaps, interest-rate caps and floors, interest-rate forwards, andexchange-traded futures and options contracts. Interest-rate derivatives have characteristics similar to securities butpossess the advantages of customization of the risk-reward profile of the instrument, minimization of balance sheetleverage, and improvement of the liquidity position. Further discussion of the use of and the accounting for derivativeinstruments is included in Notes 1 and 25 to the Consolidated Financial Statements.
Market Value Modeling: Market Value of Equity (MVE) represents the discounted present value of net cash flows fromall assets, liabilities, and off-balance sheet arrangements, other than MSRs and associated hedges. Market riskassociated with MSRs is hedged through the use of derivative instruments. Refer to Note 12 to the ConsolidatedFinancial Statements for further details on managing market risk for MSRs. Unlike the earnings simulation modeldescribed below, MVE analysis has no time horizon limitations. In addition, MVE analysis is performed as of a singlepoint in time and does not include estimates of future business volumes. As with earnings simulations, assumptionsdriving timing and magnitude of cash flows are critical inputs to the model. Particularly important are assumptionsdriving loan and security prepayments and noncontractual deposit balance movements.
The sensitivity of MVE to changes in interest rates is an indication of the longer-term interest-rate risk embedded in thebalance sheet. A primary measure of the sensitivity of MVE to movements in rates is defined as the Duration of Equity(DOE). DOE represents the estimated percentage change in MVE for a 1% instantaneous, parallel shift in the yieldcurve. Generally, the larger the absolute value of DOE, the more sensitive the value of the balance sheet is to
42

movements in rates. A positive DOE indicates the MVE should increase as rates fall, or decrease as rates rise. A negativeDOE indicates that MVE should increase as rates rise, or decrease as rates fall. Due to the embedded options in thebalance sheet, DOE is not constant and can shift with movements in the level or shape of the yield curve. ALCO has setlimits on the maximum and minimum acceptable DOE at +4.0% and -1.0%, respectively, as measured between+/-150 basis point instantaneous, parallel shifts in the yield curve.
The most recent market value model estimated the current DOE at +1.9%, above the long-term target of +1.5% butconsistent with management’s view on interest rates. DOE would rise to +2.7% given a parallel shift of the yield curveup 150 basis points and would be within the maximum constraint of +4.0%. DOE would decline to +1.5% given aparallel shift of the yield curve down 150 basis points and would be within the minimum constraint of -1.0%.
Earnings Simulation Modeling: The earnings simulation model projects changes in net income caused by the effect ofchanges in interest rates on net interest income. The model requires management to make assumptions about how thebalance sheet is likely to evolve through time in different interest-rate environments. Loan and deposit growth rateassumptions are derived from historical analysis and management’s outlook, as are the assumptions used to projectyields and rates for new loans and deposits. Mortgage loan prepayment models are developed from industry medianestimates of prepayment speeds in conjunction with the historical prepayment performance of the Corporation’s ownloans. Noncontractual deposit growth rates and pricing are modeled on historical patterns.
Net interest income is affected by changes in the absolute level of interest rates and by changes in the shape of theyield curve. In general, a flattening of the yield curve would result in a decline in earnings due to the compression ofearning asset yields and funding rates, while a steepening would result in increased earnings as investment marginswiden. The earnings simulations are also affected by changes in spread relationships between certain rate indices, suchas the prime rate and the London Interbank Offering Rate (LIBOR).
Market implied forward rates over the next 12 months are used as the base rate scenario in the earnings simulationmodel. High and low rate scenarios are also modeled and consist of statistically determined two standard deviationmoves above and below market implied forward rates over the next 12 months. These rate scenarios are nonparallel innature and result in short- and long-term rates moving in different magnitudes. Resulting net incomes from the base,high, and low scenarios are compared and the percentage change from base net income is limited by ALCO policy to-4.0%.
The most recent earnings simulation model projects that net income would be 2.0% higher than base net income ifrates were two standard deviations (SD) higher than the implied forward curve over the next 12 months. The modelalso projects an increase in net income of 2.7% if rates were two SD below the implied forward curve over the sameperiod. In the past, the company has reported a loss of income when rates are lower than the implied forwards by twoSD. However, at the current low level of short-term interest rates, net interest income benefits from an interest-ratefloor position that hedges variable-rate commercial loans. Both of the earnings simulation projections of net incomewere within the ALCO guideline of -4.0%.
The earnings simulation model excludes the potential effects on noninterest income and noninterest expense associatedwith changes in interest rates. In particular, revenue generated from originating, selling, and servicing residentialmortgage loans is highly sensitive to changes in interest rates due to the effect such changes have on loan demand andthe value of MSRs. In general, low or declining interest rates typically lead to increased loan sales revenue butpotentially lower loan servicing revenue due to the impact of higher loan prepayments on the value of MSRs.Conversely, high or rising interest rates typically reduce mortgage loan demand and hence loan sales revenue whileloan servicing revenue may rise due to lower prepayments. In addition, net interest income earned on loans held forsale increases when the yield curve steepens and decreases when the yield curve flattens. Risk related to mortgagebanking activities is also monitored by ALCO.
43

Summary information about the interest-rate risk measures follows:
2007 2006
One Year Net Income Simulation Projection2 SD below implied forward curve 2.7% -1.3%2 SD above implied forward curve 2.0 1.2Duration of Equity-150 bp Shock vs. Stable rate 1.5% .5%+150 bp Shock vs. Stable rate 2.7 2.2
Trading Risk Management: Securities, loans, and derivative instruments are classified as trading when they are enteredinto for the purpose of making short-term profits or to provide risk management products to customers. The risk ofloss associated with these activities is monitored on a regular basis through the use of a statistically based Value-At-Riskmethodology (VAR). VAR is defined as the estimated maximum dollar loss from adverse market movements, with 99%confidence, based on historical market-rate and price changes for a 10-day holding period. During 2007, the average,high, and low VAR amounts were $5 million, $9 million, and $3 million, respectively, which were within the limit,established by ALCO of $19 million. During 2006, the average, high, and low VAR amounts were $2 million, $6 million,and $500 thousand, respectively. VAR estimates are monitored regularly by ALCO. Further discussion of tradingactivities is included in Note 9 to the Consolidated Financial Statements.
Liquidity Risk
Liquidity risk arises from the possibility the Corporation may not be able to meet current or future financialcommitments, or may become unduly reliant on alternative or unstable funding sources. The objective of liquidity riskmanagement is to ensure that the cash flow requirements of depositors and borrowers, as well as the operating cashneeds of the Corporation, are met, taking into account all on- and off-balance sheet funding demands. Liquidity riskmanagement also includes ensuring cash flow needs are met at a reasonable cost. Management adheres to a liquidityrisk management policy which identifies the primary sources of liquidity, establishes procedures for monitoring andmeasuring liquidity, and establishes minimum liquidity requirements in compliance with regulatory guidance. The policyalso includes a contingency funding plan to address liquidity needs in the event of an institution-specific or a systemicfinancial crisis. The liquidity position is continually monitored and reviewed by ALCO.
The Corporation’s operating activities represented a net use of cash in 2007. The primary reason for the negative cashflows from operations was the disruption in the mortgage markets in 2007. The Corporation was unable to sell certainmortgage loans that had been originated for sale. As a result, cash used to originate mortgage loans exceeded cashreceived from sale or securitization of mortgage loans in 2007. Management has discontinued the origination of certainmortgage loans which are not salable in the current market.
The Corporation’s most significant contractual obligations and commitments are presented within the discussion whichfollows on Contractual Obligations, Commitments, Contingent Liabilities and Off-Balance Sheet Arrangements. At theholding company level, the Corporation uses cash to pay dividends to stockholders, repurchase common stock,complete acquisitions, service debt and pay various operating expenses.
In 2007, 2006 and 2005, the Corporation paid dividends of $985 million, $934 million, and $924 million, respectively,to its common and preferred stockholders. In January 2008, the Board declared dividends of $135 million to be paid inthe first quarter of 2008. Dividend payments are expected to be lower in 2008 than in the prior three years.Repurchases of common stock were $3.2 billion in 2007, $.7 billion in 2006 and $1.5 billion in 2005. No repurchasesof common stock are planned in 2008 as management intends to build capital.
Net funds (used in)/received from acquisitions were $(249) million in 2007, $157 million in 2006, and $(322) million in2005. Net funds (transferred)/received in conjunction with divestitures were $(126) million in 2007, $(74) million in2006, and $24 million in 2005. The Corporation does not currently have any pending acquisitions or divestitures. Cashused to repay debt was $8.5 billion in 2007, $13.4 billion in 2006 and $9.7 billion in 2005. Cash paid for interest ondeposits and purchased funding was $4.8 billion in 2007, $4.3 billion in 2006, and $3.0 billion 2005. Cash used to
44

service debt in 2008 is expected to be higher than 2007 due to higher purchased funding levels and higher interestrates. Future maturities of long-term debt are estimated to be $9.5 billion in 2008, $5.7 billion in 2009, $3.5 billion in2010, $1.4 billion in 2011, $1.2 billion in 2012, and $4.6 billion thereafter.
The main sources of funding for the holding company include dividends and other distributions from its subsidiaries,the commercial paper market, and access to the capital markets. The main sources of funding for National City Bankare operating cash flows from banking activities, deposits gathered through the branch system, and purchased funds.As discussed in Note 18 to the Consolidated Financial Statements, National City Bank is subject to regulation and,among other things, may be limited in its ability to pay dividends or otherwise transfer funds to the holding company.Accordingly, consolidated cash flows as presented in the Consolidated Statements of Cash Flows may not representcash immediately available to the holding company. During 2007, the Corporation’s bank and nonbank subsidiariesdeclared and paid cash dividends totaling $950 million. Returns of capital paid to the holding company by bank andnonbank subsidiaries during 2007 totaled $500 million and $9 million, respectively. During 2008, the Corporation’sbank subsidiaries may not pay dividends to the holding company beyond their net profits for 2008, up to the date ofsuch dividend declaration, without prior regulatory approval. Funds raised in the commercial paper market through theCorporation’s subsidiary, National City Credit Corporation, support the short-term cash needs of the holding companyand nonbank subsidiaries. Commercial paper borrowings of $1.2 billion and $812 million were outstanding atDecember 31, 2007 and 2006, respectively. In 2008, the financial markets for short-term funding are expected to beless liquid as investors have heightened concerns about credit quality. The holding company has adequate funds tomeet all forecasted 2008 cash needs without reliance on the short-term markets.
Core deposits continue to be the most significant source of National City Bank’s funding. At December 31, 2007 and2006, core deposits comprised 60% and 54% of total funding, respectively. Core deposits increased as a source offunds in 2007 from growth in the number of deposit accounts and recent acquisitions. Federal Home Loan Bankadvances also increased as a source of funds in 2007. At December 31, 2007, National City Bank’s unused availableborrowing capacity with the Federal Home Loan Bank was $3.1 billion. Refer to the Financial Condition section forfurther discussion on funding sources.
Proceeds from loan sales or securitizations were $49.2 billion in 2007, $65.5 billion in 2006, and $75.8 billion in 2005.Loan sales and securitizations are expected to be a lower source of funding in 2008 as management has curtailed theproduction of certain mortgage products. In 2008, the Corporation may have the option to exercise an early call on apool of securitized automobile loans. As of December 31, 2007, the remaining principal balance of these securitizedloans was approximately $85 million.
In April 2007, the Corporation’s Board authorized the holding company to issue up to $1.5 billion in senior debtsecurities or subordinated debt securities in future periods. A new shelf registration will be filed with the Securities andExchange Commission at the time of issuance of these securities. There were no issuances under this authorizationduring 2007. Prior to this authorization, the Corporation had in place a shelf registration with the Securities andExchange Commission which allowed for the sale, over time, of up to $1.5 billion in senior subordinated debtsecurities, preferred stock, depositary shares, and common stock issuable in connection with conversion of securities.During 2007, the holding company issued $600 million of senior notes which completed the issuances under this shelfregistration.
The Corporation had a shelf registration filed with the Securities and Exchange Commission, to allow for the sale overtime of junior subordinated debt securities to three subsidiary trusts, along with an equal amount of the trusts’ equitysecurities in the capital markets. In 2007, the Corporation completed its issuance under this shelf by issuing $1.0 billionof capital securities. In 2006, $750 million of capital securities were issued under this shelf registration statement.Further discussion of junior subordinated debentures is included in Note 17 to the Consolidated Financial Statements.
In November 2007, the Corporation filed a new shelf registration with the Securities and Exchange Commission toallow for the sale over time of an unlimited amount of junior subordinated debt to six subsidiary trusts, along with anequal amount of capital securities of the trusts in the capital markets.
45

In January 2008, the Corporation filed another shelf registration with the Securities and Exchange Commission, toallow for the sale over time of an unlimited amount of senior or subordinated debt, junior subordinated debt, commonor preferred stock, purchase contracts, units and warrants or, in one or more offerings by either the Corporation, orone of six subsidiary trusts. In January 2008, the Corporation issued $1.4 billion of senior convertible debt notes andissued $650 million of capital securities under this shelf registration statement. A portion of the proceeds will be usedto repay $300 million of long-term debt maturing in April 2008.
The cost and availability of short- and long-term funding is influenced by debt ratings. During 2007, Fitch Ratingsreduced the Corporation’s long-term issuer rating to A+ (outlook negative) from AA-, and the Corporation’s short-termissuer rating to F-1 from F-1+, citing National City’s exposure to mortgage, home equity and construction lending. InJanuary 2008, Moody’s Investors’ Service, while affirming National City Bank’s top short-term rating of P-1, placed all ofthe long-term debt and financial strength ratings of the Corporation and its subsidiaries on review for possibledowngrade. A decrease, or potential decrease, in credit ratings could limit access to the capital markets and increasethe cost of debt, and thereby adversely affect liquidity and financial condition.
The Corporation has an equity interest of approximately 8% in Visa USA. Visa Inc., the parent company of Visa USA,intends to conduct an initial public offering (IPO) in 2008. Visa Inc. plans to use the proceeds to fund an escrowaccount to be used for settlement of litigation and to redeem a portion of Visa USA members’ shares. Accordingly,National City expects to record a gain for partial redemption of its equity interest, following the completion of the IPO.The realization and amount of this gain are dependent upon the occurrence of Visa’s IPO and the amount of funds setaside by Visa for litigation matters.
Operational Risk Management
Operational risk is the risk of loss incidental to day-to-day activities, including, but not limited to, the risk of fraud byemployees or persons outside the Corporation, the execution of unauthorized transactions by employees, errors relatingto transaction processing and technology, breaches of the internal control system and compliance requirements andbusiness disruption and system failures. This risk of loss also includes the potential legal actions that could arise as aresult of an operational deficiency or as a result of noncompliance with applicable regulatory standards.
Operational risk is inherent in all business activities, and the management of this risk is important to the achievement ofthe Corporation’s objectives. In the event of a breakdown in the internal control system, improper operation of systemsor improper employees’ actions, the Corporation could suffer financial loss, face regulatory action or suffer damage toits reputation.
The Corporation manages operational risk through a risk management framework and its internal control processes.Within this framework, the Corporate Operational Risk Committee provides oversight and assesses the most significantoperational risks. Under the guidance of this committee, risk management personnel establish policies and interact withbusiness lines to monitor significant operating risks on a regular basis. Business lines have direct and primaryresponsibility and accountability for identifying, controlling and monitoring operational risks embedded in theirbusiness. Business managers maintain a system of controls with the objective of providing proper transactionauthorization and execution, proper system operations, safeguarding of assets from misuse or theft, and ensuring thereliability of financial and other data. Business managers ensure that the controls are appropriate and are implementedas designed. The Corporation’s internal audit function validates the system of internal controls through regular andongoing audit procedures and reports on the effectiveness of internal controls to executive management and the AuditCommittee of the Board of Directors.
While the Corporation believes that it has designed effective methods to minimize operational risks, there is noabsolute assurance that business disruption or operational losses will not occur. On an ongoing basis, managementmakes process changes and investments to enhance its systems of internal controls and business continuity and disasterrecovery plans.
46

Contractual Obligations, Commitments, Contingent Liabilities, and Off-Balance SheetArrangements
The Corporation’s financial obligations include contractual obligations and commitments that may require future cashpayments.
Contractual Obligations: The following table presents significant fixed and determinable contractual obligations bypayment date as of December 31, 2007. The payment amounts represent those amounts contractually due to therecipient and do not include unamortized premiums or discounts, hedge basis adjustments, fair value adjustments, orother similar carrying value adjustments. Further discussion of the nature of each obligation is included in thereferenced note to the Consolidated Financial Statements.
(In Millions)Note
Reference
OneYear
or Less
One toThreeYears
Three toFive
Years
OverFive
Years Total
Payments Due In
Deposits without a stated maturity(a) $65,012 $ — $ — $ — $65,012Consumer and brokered certificates of
deposits(b) 28,228 3,688 2,511 2,447 36,874Federal funds borrowed and security repurchase
agreements(b) 14 5,102 — — — 5,102Borrowed funds(b) 15 2,044 — — — 2,044Long-term debt(b) 16,17 10,811 10,404 3,550 14,574 39,339Operating leases 174 266 211 603 1,254Purchase obligations 197 247 131 34 609
(a) Excludes interest.(b) Includes interest on both fixed- and variable-rate obligations. The interest associated with variable-rate obligations
is based upon interest rates in effect at December 31, 2007. The contractual amounts to be paid on variable-rateobligations are affected by changes in market interest rates. Future changes in market interest rates couldmaterially affect the contractual amounts to be paid.
The operating lease obligations arise from short- and long-term leases for facilities, certain software, and dataprocessing and other equipment. Purchase obligations arise from agreements to purchase goods or services that areenforceable and legally binding and that specify all significant terms, including: fixed or minimum quantities to bepurchased; fixed, minimum or variable price provisions; and the approximate timing of the transaction. The obligationsare primarily associated with information technology, data processing, branch construction, and the outsourcing ofcertain operational activities.
As of December 31, 2007, the liability for uncertain tax positions, excluding associated interest and penalties, was$209 million pursuant to FASB Interpretation No. 48. This liability represents an estimate of tax positions that theCorporation has taken in its tax returns which may ultimately not be sustained upon examination by the tax authorities.Since the ultimate amount and timing of any future cash settlements cannot be predicted with reasonable certainty,this estimated liability has been excluded from the contractual obligations table.
The Corporation did not have any commitments or obligations to its qualified pension plan at December 31, 2007 dueto the overfunded status of the plan. The Corporation also has obligations under its supplemental pension andpostretirement plans as described in Note 24 to the Consolidated Financial Statements. These obligations representactuarially determined future benefit payments to eligible plan participants. The Corporation reserves the right toterminate these plans at any time.
The Corporation also enters into derivative contracts under which it either receives cash from or pays cash tocounterparties depending on changes in interest rates. Derivative contracts are carried at fair value on the ConsolidatedBalance Sheet, with the fair value representing the net present value of expected future cash receipts or paymentsbased on market interest rates as of the balance sheet date. The fair value of the contracts change as market interest
47

rates change. Certain contracts, such as interest-rate futures, are cash settled daily, while others, such as interest-rateswaps, involve monthly cash settlement. Because the derivative liabilities recorded on the Consolidated Balance Sheet atDecember 31, 2007 do not represent the amounts that may ultimately be paid under these contracts, these liabilitiesare not included in the table of contractual obligations presented above. Further discussion of derivative instruments isincluded in Notes 1 and 25 to the Consolidated Financial Statements.
Commitments: The following table details the amounts and expected maturities of significant commitments as ofDecember 31, 2007. Further discussion of these commitments is included in Note 22 to the ConsolidatedFinancial Statements.
(In Millions)
OneYear
or Less
One toThreeYears
Three toFive
Years
OverFive
Years Total
Commitments to extend credit:Revolving home equity and credit card lines $35,792 $ 11 $ — $ — $35,803Commercial 8,923 10,009 8,447 853 28,232Residential real estate 7,218 — — — 7,218Other 607 — — — 607
Standby letters of credit 1,963 1,861 1,436 112 5,372Commercial letters of credit 236 64 20 7 327Net commitments to sell mortgage loans and mortgage-backed
securities 2,500 — — — 2,500Net commitments to sell commercial real estate loans 535 91 — — 626Commitments to fund civic and community investments 359 236 100 22 717Commitments to fund principal investments 28 35 111 183 357Commitments to purchase beneficial interests in securitized
automobile loans 283 — — — 283
Commitments to extend credit, including loan commitments, standby letters of credit, and commercial letters of creditdo not necessarily represent future cash requirements, in that these commitments often expire without being drawnupon.
The commitments to fund principal investments primarily relate to indirect investments in various private equity fundsmanaged by third-party general and limited partners. These estimated commitments were based primarily on theexpiration of each fund’s investment period at December 31, 2007. The timing of these payments could change due toextensions in the investment periods of the funds or by the rate at which the commitments are invested, as determinedby the general or limited partners of the funds.
The commitments to fund civic and community investments pertain to the construction and development of propertiesfor low-income housing, small business real estate, and historic tax credit projects. The timing and amounts of thesecommitments are projected based upon the financing arrangements provided in each project’s partnership or operatingagreement, and could change due to variances in the construction schedule, project revisions, or the cancellation of theproject.
National City Bank, a subsidiary of the Corporation, along with other financial institutions, has agreed to providebackup liquidity to a third-party commercial paper conduit. The conduit holds various third-party assets includingbeneficial interests in the cash flows of trade receivables, credit cards and other financial assets, as well as automobileloans securitized by the Corporation. The conduit has no interests in subprime mortgage loans. The Corporation hasretained interests in the securitized automobile loans in the form of Class A notes, Class B notes and an interest-onlystrip. As of December 31, 2007, the fair value of these retained interests was $28 million. The conduit relies uponcommercial paper for its funding. In the event of a disruption in the commercial paper markets, the conduit couldexperience a liquidity event. At such time, the conduit may require National City Bank to purchase a 49% interest in anote representing a beneficial interest in the Corporation’s securitized automobile loans. Another financial institution,affiliated with the conduit, has committed to purchase the remaining 51% interest in this same note. Upon theconduit’s request, National City Bank would pay cash equal to the par value of the notes, less the corresponding
48

portion of all defaulted loans, plus accrued interest. In return, National City Bank would be entitled to undividedinterest in the cash flows of the collateral underlying the note. The Corporation receives an annual commitment fee of7 basis points for providing this backup liquidity. To date, the conduit has not experienced any difficulty in accessing thecommercial paper markets. The Corporation’s commitment declines commensurate with the unpaid principal balance ofthe automobile loans securitized by the Corporation. As of December 31, 2007, the Corporation’s maximumcommitment was $283 million. This commitment expires in December 2008 but may be renewed annually for anadditional 12 months by mutual agreement of the parties.
Contingent Liabilities: The Corporation may also incur liabilities under various contractual agreements contingent uponthe occurrence of certain events. A discussion of significant contractual arrangements under which National City maybe held contingently liable is included in Note 22 to the Consolidated Financial Statements.
Off-Balance Sheet Arrangements: Significant off-balance sheet arrangements include the use of special-purpose entities,generally securitization trusts, to diversify funding sources. During the past several years, National City has sold creditcard receivables and automobile loans to securitization trusts which are considered qualifying special-purpose entitiesand, accordingly, are not included in the Consolidated Balance Sheet. The Corporation continues to service the loanssold to the trusts, for which it receives a servicing fee, and also has certain retained interests in the assets of the trusts.
During both 2007 and 2006, the Corporation securitized $425 million of credit card receivables following the maturityof its Series 2002-1 and 2001-1 credit card securitizations. In 2005, the Corporation securitized $600 million of creditcard receivables following the maturity of its Series 2000-1 securitization. In 2005, the Corporation securitized$2.2 billion of fixed-rate closed end indirect automobile loans. Further discussion on the accounting for securitizations isincluded in Note 1 to the Consolidated Financial Statements, and detail regarding securitization transactions andretained interests is included in Note 5.
The Corporation’s securitization transactions are monitored regularly by management. The securitization structures arereviewed primarily to ensure the trust in the structure continues to be a qualified special-purpose entity, thesecuritization transaction itself continues to be accounted for as a sale, and the economics of the structure performs inaccordance with securitization governing documents. Amendments to the securitization governing documents, changesin bankruptcy or sale laws or changes in authoritative accounting literature could result in the securitization trust notqualifying as a special-purpose entity or the securitization transaction to not qualify for sale accounting. Any suchchange could result in the consolidation of the assets and liabilities of the securitization trust on the Corporation’sbalance sheet which would lead to the subsequent accounting for the transaction as a secured borrowing. Additionally,the economics of a securitization structure could change the timing of when the Corporation repurchases loans fromthe securitization trust through its exercise of a contractual cleanup call.
The Corporation also has obligations arising from contractual arrangements that meet the criteria of FASBInterpretation No. 45. These obligations are discussed in Note 22 to the Consolidated Financial Statements.
Application of Critical Accounting Policies and Estimates
National City’s financial statements are prepared in accordance with U.S. generally accepted accounting principles andfollow general industry practices within the industries in which it operates. Application of these principles requiresmanagement to make estimates or judgments that affect the amounts reported in the financial statements andaccompanying notes. These estimates are based on information available as of the date of the financial statements;accordingly, as this information changes, the financial statements could reflect different estimates or judgments. Certainpolicies inherently have a greater reliance on the use of estimates, and as such have a greater possibility of producingresults that could be materially different than originally reported. Estimates or judgments are necessary when assets andliabilities are required to be recorded at fair value, when a decline in the value of an asset not carried on the financialstatements at fair value warrants an impairment write-down or valuation reserve to be established, or when an asset orliability needs to be recorded contingent upon a future event. Carrying assets and liabilities at fair value inherentlyresults in more financial statement volatility. The fair values and the information used to record valuation adjustmentsfor certain assets and liabilities are based either on quoted market prices or other market inputs, when available. When
49

such information is not available, fair value may be estimated by management primarily through the use of discountedcash flow models.
The most significant accounting policies followed by the Corporation are presented in Note 1 to the ConsolidatedFinancial Statements. These policies, along with the disclosures presented in the other financial statement notes and inthis Financial Review, provide information on how significant assets and liabilities are valued in the financial statementsand how those values are determined. Any material effect on the financial statements related to these criticalaccounting areas is also discussed in this Financial Review. Management views critical accounting policies to be thosewhich are highly dependent on subjective or complex judgments, estimates and assumptions, and where changes inthose estimates and assumptions could have a significant impact on the financial statements. Management currentlyviews the valuation of mortgage loans held for sale, the allowance for loan losses and allowance for losses on lending-related commitments, mortgage servicing rights, derivative instruments, impairment of goodwill, and income taxes tobe critical accounting policies which contain significant estimates or judgments.
Residential Mortgage Loans Held for Sale Valuation: Mortgage loans held for sale are reported at the lower of cost orfair value applied on an aggregate basis. The fair value of mortgage loans held for sale is generally based on observablemarket prices for similar loans or quoted prices for loans committed for sale. Management considers in its assessmentthe probability that investor commitments may not be honored in full. In the absence of observable market prices, fairvalue is based upon recent bids from potential buyers. Otherwise, fair value may be estimated using a discounted cashflow model incorporating inputs and assumptions consistent with market participants’ views.
During 2007, the Corporation used a discounted cash flow model to estimate the fair value of nonprime mortgageloans and home equity loans and lines of credit transferred from held for sale to portfolio as there was no observablemarket for sale of these products. Key inputs to the valuation models were projected credit losses, prepayment speeds,and the discount rate. Projected credit losses were estimated based on a combination of historical credit losses for staticpools of similar loans, adjusted by recent industry data of projected losses for similar types of loans. Prepayment speedswere based on historical prepayments for static pools of similar loans adjusted to reflect market conditions at the timeof the valuations. The discount rates were estimated based upon the rate utilized by market participants in priortransactions adjusted to reflect a higher risk premium in the current market.
A valuation allowance is recognized whenever the carrying value, including basis adjustments arising from fair valuehedge relationships, exceeds the aggregate fair value of loans held for sale at the measurement date. Valuationadjustments may also be recognized when loans are transferred from held for sale to portfolio as these loans arerequired to be transferred at the lower-of-cost or fair value. As of December 31, 2007 and 2006, the valuationallowance related to mortgage loans held for sale was $.6 million and $65 million, respectively. At December 31, 2007,mortgage loans held for-sale consisted primarily of agency-eligible first lien mortgage loans. The December 31, 2007valuation allowance related to loans repurchased from investors that were held for resale. At December 31, 2006, thevaluation allowance represented fair value write-downs on nonprime mortgage loans originated by the Corporation’sformer First Franklin unit, which was sold in late 2006. The loans originated by First Franklin that were held for sale atDecember 31, 2006 were transferred to portfolio in March 2007. At the time of transfer, the loans had an unpaidprincipal balance of $1.6 billion, and were transferred net of fair value writedowns of $86 million, $21 million of whichwas recognized in 2007.
During the last half of 2007, the markets for sale of certain mortgage loans were severely disrupted and certainmortgage loans held for sale were not able to be sold. As a result, management reassessed its intent and ability to sellcertain nonagency-eligible residential mortgage loans and home equity loans and lines of credit. Transfers from held forsale to portfolio had an unpaid principal balance of $7.2 billion, and were transferred net of fair value writedowns of$197 million.
Valuation gains and losses are recognized in the income statement within loan sale revenue. Activity related to the FirstFranklin liquidating loan portfolio is reflected within Parent and Other for line of business reporting, while the otherloan valuation and transfer activity is included in the Mortgage Banking line of business.
50

The fair value of loans held for sale in the absence of a ready market is a significant estimate which is sensitive tochange based on market conditions, liquidity of the markets, supply and demand for certain loan products, as well aschanges in prepayment estimates or anticipated credit losses.
Allowance for Loan Losses and Allowance for Losses on Lending-Related Commitments: Management’s assessment ofthe adequacy of the allowance for loan losses and allowance for lending-related commitments considers individualimpaired loans, pools of homogeneous loans with similar risk characteristics, imprecision in estimating losses, and otherenvironmental risk factors. As described below, an established methodology exists for estimating the risk of loss foreach of these elements.
An allowance is established for probable credit losses on impaired loans. Nonperforming commercial loans and leasesexceeding policy thresholds are regularly reviewed to identify impairment. A loan or lease is impaired when, based oncurrent information and events, it is probable that the Corporation will not be able to collect all amounts contractuallydue. Measuring impairment of a loan requires judgment and estimates, and the eventual outcomes may differ fromthose estimates. Impairment is measured based upon the present value of expected future cash flows from the loandiscounted at the loan’s effective rate, the loan’s observable market price or the fair value of collateral, if the loan iscollateral dependent. When the selected measure is less than the recorded investment in the loan, impairment hasoccurred. Impaired loans were $334 million and $220 million at December 31, 2007 and 2006, respectively. Theallowance for impaired loans was $49 million and $60 million at December 31, 2007 and 2006, respectively. While thiselement of the allowance has been relatively flat year to year, the nature of the underlying impaired loans has changed.At December 31, 2007, the allowance for impaired loans was largely related to real estate developer loans, while lastyear it primarily related to passenger airline leases which have since been charged off.
Pools of homogeneous loans with similar risk and loss characteristics are also assessed for probable losses. These loanpools include all other loans and leases not individually evaluated for impairment as discussed above. For commercialloans, a loss migration analysis is performed which averages historic loss ratios. In 2007, management refined itsmethod of applying commercial and commercial real estate loan recoveries within the loss migration analysis. In priorperiods, commercial and commercial real estate recoveries were largely applied to the nonperforming loan category. In2007, these recoveries have now been applied across all loan grades to produce what management believes is a moreaccurate estimate of the net loss ratio for each category. For consumer loans, average historical losses are utilized toestimate losses currently inherent in the portfolio. Consumer loans are pooled by probability of default within productsegments. The probability of default is based on the historical performance of customer attributes, such as credit score,loan-to-value, origination date, collateral type, worst delinquency, and other relevant factors. Credit losses on certainconsumer loans are covered by lender-paid mortgage insurance. These insurance policies have various levels ofcoverage, deductibles, and stop loss limits. Management considers probable third-party insurance recoveries in itsassessment of estimated losses for pools of homogeneous loans. The allowance for pools of homogeneous loans was$1.3 billion and $757 million at December 31, 2007 and 2006, respectively. This element of the allowance increased in2007 primarily due to a higher expected probability of default rate assigned to the liquidating residential real estateloan portfolio and residential construction loans arising from adverse trends observed in delinquencies, charge-offs andforeclosures.
An allowance is also recognized for imprecision inherent in loan loss migration models and other estimates of loss.Imprecision occurs because historic loss patterns may not be representative of losses inherent in the current portfolio.Reasons for imprecision include expansion of the Corporation’s footprint, changes in economic conditions, and difficultyidentifying triggering events, among other factors. Imprecision is estimated by comparing actual losses incurred topreviously forecasted losses over several time periods. The volatility of this imprecision, as expressed in terms of thestandard deviation of the difference between the actual and forecasted losses, is used to calculate an imprecisionpercentage that represents the probable forecast error. The imprecision percentage is applied to the current portfoliobalance to determine the required allowance. The allowance established for imprecision was $505 million and$392 million at December 31, 2007 and 2006, respectively. This element of the allowance increased in 2007 due tochanges in the portfolio mix, including recent acquisitions.
Finally, the allowance considers specific environmental factors which pose additional risks that may not have beenadequately captured in the elements described above. For each environmental risk, a range of expected losses is
51

calculated based on observable data. Management applies judgment to determine the most likely amount of losswithin the range. When an allowance is established for environmental risks, conditions for its release are alsoestablished. During 2007, management established a $25 million environmental reserve for home equity lines and loansthat were transferred to portfolio. Continued weakness in the housing markets, particularly in California and Florida,resulted in a significant increase in delinquency rates for home equity lines and loans above the historical rates used inthe Corporation’s estimated loss model. The allowance for loan losses allocated to environmental risks was $15 millionat December 31, 2007. The environmental reserve decreased by $10 million due to charge-offs from the related homeequity lines and loans. There was no allowance for environmental risks recorded at December 31, 2006.
There are many factors affecting the allowance for loan losses and allowance for lending-related commitments; someare quantitative while others require qualitative judgment. Although management believes its methodology fordetermining the allowance adequately considers all of the potential factors to identify and quantify probable losses inthe portfolio, the process includes subjective elements and is therefore susceptible to change. To the extent that actualoutcomes differ from management’s estimates, additional provision for credit losses could be required, or a previouslyrecognized provision could be reversed, either of which could have a material impact on earnings in future periods. Inaddition, a higher allowance for loan losses may be required in future periods if the economy enters a recession or theweakness in the housing markets deteriorates further, or continues for a prolonged period.
The allowance for loan losses addresses incurred credit losses in the loan and lease portfolio and is presented as areserve against portfolio loans on the balance sheet. The allowance for losses on lending-related commitmentsaddresses incurred credit losses in commitments to lend and letters of credit and is presented in accrued expenses andother liabilities on the balance sheet. The allowance for losses on lending-related commitments is computed using amethodology similar to that used in determining the allowance for loan losses, modified to take into account theprobability of funding these commitments. When a commitment is funded, any previously established allowance forlosses on lending-related commitments is reversed and re-established in the allowance for loan losses.
The allowance for loan losses and the allowance for losses on lending-related commitments are assigned to businesslines based on the nature of the loan portfolio in each business line. Commercial Banking-Regional, CommercialBanking-National, Retail Banking, and Mortgage Banking have been assigned most of the allowance, and accordingly,would be the business lines most affected by actual outcomes differing from prior estimates.
Valuation of Mortgage Servicing Rights (MSRs): The Corporation employs a risk management strategy designed toprotect the value of MSRs from changes in interest rates. MSR values are hedged with securities and a portfolio ofderivatives, primarily interest-rate swaps, options, mortgage-backed forwards, and futures contracts. As interest rateschange, these financial instruments are expected to have changes in fair value which are negatively correlated to thechange in fair value of the hedged MSR portfolio. The hedge relationships are actively managed in response tochanging market risks over the life of the MSR assets. Selecting appropriate financial instruments to hedge this riskrequires significant management judgment to assess how mortgage rates and prepayment speeds could affect thefuture values of MSRs.
Management has elected fair value as its measurement method for MSRs. Management measures net MSR hedginggains or losses as the change in the fair value of mortgage servicing rights, exclusive of changes associated with timedecay and payoffs, compared to the change in the fair value of the associated financial instruments. Hedging resultsare frequently volatile in the short term, but over longer periods of time the hedging strategies have been largelysuccessful in protecting the economic value of the MSR portfolio.
MSRs do not trade in an active open market with readily observable market prices. Although sales of MSRs do occur,the exact terms and conditions may not be available. As a result, MSRs are established and valued using discountedcash flow modeling techniques which require management to make estimates regarding future net servicing cashflows, taking into consideration actual and expected mortgage loan prepayment rates, discount rates, servicing costs,and numerous other factors. Management regularly updates its model inputs to reflect current market conditions. Inaddition, the reasonableness of the model is periodically validated by obtaining third-party broker estimates of the fairvalue of the MSR portfolio.
52

The expected and actual rates of mortgage loan prepayments are the most significant factors driving the value ofMSRs. During 2007, weakness in the housing markets caused prepayments to slow as fewer borrowers refinanced theirmortgages. The Corporation uses an internal proprietary model to estimate future loan prepayments. This model usesempirical data drawn from the historical performance of the Corporation’s managed portfolio. The implementation ofthis model resulted in a one-time decrease in the fair value of MSRs of $56 million during 2006.
Future interest rates are another significant factor in the valuation of MSRs. In 2007, the Corporation refined its MSRvaluation model to incorporate market implied forward interest rates to estimate the future direction of mortgage anddiscount rates. The forward rates utilized are derived from the current yield curve for U.S. dollar interest-rate swaps andare consistent with pricing of capital markets instruments. In prior periods, the MSR valuation model held interest ratesconstant at the current market rate. This change in model inputs had a negligible impact on the MSR valuation as theforward curve was relatively flat at the date of adoption. However, changes in the shape and slope of the forwardcurve could introduce additional volatility to the fair value of MSRs in the future.
The fair value of MSRs and significant inputs to the valuation model at December 31, are shown below.
(Dollars in Millions) 2007 2006
Fair value $2,526 $2,094Weighted-average life (in years) 5.0 5.0Weighted-average constant prepayment rate (CPR) 14.21% 17.66%Spread over forward interest-rate swap rates 5.79 —Weighted-average discount rate — 9.77
A sensitivity analysis of the hypothetical effect on the fair value of MSRs to adverse changes in key assumptions ispresented below. Changes in fair value generally cannot be extrapolated because the relationship of the change in theassumption to the change in fair value may not be linear. Also, the effect of a variation in a particular assumption onthe fair value of the MSRs is calculated independently without changing any other assumption. In reality, changes inone factor may result in changes in another (for example, changes in mortgage interest rates, which drive changes inprepayment rate estimates, could result in changes in the interest-rate spread), which could either magnify orcounteract the sensitivities.
(Dollars in Millions)December 31
2007
Fair value $2,526Prepayment rate:Decline in fair value from 10% adverse change 121Decline in fair value from 20% adverse change 233
Spread over forward interest-rate swap rates(a):Decline in fair value from 10% adverse change 55Decline in fair value from 20% adverse change 107
(a) Used to discount MSR cash flows.
Derivative Instruments: The Corporation regularly uses derivative instruments as part of its risk management activities toprotect the value of certain assets and liabilities and future cash flows against adverse price or interest-rate movements.The Corporation also has residential and commercial mortgage loan commitments related to loans to be sold, whichare defined as derivatives under SFAS 133, and enters into derivatives for trading purposes.
All derivative instruments are carried at fair value on the balance sheet. Management values derivative instrumentsusing observable market prices, when available. In the absence of observable market prices, management usesdiscounted cash flow models to estimate the fair value of derivatives. The interest rates used in these cash flow modelsare based on forward yield curves observable in the current cash and derivatives markets, consistent with howderivatives are valued by most market participants. As of December 31, 2007, the recorded fair values of derivativeassets and liabilities were $1.0 billion and $608 million, respectively.
53

Certain derivative instruments are formally designated in SFAS 133 hedge relationships as a hedge of one of thefollowing: the fair value of a recognized asset or liability, the expected future cash flows of a recognized asset orliability, or the expected future cash flows of a forecasted transaction. For these derivatives, both at the inception of thehedge and on an ongoing basis, management assesses the effectiveness of the hedge instrument in achievingoffsetting changes in fair value or cash flows compared to the hedged item.
At the inception of each SFAS 133 hedge relationship, management performs a prospective test of the effectiveness ofthe hedge. For hedges of commercial real estate loans originated for sale, management reviews the terms of the hedgeinstrument compared to the terms of the hedged item to assess whether the hedge relationship is expected to behighly effective. For all other SFAS 133 hedge relationships, a quantitative prospective test is performed at the inceptionof the hedge to assess the effectiveness of the hedge.
For each SFAS 133 hedge relationship, a quantitative retrospective test is performed to determine if the hedge washighly effective. The methods utilized to retrospectively test hedge effectiveness, as well as the frequency of testing,vary based on the hedged item and the designated hedge period. For fair value hedges of fixed-rate debt, includingcertificates of deposit, management utilizes a dollar offset ratio to test hedge effectiveness on a monthly basis. For fairvalue hedges of portfolio loans and residential mortgage loans held for sale, a dollar offset ratio test is performed on adaily basis. Effectiveness testing for commercial real estate loans originated for sale is measured using a dollar offsetratio test applied on either a monthly or quarterly basis. For cash flow hedges of funding products, a dollar offset ratiotest is applied on a monthly basis. For cash flow hedges of commercial loans, a monthly regression analysis isperformed. There are no known sources of variability between the hedge instrument and the hedged item that areexcluded from the effectiveness test.
When a retrospective hedge effectiveness test fails, the change in the derivative’s fair value is recognized in earningswithout a corresponding offset for the hedged item. A quantitative prospective test is then employed to determinewhether the hedge relationship is expected to be highly effective in future periods under various interest-rate shockscenarios. The method used for these prospective tests is the same method used for retrospective testing.
Because the majority of the derivative instruments are used to protect the value of recognized assets and liabilities onthe balance sheet, changes in the value of the derivative instruments are typically offset by changes in the value of theassets and liabilities being hedged, although income statement volatility can still occur if the derivative instruments arenot effective in hedging changes in the fair value of those assets and liabilities. Changes in the fair values of derivativeinstruments associated with mortgage banking activities are included in either loan sale revenue or loan servicingrevenue on the income statement and affect the results of the Mortgage Banking line of business. Changes in the fairvalues of other derivatives are included in other noninterest income on the income statement and are primarilygenerated from investment funding activities that are not allocated to the business lines. Notes 1 and 25 to theConsolidated Financial Statements provide further discussion on the accounting and use of derivative instruments.
Impairment of Goodwill: Historically, management has utilized market-based valuation multiples when available toestimate the fair value of its reporting units. During 2007, severe disruption in the mortgage markets led to a decline inthe profitability of mortgage companies. As a result, during annual impairment testing, observable market priceinformation in the form of comparable mortgage companies price/earnings ratios was no longer available.Management modified its valuation procedures to employ a discounted cash flow model to estimate fair value of itsmortgage business. This model applied assumptions that a market participant would use, taking into account thetiming and the risk of the related cash flows. The resulting fair value of the Mortgage Banking segment wasdetermined to be less than its carrying value. Management measured the impairment loss as the excess of the carryingamount of the goodwill over its implied fair value. The result was an impairment loss of $181 million. At December 31,2007, there is no goodwill remaining in the Mortgage Banking segment.
Income Taxes: The Corporation is subject to the income tax laws of the U.S., its states and other jurisdictions where itconducts business. These laws are complex and subject to different interpretations by the taxpayer and the varioustaxing authorities. In determining the provision for income taxes, management must make judgments and estimatesabout the application of these inherently complex laws, related regulations, and case law. In the process of preparingthe Corporation’s tax returns, management attempts to make reasonable interpretations of the tax laws. These
54

interpretations are subject to challenge by the tax authorities upon audit or to reinterpretation based on management’songoing assessment of facts and evolving case law. The Internal Revenue Service (IRS) has completed their examinationsof the Corporation’s income tax returns for years prior to 2003, except for a 2002 amended return that was filedsubsequent to the completion of the 2002 audit. Their examination of tax years 2003-2004 is currently in process. Atthis time, the IRS has not proposed any significant adjustments to the tax positions claimed on these returns that arenot currently reflected in the Corporation’s income tax reserves.
The Corporation adopted the provisions of FASB Interpretation No. 48, Accounting for Uncertainty in Income Taxes, onJanuary 1, 2007. As a result of the adoption of this new accounting standard, the Corporation recognized a $31 millionincrease in its estimated liability for uncertain tax positions ($24 million net of tax), which was recorded as thecumulative effect of an accounting change, reducing the opening balance of retained earnings. As of December 31,2007, the estimated liability for uncertain tax positions was $209 million, excluding accrued interest and penalties of$58 million. Approximately $109 million of that liability pertains to tax positions where a change in the actual orestimated outcome would increase or decrease the provision for income taxes.
It is reasonably possible that the liability for uncertain tax positions could increase or decrease in the next 12 monthsdue to the completion of tax authorities’ exams or the expiration of the statute of limitations. Management estimatesthat the liability for uncertain tax positions could decrease by $22 million within the next 12 months.
The provision for interest and penalties was $22 million, $4 million and $4 million for the years ended December 31,2007, 2006 and 2005, respectively. The Corporation recognizes interest and penalties associated with uncertain taxpositions within income tax expense.
Recent Accounting Pronouncements and Developments
Note 2 to the Consolidated Financial Statements in Item 8 discusses new accounting policies adopted by theCorporation during 2007 and the expected impact of accounting policies recently issued but not yet required to beadopted. To the extent the adoption of new accounting standards materially affects financial condition, results ofoperations, or liquidity, the impacts are discussed in the applicable section(s) of this section and Notes to theConsolidated Financial Statements.
Fourth Quarter Review
Results for the fourth quarter of 2007 were affected by continued disruption in the mortgage markets anddeterioration in the credit quality of loans secured by real estate. During the quarter, management completed arestructuring of the mortgage business. Production of nonsalable mortgage loans was curtailed and staffing reductionswere initiated. Mortgage loans formerly held for sale were transferred to portfolio. A large provision for loan losses wasrecorded as a result of deteriorating credit trends. Unaudited quarterly results are presented on page 137.
Net loss for the fourth quarter of 2007 was $(333) million, or $(.53) per diluted share, compared to a third quarter2007 net loss of $(19) million, or $(.03) per diluted share. Fourth quarter 2006 net income was $842 million, or $1.36per diluted share, inclusive of a $622 million after-tax gain, or approximately $1.00 per diluted share, on the sale ofFirst Franklin.
Tax-equivalent net interest income for the fourth quarter of 2007 was $1.1 billion, about equal to the precedingquarter, and down 2% compared to the fourth quarter of 2006. Average earning assets increased 5% compared to thepreceding quarter and 10% compared to the fourth quarter a year ago. Net interest margin was 3.30% for the fourthquarter of 2007, down 13 basis points from the third quarter of 2007, and 43 basis points from the fourth quarter of2006. The lower margin in the fourth quarter 2007 reflects higher LIBOR-based funding costs, narrower spreads onboth commercial and consumer loans, and lower levels of noninterest-bearing funds compared to the fourth quarter ayear ago.
Average portfolio loans were $113.5 billion in the fourth quarter of 2007, up from $104.4 billion in the precedingquarter, and $93.1 billion in the fourth quarter a year ago. Both the linked-quarter and year-over-year increases reflect
55

growth in commercial loans, recent acquisitions, and transfers to portfolio of mortgage loans formerly held for sale.Average total deposits were $98.3 billion in the fourth quarter of 2007, up $4.8 billion from the preceding quarter, andup $13.8 billion compared to the fourth quarter a year ago. Deposit balances have grown with recent acquisitions aswell as continued household growth and expansion.
The provision for loan losses was $691 million for the fourth quarter of 2007, compared to $368 million for the thirdquarter of 2007, and $325 million for the fourth quarter of 2006. The large provision in the fourth quarter of 2007reflects higher probable credit losses on nonprime mortgage loans, broker-sourced home equity loans, residentialconstruction loans, and other mortgage assets. Net charge-offs in the fourth quarter of 2007 were $275 million,compared with $141 million in the preceding quarter, and $128 million in the fourth quarter of last year. Both thelinked-quarter and year-over-year increase in net charge-offs were primarily related to mortgage loans and home equitylines of credit.
Noninterest income was $597 million in the fourth quarter of 2007, compared to $624 million in the prior quarter, and$1.7 billion in the fourth quarter of 2006. Excluding the $984 million pretax gain on the sale of First Franklin,noninterest income for the fourth quarter of 2006 would have been $718 million. Net loan sale (loss)/revenue were$(149) million in the fourth quarter of 2007, $(74) million in the third quarter of 2007, versus $122 million in thefourth quarter a year ago. During the fourth quarter of 2007, additional fair value write-downs of $154 million wererecorded on loans held for sale due to further deterioration in market values, failed trades, and trade kick-outs. Loanservicing revenue was $115 million in the fourth quarter of 2007, compared to $159 million in the immediatelypreceding quarter, and $52 million in the fourth quarter a year ago. Net mortgage servicing right (MSR) hedging pretaxgains/(losses) were $11 million in the fourth quarter of 2007, $64 million in the preceding quarter, and $(60) million inthe fourth quarter a year ago. Deposit service fees, other service fees and brokerage revenue all showed growth in thefourth quarter of 2007.
Noninterest expense was $1.6 billion for the fourth quarter of 2007, compared to $1.4 billion in the third quarter of2007, and $1.2 billion in the fourth quarter a year ago. The fourth quarter of 2007 included a goodwill impairmentcharge of $181 million related to the mortgage business and accruals for Visa indemnification losses of $132 million.Noninterest expense for the third quarter of 2007 included a Visa indemnification loss of $157 million, mortgage assetimpairments of $44 million, and a probable litigation settlement of $25 million. No similar items were present in thefourth quarter of last year. Severance and outplacements costs were $66 million in the fourth quarter of 2007,$23 million in the third quarter of 2007, and $9 million in the fourth quarter a year ago.
Item 7A. QUANTITATIVE AND QUALITATIVE DISCLOSURES ABOUT MARKET RISK
The information required by this item is incorporated by reference to Item 7 under the Market Risk section.
56

Item 8. FINANCIAL STATEMENT AND SUPPLEMENTARY DATA
Report on Management’s Assessment of Internal Control over Financial Reporting
National City Corporation is responsible for the preparation, integrity, and fair presentation of the financial statementsincluded in this annual report. The financial statements and notes have been prepared in conformity with United Statesgenerally accepted accounting principles and necessarily include some amounts that are based on management’s bestestimates and judgments.
As management of National City Corporation, we are responsible for establishing and maintaining effective internalcontrol over financial reporting that is designed to produce reliable financial statements in conformity with UnitedStates generally accepted accounting principles. The system of internal control over financial reporting as it relates tothe financial statements is evaluated for effectiveness by management and tested for reliability through a program ofinternal audits. Actions are taken to correct potential deficiencies as they are identified. Any system of internal control,no matter how well designed, has inherent limitations, including the possibility that a control can be circumvented oroverridden and misstatements due to error or fraud may occur and not be detected. Also, because of changes inconditions, internal control effectiveness may vary over time. Accordingly, even an effective system of internal controlwill provide only reasonable assurance with respect to financial statement preparation.
Management assessed the system of internal control over financial reporting as of December 31, 2007, in relation tocriteria for effective internal control over financial reporting as described in “Internal Control — Integrated Framework,”issued by the Committee of Sponsoring Organizations of the Treadway Commission. Based on this assessment,management concludes that, as of December 31, 2007, its system of internal control over financial reporting iseffective and meets the criteria of the “Internal Control — Integrated Framework.” Ernst & Young LLP, independentregistered public accounting firm, has issued an attestation report on the effectiveness of internal control over financialreporting.
/s/ PETER E. RASKIND
Peter E. RaskindChairman, President, andChief Executive Officer
/s/ JEFFREY D. KELLY
Jeffrey D. KellyVice Chairman andChief Financial Officer
Cleveland, OhioFebruary 13, 2008
57

Reports of Ernst & Young LLP,Independent Registered Public Accounting Firm
Report on Consolidated Financial Statements
Audit Committee of the Board of Directors and the Stockholders of National City Corporation
We have audited the accompanying consolidated balance sheets of National City Corporation and subsidiaries as ofDecember 31, 2007 and 2006, and the related consolidated statements of income, changes in stockholders’ equity,and cash flows for each of the three years in the period ended December 31, 2007. These financial statements are theresponsibility of National City Corporation’s management. Our responsibility is to express an opinion on these financialstatements based on our audits.
We conducted our audits in accordance with the standards of the Public Company Accounting Oversight Board (UnitedStates). Those standards require that we plan and perform the audit to obtain reasonable assurance about whether thefinancial statements are free of material misstatement. An audit includes examining, on a test basis, evidencesupporting the amounts and disclosures in the financial statements. An audit also includes assessing the accountingprinciples used and significant estimates made by management, as well as evaluating the overall financial statementpresentation. We believe that our audits provide a reasonable basis for our opinion.
In our opinion, the financial statements referred to above present fairly, in all material respects, the consolidatedfinancial position of National City Corporation and subsidiaries at December 31, 2007 and 2006, and the consolidatedresults of their operations and their cash flows for each of the three years in the period ended December 31, 2007, inconformity with U.S. generally accepted accounting principles.
As discussed in Note 2 to the consolidated financial statements, National City Corporation changed its method ofaccounting for defined benefit pension and other postretirement plans as of December 31, 2006, in accordance withFinancial Accounting Standards Board No. 158, Employers’ Accounting for Defined Benefit Pension and OtherPostretirement Plans and also changed its method of accounting for uncertain tax positions on January 1, 2007, inaccordance with FASB Interpretation No. 48, Accounting for Uncertainty in Income Taxes.
We also have audited, in accordance with the standards of the Public Company Accounting Oversight Board (UnitedStates), National City Corporation’s internal control over financial reporting as of December 31, 2007, based on criteriaestablished in Internal Control — Integrated Framework issued by the Committee of Sponsoring Organizations of theTreadway Commission and our report dated February 13, 2008 expressed an unqualified opinion thereon.
Cleveland, OhioFebruary 13, 2008
58

Report on Effectiveness of Internal Control Over Financial Reporting
Audit Committee of the Board of Directors and the Stockholders of National City Corporation
We have audited National City Corporation’s internal control over financial reporting as of December 31, 2007, basedon criteria established in Internal Control — Integrated Framework issued by the Committee of SponsoringOrganizations of the Treadway Commission (the COSO criteria). National City Corporation’s management is responsiblefor maintaining effective internal control over financial reporting, and for its assessment of the effectiveness of internalcontrol over financial reporting included in the accompanying Report on Management’s Assessment of Internal ControlOver Financial Reporting. Our responsibility is to express an opinion on the company’s internal control over financialreporting based on our audit.
We conducted our audit in accordance with the standards of the Public Company Accounting Oversight Board (UnitedStates). Those standards require that we plan and perform the audit to obtain reasonable assurance about whethereffective internal control over financial reporting was maintained in all material respects. Our audit included obtainingan understanding of internal control over financial reporting, assessing the risk that a material weakness exists, testingand evaluating the design and operating effectiveness of internal control based on the assessed risk, and performingsuch other procedures as we considered necessary in the circumstances. We believe that our audit provides areasonable basis for our opinion.
A company’s internal control over financial reporting is a process designed to provide reasonable assurance regardingthe reliability of financial reporting and the preparation of financial statements for external purposes in accordance withgenerally accepted accounting principles. A company’s internal control over financial reporting includes those policiesand procedures that (1) pertain to the maintenance of records that, in reasonable detail, accurately and fairly reflect thetransactions and dispositions of the assets of the company; (2) provide reasonable assurance that transactions arerecorded as necessary to permit preparation of financial statements in accordance with generally accepted accountingprinciples, and that receipts and expenditures of the company are being made only in accordance with authorizationsof management and directors of the company; and (3) provide reasonable assurance regarding prevention or timelydetection of unauthorized acquisition, use, or disposition of the company’s assets that could have a material effect onthe financial statements.
Because of its inherent limitations, internal control over financial reporting may not prevent or detect misstatements.Also, projections of any evaluation of effectiveness to future periods are subject to the risk that controls may becomeinadequate because of changes in conditions, or that the degree of compliance with the policies or procedures maydeteriorate.
In our opinion, National City Corporation maintained, in all material respects, effective internal control over financialreporting as of December 31, 2007, based on the COSO criteria.
We also have audited, in accordance with the standards of the Public Company Accounting Oversight Board (UnitedStates), the consolidated balance sheets of National City Corporation as of December 31, 2007 and 2006, and therelated consolidated statements of income, stockholders’ equity, and cash flows for each of the three years in theperiod ended December 31, 2007 and our report dated February 13, 2008 expressed an unqualified opinion thereon.
Cleveland, OhioFebruary 13, 2008
59

CONSOLIDATED FINANCIAL STATEMENTSCONSOLIDATED BALANCE SHEETS
(Dollars in Thousands, Except Per Share Amounts) 2007 2006December 31
AssetsCash and demand balances due from banks $ 3,226,493 $ 3,521,153Federal funds sold and security resale agreements 100,278 1,551,350Securities available for sale, at fair value 8,731,257 7,508,820Other investments 2,306,297 6,317,779Loans held for sale or securitization:
Commercial 41,351 33,661Commercial real estate 507,641 177,312Residential real estate 3,741,322 9,327,783Home equity lines of credit — 2,888,512Credit card — 425,000Student loans 159 638
Total loans held for sale or securitization 4,290,473 12,852,906Portfolio loans:
Commercial 30,914,512 26,969,081Commercial leases 4,437,162 4,082,940Commercial construction 9,051,007 7,160,310Commercial real estate 14,883,089 12,436,458Residential real estate 30,242,757 21,881,602Home equity lines of credit 18,079,580 14,594,782Credit card and other unsecured lines of credit 3,914,693 3,006,789Other consumer 4,499,181 5,360,110
Total portfolio loans 116,021,981 95,492,072Allowance for loan losses (1,761,728) (1,131,175)
Net portfolio loans 114,260,253 94,360,897Properties and equipment 1,707,487 1,402,150Equipment leased to others 374,789 572,952Other real estate owned 424,332 229,070Mortgage servicing rights 2,525,842 2,094,387Goodwill 5,423,907 3,815,911Other intangible assets 355,823 183,648Derivative assets 1,030,794 612,914Accrued income and other assets 5,616,003 5,166,905
Total Assets $150,374,028 $140,190,842
LiabilitiesDeposits:
Noninterest bearing $ 17,363,648 $ 17,537,278NOW and money market 37,868,236 30,335,531Savings 2,870,716 1,881,444Consumer time 29,433,081 23,620,821Other 3,110,153 4,119,756Foreign 6,909,661 9,738,760Total deposits 97,555,495 87,233,590
Federal funds borrowed and security repurchase agreements 5,100,185 5,283,997Borrowed funds 2,055,063 1,648,967Long-term debt 25,992,453 25,406,971Junior subordinated debentures owed to unconsolidated subsidiary trusts 1,899,683 948,705Derivative liabilities 608,131 717,830Accrued expenses and other liabilities 3,755,190 4,369,779
Total Liabilities $136,966,200 $125,609,839
Stockholders’ EquityPreferred stock, no par value, authorized 5,000,000 shares, 70,272 shares outstanding in 2007 and
2006 (Liquidation preference of $7 million) $ — $ —Common stock, par value $4 per share, 1,400,000,000 shares authorized, 633,945,720 and
632,381,603 outstanding shares at December 31, 2007 and 2006, respectively 2,535,783 2,529,527Capital surplus 6,374,955 4,793,537Retained earnings 4,405,526 7,328,853Accumulated other comprehensive income (loss) 91,564 (70,914)
Total Stockholders’ Equity 13,407,828 14,581,003Total Liabilities and Stockholders’ Equity $150,374,028 $140,190,842
See Notes to Consolidated Financial Statements
60

CONSOLIDATED STATEMENTS OF INCOME
(Dollars in Thousands, Except Per Share Amounts) 2007 2006 2005For the Calendar Year
Interest IncomeLoans $ 8,570,273 $ 8,351,493 $ 7,239,110Securities:
Taxable 396,378 385,807 342,797Exempt from Federal income taxes 19,899 25,461 30,509Dividends 2,646 2,906 8,857
Federal funds sold and security resale agreements 63,842 34,847 12,266Other investments 132,057 133,248 98,280
Total interest income 9,185,095 8,933,762 7,731,819Interest Expense
Deposits 2,990,671 2,420,316 1,604,601Federal funds borrowed and security repurchase agreements 272,504 284,505 209,893Borrowed funds 108,662 102,893 67,896Long-term debt and capital securities 1,417,525 1,522,445 1,153,681
Total interest expense 4,789,362 4,330,159 3,036,071Net Interest Income 4,395,733 4,603,603 4,695,748Provision for Loan Losses 1,325,903 488,208 300,531
Net interest income after provision for loan losses 3,069,830 4,115,395 4,395,217Noninterest Income
Deposit service charges 904,813 818,301 740,280Loan sale (loss) revenue (38,353) 765,513 808,356Loan servicing revenue 401,732 91,467 399,379Trust and investment management fees 317,984 300,747 296,012Brokerage revenue 188,672 157,823 159,433Leasing revenue 177,974 228,149 267,315Other service fees 142,832 138,147 129,497Insurance revenue 133,617 129,341 102,789Card-related fees 125,024 109,768 105,222Gain on divestitures 16,493 983,940 16,001Securities gains (losses), net 21,816 (483) 27,087Other 213,557 296,252 252,948
Total noninterest income 2,606,161 4,018,965 3,304,319Noninterest Expense
Salaries, benefits, and other personnel 2,580,226 2,603,554 2,560,250Impairment, fraud, and other losses 614,161 51,095 90,887Third-party services 357,245 352,343 332,391Equipment 335,344 326,058 303,471Net occupancy 315,037 297,949 315,647Marketing and public relations 156,922 147,679 164,533Leasing expense 119,244 165,067 178,969Other 827,135 767,979 787,972
Total noninterest expense 5,305,314 4,711,724 4,734,120Income before income tax expense 370,677 3,422,636 2,965,416Income tax expense 56,702 1,122,800 980,187Net Income $ 313,975 $ 2,299,836 $ 1,985,229
Net Income Per Common ShareBasic $ .51 $ 3.77 $ 3.13Diluted .51 3.72 3.09
Average Common Shares OutstandingBasic 606,388,766 609,316,070 633,431,660Diluted 612,236,659 617,671,507 641,600,969
Dividends declared per common share $ 1.60 $ 1.52 $ 1.44
See Notes to Consolidated Financial Statements
61

CONSOLIDATED STATEMENTS OF CHANGES IN STOCKHOLDERS’ EQUITY
(Dollars in Thousands, Except Per Share Amounts)Preferred
StockCommon
StockCapitalSurplus
RetainedEarnings
AccumulatedOther
ComprehensiveIncome (Loss) Total
Balance, December 31, 2004 $— $2,586,999 $3,647,711 $ 6,468,231 $ 100,588 $12,803,529Comprehensive income:
Net income 1,985,229 1,985,229Other comprehensive income, net of tax:
Change in unrealized gains and losses onsecurities, net of reclassification adjustment fornet gains included in net income (111,211) (111,211)
Change in unrealized gains and losses onderivative instruments used in cash flowhedging relationships, net of reclassificationadjustment for net losses included in netincome 22,488 22,488
Total comprehensive income 1,896,506Common dividends declared, $1.44 per share (922,377) (922,377)Preferred dividends declared, $23.00 per share (1,616) (1,616)Issuance of 5,283,451 common shares under stock
option plans 21,337 142,194 163,531Issuance of 6,444,223 common shares pursuant to
exercise of PRIDES forward contracts 25,777 139,224 165,001Repurchase of 43,480,400 common shares (173,922) (247,526) (1,070,255) (1,491,703)
Balance, December 31, 2005 $— $2,460,191 $3,681,603 $ 6,459,212 $ 11,865 $12,612,871Comprehensive income:
Net income 2,299,836 2,299,836Other comprehensive income, net of tax:
Change in unrealized gains and losses onsecurities, net of reclassification adjustment fornet gains included in net income 7,956 7,956
Change in unrealized gains and losses onderivative instruments used in cash flowhedging relationships, net of reclassificationadjustment for net gains included in net income (19,388) (19,388)
Total comprehensive income 2,288,404Cumulative effect of change in accounting for
mortgage servicing assets 16,886 16,886Cumulative effect of change in accounting for pension
and other postretirement obligations (71,347) (71,347)Common dividends declared, $1.52 per share (931,828) (931,828)Preferred dividends declared, $24.26 per share (1,704) (1,704)Issuance of 7,985,388 common shares under stock-
based compensation plans 32,115 253,645 285,760Issuance of 29,456,622 common shares pursuant to
acquisitions(1) 117,826 976,850 1,094,676Repurchase of 20,151,100 common shares (80,605) (118,561) (514,740) (713,906)Other 1,191 1,191
Balance, December 31, 2006 $— $2,529,527 $4,793,537 $ 7,328,853 $ (70,914) $14,581,003Comprehensive income:
Net income 313,975 313,975Other comprehensive income, net of tax:
Change in unrealized gains and losses onsecurities, net of reclassification adjustment fornet gains included in net income 10,596 10,596
Change in unrealized gains and losses onderivative instruments used in cash flowhedging relationships, net of reclassificationadjustment for net gains included in net income 73,396 73,396
Change in accumulated unrealized losses forpension and other postretirement obligations 78,486 78,486
Total comprehensive income 476,453Cumulative effect of change in accounting for
uncertainty in income taxes (24,122) (24,122)Common dividends declared, $1.60 per share (983,170) (983,170)Preferred dividends declared, $25.54 per share (1,794) (1,794)Issuance of 7,336,512 common shares under stock-
based compensation plans 29,757 226,061 255,818Issuance of 80,291,037 common shares pursuant to
acquisitions(1) 321,165 2,015,188 2,336,353Repurchase of 86,166,638 common shares (344,666) (659,831) (2,228,216) (3,232,713)
Balance, December 31, 2007 $— $2,535,783 $6,374,955 $ 4,405,526 $ 91,564 $13,407,828
(1) Includes fair value of stock options exchanged and other equity instruments issued, if applicable.See Notes to Consolidated Financial Statements
62

CONSOLIDATED STATEMENTS OF CASH FLOWS
(In Thousands) 2007 2006 2005For the Calendar Year
Operating ActivitiesNet income $ 313,975 $ 2,299,836 $ 1,985,229Adjustments to reconcile net income to net cash provided by operating activities:
Provision for loan losses 1,325,903 488,208 300,531Depreciation and amortization of properties and equipment 361,586 398,193 426,011(Accretion) amortization on securities, loans, deposits, and debt obligations (33,394) 167,509 (65,294)MSR fair value changes 284,613 405,754 432,108Amortization of intangible assets and other servicing assets 131,210 95,211 99,012Derivative losses (gains), net 37,274 (266,414) (317,058)Gain on divestitures (16,493) (983,940) (16,001)Gains on loans sold or securitized, net (137,059) (623,431) (602,286)Other losses (gains), net 313,628 (14,301) 88,692Impairment and indemnification charges 552,270 24,671 41,537Originations and purchases of loans held for sale or securitization (51,669,117) (70,524,228) (74,928,227)Principal payments on and proceeds from sales of loans held for sale or securitization 49,215,468 65,478,627 75,808,753Net change in trading assets and liabilities (376,780) 306,987 (515,643)(Benefit) provision for deferred income taxes (405,403) 39,752 348,411Other operating activities, net (636,488) (10,325) 1,039,095
Net cash (used in) provided by operating activities (738,807) (2,717,891) 4,124,870Lending and Investing Activities
Net decrease (increase) in federal funds sold, security resale agreements, and otherinvestments 6,101,857 (1,488,655) (263,945)
Purchases of available-for-sale securities (1,907,252) (1,870,931) (2,738,209)Proceeds from sales of available-for-sale securities 1,821,099 1,346,372 1,693,294Proceeds from maturities, calls, and prepayments of available-for-sale securities 1,193,250 1,440,652 1,817,125Net (increase) decrease in portfolio loans (4,624,299) 969,634 (10,850,628)Proceeds from sales of loans 2,774,378 9,919,904 3,158,574Proceeds from securitizations of loans 425,000 648,236 2,730,822Net increase in properties and equipment (220,552) (304,506) (189,505)Net cash (paid) received for acquisitions (248,677) 156,561 (322,273)Net cash (transferred) received for divestitures (125,942) (74,214) 24,241
Net cash provided by (used in) lending and investing activities 5,188,862 10,743,053 (4,940,504)Deposit and Financing Activities
Net (decrease) increase in deposits (275,634) 429,842 (1,663,242)Net (decrease) increase in federal funds borrowed and security repurchase agreements (647,188) (1,237,235) 606,826Net increase (decrease) in borrowed funds 371,405 (769,191) 1,457,883Repayments of long-term debt (8,500,087) (13,421,953) (9,736,627)Proceeds from issuances of long-term debt 8,327,070 8,188,570 12,159,635Dividends paid (984,964) (933,532) (923,993)Issuances of common stock 180,018 224,470 282,480Repurchases of common stock (3,232,713) (713,906) (1,491,703)Excess tax benefit for share based payments 17,378 21,261 —
Net cash (used in) provided by deposit and financing activities (4,744,715) (8,211,674) 691,259Net decrease in cash and demand balances due from banks (294,660) (186,512) (124,375)Cash and demand balances due from banks, January 1 3,521,153 3,707,665 3,832,040Cash and Demand Balances Due from Banks, December 31 $ 3,226,493 $ 3,521,153 $ 3,707,665
Supplemental InformationCash paid for:
Interest $ 4,839,526 $ 4,289,917 $ 3,004,305Income taxes 834,397 658,961 835,635
Noncash items:Transfers of portfolio loans and property to other real estate 758,189 468,645 204,203Transfers of portfolio loans to held for sale 609,840 10,578,105 3,650,826Transfers of held for sale loans to portfolio 8,796,693 64,237 314,699Common shares and stock options issued for acquisitions 2,336,353 1,088,031 (10,842)Investment received upon sale of First Franklin — 4,474,810 —Carrying value of securities donated to the National City Foundation — — 24,179
63

Notes to Consolidated Financial Statements
Nature of Operations
National City Corporation (National City or the Corporation) is a financial holding company headquartered in Cleveland,Ohio. National City operates through an extensive branch bank network in Ohio, Florida, Illinois, Indiana, Kentucky,Michigan, Missouri, Pennsylvania, and Wisconsin, and also conducts selected lending businesses and provides otherfinancial services on a nationwide basis. Primary businesses include commercial and retail banking, mortgage financingand servicing, consumer finance, and asset management.
1. Basis of Presentation and Significant Accounting Policies
The accompanying Consolidated Financial Statements include the accounts of the Corporation and its consolidatedsubsidiaries. All significant intercompany transactions and balances have been eliminated. Certain prior period amountshave been reclassified to conform with the current period presentation.
Consolidation: Accounting Research Bulletin 51 (ARB 51), Consolidated Financial Statements, requires a company’sconsolidated financial statements include subsidiaries in which a company has a controlling financial interest. Thisrequirement usually has been applied to subsidiaries in which a company has a majority voting interest. Investments incompanies in which the Corporation controls operating and financing decisions (principally defined as owning a votingor economic interest greater than 50%) are consolidated. Investments in companies in which the Corporation hassignificant influence over operating and financing decisions (principally defined as owning a voting or economic interestof 20% to 50%) and limited partnership investments are generally accounted for by the equity method of accounting.These investments are principally included in other assets, and National City’s proportionate share of income or loss isincluded in other noninterest income.
The voting interest approach defined in ARB 51 is not applicable in identifying controlling financial interests in entitiesthat are not controllable through voting interests or in which the equity investors do not bear the residual economicrisks. In such instances, Financial Accounting Standards Board Interpretation 46(R) (FIN 46R), Consolidation of VariableInterest Entities (VIE), provides guidance on when a company should include in its financial statements the assets,liabilities, and activities of another entity. In general, a VIE is a corporation, partnership, trust, or any other legalstructure used for business purposes that either does not have equity investors with voting rights or has equity investorsthat do not provide sufficient financial resources for the entity to support its activities. FIN 46R requires a VIE to beconsolidated by a company if that company is subject to a majority of the risk of loss from the VIE’s activities or entitledto receive a majority of the entity’s residual returns or both. A company that consolidates a VIE is called the primarybeneficiary of that entity. The Corporation’s Consolidated Financial Statements include the assets, liabilities, andactivities of VIEs for which it is deemed to be the primary beneficiary.
The Corporation uses special-purpose entities (SPEs), primarily securitization trusts, to diversify its funding sources. SPEsare not operating entities, generally have no employees, and usually have a limited life. The basic SPE structure involvesthe Corporation transferring assets to the SPE. The SPE funds the purchase of those assets by issuing asset-backedsecurities to investors. The legal documents governing the SPE describe how the cash received on the assets held in theSPE must be allocated to the investors and other parties that have rights to these cash flows. National City structuresthese SPEs to be bankruptcy remote, thereby insulating investors from the impact of the creditors of other entities,including the transferor of the assets.
Where the Corporation is a transferor of assets to an SPE, the assets sold to the SPE generally are no longer recordedon the balance sheet and the SPE is not consolidated when the SPE is a qualifying special-purpose entity (QSPE).Statement of Financial Accounting Standards 140 (SFAS 140), Accounting for Transfers and Servicing of Financial Assetsand Extinguishments of Liabilities, provides specific criteria for determining when an SPE meets the definition of aQSPE. In determining whether to consolidate nonqualifying SPEs where assets are legally isolated from National City’screditors, the Corporation considers such factors as the amount of third-party equity, the retention of risks andrewards, and the extent of control available to third parties. The Corporation currently services credit card and
64

automobile loans that were sold to securitization trusts. Further discussion regarding these securitization trusts isincluded in Note 5.
Use of Estimates: The accounting and reporting policies of National City conform with U.S. generally acceptedaccounting principles (GAAP). The preparation of financial statements in conformity with GAAP requires managementto make estimates, assumptions, and judgments that affect the amounts reported in the financial statements andaccompanying notes. Actual realized amounts could differ materially from those estimates.
Statement of Cash Flows: Cash and demand balances due from banks are considered cash and cash equivalents forfinancial reporting purposes. Cash flows associated with loan activities are classified in the statement of cash flowsbased upon their balance sheet classification at the time of origination or acquisition. Loan activities associated withloans held for sale and portfolio loans are classified as operating and investing activities, respectively, in the statementof cash flows.
Business Combinations: Business combinations are accounted for under the purchase method of accounting. Underthe purchase method, assets and liabilities of the business acquired are recorded at their estimated fair values as of thedate of acquisition with any excess of the cost of the acquisition over the fair value of the net tangible and intangibleassets acquired recorded as goodwill. Results of operations of the acquired business are included in the incomestatement from the date of acquisition. Refer to Note 3 for further discussion.
Loans and Leases: Loans are classified within portfolio when management has the intent and ability to hold the loanfor the foreseeable future, or until maturity or payoff. The foreseeable future is a management judgment which isdetermined based upon the type of loan, business strategies, current market conditions, balance sheet managementand liquidity needs. Management’s view of the foreseeable future may change based on changes in these conditions.When a decision is made to sell or securitize a loan that was not originated or initially acquired with the intent to sellor securitize, the loan is reclassified from portfolio into held for sale or securitization. Loans are classified as held forsale when management has the intent and ability to sell or securitize. Due to changing market conditions or otherstrategic initiatives, management’s intent with respect to the disposition of the loan may change, and accordingly, loanspreviously classified as held for sale may be reclassified into portfolio. Loans transferred between loans held for sale andportfolio classifications are recorded at the lower of cost or market at the date of transfer.
Portfolio loans are carried at the principal amount outstanding net of unearned income, unamortized premiums ordiscounts, deferred loan origination fees and costs, and fair value adjustments, if any. Loans held for sale orsecuritization are carried at the lower of cost or fair value applied on an aggregate basis by type of loan. Fair value ismeasured based on purchase commitments, bids received from potential purchasers, quoted prices for the same orsimilar loans, or prices of recent sales or securitizations. Management considers in its assessment the probability thatbuyer commitments may not close. In the absence of an active market, fair value is based upon a discounted cash flowmodel which utilizes inputs and assumptions which are believed to be consistent with market participants’ views.
When the Corporation sells a loan or group of loans which qualify as a sale pursuant to SFAS 140, the loans areremoved from the balance sheet and a gain or loss is recognized in loan sale revenue.
Interest income is recognized utilizing the interest method. Loan origination fees, fees for providing loan commitmentsthat result in loans, certain direct origination costs, and unearned discounts are deferred and amortized into interestincome utilizing the interest method to achieve a level effective yield over the term of the loan. Other credit-relatedfees, including letter and line of credit fees and loan syndication fees, are recognized as fee income when earned.
Leases are classified as either direct financing leases or operating leases, based on the terms of the lease arrangement.To be classified as a direct financing lease, the lease must have at least one of the following four characteristics: 1) thelease transfers ownership of the property to the lessee by the end of the lease term, 2) the lease contains a bargainpurchase option, 3) the lease term is equal to 75% or more of the estimated economic life of the leased property, or4) the present value of the minimum lease payments are at least 90% of the cost of the leased property. Leases that donot meet any of these four criteria are classified as operating leases and reported as equipment leased to others on thebalance sheet.
65

Income on operating leases is recognized on a straight-line basis over the lease term. Income on direct financing leasesis recognized on a basis that achieves a constant periodic rate of return on the outstanding investment. Income onleveraged leases is recognized on a basis that achieves a constant periodic rate of return on the outstanding investmentin the lease, net of the related deferred tax liability, in the years in which the net investment is positive.
At the inception of a lease, residual value is determined based on the estimated fair market value of the asset at theend of the original lease term. For automobile leases, fair value was based upon published industry market guides. Forcommercial equipment leases, fair value may be based upon observable market prices, third-party valuations, or pricesreceived on sales of similar assets at the end of the lease term. Renewal options and extensions are not considered inthe original lease term due to the absence of penalties for nonrenewal.
Automobile lease residual values and certain types of commercial equipment lease residuals are guaranteed by thirdparties. Although these guarantees of residual value are not considered in determining the initial accounting for theseleases, the guarantees can affect the future accounting for the residual values. Commercial equipment residual valuesnot protected by a guarantee are reviewed quarterly for other-than-temporary impairment. Impairment is assessed bycomparing the carrying value of the leased asset’s residual value to both current and end-of-lease term market values.Where this analysis indicates that an other-than-temporary impairment has occurred, the carrying value of the leaseresidual is reduced to the estimated fair value, with the write-down generally recognized in other noninterest expensein the income statement.
Commercial loans and leases and commercial loans secured by real estate are designated as nonperforming wheneither principal or interest payments are 90 days or more past due (unless the loan or lease is sufficiently collateralizedsuch that full repayment of both principal and interest is expected and is in the process of collection), terms arerenegotiated below market levels, or when an individual analysis of a borrower’s creditworthiness indicates a creditshould be placed on nonperforming status. When a loan is placed on nonperforming status, uncollected interestaccrued in prior years is charged against the allowance for loan losses, while uncollected interest accrued in the currentyear is reversed against interest income. Interest income is recorded on a cash basis during the period the loan is onnonperforming status after recovery of principal is reasonably assured. Nonperforming commercial loans and leases andcommercial loans secured by real estate are generally charged off to the extent principal and interest due exceed thenet realizable value of the collateral, with the charge-off occurring when the loss is reasonably quantifiable but notlater than when the loan becomes 180 days past due.
Commercial and commercial real estate loans exceeding $5 million are evaluated for impairment in accordance with theprovisions of SFAS 114, Accounting by Creditors for Impairment of a Loan, which requires an allowance to beestablished as a component of the allowance for loan losses when it is probable all amounts due will not be collectedpursuant to the contractual terms of the loan and the recorded investment in the loan exceeds its fair value. Fair valueis measured using either the present value of expected future cash flows discounted at the loan’s effective interest rate,the observable market price of the loan, or the fair value of the collateral, if the loan is collateral dependent. All loanssubject to evaluation and considered impaired are included in nonperforming assets.
Loans secured by one-to-four family residential real estate, including home equity lines of credit and loans, aredesignated as nonperforming based upon several factors including payment delinquency, bankruptcy status, and priorprincipal charge-offs. When a loan is placed on nonperforming status, uncollected interest accrued in prior years ischarged against the allowance for loan losses, while uncollected interest accrued in the current year is reversed againstinterest income. Additionally, these loan types are generally charged off to the extent principal and interest due exceedthe estimated realizable value of the collateral on the date the loan becomes 180 days past due, or at the earlier of theforeclosure sale or when an appraisal indicates a value less than the loan value. Loans covered by lender-paid mortgageinsurance are not charged off to the extent an insurance recovery is probable.
Consumer loans are subject to mandatory charge-off at a specified delinquency date and, except for residential realestate loans, are usually not classified as nonperforming prior to being charged off. Closed-end consumer loans, whichinclude installment and student loans and automobile leases, are generally charged off in full no later than when theloan becomes 120 days past due. Open-end, unsecured consumer loans, such as credit card loans, are generallycharged off in full no later than when the loan becomes 150 days past due.
66

Loans that are restructured due to a borrower experiencing financial difficulties, where the Corporation, for economicor legal reasons, grants a concession to the borrower that it would otherwise not consider, are accounted for as atroubled debt restructuring (TDR). TDRs may include certain modifications of terms of loans, receipts of assets fromdebtors in partial or full satisfaction of loans, or a combination of both. Restructured loans classified as TDRs areaccounted for in accordance with SFAS 15, Accounting by Debtors and Creditors for Troubled Debt Restructurings, andSFAS 114.
The Corporation sells residential and commercial real estate loans to Government National Mortgage Association(GNMA) and Federal National Mortgage Association (FNMA) in the normal course of business. These loan sale programsallow the Corporation to repurchase individual delinquent loans that meet certain criteria. Without the sponsoringentity’s prior authorization, the Corporation has the option to repurchase the delinquent loan for an amount equal to100% of the remaining principal balance of the loan. Under SFAS 140, once the Corporation has the unconditionalability to repurchase the delinquent loan, effective control over the loan has been regained. At this point, theCorporation is required to recognize the loan and a related liability on its balance sheet, regardless of the Corporation’sintent to repurchase the loan. Refer to Note 7 for loans and borrowings recognized under these programs.
Allowance for Loan Losses and Allowance for Losses on Lending-Related Commitments: The allowance for loanlosses is maintained at a level believed adequate by management to absorb probable incurred losses within the loanportfolio and is based on the size and current risk characteristics of the loan portfolio, an assessment of individualproblem loans and actual loss experience, probable recoveries under lender paid mortgage insurance, current economicevents in specific industries and geographical areas, including unemployment levels, and other pertinent factors,including regulatory guidance and general economic conditions. Determination of the allowance is inherently subjectiveas it requires significant estimates, including the amounts and timing of expected future cash flows on impaired loans,estimated losses on pools of homogeneous loans based on historical loss experience, insurance coverage limits, andconsideration of current environmental factors and economic trends, all of which may be susceptible to significantchange. Loan losses are charged off against the allowance, while recoveries of amounts previously charged off arecredited to the allowance. A provision for credit losses is recorded based on management’s periodic evaluation of thefactors previously mentioned, as well as other pertinent factors. Evaluations are conducted quarterly. When portfolioloans are identified for sale or securitization, the attributed loan loss allowance is reclassified to held for sale as areduction to the carrying value of the loans. If a loss attributable to deterioration of the creditworthiness of theborrower is anticipated upon sale, a charge-off is recognized upon transfer.
The Corporation maintains an allowance for losses on unfunded commercial lending commitments and letters of creditto provide for the risk of loss inherent in these arrangements. The allowance is computed using a methodology similarto that used to determine the allowance for loan losses, modified to take into account the probability of a drawdownon the commitment. This allowance is reported as a liability on the balance sheet within accrued expenses and otherliabilities, while the corresponding provision for these losses is recorded in noninterest expense.
Other Real Estate Owned: Other real estate owned (OREO) is comprised principally of commercial and residential realestate properties obtained in partial or total satisfaction of loan obligations, as well as bank premises qualifying as heldfor sale under SFAS 144, Accounting for the Impairment or Disposal of Long-Lived Assets. OREO obtained insatisfaction of a loan is recorded at the estimated fair value less anticipated selling costs based upon the property’sappraised value at the date of transfer, with any difference between the fair value of the property and the net carryingvalue of the loan either charged to the allowance for loan losses, or recorded in noninterest income after recovery ofpreviously recognized charge-offs. Bank premises are transferred at the lower of carrying value or estimated fair valueless anticipated selling costs. Subsequent changes in value are reported as adjustments to the carrying amount, not toexceed the initial carrying value of the assets at the time of transfer, with the offset recorded in noninterest expense.Gains or losses not previously recognized resulting from the sale of OREO are recognized in noninterest expense on thedate of sale.
Securities: Investments in debt securities and certain equity securities with readily determinable fair values, other thanthose classified as principal investments or accounted for under the equity method, are accounted for under SFAS 115,Accounting for Certain Investments in Debt and Equity Securities. SFAS 115 requires investments to be classified within
67

one of three categories: trading, held to maturity, or available for sale, based on the type of security and management’sability and intent with regard to selling the security.
Securities purchased with the intention of realizing short-term profits, or that are used to manage risk in other balancesheet assets and liabilities carried at fair value, are considered trading securities, carried at fair value, and are includedin other investments on the balance sheet. Depending on the purpose for holding the securities, realized and unrealizedgains and losses are included in either brokerage revenue, loan servicing revenue or other noninterest income in thestatement of income. Interest on trading account securities is recorded in interest income. Loans are classified astrading when positions are bought and sold primarily to make profits on short-term appreciation or for other tradingpurposes. Trading loans are also included in other investments on the balance sheet and are carried at fair value, withgains and losses included in other noninterest income. See Note 9 for further information on trading securities.
Debt securities are classified as held to maturity when management has the positive intent and ability to hold thesecurities to maturity. Securities held to maturity, when present, are carried at amortized cost. At December 31, 2007,National City held one security as held to maturity with an amortized cost of $6 million and a fair value ofapproximately $6 million. National City held no securities classified as held to maturity at December 31, 2006.
Debt and marketable equity securities not classified as held to maturity or trading are classified as available for sale.Securities available for sale are carried at fair value with unrealized gains and unrealized losses not deemed other-than-temporary reported in accumulated other comprehensive income, net of tax. Realized gains and losses on the sale of,and other-than-temporary impairment charges, on available-for-sale securities are recorded in securities gains or lossesin the statement of income.
Interest and dividends on securities, including amortization of premiums and accretion of discounts using the effectiveinterest method over the period to maturity, are included in interest income. Realized gains and losses on the sale ofsecurities, and other-than-temporary impairment charges, are determined using the specific-identification method.Purchases and sales of securities are recognized on a trade date basis.
Certain equity security investments that do not have readily determinable fair values and for which the Corporationdoes not exercise significant influence are carried at cost and classified either within other investments or other assetson the balance sheet depending on the frequency of dividend declarations. Cost method investments classified withinother investments consist solely of shares of Federal Home Loan Bank and Federal Reserve Bank stock. Theseinvestments totaled $808 million and $483 million at December 31, 2007 and December 31, 2006, respectively. Costmethod investments classified within other assets were less than $1 million at December 31, 2007 and December 31,2006. The Corporation’s investment in Visa has no cost basis. Cost method investments are reviewed for impairment atleast annually or sooner if events or changes in circumstances indicate the carrying value may not be recoverable.
Principal Investments: Principal investments, which include direct investments in private and public companies andindirect investments in private equity funds, are carried at estimated fair value with changes in fair value recognized inother noninterest income.
Direct investments include equity and mezzanine investments in the form of common stock, preferred stock, limitedliability company interests, warrants, and subordinated debt. Direct mezzanine investments in the form of subordinateddebt and preferred stock, which earn interest or dividends, are included in other investments on the balance sheet,while the remainder of the direct investments are included in other assets. Indirect investments include ownershipinterests in private equity funds managed by third-party general partners and are included in other assets on thebalance sheet.
The fair values of publicly traded investments are determined using quoted market prices, subject to various discountfactors related to sales restrictions and regulations, when appropriate. Investments that are not publicly traded areinitially recorded at cost, and subsequent adjustments to fair value are estimated in good faith by management. Factorsused in determining the fair value of direct investments include consideration of the company’s business model, currentand projected financial performance, liquidity, management team, and overall economic and market conditions. Factorsused in determining the fair value of indirect investments include evaluation of the investments owned by the private
68

equity funds, the general partner’s valuation techniques, and overall economic and market conditions. The fair valueestimates of the investments are based upon currently available information and may not necessarily represent amountsthat will ultimately be realized, which depend on future events and circumstances.
Interest and dividends on direct mezzanine debt and preferred stock investments are recorded in interest income. Allother income on principal investments, including fair value adjustments, realized gains and losses on the return ofcapital, and principal investment write-offs, is recognized in other noninterest income.
Securities Purchased Under Agreements to Resell and Securities Sold Under Agreements to Repurchase:Securities purchased under agreements to resell and securities sold under agreements to repurchase are generallyaccounted for as collateralized financing transactions and are recorded at the amounts at which the securities wereacquired or sold plus accrued interest. Securities, generally U.S. government and federal agency securities, pledged ascollateral under these financing arrangements cannot be sold or repledged by the secured party. The fair value ofcollateral either received from or provided to a third party is continually monitored, and additional collateral is obtainedor requested to be returned as appropriate.
Goodwill and Other Intangible Assets: Goodwill represents the excess of the cost of an acquisition over the fairvalue of the net assets acquired. Other intangible assets represent purchased assets that also lack physical substancebut can be separately distinguished from goodwill because of contractual or other legal rights or because the asset iscapable of being sold or exchanged, either on its own or in combination with a related contract, asset, or liability.Goodwill impairment testing is performed annually, or more frequently if events or circumstances indicate possibleimpairment. Goodwill is allocated to reporting units one level below business segments. Fair values of reporting unitsare determined using either market-based valuation multiples for comparable businesses if available, or discounted cashflow analyses based on internal financial forecasts. If the fair value of a reporting unit exceeds its net book value,goodwill is considered not to be impaired. If the net book value of a reporting unit exceeds its fair value, animpairment loss may be recognized. An impairment loss is measured as the excess of the carrying value of the goodwillof a reporting unit over its implied fair value. The implied fair value of goodwill represents the difference between thefair value of the reporting unit and the fair value of all of the assets and liabilities of that unit, including anyunrecognized intangible assets. Goodwill impairment losses are recorded in other noninterest expense. Note 11contains additional information regarding goodwill and the carrying values by major lines of business.
Intangible assets with finite lives include those associated with core deposits, credit cards, and other items. Intangibleassets are subject to impairment testing whenever events or changes in circumstances indicate that the carryingamount may not be recoverable. Core deposit intangibles are primarily amortized over a period not to exceed 10 yearsusing an accelerated amortization method. Credit card intangibles are amortized over their estimated useful lives on astraight-line basis, which range from one to seven years. Other intangibles, primarily customer contracts andnoncompete agreements, are amortized over the period benefited ranging from three to 11 years. Amortizationexpense for core deposits and other intangibles is recognized in noninterest expense. Note 11 includes a summary ofother intangible assets.
Depreciable Assets: Properties and equipment are stated at cost less accumulated depreciation and amortization.Maintenance and repairs are charged to expense as incurred, while improvements which extend an asset’s useful lifeare capitalized and depreciated over the estimated remaining life of the asset. Depreciation and amortization arecalculated using the straight-line method over the estimated useful life of the asset. Useful lives range from one to10 years for furniture, fixtures, and equipment; three to five years for software, hardware, and data handlingequipment; and 10 to 40 years for buildings and building improvements. Land improvements are amortized over aperiod of 15 years. Leasehold improvements are amortized over the shorter of the asset’s useful life or the remaininglease term, including renewal periods when reasonably assured pursuant to SFAS 13, Accounting for Leases. Forleasehold improvements acquired in a business combination, lease renewals reasonably assured at the date ofacquisition are included in the remaining lease term. For leasehold improvements placed in service after the inceptionof the lease, lease renewals reasonably assured at the date of purchase are included in the remaining lease term.
Long-lived depreciable assets are evaluated periodically for impairment when events or changes in circumstancesindicate the carrying amount may not be recoverable. Impairment exists when the expected undiscounted future cash
69

flows of a long-lived asset are less than its carrying value. In that event, the Corporation recognizes a loss for thedifference between the carrying amount and the estimated fair value of the asset based on a quoted market price, ifavailable, or a discounted cash flow analysis. Impairment losses are recorded in other noninterest expense.
Equipment leased to others is stated at cost less accumulated depreciation. Depreciation expense is recorded on astraight-line basis over the life of the lease considering the estimated residual value. On a periodic basis, leased assetsare reviewed for impairment. An impairment loss is recognized if the carrying amount of leased assets exceeds fairvalue and is not recoverable. The carrying amount of leased assets is not recoverable if it exceeds the sum of theundiscounted cash flows expected to result from the lease payments and the estimated residual value upon theeventual disposition of the equipment.
Asset Securitizations: National City uses the securitization of financial assets as a source of funding. In asecuritization, financial assets, including pools of credit card and automobile loans, are transferred into trusts or to SPEsin transactions which are effective under applicable banking rules and regulations to legally isolate the assets fromNational City Bank (the Bank), a subsidiary of the Corporation. Where the transferor is a depository institution, such asthe Bank, legal isolation is accomplished through compliance with specific rules and regulations of the relevantregulatory authorities. In addition, the Corporation purchased the guaranteed portion of Small Business Administration(SBA) loans from third-party lenders and then securitized these loans into SBA guaranteed pooled securities through theuse of a fiscal and transfer agent approved by the SBA. The certificates are then sold directly to institutional investors,achieving legal isolation.
SFAS 140 requires a true sale analysis of the treatment of the transfer under state law as if the Corporation was adebtor under the bankruptcy code. A true sale legal analysis includes several legally relevant factors, such as the natureand level of recourse to the transferor, and the nature of retained interests in the loans sold. The analytical conclusionas to a true sale is never absolute and unconditional, but contains qualifications based on the inherent equitablepowers of a bankruptcy court, as well as the unsettled state of the common law. Once the legal isolation test has beenmet under SFAS 140, other factors concerning the nature and extent of the transferor’s control over the transferredassets are taken into account in order to determine whether derecognition of assets is warranted, including whetherthe SPE has complied with rules concerning qualifying special-purpose entities.
Legal opinions regarding legal isolation have been obtained by the Bank for each of its credit card securitizations. Theseopinions stated in their conclusions that the Federal Deposit Insurance Corporation (FDIC) regulation, Treatment by theFederal Deposit Insurance Corporation as Conservator or Receiver of Financial Assets Transferred by an InsuredDepository Institution in Connection with a Securitization or Participation (Securitization Rule) would be applicable tothe transfer of such assets. The Securitization Rule provides reasonable assurance that neither the FDIC acting asconservator or receiver for the transferring bank subsidiary, nor any other creditor of the bank, may reclaim or recoverthe assets from the securitization trust or recharacterize the assets as property of the transferring bank subsidiary or ofthe conservatorship or receivership for the bank. The opinion further reasoned, even if the Securitization Rule did notapply, then pursuant to various FDIC pronouncements, the FDIC would uphold the effectiveness of the security interestgranted in the financial assets.
Legal opinions were also obtained for each automobile loan securitization, which were all structured as two-steptransfers. While noting each of these transactions fall within the meaning of a securitization under the SecuritizationRule, in accordance with accounting guidance, an analysis was also rendered under state law as if the transferring Bankwas a debtor under the bankruptcy code. The true sale opinion obtained for each of these transactions providesreasonable assurance that the purchased assets would not be characterized as the property of the transferring bank’sreceivership or conservatorship estate in the event of insolvency and also states the transferor would not be required tosubstantively consolidate the assets and liabilities of the purchaser SPE with those of the transferor upon such event.
The process of securitizing SBA loans into pools of SBA certificates is prescribed by the SBA and must be followed toobtain the SBA guarantee. This process meets the requirements for sale treatment under SFAS 140.
In a securitization, the trust issues beneficial interests in the form of senior and subordinated asset-backed securitiesbacked or collateralized by the assets sold to the trust. The senior classes of the asset-backed securities typically receive
70

investment grade credit ratings at the time of issuance. These ratings are generally achieved through the creation oflower-rated subordinated classes of asset-backed securities, as well as subordinated interests retained by an affiliate ofthe Corporation. In all cases, the Corporation or its affiliates may retain interests in the securitized assets, which maytake the form of seller certificates, subordinated tranches, cash reserve balances or interest-only strips representing thecash flows generated by the assets in excess of the contractual cash flows required to be paid to the investors.
An SBA approved fiscal and transfer agent associated with the SBA securitizations issues certificates once all thenecessary documents to support the transaction have been provided. The Corporation has retained beneficial interestsin the securitized assets in the form of interest-only strips. The SBA guarantees the credit risk with respect to theloans sold.
In accordance with SFAS 140, securitized loans are removed from the balance sheet and a net gain or loss is recognizedin income at the time of initial sale and each subsequent sale when the combined net sales proceeds and, if applicable,retained interests differ from the loans’ allocated carrying amount. Net gains or losses resulting from securitizations arerecorded in loan sale revenue within noninterest income.
Retained interests in the subordinated tranches and interest-only strips are recorded at their fair value and included inthe available-for-sale or the trading securities portfolio. Retained interests from the credit card and automobile loansecuritizations are classified as available-for-sale securities. Retained interests from the SBA securitizations are classifiedas trading securities and are included in other investments on the balance sheet. Subsequent adjustments to the fairvalue of retained interests classified as available for sale are recorded through accumulated other comprehensiveincome within stockholders’ equity, or in security losses in the income statement if the fair value has declined below thecarrying amount, and such decline has been determined to be other-than-temporary. Fair value adjustments to retainedinterests classified as trading securities are recorded in other noninterest income while other-than-temporaryimpairments are recorded within security (losses) gains, net.
The fair value of retained interests is estimated at the time of sale and at each subsequent reporting date by using acash flow valuation model which calculates the present value of the estimated cash flows of retained interests.Assumptions and estimates used in the cash flow model consist of credit loss rates, loan prepayment rates, loan poolcharacteristics such as loan interest rates and expected life of the loans, the cost of funds, servicing fees and costs, anddiscount rates commensurate with the risks involved. On a monthly basis, management reviews the historicalperformance of each retained interest and the assumptions used to project future cash flows. If past performance orfuture expectations dictate, assumptions are revised and the present value of future retained interest cash flows isrecalculated. Refer to Note 5 for further analysis of the assumptions used in the determination of fair value of retainedinterests. The value of these retained interests represent National City’s maximum loss exposure with respect tosecuritization vehicles. The investors in the asset-backed securities issued by the SPEs have no further recourse againstthe Corporation if cash flows generated by the securitized assets are inadequate to service the obligations of the SPEs.
For credit card securitizations, the Corporation’s continuing involvement in the securitized assets includes maintainingan undivided, pro rata interest in all credit card assets that are in the trust, referred to as seller’s interest. The seller’sinterest ranks equally with the investors’ interests in the trust. As the amount of the assets in the securitized poolfluctuates due to customer payments, purchases, cash advances, and credit losses, the carrying amount of the seller’sinterest will vary. However, the Corporation is required to maintain its seller’s interest at a minimum level of 5% of theinitial invested amount in each series to ensure sufficient assets are available for allocation to the investors’ interests.
Also with regard to credit card securitizations, the trust is not required to make principal payments to the investorsduring the revolving period, which generally approximates 48 months. Instead, the trust uses principal paymentsreceived on the accounts to purchase new credit card loans. Therefore, the principal dollar amount of the investor’sinterest in the assets within the trust remains unchanged. Once the revolving period ends, the trust will distributeprincipal payments to the investors according to the terms of the transaction. Distribution of principal to the investorsin the credit card trust may begin earlier if the average annualized yield on the loans securitized (generally equal to thesum of interest income, interchange and other fees, less principal credit losses during the period) for three consecutivemonths drops below a minimum yield (generally equal to the sum of the coupon rate payable to investors pluscontractual servicing fees), or certain other events occur.
71

Transaction costs associated with revolving loan securitizations are deferred at the time of sale and amortized over therevolving term of the securitization, while transaction costs associated with fixed-term securitizations are recognized asa component of the gain or loss at the time of sale.
Servicing Assets: The Corporation periodically sells or securitizes loans while retaining the obligation to perform theservicing of such loans. In addition, the Corporation may purchase or assume the right to service loans originated byothers. Whenever the Corporation undertakes an obligation to service a loan, management assesses whether aservicing asset or liability should be recognized. A servicing asset is recognized whenever the compensation for servicingis expected to exceed current market servicing prices. Likewise, a servicing liability would be recognized in the eventthat servicing fees to be received are not expected to adequately compensate the Corporation for its expected cost.Servicing assets related to residential real estate loans are separately presented on the balance sheet as mortgageservicing rights (MSRs). Servicing assets associated with the sale or securitization of commercial real estate and otherconsumer loans are presented within other assets on the balance sheet. The Corporation does not presently have anyservicing liabilities.
All separately recognized servicing assets and/or liabilities are initially recognized at fair value. For subsequentmeasurement of servicing rights, the Corporation has elected the fair value method for MSRs while all other servicingassets follow the amortization method. Under the fair value measurement method, MSRs are recorded at fair valueeach reporting period, and changes in fair value are reported in loan servicing revenue in the income statement. Underthe amortization method, other servicing assets are amortized in proportion to, and over the period of, estimatedservicing income and assessed for impairment based on fair value at each reporting period. Contractual servicing feesincluding ancillary income and late fees, as well as fair value adjustments, associated derivative gains and losses, andimpairment losses, if any, are reported in loan servicing revenue in the income statement.
The fair value of MSRs is estimated by using a cash flow valuation model which calculates the present value ofestimated future net servicing cash flows, taking into consideration actual and expected mortgage loan prepaymentrates, discount rates, servicing costs, and other economic factors, which are determined based on current marketconditions. Expected mortgage loan prepayment assumptions are derived from an internal proprietary model andconsider empirical data drawn from the historical performance of the Corporation’s managed portfolio. Prepaymentrates have a lesser impact on the value of servicing assets associated with commercial real estate loans as these loanshave lockout and prepayment penalties generally ranging from five to nine years.
Future interest rates are another significant factor in the valuation of MSRs. In 2007, the Corporation refined its MSRvaluation model to incorporate market implied forward interest rates to estimate the future direction of mortgage anddiscount rates. The forward rates utilized are derived from the current yield curve for U.S. dollar interest rate swaps andare consistent with pricing of capital markets instruments. In prior periods, the MSR valuation model assumed thatinterest rates remained constant over the life of the servicing asset cash flows.
Derivative Instruments: The Corporation enters into derivative transactions principally to protect against the risk ofadverse price or interest-rate movements on the value of certain assets and liabilities and on future cash flows. Inaddition, certain contracts and commitments, such as mortgage loan commitments, are defined as derivativesunder GAAP.
Under the requirements of SFAS 133, Accounting for Derivative Instruments and Hedging Activities, as amended, allderivative instruments are carried at fair value on the balance sheet. SFAS 133 provides special hedge accountingprovisions, which permit the change in the fair value of the hedged item related to the risk being hedged to berecognized in earnings in the same period and in the same income statement line as the change in the fair value of thederivative.
Derivative instruments designated in a hedge relationship to mitigate exposure to changes in the fair value of an asset,liability, or firm commitment attributable to a particular risk, such as interest-rate risk, are considered fair value hedgesunder SFAS 133. Derivative instruments designated in a hedge relationship to mitigate exposure to variability inexpected future cash flows, or other types of forecasted transactions, are considered cash flow hedges. The
72

Corporation formally documents all relationships between hedging instruments and hedged items, as well as its riskmanagement objective and strategy for undertaking each hedge transaction.
Fair value hedges are accounted for by recording the fair value of the derivative instrument, the fair value of thehedged risk of the hedged asset or liability, with corresponding offsets recorded in the income statement. The fairvalues of derivatives are recorded as freestanding assets or liabilities on the balance sheet, while fair value adjustmentsto the hedged assets or liabilities are included in the carrying value of the hedged items. Actual cash receipts orpayments and related amounts accrued during the period on derivatives included in a fair value hedge relationship arerecorded as adjustments to the income or expense recorded on the hedged asset or liability.
Cash flow hedges are accounted for by recording the fair value of the derivative instrument on the balance sheet aseither a freestanding asset or liability, with a corresponding offset recorded in accumulated other comprehensiveincome within stockholders’ equity, net of tax. Amounts are reclassified from accumulated other comprehensive incometo the income statement in the period or periods the hedged forecasted transaction affects earnings.
Under both the fair value and cash flow hedge methods, derivative gains and losses not effective in hedging thechange in fair value or expected cash flows of the hedged item are recognized immediately in the income statement.At the hedge’s inception and at least quarterly thereafter, a formal assessment is performed to determine whetherchanges in the fair values or cash flows of the derivative instruments have been highly effective in offsetting changes inthe fair values or cash flows of the hedged items and whether they are expected to be highly effective in the future. Ifit is determined a derivative instrument has not been or will not continue to be highly effective as a hedge, hedgeaccounting is discontinued. When this occurs, SFAS 133 basis adjustments recorded on hedged assets and liabilities areamortized over the remaining life of the hedged item beginning no later than when hedge accounting ceases.
Share-Based Payment: Compensation cost is recognized for stock options and restricted stock awards issued toemployees. Compensation cost is measured as the fair value of these awards on their date of grant. A Black-Scholesmodel is utilized to estimate the fair value of stock options, while the market price of the Corporation’s common stockat the date of grant is used to estimate the fair value of restricted stock awards. Compensation cost is recognized overthe required service period, generally defined as the vesting period for stock option awards and as the restriction periodfor restricted stock awards. For awards with graded vesting, compensation cost is recognized on a straight-line basisover the requisite service period for the entire award. When an award is granted to an employee who is retirementeligible, the compensation cost of these awards is recognized over the period up to the date the employee firstbecomes eligible to retire.
Advertising Costs: Advertising costs are generally expensed as incurred.
Income Taxes: The Corporation and its subsidiaries file a consolidated federal income tax return. The provision forincome taxes is based upon income in the consolidated financial statements, rather than amounts reported on theincome tax return. Deferred tax assets and liabilities are recognized for the future tax consequences attributable todifferences between the financial statement carrying amounts of existing assets and liabilities and their respective taxbases. Deferred tax assets and liabilities are measured using enacted tax rates expected to apply to taxable income inthe years in which those temporary differences are expected to be recovered or settled. The effect on deferred taxassets and liabilities of a change in tax rates is recognized as income or expense in the period that includes theenactment date.
Positions taken in the Corporation’s tax returns may be subject to challenge by the taxing authorities upon examination.Uncertain tax positions are initially recognized in the financial statements when it is more likely than not the positionwill be sustained upon examination by the tax authorities. Such tax positions are both initially and subsequentlymeasured as the largest amount of tax benefit that is greater than 50% likely of being realized upon settlement withthe tax authority, assuming full knowledge of the position and all relevant facts. The Corporation provides for interestand, in some cases, penalties on tax positions that may be challenged by the taxing authorities. Interest expense isrecognized beginning in the first period that such interest would begin accruing. Penalties are recognized in the periodthat the Corporation claims the position in the tax return. Interest and penalties on income tax uncertainties areclassified within income tax expense in the income statement.
73

Stock Repurchases: The Corporation periodically repurchases shares of its outstanding common stock through openmarket purchases or other methods. Repurchased shares are recorded as treasury shares on the trade date using thepar value method, and the cash paid is allocated to common stock, capital surplus, and retained earnings. Treasuryshares are available for reissuance upon exercise of employee stock awards.
2. Recent Accounting Pronouncements
Accounting for Certain Hybrid Financial Instruments: In February 2006, the Financial Accounting Standards Board(FASB) issued SFAS 155, Accounting for Certain Hybrid Financial Instruments, which amends SFAS 133 and SFAS 140.SFAS 155 requires entities to evaluate and identify whether interests in securitized financial assets are freestandingderivatives or hybrid financial instruments that contain an embedded derivative that may require bifurcation. SFAS 155also permits fair value measurement for any hybrid financial instrument that contains an embedded derivative thatotherwise would require bifurcation. This statement was effective for all financial instruments acquired or issued by theCorporation on or after January 1, 2007. The adoption of this statement did not have a material impact on financialcondition, results of operations, or liquidity.
Accounting for Uncertainty in Income Taxes: In June 2006, the FASB issued Interpretation No. 48 (FIN 48),Accounting for Uncertainty in Income Taxes, an interpretation of SFAS 109, Accounting for Income Taxes. FIN 48prescribes a comprehensive model for how companies should recognize, measure, present, and disclose in theirfinancial statements uncertain tax positions taken or expected to be taken on a tax return. Under FIN 48, tax positionsshall initially be recognized in the financial statements when it is more likely than not the position will be sustainedupon examination by the tax authorities. Such tax positions shall initially and subsequently be measured as the largestamount of tax benefit that is greater than 50% likely of being realized upon settlement with the tax authorityassuming full knowledge of the position and all relevant facts. FIN 48 also revises disclosure requirements to include anannual tabular rollforward of uncertain tax positions. The provisions of this interpretation were adopted by theCorporation on January 1, 2007. Upon adoption, the Corporation increased its reserves for uncertain tax positions by$31 million which was recognized by way of a cumulative effect adjustment to retained earnings ($24 million net oftax).
Accounting for a Change or Projected Change in the Timing of Cash Flows Relating to Income TaxesGenerated by a Leveraged Lease Transaction: In July 2006, the FASB issued FASB Staff Position (FSP) 13-2,Accounting for a Change or Projected Change in the Timing of Cash Flows Relating to Income Taxes Generated by aLeveraged Lease Transaction. This FSP amends SFAS 13, Accounting for Leases, to require a lessor in a leveraged leasetransaction to recalculate the lease for the effects of a change or projected change in the timing of cash flows relatingto income taxes that are generated by the transaction. The Corporation adopted FSP 13-2 on January 1, 2007, and theadoption did not have a material impact on financial condition, results of operations, or liquidity.
Employers’ Accounting for Defined Benefit Pension and Other Postretirement Plans: In September 2006, theFASB issued SFAS 158, Employers’ Accounting for Defined Benefit Pension and Other Postretirement Plans. OnDecember 31, 2006, the Corporation adopted the recognition and disclosure provisions of this statement whichresulted in the recording of the funded status of its pension and postretirement plans as either assets or liabilities andthe recording of unrecognized actuarial gains/losses, prior service costs, and transition obligations totaling $71 millionas a separate component of accumulated other comprehensive income, net of tax. SFAS 158 also required theCorporation to change the measurement date of its defined benefit pension and other postretirement obligations fromOctober 31 to December 31. The incremental pension benefit associated with the measurement date change wasrecognized on January 1, 2008 as an increase to retained earnings of $1 million after-tax.
Fair Value Measurements: In September 2006, the FASB issued SFAS 157, Fair Value Measurements, which uponadoption will replace various definitions of fair value in existing accounting literature with a single definition, willestablish a framework for measuring fair value, and will require additional disclosures about fair value measurements.SFAS 157 clarifies that fair value is the price that would be received to sell an asset or the price paid to transfer aliability in the principal or most advantageous market available to the entity and emphasizes that fair value is a market-based measurement and should be based on the assumptions market participants would use. The statement alsocreates a three-level hierarchy under which individual fair value estimates are to be ranked based on the relative
74

reliability of the inputs used in the valuation. This hierarchy is the basis for the disclosure requirements, with fair valueestimates based on the least reliable inputs requiring more extensive disclosures about the valuation method used andthe gains and losses associated with those estimates. SFAS 157 is required to be applied whenever another financialaccounting standard requires or permits an asset or liability to be measured at fair value. The statement does notexpand the use of fair value to any new circumstances. The Corporation adopted SFAS 157 on January 1, 2008, andthe adoption did not have a material impact on financial condition, results of operations, or liquidity.
Fair Value Option: In February 2007, the FASB issued SFAS No. 159, The Fair Value Option for Financial Assets andLiabilities. The statement allows an entity to elect to measure certain financial assets and liabilities at fair value withchanges in fair value recognized in the income statement each period. The statement also requires additionaldisclosures to identify the effects of an entity’s fair value election on its earnings. On January 1, 2008, the Corporationelected the fair value option for residential and commercial real estate loans held for sale. Previously, these loans werecarried at the lower-of-cost or fair value after consideration of any SFAS 133 valuation adjustments. Interest rate riskrelated to these loans was hedged with derivative instruments and application of the fair value option allows for boththe loans and the derivatives to be carried at fair value without the burden of applying for hedge accounting underSFAS 133. The election was applied to existing residential and commercial real estate loans held for sale as of January 1,2008 and is also being applied prospectively to the same types of loans originated or purchased as held for sale. As ofthe adoption date, the carrying value of the existing loans held for sale was adjusted to fair value through acumulative-effect adjustment to beginning retained earnings. This adjustment represented an increase in value of$12 million pretax ($8 million net of tax). Prospectively, accounting for residential and commercial real estate loans tobe sold at fair value will accelerate the recognition of some gains and losses previously recognized at the time of salebut otherwise is not expected to have a material impact on financial condition, results of operations, or liquidity.
Amendment of FASB Interpretation No. 39: In April 2007, the FASB issued FSP 39-1, Amendment of FASBInterpretation No. 39, Offsetting of Amounts Related to Certain Contracts. FSP 39-1 permits entities to offset fair valueamounts recognized for multiple derivative instruments executed with the same counterparty under a master nettingagreement. FSP 39-1 clarifies that the fair value amounts recognized for the right to reclaim cash collateral, or theobligation to return cash collateral, arising from the same master netting arrangement, should also be offset againstthe fair value of the related derivative instruments. The Corporation has historically presented all of its derivativepositions and related collateral on a gross basis.
Effective January 1, 2008, the Corporation adopted a net presentation for derivative positions and related collateralentered into under master netting agreements pursuant to the guidance in FIN 39 and FSP 39-1. The adoption of thisguidance resulted in balance sheet reclassifications of certain cash collateral-based short-term investments against therelated derivative liabilities and certain deposit liability balances against the related fair values of derivative assets. Theeffects of these reclassifications will fluctuate based on the fair values of the derivative contracts but overall are notexpected to have a material impact on either total assets or total liabilities. The adoption of this presentation changedid not have an impact on stockholders’ equity, results of operations, or liquidity.
Accounting for Income Tax Benefits of Dividends on Share-Based Payment Awards: In June 2007, the FASBratified the consensus reached in EITF 06-11, Accounting for Income Tax Benefits of Dividends on Share-Based PaymentAwards. EITF 06-11 applies to entities that have share-based payment arrangements that entitle employees to receivedividends or dividend equivalents on equity-classified nonvested shares when those dividends or dividend equivalentsare charged to retained earnings and result in an income tax deduction. Entities that have share-based paymentarrangements that fall within the scope of EITF 06-11 will be required to increase capital surplus for any realizedincome tax benefit associated with dividends or dividend equivalents paid to employees for equity classified nonvestedequity awards. Any increase recorded to capital surplus is required to be included in an entity’s pool of excess taxbenefits that are available to absorb potential future tax deficiencies on share-based payment awards. The Corporationadopted EITF 06-11 on January 1, 2008 for dividends declared on share-based payment awards subsequent to thisdate. The impact of adoption is not expected to have a material impact on financial condition, results of operations, orliquidity.
Accounting for Written Loan Commitments Accounted for at Fair Value: In November 2007, the Securities andExchange Commission issued Staff Accounting Bulletin (SAB) No. 109, which addresses the valuation of written loan
75

commitments accounted for at fair value through earnings. The guidance in SAB 109 expresses the staff’s view that themeasurement of fair value for a written loan commitment accounted for at fair value through earnings shouldincorporate the expected net future cash flows related to the associated servicing of the loan. Previously under SAB 105,Application of Accounting Principles to Loan Commitments, this component of value was not incorporated into the fairvalue of the loan commitment. The Corporation adopted the provisions of SAB 109 for written loan commitmentsentered into or modified after December 31, 2007 related to residential and commercial real estate loans held for salethat are accounted for as derivatives under SFAS 133. The Corporation does not account for any other written loancommitments at fair value through earnings. The impact of SAB 109 will be to accelerate the recognition of theestimated fair value of the servicing inherent in the loan to the commitment date.
Business Combinations: In December 2007, the FASB issued SFAS 141(R), Business Combinations. SFAS 141(R) willsignificantly change how entities apply the acquisition method to business combinations. The most significant changesaffecting how the Corporation will account for business combinations under this Statement include: the acquisitiondate will be date the acquirer obtains control; all (and only) identifiable assets acquired, liabilities assumed, andnoncontrolling interests in the acquiree will be stated at fair value on the acquisition date; assets or liabilities arisingfrom noncontractual contingencies will be measured at their acquisition date fair value only if it is more likely than notthat they meet the definition of an asset or liability on the acquisition date; adjustments subsequently made to theprovisional amounts recorded on the acquisition date will be made retroactively during a measurement period not toexceed one year; acquisition-related restructuring costs that do not meet the criteria in SFAS 146, Accounting for CostsAssociated with Exit or Disposal Activities, will be expensed as incurred; transaction costs will be expensed as incurred;reversals of deferred income tax valuation allowances and income tax contingencies will be recognized in earningssubsequent to the measurement period; and the allowance for loan losses of an acquiree will not be permitted to berecognized by the acquirer. Additionally, SFAS 141(R) will require new and modified disclosures surrounding subsequentchanges to acquisition-related contingencies, contingent consideration, noncontrolling interests, acquisition-relatedtransaction costs, fair values and cash flows not expected to be collected for acquired loans, and an enhancedgoodwill rollforward.
The Corporation will be required to prospectively apply SFAS 141(R) to all business combinations completed on or afterJanuary 1, 2009. Early adoption is not permitted. For business combinations in which the acquisition date was beforethe effective date, the provisions of SFAS 141(R) will apply to the subsequent accounting for deferred income taxvaluation allowances and income tax contingencies and will require any changes in those amounts to be recorded inearnings. At December 31, 2007, the Corporation’s acquired deferred income tax valuation allowances and income taxcontingencies totaled $2 million and $32 million, respectively. Management is currently evaluating the effects thatSFAS 141(R) will have on the financial condition, results of operations, liquidity, and the disclosures that will bepresented in the consolidated financial statements.
Accounting for Noncontrolling Interests: In December 2007, the FASB issued SFAS 160, Noncontrolling interests inConsolidated Financial Statements, an Amendment of ARB 51. SFAS 160 establishes new accounting and reportingstandards for noncontrolling interests in a subsidiary and for the deconsolidation of a subsidiary. SFAS 160 will requireentities to classify noncontrolling interests as a component of stockholders’ equity and will require subsequent changesin ownership interests in a subsidiary to be accounted for as an equity transaction. Additionally, SFAS 160 will requireentities to recognize a gain or loss upon the loss of control of a subsidiary and to remeasure any ownership interestretained at fair value on that date. This statement also requires expanded disclosures that clearly identify anddistinguish between the interests of the parent and the interests of the noncontrolling owners. SFAS 160 is effective ona prospective basis for fiscal years, and interim periods within those fiscal years, beginning on or after December 15,2008, except for the presentation and disclosure requirements, which are required to be applied retrospectively. Earlyadoption is not permitted.
At December 31, 2007, noncontrolling interests in subsidiaries totaled approximately $135 million and were included inaccrued expenses and other liabilities on the consolidated balance sheet. Management is currently evaluating theeffects, if any, that SFAS 160 will have upon adoption as this standard will affect the presentation and disclosure ofnoncontrolling interests in the consolidated financial statements.
76

3. Acquisitions and Divestitures
Acquisitions: On May 1, 2006, in a cash transaction, the Corporation completed its acquisition of Forbes First FinancialCorporation (Pioneer), a privately held bank holding company operating eight branches in the St. Louis, Missouri,metropolitan area through its subsidiary Pioneer Bank. As of the acquisition date, the fair value of Pioneer’s loans anddeposits were $372 million and $430 million, respectively. Goodwill and intangibles resulting from this acquisitiontotaled $60 million.
On December 1, 2006, the Corporation completed its acquisition of Harbor Florida Bancshares, Inc. (Harbor), a bankingcompany operating 42 branches along the central east coast of Florida through its subsidiary Harbor Federal SavingsBank. Under the terms of the agreement, each share of Harbor common stock was exchanged for 1.2206 shares ofNational City common stock. Approximately 29 million shares of National City common stock were issued inconjunction with this transaction. The common shares issued were valued at $36.68 per share, representing theaverage of closing market prices for two days prior and subsequent to the date the exchange ratio was finalized. Thetotal cost of the transaction was $1.1 billion, and included $14 million for the fair value of stock options exchanged.
On January 5, 2007, the Corporation completed its acquisition of Fidelity Bankshares, Inc. (Fidelity), a banking companyoperating 52 branches along Florida’s southeast coast through its subsidiary Fidelity Federal Bank & Trust. Under theterms of the agreement, Fidelity shareholders elected to receive either $39.50 in cash or 1.0977 shares of National Citycommon stock for each share of Fidelity stock outstanding. Shareholder elections were subject to an allocation processthat resulted in 50% of Fidelity’s outstanding shares being exchanged for cash and 50% exchanged for National Citycommon stock, resulting in the issuance of approximately 14 million shares of National City common stock and a cashpayment of $506 million. The common shares were valued at $36.16 per share, representing the average of closingmarket prices for two days prior and subsequent to the date the merger was announced. The total cost of thetransaction was $1.0 billion, including $20 million related to stock options settled in cash.
On September 1, 2007, the Corporation completed its acquisition of MAF Bancorp, Inc. (MAF), a banking companyoperating 82 branches throughout Chicago and Milwaukee and surrounding areas. Under the terms of the agreement,each share of MAF common stock was exchanged for 1.9939 shares of National City common stock. Approximately67 million shares of National City common stock were issued in conjunction with this transaction. The common sharesissued were valued at $27.16 per share, representing the average of closing market prices for two days prior andsubsequent to the date the exchange ratio was finalized. The total cost of the transaction was $1.8 billion, andincluded $35 million for the fair value of stock options exchanged.
Assets and liabilities of acquired entities are recorded at estimated fair values as of respective acquisition dates, and theresults of acquired entity operations are included in income from those dates. The fair values of acquired assets andliabilities, including identifiable intangible assets, are finalized as quickly as possible following an acquisition. Thepurchase price allocations for Harbor and Fidelity are complete. The MAF purchase price allocation is substantiallycomplete; however, its valuations may be subject to revision as additional information becomes available. Purchaseaccounting adjustments determinable within 12 months of acquisition date result in adjustments to goodwill.
77

The following table shows the excess purchase price over carrying value of net assets acquired, purchase priceallocation and resulting goodwill recorded to date for recent acquisitions.
(In Thousands) Harbor Fidelity MAFPurchase price $1,080,145 $1,034,828 $ 1,844,522Carrying value of net assets acquired (344,162) (269,008) (698,718)
Excess of purchase price over carrying value of net assets acquired 735,983 765,820 1,145,804Purchase accounting adjustments
Securities 9,699 (531) 587Portfolio loans and loans held for sale (29,852) (52,929) (10,684)Premises and equipment (26,351) (38,384) (379)Mortgage servicing rights (3,253) (3,749) (16,802)Other assets (9,039) (440) 19,991Deposits (1,244) (1,416) (5,073)Borrowings (769) 2,854 (2,569)Severance and exit costs 11,236 31,123 39,914Other liabilities 24,169 26,414 9,650Deferred taxes 28,439 72,093 31,454
Subtotal 739,018 800,855 1,211,893Core deposit intangibles (36,935) (84,972) (153,878)Other identifiable intangible assets (9,108) (2,060) (618)Goodwill $ 692,975 $ 713,823 $ 1,057,397
The following table summarizes the estimated fair value of net assets acquired related to recent acquisitions.
(In Thousands) Harbor Fidelity MAFAssets
Cash and cash equivalents $ 242,124 $ 142,483 $ 141,860Federal funds sold — — 107,709Securities 389,869 628,068 1,821,230Loans, net of allowance for loan losses 2,638,892 3,569,353 7,074,697Premises and other equipment 87,885 132,811 165,764Goodwill and other intangibles 739,018 800,855 1,211,893Mortgage servicing rights 4,741 7,074 35,908Other assets 63,206 95,096 339,999
Total Assets 4,165,735 5,375,740 10,899,060Liabilities
Deposits 2,389,861 3,375,712 7,351,337Borrowings 614,680 763,931 1,471,026Other liabilities 81,049 201,269 232,175
Total Liabilities 3,085,590 4,340,912 9,054,538Fair value of net assets acquired $1,080,145 $1,034,828 $ 1,844,522
78

The following unaudited pro forma consolidated financial information presents the combined results of operations ofthe Corporation as if the Pioneer, Harbor, Fidelity and MAF acquisitions had occurred as of the beginning of 2007 and2006, respectively.
(Dollars in Thousands, Except Per Share Amounts) 2007 2006For the Calendar Year
Net interest income $ 4,544,455 $ 5,037,670Provision for loan losses 1,332,701 495,109
Net interest income after provision for loan losses 3,211,754 4,542,561Noninterest income 2,665,583 4,144,238Noninterest expense 5,476,864 5,231,068Income before income tax expense 400,473 3,455,731Income tax expense 68,351 1,140,938Net Income $ 332,122 $ 2,314,793
Net Income Per Common ShareBasic $ .51 $ 3.23Diluted .50 3.18
Average Common Shares OutstandingBasic 651,006,096 715,763,157Diluted 658,625,367 727,292,653
The pro forma results include amortization of fair value adjustments on loans, deposits, and debt, amortization ofnewly created intangibles and post-merger acquisition related charges. The pro forma number of average commonshares outstanding includes adjustments for shares issued for the acquisitions and the impact of additional dilutivesecurities but does not assume any incremental share repurchases. The pro forma results presented do not reflect costsavings or revenue enhancements anticipated from the acquisitions and are not necessarily indicative of what actuallywould have occurred if the acquisitions had been completed as of the beginning of the periods presented, nor are theynecessarily indicative of future consolidated results.
Divestitures: In 2007, the Corporation sold three branches located in western Illinois. The Corporation recognized again on this transaction of approximately $16 million. On December 30, 2006, the Corporation completed the sale ofits First Franklin nonprime mortgage origination network and related servicing platform. The Corporation recognized apretax gain of $984 million, or $622 million after tax, on this transaction. The purchase price and the resulting gain aresubject to adjustment based on the closing date values of assets and liabilities sold, as well as other negotiated matters.In 2005, the Corporation sold Madison Bank & Trust, an Indiana state chartered bank, including six branches. TheCorporation recognized a gain on this transaction of approximately $16 million.
4. Restructuring Charges
Restructuring programs consist of acquisition integration related activities as well as other strategic initiatives. Duringthe years ended December 31, 2007 and 2006, the Corporation recorded severance and other employee-relatedexpense of $106 million and $33 million, respectively. The severance charges in 2007 were primarily related to staffingreductions in the mortgage business and in corporate support units. The severance charges in 2006 were primarilyrelated to the divestiture of First Franklin and other business activities. Severance and other employee-related costsincurred in 2007 and 2006 included $8 million and $6 million, respectively, of retention benefits for employeesassociated with acquired or divested units.
Acquisition integration plans were formulated prior to the completion of each acquisition. Costs incurred foracquisition-related employee terminations consist of severance, retention, and outplacement benefits. Severance andoutplacement benefit costs were recognized in the allocation of the purchase price to acquired assets and liabilities.Retention benefits were recorded to salaries expense over the required service period. Costs relating to the exit ofcertain acquired businesses, facility leases, and other contract termination costs were also recognized in the allocationof the purchase price to acquired assets and liabilities. The activity shown in the table below includes severance andrestructuring costs associated with the MAF Bancorp acquisition which was completed on September 1, 2007.
79

Payments will continue to be made for acquisition-related integration costs through December 2010 for severancebenefits and through January 2013 for lease obligations related to vacated facilities.
Severance and other employee-related costs, associated with other strategic initiatives and incurred in the normalcourse of business, are recorded in salaries, benefits and other personnel costs in the income statement. Thesepayments are scheduled to occur through April 2009. Other restructuring costs, which consist primarily of consultingand lease exit costs unrelated to acquisitions, are recorded in third-party services and other noninterest expense,respectively, and are scheduled to occur through December 2010.
Activity in the severance and restructuring liability for the years ended December 31, 2007 and 2006 is presented in thefollowing table. Historically, the majority of severance and other termination expenses have been recorded asunallocated corporate charges within the Parent and Other segment. However, in 2007, severance and other employee-related costs of $36 million, directly associated with staffing reductions in our mortgage operations, were recordedwithin the Mortgage Banking segment.
(In Thousands) Acquisitions Other Total
For the Calendar YearDecember 31, 2007
Beginning balance $ 40,494 $ 32,110 $ 72,604Severance and other employee related costs:
Charged to expense 7,666 98,277 105,943Recognized in purchase price allocation 56,498 — 56,498Payments (51,147) (52,692) (103,839)
Exit costs, contract terminations and other:Charged to expense — 11,017 11,017Recognized in purchase price allocation 12,196 — 12,196Payments (13,567) (7,771) (21,338)
Ending balance $ 52,140 $ 80,941 $ 133,081
(In Thousands) Acquisitions Other Total
For the Calendar YearDecember 31, 2006
Beginning balance $35,455 $ 52,398 $ 87,853Severance and other employee related costs:
Charged to expense 426 33,056 33,482Recognized in purchase price allocation 11,967 — 11,967Payments (6,097) (51,097) (57,194)
Exit costs, contract terminations and other:Charged to expense — 3,710 3,710Recognized in purchase price allocation 4,778 — 4,778Payments (6,035) (5,957) (11,992)
Ending balance $40,494 $ 32,110 $ 72,604
5. Securitization Activity
The Corporation has securitized pools of credit card, automobile, and Small Business Administration (SBA) loans. Recentsecuritization activities are described below.
Credit Card: In 2007, the Corporation securitized a $425 million pool of credit card receivables (Series 2007-1)following the maturity of its Series 2002-1 securitization. A pretax gain of approximately $2 million was recognized onthis transaction within loan sale revenue. Retained interests of $31 million were recognized at the date of sale.Transaction costs were $2 million. In 2006, the Corporation securitized a $425 million pool of credit card receivables(Series 2006-1) following the maturity of its Series 2001-1 securitization. A pretax gain of $2 million was recognized onthis transaction within loan sale revenue. Retained interests in these loans of $28 million were recognized at the date
80

of sale. Transaction costs were $1 million. In 2005, the Corporation securitized a $600 million pool of credit cardreceivables (Series 2005-1) following the maturity of its Series 2000-1 securitization. A pretax gain of $1 million wasrecorded on this transaction within loan sale revenue. Retained interests in these loans of $37 million were recognizedat the date of sale. Transaction costs were $3 million.
Retained interests associated with the above transactions included a seller’s interest in the loans, accrued interest, andan interest-only strip. The initial carrying values of these retained interests were determined by allocating the carryingvalue among the assets sold and retained based on their relative fair values at their respective dates of sale. The fairvalue of the interest-only strips were estimated by discounting the projected future cash flows of this securities. TheCorporation retained the right to service these loans. Servicing fees to be received approximated the current marketrate for servicing fees; therefore, no servicing asset or liability was recognized.
Transaction costs related to each of the above transactions were capitalized and are amortized over the revolvingperiod of each securitization of four years.
Automobile: In 2006, the Corporation exercised an early clean-up call on the outstanding notes of the Series 2002-Aautomobile securitization. Accordingly, the Corporation redeemed $48 million of loans from the securitization trust at aprice equal to unpaid principal plus accrued interest. These loans were recorded at fair value which approximated thepurchase price.
In 2005, the Corporation securitized $2.2 billion of fixed-rate, closed-end indirect automobile loans (Series 2005-A).A pretax loss of $29 million was recorded on this transaction within loan sale revenue. Retained interests in thesecuritized loans recognized upon sale consisting of a subordinated interest in the securitized loans and an interest-onlystrip. Retained interests were valued at the date of sale by allocating the previous carrying amount between the assetssold and the retained interests based on their relative fair values at the date of sale. The initial carrying value of thesubordinated interest and interest-only security of $78 million was estimated at the date of sale by discountingprojected future cash flows. The Corporation also retained the right to service these loans, and a servicing asset of$20 million was recognized at the date of sale. Transaction costs associated with this fixed-term securitization wereincluded as a component of the loss on sale.
In 2008, the Corporation will have the option to exercise an early clean-up call on its Series 2004-A securitization ofautomobile loans.
SBA: The Corporation did not securitize any pools of SBA loans in 2007. During 2006 and 2005, the Corporationsecuritized pools of SBA loans totaling $205 million and $46 million, respectively. Retained interests in the form ofinterest-only strips were recognized with an initial carrying value of approximately $5 million and $3 million in 2006and 2005, respectively. The SBA loans securitized were sold servicing released and all transaction costs were expensedin conjunction with these sales.
Home Equity: As of December 31, 2007 and 2006, the Corporation had no securitized home equity loans. TheCorporation obtained securitized home equity loans from a 2004 acquisition and exercised its option to call thesesecuritizations in 2006 and 2005. Accordingly, the cash flows received from securitization trusts shown in the followingtables include some activity for securitized home equity loans in 2006 and 2005.
At the inception of each securitization, the assumptions used to value retained interests were as follows:
Weighted-Average
Life(in months)
VariableAnnual
Coupon RateTo Investors
MonthlyPrincipal
RepaymentRate
ExpectedAnnualCreditLosses
AnnualDiscount
Rate YieldCredit Card Loans:
Interest-only strip (Series 2005-1) 3.2 3.75% 18.21% 5.35% 15.00% 12.00%Interest-only strip (Series 2006-1) 3.1 4.81 19.01 4.77 15.00 13.79Interest-only strip (Series 2007-1) 3.1 5.39 19.19 4.04 15.00 13.13
81

Weighted-Average
Life(in months)
MonthlyPrepayment
Speed(% ABS)
ExpectedCumulative
Credit Losses
AnnualDiscount
Rate
Weighted-AverageCoupon
Automobile Loans:Interest-only strip (Series 2004-A) 21.8 1.50% 1.75% 12.00% 6.79%Servicing asset (Series 2004-A) 21.8 1.50 1.75 11.00 6.79Interest-only strip (Series 2005-A) 16.6 1.50 2.18 12.00 7.06Servicing asset (Series 2005-A) 12.5 1.50 2.18 10.00 7.06
A summary of the components of managed loans, representing both owned and securitized loans, along withquantitative information about delinquencies and net credit losses follows:
(In Millions)PrincipalBalance
Loans PastDue 30Days orMore
AverageBalances
Net CreditLosses
As of December 31, 2007 For the Calendar Year
Type of loan:Credit card $3,301.9 $135.3 $2,822.1 $120.5Automobile 766.4 25.5 1,151.8 11.0SBA 162.9 11.6 203.0 —
Total loans managed or securitized 4,231.2 172.4 4,176.9 131.5Less loans securitized:
Credit card 1,450.0 54.8 1,359.2 55.1Automobile 688.8 20.3 1,028.3 12.0SBA 162.9 11.6 203.0 —
Less loans held for securitization:Credit card — — 90.8 —Loans held in portfolio $1,929.5 $ 85.7 $1,495.6 $ 64.4
(In Millions)PrincipalBalance
Loans PastDue 30Days orMore
AverageBalances
Net CreditLosses
As of December 31, 2006 For the Calendar Year
Type of loan:Credit card $2,635.2 $110.4 $2,400.5 $ 95.1Automobile 1,624.4 37.5 2,260.6 17.3SBA 234.4 67.9 96.7 —
Total loans managed or securitized 4,494.0 215.8 4,757.8 112.4Less loans securitized:
Credit card 1,024.7 45.4 1,325.4 49.2Automobile 1,439.5 26.1 1,985.8 15.7SBA 234.4 67.9 96.7 —
Less loans held for securitization:Credit card 425.0 — 124.0 —Loans held in portfolio $1,370.4 $ 76.4 $1,225.9 $ 47.5
82

Certain cash flows received from the securitization trusts follow:
(In Millions)CreditCard Automobile SBA
CreditCard Automobile
HomeEquity SBA
2007 2006For the Calendar Year
Proceeds from new securitizations $ 425.0 $ — $ — $ 425.0 $ — $— $223.2Proceeds from collections reinvested
in previous securitizations 3,027.7 — — 2,752.2 — — —Servicing fees received 27.3 10.5 — 26.9 20.1 — —Other cash flows received on
interests that continue to be held 84.8 5.0 2.5 92.3 29.5 — 1.4Proceeds from sales of previously
charged-off accounts 3.8 — — 4.7 — — —Purchases of delinquent or
foreclosed assets — — — — — .1 —
(In Millions)CreditCard Automobile
HomeEquity SBA
2005For the Calendar Year
Proceeds from new securitizations $ 600.0 $2,103.9 $ — $44.7Proceeds from collections reinvested in previous securitizations 2,789.3 — 2.7 —Servicing fees received 28.1 8.7 .3 —Other cash flows received on interests that continue to be held 70.8 15.7 .9 .7Proceeds from sales of previously charged-off accounts 1.0 — — —Purchases of delinquent or foreclosed assets — — 1.2 —
The Corporation holds certain interests in securitized credit card and automobile loans consisting of interest-only stripsand servicing assets. The table below presents the weighted-average assumptions used to measure the fair values ofthese retained interests as of December 31, 2007. The sensitivity of these fair values to immediate 10% and 20%adverse changes in key assumptions is also shown. These sensitivities are hypothetical. Changes in fair value based on a10% variation in assumptions generally cannot be extrapolated because the relationship of the change in theassumption to the change in fair value may not be linear. Also, the effect of a variation in a particular assumption onthe fair value of the retained interests is calculated without changing any other assumption; in reality, changes in onefactor may result in changes in another (for example, increases in market interest rates may result in lower prepaymentsand increased credit losses), which might magnify or counteract the sensitivities.
(Dollars in Millions)Fair
Value
Weighted-Average
Life(in months)
VariableAnnual
Coupon Rate toInvestors
MonthlyPrincipal
RepaymentRate
ExpectedAnnualCreditLosses
AnnualDiscount
Rate YieldCredit Card LoansInterest-only strips $5.8 3.2 4.92% 18.41% 4.29% 15.00% 12.84%
Decline in fair value of10% adverse change $1.8 $0.4 $1.7 $— $4.8
Decline in fair value of20% adverse change 3.7 0.7 3.1 — 5.8
83

(Dollars in Millions)Fair
Value
Weighted-Average Life(in months)
MonthlyPrepayment
Speed(% ABS)(a)
ExpectedCumulative
CreditLosses
AnnualDiscount
Rate
Weighted-AverageCoupon
Automobile LoansInterest-only strip $13.5 3.0 1.26% 1.65% 12.00% 7.03%
Decline in fair value of 10% adversechange $— $2.4 $0.2 $2.9
Decline in fair value of 20% adversechange — 5.2 0.3 5.5
Servicing asset(b) $ 3.6 5.9 1.26% 1.65% 10.12% 7.03%Decline in fair value of 10% adverse
change $0.2 $— $— $—Decline in fair value of 20% adverse
change 0.5 — — —
(a) Absolute prepayment speed.(b) Carrying value of servicing asset at December 31, 2007 was $3 million.
6. Leases
National City leases commercial equipment and automobiles to customers. The leases are classified as either leasefinancings or operating leases based on the terms of the lease arrangement. When a lease is classified as a leasefinancing, the future lease payments, net of unearned income and the estimated residual value of the leased propertyat the end of the lease term, are recorded as an asset within the loan portfolio. The amortization of the unearnedincome is recorded as interest income. When a lease is classified as an operating lease, the cost of the leased property,net of depreciation, is recorded as equipment leased to others on the Consolidated Balance Sheets. Rental income isrecorded in noninterest income while the depreciation on the leased property is recorded in noninterest expense. At theexpiration of a lease, the leased property is either sold or a new lease agreement is initiated.
Lease Financings: Lease financings, included in portfolio loans on the Consolidated Balance Sheet, consist of directfinancing and leveraged leases of commercial and other equipment, primarily computers and office equipment,manufacturing and mining equipment, commercial trucks and trailers, airplanes, medical, construction, data processing,along with retail automobile lease financings. Commercial equipment lease financings are included in commercialleases, while automobile lease financings are included in other consumer loans. The Corporation no longer originatesautomobile leases; accordingly, this portfolio will runoff over time as the leases expire and the automobiles are sold.
A summary of lease financings by type at December 31:
(In Thousands) 2007 2006Commercial
Direct financings $4,279,751 $3,868,271Leveraged leases 157,411 214,669
Total commercial lease financings 4,437,162 4,082,940Consumer
Retail automobile lease financings 142,342 299,704Total net investment in lease financings $4,579,504 $4,382,644
84

The components of the net investment in lease financings by type at December 31:
(In Thousands) 2007 2006Commercial
Lease payments receivable $4,711,570 $4,260,255Estimated residual value of leased assets 392,794 408,809Gross investment in commercial lease financings 5,104,364 4,669,064Unearned income (667,202) (586,124)
Total net investment in commercial lease financings $4,437,162 $4,082,940Consumer
Lease payments receivable $ 38,667 $ 117,176Estimated residual value of leased assets 109,070 201,723Gross investment in consumer lease financings 147,737 318,899Unearned income (5,395) (19,195)
Total net investment in consumer lease financings $ 142,342 $ 299,704
A rollforward of the residual value component of lease financings by type follows:
(In Thousands) 2007 2006For the Calendar year
CommercialBeginning balance $ 408,809 $ 482,049Additions 132,768 95,174Runoff (148,348) (156,972)Write-downs (435) (11,442)
Ending balance $ 392,794 $ 408,809Consumer
Beginning balance $ 201,723 $ 231,582Runoff (92,653) (29,859)
Ending balance $ 109,070 $ 201,723
At December 31, 2007, the minimum future lease payments to be received from lease financings by type were asfollows:
(In Millions) 2008 2009 2010 2011 20122013 andBeyond Total
Commercial $1,568.4 $1,117.7 $794.5 $499.9 $267.9 $463.2 $4,711.6Consumer 13.2 23.1 2.4 — — — 38.7Total $1,581.6 $1,140.8 $796.9 $499.9 $267.9 $463.2 $4,750.3
Equipment Leased to Others: Equipment leased to others represents equipment owned by National City that isleased to customers under operating leases. Commercial equipment includes aircraft and other transportation,manufacturing, construction, data processing, medical, and office equipment leased to commercial customers whileconsumer equipment consists of automobiles leased to retail customers. The totals below also include the carryingvalue of any equipment previously leased to customers under either operating or financing leases that are in theprocess of being either renewed or sold.
85

A summary of the net carrying value of equipment leased to others by type at December 31 follows:
(In Thousands) 2007 2006Commercial
Cost $ 543,085 $ 616,787Accumulated depreciation (187,733) (151,358)
Net carrying value of commercial leased equipment 355,352 465,429Consumer
Cost 45,828 174,586Accumulated depreciation (26,391) (67,063)
Net carrying value of consumer leased equipment 19,437 107,523Total net carrying value of equipment leased to others $ 374,789 $ 572,952
Depreciation expense on equipment leased to others totaled $114 million in 2007, $155 million in 2006, and$197 million in 2005.
At December 31, 2007, the minimum future lease payments to be received from equipment leased to others by typewere as follows:
(In Millions) 2008 2009 2010 2011 20122013 andBeyond Total
Commercial $94.7 $72.4 $45.2 $26.5 $14.6 $29.4 $282.8Consumer 1.8 .6 — — — — 2.4Total $96.5 $73.0 $45.2 $26.5 $14.6 $29.4 $285.2
7. Loans, Allowance for Loan Losses and Allowance for Losses on Lending-RelatedCommitments
Total portfolio loans outstanding are recorded net of unearned income, unamortized premiums and discounts, deferredloan fees and costs, and fair value adjustments of $956 million and $387 million at December 31, 2007 and 2006,respectively. Loans held for sale are recorded at lower of cost or market on an aggregate basis by loan type. Thevaluation allowance recognized to reduce the carrying value of mortgage loans held for sale to fair value was $605thousand and $65 million at December 31, 2007 and 2006, respectively.
The Corporation has the option to repurchase certain delinquent loans that were sold in prior periods. The Corporationhas recognized these loans and the related repurchase obligation on its Consolidated Balance Sheet as follows:
(In Millions) 2007 2006December 31
Residential real estate portfolio loans $334 $297Commercial real estate loans held for sale 3 8Other borrowed funds $337 $305
To provide for probable losses in the loan portfolio, National City maintains an allowance for loan losses and anallowance for losses on lending-related commitments.
86

Activity in the allowance for loan losses follows:
(In Thousands) 2007 2006 2005For the Calendar Year
Balance at beginning of period $1,131,175 $1,094,047 $1,188,462Provision for loan losses 1,325,903 488,208 300,531Charge-offs (844,524) (645,140) (602,902)Recoveries 183,446 203,612 222,042Net charge-offs (661,078) (441,528) (380,860)Other(a) (34,272) (9,552) (14,086)Balance at end of period $1,761,728 $1,131,175 $1,094,047
(a) Includes the allowance for loan losses associated with acquisitions, portfolio loans transferred to held for sale, and in2007 and 2006, reinsurance claims paid to third parties.
In 2007 and 2006, the Corporation’s insurance subsidiary provided reinsurance to a third party who provides theprimary mortgage insurance on certain portfolio loans. Under this arrangement, National City assumed a 50% pro ratashare of credit losses on the insured portfolio loans subject to certain limits. The provision for credit losses includedexpected reinsurance losses associated with insured nonprime mortgage loans of $48 million and $79 million for 2007and 2006, respectively.
Activity in the allowance for losses on lending-related commitments follows:
(In Thousands) 2007 2006 2005For the Calendar Year
Balance at beginning of period $ 77,986 $83,601 $100,538Net provision for losses on lending-related commitments (13,223) (5,615) (16,937)Balance at end of period $ 64,763 $77,986 $ 83,601
Nonperforming loans totaled $1.1 billion and $500 million as of December 31, 2007 and 2006, respectively. For loansclassified as nonperforming at December 31, 2007, the contractual interest due and actual interest recognized on thoseloans during 2007 was $114 million and $34 million, respectively.
Impaired loans, as defined under SFAS 114, are included in nonperforming loans. Average impaired loans for 2007,2006, and 2005 totaled $239 million, $158 million, and $108 million, respectively. During 2007, 2006, and 2005,interest recognized on impaired loans while they were considered impaired was not material. The majority of the loansdeemed impaired were evaluated using the fair value of the collateral as the measurement method. The following tablepresents details on the allowance for loan losses related to impaired loans.
(In Thousands) 2007 2006December 31
Impaired loans with an associated allowance $207,421 $118,127Impaired loans without an associated allowance 126,259 71,360Total impaired loans $333,680 $189,487
Allowance for loan losses allocated to impaired loans $ 48,320 $ 29,545
87

8. Securities
Securities available for sale follow:
(In Thousands)Amortized
CostUnrealized
GainsUnrealized
LossesFair
Value
December 31, 2007
U.S. Treasury $1,055,520 $ 43,387 $ — $1,098,907Federal agency 262,314 5,158 152 267,320Mortgage-backed securities 6,610,008 38,529 64,306 6,584,231Asset-backed and corporate debt securities 204,345 516 13,373 191,488States and political subdivisions 382,097 4,282 489 385,890Other 194,024 10,379 982 203,421Total securities $8,708,308 $102,251 $79,302 $8,731,257
(In Thousands)Amortized
CostUnrealized
GainsUnrealized
LossesFair
Value
December 31, 2006
U.S. Treasury $1,051,590 $ 8,872 $12,001 $1,048,461Federal agency 250,054 2,458 1,589 250,923Mortgage-backed securities 5,305,629 41,119 51,919 5,294,829Asset-backed and corporate debt securities 174,829 2,188 20 176,997States and political subdivisions 499,563 7,205 972 505,796Other 221,327 10,834 347 231,814Total securities $7,502,992 $72,676 $66,848 $7,508,820
Other securities included retained interests from securitizations as well as equity securities.
The following table presents the age of gross unrealized losses and associated fair value by investment category.
(In Thousands)Fair
ValueUnrealized
LossesFair
ValueUnrealized
LossesFair
ValueUnrealized
Losses
Less Than 12 Months 12 Months or More TotalDecember 31, 2007
U.S. Treasury $ — $ — $ — $ — $ — $ —Federal agency — — 35,792 152 35,792 152Mortgage-backed securities 1,955,482 26,552 1,589,876 37,754 3,545,358 64,306Asset-backed securities 155,846 13,352 2,638 21 158,484 13,373States and political subdivisions 17,691 101 42,104 388 59,795 489Other 43,859 982 — — 43,859 982Total $2,172,878 $40,987 $1,670,410 $38,315 $3,843,288 $79,302
88

(In Thousands)Fair
ValueUnrealized
LossesFair
ValueUnrealized
LossesFair
ValueUnrealized
Losses
Less Than 12 Months 12 Months or More TotalDecember 31, 2006
U.S. Treasury $ 121,826 $ 1,110 $ 465,376 $10,891 $ 587,202 $12,001Federal agency 68,273 97 79,614 1,492 147,887 1,589Mortgage-backed securities 1,286,002 11,328 1,957,546 40,591 3,243,548 51,919Asset-backed securities 7,269 18 377 2 7,646 20States and political subdivisions 4,279 5 57,953 967 62,232 972Other 19,215 191 15,593 156 34,808 347Total $1,506,864 $12,749 $2,576,459 $54,099 $4,083,323 $66,848
Securities available for sale are reviewed for possible other-than-temporary impairment on a quarterly basis. During thisreview, management considers the severity and duration of the unrealized losses as well as its intent and ability to holdthe securities until recovery, taking into account balance sheet management strategies and its market view and outlook.Management also assesses the nature of the unrealized losses taking into consideration factors such as changes in risk-free interest rates, general credit spread widening, market supply and demand, creditworthiness of the issuer or anycredit enhancement providers, and the quality of the underlying collateral. During 2007, management recognized$4 million of other-than-temporary impairment losses on FNMA and FHLMC perpetual preferred securities.
Management also reviewed mortgage-backed and asset-backed securities with unrealized losses for other-than-temporary impairment. Management believes the primary reason for the unrealized losses on these securities is generalcredit spread widening caused by market concern over the credit quality of residential mortgages, an imbalancebetween market supply and demand for these securities, and in some instances, an increase in the risk-free interestrate at December 31, 2007 compared to the risk-free interest rate at the security’s acquisition date. All the issuers ofthe mortgage-backed and asset-backed securities in the Corporation’s portfolio are of investment grade quality. Therehave been no recent credit downgrades of these securities by either Moody’s Investors Service or Standard & Poors. Forcertain securities with unrealized losses, management also reviewed the performance of the underlying collateral andconsidered the securitization structure, but did not find any indication of any security-specific credit concerns.Management has the intent and ability to hold these securities until recovery. Therefore, other than the FNMA andFHLMC securities mentioned above, management concluded that none of the unrealized losses on the securities in theavailable-for-sale portfolio represent an other-than-temporary impairment as of December 31, 2007.
The following table presents the amortized cost, fair value, and weighted-average yield of securities at December 31,2007 by maturity:
(Dollars in Thousands) Within 1 Year1 to 5Years
5 to 10Years
After 10Years Total
Weighted-AverageYield(a)
U.S. Treasury $ 12 $ 488,193 $ 556,770 $ 10,545 $1,055,520 4.41%Federal agency 95,688 137,121 11,281 18,224 262,314 4.74%Mortgage-backed securities 79,851 3,774,969 2,256,415 498,773 6,610,008 5.34%Asset-backed and corporate
debt securities 25,606 73,656 7,163 97,920 204,345 6.24%States and political subdivisions 57,948 180,660 70,879 72,610 382,097 7.19%Other 11,610 45,639 — 136,775 194,024 4.90%Amortized cost $270,715 $4,700,238 $2,902,508 $834,847 $8,708,308
Fair value $271,071 $4,707,446 $2,922,872 $829,868 $8,731,257
Weighted-Average Yield(a) 5.17% 5.14% 5.48% 5.78% 5.31%
(a) Yield on debt securities only; equity securities and retained interests in securitizations are excluded.
89

Weighted-average yields are based on amortized cost. Yields on tax-exempt securities are calculated on a tax-equivalentbasis using the marginal Federal income tax rate of 35%. Mortgage-backed securities and retained interests insecuritizations are assigned to maturity categories based on their estimated average lives. Equity securities are includedin other securities in the After 10 Years category. At December 31, 2007, the fair value of securities pledged to securepublic and trust deposits, U.S. Treasury notes, security repurchase agreements, FHLB borrowings, and derivativeinstruments totaled $8.0 billion. At December 31, 2007, there were no securities of a single issuer which exceeded10% of stockholders’ equity.
In 2007, 2006, and 2005, gross securities gains were $34 million, $18 million, and $43 million, respectively, while grosssecurities losses were $12 million, $18 million, and $16 million, respectively.
9. Trading Assets and Liabilities
Securities, loans, and derivative instruments are classified as trading when they are entered into for the purpose ofmaking short-term profits or to provide risk management products to customers. Certain securities used to manage riskrelated to mortgage servicing assets are also classified as trading securities. All trading instruments are carried at fairvalue. Trading securities primarily include U.S. Treasury securities, U.S. government agency securities, mortgage-backedsecurities, and corporate bonds. Trading loans include the guaranteed portion of Small Business Administration loansand syndicated commercial loans held for distribution to others. Trading securities and loans are classified within otherinvestments on the balance sheet. Trading derivative instruments principally represent interest-rate swap and optioncontracts and foreign currency futures and forward contracts entered into to meet the risk management needs ofcommercial banking customers. The fair values of trading derivatives are included in derivative assets and derivativeliabilities on the balance sheet. Further detail on derivative instruments is included in Note 25. Trading liabilities alsoinclude securities sold short, which are obligations to purchase securities that have already been sold to other thirdparties. Liabilities for securities sold short are classified within borrowed funds on the balance sheet.
The following table presents the fair values of trading assets and liabilities.
(In Thousands) 2007 2006December 31
Trading assets:Securities $ 804,547 $447,031Loans 177,755 213,514Derivative instruments 234,451 118,962
Total trading assets $1,216,753 $779,507
Trading liabilities:Securities sold short $ 7,876 $ 52,122Derivative instruments 202,297 97,585
Total trading liabilities $ 210,173 $149,707
Trading revenue includes both net interest income from trading securities, loans, and securities sold short, and gainsand losses from changes in the fair value of trading instruments. Unrealized losses recorded within trading revenue fortrading securities held at December 31, 2007 totaled $(1) million, compared to unrealized gains of $5 million for
90

December 31, 2006. Gains and losses on trading instruments are included either within loan servicing revenue,brokerage revenue, or other income on the income statement. Total revenue from trading activities was as follows:
(In Thousands) 2007 2006 2005For the Calendar Year
Net interest income $35,866 $47,555 $38,492Gains (losses) in noninterest income:
Securities and securities sold short (4,104) 14,112 (476)Loans (7,869) (14,888) 560Derivative instruments 18,936 8,604 38,349
Subtotal 6,963 7,828 38,433Total net trading revenue $42,829 $55,383 $76,925
10. Principal Investments
The principal investment portfolio includes direct investments in private and public companies, as well as indirectinvestments in private equity funds which are managed by third parties. The direct portfolio consists of investments inthe consumer/retail, manufacturing, automotive, commercial services, healthcare, commercial/industrial distribution, andbuilding products industries with the largest industry, consumer/retail, constituting approximately 14% of the totalprincipal investment portfolio. The indirect portfolio is diversified according to the terms of the fund’s agreement andthe general partner’s direction. Principal investments are classified within other investments as well as other assets onthe balance sheet. A rollforward of principal investments follows:
(In Thousands) 2007 2006For the Calendar Year
Direct Investments:Carrying value at beginning of period $311,218 $ 316,974Investments – new fundings 87,807 71,104Returns of capital and write-offs (21,849) (73,571)Fair value adjustments 9,715 (3,289)Carrying value at end of period $386,891 $ 311,218
Indirect Investments:Carrying value at beginning of period $354,278 $ 343,864Investments – new fundings 87,017 88,202Returns of capital and write-offs (56,681) (76,200)Fair value adjustments 3,960 (1,588)Carrying value at end of period $388,574 $ 354,278
Total Principal Investments:Carrying value at beginning of period $665,496 $ 660,838Investments – new fundings 174,824 159,306Returns of capital and write-offs (78,530) (149,771)Fair value adjustments 13,675 (4,877)Carrying value at end of period $775,465 $ 665,496
(In Thousands) 2007 2006 2005For the Calendar Year
Principal investment revenue(a) $27,783 $ 29,197 $28,273Net principal investment gains(b) $95,524 $117,882 $57,156
(a) Consists primarily of interest, dividends, and fee income(b) Consists primarily of fair value adjustments and realized gains and losses on investments
91

The principal investment portfolio is managed primarily within the Commercial Banking-National line of business.Accounting policies for principal investments are included in Note 1. Commitments to fund principal investments arediscussed in Note 22.
11. Goodwill and Other Intangible Assets
The carrying value of goodwill was $5.4 billion and $3.8 billion at December 31, 2007 and 2006, respectively. Arollforward of goodwill by line of business for 2007 and 2006 follows:
(In Thousands)January 1,
2007Goodwill
Adjustments(a)Impairment
LossesDecember 31,
2007
Retail Banking $1,501,931 $1,226,175 $ — $2,728,106Commercial Banking-Regional 1,671,003 409,792 — 2,080,795Commercial Banking-National 336,897 12,109 — 349,006Mortgage Banking 76,031 104,685 (180,716) —Asset Management 230,049 35,951 — 266,000Parent and Other — — — —Total $3,815,911 $1,788,712 $(180,716) $5,423,907
(In Thousands)January 1,
2006Goodwill
Adjustments(a)Impairment
LossesDecember 31,
2006
Retail Banking $1,025,340 $ 476,591 $ — $1,501,931Commercial Banking-Regional 1,450,547 220,456 — 1,671,003Commercial Banking-National 338,097 (1,200) — 336,897Mortgage Banking 62,392 13,639 — 76,031Asset Management 230,701 (652) — 230,049Parent and Other 206,032 (206,032) — —Total $3,313,109 $ 502,802 $ — $3,815,911
(a) Represents goodwill associated with acquisitions, purchase accounting adjustments, as well as the realignment ofgoodwill among segments.
In 2007, the Corporation completed the acquisitions of MAF Bancorp, Inc. and Fidelity Bankshares, Inc., whichincreased goodwill by $1.1 billion and $714 million, respectively. The goodwill associated with these acquisitions wasallocated to the business segments based on the relative fair value that each acquisition added to these segments, asshown in the table above. Retail Banking received the largest allocation. The fair values upon which the allocationswere based were estimated based on generally accepted valuation techniques including discounted projected cashflows, earnings multiples, and comparable transactions. Refer to Note 3 for further discussion on recent acquisitions.
During 2007, the mortgage industry experienced adverse market conditions. During the annual impairment review, itwas determined that the fair value of the Mortgage Banking segment was less than its carrying value. A discountedcash flow model was used to calculate the fair value of the business segment by applying assumptions that a marketparticipant would use taking into account the timing and the risk of the related cash flows. The impairment loss wascalculated as the excess of the carrying amount of the goodwill over the implied fair value of the business. The impliedfair value of the business was based upon the excess of the recorded and unrecorded assets and liabilities over thepreviously determined fair value of the Mortgage Banking segment. The resulting impairment loss was $181 million. Asnoted in the table above, there is no goodwill remaining related to the Mortgage Banking segment atDecember 31, 2007.
In 2006, the Corporation completed the acquisitions of Harbor Florida Bancshares, Inc. and Forbes First Financial whichadded $682 million and $43 million, respectively, to goodwill. This goodwill was principally allocated to the RetailBanking and Commercial Banking-Regional segments based on the relative fair value that each acquisition added tothese segments. Also in 2006, the Corporation sold its First Franklin nonprime mortgage origination and servicing
92

platform. Goodwill of $206 million was included in the carrying amount of net assets sold in determining the gainrealized upon sale. Goodwill associated with First Franklin was included within the Parent and Other segment.
Finite-lived intangible assets capitalized on the balance sheet include core deposit, credit card and other intangibles.Recent acquisitions added $239 million of core deposit intangibles and $7 million of other intangibles in 2007. Theamortization periods for newly capitalized intangibles are ten years for core deposits and one to ten years for otherintangibles. A summary of these intangible assets at December 31 follows:
(In Thousands) 2007 2006
Core deposit intangiblesGross carrying amount $475,467 $239,289Less: accumulated amortization 144,727 85,876Net carrying amount 330,740 153,413
Credit card intangiblesGross carrying amount 6,310 7,699Less: accumulated amortization 4,357 2,914Net carrying amount 1,953 4,785
Other intangiblesGross carrying amount 78,449 62,183Less: accumulated amortization 55,319 36,733Net carrying amount 23,130 25,450
Total finite-lived intangiblesGross carrying amount 560,226 309,171Less: accumulated amortization 204,403 125,523Net carrying amount $355,823 $183,648
Amortization expense on finite-lived intangible assets totaled $82 million, $50 million, and $76 million for 2007, 2006,and 2005, respectively. Amortization expense on finite-lived intangible assets is expected to total $80 million,$69 million, $58 million, $47 million, and $37 million for fiscal years 2008 through 2012, respectively.
12. Servicing Assets
The Corporation has obligations to service residential mortgage loans, commercial real estate loans, automobile loans,and other consumer loans. Classes of servicing assets are identified based on loan type and the method of managingthe risks associated with these assets. A description of the various classes of servicing assets follows.
Residential Mortgage Servicing Rights: The Corporation recognizes mortgage servicing right (MSR) assets onresidential real estate loans when it retains the obligation to service these loans upon sale and the servicing fee is morethan adequate compensation. MSRs are subject to declines in value from actual or expected prepayments of theunderlying loans. The Corporation manages this risk by hedging the fair value of MSRs with securities and derivativeinstruments which are expected to increase in value when the value of MSRs declines.
Effective January 1, 2006, the Corporation adopted the provisions of SFAS 156 and elected the fair value measurementmethod for MSRs. Upon adoption, the carrying value of the MSRs was increased to fair value by recognizing acumulative effect adjustment of $26 million pretax, or $17 million after tax. Management selected the fair valuemeasurement method of accounting for MSRs to be consistent with its risk management strategy to hedge the fairvalue of these assets. The fair value method of accounting for MSRs matches the accounting for the related securitiesand derivative instruments. Changes in the fair value of MSRs, as well as changes in fair value of the related securitiesand derivative instruments, are recognized each period within loan servicing revenue on the income statement.
On December 30, 2006, the First Franklin nonprime mortgage servicing platform and servicing rights valued at$223 million were sold.
93

Changes in the carrying value of MSRs, accounted for at fair value, follow:
(In Thousands) 2007 2006For the Calendar Year
Balance at beginning of period $2,094,387 $2,115,715Cumulative effect of change in accounting — 26,392Additions:
From loans sold with servicing retained 673,086 576,023From acquisitions 42,982 4,741
Subtractions from sales of servicing rights — (222,730)Changes in fair value due to:
Time decay and payoffs(a) (344,282) (403,969)Implementation of internal prepayment model — (55,983)All other changes in valuation inputs or assumptions(b) 59,669 54,198
Fair value of MSRs at end of period $2,525,842 $2,094,387Unpaid principal balance of loans serviced for others (in millions) $ 179,437 $ 162,264
(a) Represents decrease in MSR value due to passage of time, including the impact from both regularly scheduled loanprincipal payments and loans that paid down or paid off during the period.
(b) Represents MSR value change resulting primarily from market-driven changes in interest rates.
The fair value of MSRs is estimated using a valuation model that calculates the present value of estimated future netservicing cash flows, taking into consideration actual and expected mortgage loan prepayment rates, discount rates,servicing costs, and other economic factors, which are determined based on current market conditions. The currentmortgage interest rate influences the expected prepayment rate and therefore, the length of the cash flows associatedwith the servicing asset, while the discount rate determines the present value of those cash flows. Expected mortgageloan prepayment assumptions are estimated by an internal proprietary model and consider empirical data drawn fromthe historical performance of the Corporation’s managed loan servicing portfolio.
Future interest rates are another significant factor in the valuation of MSRs. In 2007, the Corporation refined its MSRvaluation model to incorporate market implied forward interest rates to estimate the future direction of mortgage anddiscount rates. The forward rates utilized are derived from the current yield curve for U.S. dollar interest rate swaps andare consistent with pricing of capital markets instruments. In prior periods, the MSR valuation model assumed thatinterest rates remained constant over the life of the servicing asset cash flows.
Management periodically obtains third-party valuations of the MSR portfolio to assess the reasonableness of the fairvalue calculated by its internal valuation model.
The key economic assumptions used in determining the fair value of MSRs capitalized during 2007 and 2006 were asfollows:
2007 2006Weighted-average life (in years) 6.1 3.4Weighted-average CPR 16.32% 29.88%Spread over forward interest rate swap rates(a) 600 —Weighted-average discount rate(b) 10.14 11.49
(a) Utilized to discount the servicing cash flows for the months of May through December 2007.(b) Utilized to discount the servicing cash flows for the months of January through April 2007 and in 2006.
94

The key economic assumptions used in determining the fair value of MSRs at year end were as follows:
2007 2006December 31
Weighted-average life (in years) 5.0 5.0Weighted-average CPR 14.21% 17.66%Spread over forward interest rate swap rates 579 —Weighted-average discount rate — 9.77
Commercial Real Estate Servicing Assets: Commercial real estate servicing assets are recognized upon sellingcommercial real estate loans into the secondary market, while retaining the obligation to service those loans, or frompurchasing or assuming the right to service commercial real estate loans originated by others. These servicing assets areinitially measured at fair value and subsequently accounted for using the amortization method. Under this method, theassets are amortized in proportion to and over the period of estimated servicing income and are evaluated forimpairment on a quarterly basis. For purposes of the impairment analysis, management stratifies these servicing assetsby loan type as well as by the term of the underlying loans. When the carrying value exceeds the fair value and isbelieved to be temporary, a valuation allowance is established by a charge to loan servicing revenue in the incomestatement. Other-than-temporary impairment is recognized when the recoverability of the carrying value is determinedto be remote. When this situation occurs, the unrecoverable portion of the valuation allowance is applied as a directwrite-down to the carrying value of the servicing asset. Unlike a valuation allowance, a direct write-down permanentlyreduces the carrying value of the servicing asset and the valuation allowance, precluding recognition of subsequentrecoveries. There were no other-than-temporary impairments on commercial real estate servicing assets recognizedduring 2007 or 2006.
The fair value of commercial real estate servicing assets is estimated with an internal valuation model, or by obtaining athird-party opinion of value from Mortgage Industry Advisory Corporation. Both methods are based on calculating thepresent value of estimated future net servicing cash flows, taking into consideration discount rates, prepayments, andservicing costs. The internal valuation model is validated at least annually through a third-party valuation.
95

Commercial real estate servicing assets are classified in other assets on the balance sheet. Changes in the carrying valueof the commercial real estate servicing assets and the associated valuation allowance follow:
(In Thousands) 2007 2006For the Calendar Year
Commercial real estate servicing assetsBalance at beginning of period $146,867 $138,408Additions:
From loans sold with servicing retained 21,738 25,333From assumptions of servicing 276 1,233From purchases of servicing 5,025 3,623
Subtractions:Amortization (25,072) (21,501)Sales (741) (229)
Carrying value before valuation allowance at end of period 148,093 146,867
Valuation allowanceBalance at beginning of period (957) (1,075)Impairment (charges) recoveries (35) 118
Balance at end of period (992) (957)
Net carrying value of servicing assets at end of period $147,101 $145,910
Unpaid principal balance of commercial real estate loans serviced for others(in millions) $ 17,818 $ 16,701
Fair value of servicing assets:Beginning of period $188,716 $163,182End of period 183,342 188,716
The key economic assumptions used to estimate the fair value of these servicing assets at December 31, 2007 and2006 were as follows:
2007 2006December 31
Weighted-average life (in years) 8.1 8.3Weighted-average discount rate 13.13% 13.31%
Other Consumer Loans: The Corporation also has servicing assets related to sales or securitizations of automobileloans and certain home equity loans and home equity lines of credit. These servicing assets are accounted for using theamortization method and are included in other assets on the balance sheet. The servicing asset related to securitizedautomobile loans was $3 million and $8 million at December 31, 2007 and 2006, respectively. The servicing assetrelated to home equity loans and lines of credit was $27 million and $22 million at December 31, 2007 and 2006,respectively. No servicing asset or liability has been recognized related to the Corporation’s obligation to service creditcard loans as the fee received for performing this service is deemed to approximate the amount that would be paid tofairly compensate a substitute servicer, should one be required.
96

Contractual Servicing Fees: Contractual servicing fees, including late fees and ancillary income, for each type of loanserviced are presented below. Contractual servicing fees are included within loan servicing revenue on theincome statement.
(In Thousands) 2007 2006 2005For the Calendar Year
Residential real estate $534,975 $625,007 $533,291Credit card 99,041 110,105 78,105Commercial real estate 37,365 31,696 25,843Automobile 19,641 35,894 11,478Home equity lines of credit 53,807 26,957 746Home equity loans 15,162 3,838 —
Total contractual servicing fees $759,991 $833,497 $649,463
13. Properties and Equipment
The composition of properties and equipment follows:
(In Thousands) 2007 2006December 31
Land $ 378,133 $ 245,249Buildings and leasehold improvements 1,352,497 1,074,422Equipment 1,152,903 1,058,034
2,883,533 2,377,705Less accumulated depreciation and amortization 1,176,046 975,555
Net properties and equipment $1,707,487 $1,402,150
Depreciation and amortization of properties and equipment, including assets recorded under capital leases, totaled$249 million in 2007, $243 million in 2006, and $229 million in 2005. Unamortized internally developed software costswere $159 million and $194 million at December 31, 2007 and 2006, respectively. Amortization of internally developedsoftware costs totaled $58 million in 2007, $43 million in 2006, and $36 million in 2005. During 2007, the Corporationrecognized a fixed asset impairment charge of $43 million on internally developed software used to originate mortgageloans within its former correspondent lending business. Adverse conditions in the mortgage markets in 2007 led to thecurtailment of certain mortgage products and the exit of the correspondent lending business. As a result of theseconditions, this asset, along with certain other mortgage-related software, was deemed impaired. This charge wasrecorded within the Mortgage Banking segment. In 2005, the Corporation recognized an $18 million impairmentcharge on certain under-utilized buildings. This change was recorded within the Parent and Other segment. There wereno significant fixed asset impairments in 2006.
97

14. Federal Funds Borrowed and Security Repurchase Agreements
Detail of federal funds borrowed and security repurchase agreements follows:
(Dollars in Thousands) 2007 2006 2005Balance at December 31:
Federal funds borrowed $1,215,640 $1,526,807 $3,101,648Security repurchase agreements 3,884,545 3,757,190 3,397,606
Maximum outstanding at any month end:Federal funds borrowed 5,322,681 4,824,432 6,887,983Security repurchase agreements 4,632,773 3,877,339 3,697,789
Daily average amount outstanding:Federal funds borrowed 1,894,168 2,885,996 4,021,248Security repurchase agreements 4,133,423 3,486,526 3,316,941
Weighted daily average interest rate:Federal funds borrowed 5.18% 5.08% 3.34%Security repurchase agreements 4.22 3.96 2.28
Weighted daily interest rate for amounts outstanding at December 31:Federal funds borrowed 3.58% 5.09% 4.06%Security repurchase agreements 3.54 4.40 3.05
As of December 31, 2007, federal funds borrowed and security repurchase agreements have maturities of one monthor less.
15. Borrowed Funds
Detail of borrowed funds follows:
(In Thousands) 2007 2006December 31
Commercial paper $1,170,581 $ 811,842U.S. Treasury notes 500,000 433,829Other 384,482 403,296
Total borrowed funds $2,055,063 $1,648,967
Weighted-average rate 4.30% 4.96%
Commercial paper is issued by the Corporation’s subsidiary, National City Credit Corporation. As of December 31,2007, the entire balance had maturities of four months or less. U.S. Treasury notes represent secured borrowings fromthe U.S. Treasury. These borrowings are collateralized by qualifying securities and commercial loans. The funds areplaced at the discretion of the U.S. Treasury. At December 31, 2007, the entire balance of outstanding U.S. Treasurynotes was callable on demand by the U.S. Treasury.
The other category at December 31, 2007 and 2006, included liabilities totaling $337 million and $305 million,respectively, related to mortgage loans available for repurchase under GNMA and FNMA loan sale programs. Seefurther discussion in Note 1. The other category also included obligations totaling $8 million and $52 million atDecember 31, 2007 and 2006, respectively, related to securities sold short, which are obligations to purchase securitiesthat have already been sold to other third parties. Some short sales are held for trading purposes, while others are usedto economically hedge risk associated with other assets or liabilities. See further discussion in Note 9.
98

16. Long-Term Debt
The composition of long-term debt follows. This note excludes the junior subordinated notes owed to theunconsolidated subsidiary trusts. See Note 17 for further discussion on these obligations.
(In Thousands) 2007 2006December 31
3.20% senior notes due 2008 $ 297,907 $ 291,7643.125% senior notes due 2009 194,489 190,8985.75% subordinated notes due 2009 302,419 302,550Variable-rate senior note due 2009 600,000 —Variable-rate senior note due 2010 301,461 299,9084.90% senior notes due 2015 395,564 389,6746.875% subordinated notes due 2019 776,672 764,0528.375% senior note redeemed 2007 — 69,960
Total holding company 2,868,512 2,308,806Senior bank notes 13,061,382 18,580,239Federal Home Loan Bank advances 6,256,186 1,998,9237.25% subordinated notes due 2010 235,473 239,0526.30% subordinated notes due 2011 212,955 208,0657.25% subordinated notes due 2011 201,145 197,9336.25% subordinated notes due 2011 307,131 310,2146.20% subordinated notes due 2011 518,893 507,8924.63% subordinated notes due 2013 295,041 295,3265.25% subordinated notes due 2016 239,348 244,697Variable-rate subordinated notes due 2016 249,615 249,486Variable-rate subordinated notes due 2017 523,110 —5.80% subordinated notes due 2017 442,651 —4.25% subordinated notes due 2018 225,530 224,354Repurchase agreements 320,911 —Secured debt financings 25,911 31,067Other 8,659 10,917
Total subsidiaries 23,123,941 23,098,165
Total long-term debt $25,992,453 $25,406,971
The amounts above represent the par value of the debt adjusted for any unamortized discount, other basis adjustmentsrelated to hedging the debt with derivative instruments, and fair value adjustments recognized in connection with debtacquired through acquisitions. The Corporation uses derivative instruments, primarily interest-rate swaps and caps, tomanage interest-rate risk on its long-term debt. Interest-rate swaps are used to hedge the fair value of certain fixed-rate debt by converting the debt to variable rate and are also used to hedge the cash flow variability associated withcertain variable-rate debt by converting the debt to fixed rate. Interest-rate caps are also used to hedge cash flowvariability by capping the interest payments associated with variable-rate debt issuances. Further discussion onderivative instruments is included in Notes 1 and 25.
The subordinated notes of the holding company and National City Bank qualify for Tier 2 capital under the regulatorycapital requirements of the federal banking agencies. Further discussion on regulatory capital requirements is includedin Note 18.
99

A summary of par values and weighted-average rates of long-term debt as of December 31, 2007, follows. Theweighted-average effective rate includes the effects of derivative instruments used to manage interest-rate risk,amortization of discounts, and amortization of fair value adjustments associated with debt acquiredthrough acquisitions.
(Dollars in Thousands) Par ValueWeighted-AverageContractual Rate
Weighted-AverageEffective Rate
Senior bank notes $13,065,727 4.86% 4.93%FHLB advances 6,237,781 4.89 5.17Subordinated notes 4,425,000 5.95 5.68Senior notes 1,800,000 4.48 4.61Repurchase agreements 325,000 4.47 4.78Secured debt financings 25,911 6.60 6.60Other 8,659 6.20 6.20
Total long-term debt $25,888,078 5.02% 5.01%
National City Bank has issued senior and subordinated bank notes. During 2007, National City Bank issued senior banknotes with a par value of $2.1 billion and subordinated bank notes with par values totaling $950 million. AtDecember 31, 2007, senior bank notes totaling $1.6 billion were contractually based on a fixed rate of interest and$11.5 billion were contractually based on a variable rate of interest. Senior bank notes have maturities ranging from2008 to 2078. All but two subordinated notes of National City Bank were issued at fixed rates, pay interest semi-annually and may not be redeemed prior to maturity. The variable-rate subordinated note due 2016 is based on three-month LIBOR plus 35 basis points, resets quarterly, and was 5.341% at December 31, 2007. The variable-ratesubordinated note due 2017 is based on three-month LIBOR plus 37 basis points, resets quarterly, and was 5.521% atDecember 31, 2007. National City acquired repurchase agreements as part of the MAF Bancorp acquisition, which atDecember 31, 2007, consisted of $100 million of fixed-rate obligations, $225 million of variable-rate obligations, andhave maturities ranging from 2008 to 2014.
The holding company has issued both senior and subordinated notes. All but two of the notes issued by the holdingcompany are fixed rate. The $600 million variable-rate senior note due 2009 was issued during the first quarter of2007. The interest rate on this note is based on three-month LIBOR plus 1.5 basis points, is reset quarterly, and was4.941% at December 31, 2007. The interest rate on the variable-rate senior note due 2010 is based on three-monthLIBOR plus 17 basis points, is reset quarterly and was 5.161% at December 31, 2007. The 8.375% senior note of theholding company was called on July 15, 2007. All remaining senior notes and subordinated notes of the holdingcompany pay interest semi-annually and may not be redeemed prior to maturity.
At December 31, 2007, Federal Home Loan Bank (FHLB) advances consisted of $2.1 billion of fixed-rate obligations and$4.1 million of variable-rate obligations. The Corporation’s maximum remaining borrowing limit with the FHLB was$3.1 billion at December 31, 2007. The Corporation pledged $16.2 billion in residential real estate loans, $7.0 billion inhome equity lines of credit, and $55 million in mortgage-backed securities as collateral against FHLB borrowings atDecember 31, 2007. FHLB advances have maturities ranging from 2008 to 2030.
At December 31, 2007, long-term debt maturities, based on par values of such debt, were as follows: $9.5 billion in2008, $5.7 billion in 2009, $3.5 billion in 2010, $1.4 billion in 2011, $1.2 billion in 2012, and $4.6 billion thereafter.
In January 2008, the holding company issued $1.4 billion of convertible senior notes. Interest on these notes will bepaid semiannually at a fixed rate of 4.0%. The maturity date of these notes is February 1, 2011. The Corporation maynot redeem these notes prior to their maturity date. Holders may convert their notes, at their option, prior toNovember 15, 2010 under certain circumstances, including (i) if the trading price of the notes is less than a definedthreshold measured against the market value of National City common stock, (ii) any time after March 31, 2008, if themarket price of National City common stock exceeds 130% of the conversion price of the notes in effect on the lasttrading day of the immediately preceding calendar quarter, or (iii) upon the occurrence of certain specific events. After
100

November 15, 2010, the holders may convert their notes at any time through the third scheduled trading datepreceding the maturity date. The initial conversion rate will be equal to 52.8709 shares, which represented an initialconversion price of approximately $18.91, a 22.5% conversion premium to the last reported sale price of National Citycommon stock on January 23, 2008. The conversion rate will be subject to adjustment for stock splits, stock dividends,cash dividends in excess of certain thresholds, stock repurchases where the price exceeds market values, and certainother events. Upon conversion, the Corporation will pay cash equal to the principal balance of the notes and may issueshares of its common stock for any conversion value, determined over a 40 day observation period, that exceeds theprincipal balance of the notes being converted. The maximum number of net common shares that the Corporation maybe required to issue is 76 million shares, subject to potential adjustment in the case of certain events, make-wholefundamental changes, or early termination. The Corporation intends to use a portion of the net proceeds from thisoffering to repay $300 million of senior notes maturing in 2008, to pay the net cost of a related hedged transaction,and for general corporate purposes.
The holders of the convertible senior notes may elect: i) in the case of a make-whole fundamental change, to convertthe notes prior to the effective time of such change, in which case the conversion rate will be increased as provided bya formula set forth in the indenture supplement governing the convertible senior notes; or ii) upon the effective time ofany fundamental change, to require the Corporation to repurchase the convertible senior notes at their principalamount plus accrued but unpaid interest.
Generally, a fundamental change includes an acquisition of more than 50% of National City’s common stock, certainmergers, consolidations or other business combinations, if the Corporation’s continuing directors are less than themajority of the Board of Directors, a liquidation or dissolution, or National City’s common stock is not listed on anyU.S. national securities exchange. These rights may discourage a business combination or other transaction that isfavored by certain of our shareholders.
In conjunction with this offering, the Corporation entered into a convertible note hedge and warrant transactionswhich are intended to offset the potential share dilution upon conversion of the notes. For more description on thehedge transaction refer to Note 22 of the Consolidated Financial Statements.
17. Junior Subordinated Debentures Owed to Unconsolidated Subsidiary Trusts andCorporation-Obligated Mandatorily Redeemable Capital Securities of Subsidiary TrustsHolding Solely Debentures of the Corporation
As of December 31, 2007, National City sponsored seven trusts, of which 100% of the common equity is owned bythe Corporation, formed for the purpose of issuing corporation-obligated mandatorily redeemable capital securities (thecapital securities) to third-party investors and investing the proceeds from the sale of such capital securities solely injunior subordinated debt securities of the Corporation (the debentures). The debentures held by each trust are the soleassets of that trust which issued common securities to the Corporation and preferred capital securities to third-partyinvestors. The capital securities of these trusts qualify as Tier I capital of the Corporation for regulatory purposes. OnMay 25, 2007 and August 30, 2007, the Corporation issued $500 million and $518 million of junior subordinateddebentures, respectively.
The $500 million junior subordinated debentures owed to National City Capital Trust III bear interest at a fixed rate of6.625%, payable quarterly in arrears. These debentures are redeemable at par plus accrued unpaid interest, in whole orin part, anytime after May 25, 2012, with the prior approval of the Federal Reserve Board. The $500 million juniorsubordinated debentures have a scheduled maturity date of May 25, 2047. Upon the scheduled maturity date, theCorporation will be required to refinance these debentures with securities that are treated as capital for regulatorypurposes. If the Corporation is unable to refinance these securities, they will remain outstanding until their legalmaturity date of May 25, 2067, and bear interest at a variable rate equal to one-month LIBOR plus 2.1263 basis points.These debentures rank pari-passu to the Corporation’s other junior subordinated debentures issued to National CityCapital Trust II and IV, junior to the Corporation’s outstanding debt, and junior to its other outstanding juniorsubordinated debentures.
101

The $518 million junior subordinated debentures owed to National City Capital Trust IV bear interest at a fixed rate of8.0%, payable quarterly in arrears. These debentures are redeemable at par plus accrued unpaid interest, in whole or inpart, anytime after August 30, 2012, with the prior approval of the Federal Reserve Board. These debentures have ascheduled maturity date of September 15, 2047. Upon the scheduled maturity date, the Corporation will be requiredto refinance these debentures with securities that are treated as capital for regulatory purposes. If the Corporation isunable to refinance these securities, they will remain outstanding until their legal maturity date of August 30, 2067 andbear interest at a variable rate equal to one-month LIBOR plus 3.487 basis points. These debentures rank pari-passu tothe Corporation’s junior subordinated debentures issued to National City Capital Trust II and III, junior to theCorporation’s outstanding debt, and junior to its other outstanding junior subordinated debentures.
Consolidated debt obligations related to subsidiary trusts holding solely debentures of the Corporation follow. Theseamounts represent the par value of the obligations owed to the subsidiary trusts, including the Corporation’s ownershipinterest in the trusts, plus basis adjustments related to hedging the obligations with derivative instruments and fairvalue adjustments recognized in connection with obligations acquired through acquisitions.
(In Thousands) 2007 2006December 31
6.625% junior subordinated debentures owed to National City Capital Trust II dueNovember 15, 2036 $ 753,947 $752,681
6.625% junior subordinated debentures owed to National City Capital Trust III dueMay 25, 2047 499,017 —
8.000% junior subordinated debentures owed to National City Capital Trust IV dueSeptember 15, 2047 520,697 —
Variable-rate junior subordinated debentures owed to MAF Bancorp Capital Trust II dueSeptember 15, 2035 38,065 —
Variable-rate junior subordinated debentures owed to MAF Bancorp Capital Trust I dueJune 15, 2035 32,609 —
Variable-rate junior subordinated debentures owed to Fidelity Capital Trust III dueNovember 23, 2034 32,010 —
Variable-rate junior subordinated debentures owed to Fidelity Capital Trust II dueJanuary 23, 2034 23,338 —
8.12% junior subordinated debentures owed to First of America Capital Trust I redeemedJanuary 31, 2007 — 154,640
9.85% junior subordinated debentures owed to Fort Wayne Capital Trust I redeemedApril 15, 2007 — 30,928
Variable-rate junior subordinated debentures owed to Banc Services Corp. Statutory Trust Iredeemed June 26, 2007 — 7,317
Variable-rate junior subordinated debentures owed to Forbes First Financial Statutory Trust Iredeemed June 26, 2007 — 3,139
Total junior subordinated debentures owed to unconsolidated subsidiary trusts $1,899,683 $948,705
Distributions on the capital securities issued by National City Capital Trust II, III and IV are payable quarterly at a rate perannum equal to the interest rate being earned by the trust on the debentures held by these trusts. Distributions on thecapital securities issued by Fidelity Capital Trust III are payable quarterly at a variable rate equal to the three-monthLIBOR rate plus 197 basis points, with no maximum interest rate. The interest rate associated with Fidelity CapitalTrust III was 6.99% at December 31, 2007. Distributions on the capital securities issued by Fidelity Capital Trust II arepayable quarterly at a variable rate equal to the three-month LIBOR rate plus 285 basis points, with no maximuminterest rate. The interest rate associated with Fidelity Capital Trust II was 7.83% at December 31, 2007. Distributionson the capital securities issued by MAF Bancorp Capital Trust I are payable quarterly at a variable rate equal to thethree-month LIBOR rate plus 175 basis points, with no maximum interest rate. The interest rate associated with MAFBancorp Capital Trust I was 6.74% at December 31, 2007. Distributions on the capital securities issued by MAFBancorp Capital Trust II are payable quarterly at a variable rate equal to the three-month LIBOR rate plus 140 basis
102

points, with no maximum interest rate. The interest rate associated with MAF Bancorp Capital Trust II was 6.39% atDecember 31, 2007.
The capital securities are subject to mandatory redemption, in whole or in part, upon repayment of the debentures. TheCorporation has entered into agreements which, taken collectively, fully and unconditionally guarantee the capitalsecurities subject to the terms of each of the guarantees. The debentures held by the trusts are first redeemable, inwhole or in part, by the Corporation as follows:
First Call Date
Fidelity Capital Trust II January 23, 2009Fidelity Capital Trust III November 23, 2009MAF Capital Bancorp Trust I June 15, 2010MAF Capital Bancorp Trust II September 15, 2010National City Capital Trust II November 15, 2011National City Capital Trust III May 25, 2012National City Capital Trust IV August 30, 2012
In January 2008, the Corporation issued $500 million of junior subordinated debentures to National City PreferredCapital Trust I. These junior subordinated debentures bear interest at a fixed rate of 8.729%, payable semi-annually inarrears. These debentures are redeemable at par plus accrued unpaid interest, in whole or in part, anytime afterDecember 10, 2016, with the prior approval of the Federal Reserve Board. These debentures have a scheduled maturitydate of December 10, 2043. These debentures are eligible to be remarketed one month prior to December 10, 2012 atwhich time the interest rate, call date, and maturity may be reset. These debentures rank pari-passu to theCorporation’s junior subordinated debentures issued to National City Capital II, III and IV, junior to the Corporation’soutstanding debt, and junior to its other outstanding junior subordinated debentures.
The Corporation may only redeem or repurchase its junior subordinated notes payable owed to National City CapitalTrust II, III and IV more than 10 years in advance of their legal maturity dates, subject to certain limitations. TheCorporation may only redeem or repurchase its junior subordinated notes payable owed to National City PreferredCapital Trust I prior to December 10, 2016, subject to certain limitations. Prior to the date of that redemption orrepurchase, the Corporation must have received proceeds from the issuance of equity or hybrid securities that qualifyas Tier 1 capital under the Federal Reserve’s capital guidelines. The Corporation will also be required to obtain approvalof the Federal Reserve prior to the issuance of such securities. The current beneficiaries of this limitation are the holdersof the Corporation’s 6.875% subordinated notes due 2019.
18. Regulatory Restrictions and Capital Ratios
The Corporation and its bank subsidiaries, National City Bank and MidAmerica Bank, are subject to various regulatorycapital requirements of federal regulatory agencies that involve quantitative measures of assets, liabilities, and certainoff-balance-sheet items as calculated under regulatory accounting practices. The capital amounts and classifications arealso subject to qualitative judgments by the regulators about components, risk weightings, and other factors. Failure tomeet minimum capital requirements can result in certain mandatory and possible additional discretionary actions byregulators that could have a material effect on financial position and operations.
103

Regulatory and other capital measures follow:
(Dollars in Thousands) Amount Ratio Amount Ratio2007 2006
Total equity/assets $13,407,828 8.92% $14,581,003 10.40%Total common equity/assets 13,407,828 8.92 14,581,003 10.40Tangible common equity/tangible assets 7,628,098 5.28 10,581,444 7.77Tier 1 capital 9,366,935 6.53 11,534,600 8.93Total risk-based capital 14,728,763 10.27 15,704,502 12.16Leverage 9,366,935 6.39 11,534,600 8.56
The tangible common equity ratio excludes goodwill and other intangible assets from both the numeratorand denominator.
Tier 1 capital consists of total equity plus qualifying capital securities and minority interests, less unrealized gains andlosses accumulated in other comprehensive income, certain intangible assets, and adjustments related to the valuationof servicing assets and certain equity investments in nonfinancial companies (principal investments).
Total risk-based capital is comprised of Tier 1 capital plus qualifying subordinated debt and allowance for loan lossesand a portion of unrealized gains on certain equity securities.
Both the Tier 1 and the total risk-based capital ratios are computed by dividing the respective capital amounts byrisk-weighted assets, as defined.
The leverage ratio reflects Tier 1 capital divided by average total assets for the period. Average assets used in thecalculation exclude certain intangible and servicing assets.
National City Corporation’s Tier 1, total risk-based capital, and leverage ratios for the current period are above therequired minimum levels of 4.00%, 8.00%, and 3.00%, respectively. The capital levels at National City Bank andMidAmerica Bank are maintained at or above the well-capitalized minimums of 6.00%, 10.00%, and 5.00% for theTier 1 capital, total risk-based capital, and leverage ratios, respectively, as defined under the regulatory framework forprompt corrective action.
National City Bank and MidAmerica Bank from time to time are required to maintain noninterest bearing reservebalances with the Federal Reserve Bank. The required reserve balance was $19 million at December 31, 2007.
Under current Federal Reserve regulations, a bank subsidiary is limited in the amount it may loan to its parent companyand nonbank subsidiaries. Loans to a single affiliate may not exceed 10% and loans to all affiliates may not exceed20% of the bank’s capital stock, surplus and undivided profits, plus the allowance for loan losses. Loans from thesubsidiary bank to nonbank affiliates, including the parent company, are also required to be collateralized.
Dividends paid by subsidiary banks to its parent company are also subject to certain legal and regulatory limitations. In2008, subsidiary banks may pay dividends up to and equal to their net income for 2008, as defined by statute, throughthe date of any such dividend declaration, without prior regulatory approval.
Dividends paid by the Corporation are also subject to certain legal restrictions and regulatory guidance.
The Corporation’s mortgage banking and broker/dealer subsidiaries are also required to maintain minimum net worthcapital requirements with various governmental agencies. The mortgage banking subsidiaries’ net worth requirementsare governed by the Department of Housing and Urban Development and the Government National MortgageAssociation. The broker/dealer’s net worth requirements are governed by the United States Securities and ExchangeCommission. As of December 31, 2007, these subsidiaries met their respective minimum net worth capital requirements.
104

19. Stockholders’ Equity
Common Stock Warrant: In January 2008, in conjunction with the issuance of convertible senior notes, commonstock warrants were issued to a third party. The holder has the option to exercise 844,465 warrants, on a daily basis,commencing June 15, 2011 and ending on July 15, 2011, and 844,466 warrants, on a daily basis, commencing July 18,2011 and ending on October 20, 2011. The strike price of these warrants is $27.79 per share, which represented an80% premium to the last reported sale price of $15.44 per share of National City common stock on January 23, 2008.Upon exercise, the Corporation will deliver common shares with a market value equal to the number of warrantsexercised multiplied by the excess of the market price of National City common stock over the strike price. Themaximum number of shares that could be required to be issued is approximately 76 million, subject to adjustment inthe case of certain events, make-whole fundamental changes or early termination. The Corporation has reserved 93.1million shares for issuance pursuant to the convertible notes and warrants.
Preferred Stock: The Corporation issued 70,272 shares of no par, Series D convertible non-voting preferred stock inconjunction with a 2004 acquisition. Each share of Series D preferred stock is convertible at any time by the holder into15.96 shares of National City common stock. The conversion rate is subject to adjustment in the event the Corporationtakes certain actions such as paying a dividend in stock, splitting its common stock, or combining its common stockinto a smaller number of shares. Common shares deliverable upon conversion of the preferred stock have beenreserved for future issuance. The Corporation has no right to redeem the preferred stock. Dividends are paid on thepreferred stock as dividends are paid on common stock at the dividend rate per common share multiplied by thepreferred stock conversion ratio. The Series D preferred stock shall be preferred over National City common stock in theevent of liquidation or dissolution of the Corporation. In such event, the preferred holders will be entitled to receive$100 per share, or $7 million, plus accrued and unpaid dividends.
In January 2008, the Corporation designated 5,751 shares as no par, Series E perpetual preferred stock, of which 5,001of these shares would be issued pursuant to a stock purchase contract with National City Preferred Capital Trust I. Thestock purchase date is expected to be December 10, 2012, but could occur earlier or later, under certain conditions. InJanuary 2008, the Corporation also designated 1,725 shares as no par, Series F preferred stock, of which 1,500 ofthese shares were issued. Both the Series E and F preferred stock will rank senior to National City common stock andon parity with the Series D preferred stock in the event of liquidation or dissolution of the Corporation. Both theSeries E and F preferred stock have a liquidation value of $100,000 per share. Both series are noncumulative withrespect to dividends and will have limited voting rights in the event of nonpayment of dividends and certain otherevents. Holders of this preferred stock will be entitled to receive dividends, when and as declared by the Board ofDirectors. Series E shall be redeemable at the Corporation’s option, and subject to Federal Reserve approval, at any dateafter December 10, 2012. Series F shall be redeemable at the Corporation’s option, subject to Federal Reserve approval,at any date after February 1, 2013. Subject to these conditions, both Series E and F may be redeemed for $100,000per share plus any declared but unpaid dividends. The Corporation will be limited in its right to redeem both Series Eand F prior to ten years after their initial issuance dates by a replacement capital covenant. Pursuant to this covenant,the Corporation must have received proceeds from the issuance of equity or hybrid securities that qualify as Tier Icapital and may be required to obtain the approval of the Federal Reserve The current beneficiary of this limitation arethe holders of the Corporation’s 6.875% subordinated notes due 2019.
Common Stock Repurchases: On April 24, 2007, the Corporation’s Board of Directors authorized the repurchase ofup to 40 million shares of National City common stock subject to an aggregate purchase limit of $1.6 billion. Thisauthorization, which has no expiration date, was incremental to all previous authorizations approved by the Board ofDirectors. Repurchased shares are held for reissue in connection with compensation plans and for general corporatepurposes. During 2007, 2006, and 2005, the Corporation repurchased 45.9 million, 20.1 million, and 43.5 millionshares, respectively under those authorizations. As of December 31, 2007, 37.6 million shares remain authorizedfor repurchase.
On January 25, 2007, the Corporation’s Board of Directors authorized a “modified Dutch auction” tender offer topurchase up to 75 million shares of its outstanding common stock, at a price range not greater than $38.75 per sharenor less than $35.00 per share, for a maximum aggregate repurchase price of $2.9 billion. On March 7, 2007, the
105

Corporation accepted for purchase 40.3 million shares of its common stock at $38.75 per share for an aggregate priceof $1.6 billion. The share repurchase authorizations described above were unaffected by the tender offer.
Preferred Securities of Subsidiaries: PFGI Capital Corporation (PFGI Capital) is a consolidated subsidiary of theCorporation associated with a 2004 acquisition. The purpose of PFGI Capital is to invest in commercial mortgage loansand other authorized investments acquired from the Corporation to generate net income for distribution to itsstockholders. PFGI Capital has elected to be treated as a real estate investment trust (REIT) for federal income taxpurposes. Upon its formation, PFGI Capital issued 6.6 million equity units (PRIDES) to outside investors. The ownershipby outside investors is accounted for as a minority interest in the Consolidated Financial Statements. Each PRIDES wascomprised of two components – a three-year forward purchase contract and PFGI Capital Series A Preferred Stock.During 2005, all PRIDES holders exercised their Forward Purchase Contracts which entitled them to purchase 6,444,223newly issued shares of National City common stock for $165 million.
106

Other Comprehensive Income: A summary of activity in accumulated other comprehensive income follows:
(In Thousands) 2007 2006 2005For the Calendar Year
Accumulated unrealized gains (losses) on securities available for sale at January 1,net of tax $ 3,938 $ (4,018) $ 107,193
Net unrealized gains (losses) for the period, net of tax expense (benefit) of$13,341 in 2007, $4,115 in 2006, and $(49,316) in 2005 24,776 7,642 (91,586)
Reclassification adjustment for (gains) losses included in net income net of taxexpense (benefit) of $7,636 in 2007, $(169) in 2006, and $7,463 in 2005 (14,180) 314 (19,625)
Effect on other comprehensive income for the period 10,596 7,956 (111,211)Accumulated unrealized gains (losses) on securities available for sale at
December 31, net of tax $ 14,534 $ 3,938 $ (4,018)
Accumulated unrealized (losses) gains on derivatives used in cash flow hedgingrelationships at January 1, net of tax $ (3,505) $ 15,883 $ (6,605)
Net unrealized gains for the period, net of tax expense of $39,452 in 2007,$4,227 in 2006, and $16,849 in 2005 73,268 7,850 31,291
Reclassification adjustment for losses (gains) included in net income, net of tax(benefit) expense of $(69) in 2007, $14,666 in 2006, and $4,740 in 2005 128 (27,238) (8,803)
Effect on other comprehensive income for the period 73,396 (19,388) 22,488Accumulated unrealized gains (losses) on derivatives used in cash flow hedging
relationships at December 31, net of tax $ 69,891 $ (3,505) $ 15,883
Accumulated unrealized losses for pension and other postretirement obligationsat January 1, net of tax $ (71,347) $ — $ —
Net unrealized losses of prior service costs for the period, net of taxbenefit of $2,854 (4,859) — —
Net unrealized gains for the period, net of tax expense of $48,710 82,938 — —Amortization of prior service costs included in net periodic benefit, net of tax
benefit of $1,319 in 2007 (2,300) — —Amortization of transition obligation included in net periodic benefit, net of tax
expense of $295 in 2007 514 — —Amortization of net loss included in net periodic benefit, net of tax expense of
$1,257 in 2007 2,193 — —Effect on other comprehensive income for the period 78,486 — —Prior service costs, net of tax expense of $5,974 in 2006 — 10,506 —Transition obligation, net of tax benefit of $1,210 in 2006 — (2,128) —Net loss, net of tax benefit of $45,333 in 2006 — (79,725) —Cumulative effect of change in accounting for pensions and other postretirement
liabilities — (71,347) —Accumulated unrealized gains (losses) for pension and other postretirement
obligations at December 31, net of tax $ 7,139 $(71,347) $ —
Accumulated other comprehensive (loss) income at January 1, net of tax $ (70,914) $ 11,865 $ 100,588Other comprehensive income (loss), net of tax 162,478 (11,432) (88,723)Cumulative effect of change in accounting for pensions and other
postretirement liabilities — (71,347) —Accumulated other comprehensive income (loss) at December 31, net of
tax $ 91,564 $(70,914) $ 11,865
107

20. Net Income Per Common Share
Calculations of basic and diluted net income per share follow:
(Dollars in Thousands, Except Per Share Amounts) 2007 2006 2005For the Calendar Year
BasicNet income $ 313,975 $ 2,299,836 $ 1,985,229Less preferred dividends 1,794 1,704 1,616Net income applicable to common stock $ 312,181 $ 2,298,132 $ 1,983,613Average common shares outstanding 607,106,057 609,395,710 633,431,660Less average unallocated ESOP shares 717,291 79,640 —Average common shares outstanding – basic 606,388,766 609,316,070 633,431,660Net income per common share – basic $ .51 $ 3.77 $ 3.13
DilutedNet income $ 313,975 $ 2,299,836 $ 1,985,229Average common shares outstanding – basic 606,388,766 609,316,070 633,431,660Stock awards 4,726,352 7,233,896 6,679,651Convertible preferred stock 1,121,541 1,121,541 1,121,541Forward contracts — — 368,117Average common shares outstanding – diluted 612,236,659 617,671,507 641,600,969Net income per common share – diluted $ .51 $ 3.72 $ 3.09
Basic net income per common share is calculated by dividing net income, less dividend requirements on convertiblepreferred stock, by the weighted-average number of common shares outstanding, less unallocated Employee StockOwnership Plan (ESOP) shares, for the period.
Diluted net income per common share takes into consideration the pro forma dilution of outstanding convertiblepreferred stock and certain unvested restricted stock and unexercised stock option awards. In 2005, diluted commonshares outstanding also considered commitments to issue additional shares pursuant to forward contracts, which wereexercised in full in 2005. For the years ended December 31, 2007, 2006, and 2005, options to purchase 18.7 million,5.4 million, and 10.4 million shares of common stock, respectively, were outstanding but not included in thecomputation of diluted net income per share because the option exercise price exceeded the fair value of the stocksuch that their inclusion would have had an anti-dilutive effect. Diluted net income is not adjusted for preferreddividend requirements since preferred shares are assumed to be converted from the beginning of the period.
In January 2008, the Corporation issued convertible senior notes, as well as common stock warrants and entered into acovered spread hedge transaction. Upon conversion of the notes, the Corporation may be required to issue commonshares. If the common stock price exceeds $18.91 per share, the impact would be dilutive to earnings per share. TheCorporation has hedged the dilutive impact of this transaction. The common stock warrants were issued to a thirdparty at a strike price of $27.79 per share, which represents an 80% premium to the last reported sale price of $15.44per share of National City’s common stock on January 23, 2008. These warrants are exercisable beginning June 15,2011 and expire October 20, 2011. These warrants would be dilutive to earnings per share in future periods if themarket price of National City common stock were to exceed the warrant’s strike price. The maximum number of netshares that can be issued pursuant to the warrants and the convertible senior notes is 76 million, subject to adjustment.
108

21. Income Taxes
The composition of income tax expense follows:
(In Thousands) 2007 2006 2005For the Calendar Year
Current:Federal $ 428,881 $1,031,632 $617,351State 33,224 51,416 14,425
Total current 462,105 1,083,048 631,776Deferred:
Federal (362,375) 43,402 341,551State (43,028) (3,650) 6,860
Total deferred (405,403) 39,752 348,411
Income tax expense $ 56,702 $1,122,800 $980,187
Income tax expense applicable to securities transactions $ 7,636 $ (169) $ 7,493
The effective tax rate differs from the statutory Federal tax rate applicable to corporations as a result of permanentdifferences between accounting and taxable income as shown in the following table:
2007 2006 2005For the Calendar Year
Statutory Federal tax rate 35.0% 35.0% 35.0%Life insurance (7.9) (0.8) (0.9)Tax-exempt income (4.5) (0.5) (0.7)State taxes (1.6) 0.9 0.5Tax credits (18.7) (1.5) (1.7)Goodwill impairment 12.2 — —Other 0.8 (0.3) 0.9
Effective tax rate 15.3% 32.8% 33.1%
109

Significant components of deferred tax liabilities and assets as of December 31 follow:
(In Thousands) 2007 2006
Deferred tax liabilities:Mortgage servicing rights $ 818,592 $ 641,499Leases and equipment leased to others 352,789 456,309Properties and equipment 107,680 58,881Deferred loan fees 72,975 94,868Unrealized gains on securities & loans available or held for sale 31,270 3,098State income taxes — 20,113Intangibles 113,330 63,288Other, net 104,415 99,248
Total deferred tax liabilities 1,601,051 1,437,304Deferred tax assets:
Allowance for loan losses 723,009 448,015Deferred compensation accrual 116,050 115,256Repurchase and indemnification reserves 191,586 62,620Employee benefit accruals 87,832 89,092State income taxes 22,702 —Retained interests 14,516 19,273Net operating loss carryforwards 10,578 9,741Other, net 207,327 145,200
Gross deferred tax assets 1,373,600 889,197Less: valuation allowance (9,735) (4,992)
Total deferred tax assets, net 1,363,865 884,205
Net deferred tax liability $ 237,186 $ 553,099
A federal net operating loss carryforward of less than $1 million remaining at December 31, 2007 was acquired inconnection with the acquisition of Forbes, Harbor and Fidelity. This carryforward expires in 2023. Management believesthat future taxable income will be sufficient to fully realize the deferred tax asset associated with this carryforward. Thevaluation allowance shown above relates to state net operating loss carryforwards which may not be realized infuture periods.
Retained earnings at December 31, 2007 includes $117 million in allocations of earnings for bad debt deductions offormer thrift subsidiaries for which no income tax has been provided. Under current law, if certain subsidiaries usethese bad debt reserves for purposes other than to absorb bad debt losses, they will be subject to Federal income taxat the current corporate tax rate.
For the years ended 2007, 2006, and 2005, income tax benefits of $21 million, $18 million, and $19 million,respectively, were credited to stockholders’ equity related to the exercise of nonqualified employee stock options.
110

The Corporation adopted the provisions of FASB Interpretation No. 48, Accounting for Uncertainty in Income Taxes, onJanuary 1, 2007. As a result of the adoption of this new accounting standard, the Corporation recorded a $31 millionincrease in its liability for uncertain tax positions and related interest ($24 million net of tax), which was accounted foras a cumulative effect of an accounting change, reducing the opening balance of retained earnings. As ofDecember 31, 2007 and 2006, the Corporation had a liability for uncertain tax positions, excluding interest andpenalties, of $209 million and $184 million, respectively. A reconciliation of the beginning and ending balance ofunrecognized tax benefits is as follows:
(In Thousands) 2007
Balance at January 1, 2007 $184,107Additions:
Positions taken during the current year 1,712Positions taken during a prior period 25,612Obtained in acquisitions 11,480Translation adjustments 107
Reductions:Positions taken during the current year (345)Positions taken during a prior period (7,995)Decreases related to settlements with taxing authorities (723)Reductions resulting from lapse of statutes of limitation (4,951)
Balance at December 31, 2007 $209,004
The Corporation recognizes interest and penalties associated with uncertain tax positions in income tax expense. During2007, 2006, and 2005, the provision for interest and penalties was $22 million, $4 million, and $4 million, respectively.The Corporation had approximately $58 million and $31 million accrued for payment of interest and penalties as ofDecember 31, 2007 and 2006, respectively.
22. Commitments, Contingent Liabilities, Guarantees, and Related Party Transactions
Commitments: A summary of the contractual amount of significant commitments follows:
(In thousands) 2007 2006December 31
Commitments to extend credit:Revolving home equity and credit card lines $35,803,302 $34,286,346Commercial 28,231,694 24,851,485Residential real estate 7,218,115 9,506,648Other 607,390 1,047,439
Standby letters of credit 5,371,844 5,265,929Commercial letters of credit 326,607 338,110Net commitments to sell mortgage loans and mortgage-backed securities 2,500,026 3,480,387Net commitments to sell commercial real estate loans 625,949 376,375Commitments to fund civic and community investments 717,400 607,190Commitments to fund principal investments 357,101 282,407Commitments to purchase beneficial interests in securitized automobile loans 283,012 573,152
Commitments to extend credit are agreements to lend. Since many of these commitments expire without being drawnupon, the total commitment amounts do not necessarily represent future cash flow requirements. Certain lendingcommitments for residential mortgage and commercial real estate loans to be sold into the secondary market areconsidered derivative instruments in accordance with SFAS 133. The changes in the fair value of these commitmentsdue to changes in interest rates are recorded on the balance sheet as either derivative assets or derivative liabilities. Thecommitments related to residential mortgage loans and commercial real estate loans are included in residential realestate and commercial loans, respectively, in the above table. Further discussion on derivative instruments is included inNotes 1 and 25.
111

Standby and commercial letters of credit are conditional commitments issued to guarantee the performance of acustomer to a third party. Standby letters of credit generally are contingent upon the failure of the customer to performaccording to the terms of the underlying contract with the third party, while commercial letters of credit are issuedspecifically to facilitate commerce and typically result in the commitment being drawn on when the underlyingtransaction is consummated between the customer and the third party. The credit risk associated with loancommitments and standby and commercial letters of credit is essentially the same as that involved in extending loans tocustomers and is subject to normal credit policies. Collateral may be obtained based on management’s creditassessment of the customer.
The Corporation enters into forward contracts for the future delivery or purchase of fixed-rate residential mortgageloans, mortgage-backed securities, and commercial real estate loans to reduce the interest-rate risk associated withloans held for sale, commitments to fund loans, and mortgage servicing rights. These contracts are also consideredderivative instruments under SFAS 133, and the fair value of these contracts are recorded on the balance sheet aseither derivative assets or derivative liabilities. Further discussion on derivative instruments is included in Notes 1 and 25.
The Corporation invests in low-income housing, small-business commercial real estate, and historic tax credit projects topromote the revitalization of low- to moderate-income neighborhoods throughout the local communities of its bankingsubsidiary. As a limited partner in these unconsolidated projects, the Corporation is allocated tax credits anddeductions. The commitments to fund civic and community investments represent funds committed for existing andfuture projects.
The Corporation has principal investment commitments to provide equity and mezzanine capital financing to privateand public companies through either direct investments in specific companies or through investment funds andpartnerships. The timing of future cash requirements to fund such commitments is generally dependent on theinvestment cycle. This cycle, over which privately held companies are funded by private equity investors and ultimatelysold, merged, or taken public through an initial offering, can vary based on overall market conditions as well as thenature and type of industry in which the companies operate.
National City Bank, a subsidiary of the Corporation, along with other financial institutions, has agreed to providebackup liquidity to a third-party commercial paper conduit. The conduit holds various third-party assets includingbeneficial interests in the cash flows of trade receivables, credit cards and other financial assets, as well as automobileloans securitized by the Corporation. The conduit has no interests in subprime mortgage loans. The Corporation hasretained interests in the securitized automobile loans in the form of Class A notes, Class B notes, and an interest-onlystrip. As of December 31, 2007, the fair value of these retained interests was $28 million. The conduit relies uponcommercial paper for its funding. In the event of a disruption in the commercial paper markets, the conduit couldexperience a liquidity event. At such time, the conduit may require National City Bank to purchase a 49% interest in anote representing a beneficial interest in the Corporation’s securitized automobile loans. Another financial institution,affiliated with the conduit, has committed to purchase the remaining 51% interest in this same note. Upon theconduit’s request, National City Bank would pay cash equal to the par value of the notes, less the correspondingportion of all defaulted loans, plus accrued interest. In return, National City Bank would be entitled to undividedinterest in the cash flows of the collateral underlying the note. The Corporation receives an annual commitment fee of7 basis points for providing this backup liquidity. To date, the conduit has not experienced any difficulty in accessing thecommercial paper markets. The Corporation’s commitment declines commensurate with the unpaid principal balance ofthe automobile loans securitized by the Corporation. As of December 31, 2007, the Corporation’s maximumcommitment was $283 million. This commitment expires in December 2008 but may be renewed annually for anadditional 12 months by mutual agreement of the parties.
The Corporation and certain of its subsidiaries occupy certain facilities under long-term operating leases and, inaddition, leases certain software and data processing and other equipment. The aggregate minimum annual rentalcommitments under these leases total approximately $174 million in 2008, $144 million in 2009, $122 million in 2010,$110 million in 2011, $101 million in 2012, and $603 million thereafter. The Corporation also subleases and receivesrental income on certain leased properties. As of December 31, 2007, aggregate future minimum rentals to be receivedunder noncancelable subleases totaled $17 million. Total operating lease expense, net of sublease income, recordedunder all operating leases was $159 million, $163 million, and $179 million in 2007, 2006, and 2005, respectively.
112

In January 2008, in conjunction with the issuance of junior subordinated notes, the Corporation issued a stockpurchase contract to the unconsolidated subsidiary trust which holds these notes. Pursuant to this contract, theCorporation is committed to make contractual payments to the trust at a rate of 3.271% applied to the stated value ofthe stock purchase contracts of $500 million. This commitment expires when the stock purchase contracts are exercisedwhich is expected to be December 10, 2012, but could be earlier or later based on certain conditions.
In January 2008, in conjunction with the issuance of convertible senior notes, the Corporation entered into a hedgetransaction designed to reduce the potential dilutive impact of issuing common shares upon conversion of these notes.Pursuant to this contract, the Corporation has entered into a call option to purchase National City common shares fromthe hedge counterparty. The number of shares to be delivered, the strike price, and the settlement dates all correspondwith conversion terms of the convertible senior notes. The maximum number of common shares that could bepurchased under this contract is 76 million, subject to adjustment in the same manner as the conversion rate associatedwith the convertible notes. This contract will be physically settled by the counterparty delivering shares and theCorporation delivering cash. It expires upon the earlier of the last day that the convertible senior notes are outstanding,or three days prior to the maturity of these notes. At the same time, the Corporation entered into a warrant to sell upto 76 million shares of its common stock to a counterparty.
Contingent Liabilities and Guarantees: The Corporation has entered into agreements to sell residential mortgageloans and home equity lines of credit (collectively, loans) in the normal course of business. These agreements usuallyrequire certain representations concerning credit information, loan documentation, collateral, and insurability. On aregular basis, investors request the Corporation to indemnify them against losses on certain loans or to repurchaseloans which the investors believe do not comply with applicable representations. Upon completion of its owninvestigation, the Corporation generally repurchases or provides indemnification on such loans. Indemnification requestsare generally received within two years subsequent to the date of sale.
Management maintains a liability for estimated losses on loans expected to be repurchased or on which indemnificationis expected to be provided and regularly evaluates the adequacy of this recourse liability based on trends in repurchaseand indemnification requests, actual loss experience, known and inherent risks in the loans, and current economicconditions. In connection with the sale of the First Franklin origination and sales platform, the Corporation transferredits recourse obligation associated with this unit to the buyer. At December 31, 2007 and 2006, the liability forestimated losses on repurchase and indemnification was $212 million and $171 million, respectively, and was includedin other liabilities on the balance sheet. Further details on loans sold subject to indemnification provisions, loansrepurchased or indemnified, and losses charged against the liability follow:
(In Millions) 2007 2006(a) 2005(b)For the Calendar Year
Total loans sold $47,524 $70,897 $72,134Total loans repurchased or indemnified 563 479 331Losses incurred 140 115 90
(a) Included $25.6 billion of loans sold, $260 million of loans repurchased or indemnified, and $59 million of lossesincurred related to the First Franklin unit.
(b) Included $20.8 billion of loans sold, $61 million of loans repurchased or indemnified, and $29 million of lossesincurred related to the First Franklin unit.
At December 31, 2007, the outstanding balances of residential real estate loans sold that the Corporation hasindemnified or remain uninsured totaled $563 million and $72 million, respectively. The volume and balance ofuninsured government loans may be affected by processing or notification delays. Management believes the majority ofthe uninsured loans will become insured during the normal course of business. To the extent insurance is not obtained,the loans may be subject to repurchase. Uninsured government loans which were ultimately repurchased have beenincluded in the repurchase totals above.
On December 30, 2006, the Corporation completed the sale of the First Franklin nonprime mortgage origination andservicing platform. The proceeds received from this transaction were based on a preliminary statement of net assets
113

sold. The purchase price is subject to adjustment based on the closing date values of net assets sold, as well as othernegotiated matters. Accordingly, the Corporation may either pay or receive additional consideration depending on thefinal outcome of this matter. The amount of the purchase price adjustment, if any, will decrease or increase the gainrecognized on the sale of this unit. On April 13, 2007, the Corporation received a dispute notice from Merrill LynchBank & Trust Co., FSB, the buyer of First Franklin, which asserted that the closing date net asset values and relatedpurchase price were overstated by $67 million. National City management does not agree with that assertion. If theparties cannot reach agreement on this dispute, this matter would be subject to arbitration.
The Corporation has a wholly owned captive insurance subsidiary which provides reinsurance to third-party insurerswho provide lender paid mortgage insurance on approximately $1.4 billion of the Corporation’s nonprime secondmortgage loans and lines. These arrangements are quota share reinsurance contracts whereby the captive insurancesubsidiary is entitled to 50% of the primary policy premiums and assumes 50% of the risk of loss under the lender-paidmortgage insurance primary policy, which limits losses to 10% of the original insured risk per policy year. Loss reservesare provided for the estimated costs of settling reinsurance claims on defaulted loans. Loss reserves are established forreported claims as well as incurred but not reported claims. Management establishes loss reserves using historicalexperience and by making various assumptions and estimates of trends in loss severity, frequency, and other factors.The methods used to develop these reserves are subject to continual review and refinement, and any adjustments tothese reserves are reflected in current period operations as identified. As of December 31, 2007 and 2006, reinsuranceloss reserves of $21 million and $60 million, respectively, were included within the allowance for loan losses. Theprovision for reinsurance losses of $48 million in 2007 and $79 million in 2006 is included in the provision for loanlosses in the Consolidated Financial Statements. In segment reporting, the provision for reinsurance losses is includedwithin Retail Banking’s results as noninterest expense. As of December 31, 2007, the Corporation had no remainingexposure to additional reinsurance losses related to nonprime second mortgage loans and lines as the policy limit hasbeen reached.
Red Mortgage Capital, a wholly owned subsidiary, is an approved Fannie Mae Delegated Underwriting and Servicing(DUS) mortgage lender. Under the Fannie Mae DUS program, Red Mortgage Capital underwrites, funds, and sellsmortgage loans on multifamily rental projects. Red Mortgage Capital then services these mortgage loans on FannieMae’s behalf. Participation in the Fannie Mae DUS program requires Red Mortgage Capital to share the risk of loanlosses with Fannie Mae. Under the loss-sharing arrangement, Red Mortgage Capital and Fannie Mae split losses withone-third assumed by Red Mortgage Capital and two-thirds assumed by Fannie Mae. The Corporation provides aguarantee to Fannie Mae that it would fulfill all payments required of Red Mortgage Capital under the loss sharingarrangement if Red Mortgage Capital fails to meet its obligations. The maximum potential amount of undiscountedfuture payments that may be required under this program is equal to approximately one-third of the principal balanceof the loans outstanding at December 31, 2007. If payment is required under this program, Red Mortgage Capitalwould have an interest in the collateral underlying the commercial mortgage loan on which the loss occurred. As ofDecember 31, 2007 and 2006, Red Mortgage Capital serviced loans, subject to risk sharing under the DUS program,had outstanding principal balances aggregating $5.2 billion and $4.9 billion, respectively. This guarantee will continueuntil such time as the loss sharing agreement is amended or Red Mortgage Capital no longer shares the risk of losseswith Fannie Mae. The fair value of the guarantee, in the form of reserves for losses under the Fannie Mae DUSprogram, is recorded in accrued expenses and other liabilities on the balance sheet and totaled $5 million at bothDecember 31, 2007 and 2006.
The guarantee liability for standby letters of credit was $34 million and $39 million at December 31, 2007 and 2006,respectively. This liability was recorded in other liabilities on the balance sheet. See above for further discussion onstandby letters of credit and their associated outstanding commitments.
The Corporation is subject to nonincome taxes in the various jurisdictions where it does business. The most significantof these taxes is franchise tax which is assessed by some states in lieu of or in addition to income taxes. The amount oftax due may be subject to different interpretations by the Corporation and the taxing authorities. In preparing theCorporation’s tax returns, management attempts to make reasonable interpretations of the tax laws; however, itspositions may be subject to challenge upon audit. Management accrues for nonincome tax contingencies that arejudged to be both probable and estimable. Management has also identified other unaccrued nonincome tax
114

contingencies, which are considered reasonably possible but not probable, totaling approximately $38 millionas of December 31, 2007.
The Corporation is a member of the Visa USA network. On October 3, 2007, the Visa organization completed a seriesof restructuring transactions to combine its affiliated operating companies, including Visa USA, under a single holdingcompany, Visa, Inc. As a result of Visa’s restructuring, the Corporation’s membership interest in Visa USA wasexchanged for an approximately 8% equity interest in Visa Inc. Class USA stock. On November 11, 2007, Visa Inc. fileda registration statement with the Securities and Exchange Commission for the offer and sale of its common stock tothe public. Visa has disclosed that it plans to use the proceeds from its initial public offering to partially redeem VisaUSA members’ equity interests and to fund the settlement of certain Visa USA related litigation.
Pursuant to the Visa USA bylaws, the Corporation is obligated to indemnify Visa, Inc. for certain losses. On October 3,2007, a Loss Sharing Agreement (LSA) became effective which reaffirmed the Corporation’s obligation to indemnifyVisa, Inc. for potential future settlement of certain litigation. The Corporation’s indemnification obligation is limited toits 8% proportionate equity interest in Visa USA. During 2007, Visa announced that it had recognized liabilities forprobable settlements for two of the covered suits. The Corporation has accrued its proportionate share of theseanticipated settlements. In addition, the Corporation has recognized a guarantee liability for the other covered suits.The guarantee liability was measured using a probability weighted cash flow model of the potential outcomes of thecovered suits. As of December 31, 2007, the Corporation’s estimated liability related to its obligation to indemnify Visafor covered litigation was $292 million.
If the Visa initial public offering is successfully completed, the Corporation is expected to receive cash in partialredemption of its equity interest currently carried at zero value. Further, management expects that the indemnificationobligation to Visa will be reduced when Visa either disburses funds for negotiated settlements, or funds an escrowaccount designated for settlement of covered litigation. Management expects that the gain to be realized fromredemption of Visa shares will more than exceed the indemnification obligations recorded to date.
NatCity Investments, a wholly-owned broker-dealer subsidiary of the Corporation, acts as underwriter and remarketingagent for certain issuers of variable rate demand obligations (VRDOs). These VRDOs are issued with long statedmaturities but are considered short-term instruments because of a “put” feature that allows the investor to tender thebonds to the remarketing agent. The bonds are traded at par and the yields on the bonds are generally reset on aweekly basis. The VRDOs are supported by various credit and liquidity enhancements, including letters of credit (LOCs),standby bond purchase agreements (SBPAs), and bond insurance. As a result of increased uncertainty in the markets,investors becoming more risk averse, and actual or potential downgrading in ratings for both bond insurers andproviders of LOCs and SBPAs, remarketing agents are experiencing less liquidity in the VRDO market. If NatCityInvestments is unable to successfully remarket the securities, it has the option of holding the bonds on its balance sheetor putting the bonds to the issuer who would then draw upon the LOCs and SBPAs. At December 31, 2007, NatCityInvestments was remarketing agent for approximately $3 billion of VRDOs, of which approximately $2 billion werebacked by National City Bank credit and liquidity enhancements.
Litigation: National City and its subsidiaries are involved in a number of legal proceedings arising from the conduct oftheir business activities. These proceedings include claims brought against the Corporation and its subsidiaries whereNational City acted as depository bank, lender, underwriter, fiduciary, financial advisor, broker, or other businessactivities. Reserves are established for legal claims when losses associated with the claims are judged to be probable,and the loss can be reasonably estimated. In many lawsuits and arbitrations, including almost all of the class actionlawsuits, it is not possible to determine whether a liability has been incurred or to estimate the ultimate or minimumamount of that liability until the case is close to resolution, in which case a reserve will not be recognized until thattime.
On or about November 22, 2002, a claim was asserted in the Marion County Probate Court (Indiana) against NationalCity Bank of Indiana, a subsidiary of the Corporation since merged into National City Bank, concerning management ofinvestments held in a trust for the benefit of the Americans for the Arts and The Poetry Foundation. The claim allegedfailure to adequately and timely diversify investments held in this trust, which resulted in investment losses. Thebeneficiaries were seeking damages of as much as $100 million. In December 2005, the court entered an order
115

granting National City Bank of Indiana’s motion for summary judgment, and the beneficiaries filed an appeal. OnOctober 19, 2006, the Indiana Court of Appeals, in a unanimous decision, affirmed the order granting National CityBank of Indiana’s motion for summary judgment. By order dated March 8, 2007, the Indiana Supreme Courtunanimously denied the beneficiaries’ motion to transfer the appeal to the Indiana Supreme Court. The beneficiarieshave no further appeals as a matter of right.
Beginning on June 22, 2005, a series of antitrust class action lawsuits were filed against Visa», MasterCard», andseveral major financial institutions, including eight cases naming the Corporation and its subsidiary, National City Bankof Kentucky, since merged into National City Bank. The plaintiffs, merchants operating commercial businessesthroughout the U.S. and trade associations, claim that the interchange fees charged by card-issuing banks areunreasonable and seek injunctive relief and unspecified damages. The cases have been consolidated for pretrialproceedings in the United States District Court for the Eastern District of New York. On July 1, 2007, the Corporationand National City Bank entered into a Judgment Sharing Agreement (JSA) with respect to this litigation. This litigation isalso subject to the Visa USA bylaws and the LSA discussed above. On September 7, 2007, the Magistrate Judgerecommended to the District Court that all claims that predate January 1, 2004 should be dismissed. Given thepreliminary stage of the remaining suits, it is not possible for management to assess the probability of a materialadverse outcome, or reasonably estimate the amount of potential loss.
On March 31, 2006, the Corporation and National City Bank were served with a patent infringement lawsuit filed inthe United States District Court for the Eastern District of Texas. The plaintiff, Data Treasury Corporation, claims thatthe Corporation, as well as over 50 other financial institutions or check processors, infringed on its patents involvingcheck imaging, storage and transfer. The plaintiff seeks damages and injunctive relief. On January 6, 2006, the USPatent and Trademark Office (USPTO) ordered a re-examination of certain of the patents (the Ballard Patents) and theCourt stayed the litigation as to those patents. Subsequently, the USPTO confirmed the patentability of all claims of theBallard patents under re-examination and the Plaintiff has now indicated its intention to ask the court to lift the stay.On or about July 27, 2007, the USPTO granted re-examination of the other patents in suit (the Huntington Patents) andthe Court stayed the litigation as to those patents. At this stage of this lawsuit, it is not possible for management toassess the probability of a material adverse outcome, or reasonably estimate the amount of potential loss.
On December 19, 2005, a class action suit was filed against National City Mortgage Co. in the U.S. District Court forthe Southern District of Illinois. The lawsuit alleges that National City Mortgage loan originators were improperlydesignated as exempt employees and seeks monetary damages. On June 21, 2007, the court conditionally certified anopt-in class of loan originators. On November 6, 2007, a settlement in principle was reached to resolve all wage andhour claims of the loan originators employed during the class period that opt-in to the settlement class. This settlementis subject to court approval. At December 31, 2007, the Corporation has a $25 million reserve accrued for this matter.
On January 10 and January 17, 2008, two putative class action lawsuits were filed in the United States District Courtfor the Northern District of Ohio against National City Corporation, the Administrative Committee for the National CitySavings and Investment Plan and certain current and former officers and directors of the Corporation. The complaintsallege violations of the Employee Retirement Income Security Act (ERISA) relating to the Corporation’s stock beingoffered as an investment alternative for participants in the Plan. The complaints seek unspecified money damages andequitable relief. At this stage of these lawsuits, it is not possible for management to assess the probability of a materialadverse outcome, or reasonably estimate the amount of any potential loss.
On January 18 and January 28, 2008, two shareholder derivative complaints were filed in the United States DistrictCourt for the Northern District of Ohio against certain current and former officers and directors of the Corporationalleging breach of fiduciary duty, waste of corporate assets, unjust enrichment and violations of the Securities ExchangeAct of 1934. On February 6, 2008, two shareholder derivative actions were filed in Chancery Court for the state ofDelaware against certain current and former officers and directors of the Corporation alleging breach of fiduciary dutyand unjust enrichment. On February 11, 2008, a shareholder derivative action was filed in Common Pleas Court inCuyahoga County, Ohio against certain current and former officers and directors of the Corporation alleging breach offiduciary duty and unjust enrichment. All of these shareholder derivative lawsuits make substantially identical allegationsagainst substantially identical parties. The complaints seek unspecified money damages and equitable relief. At thisstage of these lawsuits, it is not possible for management to assess the probability of a material adverse outcome, orreasonably estimate the amount of potential loss.
116

On January 24, 2008, a putative class action lawsuit was filed in the United States District Court for the NorthernDistrict of Ohio against National City Corporation and certain current and former officers and directors of theCorporation. The complaint alleges violations of federal securities laws and seeks unspecified damages and equitablerelief on behalf of purchasers of the Corporation’s stock during the period April 30, 2007 to January 2, 2008. At thisstage of the lawsuit, it is not possible for management to assess the probability of a material adverse outcome, orreasonably estimate the amount of any potential loss.
Based on information currently available, consultation with counsel, available insurance coverage and establishedreserves, management believes that the eventual outcome of all claims against the Corporation and its subsidiaries willnot, individually or in the aggregate, have a material adverse effect on consolidated financial position or results ofoperations. However, it is possible that the ultimate resolution of these matters, if unfavorable, may be material to theresults of operations for a particular period.
23. Stock Options and AwardsUnder the National City Corporation Long-Term Cash and Equity Incentive Plan (the Long-Term Incentive Plan) up to45 million shares of National City common stock may be made the subject of option rights, stock appreciation rights,restricted awards, common stock awards, or restricted stock units, in the aggregate. In addition, no more than13 million shares may be awarded in the form of restricted stock, restricted stock units, or common stock awards; andno more than 40 million shares may be awarded in the form of incentive stock options. As of December 31, 2007,stock options and restricted stock awards available for grant under the Long-Term Incentive Plan totaled 16.8 millionand 4.2 million shares, respectively.
Stock Options: Stock options may be granted to officers and key employees to purchase shares of common stock atthe market price of the common stock on the date of grant. These options generally become exercisable to the extentof 25% to 50% annually, beginning one year from the date of grant, and expire no later than 10 years from the dateof grant. Prior to 2006, stock options were also granted that included the right to receive additional options if certaincriteria are met. The exercise price of an additional option is equal to the market price of the common stock on thedate the additional option is granted. Additional options vest six months from the date of grant and have a contractualterm equal to the remaining term of the original option. During 2007, 2006, and 2005, pretax compensation expenserecognized for stock options totaled $20 million, $23 million, and $20 million, respectively. The associated tax benefitwas $6 million, $7 million, and $6 million for 2007, 2006, and 2005, respectively.
The fair values of stock options were estimated at the date of grant using the Black-Scholes option pricing model. TheBlack-Scholes model was originally developed for use in estimating the fair value of traded options, which havedifferent characteristics from the Corporation’s employee stock options. The model is sensitive to changes inassumptions which can materially affect the fair value estimate. The Corporation’s method of estimating expectedvolatility includes both historical volatility and implied volatility based upon National City options traded in the openmarket. The expected dividend yield is estimated based on the expected dividend rate over the term of the options. Theexpected term of the options is based on the Corporation’s historical exercise experience, and the risk-free interest rateis based on U.S. Treasury zero-coupon issues with a remaining term approximating the expected life of the options. Thefollowing assumptions were used to determine the fair value of options granted in the periods stated below.
2007 2006 2005For the Calendar Year
Expected volatility 24.0% 19.8% 20.3%Expected dividend yield 4.0 4.3 4.2Risk-free interest rate 4.1 4.0 3.9Expected term (in years) 6 6 6
The weighted-average grant date fair value per share of options granted during 2007, 2006, and 2005, was $3.92,$5.21, and $5.12, respectively. The total intrinsic value of options exercised during 2007, 2006, and 2005, was$73 million, $80 million, and $68 million, respectively. As of December 31, 2007, there was $38 million of totalunrecognized compensation cost related to nonvested stock option awards. This cost is expected to be recognized overa period of four years.
117

In 2007 and 2006, upon the consummation of the Mid America and Harbor acquisitions, all outstanding options issuedby these entities became fully vested and were converted into equivalent National City options.
Cash received from the exercise of options for 2007, 2006, and 2005, was $161 million, $206 million, and$154 million, respectively. The tax benefit realized for the tax deductions from option exercises totaled $23 million,$25 million, and $19 million for 2007, 2006, and 2005, respectively. The Corporation generally uses treasury shares tosatisfy stock option exercises.
Stock option activity follows:
Shares
Weighted-AverageExercise
Price
Weighted-Average
RemainingContractual
Term(in years)
AggregateIntrinsic Value(In thousands)
Outstanding at January 1, 2007 43,014,406 $31.36Acquisition 5,303,419 17.29Granted 7,635,514 22.02Exercised (7,858,192) 26.47Forfeited or expired (1,902,046) 34.49Outstanding at December 31, 2007 46,193,101 $28.90 4.9 $ 3,988
Exercisable at December 31, 2007 36,093,243 $29.90 3.8 $ 3,988
Outstanding at January 1, 2006 50,135,498 $30.72Acquisition 738,314 14.37Granted 2,625,784 36.58Exercised (9,576,897) 27.76Forfeited or expired (908,293) 35.17
Outstanding at December 31, 2006 43,014,406 $31.36 4.7 $227,298
Exercisable at December 31, 2006 36,402,595 $30.59 4.1 $220,992
Outstanding at January 1, 2005 54,700,740 $29.83Granted 2,914,859 35.30Exercised (6,553,014) 24.95Forfeited or expired (927,087) 33.48
Outstanding at December 31, 2005 50,135,498 $30.72 5.1 $174,941
Exercisable at December 31, 2005 41,662,765 $29.83 4.3 $174,916
Restricted Shares: Restricted common shares may currently be awarded to officers, key employees, and outsidedirectors. In general, restrictions on outside directors’ shares expire after nine months, and restrictions on sharesgranted to key employees and officers expire within a four-year period. The Corporation recognizes compensationexpense over the restricted period. Pretax compensation expense recognized for restricted shares during 2007, 2006and 2005 totaled $57 million, $46 million, and $38 million, respectively. The tax benefit was $21 million, $17 million,and $14 million in 2007, 2006 and 2005, respectively
118

Restricted share activity follows:
Shares
Weighted-Average
Grant DateFair Value Shares
Weighted-Average
Grant DateFair Value Shares
Weighted-Average
Grant DateFair Value
2007 2006 2005
Nonvested at January 1 7,344,918 $34.96 6,452,193 $33.74 4,838,125 $33.10Granted 2,879,400 22.77 2,496,784 36.50 2,626,357 34.79Vested (1,426,695) 33.17 (1,033,190) 31.47 (682,971) 32.43Forfeited (461,473) 34.96 (570,869) 34.29 (329,318) 33.80Nonvested at December 31 8,336,150 $31.03 7,344,918 $34.96 6,452,193 $33.74
As of December 31, 2007, there was $104 million of total unrecognized compensation cost related to restricted shares.This cost is expected to be recognized over a weighted-average period of 2.6 years. The total fair value of shares vestedduring 2007, 2006, and 2005 was $42 million, $37 million, and $24 million, respectively.
24. Pension and Other Postretirement Benefit Plans
Defined Benefit Plans: National City has a qualified pension plan covering substantially all employees hired prior toApril 1, 2006. Pension benefits are derived from a cash balance formula, whereby credits based on salary, age, andyears of service are allocated to employee accounts. As required by the Pension Protection Act, National City hasamended the plan to change the plan’s vesting requirements from five years to three years. Actuarially determinedpension costs are charged to benefits expense in the income statement. The Corporation’s funding policy is tocontribute at least the minimum amount required by the Employee Retirement Income Security Act of 1974.
The Corporation maintains nonqualified supplemental retirement plans for certain key employees. All benefits providedunder these plans are unfunded, and payments to plan participants are made by the Corporation.
In connection with the Harbor acquisition, the Corporation acquired a frozen multi-employer pension plan. This planwas terminated in June 2007 at a cost of $7 million. In connection with the Fidelity acquisition, the Corporationacquired a frozen qualified defined benefit pension plan. There were no contributions to this plan for the year endedDecember 31, 2007.
National City also has a benefit plan offering postretirement medical and life insurance benefits. The medical portion ofthe plan is contributory and the life insurance coverage is noncontributory to the participants. As of April 1, 2006,retiree life insurance was eliminated for active employees who were not yet participants in the plan. As a result, thepostretirement obligation decreased by $10 million and the net periodic cost decreased by $7 million for 2006. TheCorporation has no plan assets attributable to the plan, and funds the benefits as claims arise. Benefit costs related tothis plan are recognized in the periods employees provide service for such benefits. The Corporation reserves the rightto terminate or make plan changes at any time.
The asset allocation for the defined benefit pension plan as of the measurement date, by asset category, is as follows:
Asset Category 2007 2006Percentage of Plan Assets
Equity securities 80% 81%Debt securities 9 9Cash and cash equivalents 11 10
Total 100% 100%
The investment objective for the qualified pension plan is to maximize total return with tolerance for slightly aboveaverage risk. Asset allocation strongly favors equities, with a target allocation of approximately 80% equity securities,
119

15% fixed income securities, and 5% cash. Due to volatility in the market, the target allocation is not always desirableand asset allocations will fluctuate. A core equity position of large cap stocks will be maintained. However, moreaggressive or volatile sectors will be meaningfully represented in the asset mix in pursuit of higher returns. Highervolatility investment strategies such as credit risk, structured finance, and international bonds will be appropriatestrategies in conjunction with the core position.
It is management’s intent to give the investment managers flexibility within the overall guidelines with respect toinvestment decisions and their timing. However, certain investments require specific review and approval bymanagement. Management is also informed of anticipated changes in nonproprietary investment managers, significantmodifications of any previously approved investment, or anticipated use of derivatives to execute investment strategies.
Equity securities include $122 million and $188 million of National City common stock at October 31, 2007 and 2006,respectively. The $122 million of National City common stock included in plan assets at October 31, 2007 represented5,048,833 shares of stock at a closing price of $24.25 as of that date. During 2007, dividends of $8 million were paidon the shares included in plan assets.
Using an actuarial measurement date of October 31 for Pension and Other Postretirement Benefits and an actuarialmeasurement date of December 31 for Supplemental Pension Benefits, benefit obligation activity and plan assets foreach of the plans follows:
(In Thousands) 2007 2006 2007 2006 2007 2006
PensionBenefits
SupplementalPension Benefits
OtherPostretirement
Benefits
Change in Benefit ObligationBenefit obligation at beginning of measurement
period $1,644,764 $1,544,144 $ 136,454 $ 134,568 $ 144,585 $ 159,232Service cost 59,554 58,127 1,872 1,590 1,520 1,776Interest cost 97,718 89,437 9,060 7,856 8,355 8,523Participant contributions — — — — 2,804 15,986Plan amendments 3,751 — — — 184 (9,743)Acquisitions 24,765 — 56,287 — 468 —Actuarial (gains) losses (46,609) 29,174 (287) 2,437 (14,347) (7,431)Benefits paid (89,207) (76,118) (58,532) (9,997) (11,330) (23,758)Benefit obligation at end of measurement
period $1,694,736 $1,644,764 $ 144,854 $ 136,454 $ 132,239 $ 144,585Change in Fair Value of
Plan AssetsFair value at beginning of measurement period $1,881,470 $1,725,560 $ — $ — $ — $ —Actual return on plan assets 224,338 235,301 — — — —
Employer contribution — — 58,532 9,997 8,526 7,772Participant contributions — — — — 2,804 15,986Expenses paid (5,234) (3,273) — — — —Acquisitions 31,598 — — — — —Benefits paid (89,207) (76,118) (58,532) (9,997) (11,330) (23,758)
Fair value at end of measurement period $2,042,965 $1,881,470 $ — $ — $ — $ —Funded status at end of measurement
period $ 348,229 $ 236,706 $(144,854) $(136,454) $(132,239) $(144,585)
120

Reconciliation of the funded status at the end of the measurement period to the amounts recognized in the statementof financial position as of December 31 follows:
(In Thousands) 2007 2006 2007 2006 2007 2006
PensionBenefits
SupplementalPension Benefits
OtherPostretirement Benefits
Funded status at end of measurementperiod $348,229 $236,706 $(144,854) $(136,454) $(132,239) $(144,585)
Unrecognized costs (4,755) — 4,151 — — —Benefits paid — — (703) 2,051 1,445 1,588Acquisition (9,741) — (2,236) (1,908) — (573)Accrued income and other assets/
(accrued expenses and otherliabilities) at year end $333,733 $236,706 $(143,642) $(136,311) $(130,794) $(143,570)
The accumulated benefit obligation for the qualified pension plan was $1.7 billion and $1.6 billion at October 31, 2007and 2006, respectively.
The weighted-average assumptions used to determine benefit obligations at the measurement date were as follows:
2007 2006 2007 2006 2007 2006Pension Benefits
SupplementalPension Benefits
Other PostretirementBenefits
Discount rate 6.25% 6.00% 6.25% 6.00% 6.25% 6.00%Rate of compensation increase 2.75–7.50 2.75–7.50 5.00 5.00 2.75–7.50 2.75–7.50
The assumed healthcare cost trend rate, used in determining other postretirement benefits, at the measurement datefollows:
2007 2006Health care cost trend rate for next year 9% 10%Rate to which the cost trend rate is assumed to decline (ultimate trend rate) 4 5Year the rates reach the ultimate trend rate 2012 2012
The healthcare trend rate assumption affects only those participants retired under the plan prior to April 1, 1989.
Assumed healthcare cost trend rates affect the amounts reported for the healthcare plan. A one-percentage-pointchange in the assumed healthcare cost trend rate would have the following effect.
(In Thousands) 1-Percentage Point Increase 1-Percentage Point DecreaseEffect on total of service and interest cost $ 235 $ (205)Effect on postretirement benefit obligation 3,390 (2,961)
121

Using an actuarial measurement date of October 31 for Pension and Other Postretirement Benefits and a measurementdate of December 31 for Supplemental Pension Benefits, components of net periodic (income) cost follow:
(In Thousands) 2007 2006 2005
Pension BenefitsService cost $ 59,554 $ 58,127 $ 59,540Interest cost 97,718 89,437 85,171Expected return on plan assets (154,879) (138,728) (137,991)Amortization of prior service cost (4,755) (4,755) (4,755)Recognized net actuarial loss (209) 456 739
Net periodic (income) cost $ (2,571) $ 4,537 $ 2,704
Supplemental Pension BenefitsService cost $ 1,872 $ 1,590 $ 1,427Interest cost 9,060 7,856 7,841Amortization of prior service cost 977 1,330 1,984Recognized net actuarial loss 8,582 3,587 4,902
Net periodic cost $ 20,491 $ 14,363 $ 16,154
Other Postretirement BenefitsService cost $ 1,520 $ 1,776 $ 3,384Interest cost 8,355 8,523 8,931Amortization of prior service cost 159 188 95Transition obligation 808 907 1,402Recognized net actuarial loss 276 573 979Curtailment gain — (5,194) —
Net periodic cost $ 11,118 $ 6,773 $ 14,791
The weighted-average assumptions used to determine net periodic (income) cost for the years ended December 31were as follows:
2007 2006 2007 2006 2007 2006
PensionBenefits
SupplementalPension Benefits
OtherPostretirement Benefits
Weighted-Average AssumptionsDiscount rate 6.00% 6.00% 6.00% 6.00% 6.00% 6.00%Rate of compensation increase 2.75-7.50 2.75-7.50 5.00 5.00 2.75-7.50 2.75-7.50Expected long-term return on plan assets 8.50 8.50 — — — —
The expected long-term rate of return was estimated using market benchmarks for equities and bonds applied to theplan’s target asset allocation. The expected return on equities was computed utilizing a valuation framework, whichprojected future returns based on current equity valuations rather than historical returns. Due to active management ofthe plan’s assets, the return on the plan’s equity investments historically has exceeded market averages. Managementestimated the rate by which the plan assets would outperform the market in the future based on historical experienceadjusted for changes in asset allocation and expectations for overall lower future returns on equities compared topast periods.
National City does not anticipate making a contribution to its qualified pension plan in 2008 as the plan is currentlyoverfunded. The 2008 pension plan assumptions used to determine net periodic cost will be a discount rate of 6.25%and an expected long-term return on plan assets of 8.50%.
122

At December 31, 2007, the projected benefit payments for each of the plans are as follows:
(In Millions)PensionBenefits
SupplementalPension Benefits
OtherPostretirement
BenefitsTotal
Benefits2008 $ 85 $21 $10 $1162009 89 14 10 1132010 91 14 11 1162011 94 13 11 1182012 100 13 11 1242013 – 2017 574 59 55 688
The projected payments were calculated using the same assumptions as those used to calculate the benefit obligationslisted above.
Amounts recognized in accumulated other comprehensive income, net of tax, as of December 31, 2007 follow:
(In Thousands)PensionBenefits
SupplementalPension Benefits
PostretirementBenefits Total
Prior service cost $ (5,208) $ 958 $ 903 $(3,347)Transition obligation — — 1,614 1,614Net loss (18,922) 13,642 (126) (5,406)
Total $(24,130) $14,600 $2,391 $(7,139)
Amounts recognized in accumulated other comprehensive loss, net of tax, as of December 31, 2006 follow:
(In Thousands)PensionBenefits
SupplementalPension Benefits
PostretirementBenefits Total
Prior service cost $(13,590) $ 2,195 $ 889 $(10,506)Transition obligation — — 2,128 2,128Net loss 50,773 19,955 8,997 79,725
Total $ 37,183 $22,150 $12,014 $ 71,347
The estimated costs that will be amortized from accumulated other comprehensive (income) loss into net periodic(income) cost over the next fiscal year are as follows:
(In Thousands)PensionBenefits
SupplementalPension Benefits
PostretirementBenefits Total
Prior service cost $(3,698) $ 965 $ 227 $(2,506)Transition obligation — — 808 808Net loss — 1,932 — 1,932
Total $(3,698) $2,897 $1,035 $ 234
Defined Contribution Plans: Substantially all employees are eligible to contribute a portion of their pretaxcompensation to a defined contribution plan. The Corporation may make contributions to the plan for employees withone or more years of service in the form of National City common stock in varying amounts depending on participantcontribution levels. In 2007 and 2006, the Corporation provided up to a 6.9% matching contribution. For both yearsended 2007 and 2006 the expense related to the plan was $84 million. For the year ended 2005 the expense was$79 million.
The Corporation also acquired Harbor’s leveraged employee stock ownership plan (ESOP) plan, which covered alleligible Harbor employees age 21 and over. Dividends paid on unallocated shares reduce the Corporation’s cashcontribution to the ESOP. The ESOP’s loan from the Corporation is eliminated in consolidation. For years ended 2007and 2006, allocated shares were 942,201 and 1,134,686, respectively, shares committed to be released were 85,245,and suspense (unallocated and not yet committed to be released) shares held by the ESOP were 852,455 and 937,700,
123

respectively. As shares are released, the Corporation recognizes compensation expense equal to the current marketprice of the shares. Allocated shares and shares committed to be released are included in the weighted-averagecommon shares outstanding used to compute earnings per share. In 2007 and 2006, the Corporation recordedcompensation expense of approximately $3 million and $.3 million, respectively. For years ended 2007 and 2006, thefair value of the unallocated shares was $14 million and $34 million, respectively.
25. Derivative Instruments and Hedging Activities
The Corporation uses derivative instruments primarily to protect against the risk of adverse price or interest-ratemovements on the value of certain assets and liabilities and on future cash flows. It also executes derivative instrumentswith its commercial banking customers to facilitate their risk management strategies. Derivative instruments representcontracts between parties that usually require little or no initial net investment and result in one party delivering cash oranother type of asset to the other party based on a notional amount and an underlying as specified in the contract. Anotional amount represents the number of units of a specific item, such as currency units or shares. An underlyingrepresents a variable, such as an interest rate, security price, or price index. The amount of cash or other asset deliveredfrom one party to the other is determined based on the interaction of the notional amount of the contract with theunderlying. Derivatives are also implicit in certain contracts and commitments, such as residential and commercial realestate loan commitments associated with loans to be sold, which by definition qualify as derivative instruments underSFAS 133.
Market risk is the risk of loss arising from an adverse change in interest rates, exchange rates, or equity prices. TheCorporation’s primary market risk is interest-rate risk. Management uses derivative instruments to protect against therisk of interest-rate movements on the value of certain assets and liabilities and on future cash flows. These instrumentsinclude interest-rate swaps, interest-rate futures, interest-rate options, forward agreements, and interest-rate caps andfloors with indices that relate to the pricing of specific assets and liabilities. The nature and volume of the derivativeinstruments used to manage interest-rate risk depend on the level and type of assets and liabilities on the balance sheetand the risk management strategies for the current and anticipated rate environments.
As with any financial instrument, derivative instruments have inherent risks, primarily market and credit risk. Market riskassociated with changes in interest rates is managed in conjunction with the Corporation’s overall market riskmonitoring process, as further discussed in the Market Risk section within Item 7.
Credit risk occurs when a counterparty to a derivative contract, where the Corporation has an unrealized gain, fails toperform according to the terms of the agreement. Credit risk is managed by limiting the aggregate amount of netunrealized gains in agreements outstanding, monitoring the size and the maturity structure of the derivative portfolio,applying uniform credit standards to all activities with credit risk, and collateralizing gains. The Corporation hasestablished bilateral collateral agreements with its major derivative dealer counterparties that provide for exchanges ofmarketable securities or cash to collateralize either party’s net gains. At December 31, 2007, these collateralagreements covered 99.5% of the notional amount of the total derivative portfolio, excluding futures contracts that arecash settled daily with counterparties, certain forward commitments to sell or purchase mortgage loans or mortgage-backed securities, and customer derivative contracts. At December 31, 2007, the Corporation held cash,U.S. government, and U.S. government-sponsored agency securities with a fair value of $452 million to collateralize netgains with counterparties and had pledged or delivered to counterparties cash, U.S. government, and U.S. government-sponsored agency securities with a fair value of $161 million to collateralize net losses with counterparties. In certaininstances, open forward commitments to sell or purchase mortgage loans or mortgage-backed securities are notcovered by collateral agreements due to the fact these contracts usually mature within 90 days. The credit riskassociated with derivative instruments executed with the Corporation’s commercial banking customers is essentially thesame as that involved in extending loans and is subject to similar credit policies. Collateral may be obtained based onmanagement’s assessment of the customer.
Derivative contracts are valued using observable market prices, when available. In the absence of observable marketprices, the Corporation uses discounted cash flow models to estimate the fair value of its derivatives. The interest ratesused in these cash flow models are based on forward yield curves that are observable in the current cash andderivatives markets, consistent with how derivatives are valued by market participants. Cash flow models used for
124

valuing derivative instruments are regularly validated by testing through comparison with other third parties. Theestimated fair value of a mortgage banking loan commitment is based on the change in estimated fair value of theunderlying mortgage loan and the probability that the mortgage loan will fund within the terms of the loancommitment. The change in fair value of the underlying mortgage loan is based on quoted mortgage-backed securitiesprices. The probability that the loan will fund is derived from the Corporation’s own historical empirical data. Thechange in value of the underlying mortgage loan is measured from the commitment date. At the time of issuance, theestimated fair value of the commitment is zero. The valuations presented in the following tables are based on yieldcurves, forward yield curves, and implied volatilities that were observable in the cash and derivatives markets onDecember 31, 2007 and 2006.
Fair Value Hedges: The Corporation primarily uses interest-rate swaps, interest-rate futures, interest-rate caps andfloors, interest-rate options, interest-rate forwards, and forward purchase and sales commitments to hedge the fairvalues of residential mortgage and commercial real estate loans held for sale and certain fixed-rate commercial portfolioloans for changes in interest rates. The Corporation also uses receive-fixed interest-rate swaps to hedge the fair value ofcertain fixed-rate funding products against changes in interest rates. The funding products hedged include purchasedcertificates of deposit, long-term FHLB advances, senior and subordinated long-term debt, and senior bank notes.
For fair value hedges of fixed-rate debt, including purchased certificates of deposit, management uses a monthly dollaroffset ratio to test retrospective effectiveness. For fair value hedges of portfolio loans and residential mortgage loansheld for sale, a dollar offset ratio test is performed on a daily basis. Effectiveness testing for commercial real estateloans held for sale is measured monthly using a dollar offset ratio. There were no components of derivative instrumentsthat were excluded from the assessment of hedge effectiveness.
For 2007, 2006 and 2005, the Corporation recognized total net ineffective fair value hedge gains of $3 million,$4 million, and $60 million, respectively. Details of net ineffective hedge gains and losses by hedge strategy arepresented in the table on page 128. Net ineffective hedge gains and losses on residential mortgage and commercialreal estate loans held for sale are included in loan sale revenue on the income statement. Net ineffective hedge gainsand losses related to hedging commercial portfolio loans and fixed-rate funding products are included in othernoninterest income on the income statement.
Cash Flow Hedges: The Corporation hedges cash flow variability related to variable-rate commercial loans and fundingproducts, specifically FHLB advances and senior bank notes. Interest-rate floors are used to hedge the cash flowsassociated with variable-rate commercial loans while interest-rate caps are used to hedge cash flows from thevariable-rate funding products.
Retrospective hedge effectiveness for cash flow hedges of variable-rate funding products is determined using a dollaroffset ratio applied on a monthly basis. Retrospective hedge effectiveness for variable-rate commercial loans isdetermined on a monthly basis using regression analysis. There were no components of derivative instruments thatwere excluded from the assessment of hedge effectiveness. For 2007, 2006 and 2005, the Corporation recognized netineffective cash flow hedge (losses) gains of $(65) thousand, $31 thousand, and $(342) thousand, respectively. Theselosses are included in other noninterest income on the income statement.
Derivative gains and losses reclassified from accumulated other comprehensive income to current period earnings areincluded in the line item in which the hedged cash flows are recorded. At December 31, 2007 and 2006, accumulatedother comprehensive income included a deferred after-tax net gain (loss) of $70 million and $(4) million, respectively,related to derivatives used to hedge loan and funding cash flows. See Note 19 for further detail of the amountsincluded in accumulated other comprehensive income. The net after-tax derivative gain included in accumulated othercomprehensive income at December 31, 2007 is projected to be reclassified into net interest income in conjunctionwith the recognition of interest payments on loan and funding products through August 2013, with $3 million ofafter-tax net loss expected to be recognized in net interest income within the next year. There were no gains or lossesreclassified into earnings in 2007 or 2006 arising from the determination that the original forecasted transaction wouldnot occur. In 2005, a pretax gain of $8 million was reclassified from other comprehensive income to noninterestexpense as a component of the net gain on the extinguishment of certain variable-rate debt secured by automobileleases.
125

The notional amounts of the derivatives portfolio used for interest-rate risk management purposes and designated asaccounting hedges under SFAS 133 follows:
(In Millions) 2007 2006December 31
Fair Value HedgesCommercial loans
Receive-fixed interest rate swaps $ 60 $ 112Pay-fixed interest rate swaps 2,318 2,712Interest rate caps sold 50 150Interest rate floors sold 100 100Interest rate collars purchased 5 5Interest rate futures purchased 1,587 2,204Interest rate futures sold 1,937 2,595
Total 6,057 7,878Mortgage loans held for sale
Net forward commitments to sell mortgage loans and mortgage-backed securities 1,283 1,855Receive-fixed interest rate swaps 400 1,775Receive-fixed interest rate swaptions purchased 600 —Pay-fixed interest rate swaps — 550Pay-fixed interest rate swaptions purchased 650 —Interest rate caps purchased — 500Interest rate floors purchased — 500
Total 2,933 5,180Commercial real estate loans held for sale
Forward commitments to sell commercial real estate loans 244 136Interest rate futures purchased 8 —Receive-fixed interest rate swaps 108 —
Total 360 136Funding
Receive-fixed interest rate swaps 4,116 7,991Callable receive-fixed interest rate swaps 3,154 2,706
Total 7,270 10,697Total notional of derivatives used in fair value hedges 16,620 23,891Cash Flow Hedges
Commercial loansInterest rate floors purchased 13,800 —
FundingPay-fixed interest rate swaps — 170Interest rate caps purchased 300 300
Total 300 470Total notional of derivatives used in cash flow hedges 14,100 470Total notional of derivatives designated in SFAS 133 relationships $30,720 $24,361
126

The fair value of derivative instruments used for interest-rate risk management purposes and designated as accountinghedges under SFAS 133 follows:
(In Millions) Asset Liability Asset Liability2007 2006
December 31
Fair Value HedgesCommercial loans
Receive-fixed interest rate swaps $ .7 $ — $ 1.0 $ .3Pay-fixed interest rate swaps 3.5 30.3 33.3 10.3Interest rate collars purchased — .3 — .2
Total 4.2 30.6 34.3 10.8Mortgage loans held for saleNet forward commitments to sell mortgage loans and mortgage-backed
securities .6 11.6 6.0 11.8Receive-fixed interest rate swaps 10.2 — 12.0 27.7Receive-fixed interest rate swaptions purchased 17.6 — — —Pay-fixed interest rate swaps — — — 6.8Pay-fixed interest rate swaptions purchased 2.6 — — —Interest rate floors purchased — — 1.8 —
Total 31.0 11.6 19.8 46.3Commercial real estate loans held for sale
Forward commitments to sell commercial real estate loans — 3.6 .2 1.3Receive-fixed interest rate swaps 1.5 5.8 — —
Total 1.5 9.4 .2 1.3Funding
Receive-fixed interest rate swaps 140.1 1.5 112.1 115.8Callable receive-fixed interest rate swaps .2 61.6 — 87.5
Total 140.3 63.1 112.1 203.3Total fair value of derivatives used in fair value hedges 177.0 114.7 166.4 261.7Cash Flow Hedges
Commercial loansInterest rate floors purchased 168.1 — — —
FundingPay-fixed interest rate swaps — — — .9Interest rate caps purchased — .7 .1 —
Total — .7 .1 .9Total fair value of derivatives used in cash flow hedges 168.1 .7 .1 .9Total fair value of derivatives designated in SFAS 133 relationships $345.1 $115.4 $166.5 $262.6
127

The net ineffective hedge gain (loss) recognized for each SFAS 133 hedge strategy follows:
(In Millions) 2007 2006 2005For the Calendar Year
Fair Value HedgesCommercial loans $(8.7) $ 6.2 $21.9Mortgage loans held for sale 9.0 (.6) 6.7Commercial real estate loans held for sale (.5) — —Mortgage servicing rights — — 30.5Commercial loans — — —Funding 3.0 (1.3) .5Total fair value hedge gain 2.8 4.3 59.6Cash Flow HedgesFunding (.1) — (.3)Total cash flow hedge loss (.1) — (.3)Net ineffective hedge gain on SFAS 133 hedge strategies $ 2.7 $ 4.3 $59.3
Other Derivative Activities: The derivative portfolio also includes derivative financial instruments not included inSFAS 133 hedge relationships. These derivatives primarily consist of interest-rate swaps, futures, options, caps, floors,and forwards used to hedge the risk of declines in the value of residential mortgage servicing rights accounted for atfair value.
The notional amounts of derivative instruments used for mortgage servicing rights (MSR) risk management, which arenot designated in SFAS 133 hedge relationships, are presented in the following table:
(In Millions) 2007 2006December 31
Net forward commitments to purchase mortgage loans and mortgage-backed securities $ 8,430 $ 4,300Basis swaps 178 —Receive-fixed interest rate swaps 4,310 5,570Receive-fixed interest rate swaptions purchased 6,150 7,300Receive-fixed interest rate swaptions sold — 3,000Pay-fixed interest rate swaps 3,820 1,930Pay-fixed interest rate swaptions purchased 2,150 2,550Pay-fixed interest rate swaptions sold — 2,000Principal-only interest rate swaps — 396Interest rate caps purchased 5,750 2,500Interest rate floors purchased 5,500 14,200Interest rate futures purchased — 1,410Total derivative instruments used for MSR risk management $36,288 $45,156
128

Assets and liabilities recognized for derivative instruments used for mortgage servicing rights risk management, whichare not designated in SFAS 133 hedge relationships, are presented in the following table:
(In Millions) Asset Liability Asset Liability2007 2006
December 31
Net forward commitments to purchase mortgage loans and mortgage-backed securities $ — $ 72.6 $ — $ 22.2
Basis swaps — 2.1 — —Receive-fixed interest rate swaps 80.9 13.7 12.9 124.0Receive-fixed interest rate swaptions purchased 204.8 — 58.9 —Receive-fixed interest rate swaptions sold — — — 43.9Pay-fixed interest rate swaps .8 170.6 — 80.0Pay-fixed interest rate swaptions purchased 55.7 — 31.9 —Pay-fixed interest rate swaptions sold — — — 39.1Principal-only interest rate swaps — — — 6.2Interest rate caps purchased 24.1 — — —Interest rate floors purchased 38.3 — 86.1 —Fair value of derivative instruments used for MSR risk management $404.6 $259.0 $189.8 $315.4
Other derivatives held but not included in SFAS 133 hedge relationships include mortgage banking loan commitments,which are defined as derivative instruments under SFAS 133, forward commitments to sell mortgage loans andmortgage-backed securities which are used to hedge the loan commitments, certain instruments used to economicallyhedge interest-rate risk, and instruments held for trading purposes, which are entered into for the purpose of makingshort-term profits or for providing risk management products to commercial banking customers.
A summary of the fair value of derivative net assets (liabilities) not designated in SFAS 133 hedge relationships, inclusiveof those used to hedge mortgage servicing rights, follows:
(In Millions) 2007 2006December 31
Loan sale and servicing risk management:Mortgage servicing rights $145.6 $(125.6)Mortgage and commercial real estate loans and loan commitments 3.8 17.0Total loan sale and servicing 149.4 (108.6)
Trading derivatives:Customer risk management 34.2 29.6Other (2.0) (8.2)Total trading 32.2 21.4
Used for other risk management purposes 11.4 78.4Total net asset (liability) on derivatives not designated in SFAS 133 hedge relationships $193.0 $ (8.8)
Gains and losses on derivatives used to manage risk associated with mortgage servicing rights are included in loanservicing income, while gains and losses on mortgage and commercial real estate loan commitments and associatedloan risk management instruments are included in loan sale revenue on the income statement. Gains and losses on
129

derivative instruments held for trading or other risk management purposes are included in other noninterest income.Net gains (losses) on derivatives instruments not designated in SFAS 133 hedge relationships are as follows:
(In Millions) 2007 2006 2005For the Calendar Year
Loan sale and servicing risk management:Mortgage servicing rights $(22.3) $(297.4) $166.1Mortgage and commercial real estate loans and loan commitments (12.3) 37.7 52.0Total loan sale and servicing (34.6) (259.7) 218.1
Trading derivatives:Customer risk management 18.6 15.4 17.4Other .3 (6.8) 20.9Total trading 18.9 8.6 38.3
Used for other risk management purposes (13.5) (20.1) 3.4Total net (loss) gain on derivatives not designated in SFAS 133 relationships $(29.2) $(271.2) $259.8
26. Fair Value of Financial Instruments
Fair value estimates are made as of a specific point in time based on the characteristics of the financial instruments andrelevant market information. Where available, quoted market prices are used. In other cases, fair values are based onestimates using option-adjusted discounted cash flow models or other valuation techniques. These techniques aresignificantly affected by the assumptions used, including discount rates, market volatility, and estimates of future cashflows. As such, the derived fair value estimates cannot be substantiated by comparison to independent markets and,further, may not be realizable in an immediate settlement of the instruments.
The following table presents the estimates of fair value of financial instruments at December 31, 2007 and 2006.Excluded are certain items not defined as financial instruments, including nonfinancial assets and intangibles, as well ascertain liabilities such as obligations for pension and other postretirement benefits, deferred compensationarrangements, and leases. Accordingly, the aggregate fair value amounts presented do not purport to represent the fairvalue of the Corporation.
(In Millions)Carrying
ValueFair
ValueCarrying
ValueFair
Value
2007 2006
Financial AssetsCash and cash equivalents $ 5,342 $ 5,342 $ 11,399 $ 11,399Loans held for sale or securitization 4,290 4,302 12,853 12,955Loans, net of allowance for loan losses 114,260 114,899 94,361 95,542Securities 8,731 8,731 7,509 7,509Derivative assets 1,031 1,031 613 613Other 1,603 1,603 1,161 1,161Financial LiabilitiesDeposits $ (97,555) $ (93,019) $(87,234) $(82,805)Short-term borrowings (7,155) (7,161) (6,933) (6,949)Long-term debt (27,892) (27,076) (26,356) (26,928)Derivative liabilities (608) (608) (718) (718)Other (345) (345) (395) (395)Other Financial InstrumentsCommitments to extend credit $ (74) $ (74) $ (93) $ (93)Standby and commercial letters of credit (34) (34) (38) (38)
130

The following methods and assumptions were used to estimate the fair value of each class of financial instrument:
Cash and Cash Equivalents: Due to their short-term nature, the carrying amounts reported in the balance sheetapproximate fair value for these assets. For purposes of this disclosure only, cash equivalents include Federal funds sold,security resale agreements, accrued interest receivable, and other short-term investments.
Loans and Loans Held for Sale or Securitization: The fair values of portfolio loans, commercial, commercial realestate, and credit card loans held for sale or securitization are estimated using an option-adjusted discounted cash flowmodel that discounts future cash flows using recent market interest rates, market volatility, and credit spreadassumptions. The fair values of mortgage loans held for sale are based either upon observable market prices or pricesobtained from third parties.
Securities: The fair values of securities are based primarily upon quoted market prices.
Derivative Assets and Liabilities: Fair values for derivative instruments are based either on observable market pricesor cash flow projection models acquired from third parties.
Deposits: The fair values disclosed for demand deposits (e.g., interest and noninterest bearing checking, savings, andcertain types of money market accounts) are equal to the amounts payable on demand at the reporting date (i.e., theircarrying amounts). The carrying amounts for variable-rate money market accounts and certificates of depositapproximate their fair values at the reporting date. Fair values for fixed-rate certificates of deposit are estimated usingan option-adjusted discounted cash flow model.
Short-Term Borrowings: The carrying amounts of Federal funds borrowed, security repurchase agreements,commercial paper, and other short-term borrowings approximate their fair values.
Long-Term Debt: The fair values of long-term borrowings are estimated using an option-adjusted discounted cashflow model that incorporates the Corporation’s current incremental borrowing rates for similar types ofborrowing arrangements.
Other Financial Instruments: The amounts shown under carrying value represent estimated obligations underoff-balance sheet financial instruments. These estimated obligations consist of deferred fees and expected losscontingencies associated with the financial instruments. The carrying value of these instruments approximatestheir fair value.
27. Line of Business Results
The Corporation manages its business by product and service offerings as well as the distribution channel throughwhich these products and services are offered. Effective January 1, 2007, the Corporation implemented areorganization of its management structure resulting in the following five reportable segments: Retail Banking,Commercial Banking-Regional, Commercial Banking-National, Mortgage Banking, and Asset Management. Each ofthese segments is further described below. All revenues and expenses not directly associated with or allocated to thesesegments are reported within Parent and Other. Prior periods’ results have been reclassified to conform with the currentpresentation.
Net income is the primary measure used by management to assess segment performance and allocate resources.Segment results are derived from the Corporation’s management reporting system. There is no comprehensiveauthoritative guidance on how to allocate revenues and expenses among business segments. The Corporation usesvarious methodologies to assign revenues, expenses and assets to its segments in an attempt to reflect the underlyingeconomics of each business. These methodologies may differ from techniques applied by other financial institutions.The accounting policies of the segments are generally the same as the Corporation, except that certain transactions arepresented differently within the segment results, as described below.
131

Net interest income is presented in the segment results on a tax-equivalent basis. Assets and liabilities within eachbusiness unit are match funded, and interest-rate risk is centrally managed as part of investment funding activities. Netinterest income of each segment also includes interest earned on securitized loans which, for management reportingpurposes, continue to be reflected as owned by the business that manages those assets. Interest income and fundingcosts associated with securitized loans are eliminated within Parent & Other. The provision for loan losses is assigned toeach segment based upon the required allowance for loan losses of each segment. Noninterest income, as well ascertain operating expenses, can generally be directly identified with a specific business. Indirect expenses are allocatedto each segment based on various methodologies to estimate usage. Income tax expense is assigned to each segmentusing a standard rate which considers federal, state and local income taxes as well as state franchise taxes. Adjustmentsto reconcile the segments’ income tax expense to the consolidated income tax expense are recorded within Parent andOther. Goodwill is assigned to each segment based on the fair value that each acquired business added to eachsegment in relation to the total acquisition cost. A risk-based methodology is used to allocate capital to the segments.Management periodically refines its methodologies to allocate revenues and expenses as well as assets, liabilities andcapital to its various businesses.
Retail Banking provides banking services to consumers and small businesses within National City’s nine-state footprint.In addition to deposit gathering and direct lending services provided through the retail bank branch network, callcenters, and the Internet, Retail Banking’s activities also include small business banking services, education finance,retail brokerage, and lending-related insurance services. Consumer lending products include home equity, governmentor privately guaranteed student loans, and credit cards and other unsecured personal and small business lines of credit.Significant revenue sources include net interest income on loan and deposit accounts, deposit account service fees,debit and credit card interchange and service fees, and ATM surcharge and net interchange fees. Major expenses arecredit, personnel costs, and branch network support.
Commercial Banking-Regional provides products and services to large- and medium-sized corporations within NationalCity’s nine-state footprint. Major products and services include: lines of credit, term loans, leases, investment real estatelending, asset-based lending, treasury management, stock transfer, international services and dealer floorplan financing.Significant revenue sources are net interest income on loan and deposit accounts, brokerage revenue, leasing revenueand other fee income. A major source of revenue is from companies with annual sales in the $5 million to $500 millionrange across a diverse group of industries. Major expenses are personnel and credit costs.
Commercial Banking-National provides products and services to select customers in certain industries or distributionchannels, as well as customers outside of National City’s footprint. Major products and services include: loan sales andsecuritization, structured finance, syndicated lending, commercial leasing, equity and mezzanine capital, derivatives,public finance, investment banking, correspondent banking, multifamily real estate lending and commercial real estatelending in selected national markets. Significant revenue sources are loan sales revenue, principal investment gains, andother fee income. Major expenses are primarily personnel costs.
Mortgage Banking originates residential mortgage, home equity lines and loans both within National City’s bankingfootprint and on a nationwide basis. Mortgage loans generally represent loans collateralized by one-to-four-familyresidential real estate and are made to borrowers in good credit standing. These loans are typically sold to primarymortgage market aggregators (Fannie Mae, Freddie Mac, Ginnie Mae, or the Federal Home Loan Banks) and third-partyinvestors. Mortgage Banking’s business activities also include servicing mortgage loans, home equity loans, and homeequity lines of credit for third-party investors. Significant revenue streams include net interest income earned onportfolio loans and loans held for sale, as well as loan sale and servicing revenue. Major expenses include credit,personnel costs, branch office costs, loan servicing and insurance expense.
The Asset Management business includes both institutional asset and personal wealth management. Institutional assetmanagement services are provided by two business units – Allegiant Asset Management Group and Allegiant AssetManagement Company. These business units provide investment management, custody, retirement planning services,and other corporate trust services to institutional clients, and act as the investment advisor for the Allegiant» mutualfunds. The clients served include publicly traded corporations, charitable endowments and foundations, as well asunions, residing primarily in National City’s banking footprint and generally complementing its corporate bankingrelationships. Personal wealth management services are provided by two business units – Private Client Group and
132

Sterling. Products and services include private banking services and tailored credit solutions, customized investmentmanagement services, brokerage, financial planning, as well as trust management and administration for affluentindividuals and families. Sterling offers financial management services for high net worth clients.
Parent and Other contains revenues and expenses not directly associated with or allocated to the above segments, aswell as investment funding activities including the investment portfolio, short- and long-term borrowings, derivativesused for interest-rate risk management, and asset securitizations. Revenues and expenses associated with certaindiscontinued or exited products, services or business units, including the former First Franklin loan origination andservicing platform, are recorded with Parent and Other. Adjustments to reconcile the segment results to theConsolidated Financial Statements are also recorded within Parent and Other.
Selected financial information by line of business follows. For further discussion on the segments’ results see the Line ofBusiness Results section of Item 7 of this Form 10-K.
(In Thousands)Retail
Banking
CommercialBanking-Regional
CommercialBanking-National
MortgageBanking
AssetManagement
Parent andOther(b)
ConsolidatedTotal
2007Net interest income (expense)(a) $2,304,278 $1,098,531 $473,919 $ 663,445 $138,932 $ (254,371) $4,424,734Provision for loan losses 289,104 133,986 59,411 579,408 12,188 251,806 1,325,903Net interest income (expense) after
provision 2,015,174 964,545 414,508 84,037 126,744 (506,177) 3,098,831Noninterest income 1,188,740 233,603 472,267 210,895 376,327 124,329 2,606,161Noninterest expense 2,020,242 546,514 432,050 1,086,274 342,557 877,677 5,305,314Income (loss) before taxes 1,183,672 651,634 454,725 (791,342) 160,514 (1,259,525) 399,678Income tax expense (benefit)(a) 467,926 249,091 168,692 (249,994) 60,674 (610,686) 85,703Net income (loss) $ 715,746 $ 402,543 $286,033 $ (541,348) $ 99,840 $ (648,839) $ 313,975
Intersegment revenue (expense) $ (2,490) $ (1,439) $ 45,873 $ (18,724) $ 9,625 $ (32,845) $ —Average assets (in millions) 29,307 36,417 17,676 31,537 4,132 24,490 143,559
2006Net interest income(a) $1,996,135 $1,075,533 $455,705 $ 607,311 $129,614 $ 369,422 $4,633,720Provision for loan losses 182,565 68,311 3,453 74,566 3,394 155,919 488,208Net interest income after provision 1,813,570 1,007,222 452,252 532,745 126,220 213,503 4,145,512Noninterest income 1,059,899 222,444 524,852 365,310 352,558 1,493,902 4,018,965Noninterest expense 1,732,653 513,245 406,194 804,889 321,547 933,196 4,711,724Income before taxes 1,140,816 716,421 570,910 93,166 157,231 774,209 3,452,753Income tax expense(a) 440,345 273,804 198,604 35,163 59,433 145,568 1,152,917Net income $ 700,471 $ 442,617 $372,306 $ 58,003 $ 97,798 $ 628,641 $2,299,836
Intersegment revenue (expense) $ (2,402) $ 1,232 $ 33,873 $ 4,292 $ 6,685 $ (43,680) $ —Average assets (in millions) 24,680 32,884 15,531 25,845 3,747 35,991 138,678
2005Net interest income(a) $1,906,022 $1,034,101 $451,731 $ 720,132 $118,365 $ 496,123 $4,726,474Provision (benefit) for loan losses 251,714 (10,538) 2,446 58,044 7,635 (8,770) 300,531Net interest income after provision 1,654,308 1,044,639 449,285 662,088 110,730 504,893 4,425,943Noninterest income 955,326 216,081 385,010 832,738 343,997 571,167 3,304,319Noninterest expense 1,607,281 473,840 330,097 843,139 326,003 1,153,760 4,734,120Income (loss) before taxes 1,002,353 786,880 504,198 651,687 128,724 (77,700) 2,996,142Income tax expense (benefit)(a) 385,980 300,809 187,945 233,187 48,658 (145,666) 1,010,913Net income $ 616,373 $ 486,071 $316,253 $ 418,500 $ 80,066 $ 67,966 $1,985,229
Intersegment revenue (expense) $ (3,332) $ 1,502 $ 27,712 $ 5,001 $ 6,042 $ (36,925) $ —Average assets (in millions) 23,944 31,372 13,368 28,581 3,431 40,860 141,556
(a) Includes tax-equivalent adjustment for tax-exempt interest income.(b) Includes after-tax gains on sale of $622 million for First Franklin in 2006.
Effective January 1, 2006, the Corporation changed its methodology for allocating interest credit on mortgage escrowaccounts from a short-term rate to a longer-term swap rate to better reflect the duration of these accounts. Thischange did not have a significant impact on Mortgage Banking’s net interest income for 2006 as the yield curve wasrelatively flat. Had this same methodology been applied to prior periods, Mortgage Banking’s net interest income for2005 would have increased by $25 million.
133

28. Financial Holding Company
Condensed financial statements of the holding company, which include transactions with subsidiaries, follow:
(In Thousands) 2007 2006December 31
Balance Sheets
AssetsCash and demand balances due from banks $ 1,279,310 $ 1,315,479Loans to and receivables from subsidiaries 1,109,582 3,048,331Securities 205,573 219,952Other investments 13,272 192,398Investments in:
Subsidiary banks 15,026,150 12,735,292Nonbank subsidiaries 583,645 346,770
Goodwill 121,670 117,471Derivative assets 81,723 67,632Other assets 914,572 705,035
Total Assets $19,335,497 $18,748,360
Liabilities and Stockholders’ EquityLong-term debt $ 2,868,512 $ 2,308,802Borrowed funds from subsidiaries 1,899,683 948,705Derivative liabilities 23,847 39,858Indemnification liabilities 291,680 —Accrued expenses and other liabilities 843,947 869,992
Total liabilities 5,927,669 4,167,357Stockholders’ equity 13,407,828 14,581,003
Total Liabilities and Stockholders’ Equity $19,335,497 $18,748,360
Securities and other investments totaling $102 million at December 31, 2007 were restricted for use in certainnonqualified benefit plans. The borrowed funds from subsidiaries balance includes the junior subordinated debtsecurities payable to the wholly owned subsidiary trusts (the trusts). The holding company continues to guarantee thecapital securities issued by the trusts, which totaled $1.9 billion at December 31, 2007. The holding company alsoguarantees commercial paper issued by its subsidiary National City Credit Corporation, which borrowings totaled$1.2 billion at December 31, 2007. Additionally, the holding company guarantees certain financial and indemnificationobligations of National City Bank under its membership with Visa» and Mastercard». As of December 31, 2007, theholding company had recognized a $292 million liability related to Visa matters discussed in Note 22.
134

(In Thousands) 2007 2006 2005For the Calendar Year
Statements of Income
IncomeDividends from:
Subsidiary banks $ 950,000 $1,975,000 $1,225,000Nonbank subsidiaries 45 170,468 11,411
Interest on loans to subsidiaries 123,693 71,151 47,463Interest and dividends on securities 5,845 8,012 14,651Securities gains, net 957 14,048 20,481Derivative (losses)/gains, net (2,052) 16,127 3,459Other income 22,197 47,166 48,083
Total Income 1,100,685 2,301,972 1,370,548
ExpenseInterest on debt and other borrowings 251,774 158,673 121,793Impairment, fraud, and other losses 13,506 7,783 7,195Other expense 61,520 126,437 117,776
Total Expense 326,800 292,893 246,764
Income before taxes and equity in undistributed net income of subsidiaries 773,885 2,009,079 1,123,784Income tax benefit (158,517) (96,899) (32,964)Income before equity in undistributed net income of subsidiaries 932,402 2,105,978 1,156,748Equity in undistributed net (loss)/income of subsidiaries (618,427) 193,858 828,481Net Income $ 313,975 $2,299,836 $1,985,229
135

(In Thousands) 2007 2006 2005For the Calendar Year
Statements of Cash Flows
Operating ActivitiesNet income $ 313,975 $ 2,299,836 $ 1,985,229Adjustments to reconcile net income to net cash provided by operating
activities:Equity in undistributed net loss/(income) of subsidiaries 618,427 (193,858) (828,481)Gain on sale of operating units — — (16,001)Depreciation and amortization of properties and equipment 2,691 2,691 2,691Decrease (increase) in receivables from subsidiaries 1,732,174 (1,596,319) 43,886Securities gains, net (957) (14,048) (20,481)Other losses, net 3,384 7,924 35,716Amortization of premiums and discounts on securities and debt (2,933) (8,373) (9,510)(Decrease) increase in accrued expenses and other liabilities (57,275) 2,184 (7,751)Excess tax benefit for share based payments (17,378) (21,261) —Increase in tax receivable (154,380) — —Other, net 125,667 53,215 54,603
Net cash provided by operating activities 2,563,395 531,991 1,239,901Investing Activities
Proceeds from sale of operating units — — 30,226Purchases of securities (124,691) (192,199) (305,160)Proceeds from sales and maturities of securities 140,944 322,048 339,822Net change in other investments 181,619 46,257 (161,628)Principal collected on loans to subsidiaries 699,720 327,000 750,000Loans to subsidiaries (446,000) (790,000) (1,035,000)Investments in subsidiaries (272,059) (110,443) (75,525)Returns of investment from subsidiaries 509,084 1,700,000 1,436,071Cash paid for acquisitions, net (513,179) (72,520) —
Net cash provided by investing activities 175,438 1,230,143 978,806Financing Activities
Issuance of debt 1,594,156 729,710 698,875Repayment of debt (348,877) (283,659) (366,860)Excess tax benefit for share based payments 17,378 21,261 —Dividends paid (984,964) (933,532) (923,993)Issuances of common stock 180,018 224,470 282,480Repurchases of common stock (3,232,713) (713,906) (1,491,703)
Net cash used in financing activities (2,775,002) (955,656) (1,801,201)(Decrease)/increase in cash and demand balances due from banks (36,169) 806,478 417,506Cash and demand balances due from banks, January 1 1,315,479 509,001 91,495Cash and Demand Balances Due from Banks, December 31 $ 1,279,310 $ 1,315,479 $ 509,001
Supplemental InformationCash paid for interest $ 242,508 $ 158,589 $ 118,555Carrying value of securities donated to National City Charitable
Foundations — — 24,179Non-Cash capital contributions to bank subsidiary 289,000 — —Common shares and stock options issued for acquisitions 2,336,353 1,088,031 (10,842)
Retained earnings of the holding company included $8.4 billion and $8.0 billion of equity in undistributed net incomeof subsidiaries at December 31, 2007 and 2006, respectively.
136

29. Quarterly Financial Information (unaudited)
(Dollars in Millions, Except Per Share Amounts) First Second Third Fourth Full Year2007Condensed Income Statement
Interest income $2,211 $2,247 $2,353 $2,374 $9,185Interest expense 1,100 1,158 1,258 1,273 4,789Net interest income 1,111 1,089 1,095 1,101 4,396Provision for loan losses 122 145 368 691 1,326Noninterest income 620 765 624 597 2,606Noninterest expense 1,156 1,186 1,397 1,566 5,305Income (Loss) before income tax expense 453 523 (46) (559) 371Net income (Loss) 319 347 (19) (333) 314
Financial RatiosReturn on average common equity 8.98% 11.35% — — 2.36%Return on average assets .94 1.00 — — .22Net interest margin 3.69 3.59 3.43% 3.30% 3.49Efficiency ratio 66.50 63.76 80.89 91.86 75.46
Per Common ShareBasic net income (loss)(1) $ .50 $ .60 $ (.03) $ (.53) $ .51Diluted net income(loss)(1) .50 .60 (.03) (.53) .51Dividends declared and paid .39 .39 .41 .41 1.60
2006Condensed Income Statement
Interest income $2,145 $2,236 $2,290 $2,263 $8,934Interest expense 969 1,076 1,148 1,137 4,330Net interest income 1,176 1,160 1,142 1,126 4,604Provision for loan losses 32 62 70 325 489Noninterest income(2) 656 784 877 1,702 4,019Noninterest expense 1,144 1,171 1,187 1,209 4,711Income before income tax expense 656 711 762 1,294 3,423Net income 459 473 526 842 2,300
Financial RatiosReturn on average common equity 14.91% 15.08% 16.45% 24.93% 17.98%Return on average assets 1.33 1.35 1.51 2.44 1.66Net interest margin 3.81 3.73 3.73 3.73 3.75Efficiency ratio 62.18 60.04 58.59 42.64 54.45
Per Common ShareBasic net income(1) $ .75 $ .77 $ .87 $ 1.37 $ 3.77Diluted net income(1) .74 .77 .86 1.36 3.72Dividends declared and paid .37 .37 .39 .39 1.52
2005Condensed Income Statement
Interest income $1,744 $1,857 $2,027 $2,104 $7,732Interest expense 594 694 827 921 3,036Net interest income 1,150 1,163 1,200 1,183 4,696Provision for loan losses 77 19 68 136 300Noninterest income 799 981 747 777 3,304Noninterest expense 1,141 1,187 1,144 1,263 4,735Income before income tax expense 731 938 735 561 2,965Net income 484 625 478 398 1,985
Financial RatiosReturn on average common equity 15.35% 19.65% 14.59% 12.57% 15.54%Return on average assets 1.42 1.80 1.31 1.10 1.40Net interest margin 3.78 3.76 3.72 3.74 3.74Efficiency ratio 58.30 55.16 58.54 64.14 58.95
Per Common ShareBasic net income $ .75 $ .98 $ .75 $ .65 $ 3.13Diluted net income .74 .97 .74 .64 3.09Dividends declared and paid .35 .35 .37 .37 1.44
(1) The sum of the quarterly earnings per share may not equal the year-to-date earnings per share as each period iscomputed independently.
(2) Noninterest income for the fourth quarter of 2006 includes a $984 million pretax gain on the sale of First Franklin.
137

Item 9. CHANGES IN AND DISAGREEMENTS WITH ACCOUNTANTS ON ACCOUNTING ANDFINANCIAL DISCLOSURE
None.
Item 9A. CONTROLS AND PROCEDURES
Disclosure Controls and Procedures
National City’s management is responsible for establishing and maintaining effective disclosure controls and procedures,as defined under Rules 13a-15(e) and 15d-15(e) of the Securities Exchange Act of 1934. As of December 31, 2007, anevaluation was performed under the supervision and with the participation of management, including the ChiefExecutive Officer and Chief Financial Officer, of the effectiveness of the design and operation of the Corporation’sdisclosure controls and procedures. Based on that evaluation, management concluded that disclosure controls andprocedures as of December 31, 2007 were effective in ensuring material information required to be disclosed in thisAnnual Report on Form 10-K was recorded, processed, summarized, and reported on a timely basis. Additionally, therewere no changes in internal controls during the quarter ended December 31, 2007 that have materially affected, or arereasonably likely to materially affect, internal control over financial reporting.
Management’s Report on Internal Control Over Financial Reporting
Management’s responsibilities related to establishing and maintaining effective disclosure controls and proceduresinclude maintaining effective internal controls over financial reporting that are designed to produce reliable financialstatements in accordance with accounting principles generally accepted in the United States. As disclosed in the Reporton Management’s Assessment of Internal Control Over Financial Reporting which is set forth on page 57 and isincorporated herein by reference, management assessed the Corporation’s system of internal control over financialreporting as of December 31, 2007, in relation to criteria for effective internal control over financial reporting asdescribed in “Internal Control – Integrated Framework,” issued by the Committee of Sponsoring Organizations of theTreadway Commission. Based on this assessment, management believes that, as of December 31, 2007, its system ofinternal control over financial reporting met those criteria and is effective.
Attestation Report of the Independent Registered Public Accounting Firm
The effectiveness of the Company’s internal control over financial reporting as of December 31, 2007 has been auditedby Ernst & Young LLP, an independent registered public accounting firm, as stated in its report, which is set forth onpage 59 and is incorporated herein by reference.
Changes in Internal Control Over Financial Reporting
There have been no significant changes in internal controls or in other factors that could significantly affect internalcontrols subsequent to December 31, 2007.
Item 9B. OTHER INFORMATION
None.
PART III.
Item 10. DIRECTORS, EXECUTIVE OFFICERS AND CORPORATE GOVERNANCE
The information required by this item is incorporated by reference to the sections entitled “Corporate Governance,”“Election of Directors,” “Nominees for Election as Directors,” “Section 16(a) Beneficial Ownership Reporting
138

Compliance,” “Board of Directors and Committees,” “Compensation Committee Interlocks and Insider Perticipation,”“Communication with Non–Management Members of the Board of Directors,” “Report of the Audit Committee,” and“Board of Director Nomination Process” of the Corporation’s Proxy Statement to be filed with the Commission for its2008 annual meeting of shareholders.
Executive Officers of the Registrant
The Executive Officers of National City (as of February 13, 2008) are as follows:
Name Age Position
Peter E. Raskind 51 Chairman, President and Chief Executive OfficerJeffrey D. Kelly 54 Vice Chairman and Chief Financial OfficerDaniel J. Frate 47 Executive Vice PresidentJon L. Gorney 57 Executive Vice PresidentTimothy J. Lathe 52 Executive Vice PresidentPhilip L. Rice 49 Executive Vice PresidentDale Roskom 50 Executive Vice PresidentShelley J. Seifert 53 Executive Vice PresidentJeffrey J. Tengel 45 Executive Vice PresidentDavid L. Zoeller 58 Executive Vice President, General Counsel, and SecretaryJames P. Gulick 49 Senior Vice President and General AuditorRobert B. Crowl 44 Senior Vice PresidentThomas A. Richlovsky 56 Senior Vice President, Treasurer and Principal Accounting OfficerClark H. Khayat 36 Senior Vice President, Finance and Strategy
The term of office for executive officers is one year.
There is no family relationship between any of the executive officers.
Mr. Raskind has been chairman of the board of directors since December 2007, chief executive officer since July 2007,and president since December 2006. He was vice chairman from December 2004 to December 2006. He was anexecutive vice president from 2000 to December 2004.
Mr. Kelly has been vice chairman since December 2004 and chief financial officer since 2000. He was an executive vicepresident from 1994 to December 2004. Mr. Kelly is also a member of the board of directors.
Mr. Frate has been an executive vice president since November 2005. He had been a senior vice president since 2003.Prior to joining National City, he served as president and chief operating officer of Bank One Card Services andpresident of U.S. Bancorp’s Payment Systems.
Mr. Gorney has been an executive vice president since 1993.
Mr. Lathe has been an executive vice president since 2000 and is head of the Private Client Group. He has beenchairman and chief executive officer of NatCity Investments, Inc. since August 2004, and was president and chiefexecutive officer of National City Bank of the Midwest.
Mr. Rice has been an executive vice president and president and chief executive officer of National City Bank since 2000.
Mr. Roskom has been an executive vice president and chief risk officer since November 2007 and has been an executivevice president of National City Bank since December 2006. He was chief risk officer of Barclaycard UK from July 2004to December 2006 and finance director of Barclaycard’s global businesses from January 2006 to October 2006. He wasa senior vice president of Chase Card Services from September 2001 to June 2004.
Ms. Seifert has been an executive vice president since 2000.
139

Mr. Tengel has been an executive vice president since October 2006. He held a variety of credit positions sinceDecember 2002 and most recently served as senior vice president and chief credit officer. Prior to December 2002, heserved as senior managing director and head of debt capital markets.
Mr. Zoeller has been an executive vice president since 2000. Since 1992, he has been general counsel and secretary.
Mr. Gulick has been senior vice president and general auditor since 1995.
Mr. Crowl has been a senior vice president since October 2004 and chief operating officer of National City Mortgagesince October 2007. He was the corporate comptroller from April 2004 to October 2007. He was the Asset/Liability andSecuritization manager from November 1998 to April 2004.
Mr. Richlovsky has been senior vice president and treasurer since 1989.
Mr. Khayat has been head of Corporate Finance and Strategy since November 2007 and a senior vice president andhead of Corporate Planning since 2005. He has been with National City since 2003 and, prior to rejoining NationalCity, he was an engagement manager at McKinsey & Company. Prior to McKinsey and Company, Mr. Khayat was avice president in NatCity Investments’ Corporate Finance Group.
Item 11. EXECUTIVE COMPENSATION
The information required by this item is incorporated by reference to the sections entitled “Board of Directors andCommittee,” “Director Compensation,” “Compensation Discussion and Analysis,” “Executive Compensation,”“Summary Compensation Table,” “Grants of Plan-Based Awards,” “Narrative Disclosure to Summary CompensationTable and Grants of Plan-Based Awards Table,” “Outstanding Equity Awards at Fiscal Year-End,” “Options Exercises andStock Vested,” “Pension Benefits,” “Nonqualified Deferred Compensation,” “Other Potential Post-EmploymentPayments,” “Compensation Committee Interlocks and Insider Participation,” and “Compensation and OrganizationCommittee Report” of the Corporation’s Proxy Statement to be filed with the Commission for its 2008 annual meetingof shareholders.
Item 12. SECURITY OWNERSHIP OF CERTAIN BENEFICIAL OWNERS AND MANAGEMENTAND RELATED STOCKHOLDER MATTERS
The information required by this item is incorporated by reference to the sections entitled “Beneficial Ownership” and“Beneficial Security Ownership of Management” of the Corporation’s Proxy Statement to be filed with the Commissionfor its 2008 annual meeting of shareholders.
Additional stock option and restricted award information as of December 31, 2007 follows, which includes plansassumed through various acquisitions. As of December 31, 2007, outstanding options related to these acquired planstotaled 6.4 million shares with a weighted-average exercise price per share of $21.39.
Shares toBe Issued
UponExercise
Weighted-AverageOptionExercise
Price
SharesAvailablefor Future
Grants
Plans approved by stockholders 54,434,314 $28.90 20,985,032Plans not approved by stockholders(a) 399,740 26.83 —Total 54,834,054 $28.90 20,985,032
(a) Provident Financial Group was acquired in 2004. Provident’s 2000 Employee Stock Option Plan provided for thegrant of stock options to employees, other than executive officers. Options were granted at an exercise price of notless than 95% of market price at the time of the grant, for a term of up to 10 years. Options vested as determinedby Provident’s Compensation Committee. The 55,212 remaining outstanding options at December 31, 2007are all exercisable.
140

Provident’s 2002 Outside Directors Stock Option Plan provided for the grant of 2,000 options to each non-employee director upon election to its Board and upon each subsequent annual election. The options were grantedat an exercise price equal to their market price, for a term of 10 years. Options vested as determined by Provident’sCompensation Committee. The 39,725 remaining outstanding options at December 31, 2007 are all exercisable.
The National City Corporation 2004 Deferred Compensation Plan provides eligible employees the opportunity todefer the receipt of cash compensation which would have otherwise been received as salary, as variable pay or asan incentive award. The plan provides participants with nonelective deferred compensation, and the deferredcompensation is credited with gains or losses based upon investment options made available from time to time,and, as such, there is no weighted-average exercise price. The plan does not limit the number of shares that maybe issued for the plan.
Item 13. CERTAIN RELATIONSHIPS AND RELATED TRANSACTIONS, AND DIRECTORINDEPENDENCE
The information required by this item is incorporated by reference to the sections entitled “Board of Directors andCommittees,” “Election of Directors,” and “Transaction with Related Persons” of the Corporation’s Proxy Statement tobe filed with the Commission for its 2008 annual meeting of shareholders.
Item 14. PRINCIPAL ACCOUNTANT FEES AND SERVICES
The information required by this item is incorporated by reference to the section entitled “Independent PublicAccountants” of the Corporation’s Proxy Statement to be filed with the Commission for its 2008 annual meeting ofshareholders.
PART IV.
Item 15. EXHIBITS AND FINANCIAL STATEMENTS SCHEDULES
The following report of independent registered public accounting firm and consolidated financial statements areincorporated by reference to Item 8 of this Form 10-K:
Report of Independent Registered Public Accounting FirmConsolidated Balance Sheets – December 31, 2007 and 2006Consolidated Statements of Income – For the Years Ended December 31, 2007, 2006, and 2005Consolidated Statements of Changes In Stockholders’ Equity – For the Years Ended December 31, 2007, 2006, and 2005Consolidated Statements of Cash Flows – For the Years Ended December 31, 2007, 2006, and 2005Notes to Consolidated Financial Statements
Financial Statement Schedules – Omitted due to inapplicability or because required information is shown in theconsolidated financial statements or the notes thereto.
Any exhibits within exhibit numbers 3, 4, 10 or 14 documented in this index as being filed with the United StatesSecurities and Exchange Commission (SEC) as part of the December 31, 2007 Form 10-K have been filed separatelywith the SEC and are available on request from the Secretary of the Corporation at the principal executive offices orthrough the SEC at www.sec.gov.
141

Exhibit Index
ExhibitNumber Exhibit Description
3.1 Amended and Restated Certificate of Incorporation of National City Corporation dated April 13, 1999 (filedas Exhibit 3.2 to Registrant’s Quarterly Report on Form 10-Q for the quarter and nine months endedSeptember 30, 2000, and incorporated herein by reference).
3.2 National City Corporation First Restatement of By-laws adopted April 27, 1987 (as Amended throughOctober 22, 2007) (filed as Exhibit 3(ii) to Registrant’s Current Report on Form 8-K filed on October 26,2007, and incorporated herein by reference).
3.3 Certificate of Designation Rights and Preferences of the Series D Non-voting Convertible Preferred StockWithout Par Value of National City Corporation (filed as Exhibit 3.3 to Registrant’s Annual Report on Form10-K for the fiscal year ended December 31, 2004, and incorporated herein by reference).
3.4 Certificate of Designations of Non-Cumulative Perpetual Preferred Stock, Series E, Without Par Value ofNational City Corporation (filed as Exhibit 4.10 to Registrant’s Form 8-A filed on January 30, 2008, andincorporated herein by reference).
3.5 Certificate of Designations of 9.875% Fixed-to-Floating Rate Non-Cumulative Preferred Stock, Series F,Without Par Value of National City Corporation (filed as Exhibit 4.1 to Registrant’s Form 8-A filed onJanuary 30, 2008, and incorporated herein by reference).
4.1 Amended and restated Certificate of Incorporation of National City Corporation dated April 13, 1999 (filedas Exhibit 3.2 to Registrant’s Quarterly Report on Form 10-Q for the quarter and nine months endedSeptember 30, 2000, and incorporated herein by reference) related to capital stock of National CityCorporation.
4.2 National City Corporation First Restatement of By-laws adopted April 27, 1987 (as Amended throughOctober 22, 2007) (filed as Exhibit 3(ii) to Registrant’s Current Report on Form 8-K filed on October 26,2007, and incorporated herein by reference) related to stockholder rights.
4.3 Certificate of Designation Rights and Preferences of the Series D Non-voting Convertible Preferred StockWithout Par Value of National City Corporation (filed as Exhibit 3.3 to Registrant’s Annual Report on Form10-K for the fiscal year ended December 31, 2004, and incorporated herein by reference).
4.4 Certificate of Designations of Non-Cumulative Perpetual Preferred Stock, Series E, Without Par Value ofNational City Corporation (filed as Exhibit 4.10 to Registrant’s Form 8-A filed on January 30, 2008, andincorporated herein by reference).
4.5 Certificate of Designations of 9.875% Fixed-to-Floating Rate Non-Cumulative Preferred Stock, Series F,Without Par Value of National City Corporation (filed as Exhibit 4.1 to Registrant’s Form 8-A filed onJanuary 30, 2008, and incorporated herein by reference).
4.6 Deposit Agreement, dated January 30, 2008 by and among the Registrant, Wilmington Trust Company,National City Bank as Transfer Agent and Registrar, and all holders from time to time of Receipts issuedpursuant thereto, (filed as Exhibit 4.2 to Registrant’s Form 8-A filed on January 30, 2008 (related toRegistration No. 333-148769), and incorporated herein by reference).
4.7 National City agrees to furnish upon request to the Commission a copy of each instrument defining therights of holders of Senior and Subordinated debt of National City.
10.1 National City Corporation’s 1993 Stock Option Plan (filed as Exhibit 10.5 to Registration Statement No. 33-49823 and incorporated herein by reference).
10.2 National City Corporation Plan for Deferred Payment of Directors’ Fees, as Amended (filed as Exhibit 10.5 toRegistration Statement No. 2-914334 and incorporated herein by reference).
10.3 National City Corporation Supplemental Executive Retirement Plan, as Amended and Restated effectiveJanuary 1, 2005 (filed as Exhibit 10.4 to Registrant’s Quarterly Report on Form 10-Q for the quarter endedMarch 31, 2006, and incorporated herein by reference).
10.4 National City Corporation Amended and Second Restated 1991 Restricted Stock Plan (filed as Exhibit 10.9 toRegistration Statement No. 33-49823 and incorporated herein by reference).
10.5 Form of grant made under National City Corporation 1991 Restricted Stock Plan in connection with NationalCity Corporation Supplemental Executive Retirement Plan as Amended (filed as Exhibit 10.7 to Registrant’sQuarterly Report on Form 10-Q for the quarter ended March 31, 2003, and incorporated herein byreference).
142

ExhibitNumber Exhibit Description
10.6 Form of contracts with Jon L. Gorney, Jeffrey D. Kelly, David L. Zoeller, Thomas A. Richlovsky, James P.Gulick, Peter E. Raskind, Philip L. Rice, Timothy J. Lathe, Shelley J. Seifert and Daniel J. Frate (filed asExhibit 10.1 to Registrant’s Current Report on Form 8-K filed on December 7, 2007, and incorporated hereinby reference).
10.7 Split Dollar Insurance Agreement effective January 1, 1994, between National City Corporation and certainkey employees (filed as Exhibit 10.11 to Registrant’s Quarterly Report on Form 10-Q for the quarter endedMarch 31, 2003, and incorporated herein by reference).
10.8 National City Corporation 1997 Stock Option Plan as Amended and Restated effective October 22, 2001(filed as Exhibit 10.17 to Registrant’s Annual Report on Form 10-K for the fiscal year ended December 31,2001, and incorporated herein by reference).
10.9 National City Corporation 1997 Restricted Stock Plan as Amended and Restated effective October 31, 2001(filed as Exhibit 10.18 to Registrant’s Annual Report on Form 10-K for the fiscal year ended December 31,2001, and incorporated herein by reference).
10.10 National City Corporation Retention Plan for Executive Officers, Amended and Restated effective January 1,2005 (filed as Exhibit 10.17 to Registrant’s Annual Report on Form 10-K for the fiscal year ended December31, 2005, and incorporated herein by reference).
10.11 Integra Financial Corporation Management Incentive Plan (filed as Exhibit 4.4 to Registrant’s Post-EffectiveAmendment No. 1 on Form S-8 to Form S-4 Registration Statement No. 333-01697, dated April 30, 1996,and incorporated herein by reference).
10.12 National City Corporation Management Incentive Plan for Senior Officers, as Amended and Restatedeffective January 1, 2005 (filed as Exhibit 10.12 to Registrant’s Quarterly Report on Form 10-Q for thequarter ended June 30, 2007, and incorporated herein by reference).
10.13 National City Corporation Supplemental Cash Balance Pension Plan, as Amended and Restated effectiveJanuary 1, 2005 (filed as Exhibit 10.14 to Registrant’s Quarterly Report on Form 10-Q for the quarter endedMarch 31, 2006, and incorporated herein by reference).
10.14 The National City Corporation 2001 Stock Option Plan as Amended and Restated effective October 22,2001 (filed as Exhibit 10.27 to Registrant’s Annual Report on Form 10-K for the fiscal year ended December31, 2001, and incorporated herein by reference).
10.15 National City Corporation 2002 Restricted Stock Plan (filed as Exhibit A to Registrant’s Proxy Statementdated March 8, 2002, and incorporated herein by reference).
10.16 The National City Corporation Long-Term Deferred Share Compensation Plan effective April 22, 2002 (filedas Exhibit 10.33 to Registrant’s Quarterly Report on Form 10-Q for the quarter ended June 30, 2002, andincorporated herein by reference).
10.17 The National City Corporation Deferred Compensation Plan, as Amended and Restated effective January 1,2005 (filed as Exhibit 10.18 to Registrant’s Quarterly Report on Form 10-Q for the quarter ended March 31,2006, and incorporated herein by reference).
10.18 Form of Agreement Not To Compete with David A. Daberko and William E. MacDonald III (filed as Exhibit10.35 to Registrant’s Quarterly Report on Form 10-Q for the quarter ended June 30, 2002, and incorporatedherein by reference).
10.19 Summary of Non-employee Directors’ Compensation (filed as Exhibit 99.3 to Registrant’s Current Report onForm 8-K filed on July 25, 2007, and incorporated herein by reference).
10.20 The National City Corporation Executive Savings Plan, as Amended and Restated effective January 1, 2003(filed as Exhibit 10.32 to Registrant’s Annual Report on Form 10-K for the fiscal year ended December 31,2002, and incorporated herein by reference).
10.21 The National City Corporation Savings and Investment Plan, as Amended and Restated effective January 1,2001 (filed as Exhibit 10.33 to Registrant’s Annual Report on Form 10-K for the fiscal year ended December31, 2002, and incorporated herein by reference).
10.22 Amendment No. 1 to the National City Savings and Investment Plan, as Amended and Restated effectiveJanuary 1, 2001 (filed as Exhibit 10.35 to Registrant’s Annual Report on Form 10-K for the fiscal year endedDecember 31, 2002, and incorporated herein by reference).
143

ExhibitNumber Exhibit Description
10.23 Amendment No. 1 to the Split Dollar Insurance Agreement effective January 1, 2003 (filed as Exhibit 10.37to Registrant’s Annual Report on Form 10-K for the fiscal year ended December 31, 2002, and incorporatedherein by reference).
10.24 Credit Agreement dated as of April 12, 2001, by and between National City and the banks named therein(filed as Exhibit 4.2 to Registrant’s Quarterly Report on Form 10-Q for the quarter ended March 31, 2001,and incorporated herein by reference) and the Assumption Agreement dated June 11, 2002 (filed as Exhibit4.2 to Registrant’s Quarterly Report on Form 10-Q for the quarter ended June 30, 2002, and incorporatedherein by reference).
10.25 Agreement to Terminate Change in Control Benefits between National City Corporation and David A.Daberko (filed as exhibit 10.25 to Registrant’s Annual Report on Form 10-K for the fiscal year endedDecember 31, 2006, and incorporated herein by reference).
10.26 The National City Corporation Long-Term Cash and Equity Incentive Plan Effective January 1, 2005 (filed asExhibit 10.26 to Registrant’s Quarterly Report on Form 10-Q for the quarter ended June 30, 2007, andincorporated herein by reference).
10.27 National City Executive Long-Term Disability Plan (filed as Exhibit 10.41 to Registrant’s Annual Report onForm 10-K for the fiscal year ended December 31, 2004, and incorporated herein by reference).
10.28 Amendment No. 2 to the National City Savings and Investment Plan, as Amended and Restated effectiveJanuary 1, 2001 (filed as Exhibit 10.42 to the Registrant’s Quarterly Report on Form 10-Q for the quarterended March 31, 2004, and incorporated herein by reference).
10.29 Amendment No. 3 to the National City Savings and Investment Plan, as Amended and Restated effectiveJanuary 1, 2001 (filed as Exhibit 10.1 to the Registrant’s Post-Effective Amendment No. 3 to Form S-8Registration Statement No. 333-61712 dated April 19, 2004, and incorporated herein by reference).
10.30 Amendment No. 4 to the National City Savings and Investment Plan, as Amended and Restated effectiveJanuary 1, 2001 (filed as Exhibit 10.3 to the Registrant’s Post-Effective Amendment No. 3 to Form S-8Registration Statement No. 333-61712 dated April 19, 2004, and incorporated herein by reference).
10.31 The National City Corporation 2004 Deferred Compensation Plan, as Amended and Restated effectiveJanuary 1, 2005 (filed as Exhibit 10.35 to Registrant’s Quarterly Report on Form 10-Q for the quarter endedMarch 31, 2006, and incorporated herein by reference).
10.32 Amendment No. 5 to the National City Savings and Investment Plan, as Amended and Restated effectiveJanuary 1, 2001 (filed as Exhibit 10.61 to Registrant’s Annual Report on Form 10-K for the fiscal year endedDecember 31, 2004, and incorporated herein by reference).
10.33 Amendment No. 6 to the National City Savings and Investment Plan, as Amended and Restated effectiveJanuary 1, 2001 (filed as Exhibit 10.62 to Registrant’s Annual Report on Form 10-K for the fiscal year endedDecember 31, 2005, and incorporated herein by reference).
10.34 Appendices AO, AP, AQ, and AR to the National City Savings and Investment Plan, as Amended andRestated effective January 1, 2001 (filed as Exhibit 10.63 to Registrant’s Annual Report on Form 10-K for thefiscal year ended December 31, 2004, and incorporated herein by reference).
10.35 Form of Restricted Stock Award Agreement (filed as Exhibit 10.64 to Registrant’s Quarterly Report on Form10-Q for the quarter ended June 30, 2005, and incorporated herein by reference).
10.36 Form of Restricted Stock Award Agreement used in connection with National City Corporation ManagementIncentive Plan for Senior Officers (filed as Exhibit 10.65 to Registrant’s Quarterly Report on Form 10-Q forthe quarter ended March 31, 2005, and incorporated herein by reference).
10.37 Form of Incentive Stock Option Award Agreement (filed as Exhibit 10.66 to Registrant’s Quarterly Report onForm 10-Q for the quarter ended September 30, 2005, and incorporated herein by reference).
10.38 Form of Non-qualified Stock Option Award Agreement (filed as Exhibit 10.41 to Registrant’s QuarterlyReport on Form 10-Q for the quarter ended June 30, 2007, and incorporated herein by reference).
10.39 Form of contracts with Robert B. Crowl and Jeffrey J. Tengel (filed as Exhibit 10.3 to Registrant’s CurrentReport on Form 8-K filed on December 7, 2007, and incorporated herein by reference).
10.40 Appendices AS, AT, AU, AV, and AW to the National City Savings and Investment Plan, as Amended andRestated effective January 1, 2001 (filed as Exhibit 10.70 to Registrant’s Annual Report on Form 10-K for thefiscal year ended December 31, 2005, and incorporated herein by reference).
144

ExhibitNumber Exhibit Description
10.41 Form of Restricted Stock Unit Award Agreement (filed as Exhibit 10.45 to Registrant’s Quarterly Report onForm 10-Q for the quarter ended March 31, 2007, and incorporated herein by reference).
10.42 National City Corporation Management Severance Plan, as Amended and Restated effective January 1, 2005(filed as Exhibit 10.46 to Registrant’s Quarterly Report on Form 10-Q for the quarter ended June 30, 2007,and incorporated herein by reference).
10.43 Form of Amendment to Agreement Not to Compete with David A. Daberko and William E. MacDonald III(filed as Exhibit 10.48 to Registrant’s Quarterly Report on Form 10-Q for the quarter ended March 31, 2006,and incorporated herein by reference).
10.44 Form of Non-Elective Deferred Compensation Award Statement (filed as Exhibit 10.48 to Registrant’sQuarterly Report on Form 10-Q for the quarter ended June 30, 2007, and incorporated herein by reference).
10.45 Form of Non-Elective Deferred Compensation Award Statement (filed as exhibit 99.2 to Registrant’s CurrentReport on Form 8-K filed on May 1, 2006, and incorporated herein by reference).
10.46 Deferred Compensation Plan for Daniel J. Frate (filed as exhibit 10.51 to Registrant’s Quarterly Report onForm 10-Q for the quarter ended March 31, 2006, and incorporated herein by reference).
10.47 Release and Separation Agreement between National City Corporation and John D. Gellhausen (filed asexhibit 10.51 to Registrant’s Quarterly Report on Form 10-Q for the quarter ended September 30, 2006, andincorporated herein by reference).
10.48 Form of Restricted Stock Unit Agreement (Retention/Non-compete) between National City Corporation andeach of Jeffrey D. Kelly and Peter E. Raskind (filed as exhibit 10.52 to Registrant’s Quarterly Report on Form10-Q for the quarter ended September 30, 2006, and incorporated herein by reference).
10.49 Form of Restricted Stock Unit Agreement (Performance) between National City Corporation and each ofJeffrey D. Kelly, Peter E. Raskind and Daniel J. Frate (filed as exhibit 10.53 to Registrant’s Quarterly Report onForm 10-Q for the quarter ended September 30, 2006, and incorporated herein by reference).
10.50 Form of Restricted Stock Award Agreement (filed as exhibit 99.1 to Registrant’s Current Report on Form 8-Kfiled on October 23, 2006, and incorporated herein by reference).
10.51 Form of Restricted Stock Unit Award Agreement (filed as exhibit 99.2 to Registrant’s Current Report on Form8-K filed on October 23, 2006, and incorporated herein by reference).
10.52 Form of Restricted Stock Unit Award Agreement (filed as exhibit 99.3 to Registrant’s Current Report on Form8-K filed on October 23, 2006, and incorporated herein by reference).
10.53 Aircraft Time Sharing Agreement between National City Credit Corporation and David A. Daberko (filed asexhibit 99.1 to Registrant’s Current Report on Form 8-K filed on October 23, 2006, and incorporated hereinby reference).
10.54 Aircraft Time Sharing Agreement between National City Credit Corporation and David A. Daberko (filed asexhibit 99.2 to Registrant’s Current Report on Form 8-K filed on October 23, 2006, and incorporated hereinby reference).
10.55 Severance Agreement Termination between National City Corporation and David A. Daberko (filed as exhibit99.4 to Registrant’s Current Report on Form 8-K filed on October 23, 2006, and incorporated herein byreference).
10.56 Amendment to National City Corporation Amended and Second Restated 1991 Restricted Stock Plan (filedas exhibit 10.61 to Registrant’s Quarterly Report on Form 10-Q for the quarter ended September 30, 2006,and incorporated herein by reference).
10.57 Amendment to National City Corporation Amended and Restated 1993 Stock Option Plan (filed as exhibit10.62 to Registrant’s Quarterly Report on Form 10-Q for the quarter ended September 30, 2006, andincorporated herein by reference).
10.58 Amendment to National City Corporation 1997 Restricted Stock Plan, Amended and Restated EffectiveOctober 31, 2001 (filed as exhibit 10.63 to Registrant’s Quarterly Report on Form 10-Q for the quarterended September 30, 2006, and incorporated herein by reference).
10.59 Amendment to National City Corporation 1997 Stock Option Plan as Amended and Restated EffectiveOctober 22, 2001 (filed as exhibit 10.64 to Registrant’s Quarterly Report on Form 10-Q for the quarterended September 30, 2006, and incorporated herein by reference).
145

ExhibitNumber Exhibit Description
10.60 Amendment to National City Corporation 2001 Stock Option Plan as Amended and Restated EffectiveOctober 22, 2001 (filed as exhibit 10.65 to Registrant’s Quarterly Report on Form 10-Q for the quarterended September 30, 2006, and incorporated herein by reference).
10.61 Amendment to National City Corporation 2002 Restricted Stock Plan (filed as exhibit 10.66 to Registrant’sQuarterly Report on Form 10-Q for the quarter ended September 30, 2006, and incorporated herein byreference).
10.62 National City Corporation CEO Post-Retirement Office Plan (filed as Exhibit 99.2 to Registrant’s CurrentReport on Form 8-K filed on July 25, 2007, and incorporated herein by reference).
10.63 2007 Executive Bonus Plan (filed as Exhibit 99 to Registrant’s Current Report on Form 8-K filed on October26, 2007, and incorporated herein by reference).
10.64 Form of contract with Dale Roskom (filed as Exhibit 10.2 to Registrant’s Current Report on Form 8-K filed onDecember 7, 2007, and incorporated herein by reference).
10.65 Form of contract with Clark H. Khayat (filed as Exhibit 10.4 to Registrant’s Current Report on Form 8-K filedon December 7, 2007, and incorporated herein by reference).
11.0 Statement re computation of per share earnings incorporated by reference to Note 20 of the Notes to theConsolidated Financial Statements of this report.
12.1 Computation of Ratio of Earnings to Fixed Charges.14.1 Code of Ethics (filed as Exhibit 14.1 to Registrant’s Current Report on Form 8-K filed on April 26, 2005, and
incorporated herein by reference).14.2 Code of Ethics for Senior Financial Officers (filed as Exhibit 14.2 to Registrant’s Current Report on Form 8-K
filed on April 26, 2005, and incorporated herein by reference).21.1 Subsidiaries of Registrant.23.1 Consent of Ernst & Young LLP, Independent Registered Public Accounting Firm for National City Corporation.24.1 Power of Attorney.31.1 Chief Executive Officer Sarbanes-Oxley Act 302 Certification dated February 13, 2008 for National City
Corporation’s Annual Report on Form 10-K for the year ended December 31, 2007.31.2 Chief Financial Officer Sarbanes-Oxley Act 302 Certification dated February 13, 2008 for National City
Corporation’s Annual Report on Form 10-K for the year ended December 31, 2007.32.1 Chief Executive Officer Sarbanes-Oxley Act 906 Certification dated February 13, 2008 for National City
Corporation’s Annual Report on Form 10-K for the year ended December 31, 2007.32.2 Chief Financial Officer Sarbanes-Oxley Act 906 Certification dated February 13, 2008 for National City
Corporation’s Annual Report on Form 10-K for the year ended December 31, 2007.
146

Signatures
Pursuant to the requirements of Section 13 or 15(d) of the Securities Exchange Act of 1934, the Registrant has dulycaused this report to be signed on its behalf by the undersigned, thereunto duly authorized, on February 13, 2008.
National City Corporation
/s/ PETER E. RASKIND
Peter E. RaskindChairman, President and Chief Executive Officer
Pursuant to the requirements of the Securities Exchange Act of 1934, this report has been signed below by thefollowing persons on behalf of the Registrant and in the capacities indicated, on February 13, 2008.
/s/ PETER E. RASKIND
Peter E. RaskindChairman, President and Chief Executive Officer
/s/ JEFFREY D. KELLY
Jeffrey D. KellyVice Chairman and Chief Financial Officer
/s/ THOMAS A. RICHLOVSKY
Thomas A. RichlovskySenior Vice President and Treasurer
The Directors of National City Corporation executed a power of attorney appointing David L. Zoeller, Carlton E. Langer,and Thomas A. Richlovsky their attorneys-in-fact, empowering them to sign this report on their behalf.
/s/ DAVID L. ZOELLER
By David L. ZoellerAttorney-in-fact
147

Certification of Chief Executive Officer Sarbanes-Oxley Act Section 302
I, Peter E. Raskind, certify that:
1. I have reviewed this annual report on Form 10-K of National City Corporation;
2. Based on my knowledge, this report does not contain any untrue statement of a material fact or omit to state amaterial fact necessary to make the statements made, in light of the circumstances under which such statements weremade, not misleading with respect to the period covered by this report;
3. Based on my knowledge, the financial statements, and other financial information included in this report, fairlypresent in all material respects the financial condition, results of operations and cash flows of the registrant as of, andfor, the periods presented in this report;
4. The registrant’s other certifying officer and I are responsible for establishing and maintaining disclosure controls andprocedures (as defined in Exchange Act Rules 13a-15(e) and 15d-15(e)) and internal control over financial reporting (asdefined in Exchange Act Rules 13a-15(f) and 15d-15(f)) for the registrant and have:
a) Designed such disclosure controls and procedures, or caused such disclosure controls and procedures to bedesigned under our supervision, to ensure that material information relating to the registrant, including itsconsolidated subsidiaries, is made known to us by others within those entities, particularly during the period inwhich this report is being prepared;
b) Designed such internal control over financial reporting, or caused such internal control over financial reportingto be designed under our supervision, to provide reasonable assurance regarding the reliability of financialreporting and the preparation of financial statements for external purposes in accordance with generally acceptedaccounting principles;
c) Evaluated the effectiveness of the registrant’s disclosure controls and procedures and presented in this reportour conclusions about the effectiveness of the disclosure controls and procedures, as of the end of the periodcovered by this report based on such evaluation; and
d) Disclosed in this report any change in the registrant’s internal control over financial reporting that occurredduring the registrant’s most recent fiscal quarter that has materially affected, or is reasonably likely to materiallyaffect, the registrant’s internal control over financial reporting; and
5. The registrant’s other certifying officer and I have disclosed, based on our most recent evaluation of internal controlover financial reporting, to the registrant’s auditors and the audit committee of the registrant’s board of directors:
a) All significant deficiencies and material weaknesses in the design or operation of internal control over financialreporting which are reasonably likely to adversely affect the registrant’s ability to record, process, summarize andreport financial information; and
b) Any fraud, whether or not material, that involves management or other employees who have a significant rolein the registrant’s internal control over financial reporting.
Date: February 13, 2008
By: /s/ PETER E. RASKIND
Peter E. RaskindChairman, President and Chief Executive Officer
148

Certification of Chief Executive Officer Sarbanes-Oxley Act Section 906
Pursuant to 18 U.S.C. section 1350, the undersigned officer of National City Corporation (the “Company”), herebycertifies, to such officer’s knowledge, that the Company’s Annual Report on Form 10-K for the year endedDecember 31, 2007 (the “Report”) fully complies with the requirements of Section 13(a) or 15(d), as applicable, of theSecurities Exchange Act of 1934 and that the information contained in the Report fairly presents, in all materialrespects, the financial condition and results of operations of the Company.
Date: February 13, 2008
By: /s/ PETER E. RASKIND
Peter E. RaskindChairman, President and Chief Executive Officer
The signed original of this written statement required by Section 906, or other document authenticating,acknowledging, or otherwise adopting the signature that appears in typed form within the electronic version of thiswritten statement required by Section 906, has been provided to the Company and will be retained by the Companyand furnished to the Securities and Exchange Commission or its staff upon request.
NEW YORK STOCK EXCHANGE
In accordance with the rules of the New York Stock Exchange, David A. Daberko, the chief executive officer of NationalCity on May 21, 2007, submitted the required annual Section 303A.12(a) chief executive officer certification to theNew York Stock Exchange on May 21, 2007. National City’s Form 10-K for its fiscal year ended December 31, 2007, asfiled with the Securities and Exchange Commission includes, as exhibits, the certifications of National City’s chiefexecutive officer and chief financial officer required by Section 302 of the Sarbanes-Oxley Act of 2002.
149

Certification of Chief Financial Officer Sarbanes-Oxley Act Section 302
I, Jeffrey D. Kelly, certify that:
1. I have reviewed this annual report on Form 10-K of National City Corporation;
2. Based on my knowledge, this report does not contain any untrue statement of a material fact or omit to state amaterial fact necessary to make the statements made, in light of the circumstances under which such statements weremade, not misleading with respect to the period covered by this report;
3. Based on my knowledge, the financial statements, and other financial information included in this report, fairlypresent in all material respects the financial condition, results of operations and cash flows of the registrant as of, andfor, the periods presented in this report;
4. The registrant’s other certifying officer and I are responsible for establishing and maintaining disclosure controls andprocedures (as defined in Exchange Act Rules 13a-15(e) and 15d-15(e)) and internal control over financial reporting (asdefined in Exchange Act Rules 13a-15(f) and 15d-15(f)) for the registrant and have:
a) Designed such disclosure controls and procedures, or caused such disclosure controls and procedures to bedesigned under our supervision, to ensure that material information relating to the registrant, including itsconsolidated subsidiaries, is made known to us by others within those entities, particularly during the period inwhich this report is being prepared;
b) Designed such internal control over financial reporting, or caused such internal control over financial reportingto be designed under our supervision, to provide reasonable assurance regarding the reliability of financialreporting and the preparation of financial statements for external purposes in accordance with generally acceptedaccounting principles;
c) Evaluated the effectiveness of the registrant’s disclosure controls and procedures and presented in this reportour conclusions about the effectiveness of the disclosure controls and procedures, as of the end of the periodcovered by this report based on such evaluation; and
d) Disclosed in this report any change in the registrant’s internal control over financial reporting that occurredduring the registrant’s most recent fiscal quarter that has materially affected, or is reasonably likely to materiallyaffect, the registrant’s internal control over financial reporting; and
5. The registrant’s other certifying officer and I have disclosed, based on our most recent evaluation of internal controlover financial reporting, to the registrant’s auditors and the audit committee of the registrant’s board of directors:
a) All significant deficiencies and material weaknesses in the design or operation of internal control over financialreporting which are reasonably likely to adversely affect the registrant’s ability to record, process, summarize andreport financial information; and
b) Any fraud, whether or not material, that involves management or other employees who have a significant rolein the registrant’s internal control over financial reporting.
Date: February 13, 2008
By: /s/ JEFFREY D. KELLY
Jeffrey D. KellyVice Chairman and Chief Financial Officer
150

Certification of Chief Financial Officer Sarbanes-Oxley Act Section 906
Pursuant to 18 U.S.C. section 1350, the undersigned officer of National City Corporation (the “Company”), herebycertifies, to such officer’s knowledge, that the Company’s Annual Report on Form 10-K for the year endedDecember 31, 2007 (the “Report”) fully complies with the requirements of Section 13(a) or 15(d), as applicable, of theSecurities Exchange Act of 1934 and that the information contained in the Report fairly presents, in all materialrespects, the financial condition and results of operations of the Company.
Date: February 13, 2008
By: /s/ JEFFREY D. KELLY
Jeffrey D. KellyVice Chairman and Chief Financial Officer
The signed original of this written statement required by Section 906, or other document authenticating,acknowledging, or otherwise adopting the signature that appears in typed form within the electronic version of thiswritten statement required by Section 906, has been provided to the Company and will be retained by the Companyand furnished to the Securities and Exchange Commission or its staff upon request.
151

Corporate HeadquartersNational City Center 1900 East Ninth Street Cleveland, Ohio 44114-3484 216-222-2000 NationalCity.com
Transfer Agent and RegistrarNational City Bank Shareholder Services Operations Department 5352 P.O. Box 92301 Cleveland, Ohio 44101
Stockholders of record may access their accounts via the Internet to review account holdings and transaction history through National City’s StockAccess at ncstockaccess.com. For login assistance or other inquiries, call 1-800-622-6757.
Investor InformationJill Hennessey Investor Relations Department 2229 P.O. Box 5756 Cleveland, Ohio 44101-0756 1-800-622-4204 [email protected]
Common Stock ListingNational City Corporation common stock is traded on the New York Stock Exchange under the symbol NCC. The stock is abbreviated in financial publications as NtlCity.
Preferred Securities ListingsNational City sponsors four capital trusts which have issued corporation-obligated mandatorily redeemable capital securities that are traded on the New York Stock Exchange under the symbols NCCPRA, NCCPRB, NCCPRC and NCCPRD.
National City Corporation depositary preferred shares are traded on the New York Stock Exchange under the symbol NCCPRF.
Web Site Access to United States Securities and Exchange Commission FilingsAll reports filed electronically by National City Corporation with the United States Securities and Exchange Commission (SEC), including the Annual Report on Form 10-K, quarterly reports on Form 10-Q, and current event reports on Form 8-K, as well as any amendments to those reports, are accessible at no cost on the Corporation’s Web site at NationalCity.com. These filings are also accessible on the SEC’s Web site at www.sec.gov.
Dividend Reinvestment and Stock Purchase PlanNational City Corporation offers stockholders a convenient way to increase their investment through the National City Amended and Restated Dividend Reinvestment and Stock Purchase Plan (the Plan). Under the Plan, investors can elect to acquire National City shares in the open market by reinvesting dividends and through optional cash payments. National City absorbs the fees and brokerage commissions on shares acquired through the Plan.
To obtain a Plan prospectus and authorization card, please call 1-800-622-6757. The Plan prospectus is also available at NationalCity.com.
Direct Deposit of DividendsThe direct deposit program provides for free automatic deposit of quarterly dividends directly to a checking or savings account. For information regarding this program, call 1-800-622-6757.
Corporate GovernanceNational City’s corporate governance practices are described in the following documents, available free of charge on NationalCity.com or in print form through the Investor Relations department: Corporate Governance Guidelines, Code of Ethics, Code of Ethics for Senior Financial Officers, Audit Committee Charter, Nominating and Board of Directors Governance Committee Charter, Compensation Committee Charter, and Risk and Public Policy Committee Charter.
Annual MeetingThe Annual Meeting of Stockholders will be on Tuesday, April 29, 2008 at 10 a.m. Eastern time National City Corporation National City Center 1900 East Ninth Street Cleveland, Ohio 44114-3484
Debt Ratings Moody’s Fitch Investors Standard DBRS Ratings Service & Poor’s
National City Corporation B Commercial paper R-1 (mid) F1 P-1 A-1 Senior debt A (high) A+ A2 A Subordinated debt A A A3 A-
National City Bank B Short-term certificates of deposit R-1 (mid) F1+ P-1 A-1 Long-term certificates of deposit AA (low) AA- A1 A+ Senior bank notes AA (low) A+ A1 A+ Subordinated bank notes A (high) A A2 A
Common Stock Information First Second Third Fourth Full Quarter Quarter Quarter Quarter Year
2007 Dividends paid $ .39 $ .39 $ .41 $ .41 $ 1.60 High 38.94 38.32 34.30 27.21 38.94 Low 34.82 33.08 24.88 15.76 15.76 Close 37.25 33.32 25.09 16.46 16.46
2006 Dividends paid $ .37 $ .37 $ .39 $ .39 $ 1.52 High 36.25 38.04 37.42 37.47 38.04 Low 33.26 34.38 34.50 35.29 33.26 Close 34.90 36.19 36.60 36.56 36.56
Corporate Information

1900 East Ninth Street Cleveland, Ohio 44114-3484 NationalCity.com
Points from National City is a National City Corporation® registered service mark. 74-0549-00 (Rev. 02/08)