new york geneva miami annual report...
TRANSCRIPT

New York Geneva Miami
www.elizabetharden.com Annual Report 2007
88724_Cov:Layout 1 10/1/07 5:19 PM Page 1

The new fragrance
Catherine Zeta-Jones ©
Eliz
abet
h A
rden
, Inc
.
Corporate Offices2400 S.W. 145 AvenueMiramar, Florida 33027954-364-6900
200 Park Avenue SouthNew York, New York 10003212-261-1000
200 First Stamford PlaceStamford, Connecticut 06902203-462-5700
28, chemin de Joinville1216 Cointrin-Geneva41-22-791-8711
Investor RelationsFor investor information, including filings with the Securities and Exchange Commission and other financial literature, please visit our website at www.elizabetharden.com or write to us at:
Elizabeth Arden, Inc. Investor Relations200 Park Avenue SouthNew York, NY 10003
Transfer Agent and RegistrarAmerican Stock Transfer and Trust Company59 Maiden LaneNew York, New York 10038800-937-5449
Independent RegisteredPublic Accounting FirmPricewaterhouseCoopers LLP300 Madison AvenueNew York, New York 10017
Common Stock InformationOur common stock is traded on the NASDAQ Global Select Market under the symbol “RDEN.”
Annual MeetingOur annual meeting of shareholders will be held onNovember 14, 2007 at 10:00 a.m., local time, at our executive offices located at 2400 S.W. 145 Avenue, Miramar, Florida 33027.
CORPORATE AND INVESTOR INFORMATION
E. Scott BeattieChairman, President
and Chief Executive OfficerElizabeth Arden, Inc.
Fred BerensManaging Director - InvestmentsWachovia Securities, Inc.
Maura J. Clark(1,3)
PresidentCommercial and Industrial EnergyDirect Energy Services, LLC
Richard C.W. MauranPrivate Investor
William M. Tatham(1,2)
Chairman and Chief Executive OfficerNexJ Systems, Inc.
J.W. Nevil Thomas(2,3)
President and Chief Executive Officer Nevcorp
Paul WestVice ChairmanElizabeth Arden, Inc.
D i r e c t o r s
Desig
ned
and
prod
uced
by R
R Do
nnell
ey F
inanc
ial, M
iami, F
lorida
(1) Audit Committee Member(2) Compensation Committee Member(3) Nominating and Corporate Governance Committee Member
(1)Chairperson (2)Chairperson
(3)Chairperson
Elizabeth Arden brands featured on our cover.
1st Row: Danielle by Danielle Steel, Nanette Lepore, M by Mariah Carey, Britney Spears believe, Lulu Guinness, Jewel Alfred Sung
2nd Row: Elizabeth Arden Red Door, PREVAGE®, Ceramide Gold UltraRestorative Capsules, Eight HourCream, Elizabeth Arden Intervene,Elizabeth Arden green tea
3rd Row: with Love... Hilary Duff, BadgleyMischka Fleurs de Nuit, Elizabeth Taylor’s White Diamonds, Wings, fantasy Britney Spears, GANT Adventure
4th Row: HUMMER®, GANT Liquid, Halston Z-14, Daytona 500®,Elizabeth Arden 5th Avenue after five, White Shoulders
5th Row: Elizabeth Arden Provocative Woman,Sunflowers, curious Britney Spears,PS®, Giorgio Beverly Hills, Grey Flannel
88724_Cov:Layout 1 9/28/07 3:30 PM Page 2

1
F I N A N C I A L H I G H L I G H T S
Net sales
Gross profit
Net income, as reported
Net income, as adjusted
Diluted earnings (loss) per commonshare, as reported
Diluted earnings per commonshare, as adjusted
Shareholders’ equity
EBITDA, as reported(g)
EBITDA, as adjusted(g)
$1,127,476
461,319
37,334
39,078(b)
$ 1.30
1.36(b)
$ 320,927
$ 98,524
100,618(b)
$ 920,538
411,364
37,604
39,072(d)
$ 1.25
1.30(d)
$ 259,200
$ 100,038
102,194(d)
$ 954,550
404,072
32,794
34,231(c)
$ 1.10
1.15(c)
$ 277,847
$ 89,608
91,539(c)
$ 832,003
349,200
2,928
27,922(e)
$ (1.66)
1.01(e)
$ 202,060
$ 51,358
93,702(e)
$ 746,142
304,278
9,987
9,863(f)
$ 0.35
0.34(f)
$ 98,989
$ 81,907
81,733(f)
Pro forma twelve months ended(a)in thousands, except per share data
(a) On June 2, 2004, the Company’s Board of Directors approved a fiscal year-end change from January 31 to June 30. The pro forma presentation reflects the unauditedconsolidated selected financial data for the equivalent prior-year periods based on the new fiscal year end, consistent with the presentation on our corporate website.
(b) Adjusted to exclude restructuring charges of $2.1 million.
(c) Adjusted to exclude debt extinguishment charges associated with long-term debt redemption and restructuring charges of $0.8 million and $1.2 million, respectively.
(d) Adjusted to exclude impairment charge related to the then anticipated sale of the Miami Lakes facility of $2.2 million.
(e) Adjusted to exclude debt extinguishment charges associated with long-term debt redemption and corporate restructuring charges of $38.8 million and $3.5 million, respectively, and the accelerated accretion on converted preferred stock.
(f) Adjusted to exclude debt extinguishment gain associated with long-term debt redemption of $0.2 million.
(g) EBITDA is defined as net income plus the provision for income taxes, plus interest expense, plus depreciation and amortization.
Fiscal year endedJune 30, 2007
(Audited)June 30, 2004
(Unaudited)June 28, 2003
(Unaudited)June 30, 2005
(Audited)
Fiscal year ended
NET SALES EPS
El
iz
ab
et
h
Ar
de
n
An
nu
al
R
ep
or
t
20
07
June 30, 2006(Audited)
For additional detail and information, including a discussion of EBITDA, please refer to Part II, Item 6, Selected Financial Data in our Annual Report on Form 10-K, which is included in this Annual Report. Also, the fiscal years ended June 30, 2006 and June 30, 2007 reflect share-based payment expenses resulting from the applicationof SFAS 123R, which we adopted on July 1, 2005 for the year ended June 30, 2006 and subsequent periods.
*
* Diluted earnings per common share, as adjusted.
88724_8pgr:Layout 1 10/2/07 5:53 PM Page 2

2
iscal 2007 marked the achievement of a major milestone for Elizabeth Arden as we topped the $1 billion mark in net sales. Total net sales increased by18.1% to a record $1.127 billion, and our reported earnings per diluted
share grew a healthy 18.2% to $1.30 from $1.10.
Our record sales and strong earnings growth reflectthe strength of our multi-dimensional business model.Our business performed well across all facets:geography, tiers of distribution and brand portfolio.In particular, our North America fragrances andInternational businesses contributed strongly to our results, as did our Elizabeth Arden-branded skin care and color cosmetics products. Theseresults were fueled in part by the successful inte-gration of two strategic acquisitions this past year,continued successful innovation in our productofferings and further expansion and developmentof our International markets.
Net Sales of North America Fragrances Business Grew by 23%
The growth of our North America fragrances business was led by the introduction of new ownedbrands and brands that we distribute on behalf ofour beauty partners. During this fiscal year, we integrated both the Riviera Concepts and SovereignSales acquisitions into our business, allowing us tosell to new prestige retailers, expand our productofferings and programs and increase our marketshare. We increased sales with virtually every oneof our key U.S. mass retail customers in fiscal 2007.Our unique ability to create differentiated productofferings in multiple tiers of distribution allows us tocreate additional sales opportunities for our brandsand offer a healthy pipeline of new products to allour North America fragrance retailers.
FE
li
za
be
th
A
rd
en
A
nn
ua
l
Re
po
rt
2
00
7
D E A R F E L L O WS H A R E H O L D E R S :
F
88724_8pgr:Layout 1 9/28/07 2:48 PM Page 3

3
This fiscal year we introduced an unprecedentednumber of fragrances to our mass and mid-tierretail customers, including brands that we own suchas fantasy Britney Spears (which became the numberone new fragrance launch at mass retailers duringcalendar 2006), with Love…Hilary Duff and Danielleby Danielle Steel, as well as fragrance brands we dis-tribute on behalf of other beauty companies. Afterlaunching Danielle by Danielle Steel at U.S. prestigedepartment stores in the fall of 2006, this fragrancewas introduced to additional retailers where itbecame the leading women’s fragrance brand during Mother’s Day 2007 at Kohl’s, JCPenney and Sears, underscoring the strength of our multi-channel distribution model.
Our Britney Spears fragrances, which representedjust under 10% of our net sales in fiscal 2007, continued to perform well and helped drive ourmass retail business. Retail sales of Britney Spearsfragrances were up double digits at mass retailers in the second half of fiscal 2007. Britney Spears fragrances, including fantasy Britney Spears and curious Britney Spears (representing two of the topten launches at U.S. prestige department stores for calender years 2004-2006*), are sold acrossmultiple outlets worldwide. Approximately half of the sales of Britney Spears fragrances in fiscal 2007 occurred outside the U.S. Based on the success of these fragrances and the mostrecent addition to the Britney Spears franchise, midnight fantasy, we believe there continues to be good demand around the world for these fragrances. We are excited about the newestBritney Spears fragrance, Britney Spears believe,which we are introducing in the fall of 2007 in the U.S. and internationally in the spring of 2008.
International Net Sales Increased by 12%
Our International business, which representedapproximately 35% of our net sales in fiscal 2007,also continued its positive performance with strong sales increases in our Asia Pacific and TravelRetail markets and continued solid growth in othermarkets, including Latin America and the Middle East. In January 2007 we opened an office in Dubai,which is serving as our headquarters for ourMiddle East business, where we are experiencingrapid growth in the demand for our products.
As we mentioned last year, we acquired our distrib-utor’s business in China and Taiwan and establishedaffiliates in those markets. These two affiliatestogether with our business in Hong Kong are nowbeing managed as one integrated Greater Chinabusiness from our headquarters in Shanghai.Revenues in Greater China doubled this year, andwe currently expect revenues from this market togrow by another 50% in fiscal 2008.
In China and other developing markets such asIndia and Brazil, where beauty represents an aspira-tional luxury, we are seeing tremendous potential for our brands and are implementing initiatives toexploit these opportunities. In Brazil, for example,we will be implementing a strategy to engage inlocal partnerships and production. This will allow us to make our products more affordable for thelocal consumer and to better service the emergingdemand in this rapidly developing market.
El
iz
ab
et
h
Ar
de
n
An
nu
al
R
ep
or
t
20
07
*Source: NPD.
Elizabeth Arden counter in Shanghai
PREVAGE® billboard - China
88724_8pgr:Layout 1 9/28/07 2:48 PM Page 4

Our Travel Retail business has been particularly suc-cessful, with our retail sales growth outpacing thecategory for the past two calendar years. In fact,we are one of a few companies to have increasedour market share in Travel Retail for the past fouryears. Travel Retail outlets represent an ideal shoppingvenue in markets where the retail infrastructure is less developed, such as China, India and LatinAmerica. We benefited in that sector from the success of our licensed brands, such as the BritneySpears and Hilary Duff fragrances, and are particularlypleased by the sales growth of our Elizabeth Arden-branded products, which outpaced the growth ofthe category for the 2006 calendar year. The mostnotable successes included the new PREVAGE®
Eye Anti-Aging Moisturizing Treatment, the continuedsuccess of PREVAGE® Anti-Aging Treatment, whichlaunched in Travel Retail in fiscal 2006, and othercore Elizabeth Arden-branded products, includingEight Hour Cream, Elizabeth Arden Ceramide andElizabeth Arden green tea fragrances.
Net Sales of Elizabeth Arden Skin Care andColor Cosmetics Products Grew by 16%
The Elizabeth Arden brand is key to the strength of our business. We believe that the ElizabethArden brand, which represented nearly $500 mil-lion in net sales in fiscal 2007, is one of the mostrecognized names in beauty globally and has significantgrowth potential. In fiscal 2007, over 60% of thenet sales of Elizabeth Arden-branded products weremade outside the U.S., and we believe there aretremendous opportunities for the growth of thisbrand internationally, particularly in developing markets. Our objective is to elevate the ElizabethArden brand to one that the world recognizes not only as a beauty icon, but as a progressive and innovative brand that continues to maintain relevance with today’s global consumer.
In fiscal 2007, we made tremendous progress infocusing our Elizabeth Arden skin care and colorbusiness on three core skin care lead franchises:Ceramide, our established corrective anti-aging skincare line targeted to women who are 40 and over; Intervene, our pre-emptive anti-aging skin careregime targeted to the 30 to 50 year old whodesires to fight the signs of aging; and PREVAGE®
Anti-Aging Treatment, our premium cosmeceuticalproduct, which is the perfect complement to bothCeramide andIntervene. EightHour Cream, ourall-purpose skincare brand, has a long heritagedating back to the 1930’s. It wasone of the firstbrands ever creat-ed by ElizabethArden herself and still commandssignificant brandloyalty today. By aligning our cos-metic productswith these distinctpillars and rationalizing all of our product offeringsthat cannot be categorized within these franchises, we have simplified our offerings for both consumersand the beauty consultants selling our products.
Award-winning PREVAGE® Anti-Aging Treatmenthas significantly affected the Elizabeth Arden brandsince its November 2005 introduction. PREVAGE®
has elevated the Elizabeth Arden brand image and market share, improved beauty counter productivity,and provided entry into luxury channels of distribu-tion and new markets. Sales of PREVAGE® productsincreased by 45% in fiscal 2007, with 60% of salesoccurring outside the U.S. Given the success ofPREVAGE® in various markets around the world, we believe the potential for this brand is consi-derable. For example, in its first year, PREVAGE®
became the #1 cosmeceutical brand across theAsia-Pacific Travel Retail market. It continues to win numerous awards around the world as well,including most recently the award for highestgrowth for a beauty product in Mexico, the Prix De Marie Claire award in Australia, the Best New
4
El
iz
ab
et
h
Ar
de
n
An
nu
al
R
ep
or
t
20
07
Elizabeth Arden displays - Dubai
88724_8pgr:Layout 1 10/2/07 5:25 PM Page 5

Product Award for Prestige Skin Care in Canada and the best campaign in the luxury goods and fashion category at the Media and Marketing pan-European Media Awards.
We believe the strength of PREVAGE®, coupledwith the quality of our innovation, will allow us tocapture additional market share for the ElizabethArden brand globally.
Notable skin care and color products that are beingintroduced in fiscal 2008 include Ceramide GoldUltra Restorative Capsules, PREVAGE® Anti-Aging NightCream, a Limited Edition Eight Hour Cream, a foundationto complement the newly launched Intervene skincare line and a whitening skin care treatment prod-uct, Elizabeth Arden White Glove, targeted for Asia.
The Breadth of our Prestige FragrancePortfolio is a Continued Source of Strength
Our diverse fragrance brand portfolio is a signifi-cant asset to our business. Net sales of fragrancesincreased by approximately 20% globally in fiscal 2007. We classify this expansive portfolio of fragrance brands into the following categories:the Elizabeth Arden-branded fragrances, including
Elizabeth Arden Red Door, Elizabeth Arden 5th Avenue,Elizabeth Arden green tea and our most recentlaunch, Elizabeth Arden Mediterranean, all of which are promoted by our beautiful and elegantcorporate spokesperson, Catherine Zeta-Jones;celebrity fragrances, including Elizabeth Taylor’s White Diamonds, a perennial best-seller, and thenew fragrance M by Mariah Carey, which are eachtargeted towards a specific consumer demographic;designer fragrance brands, including the newlyacquired Badgley Mischka and Alfred Sung fra-grances, which are sold in prestige distribution and target an audience familiar with their clothingand accessory designs, and the Halston and GANTfragrance brands; and lifestyle fragrance brands,including Giorgio Beverly Hills, another global classicfragrance brand we added to our portfolio in fiscal2007, HUMMER® Fragrance for Men, under a licenseagreement with General Motors Corporation,and Paul Sebastian, all of which represent aspira-tional lifestyles with which consumers want to be associated.
5
El
iz
ab
et
h
Ar
de
n
An
nu
al
R
ep
or
t
20
07Diverse
FragrancePortfolio
Celebrity
Mariah Carey
Hilary Duff
Britney Spears
Danielle Steel
Elizabeth Taylor
Elizabeth Arden-branded
5th Avenue
green tea
Mediterranean
Provocative Woman
Red Door
Designer
Geoffrey Beene
GANT
Lulu Guinness
Halston
Nanette Lepore
Bob Mackie
Badgley Mischka
Alfred Sung
Lifestyle
Daytona 500
Giorgio
HUMMER®
Paul Sebastian
White Shoulders
88724_8pgr:Layout 1 9/28/07 2:49 PM Page 6
This large selection of brands allows us to sell ourproducts around the world (over 40% of fiscal 2007net sales of our owned and licensed fragrancesoccurred outside the U.S.) and to multiple retailers,from luxury and specialty stores to mass retailers,allowing us to reach a diverse consumer demographic.For example, the recent launch of Badgley Mischkaat Saks 5th Avenue in Dubai achieved the numberone ranking in its first two weeks of launch. ElizabethArden Mediterranean, which was launched in fiscal 2007to retailers in the U.S. and in various internationalmarkets, is still being introduced in additional marketsaround the world. For example, in Australia, ElizabethArden Mediterranean was the best-selling fragrance forthe first four weeks after its launch in August 2007.
We also have a growing and significant portfolio ofdistributed brands, where we partner with otherbeauty companies to distribute top prestige fragrancebrands to mass and mid-tier retailers. This allows usto offer our retailers an even broader assortmentof fine fragrances.
Focus for Fiscal 2008 and Beyond: ImprovedReturn on Invested Capital throughImproved Operating Margins and Cash Flow
Our entire organization is intently focused onimproving our return on invested capital by drivingoperating margins, earnings and cash flow. Our his-torical operating margins were higher than the oper-ating margin reported in fiscal 2007, and our objectiveis to return and to surpass our historical operatingmargins over the next several years. We have iden-tified, and are well underway in implementing, anumber of initiatives, including a re-engineering ofour extended supply chain and logistics functions,improving fragrance portfolio management and the
development of key European account management,to contribute to improved return on invested capital.These initiatives, as well as the improved leverage ofour international platform and global infrastructure,should allow us to achieve our goals.
For fiscal 2008, we also further improved our com-pensation structure to ensure even closer alignmentwith specific financial and operating metrics.
Re-engineering of Supply Chain and Logistics Processes
A major area of opportunity is to better leverageour increased sales volume throughout our extended supply chain and logistics functions. Last year, we hired a world class consulting firmwith over 30 years of experience in assisting companies drive improvements in the areas of product development and supply chain and logistics execution. During fiscal 2007, this firm
6
El
iz
ab
et
h
Ar
de
n
An
nu
al
R
ep
or
t
20
07
Harper’s Bazaar-Australia
88724_8pgr:Layout 1 9/28/07 2:49 PM Page 7

completed an extensive review and assess-ment of our global extended supply chainand logistics functions and benchmarked ourperformance against industry standards andidentified specific areas of opportunity toleverage our growth and gain operationalefficiencies. We have begun implementingprograms in areas that include account management, sales and operations planning, materials management, strategic sourcing andlogistics fulfillment. We expect to re-engineerthese processes in fiscal 2008, with the expectedbenefits to more significantly impact our fiscal 2009and fiscal 2010 performance. In addition to improvedoperating margins, we expect this initiative to resultin reduced inventories, increased operating cash flowand improved capacity to handle additional volume.
Fragrance Portfolio Management
With a strategy to find the appropriate balancebetween market relevant support and maximizingreturn on invested capital, we also have completeda review of how we manage our brand supportand allocate resources across our brand portfolio.For example, this year we are allocating a significant per-centage of our advertising spend behind classic fra-grance brands such as Elizabeth Taylor’sWhite Diamonds and Elizabeth ArdenRed Door to increase the profitabilityof our fragrance portfolio. TheElizabeth Taylor fragrance franchise, forexample, continues to be our crownjewel. Year after year, White Diamondsis the top-selling fragrance at mass andmid-tier retailers, and at U.S. depart-ment stores consistently ranks amongthe top ten best-selling holiday giftsets in the fragrance category.
We are also re-balancingthe advertising spend on new launches to more effectively reach consumers by better coordinating ourmedia spend with consumertraffic and launch activity.
Our newest celebrity fra-grance, M by Mariah Carey,is launching in the fall of
2007. Mariah is the best-selling female recordingartist of all time with 17 number one singles in the U.S. and global album sales exceeding 160 million units. Mariah’s popularity spans theglobe as evidenced by her record sales. In fact,record sales for the GRAMMY® award-winningEmancipation of Mimi album exceeded ten millioncopies worldwide. Based on the global appeal of Mariah Carey, we are introducing this brand to retailers in the U.S and internationally at thesame time, a first for us for a major fragrancelaunch. We are excited by the response so far from our consumers and retailers to M by Mariah Carey, including the recently launched mariahcareybeauty.com website, where pre-orders of her fragrance exceeded expectations.
Other fragrance launches slated for fiscal 2008include Fleurs De Nuit, a new Badgley Mischka fragrance, GANT Summer, a new Elizabeth Ardengreen tea fragrance and a new Hilary Duff fragrance, wrapped with love.
European Key Account Focus
In fiscal 2007, we completed the restructuring ofour European sales and marketing organizationsand created a pan-European “key account”organization to better serve European retailers.
Many of our retail customers in Europe, such as Douglas,Sephora and Marionnaud, havebecome more pan-European. As a result, we have realignedour sales infrastructure to bemore account focused, ratherthan geographically focused. We believe these initiatives will help us expand our Europeansales and improve profitability.
7
El
iz
ab
et
h
Ar
de
n
An
nu
al
R
ep
or
t
20
07
Mark Badgley and James Mischka at “bottle signing” (Nordstrom, Costa Mesa, California).
88724_8pgr:Layout 1 10/2/07 5:31 PM Page 8

8
We also are applying the skill and expertise that we developed for the U.S. mass retail market ininternational markets where appropriate. We have had success in Australia where we began selling select prestige products to mass retailers in that market. Net sales in Australia grew over50% in fiscal 2007. We are in the process of actively exploring opportunities to implement this strategy in Europe in fiscal 2008. We believethere are significant opportunities given the number of emerging, fast growing and high quality “masstige” retailers.
Expand E-commerce and other distribution channels
We are well underway in elevating our e-commercestrategy and developing additional outlets of distribution for our products, including testingfree standing kiosk-type vending machines throughZoom Systems, which are located in malls, airportsand resorts. In fiscal 2007, we also hired resourcesto more fully develop our e-commerce strategy. Our new e-commerce site is intended to create on-line brand awareness and loyalty and expand theconsumer base. It also provides an ideal avenue to educate consumers about our skin care, cosmetics and fragrance products.
Grow Cash Flow
We generated cash flow from operations of $59million this year and we are committed to growing our cash flow in fiscal 2008, with more significantincreases in fiscal 2009 as the results from the initiatives outlined previously are achieved. We intendto use our free cash flow to pay down our operating
line, make acquisitions as appropriate opportunitiesarise and repurchase stock. Through fiscal 2007, we repurchased approximately $45 million of stockunder our $80 million stock buyback program.
The Support of Our Key Employees and Stakeholders
We thank you, our shareholders, for your conti-nued support and confidence in Elizabeth Arden.As a public company, we are seriously committedto strong principles of corporate governance toensure that we operate at the highest and mostresponsible level. I am pleased to report that ourcorporate governance quotient over the past fouryears, as determined by Institutional ShareholderServices, which ranks over 8,000 companies world-wide on the strengths, deficiencies and risks of acompany's corporate governance practices, puts us in the top 10% of companies that make up theRussell 3000 index.
On behalf of the entire Elizabeth Arden organiza-tion, I also would like to thank our retail and supplypartners around the world.
Finally, I would like to take this opportunity to thankthe talented employees and beauty advisors whoare so very dedicated to the success of ElizabethArden. Thanks to your support and dedication, we look forward to continued success and profitable growth for the foreseeable future.
El
iz
ab
et
h
Ar
de
n
An
nu
al
R
ep
or
t
20
07
E. Scott BeattieChairman, President and Chief Executive Officer
Elizabeth Arden counter in India
88724_8pgr:Layout 1 9/28/07 2:49 PM Page 9

Elizabeth Arden, Inc.
TABLE OF CONTENTS
Page
Part I
Item 1. Business . . . . . . . . . . . . . . . . . . . . . . . . . . . . . . . . . . . . . . . . . . . . . . . . . . . . . . . . . . 11
Item 1A. Risk Factors . . . . . . . . . . . . . . . . . . . . . . . . . . . . . . . . . . . . . . . . . . . . . . . . . . . . . . 20
Item 1B. Unresolved Staff Comments . . . . . . . . . . . . . . . . . . . . . . . . . . . . . . . . . . . . . . . . . . 25
Item 2. Properties . . . . . . . . . . . . . . . . . . . . . . . . . . . . . . . . . . . . . . . . . . . . . . . . . . . . . . . . 25
Item 3. Legal Proceedings . . . . . . . . . . . . . . . . . . . . . . . . . . . . . . . . . . . . . . . . . . . . . . . . . . 26
Item 4. Submission of Matters to a Vote of Security Holders . . . . . . . . . . . . . . . . . . . . . . . 26
Part II
Item 5. Market For Registrant’s Common Equity, Related Stockholder Matters andIssuer Purchases of Equity Securities . . . . . . . . . . . . . . . . . . . . . . . . . . . . . . . . . 27
Item 6. Selected Financial Data . . . . . . . . . . . . . . . . . . . . . . . . . . . . . . . . . . . . . . . . . . . . . 29
Item 7. Management’s Discussion and Analysis of Financial Condition and Results ofOperation . . . . . . . . . . . . . . . . . . . . . . . . . . . . . . . . . . . . . . . . . . . . . . . . . . . . . . 31
Item 7A. Quantitative and Qualitative Disclosures About Market Risk . . . . . . . . . . . . . . . . 44
Item 8. Financial Statements and Supplementary Data . . . . . . . . . . . . . . . . . . . . . . . . . . . 46
Item 9. Changes in and Disagreements with Accountants on Accounting and FinancialDisclosure . . . . . . . . . . . . . . . . . . . . . . . . . . . . . . . . . . . . . . . . . . . . . . . . . . . . . . 87
Item 9A. Controls and Procedures . . . . . . . . . . . . . . . . . . . . . . . . . . . . . . . . . . . . . . . . . . . . . 87
Item 9B. Other Information . . . . . . . . . . . . . . . . . . . . . . . . . . . . . . . . . . . . . . . . . . . . . . . . . . 87
Part III
Item 10. Directors, Executive Officers and Corporate Governance . . . . . . . . . . . . . . . . . . . 87
Item 11. Executive Compensation . . . . . . . . . . . . . . . . . . . . . . . . . . . . . . . . . . . . . . . . . . . . . 87
Item 12. Security Ownership of Certain Beneficial Owners and Management and RelatedStockholder Matters . . . . . . . . . . . . . . . . . . . . . . . . . . . . . . . . . . . . . . . . . . . . . . 88
Item 13. Certain Relationships and Related Transactions, and Director Independence . . . 88
Item 14. Principal Accounting Fees and Services . . . . . . . . . . . . . . . . . . . . . . . . . . . . . . . . . 88
Part IV
Item 15. Exhibits, Financial Statement Schedules . . . . . . . . . . . . . . . . . . . . . . . . . . . . . . . 88
Signatures . . . . . . . . . . . . . . . . . . . . . . . . . . . . . . . . . . . . . . . . . . . . . . . . . . . . . . . . . . . . . . . . . . . 92
10

PART I
ITEM 1. BUSINESS
General
Elizabeth Arden, Inc., is a global prestige beauty products company with an extensive portfolioof prestige fragrance, skin care and cosmetics brands. We market approximately 100 owned orlicensed prestige brands, including the Elizabeth Arden fragrances: Red Door, Elizabeth Arden 5thAvenue, Elizabeth Arden Provocative Woman, Elizabeth Arden green tea, and Elizabeth ArdenMediterranean; the Elizabeth Arden skin care brands: Ceramide, Eight Hour Cream, Intervene andPREVAGE™; and the Elizabeth Arden branded lipstick, foundation and other color cosmeticsproducts. Our fragrance portfolio also includes the Elizabeth Taylor fragrance brands: WhiteDiamonds and Elizabeth Taylor’s Passion; the Britney Spears fragrance brands: curious BritneySpears, fantasy Britney Spears and Britney Spears believe; the Hilary Duff fragrance withLove...Hilary Duff; the Danielle Steel fragrance Danielle by Danielle Steel; the Mariah Careyfragrance M by Mariah Carey; the fragrance brands White Shoulders, Giorgio Beverly Hills andGiorgio Red; the men’s fragrances: Daytona 500, HUMMERTM Fragrance for Men and PS FineCologne for Men; and the designer fragrance brands of Alfred Sung, Badgley Mischka, BobMackie, GANT, Lulu Guinness, Nanette Lepore, Geoffrey Beene and Halston. In addition toour owned and licensed fragrance brands, we distribute over 300 additional prestige fragrancebrands, primarily in the United States through distribution agreements and other purchasingarrangements.
We sell our prestige beauty products to retailers and other outlets in the United States andinternationally, including;
• department stores such as Macy’s, Dillard’s, Belk, JCPenney, Saks and Nordstroms;
• mass retailers such as Wal-Mart, Target, Sears, Kohl’s, Walgreens, Rite-Aid and CVS; and
• international retailers such as Boots, Debenhams, Sephora, Marionnaud, Hudson’s Bay,Shoppers Drug Mart, Myer, Douglas and various travel retail outlets such as Nuance,Heinemann and WDF.
In the United States, we sell our Elizabeth Arden skin care and cosmetics products primarily inprestige department stores and our fragrances in prestige department stores and mass retailers. Wealso sell our Elizabeth Arden fragrances, skin care and cosmetics products and other fragrance linesin approximately 90 countries worldwide through perfumeries, boutiques, department stores andtravel retail outlets, such as duty free shops and airport boutiques, and on the internet. Ourinternational operations are subject to volatility because of foreign currency exchange rate changes,inflation and changes in political and economic conditions in the countries in which we operate. Thevalue of international assets is affected by fluctuations in foreign currency exchange rates.
On August 11, 2006, we completed the acquisition of certain assets comprising the fragrancebusiness of Sovereign Sales, LLC, including inventory and certain intangible assets. Sovereign Saleswas a distributor of prestige fragrances to mass retail customers. This acquisition has allowed us tooffer additional fragrance brands to our mass retail customers.
On June 29, 2006, we completed the acquisition of certain assets of Riviera Concepts Inc.,including inventory, accounts receivable and brand licenses for a number of fragrance brands,including the fragrance brands of Alfred Sung, HUMMER™, Badgley Mischka, Nannette Lepore andBob Mackie.
11

Our net sales to customers in the United States and internationally in dollars and net sales as apercentage of consolidated net sales for the years ended June 30, 2007, 2006 and 2005, are listed inthe following chart:
Years Ended June 30,2007 2006 2005
(Amounts in millions) Sales % Sales % Sales %
United States . . . . . . . . . . . . . . . . . . . . . $ 706.5 63% $576.7 60% $571.4 62%International . . . . . . . . . . . . . . . . . . . . . 421.0 37% 377.9 40% 349.1 38%
Total . . . . . . . . . . . . . . . . . . . . . . . . $1,127.5 100% $954.6 100% $920.5 100%
Our largest foreign countries in terms of net sales for the years ended June 30, 2007, 2006 and2005, are listed in the following chart:
Years Ended June 30,(Amounts in millions) 2007 2006 2005
United Kingdom . . . . . . . . . . . . . . . . . . . . . . . . . . . . . . . . . . . . . . . . $45.9 $47.5 $45.6Canada . . . . . . . . . . . . . . . . . . . . . . . . . . . . . . . . . . . . . . . . . . . . . . . 38.8 32.1 30.7Australia . . . . . . . . . . . . . . . . . . . . . . . . . . . . . . . . . . . . . . . . . . . . . . 31.6 20.4 17.9Spain . . . . . . . . . . . . . . . . . . . . . . . . . . . . . . . . . . . . . . . . . . . . . . . . . 23.9 23.0 25.4
For information on the breakdown of our long-lived assets in the United States and internationallyand risks associated with our international operations, see Note 19 to the Notes to ConsolidatedFinancial Statements.
Our principal executive offices are located at 2400 S.W. 145th Avenue, Miramar, Florida33027, and our telephone number is (954) 364-6900. We maintain a website with the addresswww.elizabetharden.com. We are not including information contained on our website as part of norincorporating it by reference into this Annual Report on Form 10-K. We make available free ofcharge through our website our Annual Reports on Form 10-K, Quarterly Reports on Form 10-Qand Current Reports on Form 8-K, and amendments to these reports, as soon as reasonablypracticable after we electronically file such material with or furnish such material to the Securitiesand Exchange Commission.
Information relating to corporate governance at Elizabeth Arden, Inc., including our CorporateGovernance Guidelines and Principles, Code of Ethics for Directors and Executive and FinanceOfficers, Code of Business Conduct and charters for the Audit Committee, the CompensationCommittee and the Nominating and Corporate Governance Committee, is available on our websiteunder the section “EA Corporate — Investor Relations — Corporate Governance.” We will providethe foregoing information without charge upon written request to Secretary, Elizabeth Arden, Inc.,2400 S.W. 145th Avenue, Miramar, FL 33027.
Business Strategy
Our business strategy is to grow our brand portfolio by investing behind our core brands and toacquire control of and develop additional prestige brands through brand development, acquisitionsand new licensing and distribution agreements that will complement our existing brand portfolioand target additional demographics. We are also focused on improving our cash flow and operatingmargins, particularly through improving our extended supply chain and logistics functions,managing the advertising spend behind our new fragrance launches and leveraging our globaloverhead structure more efficiently. In fiscal 2008, we plan to launch a number of new brands andproducts, including our new Mariah Carey fragrance, M by Mariah Carey, a new Britney Spearsfragrance, Britney Spears believe, and the night cream PREVAGETM Night, as well as introduce newdistributed fragrance brands to mass retailers on behalf of other beauty companies.
12

During the fiscal year ended June 30, 2007, we (i) acquired the exclusive worldwide license forthe Giorgio Beverly Hills brand, (ii) launched a new Elizabeth Arden skin care line, Intervene,(iii) and launched a new Elizabeth Arden fragrance, Elizabeth Arden Mediterranean, and the withLove...Hilary Duff and Danielle by Danielle Steel fragrances. In addition, during fiscal 2007, wecompleted the acquisition of certain assets comprising the fragrance business of Sovereign Sales,LLC, a prestige fragrance distributor to U.S. mass retailers, and the prestige fragrance brandportfolio of Riviera Concepts Inc., including licenses to manufacture the Alfred Sung, HUMMER™,Badgley Mischka, Nannette Lepore and Bob Mackie fragrance brands. These acquisitions andlicensing arrangements have enabled us to expand our market share with our mass retail customersand sell our products into new retailers and markets, and to broaden our fragrance portfolio.
We are also investing in certain developing markets around the world that we believe havesignificant opportunities for growth of our products. During the fiscal year ended June 30, 2007, weestablished a sales affiliate in Dubai to better serve the Middle East. During the fiscal year endedJune 30, 2006, we acquired the assets of our distributors in Taiwan and China, established affiliatesin those markets and integrated those affiliates with our Hong Kong business to create a GreaterChina market. We are also focusing on expanding sales of our products in other developing marketsincluding Latin America and India.
We continue to pursue business efficiencies throughout the company, particularly in the supplychain, logistics and information technology areas. Improving our working capital efficiencies and ourcost structure also continue to be a significant focus.
Products
Our net sales of products and net sales as a percentage of consolidated net sales for the yearsended June 30, 2007, 2006 and 2005, are listed in the following chart.
Years Ended June 30,2007 2006 2005
(Amounts in millions) Sales % Sales % Sales %
Fragrance . . . . . . . . . . . . . . . . . . . . . . . . . . . . . . . . . $ 851.1 75%$716.6 75%$691.0 75%Skin Care . . . . . . . . . . . . . . . . . . . . . . . . . . . . . . . . . 200.6 18% 169.0 18% 155.5 17%Cosmetics . . . . . . . . . . . . . . . . . . . . . . . . . . . . . . . . . 75.8 7% 69.0 7% 74.0 8%
Total . . . . . . . . . . . . . . . . . . . . . . . . . . . . . . . . . . . $1,127.5 100%$954.6 100%$920.5 100%
Fragrance. We offer a wide variety of fragrance products for both men and women, includingperfume, cologne, eau de toilette, eau de parfum, body spray and gift sets. Our fragrances are classifiedinto the Elizabeth Arden branded fragrances, such as Elizabeth Arden Red Door and Elizabeth Arden5th Avenue; celebrity fragrances such as Elizabeth Taylor’s White Diamonds and the Britney Spearsfragrances; designer fragrances such as the Badgley Mischka, Halston and GANT fragrance brands;and lifestyle fragrances such as Giorgio Beverly Hills, Paul Sebastian and the HUMMERTM fragrances.Each fragrance is sold in a variety of sizes and packaging arrangements. In addition, bath and bodyproducts that are based on the particular fragrance, such as soaps, deodorants, body lotions, gels,creams and dusting powder are sold to complement the fragrance lines. We tailor the size andpackaging of the fragrance to suit the particular target customer. Our fragrance products generallyretail at prices ranging from $5 to $225, depending on the size, type and packaging of the product.
Skin Care. Our skin care lines are sold under the Elizabeth Arden name and include productssuch as moisturizers, creams, lotions and cleansers. Our core product brands include Ceramide,PREVAGE™, Eight Hour Cream, and Intervene, a new skin care line targeted for the 30 to 50 yearold customer. We sell skin care products internationally and in the United States, primarily inprestige department and specialty stores, perfumeries and travel retail outlets. Our skin careproducts generally retail at prices ranging from $16 to $335.
13

Cosmetics. Under the Elizabeth Arden name, we offer a variety of cosmetics, includingfoundations, lipsticks, mascaras, eye shadows and powders. We offer these products in a wide arrayof shades and colors. Our strategy is to align our color offerings with our core skin care products. Weuse our cosmetic products to attract consumers to the beauty counters at department stores wherethe Elizabeth Arden fragrance and skin care products are also sold. We sell our cosmeticsinternationally and in the United States, primarily in prestige and specialty stores, perfumeries andtravel retail outlets. Our cosmetic products generally retail at prices ranging from $14 to $49.
Trademarks, Licenses and Patents
We own or have rights to use the trademarks necessary for the manufacturing, marketing,distribution and sale of numerous fragrance, cosmetic and skin care brands, including ElizabethArden’s Red Door, Red Door Revealed, Elizabeth Arden 5th Avenue, Elizabeth Arden ProvocativeWoman, Elizabeth Arden Mediterranean, Visible Difference, Plump Perfect, Intervene, Millennium,White Shoulders, Halston, Z-14, PS Fine Cologne for Men, Design and Wings. We have registeredthese trademarks, or have applications pending, in the United States and in certain of the countriesin which we sell these product lines. We consider the protection of our trademarks to be important toour business.
We are the exclusive worldwide trademark licensee for a number of fragrance brands includingthe Elizabeth Taylor fragrances White Diamonds and Elizabeth Taylor’s Passion; the Alfred Sungfragrance brands SUNG Alfred Sung, SHI Alfred Sung and JEWEL Alfred Sung; the HUMMER™fragrances HUMMER™ and H2; the designer fragrance brands of Badgley Mischka, Nanette Lepore,Bob Mackie, Lulu Guinness, Geoffrey Beene and Halston, the Britney Spears fragrances curiousBritney Spears and fantasy Britney Spears; the Hilary Duff fragrance with Love...Hilary Duff; theDanielle Steel fragrances Danielle by Danielle Steel; the Mariah Carey fragrance M by MariahCarey, and the Giorgio fragrances Giorgio Beverly Hills and Giorgio Red. We are the exclusiveworldwide licensee for the PREVAGE™ skin care line for retail outlets. The Taylor license agreementterminates in October 2022 and is renewable by us, at our sole option, for unlimited 20-yearperiods. The Britney Spears license terminates in December 2009 and is renewable by us, at our soleoption, for a 5-year term. The PREVAGE™ license terminates in December 2010 and is renewableby us for unlimited 5-year terms if certain sales targets are achieved. The other license agreementshave terms ranging from 2009 to 2045 and beyond and, typically, have renewal terms dependent onsales targets being achieved.
We also have the right under various exclusive distributor and license agreements to distributeother fragrances in various territories and to use the registered trademarks of third parties inconnection with the sale of these products.
Certain of our skin care and cosmetic products and the PREVAGE™ skin care line incorporatepatented or patent-pending formulations. In addition, several of our packaging methods, packages,components and products are covered by design patents, patent applications and copyrights.Substantially all of our trademarks and all of our patents are held by us or by one of our wholly-owned United States subsidiaries.
Sales and Distribution
We sell our prestige beauty products to retailers in the United States, including departmentstores such as Macy’s, Dillard’s, Saks, JCPenney, Belk and Nordstroms; mass retailers such asWal-Mart, Target, Sears, Kohl’s, Walgreens, Rite-Aid and CVS; and international retailers such asBoots, Debenhams, Sephora, Marionnaud, Hudson’s Bay, Shoppers Drug Mart, Myer, Douglas andvarious travel retail outlets such as Nuance, Heinemann and WDF. We also sell products toindependent fragrance, cosmetic, gift and other stores and through e-commerce. We currently sellour skin care and cosmetics products in the United States primarily in prestige department and
14

specialty stores. We also sell our fragrances, skin care and cosmetic products in approximately 90other countries worldwide through perfumeries, pharmacies, department stores, specialty retailers,“duty free” shops and other retail shops and travel retail locations. In certain countries, we maintaina dedicated sales force that solicits orders and provides customer service. In other countries andjurisdictions, we sell our products through local distributors under contractual arrangements. Wemanage our operations outside of North America from our offices in Geneva, Switzerland.
We also sell our Elizabeth Arden products in the Elizabeth Arden and Red Door beauty salons,which are owned and operated by an unrelated third party. In addition to the sales price of theproducts sold to the operator of these salons, we receive a licensing fee based on the net sales fromeach of the salons for the use of the “Elizabeth Arden” or “Red Door” trademarks.
Our sales and marketing support staff and personnel are organized by customer account. Oursales force routinely visits retailers to assist in the merchandising, layout and stocking of sellingareas. In the U.S., we have a sales force for Elizabeth Arden branded products that are sold inprestige distribution. For many of our mass retailers in the United States and Canada, we sell basicproducts in special packaging that deter theft and permit the products to be sold in open displays.Our fulfillment capabilities enable us to reliably process, assemble and ship small orders on a timelybasis. We use this ability to assist our customers in their retail distribution through “drop shipping”directly to their stores and by fulfilling their sales of beauty products over the Internet. In fiscal2007, we also launched an e-commerce site to sell selected products directly to consumers.
As is customary in the beauty industry, we do not generally have long-term or exclusivecontracts with any of our retail customers. Sales to customers are generally made pursuant topurchase orders. We believe that our continuing relationships with our customers are based uponour ability to provide a wide selection and reliable source of prestige beauty products, our expertisein marketing and new product introduction, and our ability to provide value-added services,including our category management services, to U.S. mass retailers.
Our ten largest customers accounted for approximately 39% of net sales for the year endedJune 30, 2007. The only customer that accounted for more than 10% of our net sales during thatperiod was Wal-Mart (including Sam’s Club), which, on a global basis, accounted for approximately18% of our net sales. The loss of or a significant adverse change in our relationship with any of ourlargest customers could have a material adverse effect on our business, prospects, results ofoperations, financial condition and cash flows.
The industry practice for businesses that market beauty products has been to grant certainretailers, subject to our authorization and approval, the right to either return merchandise or toreceive a markdown allowance for certain promotional products. We establish estimated returnreserves and markdown allowances at the time of sale based upon historical and projectedexperience, economic trends and changes in customer demand. Our reserves and allowances arereviewed and updated as needed during the year, and additions to these reserves and allowancesmay be required. Additions to our reserves and allowances may have a negative impact on ourfinancial results. We have a dedicated sales organization to sell returned products that are saleable.
Marketing
Our marketing approach emphasizes a consistent global image for our brands, and each of ourfragrance, skin care and cosmetics products is distinctively positioned with specific advertisingthemes, logos and packaging tailored for that particular product. We utilize our spokesperson,Catherine Zeta-Jones, and our classic Red Door symbol, to reinforce the Elizabeth Arden brandheritage and contemporize the Elizabeth Arden brand globally. We use traditional print, television
15

UNITED STATESSECURITIES AND EXCHANGE COMMISSION
Washington, D.C. 20549
FORM 10-KÈ ANNUAL REPORT PURSUANT TO SECTION 13 OR 15(d) OF THE
SECURITIES EXCHANGE ACT OF 1934For the fiscal year ended June 30, 2007
OR‘ TRANSITION REPORT PURSUANT TO SECTION 13 OR 15(d) OF THE
SECURITIES EXCHANGE ACT OF 1934For the transition period from to
Commission file number 1-6370
Elizabeth Arden, Inc.(Exact name of registrant as specified in its charter)
Florida 59-0914138(State or other jurisdiction of
incorporation or organization)(I.R.S. Employer
Identification No.)
2400 SW 145th Avenue,Miramar, Florida 33027
(Address of principal executive offices) (Zip Code)(954) 364-6900
(Registrant’s telephone number, including area code)Securities registered pursuant to Section 12(b) of the Act: NoneSecurities registered pursuant to Section 12(g) of the Act: Common Stock, $.01 Par Value
Indicate by check mark if the registrant is a well-known seasoned issuer, as defined in Rule 405of the Securities Act. Yes ‘ No È
Indicate by check mark if the registrant is not required to file reports pursuant to Section 13 orSection 15(d) of the Act. Yes ‘ No È
Indicate by check mark whether the registrant (1) has filed all reports required to be filed bySection 13 or 15(d) of the Securities Exchange Act of 1934 during the preceding 12 months (or forsuch shorter period that the registrant was required to file such reports), and (2) has been subject tosuch filing requirements for the past 90 days. Yes È No ‘
Indicate by check mark if disclosure of delinquent filers pursuant to Item 405 of Regulation S-K(§229.405 of this chapter) is not contained herein, and will not be contained, to the best ofregistrant’s knowledge, in definitive proxy or information statements incorporated by reference inPart III of this Form 10-K or any amendment to this Form 10-K. È
Indicate by check mark whether the registrant is a large accelerated filer, an accelerated filer, ora non-accelerated filer. See definition of “accelerated filer and large accelerated filer” in Rule 12b-2of the Exchange Act. (Check one):
Large accelerated filer ‘ Accelerated filer È Non-accelerated filer ‘Indicate by check mark whether the registrant is a shell company (as defined in rule 12b-2 of
the Act). Yes ‘ No È
The aggregate market value of voting Common Stock held by non-affiliates of the registrantwas approximately $461 million based on the closing price of the Common Stock on the NASDAQGlobal Select Market of $19.05 per share on December 31, 2006, the last business day of theregistrant’s most recently completed second fiscal quarter, based on the number of sharesoutstanding on that date less the number of shares held by the registrant’s directors, executiveofficers and holders of at least 10% of the outstanding shares of Common Stock.
As of September 5, 2007, the registrant had 28,820,663 shares of Common Stock outstanding.
Documents Incorporated by ReferencePortions of the Registrant’s definitive proxy statement relating to its 2007 Annual Meeting of
Shareholders, to be filed no later than 120 days after the close of the Registrant’s fiscal year endedJune 30, 2007, are hereby incorporated by reference in Part III of this Annual Report on Form 10-K.
9

and radio advertising, and point-of-sale merchandising, including displays and sampling, as well asless traditional methods, such as the internet, mobile phones and instant messaging. We work withthird party advertising agencies to assist us in our worldwide media planning which includesdeveloping the media strategy for our brands and assisting us in developing the marketingcampaigns for many of our products. We believe these agencies have the expertise to help useffectively market our products. During the last three fiscal years, we increased our advertising topromote our core product franchises.
New product introduction is an important element in attracting consumers to our brands and increating brand excitement with our retail customers. Our marketing personnel work closely withcustomers to develop new products and promotions and extensions of our well-established brands.Our efforts are primarily focused on the identification of consumer needs and shifts in consumerpreferences in order to develop new fragrance, skin care and cosmetic products, develop lineextensions and promotions, and redesign or reformulate existing products.
Our marketing efforts also benefit from cooperative advertising programs with our retailers,often linked with particular promotions. In our department store and perfumerie accounts, weperiodically promote our brands with “gift with purchase” and “purchase with purchase” programs.At in-store counters, sales representatives offer personal demonstrations to market individualproducts. We also engage in extensive sampling programs.
With many of our retail customers, our marketing personnel often design model schematicplanograms for the customer’s fragrance department, identify trends in consumer preferences andadapt the product assortment to these trends, conduct training programs for the customer’s salespersonnel and manage in-store “special events.” Our marketing personnel also work to design giftsets tailored to the customer’s needs. For certain customers, we provide comprehensive sales analysisand active management of the prestige fragrance category. We believe these services distinguish usfrom our competitors and contribute to customer loyalty.
Seasonality
Our operations have historically been seasonal, with higher sales occurring in the first half ofour fiscal year as a result of increased demand by retailers in anticipation of and during the holidayseason. In the year ended June 30, 2007, approximately 59% of our net sales were made during thefirst half of our fiscal year. Due to product innovations and the size and timing of certain ordersfrom our customers, sales, results of operations, working capital requirements and cash flows canvary significantly between quarters of the same and different years. As a result, we expect toexperience variability in net sales, operating margin, net income, working capital requirements andcash flows on a quarterly basis. Increased sales of skin care and cosmetic products relative tofragrances may reduce the seasonality of our business.
Manufacturing, Supply Chain and Logistics
We use third-party contract manufacturers in the United States and Europe to obtainsubstantially all raw materials, components and packaging products and to manufacture finishedproducts relating to our owned and licensed brands. Our fragrance and skin care products areprimarily manufactured by Cosmetic Essence, Inc., an unrelated third party, in plants located inNew Jersey and Roanoke, Virginia, under a manufacturing agreement that expires on January 31,2010. Pricing is based on fixed costs per item. Third parties in Europe manufacture certain of ourfragrance and cosmetic products. We also have a small manufacturing facility in South Africaprimarily to manufacture local requirements of our products.
Except for the Cosmetic Essence, Inc. manufacturing agreement, as is customary in ourindustry, we generally do not have long-term or exclusive agreements with contract manufacturersof our owned and licensed brands or with fragrance manufacturers or suppliers of our distributed
16

brands. We generally make purchases through purchase orders. We believe that we have goodrelationships with manufacturers of our owned and licensed brands and that there are alternativesources should one or more of these manufacturers become unavailable. We receive our distributedbrands in finished goods form directly from fragrance manufacturers, as well as from other sources.Our ten largest fragrance manufacturers or suppliers of brands that are distributed by us on anon-exclusive basis accounted for approximately 28% of our cost of sales for the year endedJune 30, 2007. The loss of, or a significant adverse change in our relationship with, any of our keyfragrance manufacturers for our owned and licensed brands, such as Cosmetic Essence, Inc., orsuppliers of our distributed fragrance brands could have a material adverse effect on our business,prospects, results of operations or financial condition.
Our fulfillment operations for the United States and certain other areas of the world areconducted out of a leased distribution facility in Roanoke, Virginia. The 400,000 square-footRoanoke facility accommodates our distribution activities and houses a large portion of ourinventory. Our fulfillment operations for Europe are conducted under a logistics services agreementby CEPL, an unrelated third party, at CEPL’s facility in Beville, France. The CEPL agreementexpires in June 2008. While we insure our inventory and the Roanoke facility, the loss of either ofthese distribution facilities, as well as the inventory stored in those facilities, would require us to findreplacement facilities and inventory and could have a material adverse effect on our business,prospects, results of operations, cash flows and financial condition.
Government Regulation
We and our products are subject to regulation by the Food and Drug Administration and theFederal Trade Commission in the United States, as well as by various other federal, state, local andinternational regulatory authorities in the countries in which our products are produced or sold.Such regulations principally relate to the ingredients, manufacturing, labeling, packaging andmarketing of our products. We believe that we are in substantial compliance with such regulations,as well as with applicable federal, state, local and international and other countries’ rules andregulations governing the discharge of materials hazardous to the environment.
Management Information Systems
Our primary information technology systems discussed below provide a complete portfolio ofbusiness systems, business intelligence systems, and information technology infrastructure servicesto support our global operations:
• Logistics and supply chain systems, including purchasing, materials management,manufacturing, inventory management, order management, customer service, pricing,demand planning, warehouse management and shipping;
• Financial and administrative systems, including general ledger, payables, receivables,personnel, payroll, tax, treasury and asset management;
• Electronic data interchange systems to enable electronic exchange of order, status, invoice,and financial information with our customers, financial service providers and our partnerswithin the extended supply chain;
• Business intelligence and business analysis systems to enable management’s informationalneeds as they conduct business operations and perform business decision making; and
• Information technology infrastructure services to enable seamless integration of our globalbusiness operations through Wide Area Networks (WAN), personal computing technologies,electronic mail, and service agreements with outsourced computing operations.
These management information systems and infrastructure provide on-line business processsupport for our global business operations. Further, many of these capabilities have been extendedinto the operations of our U.S. customers and third party service providers to enhance these
17

arrangements, with examples such as vendor managed inventory, third party distribution, thirdparty manufacturing, inventory replenishment, customer billing, retail sales analysis, productavailability, pricing information and transportation management.
As part of our continuing efforts to enhance the effectiveness and strategic value of ouroperations and systems, during the year ended June 30, 2007, we launched an e-commerce web siteto sell our selected products directly to consumers, we implemented an enterprise resource planning(ERP) system for our Greater China operations, we implemented business intelligence systems toenable global purchasing analysis and improved forecasting effectiveness, we integrated a largeportion of our prior Canada-based distribution services into our Roanoke logistics center, and weimplemented vendor performance management processes.
We have back-up facilities to enhance the reliability of our management information systems.These facilities will allow us to continue to operate if our main facilities should fail. We also have adisaster recovery plan, which is tested periodically, to protect our business operations and customerinformation. We also have business interruption insurance to cover a portion of any disruption inour management information systems resulting from certain hazards.
Competition
The beauty industry is highly competitive and, at times, subject to rapidly changing consumerpreferences and industry trends. Competition is generally a function of brand strength, assortmentand continuity of merchandise selection, reliable order fulfillment and delivery, and level of brandsupport and in-store customer support. We compete with a large number of manufacturers andmarketers of beauty products, some of which have substantially more resources than we do.
We believe that we compete primarily on the basis of product recognition, quality, performance,price, and our emphasis on providing value-added customer services, including categorymanagement services, to certain retailers. There are products that are better-known and morepopular than the products manufactured or supplied by us. Many of our competitors aresubstantially larger and more diversified, and have substantially greater financial and marketingresources than we do, as well as greater name recognition and the ability to develop and marketproducts similar to and competitive with those manufactured by us.
Employees
As of September 4, 2007, we had approximately 2,250 full-time employees and approximately 600part-time employees in the United States and 17 foreign countries. None of our employees are covered bya collective bargaining agreement. We believe that our relationship with our employees is satisfactory.
Executive Officers of the Company
The following sets forth the names and ages of each of our executive officers as of September 4,2007 and the positions they hold:
Name Age Position with the Company
E. Scott Beattie . . . . . . . . . . . . 48 Chairman, President and Chief Executive OfficerStephen J. Smith . . . . . . . . . . 47 Executive Vice President and Chief Financial OfficerL. Hoy Heise . . . . . . . . . . . . . 61 Executive Vice President, Chief Information Officer and
Operations PlanningMichael H. Lombardi . . . . . . . 64 Executive Vice President, OperationsOscar E. Marina . . . . . . . . . . . 48 Executive Vice President, General Counsel and SecretaryElizabeth Park . . . . . . . . . . . . 44 Executive Vice President, Skin Care & Color Marketing and
General Manager—Arden U.S.Ronald L. Rolleston . . . . . . . . 51 Executive Vice President, Global Fragrance MarketingJoel B. Ronkin . . . . . . . . . . . . 39 Executive Vice President, General Manager—North America
FragrancesJacobus A. J. Steffens . . . . . . . 46 Executive Vice President, General Manager—International
18

Each of our executive officers holds office for such term as may be determined by our board ofdirectors. Set forth below is a brief description of the business experience of each of our executiveofficers.
E. Scott Beattie has served as Chairman of the Board of Directors since April 2000, as ourPresident and Chief Executive Officer since August 2006, as our Chief Executive Officer since March1998 and as a director of the company since November 1995. Mr. Beattie also served as ourPresident from April 1997 to March 2003, as our Chief Operating Officer from April 1997 to March1998, and as our Vice Chairman of the Board of Directors and Assistant Secretary from November1995 to April 1997. Mr. Beattie is a director of Object Video, Inc., an information technologycompany. Mr. Beattie is also a director and a member of the Executive Committee of The Cosmetic,Toiletry & Fragrance Association and a member of the advisory board of the Ivey Business School.
Stephen J. Smith has served as our Executive Vice President and Chief Financial Officer sinceMay 2001. Previously, Mr. Smith was with PricewaterhouseCoopers LLP, an internationalprofessional services firm, as partner from October 1993 until May 2001, and as manager fromJuly 1987 until October 1993.
L. Hoy Heise has served as our Executive Vice President, Chief Information Officer andOperations Planning since May 2006 and as our Senior Vice President and Chief Information Officerfrom May 2004 until May 2006. From February 2003 until May 2004, Mr. Heise was the founderand principal of his own technology consulting firm. From June 1999 until May 2001, Mr. Heise wasSenior Vice President of Gartner, an information technology research firm. Prior to that time,Mr. Heise worked in various management and consulting capacities for Renaissance Worldwide, aglobal provider of business process improvement and information technology consulting services.
Michael H. Lombardi has served as our Executive Vice President, Operations since March2004, as our Senior Vice President, Operations since January 2001 and as Senior Vice President,Marketing/Supply Chain Operations with the Elizabeth Arden Company, a division of UnileverN.V., since April 1999. Prior to joining the Elizabeth Arden Company, Mr. Lombardi worked invarious management capacities for Chesebrough Ponds, Inc.
Oscar E. Marina has served as our Executive Vice President, General Counsel and Secretarysince March 2004, as our Senior Vice President, General Counsel and Secretary from March 2000through February 2004, and as our Vice President, General Counsel and Secretary from March1996 through March 2000. From October 1988 until March 1996, Mr. Marina was an attorney withthe law firm of Steel Hector & Davis L.L.P. in Miami, becoming a partner of the firm in January1995.
Elizabeth Park has served as our Executive Vice President, Skin Care & Color Marketing andGeneral Manager — Arden U.S., since May 2006 and as our Senior Vice President, GlobalMarketing from March 2005 until May 2006. Prior to joining our company, Ms. Park was SeniorVice President Marketing U.S.A. for Lancôme, a division of L’Oreal Products from March 2003 untilMarch 2005. From July 1995 to July 2002, Ms. Park held several marketing management positionswith the Estee Lauder Companies.
Ronald L. Rolleston has served as our Executive Vice President, Global Fragrance Marketingsince May 2006, as our Executive Vice President, Global Marketing since April 2003, as ourExecutive Vice President, Global Marketing and Prestige Sales from February 2002 until April2003, as our Senior Vice President, Global Marketing from February 2001 through January 2002,and as our Senior Vice President, Prestige Sales from March 1999 through January 2001.Mr. Rolleston served as President of Paul Sebastian, Inc., a fragrance manufacturer, from September1997 until January 1999. Mr. Rolleston served as Executive Vice President of Global Marketing ofthe Elizabeth Arden Company from January 1995 to March 1997 and as the General Manager ofEurope for the Calvin Klein Cosmetics Company from May 1990 to September 1994.
19

Joel B. Ronkin has served as our Executive Vice President, General Manager — North AmericaFragrances since May 2006, as our Executive Vice President and Chief Administrative Officer fromMarch 2004 until May 2006, as our Senior Vice President and Chief Administrative Officer fromFebruary 2001 through February 2004, and as our Vice President, Associate General Counsel andAssistant Secretary from March 1999 through January 2001. From June 1997 through March 1999,Mr. Ronkin served as the Vice President, Secretary and General Counsel of National Auto FinanceCompany, Inc., an automobile finance company. From May 1992 until June 1997, Mr. Ronkin wasan attorney with the law firm of Steel Hector & Davis L.L.P. in Miami, Florida.
Jacobus A.J. Steffens has served as our Executive Vice President, General Manager —International since March 2004 and as our Senior Vice President, General Manager — Internationalfrom January 2001 through February 2004. Before joining the company, Mr. Steffens worked invarious management capacities for divisions of Unilever N.V., including as the Chief InformationOfficer of Unilever’s European Ice Cream & Frozen Foods division from January 1997 untilDecember 2000, as the Controller Global Marketing & Creative at the Elizabeth Arden Companyfrom January 1992 until December 1995 and in various financial roles for Unilever’s QuestInternational Flavours and Fragrances division from the end of 1986 until December 1991.
ITEM 1A. RISK FACTORS
The risk factors in this section describe the major risks to our business, prospects, results ofoperations and financial condition and should be considered carefully. In addition, these factorsconstitute our cautionary statements under the Private Securities Litigation Reform Act of 1995 andcould cause our actual results to differ materially from those projected in any forward-lookingstatements (as defined in such act) made in this Annual Report on Form 10-K. Investors should notplace undue reliance on any such forward-looking statements. Any statements that are not historicalfacts and that express, or involve discussions as to, expectations, beliefs, plans, objectives,assumptions or future events or performance (often, but not always, through the use of words orphrases such as “will likely result,” “are expected to,” “will continue,” “is anticipated,” “estimated,”“intends,” “plans,” “believes” and “projects”) may be forward-looking and may involve estimatesand uncertainties which could cause actual results to differ materially from those expressed in theforward-looking statements.
Further, any forward-looking statement speaks only as of the date on which such statement ismade, and we undertake no obligation to update any forward-looking statement to reflect events orcircumstances after the date on which such statement is made or to reflect the occurrence ofanticipated or unanticipated events or circumstances. New factors emerge from time to time, and itis not possible for us to predict all of such factors. Further, we cannot assess the impact of each suchfactor on our results of operations or the extent to which any factor, or combination of factors, maycause actual results to differ materially from those contained in any forward-looking statements.
We do not have contracts with customers or most of our suppliers, so if we cannot maintainand develop relationships with customers and suppliers our business, prospects, results ofoperations and financial condition may be materially adversely affected.
We do not have long-term or exclusive contracts with any of our customers and generally do nothave long-term or exclusive contracts with our suppliers of distributed brands. Our ten largestcustomers accounted for approximately 39% of our net sales in the year ended June 30, 2007. Ouronly customer who accounted for more than 10% of our net sales in the year ended June 30, 2007was Wal-Mart (including Sam’s Club), who, on a global basis, accounted for approximately 18% ofour net sales. In addition, our suppliers of distributed brands, which represented approximately 41%of our cost of sales for fiscal 2007, generally can, at any time, elect to supply products to ourcustomers directly or through another distributor. Our suppliers of distributed brands may alsochoose to reduce or eliminate the volume of their products distributed by us. The loss of any of ourkey suppliers or customers, or a change in our relationship with any one of them, could have amaterial adverse effect on our business, prospects, results of operations and financial condition.
20

We rely on third-party manufacturers for substantially all of our owned and licensedproducts.
We do not own or operate any significant manufacturing facilities. We use third-partymanufacturers and suppliers to manufacture substantially all of our owned and licensed products.We currently obtain these products from a limited number of manufacturers and other suppliers.Our business, prospects, results of operations and financial condition could be materially adverselyaffected if our manufacturers were to experience problems with product quality or delays in thedelivery of the finished products or the raw materials or components used to make such product.
The loss of or disruption in our distribution facilities may have a material adverse effect onour business.
We currently have one distribution facility in the United States and use a third-party fulfillmentcenter in France for European distribution. These facilities house a large portion of our inventory.Any loss of or damage to these facilities or the inventory stored in these facilities, could adverselyaffect our business, prospects, results of operations and financial condition.
We may be adversely affected by factors affecting our customers’ businesses.
Factors that adversely impact our customers’ businesses may have an adverse effect on ourbusiness and results of operations also. These factors may include:
• any credit risks presented by the financial condition of our customers;
• the effect of consolidation in the retail industry, including the closure of customer doors,and the uncertainty resulting therefrom; and
• inventory reduction initiatives and other factors affecting customer buying patterns,including retail space committment to fragrances and cosmetics.
We may be adversely affected by domestic and international economic conditions and otherevents that impact consumer confidence and demand.
We believe that consumer spending on beauty products is influenced by general economicconditions and the availability of discretionary income. Domestic or international general economicdownturns, including periods of inflation or high gasoline prices or declining consumer confidence,may affect consumer purchasing patterns and result in reduced net sales to our customers. Inaddition, any reductions in travel or increases in restrictions on travelers’ ability to transport ourproducts on airplanes due to general economic downturns, diseases, acts of war or terrorism couldresult in a material decline in the net sales and profitability of our travel retail business.
The beauty industry is highly competitive and if we cannot effectively compete our businessand results of operations will suffer.
The beauty industry is highly competitive and can change rapidly due to consumer preferencesand industry trends. We compete primarily with global prestige beauty companies, some of whomhave greater resources than we have and brands with greater name recognition and consumer loyaltythan our brands. Our products also compete with new products that often are accompanied bysubstantial promotional campaigns. Our success depends on our products’ appeal to a broad rangeof consumers whose preferences cannot be predicted with certainty and are subject to change, andon our ability to develop new products through product innovations and product line extensions,which involve numerous risks. We may also incur increased expenses in connection with productdevelopment, marketing and advertising that are not subsequently supported by a sufficient level ofsales, which could negatively affect our results of operations. These competitive factors, as well asnew product risks, could have an adverse effect on our business prospects, results of operations andfinancial condition.
21

Our business strategy depends upon our ability to acquire or license additional brands orsecure additional distribution arrangements and obtain the required financing for theseagreements and arrangements.
Our business strategy contemplates the continued growth of our portfolio of owned, licensedand distributed brands. Our future expansion through acquisitions, new product licenses or newproduct distribution arrangements, if any, will depend upon our ability to identify suitable brands toacquire, license or distribute and our ability to obtain the required financing for these acquisitions,licenses or distribution arrangements, and thus depends on the capital resources and working capitalavailable to us. We may not be able to identify, negotiate, finance or consummate such acquisitions,licenses or arrangements, or the associated working capital requirements, on terms acceptable to us,or at all, which could hinder our ability to increase revenues and build our business.
The success of our business depends, in part, on the demand for celebrity beauty products.
We have license agreements to manufacture, market and distribute a number of celebritybeauty products, including those of Elizabeth Taylor, Britney Spears, Hilary Duff, Danielle Steel andMariah Carey. In fiscal 2007, we derived approximately 20% of our net sales from these celebritybeauty products. The demand for these products is, to some extent, dependent on the appeal toconsumers of the particular celebrity and the celebrity’s reputation. To the extent that the celebrityfragrance category or a particular celebrity ceases to be appealing to consumers or a celebrity’sreputation is adversely affected, sales of the related products and the value of the brands candecrease materially and the duration of the applicable license agreement may be shortened.
We may not be able to successfully and cost-effectively integrate acquired businesses or newbrands.
Acquisitions entail numerous integration risks and impose costs on us that could materiallyadversely affect our business and financial results, including:
• difficulties in assimilating acquired operations or products, including disruptions to ouroperations or the loss of key employees from acquired businesses;
• diversion of management’s attention from our core business;
• adverse effects on existing business relationships with suppliers and customers;
• incurrence or assumption of additional debt and liabilities; and
• incurrence of significant amortization expenses related to intangible assets and the potentialimpairment of acquired assets.
Our business could be adversely affected if we are unable to successfully protect ourintellectual property rights.
The market for our products depends to a significant extent upon the value associated with ourtrademarks and trade names. We own, or have licenses or other rights to use, the materialtrademark and trade name rights used in connection with the packaging, marketing and distributionof our major owned and licensed products both in the U.S. and in other countries where suchproducts are principally sold.
We also cannot assure you that the owners of the trademarks that we license can or willsuccessfully maintain their intellectual property rights or that we will be able to comply with theterms set forth in the applicable license agreements, including among other things payment ofminimum royalties, minimum marketing expenses and maintenance of certain levels of sales.
Although most of our brand names are registered in the U.S. and in certain foreign countries inwhich we operate, we may not be successful in asserting trademark or trade name protection. Inaddition, the laws of certain foreign countries may not protect our intellectual property rights to thesame extent as the laws of the U.S. The costs required to protect our trademarks and trade namesmay be substantial.
22

If other parties infringe on our intellectual property rights or the intellectual property rightsthat we license, the value of our brands in the marketplace may be diluted. In addition, anyinfringement of our intellectual property rights would also likely result in a commitment of our timeand resources to protect these rights through litigation or otherwise. We may infringe on others’intellectual property rights. One or more adverse judgments with respect to these intellectualproperty rights could negatively impact our ability to compete and could materially adversely affectour business, prospects, results of operations and financial condition.
We are subject to risks related to our international operations.
We operate on a global basis, with sales in approximately 90 countries. Approximately 37% ofour fiscal 2007 net sales were generated outside of the United States. Our international operationscould be adversely affected by:
• import and export license requirements;
• trade restrictions;
• changes in tariffs and taxes;
• restrictions on repatriating foreign profits back to the United States;
• changes in, or our unfamiliarity with, foreign laws and regulations;
• difficulties in staffing and managing international operations; and
• changes in social, political, legal and other conditions.
Fluctuations in foreign exchange rates could adversely affect our results of operations andcash flows.
Our functional currency is the U.S. dollar. Our results of operations, debt, interest expense anda significant portion of our overhead expenses are reported in U.S. dollars. Approximately 37% ofour net sales for fiscal 2007 were from our international operations, with a substantial portion ofthis amount denominated in currencies other than the U.S. dollar. Outside the United States, oursales and costs are denominated in a variety of currencies including the Euro, British pound, Swissfranc and Canadian and Australian dollar. A significant weakening of the currencies in which wegenerate sales relative to the U.S. dollar may adversely affect our ability to meet our U.S. dollarobligations and could adversely affect our results of operations and cash flows used to fund workingcapital.
Our quarterly results of operations fluctuate due to seasonality and other factors, and wemay not have sufficient liquidity to meet our seasonal working capital requirements.
We generate a significant portion of our net income in the first half of our fiscal year as a resultof the seasonality of sales combined with fixed operating expenses, interest expense and quarterlydepreciation and amortization charges. Similarly, our working capital needs are greater during thefirst half of the fiscal year. In addition, we may experience variability in net sales and net income ona quarterly basis as a result of a variety of factors, including new product launches, the timing ofcustomer orders and additions or losses of brands or distribution rights. If we were to experience asignificant shortfall in sales or internally generated funds, we may not have sufficient liquidity tofund our business.
Our level of debt and debt service obligations, and the restrictive covenants in our revolvingcredit facility and our indenture for our 73⁄4% senior subordinated notes, may reduce ouroperating and financial flexibility and could adversely affect our business and growthprospects.
At June 30, 2007, we had total debt of approximately $323 million, including $225 million inaggregate principal amount outstanding under our 73⁄4% senior subordinated notes and $98 million
23
outstanding on our revolving credit facility. Our indebtedness could adversely impact our business,prospects, results of operations and financial condition by; increasing our vulnerability to generaladverse economic and industry conditions; restricting our ability to consummate acquisitions;requiring us to use cash flow from operations to make payments on our indebtedness, therebyreducing the availability of our cash flow to fund working capital, capital expenditures and othergeneral corporate requirements; and imposing operating and financial restrictions that may limit ouroperating and financial flexibility.
Specifically, our revolving credit facility and our indenture for our 73⁄4% senior subordinatednotes limit or otherwise affect our ability to, among other things:
• incur additional debt;
• pay dividends or make other restricted payments;
• create or permit certain liens, other than customary and ordinary liens;
• sell assets other than in the ordinary course of our business;
• invest in other entities or businesses; and
• consolidate or merge with or into other companies or sell all or substantially all of ourassets.
These restrictions could limit our ability to finance our future operations or capital needs, makeacquisitions or pursue available business opportunities. Our revolving credit facility also requires usto maintain specified amounts of borrowing availability or maintain a debt service coverage ratio.Our ability to meet these conditions and our ability to service our debt obligations will depend uponour future operating performance, which can be affected by general economic, financial,competitive, legislative, regulatory, business and other factors beyond our control. If our actualresults deviate significantly from our projections, we may not be able to service our debt or remainin compliance with the conditions contained in our revolving credit facility, and we would not beallowed to borrow under the revolving credit facility. If we were not able to borrow under ourrevolving credit facility, we would be required to develop an alternative source of liquidity. Wecannot assure you that we could obtain replacement financing on favorable terms or at all.
A default under our revolving credit facility could also result in a default under our indenturefor our 73⁄4% senior subordinated notes. Upon the occurrence of an event of default under ourindenture, all amounts outstanding under our other indebtedness may be declared to be immediatelydue and payable. If we were unable to repay amounts due on our secured debt, the lenders wouldhave the right to proceed against the collateral granted to them to secure that debt.
Our success depends, in part, on the quality, efficacy and safety of our products.
Our success depends, in part, on the quality, efficacy and safety of our products. If our productsare found to be defective or unsafe, or if they otherwise fail to meet our customers’ standards, ourrelationships with customers or consumers could suffer, the appeal of one or more of our brandscould be diminished, and we could lose sales and/or become subject to liability claims, any of whichcould have a material adverse effect on our business, prospects, results of operations or financialcondition.
Our success depends upon the retention and availability of key personnel and the successionof senior management.
Our success largely depends on the performance of our management team and other keypersonnel. Our future operations could be harmed if we are unable to attract and retain talented,highly qualified senior executives and other key personnel. In addition, if we are unable to effectivelyprovide for the succession of senior management, including our chief executive officer, our business,prospects, results of operations and financial condition may be materially adversely affected.
24

Our business is subject to regulation in the United States and internationally.
The manufacturing, distribution, formulation, packaging and advertising of our products andthose we distribute are subject to numerous and complicated federal, state and foreign governmentalregulations. Compliance with these regulations is difficult and expensive. If we fail to adhere, or arealleged to have failed to adhere, to any applicable federal, state or foreign laws or regulations, ourresults of operation and financial condition may be adversely affected. In addition, our future resultscould be adversely affected by changes in applicable federal, state and foreign laws and regulations(including product liability, intellectual property, consumer laws, privacy laws and productregulation), as well as changes in accounting standards and taxation requirements (includingtax-rate changes, new tax laws and revised tax law interpretations).
The market price of our common stock may fluctuate as a result of a variety of factors.
The market price of our common stock could fluctuate significantly in response to variousfactors, many of which are beyond our control, including:
• volatility in the financial markets;
• actual or anticipated variations in our quarterly or annual financial results;
• announcements or significant developments with respect to beauty products or the beautyindustry in general;
• general economic and political conditions; and
• governmental policies and regulations.
We are subject to risks associated with our reliance on global information systems.
We have information systems that support our business processes, including marketing, sales,order processing, distribution, finance and intracompany communications throughout the world.These systems may be susceptible to outages due to fire, floods, tornadoes, hurricanes, power loss,telecommunications failures, and similar events. Despite the implementation of network securitymeasures, our systems may be vulnerable to computer viruses and similar disruptions fromunauthorized tampering. The occurrence of these or other events could disrupt or damage ourinformation systems and adversely affect our business and results of operations. In addition, fromtime to time we must upgrade or enhance our systems to support our business and its growth, whichmay require substantial investment and dedication of management resources. Any failure to properlymaintain or upgrade our systems to accommodate our actual or anticipated growth, or to implementany such upgrades on a timely and cost-effective basis, may adversely affect our business and resultsof operations.
ITEM 1B. UNRESOLVED STAFF COMMENTS
As of the filing of this Annual Report on Form 10-K, there were no unresolved comments fromthe Staff of the Securities and Exchange Commission.
ITEM 2. PROPERTIES
United States. Our corporate headquarters are located in Miramar, Florida, where we leaseapproximately 35,000 square feet of general office space. The lease expires May 31, 2011. Our U.S.fulfillment operations are conducted in our Roanoke, Virginia distribution facility that consists ofapproximately 400,000 square feet and is leased through September 2013. We also lease a 76,000-square foot warehouse in Roanoke to coordinate returns processing that is leased through December2009. From time to time, we also lease additional temporary warehouse facilities to handle inventoryoverflow. We lease 62,000 square feet of general office space for our supply chain, informationsystems and finance operations in Stamford, Connecticut under a lease that expires October 2011.We lease approximately 33,000 square feet of general offices primarily for our marketing operationsin New York City under a lease that expires in April 2016.
25

International. Our international operations are headquartered in offices in Geneva,Switzerland under a lease that expires in December 2007. We also lease sales offices in Australia,Austria, Canada, China, Denmark, Dubai, Italy, Korea, New Zealand, Puerto Rico, Singapore, SouthAfrica, Spain, Taiwan, and the United Kingdom, and a small distribution facility in Puerto Rico. Weown a small manufacturing and distribution facility in South Africa primarily to manufacture anddistribute local requirements of our products.
ITEM 3. LEGAL PROCEEDINGS
In October 2005, we received a demand from Mystic Tan, Inc., a licensee of certain of ourpatents, alleging that we had breached the license agreement with them, indicating that it would notpay any further royalties and requesting that we return approximately $3 million in royaltypayments already made. We believe that we have not breached the license agreement and that thelicensee is obligated to continue to make royalty payments. In November 2006, we filed a lawsuitagainst the licensee in the U.S. District Court for the Southern District of New York seeking recoveryof our damages for breach of contract. In April 2007, the licensee filed a counterclaim for breach ofcontract, negligence, unjust enrichment and other related counts, and also seeks declaratory reliefthat the licensee is not obligated to make further royalty payments and is entitled to recoverapproximately $3 million in royalty payments already made plus interest. We are not able todetermine the ultimate outcome of this action or estimate the possible loss or range of loss relating tothe licensee’s claim, but we believe the ultimate outcome will not have a material adverse effect onour financial position, results of operations or cash flows.
In May 2007, we settled an action filed against us in August 2006 by Dr. Amy Lewis. Dr. Lewisfiled the action in the U.S. District Court for the Southern District of New York, alleging that our useof her quote in product advertisements was unauthorized and constituted a false endorsement, falseadvertising, invasion of privacy, trademark dilution and disparagement, a violation of the right topublicity, fraud and unjust enrichment. Dr. Lewis sought to enjoin our use of her name andadvertising, and damages of no less than $2,000,000, including payments of profits associated withthe relevant product, and exemplary and treble damages. Under the terms of the settlement, andwithout admitting any liability, we paid Dr. Lewis $95,000.
The Company is a party to a number of other legal actions, proceedings and claims. While anyaction, proceeding or claim contains an element of uncertainty and it is possible that the Company’scash flows and results of operations in a particular quarter or year could be materially affected bythe impact of such actions, proceedings and claims, management of the Company believes that theoutcome of such actions, proceedings or claims will not have a material adverse effect on theCompany’s business, financial position or results of operations.
ITEM 4. SUBMISSION OF MATTERS TO A VOTE OF SECURITY HOLDERS
No matters were submitted to a vote of security holders during the fourth quarter of the fiscalyear ended June 30, 2007.
26

PART II
ITEM5. MARKET FOR REGISTRANT’S COMMON EQUITY, RELATED STOCKHOLDERMATTERS AND ISSUER PURCHASES OF EQUITY SECURITIES
Market Information. Our common stock, $.01 par value per share, has been traded on theNASDAQ Global Select Market under the symbol “RDEN” since January 25, 2001. The followingtable sets forth the high and low sales prices for our common stock, as reported by NASDAQ foreach of our fiscal quarters from July 1, 2005 through June 30, 2007.
Quarter Ended High Low
6/30/07 . . . . . . . . . . . . . . . . . . . . . . . . . . . . . . . . . . . . . . . . . . . . . . . . . . . $24.73 $21.643/31/07 . . . . . . . . . . . . . . . . . . . . . . . . . . . . . . . . . . . . . . . . . . . . . . . . . . . $22.97 $17.4112/31/06 . . . . . . . . . . . . . . . . . . . . . . . . . . . . . . . . . . . . . . . . . . . . . . . . . . $19.74 $16.069/30/06 . . . . . . . . . . . . . . . . . . . . . . . . . . . . . . . . . . . . . . . . . . . . . . . . . . . $19.04 $13.636/30/06 . . . . . . . . . . . . . . . . . . . . . . . . . . . . . . . . . . . . . . . . . . . . . . . . . . . $23.60 $16.483/31/06 . . . . . . . . . . . . . . . . . . . . . . . . . . . . . . . . . . . . . . . . . . . . . . . . . . . $24.58 $18.8312/31/05 . . . . . . . . . . . . . . . . . . . . . . . . . . . . . . . . . . . . . . . . . . . . . . . . . . $22.43 $18.289/30/05 . . . . . . . . . . . . . . . . . . . . . . . . . . . . . . . . . . . . . . . . . . . . . . . . . . . $25.31 $20.25
Holders. As of September 5, 2007, there were 405 record holders of our common stock. Thenumber of record holders does not include beneficial owners of common stock whose shares are heldin the names of banks, brokers, nominees or other fiduciaries.
Dividends. We have not declared any cash dividends on our common stock since we became abeauty products company in 1995, and we currently have no plans to declare dividends on ourcommon stock in the foreseeable future. Any future determination by our board of directors to paydividends on our common stock will be made only after considering our financial condition, resultsof operations, capital requirements and other relevant factors. Additionally, our revolving creditfacility and the indentures relating to our 7 3⁄4% senior subordinated notes due 2014 restrict ourability to pay cash dividends based upon our ability to satisfy certain financial covenants, includinghaving a certain amount of borrowing capacity and a fixed charge coverage ratio after the paymentof the dividends. See Notes 9 and 10 to the Notes to Consolidated Financial Statements.
Performance Graph. The following performance graph data and table compare the cumulativetotal shareholder returns, including the reinvestment of dividends, on our common stock with thecompanies in the Russell 2000 Index and a market-weighted index of publicly traded peercompanies for the 65 month period from January 31, 2002 through June 30, 2007 (in June 2004,we changed our fiscal year end from January 31 to June 30).
The peer group is a good representation of consumer products and beauty companies withsimilar market capitalizations and/or products as our company. The publicly traded companies inthe peer group are Avon Products, Inc., Chattem, Inc., The Estee Lauder Companies, Inc., InterParfums, Inc. and Revlon, Inc. The graph and table assume that $100 was invested on January 31,2002 in each of the Russell 2000 Index and the peer group and our common stock, and that alldividends were reinvested.
27
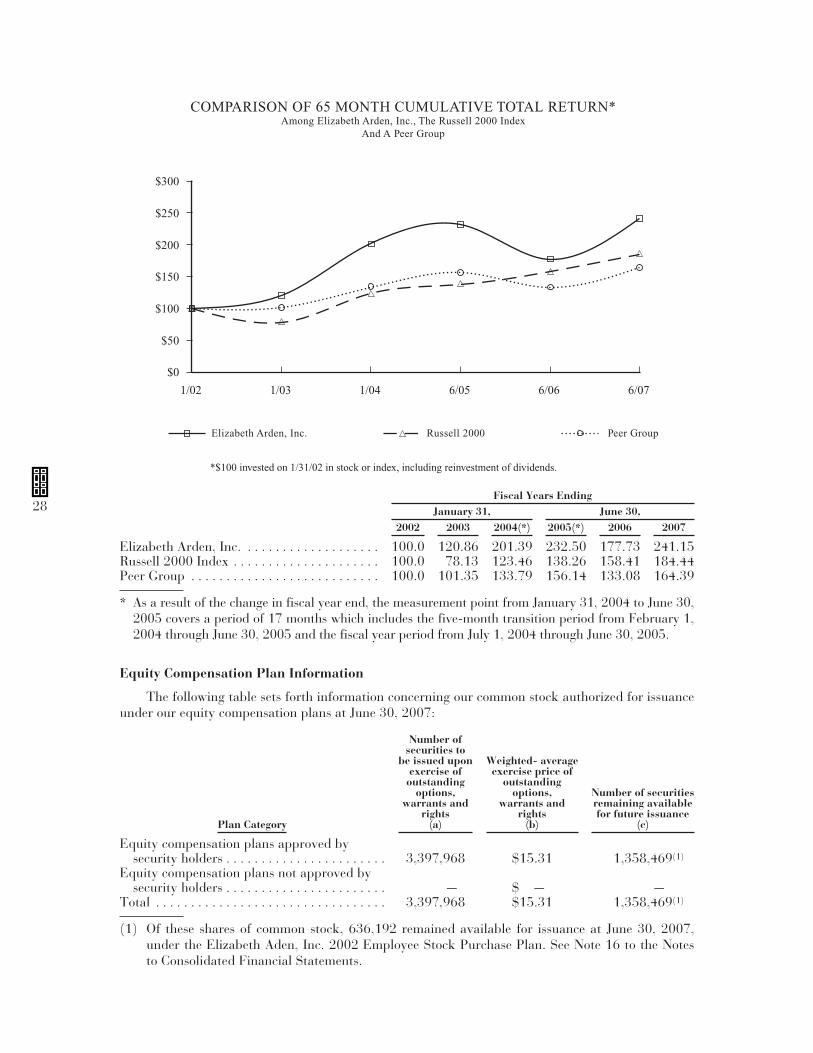
Elizabeth Arden, Inc. Russell 2000 Peer Group
*$100 invested on 1/31/02 in stock or index, including reinvestment of dividends.
COMPARISON OF 65 MONTH CUMULATIVE TOTAL RETURN*Among Elizabeth Arden, Inc., The Russell 2000 Index
And A Peer Group
1/02 1/03 1/04 6/05 6/06 6/07
$0
$50
$100
$150
$200
$250
$300
Fiscal Years EndingJanuary 31, June 30,
2002 2003 2004(*) 2005(*) 2006 2007
Elizabeth Arden, Inc. . . . . . . . . . . . . . . . . . . . 100.0 120.86 201.39 232.50 177.73 241.15Russell 2000 Index . . . . . . . . . . . . . . . . . . . . . 100.0 78.13 123.46 138.26 158.41 184.44Peer Group . . . . . . . . . . . . . . . . . . . . . . . . . . . 100.0 101.35 133.79 156.14 133.08 164.39
* As a result of the change in fiscal year end, the measurement point from January 31, 2004 to June 30,2005 covers a period of 17 months which includes the five-month transition period from February 1,2004 through June 30, 2005 and the fiscal year period from July 1, 2004 through June 30, 2005.
Equity Compensation Plan Information
The following table sets forth information concerning our common stock authorized for issuanceunder our equity compensation plans at June 30, 2007:
Plan Category
Number ofsecurities to
be issued uponexercise of
outstandingoptions,
warrants andrights
(a)
Weighted- averageexercise price of
outstandingoptions,
warrants andrights
(b)
Number of securitiesremaining availablefor future issuance
(c)
Equity compensation plans approved bysecurity holders . . . . . . . . . . . . . . . . . . . . . . . 3,397,968 $15.31 1,358,469(1)
Equity compensation plans not approved bysecurity holders . . . . . . . . . . . . . . . . . . . . . . . — $ — —
Total . . . . . . . . . . . . . . . . . . . . . . . . . . . . . . . . . 3,397,968 $15.31 1,358,469(1)
(1) Of these shares of common stock, 636,192 remained available for issuance at June 30, 2007,under the Elizabeth Aden, Inc. 2002 Employee Stock Purchase Plan. See Note 16 to the Notesto Consolidated Financial Statements.
28
ITEM 6. SELECTED FINANCIAL DATA
We derived the following selected financial data from our audited consolidated financialstatements. The following data should be read in conjunction with “Management’s Discussion andAnalysis of Financial Condition and Results of Operations” and our consolidated financialstatements and the related notes included elsewhere in this annual report.
On June 2, 2004, our board of directors approved a change in fiscal year end from January 31to June 30, effective as of June 30, 2004. The change was implemented to better reflect our businesscycle and to enhance business planning relative to our customers’ retail calendars. See our websitewww.elizabetharden.com\Corporate Info for unaudited financial results for the twelve months endedJune 30, 2004, and 2003.
Years Ended June 30, Five MonthsEnded
June 30, 2004
Years EndedJanuary 31,
(Amounts in thousands, except per share data) 2007 2006 2005 2004 2003
Selected Statement of Income DataNet sales . . . . . . . . . . . . . . . . . . . . . . . . . . . . . . . $1,127,476 $954,550 $ 920,538 $222,784 $814,425 $752,041Gross profit . . . . . . . . . . . . . . . . . . . . . . . . . . . . 461,319 404,072 411,364 88,284 335,777 307,413Income (loss) from operations . . . . . . . . . . . . . . 74,006 68,257 78,533 (32,314) 72,330 68,209Debt extinguishment charges . . . . . . . . . . . . . . — 758 — 3,874 34,808 —Net income (loss) . . . . . . . . . . . . . . . . . . . . . . . . 37,334 32,794 37,604 (31,843) 2,036 18,150Accretion and dividend on preferred stock . . . . — — — 762 3,502 3,653Accelerated accretion on converted preferred
stock . . . . . . . . . . . . . . . . . . . . . . . . . . . . . . . . — — — 19,090 18,584 —Net income (loss) attributable to common
shareholders . . . . . . . . . . . . . . . . . . . . . . . . . . 37,334 32,794 37,604 (51,695) (20,050) 14,497
Selected Per Share DataEarnings (loss) per common share
Basic . . . . . . . . . . . . . . . . . . . . . . . . . . . . . . $ 1.35(1) $ 1.15(1) $ 1.35(2) $ (2.08)(3) $ (1.02)(4)$ 0.82Diluted . . . . . . . . . . . . . . . . . . . . . . . . . . . . $ 1.30(1) $ 1.10(1) $ 1.25(2) $ (2.08)(3) $ (1.02)(4)$ 0.78
Weighted average number of common sharesBasic . . . . . . . . . . . . . . . . . . . . . . . . . . . . . . 27,607 28,628 27,792 24,885 19,581 17,757Diluted . . . . . . . . . . . . . . . . . . . . . . . . . . . . 28,826 29,818 30,025 24,885 19,581 23,200
Other DataEBITDA(5) . . . . . . . . . . . . . . . . . . . . . . . . . . . . . $ 98,524 $ 89,608 $ 100,038 $ (27,495) $ 58,374 $ 90,984Net cash provided by (used in) operating
activities . . . . . . . . . . . . . . . . . . . . . . . . . . . . . 58,816 65,276 35,549 (46,591) 45,801 28,620Net cash used in investing activities . . . . . . . . . 110,518 24,335 17,508 4,138 11,365 13,007Net cash provided by (used in) financing
activities . . . . . . . . . . . . . . . . . . . . . . . . . . . . . 53,120 (37,584) (15,785) (15,080) 31,196 (9,753)
Years Ended June 30, Five MonthsEnded
June 30, 2004
Years EndedJanuary 31,
2007 2006 2005 2004 2003
Selected Balance Sheet DataCash . . . . . . . . . . . . . . . . . . . . . . . . . . . . . . . . . . $ 30,287 $ 28,466 $ 25,316 $ 23,494 $ 89,087 $ 22,663Inventories . . . . . . . . . . . . . . . . . . . . . . . . . . . . . 380,232 269,270 273,343 258,638 193,382 200,876Working capital . . . . . . . . . . . . . . . . . . . . . . . . . 298,165 280,942 275,628 191,872 220,843 216,461Total assets . . . . . . . . . . . . . . . . . . . . . . . . . . . . 939,175 759,903 719,897 663,686 698,079 627,620Short-term debt . . . . . . . . . . . . . . . . . . . . . . . . . 97,640 40,000 47,700 65,900 — 2,068Long-term debt, including current portion . . . 225,655 225,951 233,802 238,566 325,089 320,329Convertible, redeemable preferred stock . . . . . — — — — 10,793 15,634Shareholders’ equity . . . . . . . . . . . . . . . . . . . . . 320,927 277,847 259,200 202,060 210,959 131,844
(1) We adopted SFAS 123R, Share-Based Payment, on July 1, 2005, for the year ended June 30, 2006 and subsequentperiods. For the year ended June 30, 2007, share-based payment expenses resulting from the application of SFAS 123Rand restructuring charges reduced basic and fully diluted earnings per share by $0.20 per share. For the year endedJune 30, 2006, share-based payment expenses resulting from the application of SFAS 123R, restructuring and debtextinguishment charges reduced basic and fully diluted earnings per share by $0.20 and $0.19 per share, respectively.
(2) Reflects a reduction in basic and fully diluted earnings per share of $0.06 and $0.05 per share, respectively, as a result ofthe impairment charge related to the sale of the Miami Lakes facility in June 2005.
29

(3) Reflects a reduction in basic and diluted loss per share of $0.89 per share, as a result of the accelerated accretion on theconversion of our Series D convertible preferred stock into common stock in April 2004 and June 2004 and debtextinguishment and restructuring charges.
(4) Reflects a reduction in basic and diluted earnings per share of $2.09 and $1.99 per share, respectively, as a result of theaccelerated accretion on the conversion of our Series D convertible preferred stock into common stock in October 2003and debt extinguishment and restructuring charges.
(5) EBITDA is defined as net income plus the provision for income taxes (or net loss less the benefit from income taxes), plusinterest expense, plus depreciation and amortization expense. EBITDA should not be considered as an alternative tooperating income (loss) or net income (loss) (as determined in accordance with generally accepted accounting principles)as a measure of our operating performance or to net cash provided by operating, investing and financing activities (asdetermined in accordance with generally accepted accounting principles) or as a measure of our ability to meet cashneeds. We believe that EBITDA is a measure commonly reported and widely used by investors and other interestedparties as a measure of a company’s operating performance and debt servicing ability because it assists in comparingperformance on a consistent basis without regard to capital structure (particularly when acquisitions are involved),depreciation and amortization, or non-operating factors such as historical cost. Accordingly, as a result of our capitalstructure, we believe EBITDA is a relevant measure. This information has been disclosed here to permit a more completecomparative analysis of our operating performance relative to other companies and of our debt servicing ability. EBITDAmay not, however, be comparable in all instances to other similar types of measures.In addition, EBITDA has limitations as an analytical tool, including the fact that:
• it does not reflect our cash expenditures, future requirements for capital expenditures or contractual commitments;
• it does not reflect the significant interest expense or the cash requirements necessary to service interest or principalpayments on our debt;
• it does not reflect any cash income taxes that we may be required to pay; and
• although depreciation and amortization are non-cash charges, the assets being depreciated and amortized will oftenhave to be replaced in the future and these measures do not reflect any cash requirements for such replacements.
The following is a reconciliation of net income (loss), as determined in accordance withgenerally accepted accounting principles, to EBITDA:
Years Ended June 30, Five MonthsEnded
June 30, 2004
Years EndedJanuary 31,
(Amounts in thousands) 2007 2006 2005 2004 2003
Net income (loss) . . . . . . . . . $37,334 $32,794 $ 37,604 $(31,843) $ 2,036 $18,150Provision for (benefit
from) incometaxes . . . . . . . . . . . . . 7,474 11,281 17,403 (14,188) (4,112) 7,059
Interest expense . . . . . . 29,198 23,424 23,526 9,835 39,593 43,075Depreciation and
amortization . . . . . . . 24,518 22,109 21,505 8,701 20,857 22,700
EBITDA . . . . . . . . . . . . . . . . $98,524(a) $89,608(b) $100,038(c) $(27,495)(d) $58,374(e) $90,984
(a) Includes $4.7 million of share-based payment expenses resulting from the application ofSFAS 123R and $2.1 million of restructuring charges.
(b) Includes $5.8 million of share-based payment expenses resulting from the application ofSFAS 123R, $1.2 million of restructuring charges and $0.8 million of debt extinguishmentcharges.
(c) Includes an impairment charge related to the sale of the Miami Lakes facility of $2.2 million.(d) Includes debt extinguishment and restructuring charges of $3.9 million and $1.3 million,
respectively.(e) Includes debt extinguishment and restructuring charges of $34.8 million and $2.3 million,
respectively.
30

ITEM 7. MANAGEMENT’S DISCUSSION AND ANALYSIS OF FINANCIAL CONDITION ANDRESULTS OF OPERATIONS
The following discussion and analysis should be read in conjunction with the consolidatedfinancial statements and the accompanying notes which appear elsewhere in this document.
Overview
We are a global prestige beauty products company. We sell fragrance, skin care and colorcosmetic products in the United States primarily to department stores and mass retailers, as well asinternationally in prestige department stores, perfumeries, boutiques and travel retail locations. Wehave established ourselves as a source of over 400 fragrance, skin care and cosmetic brands throughbrand ownership, brand licensing and distribution arrangements. In addition to approximately 100prestige brands we own or license, we also distribute over 300 additional prestige fragrance brandsmanufactured by other beauty companies principally to mass retailers in the United States. Ourportfolio of owned and licensed fragrance brands includes the Elizabeth Arden fragrance brands:Red Door, Elizabeth Arden 5th Avenue, Elizabeth Arden Provocative Woman, Elizabeth Arden greentea, and Elizabeth Arden Mediterranean; the Elizabeth Taylor fragrance brands: White Diamondsand Elizabeth Taylor’s Passion; the Britney Spears fragrance brands: curious Britney Spears,fantasy Britney Spears and Britney Spears believe; the Mariah Carey fragrance M by Mariah Carey;the Hilary Duff fragrance with Love...Hilary Duff; the Danielle Steel fragrance Danielle by DanielleSteel; the fragrance brands White Shoulders, Giorgio and Giorgio Red; the men’s fragrancesDaytona 500, HUMMERTM Fragrance for Men, and PS Fine Cologne for Men; and the designerfragrance brands of Alfred Sung, Badgley Mischka, Bob Mackie, GANT, Lulu Guinness, NanetteLepore, Geoffrey Beene and Halston. Our skin care brands include Ceramide, Intervene, Eight HourCream and PREVAGETM, and our cosmetic products include the Elizabeth Arden brand lipstick,foundation and color cosmetic products.
Our business strategy to increase net sales, operating margins and earnings is based on(a) growing the sales of our existing brand portfolio through new product launches and increasedadvertising and marketing activities, (b) acquiring control of additional prestige brands throughlicensing opportunities and acquisitions, (c) expanding the offering of prestige fragrance productsthat we distribute on behalf of other beauty companies to mass retail customers, (d) implementinginitiatives to improve our cost structure and working capital efficiencies, and (e) developing ourbusiness in emerging markets.
We manage our business by evaluating net sales, EBITDA (as defined in Note 5 under Item 6“Selected Financial Data”) and working capital utilization (including monitoring our levels ofinventory, accounts receivable and operating cash flow). We encounter a variety of challenges thatmay affect our business and should be considered as described in Item 1A “Risk Factors” and in thesection “Management’s Discussion and Analysis of Financial Condition and Results of Operations -Forward-Looking Information and Factors That May Affect Future Results.”
On August 11, 2006, we completed the acquisition of certain assets comprising the fragrancebusiness of Sovereign Sales, LLC, a distributor of prestige fragrances to mass retail customers inNorth America for over 20 years. This acquisition helped to expand our North American fragrancebusiness and increase our market share with our mass retail customers. In addition, on June 29,2006, we acquired the brand licenses and certain assets of Riviera Concepts Inc. The acquiredbrands included the designer fragrance brands of Alfred Sung, Badgley Mischka, Lulu Guinness,Nanette Lepore, and Bob Mackie and the HUMMER™ Fragrance for Men. During fiscal 2007, wealso acquired the exclusive worldwide license for the Giorgio Beverly Hills brand. We believe theacquisition of these fragrance brands has complemented our fragrance portfolio.
31

For fiscal 2008, our key focus will be on improving our operating margins, cash flow fromoperations and return on invested capital. We are implementing a variety of initiatives relating toour extended supply chain, logistics functions and enterprise information systems that we believewill provide improved operating and financial performance.
Our financial results for the fiscal year ending June 30, 2008, will also depend on our ability tosuccessfully launch new products, particularly our new fragrances for Mariah Carey and BritneySpears, to successfully introduce our fragrance brands to additional retailers and to continue to growour international sales. New product introductions require additional upfront spending formarketing, development and promotional expenses. To the extent one or more of our new productintroductions or our efforts to expand operating margins or grow international sales are not assuccessful as we had planned, it could result in a reduction of our profitability and cash flow.
Critical Accounting Policies and Estimates
We consider the following accounting policies important in understanding our operating resultsand financial condition. See Note 1 to the Notes to Consolidated Financial Statements — “GeneralInformation and Summary of Significant Accounting Policies,” for a discussion of these and otheraccounting policies.
Accounting for Acquisitions and Intangible Assets. We have accounted for our acquisitionsunder the purchase method of accounting for business combinations. Under the purchase method ofaccounting, the cost, including transaction costs, are allocated to the underlying net assets, based ontheir respective estimated fair values. The excess of the purchase price over the estimated fair valuesof the net assets acquired is recorded as goodwill.
The judgments made in determining the estimated fair value and expected useful lives assignedto each class of assets and liabilities acquired can significantly affect net income. For example,different classes of assets will have useful lives that differ, and the useful life of property, plant, andequipment acquired will differ substantially from the useful life of brand licenses and trademarks.Consequently, to the extent a longer-lived asset is ascribed greater value under the purchase methodthan a shorter-lived asset, net income in a given period may be higher.
Determining the fair value of certain assets and liabilities acquired is judgmental in nature andoften involves the use of significant estimates and assumptions. One of the areas that requires morejudgment is determining the fair value and useful lives of intangible assets. In this process, we oftenobtain the assistance of third party valuation firms for certain intangible assets.
Our intangible assets consist of exclusive brand licenses, trademarks and other intellectualproperty, customer relationships and lists, non-compete agreements and goodwill. The value of theseassets is exposed to future adverse changes if we experience declines in operating results orexperience significant negative industry or economic trends. We review intangible assets andgoodwill for impairment at least annually. Our intangibles are reviewed for impairment orreconsideration of the useful life assigned as circumstances dictate using the guidance of applicableaccounting literature.
We have determined that the Elizabeth Arden trademarks have indefinite useful lives, as cashflows from the use of the trademarks are expected to be generated indefinitely. During the quarterended June 30, 2007, we performed our annual impairment testing of these assets with theassistance of a third party valuation firm. The analyses and assessments of these assets indicatedthat no impairment adjustment was required.
Depreciation and Amortization. Depreciation and amortization is provided over the estimateduseful lives of the assets using the straight-line method. Periodically, we review the lives assigned toour long-lived assets and adjust the lives, as circumstances dictate.
32

Long-Lived Assets. We review for the impairment of long-lived assets to be held and usedwhenever events or changes in circumstances indicate that the carrying amount of such assets maynot be fully recoverable. Measurement of an impairment loss is based on the fair value of the assetcompared to its carrying value. Long-lived assets to be disposed of are reported at the lower ofcarrying amount or fair value less costs to sell.
Revenue Recognition. Sales are recognized when title and risk of loss transfers to the customer,the sales price is fixed or determinable and collectibility of the resulting receivable is probable. Salesare recorded net of estimated returns and other allowances. The provision for sales returnsrepresents management’s estimate of future returns based on historical experience and consideringcurrent external factors and market conditions.
Allowances for Sales Returns and Markdowns. As is customary in the prestige beauty business,we grant certain of our customers, subject to our authorization and approval, the right to eitherreturn product or to receive a markdown allowance for certain promotional product. Upon sale, werecord a provision for product returns and markdowns estimated based on our historical andprojected experience, economic trends and changes in customer demand. There is considerablejudgment used in evaluating the factors influencing the allowance for returns and markdowns, andadditional allowances in any particular period may be needed.
Allowances for Doubtful Accounts Receivable. We maintain allowances for doubtful accountsto cover uncollectible accounts receivable, and we evaluate our accounts receivable to determine ifthey will ultimately be collected. This evaluation includes significant judgments and estimates,including an analysis of receivables aging and a customer-by-customer review for large accounts. If,for example, the financial condition of our customers deteriorates resulting in an impairment of theirability to pay, additional allowances may be required.
Provisions for Inventory Obsolescence. We record a provision for estimated obsolescence andshrinkage of inventory. Our estimates consider the cost of inventory, forecasted demand, theestimated market value, the shelf life of the inventory and our historical experience. If there arechanges to these estimates, additional provisions for inventory obsolescence may be necessary.
Hedge Contracts. We have designated each qualifying foreign currency contract we haveentered into as a cash flow hedge. Unrealized gains or losses, net of taxes, associated with thesecontracts are included in accumulated other comprehensive income on the balance sheet. Gains andlosses will only be recognized in earnings in the period in which the contracts expire.
Share-Based Compensation. All share-based payments to employees, including the grants ofemployee stock options, are recognized in the financial statements based on their fair values, butonly to the extent that vesting is considered probable. Compensation cost for awards that vest willnot be reversed if the awards expire without being exercised. The fair value of stock options isdetermined using the Black-Scholes option-pricing model. The fair value of the market-basedrestricted stock awards is determined using a Monte Carlo simulation model, and the fair value of allother restricted stock awards is based on the closing price of our common stock on the date of grant.Compensation costs for awards are amortized using the straight-line method. Option pricing modelinput assumptions such as expected term, expected volatility and risk-free interest rate impact thefair value estimate. Further, the forfeiture rate impacts the amount of aggregate compensation.These assumptions are subjective and generally require significant analysis and judgment to develop.When estimating fair value, some of the assumptions are based on or determined from external dataand other assumptions may be derived from our historical experience with share-basedarrangements. The appropriate weight to place on historical experience is a matter of judgment,based on relevant facts and circumstances.
33
We rely on our historical experience and post-vested termination activity to provide data forestimating our expected term for use in determining the fair value of our stock options. We currentlyestimate our stock volatility by considering our historical stock volatility experience and other keyfactors. The risk-free interest rate is the implied yield currently available on U.S. Treasury zero-coupon issues with a remaining term equal to the expected term used as the input to the Black-Scholes model. We estimate forfeitures using our historical experience. Our estimates of forfeitureswill be adjusted over the requisite service period based on the extent to which actual forfeituresdiffer, or are expected to differ, from their estimates.
Income Taxes and Valuation Reserves. A valuation allowance may be required to reducedeferred tax assets to the amount that is more likely than not to be realized. We consider projectedfuture taxable income and ongoing tax planning strategies in assessing a potential valuationallowance. In the event we determine that we may not be able to realize all or part of our deferredtax asset in the future, or that new estimates indicate that a previously recorded valuation allowanceis no longer required, an adjustment to the deferred tax asset would be charged or credited to netincome in the period of such determination.
34
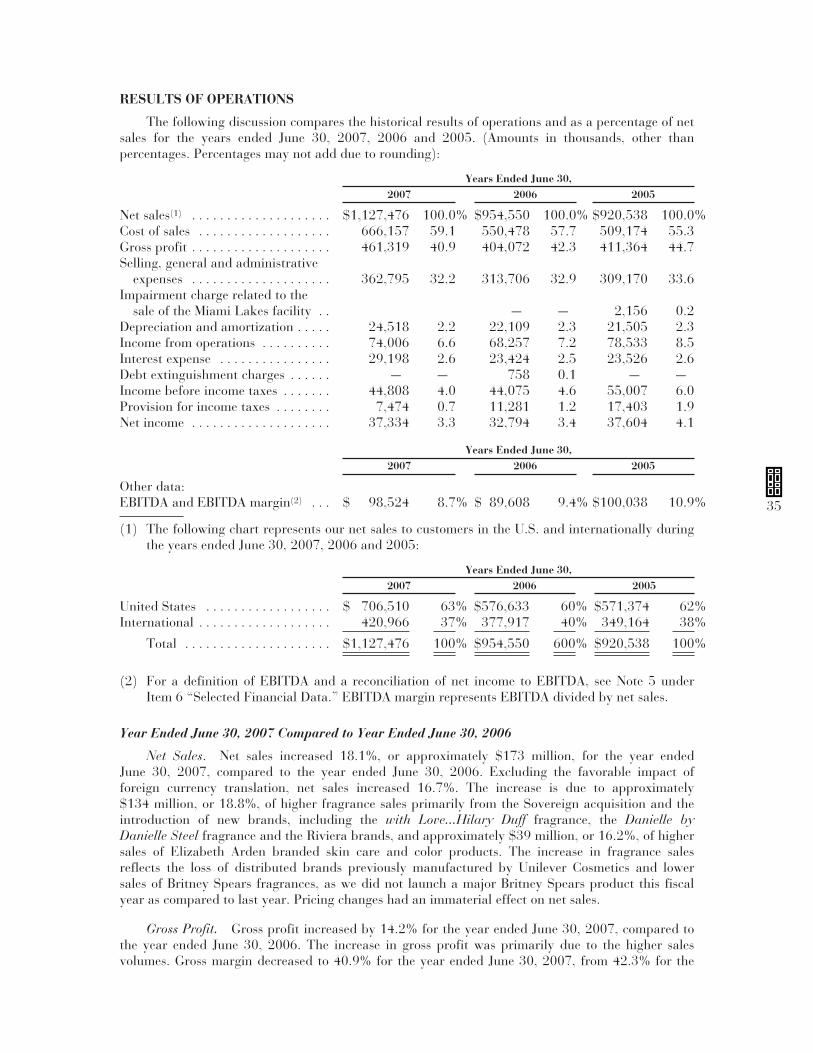
RESULTS OF OPERATIONS
The following discussion compares the historical results of operations and as a percentage of netsales for the years ended June 30, 2007, 2006 and 2005. (Amounts in thousands, other thanpercentages. Percentages may not add due to rounding):
Years Ended June 30,2007 2006 2005
Net sales(1) . . . . . . . . . . . . . . . . . . . . $1,127,476 100.0% $954,550 100.0% $920,538 100.0%Cost of sales . . . . . . . . . . . . . . . . . . . 666,157 59.1 550,478 57.7 509,174 55.3Gross profit . . . . . . . . . . . . . . . . . . . . 461,319 40.9 404,072 42.3 411,364 44.7Selling, general and administrative
expenses . . . . . . . . . . . . . . . . . . . . 362,795 32.2 313,706 32.9 309,170 33.6Impairment charge related to the
sale of the Miami Lakes facility . . — — 2,156 0.2Depreciation and amortization . . . . . 24,518 2.2 22,109 2.3 21,505 2.3Income from operations . . . . . . . . . . 74,006 6.6 68,257 7.2 78,533 8.5Interest expense . . . . . . . . . . . . . . . . 29,198 2.6 23,424 2.5 23,526 2.6Debt extinguishment charges . . . . . . — — 758 0.1 — —Income before income taxes . . . . . . . 44,808 4.0 44,075 4.6 55,007 6.0Provision for income taxes . . . . . . . . 7,474 0.7 11,281 1.2 17,403 1.9Net income . . . . . . . . . . . . . . . . . . . . 37,334 3.3 32,794 3.4 37,604 4.1
Years Ended June 30,2007 2006 2005
Other data:EBITDA and EBITDA margin(2) . . . $ 98,524 8.7% $ 89,608 9.4% $100,038 10.9%
(1) The following chart represents our net sales to customers in the U.S. and internationally duringthe years ended June 30, 2007, 2006 and 2005:
Years Ended June 30,2007 2006 2005
United States . . . . . . . . . . . . . . . . . . $ 706,510 63% $576,633 60% $571,374 62%International . . . . . . . . . . . . . . . . . . . 420,966 37% 377,917 40% 349,164 38%
Total . . . . . . . . . . . . . . . . . . . . . $1,127,476 100% $954,550 600% $920,538 100%
(2) For a definition of EBITDA and a reconciliation of net income to EBITDA, see Note 5 underItem 6 “Selected Financial Data.” EBITDA margin represents EBITDA divided by net sales.
Year Ended June 30, 2007 Compared to Year Ended June 30, 2006
Net Sales. Net sales increased 18.1%, or approximately $173 million, for the year endedJune 30, 2007, compared to the year ended June 30, 2006. Excluding the favorable impact offoreign currency translation, net sales increased 16.7%. The increase is due to approximately$134 million, or 18.8%, of higher fragrance sales primarily from the Sovereign acquisition and theintroduction of new brands, including the with Love...Hilary Duff fragrance, the Danielle byDanielle Steel fragrance and the Riviera brands, and approximately $39 million, or 16.2%, of highersales of Elizabeth Arden branded skin care and color products. The increase in fragrance salesreflects the loss of distributed brands previously manufactured by Unilever Cosmetics and lowersales of Britney Spears fragrances, as we did not launch a major Britney Spears product this fiscalyear as compared to last year. Pricing changes had an immaterial effect on net sales.
Gross Profit. Gross profit increased by 14.2% for the year ended June 30, 2007, compared tothe year ended June 30, 2006. The increase in gross profit was primarily due to the higher salesvolumes. Gross margin decreased to 40.9% for the year ended June 30, 2007, from 42.3% for the
35

year ended June 30, 2006 due to (i) a higher proportion of our net sales coming from distributedfragrances, which traditionally operate at lower gross margins than our owned and licensedfragrance brands, primarily as a result of the Sovereign acquisition, and (ii) transition costsassociated with the Riviera and Sovereign acquisitions.
SG&A. Selling, general and administrative expenses increased 15.6%, or approximately$49.1 million, for the year ended June 30, 2007, compared to the year ended June 30, 2006. Theincrease was principally due to employee compensation costs of $22.0 million that were primarilyincentive related, higher advertising, promotional, royalty and product development costs of$11.3 million mainly related to new fragrance launches, the unfavorable effect of foreign exchangerates of $5.0 million, and costs of $2.1 million associated with our restructuring plans announced inMay 2006, primarily in our European operations. Also contributing to the increase were transitioncosts associated with the Riviera and Sovereign acquisitions.
Depreciation and Amortization. Depreciation and amortization increased by 10.9% for theyear ended June 30, 2007, compared to the year ended June 30, 2006. The increase is primarily aresult of the amortization of intangible assets associated with the Riviera and Sovereign acquisitionsand higher depreciation costs due to the higher level of capital additions during the fiscal yearsended June 30, 2007 and 2006 as compared to the prior period.
Interest Expense. Interest expense, net of interest income, increased by 24.6% for the yearended June 30, 2007 compared to the year ended June 30, 2006. The increase is a result of higheraverage borrowings under our credit facility primarily due to the payment of approximately $90.4million of cash for the Sovereign acquisition.
Debt Extinguishment Costs. On February 1, 2006, we redeemed the remaining $8.8 millionaggregate principal amount of our 113⁄4% senior secured notes due 2011 at the redemption price of105.875% of their par amount plus accrued interest. As a result of the redemption, we incurred apre-tax debt extinguishment charge of approximately $0.8 million. See Note 10 to the Notes toConsolidated Financial Statements.
Provision for Income Taxes. A provision for income taxes of approximately $7.5 million wasrecorded for the year ended June 30, 2007, compared to approximately $11.3 million for the yearended June 30, 2006, due to a lower effective tax rate and higher interest expense. The income taxprovision for the year ended June 30, 2007, reflects an adjustment to the annual effective tax ratefor increased earnings contributions from our worldwide affiliates, which generally have tax rateslower than the U.S. federal statutory rate, as well as an adjustment to record a benefit from researchand development tax credits attributable to prior years and the reversal of a valuation allowanceassociated with the tax benefit for net operating losses generated by certain internationalsubsidiaries, which are now expected to be utilized. The effective tax rate for the years endedJune 30, 2007 and 2006 was 16.7% and 25.6%, respectively. See Note 13 to the Notes toConsolidated Financial Statements.
Net Income. Net income increased by 13.8% for the year ended June 30, 2007 to$37.3 million as compared to $32.8 million for the year ended June 30, 2006. The increase wasprimarily a result of a decrease in the provision for income taxes due to a lower effective tax rate andhigher income from operations due to higher net sales, partially offset by higher interest expense.
EBITDA. EBITDA (net income plus the provision for income taxes (or net loss less the benefitfrom income taxes), plus interest expense, plus depreciation and amortization expense) increased by10%, or $8.9 million, to $98.5 million for the year ended June 30, 2007 compared to $89.6 millionfor the year ended June 30, 2006. The increase in EBITDA was primarily the result of higher netsales and gross profit, partially offset by higher selling, general and administrative expenses. For areconciliation of net income to EBITDA for the years ended June 30, 2007 and 2006, see Note 5under Item 6 “Selected Financial Data.”
36

Year Ended June 30, 2006 Compared to Year Ended June 30, 2005
Net Sales. Net sales increased 3.7% for the year ended June 30, 2006 compared to the yearended June 30, 2005. Excluding the impact of foreign currency translation, net sales increased4.4%. The sales increase was mainly driven by $79 million of sales related to initial brand launches,including the fantasy Britney Spears fragrance and the PREVAGE™ skin care line, partially offsetby $17 million of lower sales of distributed brands, including as a result of the loss of distribution ofbrands previously manufactured by Unilever Cosmetics, and $30 million of lower sales of brandsinitially launched last fiscal year, primarily the curious Britney Spears and Elizabeth ArdenProvocative Woman fragrances. The consolidation of certain retail customers, such as FederatedDepartment Stores and The May Company, and retail customers implementing inventory controlinitiatives also negatively affected net sales. Pricing changes had an immaterial effect on the netsales increase.
Gross Profit. Gross profit decreased by 1.8% for the year ended June 30, 2006 compared tothe year ended June 30, 2005. Gross margin decreased to 42.3% for the year ended June 30, 2006,from 44.7% for the year ended June 30, 2005 primarily as a result of proportionately higher sales ofowned and licensed fragrances into mass retail channels of distribution and higher promotionalsales. Product costs of new launches have also increased and the consolidation of certain retailcustomers, such as Federated Department Stores and The May Company, and retail customersimplementing inventory control initiatives also negatively affected gross profit and gross margin.
SG&A. Selling, general and administrative expenses increased 1.5% for the year endedJune 30, 2006 compared to the year ended June 30, 2005. The increase was primarily due to anincrease in royalty costs related to higher sales of licensed brands and product development coststotaling $3.2 million, rent expense of $1.6 million and the unfavorable impact of foreign currencyrates of $0.7 million, partially offset by a $0.9 million decrease in promotional costs.
Impairment Charge Related to the Sale of the Miami Lakes Facility. During the year endedJune 30, 2005, we recorded a non-cash charge of approximately $2.2 million related to theimpairment of assets that were part of, or used in, the Miami Lakes facility in anticipation of thesale of the facility. See Note 7 to the Notes to Consolidated Financial Statements.
Depreciation and Amortization. Depreciation and amortization increased 2.8% for the yearended June 30, 2006, compared to the year ended June 30, 2005, primarily due to higheramortization costs resulting from the addition of the PREVAGETM license and the acquisition ofintangible assets from our former distributors in the People’s Republic of China and Taiwan.
Interest Expense. Interest expense, net of interest income, decreased by 0.4% for the yearended June 30, 2006, compared to the year ended June 30, 2005. The small decrease is primarilydue to lower average monthly borrowings on our revolving credit facility offset, in part, by higherinterest rates on our revolving credit facility and on the interest rate swap agreement prior to ourtermination of that agreement in March 2006.
Debt Extinguishment Costs. On February 1, 2006, we redeemed the remaining $8.8 millionaggregate principal amount of our 113⁄4% senior secured notes due 2011 at the redemption price of105.875% of their par amount plus accrued interest. As a result of the redemption, we incurred apre-tax debt extinguishment charge in the year ended June 30, 2006 of approximately $0.8 million.See Note 10 to the Notes to Consolidated Financial Statements.
Provision for Income Taxes. The provision for income taxes decreased by $6.1 million for theyear ended June 30, 2006 compared to the year ended June 30, 2005 due to lower income fromoperations and a lower effective tax rate. The annual effective tax rate decreased from 31.6% in theyear ended June 30, 2005, to 25.6% in the year ended June 30, 2006, due to increased earningscontribution from international affiliates, which generally have tax rates lower than the U.S. federalstatutory tax rate. See Note 13 to the Notes to Consolidated Financial Statements.
37

Net Income. Net income for the year ended June 30, 2006 decreased by $4.8 million ascompared to the year ended June 30, 2005. The decrease was primarily a result of a lower grossmargin and higher selling, general and administrative expenses, partially offset by lower incometaxes.
EBITDA. EBITDA (net income plus the provision for income taxes (or net loss less the benefitfrom income taxes), plus interest expense, plus depreciation and amortization expense) decreased by$10.4 million to $89.6 million for the year ended June 30, 2006 compared to $100.0 million for theyear ended June 30, 2005. The decrease in EBITDA was primarily the result of a lower gross profit,higher selling, general and administrative expenses and the debt extinguishment charge related tothe redemption of the remaining $8.8 million aggregate principal amount of 113⁄4% senior securednotes due 2011, partially offset by the $2.2 million impairment charge during the year endedJune 30, 2005 related to the sale of the Miami Lakes facility. For a reconciliation of net income toEBITDA for the years ended June 30, 2006 and 2005, see Note 5 under Item 6 “Selected FinancialData.”
Seasonality
Our operations have historically been seasonal, with higher sales generally occurring in the firsthalf of the fiscal year as a result of increased demand by retailers in anticipation of and during theholiday season. In the year ended June 30, 2007, approximately 59% of our net sales were madeduring the first half of the fiscal year. Due to the size and timing of certain orders from ourcustomers and new product launches, sales, results of operations, working capital requirements andcash flows can vary between quarters of the same and different years. As a result, we expect toexperience variability in net sales, operating margin, net income, working capital requirements andcash flows on a quarterly basis. Increased sales of skin care and cosmetic products relative tofragrances may reduce the seasonality of our business.
We experience seasonality in our working capital, with peak inventory levels normally from Julyto October and peak receivable balances normally from September to December. Our workingcapital borrowings are also seasonal and are normally highest in the months of September, Octoberand November. During the months of December, January and February of each year, cash isnormally generated as customer payments on holiday season orders are received.
Liquidity and Capital Resources
Years Ended June 30,(Amounts in thousands) 2007 2006 2005
Net cash provided by operating activities . . . . . . . . . . . . . . . . . . . $ 58,816 $ 65,276 $ 35,549Net cash used in investing activities . . . . . . . . . . . . . . . . . . . . . . . (110,518) (24,335) (17,508)Net cash provided by (used in) financing activities . . . . . . . . . . . 53,120 (37,584) (15,785)Net increase in cash and cash equivalents . . . . . . . . . . . . . . . . . . 1,821 3,150 1,822
Cash Flows. Net cash provided by operating activities was $6.5 million lower for the year endJune 30, 2007 as compared to June 30, 2006, as an increase in inventories, primarily due to newbrands and the Sovereign acquisition, was partially offset by higher accounts payable and otherpayables and accrued liabilities primarily due to the timing of payments.
Net cash provided by operating activities improved by approximately $30 million for the yearended June 30, 2006 as compared to the year ended June 30, 2005. The improvement was primarilydue to a reduction of inventory that generated approximately $29 million of additional cash ascompared to the prior year and accounts receivable that generated approximately $17 million ofadditional cash as compared to the prior year. This improvement was partially offset by a decreasein accounts payables and other payables and accrued expenses of approximately $6 million, andlower earnings of approximately $5 million.
38

Net cash used in investing activities increased by approximately $86 million for the year endedJune 30, 2007 as compared to the year ended June 30, 2006. The increase in net cash used ininvesting activities is primarily a result of approximately $90 million in cash paid in connection withthe Sovereign acquisition. Additionally, we realized approximately $10 million of cash proceedsfrom the sale of our Miami Lakes facility in the prior year period.
Net cash used in investing activities increased by approximately $7 million for the year endedJune 30, 2006 as compared to the year ended June 30, 2005. The increase in net cash used ininvesting activities is a result of the acquisition of the brand licenses and certain assets of RivieraConcepts Inc. in June 2006, higher capital expenditures and the acquisition of distributor assets inthe People’s Republic of China and Taiwan, partially offset by the sale of the Miami Lakes facilityand related equipment that closed on August 1, 2005 and resulted in approximately $10 million ofcash proceeds.
The following chart illustrates our net cash used in investing activities during the years endedJune 30, 2007, 2006 and 2005:
Years Ended June 30,(Amounts in thousands) 2007 2006 2005
Additions to property and equipment . . . . . . . . . . . . . . . . . . . . . . $ (19,031) $(19,225) $(15,408)Proceeds from disposals of property and equipment . . . . . . . . . . — 9,945 —Acquisition of licenses and distributor assets . . . . . . . . . . . . . . . . (91,487) (15,055) (2,100)
Total . . . . . . . . . . . . . . . . . . . . . . . . . . . . . . . . . . . . . . . . . . . . $(110,518) $(24,335) $(17,508)
We currently expect to incur approximately $25 million in capital expenditures in the yearending June 30, 2008, primarily for in-store counters and computer hardware and software.
For the year ended June 30, 2007, net cash provided by financing activities was approximately$53 million, as compared to approximately $38 million of net cash used in financing activities forthe year ended June 30, 2006. The increase was primarily due to additional borrowings under ourcredit facility used to fund a portion of the purchase price for the Sovereign acquisition in August2006 and other payments related to the Riviera acquisition in June 2006. Share repurchases totaledapproximately $8.5 million and $25 million, in the years ended June 30, 2007 and 2006,respectively. See Notes 9 and 15 to the Notes to Consolidated Financial Statements.
Net cash used in financing activities increased by approximately $22 million for the year endedJune 30, 2006 as compared to the year ended June 30, 2005. The increase in net cash used infinancing activities for the year ended June 30, 2006 was primarily due to approximately$25 million used to repurchase common stock and for the redemption of the remaining $8.8 millionaggregate principal amount of 113⁄4% senior secured notes due 2011on February 1, 2006 (See Notes10 and 15 to the Notes to Consolidated Financial Statements), partially offset by payments on therevolving credit facility and a decrease in working capital requirements.
Interest paid during the year ended June 30, 2007, included approximately $17 million ofinterest payments on the 73⁄4% senior subordinated notes due 2014 and $11 million of interest paidon the borrowings under our credit facility. Interest paid during the year ended June 30, 2006,included approximately $17 million of interest payments on the 73⁄4% senior subordinated notes,swap termination costs of approximately $3 million related to the 73⁄4% senior subordinated notesand $5 million paid on the borrowings under our credit facility. Interest paid during the year endedJune 30, 2005 included approximately $18 million of interest payments on the 73⁄4% seniorsubordinated notes that covered the period from the January 13, 2004 date of issuance throughFebruary 15, 2005.
39

Debt and Contractual Financial Obligations and Commitments. At June 30, 2007, our long-term debt and financial obligations and commitments by due dates were as follows:
Payments Due by Period
TotalLess Than
1 Year 1-3 Years 3-5 YearsMore
Than 5 Years(Amounts in thousands)Long-term debt, including current
portion(1) . . . . . . . . . . . . . . . . . . . . . . $227,813 $ 1,125 $ 1,688 $ — $225,000Interest payments on long-term
debt(2) . . . . . . . . . . . . . . . . . . . . . . . . . 113,465 17,521 34,912 34,876 26,156Operating lease obligations . . . . . . . . . . 66,300 15,501 25,897 16,860 8,042Purchase obligations(3) . . . . . . . . . . . . . . 397,129 249,685 134,621 12,823 —Other long-term obligations(4) . . . . . . . . 22,979 6,333 16,646 — —
Total . . . . . . . . . . . . . . . . . . . . . . . . $827,686 $290,165 $213,764 $64,559 $259,198
(1) Total scheduled maturities do not include approximately $2.2 million of swap termination coststhat were recorded as a reduction to long-term debt and are to be amortized to interest expenseover the remaining life of the 73⁄4% senior subordinated notes due 2014.
(2) Consists of interest at the rate of 73⁄4% per annum on the $225 million aggregate principalamount of 73⁄4% senior subordinated notes due 2014 and interest at the rate 4.15% per annumon the $3.4 million promissory term note assumed in connection with the acquisition of certainassets of Riviera Concepts Inc.
(3) Consists of purchase commitments for finished goods, raw materials, components, advertising,promotional items, minimum royalty guarantees, insurance, services pursuant to legally bindingobligations, including fixed or minimum obligations, and estimates of such obligations subjectto variable price provisions.
(4) Includes contingent consideration paid to Sovereign in September 2007 of $6.3 million andconsideration potentially payable to Sovereign and Riviera of $8.6 million and $5.7 million,respectively. See Note 12 to the Notes to Consolidated Financial Statements.
At June 30, 2007, we had contractual obligations to incur promotional and advertisingexpenses, which are either fixed commitments or based on net sales for licensed brands, andminimum royalty guarantees in an aggregate amount of $60.3 million through 2011, compared with$75.2 million through 2011 at June 30, 2006.
Future Liquidity and Capital Needs. Our principal future uses of funds are for workingcapital requirements, including brand development and marketing expenses, new product launches,additional brand acquisitions or product distribution arrangements, capital expenditures and debtservice. In addition, we may use funds to repurchase our common stock and senior subordinatednotes. We have historically financed, and we expect to continue to finance, our needs primarilythrough internally generated funds, our credit facility and external financing. We collect cash fromour customers based on our sales to them and their respective payment terms.
We have a revolving credit facility with a syndicate of banks, for which JPMorgan Chase Bankis the administrative agent, which generally provides for borrowings on a revolving basis of up to$250 million with a $25 million sub limit for letters of credit. Pursuant to an August 2007amendment to the credit facility, the credit facility was increased to $300 million until October 31,2007, and to $275 million from November 1, 2007 until November 15, 2007. After November 15,2007, the credit facility provides for borrowings up to $250 million. Under the terms of the creditfacility we may, at any time, increase the size of the credit facility up to $300 million withoutentering into a formal amendment requiring the consent of all of the banks, subject to oursatisfaction of certain conditions. In addition, from August 15, 2007 until October 31, 2007, we
40

have temporary additional borrowing availability of $25 million above the borrowing availabilitythat is supported by our level of eligible accounts receivable and inventory (as described below). Thecredit facility expires in December 2012.
The credit facility is guaranteed by all of our U.S. subsidiaries and is collateralized by a firstpriority lien on all of our U.S. accounts receivable and U.S. and Canada inventory. Except for thetemporary additional borrowing availability described above, borrowings under the credit facilityare limited to 85% of eligible accounts receivable and 85% of the appraised net liquidation value ofour inventory, as determined pursuant to the terms of the credit facility. Our obligations under thecredit facility rank senior to our 73⁄4% senior subordinated notes due 2014.
The credit facility has only one financial maintenance covenant, which is a debt servicecoverage ratio that must be maintained at not less than 1.1 to 1 if average borrowing availabilitydeclines to less than $25 million ($35 million from December 1 through May 31). No financialmaintenance covenant was applicable for the year ended June 30, 2007. Under the terms of thecredit facility, we may pay dividends or repurchase common stock if we maintain borrowingavailability of at least $25 million from June 1 to November 30, and at least $35 million fromDecember 1 to May 31 after the applicable payment. The credit facility restricts us from incurringadditional non-trade indebtedness (other than refinancings and certain small amounts ofindebtedness).
Borrowings under the credit portion of the credit facility bear interest at a floating rate based onthe “Applicable Margin,” which is determined by reference to a specific financial ratio. At ouroption, the Applicable Margin may be applied to either the London InterBank Offered Rate (LIBOR)or the prime rate. The reference ratio for determining the Applicable Margin is a debt servicecoverage ratio. The Applicable Margin charged on LIBOR loans ranges from 1.00% to 1.75% and is0% for prime rate loans, except that the Applicable Margin on the first $25 million of borrowings is1.00% higher. As of June 30, 2007, the Applicable Margin was 1.25% for LIBOR loans and 0% forprime rate loans. The commitment fee on the unused portion of the credit facility is 0.25%. For theyears ended June 30, 2007 and 2006, the weighted average annual interest rate on borrowingsunder the Company’s Credit Facility was 7.1% and 6.3%, respectively.
As of June 30, 2007, we had $98 million in outstanding borrowings and approximately$4 million in letters of credit outstanding under the credit facility, approximately $237 million ofeligible receivables and inventories available as collateral under the credit facility, and remainingborrowing availability of approximately $139 million.
As of June 30, 2007, we had outstanding $225 million aggregate principal amount of 73⁄4%senior subordinated notes. The 73⁄4% senior subordinated notes are guaranteed by our U.S.subsidiaries: DF Enterprises, Inc., FD Management, Inc., Elizabeth Arden International Holding,Inc., Elizabeth Arden (Financing), Inc., RDEN Management, Inc. and Elizabeth Arden Travel Retail,Inc. The indentures pursuant to which the 73⁄4% senior subordinated notes were issued provide thatsuch notes will be our senior subordinated obligations. The 73⁄4% senior subordinated notes rankjunior to all of our existing and future senior indebtedness, including indebtedness under the creditfacility, and pari passu in right of payment to all of our senior subordinated indebtedness. Intereston the 73⁄4% senior subordinated notes is payable semi-annually on February 15th and August 15thof each year. The indentures generally permit us (subject to the satisfaction of a fixed chargecoverage ratio and, in certain cases, also a net income test) to incur additional indebtedness, paydividends, purchase or redeem our common stock or redeem subordinated indebtedness. Theindentures generally limit our ability to create liens, merge or transfer or sell assets. The indenturesalso provide that the holders of the 73⁄4% senior subordinated notes have the option to require us torepurchase their notes in the event of a change of control involving us (as defined in the indentures).
41

We believe that existing cash and cash equivalents, internally generated funds and borrowingsunder our credit facility will be sufficient to cover debt service, working capital requirements andcapital expenditures for the next twelve months, other than additional working capital requirementsthat may result from further expansion of our operations through acquisitions of additional brands,new product launches or distribution arrangements.
Repurchases of Common Stock. On November 2, 2005, our board of directors authorized us toimplement a stock repurchase program to repurchase up to $40.0 million of our common stockthrough March 31, 2007. On November 2, 2006, our board of directors authorized the repurchase ofan additional $40.0 million of our common stock under the terms of our existing stock repurchaseprogram and extended the term of the stock repurchase program from March 31, 2007 toNovember 30, 2008. As of June 30, 2007, we have repurchased 1,862,169 shares of common stock,at an average price of $18.19 per share on the open market, at a cost of approximately$33.9 million, including sales commissions. For the year ended June 30, 2007, we repurchased524,042 shares of common stock, at an average price of $16.30 per share on the open market, at acost of approximately $8.5 million, including sales commissions. These repurchases are accountedfor under the treasury method. There were no repurchases of common stock during the three monthsended June 30, 2007.
We have discussions from time to time with manufacturers of prestige fragrance brands andwith distributors that hold exclusive distribution rights regarding our possible acquisition ofadditional exclusive manufacturing and/or distribution rights. We currently have no agreements orcommitments with respect to any such acquisition, although we periodically execute routineagreements to maintain the confidentiality of information obtained during the course of discussionswith manufacturers and distributors. There is no assurance that we will be able to negotiatesuccessfully for any such future acquisitions or that we will be able to obtain acquisition financing oradditional working capital financing on satisfactory terms for further expansion of our operations.
New Accounting Standards
Accounting for Uncertainty in Income Taxes
In June 2006, the FASB issued Financial Interpretation No. 48, “Accounting for Uncertainty inIncome Taxes - an Interpretation of FASB Statement No. 109,” which prescribes a recognitionthreshold and measurement attribute for the financial statement recognition and measurement of atax position taken or expected to be taken in a tax return. FIN 48 requires that we recognize in ourconsolidated financial statements, the impact of a tax position if it is more likely than not that suchposition will be sustained on audit based on its technical merits. The provisions of FIN 48 alsoprovide guidance on de-recognition, classification, interest and penalties, accounting in interimperiods, and disclosure. The provisions of FIN 48 are effective for us for the fiscal year beginningJuly 1, 2007, with the cumulative effect of the change in accounting principle, if any, recorded as anadjustment to the opening balance of retained earnings. We are currently evaluating the impact ofFIN 48 on our consolidated financial statements.
Fair Value Measurements
In September 2006, the FASB issued Statement of Financial Accounting Standards No. 157,Fair Value Measurements, which defines fair value, establishes a framework for measuring fair valuein accordance with generally accepted accounting principles, and expands disclosures about fairvalue measurements. SFAS 157 will be effective for us on July 1, 2008. We are currently evaluatingthe impact of SFAS 157 on our consolidated financial statements.
42
Considering the Effects of Prior Year Misstatements when Quantifying Misstatements in Current YearFinancial Statements
In September 2006, the Securities and Exchange Commission issued Staff Accounting BulletinNo. 108, “Considering the Effects of Prior Year Misstatements when Quantifying Misstatements inCurrent Year Financial Statements,” which provides interpretive guidance on the consideration ofthe effects of prior year misstatements in quantifying current year misstatements for the purpose ofa materiality assessment. SAB 108 was effective for us for the fiscal year ending June 30, 2007 andpermits a one-time transitional cumulative effect adjustment to beginning retained earnings as ofJuly 1, 2006, for errors that were not previously deemed material, but are material under theguidance in SAB 108. The adoption of SAB 108 did not have a material impact on our consolidatedfinancial statements.
The Fair Value Option for Financial Assets and Financial Liabilities
In February 2007, the FASB issued Statement of Financial Accounting Standards No. 159, TheFair Value Option for Financial Assets and Financial Liabilities. SFAS 159 permits entities to chooseto measure at fair value many financial instruments and certain other items that are not currentlyrequired to be measured at fair value. This option is only available to select financial instrumentsand is irrevocable once applied. SFAS 159 is effective for us beginning July 1, 2008. We arecurrently evaluating the impact of this new standard on our consolidated financial statements.
Forward-Looking Information and Factors That May Affect Future Results
The Securities and Exchange Commission encourages companies to disclose forward-lookinginformation so that investors can better understand a company’s future prospects and makeinformed investment decisions. This Annual Report on Form 10-K and other written and oralstatements that we make from time to time contain such forward-looking statements that set outanticipated results based on management’s plans and assumptions regarding future events orperformance. We have tried, wherever possible, to identify such statements by using words such as“anticipate,” “estimate,” “expect,” “project,” “intend,” “plan,” “believe,” “will” and similarexpressions in connection with any discussion of future operating or financial performance. Inparticular, these include statements relating to future actions, prospective products, futureperformance or results of current and anticipated products, sales efforts, expenses, interest rates,foreign exchange rates, the outcome of contingencies, such as legal proceedings, and financialresults. A list of factors that could cause our actual results of operations and financial condition todiffer materially is set forth below, and these factors are discussed in greater detail under Item 1A —“Risk Factors” of this Annual Report on Form 10-K.
• factors affecting our relationships with our customers or our customers’ businesses,including the absence of contracts with customers, our customers’ financial condition, andchanges in the retail, fragrance and cosmetic industries, such as the consolidation ofretailers and the associated closing of retail doors as well as retailer inventory controlpractices;
• our reliance on third-party manufacturers for substantially all of our owned and licensedproducts and our absence of contracts with suppliers;
• delays in shipments, inventory shortages and higher costs of production due to the loss of ordisruption in our distribution facilities or at key third party manufacturing or fulfillmentfacilities that manufacture or provide logistic services for our products;
• our ability to respond in a timely manner to changing consumer preferences and purchasingpatterns and other international and domestic conditions and events that impact consumerconfidence and demand;
• our ability to protect our intellectual property rights;
• the success, or changes in the timing or scope of, our new product launches, advertising andmerchandising programs;
43

• the quality, safety and efficacy of our products;
• the impact of competitive products and pricing;
• risks of international operations, including foreign currency fluctuations, economic andpolitical consequences of terrorist attacks, and political instability in certain regions of theworld;
• our ability to implement our growth strategy and acquire or license additional brands orsecure additional distribution arrangements, to successfully and cost-effectively integrateacquired businesses or new brands, and to finance our growth strategy and our workingcapital requirements;
• our level of indebtedness, debt service obligations and restrictive covenants in our revolvingcredit facility and the indenture for our 73⁄4% senior subordinated notes;
• changes in product mix to less profitable products;
• the retention and availability of key personnel;
• changes in the legal, regulatory and political environment that impact, or will impact, ourbusiness, including changes to customs or trade regulations or accounting standards orcritical accounting estimates; and
• other unanticipated risks and uncertainties
We caution that the factors described herein and other factors could cause our actual results ofoperations and financial condition to differ materially from those expressed in any forward-lookingstatements we make and that investors should not place undue reliance on any such forward-lookingstatements. Further, any forward-looking statement speaks only as of the date on which suchstatement is made, and we undertake no obligation to update any forward-looking statement toreflect events or circumstances after the date on which such statement is made or to reflect theoccurrence of anticipated or unanticipated events or circumstances. New factors emerge from time totime, and it is not possible for us to predict all of such factors. Further, we cannot assess the impactof each such factor on our results of operations or the extent to which any factor, or combination offactors, may cause actual results to differ materially from those contained in any forward-lookingstatements.
ITEM 7A. QUANTITATIVE AND QUALITATIVE DISCLOSURES ABOUT MARKET RISK
Interest Rate Risk
As of June 30, 2007, we had $98 million in borrowings outstanding under our revolving creditfacility. Borrowings under our revolving credit facility are seasonal, with peak borrowings typicallyin the months of September, October and November. Borrowings under the credit facility are subjectto variable rates and, accordingly, our earnings and cash flow will be affected by changes in interestrates. Based upon our average borrowings under our revolving credit facility during the year endedJune 30, 2007, and assuming there had been a two percentage point change in the average interestrate for these borrowings, it is estimated that our interest expense for the year ended June 30, 2007would have increased or decreased by approximately $3.0 million.
Foreign Currency Risk
We sell our products in approximately 90 countries around the world. During the years endedJune 30, 2007 and 2006 we derived approximately 37% and 40%, respectively, of our net sales fromour international operations. We conduct our international operations in a variety of different countriesand derive our sales in various currencies including the Euro, British pound, Swiss franc, Canadiandollar and Australian dollar, as well as the U.S. dollar. Most of our skin care and cosmetic products areproduced in a third-party manufacturing facility located in Roanoke, Virginia. Our operations may be
44

subject to volatility because of currency changes, inflation changes and changes in political andeconomic conditions in the countries in which we operate. With respect to international operations, oursales, cost of goods sold and expenses are typically denominated in a combination of local currency andthe U.S. dollar. Our results of operations are reported in U.S. dollars. Fluctuations in currency ratescan affect our reported sales, margins, operating costs and the anticipated settlement of our foreigndenominated receivables and payables. A weakening of the foreign currencies in which we generatesales relative to the currencies in which our costs are denominated, which is primarily the U.S. dollar,may decrease our reported cash flow and operating profits. Our competitors may or may not be subjectto the same fluctuations in currency rates, and our competitive position could be affected by thesechanges. As of June 30, 2007, our subsidiaries outside the United States held approximately 29% ofour total assets. The cumulative effect of translating balance sheet accounts from the functionalcurrency into the U.S. dollar at current exchange rates is included in “Accumulated othercomprehensive income” in our consolidated balance sheets.
As of June 30, 2007, we had notional amounts of 74.8 million Euros and 37.3 million Britishpounds under foreign currency contracts that expire between July 31, 2007 and June 29, 2009 toreduce the exposure of our foreign subsidiary revenues to fluctuations in currency rates. As ofJune 30, 2007, we had notional amounts of 20.3 million Canadian dollars under foreign currencycontracts that expire between July 31, 2007 and June 29, 2009 to reduce the exposure of ourCanadian subsidiary’s cost of sales to fluctuations in currency rates. We have designated eachqualifying foreign currency contract as a cash flow hedge. The gains and losses of these contractswill only be recognized in earnings in the period in which the contracts expire. The realized loss, netof taxes, recognized during the year ended June 30, 2007 was approximately $2.4 million. AtJune 30, 2007, the unrealized loss, net of taxes associated with these contracts of approximately$1.4 million, is included in accumulated other comprehensive income. The unrealized loss, net oftaxes, with respect to foreign currency contracts, increased by approximately $1.0 million during theyear ended June 30, 2007.
When appropriate, we also enter into and settle foreign currency contracts for Euros, Britishpounds and Canadian dollars to reduce the exposure of our foreign subsidiaries’ net balance sheetsto fluctuations in foreign currency rates. As of June 30, 2007, there were no such foreign currencycontracts outstanding. The realized loss, net of taxes, recognized during the year ended June 30,2007 was approximately $1.1 million.
We do not utilize foreign exchange contracts for trading or speculative purposes. There can beno assurance that our hedging operations or other exchange rate practices, if any, will eliminate orsubstantially reduce risks associated with fluctuating exchange rates.
45
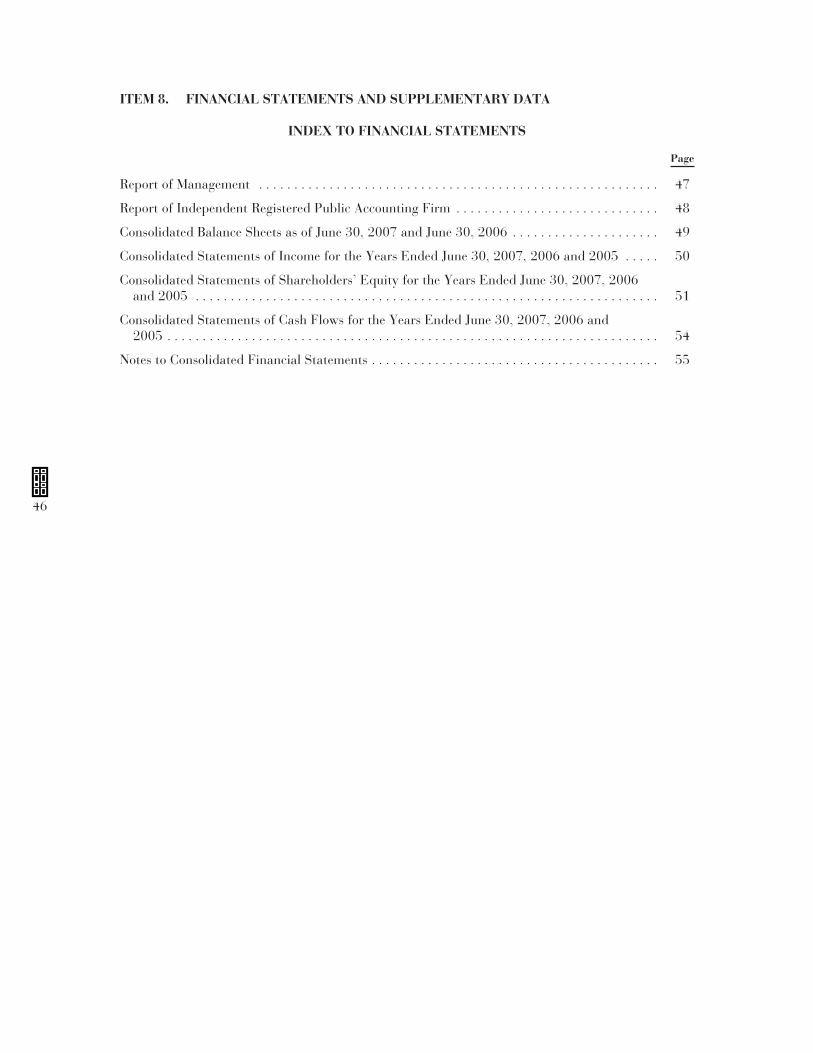
ITEM 8. FINANCIAL STATEMENTS AND SUPPLEMENTARY DATA
INDEX TO FINANCIAL STATEMENTS
Page
Report of Management . . . . . . . . . . . . . . . . . . . . . . . . . . . . . . . . . . . . . . . . . . . . . . . . . . . . . . . . . 47
Report of Independent Registered Public Accounting Firm . . . . . . . . . . . . . . . . . . . . . . . . . . . . . 48
Consolidated Balance Sheets as of June 30, 2007 and June 30, 2006 . . . . . . . . . . . . . . . . . . . . . 49
Consolidated Statements of Income for the Years Ended June 30, 2007, 2006 and 2005 . . . . . 50
Consolidated Statements of Shareholders’ Equity for the Years Ended June 30, 2007, 2006and 2005 . . . . . . . . . . . . . . . . . . . . . . . . . . . . . . . . . . . . . . . . . . . . . . . . . . . . . . . . . . . . . . . . . . 51
Consolidated Statements of Cash Flows for the Years Ended June 30, 2007, 2006 and2005 . . . . . . . . . . . . . . . . . . . . . . . . . . . . . . . . . . . . . . . . . . . . . . . . . . . . . . . . . . . . . . . . . . . . . . 54
Notes to Consolidated Financial Statements . . . . . . . . . . . . . . . . . . . . . . . . . . . . . . . . . . . . . . . . . 55
46

REPORT OF MANAGEMENTElizabeth Arden, Inc. and Subsidiaries
Report on Consolidated Financial Statements
We prepared and are responsible for the consolidated financial statements that appear in theAnnual Report on Form 10-K for the year ended June 30, 2007 of Elizabeth Arden, Inc. (the“Company”). These consolidated financial statements are in conformity with accounting principlesgenerally accepted in the United States of America, and therefore, include amounts based oninformed judgments and estimates. We also accept responsibility for the preparation of otherfinancial information that is included in the Company’s Annual Report on Form 10-K.
Report on Internal Control Over Financial Reporting
The management of the Company is responsible for establishing and maintaining adequateinternal control over financial reporting as defined in Rules 13a-15(f) and 15d-15(f) under theSecurities Exchange Act of 1934. The Company’s internal control over financial reporting isdesigned to provide reasonable assurance regarding the reliability of financial reporting and thepreparation of financial statements for external purposes in accordance with generally acceptedaccounting principles in the United States of America. The Company’s internal control over financialreporting includes those policies and procedures that: (i) pertain to the maintenance of records that,in reasonable detail, accurately and fairly reflect the transactions and dispositions of the assets of theCompany; (ii) provide reasonable assurance that transactions are recorded as necessary to permitpreparation of financial statements in accordance with generally accepted accounting principles, andthat receipts and expenditures of the Company are being made only in accordance withauthorizations of management and directors of the Company; and (iii) provide reasonable assuranceregarding prevention or timely detection of unauthorized acquisition, use or disposition of theCompany’s assets that could have a material effect on the consolidated financial statements.
Because of its inherent limitations, internal control over financial reporting may not prevent ordetect misstatements. Also, projections of any evaluation of effectiveness to future periods aresubject to the risk that controls may become inadequate because of changes in conditions, or that thedegree of compliance with the policies or procedures may deteriorate. Management of the Companyassessed the effectiveness of the Company’s internal control over financial reporting as of June 30,2007. In making this assessment, management used the criteria set forth by the Committee ofSponsoring Organizations of the Treadway Commission (COSO) in Internal Control-IntegratedFramework. Based on our assessment using those criteria, management concluded that the Companymaintained effective internal control over financial reporting as of June 30, 2007.
PricewaterhouseCoopers LLP, the independent registered public accounting firm that auditedthe consolidated financial statements that appear in the Company’s Annual Report on Form 10-Kfor the year ended June 30, 2007, has issued an attestation on the Company’s internal control overfinancial reporting as of June 30, 2007, as stated in their report which is included herein.
E. Scott Beattie Stephen J. SmithChairman, President and ChiefExecutive Officer
Executive Vice President and Chief Financial Officer
September 6, 2007
47

REPORT OF INDEPENDENT REGISTERED PUBLIC ACCOUNTING FIRM
To the Board of Directors and Shareholders ofElizabeth Arden, Inc.
In our opinion, the consolidated financial statements listed in the accompanying index presentfairly, in all material respects, the financial position of Elizabeth Arden, Inc. and its subsidiaries atJune 30, 2007 and June 30, 2006, and the results of their operations and their cash flows for each ofthe three years in the period ended June 30, 2007 in conformity with accounting principles generallyaccepted in the United States of America. Also in our opinion, the Company maintained, in allmaterial respects, effective internal control over financial reporting as of June 30, 2007, based oncriteria established in Internal Control—Integrated Framework issued by the Committee ofSponsoring Organizations of the Treadway Commission (COSO). The Company’s management isresponsible for these financial statements, for maintaining effective internal control over financialreporting and for its assessment of the effectiveness of internal control over financial reporting,included in the accompanying Report of Management appearing under Item 8. Our responsibility isto express opinions on these financial statements and on the Company’s internal control overfinancial reporting based on our integrated audits. We conducted our audits in accordance with thestandards of the Public Company Accounting Oversight Board (United States). Those standardsrequire that we plan and perform the audits to obtain reasonable assurance about whether thefinancial statements are free of material misstatement and whether effective internal control overfinancial reporting was maintained in all material respects. Our audits of the financial statementsincluded examining, on a test basis, evidence supporting the amounts and disclosures in the financialstatements, assessing the accounting principles used and significant estimates made by management,and evaluating the overall financial statement presentation. Our audit of internal control overfinancial reporting included obtaining an understanding of internal control over financial reporting,assessing the risk that a material weakness exists, and testing and evaluating the design andoperating effectiveness of internal control based on the assessed risk. Our audits also includedperforming such other procedures as we considered necessary in the circumstances. We believe thatour audits provide a reasonable basis for our opinions.
As discussed in Note 3 to the consolidated financial statements, the Company changed themanner in which it accounts for share-based compensation in the year ended June 30, 2006.
A company’s internal control over financial reporting is a process designed to providereasonable assurance regarding the reliability of financial reporting and the preparation of financialstatements for external purposes in accordance with generally accepted accounting principles. Acompany’s internal control over financial reporting includes those policies and procedures that(i) pertain to the maintenance of records that, in reasonable detail, accurately and fairly reflect thetransactions and dispositions of the assets of the company; (ii) provide reasonable assurance thattransactions are recorded as necessary to permit preparation of financial statements in accordancewith generally accepted accounting principles, and that receipts and expenditures of the companyare being made only in accordance with authorizations of management and directors of thecompany; and (iii) provide reasonable assurance regarding prevention or timely detection ofunauthorized acquisition, use, or disposition of the company’s assets that could have a materialeffect on the financial statements.
Because of its inherent limitations, internal control over financial reporting may not prevent ordetect misstatements. Also, projections of any evaluation of effectiveness to future periods aresubject to the risk that controls may become inadequate because of changes in conditions, or that thedegree of compliance with the policies or procedures may deteriorate.
PricewaterhouseCoopers LLPNew York, New YorkSeptember 6, 2007
48

ELIZABETH ARDEN, INC. AND SUBSIDIARIES
CONSOLIDATED BALANCE SHEETS(Dollars in thousands, except par value)
As ofJune 30, 2007 June 30, 2006
ASSETSCurrent Assets
Cash and cash equivalents . . . . . . . . . . . . . . . . . . . . . . . . . . . . . . . . . $ 30,287 $ 28,466Accounts receivable, net . . . . . . . . . . . . . . . . . . . . . . . . . . . . . . . . . . . 214,972 181,080Inventories . . . . . . . . . . . . . . . . . . . . . . . . . . . . . . . . . . . . . . . . . . . . . 380,232 269,270Deferred income taxes . . . . . . . . . . . . . . . . . . . . . . . . . . . . . . . . . . . . 17,427 15,471Prepaid expenses and other assets . . . . . . . . . . . . . . . . . . . . . . . . . . . 22,675 21,633
Total current assets . . . . . . . . . . . . . . . . . . . . . . . . . . . . . . . . . . . . . 665,593 515,920
Property and equipment, net . . . . . . . . . . . . . . . . . . . . . . . . . . . . . . . . . . . 42,471 34,681Exclusive brand licenses, trademarks and intangibles, net . . . . . . . . . . . . 224,611 201,534Debt financing costs, net . . . . . . . . . . . . . . . . . . . . . . . . . . . . . . . . . . . . . . 5,777 6,741Other . . . . . . . . . . . . . . . . . . . . . . . . . . . . . . . . . . . . . . . . . . . . . . . . . . . . . . 723 1,027
Total assets . . . . . . . . . . . . . . . . . . . . . . . . . . . . . . . . . . . . . . . . . . . $939,175 $759,903
LIABILITIES AND SHAREHOLDERS’ EQUITYCurrent Liabilities
Short-term debt . . . . . . . . . . . . . . . . . . . . . . . . . . . . . . . . . . . . . . . . . $ 97,640 $ 40,000Accounts payable—trade . . . . . . . . . . . . . . . . . . . . . . . . . . . . . . . . . . 180,532 134,006Other payables and accrued expenses . . . . . . . . . . . . . . . . . . . . . . . . 88,131 60,409Current portion of long-term debt . . . . . . . . . . . . . . . . . . . . . . . . . . . 1,125 563
Total current liabilities . . . . . . . . . . . . . . . . . . . . . . . . . . . . . . . . . . 367,428 234,978
Long-term LiabilitiesLong-term debt . . . . . . . . . . . . . . . . . . . . . . . . . . . . . . . . . . . . . . . . . . 224,530 225,388Deferred income taxes and other liabilities . . . . . . . . . . . . . . . . . . . . 26,290 21,690
Total long-term liabilities . . . . . . . . . . . . . . . . . . . . . . . . . . . . . . . . 250,820 247,078
Total liabilities . . . . . . . . . . . . . . . . . . . . . . . . . . . . . . . . . . . . . . . . 618,248 482,056
Commitments and contingencies (see Note 11)Shareholders’ Equity
Common stock, $.01 par value, 50,000,000 shares authorized;30,473,294 and 29,869,458 shares issued, respectively . . . . . . . . 305 299
Additional paid-in capital . . . . . . . . . . . . . . . . . . . . . . . . . . . . . . . . . 265,245 252,565Retained earnings . . . . . . . . . . . . . . . . . . . . . . . . . . . . . . . . . . . . . . . . 85,675 48,341Treasury stock (1,862,169 and 1,338,127 shares at cost,
respectively) . . . . . . . . . . . . . . . . . . . . . . . . . . . . . . . . . . . . . . . . . . (33,879) (25,339)Accumulated other comprehensive income . . . . . . . . . . . . . . . . . . . . 3,581 1,981
Total shareholders’ equity . . . . . . . . . . . . . . . . . . . . . . . . . . . . . 320,927 277,847
Total liabilities and shareholders’ equity . . . . . . . . . . . . . . . . . . $939,175 $759,903
The Accompanying Notes are an Integral Part of the Consolidated Financial Statements.
49
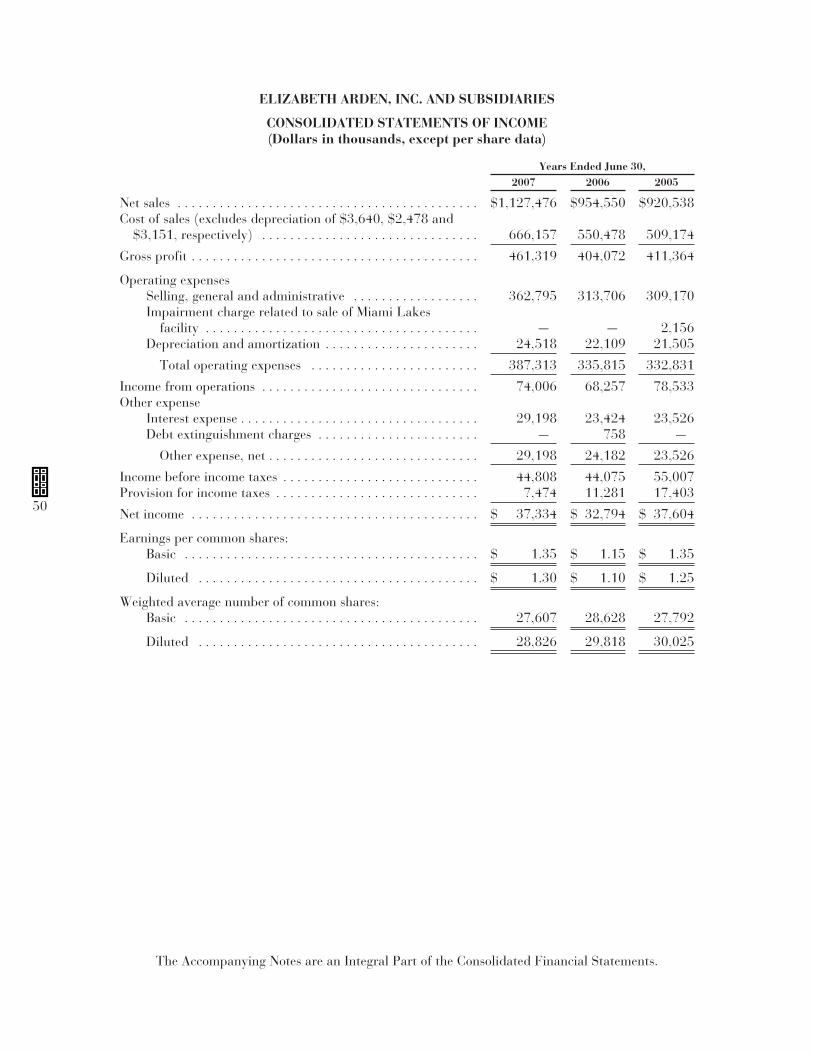
ELIZABETH ARDEN, INC. AND SUBSIDIARIES
CONSOLIDATED STATEMENTS OF INCOME(Dollars in thousands, except per share data)
Years Ended June 30,2007 2006 2005
Net sales . . . . . . . . . . . . . . . . . . . . . . . . . . . . . . . . . . . . . . . . . . . $1,127,476 $954,550 $920,538Cost of sales (excludes depreciation of $3,640, $2,478 and
$3,151, respectively) . . . . . . . . . . . . . . . . . . . . . . . . . . . . . . . 666,157 550,478 509,174
Gross profit . . . . . . . . . . . . . . . . . . . . . . . . . . . . . . . . . . . . . . . . . 461,319 404,072 411,364
Operating expensesSelling, general and administrative . . . . . . . . . . . . . . . . . . 362,795 313,706 309,170Impairment charge related to sale of Miami Lakes
facility . . . . . . . . . . . . . . . . . . . . . . . . . . . . . . . . . . . . . . . — — 2,156Depreciation and amortization . . . . . . . . . . . . . . . . . . . . . . 24,518 22,109 21,505
Total operating expenses . . . . . . . . . . . . . . . . . . . . . . . . 387,313 335,815 332,831
Income from operations . . . . . . . . . . . . . . . . . . . . . . . . . . . . . . . 74,006 68,257 78,533Other expense
Interest expense . . . . . . . . . . . . . . . . . . . . . . . . . . . . . . . . . . 29,198 23,424 23,526Debt extinguishment charges . . . . . . . . . . . . . . . . . . . . . . . — 758 —
Other expense, net . . . . . . . . . . . . . . . . . . . . . . . . . . . . . . 29,198 24,182 23,526
Income before income taxes . . . . . . . . . . . . . . . . . . . . . . . . . . . . 44,808 44,075 55,007Provision for income taxes . . . . . . . . . . . . . . . . . . . . . . . . . . . . . 7,474 11,281 17,403
Net income . . . . . . . . . . . . . . . . . . . . . . . . . . . . . . . . . . . . . . . . . $ 37,334 $ 32,794 $ 37,604
Earnings per common shares:Basic . . . . . . . . . . . . . . . . . . . . . . . . . . . . . . . . . . . . . . . . . . $ 1.35 $ 1.15 $ 1.35
Diluted . . . . . . . . . . . . . . . . . . . . . . . . . . . . . . . . . . . . . . . . $ 1.30 $ 1.10 $ 1.25
Weighted average number of common shares:Basic . . . . . . . . . . . . . . . . . . . . . . . . . . . . . . . . . . . . . . . . . . 27,607 28,628 27,792
Diluted . . . . . . . . . . . . . . . . . . . . . . . . . . . . . . . . . . . . . . . . 28,826 29,818 30,025
The Accompanying Notes are an Integral Part of the Consolidated Financial Statements.
50

ELIZABETH ARDEN, INC. AND SUBSIDIARIES
CONSOLIDATED STATEMENTS OF SHAREHOLDERS’ EQUITY(Amounts in thousands)
Common Stock AdditionalPaid-inCapital
RetainedEarnings
(AccumulatedDeficit)
Treasury StockAccumulated
OtherComprehensive
Income
UnearnedDeferred
Compensation
TotalShareholders’
EquityShares Amount Shares Amount
Balance at June 30, 2004 . . . . . . . . . . 28,170 $282 $228,891 $(22,057) — $ — $2,806 $ (7,862) $202,060Issuance of common stock upon
exercise of stock options . . . . . . . 566 6 5,734 — — — — — 5,740Issuance of common stock for
employee stock purchase plan . . 85 1 1,509 — — — — — 1,510Common stock issued to an
independent contractor . . . . . . . . — — 801 — — — — — 801Issuance of restricted stock, net of
forfeitures . . . . . . . . . . . . . . . . . . 436 4 10,331 — — — — (10,335) —Mark to market of performance-
based restricted stock . . . . . . . . . — — 329 — — — — (329) —Amortization of unearned deferred
compensation, net offorfeitures . . . . . . . . . . . . . . . . . . — — — — — — — 6,237 6,237
Tax benefit from exercise of stockoptions and other stockawards . . . . . . . . . . . . . . . . . . . . . — — 2,395 — — — — — 2,395
Other . . . . . . . . . . . . . . . . . . . . . . . . — — (71) — — — — — (71)Comprehensive income:
Net income . . . . . . . . . . . . . . . . . — — — 37,604 — — — — 37,604
Foreign currency translationadjustments . . . . . . . . . . . . . . . — — — — — — 22 — 22
Disclosure of reclassificationamounts, net of taxes (8% taxrate):
Unrealized hedging gains arisingduring the period . . . . . . . . . . — — — — — — 4,974 — 4,974
Less: reclassification adjustmentfor hedging losses included innet income . . . . . . . . . . . . . . . . — — — — — — 2,072 — 2,072
Net unrealized cash flow hedginggain . . . . . . . . . . . . . . . . . . . . . — — — — — — 2,902 — 2,902
Total comprehensive income: . . . . . — — — 37,604 — — 2,924 — 40,528
Balance at June 30, 2005 . . . . . . . . . . 29,257 $293 $249,919 $ 15,547 — $ — $5,730 $(12,289) $259,200
The Accompanying Notes are an Integral Part of the Consolidated Financial Statements.
51

ELIZABETH ARDEN, INC. AND SUBSIDIARIES
CONSOLIDATED STATEMENTS OF SHAREHOLDERS’ EQUITY—(Continued)(Amounts in thousands)
Common Stock AdditionalPaid-inCapital
RetainedEarnings
(AccumulatedDeficit)
Treasury StockAccumulated
OtherComprehensive
Income
UnearnedDeferred
Compensation
TotalShareholders’
EquityShares Amount Shares Amount
Balance at June 30, 2005 . . . . . . . 29,257 $293 $249,919 $15,547 — $ — $5,730 $(12,289) $259,200Change in accounting principle
for adoption of SFAS 123RShare-based payment awards(See Note 3) . . . . . . . . . . . . . . — — (12,150) — — — — 12,289 139
Issuance of common stock uponexercise of stock options . . . . 278 3 3,109 — — — — — 3,112
Issuance of common stock foremployee stock purchaseplan . . . . . . . . . . . . . . . . . . . . 101 1 1,663 — — — — — 1,664
Common stock issued to anindependent contractor . . . . . — — 678 — — — — — 678
Issuance of restricted stock, netof forfeitures . . . . . . . . . . . . . . 233 2 (2) — — — — — —
Amortization of share-basedawards . . . . . . . . . . . . . . . . . . — — 9,348 — — — — — 9,348
Repurchase of common stock . . — — — — (1,338) (25,339) — — (25,339)Comprehensive income:
Net income . . . . . . . . . . . . . . . — — — 32,794 — — — — 32,794
Foreign currency translationadjustments . . . . . . . . . . . . — — — — — — (335) — (335)
Disclosure of reclassificationamounts, net of taxes (8%tax rate):
Unrealized hedging lossarising during theperiod . . . . . . . . . . . . . . . . . — — — — — — (5,392) — (5,392)
Less: reclassificationadjustment for hedginggains included in netincome . . . . . . . . . . . . . . . . — — — — — — (1,978) — (1,978)
Net unrealized cashflow hedging loss . . . . . . . . — — — — — — (3,414) — (3,414)
Total comprehensive income: . . — — — 32,794 — — (3,749) — 29,045
Balance at June 30, 2006 . . . . . . . 29,869 $299 $252,565 $48,341 (1,338) $(25,339) $1,981 $ — $277,847
The Accompanying Notes are an Integral Part of the Consolidated Financial Statements.
52

ELIZABETH ARDEN, INC. AND SUBSIDIARIES
CONSOLIDATED STATEMENTS OF SHAREHOLDERS’ EQUITY(Amounts in thousands)
Common Stock AdditionalPaid-inCapital
RetainedEarnings
(AccumulatedDeficit)
Treasury StockAccumulated
OtherComprehensive
Income
UnearnedDeferred
Compensation
TotalShareholders’
EquityShares Amount Shares Amount
Balance at June 30, 2006 . . . . 29,869 $299 $252,565 $48,341 (1,338)$(25,339) $1,981 $ — $277,847Issuance of common stock
upon exercise of stockoptions . . . . . . . . . . . . . . . 260 3 3,109 — — — — — 3,112
Issuance of common stockfor employee stockpurchase plan . . . . . . . . . . 93 1 1,445 — — — — — 1,446
Issuance of restricted stock,net of forfeitures . . . . . . . 251 2 (2) — — — — — —
Amortization of share-basedawards . . . . . . . . . . . . . . . — — 8,171 — — — — — 8,171
Repurchase of commonstock . . . . . . . . . . . . . . . . . — — — — (524) (8,540) — — (8,540)
Other . . . . . . . . . . . . . . . . . . — — (43) — — — — — (43)Comprehensive income:
Net income . . . . . . . . . . . . — — — 37,334 — — — — 37,334
Foreign currency translationadjustments . . . . . . . . . . . — — — — — — 2,577 — 2,577
Disclosure ofreclassificationamounts, net of taxes(8% tax rate):
Unrealized hedging gainsarising during theperiod . . . . . . . . . . . . . . — — — — — — 1,383 — 1,383
Less: reclassificationadjustment for hedginglosses included in netincome . . . . . . . . . . . . . — — — — — — 2,360 — 2,360
Net unrealized cash flowhedging loss . . . . . . . . . — — — — — — (977) — (977)
Total comprehensiveincome: . . . . . . . . . . . . . . . — — — 37,334 — — 1,600 — 38,934
Balance at June 30, 2007 . . . . 30,473 $305 $265,245 $85,675 (1,862)$(33,879) $3,581 $ — $320,927
The Accompanying Notes are an Integral Part of the Consolidated Financial Statements.
53

ELIZABETH ARDEN, INC. AND SUBSIDIARIES
CONSOLIDATED STATEMENTS OF CASH FLOWS(Dollars in thousands)
Years Ended June 30,2007 2006 2005
Operating activities:Net income . . . . . . . . . . . . . . . . . . . . . . . . . . . . . . . . . . . . . . . . . . $ 37,334 $ 32,794 $ 37,604Adjustments to reconcile net income to net cash provided by
operating activitiesDepreciation and amortization . . . . . . . . . . . . . . . . . . . . . . 24,518 22,109 21,505Amortization of senior note offering costs, swap
termination costs and note premium . . . . . . . . . . . . . . . . 1,324 1,214 1,548Amortization of share-based awards . . . . . . . . . . . . . . . . . . 8,171 9,348 6,237Cumulative effect of a change in accounting for
share-based payment awards . . . . . . . . . . . . . . . . . . . . . . — 139 —Debt extinguishment charges . . . . . . . . . . . . . . . . . . . . . . . . — 758 —Impairment charge related to the Miami Lakes facility . . . — — 2,156Deferred income taxes . . . . . . . . . . . . . . . . . . . . . . . . . . . . . 2,136 7,565 10,685Tax benefit from exercise of stock options . . . . . . . . . . . . . — — 2,395
Change in assets and liabilities, net of acquisitionsIncrease in accounts receivable . . . . . . . . . . . . . . . . . . . . . . (35,556) (30,828) (47,659)(Increase) decrease in inventories . . . . . . . . . . . . . . . . . . . . (44,945) 13,864 (14,705)Increase in prepaid expenses and other assets . . . . . . . . . . . (1,193) (3,702) (2,678)Increase in accounts payable . . . . . . . . . . . . . . . . . . . . . . . . 44,360 26,458 1,737Increase (decrease) in other payables and accrued
expenses . . . . . . . . . . . . . . . . . . . . . . . . . . . . . . . . . . . . . . 20,547 (14,160) 16,266Other . . . . . . . . . . . . . . . . . . . . . . . . . . . . . . . . . . . . . . . . . . 2,120 (283) 458
Net cash provided by operating activities . . . . . . . . . . 58,816 65,276 35,549Investing activities:
Additions to property and equipment . . . . . . . . . . . . . . . . . . . . . (19,031) (19,225) (15,408)Proceeds from disposals of property and equipment . . . . . . . . . — 9,945 —Acquisition of licenses and other assets . . . . . . . . . . . . . . . . . . . (91,487) (15,055) (2,100)
Net cash used in investing activities . . . . . . . . . . . . . . (110,518) (24,335) (17,508)Financing activities:
Proceeds from (payments on) short-term debt . . . . . . . . . . . . . . 57,640 (7,700) (18,200)Payments on long-term debt . . . . . . . . . . . . . . . . . . . . . . . . . . . . (538) (9,321) (4,764)Repurchase of common stock . . . . . . . . . . . . . . . . . . . . . . . . . . . (8,540) (25,339) —Proceeds from the exercise of stock options . . . . . . . . . . . . . . . . 3,112 3,112 5,740Proceeds from employee stock purchase plan . . . . . . . . . . . . . . . 1,446 1,664 1,510Other . . . . . . . . . . . . . . . . . . . . . . . . . . . . . . . . . . . . . . . . . . . . . . — — (71)
Net cash provided by (used in) financing activities . . . 53,120 (37,584) (15,785)Effects of exchange rate changes on cash and cash equivalents . . . . 403 (207) (434)Net increase in cash and cash equivalents . . . . . . . . . . . . . . . . . . . . . 1,821 3,150 1,822Cash and cash equivalents at beginning of year . . . . . . . . . . . . . . . . 28,466 25,316 23,494Cash and cash equivalents at end of year . . . . . . . . . . . . . . . . . . . . . . $ 30,287 $ 28,466 $ 25,316
Supplemental Disclosure of Cash Flow Information:Interest paid during the year . . . . . . . . . . . . . . . . . . . . . . . . . . . . $ 28,147 $ 25,572 $ 23,899
Income taxes paid during the year . . . . . . . . . . . . . . . . . . . . . . . $ 2,770 $ 5,659 $ 2,943
The Accompanying Notes are an Integral Part of the Consolidated Financial Statements.
54

ELIZABETH ARDEN, INC. AND SUBSIDIARIES
NOTES TO CONSOLIDATED FINANCIAL STATEMENTS
NOTE 1. General Information and Summary of Significant Accounting Policies
Organization and Business Activity. Elizabeth Arden, Inc. (the “Company” or “our”) is amanufacturer and marketer of prestige designer fragrances, skin treatment and cosmetic products,to customers in the United States and approximately 90 countries internationally.
Basis of Consolidation. The consolidated financial statements include the accounts of theCompany’s wholly-owned domestic and international subsidiaries. All significant intercompanyaccounts and transactions have been eliminated in consolidation.
Use of Estimates. The preparation of the consolidated financial statements in conformity withgenerally accepted accounting principles requires management to make estimates and assumptionsthat affect the reported amounts of assets and liabilities and disclosure of contingent assets andliabilities at the date of the financial statements and the reported amounts of revenues and expensesduring the reporting period. Actual results could differ from those estimates. Significant estimatesinclude expected useful lives of brand licenses, trademarks, other intangible assets and property,plant and equipment, allowances for sales returns and markdowns, allowances for doubtful accountsreceivable, provisions for inventory obsolescence, and income taxes and valuation reserves. Changesin facts and circumstances may result in revised estimates, which are recorded in the period in whichthey become known.
Revenue Recognition. Sales are recognized when title and the risk of loss transfers to thecustomer, the sale price is fixed or determinable and collectibility of the resulting receivable isprobable. Sales are recorded net of estimated returns and other allowances. The provision for salesreturns represents management’s estimate of future returns based on historical and projectedexperience and considering current external factors and market conditions. During the years endedJune 30, 2007, 2006 and 2005, one customer accounted for an aggregate of 18%, 13% and 13%,respectively, of the Company’s net sales.
Foreign Currency Translation. The financial statements of the Company’s non-U.S.subsidiaries are translated in accordance with Statement of Financial Accounting Standards(“SFAS”) No. 52, “Foreign Currency Translation” (SFAS No. 52). SFAS No. 52 distinguishesbetween translation adjustments and foreign currency transactions. All assets and liabilities offoreign subsidiaries and affiliates that do not utilize the U.S. dollar as its functional currency aretranslated at year-end rates of exchange, while sales and expenses are translated at monthlyweighted average rates of exchange for the year. Unrealized translation gains or losses are reportedas foreign currency translation adjustments through other comprehensive loss or income included inshareholders’ equity. Such adjustments resulted in an unrealized gain of $2.6 million, an unrealizedloss of $0.3 million, and an unrealized gain of $21,700, during the years ended June 30, 2007, 2006and 2005, respectively. Gains or losses resulting from foreign currency transactions are recorded inthe foreign subsidiaries statement of operations. Such gains or losses totaled a loss of $2.1 millionand gains of $2.9 million and $3.6 million in the years ended June 30, 2007, 2006 and 2005,respectively.
Cash and Cash Equivalents. Cash and cash equivalents include cash and interest-bearingdeposits at banks with an original maturity date of three months or less.
Allowances for Doubtful Accounts Receivable. The Company maintains allowances fordoubtful accounts to cover uncollectible accounts receivable and evaluates its accounts receivable todetermine if they will ultimately be collected. This evaluation includes significant judgments andestimates, including an analysis of receivables aging and a customer-by-customer review for largeaccounts. If, for example, the financial condition of the Company’s customers deteriorates resultingin an impairment of their ability to pay, additional allowances may be required.
55

ELIZABETH ARDEN, INC. AND SUBSIDIARIES
NOTES TO CONSOLIDATED FINANCIAL STATEMENTS—(Continued)
Inventories. Inventories are stated at the lower of cost or market. Cost is principallydetermined using the weighted average method. See Note 6.
Property and Equipment, and Depreciation. Property and equipment are stated at cost.Expenditures for major improvements and additions are recorded to the asset accounts, whilereplacements, maintenance and repairs, which do not improve or extend the lives of the respectiveassets, are charged to expense. Depreciation is provided over the estimated useful lives of the assetsusing the straight-line method. When fixed assets are sold or otherwise disposed of, the accounts arerelieved of the original cost of the assets and the related accumulated depreciation and any resultingprofit or loss is credited or charged to income. See Note 7.
Accounting for Acquisitions. The Company has accounted for its acquisitions under thepurchase method of accounting for business combinations. Under the purchase method ofaccounting, the cost, including transaction costs, are allocated to the underlying net assets, based ontheir respective estimated fair values. The excess of the purchase price over the estimated fair valuesof the net assets acquired is recorded as goodwill.
Exclusive Brand Licenses, Trademarks, and Intangibles. Exclusive of intangible assets thathave indefinite useful lives that are no longer being amortized, the Company’s intangible assets arebeing amortized using the straight-line method over their estimated useful lives. See Note 8.
Indefinite-Lived and Long-Lived Assets. Goodwill and indefinite-lived intangible assets arereviewed annually for impairment under the provisions of SFAS No. 142, “Goodwill and OtherIntangible Assets.” The identification and measurement of impairment of goodwill and indefinite-lived intangible assets involves the estimation of the fair value of the indefinite lived intangible assetor the applicable reporting unit in the case of goodwill. The estimates of fair value are based on thebest information available as of the date of the assessment, which primarily incorporatemanagement assumptions about discounted expected future cash flows. Future cash flows can beaffected by changes in industry or market conditions or the rate and extent to which anticipatedsynergies or cost savings are realized with newly acquired entities. See Note 8.
Long-lived assets are reviewed on an ongoing basis for impairment based on a comparison ofthe carrying value of such assets against the undiscounted future cash flows. If an impairment isidentified, the carrying value of the asset is adjusted to estimated fair value. No such adjustmentswere recorded for the years ended June 30, 2007 and 2006. During the year ended June 30, 2005,the Company recorded an impairment charge of approximately $2.2 million related to the sale of itscorporate headquarters and former distribution facility located on a 13-acre tract of land in MiamiLakes, Florida.
Senior Note Offering Costs and Credit Facility Costs. Debt issuance costs and transaction fees,which are associated with the issuance of senior notes and the revolving credit facility, are beingamortized (and charged to interest expense) over the term of the related notes or the term of thecredit facility. In any period in which the senior notes are redeemed, the unamortized debt issuancecosts and transaction fees relating to the notes being redeemed are expensed. See Note 10.
Cost of Sales. Included in cost of sales are the cost of products sold, the cost of gift withpurchase items provided to customers, royalty costs related to patented technology or formulations,warehousing, distribution and supply chain costs. The major components of warehousing,distribution and supply chain costs include salary and related benefit costs for employees in thewarehousing, distribution and supply chain areas and facility related costs in these areas.
56
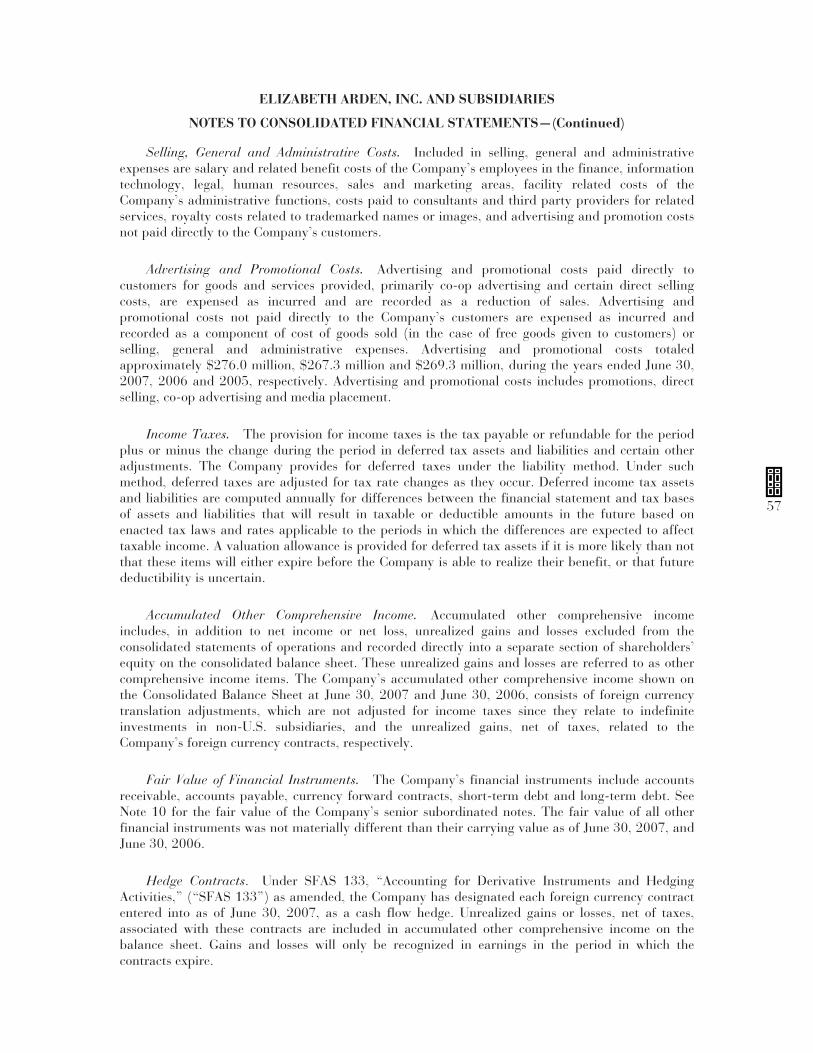
ELIZABETH ARDEN, INC. AND SUBSIDIARIES
NOTES TO CONSOLIDATED FINANCIAL STATEMENTS—(Continued)
Selling, General and Administrative Costs. Included in selling, general and administrativeexpenses are salary and related benefit costs of the Company’s employees in the finance, informationtechnology, legal, human resources, sales and marketing areas, facility related costs of theCompany’s administrative functions, costs paid to consultants and third party providers for relatedservices, royalty costs related to trademarked names or images, and advertising and promotion costsnot paid directly to the Company’s customers.
Advertising and Promotional Costs. Advertising and promotional costs paid directly tocustomers for goods and services provided, primarily co-op advertising and certain direct sellingcosts, are expensed as incurred and are recorded as a reduction of sales. Advertising andpromotional costs not paid directly to the Company’s customers are expensed as incurred andrecorded as a component of cost of goods sold (in the case of free goods given to customers) orselling, general and administrative expenses. Advertising and promotional costs totaledapproximately $276.0 million, $267.3 million and $269.3 million, during the years ended June 30,2007, 2006 and 2005, respectively. Advertising and promotional costs includes promotions, directselling, co-op advertising and media placement.
Income Taxes. The provision for income taxes is the tax payable or refundable for the periodplus or minus the change during the period in deferred tax assets and liabilities and certain otheradjustments. The Company provides for deferred taxes under the liability method. Under suchmethod, deferred taxes are adjusted for tax rate changes as they occur. Deferred income tax assetsand liabilities are computed annually for differences between the financial statement and tax basesof assets and liabilities that will result in taxable or deductible amounts in the future based onenacted tax laws and rates applicable to the periods in which the differences are expected to affecttaxable income. A valuation allowance is provided for deferred tax assets if it is more likely than notthat these items will either expire before the Company is able to realize their benefit, or that futuredeductibility is uncertain.
Accumulated Other Comprehensive Income. Accumulated other comprehensive incomeincludes, in addition to net income or net loss, unrealized gains and losses excluded from theconsolidated statements of operations and recorded directly into a separate section of shareholders’equity on the consolidated balance sheet. These unrealized gains and losses are referred to as othercomprehensive income items. The Company’s accumulated other comprehensive income shown onthe Consolidated Balance Sheet at June 30, 2007 and June 30, 2006, consists of foreign currencytranslation adjustments, which are not adjusted for income taxes since they relate to indefiniteinvestments in non-U.S. subsidiaries, and the unrealized gains, net of taxes, related to theCompany’s foreign currency contracts, respectively.
Fair Value of Financial Instruments. The Company’s financial instruments include accountsreceivable, accounts payable, currency forward contracts, short-term debt and long-term debt. SeeNote 10 for the fair value of the Company’s senior subordinated notes. The fair value of all otherfinancial instruments was not materially different than their carrying value as of June 30, 2007, andJune 30, 2006.
Hedge Contracts. Under SFAS 133, “Accounting for Derivative Instruments and HedgingActivities,” (“SFAS 133”) as amended, the Company has designated each foreign currency contractentered into as of June 30, 2007, as a cash flow hedge. Unrealized gains or losses, net of taxes,associated with these contracts are included in accumulated other comprehensive income on thebalance sheet. Gains and losses will only be recognized in earnings in the period in which thecontracts expire.
57

ELIZABETH ARDEN, INC. AND SUBSIDIARIES
NOTES TO CONSOLIDATED FINANCIAL STATEMENTS—(Continued)
NOTE 2. Earnings Per Share
Basic income per share is computed by dividing the net income by the weighted average sharesof the Company’s outstanding common stock, $.01 par value per share (“Common Stock”). Thecalculation of diluted income per share is similar to basic income per share except that thedenominator includes potentially dilutive Common Stock such as stock options and, non-vestedrestricted stock. The following table represents the computation of earnings per share:
Years Ended June 30,2007 2006 2005
(Amounts in thousands, except per share data)
BasicNet income . . . . . . . . . . . . . . . . . . . . . . . . . . . . . . . . . . . . . . . . . . $37,334 $32,794 $37,604
Weighted average shares outstanding . . . . . . . . . . . . . . . . . . . . . 27,607 28,628 27,792
Net income per basic share . . . . . . . . . . . . . . . . . . . . . . . . . . . . . $ 1.35 $ 1.15 $ 1.35
DilutedNet income . . . . . . . . . . . . . . . . . . . . . . . . . . . . . . . . . . . . . . . . . . $37,334 $32,794 $37,604
Weighted average basic shares outstanding . . . . . . . . . . . . . . . . . 27,607 28,628 27,792Potential common shares—treasury method . . . . . . . . . . . . . . . . 1,219 1,190 2,233
Weighted average shares and potential diluted shares . . . . . . . . 28,826 29,818 30,025
Net income per diluted share . . . . . . . . . . . . . . . . . . . . . . . . . . . . $ 1.30 $ 1.10 $ 1.25
The following table shows the options to purchase shares of Common Stock that wereoutstanding during the years ended June 30, 2007, 2006 and 2005, but were not included in thecomputation of earnings per diluted share because the option exercise price was greater than theaverage market price of the common shares:
Years Ended June 30,2007 2006 2005
Number of shares . . . . . . . . . . . . . . . . . . . . . . . . . 767,509 783,600 —
Range of exercise price . . . . . . . . . . . . . . . . . . . . . $ 20.15-23.40 $ 21.60-23.40 $ —
NOTE 3. Share-Based Compensation
In December 2004, the Financial Accounting Standards Board (“FASB”) issued SFAS No. 123(revised 2004) “Share-Based Payment,” (“SFAS 123R”), which replaces SFAS 123 and supersedesAPB 25. SFAS 123R requires all share-based payments to employees, including the grants ofemployee stock options, to be recognized in the financial statements based on their fair valuesbeginning with the first interim or annual period after June 15, 2005. Effective July 1, 2005, theCompany adopted SFAS 123R using the modified prospective method. Under this method,compensation cost recognized during the year ended June 30, 2006, includes: (a) compensation costfor all share-based payments granted prior to, but not vested as of July 1, 2005, based on the grantdate fair value estimated in accordance with the original provisions of SFAS 123, and(b) compensation cost for all share-based payments granted subsequent to July 1, 2005, based onthe grant date fair value estimated in accordance with the provisions of SFAS 123R amortized on astraight-line basis over the awards’ vesting period. Compensation cost for awards that vest wouldnot be reversed if the awards expire without being exercised. The fair value of stock options was
58

ELIZABETH ARDEN, INC. AND SUBSIDIARIES
NOTES TO CONSOLIDATED FINANCIAL STATEMENTS—(Continued)
determined using the Black-Scholes option-pricing model. The fair value of the market-basedrestricted stock awards was determined using a Monte Carlo simulation model, and the fair value ofall other restricted stock awards was based on the closing price of the Common Stock on the date ofgrant. Pro forma results for prior periods have not been restated.
Prior to July 1, 2005, the Company accounted for its stock incentive plans under the intrinsicvalue method prescribed by APB No. 25, “Accounting for Stock Issued to Employees,” (“APB 25”)as allowed by SFAS No. 123, “Accounting for Stock-Based Compensation” (“SFAS 123”), asamended by SFAS No. 148, “Accounting for Stock-based Compensation — Transition andDisclosure (“SFAS 148”).
At June 30, 2007, the Company had outstanding stock awards under five share-basedcompensation plans, which are described in Note 16. For the years ended June 30, 2007, 2006 and2005, share-based compensation cost charged against income was $8.2 million, $9.3 million and$6.2 million, respectively. For the years ended June 30, 2007 and 2006, share-based compensationcost includes all share-based awards while, share-based compensation cost charged against incomefor the year ended June 30, 2005 only includes restricted share awards. The tax benefit related tothe compensation cost charged to income for the years ended June 30, 2007, 2006 and 2005, wasapproximately $1.4 million, $2.4 million and $2.0 million, respectively.
As of June 30, 2007, there were approximately $7.9 million of unrecognized compensation costsrelated to non-vested share-based arrangements granted under the Company’s stock plans. Thesecosts are expected to be recognized over a weighted-average period of approximately three years.
For the year ended June 30, 2007, the Company recorded share-based payment expenses notrequired to be expensed prior to the adoption of SFAS 123R of approximately $4.7 million(approximately $3.9 million, net of taxes), or $0.14 per basic and diluted share. For the year endedJune 30, 2006, the Company recorded share-based payment expenses not required to be expensedprior to the adoption of SFAS 123R of approximately $5.8 million (approximately $4.3 million, netof taxes), or $0.15 per basic share and $0.14 per diluted share. Included in the $5.8 million of totalcosts recorded for the year ended June 30, 2006, is a charge of approximately $0.1 million relatingto a change in the valuation method of certain restricted stock awards as a result of the adoption ofSFAS 123R.
59

ELIZABETH ARDEN, INC. AND SUBSIDIARIES
NOTES TO CONSOLIDATED FINANCIAL STATEMENTS—(Continued)
Because SFAS 123R was not effective for the Company for the year ended June 30, 2005, noexpense was recognized (i) for options to purchase the Common Stock that were granted with anexercise price equal to the fair market value at the date of grant or (ii) in connection with purchasesunder the Company’s employee stock purchase plan. The following table illustrates the effect on netincome and net income per common share if the Company had applied the fair value recognitionprovisions of SFAS 123R to stock option compensation for the year ended June 30, 2005:
Year EndedJune 30, 2005
(Amounts in thousands, except per share data)
Net income as reported . . . . . . . . . . . . . . . . . . . . . . . . . . . . . . . . . . . . . . . . . . . $37,604Add: Restricted share-based employee compensation costs, net of tax,
currently included in net income . . . . . . . . . . . . . . . . . . . . . . . . . . . . . . . . . . 4,264Less: Total share-based employee compensation cost, net of tax, determined
under fair value-based method . . . . . . . . . . . . . . . . . . . . . . . . . . . . . . . . . . . 7,417
Pro forma net income . . . . . . . . . . . . . . . . . . . . . . . . . . . . . . . . . . . . . . . . . . . . $34,451
Earnings per common shareBasic
As reported . . . . . . . . . . . . . . . . . . . . . . . . . . . . . . . . . . . . . . . . . . . . . $ 1.35Pro forma . . . . . . . . . . . . . . . . . . . . . . . . . . . . . . . . . . . . . . . . . . . . . . $ 1.24
DilutedAs reported . . . . . . . . . . . . . . . . . . . . . . . . . . . . . . . . . . . . . . . . . . . . . $ 1.25Pro forma . . . . . . . . . . . . . . . . . . . . . . . . . . . . . . . . . . . . . . . . . . . . . . $ 1.15
The historical pro forma impact of applying the fair value method prescribed by SFAS 123R isnot representative of the impact that may be expected in the future due to changes resulting fromadditional grants in future years and changes in assumptions such as volatility, interest rates andexpected life used to estimate fair value of grants in future years.
The above pro forma disclosure was not presented for the years ended June 30, 2007 and 2006because share-based compensation cost has been accounted for using the fair value recognitionmethod under SFAS 123R for these periods.
NOTE 4. New Accounting Standards
Accounting for Uncertainty in Income Taxes
In June 2006, the FASB issued Financial Interpretation No. 48 (“FIN 48”), “Accounting forUncertainty in Income Taxes - an Interpretation of FASB Statement No. 109,” which prescribes arecognition threshold and measurement attribute for the financial statement recognition andmeasurement of a tax position taken or expected to be taken in a tax return. FIN 48 requires thatthe Company recognize in its consolidated financial statements, the impact of a tax position if it ismore likely than not that such position will be sustained on audit based on its technical merits. Theprovisions of FIN 48 also provide guidance on derecognition, classification, interest and penalties,accounting in interim periods, and disclosure. The provisions of FIN 48 are effective for theCompany for the fiscal year beginning July 1, 2007, with the cumulative effect of the change inaccounting principle, if any, recorded as an adjustment to the opening balance of retained earnings.The Company is currently evaluating the impact of FIN 48 on its consolidated financial statements.
60

ELIZABETH ARDEN, INC. AND SUBSIDIARIES
NOTES TO CONSOLIDATED FINANCIAL STATEMENTS—(Continued)
Fair Value Measurements
In September 2006, the FASB issued Statement of Financial Accounting Standards No. 157,Fair Value Measurements, which defines fair value, establishes a framework for measuring fair valuein accordance with generally accepted accounting principles, and expands disclosures about fairvalue measurements. SFAS 157 will be effective for us on July 1, 2008. The Company is currentlyevaluating the impact of SFAS 157 on its consolidated financial statements.
Considering the Effects of Prior Year Misstatements when Quantifying Misstatements in CurrentYear Financial Statements
In September 2006, the Securities and Exchange Commission issued Staff Accounting BulletinNo. 108, “Considering the Effects of Prior Year Misstatements when Quantifying Misstatements inCurrent Year Financial Statements,” which provides interpretive guidance on the consideration ofthe effects of prior year misstatements in quantifying current year misstatements for the purpose ofa materiality assessment. SAB 108 is effective for us for the fiscal year ending June 30, 2007 andpermits a one-time transitional cumulative effect adjustment to beginning retained earnings as ofJuly 1, 2006, for errors that were not previously deemed material, but are material under theguidance in SAB 108. The adoption of SAB 108 did not have a material impact on the Companyconsolidated financial statements.
The Fair Value Option for Financial Assets and Financial Liabilities
In February 2007, the FASB issued Statement of Financial Accounting Standards No. 159, TheFair Value Option for Financial Assets and Financial Liabilities (“SFAS 159”). SFAS 159 permitsentities to choose to measure at fair value many financial instruments and certain other items thatare not currently required to be measured at fair value. This option is only available to selectfinancial instruments and is irrevocable once applied. SFAS 159 is effective for the Companybeginning July 1, 2008. The Company is currently evaluating the impact of this new standard on itsconsolidated financial statements.
NOTE 5. Accounts Receivable, Net
The following table details the provisions and allowances established for potential losses fromaccounts receivable and estimated sales returns in the normal course of business.
Years Ended June 30,(Amounts in thousands) 2007 2006 2005
Allowance for Bad Debt:Beginning balance . . . . . . . . . . . . . . . . . . . . . . . . . . . . . . . . . . $ 4,278 $ 4,718 $ 3,022Provision . . . . . . . . . . . . . . . . . . . . . . . . . . . . . . . . . . . . . . . . . 718 1,929 3,646Write-offs, net of recoveries . . . . . . . . . . . . . . . . . . . . . . . . . . . (973) (2,369) (1,950)
Ending balance . . . . . . . . . . . . . . . . . . . . . . . . . . . . . . . . . . . . $ 4,023 $ 4,278 $ 4,718
Allowance for Sales Returns:Beginning balance . . . . . . . . . . . . . . . . . . . . . . . . . . . . . . . . . . $ 9,511 $ 7,179 $ 6,249Provision . . . . . . . . . . . . . . . . . . . . . . . . . . . . . . . . . . . . . . . . . 50,126 39,421 33,946Actual returns . . . . . . . . . . . . . . . . . . . . . . . . . . . . . . . . . . . . . (47,511) (37,089) (33,016)
Ending balance . . . . . . . . . . . . . . . . . . . . . . . . . . . . . . . . . . . . $ 12,126 $ 9,511 $ 7,179
61

ELIZABETH ARDEN, INC. AND SUBSIDIARIES
NOTES TO CONSOLIDATED FINANCIAL STATEMENTS—(Continued)
NOTE 6. Inventories
The components of inventory were as follows:
June 30,(Amounts in thousands) 2007 2006
Raw materials . . . . . . . . . . . . . . . . . . . . . . . . . . . . . . . . . . . . . . . . . . $ 61,297 $ 53,929Work in progress . . . . . . . . . . . . . . . . . . . . . . . . . . . . . . . . . . . . . . . . 32,681 35,775Finished goods . . . . . . . . . . . . . . . . . . . . . . . . . . . . . . . . . . . . . . . . . . 286,254 179,566
Totals . . . . . . . . . . . . . . . . . . . . . . . . . . . . . . . . . . . . . . . . . . . . . $380,232 $269,270
NOTE 7. Property and Equipment
Property and equipment is comprised of the following:
June 30, EstimatedLife(Amounts in thousands) 2007 2006
Land . . . . . . . . . . . . . . . . . . . . . . . . . . . . . . . . . . . . . . . . . $ 71 $ 70 —Building and building improvements . . . . . . . . . . . . . . . . 980 918 40Leasehold improvements . . . . . . . . . . . . . . . . . . . . . . . . . . 7,366 3,611 2 — 15Machinery, equipment, furniture and fixtures and
vehicles . . . . . . . . . . . . . . . . . . . . . . . . . . . . . . . . . . . . . 10,158 8,223 5 — 14Computer equipment and software . . . . . . . . . . . . . . . . . . 18,225 13,526 3 — 5Counters and trade fixtures . . . . . . . . . . . . . . . . . . . . . . . . 41,592 32,809 3 — 5Tools and molds . . . . . . . . . . . . . . . . . . . . . . . . . . . . . . . . 11,650 11,402 1 — 3
90,042 70,559Less accumulated depreciation . . . . . . . . . . . . . . . . . . . . . (53,580) (44,452)
36,462 26,107Projects in progress . . . . . . . . . . . . . . . . . . . . . . . . . . . . . . 6,009 8,574
Property and equipment, net . . . . . . . . . . . . . . . . . . . . . . $ 42,471 $ 34,681
During the year ended June 30, 2005, the Company entered into an agreement to sell its MiamiLakes Facility. The Company recorded a non-cash charge of approximately $2.2 million (beforetaxes) related to the impairment of assets that were part of, or used in, the Miami Lakes Facility.The sale of the Miami Lakes Facility closed on August 1, 2005 and the Company receivedapproximately $9.9 million in net proceeds relating to the sale of the Miami Lakes Facility andassociated equipment.
Depreciation expense for the years ended June 30, 2007, 2006 and 2005, was $13.4 million,$12.6 million and $12.8 million, respectively.
62

ELIZABETH ARDEN, INC. AND SUBSIDIARIES
NOTES TO CONSOLIDATED FINANCIAL STATEMENTS—(Continued)
NOTE 8. Exclusive Brand Licenses, Trademarks and Intangibles, Net
The following summarizes the cost basis amortization and weighted average estimated lifeassociated with the Company’s intangible assets:
(Amounts in thousands) June 30, 2007
WeightedAverage
EstimatedLife June 30, 2006
WeightedAverage
EstimatedLife
Arden brand trademarks . . . . . . . . . . . . . . . . . . . $129,094 Indefinite $129,094 IndefiniteExclusive brand licenses and related
trademarks . . . . . . . . . . . . . . . . . . . . . . . . . . . . 87,131 17 84,928 17Exclusive brand trademarks . . . . . . . . . . . . . . . . 42,330 8 41,631 8Other intangibles(1) . . . . . . . . . . . . . . . . . . . . . . . 20,489 11 19,454 8Goodwill(2) . . . . . . . . . . . . . . . . . . . . . . . . . . . . . . 15,287 Indefinite —
Exclusive brand licenses, trademarks andintangibles, gross . . . . . . . . . . . . . . . . . . . . . . . 294,231 275,107
Accumulated amortization:Arden brand trademarks . . . . . . . . . . . . . . . (6,679) (6,679)Exclusive brand licenses and related
trademarks . . . . . . . . . . . . . . . . . . . . . . . . (28,806) (23,642)Exclusive brand trademarks . . . . . . . . . . . . (31,885) (29,015)Other intangibles . . . . . . . . . . . . . . . . . . . . . (2,250) (14,237)
Exclusive brand licenses, trademarks andintangibles, net . . . . . . . . . . . . . . . . . . . . . . . . . $224,611 $201,534
(1) Primarily consists of customer relationships, customer lists and non-compete agreements.(2) Reflects the amount by which the purchase price for certain assets comprising the fragrance
business of Sovereign Sales, LLC (“Sovereign) exceeded the estimated fair value of the netidentified tangible and intangible assets acquired. See Note 12.
The Company has determined that the Elizabeth Arden trademarks have indefinite useful livesas cash flows from the use of the trademarks are expected to be generated indefinitely. During thequarter ended June 30, 2007, the Company performed its annual impairment testing of these assetswith the assistance of a third party valuation firm. The analysis and assessments of these assetsindicated that no impairment adjustment was required.
Amortization expense for the years ended June 30, 2007, 2006 and 2005, was $11.1 million,$9.5 million, and $8.7 million, respectively. Based on information available at June 30, 2007,amortization expense for fiscal years ending June 30, 2008, 2009, 2010, 2011 and 2012 is expectedto be $9.4 million, $9.0 million, $8.6 million, $6.7 million, and $4.9 million, respectively.
NOTE 9. Short-Term Debt
The Company has a revolving credit facility with a syndicate of banks, for which JPMorganChase Bank is the administrative agent, which generally provides for borrowings on a revolving basisof up to $250 million with a $25 million sub limit for letters of credit (the “Credit Facility”).Pursuant to an August 2007 amendment to the Credit Facility, the Credit Facility was increased to$300 million until October 31, 2007, and to $275 million from November 1, 2007 untilNovember 15, 2007. After November 15, 2007, the Credit Facility provides for borrowings up to$250 million. Under the terms of the Credit Facility the Company may, at any time, increase thesize of the Credit Facility up to $300 million without entering into a formal amendment requiringthe consent of all of the banks, subject to the Company’s satisfaction of certain conditions. In
63

ELIZABETH ARDEN, INC. AND SUBSIDIARIES
NOTES TO CONSOLIDATED FINANCIAL STATEMENTS—(Continued)
addition, from August 15, 2007 until October 31, 2007, the Credit Facility provides temporaryadditional borrowing availability of $25 million above the borrowing availability that is supportedby the Company’s level of eligible accounts receivable and inventory (as described below). TheCredit Facility expires in December 2012.
The Credit Facility is guaranteed by all of the Company’s U.S. subsidiaries and is collateralizedby a first priority lien on all of the Company’s U.S. accounts receivable and U.S. and Canadainventory. Except for the temporary additional borrowing availability described above, borrowingsunder the Credit Facility are limited to 85% of eligible accounts receivable and 85% of theappraised net liquidation value of the Company’s inventory, as determined pursuant to the terms ofthe Credit Facility. The Company’s obligations under the Credit Facility rank senior to theCompany’s 73⁄4% Senior Subordinated Notes due 2014 (the “73⁄4% Senior Subordinated Notes”).
The Credit Facility has only one financial maintenance covenant, which is a debt servicecoverage ratio that must be maintained at not less than 1.1 to 1 if average borrowing availabilitydeclines to less than $25 million ($35 million from December 1 through May 31). No financialmaintenance covenant was applicable for the year ended June 30, 2007. Under the terms of theCredit Facility, the Company may pay dividends or repurchase Common Stock if the Companymaintains borrowing availability of at least $25 million from June 1 to November 30, and at least$35 million from December 1 to May 31 after the applicable payment. The Credit Facility restrictsthe Company from incurring additional non-trade indebtedness (other than refinancings and certainsmall amounts of indebtedness).
Borrowings under the credit portion of the Credit Facility bear interest at a floating rate basedon the “Applicable Margin,” which is determined by reference to a specific financial ratio. At theCompany’s option, the Applicable Margin may be applied to either the London InterBank OfferedRate (“LIBOR”) or the prime rate. The reference ratio for determining the Applicable Margin is adebt service coverage ratio. The Applicable Margin charged on LIBOR loans ranges from 1% to1.75% and is 0% for prime rate loans, except that the Applicable Margin on the first $25 million ofborrowings is 1.00% higher. As of June 30, 2007, the Applicable Margin was 1.25% for LIBORloans and 0% for prime rate loans. The commitment fee on the unused portion of the Credit Facilityis 0.25%.
As of June 30, 2007, the Company had $98 million in outstanding borrowings andapproximately $4 million in letters of credit outstanding under the Credit Facility, compared withapproximately $40 million in outstanding borrowings under the Credit Facility at June 30, 2006. Asof June 30, 2007, the Company had approximately $237 million of eligible receivables andinventories available as collateral under the Credit Facility and remaining borrowing availability ofapproximately $139 million. For the years ended June 30, 2007 and 2006, the weighted averageannual interest rate on borrowings under the Company’s Credit Facility was 7.1% and 6.3%,respectively. The Company classifies the Credit Facility as short-term debt on its balance sheetbecause it expects to reduce outstanding borrowings over the next twelve months.
64
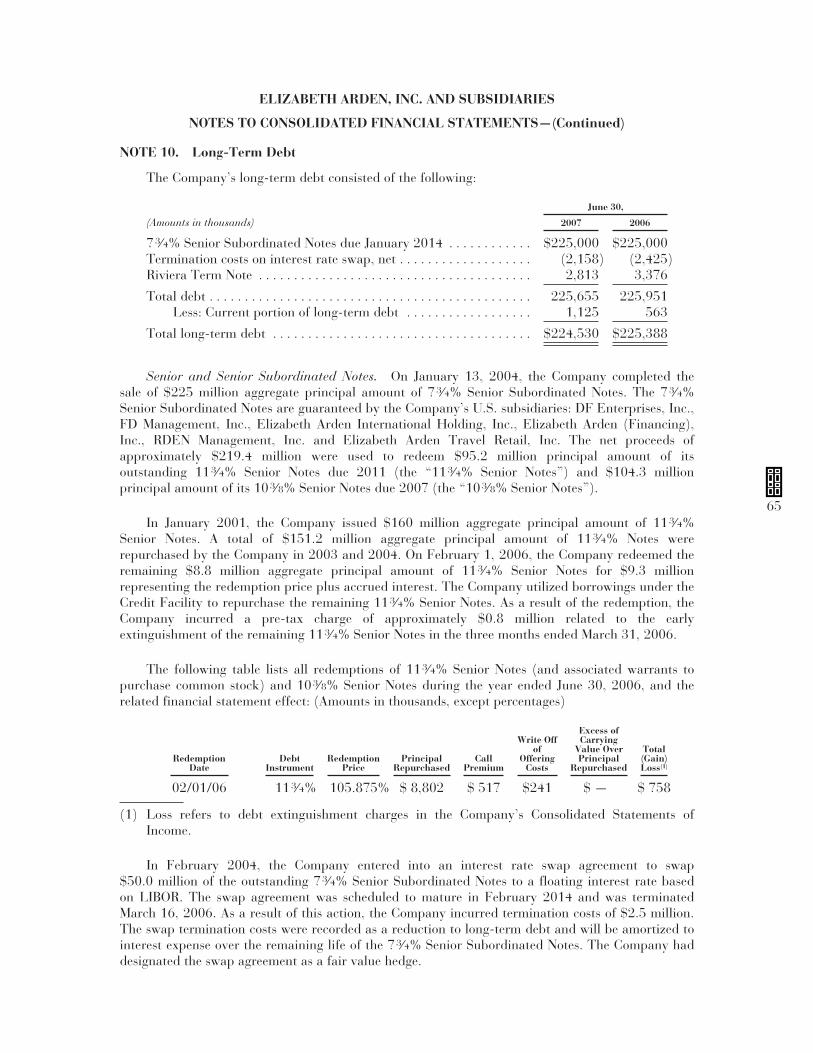
ELIZABETH ARDEN, INC. AND SUBSIDIARIES
NOTES TO CONSOLIDATED FINANCIAL STATEMENTS—(Continued)
NOTE 10. Long-Term Debt
The Company’s long-term debt consisted of the following:
June 30,
(Amounts in thousands) 2007 2006
73⁄4% Senior Subordinated Notes due January 2014 . . . . . . . . . . . . $225,000 $225,000Termination costs on interest rate swap, net . . . . . . . . . . . . . . . . . . . (2,158) (2,425)Riviera Term Note . . . . . . . . . . . . . . . . . . . . . . . . . . . . . . . . . . . . . . . 2,813 3,376
Total debt . . . . . . . . . . . . . . . . . . . . . . . . . . . . . . . . . . . . . . . . . . . . . . 225,655 225,951Less: Current portion of long-term debt . . . . . . . . . . . . . . . . . . 1,125 563
Total long-term debt . . . . . . . . . . . . . . . . . . . . . . . . . . . . . . . . . . . . . $224,530 $225,388
Senior and Senior Subordinated Notes. On January 13, 2004, the Company completed thesale of $225 million aggregate principal amount of 73⁄4% Senior Subordinated Notes. The 73⁄4%Senior Subordinated Notes are guaranteed by the Company’s U.S. subsidiaries: DF Enterprises, Inc.,FD Management, Inc., Elizabeth Arden International Holding, Inc., Elizabeth Arden (Financing),Inc., RDEN Management, Inc. and Elizabeth Arden Travel Retail, Inc. The net proceeds ofapproximately $219.4 million were used to redeem $95.2 million principal amount of itsoutstanding 113⁄4% Senior Notes due 2011 (the “113⁄4% Senior Notes”) and $104.3 millionprincipal amount of its 103⁄8% Senior Notes due 2007 (the “103⁄8% Senior Notes”).
In January 2001, the Company issued $160 million aggregate principal amount of 113⁄4%Senior Notes. A total of $151.2 million aggregate principal amount of 113⁄4% Notes wererepurchased by the Company in 2003 and 2004. On February 1, 2006, the Company redeemed theremaining $8.8 million aggregate principal amount of 113⁄4% Senior Notes for $9.3 millionrepresenting the redemption price plus accrued interest. The Company utilized borrowings under theCredit Facility to repurchase the remaining 113⁄4% Senior Notes. As a result of the redemption, theCompany incurred a pre-tax charge of approximately $0.8 million related to the earlyextinguishment of the remaining 113⁄4% Senior Notes in the three months ended March 31, 2006.
The following table lists all redemptions of 113⁄4% Senior Notes (and associated warrants topurchase common stock) and 103⁄8% Senior Notes during the year ended June 30, 2006, and therelated financial statement effect: (Amounts in thousands, except percentages)
RedemptionDate
DebtInstrument
RedemptionPrice
PrincipalRepurchased
CallPremium
Write Offof
OfferingCosts
Excess ofCarrying
Value OverPrincipal
Repurchased
Total(Gain)Loss(1)
02/01/06 113⁄4% 105.875% $ 8,802 $ 517 $241 $ — $ 758
(1) Loss refers to debt extinguishment charges in the Company’s Consolidated Statements ofIncome.
In February 2004, the Company entered into an interest rate swap agreement to swap$50.0 million of the outstanding 73⁄4% Senior Subordinated Notes to a floating interest rate basedon LIBOR. The swap agreement was scheduled to mature in February 2014 and was terminatedMarch 16, 2006. As a result of this action, the Company incurred termination costs of $2.5 million.The swap termination costs were recorded as a reduction to long-term debt and will be amortized tointerest expense over the remaining life of the 73⁄4% Senior Subordinated Notes. The Company haddesignated the swap agreement as a fair value hedge.
65

ELIZABETH ARDEN, INC. AND SUBSIDIARIES
NOTES TO CONSOLIDATED FINANCIAL STATEMENTS—(Continued)
The indentures pursuant to which the 73⁄4% Senior Subordinated Notes were issued (the“Indentures”) provide that such notes will be senior subordinated obligations of the Company. The 73⁄4% Senior Subordinated Notes rank junior to all existing and future senior indebtedness of theCompany, including indebtedness under the Credit Facility and pari passu in right of payment to allsenior subordinated indebtedness of the Company. The Indentures generally permit the Company(subject to the satisfaction of a fixed charge coverage ratio and, in certain cases, also a net incometest) to incur additional indebtedness, pay dividends, purchase or redeem capital stock of theCompany, or redeem subordinated indebtedness. The Indentures generally limit the ability of theCompany to create liens, merge or transfer or sell assets. The Indentures also provide that theholders of the 73⁄4% Senior Subordinated Notes have the option to require the Company torepurchase their notes in the event of a change of control in the Company (as defined in theIndentures).
In connection with the June 2006 acquisition (the “Riviera Acquisition”) of certain assets ofRiviera Concepts Inc. (“Riviera”), the Company assumed a promissory note held by Riviera in theprincipal amount of approximately $3.4 million (the “Riviera Term Note”). The Riviera Term Notebears interest at a rate of 4.15% per annum and is payable in six successive equal semi-annualinstallments beginning on January 15, 2007. The Riviera Term Note is subordinated to the CreditFacility and the 73⁄4% Senior Subordinated Notes.
At June 30, 2007 and June 30, 2006 the estimated fair value of the Company’s seniorsubordinated notes and the Riviera Term Note, as applicable, using available market informationand interest rates was as follows:
June 30,(Amounts in thousands) 2007 2006
73⁄4% Senior Subordinated Notes . . . . . . . . . . . . . . . . . . . . . . . . . . . $226,969 $220,500Riviera Term Note . . . . . . . . . . . . . . . . . . . . . . . . . . . . . . . . . . . . . . . $ 2,838 $ 3,376
The scheduled maturities and redemptions of long-term debt at June 30, 2007 were as follows:
(Amounts in thousands)Year Ended June 30, Amount
2008 . . . . . . . . . . . . . . . . . . . . . . . . . . . . . . . . . . . . . . . . . . . . . . . . . . . . . . . . . . . . $ 1,1252009 . . . . . . . . . . . . . . . . . . . . . . . . . . . . . . . . . . . . . . . . . . . . . . . . . . . . . . . . . . . . 1,1252010 . . . . . . . . . . . . . . . . . . . . . . . . . . . . . . . . . . . . . . . . . . . . . . . . . . . . . . . . . . . . 5632011 . . . . . . . . . . . . . . . . . . . . . . . . . . . . . . . . . . . . . . . . . . . . . . . . . . . . . . . . . . . . —2012 . . . . . . . . . . . . . . . . . . . . . . . . . . . . . . . . . . . . . . . . . . . . . . . . . . . . . . . . . . . . —After 2012 . . . . . . . . . . . . . . . . . . . . . . . . . . . . . . . . . . . . . . . . . . . . . . . . . . . . . . . 225,000
Total(1) . . . . . . . . . . . . . . . . . . . . . . . . . . . . . . . . . . . . . . . . . . . . . . . . . . . . . . $227,813
(1) Total scheduled maturities does not include approximately $2.2 million of swap terminationcosts that were recorded as a reduction to long-term debt and are being amortized to interestexpense over the remaining life of the 73⁄4% Senior Subordinated Notes.
NOTE 11. Commitments and Contingencies
The Company has lease agreements for all of the real property it uses, and owns a smallmanufacturing facility in South Africa. The Company’s leased office facilities are located inMiramar, Florida; Stamford, Connecticut; Bentonville, Arkansas; and New York, New York in theUnited States, and Australia, Austria, Canada, China, Denmark, Dubai, Italy, New Zealand, PuertoRico, Singapore, South Africa, South Korea, Spain, Switzerland, Taiwan and the United Kingdom
66

ELIZABETH ARDEN, INC. AND SUBSIDIARIES
NOTES TO CONSOLIDATED FINANCIAL STATEMENTS—(Continued)
internationally. The Company also has leased distribution facilities in Roanoke, Virginia and PuertoRico. The Company’s rent expense for operating leases for the years ended June 30, 2007, 2006and 2005 was $17.6 million, $14.5 million and $13.1 million, respectively. The Company also leasesdistribution equipment, office and computer equipment, and vehicles. In accordance with SFASNo. 13, “Accounting for Leases,” the Company reviews all of its leases to determine whether theyqualify as operating or capital leases. As of June 30, 2007, all of the Company’s leases are classified asoperating leases. Leasehold improvements are capitalized and amortized over the lesser of the usefullife of the asset or current lease term. The Company accounts for free rent periods and scheduled rentincreases on a straight-line basis over the lease term. Landlord allowances and incentives are recordedas deferred rent and are amortized as a reduction to rent expense over the lease term.
The Company’s aggregate minimum lease payments under its operating leases, purchaseobligations and commitments under other long-term contractual obligations (other than long-termdebt) at June 30, 2007, are as follows:
(Amounts in thousands)Interest
Payments(1)Operating
LeasesPurchase
Obligations(2)
OtherLong-term
Obligations(3) Total
2008 . . . . . . . . . . . . . . . . . . . . . . . . . . $ 17,521 $15,501 $249,685 $ 6,333 $289,0402009 . . . . . . . . . . . . . . . . . . . . . . . . . . 17,474 14,019 86,003 12,256 129,7522010 . . . . . . . . . . . . . . . . . . . . . . . . . . 17,438 11,878 48,618 4,390 82,3242011 . . . . . . . . . . . . . . . . . . . . . . . . . . 17,438 10,537 9,818 — 37,7932012 . . . . . . . . . . . . . . . . . . . . . . . . . . 17,438 6,323 3,005 — 26,766and thereafter . . . . . . . . . . . . . . . . . . . 26,156 8,042 — — 34,198
Total . . . . . . . . . . . . . . . . . . . . . . $113,465 $66,300 $397,129 $22,979 $599,873
(1) Consists of interest at the rate of 73⁄4% per annum on the $225 million aggregate principalamount of 73⁄4% senior subordinated notes due 2014 and interest at the rate 4.15% per annumon the $3.4 million promissory term note assumed in connection with the acquisition of certainassets of Riviera.
(2) Consists of purchase commitments for finished goods, raw materials, components, advertising,promotional items, minimum royalty guarantees, insurance, services pursuant to legally bindingobligations, including fixed or minimum obligations, and estimates of such obligations subjectto variable price provisions.
(3) Includes contingent consideration paid to Sovereign in September 2007 of $6.3 million andpotentially payable to Sovereign and Riviera of $8.6 million and $5.7 million, respectively. SeeNote 12.
At June 30, 2007, the Company had contractual obligations to incur promotional andadvertising expenses, which are either fixed commitments or based on net sales for licensed brands,and minimum royalty guarantees in an aggregate amount of $60.3 million through 2011 comparedwith $75.2 million through 2011 at June 30, 2006, which are included in the above table.
In connection with the Riviera Acquisition, the Company entered into a contingent performanceliability to Riviera in the amount of $8.6 million. This contingent performance liability does not bearinterest, is recorded in “other liabilities” on the Company’s Consolidated Balance Sheet and ispayable in annual installments beginning July 31, 2007 and ending on July 31, 2009, provided thatcertain net sales targets are achieved over the three year period after the closing date on the licensedbrands acquired in the Riviera Acquisition. If the targets for the first or second annual installmentsare not satisfied, such installments may still be payable, based on cumulative targets, in thesubsequent year or years, as the case may be. The target for the first installment due on July 31,2007, was not achieved. The contingent performance liability was recorded as a result of thenegative goodwill resulting from this acquisition. See Note 12.
67

ELIZABETH ARDEN, INC. AND SUBSIDIARIES
NOTES TO CONSOLIDATED FINANCIAL STATEMENTS—(Continued)
In connection with the August 2006 acquisition of certain assets comprising the fragrancebusiness of Sovereign, $12 million of the purchase price was in the form of contingent consideration,substantially all of which may be paid in two installments over two years from the date of closing ifcertain financial targets and other conditions are satisfied. The conditions for the first installmentwere satisfied, and a payment of $6.3 million was made in September 2007.
As of June 30, 2007, the Company had notional amounts of 74.8 million Euros and37.3 million British pounds under foreign currency contracts that expire between July 31, 2007 andJune 29, 2009 to reduce the exposure of its foreign subsidiary revenues to fluctuations in currencyrates. As of June 30, 2007, the Company had notional amounts of 20.3 million Canadian dollarsunder foreign currency contracts that expire between July 31, 2007 and June 29, 2009 to reduce theexposure of the Company’s Canadian subsidiary’s cost of sales to fluctuations in currency rates. TheCompany has designated each qualifying foreign currency contract as a cash flow hedge. The gainsand losses of these contracts will only be recognized in earnings in the period in which the contractsexpire. At June 30, 2007 and June 30, 2006, the unrealized loss, net of taxes, associated with thesecontracts of approximately $1.4 million and $0.4 million, respectively, is included in accumulatedother comprehensive income. The unrealized loss, net of taxes, generated during the year endedJune 30, 2007, was approximately $1.0 million. The unrealized loss, net of taxes, generated duringthe year ended June 30, 2006, was approximately $3.4 million. The unrealized gain, net of taxes,incurred during the year ended June 30, 2005 was approximately $2.9 million.
When appropriate, the Company also enters into and settles foreign currency contracts forEuros and British pounds to reduce the exposure of its foreign subsidiaries’ net balance sheets tofluctuations in foreign currency rates. As of June 30, 2007, there were no such foreign currencycontracts outstanding. The realized loss, net of taxes, recognized during the years ended June 30,2007 and 2006 was approximately $1.1 million and $0.2 million, respectively.
In October 2005, the Company received a demand from a licensee of certain of the Company’spatents alleging the Company had breached the license agreement, indicating that it would not payany further royalties and requesting that the Company return approximately $3 million in royaltypayments already made. The Company believes that it has not breached the license agreement andthat the licensee is obligated to continue to make royalty payments. The Company has filed a lawsuitagainst the licensee seeking recovery of its damages for breach of contract. In April 2007, thelicensee filed a counterclaim for breach of contract, negligence, unjust enrichment and other relatedcounts, and also seeks declaratory relief that the licensee is not obligated to make further royaltypayments and is entitled to recover approximately $3 million in royalty payments already made plusinterest. The Company is not able to determine the ultimate outcome of this dispute or estimate thepossible loss or range of loss relating to the licensee’s claim, but believes the ultimate outcome willnot have a material adverse effect on the Company’s financial position, results of operations or cashflows.
The Company is a party to a number of other legal actions, proceedings and claims. While anyaction, proceeding or claim contains an element of uncertainty and it is possible that the Company’scash flows and results of operations in a particular quarter or year could be materially affected bythe impact of such actions, proceedings and claims, management of the Company believes that theoutcome of such actions, proceedings or claims will not have a material adverse effect on theCompany’s business, financial position or results of operations.
68

ELIZABETH ARDEN, INC. AND SUBSIDIARIES
NOTES TO CONSOLIDATED FINANCIAL STATEMENTS—(Continued)
NOTE 12. Acquisitions
In June 2006, the Company acquired certain assets of Riviera, including inventory, accountsreceivable and certain brand licenses. The net purchase price was approximately $14.3 million andwas allocated as follows: $8.2 million for inventory, $1.8 million for accounts receivable,$0.5 million for prepaid, deferred and fixed assets, and $21.3 million for intangible assets, offset byliabilities of $17.5 million (including the assumption of a term note in the principal amount ofapproximately $3.4 million, of which $1.1 million has been paid as of July 31, 2007, a contingentperformance liability of $8.6 million and other assumed liabilities). The contingent performanceliability is payable subject to the satisfaction of certain sales targets over the three year period afterthe closing date and was recorded as a result of the negative goodwill resulting from this acquisition.See Note 11. In addition to the debt issued and liabilities assumed, the Company paid $12.6 millionin cash in connection with the acquisition.
In August 2006, the Company acquired the fragrance business of Sovereign. The assetsacquired included inventory and certain intangible assets. In addition, the Company assumed aportion of the lease payments on Sovereign’s distribution facility and entered into a short-termservices agreement. The net purchase price consisted of (i) approximately $90.2 million in cash,consisted primarily of $87.7 million paid in cash at closing and approximately $2.5 million in cashpaid in five installments after the closing; and (ii) $12.0 million in the form of contingentconsideration, substantially all of which may be paid in two installments over two years from thedate of closing if certain financial targets and other conditions are satisfied. At June 30, 2007, theconditions for the first installment were satisfied, and the Company recognized a liability of$6.3 million in the consolidated balance sheet. The first installment was paid in September 2007.The net purchase price was allocated as follows: $66.0 million for inventory, $31.4 million forcertain intangible assets and goodwill, and $0.8 million of other assets, offset by approximately$1.6 million of assumed lease payments and the services agreement. In addition, if the remainingcontingent consideration is paid, the Company intends to allocate that amount to intangible assets.The Company used the Credit Facility to fund the cash portion of the purchase price.
NOTE 13. Income Taxes
Income before income taxes consisted of the following for the years ended June 30, 2007, 2006and 2005.
Years Ended June 30,(Amounts in thousands) 2007 2006 2005
Domestic . . . . . . . . . . . . . . . . . . . . . . . . . . . . . . . . . . . . . . . . . . . . . . . $ 7,553 $18,501 $28,847Foreign . . . . . . . . . . . . . . . . . . . . . . . . . . . . . . . . . . . . . . . . . . . . . . . . . 37,255 25,574 26,160
Total income before income taxes . . . . . . . . . . . . . . . . . . . . . . . . . . . . $44,808 $44,075 $55,007
69

ELIZABETH ARDEN, INC. AND SUBSIDIARIES
NOTES TO CONSOLIDATED FINANCIAL STATEMENTS—(Continued)
The components of the provision for income taxes for the years ended June 30, 2007, 2006 and2005, are as follows:
Years Ended June 30,
(Amounts in thousands) 2007 2006 2005
Current income taxesFederal . . . . . . . . . . . . . . . . . . . . . . . . . . . . . . . . . . . . . . . . . . . . . . . . . . . . . . . $ 448 $ 325 $ 934State . . . . . . . . . . . . . . . . . . . . . . . . . . . . . . . . . . . . . . . . . . . . . . . . . . . . . . . . . 250 173 29Foreign . . . . . . . . . . . . . . . . . . . . . . . . . . . . . . . . . . . . . . . . . . . . . . . . . . . . . . . 4,640 3,218 5,755
Total current . . . . . . . . . . . . . . . . . . . . . . . . . . . . . . . . . . . . . . . . . . . . . . $5,338 $ 3,716 $ 6,718
Deferred income taxesFederal . . . . . . . . . . . . . . . . . . . . . . . . . . . . . . . . . . . . . . . . . . . . . . . . . . . . . . . $ 367 $ 5,792 $ 9,220State . . . . . . . . . . . . . . . . . . . . . . . . . . . . . . . . . . . . . . . . . . . . . . . . . . . . . . . . . 877 1,219 213Foreign . . . . . . . . . . . . . . . . . . . . . . . . . . . . . . . . . . . . . . . . . . . . . . . . . . . . . . . 892 554 1,252
Total deferred . . . . . . . . . . . . . . . . . . . . . . . . . . . . . . . . . . . . . . . . . . . . . . 2,136 7,565 10,685
Total . . . . . . . . . . . . . . . . . . . . . . . . . . . . . . . . . . . . . . . . . . . . . . . . . . . . . . . . . . . . $7,474 $11,281 $17,403
In May 2006 and September 2005, the Company repatriated $2.1 million and $3.2 million,respectively, of undistributed international earnings from two of its foreign subsidiaries. Pursuant to theAmerican Jobs Creation Act of 2004, the Company had accrued a net provision for $33,000 of estimateddeferred taxes on the repatriation of such earnings. Tax provisions were not established on the balance ofapproximately $105 million of undistributed earnings of foreign subsidiaries, since these earnings aredeemed to be permanently reinvested. If in the future these earnings are repatriated to the United States,or if the Company determines such earnings will be remitted in the foreseeable future, additional taxprovisions may be required. Due to complexities in the tax laws and the assumptions that would have tobe made, it is not practicable to estimate the amounts of income tax provisions that may be required.
Deferred tax assets relating to tax benefits of employee stock option awards have been reduced toreflect exercises during the year ended June 30, 2007. Some exercises resulted in tax deductions in excessof previously recorded benefit based on the option value at the time of grant (“windfalls”). Pursuant toSFAS 123R, although the additional tax benefit for “windfalls” are reflected in net operating tax losscarryforwards, the additional tax benefit associated with the windfalls is not recognized for financialstatement purposes until the deduction reduces taxes payable. Accordingly, since the tax benefit does notreduce current taxes payable due to net operating loss carryforwards available, “windfall” gross taxbenefits of $9.7 million are not reflected in deferred tax assets for net operating losses for the year endedJune 30, 2007. Once the Company is in a regular tax paying position, it will recognize this “windfall”through additional paid-in capital.
The total income tax provision differs from the amount obtained by applying the statutoryfederal income tax to income before income taxes as follows:
Years Ended June 30,2007 2006 2005
(Amounts in thousands, except percentages) Amount Rate Amount Rate Amount Rate
Income tax provision at statutory rates . . . . . $15,683 35.0% $15,426 35.0% $19,253 35.0%State taxes, net of federal benefits . . . . . . . . . 800 1.8 797 1.8 174 0.3Tax on foreign earnings at different rates
from statutory rates . . . . . . . . . . . . . . . . . . . . . . . (7,002) (15.6) $ (5,605) (12.7) (2,135) (3.9)Research and development tax credits . . . . . . (1,985) (4.4) — — — —Change in U.S. and foreign valuation
allowance . . . . . . . . . . . . . . . . . . . . . . . . . . . . . . . (505) (1.1) 598 1.4 (275) (0.5)Other . . . . . . . . . . . . . . . . . . . . . . . . . . . . . . . . 483 1.0 65 0.1 386 0.7
Total . . . . . . . . . . . . . . . . . . . . . . . . . . . . $ 7,474 16.7% $11,281 25.6% $17,403 31.6%
70

ELIZABETH ARDEN, INC. AND SUBSIDIARIES
NOTES TO CONSOLIDATED FINANCIAL STATEMENTS—(Continued)
Deferred income taxes reflect the net tax effects of temporary differences between the carryingamounts of assets and liabilities for financial reporting purposes and the amounts used for taxpurposes plus operating loss carryforwards. The tax effects of significant items comprising theCompany’s net deferred tax assets and liabilities are as follows:
As of June 30,(Amounts in thousands) 2007 2006
Deferred tax assetsAccrued expenses . . . . . . . . . . . . . . . . . . . . . . . . . . . . . . . . . . . . . $ 4,581 $ 2,883Stock-based compensation, including SFAS 123R . . . . . . . . . . . 5,324 3,777Net operating loss carryforwards . . . . . . . . . . . . . . . . . . . . . . . . 9,373 14,979Inventory . . . . . . . . . . . . . . . . . . . . . . . . . . . . . . . . . . . . . . . . . . . 5,847 5,048Contingent note . . . . . . . . . . . . . . . . . . . . . . . . . . . . . . . . . . . . . . 3,388 —Property and equipment . . . . . . . . . . . . . . . . . . . . . . . . . . . . . . . 350 772Research and development tax incentives, alternative minimum
tax and other tax credits . . . . . . . . . . . . . . . . . . . . . . . . . . . . . 3,918 1,749Accounts receivable . . . . . . . . . . . . . . . . . . . . . . . . . . . . . . . . . . . — 482Other . . . . . . . . . . . . . . . . . . . . . . . . . . . . . . . . . . . . . . . . . . . . . . 1,394 633
Gross deferred tax assets . . . . . . . . . . . . . . . . . . . . . . . . . . . $ 34,175 $ 30,323
Deferred tax liabilitiesAccounts receivable . . . . . . . . . . . . . . . . . . . . . . . . . . . . . . . . . . . $ (632) $ —Intangible assets . . . . . . . . . . . . . . . . . . . . . . . . . . . . . . . . . . . . . (24,282) (18,532)Other . . . . . . . . . . . . . . . . . . . . . . . . . . . . . . . . . . . . . . . . . . . . . . (4,068) (4,049)
Gross deferred tax liabilities . . . . . . . . . . . . . . . . . . . . . . . . (28,982) (22,581)
Valuation allowances . . . . . . . . . . . . . . . . . . . . . . . . . . . . . . . . . . (697) (1,221)
Total net deferred tax assets . . . . . . . . . . . . . . . . . . . . . . . . $ 4,496 $ 6,521
The following table represents the classification of the Company’s net deferred tax assets andliabilities:
June 30,(Amounts in thousands) 2007 2006
Current net deferred tax assets . . . . . . . . . . . . . . . . . . . . . . . . . . . . . . . $ 17,427 $15,471Non-current net deferred tax assets (liabilities)(1) . . . . . . . . . . . . . . . . (12,931) (8,950)
Total net deferred tax assets . . . . . . . . . . . . . . . . . . . . . . . . . . . . . $ 4,496 $ 6,521
(1) Non-current net deferred tax assets (liabilities) is included in deferred income taxes and otherliabilities in the Company’s consolidated balance sheet at June 30, 2007 and June 30, 2006.
At June 30, 2007, the Company had United States federal net operating loss carryforwards ofapproximately $27 million that will begin to expire on June 30, 2024. The Company generated stateand local net operating loss carryforwards of approximately $38 million that will begin to expire onJune 30, 2008. The Company believes that it will generate sufficient taxable income to realize thenet operating loss carryforwards before they expire. In addition, the Company had acquiredUnited States federal net operating losses of which approximately $1.1 million are remaining andwill begin to expire on June 30, 2008. Due to certain limitations in the Internal Revenue Code, theCompany believes that it is more likely than not that it will not be able to utilize a portion of theseacquired net operating losses, therefore, the Company has recorded a valuation allowance ofapproximately $154,000 related to such acquired net operating loss carryforwards.
71

ELIZABETH ARDEN, INC. AND SUBSIDIARIES
NOTES TO CONSOLIDATED FINANCIAL STATEMENTS—(Continued)
At June 30, 2007, the Company had foreign net operating loss carryforwards of approximately$8.1 million that will begin to expire on June 30, 2009. The Company’s ability to use foreign netoperating loss carryforwards is dependent on generating sufficient future taxable income prior totheir expiration. However, due to the Company’s limited operating history in certain foreignjurisdictions and the uncertainty of achieving sufficient profits to utilize foreign net operating losscarryforwards in these jurisdictions, as of June 30, 2007, the Company has recorded a valuationallowance of approximately $543,000 related to these foreign net operating loss carryforwards.
NOTE 14. Supplemental Schedule of Non-Cash Financing and Investing Activities
Year Ended(Amounts in thousands) June 30, 2005
Issuance of restricted stock and PARS, net of forfeitures from prior grants(See Note 16) . . . . . . . . . . . . . . . . . . . . . . . . . . . . . . . . . . . . . . . . . . . . . . . . . 10,335
Impairment charge related to the sale of the Miami Lakes Facility(See Note 7) . . . . . . . . . . . . . . . . . . . . . . . . . . . . . . . . . . . . . . . . . . . . . . . . . . 2,156
There were no non-cash financing and investing activities during fiscal years ended June 30,2007 and 2006.
NOTE 15. Repurchases of Common Stock
On November 2, 2005, the Company’s Board of Directors (“Board”) authorized the Companyto implement a stock repurchase program to repurchase up to $40.0 million of Common Stockthrough March 31, 2007. On November 2, 2006, the Board authorized the repurchase of anadditional $40.0 million of Common Stock under the terms of the Company’s existing stockrepurchase program and extended the term of the stock repurchase program from March 31, 2007to November 30, 2008.
As of June 30, 2007, the Company had repurchased 1,862,169 shares of Common Stock, at anaverage price of $18.19 per share on the open market, at a cost of $33.9 million, including salescommissions. For the year ended June 30, 2007, the Company repurchased 524,042 shares ofCommon Stock, at an average price of $16.30 per share on the open market, at a cost of$8.5 million, including sales commissions. These repurchases are accounted for under the treasurymethod.
NOTE 16. Stock Plans
At June 30, 2007, the Company had five stock incentive plans, two for the benefit ofnon-employee directors (the 1995 Non-Employee Director Plan and the 2004 Non-EmployeeDirector Plan (the “2004 Director Plan”), and three for the benefit of eligible employees andindependent contractors (the 1995 Stock Option Plan, the 2000 Stock Incentive Plan and the 2004Stock Incentive Plan (the “2004 Incentive Plan”)). All five plans were adopted by the Board andapproved by the Company’s shareholders. The 2004 Director Plan replaced the 1995 Non-EmployeeDirector Plan, and no further grants of stock options will occur under the 1995 Non-EmployeeDirector Plan.
The 2004 Incentive Plan authorizes the Company to grant stock-based incentives for 2,000,000shares of Common Stock under such plan to eligible employees and others that provide services tothe Company. The stock options awarded under the 2004 Incentive Plan are exercisable at any timeor in any installments as determined by the compensation committee of the Board at the time of
72

ELIZABETH ARDEN, INC. AND SUBSIDIARIES
NOTES TO CONSOLIDATED FINANCIAL STATEMENTS—(Continued)
grant and may be either incentive or non-qualified stock options under the Internal Revenue Code,as determined by the compensation committee. The exercise price for stock option grants will equalthe closing price of the Common Stock on the date of grant. The 2004 Incentive Plan also permitsstock appreciation rights, stock awards, performance awards and stock units to be granted. AtJune 30, 2007, 346,512 shares of Common Stock remained available for grant under the 2004Incentive Plan. The Board has authorized a 650,000 share increase in the number of shares ofCommon Stock available for grant under the 2004 Incentive Plan, subject to shareholder approval tobe sought at the Company’s 2007 annual meeting of shareholders.
The 2004 Director Plan authorizes the Company to grant non-qualified stock options for up to350,000 shares of Common Stock to non-employee directors of the Company. Each year on the dateof the annual meeting of the shareholders and provided that a sufficient number of shares remainavailable under the 2004 Director Plan, there will automatically be granted to each eligible directorwho is re-elected to the Board an option to purchase 6,000 shares of Common Stock or such otheramount as the Board determines based on a competitive review of comparable companies. At ameeting on August 16, 2006, the Board determined that the option to be granted in connection witha non-employee director’s re-election to the Board at the 2006 annual shareholders meeting inNovember 2006 and subsequent shareholder meetings will be for 6,000 shares of Common Stock.Unless service is terminated due to death, disability or retirement in good standing after age 70,each option granted under the 2004 Director Plan on an annual shareholders meeting date willbecome exercisable three years from the date of grant if such person has continued to serve as adirector until that date. No option may be exercisable after the expiration of ten years from the dateof grant. The exercise price will equal the closing price of the Common Stock on the date of grant.At June 30, 2007, 257,000 shares of Common Stock remained available for grant under the 2004Director Plan.
Stock Options Granted
On August 20, 2007, the Board granted stock options to 24 managerial employees for 347,150shares of Common Stock under the 2004 Stock Incentive Plan. The stock options are due to vest inequal thirds over a three-year period on dates that are two business days after the Company’sfinancial results for each of the fiscal years ending June 30, 2008, 2009 and 2010, are publiclyannounced, but only if the person receiving the grant is still employed by the Company at the timeof vesting. The exercise price of those stock options is $23.59 per share, which was the closing priceof the Common Stock on the effective date of grant. The weighted-average grant-date fair value ofoptions granted was $8.76 per share based on the Black-Scholes option-pricing model. The optionsexpire ten years from the date of grant.
Year Ended June 30, 2007. On January 31, 2007, the Board granted stock options for anaggregate of 6,000 shares of Common Stock to an employee director under the 2004 Incentive Plan.The stock options are exercisable three years from the date of grant if the director continues to serveas a director until that date. The exercise price of the stock options is $18.90 per share, which wasthe closing price of the Common Stock on the date of grant. The weighted-average grant-date fairvalue of the options granted was $7.39 per share based on the Black-Scholes option-pricing model.The options expire ten years from the date of grant.
On November 15, 2006, the date of the Company’s most recent annual meeting, the Companygranted stock options for an aggregate of 30,000 shares of Common Stock to five non-employeedirectors under the 2004 Director Plan. Pursuant to the 2004 Director Plan, stock options aregranted on the Company’s annual meeting date to non-employee directors who are re-elected to theBoard at the annual meeting. The stock options are exercisable three years from the date of grant ifsuch persons continue to serve as a director until that date. The exercise price of those stock options
73

ELIZABETH ARDEN, INC. AND SUBSIDIARIES
NOTES TO CONSOLIDATED FINANCIAL STATEMENTS—(Continued)
is $18.45 per share, which was the closing price of the Common Stock on the date of grant. Theweighted-average grant-date fair value of the options granted was $7.18 per share based on theBlack-Scholes option-pricing model. The options expire ten years from the date of grant.
On August 21, 2006, the Board granted stock options to 26 managerial employees for 316,000shares of Common Stock under the 2004 Incentive Plan. The stock options are due to vest in equalthirds over a three-year period on the dates that are two business days after the Company’s financialresults for each of the fiscal years ending June 30, 2007, 2008 and 2009 are publicly announced,but only if the person receiving the grant is still employed by the Company at the time of vesting.The exercise price of those stock options is $15.00 per share, which was the closing price of theCommon Stock on the effective date of grant. The weighted-average grant date fair value of optionsgranted was $5.85 per share based on the Black-Scholes option-pricing model. The options expireten years from the date of grant.
Year Ended June 30, 2006. On August 10, 2005, in recognition of individual performance forthe year ended June 30, 2005, the Board granted stock options to 127 managerial employees forapproximately 419,700 shares of Common Stock under the 2004 Incentive Plan. The stock optionsare due to vest over three years in thirds on each succeeding year from the date of grant, assumingthe person receiving the grant is employed by the Company at the time of vesting. The exercise priceof those stock options is $23.40 per share, which was the closing price of the Common Stock on thedate of grant. The weighted-average grant-date fair value of options granted was $8.79 per sharebased on the Black-Scholes option-pricing model. The options expire ten years from the date ofgrant.
On November 16, 2005, the Company granted stock options for an aggregate of 35,000 sharesof Common Stock to five non-employee directors under the 2004 Director Plan, which areexercisable three years from the date of grant if such persons continue to serve as a director on thatdate. The exercise price of those stock options is $19.39 per share, which was the closing price of theCommon Stock on the date of grant. The weighted-average grant-date fair value of options grantedwas $7.32 per share based on the Black-Scholes option-pricing model. The options expire ten yearsfrom the date of grant.
There were no stock options granted during the year ended June 30, 2005.
Compensation expense recorded for the years ended June 30, 2007 and 2006 resulting fromstock option grants to employees and the Board of Directors amounted to approximately$2.9 million and $3.9 million, respectively. Prior to July 1, 2005, the Company accounted for itsstock incentive plans under the recognition and measurement principles prescribed by APB No. 25,“Accounting for Stock Issued to Employees,” and related interpretations, under which no employeecompensation costs were required to be recognized for the periods presented as all options grantedunder those plans had an exercise price equal to the market value of the underlying common stockon the date of grant. Accordingly, no compensation expense has been recognized during the yearended June 30, 2005, related to the stock option grants. See Note 3 for a discussion of theimplementation by the Company of SFAS 123R.
74

ELIZABETH ARDEN, INC. AND SUBSIDIARIES
NOTES TO CONSOLIDATED FINANCIAL STATEMENTS—(Continued)
The option activities under the Company’s stock option plans are as follows:
Years Ended June 30,2007 2006 2005
Shares
WeightedAverageExercise
Price Shares
WeightedAverageExercise
Price Shares
WeightedAverageExercise
Price
Beginning outstandingoptions . . . . . . . . . . . . . . . . . 3,366,469 $15.10 3,221,194 $13.65 3,819,151 $13.08
New grants . . . . . . . . . . . . 352,000 15.36 454,700 23.08 — —Exercised . . . . . . . . . . . . . (260,167) 11.96 (278,081) 11.17 (566,083) 10.14Canceled/Expired . . . . . . (60,334) 17.18 (31,344) 16.86 (31,874) 15.62
Ending outstanding options . . 3,397,968 $15.31 3,366,469 $15.10 3,221,194 $13.65
Exercisable at end of period . . 2,756,923 2,770,424 2,792,931
Weighted average fair value ofoptions granted during theyear . . . . . . . . . . . . . . . . . . . $ 5.99 $ 8.67 $ —
Options Outstanding Options Exercisable
Range ofExercise Price
NumberOutstanding
as ofJune 30,
2007
WeightedAverage
RemainingContractual
Life
WeightedAverageExercise
Price
NumberExercisable
as ofJune 30,
2007
WeightedAverage
RemainingContractual
Life
WeightedAverageExercise
Price
$ 7.00 — 9.38 136,500 3.0 $ 8.00 136,500 3.0 $ 8.00$ 9.39 —19.54 2,493,959 4.5 $13.50 2,118,959 3.7 $13.10$19.55 —23.40 767,509 7.4 $22.46 501,464 7.0 $21.97
3,397,968 5.1 $15.31 2,756,923 4.3 $14.46
The intrinsic value of a stock option is the amount by which the current market value of theunderlying stock exceeds the exercise price of the option. The intrinsic value of stock optionsoutstanding and exercisable at June 30, 2007, 2006 and 2005 was $27.0 million, $22.2 million and$26.7 million, respectively. The total intrinsic value of stock options exercised during the yearsended June 30, 2007, 2006 and 2005, based upon the average market price during the period, wasapproximately $2.5 million, $1.7 million and $3.0 million, respectively.
The weighted average grant date fair value of options granted during the years ended June 30,2007 and 2006 was estimated on the grant date using the Black-Scholes option-pricing model withthe following assumptions:
Years Ended June 30,2007 2006
Expected dividend yield . . . . . . . . . . . . . . . . . . . . . . . . . . . . . 0.00% 0.00%Expected price volatility . . . . . . . . . . . . . . . . . . . . . . . . . . . . . 35% 35%Risk-free interest rate . . . . . . . . . . . . . . . . . . . . . . . . . . . . . . . 4.82 — 4.93% 4.03 — 4.39%Expected life of options in years . . . . . . . . . . . . . . . . . . . . . . 5 5
75

ELIZABETH ARDEN, INC. AND SUBSIDIARIES
NOTES TO CONSOLIDATED FINANCIAL STATEMENTS—(Continued)
Employee Stock Purchase Plan. The Company currently has an Employee Stock Purchase Plan(“ESPP”) under which employees in certain countries are permitted to deposit after tax funds fromtheir wages for purposes of purchasing Common Stock at a 15% discount from the lowest of theclosing price of the Common Stock at either the start of the contribution period or the end of thecontribution period. On May 31, 2007 and November 30, 2006, a purchase of Common Stockoccurred under this plan for 48,381 and 44,533 shares, respectively. Beginning in the three-monthperiod ending September 30, 2005, the Company began expensing the discount taken and the fairvalue of the “look-back” feature realized by employees upon purchases of Common Stock under theESPP. For the years ended June 30, 2007 and 2006, the Company recorded costs associated with theESPP of approximately $0.4 million and $0.5 million, respectively. The next purchase under the ESPPwill be consummated on December 1, 2007. Prior to July 1, 2005, the Company accounted for itsemployee stock purchase plan under the recognition and measurement principles prescribed by APB25, and related interpretations, under which no employee compensation costs were required to berecognized for the periods presented as all options granted under those plans had an exercise priceequal to the market value of the underlying common stock on the date of grant. Accordingly, nocompensation expense has been recognized during the year ended June 30, 2005, related to the stockoption grants. See Note 3 for a discussion on the implementation by the Company of SFAS 123R.
Restricted Stock
On August 20, 2007, the Board granted 68,700 shares of performance-based restricted stock to 20managerial employees and 80,300 shares of service-based restricted stock to 28 managerial employees.The performance-based restricted stock will vest in full on a date that is two business days after theCompany’s financial results for fiscal 2010 are released to the public, but only if (i) the person receivingthe grant is still employed by the Company and (ii) the Company achieves cumulative earnings perdiluted share target. The service-based restricted stock will vest in equal thirds over a three-year periodon a date that is two business days after the Company’s financial results for each of the fiscal yearsending June 30, 2008, 2009 and 2010 are publicly announced but only if the person is still employed bythe Company at the time of vesting. The fair value of the restricted stock granted was based on theclosing price of the Common Stock on the date of grant. The restricted stock is recorded as additionalpaid-in capital in shareholders’ equity as amortization occurs over the three-year vesting period.
Year Ended June 30, 2007. On August 21, 2006, the Board granted 138,675 shares ofperformance-based restricted stock to 70 managerial employees and 142,125 shares of service-basedrestricted stock to 80 managerial employees. The performance-based restricted stock will vest in full onthe date that is two business days after the Company’s financial results for fiscal 2009 are released to thepublic, but only if (i) the person receiving the grant is still employed by the Company and (ii) theCompany achieves cumulative earnings per diluted share target. The service-based restricted stock willvest in equal thirds over a three-year period on the dates that are two business days after the Company’sfinancial results for each of the fiscal years ending June 30, 2007, 2008 and 2009 are publiclyannounced, but only if the person is still employed by the Company at the time of vesting. The fair valueof the restricted stock granted was based on the closing price of the Common Stock on the date of grant.The restricted stock is recorded as additional paid-in capital in shareholders’ equity as amortizationoccurs over the three-year vesting period.
Year Ended June 30, 2006. On May 13, 2006, the Board authorized the grant of an aggregate of45,556 shares of restricted stock to 209 employees that vest in full one year from the date of grant.The fair value of the restricted stock granted was based on the closing price of the Common Stock onthe date of grant. The restricted stock is recorded as additional paid-in capital in shareholders’equity as amortization occurs over the one-year vesting period using the graded vesting method.
76

ELIZABETH ARDEN, INC. AND SUBSIDIARIES
NOTES TO CONSOLIDATED FINANCIAL STATEMENTS—(Continued)
On August 10, 2005, the Board granted 195,949 shares of performance-based restricted stockto 118 managerial employees, one third of which vests two years from the date of grant and theremaining two thirds of which vest three years from the date of grant if the Company achieves a10% cumulative average annualized increase in earnings per share, excluding any one-time orextraordinary events (as determined by the compensation committee of the Board), over the relevantmeasurement periods. The fair value of the restricted stock granted was based on the closing price ofthe Common Stock on the date of grant. The restricted stock is recorded as additional paid-incapital in shareholders’ equity as amortization occurs over the two- and three-year vesting periodsusing the graded vesting method. The Company did not achieve a 10% cumulative averageannualized increase in earnings per share over the measurement period of July 1, 2005 throughJune 30, 2007. Accordingly, one third of the performance-based restricted stock grant did not vestand has been forfeited. Based on the Company’s financial results for the years ended June 30, 2007and 2006 and projections for the year ending June 30, 2008, the Company determined that thevesting of the remainder of the grant is not probable. As a result, the Company did not recordcompensation expense in the years ended June 30, 2007 and 2006 related to this award.
A summary of the Company’s restricted stock activity for the year ended June 30, 2007, ispresented below:
Restricted StockShares(000)
WeightedAverageGrant-
Date FairValue
Non-vested at July 1, 2006 . . . . . . . . . . . . . . . . . . . . . . . . . . . . . . . . . . . . . . . . . . . . 773 $20.07Granted . . . . . . . . . . . . . . . . . . . . . . . . . . . . . . . . . . . . . . . . . . . . . . . . . . . . . . . . . . . 281 $15.00Vested . . . . . . . . . . . . . . . . . . . . . . . . . . . . . . . . . . . . . . . . . . . . . . . . . . . . . . . . . . . . (103) $21.26Forfeited . . . . . . . . . . . . . . . . . . . . . . . . . . . . . . . . . . . . . . . . . . . . . . . . . . . . . . . . . . (30) $18.95
Non-vested at June 30, 2007 . . . . . . . . . . . . . . . . . . . . . . . . . . . . . . . . . . . . . . . . . . . 921 $18.82
Year Ended June 30, 2005. On May 13, 2005, the Company authorized the grant of an aggregateof 42,377 shares of restricted stock to 192 employees that vest in full one year from the date of grant.These shares were recorded as unearned deferred compensation in shareholders’ equity in the amount ofapproximately $882,000, and were amortized over the one-year vesting period.
In March 2005, the Board approved the granting of up to 423,800 shares of market-based restrictedstock (“MBRS”). As a result of such approval, the Company issued 410,800 shares of MBRS to 17managerial employees. The MBRS will only vest if the Company’s total shareholder return surpasses thetotal shareholder return of the Russell 2000 Index over a three, four, five or six-year period from the dateof grant, in which case the MBRS will vest at that time. Upon adoption of SFAS 123R on July 1, 2005,the Company revalued the MBRS using a Monte Carlo simulation model using the assumptions presentedbelow:
Three Months EndedSeptember 30, 2005
Expected dividend yield . . . . . . . . . . . . . . . . . . . . . . . . . . . . . . . . . . . . . 0.00%Expected price volatility . . . . . . . . . . . . . . . . . . . . . . . . . . . . . . . . . . . . . 40.00%Risk-free interest rate . . . . . . . . . . . . . . . . . . . . . . . . . . . . . . . . . . . . . . . 3.72%Derived service period in years . . . . . . . . . . . . . . . . . . . . . . . . . . . . . . . . 3
Compensation expense for the years ended June 30, 2007, 2006 and 2005, resulting fromrestricted stock grants to employees and independent contractors of the Company, amounted toapproximately $4.9 million, $5.1 million and $6.7 million, respectively.
77

ELIZABETH ARDEN, INC. AND SUBSIDIARIES
NOTES TO CONSOLIDATED FINANCIAL STATEMENTS—(Continued)
NOTE 17. Quarterly Data (Unaudited)
Condensed consolidated quarterly and interim information is as follows: (Amounts inthousands, except per share data)
Fiscal Quarter EndedJune 30,
2007March 31,
2007December 31,
2006September 30,
2006
Net sales . . . . . . . . . . . . . . . . . . . . . . . . . . . . . . . $242,674 $219,223 $410,771 $254,808Gross profit . . . . . . . . . . . . . . . . . . . . . . . . . . . . . 105,661 98,479 157,954 99,225Income from operations . . . . . . . . . . . . . . . . . . . 14,783 10,347 43,282 5,594Net income (loss) . . . . . . . . . . . . . . . . . . . . . . . . 9,634 3,157 25,856 (1,313)Earnings (loss) per common share:
Basic . . . . . . . . . . . . . . . . . . . . . . . . . . . . . . $ 0.35 $ 0.11 $ 0.94 $ (0.05)Diluted . . . . . . . . . . . . . . . . . . . . . . . . . . . . $ 0.33 $ 0.11 $ 0.91 $ (0.05)
Fiscal Quarter EndedJune 30,
2006March 31,
2006December 31,
2005September 30,
2005
Net sales . . . . . . . . . . . . . . . . . . . . . . . . . . . . . . . $189,935 $191,344 $345,893 $227,378Gross profit . . . . . . . . . . . . . . . . . . . . . . . . . . . . . 82,996 86,250 145,760 89,066Income from operations . . . . . . . . . . . . . . . . . . . 1,693 4,883 54,279 7,402Debt extinguishment charge . . . . . . . . . . . . . . . — 758(1) — —Net (loss) income . . . . . . . . . . . . . . . . . . . . . . . . (1,897) 702 33,094 895(Loss) earnings per common share:
Basic . . . . . . . . . . . . . . . . . . . . . . . . . . . . . . $ (0.07) $ 0.02 $ 1.16 $ 0.03Diluted . . . . . . . . . . . . . . . . . . . . . . . . . . . . $ (0.07) $ 0.02 $ 1.12 $ 0.03
(1) Relates to the redemption of the 113⁄4% Senior Notes. See Note 10.
NOTE 18. Condensed Consolidating Financial Information
The following condensed financial statements as of June 30, 2007 and June 30, 2006 and forthe years ended June 30, 2007, 2006 and 2005, show the consolidated financial statements of theCompany, and, in separate financial statements, the financial statements of those subsidiaries thatare guarantors of the 7 3/4% Senior Subordinated Notes issued in January 2004, plus, in each case,the financial statements of non-guarantor entities, elimination adjustments and the consolidatedtotal. The Company’s subsidiaries DF Enterprises, Inc., FD Management, Inc., ElizabethArden International Holding, Inc., Elizabeth Arden (Financing), Inc., RDEN Management, Inc. andElizabeth Arden Travel Retail, Inc. are guarantors of the 7 3/4% Senior Subordinated Notes. Equityincome of the guarantor subsidiaries is included in other (expense) income, net. All subsidiarieslisted in this note are wholly-owned subsidiaries of the Company and their guarantees are joint andseveral, full and unconditional. All information presented in thousands.
78

ELIZABETH ARDEN, INC. AND SUBSIDIARIES
NOTES TO CONSOLIDATED FINANCIAL STATEMENTS—(Continued)
Balance Sheet
As of June 30, 2007
CompanyNon-
Guarantors
7 3⁄4% SeniorSubordinated
NotesGuarantors Eliminations Total
ASSETSCurrent Assets:
Cash and cash equivalents . . . . . $ 7,278 $ 23,001 $ 8 $ — $ 30,287Accounts receivable, net . . . . . . . 116,360 98,612 — — 214,972Inventories . . . . . . . . . . . . . . . . . . 291,536 88,696 — — 380,232Intercompany receivable . . . . . . . 66,931 137,561 287,063 (491,555) —Deferred income taxes . . . . . . . . . 18,221 (794) — — 17,427Prepaid expenses and other
assets . . . . . . . . . . . . . . . . . . . . 9,611 13,003 — 61 22,675Total current assets . . . . . . . . . 509,937 360,079 287,071 (491,494) 665,593
Property and equipment, net . . . . . 25,445 17,026 — — 42,471Other Assets:
Investment in subsidiaries . . . . . . 65,969 — — (65,969) —Exclusive brand licenses,
trademarks and intangibles,net . . . . . . . . . . . . . . . . . . . . . . 60,494 8,332 155,785 — 224,611
Debt financing costs, net . . . . . . . 5,777 — — — 5,777Other . . . . . . . . . . . . . . . . . . . . . . 217,658 (227,328) 9,136 1,257 723
Total other assets . . . . . . . . . . . 349,898 (218,996) 164,921 (64,712) 231,111Total assets . . . . . . . . . . . . . . . $885,280 $ 158,109 $451,992 $(556,206) $939,175
LIABILITIES ANDSHAREHOLDERS’ EQUITY
Current Liabilities:Short-term debt . . . . . . . . . . . . . . $ 97,640 $ — $ — $ — $ 97,640Accounts payable—trade . . . . . . 161,188 19,344 — — 180,532Intercompany payable . . . . . . . . . 19,646 224,636 246,180 (490,462) —Other payables and accrued
expenses . . . . . . . . . . . . . . . . . . 45,605 42,294 197 35 88,131Current portion of long-term
debt . . . . . . . . . . . . . . . . . . . . . 1,125 — — — 1,125Total current liabilities . . . . . . 325,204 286,274 246,377 (490,427) 367,428
Long-term debt . . . . . . . . . . . . . . 224,530 — — — 224,530Deferred income taxes and other
liabilities . . . . . . . . . . . . . . . . . 14,619 4,062 7,419 190 26,290Total liabilities . . . . . . . . . . . . . 564,353 290,336 253,796 (490,237) 618,248
Shareholders’ EquityCommon stock . . . . . . . . . . . . . . . 305 — — — 305Additional paid-in capital . . . . . . 265,245 (218,251) 217,015 1,236 265,245Retained earnings (accumulated
deficit) . . . . . . . . . . . . . . . . . . . 85,675 81,946 (18,819) (63,127) 85,675Treasury stock . . . . . . . . . . . . . . . (33,879) — — — (33,879)Accumulated other
comprehensive income . . . . . . . 3,581 4,078 — (4,078) 3,581Total shareholders’ equity . . . . 320,927 (132,227) 198,196 (65,969) 320,927Total liabilities and
shareholders’ equity . . . . . . . $885,280 $ 158,109 $451,992 $(556,206) $939,175
79

ELIZABETH ARDEN, INC. AND SUBSIDIARIES
NOTES TO CONSOLIDATED FINANCIAL STATEMENTS—(Continued)
Balance Sheet
As of June 30, 2006
CompanyNon-
Guarantors
7 3⁄4% SeniorSubordinated
NotesGuarantors Eliminations Total
ASSETSCurrent Assets:
Cash and cash equivalents . . . . . $ 4,931 $ 23,529 $ 6 $ — $ 28,466Accounts receivable, net . . . . . . . 94,385 86,695 — — 181,080Inventories . . . . . . . . . . . . . . . . . . 183,972 85,298 — — 269,270Intercompany receivable . . . . . . . 91,356 157,675 272,799 (521,830) —Deferred income taxes . . . . . . . . . 14,792 679 — — 15,471Prepaid expenses and other
assets . . . . . . . . . . . . . . . . . . . . 9,136 12,497 — — 21,633Total current assets . . . . . . . . . 398,572 366,373 272,805 (521,830) 515,920
Property and equipment, net . . . . . 21,373 13,308 — — 34,681Other Assets:
Investment in subsidiaries . . . . . . 23,173 — — (23,173) —Exclusive brand licenses,
trademarks and intangibles,net . . . . . . . . . . . . . . . . . . . . . . 34,228 9,212 158,094 — 201,534
Debt financing costs, net . . . . . . . 6,741 — — — 6,741Other . . . . . . . . . . . . . . . . . . . . . . 223,352 (232,443) 9,136 982 1,027
Total other assets . . . . . . . . . . . 287,494 (223,231) 167,230 (22,191) 209,302Total assets . . . . . . . . . . . . . . . $707,439 $ 156,450 $440,035 $(544,021) $759,903
LIABILITIES ANDSHAREHOLDERS’ EQUITY
Current Liabilities:Short-term debt . . . . . . . . . . . . . . $ 40,000 $ — $ — $ — $ 40,000Accounts payable—trade . . . . . . 116,613 17,382 — 11 134,006Intercompany payable . . . . . . . . . 7,820 274,152 239,008 (520,980) —Other payables and accrued
expenses . . . . . . . . . . . . . . . . . . 29,444 30,953 13 (1) 60,409Current portion of long-term
debt . . . . . . . . . . . . . . . . . . . . . 563 — — — 563Total current liabilities . . . . . . 194,440 322,487 239,021 (520,970) 234,978
Long-term debt . . . . . . . . . . . . . . 225,388 — — — 225,388Deferred income taxes and other
liabilities . . . . . . . . . . . . . . . . . 9,764 5,058 6,746 122 21,690Total liabilities . . . . . . . . . . . . . 429,592 327,545 245,767 (520,848) 482,056
Shareholders’ EquityCommon stock . . . . . . . . . . . . . . . 299 — — — 299Additional paid-in capital . . . . . . 252,565 (223,543) 222,570 973 252,565Retained earnings (accumulated
deficit) . . . . . . . . . . . . . . . . . . . 48,341 49,972 (28,302) (21,670) 48,341Treasury stock . . . . . . . . . . . . . . . (25,339) — — — (25,339)Accumulated other
comprehensive income . . . . . . . 1,981 2,476 — (2,476) 1,981Total shareholders’ equity . . . . 277,847 (171,095) 194,268 (23,173) 277,847Total liabilities and
shareholders’ equity . . . . . . . $707,439 $ 156,450 $440,035 $(544,021) $759,903
80

ELIZABETH ARDEN, INC. AND SUBSIDIARIES
NOTES TO CONSOLIDATED FINANCIAL STATEMENTS—(Continued)
Statement of Income
Year Ended June 30, 2007
CompanyNon-
Guarantors
7 3⁄4% SeniorSubordinated
NotesGuarantors Eliminations Total
Net sales . . . . . . . . . . . . . . . . . . . . $706,509 $420,967 $14,919 $(14,919) $1,127,476Cost of sales . . . . . . . . . . . . . . . . . . 468,168 197,989 — — 666,157
Gross profit . . . . . . . . . . . . . . . . . . 238,341 222,978 14,919 (14,919) 461,319
Selling, general andadministrative costs . . . . . . . . . . 197,684 181,277 (1,247) (14,919) 362,795
Depreciation and amortization . . . 14,679 6,925 2,914 — 24,518
Income from operations . . . . . . . . 25,978 34,776 13,252 — 74,006Other expense (income):
Interest expense (income) . . . 29,156 1,692 (1,650) — 29,198Other . . . . . . . . . . . . . . . . . . . (38,761) (4,318) 4,736 38,343 —
Income before income taxes . . . . . 35,583 37,402 10,166 (38,343) 44,808(Benefit from) provision for
income taxes . . . . . . . . . . . . . . . (1,751) 5,532 3,693 — 7,474
Net income . . . . . . . . . . . . . . . . . . $ 37,334 $ 31,870 $ 6,473 $(38,343) $ 37,334
Statement of Income
Year Ended June 30, 2006
CompanyNon-
Guarantors
7 3⁄4% SeniorSubordinated
NotesGuarantors Eliminations Total
Net sales . . . . . . . . . . . . . . . . . . . . . . $576,633 $377,917 $13,731 $(13,731) $954,550Cost of sales . . . . . . . . . . . . . . . . . . . 368,397 182,081 — — 550,478
Gross profit . . . . . . . . . . . . . . . . . . . . 208,236 195,836 13,731 (13,731) 404,072
Selling, general and administrativecosts . . . . . . . . . . . . . . . . . . . . . . . 168,164 160,245 (972) (13,731) 313,706
Depreciation and amortization . . . . . 11,978 7,295 2,836 — 22,109
Income from operations . . . . . . . . . . 28,094 28,296 11,867 — 68,257Other expense (income):
Interest expense (income) . . . . . 23,408 1,747 (1,731) — 23,424Debt extinguishment charge . . . 758 — — — 758Other . . . . . . . . . . . . . . . . . . . . . (33,192) 842 5,268 27,082 —
Income before income taxes . . . . . . . 37,120 25,707 8,330 (27,082) 44,075Provision for income taxes . . . . . . . . 4,326 3,944 3,011 — 11,281
Net income . . . . . . . . . . . . . . . . . . . . $ 32,794 $ 21,763 $ 5,319 $(27,082) $ 32,794
81

ELIZABETH ARDEN, INC. AND SUBSIDIARIES
NOTES TO CONSOLIDATED FINANCIAL STATEMENTS—(Continued)
Statement of Income
Year Ended June 30, 2005
CompanyNon-
Guarantors
7 3⁄4% SeniorSubordinated
NotesGuarantors Eliminations Total
Net sales . . . . . . . . . . . . . . . . . . . . . . $571,374 $349,164 $14,328 $(14,328) $920,538Cost of sales . . . . . . . . . . . . . . . . . . . 355,466 153,708 — 509,174
Gross profit . . . . . . . . . . . . . . . . . . . . 215,908 195,456 14,328 (14,328) 411,364
Selling, general and administrativecosts . . . . . . . . . . . . . . . . . . . . . . . 165,314 159,861 (1,677) (14,328) 309,170
Impairment charge . . . . . . . . . . . . . . 2,156 — — — 2,156Depreciation and amortization . . . . . 12,656 6,141 2,708 — 21,505
Income from operations . . . . . . . . . . 35,782 29,454 13,297 — 78,533Other expense (income):
Interest expense (income) . . . . . 23,473 2,318 (2,265) — 23,526Other . . . . . . . . . . . . . . . . . . . . . (35,742) 975 5,681 29,086 —
Income before income taxes . . . . . . . 48,051 26,161 9,881 (29,086) 55,007Provision for income taxes . . . . . . . . 10,447 3,389 3,567 — 17,403
Net income . . . . . . . . . . . . . . . . . . . . $ 37,604 $ 22,772 $ 6,314 $(29,086) $ 37,604
82

ELIZABETH ARDEN, INC. AND SUBSIDIARIES
NOTES TO CONSOLIDATED FINANCIAL STATEMENTS—(Continued)
Statement of Cash Flows
Year Ended June 30, 2007
Company Non-Guarantors
7 3⁄4% SeniorSubordinated
NotesGuarantors Eliminations Total
Operating activities:Net cash provided by operating
activities . . . . . . . . . . . . . . . . . . $ 14,263 $ 38,435 $ 7,093 $(975) $ 58,816
Investing activities:Additions to property and
equipment . . . . . . . . . . . . . . . . . (9,197) (9,834) — — (19,031)Proceeds from disposals of
property and equipment . . . . . . — — — — —Acquisition of licenses and other
assets . . . . . . . . . . . . . . . . . . . . . (91,487) — — — (91,487)
Net cash used in investing activities . . (100,684) (9,834) — — (110,518)
Financing activities:Payments on short-term debt . . . 57,640 — — — 57,640Payments on long-term debt . . . . (538) — — — (538)Repurchase of common stock . . . (8,540) (8,540)Proceeds from the exercise of
stock options . . . . . . . . . . . . . . . 3,112 — — — 3,112Proceeds from the issuance of
common stock under ESPP . . . 1,446 — — — 1,446Net change in intercompany
obligations . . . . . . . . . . . . . . . . . . . . 35,245 (29,129) (7,091) 975 —
Net cash provided by (used in) byfinancing activities . . . . . . . . . . . . . . 88,365 (29,129) (7,091) 975 53,120
Effect of exchange rate changes oncash and cash equivalents . . . . . . . . 403 — — — 403
Net increase (decrease) in cash andcash equivalents . . . . . . . . . . . . . . . . 2,347 (528) 2 — 1,821
Cash and cash equivalents atbeginning of year . . . . . . . . . . . . . . . 4,931 23,529 6 — 28,466
Cash and cash equivalents at end ofyear . . . . . . . . . . . . . . . . . . . . . . . . . $ 7,278 $ 23,001 $ 8 $ — $ 30,287
83

ELIZABETH ARDEN, INC. AND SUBSIDIARIES
NOTES TO CONSOLIDATED FINANCIAL STATEMENTS—(Continued)
Statement of Cash Flows
Year Ended June 30, 2006
Company Non-Guarantors
7 3⁄4% SeniorSubordinated
NotesGuarantors Eliminations Total
Operating activities:Net cash provided by (used in)
operating activities . . . . . . . . . . $ 73,871 $ 14,715 $(21,757) $(1,553) $ 65,276
Investing activities:Additions to property and
equipment . . . . . . . . . . . . . . . . . (10,840) (8,385) — — (19,225)Proceeds from disposals of
property and equipment . . . . . . 9,945 — — — 9,945Acquisition of licenses and other
assets . . . . . . . . . . . . . . . . . . . . . (11,472) (3,583) — — (15,055)
Net cash used in investing activities . . (12,367) (11,968) — — (24,335)
Financing activities:Payments on short-term debt . . . . (7,700) — — — (7,700)Payments on long-term debt . . . . (9,321) — — — (9,321)Repurchase of common stock . . . . (25,339) — — — (25,339)Proceeds from the exercise of
stock options . . . . . . . . . . . . . . . 3,112 — — — 3,112Proceeds from the issuance of
common stock under ESPP . . . 1,664 — — — 1,664Net change in intercompany
obligations . . . . . . . . . . . . . . . . . (25,192) 1,919 21,720 1,553 —
Net cash (used in) provided byfinancing activities . . . . . . . . . . . . . . (62,776) 1,919 21,720 1,553 (37,584)
Effect of exchange rate changes oncash and cash equivalents . . . . . . . . (207) — — — (207)
Net (decrease) increase in cash andcash equivalents . . . . . . . . . . . . . . . . (1,479) 4,666 (37) — 3,150
Cash and cash equivalents atbeginning of year . . . . . . . . . . . . . . . 6,410 18,863 43 — 25,316
Cash and cash equivalents at end ofyear . . . . . . . . . . . . . . . . . . . . . . . . . . $ 4,931 $ 23,529 $ 6 $ — $ 28,466
84

ELIZABETH ARDEN, INC. AND SUBSIDIARIES
NOTES TO CONSOLIDATED FINANCIAL STATEMENTS—(Continued)
Statement of Cash Flows
Year Ended June 30, 2005
CompanyNon-
Guarantors
7 3⁄4% SeniorSubordinated
NotesGuarantors Eliminations Total
Operating activities:Net cash provided by (used in)
operating activities . . . . . . . . . $ 79,042 $ 2,397 $(45,881) $ (9) $ 35,549
Investing activities:Additions to property and
equipment . . . . . . . . . . . . . . . . (7,648) (7,760) — — (15,408)Proceeds from disposals of
property and equipment . . . . . (2,100) — — — (2,100)
Net cash used in investingactivities . . . . . . . . . . . . . . . . . . . . . (9,748) (7,760) — — (17,508)
Financing activities:Payments on short-term debt . . (18,200) — — — (18,200)Payments on long-term debt . . . (4,764) — — — (4,764)Proceeds from the exercise of
stock options . . . . . . . . . . . . . . 5,740 — — — 5,740Other . . . . . . . . . . . . . . . . . . . . . (71) — — — (71)Proceeds from the issuance of
common stock under ESPP . . 1,510 — — — 1,510Net change in intercompany
obligations . . . . . . . . . . . . . . . (53,917) 8,024 45,884 9 —
Net cash (used in) provided byfinancing activities . . . . . . . . . . . . . (69,702) 8,024 45,884 9 (15,785)
Effect of exchange rate changes oncash and cash equivalents . . . . . . . (434) — — — (434)
Net (decrease) increase in cash andcash equivalents . . . . . . . . . . . . . . . (842) 2,661 3 — 1,822
Cash and cash equivalents atbeginning of year . . . . . . . . . . . . . . 7,251 16,202 41 — 23,494
Cash and cash equivalents at end ofyear . . . . . . . . . . . . . . . . . . . . . . . . $ 6,409 $18,863 $ 44 $— $ 25,316
85

ELIZABETH ARDEN, INC. AND SUBSIDIARIES
NOTES TO CONSOLIDATED FINANCIAL STATEMENTS—(Continued)
NOTE 19. Geographic Information
The Company manages its business on the basis of one reportable operating segment. Duringthe year ended June 30, 2007, the Company sold its products in approximately 90 countries outsidethe United States through its international affiliates and subsidiaries with operations headquarteredin Geneva, Switzerland and through third party distributors. The Company’s internationaloperations are subject to certain risks, including political instability in certain regions of the worldand diseases or other factors affecting customer purchasing patterns, economic and politicalconsequences of terrorist attacks or the threat of such attacks and fluctuations in foreign exchangerates that could adversely affect its results of operations. See Item 1A — “Risk Factors.” The valueof international assets is affected by fluctuations in foreign currency exchange rates. For a discussionof foreign currency translation, see Note 1.
Years Ended June 30,(Amounts in thousands) 2007 2006 2005
Net sales:United States . . . . . . . . . . . . . . . . . . . . . . . . . . . . $ 706,510 $576,633 $571,374United Kingdom . . . . . . . . . . . . . . . . . . . . . . . . . 45,887 47,472 45,628International . . . . . . . . . . . . . . . . . . . . . . . . . . . . 375,079 330,445 303,536
Total . . . . . . . . . . . . . . . . . . . . . . . . . . . . . . . $1,127,476 $954,550 $920,538
Classes of similar products (net sales):Fragrance . . . . . . . . . . . . . . . . . . . . . . . . . . . . . . . $ 851,051 $716,635 $690,984Skin care . . . . . . . . . . . . . . . . . . . . . . . . . . . . . . . 200,631 168,962 155,510Cosmetics . . . . . . . . . . . . . . . . . . . . . . . . . . . . . . . 75,794 68,953 74,044
Total . . . . . . . . . . . . . . . . . . . . . . . . . . . . . . . $1,127,476 $954,550 $920,538
June 30,(Amounts in thousands) 2007 2006
Long-lived assetsUnited States(1) . . . . . . . . . . . . . . . . . . . . . . . . . . . . . . $248,134 $221,212International(2) . . . . . . . . . . . . . . . . . . . . . . . . . . . . . . . 25,448 22,771
Total . . . . . . . . . . . . . . . . . . . . . . . . . . . . . . . . . . . $273,582 $243,983
(1) Primarily exclusive brand licenses, trademarks and intangibles, net, and property andequipment, net.
(2) Primarily property and equipment, net.
86

ITEM 9. CHANGES IN AND DISAGREEMENTS WITH ACCOUNTANTS ON ACCOUNTINGAND FINANCIAL DISCLOSURE
None.
ITEM 9A.CONTROLS AND PROCEDURES
The Company’s Chairman, President and Chief Executive Officer and the Company’s ExecutiveVice President and Chief Financial Officer, who are the principal executive officer and principalfinancial officer, respectively, have evaluated the effectiveness and operation of the Company’sdisclosure controls and procedures (as defined in Rules 13a-15(e) and 15d-15(e) of the SecuritiesExchange Act of 1934, as amended), as of the end of the period covered by this annual report (the“Evaluation Date”). Based upon such evaluation, they have concluded that, as of the EvaluationDate, the Company’s disclosure controls and procedures are functioning effectively.
Management’s report on the Company’s internal control over financial reporting (as such termis defined in Rules 13a-15(f) and 15d-15(f) under the Exchange Act), is included in our FinancialStatements in Item 8 under the heading Report of Management - Report on Internal Control OverFinancial Reporting and is hereby incorporated by reference. The related report of our independentregistered public accounting firm is also included in our Financial Statements in Item 8 under theheading Report of Independent Registered Public Accounting Firm.
There have been no changes in the Company’s internal controls over financial reporting duringthe Company’s most recent fiscal quarter that have materially affected, or are likely to materiallyaffect, the Company’s internal controls over financial reporting.
ITEM 9B. OTHER INFORMATION
None.
PART III
ITEM 10. DIRECTORS, EXECUTIVE OFFICERS AND CORPORATE GOVERNANCE
We have adopted a Supplemental Code of Ethics for the Directors and Executive and FinanceOfficers that applies to our directors, our chief executive officer, our chief financial officer, and ourother executive officers and finance officers. The full text of this Code of Ethics, as approved by ourboard of directors, is published on our website, at www.elizabetharden.com, under the section“EA Corporate — Investor Relations — Corporate Governance — Code of Ethics.” We intend todisclose future amendments to and waivers of the provisions of this Code of Ethics on our website.
The other information required by this item will be contained in the Company’s ProxyStatement relating to the 2007 Annual Meeting of Shareholders to be filed within 120 days after theclose of our fiscal year ended June 30, 2007 (the proxy statement) and is incorporated herein by thisreference or is included in Part I under “Executive Officers of the Company.”
ITEM 11. EXECUTIVE COMPENSATION
The information required by this item will be contained in the proxy statement and isincorporated herein by this reference.
87

ITEM 12. SECURITY OWNERSHIP OF CERTAIN BENEFICIAL OWNERS ANDMANAGEMENT AND RELATED STOCKHOLDER MATTERS
The information required by this item will be contained in the proxy statement and isincorporated herein by this reference.
ITEM 13. CERTAIN RELATIONSHIPS AND RELATED TRANSACTIONS, AND DIRECTORINDEPENDENCE
The information required by this item will be contained in the proxy statement and isincorporated herein by this reference.
ITEM 14. PRINCIPAL ACCOUNTING FEES AND SERVICES
The information required by this item will be contained in the proxy statement and isincorporated herein by this reference.
PART IV
ITEM 15 EXHIBITS, FINANCIAL STATEMENT SCHEDULES
(a) 1. Financial Statements — The consolidated financial statements and Report of IndependentRegistered Public Accounting Firm are listed in the “Index to Financial Statements andSchedules” on page 46 and included on pages 48 through 54.
2. Financial Statement Schedules — All schedules for which provision is made in theapplicable accounting regulations of the Securities and Exchange Commission (the“Commission”) are either not required under the related instructions, are not applicable(and therefore have been omitted), or the required disclosures are contained in thefinancial statements included herein.
3. Exhibits including those incorporated by reference.
ExhibitNumber Description
3.1 Amended and Restated Articles of Incorporation of the Company dated November 17,2005 (incorporated herein by reference to Exhibit 3.1 filed as part of the Company’sForm 10-Q for the quarter ended December 31, 2005 (Commission File No. 1-6370)).
3.2 Amended and Restated By-laws of the Company (incorporated herein by reference toExhibit 3.2 filed as part of the Company’s Form 10-Q for the transition period fromFebruary 1, 2004 to June 30, 2004 (Commission File No. 1-6370)).
4.1 Indenture dated as of January 13, 2004, among the Company and FD Management, Inc.,DF Enterprises, Inc., Elizabeth Arden International Holding, Inc., RDEN Management,Inc., Elizabeth Arden (Financing), Inc., Elizabeth Arden Travel Retail, Inc., asguarantors, and HSBC Bank USA, as trustee (incorporated herein by reference to Exhibit4.3 to the Company’s Form 10-K for the year ended January 31, 2004 (Commission FileNo. 1-6370)).
10.1 Second Amended and Restated Credit Agreement dated as of December 24, 2002 amongthe Company, JPMorgan Chase Bank, as administrative agent, Fleet National Bank, ascollateral agent, and the banks listed on the signature pages thereto (incorporated hereinby reference to Exhibit 4.1 filed as part of the Company’s Form 8-K dated December 30,2002 (Commission File No. 1-6370)).
88

ExhibitNumber Description
10.2 First Amendment to Second Amended and Restated Credit Agreement dated as ofFebruary 25, 2004, among the Company, JP Morgan Chase Bank, as administrativeagent, Fleet National Bank, as collateral agent, and the banks listed on the signaturepages thereto (incorporated by reference to Exhibit 4.6 filed as part of the Company’sForm 10-Q for the quarter ended May 1, 2004 (Commission File No. 1-6370)).
10.3 Second Amendment to Second Amended and Restated Credit Agreement dated as ofJune 2, 2004, among the Company, JP Morgan Chase Bank, as administrative agent,Fleet National Bank, as collateral agent, and the banks listed on the signature pagesthereto (incorporated herein by reference to Exhibit 4.6 to the Company’s Form 10-Qfor the quarter ended May 1, 2004 (Commission File No. 1-6370)).
10.4 Third Amendment to Second Amended and Restated Credit Agreement dated as ofSeptember 30, 2004, among the Company, JP Morgan Chase Bank, as administrativeagent, Fleet National Bank, as collateral agent, and the banks listed on the signaturepages thereto (incorporated herein by reference to Exhibit 4.1 filed as part of theCompany’s Form 8-K dated October 1, 2004 (Commission File No. 1-6370)).
10.5 Fourth Amendment to Second Amended and Restated Credit Agreement dated as ofNovember 2, 2005, among the Company, JP Morgan Chase Bank, as administrativeagent, Bank of America, N.A. (formerly Fleet National Bank), as the collateral agent,and the banks listed on the signature pages thereto (incorporated herein by reference toExhibit 4.8 filed as part of the Company’s Form 10-Q for the quarter ended September30, 2005 (Commission File No. 1-6370)).
10.6 Fifth Amendment to Second Amended and Restated Credit Agreement dated as of August11, 2006, among the Company, JP Morgan Chase Bank, as administrative agent, Bank ofAmerica, N.A. (formerly Fleet National Bank), as the collateral agent, and the banks listedon the signature pages thereto (incorporated by reference to Exhibit 4.7 filed as part of theCompany’s Form 10-K for the year ended June 30, 2006 (Commission File No.1-6370)).
10.7* Sixth Amendment to Second Amended and Restated Credit Agreement dated as ofAugust 15, 2007, among the Company, JP Morgan Chase Bank, as administrative agent,Bank of America, N.A. (formerly Fleet National Bank), as the collateral agent, and thebanks listed on the signature pages thereto.
10.8 Amended and Restated Security Agreement dated as of January 29, 2001, made by theCompany and certain of its subsidiaries in favor of Fleet National Bank, asadministrative agent (incorporated herein by reference to Exhibit 4.5 filed as part of theCompany’s Form 8-K dated February 7, 2001 (Commission File No. 1-6370)).
10.9 Amended and Restated Deed of Lease dated as of January 17, 2003, between theCompany and Liberty Property Limited Partnership (incorporated herein by referencedto Exhibit 10.5 filed as a part of the Company’s Form 10-Q for the quarter endedApril 26, 2003 (Commission File No. 1-6370)).
10.10 Asset Purchase Agreement dated August 11, 2006 between the Company and SovereignSales, LLC (incorporated by reference to Exhibit 10.22 filed as part of the Company’sForm 10-K for the year ended June 30, 2006 (Commission File No. 1-6370)).
10.11+ Amended 2004 Stock Incentive Plan (incorporated by reference to Exhibit 10.1 filed as partof the Company’s Form 10-Q for the quarter ended September 30, 2006 (Commission FileNo. 1-6370)).
10.12+ Amended 2004 Non-Employee Director Stock Option Plan (incorporated by reference toExhibit 10.2 filed as part of the Company’s Form 10-Q for the quarter ended September30, 2006 (Commission File No. 1-6370)).
10.13+ Amended 2000 Stock Incentive Plan (incorporated by reference to Exhibit 10.3 filed aspart of the Company’s Form 10-Q for the quarter ended September 30, 2006(Commission File No. 1-6370)).
89

ExhibitNumber Description
10.14+ Amended 1995 Stock Option Plan (incorporated by reference to Exhibit 10.4 filed aspart of the Company’s Form 10-Q for the quarter ended September 30, 2006(Commission File No. 1-6370)).
10.15+ Amended 2002 Employee Stock Purchase Plan (incorporated by reference to Exhibit10.5 filed as part of the Company’s Form 10-K for the year ended June 30, 2006(Commission File No. 1-6370)).
10.16+ Amended Non-Employee Director Stock Option Plan (incorporated by reference toExhibit 10.6 filed as part of the Company’s Form 10-Q for the quarter ended September30, 2006 (Commission File No. 1-6370)).
10.17+ Form of Nonqualified Stock Option Agreement for stock option awards under theCompany’s Amended Non-Employee Director Stock Option Plan (incorporated herein byreference to Exhibit 10.8 filed as a part of the Company’s Form 10-Q for the quarterended March 31, 2005 (Commission File No. 1-6370)).
10.18+ Form of Incentive Stock Option Agreement for stock option awards under theCompany’s Amended 1995 Stock Option Plan (incorporated herein by reference toExhibit 10.9 filed as a part of the Company’s Form 10-Q for the quarter ended March31, 2005 (Commission File No. 1-6370)).
10.19+ Form of Nonqualified Stock Option Agreement for stock option awards under theCompany’s Amended 1995 Stock Option Plan (incorporated herein by reference toExhibit 10.10 filed as a part of the Company’s Form 10-Q for the quarter ended March31, 2005 (Commission File No. 1-6370)).
10.20+ Form of Stock Option Agreement for stock option awards under the Company’s 2000Stock Incentive Plan (incorporated herein by reference to Exhibit 10.11 filed as a part ofthe Company’s Form 10-Q for the quarter ended March 31, 2005 (Commission File No.1-6370)).
10.21+ Form of Restricted Stock Agreement for service-based restricted stock awards (one-yearvesting) under the Company’s Amended 2000 Stock Incentive Plan (incorporated hereinby reference to Exhibit 10.12 filed as a part of the Company’s Form 10-Q for thequarter ended March 31, 2005 (Commission File No. 1-6370)).
10.22+ Form of Restricted Stock Agreement for the performance-based restricted stock awardsunder the Company’s Amended 2000 Stock Incentive Plan (incorporated herein byreference to Exhibit 10.13 filed as a part of the Company’s Form 10-Q for the quarterended March 31, 2005 (Commission File No. 1-6370)).
10.23+ Form of Stock Option Agreement for stock option awards under the Company’s 2004Non-Employee Director Stock Option Plan (incorporated herein by reference to Exhibit10.14 filed as a part of the Company’s Form 10-Q for the quarter ended March 31,2005 (Commission File No. 1-6370)).
10.24+ Form of Restricted Stock Agreement for the market-based restricted stock awards underthe Company’s 2004 Stock Incentive Plan (incorporated herein by reference to Exhibit10.15 filed as a part of the Company’s Form 10-Q for the quarter ended March 31,2005 (Commission File No. 1-6370)).
10.25+ Form of Stock Option Agreement for stock option awards under the Company’s 2004Stock Incentive Plan (incorporated herein by reference to Exhibit 10.19 filed as a part ofthe Company’s Form 10-K for the year ended June 30, 2005 (Commission File No. 1-6370)).
90

ExhibitNumber Description
10.26+ Form of Restricted Stock Agreement for the restricted stock awards under theCompany’s 2004 Stock Incentive Plan (incorporated herein by reference to Exhibit10.20 filed as a part of the Company’s Form 10-K for the year ended June 30, 2005(Commission File No. 1-6370)).
10.27+ 2005 Management Bonus Plan (incorporated herein by reference to Exhibit 10.21 filedas a part of the Company’s Form 10-K for the year ended June 30, 2005 (CommissionFile No. 1-6370)).
10.28+ 2005 Performance Bonus Plan (incorporated herein by reference to Exhibit 10.22 filedas a part of the Company’s Form 10-K for the year ended June 30, 2005 (CommissionFile No. 1-6370)).
10.29+* Compensation Arrangements for Named Executive Officers.
10.30+ Board of Directors Compensation Arrangements (incorporated herein by reference toExhibit 10.17 filed as a part of the Company’s Form 10-K for the year ended June 30,2006 (Commission File No. 1-6370)).
10.31+* Elizabeth Arden, Inc. Severance Policy.
10.32+* Form of Restricted Stock Agreement for service-based restricted stock awards (three-year vesting period) under the Company’s Amended 2000 Stock Incentive Plan.
12.1* Ratio of earnings to fixed charges.
21.1* Subsidiaries of the Registrant.
23.1* Consent of PricewaterhouseCoopers LLP.
24.1* Power of Attorney (included as part of signature page).
31.1* Section 302 Certification of Chief Executive Officer.
31.2* Section 302 Certification of Chief Financial Officer.
32* Section 906 Certifications of the Chief Executive Officer and the Chief FinancialOfficer.
+ Management contract or compensatory plan or arrangement.* Filed herewith.
91

SIGNATURES
Pursuant to the requirements of Section 13 or 15(d) of the Securities Exchange Act of 1934, theregistrant has duly caused this report to be signed on its behalf by the undersigned, thereunto dulyauthorized, as of the 7th day of September 2007.
ELIZABETH ARDEN, INC.
By:/s/ E. SCOTT BEATTIE
E. Scott BeattieChairman, President, ChiefExecutive Officer and Director(Principal Executive Officer)
We, the undersigned directors and officers of Elizabeth Arden, Inc., hereby severally constituteE. Scott Beattie and Stephen J. Smith, and each of them singly, our true and lawful attorneys withfull power to them and each of them to sign for us, in our names in the capacities indicated below,any and all amendments to this Annual Report on Form 10-K filed with the Securities and ExchangeCommission.
Pursuant to the requirements of the Securities Exchange Act of 1934, this report has beensigned by the following persons on behalf of the registrant and in the capacities and on the datesindicated.
Signature Title Date
/s/ E. SCOTT BEATTIE
E. Scott BeattieChairman, President, Chief
Executive Officer and Director(Principal Executive Officer)
September 7, 2007
/s/ STEPHEN J. SMITH
Stephen J. SmithExecutive Vice President and
Chief Financial Officer(Principal Financial andAccounting Officer)
September 7, 2007
/s/ FRED BERENS
Fred BerensDirector September 7, 2007
/s/ MAURA J. CLARK
Maura J. ClarkDirector September 7, 2007
/s/ RICHARD C. W. MAURAN
Richard C.W. MauranDirector September 7, 2007
/s/ WILLIAM M. TATHAM
William M. TathamDirector September 7, 2007
/s/ J. W. NEVIL THOMAS
J.W. Nevil ThomasDirector September 7, 2007
/s/ PAUL F. WEST
Paul F. WestDirector September 7, 2007
92

The new fragrance
Catherine Zeta-Jones
©E
lizab
eth
Ard
en, I
nc.
Corporate Offices2400 S.W. 145 AvenueMiramar, Florida 33027954-364-6900
200 Park Avenue SouthNew York, New York 10003212-261-1000
200 First Stamford PlaceStamford, Connecticut 06902203-462-5700
28, chemin de Joinville1216 Cointrin-Geneva41-22-791-8711
Investor RelationsFor investor information, including filings with the Securities and Exchange Commission and other financial literature, please visit our website at www.elizabetharden.com or write to us at:
Elizabeth Arden, Inc. Investor Relations200 Park Avenue SouthNew York, NY 10003
Transfer Agent and RegistrarAmerican Stock Transfer and Trust Company59 Maiden LaneNew York, New York 10038800-937-5449
Independent RegisteredPublic Accounting FirmPricewaterhouseCoopers LLP300 Madison AvenueNew York, New York 10017
Common Stock InformationOur common stock is traded on the NASDAQ Global Select Market under the symbol “RDEN.”
Annual MeetingOur annual meeting of shareholders will be held onNovember 14, 2007 at 10:00 a.m., local time, at our executive offices located at 2400 S.W. 145 Avenue, Miramar, Florida 33027.
CORPORATE AND INVESTOR INFORMATION
E. Scott BeattieChairman, President
and Chief Executive OfficerElizabeth Arden, Inc.
Fred BerensManaging Director - InvestmentsWachovia Securities, Inc.
Maura J. Clark(1,3)
PresidentCommercial and Industrial EnergyDirect Energy Services, LLC
Richard C.W. MauranPrivate Investor
William M. Tatham(1,2)
Chairman and Chief Executive OfficerNexJ Systems, Inc.
J.W. Nevil Thomas(2,3)
President and Chief Executive Officer Nevcorp
Paul WestVice ChairmanElizabeth Arden, Inc.
D i r e c t o r s
Desig
ned
and
prod
uced
by R
R Do
nnell
ey F
inanc
ial, M
iami, F
lorida
(1) Audit Committee Member(2) Compensation Committee Member(3) Nominating and Corporate Governance Committee Member
(1)Chairperson (2)Chairperson
(3)Chairperson
Elizabeth Arden brands featured on our cover.
1st Row: Danielle by Danielle Steel, Nanette Lepore, M by Mariah Carey, Britney Spears believe, Lulu Guinness, Jewel Alfred Sung
2nd Row: Elizabeth Arden Red Door, PREVAGE®, Ceramide Gold UltraRestorative Capsules, Eight HourCream, Elizabeth Arden Intervene,Elizabeth Arden green tea
3rd Row: with Love... Hilary Duff, BadgleyMischka Fleurs de Nuit, Elizabeth Taylor’s White Diamonds, Wings, fantasy Britney Spears, GANT Adventure
4th Row: HUMMER®, GANT Liquid, Halston Z-14, Daytona 500®,Elizabeth Arden 5th Avenue after five, White Shoulders
5th Row: Elizabeth Arden Provocative Woman,Sunflowers, curious Britney Spears,PS®, Giorgio Beverly Hills, Grey Flannel
88724_Cov:Layout 1 9/28/07 3:30 PM Page 2

New York Geneva Miami
www.elizabetharden.com Annual Report 2007
88724_Cov:Layout 1 10/1/07 5:19 PM Page 1