annual report 2015/2016 - west coast district municipality
TRANSCRIPT

Annual Report 2015/2016 1
Annual Report 2015/2016 2
TABLE OF CONTENTS
CHAPTER 1 – MAYOR’S FOREWORD AND EXECUTIVE SUMMARY
COMPONENT A: EXECUTIVE MAYOR’S FOREWORD 6
COMPONENT B: EXECUTIVE SUMMARY – MUNICIPAL MANAGER’S OVERVIEW 7
1.1 VISION AND MISSION OF THE WEST COAST DISTRICT MUNICIPALITY 9
1.2 MUNICIPAL FUNCTIONS, POPULATION AND ENVIRONMENTAL OVERVIEW 10
1.3 SERVICE DELIVERY OVERVIEW 19
1.4 FINANCIAL HEALTH OVERVIEW 20
1.5 ORGANISATIONAL DEVELOPMENT OVERVIEW 22
1.6 AUDITOR-GENERAL REPORT 26
1.7 STATUTORY ANNUAL REPORT PROCESS 27
CHAPTER 2 – GOVERNANCE
COMPONENT A: POLITICAL AND ADMINISTRATIVE GOVERNANCE 28
2.1 POLITICAL GOVERNANCE 30
2.2 ADMINISTRATIVE GOVERNANCE 34
COMPONENT B: INTERGOVERNMENTAL RELATIONS 35
2.3 INTERGOVERNMENTAL RELATIONS 35
COMPONENT C: PUBLIC ACCOUNTABILITY AND PARTICIPATION 36
2.4 PUBLIC MEETINGS 37
2.5 INTEGRATED DEVELOPMENT PLAN PARTICIPATION AND ALIGNMENT 38
COMPONENT D: CORPORATE GOVERNANCE 39
2.6 RISK MANAGEMENT 39
2.7 ANTI-CORRUPTION AND ANTI-FRAUD POLICY 40
2.8 SUPPLY CHAIN MANAGEMENT 41
2.9 BYLAWS 43
2.10 WEBSITE 44
CHAPTER 3 – SERVICE DELIVERY PERFORMANCE (PERFORMANCE REPORT PART I)
COMPONENT A: BASIC SERVICES 45
3.1 WATER PROVISION 46
3.2 FREE BASIC SERVICES AND INDIGENT SUPPORT 56
Annual Report 2015/2016 3
COMPONENT B: AGENCY SERVICES 57
3.3 ROADS 57
COMPONENT C: PLANNING AND DEVELOPMENT 65
3.4 TOWN PLANNING 65
3.5 LOCAL ECONOMIC DEVELOPMENT 68
3.6 TOURISM 70
COMPONENT D: COMMUNITY AND SOCIAL SERVICES 86
3.7 CHILD CARE, AGED CARE AND SOCIAL PROGRAMMES 86
COMPONENT E: ENVIRONMENTAL PROTECTION 91
3.8 POLLUTION CONTROL 91
3.9 BIODIVERSITY, LANDSCAPE AND COASTAL PROTECTION – ENVIRONMENTAL INTEGRITY 98
COMPONENT F: HEALTH 101
3.10 HEALTH INSPECTIONS, FOOD LICENSING AND FOOD INSPECTIONS 101
COMPONENT G: SECURITY AND SAFETY 103
3.11 FIRE SERVICES 103
3.12 DISASTER MANAGEMENT 107
COMPONENT H: RECREATION 117
3.13 GANZEKRAAL HOLIDAY RESORT 117
COMPONENT I: CORPORATE POLICY OFFICES AND OTHER SERVICES 120
3.14 EXECUTIVE AND COUNCIL 120
3.15 ADMINISTRATION 122
3.16 FINANCIAL SERVICES 125
3.17 HUMAN RESOURCE SERVICES 128
3.18 INFORMATION AND COMMUNICATION TECHNOLOGY SERVICES 130
3.19 OFFICE OF THE MUNICIPAL MANAGER 132
3.20 INTERNAL AUDIT 133
CHAPTER 4 – ORGANISATIONAL DEVELOPMENT PERFORMANCE
(PERFORMANCE REPORT PART II)
COMPONENT A: INTRODUCTION TO THE MUNICIPAL PERSONNEL 135
4.1 EMPLOYEE TOTALS, TURNOVER AND VACANCIES 137
4.2 HUMAN RESOURCE POLICIES 138
COMPONENT B: MANAGING THE MUNICIPAL WORKFORCE 139
4.3 INJURIES, SICKNESS AND SUSPENSIONS 139
4.4 PERFORMANCE REWARDS 140
COMPONENT C: CAPACITATING THE MUNICIPAL WORKFORCE 141
4.5 SKILLS DEVELOPMENT AND TRAINING 141
Annual Report 2015/2016 4
CHAPTER 5 – FINANCIAL PERFORMANCE
COMPONENT A: STATEMENTS OF FINANCIAL PERFORMANCE 144
5.1 STATEMENTS OF FINANCIAL PERFORMANCE 144
5.2 GRANTS 146
5.3 ASSET MANAGEMENT 147
5.4 FINANCIAL RATIOS 149
COMPONENT B: SPENDING AGAINST CAPITAL BUDGET BY STANDARD CLASSIFICATION 153
5.5 CAPITAL EXPENDITURE 153
5.6 SOURCES OF FINANCE 155
5.7 CAPITAL SPENDING ON FIVE LARGEST PROJECTS 156
5.8 CASH FLOW 158
5.9 BORROWING AND INVESTMENT 159
5.10 SUPPLY CHAIN MANAGEMENT 162
CHAPTER 6 – AUDITOR-GENERAL AUDIT FINDINGS
COMPONENT A: AUDITOR-GENERAL OPINION OF FINANCIAL STATEMENTS 2014/2015 163
6.1 AUDITOR-GENERAL REPORT 2014/2015 164
COMPONENT B: AUDITOR-GENERAL OPINION OF FINANCIAL STATEMENTS 2015/2016 167
6.2 AUDITOR-GENERAL REPORT 2015/2016 167
GLOSSARY 171
APPENDIX A – COUNCILLORS, COMMITTEE ALLOCATION AND COUNCIL ATTENDANCE 174
APPENDIX B – COMMITTEES AND COMMITTEE PURPOSES 178
APPENDIX C – THIRD-TIER ADMINISTRATIVE STRUCTURE 180
APPENDIX D – FUNCTIONS OF MUNICIPALITY/ENTITY 181
APPENDIX E – WARD REPORTING 183
APPENDIX F – WARD INFORMATION 184
APPENDIX G – RECOMMENDATIONS OF THE AUDIT COMMITTEE 185
APPENDIX H – LONG-TERM CONTRACTS AND PUBLIC-PRIVATE PARTNERSHIPS 186
APPENDIX I –SERVICE PROVIDER PERFORMANCE SCHEDULE 188
APPENDIX J – DISCLOSURE OF FINANCIAL INTERESTS: COUNCILLORS 195
APPENDIX J– DISCLOSURE OF FINANCIAL INTERESTS: SECTION 57 OFFICIALS 197
Annual Report 2015/2016 5
APPENDIX K – REVENUE COLLECTION PERFORMANCE BY VOTE AND BY SOURCE
APPENDIX K (i): REVENUE COLLECTION PERFORMANCE BY VOTE FINANCIAL DISCLOSURE
198
APPENDIX L: CONDITIONAL GRANTS RECEIVED: EXCLUDING MIG 200
APPENDIX M: CAPITAL EXPENDITURE – NEW & UPGRADE/RENEWAL PROGRAMMES 201
APPENDIX M (i): CAPITAL EXPENDITURE - NEW ASSETS PROGRAMME 201
APPENDIX M – (ii): CAPITAL EXPENDITURE – UPGRADE/RENEWAL PROGRAMME 202
APPENDIX N – CAPITAL PROGRAMME BY PROJECT YEAR 1 202
APPENDIX O – CAPITAL PROGRAMME BY PROJECT BY WARD YEAR 1 202
APPENDIX P – SERVICE CONNECTION BACKLOGS AT SCHOOLS AND CLINICS 203
APPENDIX Q – CAPITAL EXPENDITURE: UPGRADE/RENEWAL PROGRAMME 204
APPENDIX R – CAPITAL PROGRAMME BY PROJECT: YEAR 1 204
APPENDIX S – CAPITAL PROGRAMME BY WARD: YEAR 1 204
APPENDIX T – SERVICE CONNECTION BACKLOGS AT SCHOOLS AND CLINICS 205
APPENDIX U – SERVICE BACKLOGS EXPERIENCED BY THE COMMUNITY WHERE ANOTHER SPHERE OF GOVERNMENT IS RESPONSIBLE FOR SERVICE PROVISION
206
APPENDIX V – DECLARATION OF LOANS AND GRANTS MADE BY THE MUNICIPALITY 207
APPENDIX W – DECLARATION OF RETURNS NOT MADE IN DUE TIME UNDER MFMA SECTION 71
208
APPENDIX X – NATIONAL AND PROVINCIAL OUTCOMES FOR LOCAL GOVERNMENT 209
VOLUME I: ANNUAL PERFORMANCE REPORT 2015/2016 210
VOLUME II: ANNUAL FINANCIAL STATEMENTS 2015/2016 231

Annual Report 2015/2016 6
CHAPTER 1 – MAYOR’S FOREWORD AND EXECUTIVE SUMMARY
COMPONENT A: EXECUTIVE MAYOR ’S FOREWORD
During the year under review, we could once again manage to
keep fulfilling our vision and mission and give effect thereto. As
our vision states, A Quality Destination of Choice through an Open
Opportunity Society, we must at all times ensure that we provide
outstanding service delivery on the West Coast to be the
destination of choice. It was a year of many challenges but I can
proudly report that we, politicians and officials, worked hard to
deliver excellent services to people.
Our five strategic objectives namely:
Ensuring environmental integrity for the West Coast
Ensuring good governance and financial viability
Pursuing economic growth and facilitation of job
opportunities
Promoting social well-being of the community
Providing essential bulk services in the region
are the drivers of our IDP and are also in line with the Provincial
Growth and Development Strategy. With the limited funds at our
disposal, we could successfully manage our IDP.
Public participation is of utmost importance to our District and therefore we created an open opportunity for
our clients, the five B-municipalities, to engage with us through our bi-literal meetings. This platform grants us
the opportunity to find out how we can assist the municipalities in our district.
It is our aim to always put our people first and will therefore ensure that the best services are provided to them.
The strength and success of our municipality is built on the commitment and loyalty of all our officials. During
the past year we could again reap the fruit of competency, honesty and transparency. I wish to thank all our
officials and management team for their hard work and dedication. They are a team who I am really proud of.
Thanks to the members of the Executive Mayoral Committee and councillors for their support the past year.
ALD JH CLEOPHAS
EXECUTIVE MAYOR
Annual Report 2015/2016 7
COMPONENT B: EXECUTIVE SUMMARY – MUNICIPAL MANAGER’S OVERVIEW
The Annual Report has been prepared in accordance with Circular
63 of National Treasury.
The Municipality can celebrate its achievement of a sixth
consecutive Unqualified Audit opinion without matters. This
achievement is the culmination of a continued and diligent effort
by the Executive Mayor and Council and the administration to
ensure an efficient, effective and accountable administration. We
need to acknowledge the advisory and supportive role of a
competent Audit Committee, Municipal Public Accounts
Committee (MPAC) and the Office of the Auditor-General. Your
guidance has been invaluable.
The country’s changed economic circumstances have significance
for us all but young and old face particularly severe challenges.
Over the next few years we must answer some difficult questions
about youth unemployment and how we should care for growing
numbers of older residents. The West Coast District’s economy
remains vulnerable to provincial, national and global economic
developments. The proclamation of the Saldanha Bay Industrial
Development Zone can serve as the catalyst for regional economic growth. However, we need to be mindful of
our natural resources, particularly the availability of water. Due to changing weather patterns a decrease in
rainfall is noticeable for the West Coast. Continued efforts by all stakeholders to secure supply is important in
the interest of regional development. In facilitating Regional Economic Development, there were four Catalytic
Business Ventures run during the period, under the auspices of the West Coast Business Development
Programme, including Aquaculture, Waste to energy, Artisanal skills in which 1000 learners were targeted, and
up to 700 were trained, and the Captains of Industry. In addition, another three community enterprises were
provided with technical expertise and support via the local municipality, resulting in at least 20 jobs created and
adding to a grand total of nearly 600 jobs created through the technical support programme of the district
municipality.
West Coast was the first region after the City of Cape Town, to strongly promote responsible tourism and hosted
a Responsible Tourism Conference during September 2015 which was very successful with the attendance of 71
delegates from the community of the West Coast and surrounds. High profile speakers gave presentations on
their areas of expertise.
The main aim of this programme is to make the people of the West Coast aware of the fact that no business can
be sustainable if it is not managed in a responsible way by taking the social, environmental and economic aspects
into account.
In pursuit of the objects of local government as provided for by the Constitution, the year was marked by a
conference for one of our vulnerable groups namely the elderly, which enjoyed the partnership of all of the
social partners in the district. Furthermore, one beneficiary of the Orphans and Vulnerable children (OVC)
programme was granted the opportunity to attend an international youth development camp in Germany,
though our partnership with KIEZ.

Annual Report 2015/2016 8
The total operating budget for the Municipality was R399 899 660 and actual income for the year amounted to
R374 393 830 and expenditure of R360 449 445. The Municipality thus incurred an operating surplus of
R13 944 385. Capital expenditure was 89.91% amounting to R6 439 700. The municipality spent 86.14% of its
conditional grant transfers from National and Provincial Departments. Due to the nature of its functions, the
Municipality is limited in its revenue streams. The municipality’s credit rating remains unchanged at stable and
accounted for a positive cash flow. The administration is mindful of the pressure on the national fiscus and is
implementing austerity measures to ensure the financial sustainability of the institution. It is our task to
effectively manage the municipality’s assets in order to enable services to respond to changing needs and
demands.
I can report that all senior and critical positions are filled and that the incumbents meet the minimum
competency requirements for senior managers.
I am reminded daily of the privilege of working with some of the most enthusiastic and committed team of
councillors and employees. My sincere thanks go to each of these dedicated individuals. Thank you in particular
to the Executive Mayor for his unfailing support and encouragement over the past year.
Henry F Prins
Municipal Manager
Annual Report 2015/2016 9
1.1 VISION AND MISSION OF THE WEST COAST DISTRICT MUNICIPALITY
VISION A quality destination of choice through an open opportunity society. MISSION To ensure outstanding service delivery on the West Coast by pursuing the following objectives: STRATEGIC OBJECTIVES These objectives also correspond with priorities at the global, national and provincial level and align with their strategic intent. As early as 2003, the United Nations Development Programme outlined five central challenges facing sustainable development in South Africa in the South Africa Human Development Report (UNDP: 2003):
The eradication of poverty and extreme income and wealth inequalities.
The provision of access to quality and affordable basic services to all South Africans.
The promotion of environmental sustainability.
A sustained reduction in the unemployment rate.
The attainment of sustainable high growth rates. The fact that the five high-level strategic objectives that have been identified by the West Coast District Municipality are in line with these challenges emphasises that they are still confronting the country and, in particular, the District.
Ensuring environmental integrity for the West Coast.
Ensuring good governance and financial viability.
Pursuing economic growth and facilitation of job opportunities.
Promoting the social wellbeing of the community.
Providing essential bulk services in the region.
CORE VALUES
Integrity – to conduct business with integrity and be accountable to stakeholders.
Transparency – to be transparent and open in our business.
Loyalty – to be honest.
Ethics – to display moral values in our behaviour.
Respect – to treat the public and colleagues with fairness, respect and consideration.
Quality – to be committed to delivering good quality services.
Annual Report 2015/2016 10
1.2 MUNICIPAL FUNCTIONS, POPULATION AND ENVIRONMENTAL OVERVIEW
1.2.1 INTRODUCTION: BACKGROUND DATA
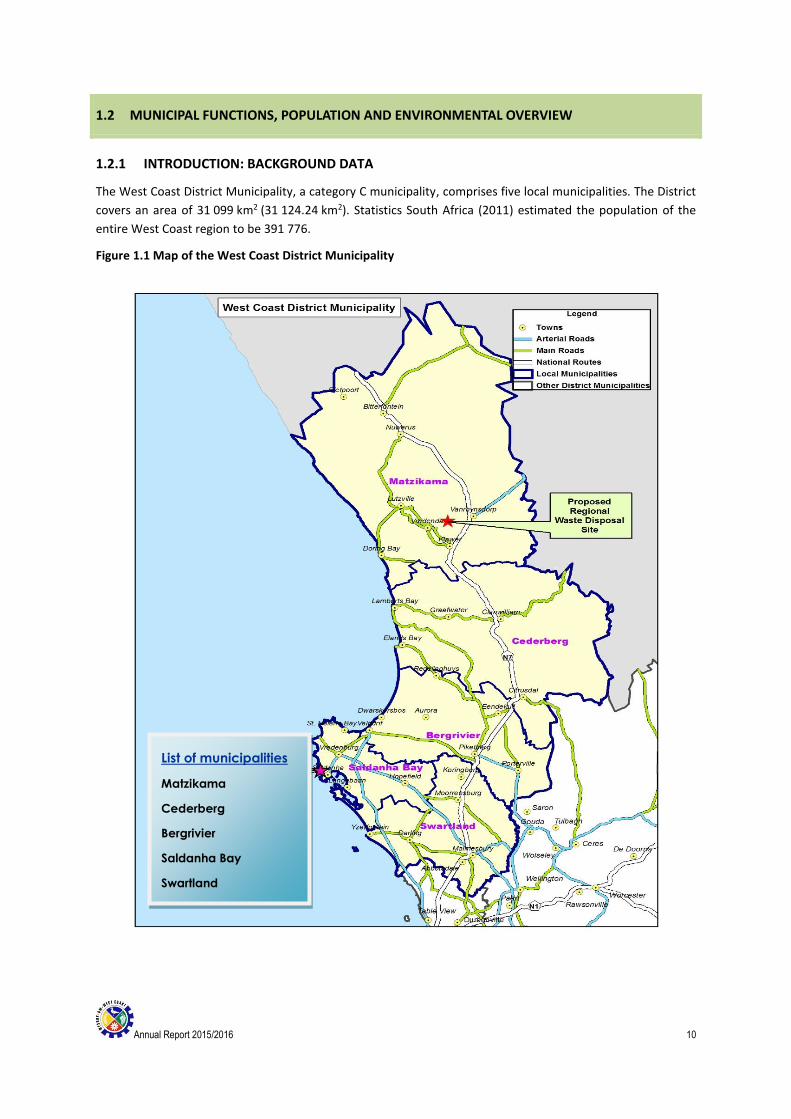
The West Coast District Municipality, a category C municipality, comprises five local municipalities. The District
covers an area of 31 099 km2 (31 124.24 km2). Statistics South Africa (2011) estimated the population of the
entire West Coast region to be 391 776.
Figure 1.1 Map of the West Coast District Municipality
List of municipalities
Matzikama
Cederberg
Bergrivier
Saldanha Bay
Swartland

Annual Report 2015/2016 11
1.2.2 HEADQUARTERS OF THE CATEGORY B MUNICIPALITIES
The West Coast District is a category C municipality, situated in Moorreesburg and comprises the following
category B local municipalities: Matzikama, Cederberg, Bergrivier, Saldanha Bay and Swartland.
The table below sets out the various municipalities that make up the West Coast District Municipality, along with
their provincial codes and principal administrative centres.
Table 1.1: Municipalities within the West Coast District Municipality
Code Local municipality Headquarters
WC013 Bergrivier Municipality Piketberg
WC012 Cederberg Municipality Clanwilliam
WC011 Matzikama Municipality Vredendal
WC014 Saldanha Bay Municipality Vredenburg
WC015 Swartland Municipality Malmesbury

Annual Report 2015/2016 12
Figure 1.2: Western Cape – Socio Economic Profile
Source: Western Cape Provincial Treasury 2015
Annual Report 2015/2016 13
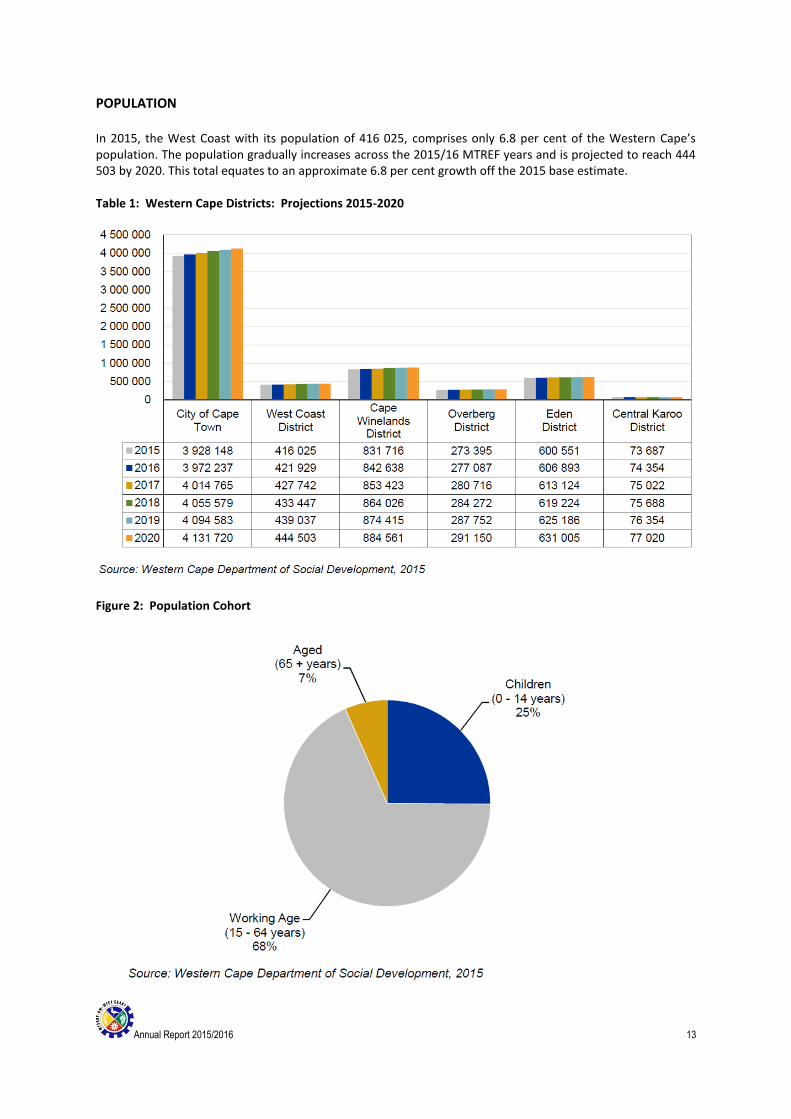
POPULATION In 2015, the West Coast with its population of 416 025, comprises only 6.8 per cent of the Western Cape’s population. The population gradually increases across the 2015/16 MTREF years and is projected to reach 444 503 by 2020. This total equates to an approximate 6.8 per cent growth off the 2015 base estimate. Table 1: Western Cape Districts: Projections 2015-2020
Figure 2: Population Cohort

Annual Report 2015/2016 14
The population age distribution of the West Coast District for 2015 reflects that approximately 68 per cent of the 416 025 inhabitants of the District are currently considered to be within the working age category. Figure 3: West Coast District: Population age distribution 2015 and projection of 2020
HOUSEHOLD ESTIMATES The number of household estimates form a basis of municipal service delivery planning and budget allocations. It is therefore vital that municipalities rely on accurate and credible estimates.. Table 1.2: West Coast District: Household estimates
The total number of household in the West Coast District was estimated to be 116 979 in 2015, a projected increase of 6 463 households since 2011.
Annual Report 2015/2016 15
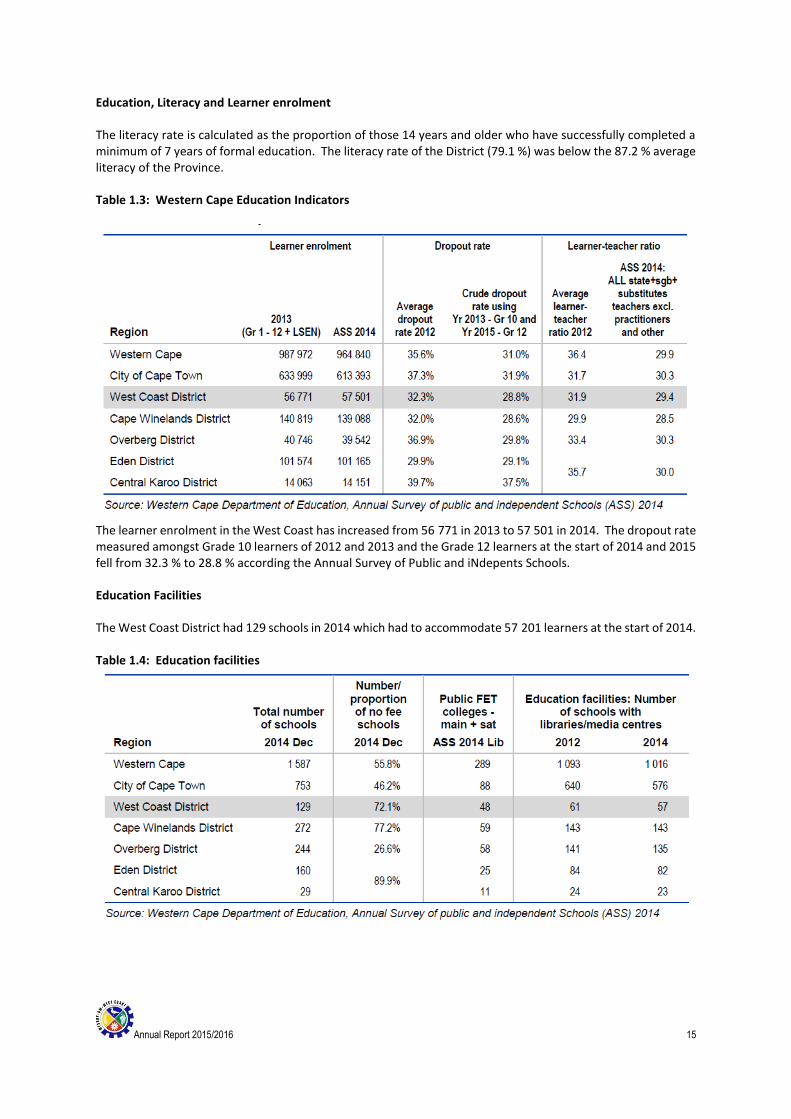
Education, Literacy and Learner enrolment The literacy rate is calculated as the proportion of those 14 years and older who have successfully completed a minimum of 7 years of formal education. The literacy rate of the District (79.1 %) was below the 87.2 % average literacy of the Province. Table 1.3: Western Cape Education Indicators
The learner enrolment in the West Coast has increased from 56 771 in 2013 to 57 501 in 2014. The dropout rate measured amongst Grade 10 learners of 2012 and 2013 and the Grade 12 learners at the start of 2014 and 2015 fell from 32.3 % to 28.8 % according the Annual Survey of Public and iNdepents Schools. Education Facilities The West Coast District had 129 schools in 2014 which had to accommodate 57 201 learners at the start of 2014. Table 1.4: Education facilities

Annual Report 2015/2016 16
Education outcomes: Matric pass rate The West Coast District had an unchanged pass rate of 88.4 % in 2013 and 2014, which ranked the West Coast as the highest ranked District in the Western Cape. Table 1.5: Education outcomes 2013 and 2014
HEALTH CARE SERVICES The West Coast District has a range of primary healthcare facilities which includes 30 fixed clinics, 37 mobile/satellite clinics, 1 community day centre and 7 district hospitals. Table 1.6: West Coast District Primary health care facilities 2015
Within the West Coast District there is a total of 0.68 operation ambulances per 100 000 population.
Annual Report 2015/2016 17
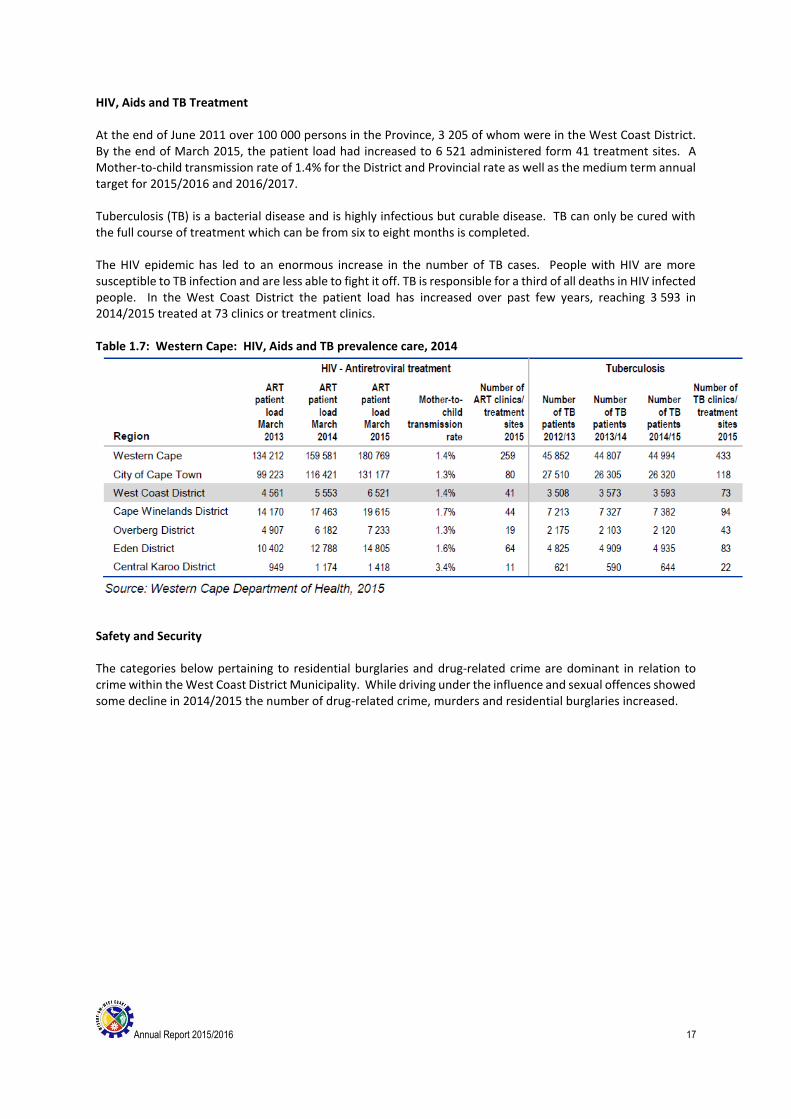
HIV, Aids and TB Treatment At the end of June 2011 over 100 000 persons in the Province, 3 205 of whom were in the West Coast District. By the end of March 2015, the patient load had increased to 6 521 administered form 41 treatment sites. A Mother-to-child transmission rate of 1.4% for the District and Provincial rate as well as the medium term annual target for 2015/2016 and 2016/2017. Tuberculosis (TB) is a bacterial disease and is highly infectious but curable disease. TB can only be cured with the full course of treatment which can be from six to eight months is completed. The HIV epidemic has led to an enormous increase in the number of TB cases. People with HIV are more susceptible to TB infection and are less able to fight it off. TB is responsible for a third of all deaths in HIV infected people. In the West Coast District the patient load has increased over past few years, reaching 3 593 in 2014/2015 treated at 73 clinics or treatment clinics. Table 1.7: Western Cape: HIV, Aids and TB prevalence care, 2014
Safety and Security The categories below pertaining to residential burglaries and drug-related crime are dominant in relation to crime within the West Coast District Municipality. While driving under the influence and sexual offences showed some decline in 2014/2015 the number of drug-related crime, murders and residential burglaries increased.
Annual Report 2015/2016 18
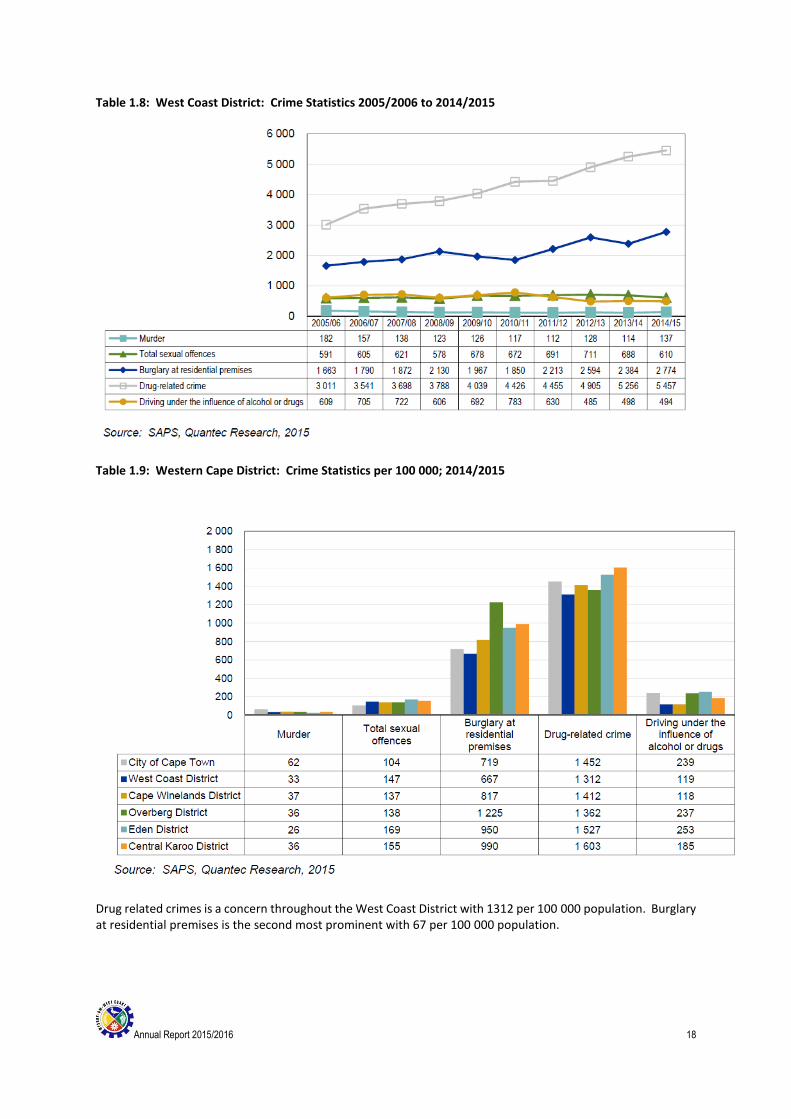
Table 1.8: West Coast District: Crime Statistics 2005/2006 to 2014/2015
Table 1.9: Western Cape District: Crime Statistics per 100 000; 2014/2015
Drug related crimes is a concern throughout the West Coast District with 1312 per 100 000 population. Burglary at residential premises is the second most prominent with 67 per 100 000 population.
Annual Report 2015/2016 19
1.3 SERVICE DELIVERY OVERVIEW
1.3.1 INTRODUCTION
The West Coast District Municipality is responsible for the delivery of potable water in terms of a bulk water
agreement to the local municipalities of Swartland, Saldanha and Bergrivier. The West Coast District Municipality
is also responsible for the maintenance of provincial roads on an agency basis for the Western Cape Department
of Transport and Public Works, and spatial planning on a regional basis. No households are provided with basic
services by the District Municipality.
The Saldanha Sea Water Desalination project that was initiated by the West Coast District Municipality was
transferred to the Saldanha Municipality as water services authority. The region has experienced a very dry
season and 20% water restrictions were introduced.
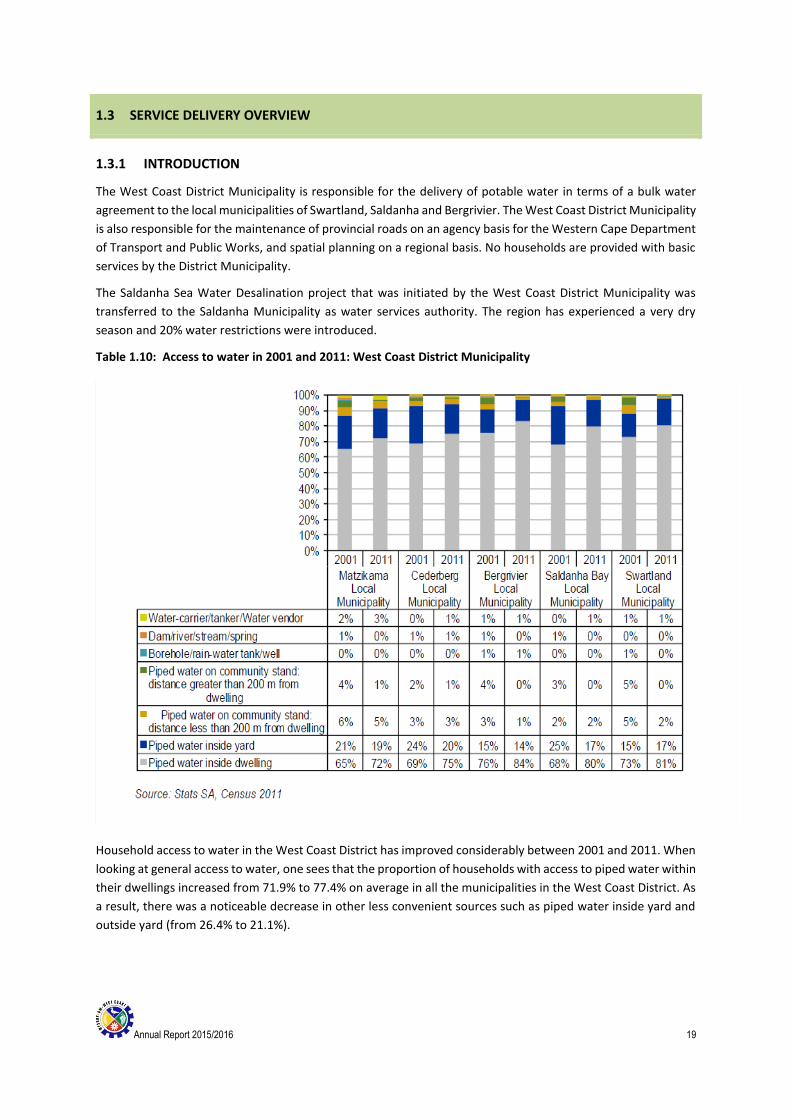
Table 1.10: Access to water in 2001 and 2011: West Coast District Municipality
Household access to water in the West Coast District has improved considerably between 2001 and 2011. When
looking at general access to water, one sees that the proportion of households with access to piped water within
their dwellings increased from 71.9% to 77.4% on average in all the municipalities in the West Coast District. As
a result, there was a noticeable decrease in other less convenient sources such as piped water inside yard and
outside yard (from 26.4% to 21.1%).
Annual Report 2015/2016 20
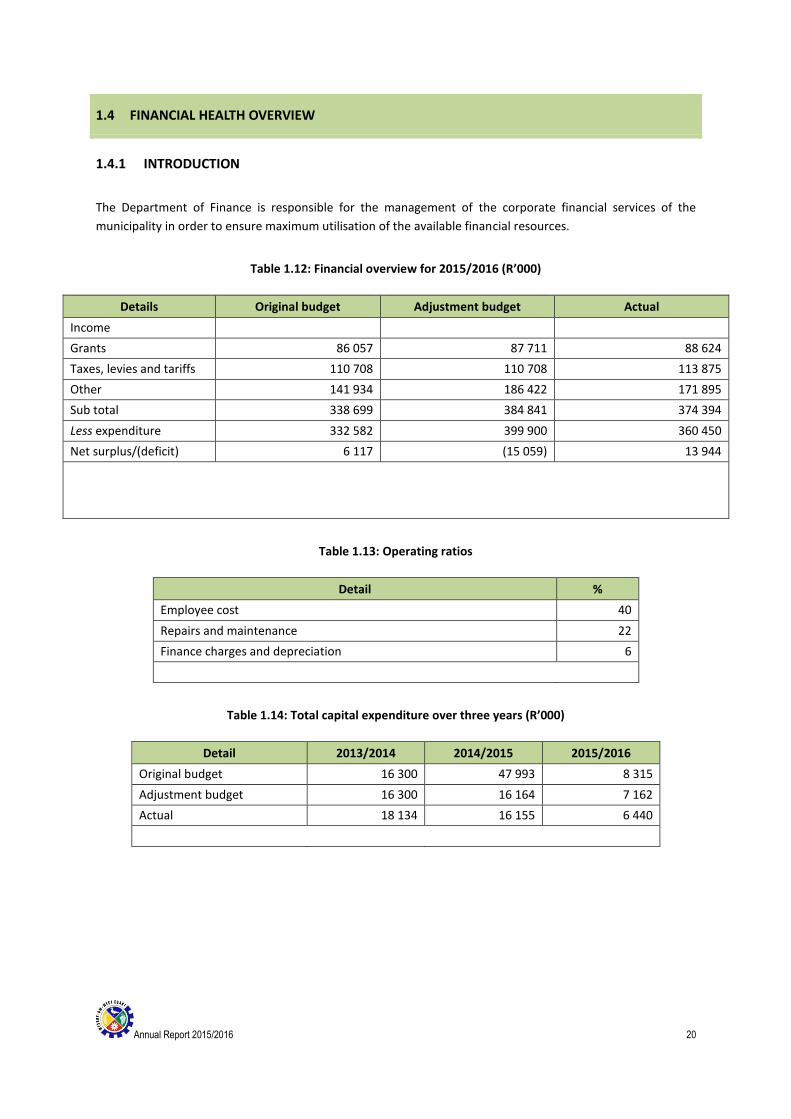
1.4 FINANCIAL HEALTH OVERVIEW
1.4.1 INTRODUCTION
The Department of Finance is responsible for the management of the corporate financial services of the
municipality in order to ensure maximum utilisation of the available financial resources.
Table 1.12: Financial overview for 2015/2016 (R’000)
Details Original budget Adjustment budget Actual
Income
Grants 86 057 87 711 88 624
Taxes, levies and tariffs 110 708 110 708 113 875
Other 141 934 186 422 171 895
Sub total 338 699 384 841 374 394
Less expenditure 332 582 399 900 360 450
Net surplus/(deficit) 6 117 (15 059) 13 944
Table 1.13: Operating ratios
Detail %
Employee cost 40
Repairs and maintenance 22
Finance charges and depreciation 6
Table 1.14: Total capital expenditure over three years (R’000)
Detail 2013/2014 2014/2015 2015/2016
Original budget 16 300 47 993 8 315
Adjustment budget 16 300 16 164 7 162
Actual 18 134 16 155 6 440
Annual Report 2015/2016 21
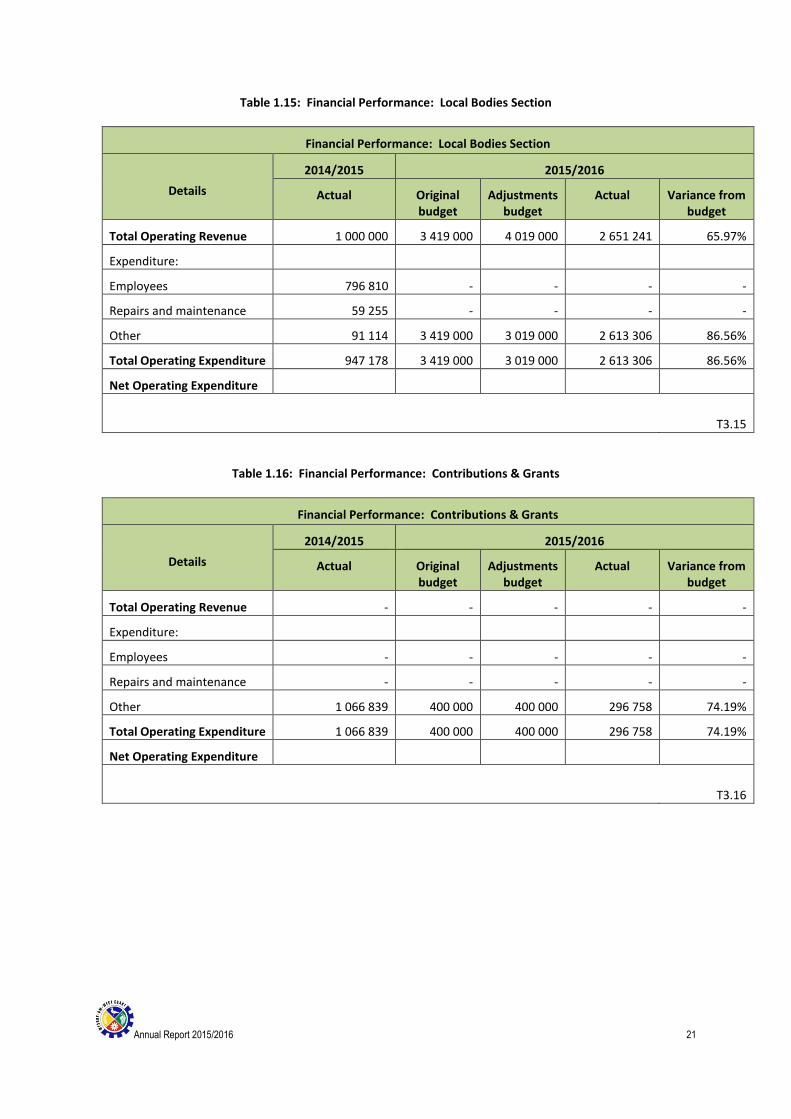
Table 1.15: Financial Performance: Local Bodies Section
Financial Performance: Local Bodies Section
Details
2014/2015 2015/2016
Actual Original budget
Adjustments budget
Actual Variance from budget
Total Operating Revenue 1 000 000 3 419 000 4 019 000 2 651 241 65.97%
Expenditure:
Employees 796 810 - - - -
Repairs and maintenance 59 255 - - - -
Other 91 114 3 419 000 3 019 000 2 613 306 86.56%
Total Operating Expenditure 947 178 3 419 000 3 019 000 2 613 306 86.56%
Net Operating Expenditure
T3.15
Table 1.16: Financial Performance: Contributions & Grants
Financial Performance: Contributions & Grants
Details
2014/2015 2015/2016
Actual Original budget
Adjustments budget
Actual Variance from budget
Total Operating Revenue - - - - -
Expenditure:
Employees - - - - -
Repairs and maintenance - - - - -
Other 1 066 839 400 000 400 000 296 758 74.19%
Total Operating Expenditure 1 066 839 400 000 400 000 296 758 74.19%
Net Operating Expenditure
T3.16
Annual Report 2015/2016 22
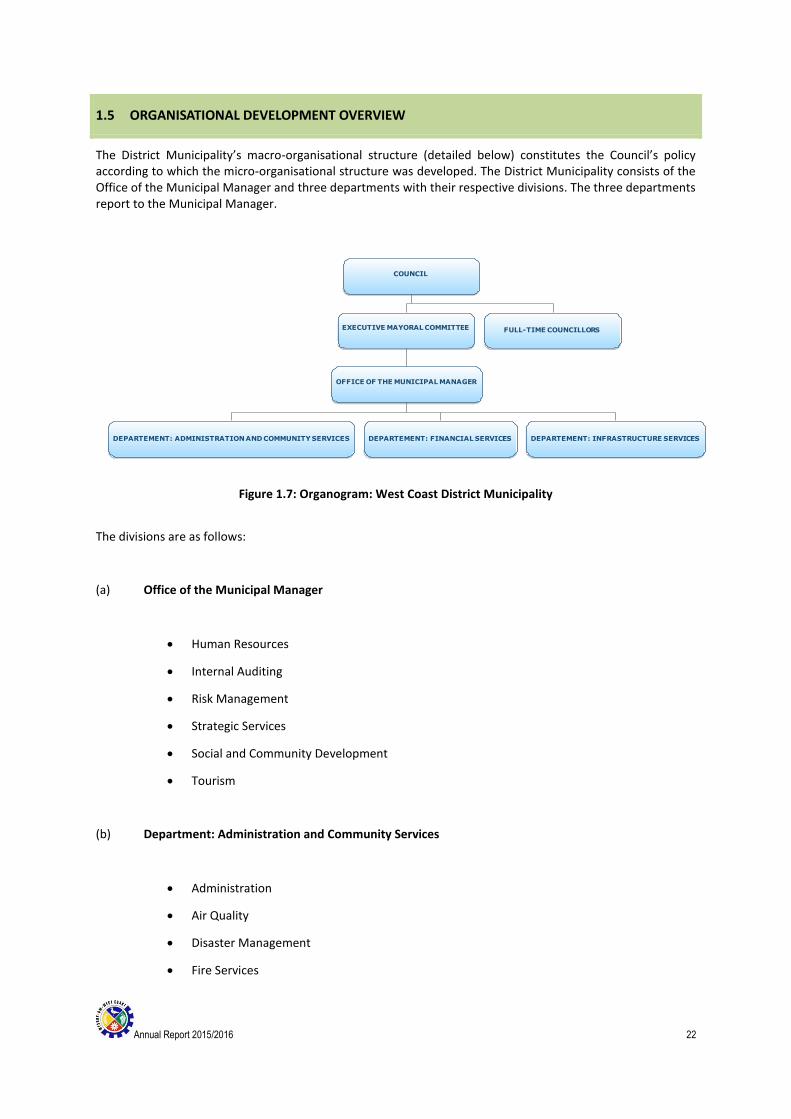
1.5 ORGANISATIONAL DEVELOPMENT OVERVIEW
The District Municipality’s macro-organisational structure (detailed below) constitutes the Council’s policy according to which the micro-organisational structure was developed. The District Municipality consists of the Office of the Municipal Manager and three departments with their respective divisions. The three departments report to the Municipal Manager.
Figure 1.7: Organogram: West Coast District Municipality
The divisions are as follows:
(a) Office of the Municipal Manager
Human Resources
Internal Auditing
Risk Management
Strategic Services
Social and Community Development
Tourism
(b) Department: Administration and Community Services
Administration
Air Quality
Disaster Management
Fire Services
COUNCIL
EXECUTIVE MAYORAL COMMITTEE
OFFICE OF THE MUNICIPAL MANAGER
DEPARTEMENT: ADMINISTRATION AND COMMUNITY SERVICES DEPARTEMENT: FINANCIAL SERVICES DEPARTEMENT: INFRASTRUCTURE SERVICES
FULL-TIME COUNCILLORS

Annual Report 2015/2016 23
Municipal Environmental Health
Municipal Environmental Management
Public Relations
(c) Department: Financial Services
Expenditure
Financial Management and Control
Income
Information Technology
Ganzekraal Resort
Supply Chain Management
(d) Department: Infrastructure Services
Civil Engineering Projects
Mechanical Workshops
Roads Construction and Maintenance
Town and Regional Planning
Water Purification
Water Distribution
The respective departments are responsible for the following functions:
(a) Office of the Municipal Manager
Employment Equity
Employment Assistance Programme
Human Resource Development
Integrated Development Programmes /Local Economic Development
Internal Auditing
Internal Audit Risk Management
Occupational Health and Safety
Annual Report 2015/2016 24
Labour Relations
Organisational and Workstudy
Social and Community Development
Strategic Management
Strategic Programmes
Tourism Marketing and Development
Training and Development
Public Relations
(b) Department: Administration and Community Services
Administrative support services
Air Quality Control
Archive services
Cleaning services
Disaster Management
Environmental Management
Fire and Rescue services
Legal Support services
Municipal Environmental Health
Reprographic services
Secretariat services
(c) Department: Financial Services
Asset control
Budget Control
Expenditure Control
Financial Statements
Information Technology
Resort management
Revenue (Income)
Supply Chain Management

Annual Report 2015/2016 25
(d) Department: Infrastructure Services
Building maintenance
Bulk water supply
Construction of Roads
Maintenance of Roads
Mechanical workshops
Project management
Technical support (electrical, instrumentation, etc.)
Town and Regional Planning
Water purification
Annual Report 2015/2016 26
1.6 AUDITOR-GENERAL REPORT
During the 2012/2013 – 2014/2015 financial years, a clean audit report was obtained.
1.6.1 COMMITMENT TO CLEAN AUDIT TARGET
The West Coast District Municipality achieved a clean audit for the two financial years and strived to sustain the
audit opinion/outcome, which resulted in the clean audit in the following year.
1.6.1.1 POLITICAL COMMITMENT TO SUSTAINING CLEAN AUDIT OPINION
The mayor leads the commitment to improve and sustain good governance.
All councillors are committed and understand their oversight role (training initiatives).
A positive environment has been created for administration to focus on implementation.
1.6.1.2 LEVEL OF PROGRESS MADE FROM PREVIOUS YEAR FINDINGS
Tenders whose, past expenditure was above R10 000 000, were advertised less than 30 days in the previous year. Management has in this year committed to advertise all tenders, for 30 days to ensure that they adhere with the prescribed legislation.
Ownership of all property was tested by means of Title Deed confirmation to ensure that all properties registered in the name of the municipality is accounted for
Future claims for the provision for post- employment medical aid relating to roads function has been raised as a receivable
The documented Disaster Recovery Plan had been physically tested for the period under review.
WCDM is reliant on the expertise of a third party service provider to support and assist in the management of the firewall as WCDM did not have any available skilled resources capable of managing the firewall. Operating procedures was documented and service providers were informed about what were expected from them, to ensure the municipality received value for money.
The latest Information Technology (IT) firmware was implemented to enhance the IT hardware.
b) Milestones achieved
Management has ensured that adequate and sufficiently skilled resources are in place and that
performance is monitored.
Policies and procedures have been established and communicated to all role players to enable and
support understanding and execution of internal control objectives, processes and responsibilities.
Proper record keeping has been implemented in a timely manner to ensure that complete, relevant
and accurate information was accessible and available to support financial and performance reporting.

Annual Report 2015/2016 27
1.7 STATUTORY ANNUAL REPORT PROCESS
Table 1.7.1: Overview of the statutory annual report process
No Activity Timeframe
1 Submit Draft Annual Report 2015/2016 to Management and the Internal
Audit Unit August
2 Submit Draft Annual Report 2015/2016 to the Auditor-General. August
3 Audit/Performance Committee considers Draft Annual Report of Municipality October
4 Municipality submits Draft Annual Report including consolidated annual financial
statements and Annual performance report to Auditor-General. November
5 Auditor-General assesses Draft Annual Report, including consolidated annual financial
statements and performance data. November
6 Municipalities receive and start to address the Auditor-General’s comments. November /
December 7 Mayor tables Annual Report and Audited Financial Statements to Council, complete with
the Auditor-General’s report.
8 Annual Report is made public and representation is invited. December
9 MPAC assesses Annual Report and Oversight Report January
10
In terms of Section 127 of the Local Government: Municipal Finance Management Act,
Act 56 of 2003 the Mayor tables the Annual Report to Council within 7 months after the
end of the financial year January/
February 11 Council adopts Annual Report and Oversight Report
12 Oversight report is made public.
13 Annual Report and Oversight report is submitted to relevant Provincial Departments and
Website
COMMENT ON THE ANNUAL REPORT PROCESS
In terms of Section 127 (2) of the Local Government: Municipal Finance Management Act (MFMA) 56 of 2003,
every municipality must deal with its annual report within seven months after the end of a financial year. A copy
of the Draft Annual Report 2015/2016 will be submitted to senior management and the Auditor-General for
scrutiny. After approval of the Annual report, the annual report will be submitted to the Auditor-General, the
relevant provincial treasury and the provincial department responsible for local government in the province.
Thereafter the Annual report will be published for public comment. The Municipal Public Accounts Committee
(MPAC) will meet to discuss the Annual report, and a recommendation on whether it is approved or rejected
will be drafted in the Oversight report within two months after the approval of the Annual Report. The Oversight
and Annual reports will be tabled to Council for approval after all the comments have been considered.
Annual Report 2015/2016 28
CHAPTER 2 – GOVERNANCE
COMPONENT A: POLITICAL AND ADMINISTRATIVE GOVERNANCE 2.1 POLITICAL GOVERNANCE
2.1.1 OVERVIEW: COMPREHENSIVE POLITICAL OVERSIGHT WITHIN THE MUNICIPALITY AT
PRESENT
As committee members have developed or are able to develop specialised skills, the quality of the work done
by them is potentially of a higher standard than that of larger structures. The composition of committees usually
represents all political parties.
Section 79 committees are nonexecutive committees that may be established for the effective and efficient
performance of any of a municipal council’s functions or the exercise of any of its powers, provided that the
municipal council determines the functions of a committee and delegates duties and powers to it. The council
must appoint the chairperson and may authorise a committee to co-opt advisory members who are not
members of the council within the limits determined by the council. The council may also determine a
committee’s procedures.
Section 80 committees are provided to assist the executive mayor. If a municipal council has an executive mayor,
it may appoint committees of councillors to assist the executive mayor. Such committees may not in number
exceed the number of members of the executive committee or mayoral committee. The executive mayor
appoints a chairperson for each committee from the mayoral committee and may delegate any powers and
duties of the executive mayor to the committee. Section 80 committees must report to the executive mayor in
accordance with the directions of the executive committee or executive mayor.
2.1.2 AUDIT COMMITTEE
Section 166(1) of the MFMA states that “each municipality or municipal entity must have an Audit Committee”,
and Section 166(4)(a) of the MFMA states that “an Audit Committee must consist of at least three persons with
appropriate experience”. The Audit Committee is an independent advisory body and presently consists of five
members who are appointed by Council. With reference to the West Coast District Municipality Audit Charter,
the Audit Committee assists Council by providing inputs to ensure effective systems that complement service
delivery, the safeguarding of municipal assets, the maintenance of financial records, risk management,
corporate governance and an effective internal control system. The Audit Committee also investigates matters
within the scope of the committee’s duties if referred to the committee by Council or the Municipal Manager.
Furthermore, the Audit Committee provides independent specialist advice on financial performance, efficiency
and effectiveness, performance management and compliance with legislation.
2.1.3 MUNICIPAL PUBLIC ACCOUNTS COMMITTEE
The purpose of the Municipal Public Accounts Committee (MPAC) is to serve as an oversight committee that
exercises oversight over the executive obligations of Council. The MPAC will assist Council to hold the executive
to account and to ensure the efficient and effective use of municipal resources. By so doing, the MPAC will help
to increase Council and public awareness of the financial and performance issues of the Municipality.
The MPAC was established in terms of Section 79 of the Local Government: Municipal Structures Act 117 of
1998 and performs an oversight function on behalf of Council and is not a duplication of other committees of
Council, such as the Audit Committee.

Annual Report 2015/2016 29
The MPAC may engage directly with the public and consider public comments when received and will be entitled
to request documents or evidence from the accounting officer. The MPAC will report to Council on the activities
of the committee. The report must include details of the committee’s activities during the preceding and current
financial years, the number of meetings held, the membership of the committee and key resolutions taken in
the annual report.

Annual Report 2015/2016 30
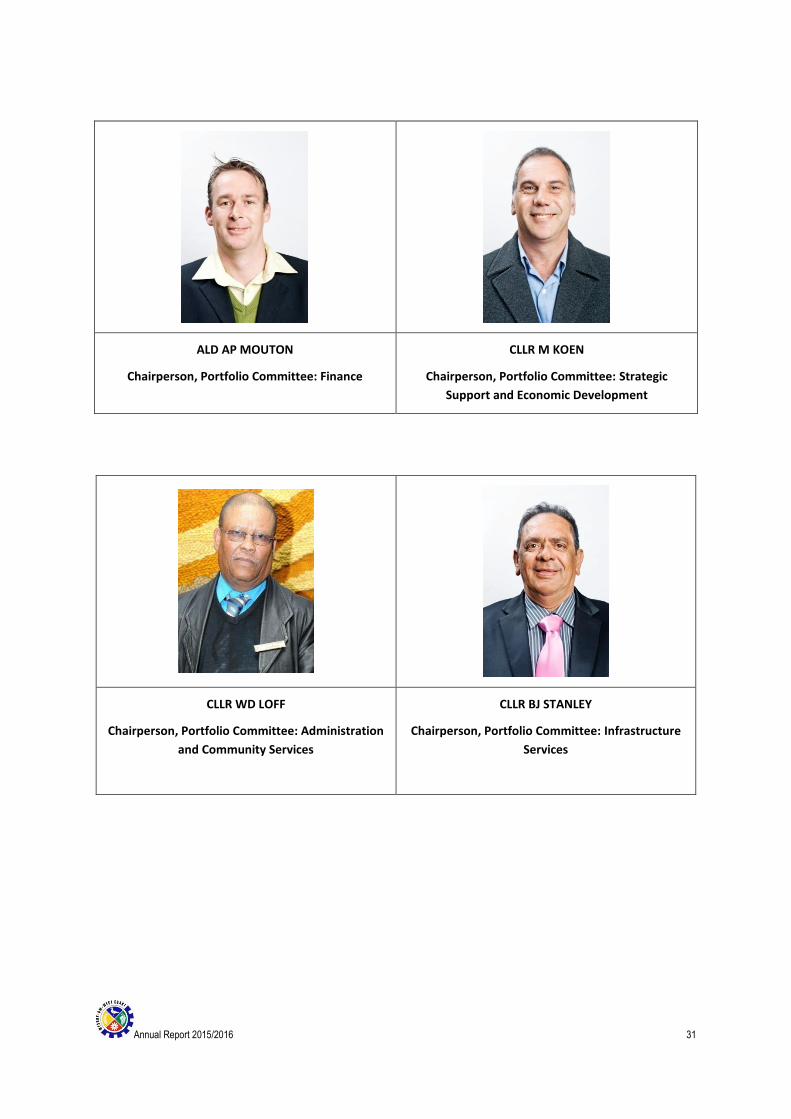
2.1.5 MEMBERS OF THE EXECUTIVE MAYORAL COMMITTEE
EXECUTIVE MAYOR
ALD JH CLEOPHAS
SPEAKER
CLLR A KRUGER
EXECUTIVE DEPUTY MAYOR
ALD JJ JOSEPHUS
Annual Report 2015/2016 31
ALD AP MOUTON
Chairperson, Portfolio Committee: Finance
CLLR M KOEN
Chairperson, Portfolio Committee: Strategic
Support and Economic Development
CLLR WD LOFF
Chairperson, Portfolio Committee: Administration
and Community Services
CLLR BJ STANLEY
Chairperson, Portfolio Committee: Infrastructure
Services
Annual Report 2015/2016 32
2.1.6 FUNCTION: EXECUTIVE AUTHORITY AND COUNCIL
The West Coast District Municipality has 24 councillors of which 40% have been directly elected (proportional).
Of the remaining representation, 60% are members who have been elected from the local municipalities within
the District Municipality’s area of jurisdiction.
The 60% are representatives from the following municipalities:
Swartland Municipality Four representatives
Cederberg Municipality Two representatives
Bergrivier Municipality Two representatives
Saldanha Bay Municipality Four representatives
Matzikama Municipality Two representatives
The Mayoral Committee consists of the chairs of the respective portfolio committees that have been established
in terms of Section 80 of the Municipal Structures Act.
Mayor Ald JH Cleophas
Deputy Mayor Ald JJ Josephus
Speaker Cllr A Kruger
The Section 80 committees advise and make recommendations to the Executive Mayoral Committee and
Council.
The following Section 80 committees have been established and the chairs of these committees are as follows:
Portfolio Committee: Strategic Support and
Economic Development
Cllr M Koen
Portfolio Committee: Finance Ald AP Mouton
Portfolio Committee: Administration and
Community Services
Cllr WD Loff
Portfolio Committee: Infrastructure Services Cllr B Stanley
Members of Council are as follows:
Speaker Cllr A Kruger DA Saldanha Bay Municipality
Executive Mayor Ald JH Cleophas DA Swartland Municipality
Executive Mayoral Committee Ald JJ Josephus DA West Coast District Municipality
Executive Mayoral Committee Cllr M Koen DA West Coast District Municipality
Executive Mayoral Committee Ald AP Mouton DA West Coast District Municipality
Executive Mayoral Committee Cllr WD Loff DA West Coast District Municipality
Executive Mayoral Committee Cllr BJ Stanley DA Swartland Municipality
Annual Report 2015/2016 33
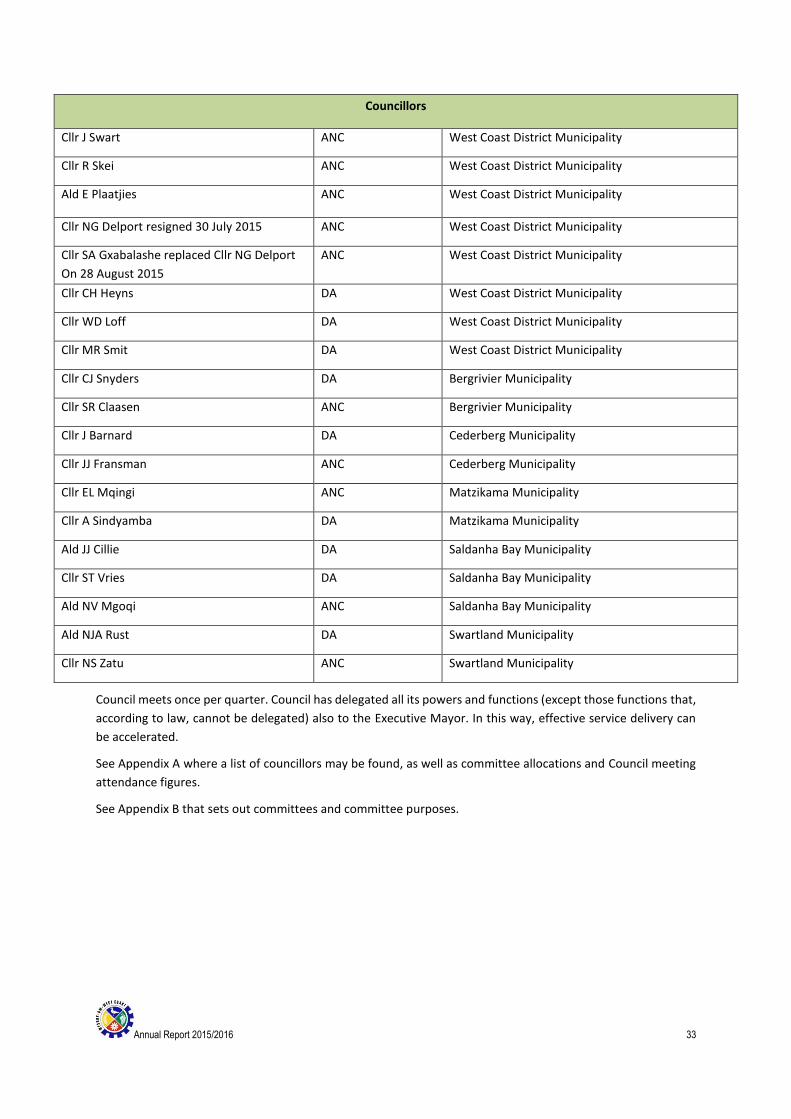
Councillors
Cllr J Swart ANC West Coast District Municipality
Cllr R Skei ANC West Coast District Municipality
Ald E Plaatjies ANC West Coast District Municipality
Cllr NG Delport resigned 30 July 2015 ANC West Coast District Municipality
Cllr SA Gxabalashe replaced Cllr NG Delport
On 28 August 2015
ANC West Coast District Municipality
Cllr CH Heyns DA West Coast District Municipality
Cllr WD Loff DA West Coast District Municipality
Cllr MR Smit DA West Coast District Municipality
Cllr CJ Snyders DA Bergrivier Municipality
Cllr SR Claasen ANC Bergrivier Municipality
Cllr J Barnard DA Cederberg Municipality
Cllr JJ Fransman ANC Cederberg Municipality
Cllr EL Mqingi ANC Matzikama Municipality
Cllr A Sindyamba DA Matzikama Municipality
Ald JJ Cillie DA Saldanha Bay Municipality
Cllr ST Vries DA Saldanha Bay Municipality
Ald NV Mgoqi ANC Saldanha Bay Municipality
Ald NJA Rust DA Swartland Municipality
Cllr NS Zatu ANC Swartland Municipality
Council meets once per quarter. Council has delegated all its powers and functions (except those functions that,
according to law, cannot be delegated) also to the Executive Mayor. In this way, effective service delivery can
be accelerated.
See Appendix A where a list of councillors may be found, as well as committee allocations and Council meeting
attendance figures.
See Appendix B that sets out committees and committee purposes.
Annual Report 2015/2016 34
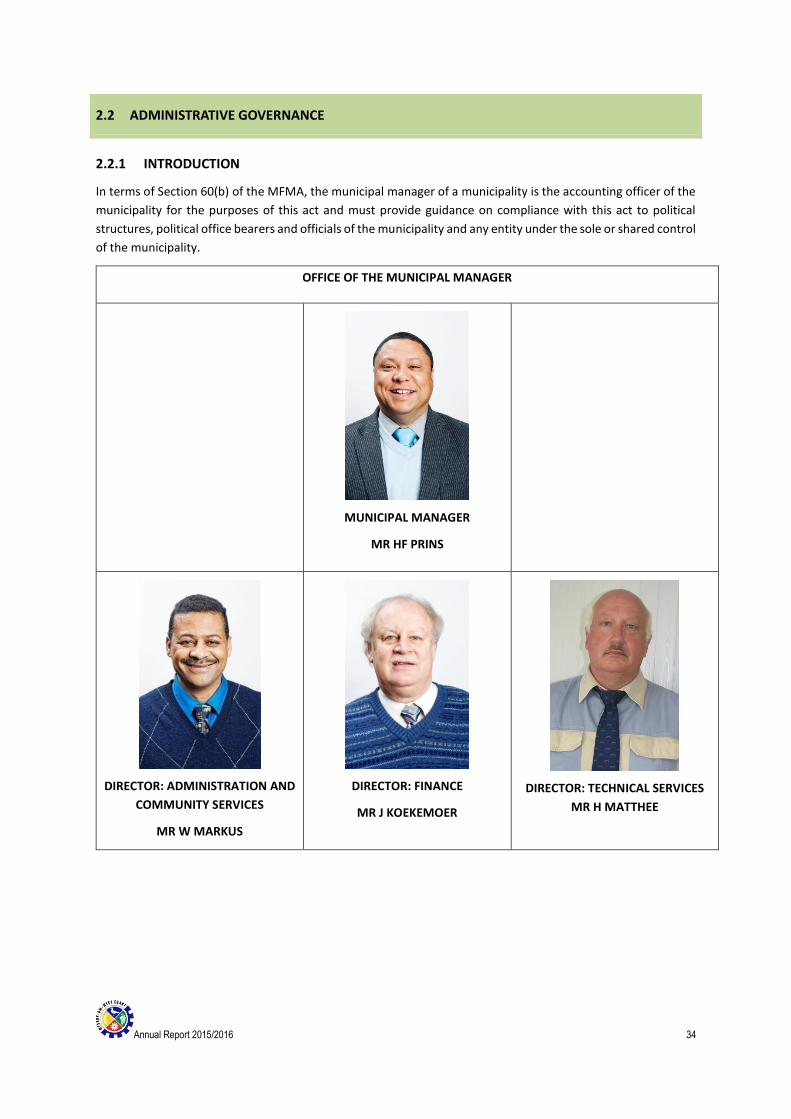
2.2 ADMINISTRATIVE GOVERNANCE
2.2.1 INTRODUCTION
In terms of Section 60(b) of the MFMA, the municipal manager of a municipality is the accounting officer of the
municipality for the purposes of this act and must provide guidance on compliance with this act to political
structures, political office bearers and officials of the municipality and any entity under the sole or shared control
of the municipality.
OFFICE OF THE MUNICIPAL MANAGER
MUNICIPAL MANAGER
MR HF PRINS
DIRECTOR: ADMINISTRATION AND
COMMUNITY SERVICES
MR W MARKUS
DIRECTOR: FINANCE
MR J KOEKEMOER
DIRECTOR: TECHNICAL SERVICES
MR H MATTHEE

Annual Report 2015/2016 35
COMPONENT B: INTERGOVERNMENTAL RELATIONS
2.3 INTERGOVERNMENTAL RELATIONS
2.3.1 NATIONAL INTERGOVERNMENTAL STRUCTURES
Various South African Local Government Association (SALGA) national working groups
National Municipal Managers Forum
2.3.2 PROVINCIAL INTERGOVERNMENTAL STRUCTURES
Premier’s Co-ordinating Forum
MinMay
MinMay Technical Committee
Western Cape Municipal Manager’s Forum
Chief Financial Officer’s Forum
Provincial IDP Managers’ Forum
LED Managers’ Forum
Various SALGA provincial working groups
Provincial Public Participation Forum
Western Cape IDP Innovation Forum
Western Cape Chief Audit Executive Forum
Municipal Accounting Working Committee
Municipal Accounting Forum
Western Cape Supply Chain Management Forum
Others
2.3.3 RELATIONSHIPS WITH MUNICIPAL ENTITIES
No municipal entities
2.3.4 DISTRICT INTERGOVERNMENTAL STRUCTURES
District Co-ordinating Forum and Technical Committee (Municipal Managers’ Forum)
IDP Co-ordinating Committee
Multi-sectoral Forum
District Safety Forum
Disaster Management Advisory Forum
IDP LED Managers’ Forum incorporating public participation
District Internal Auditors’ Forum
District Supply Chain Management Forum
Others
Regular bilateral engagements between district and local municipalities and with the respective provincial and
national sector departments are held.

Annual Report 2015/2016 36
COMPONENT C: PUBLIC ACCOUNTABILITY AND PARTICIPATION
OVERVIEW: PUBLIC ACCOUNTABILITY AND PARTICIPATION
Section 15(b) of the Local Government: Municipal Systems Act 32 of 2000 requires a municipality to establish
and organise its administration to facilitate and cultivate a culture of accountability among its staff. Section 16(i)
states that a municipality must develop a system of municipal governance that complements formal
representative governance with a system of participatory governance. Section 18(i)(d) requires a municipality
to supply its community with information concerning municipal governance, management and development.
COMMENT ON PUBLIC ACCOUNTABILITY
Public participation, public accountability and citizen engagement are achieved through a structured process of
targeted public stakeholder engagement. This process is driven in conjunction with all the local municipalities in
the District, using a shared platform of public engagement at the municipal level, and is further enhanced
through direct engagements with the local municipalities in the District. In this regard, priority issues emanating
from the local municipal areas are incorporated into the strategic planning of the District Municipality and,
where applicable, referred to the relevant sector department.
In addition, the West Coast District Municipality promotes and supports district-wide public participation and
the mobilisation of civil society through initiatives aimed at strengthening the functioning of ward structures
throughout the region.
Annual Report 2015/2016 37
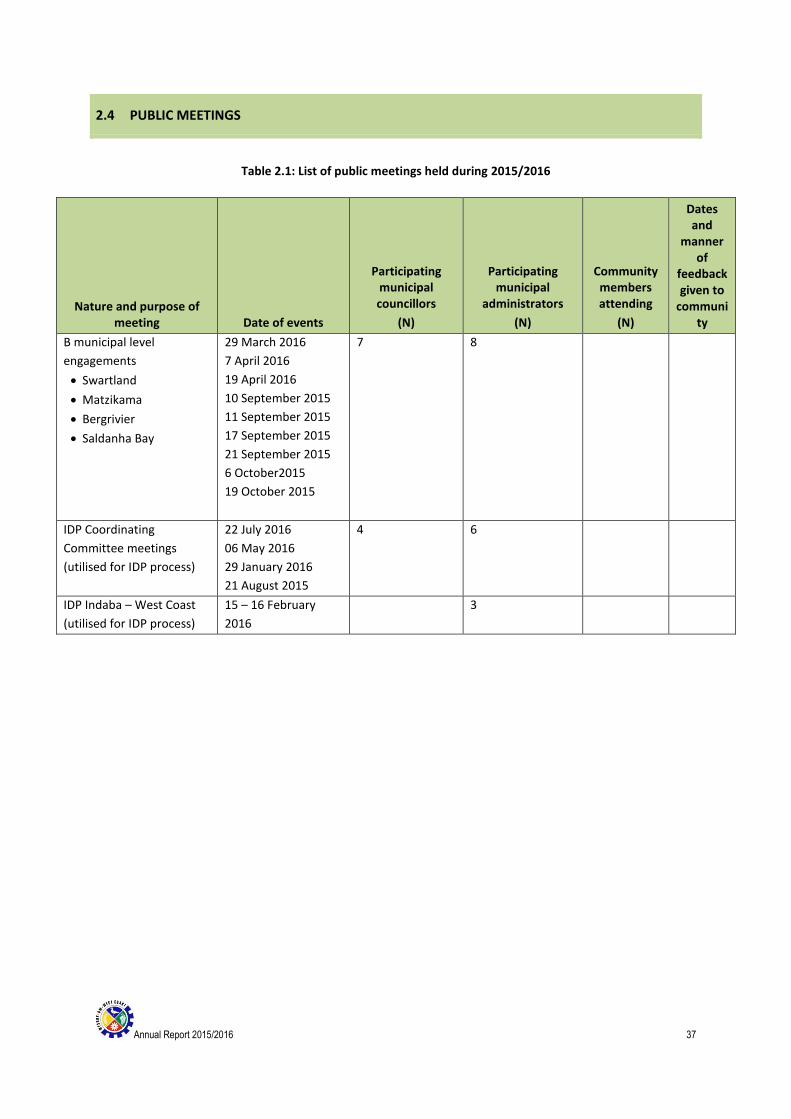
2.4 PUBLIC MEETINGS
Table 2.1: List of public meetings held during 2015/2016
Nature and purpose of meeting Date of events
Participating municipal councillors
(N)
Participating municipal
administrators
(N)
Community members attending
(N)
Dates and
manner of
feedback given to
community
B municipal level
engagements
Swartland
Matzikama
Bergrivier
Saldanha Bay
29 March 2016
7 April 2016
19 April 2016
10 September 2015
11 September 2015
17 September 2015
21 September 2015
6 October2015
19 October 2015
7 8
IDP Coordinating
Committee meetings
(utilised for IDP process)
22 July 2016
06 May 2016
29 January 2016
21 August 2015
4 6
IDP Indaba – West Coast
(utilised for IDP process)
15 – 16 February
2016
3
Annual Report 2015/2016 38
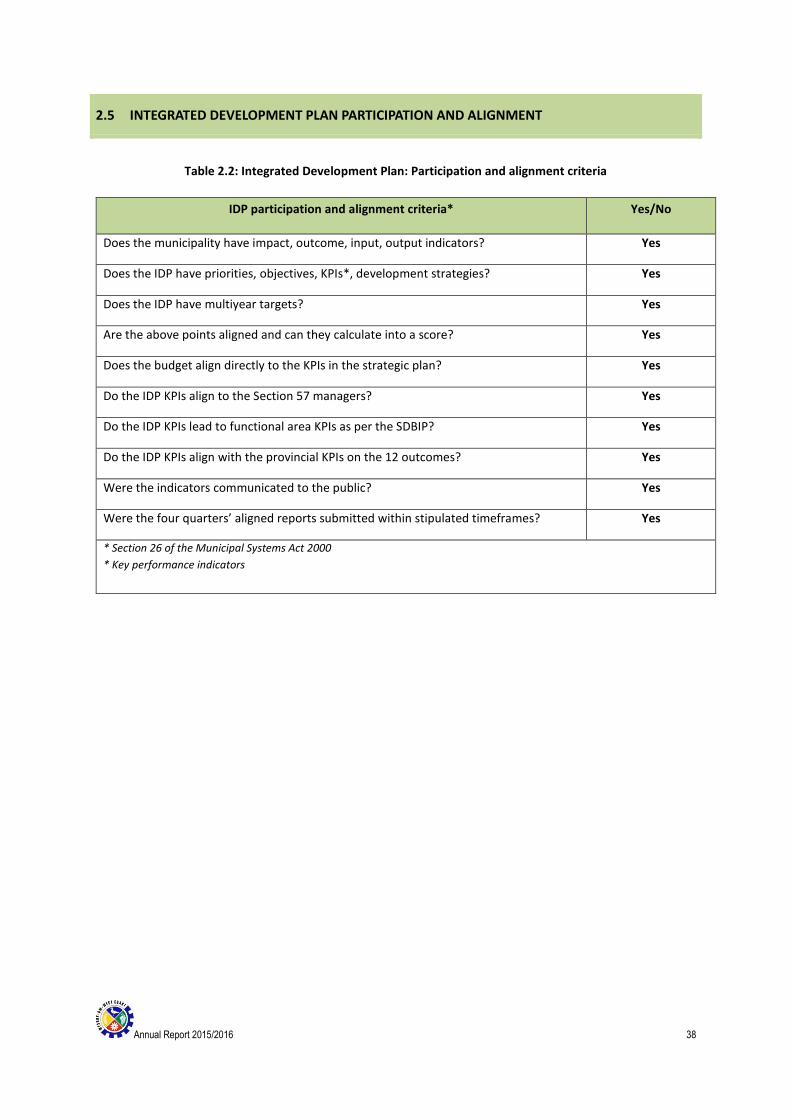
2.5 INTEGRATED DEVELOPMENT PLAN PARTICIPATION AND ALIGNMENT
Table 2.2: Integrated Development Plan: Participation and alignment criteria
IDP participation and alignment criteria* Yes/No
Does the municipality have impact, outcome, input, output indicators? Yes
Does the IDP have priorities, objectives, KPIs*, development strategies? Yes
Does the IDP have multiyear targets? Yes
Are the above points aligned and can they calculate into a score? Yes
Does the budget align directly to the KPIs in the strategic plan? Yes
Do the IDP KPIs align to the Section 57 managers? Yes
Do the IDP KPIs lead to functional area KPIs as per the SDBIP? Yes
Do the IDP KPIs align with the provincial KPIs on the 12 outcomes? Yes
Were the indicators communicated to the public? Yes
Were the four quarters’ aligned reports submitted within stipulated timeframes? Yes
* Section 26 of the Municipal Systems Act 2000
* Key performance indicators
Annual Report 2015/2016 39
COMPONENT D: CORPORATE GOVERNANCE
2.6 RISK MANAGEMENT
Risk management is one of the core responsibilities of management, according to Section 62 of the Municipal
Finance Management Act (MFMA) and is an integral part of the internal processes of a municipality. It is a
systematic and formalised process to identify, assess, manage, monitor and report risks on a continuous basis
before such risks can impact negatively on the service delivery capacity of the West Coast District Municipality.
When properly executed, risk management provides reasonable assurance that the institution will be successful
in achieving its goals and objectives.
A risk assessment is conducted on a quarterly basis by Risk Management Shared Services. This department
facilitates the process of identifying and assessing risk per directorate. The aim is to determine the magnitude
of risk exposure by assessing the likelihood of the risk materialising and the impact that it would have on the
achievement of objectives. The identified risks are then prioritised – which enables management to focus more
time, effort and resources on higher risk areas. To mitigate the risks with which the Municipal District is
confronted, management implements control activities by establishing policies and appropriate procedures such
as approvals, authorisations, segregation of duties, reconciliations and physical safeguards.
In addition, the Risk Management Shared Services reports on a quarterly basis to the Risk Management
Committee on work performed and other operating measures that are of interest to the Committee.
The Risk Management Shared Services unit provided risk services to the 4 local municipalities (Swartland,
Bergrivier, cederberg and Matzikama) in the past year over and above the work that was done at the district.
On 5 May 2016 a decision was taken to stop the Risk management shared Services when the provincial funding
for the project comes to an end. This function will be absorbed into the current municipal structure in the new
financial year
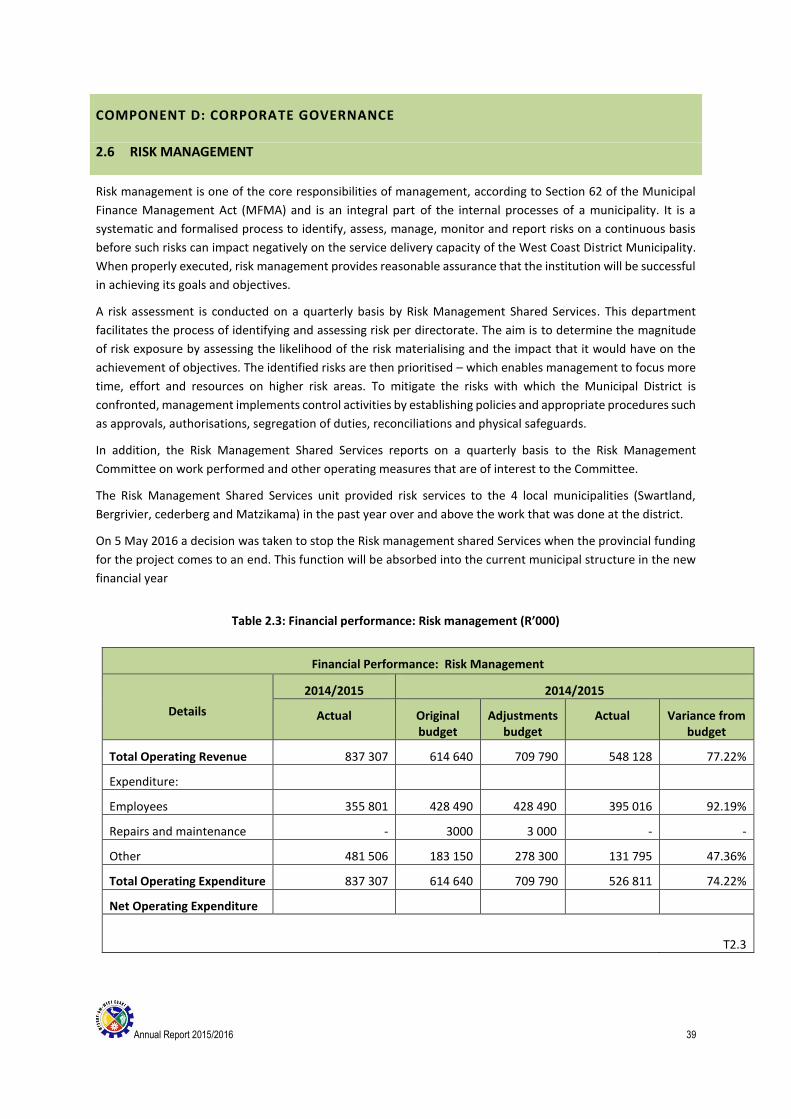
Table 2.3: Financial performance: Risk management (R’000)
Financial Performance: Risk Management
Details
2014/2015 2014/2015
Actual Original budget
Adjustments budget
Actual Variance from budget
Total Operating Revenue 837 307 614 640 709 790 548 128 77.22%
Expenditure:
Employees 355 801 428 490 428 490 395 016 92.19%
Repairs and maintenance - 3000 3 000 - -
Other 481 506 183 150 278 300 131 795 47.36%
Total Operating Expenditure 837 307 614 640 709 790 526 811 74.22%
Net Operating Expenditure
T2.3

Annual Report 2015/2016 40
2.7 ANTI-CORRUPTION AND ANTI-FRAUD POLICY
2.7.1 ANTI-CORRUPTION AND ANTI-FRAUD STRATEGY
The West Coast District Municipality has adopted a zero tolerance stance when it comes to fraud and corruption,
and this is further enhanced by our fraud prevention policy.
Our officials are empowered to report any suspected fraud or corruption anonymously on our national whistle-
blowing hotline, 0800 701 701.
For the year under review, we are delighted to report that no instances of suspected fraud or corruption took
place.
The West Coast District Municipality has developed the following policy documents to prevent fraud, corruption
and theft:
Fraud Prevention Plan
Whistle-blowing Policy
The documents provide assurance that the West Coast District Municipality has a zero tolerance policy regarding
fraudulent and corrupt activities. This has led to a fraud- and corruption-free financial year for the West Coast
District Municipality.

Annual Report 2015/2016 41
2.8 SUPPLY CHAIN MANAGEMENT
Refer to Appendix G for more information: West Coast District Municipalty adopted and approved her SCM Policy on 14 December 2005. An assessment of the Municipality’s SCM policy was conducted by the Provincial Treasuyr in November 2010. Recommendations were provided to the municipality in order to align the policy to the regulatory framework. The neccessary amendments were made and the the amended policy was submitted to Provincial Treasury for scrutiny and to determine its consistency with the Supply Chain Management legislation. The assessment of the amended SCM policy by Provincial Treasury was very satisfactory with minor recommendations. The reviewed SCM Policy was adopted by Council on 30 November 2011. Regulation 3 of the Supply Chain Management Policy of the West Coast District Municipality determines that each Municipality must annually review and if necessary, amend it Supply Chain Management Policy. The Supply Chain Management Policy was again reviewed and amended with the newest Supply Chain Management prescripts and practices. The new reviewed SCM Policy was adopted by Council on 5 December 2012. The SCM Policy of 5 December 2012 was submitted to Provincial Treasury for scrutiny and to determine its consistency with the Supply Chain Management legislation as contained in the MFMA and the SCM Regulations as well as alignment to the SCM Model Policy and SCM guidelines. Provincial Treasury responded on 25 October 2013 and found:
a) The Municipality’s SCM Policy is of sound quality and closely to the Model Policy, b) Paragraph and sub paragraph numbers are correctly numbered and are all in proper order, c) The policy document is free from spelling and grammatical errors.
Provincial Treasury’s minor findings on the assessed SCM Policy was refined and considered in the next amendment of the Supply Chain Management Policy to be tabled at the next Council meeting. The Supply Chain Management Policy was again amended with the newest Supply Chain Management prescripts and practices. The new reviewed SCM Policy was adopted by Council on 27 August 2014. The Supply Chain Management Policy must be annually reviewed and amended as SCM prescripts and Legislation changes. The Supply Chain Management Policy was again amended with the newest Supply Chain Management prescripts and practices. The new reviewed SCM Policy was adopted by Council on 25 May 2016. The West Coast District Municipality has established a Supply Chain Management Unit in line with the SCM Policy The SCM Manager reports directly to the Chief Financial Officer.
Annual Report 2015/2016 42
The calling of tenders is an integral part of SCM, as legislation compels public institutions to follow prescribed processes. A thorough knowledge of the different phases of SCM and accompanying procedures is therefore necessary to ensure that officials procure goods and services timeleuosly and according to the requested requirements. The Accounting Officer has approved the various Bid Committees which is fully operational. The Municipality ensures that the SCM processes is fair, transparent, equitable, competitive and cost effective.
Annual Report 2015/2016 43
2.9 BYLAWS
The Municipal Systems Act Section 11(3) (m) provides municipal councils with the legislative authority to pass
and implement bylaws for the betterment of the community within the terms of the legislation.
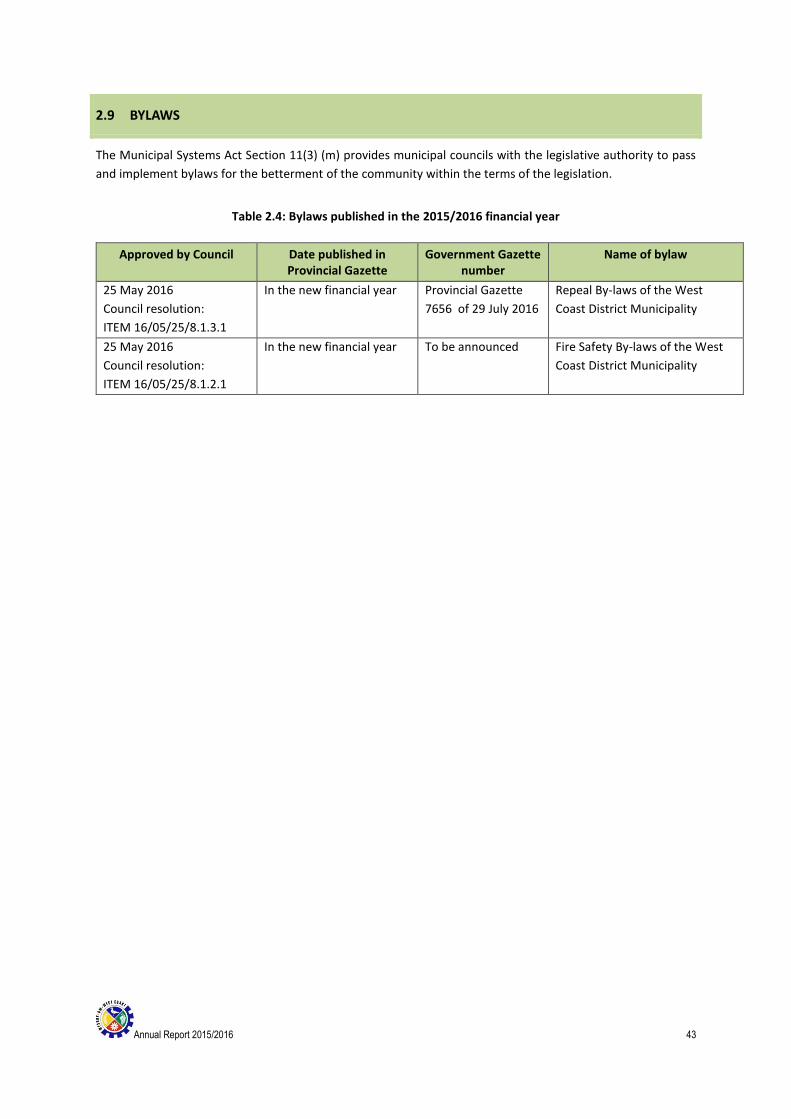
Table 2.4: Bylaws published in the 2015/2016 financial year
Approved by Council Date published in Provincial Gazette
Government Gazette number
Name of bylaw
25 May 2016
Council resolution:
ITEM 16/05/25/8.1.3.1
In the new financial year Provincial Gazette
7656 of 29 July 2016
Repeal By-laws of the West
Coast District Municipality
25 May 2016
Council resolution:
ITEM 16/05/25/8.1.2.1
In the new financial year To be announced
Fire Safety By-laws of the West
Coast District Municipality
Annual Report 2015/2016 44
2.10 WEBSITE
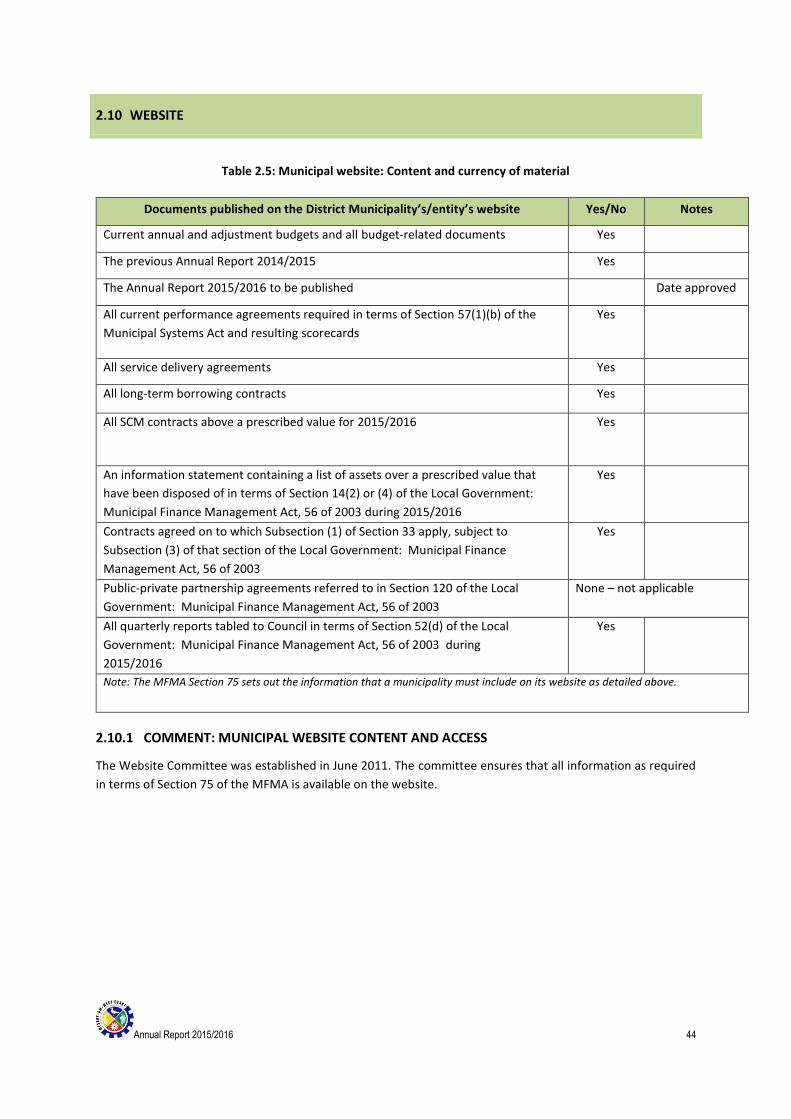
Table 2.5: Municipal website: Content and currency of material
Documents published on the District Municipality’s/entity’s website Yes/No Notes
Current annual and adjustment budgets and all budget-related documents Yes
The previous Annual Report 2014/2015 Yes
The Annual Report 2015/2016 to be published Date approved
All current performance agreements required in terms of Section 57(1)(b) of the
Municipal Systems Act and resulting scorecards
Yes
All service delivery agreements Yes
All long-term borrowing contracts Yes
All SCM contracts above a prescribed value for 2015/2016 Yes
An information statement containing a list of assets over a prescribed value that
have been disposed of in terms of Section 14(2) or (4) of the Local Government:
Municipal Finance Management Act, 56 of 2003 during 2015/2016
Yes
Contracts agreed on to which Subsection (1) of Section 33 apply, subject to
Subsection (3) of that section of the Local Government: Municipal Finance
Management Act, 56 of 2003
Yes
Public-private partnership agreements referred to in Section 120 of the Local
Government: Municipal Finance Management Act, 56 of 2003
None – not applicable
All quarterly reports tabled to Council in terms of Section 52(d) of the Local
Government: Municipal Finance Management Act, 56 of 2003 during
2015/2016
Yes
Note: The MFMA Section 75 sets out the information that a municipality must include on its website as detailed above.
2.10.1 COMMENT: MUNICIPAL WEBSITE CONTENT AND ACCESS
The Website Committee was established in June 2011. The committee ensures that all information as required
in terms of Section 75 of the MFMA is available on the website.
Annual Report 2015/2016 45
CHAPTER 3 – SERVICE DELIVERY PERFORMANCE
(PERFORMANCE REPORT PART I)
COMPONENT A: BASIC SERVICES
3.1 INTRODUCTION
The West Coast District Municipality is responsible for the delivery of potable water in terms of a bulk water
agreement to the local municipalities of Swartland, Saldanha and Bergrivier. The West Coast District Municipality
is also responsible for the maintenance of provincial roads on an agency basis for the Western Cape Department
of Transport and Public Works, and spatial planning on a regional basis. No households are provided with basic
services by the District Municipality.
The Saldanha Sea Water Desalination project that was initiated by the West Coast District Municipality was
transferred to the Saldanha Municipality as water services authority. The region has experienced a very dry
season and 20% water restrictions were introduced.
Annual Report 2015/2016 46
3.1 WATER PROVISION
3.1.1 INTRODUCTION
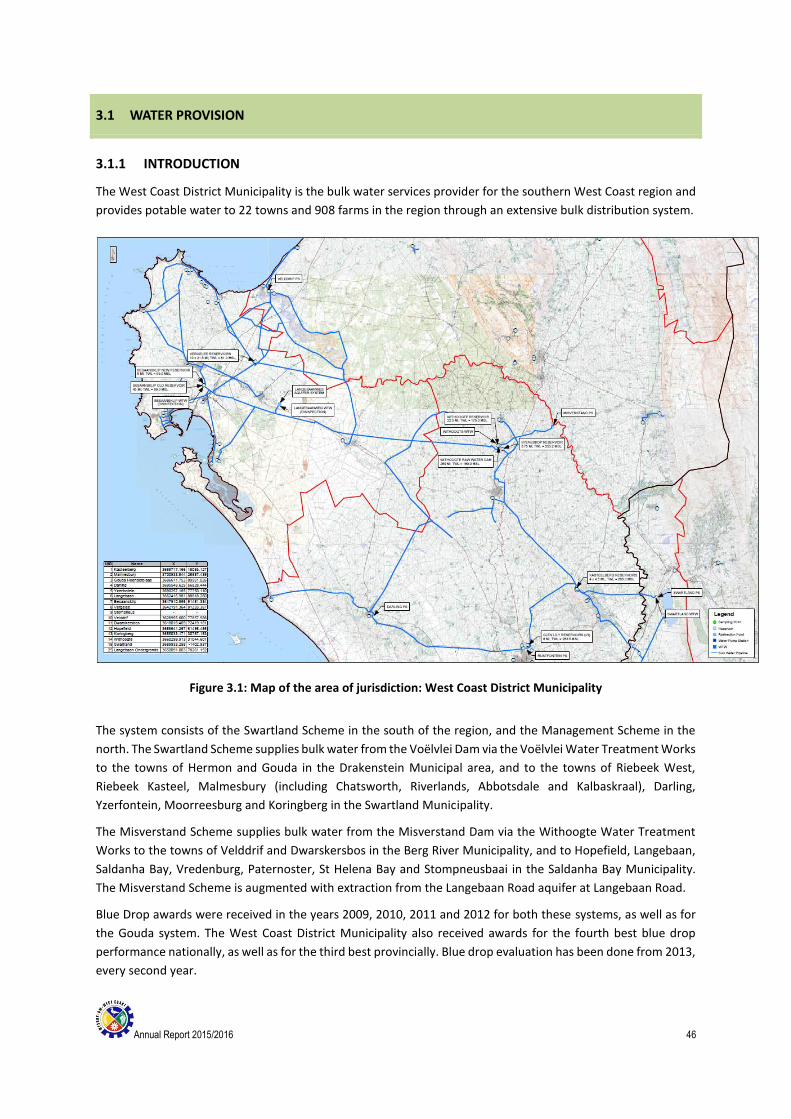
The West Coast District Municipality is the bulk water services provider for the southern West Coast region and
provides potable water to 22 towns and 908 farms in the region through an extensive bulk distribution system.
Figure 3.1: Map of the area of jurisdiction: West Coast District Municipality
The system consists of the Swartland Scheme in the south of the region, and the Management Scheme in the
north. The Swartland Scheme supplies bulk water from the Voëlvlei Dam via the Voëlvlei Water Treatment Works
to the towns of Hermon and Gouda in the Drakenstein Municipal area, and to the towns of Riebeek West,
Riebeek Kasteel, Malmesbury (including Chatsworth, Riverlands, Abbotsdale and Kalbaskraal), Darling,
Yzerfontein, Moorreesburg and Koringberg in the Swartland Municipality.
The Misverstand Scheme supplies bulk water from the Misverstand Dam via the Withoogte Water Treatment
Works to the towns of Velddrif and Dwarskersbos in the Berg River Municipality, and to Hopefield, Langebaan,
Saldanha Bay, Vredenburg, Paternoster, St Helena Bay and Stompneusbaai in the Saldanha Bay Municipality.
The Misverstand Scheme is augmented with extraction from the Langebaan Road aquifer at Langebaan Road.
Blue Drop awards were received in the years 2009, 2010, 2011 and 2012 for both these systems, as well as for
the Gouda system. The West Coast District Municipality also received awards for the fourth best blue drop
performance nationally, as well as for the third best provincially. Blue drop evaluation has been done from 2013,
every second year.
Annual Report 2015/2016 47
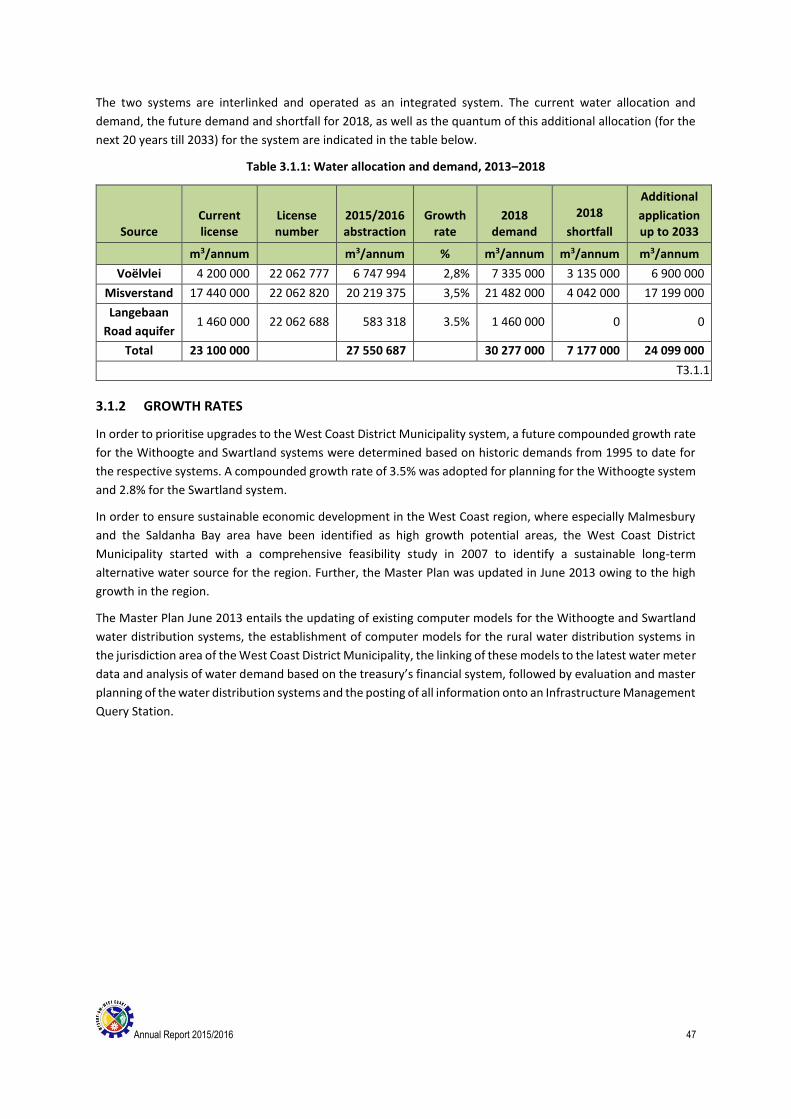
The two systems are interlinked and operated as an integrated system. The current water allocation and
demand, the future demand and shortfall for 2018, as well as the quantum of this additional allocation (for the
next 20 years till 2033) for the system are indicated in the table below.
Table 3.1.1: Water allocation and demand, 2013–2018
Source Current license
License number
2015/2016 abstraction
Growth rate
2018 demand
2018
shortfall
Additional
application up to 2033
m3/annum m3/annum % m3/annum m3/annum m3/annum
Voëlvlei 4 200 000 22 062 777 6 747 994 2,8% 7 335 000 3 135 000 6 900 000
Misverstand 17 440 000 22 062 820 20 219 375 3,5% 21 482 000 4 042 000 17 199 000
Langebaan
Road aquifer 1 460 000 22 062 688 583 318 3.5% 1 460 000 0 0
Total 23 100 000 27 550 687 30 277 000 7 177 000 24 099 000
T3.1.1
3.1.2 GROWTH RATES
In order to prioritise upgrades to the West Coast District Municipality system, a future compounded growth rate
for the Withoogte and Swartland systems were determined based on historic demands from 1995 to date for
the respective systems. A compounded growth rate of 3.5% was adopted for planning for the Withoogte system
and 2.8% for the Swartland system.
In order to ensure sustainable economic development in the West Coast region, where especially Malmesbury
and the Saldanha Bay area have been identified as high growth potential areas, the West Coast District
Municipality started with a comprehensive feasibility study in 2007 to identify a sustainable long-term
alternative water source for the region. Further, the Master Plan was updated in June 2013 owing to the high
growth in the region.
The Master Plan June 2013 entails the updating of existing computer models for the Withoogte and Swartland
water distribution systems, the establishment of computer models for the rural water distribution systems in
the jurisdiction area of the West Coast District Municipality, the linking of these models to the latest water meter
data and analysis of water demand based on the treasury’s financial system, followed by evaluation and master
planning of the water distribution systems and the posting of all information onto an Infrastructure Management
Query Station.

Annual Report 2015/2016 48
3.1.3 COMMENT: WATER USE BY SECTOR
Bulk water is provided by the West Coast District Municipality to three local municipalities and 918 farms in the
West Coast region.
RESOURCE CAPACITY FOR WITHOOGTE SYSTEM Future resources and treatment capacity scenarios for the Withoogte system was investigate for the next 30 years and entails the following 3 scenarios. Scenario A: No additional resources available from Berg River catchment. Capacity of Withoogte WTW kept at 72.0 Ml/day. Additional water resources available through desalination.
Figure 3.2: Scenario A: Additional resources through Desalination
Annual Report 2015/2016 49
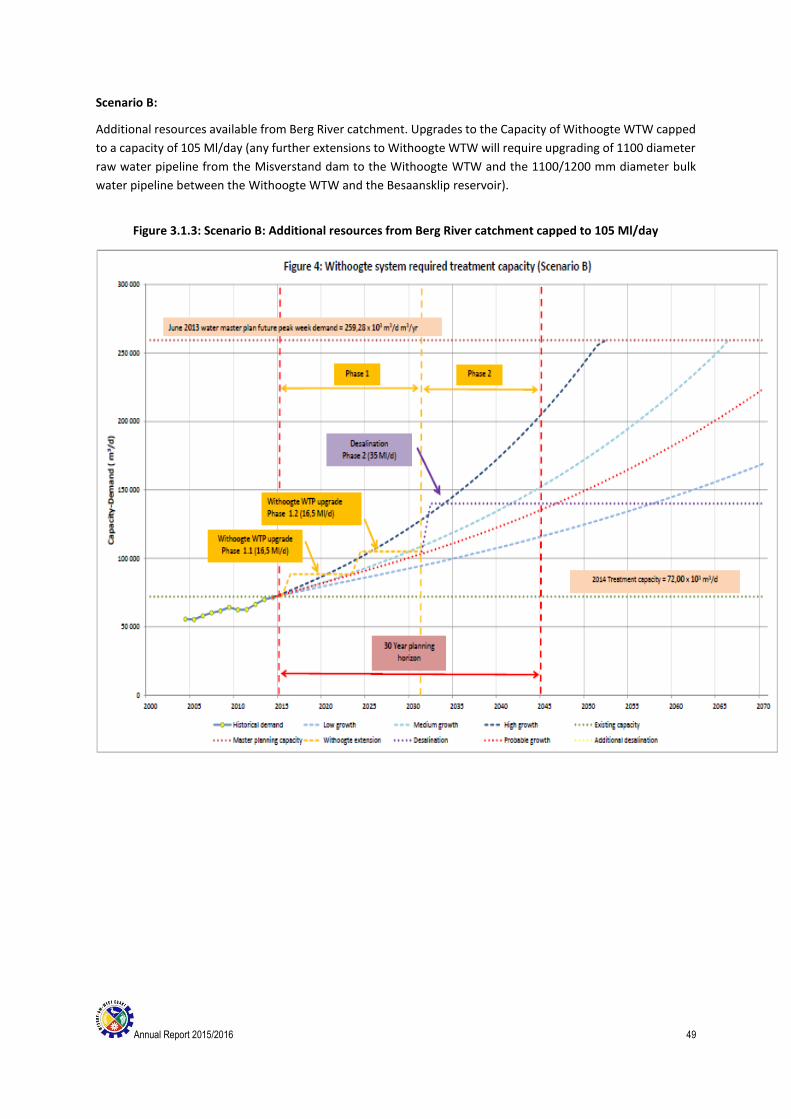
Scenario B:
Additional resources available from Berg River catchment. Upgrades to the Capacity of Withoogte WTW capped
to a capacity of 105 Ml/day (any further extensions to Withoogte WTW will require upgrading of 1100 diameter
raw water pipeline from the Misverstand dam to the Withoogte WTW and the 1100/1200 mm diameter bulk
water pipeline between the Withoogte WTW and the Besaansklip reservoir).
Figure 3.1.3: Scenario B: Additional resources from Berg River catchment capped to 105 Ml/day

Annual Report 2015/2016 50
Scenario C:
Additional resources available from Berg River catchment. No Desalination
Figure 3.1.4: Scenario C: Additional resources from Berg River system no Desalination

Annual Report 2015/2016 51
Table 3.1.2: Water consumption,
Table 3.1.3: Employment statistics: Water provision, 201502016
Job level
2014/2015 2015/2016
Employees
(N)
Posts
(N)
Employees
(N)
Vacancies: full-time equivalent
(N)
Vacancies
(% of total posts)
0–3 24 33 24 3 9.09 %
4–6 25 34 28 1 2.94 %
7–9 31 41 34 6 14.63 %
10–12 6 6 4 2 33.33 %
13–15 4 4 4 0 0.00 %
16–18 1 1 1 0 0.00 %
19–20 0 0 0 0 0.00 %
Total 91 119 95 12 10.08 %
T3.1.3
Year
Quantity (kilolitres) Losses
Raw water withdrawn
Purified water delivered Water sales Purification Distribution
2008/2009 24 585 837 23 083 499 21 790 185 6,11% 5,60%
2009/2010 24 315 601 22 769 765 22 076 522 6,36% 3,04%
2010/2011 24 314 294 22 777 941 21 496 174 6,32% 5,63%
2011/2012 25 205 808 23 692 176 22 490 474 6,01% 5,07%
2012/2013 26 220 257 24 550 591 23 328 832 6,37% 4,98%
2013/2014 26 860 870 24 896 806 23 662 082 7,31% 4,96%
2014/2015 27 731 941 26 046 245 24 211 361 6.08% 7.04%
2015/2016 27 550 687 25 845 914 23 983 088 6,19 % 8,18%
T3.1.2

Annual Report 2015/2016 52
Table 3.1.4: Financial performance: Water services, 2015/2016 (Year 1) (R’000)
Financial Performance: Water Division
Details
2014/2015 2015/2016
Actual Original budget
Adjustments budget
Actual Variance from budget
Total Operating Revenue 110 285 580 110 534 550 110 534 550 113 808 173 102.96%
Expenditure:
Employees 21 476 558 26 731 920 25 914 250 23 897 769 92.22%
Repairs and maintenance 3 878 974 4 335 000 4 335 000 3 971 690 91.62%
Other 56 720 963 76 012 000 95 148 800 77 312 299 81.25%
Total Operating Expenditure 82 076 495 107 078 920 125 398 050 105 181 758 83.88%
Net Operating Expenditure
Net expenditure to be consistent with summary table T5.1.2 in Chapter 5. Variances are calculated by dividing the difference between the actual and original Budget by the actual. T3.1.4
Table 3.1.5: Capital expenditure: Water services, 2015/2016
Capital projects
2015/2016
Budget Adjustment
budget Actual
expenditure
Variance from original
budget Total project
value
Total 5 315 000 4 162 416 4 008 496 -24.6 4 008 496
Flow meters & Instrumentation 300 000 249 356 238 659 238 659
Valves 2 750 000 2 750 000 2 683 702 2 683 702
Air Conditioners 20 000 20 820 20 814 20 814
Network & Communication 600 000 631 740 631 740 631 740
Pipe Replacement 1 250 000 122 010 122 000 122 000
Pump & Motor replacement 200 000 195 800 182 081 182 081
Dosing Equipment: Water 45 000 45 000 44 937 44 937
Tools 150 000 147 690 84 473 84 473
T3.1.5
Annual Report 2015/2016 53
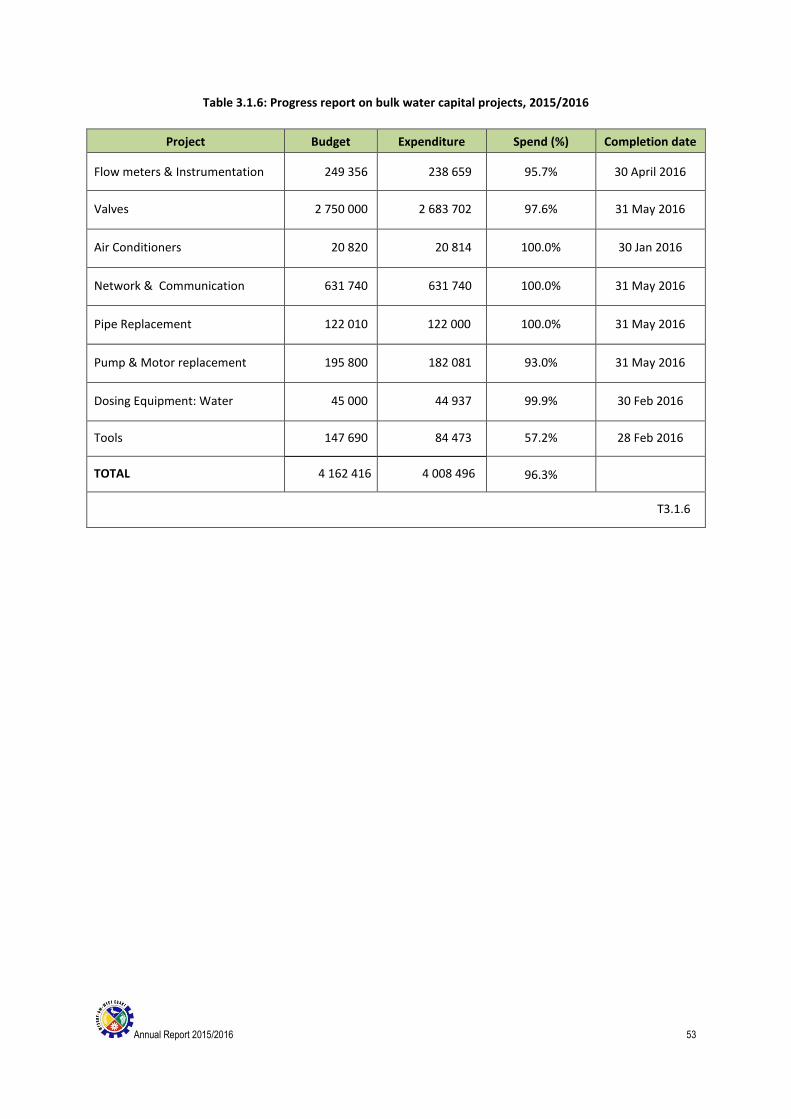
Table 3.1.6: Progress report on bulk water capital projects, 2015/2016
Project Budget Expenditure Spend (%) Completion date
Flow meters & Instrumentation 249 356 238 659 95.7% 30 April 2016
Valves 2 750 000 2 683 702 97.6% 31 May 2016
Air Conditioners 20 820 20 814 100.0% 30 Jan 2016
Network & Communication 631 740 631 740 100.0% 31 May 2016
Pipe Replacement 122 010 122 000 100.0% 31 May 2016
Pump & Motor replacement 195 800 182 081 93.0% 31 May 2016
Dosing Equipment: Water 45 000 44 937 99.9% 30 Feb 2016
Tools 147 690 84 473 57.2% 28 Feb 2016
TOTAL 4 162 416 4 008 496 96.3%
T3.1.6
Annual Report 2015/2016 54
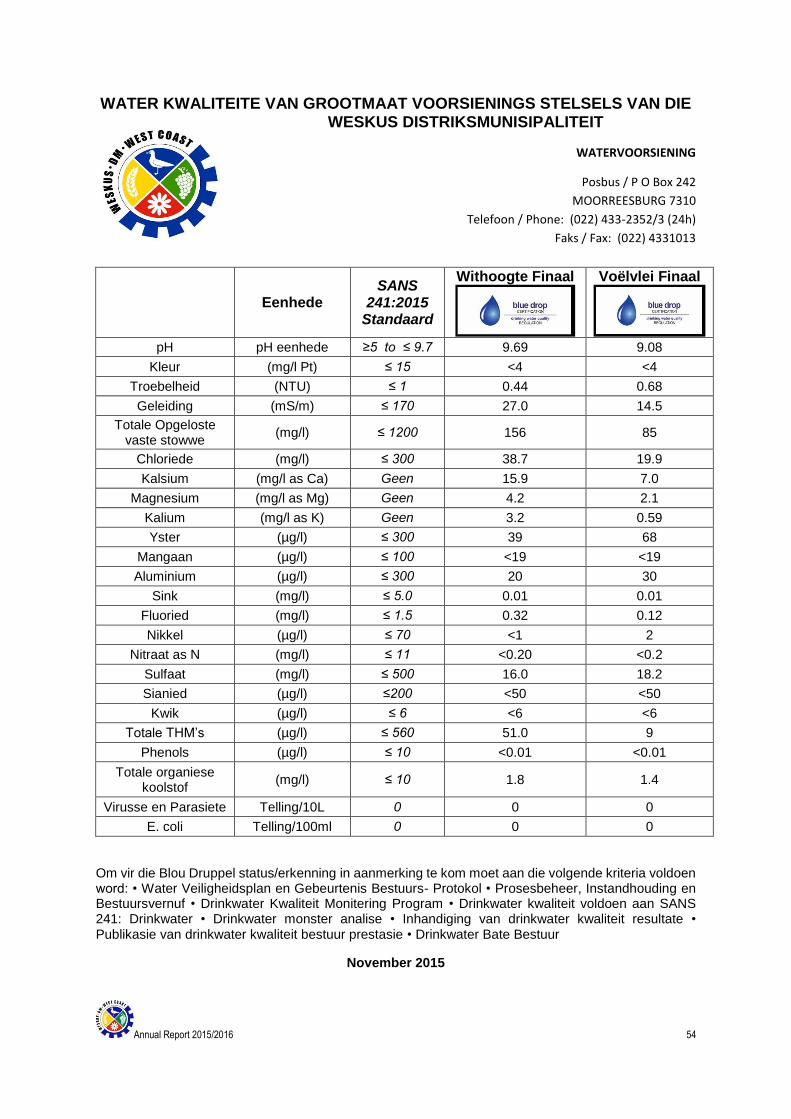
WATER KWALITEITE VAN GROOTMAAT VOORSIENINGS STELSELS VAN DIE WESKUS DISTRIKSMUNISIPALITEIT
WATERVOORSIENING
Posbus / P O Box 242
MOORREESBURG 7310
Telefoon / Phone: (022) 433-2352/3 (24h)
Faks / Fax: (022) 4331013
Eenhede SANS
241:2015 Standaard
Withoogte Finaal
Voëlvlei Finaal
pH pH eenhede ≥5 to ≤ 9.7 9.69 9.08
Kleur (mg/l Pt) ≤ 15 <4 <4
Troebelheid (NTU) ≤ 1 0.44 0.68
Geleiding (mS/m) ≤ 170 27.0 14.5
Totale Opgeloste vaste stowwe
(mg/l) ≤ 1200 156 85
Chloriede (mg/l) ≤ 300 38.7 19.9
Kalsium (mg/l as Ca) Geen 15.9 7.0
Magnesium (mg/l as Mg) Geen 4.2 2.1
Kalium (mg/l as K) Geen 3.2 0.59
Yster (µg/l) ≤ 300 39 68
Mangaan (µg/l) ≤ 100 <19 <19
Aluminium (µg/l) ≤ 300 20 30
Sink (mg/l) ≤ 5.0 0.01 0.01
Fluoried (mg/l) ≤ 1.5 0.32 0.12
Nikkel (µg/l) ≤ 70 <1 2
Nitraat as N (mg/l) ≤ 11 <0.20 <0.2
Sulfaat (mg/l) ≤ 500 16.0 18.2
Sianied (µg/l) ≤200 <50 <50
Kwik (µg/l) ≤ 6 <6 <6
Totale THM’s (µg/l) ≤ 560 51.0 9
Phenols (µg/l) ≤ 10 <0.01 <0.01
Totale organiese koolstof
(mg/l) ≤ 10 1.8 1.4
Virusse en Parasiete Telling/10L 0 0 0
E. coli Telling/100ml 0 0 0
Om vir die Blou Druppel status/erkenning in aanmerking te kom moet aan die volgende kriteria voldoen word: • Water Veiligheidsplan en Gebeurtenis Bestuurs- Protokol • Prosesbeheer, Instandhouding en Bestuursvernuf • Drinkwater Kwaliteit Monitering Program • Drinkwater kwaliteit voldoen aan SANS 241: Drinkwater • Drinkwater monster analise • Inhandiging van drinkwater kwaliteit resultate • Publikasie van drinkwater kwaliteit bestuur prestasie • Drinkwater Bate Bestuur
November 2015
Annual Report 2015/2016 55
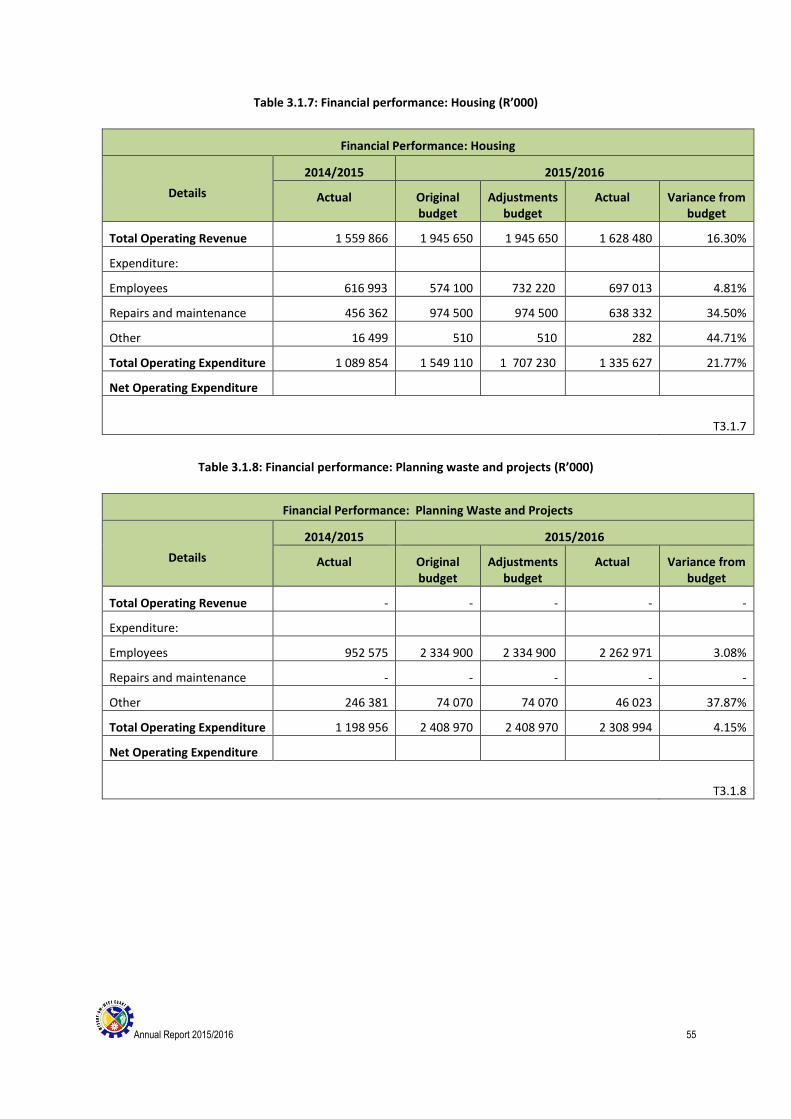
Table 3.1.7: Financial performance: Housing (R’000)
Financial Performance: Housing
Details
2014/2015 2015/2016
Actual Original budget
Adjustments budget
Actual Variance from budget
Total Operating Revenue 1 559 866 1 945 650 1 945 650 1 628 480 16.30%
Expenditure:
Employees 616 993 574 100 732 220 697 013 4.81%
Repairs and maintenance 456 362 974 500 974 500 638 332 34.50%
Other 16 499 510 510 282 44.71%
Total Operating Expenditure 1 089 854 1 549 110 1 707 230 1 335 627 21.77%
Net Operating Expenditure
T3.1.7
Table 3.1.8: Financial performance: Planning waste and projects (R’000)
Financial Performance: Planning Waste and Projects
Details
2014/2015 2015/2016
Actual Original budget
Adjustments budget
Actual Variance from budget
Total Operating Revenue - - - - -
Expenditure:
Employees 952 575 2 334 900 2 334 900 2 262 971 3.08%
Repairs and maintenance - - - - -
Other 246 381 74 070 74 070 46 023 37.87%
Total Operating Expenditure 1 198 956 2 408 970 2 408 970 2 308 994 4.15%
Net Operating Expenditure
T3.1.8

Annual Report 2015/2016 56
3.2 FREE BASIC SERVICES AND INDIGENT SUPPORT
3.2.1 INTRODUCTION
The West Coast District Municipality Indigent Policy was revised and approved on 02 December 2015.
There are only 14 households left at the Withoogte WTW. The Indigent Policy provides the following to these
households:
a) Water – 6 kl (maximum)
b) Refuse removal
c) Sewerage removal
d) Electricity – 100 units
e) Rates up to a maximum valuation of R50 000
f) House rental – 67% of debt raised
Table 3.2.1: Free basic services to low-income households
Number of households
Households earning less than R3 124 per month
Total Total
Free basic water Free basic sanitation
Free basic electricity
Free basic refuse
Access % Access % Access % Access %
2010/11 921 438 438 100 241 100 921 100 529 100
2011/12 88 11 11 100 11 100 88 100 11 100
2012/13 88 11 11 100 11 100 88 100 11 100
2013/14 88 10 10 100 10 100 88 100 10 100
2014/15 91 14 14 100 14 100 14 100 14 100
2015/16 96 12 12 100 12 100 12 100 11 100
The Allpay Grant for October 2015 as published was R1,420.00. The West Coast DM Indigent Policy prescribes
that the income of the person should not exceed the limit, 2 x Allpay grant + 10%. Therefore the calculation is
as follows: R1,420.00 x 2 – R2, 480.00 + R284.00 = R3,124.00.
Annual Report 2015/2016 57
COMPONENT B: AGENCY SERVICES
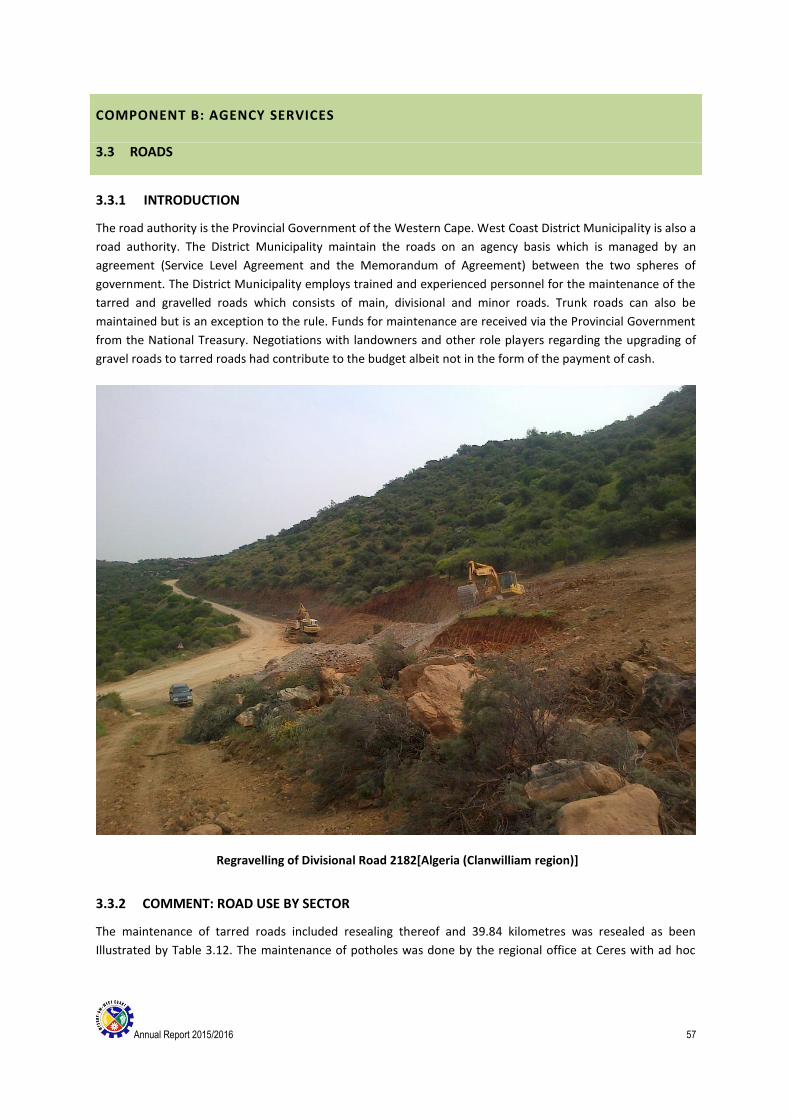
3.3 ROADS
3.3.1 INTRODUCTION
The road authority is the Provincial Government of the Western Cape. West Coast District Municipality is also a
road authority. The District Municipality maintain the roads on an agency basis which is managed by an
agreement (Service Level Agreement and the Memorandum of Agreement) between the two spheres of
government. The District Municipality employs trained and experienced personnel for the maintenance of the
tarred and gravelled roads which consists of main, divisional and minor roads. Trunk roads can also be
maintained but is an exception to the rule. Funds for maintenance are received via the Provincial Government
from the National Treasury. Negotiations with landowners and other role players regarding the upgrading of
gravel roads to tarred roads had contribute to the budget albeit not in the form of the payment of cash.
Regravelling of Divisional Road 2182[Algeria (Clanwilliam region)]
3.3.2 COMMENT: ROAD USE BY SECTOR
The maintenance of tarred roads included resealing thereof and 39.84 kilometres was resealed as been
Illustrated by Table 3.12. The maintenance of potholes was done by the regional office at Ceres with ad hoc

Annual Report 2015/2016 58
requests for assistance. No rehabilitation was undertake by the District Municipality during the report period
but 5 projects was done through C- contracts and managed by the road authority.
Whilst maintaining gravel roads included re gravelling, spot regravel, grading(dry-, wet- and heavy blading) ,
maintenance of stormwater structures(including the replacement thereof),maintenance of fencing(including the
replacement/upgrading of portions thereof) and maintenance of furniture at rest stops alongside and within the
road reserve. 18 drawn graders is distributed through the jurisdiction and mainly minor roads were graded by
local landowners. No costs other than the maintenance of the graders were involved
Upgrading gravel roads with a permanent wearing coarse was undertaken and 9.83 kilometres completed (see
Table 3.11) with another 2 projects in various stages of completion. The private sector contributed a large
portion to the success of the upgraded roads. The performance target set for the financial year was 2.95
kilometres.
The activities mentioned above were carried out by two construction/regravelling-, one concrete -, eleven
maintenance - and fifteen grader teams. The gravelling and maintenance teams are distributed throughout the
jurisdiction of 32 000 km2
Maintenance of the Yellow Fleet was also undertaken and were done by two workshops that are situated in
Moorreesburg and Vanrhynsdorp, respectively with a personnel of 25 persons.
The maintenance and upgrading of roads were done by a personnel of 179 totalling 204 .
Shuttering of wingwalls – Divisional Road 2164 (Paternoster area)
Annual Report 2015/2016 59
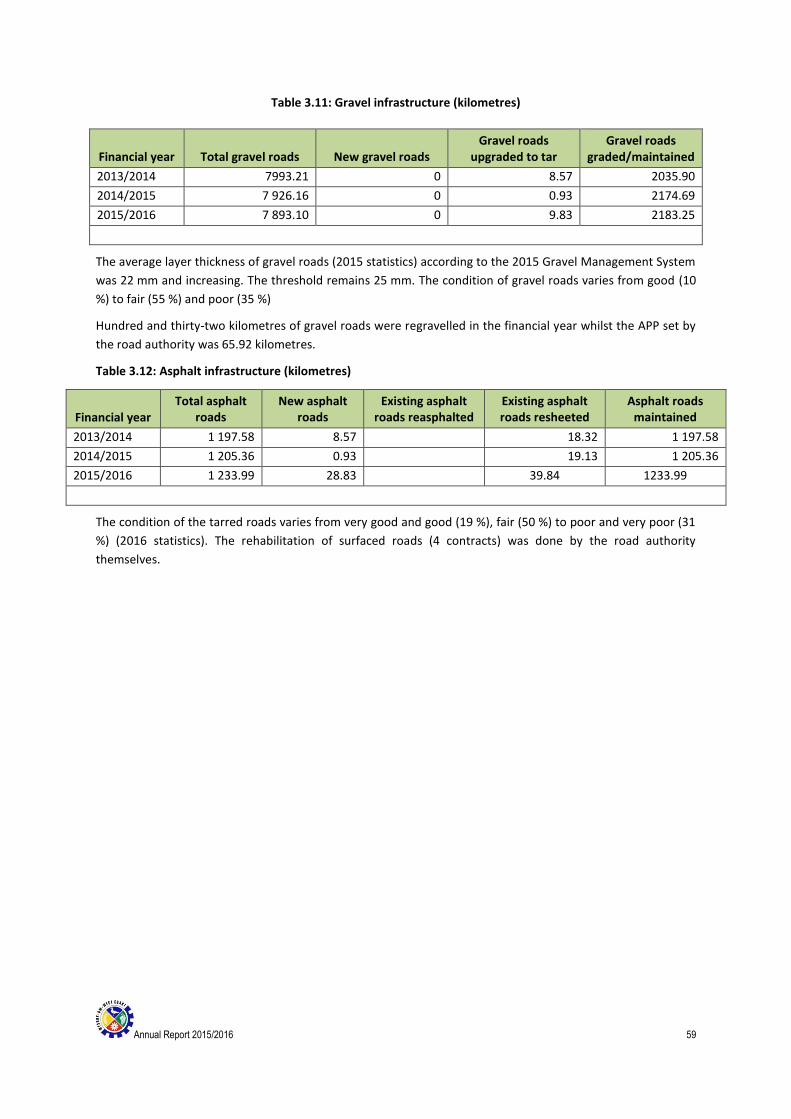
Table 3.11: Gravel infrastructure (kilometres)
Financial year Total gravel roads New gravel roads Gravel roads
upgraded to tar Gravel roads
graded/maintained
2013/2014 7993.21 0 8.57 2035.90
2014/2015 7 926.16 0 0.93 2174.69 2015/2016 7 893.10 0 9.83 2183.25
The average layer thickness of gravel roads (2015 statistics) according to the 2015 Gravel Management System
was 22 mm and increasing. The threshold remains 25 mm. The condition of gravel roads varies from good (10
%) to fair (55 %) and poor (35 %)
Hundred and thirty-two kilometres of gravel roads were regravelled in the financial year whilst the APP set by
the road authority was 65.92 kilometres.
Table 3.12: Asphalt infrastructure (kilometres)
Financial year Total asphalt
roads New asphalt
roads Existing asphalt
roads reasphalted Existing asphalt roads resheeted
Asphalt roads maintained
2013/2014 1 197.58 8.57 18.32 1 197.58
2014/2015 1 205.36 0.93 19.13 1 205.36
2015/2016 1 233.99 28.83 39.84 1233.99
The condition of the tarred roads varies from very good and good (19 %), fair (50 %) to poor and very poor (31
%) (2016 statistics). The rehabilitation of surfaced roads (4 contracts) was done by the road authority
themselves.

Annual Report 2015/2016 60
Upgrading of Main Road (Citrusdal region); Applying 13 mm stone
Table 3.13: Cost of construction/maintenance (R’000)
Financial year
Gravel Tar
New Gravel – tar Maintained New Reworked Maintained
2013/2014 10 741 58 407 14 709
2014/2015 2 121 73 083 13 453
2015/2016 44 505 73 520 21 630
Annual Report 2015/2016 61
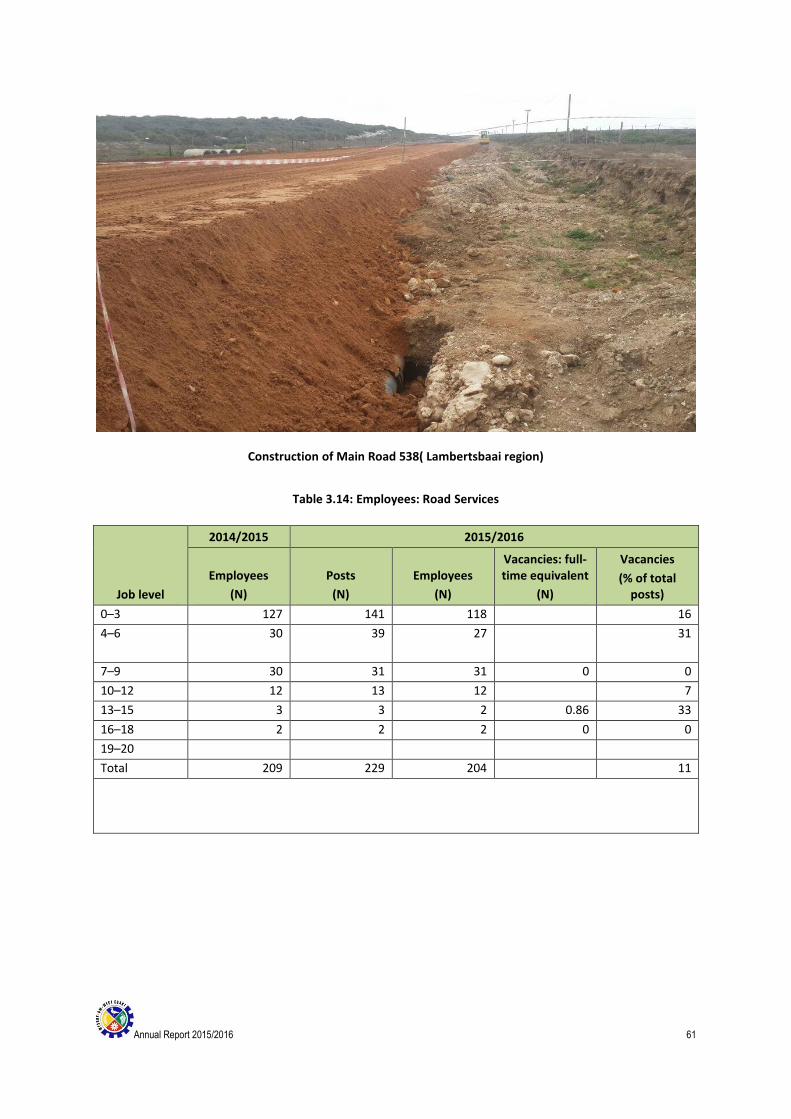
Construction of Main Road 538( Lambertsbaai region)
Table 3.14: Employees: Road Services
Job level
2014/2015 2015/2016
Employees
(N)
Posts
(N)
Employees
(N)
Vacancies: full-time equivalent
(N)
Vacancies
(% of total posts)
0–3 127 141 118 16
4–6 30 39
27
31
7–9 30 31 31 0 0
10–12 12 13 12 7
13–15 3 3 2 0.86 33
16–18 2 2 2 0 0
19–20
Total 209 229 204 11
Annual Report 2015/2016 62
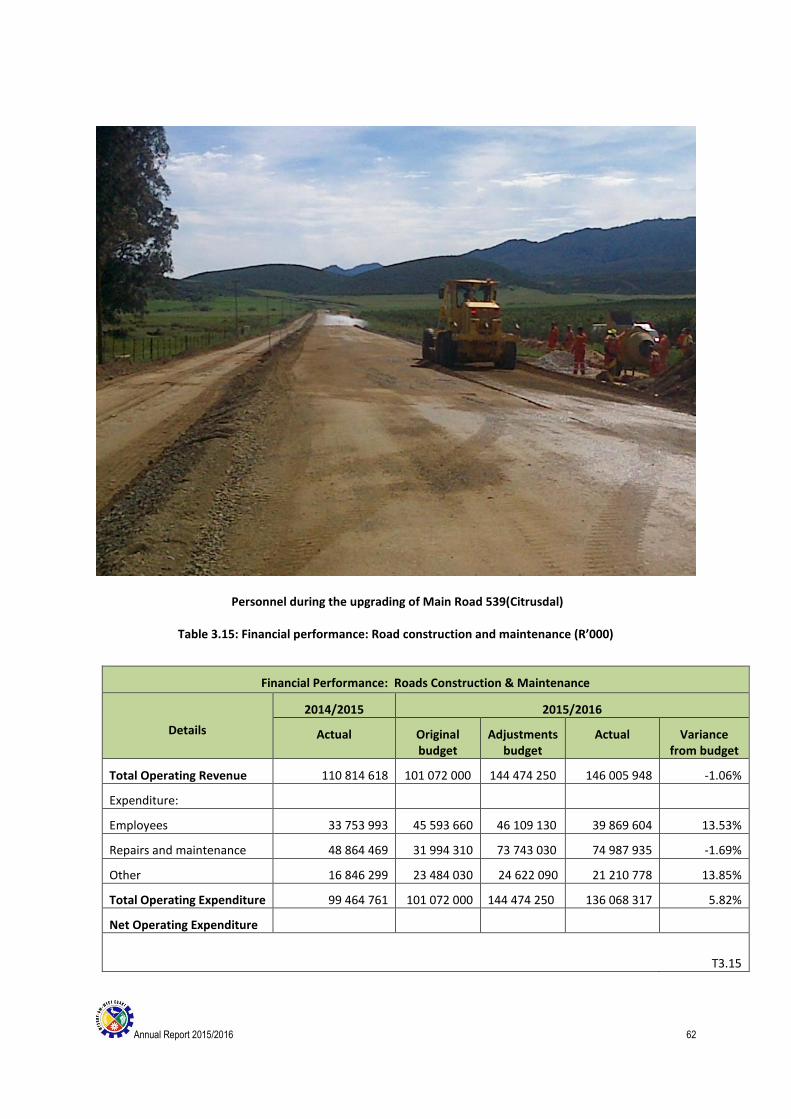
Personnel during the upgrading of Main Road 539(Citrusdal)
Table 3.15: Financial performance: Road construction and maintenance (R’000)
Financial Performance: Roads Construction & Maintenance
Details
2014/2015 2015/2016
Actual Original budget
Adjustments budget
Actual Variance from budget
Total Operating Revenue 110 814 618 101 072 000 144 474 250 146 005 948 -1.06%
Expenditure:
Employees 33 753 993 45 593 660 46 109 130 39 869 604 13.53%
Repairs and maintenance 48 864 469 31 994 310 73 743 030 74 987 935 -1.69%
Other 16 846 299 23 484 030 24 622 090 21 210 778 13.85%
Total Operating Expenditure 99 464 761 101 072 000 144 474 250 136 068 317 5.82%
Net Operating Expenditure
T3.15
Annual Report 2015/2016 63
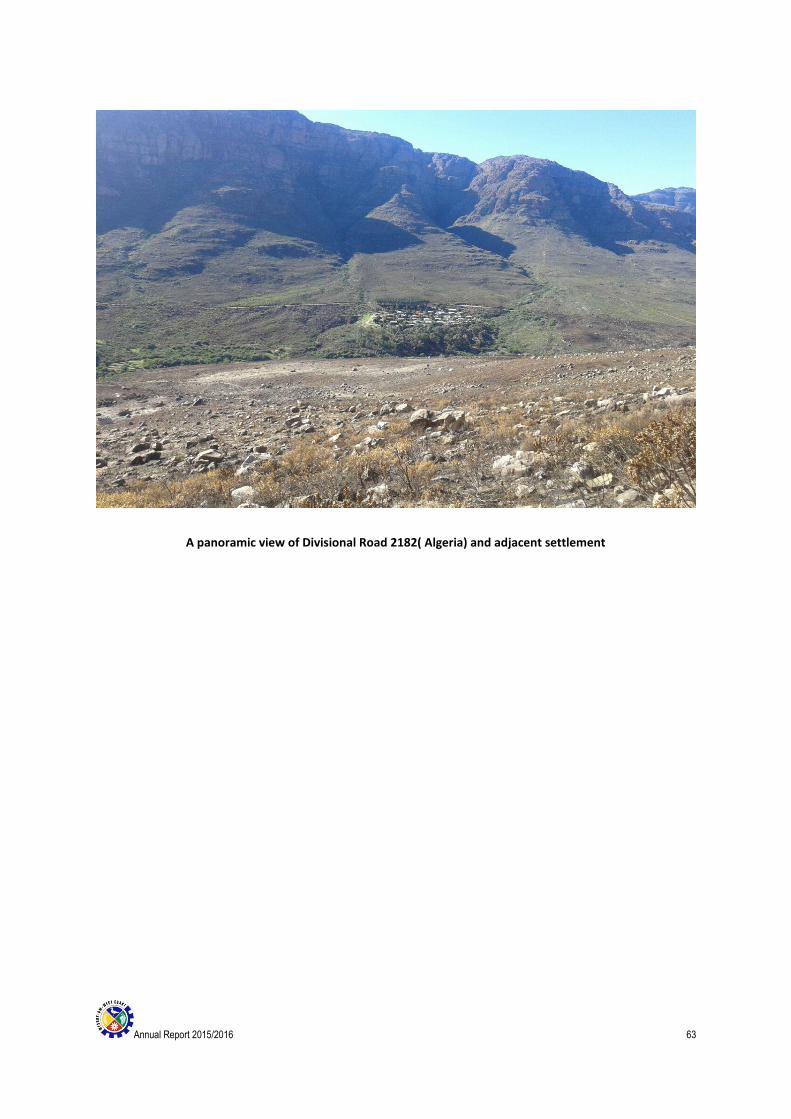
A panoramic view of Divisional Road 2182( Algeria) and adjacent settlement

Annual Report 2015/2016 64
Table 3.16: Capital expenditure: Road Services (R’000)
Capital projects Budget Adjustment
budget Variance from original budget
Total project value
MR 00539(km 16.9 -25.95) Upgrade 2 000 19 500 (26 312) 39 750
DR 01487 (km 0–15.55) Regravel 3 004 3 004 267 2 829
DR 01487 (km 25 -55) Regravel 9 680 9 127 3 277
DR 02182 (km 0 – 21.22) Regravel 10 470 5891
MR 00546 (KM 0 – 18.0) Regravel 8 000 8000 (3 126) 11 126
Minor Road 07885 (km 0 – 3.45)
Regravel 635 635
(372) 1 062
DR 02175 (km 30.3) Replacement of
existing stormwaterstructure 1 500
(36) 1536
MR 00310 (km 102,4 – 103.97)
Upgrade 750 1300
(257)
MR 00310(km 104.48 – 105.22)
Upgrade 500 750
(695) 1 195
Mr 00538(km 1.74 – 12.0) Upgrade 22 145 9 350 4 488
DR 02163 (km 0 – 4.80) Reseal 790 790 347 443
DR 02196 (km 0.99 – 1.85) Reseal 329 329 (102) 431
DR 02216(km 0 – 5.25) Reseal 1 879 1879 874 1004
MR 00228 (km 21.22– 22.64) Reseal 427 427 265 162
Minor Road 07776 (km 0 – 2.49)
Reseal 493 493
(55) 548
Minor Road 07780 (km 2.80 – 3.19)
Reseal 76 76
(287) 363
Minor Road 07780 (km3.50 – 4.73)
Reseal 238 238
(32) 270
Minor Road 07794 (km 8.95 – 9.73)
Reseal 216 216
(17) 233
TR02303 (km 12.5- 35.12) Reseal 9 904 13 393 773 12 660
DR 2195(km 0 – 7) Regravel 302 (302) 2 780
Minor Road 5325(km 0-12.14)
Regravel 34 (34) 1 854
MR 545(km 0 – 46.6) Regravel 2750 (2 750) 2 2750
DR 1171(km 9 – 17.23) Regravel 194 (194) 194
DR 2183 (km 27.01- 27.32) Reseal 77 (77) 77
DR 2175(km 0 – 8.15) Reseal 650 492 158
DR 2175(km 17.98 – 22.03) Reseal 243 86 157
= Project not completed
() = Over expenditure

Annual Report 2015/2016 65
COMPONENT C: PLANNING AND DEVELOPMENT 3.4 TOWN PLANNING
3.4.1 INTRODUCTION
The Division Spatial Planning & Development of the West Coast District Municipality endeavours to promote
and facilitate coordinated, regulated spatial planning and land use development and management in the West
Coast District Region in accordance with the strategic objectives of the municipality as contained in the IDP and
SDF. This requires addressing the social needs of the community, promoting economic growth, whilst protecting
the environment to ensure the sustainable use of resources.
To this end comments are provided on all projects circulated to the West Coast District Municipality as part of
the public participation process for environmental assessments in terms of the National Environmental
Management Act, 1998 (NEMA). Socioeconomic, spatial planning and environmental comments are provided
on all projects or developments that have a regional impact or that have an impact on West Coast District
Municipal functions.
The Division represents the West Coast District Municipality at various initiatives established to facilitate
integrated spatial planning and development across the District and to ensure alignment with the strategic
objectives contained in the West Coast District Spatial Development Framework and the Provincial Spatial
Development Framework. Two initiatives of the Western Cape Government are currently underway in this
regard, i.e. the Greater Cape Town Regional Spatial Implementation Framework and the Greater Saldanha
Regional Spatial Implementation Framework.
During 2015 all the local municipalities in the West Coast District adopted a Municipal Land Use Planning Bylaw
in accordance with the Spatial Planning and Land Use Management Act (SPLUMA) (Act 16 of 2013) and the
Western Cape Land Use Planning Act (LUPA) (Act 3 of 2014), introducing a new spatial and land use planning
dispensation to local municipalities. SPLUMA also introduces the development principles of spatial justice,
efficiency, sustainability and resilience which all future developments must meet.
The West Coast District Municipality does not process applications for land use management. This is the function
of the respective category B municipalities in their areas of jurisdiction. However, comments on socioeconomic
status, spatial planning, environmental health, environmental management, fire management and disaster
management are provided by the West Coast District Municipality when land use management applications in
category B municipal areas are circulated for comment to stakeholders and organs of state, as required by
legislation.
3.4.2 COMMENTS: PLANNING
3.4.2.1 ENVIRONMENTAL ASSESSMENT REPORTS
During 2015 comments were provided on 48 environmental assessment reports that were circulated to the West
Coast District Municipality for comment during the public participation periods legislated by NEMA.
3.4.2.2 LAND USE MANAGEMENT APPLICATIONS
27 Land use applications submitted to local municipalities in the West Coast District were circulated to the
municipality as per legislative requirements and comments were provided to the respective local municipalities.

Annual Report 2015/2016 66
3.4.2.4 SHARED SERVICES
The WCDM Town and Regional Planner have been nominated to serve on the Bergrivier and Saldanha Bay Municipal Planning Tribunals.
Table 3.4.1: Employees: Planning
Job level
2014/2015 2015/2016
Employees
(N)
Posts
(N)
Employees
(N)
Vacancies: full-time equivalent
(N)
Vacancies
(% of total posts)
13–15 1 1 1 0 0%
Total 1 1 0 0%
T3.4.1
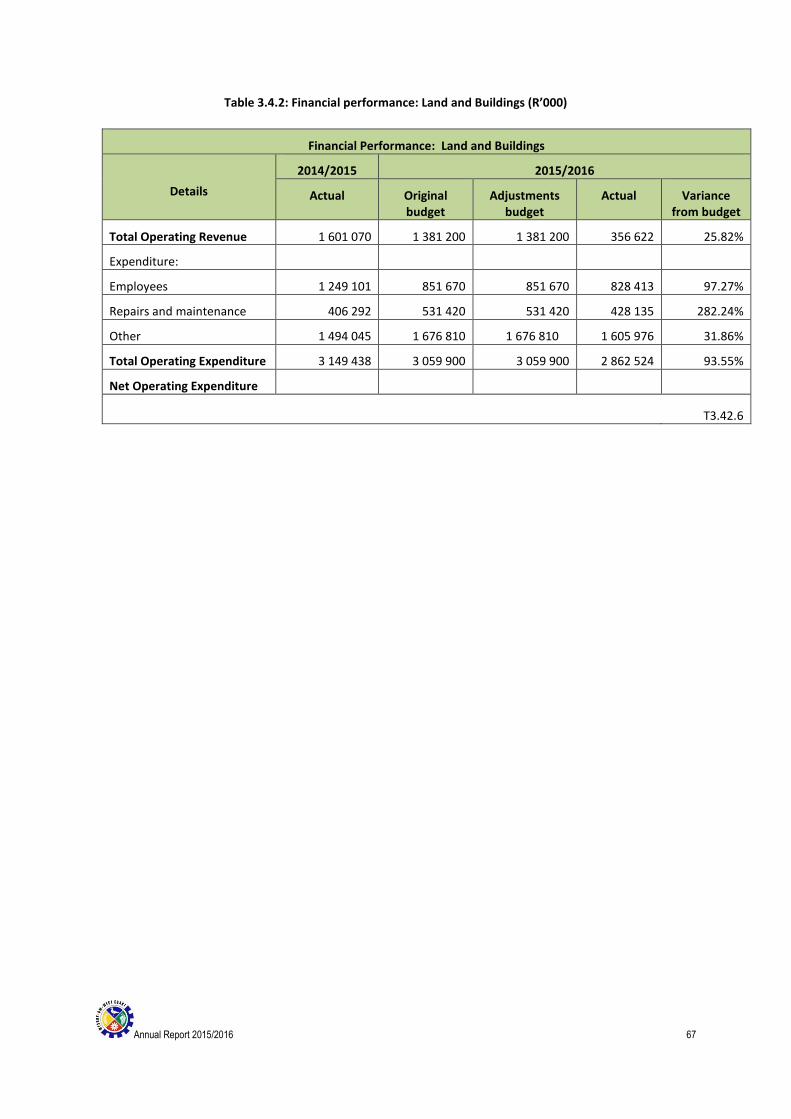
Annual Report 2015/2016 67
Table 3.4.2: Financial performance: Land and Buildings (R’000)
Financial Performance: Land and Buildings
Details
2014/2015 2015/2016
Actual Original budget
Adjustments budget
Actual Variance from budget
Total Operating Revenue 1 601 070 1 381 200 1 381 200 356 622 25.82%
Expenditure:
Employees 1 249 101 851 670 851 670 828 413 97.27%
Repairs and maintenance 406 292 531 420 531 420 428 135 282.24%
Other 1 494 045 1 676 810 1 676 810 1 605 976 31.86%
Total Operating Expenditure 3 149 438 3 059 900 3 059 900 2 862 524 93.55%
Net Operating Expenditure
T3.42.6

Annual Report 2015/2016 68
3.5 LOCAL ECONOMIC DEVELOPMENT
3.5.1 INTRODUCTION
The West Coast District Municipality is currently in the process of operationalising the strategy through the West
Coast Economic Development Partnership. This entails the profiling of the West Coast District and identifying of
strategic catalytic projects.
The West Coast region has been selected as a pilot for the Western Cape Economic Development Partnership in
cooperation with the Western Cape Department of Economic Development and Tourism. This can be seen as an
ideal opportunity for the region to be strengthened through the mobilisation and coordination efforts of the
Western Cape Economic Development Partnership and for effective service delivery integration within a
geographical space. This endeavour continues to enjoy the support of the German International Co-operation
and the National Department of Co-operative Governance.
Table 3.5.1: GDPR Contribution per municipality 2010-2013
Table 3.5.1 shows the rising contribution of these two municipalities to the WCD GDPR for the period 2000 -
2013. Matzikama Municipality is with its total contribution being on a downward trend since 2000. The
contribution of the Bergrivier and Cederberg municipalities has been fairly constant over the 2000 to 2013
period. Employment contributions by municipality follow similar trends compared to GDPR. Of interest is the
rising contribution to employment by Saldanha Bay Municipality which is currently benefiting from the Saldanha
Bay- Northern Cape development corridor project, which is set to embark on a railway and ports expansion
drive. As a result employment levels in WCD are likely to continue increasing. The district is also benefiting from
the construction of industrial space and the establishment of the Industrial Development Zone (IDZ), maritime
support for the oil and gas project and the expansion of iron ore mining in the Northern Cape.

Annual Report 2015/2016 69
Table 3.5.2: Employees: Strategic Services
Job level
2014/2015 2015/2016
Employees
(N)
Posts
(N)
Employees
(N)
Vacancies: full-time equivalent
(N)
Vacancies
(% of total posts)
0–3
4–6
7–9 1 1
10–12 1 1 2 0
13–15
16–18 1 1 1 0
19–20
Total 3 3
T3.5.2
Table 3.5.3: Financial performance: Strategic Services (R’000)
Financial Performance Strategic Services
Details
2014/2015 2015/2016
Actual Original budget
Adjustments budget
Actual Variance from budget
Total Operating Revenue 43 860 - - - -
Expenditure:
Employees 944 595 1 320 390 1 320 390 1 343 631 101.76%
Repairs and maintenance 165 4 080 4 080 - -
Other 710 119 1 088 900 1 088 900 974 044 89.45%
Total Operating Expenditure 1 654 879 2 413 370 2 413 370 2 317 675 96.03%
Net Operating Expenditure
T3.5.3
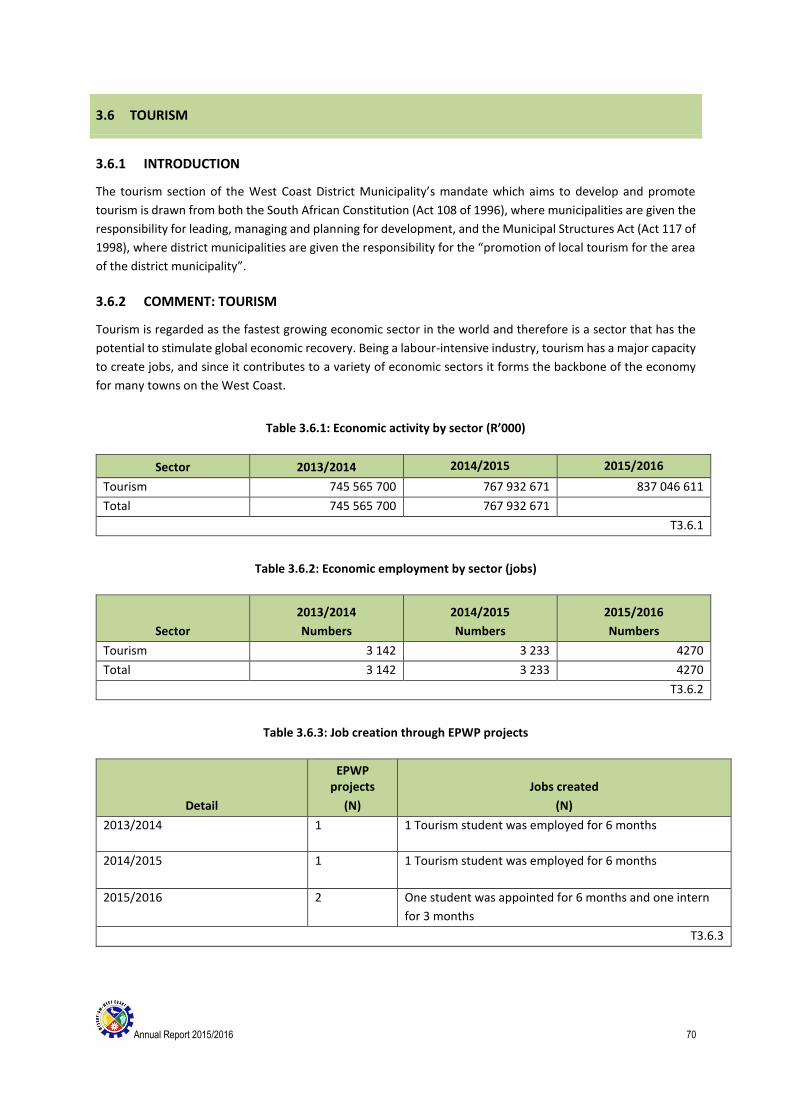
Annual Report 2015/2016 70
3.6 TOURISM
3.6.1 INTRODUCTION
The tourism section of the West Coast District Municipality’s mandate which aims to develop and promote
tourism is drawn from both the South African Constitution (Act 108 of 1996), where municipalities are given the
responsibility for leading, managing and planning for development, and the Municipal Structures Act (Act 117 of
1998), where district municipalities are given the responsibility for the “promotion of local tourism for the area
of the district municipality”.
3.6.2 COMMENT: TOURISM
Tourism is regarded as the fastest growing economic sector in the world and therefore is a sector that has the
potential to stimulate global economic recovery. Being a labour-intensive industry, tourism has a major capacity
to create jobs, and since it contributes to a variety of economic sectors it forms the backbone of the economy
for many towns on the West Coast.
Table 3.6.1: Economic activity by sector (R’000)
Sector 2013/2014 2014/2015 2015/2016
Tourism 745 565 700 767 932 671 837 046 611
Total 745 565 700 767 932 671
T3.6.1
Table 3.6.2: Economic employment by sector (jobs)
Sector
2013/2014
Numbers
2014/2015
Numbers
2015/2016
Numbers
Tourism 3 142 3 233 4270
Total 3 142 3 233 4270
T3.6.2
Table 3.6.3: Job creation through EPWP projects
Detail
EPWP projects
(N)
Jobs created
(N)
2013/2014 1 1 Tourism student was employed for 6 months
2014/2015 1 1 Tourism student was employed for 6 months
2015/2016 2 One student was appointed for 6 months and one intern
for 3 months
T3.6.3

Annual Report 2015/2016 71
Table 3.6.4: Employees: Tourism
Job level
2014/2015 2015/2016
Employees
(N)
Posts
(N)
Employees
(N)
Vacancies: full-time equivalent
(N)
Vacancies
(% of total posts)
0–3
4–6
7–9 58 11010001-22 58 0 0
10–12 59, 54 11010001-22 59, 88 and 105 0 0
13–15 57 11010001-22 57 0 0
16–18
19–20
Total
T3.6.4
Table 3.6.5: Financial performance: Tourism (R’000)
Financial Performance Tourism
Details
2014/2015 2015/2016
Actual Original budget
Adjustments budget
Actual Variance from budget
Total Operating Revenue - - - - -
Expenditure:
Employees 1 526 923 1 790 780 1 790 780 1 521 222 84.95%
Repairs and maintenance - - - - -
Other 913 315 834 850 834 850 759 136 90.93%
Total Operating Expenditure 2 440 138 2 625 630 2 625 630 2 280 358 86.85%
Net Operating Expenditure
T3.6.5

Annual Report 2015/2016 72
3.6.3 OVERALL TOURISM PERFORMANCE
Tourism is the 3rd biggest economic driver on the West Coast and every 21 visitors to an area result in one permanent job and every 8 visitors to an area result in one temporary job. The 6% increase in visitors to the West Coast compared to 2014–2015, proves that Tourism are on the right track, and the growth in Black-owned tourism businesses on the West Coast indicates that the tourism strategy is being implemented successfully.
The economic climate of the last few years caused visitors to become a lot more discerning and competition is
growing by the day. It is very important to take a good look at how we manage tourism on the West Coast and
what outcomes we can achieve through our shared investment in people and tourism money, to make sure that
the tourism sector keeps on growing in a responsible and sustainable way. Since the Western Cape is our main
target market we spend most of the marketing budget on marketing initiatives for the local and national market.
In 2015, the Cape West Coast recorded a share of 76.4% from the domestic market and 22.1% originating from
international source countries. The international market were led by visitors from Germany (33.4%), the United
Kingdom (21.3%) and the Netherlands (10.0%). Top domestic provinces to the region included visitors from the
Western Cape (51.9%), Gauteng (20.3%) and Eastern Cape (5.9%).
Amongst all visitors, holiday/leisure ranked as the strongest driver for travel to the region, with over 80% of
respondents primarily travelling for leisure purposes. Visiting friends and relatives and business followed as the
second and third most popular reasons for travelling to the region.
The most common age profile of visitors to the Cape West Coast were between 51-70 years, and visitors mainly
travelled in pairs. Top accommodation choices were self-catering establishments and B&Bs, and visitors mostly
spent an average of R501-R1000 per day on accommodation in the region.
Internet/websites and word of mouth ranked as the leading information sources used by visitors to obtain
information on the destination.

Annual Report 2015/2016 73
Table 3.6.3.1 WESGRO Research unit

Annual Report 2015/2016 74
Table 3.6.3.2
Table 3.6.3.3

Annual Report 2015/2016 75
Table 3.6.3.4
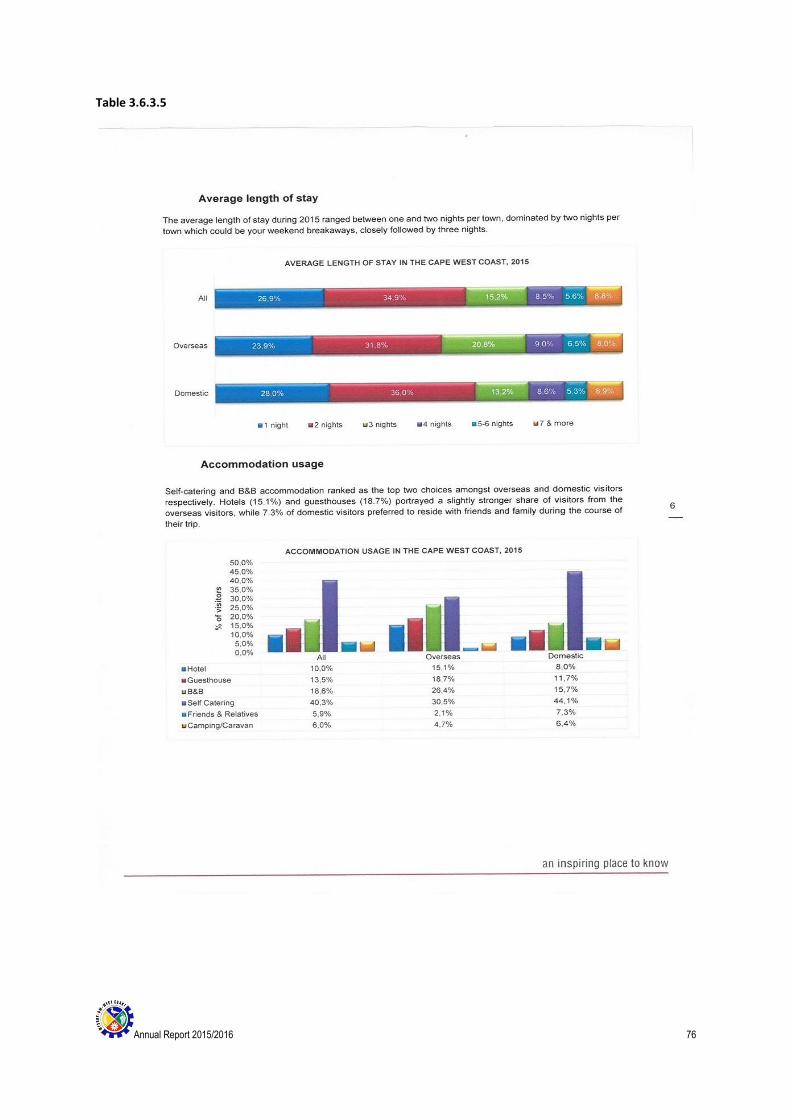
Annual Report 2015/2016 76
Table 3.6.3.5
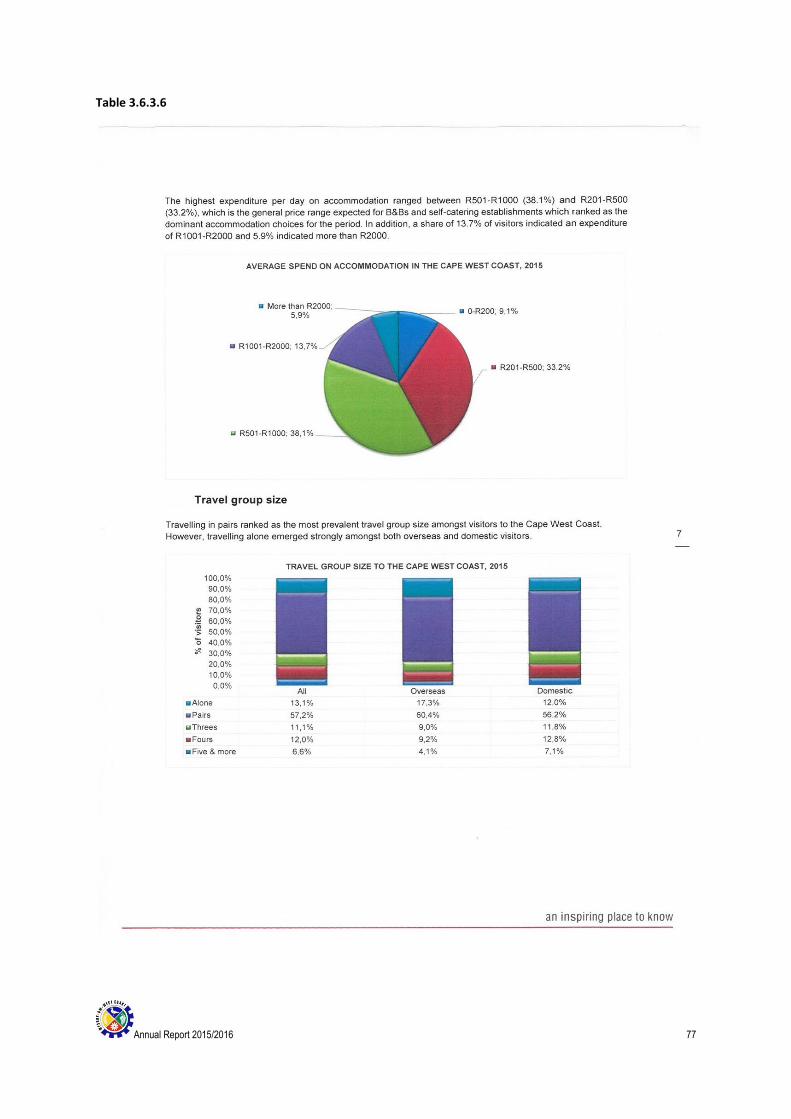
Annual Report 2015/2016 77
Table 3.6.3.6
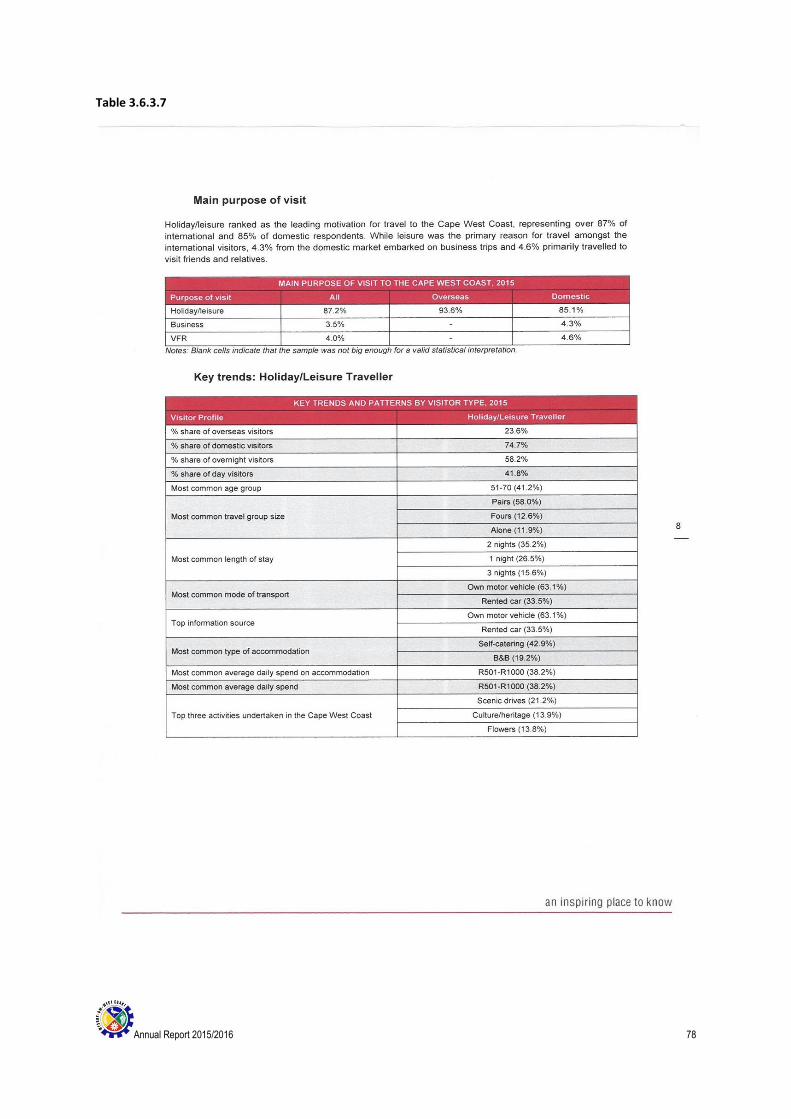
Annual Report 2015/2016 78
Table 3.6.3.7
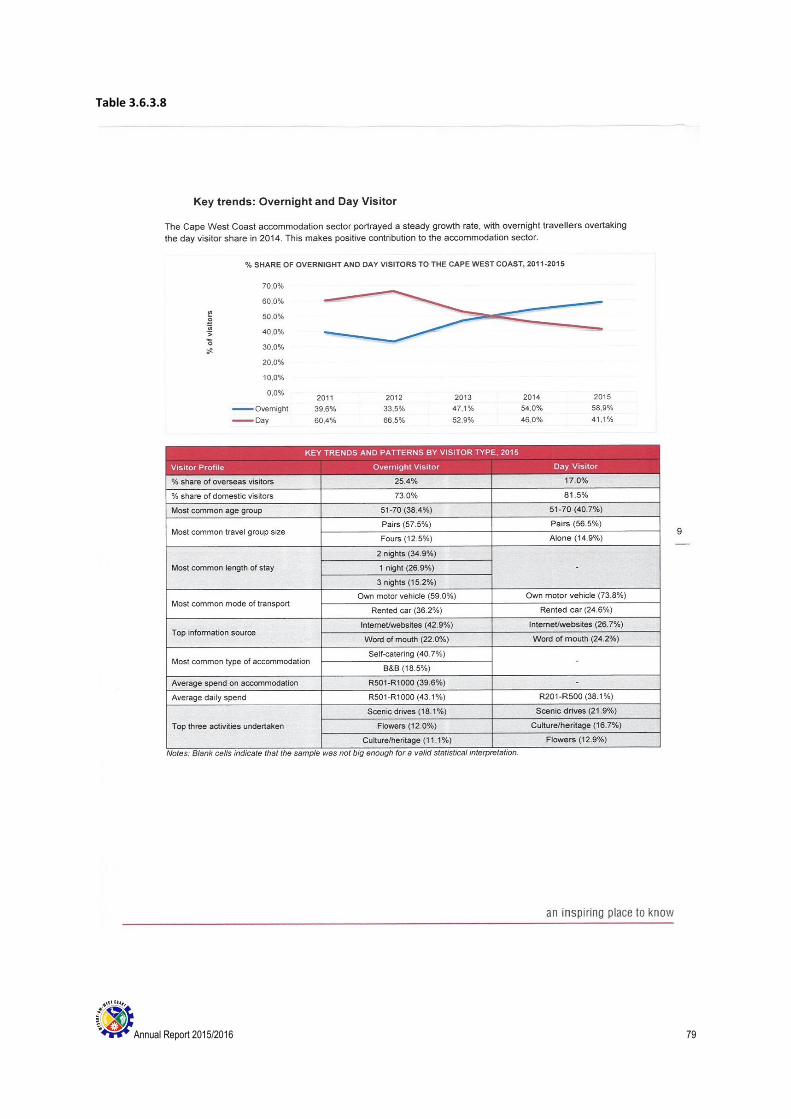
Annual Report 2015/2016 79
Table 3.6.3.8
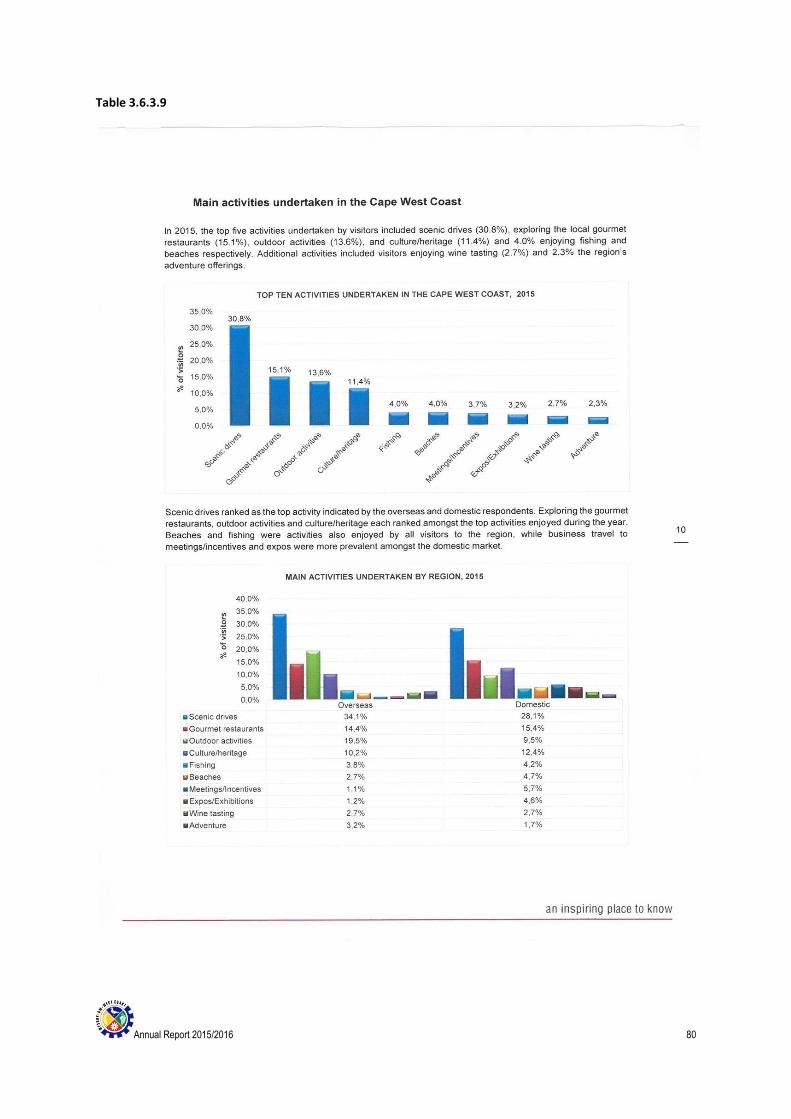
Annual Report 2015/2016 80
Table 3.6.3.9
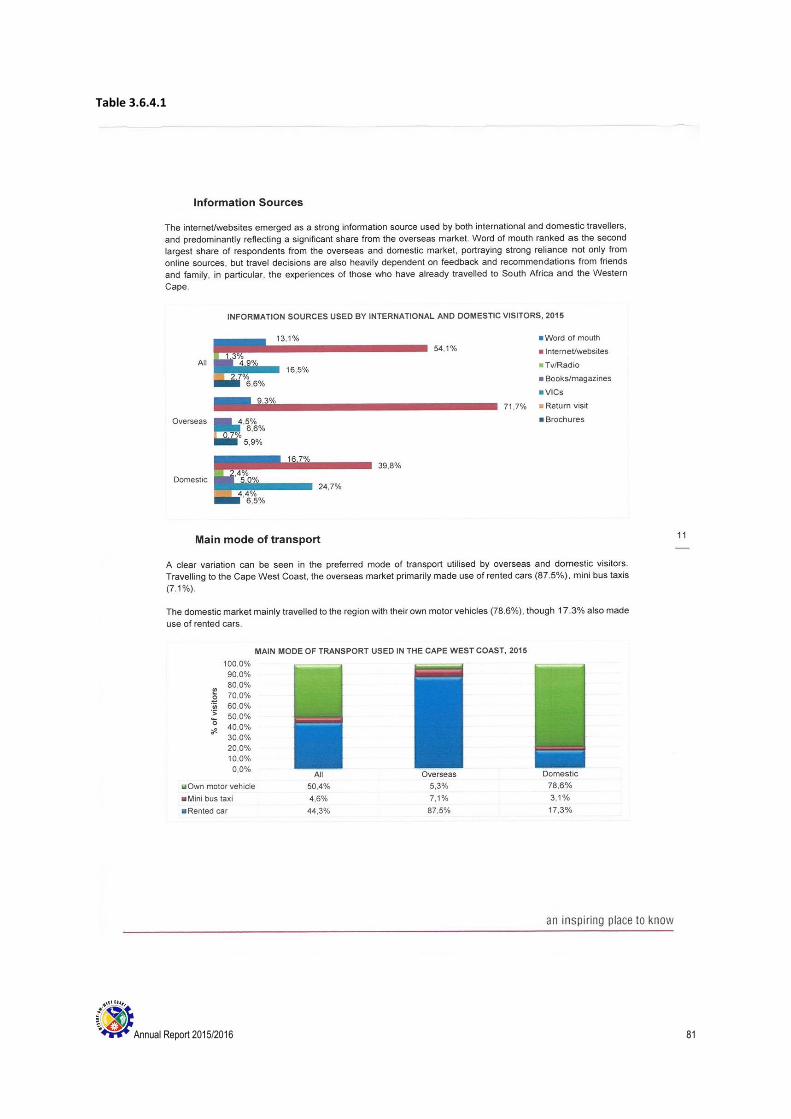
Annual Report 2015/2016 81
Table 3.6.4.1
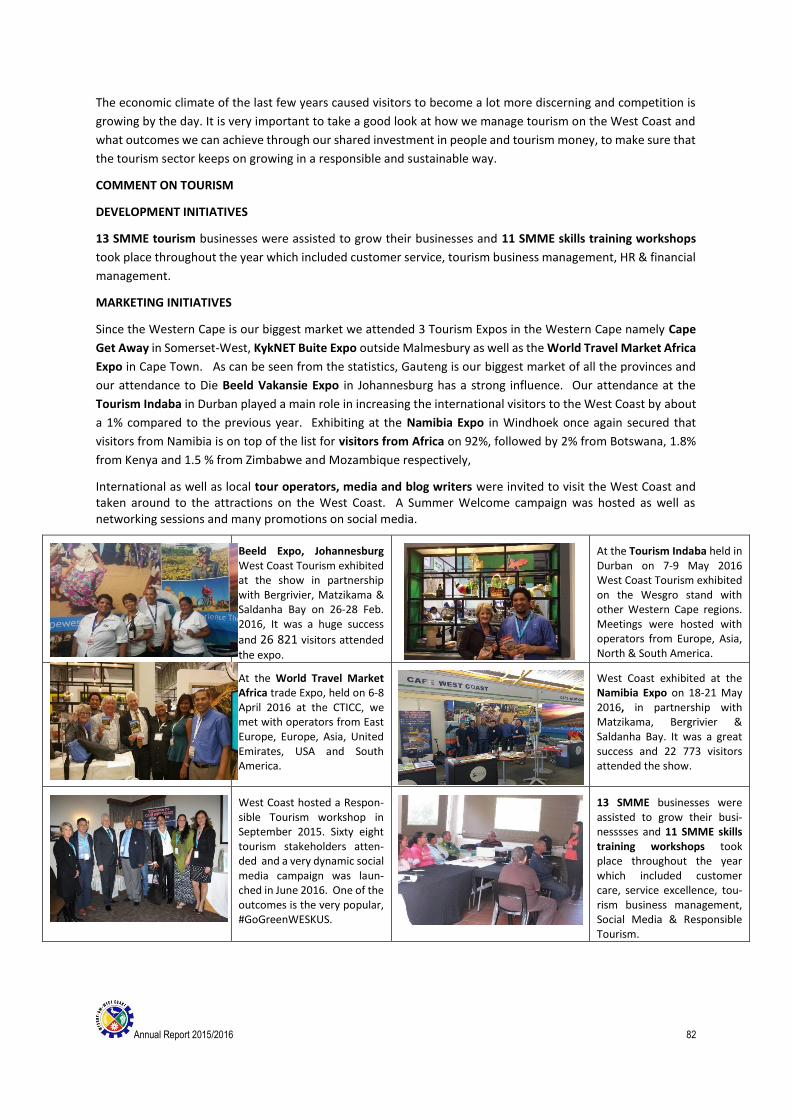
Annual Report 2015/2016 82
The economic climate of the last few years caused visitors to become a lot more discerning and competition is
growing by the day. It is very important to take a good look at how we manage tourism on the West Coast and
what outcomes we can achieve through our shared investment in people and tourism money, to make sure that
the tourism sector keeps on growing in a responsible and sustainable way.
COMMENT ON TOURISM
DEVELOPMENT INITIATIVES
13 SMME tourism businesses were assisted to grow their businesses and 11 SMME skills training workshops
took place throughout the year which included customer service, tourism business management, HR & financial
management.
MARKETING INITIATIVES
Since the Western Cape is our biggest market we attended 3 Tourism Expos in the Western Cape namely Cape
Get Away in Somerset-West, KykNET Buite Expo outside Malmesbury as well as the World Travel Market Africa
Expo in Cape Town. As can be seen from the statistics, Gauteng is our biggest market of all the provinces and
our attendance to Die Beeld Vakansie Expo in Johannesburg has a strong influence. Our attendance at the
Tourism Indaba in Durban played a main role in increasing the international visitors to the West Coast by about
a 1% compared to the previous year. Exhibiting at the Namibia Expo in Windhoek once again secured that
visitors from Namibia is on top of the list for visitors from Africa on 92%, followed by 2% from Botswana, 1.8%
from Kenya and 1.5 % from Zimbabwe and Mozambique respectively,
International as well as local tour operators, media and blog writers were invited to visit the West Coast and taken around to the attractions on the West Coast. A Summer Welcome campaign was hosted as well as networking sessions and many promotions on social media.
Beeld Expo, Johannesburg West Coast Tourism exhibited at the show in partnership with Bergrivier, Matzikama & Saldanha Bay on 26-28 Feb. 2016, It was a huge success
and 26 821 visitors attended
the expo.
At the Tourism Indaba held in Durban on 7-9 May 2016 West Coast Tourism exhibited on the Wesgro stand with other Western Cape regions. Meetings were hosted with operators from Europe, Asia, North & South America.
At the World Travel Market Africa trade Expo, held on 6-8 April 2016 at the CTICC, we met with operators from East Europe, Europe, Asia, United Emirates, USA and South America.
West Coast exhibited at the Namibia Expo on 18-21 May 2016, in partnership with Matzikama, Bergrivier & Saldanha Bay. It was a great success and 22 773 visitors attended the show.
West Coast hosted a Respon-sible Tourism workshop in September 2015. Sixty eight tourism stakeholders atten-ded and a very dynamic social media campaign was laun-ched in June 2016. One of the outcomes is the very popular, #GoGreenWESKUS.
13 SMME businesses were assisted to grow their busi-nesssses and 11 SMME skills training workshops took place throughout the year which included customer care, service excellence, tou-rism business management, Social Media & Responsible Tourism.

Annual Report 2015/2016 83
51 247 Brochures and promo- tional maps were printed and distributed at tourism expos, events and information offices. Although e-marketing is getting more dominant, many travellers still prefer brochures and especially maps.
63 Promotional activities were initiated to market the West Coast as a destination of choice to tourists, tour operators, blog writers and media from other provinces as well as other countries like India, China, Europe, North and South America.
Annual Report 2015/2016 84
Public Relations Officer
Introduction:
On 1 September 2015, the Public Relations Officer were moved to the Tourism Division in the Department: Office
of the Municipal Manager.
The aim: The aim of public relations is to improve effective communication and to also improve communication
between the different departments of the municipality, the national and provincial departments as well as
between other municipalities within the area of the Western Cape with their different communities.
Background: The most important form of communication is by distributing newsletters and information
documents within our community. From time to time there will be different workshops and exhibitions that will
be hosted by the municipality to inform the community about what is happening in our area.
A monthly internal newsletter is distributed with the payslips of the employees to ensure that everyone is up to
date with things that happen and decisions that are made within the municipality.
Effective cooperation between the different departments and the Public Relations officer has increased greatly
over the year.
The draft communication policy will be circulated for comments as soon as all the feedback has been received.
Social Media: Although the issue had been discussed at several meetings, there is still no action taken with
regards to social media. There is a SMS line that notifies the councillors of meetings that will take place. The
tourism department are making use of social media for a few years now and it has been very successful with
comments and tweets on their profiles on social media.
Advertisements: The municipality does not often make use of advertisements to promote the municipality.
Advertisements are only used as notification of meetings, road closures and important events. No
advertisements are allowed to be placed to launch or introduce the municipality in the area. This means no radio
advertisements are used to promote the municipality. This is a big problem due to the lack of finances.
Radio: The tourism department has a partnership with the Radio Cape Pulpit to promote the West Coast region
at no cost. The tourism officials do radio interviews on a weekly basis to promote and sell the West Coast Region
(See Tourism Report). Road closures are send to the radio stations to inform road users of the closed roads.
Printed Media: A number of articles were placed in the local newspaper in the past financial book year where
the municipality make use of local media to spread information. There are four local newspapers that we make
use of.
Gazette (Media24) Courant Weslander (Media24) Kontrei
17 stories 13 11 2
(These are press releases and photographs only.)
Die Weslander and the Gazette is connected to each other as Media 24 and the Gazette covers most of our
stories in the area. Notices of council meetings are published in all the local newspapers and records of the
publications are available in the archive department of the municipality. Annually, a message of congratulation
to the matriculates of the West Coast is published in the local media.
Media Releases: The most of the media releases that we received from the media were about the drought
and everything that goes with it. In May there were questions from Ons Kontrei in the Matzikama region with
regards to the drinking water that is not up to standard.
Residents of the Saldanha area always pose questions about pollution. The enquiries were answered in a media
release by the role-players that were send to the media by the Public Relations officer.

Annual Report 2015/2016 85
External Newsletters are send out quarterly to the community and other municipalities. Two are printed in black
and white and in the middle and in the end of the year the newsletter are printed in full colour. This information
in this newsletter are based on the different B-municipalities in the region and also contains full coverage on
matters and interest of our broader community.
An internal flyer is attached to the payslips of the employees each month. This flyer covers matters within the
municipality, policies and other information
Website: Most of the above mentioned articles are published on the website for the public to read. Regular
meetings are being held and attended on how to manage the website.
Meetings: The PP COMTECH (Public Participation and communication) meeting has been divided in two, with
Public Participation and Communication handled separately. These meetings are more effective and are
attended regularly. The meetings take place once every quarter and the last two meetings that took place in
Napier and Tulbagh were attended by the municipality.
Council meetings and management meetings are attended on a regular basis and decisions about the community
are conveyed through news articles, newsletters, flyers and the website.
Reports Monthly reports are compiled on the duties of the Communication Official. Work/Duty roster for the
coming week are compiled and are sent to senior official. Regular staff meetings take place to get updates on
work progress from the staff and in this way the Public Relations Officer are more involved in the projects and
events of the municipality.
Promotional Material Two new banners were printed this year and with the upcoming elections in August,
it was decided to keep the setup of the two banners until the new council is being announced. The community
development officials and the other departments make use of the materials for their projects. The contact
details of the municipality is added on all the promotional materials.
Further Training No training took place during this financial book year.
Future Communication at the West Coast District Municipality is slowly starting to make progress but there
is still room for improvement. The cooperation between the different department and the feedback are a lot
more positive.
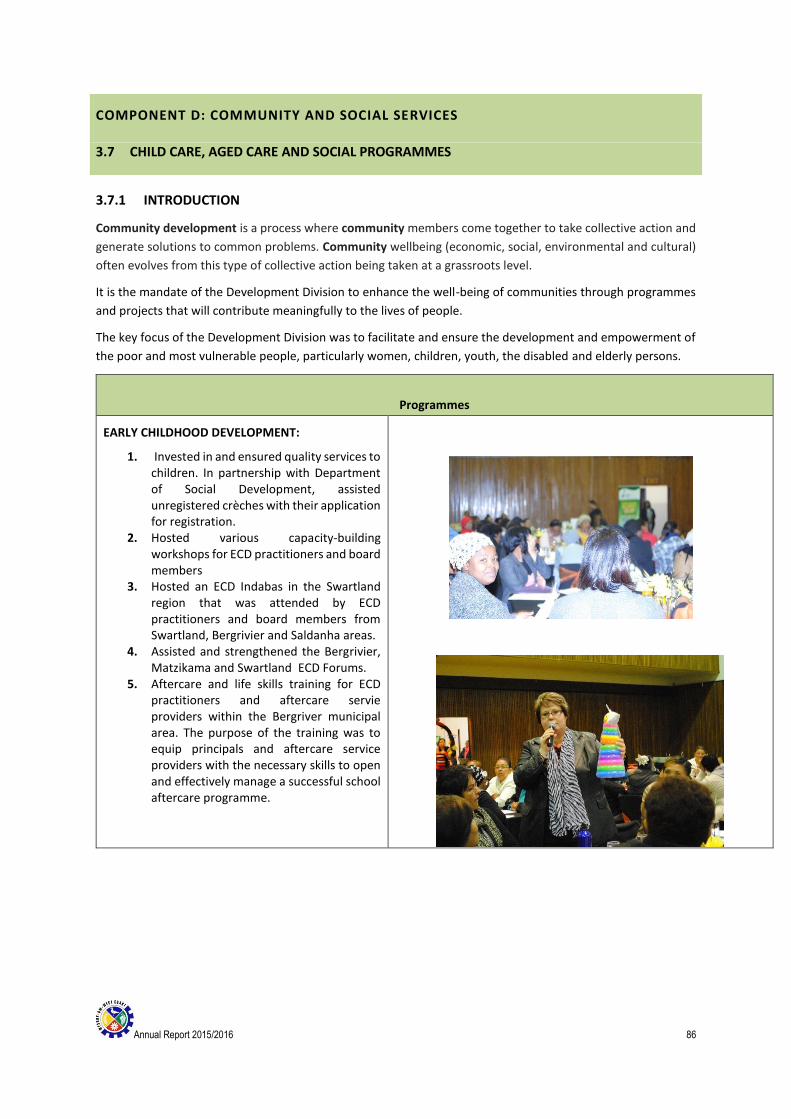
Annual Report 2015/2016 86
COMPONENT D: COMMUNITY AND SOCIAL SERVICES
3.7 CHILD CARE, AGED CARE AND SOCIAL PROGRAMMES
3.7.1 INTRODUCTION
Community development is a process where community members come together to take collective action and
generate solutions to common problems. Community wellbeing (economic, social, environmental and cultural)
often evolves from this type of collective action being taken at a grassroots level.
It is the mandate of the Development Division to enhance the well-being of communities through programmes
and projects that will contribute meaningfully to the lives of people.
The key focus of the Development Division was to facilitate and ensure the development and empowerment of
the poor and most vulnerable people, particularly women, children, youth, the disabled and elderly persons.
Programmes
EARLY CHILDHOOD DEVELOPMENT:
1. Invested in and ensured quality services to children. In partnership with Department of Social Development, assisted unregistered crèches with their application for registration.
2. Hosted various capacity-building workshops for ECD practitioners and board members
3. Hosted an ECD Indabas in the Swartland region that was attended by ECD practitioners and board members from Swartland, Bergrivier and Saldanha areas.
4. Assisted and strengthened the Bergrivier, Matzikama and Swartland ECD Forums.
5. Aftercare and life skills training for ECD practitioners and aftercare servie providers within the Bergriver municipal area. The purpose of the training was to equip principals and aftercare service providers with the necessary skills to open and effectively manage a successful school aftercare programme.
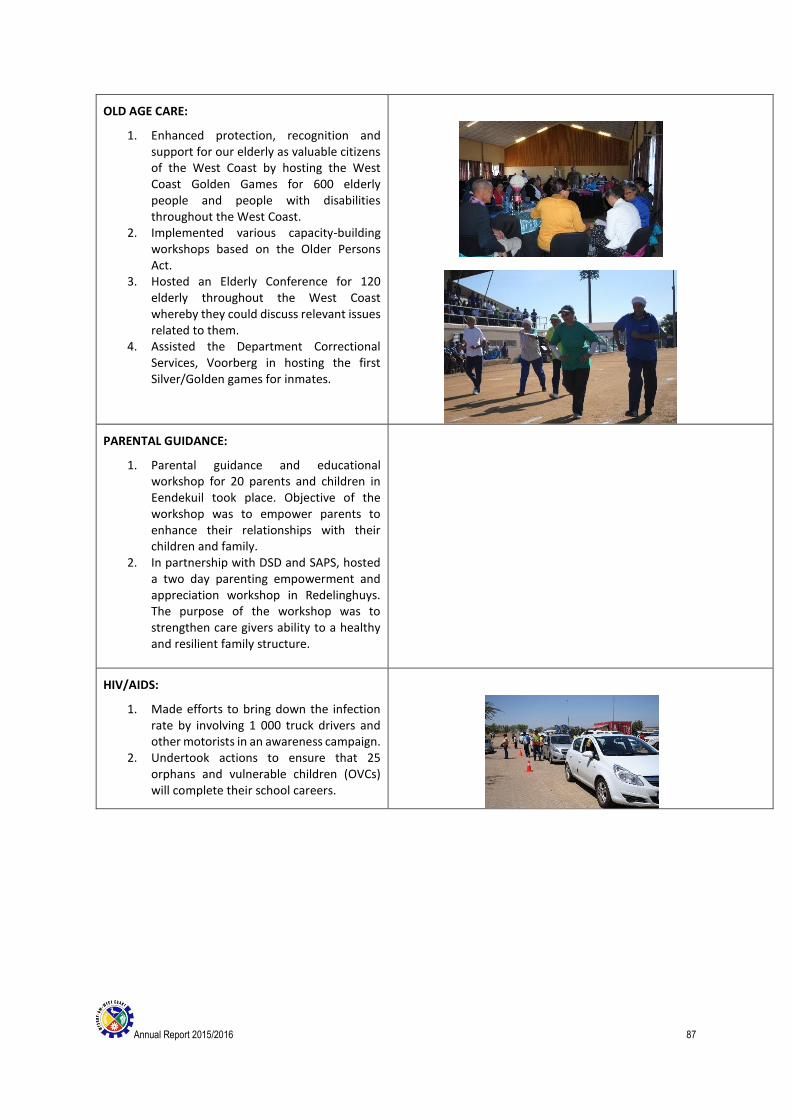
Annual Report 2015/2016 87
OLD AGE CARE:
1. Enhanced protection, recognition and support for our elderly as valuable citizens of the West Coast by hosting the West Coast Golden Games for 600 elderly people and people with disabilities throughout the West Coast.
2. Implemented various capacity-building workshops based on the Older Persons Act.
3. Hosted an Elderly Conference for 120 elderly throughout the West Coast whereby they could discuss relevant issues related to them.
4. Assisted the Department Correctional Services, Voorberg in hosting the first Silver/Golden games for inmates.
PARENTAL GUIDANCE:
1. Parental guidance and educational workshop for 20 parents and children in Eendekuil took place. Objective of the workshop was to empower parents to enhance their relationships with their children and family.
2. In partnership with DSD and SAPS, hosted a two day parenting empowerment and appreciation workshop in Redelinghuys. The purpose of the workshop was to strengthen care givers ability to a healthy and resilient family structure.
HIV/AIDS:
1. Made efforts to bring down the infection rate by involving 1 000 truck drivers and other motorists in an awareness campaign.
2. Undertook actions to ensure that 25 orphans and vulnerable children (OVCs) will complete their school careers.

Annual Report 2015/2016 88
CULTURE: • Launch of 2016 art calender with the
theme “Salt of the earth”. The purpose of the project was : - Publish artworks of young children - Showcase talents in West Coast - Unique West Coast product that can contribute to marketing of region - Outputs of this piece of work will help us better articulate the value of arts and culture and reinforce the role it plays in our society - Contribute to building the holistic case for arts and culture
SUBSTANCE ABUSE:
1. Strengthened and promoted drug abuse prevention.
2. Implemented awareness campaigns focusing on the impact of substance abuse on vulnerable families especially in Velddrif and Citrusdal areas.
3. Trained and strengthened support groups for substance abuse prevention.
4. Support initiatives by the Swartland LDAC
INTERNATIONAL OUTREACH:
WCDM signed an agreement with the organisation
KIEZ in Quedlingburg, Germany. During July 2015,
12 youth from the West Coast attended an
international youth camp in Blankenburg, Germany.
The goal of the camp was to encourage tolerance
between cultures, develop leadership, broaden
learners’ vision and expand learners’ feeling of
responsibility for the immediate environment to the
rest of the world.
During October 2015 the West Coast District
Municipality accommodated 26 Germans who
visited the West Coast for 12 days. During their visit,
they were introduced to historical places and sights
within the West Coast.
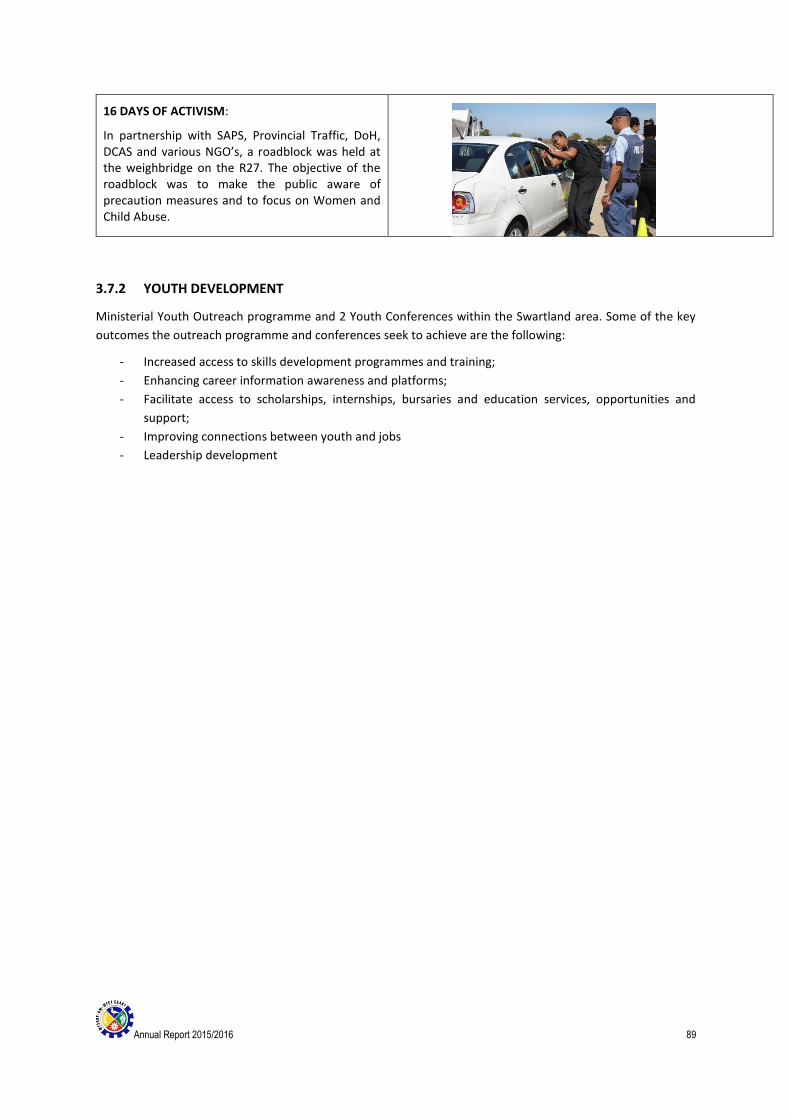
Annual Report 2015/2016 89
16 DAYS OF ACTIVISM:
In partnership with SAPS, Provincial Traffic, DoH, DCAS and various NGO’s, a roadblock was held at the weighbridge on the R27. The objective of the roadblock was to make the public aware of precaution measures and to focus on Women and Child Abuse.
3.7.2 YOUTH DEVELOPMENT
Ministerial Youth Outreach programme and 2 Youth Conferences within the Swartland area. Some of the key
outcomes the outreach programme and conferences seek to achieve are the following:
- Increased access to skills development programmes and training;
- Enhancing career information awareness and platforms;
- Facilitate access to scholarships, internships, bursaries and education services, opportunities and
support;
- Improving connections between youth and jobs
- Leadership development

Annual Report 2015/2016 90
Table 3.7.1: Financial performance development (R’000)
Financial Performance Development
Details
2014/2015 2015/2016
Actual Original budget
Adjustments budget
Actual Variance from budget
Total Operating Revenue - - - - -
Expenditure:
Employees 2 242 184 2 643 010 2 643 010 2 577 979 97.54%
Repairs and maintenance - - - - -
Other 840 744 806 820 806 820 635 087 78.71%
Total Operating Expenditure 3 082 928 3 449 830 3 449 830 3 213 066 93.14%
Net Operating Expenditure
T3.7.2

Annual Report 2015/2016 91
COMPONENT E: ENVIRONMENTAL PROTECTION
3.8 POLLUTION CONTROL (AIR QUALITY)
3.8.1 INTRODUCTION
The National Environmental Management Air Quality Act, 2004 (Act 39 of 2004) came into full effect on 1 April
2010.
Section 17 of the Act places an obligation on organs of state to submit an annual report. Each sphere of
government, which also includes local government as defined in terms of Section 239 of the Constitution (Act
108 of 1996), must report on the implementation of its air quality management plan, including information on:
air quality management initiatives undertaken by it during the reporting period;
the level of its compliance with ambient air quality standards;
measures taken by it to secure compliance with those standards; and
its air quality monitoring activities.
3.8.2 Air Quality Management Planning:
An Air Quality Management Plan (AQMP) was approved by Council in November 2011 and included in the IDP.
An Air Quality Management By – law for the WCDM has also been gazetted on 06 September 2013. The AQMP
will be reviewed during the 2016/2017 financial.
The following issues were identified in the AQMP that require attention:
INTERVENTION TIME FRAME IMPLEMENTATION
Implementation of human resources
Appoint Chief Air Quality
Officer
Short term Manager: Air Quality officially placed: 06 July 2012
Appoint an Air Quality
Officer
Short term Senior Air Quality Officer appointed 01 December 2012
Appoint an Air Quality
Technician
Short to medium
term
Not implemented. Personnel structure to be amended to make
provision for second Air Quality Officer to be appointed in future.
This should receive attention during the 2017/2018 financial
year.
Implementation of Air Quality Management Tools
Emissions Inventory Short to long term. DEA published legislation and established an internet based
national atmospheric emissions inventory system requiring
industry and local government to report to the system on an
annual basis. The emissions inventory for the District consists of
listed activities licenced in terms of NEM: AQA.
Dispersion modelling Medium to long
term
When required external expertise will be appointed to conduct
dispersion modelling. Will have to budget for this.
Implementation of Air Quality monitoring
Ambient air quality
monitoring network
Medium to long
term.
Some ambient air quality monitoring done by industry in
Saldanha and Provincial monitoring station in St Helena Bay and
Malmesbury. Saldanha Bay Municipality established an ambient
monitoring network comprising of two monitoring stations for

Annual Report 2015/2016 92
criteria pollutants as well as seven dust fallout monitors. The
District has entered into a MoU with Local Municipalities to
facilitate future ambient air monitoring initiatives. The WCDM
also made provision on the 2016/2017 budget for an ambient air
monitoring station to be placed in the Laaiplek area measuring
amongst others H2S.
Emission Reduction / Control Strategies
Reduce / control
domestic fuel burning
Short to long term.
Local Municipalities
to address.
Promote the use of renewable energy and create awareness.
This issue will receive further attention through the Joint
Municipal Air Quality Working Group (JMAQWG) established to
improve the working relationship between District and Local
Municipalities.
Control of
transportation
emissions.
Short to long term.
Local Municipalities
in terms of By-laws.
Do vehicle count and diesel vehicle testing. To be further
discussed between District and Local Municipal Air Quality
Officers during JMAQWG meetings.
Control of emissions
from mining activities.
Short to long term.
Local Municipalities
with assistance
from District and
Province.
Control of dust. Local Municipal Air Quality Officers to apply
National Dust Control Regulations and request dust control plan
and dust fallout monitoring. To be further discussed at JMAQWG
meetings.
Control of emissions
from agricultural
activities.
Local Municipalities
with assistance
from District and
Agriculture.
Control of dust and open burning in terms of Local Municipal By-
laws. Is receiving limited attention through interaction with
Provincial Department and Agriculture. Local Municipal Air
Quality Officers also encouraged through the JMAQWG
meetings to provide input when applications for burning permits
are considered by WCDM Fire Chief.
Control of emissions
from industrial activities.
Short to long term.
District and Local
Municipalities
responsibility.
Licensing of listed activities done by District. Emissions standards
enforced through issuing of licences. Emissions from small fuel
burning appliances and non-listed industrial activities to be
controlled by Local Municipalities through application of their Air
Pollution Control By-laws. To be further encouraged through
interaction at the JMAQWG meetings.
Control of emissions
from waste treatment
disposal activities.
Short to long term.
Local Municipalities
and District with
assistance from
Provincial
Government.
Incineration controlled through licensing in terms of Air Quality
Act emission standards. Landfills still to be properly controlled
by Local Municipalities with assistance from District and
Provincial Government in terms of the Waste Act. To be further
discussed at JMAQWG meetings.
Control of emissions
from biomass burning
i.e. veld fires.
Short to long term.
Local and District
Municipality’s
responsibility.
Strict control over veld fires whether naturally occurring or due
to planned burning should be implemented. Local Municipal Air
Quality Officers encouraged through the JMAQWG meetings to
provide input when applications for burning permits are
considered by WCDM Fire Chief.
A Memorandum of Understanding (MoU) has been entered into between District and Local Municipalities and
a Joint Municipal Air Quality Working Group (JMAQWG) has been established during February 2015. The division
of functions between District and Local Municipalities has been finalised and included in the MoU which also

Annual Report 2015/2016 93
serves as terms of reference for the working group. The JMAQWG meets on quarterly intervals and since the
first meeting in February 2015 a total of 6 meetings have thus far been held.
With regards to the implementation of the AQMP it is important to note that a Manager: Air Quality and Senior
Air Quality Officer has been appointed and that awareness raising is being done through the establishment of
working groups and environmental stakeholders forums.
The main function of the West Coast District Municipality is the licensing of listed activities assigned to it in terms
of the National Environmental Management: Air Quality Act. Emission standards established in terms of the Air
Quality Act are enforced through licence conditions.
3.8.3 Challenges:
Animal matter processing whereby fish and fish offcuts are processed to fishmeal give rise to offensive odours
that result in public complaints. These industries are regulated through licence conditions and are required to
apply best practices to control odorous emissions.
Another major issue is the storage and handling of iron ore through the Saldanha Port that result in staining of
private and public property. The staining issue has resulted in the establishment of an action group by certain
public members and the issue has been escalated to the office of the MEC by the group. An Atmospheric
Emission Licence (AEL) was issued on 05 February 2016 followed by a public meeting on 09 March 2016 where
the WCDM presented on AEL conditions, the licence holder on AEL conditions and compensation issues and the
Western Cape Government on enforcement and compliance. The public meeting was attended by approximately
200 people. A member of public also lodged a complaint with the Public Protector whom requested certain
information.
Figure 3.8.4 Map indicating location of listed activities within the West Coast District area:
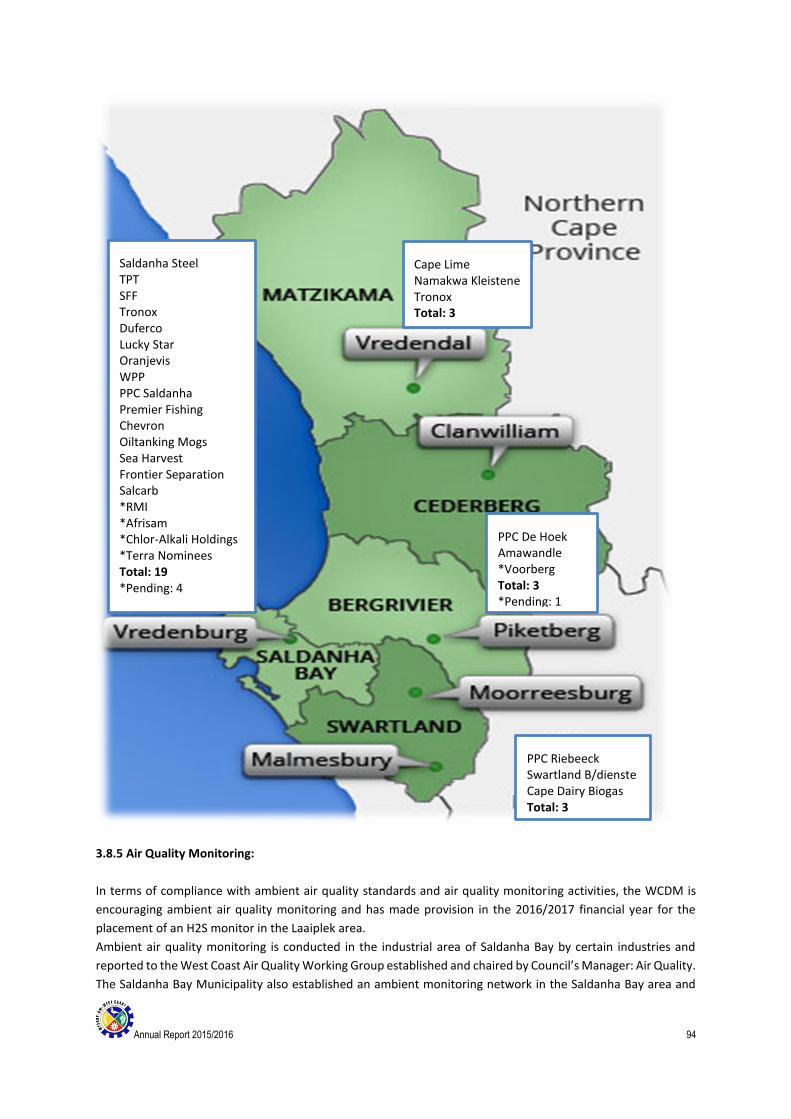
Annual Report 2015/2016 94
3.8.5 Air Quality Monitoring:
In terms of compliance with ambient air quality standards and air quality monitoring activities, the WCDM is
encouraging ambient air quality monitoring and has made provision in the 2016/2017 financial year for the
placement of an H2S monitor in the Laaiplek area.
Ambient air quality monitoring is conducted in the industrial area of Saldanha Bay by certain industries and
reported to the West Coast Air Quality Working Group established and chaired by Council’s Manager: Air Quality.
The Saldanha Bay Municipality also established an ambient monitoring network in the Saldanha Bay area and
Saldanha Steel TPT SFF Tronox Duferco Lucky Star Oranjevis WPP PPC Saldanha Premier Fishing Chevron Oiltanking Mogs Sea Harvest Frontier Separation Salcarb *RMI *Afrisam *Chlor-Alkali Holdings *Terra Nominees Total: 19 *Pending: 4
Cape Lime Namakwa Kleistene Tronox Total: 3
PPC De Hoek Amawandle *Voorberg Total: 3 *Pending: 1
PPC Riebeeck Swartland B/dienste Cape Dairy Biogas Total: 3

Annual Report 2015/2016 95
placed two ambient monitoring stations and seven dust fallout buckets. Results from these stations are also
reported to the quarterly West Coast Air Quality Working Group meetings. In terms of the National Framework
for Air Quality Management the Saldanha Bay area has been listed as an area of poor air quality and therefor
the majority of stations are found in this area of concern. The ambient air monitoring network established by
the Saldanha Bay Municipality will also provide important background information for industrial development
resulting from the IDZ approval in the area.
Ambient air quality results as well as dust fallout levels recorded by the Saldanha Bay monitoring stations
indicated compliance with national standards.
Number of ambient air monitoring stations Location
4 x Industrial owned stations Saldanha and Vredenburg
2 x DEA&DP owned stations St Helena Bay and Malmesbury
2 x Saldanha Bay Municipality owned stations Saldanha and Vredenburg
3.8.6 Section 21 Listed Activities – Atmospheric Emission Licensing
List of AEL applications received and / or processed during reporting period:
APPLICANT APPLICATION DATE DATE ISSUED STATUS
Terra Nominees 09/09/2015 Pending Pending
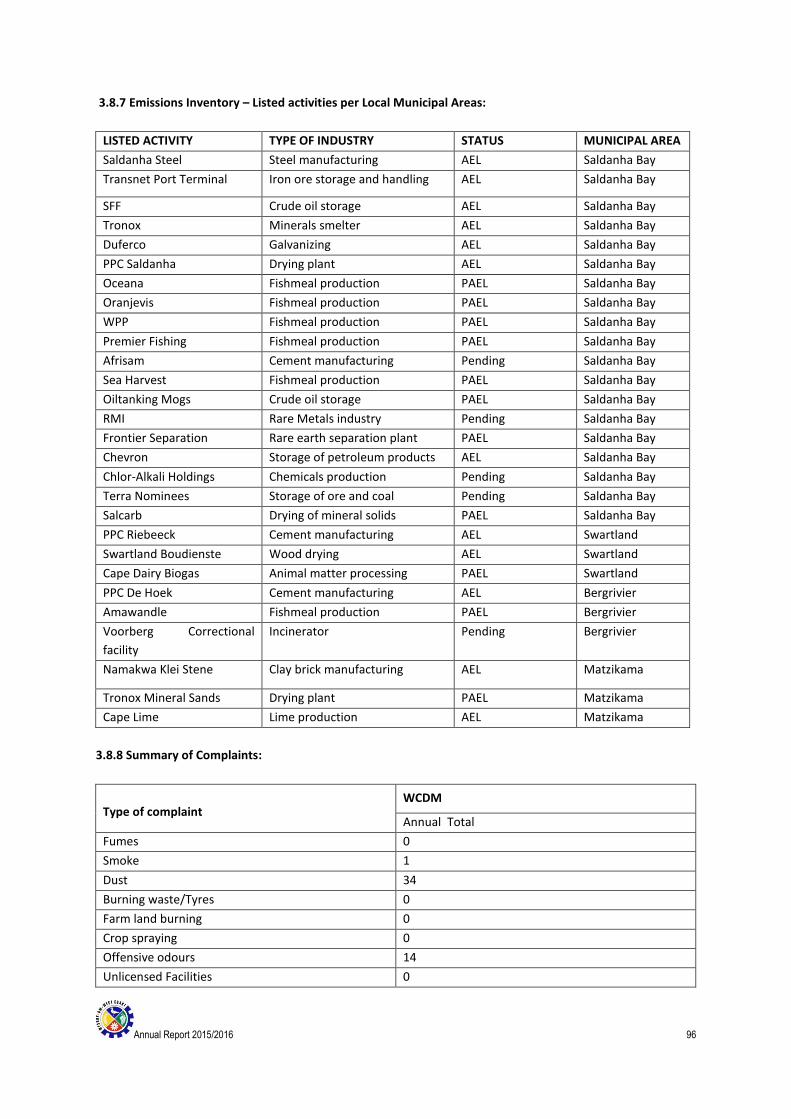
Annual Report 2015/2016 96
3.8.7 Emissions Inventory – Listed activities per Local Municipal Areas:
LISTED ACTIVITY TYPE OF INDUSTRY STATUS MUNICIPAL AREA
Saldanha Steel Steel manufacturing AEL Saldanha Bay
Transnet Port Terminal Iron ore storage and handling AEL Saldanha Bay
SFF Crude oil storage AEL Saldanha Bay
Tronox Minerals smelter AEL Saldanha Bay
Duferco Galvanizing AEL Saldanha Bay
PPC Saldanha Drying plant AEL Saldanha Bay
Oceana Fishmeal production PAEL Saldanha Bay
Oranjevis Fishmeal production PAEL Saldanha Bay
WPP Fishmeal production PAEL Saldanha Bay
Premier Fishing Fishmeal production PAEL Saldanha Bay
Afrisam Cement manufacturing Pending Saldanha Bay
Sea Harvest Fishmeal production PAEL Saldanha Bay
Oiltanking Mogs Crude oil storage PAEL Saldanha Bay
RMI Rare Metals industry Pending Saldanha Bay
Frontier Separation Rare earth separation plant PAEL Saldanha Bay
Chevron Storage of petroleum products AEL Saldanha Bay
Chlor-Alkali Holdings Chemicals production Pending Saldanha Bay
Terra Nominees Storage of ore and coal Pending Saldanha Bay
Salcarb Drying of mineral solids PAEL Saldanha Bay
PPC Riebeeck Cement manufacturing AEL Swartland
Swartland Boudienste Wood drying AEL Swartland
Cape Dairy Biogas Animal matter processing PAEL Swartland
PPC De Hoek Cement manufacturing AEL Bergrivier
Amawandle Fishmeal production PAEL Bergrivier
Voorberg Correctional
facility
Incinerator Pending Bergrivier
Namakwa Klei Stene Clay brick manufacturing AEL Matzikama
Tronox Mineral Sands Drying plant PAEL Matzikama
Cape Lime Lime production AEL Matzikama
3.8.8 Summary of Complaints:
Type of complaint WCDM
Annual Total
Fumes 0
Smoke 1
Dust 34
Burning waste/Tyres 0
Farm land burning 0
Crop spraying 0
Offensive odours 14
Unlicensed Facilities 0
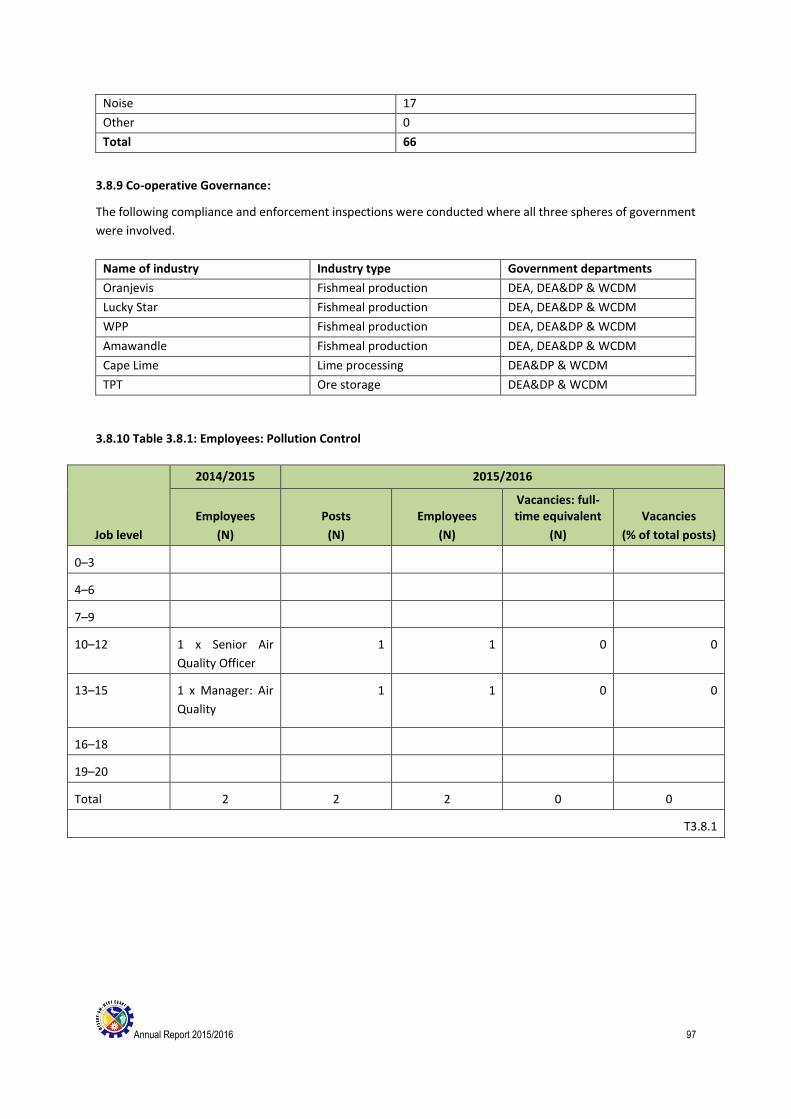
Annual Report 2015/2016 97
Noise 17
Other 0
Total 66
3.8.9 Co-operative Governance:
The following compliance and enforcement inspections were conducted where all three spheres of government
were involved.
Name of industry Industry type Government departments
Oranjevis Fishmeal production DEA, DEA&DP & WCDM
Lucky Star Fishmeal production DEA, DEA&DP & WCDM
WPP Fishmeal production DEA, DEA&DP & WCDM
Amawandle Fishmeal production DEA, DEA&DP & WCDM
Cape Lime Lime processing DEA&DP & WCDM
TPT Ore storage DEA&DP & WCDM
3.8.10 Table 3.8.1: Employees: Pollution Control
Job level
2014/2015 2015/2016
Employees
(N)
Posts
(N)
Employees
(N)
Vacancies: full-time equivalent
(N)
Vacancies
(% of total posts)
0–3
4–6
7–9
10–12 1 x Senior Air
Quality Officer
1 1 0 0
13–15 1 x Manager: Air
Quality
1
1
0
0
16–18
19–20
Total 2 2 2 0 0
T3.8.1

Annual Report 2015/2016 98
ENVIRONMENTAL INTEGRITY
3.9.1 INTRODUCTION
CLIMATE CHANGE FRAMEWORK FOR THE WCDM Aurecon presented the completed Climate Change Framework for the WCDM, at the Mayoral Committee meeting dated 25 September 2014. The Framework was adopted and approved at the Mayoral Committee meeting dated the 18th of March 2015. DEADP’s Municipal Support Programme did an excellent presentation on the 7th of April 2015 to discuss the way forward with the implementation of the completed framework with the Councillors. It was agreed at the end of the workshop that each Councillor that represents a local municipality would take the Climate Change Framework to their respective local Councils to also be adopted locally.
COASTAL MANAGEMENT (ICM ACT 24 of 2009)
The West Coast Municipal Coastal Management Plan (CMP) is complete and was approved by Council on the 28th of August 2013 at the Council Meeting.
EPWP PROJECTS – EAC/Social/Infrastructure (Coastal Management/Alien Clearing) Good progresses are still being made regarding the removal of alien vegetation from the Bergriver/Misverstand area. This EPWP – Environmental Sector Project - is run in partnership with Agriculture (Landcare), Cape Winelands DM, the Lower Berg River Irrigation Board, and the Department of Water Affairs (Working for Water Programme). The project still focuses on the removal of alien trees and assisting with the clearing of excessive reed in the area. EPWP Environmental Sector teams are all assisting with the implementation of Coastal Management functions as per WCDM Coastal Management Plan (ICM Act). Young alien tree branches are also currently being utilized at Yzerfontein for to assist as dune rehabilitation material. Good feedback and progress has been made during the last two months. An EPWP District Forum meeting was attended on the 6th of September 2012 where feedback and a presentation were given to the Province regarding the Bergriver Alien Clearing Programme. A site visit was also conducted at the project after the meeting closed. The EPWP Grand Agreement is in place but the policy still need to be signed and is still outstanding. Funding from the EPWP was received on the 15th of August 2012 and will be utilized ASAP to appoint additional beneficiaries to the project, which will include, protective clothing, equipment, transport, salaries and relevant training in the form of first aid, health and safety, and chain saw operation courses.
WfW PROJECTS - ALIEN VEGETATION REMOVAL A Working for Water agreement was entered into between Dept Env Affairs and the WCDM being the Implementing Agent (IA) which started the 1st of October 2014. Working for Water beneficiaries had their induction done by WfW officials form the Dept of Env Affairs and the beneficiaries are currently being trained as part of the program for health and safety, first aid, chain saw, herbicide and water safety as required in terms of the program. The following WfW Alien Clearing projects are currently running (with the amount of beneficiaries in brackets): Goedverwacht (10), Bergrivier (9), Hopefield (12). The following WfW Alien Clearing projects are currently running (with the amount of beneficiaries in brackets): Bergrivier (10), Hopefield (11). A total amount of R 461 604 was transferred to the WCDM as a grand to be used till 30 June 2015 to further the implementation of the WfW program for 2015 as stipulated in the approved agreement between WfW and WCDM.
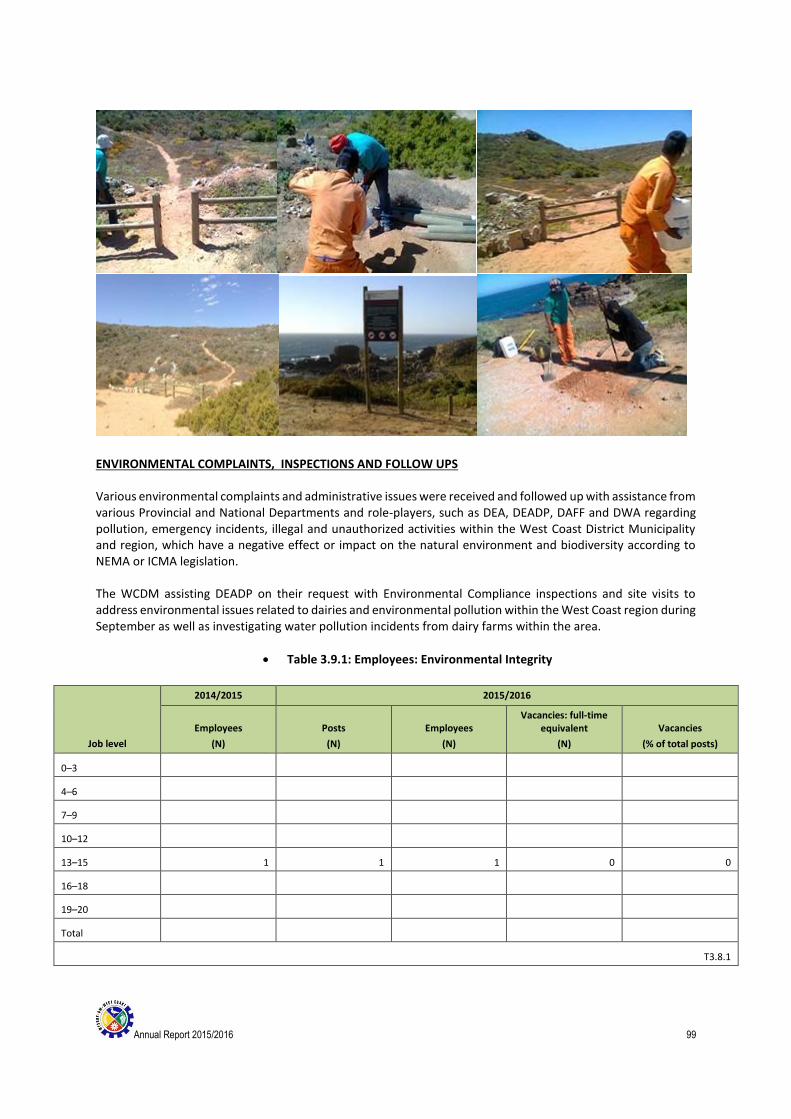
Annual Report 2015/2016 99
ENVIRONMENTAL COMPLAINTS, INSPECTIONS AND FOLLOW UPS Various environmental complaints and administrative issues were received and followed up with assistance from various Provincial and National Departments and role-players, such as DEA, DEADP, DAFF and DWA regarding pollution, emergency incidents, illegal and unauthorized activities within the West Coast District Municipality and region, which have a negative effect or impact on the natural environment and biodiversity according to NEMA or ICMA legislation. The WCDM assisting DEADP on their request with Environmental Compliance inspections and site visits to address environmental issues related to dairies and environmental pollution within the West Coast region during September as well as investigating water pollution incidents from dairy farms within the area.
Table 3.9.1: Employees: Environmental Integrity
Job level
2014/2015 2015/2016
Employees
(N)
Posts
(N)
Employees
(N)
Vacancies: full-time equivalent
(N)
Vacancies
(% of total posts)
0–3
4–6
7–9
10–12
13–15 1 1 1 0 0
16–18
19–20
Total
T3.8.1
Annual Report 2015/2016 100
Table 3.9.2: Financial performance: EPWP (R’000)
Financial Performance: EPWP
Details
2014/2015 2015/2016
Actual Original budget
Adjustments budget
Actual Variance from budget
Total Operating Revenue - - 1 000 000 994 329 99.43%
Expenditure:
Employees - - 952 000 933 534 98.06%
Repairs and maintenance - - 8 000 885 11.05%
Other - - 40 000 26 015 65.04%
Total Operating Expenditure - - 1 000 000 960 434 96.04%
Net Operating Expenditure
T3.9.2
Table 3.9.3: Capital expenditure: Environmental Integrity (R’000)
Capital projects
2015/2016
Budget Adjustment
budget Actual
expenditure
Variance
from origina
l budget
Total project value
Total all
Education and awareness R 50 000 R 50 000 R 50 000
Estuary management R 50 000 R 50 000 R 50 000
Coastal management R 100 000 R 90 000 R 90 000
Alien vegetation removal & clean-ups R 100 000 R 100 000 R 100 000
External Grants:
EPWP Program (Alien & Coastal Mngt) R 250 000 R 250 000 R 250 000
WFW Programme R 1 143 488
R 1 143
488 R 1 143 488
T3. 9.3

Annual Report 2015/2016 101
COMPONENT F: HEALTH
3.10 HEALTH INSPECTIONS, FOOD LICENSING AND FOOD INSPECTIONS
3.10.1 INTRODUCTION
The Division of Environmental Health, being aware of the constitutional right of every person to an environment
that is not harmful to his or her health or well-being, and the principles that underlie the National Health Act,
2003 (Act 61 of 2003) and the National Environmental Management Act, 1998 (Act 107 of 1998), aims to protect
and promote the health and well-being of all our residents in the West Coast District Municipal region by
providing, in accordance with applicable laws, a sustainable, effective and responsible environmental health
service.
Section 24 of the Constitution of South Africa, 1996 (Act 108 of 1996) states that every resident of our country
has the right to an environment that is not harmful to his or her health and well-being. All local authorities in the
West Coast District Municipal region still face the challenge to ensure such an environment to its residents.
Environmental health denotes a condition of optimal wholesomeness of the environment in which man exists
and interacts with others in the lowest possible presence or total absence of any stimuli detrimental to human
health.
The Division of Environmental Health is therefore responsible for the identification, evaluation, control and
prevention of those factors that can be detrimental to people’s health and well-being. In terms of the above-
mentioned Acts, the functions of the Environmental Health Services are as follows:
1) Waste management and monitoring
2) Food control
3) Control of premises
4) Communicable disease control
5) Vector control
6) Environmental pollution control
7) Chemical safety
8) Disposal of the dead
Annual Report 2015/2016 102
Table 3.10.1: Employees: Environmental Health –Health Inspection
Job level
2014/2015 2015/2016
Employees
(N)
Posts
(N)
Employees
(N)
Vacancies: full-time equivalent
(N)
Vacancies
(% of total posts)
0–3 3 4 4 -- --
4–6 1 0 0 -- --
7–9 1 1 1 -- --
10–12 23 24 23 1.064 2.857
13–15 5 5 5 -- --
16–18 1 1 1 -- --
19–20 -- -- -- -- --
Total 33 35 34 1.064 2.857
T3.10.1
Table 3.10.2: Financial performance: Environmental Health (R’000)
Financial Performance: Environmental Health
Details
2014/2015 2015/2016
Actual Original budget
Adjustments budget
Actual Variance from budget
Total Operating Revenue 6 594 861 7 863 700 8 043 700 7 204 199 89.56%
Expenditure:
Employees 15 426 090 17 567 510 17 747 510 16 228 062 91.44%
Repairs and maintenance 33 432 31 000 37 000 17 269 46.67%
Other 1 924 463 1 565 250 1 559 250 1 275 483 81.80%
Total Operating Expenditure 17 383 985 19 163 760 19 343 760 17 520 814 90.58%
Net Operating Expenditure
T3.10.2
Annual Report 2015/2016 103
COMPONENT G: SECURITY AND SAFETY
3.11 FIRE SERVICES
3.11.1 INTRODUCTION
For the second consecutive year it can be reported that the 2015/2016 year was a fairly quiet year for the Fire
and Rescue Services of the West Coast District Municipality in relation to the attendance of wildland fires. In the
2013/2014 summer season it was reported that it could have been due to the frequent and abnormal amount
of rain that fell during the summer. For the 2014/2015 and 2015/2016 season, although dry conditions was
experienced throughout the District the low frequency of major fires can be attributed to the cooperation
between the members of the Fire Protection Association (FPA) and the Fire Service. FPA members have acted
apon the responsibilities placed on them through the National Veld and Forest Fire Act, making it easier to
change the strategy, as was followed for the last few years, form fighting fires to managing fires to a point where
it can be extinguished safely and at minimal cost.
The Fire and Rescue Services of the West Coast District Municipality attended to a total of 1 696 incidents. A
total of 9 149 man hours were spent on these incidents. The man hours listed does not include the time spent
on training, fire prevention and public training activities. These activities and the attending to incidences are
provided by this Service to the communities within the boundaries of the West Coast District Municipality,
including six fire stations (Malmesbury, Moorreesburg, Piketberg, Vredenburg, Clanwilliam and Vredendal)
throughout the District and a staff complement of 60 fire fighters (1 x chief fire officer, 6 x station officers, 5 x
platoon officer and 48 x fire fighters) and 31 fire fighting vehicles.
The West Coast District Municipality Fire and Rescue Services is still the only professional full-time fire and rescue
service for the whole of the West Coast District Municipality and renders services in the areas of our local
municipalities through memoranda of understanding.
As from 1 April 2014, the West Coast District Municipality entered into a three-year contract with Saldanha Bay
Municipality, whereby the West Coast District Municipality will render a professional fire and rescue service on
behalf of Saldanha Bay Municipality. In the process, the West Coast District Municipality will also assist Saldanha
Bay Municipality in building its own service for the future. Since the inception of the agreement 12 x Fire Fighters
were appointed on behalf of Saldanha Bay Municipality and are we in the process of establishing 2 x Satellite
Fire Stations in Hopefield and Tabak Bay.
3.11.2 OPERATIONAL MATTERS
As mentioned, the Fire and Rescue Services of the West Coast District attended to a total of 1 696 incidents
during the 2015/2016 year. This service is still assisting Emergency Management Services (EMS) and Metro in
responding to medical incidents when an ambulance is not immediately available. This arrangement is only for
priority one emergencies.
As mentioned previously, the 2014/2015 and 2015/2016 season was fairly quiet, in relation to what was
experienced in the other Districts. Yet again mention must be made of the cooperation between the members
of the FPA and the Fire Service. During the 2015/2016 summer season this Department attended to 12 major
fires which burnt a total area of 42 500 hectares. Most of this was natural fynbos which were due to burn
because of the natural cycle. Only two of the fires continued for more than 5 days before it could be brought
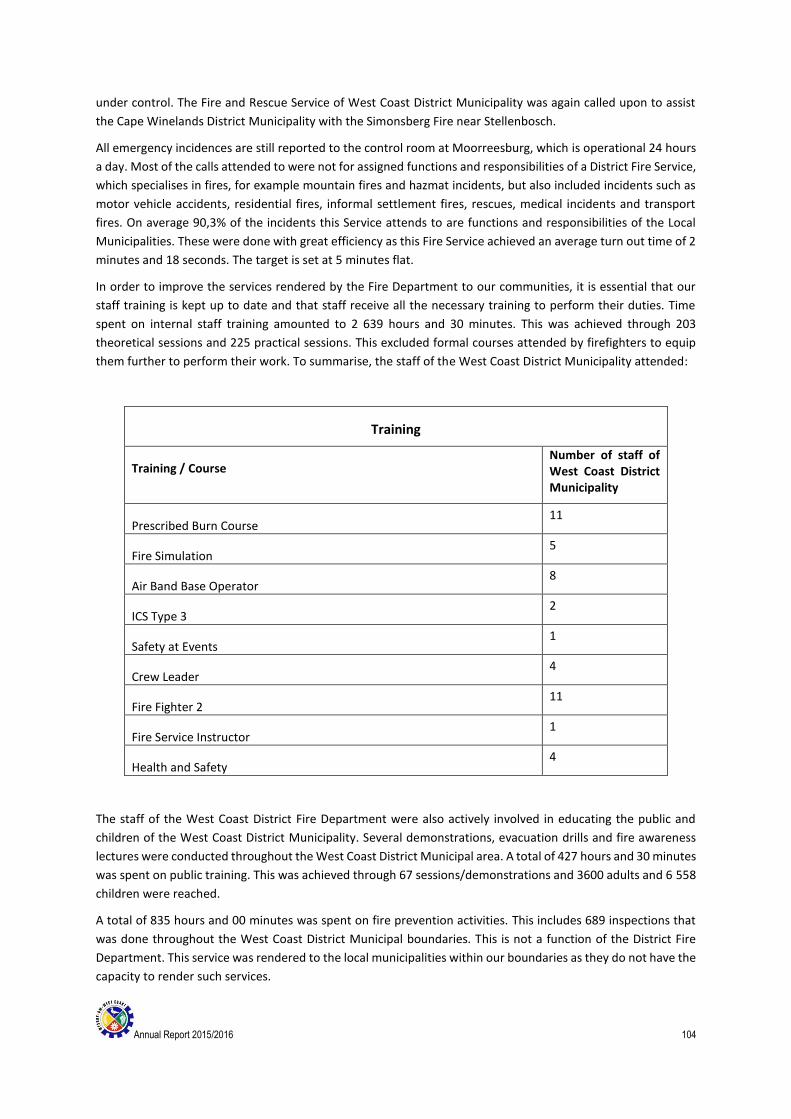
Annual Report 2015/2016 104
under control. The Fire and Rescue Service of West Coast District Municipality was again called upon to assist
the Cape Winelands District Municipality with the Simonsberg Fire near Stellenbosch.
All emergency incidences are still reported to the control room at Moorreesburg, which is operational 24 hours
a day. Most of the calls attended to were not for assigned functions and responsibilities of a District Fire Service,
which specialises in fires, for example mountain fires and hazmat incidents, but also included incidents such as
motor vehicle accidents, residential fires, informal settlement fires, rescues, medical incidents and transport
fires. On average 90,3% of the incidents this Service attends to are functions and responsibilities of the Local
Municipalities. These were done with great efficiency as this Fire Service achieved an average turn out time of 2
minutes and 18 seconds. The target is set at 5 minutes flat.
In order to improve the services rendered by the Fire Department to our communities, it is essential that our
staff training is kept up to date and that staff receive all the necessary training to perform their duties. Time
spent on internal staff training amounted to 2 639 hours and 30 minutes. This was achieved through 203
theoretical sessions and 225 practical sessions. This excluded formal courses attended by firefighters to equip
them further to perform their work. To summarise, the staff of the West Coast District Municipality attended:
Training
Training / Course Number of staff of West Coast District Municipality
Prescribed Burn Course 11
Fire Simulation 5
Air Band Base Operator 8
ICS Type 3 2
Safety at Events 1
Crew Leader 4
Fire Fighter 2 11
Fire Service Instructor 1
Health and Safety 4
The staff of the West Coast District Fire Department were also actively involved in educating the public and
children of the West Coast District Municipality. Several demonstrations, evacuation drills and fire awareness
lectures were conducted throughout the West Coast District Municipal area. A total of 427 hours and 30 minutes
was spent on public training. This was achieved through 67 sessions/demonstrations and 3600 adults and 6 558
children were reached.
A total of 835 hours and 00 minutes was spent on fire prevention activities. This includes 689 inspections that
was done throughout the West Coast District Municipal boundaries. This is not a function of the District Fire
Department. This service was rendered to the local municipalities within our boundaries as they do not have the
capacity to render such services.
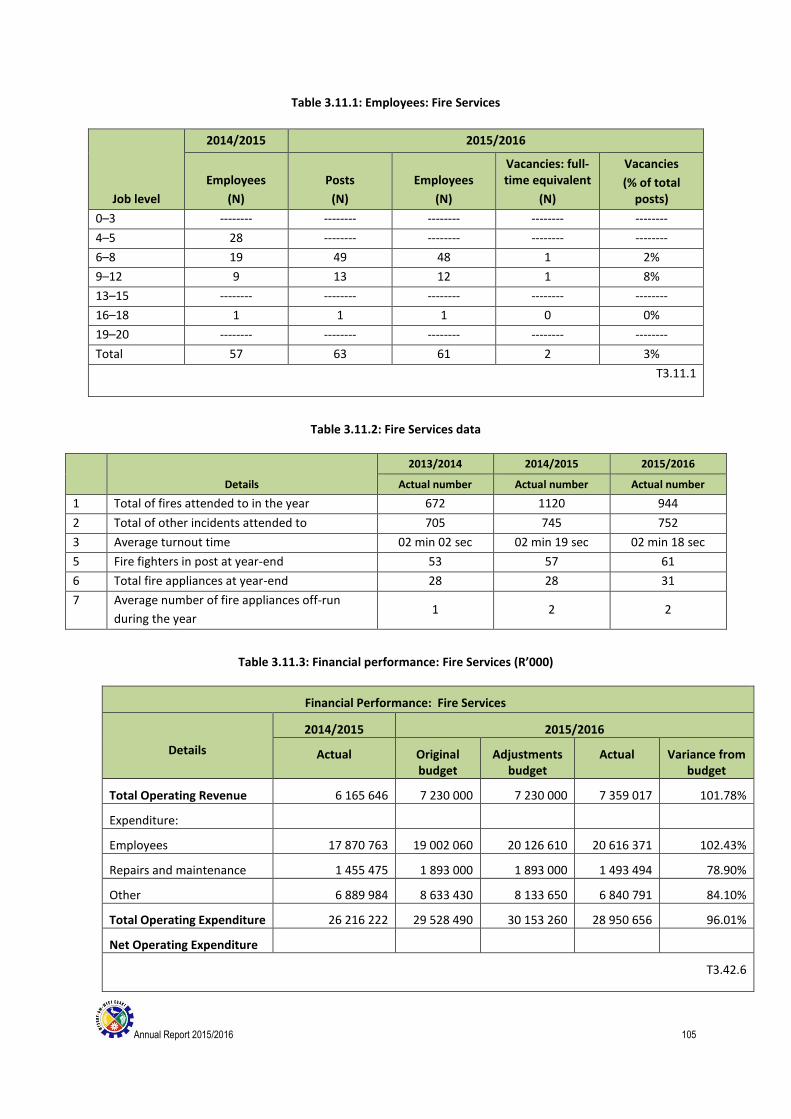
Annual Report 2015/2016 105
Table 3.11.1: Employees: Fire Services
Job level
2014/2015 2015/2016
Employees
(N)
Posts
(N)
Employees
(N)
Vacancies: full-time equivalent
(N)
Vacancies
(% of total posts)
0–3 -------- -------- -------- -------- --------
4–5 28 -------- -------- -------- --------
6–8 19 49 48 1 2%
9–12 9 13 12 1 8%
13–15 -------- -------- -------- -------- --------
16–18 1 1 1 0 0%
19–20 -------- -------- -------- -------- --------
Total 57 63 61 2 3%
T3.11.1
Table 3.11.2: Fire Services data
Details
2013/2014 2014/2015 2015/2016
Actual number Actual number Actual number
1 Total of fires attended to in the year 672 1120 944
2 Total of other incidents attended to 705 745 752
3 Average turnout time 02 min 02 sec 02 min 19 sec 02 min 18 sec
5 Fire fighters in post at year-end 53 57 61
6 Total fire appliances at year-end 28 28 31
7 Average number of fire appliances off-run
during the year 1 2 2
Table 3.11.3: Financial performance: Fire Services (R’000)
Financial Performance: Fire Services
Details
2014/2015 2015/2016
Actual Original budget
Adjustments budget
Actual Variance from budget
Total Operating Revenue 6 165 646 7 230 000 7 230 000 7 359 017 101.78%
Expenditure:
Employees 17 870 763 19 002 060 20 126 610 20 616 371 102.43%
Repairs and maintenance 1 455 475 1 893 000 1 893 000 1 493 494 78.90%
Other 6 889 984 8 633 430 8 133 650 6 840 791 84.10%
Total Operating Expenditure 26 216 222 29 528 490 30 153 260 28 950 656 96.01%
Net Operating Expenditure
T3.42.6

Annual Report 2015/2016 106
Financial Performance: Fire Services Saldanha
Details
2014/2015 2015/2016
Actual Original budget
Adjustments budget
Actual Variance from budget
Total Operating Revenue 3 300 252 3 910 000 4 710 000 3 488 845 74.07%
Expenditure:
Employees 2 857 875 2 707 620 3 924 620 2 996 334 71.24%
Repairs and maintenance 205 225 335 800 335 800 111 710 33.27%
Other 228 580 866 580 766 580 380 801 49.68%
Total Operating Expenditure 3 291 680 3 910 000 5 027 000 3 488 845 69.40%
Net Operating Expenditure
T3.11.4
Financial Performance: Working For Water
Details
2014/2015 2015/2016
Actual Original budget
Adjustments budget
Actual Variance from budget
Total Operating Revenue - - 778 400 634 451 81.51%
Expenditure:
Employees - - 642 000 458 338 71.39%
Repairs and maintenance - - 36 400 16 939 46.53%
Other - - 100 000 134 050 134.05%
Total Operating Expenditure - - 778 400 609 327 78.28%
Net Operating Expenditure
T3.11.5
Annual Report 2015/2016 107
3.12 DISASTER MANAGEMENT
3.12.1 INTRODUCTION
Disaster Management within the West Coast is being guided by the following legislation:
* The Constitution
* The Disaster Management Act
* The West Coast Disaster Management Framework.
* The West Coast Disaster Management Plan
All of these documents are available on the website of West Coast District Municipality www.westcoastdm.co.za
3.12.2 CAPACITY BUILDING
Disaster Management Act: The act was amended during this financial year. The Head of the Centre attended
various workshops where these amendments were discussed.
West Coast Disaster Management Framework (2013): This document is being used as the guiding document for
disaster management within the district.
West Coast Disaster Management Plan (2016): the plan was reviewed and was approved by Council on 25 May
2016.
The Centre: The West Coast District Municipality has an active disaster management centre since 2008.
Staff: The Centre has a Head of Centre (as stipulated in section 45 of the Disaster Management Act) and a
General Assistant who is responsible for the Cleaning. Also see the table at the end of this report.
Staff (Contract appointment):
A contract position was made available from 1 July – 31 December 2015 for the sole purpose of assisting with
the update of the disaster management plan. The plan was updated at a fraction of the cost it would have if a
consultant have been appointed.
Staff Training received:
mSCOA (7 December 2015, 23 February & 29 June 2016 – internally)
Induction (1 March for new appointee) Staff Training given (Awareness):
Stenden University: 8 October 2015
Ehlanzeni District Municipality 20 October 2015: the emphasis was on sharing of experiences amongst implementers.
Exercise was held on 28 October 2015. The planning took place on 18 and 23 October. The scenario was a truck and an ambulance that collided on the N7. The truck was carrying hazardous material. Three separate debriefings were held after the exercise. Valuable lessons were learnt.
Volunteers: The centre makes use of the services of established NGO’s e.g. Lions, to assist communities. The
Centre also assist NGO’s to expand their own capacity through internal training programmes e.g. ALERT.
Call-taking and dispatch facility: The West Coast Disaster Management Centre has a call-taking and dispatch
facility that is operated in conjunction with Department of Health: EMS. This is done according to a
Annual Report 2015/2016 108
Memorandum of Agreement. In this facility all emergencies calls are taken and the needed services are dispatch
(EMS, Fire, Provincial Traffic, Municipal Fire, SANRAL and notification to the Police if needed ). The centre
handles about 13 000 calls per month. Further details are available in the report from the West Coast Fire
Brigade Services. EMS has a service level agreement with Dimension Data for maintaining the CaremonX (Call
taking and dispatch) programme developed by Valentia.
Organization management facility: This facility is part of the Disaster Management building and used as a Joint
Operation Centre (JOC) during the managing of a mayor incidents. For the rest of the time it is used as a meeting
facility to discuss the prevention measures during the day to day activities. As part of prevention, it is also used
as a training facility that is open to all government departments within the district.
3.12.3 RISK ASSESSMENT (What is a risk to the West Coast?)
A risk assessment is done to establish what dangers are facing the communities of the West Coast. These risks
are reflected below. The risk register for the district is updated every year. New risks that appear this year: Zika
Viurs. From now on it will also reflect the risks that the B-Municipalities have identified in their community
based risk assessments.
The following B-Municipalities complete their risk assessments:
Bergrivier (November 2015),
Cederberg (draft report presented to the Municipal Manager on 1 October 2015) and
Saldanha Municipalities (May 2016)
3.12.4 RISK REDUCTION: (How can we avoid it/reduced or transferred?)
The first priority is to avoid any risks. But some risks cannot be avoided e.g. drought. If it cannot be avoided, it
must be reduced (Example water restrictions). If it cannot be reduce then it can be transferred to another
institution e.g. taking out insurance. After all these prevention measures, the disaster still happens, then you
have to manage it. Risk reduction measures take place mainly within the line functions, but in extreme cases
the Centre will become involved in addressing challenges. The emphasis of Disaster Management is on
prevention. The Centre will assist to co-ordinate the various initiatives.
3.12.5 SPECIFIC RESPONSE AND RECOVERY EFFORTS
If the risk cannot be avoided, reduce or transferred, then it must be managed when it occurs.
Accidents (aircraft): Avian legislation applies.
The lead agency is Department of Transport
SAMSA gives training
Response: The Centre was requested on 29 February 2016 to assist to locate a Cessna aircraft on route
between Bredasdorp and Groenrivier (close to Garries). With the assistance of volunteers of Cederberg
Municipality the aircraft was located
Accidents (road):
Lead agency: Department of Transport (Provincial & Municipal Traffic)
Risk reduction measures includes:
o Department of Community Safety legislation applies;
o Department of Community Safety (Provincial Traffic): regular roadblocks
o Department of Transport: weigh bridges do daily checks;
o Department of Transport – N7 quarterly meetings
o Department of Transport – SANRAL: distribute weekly schedules to blasting on N7

Annual Report 2015/2016 109
o Department of Transport – SANRAL quarterly meetings to improve the systems and make the
roads safer, especially the road works.
o WCDM Section Roads does maintenance;
o SANRAL does road maintenance on N7
Response: The Gap is that the municipalities are mandated to respond to accidents, but they are poorly
equipped to respond, thus by default the district fire and rescue still plays an important role.
Response is provided by the Fire Brigade Services, Traffic department, EMS and SAPS.
Accidents (sea):
Department of Transport (Saldanha Bay harbour) holds exercises on a regular basis in conjunction with
Department of Environmental Affairs to test the oil pollution plans.
African horse sickness: The Department of Agriculture has a prevention plan. No incident was reported.
Anthrax (humans): The Department of Health monitors the situation. No incident was reported.
Coastal erosion: Set-back lines were established for future developments
WCDM Environmental Management section monitors situation and make recommendations
regarding rehabilitation in conjunction with Department of Environmental Affairs and
Agriculture.
Deforestation: The Department of Environmental Affairs monitors the situation; Working for Water and
Working for Fires are example of job creation projects that are conducted in conjunction with West Coast
District Environmental Management and Fire Brigade Services to assist with alien clearing.
Desertification: The Department of Environmental Affairs and land owners monitor the situation.
Rehabilitation projects are being done in conjunction with West Coast District (Environmental Integrity).
The Department of Agriculture (Agro Meteorological committee) makes available monthly advisory on
weather and crops which the Centre distributes to all the Advisory members.
Disease (African Horse Sickness): a case was reported outside Hermon in April. No further cases were reported.
Diseases (Animals): Foot and mouth disease: no reports were received.
Diseases (Human) (cholera, TB, HIV/Aids, measles, etc.): Monitoring is done by the Department of Health via
clinics, mobile clinics and GPs. Additional support is provided by West Coast District Environmental Health.
Diseases (Human - Ebola): There is a draft a contingency plan (July 2014) for the West Coast which was drafted
in conjunction with Department of Health guidelines and National Institute for communicable diseases as
well as distributing information made available for awareness.
Diseases (Human - Food poisoning): Awareness and training are being done by Municipal Health regarding the
handling of food. Two incidences were reported. One in Clanwilliam (273 students) and one in Nuwerust
(50 people). In both cases the test results show that contaminated chicken was the caused of it. SEE also
reports of Municipal Health.
Diseases (Human - Influenza)
Awareness campaign are run by Department of Health
Various prevention measures that are in place from Department of Health e.g. vaccine
Annual Report 2015/2016 110
Influenza prevention plan Department Health (swine flu been removed as a communicable disease)
Protective clothing for staff members
Disease (Human – Zika virus) – NEW RISK FOR 2016
Zika virus infection is spread by mosquitoes and is mild in most people, but there is concern that Zika is causing
serious brain injury to babies whose mothers have been infected during pregnancy, and an increase in cases of
Guillain-Barre Syndrome, a temporary but serious disorder causing paralysis.
Drought:
The year 2015 was the driest year since 1921. The West Coast received the lowest amount of rain between
October and December 2015. Prevention measures for the drought include:
o The West Coast District’s Bulk Water Master Plan is in place.
o Desalination plants were built in the past. The one in Lamberts Bay will be completed in the near
future.
o The municipalities instituted water restrictions although Department Water & Sanitation did not
insisted on it at the time.
o The Centre made posters available to the Municipalities with the assistance from the Environmental
Integrity section of WCDM.
o Water saving awareness campaigns is are being run by the Municipalities.
o Department of Agriculture (Western Cape): has a draft drought plan
o Department of Local Government: the Centre reports regularly on the situation
o A task team has been formed In collaboration with Department of Agriculture & Department of Water
Affairs and Sanitation on district level.
o Department of Agriculture publishes monthly Agro Meteorological committee Advisory on weather
and crops.
o Department of Water Affairs (Hydrology) monitor the dam levels.
o Department of Water & Sanitation (Groundwater) Monitors and manages the boreholes that belong
to DWS & advises on water management.
o Municipalities monitors its own bore holes.
Response to Drought:
Since 29 April 2015 the Centre has been involved due to the low water level of the Clanwillaim dam. Due to the
conservative usage of the water, it was stretched until the winter rains appeared. The Department Water &
Sanitation (Clanwilliam) Rassie Nieuwoudt, Francois van Heerden and the water users (LORWUA) should be
commended for their efforts to save water.
During October and November the Department of Agriculture received requests from various farmers for
assistance as a result of the lack of winter rainfall. As a result a tour was organized in conjunction with
Department of Local Government (Provincial Disaster Management Centre) and the West Coast Disaster
Management Centre. This was undertaken from 9-11 November 2015. The following areas were visited:
Agterpakhuys, Bitterfontein, Clanwilliam, Doringbos, Graafwater, Kliprand, Lambertsbaai, Landplaas, Piketberg
(Rooi Karoo), Porterville, Rietpoort, Sandveld, Stofkraal, Van Rhynsdorp, Vredendal and Wuppertal. About 1500
km were covered. The farmer unions of Bitterfontein, Kliprand and Porteville were visited. A report was drafted
by Department of Agriculture. This report was use as the basis to start the process of disaster declaration. The
local municipalities requested that their areas be declared a disaster area. The request for a declaration was
Annual Report 2015/2016 111
sent to the Provincial Disaster Management Centre on 20 November and on the 25th it was submitted to the
Provincial Cabinet. The National Disaster Management Centre classified it as a local disaster (agricultural).
A provincial drought task team was established in January 2016. The West Coast district is represented on this
task team. There was also a meeting with the National Stakeholders on 26 January 2016. The task team meet
once a month. Feedback reports are also submitted to the task team on average once a month.
Donation of water: The Centre was contacted by various companies that wanted to donate water. A data base
was started.
Communication: In addition to the feedback reports to the drought task team, the Disaster Management centre
gives feedback to the Portfolio committee every month and other role players.
Various other role players have assisted as well, but the detail of their assistance is not covered in this report.
These role players are: Department of Agriculture, Department of Labour, Department of Social Development,
Department of Water & Sanitation (groundwater & hydrology), farmers from other areas and SASSA.
What is the current situation? The water in the Clanwilliam dam (for the Northern part) has risen to above last
years’ level which is very good news. Unfortunately, the water levels in the Voelvlei and Bergrivier dams are
15% lower that it was last year the same time. This is still a concern for the upcoming summer months. The
possibly exists that an extension on the current drought declaration will be requested.
Electricity disruption: updated the contingency plan as changes are received from Department of Energy or
other role players. Encourage the B-Municipalities to also draft their own contingency plans.
Earthquakes: see Seismic Hazards
Events: 2010 World Cup Soccer: The Disaster Management Plan was drafted based on the SANS Code for Mass
Events. 1 New legislation and lessons learnt were incorporated into the event plans. Each event is managed
by the local authority.
Golden Games (May) planning meetings were held for the events in Moorreesburg and Vredendal
WCDM uses a check list to make sure that all the requirements are met. The Health inspectors see to
that all food stalls have a certificate of fitness.
Risk reduction….
Fires: (structural) –
Fires: The Fire Brigade Services respond according to their standard operating procedures (SOPs). The
statistics can be viewed in the report under Fire Brigade Services.
Fires (Structural) – Windfarms: an exercise was held with all the role players. According to the owner
it was the first exercise of this kind to be held in the country.
Fires (veldt):
1 South African National Standard 10366: Health and safety at events – General requirements

Annual Report 2015/2016 112
Awareness: The centre prints annually pamphlets with the emergency number. These pamphlets are
divided between the disaster management centre, fire brigade, EMS and provincial traffic that use it with
their own awareness initiatives.
In the weather warnings are issued by the SA Weather bureau with suggestion on prevention measures to
the public, including Fire Danger Indexes.
The Fire Brigade Services received the monthly Agro Meteorological committee Advisory on weather and
crops as distributed by Department of Agriculture.
See the section of the Fire Brigade Services for a full report of their activities for the year in relation to veld
fires
Floods:
Preparations for floods are part of the West Coast Disaster Management Plan and it includes:
Draft flood plan (Department of Water Affairs) for addressing flooding from rivers and dams.
Estuary plans (emergency opening and closing procedures).
The West Coast District Environmental Management river maintenance projects.
Clanwilliam dam (maintenance plan as well as a management plan for a dam wall failure).
Early warnings from the Weather Bureau. www.weathersa.co.za and sms to the Centres..
Long term forecasting from Department of Agriculture: monthly Agro Meteorological committee Advisory
on weather and crops
During December 2015 the Centre was asked to assist with the proof reading of the document Off the
Radar: Severe storms and their impacts in the Western Cape, South Africa.
RADAR (Research Alliance for Disaster and Risk Reduction), University of Stellenbosch, held a seminar on
flooding research for the Western Cape on 22 October.. This was based on flooding incidents of the past 10
years. From that it was clear that summer flooding causes more damage than winter flooding.
Rain during 21-23 April 2016 caused minor flooding in Saldanha Bay, Moorreesburg and Citrusdal. The
municipalities dealt with it by following their flood Management plans that are in place at all the B
municipalities.
Hail:
The South African Weather Service provides early warnings; land owners protect produce where possible. The
Centre did not received any report of damages due to hail.
Hazardous installations:
The hazmat function is still performed by the Fire Brigade Services.
For full details, see the report of the Fire Service).
Hazmat (rail): The Department of Transport is responsible.
Drafted a contingency plan is available.
No request for assistance was received.
Hazmat (road):
The West Coast Disaster Management plan reflects:
o The Department of Community Safety legislation applicable for roadworthiness and road traffic.
o The public education that is done by the Department of Community Safety

Annual Report 2015/2016 113
o The Department of Transport (Provincial Traffic) monitors and law enforcement at the way bridges
o The NEMA legislation
The West Coast District (Fire Brigade Service) responds to these incidences.
No request was received by the Centre for assistance.
Hazmat (road):
The Fire Brigade Services and Environmental Management respond.
Department of Environmental management report all section 30 incidents to the provincial
departments and monitor the clean-up procedures. The West Coast DM assist with the reporting of
these incidents according to a SOP. Also see the report of the Environmental Integrity section of the
WCDM.
Hazmat (sea):
The legislation of both the Department of Environmental Affairs and the Department of Transport applies.
The Centre did not receive any report of hazmat at sea (oil pollution).
Heat waves:
South African Weather offices sends out early warnings via media
On 27 October 2015 the South African Weather Services measured the highest temperature for the
West Coast at 48.30 at Vredendal. The previous record was 42.30 (30 October 1999). During the year
several heat waves were experienced (three just in March)
Department of Agriculture: monthly Agro Meteorological committee Advisory on weather and crops
Municipal health inspectors do awareness regarding storing and handling of food during extremely hot
periods.
any advisories (via mail) from SAWeather Services are distrusted to the role-players. The Centre also
assisted to get the municipalities on the sms system of SAWS in order to get the warnings on their
phones which ensure quicker responses.
Land degradation:
Land owners monitor the situation and the Department of Environmental Affairs legislation and
rehabilitation projects support the process. Cape Nature and NGOs assist.
The Department of Agriculture responds in terms of CARA.
No requests were received by Disaster Management.
Lightning: Weather office sends out warnings
Department of Agriculture: monthly Agro Meteorological committee Advisory on weather and crops
Municipal elections:
The Department of Cooperative Affairs and the IEC oversee the process. Training and education was provided
by the IEC. Municipalities are in the process to prepare for the elections in August.

Annual Report 2015/2016 114
Nuclear:
Awareness: Koeberg had a Road show 27-31 October with the truck that transports the radioactive
material to Vaalputs.
The centre attends the quarterly Emergency Planning Steering and Oversight committee (EPSOC) that
is chaired by the Department of Energy.
The West Coast District is a co-signature to the MOU with the City of Cape Town.
Quaterly Emergency Planning Committee (EPC) meetings are attended with the City of Cape Town. An
MOU with Bergrivier, Saldanha Bay and Swartland was drafted to supply accommodation in the case of
an evacuation.
A large, framed map was supplied by City of Cape Town indicating the evacuation plan for Koeberg.
Koeberg Eskom exercise took place on 20 April 2016
Pollution (air): West Coast District (Environmental Health) does monitoring; legislation applies.
Pollution (water): West Coast District (Environmental Health) does monitoring by taking samples to adhere to
legislation. Monitoring of river water is also done on behalf of Department of Water Affairs and Sanitation
according to an MOU that is in affect for the next two year. See the report of the Environmental Health for
specific statistics.
Red tide (and other animal stranding): The Department of Environmental Affairs monitors the situation and
issues warnings. A Cape Rock Lobster Response contingency plan is already in place.
Early warning (Department of Agriculture)
Monitoring are done according to green, yellow and red stages
Live lobsters are relocated
Updated the West Coast Rock Lobster contingency plan
Also see report from Section Environmental Management. Red tide (and animal strandings):
Disaster Management coordinates responses in conjunction with the Department of Fisheries.
During 24- 31 Dec 2015 the Centre received a report of possible rock lobster walk out at Elands Bay.
Rock lobsters were hiding in shallow tidal rocks. Public were picking them up and throwing it back in
deeper ends. It did not develop as a full red tide walk out. Red tide was spotted during March, but no
walk outs occurred. During April small amounts of fish washed ashore, but no lobster walk outs
occurred. On 11 May 2016 about 1000 live and dead fish washed out in Saldanha Bay harbour.
Whales/dolphins on beaches: none were reported.
Rift Valley fever: The Department of Agriculture has a plan. No reports were received.
Sand dune migration: polls that were harvested during the alien clearing projects are being use to anker the
bales that are used during dune rehabilitation projects. No serious disruptions were reported.
Seismic hazards:
This risk is part of Disaster Management Plan.
On Wednesday 2 December 2015 at 09:14 a magnitude 3.7 earthquake was felt in the Western Cape.
According to the Council of Geoscience the epicentre was Tulbagh. Reports of tremors were felt as
wide as Porterville, Malmesbury, Melkbosstrand and Atlantis. No damages were reported to the
Centre.
Annual Report 2015/2016 115
Severe weather:
Weather office sent out a warning that Spring tide, full moon and new moon will be more severe this
year due to alignment of the moon and the sun.
Early warnings are sent out by the SA Weatherservices
Department of Agriculture: monthly Agro Meteorological committee Advisory on weather and crops
Severe weather: regular reports were received, but no serious damage.
Social conflict:
Awareness by community leaders within the Municipalities
Department of Community Safety: meet regularly with the community leaders
Department of Foreign Affairs: legislation in place to prevent illegal immigrants
The Draft Social Conflict Plan is coordinated by the Disaster Management Centre of the West Coast and
clusters of the South African Police Services.
Community Safety meeting are being held on a quarterly basis with all role players.
Ad hoc meetings are called by Department of Community Safety where all role players are present for
a specific cluster e.g. Vredenburg Cluster and Malmesbury.
Updated the contingency plan.
Social conflict:
There was a land invasion in Citrusdal 4-6 April 2016, which the municipality could manage.
It is a standing item on the agenda of the West Coast IDP CC
Storm surges: No request for assistance was received:
Winds: Line functions respond, as needed.
General:
The Centre took part in an exhibition at the Moorreesburg Library hall during March – 30 April 2016.
The Head of the Centre was invited to be a speaker at the Drought Seminar that was hosted by the University of
Stellenbosch. The topic was: A district’s perspective on managing a drought disaster. Various questionnaires
were completed during the year as part of research projects.
The greatest challenge for the Centre is to comply with section 44 (Powers and Duties) of the Disaster
Management Act with not enough money and only a Head of Disaster Management Centre. Urgent changes to
the funding model as well as the capacity model is needed.
The biggest success is that the Disaster Management Plan was internally updated by the Head of the Centre with
the assistance of a Administrative Officer, Gordinia Briers, who was trained by the Head of the Centre. This was
done within 12 months and with modest budget of R60 000.
The Centre is extremely grateful for the support from all staff from other departments within the District
Municipality, the five local municipalities, the provincial departments, the national departments and the NGO’s.
I am because we are.
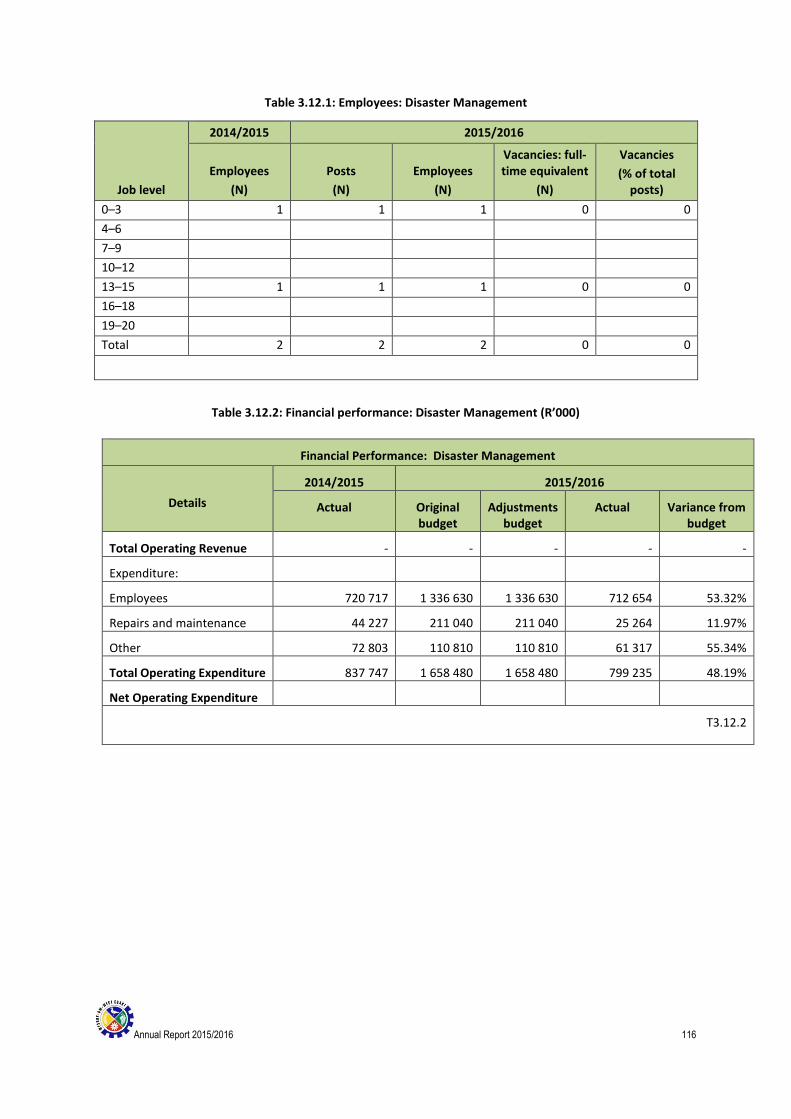
Annual Report 2015/2016 116
Table 3.12.1: Employees: Disaster Management
Job level
2014/2015 2015/2016
Employees
(N)
Posts
(N)
Employees
(N)
Vacancies: full-time equivalent
(N)
Vacancies
(% of total posts)
0–3 1 1 1 0 0
4–6
7–9
10–12
13–15 1 1 1 0 0
16–18
19–20
Total 2 2 2 0 0
Table 3.12.2: Financial performance: Disaster Management (R’000)
Financial Performance: Disaster Management
Details
2014/2015 2015/2016
Actual Original budget
Adjustments budget
Actual Variance from budget
Total Operating Revenue - - - - -
Expenditure:
Employees 720 717 1 336 630 1 336 630 712 654 53.32%
Repairs and maintenance 44 227 211 040 211 040 25 264 11.97%
Other 72 803 110 810 110 810 61 317 55.34%
Total Operating Expenditure 837 747 1 658 480 1 658 480 799 235 48.19%
Net Operating Expenditure
T3.12.2
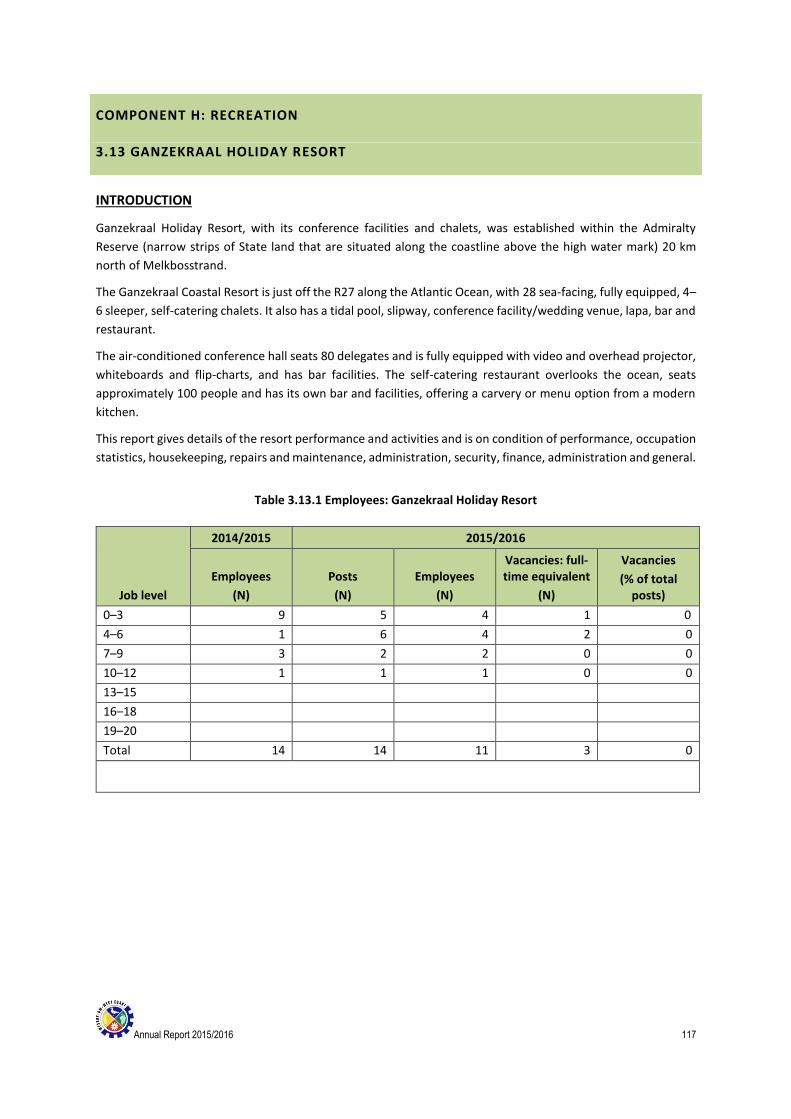
Annual Report 2015/2016 117
COMPONENT H: RECREATION
3.13 GANZEKRAAL HOLIDAY RESORT
INTRODUCTION
Ganzekraal Holiday Resort, with its conference facilities and chalets, was established within the Admiralty
Reserve (narrow strips of State land that are situated along the coastline above the high water mark) 20 km
north of Melkbosstrand.
The Ganzekraal Coastal Resort is just off the R27 along the Atlantic Ocean, with 28 sea-facing, fully equipped, 4–
6 sleeper, self-catering chalets. It also has a tidal pool, slipway, conference facility/wedding venue, lapa, bar and
restaurant.
The air-conditioned conference hall seats 80 delegates and is fully equipped with video and overhead projector,
whiteboards and flip-charts, and has bar facilities. The self-catering restaurant overlooks the ocean, seats
approximately 100 people and has its own bar and facilities, offering a carvery or menu option from a modern
kitchen.
This report gives details of the resort performance and activities and is on condition of performance, occupation
statistics, housekeeping, repairs and maintenance, administration, security, finance, administration and general.
Table 3.13.1 Employees: Ganzekraal Holiday Resort
Job level
2014/2015 2015/2016
Employees
(N)
Posts
(N)
Employees
(N)
Vacancies: full-time equivalent
(N)
Vacancies
(% of total posts)
0–3 9 5 4 1 0
4–6 1 6 4 2 0
7–9 3 2 2 0 0
10–12 1 1 1 0 0
13–15
16–18
19–20
Total 14 14 11 3 0
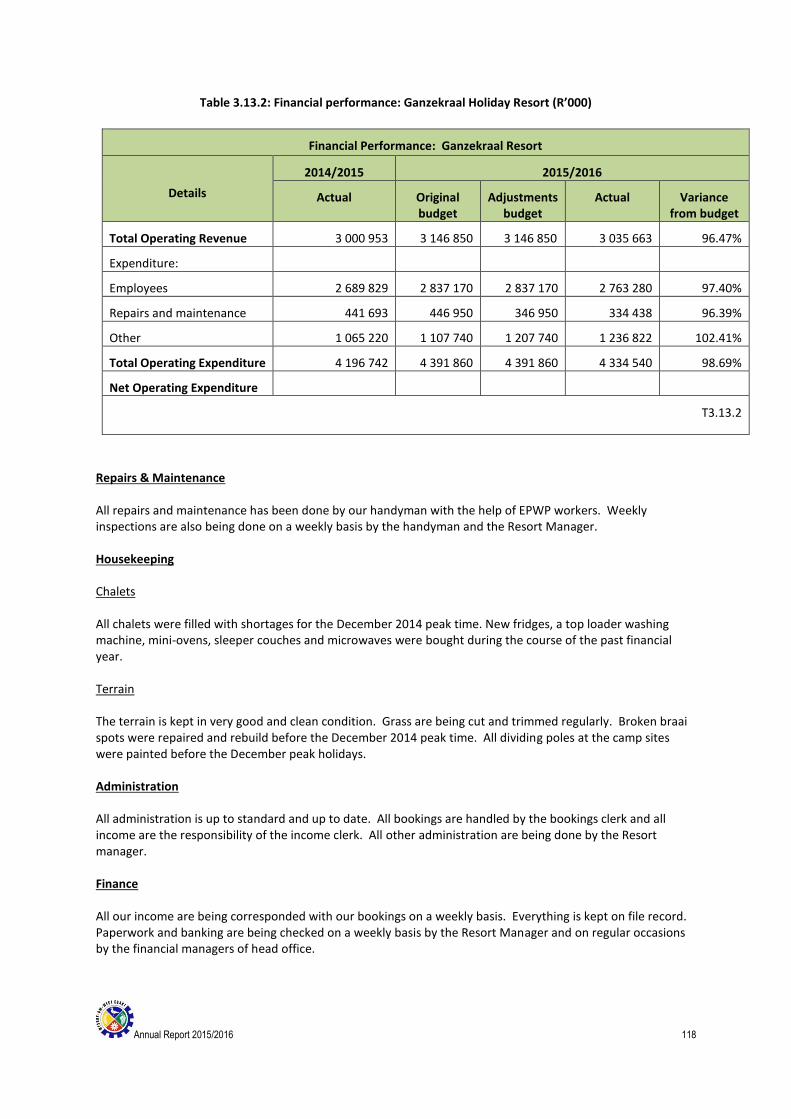
Annual Report 2015/2016 118
Table 3.13.2: Financial performance: Ganzekraal Holiday Resort (R’000)
Financial Performance: Ganzekraal Resort
Details
2014/2015 2015/2016
Actual Original budget
Adjustments budget
Actual Variance from budget
Total Operating Revenue 3 000 953 3 146 850 3 146 850 3 035 663 96.47%
Expenditure:
Employees 2 689 829 2 837 170 2 837 170 2 763 280 97.40%
Repairs and maintenance 441 693 446 950 346 950 334 438 96.39%
Other 1 065 220 1 107 740 1 207 740 1 236 822 102.41%
Total Operating Expenditure 4 196 742 4 391 860 4 391 860 4 334 540 98.69%
Net Operating Expenditure
T3.13.2
Repairs & Maintenance All repairs and maintenance has been done by our handyman with the help of EPWP workers. Weekly inspections are also being done on a weekly basis by the handyman and the Resort Manager. Housekeeping Chalets All chalets were filled with shortages for the December 2014 peak time. New fridges, a top loader washing machine, mini-ovens, sleeper couches and microwaves were bought during the course of the past financial year. Terrain The terrain is kept in very good and clean condition. Grass are being cut and trimmed regularly. Broken braai spots were repaired and rebuild before the December 2014 peak time. All dividing poles at the camp sites were painted before the December peak holidays. Administration All administration is up to standard and up to date. All bookings are handled by the bookings clerk and all income are the responsibility of the income clerk. All other administration are being done by the Resort manager. Finance All our income are being corresponded with our bookings on a weekly basis. Everything is kept on file record. Paperwork and banking are being checked on a weekly basis by the Resort Manager and on regular occasions by the financial managers of head office.

Annual Report 2015/2016 119
Security Mafoko Security is still delivery good services and presents regular reports and site visits. General Although some more maintenance still needs to be done, Ganzekraal Resort is still operating good and is still very busy even during the winter time. We also had another successful December and Easter peak time for 2014/2015 period. Occupation Statistics
OCCUPATION STATISTICS
CLASS 2014/2015 2015/2015
Amanzi 43.84% 45.45%
Proteas 48.00% 45.38%
Mooimake 41.10% 40.90%
Facilities 14.64% 13.90%
Camping sites 24.15% 23.24%
Resort Avenue 30.17% 29.57%

Annual Report 2015/2016 120
COMPONENT I: CORPORATE POLICY OFFICES AND OTHER SERVICES
3.14 EXECUTIVE AND COUNCIL
This component includes the executive office (mayor, councillors and municipal manager).
3.14.1 EXECUTIVE AND COUNCIL VISION
A quality destination of choice through an open opportunity society.
3.14.2 MISSION
To ensure outstanding service delivery on the West Coast by pursuing the following objectives:
3.14.3 STRATEGIC OBJECTIVES
These objectives also correspond with priorities at the global, national and provincial level and align with the
strategic intent. As early as 2003, the United Nations Development Programme outlined five central challenges
facing sustainable development in South Africa in the South Africa Human Development Report (UNDP:2003):
The eradication of poverty and extreme income and wealth inequalities.
The provision of access to quality and affordable basic services to all South Africans.
The promotion of environmental sustainability.
A sustained reduction in the unemployment rate.
The attainment of sustainable high growth rates.
The fact that the five high-level strategic objectives that have been identified by the West Coast District
Municipality are in line with these challenges emphasises that the District Municipality continues to confront
the issues of the country and, in particular, of the district. The District Municipality’s objectives are as follows:
Ensuring environmental integrity for the West Coast.
Ensuring good governance and financial viability.
Pursuing economic growth and facilitation of job opportunities.
Promoting the social wellbeing of the community.
Providing essential bulk services in the region.
3.14.4 CORE VALUES
Integrity – to conduct business with integrity and be accountable to stakeholders.
Transparency – to be transparent and open in our business.
Loyalty – to be honest.
Ethics – to display moral values in our behaviour.
Respect – to treat the public and colleagues with fairness, respect and consideration.
Quality – to be committed to delivering good quality services.
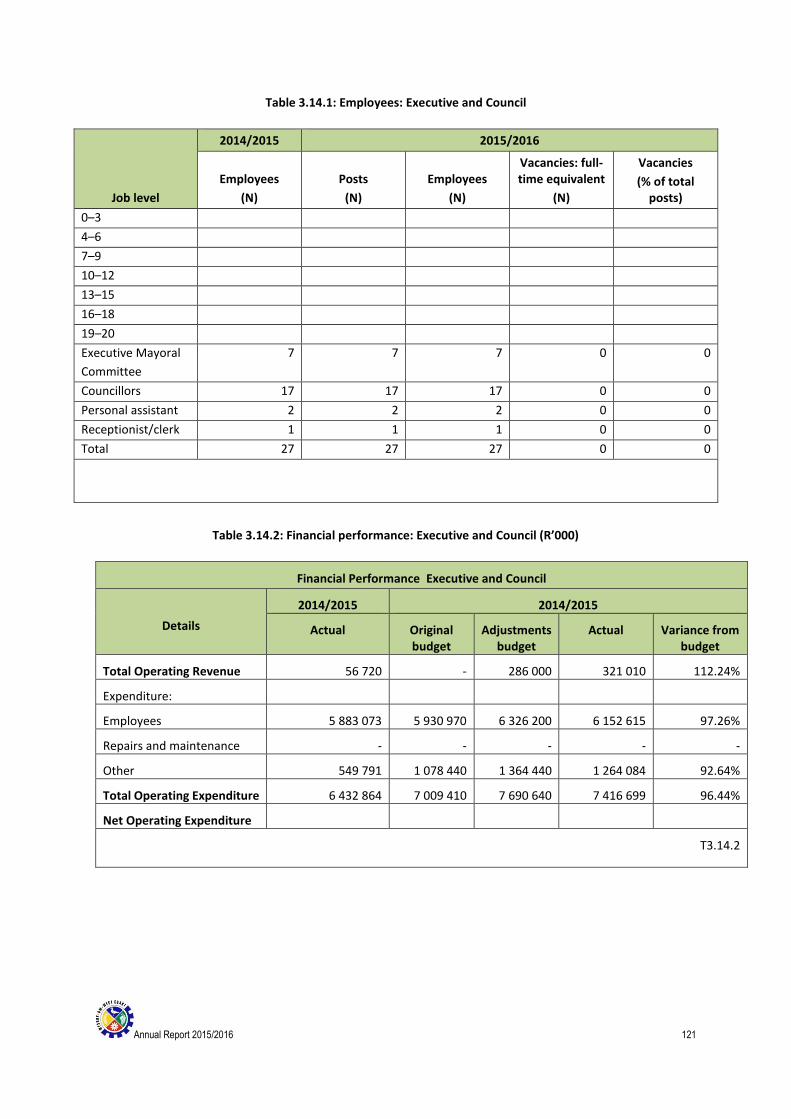
Annual Report 2015/2016 121
Table 3.14.1: Employees: Executive and Council
Job level
2014/2015 2015/2016
Employees
(N)
Posts
(N)
Employees
(N)
Vacancies: full-time equivalent
(N)
Vacancies
(% of total posts)
0–3
4–6
7–9
10–12
13–15
16–18
19–20
Executive Mayoral
Committee
7 7 7 0 0
Councillors 17 17 17 0 0
Personal assistant 2 2 2 0 0
Receptionist/clerk 1 1 1 0 0
Total 27 27 27 0 0
Table 3.14.2: Financial performance: Executive and Council (R’000)
Financial Performance Executive and Council
Details
2014/2015 2014/2015
Actual Original budget
Adjustments budget
Actual Variance from budget
Total Operating Revenue 56 720 - 286 000 321 010 112.24%
Expenditure:
Employees 5 883 073 5 930 970 6 326 200 6 152 615 97.26%
Repairs and maintenance - - - - -
Other 549 791 1 078 440 1 364 440 1 264 084 92.64%
Total Operating Expenditure 6 432 864 7 009 410 7 690 640 7 416 699 96.44%
Net Operating Expenditure
T3.14.2

Annual Report 2015/2016 122
3.15 ADMINISTRATION
3.15.1 INTRODUCTION
The Administration Division manages the key performance areas of the West Coast District Municipality by
providing an effective administrative service to core service delivery functions by designing, developing and
aligning policies, implementing procedures, reviewing policies and procedures, and aligning document
management systems to facilitate effective circulation, response, storage and retrieval. The division also
manages and controls strict adherence to Council policy and relevant legislation.
MORE INFORMATION
More information regarding the activities of the Division Administration is available in:
Chapter 2.9: Governance under By-laws
Appendix A – Councillors, Committee Allocation and Council Attendance
Appendix B – Committees and Committee Purposes
Appendix D – Functions of Municipality/Entity
Appendix J – Disclosure of Financial Interests: Councillors
3.15.2 COMPILATION OF THE ANNUAL REPORT AND OVERSIGHT REPORT
The Administration Division is responsible for the compilation of the annual report by drawing up timeframes
for all tasks relating to the completion of the annual report, liaising with departmental heads, tabling the annual
report to Council, distributing the annual report to the relevant government departments and carrying out the
final phase of translating, editing and printing the final version. The division also manages both the process and
drafting of the oversight report, in collaboration with the Oversight Committee, and tables the oversight report
to Council.
3.15.3 SECRETARIAT
As the administrative arm of the Municipality, the Secretariat Division renders an administrative support service
to Council and its political structures and ensures quality administrative service delivery by managing all standing
committee and ad hoc committee meetings and ensuring effective coordination and prompt secretariat support.
The Secretariat Division is responsible for the following meetings:
Council meetings, special Council meetings, District Coordinating Forum (DCF)Technical Committee meetings,
Water Monitoring meetings, Water Monitoring Technical Committee meetings, Oversight Committee meetings,
Risk Management meetings, Portfolio Committees: Administration and Community Service, Finance and
Technical Services meetings, and Bid Committee meetings: Specification and Evaluation, Bid Adjudication
Committee and Audit Committee meetings.
3.15.4 OFFICE SUPPORT SERVICES
3.15.4.1 RECORDS AND ARCHIVES
The Administration Division manages the implementation of procedures and systems associated with document
flow, such as the archiving and keeping of records systems (in accordance with statutory prescriptions) and the
establishment, evaluation and maintenance of registry procedures for the operating of the main registry office
and suboffices and for regulating record keeping. The division also oversees compliance with statutory
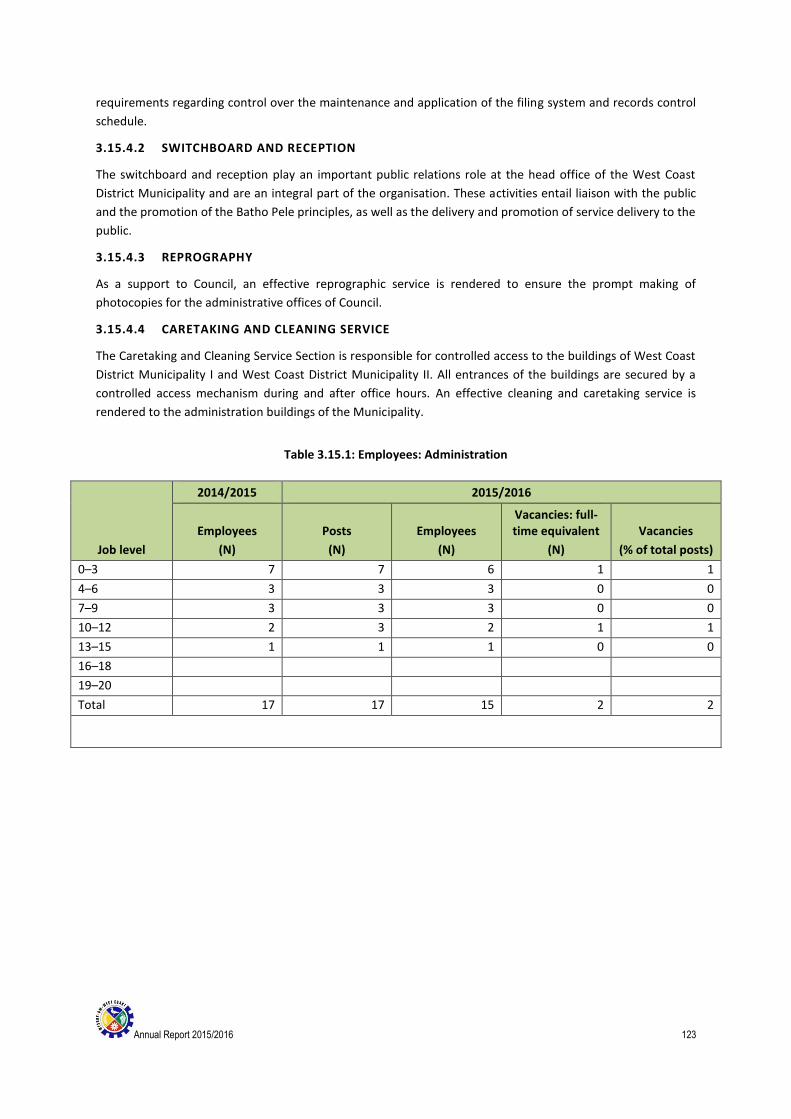
Annual Report 2015/2016 123
requirements regarding control over the maintenance and application of the filing system and records control
schedule.
3.15.4.2 SWITCHBOARD AND RECEPTION
The switchboard and reception play an important public relations role at the head office of the West Coast
District Municipality and are an integral part of the organisation. These activities entail liaison with the public
and the promotion of the Batho Pele principles, as well as the delivery and promotion of service delivery to the
public.
3.15.4.3 REPROGRAPHY
As a support to Council, an effective reprographic service is rendered to ensure the prompt making of
photocopies for the administrative offices of Council.
3.15.4.4 CARETAKING AND CLEANING SERVICE
The Caretaking and Cleaning Service Section is responsible for controlled access to the buildings of West Coast
District Municipality I and West Coast District Municipality II. All entrances of the buildings are secured by a
controlled access mechanism during and after office hours. An effective cleaning and caretaking service is
rendered to the administration buildings of the Municipality.
Table 3.15.1: Employees: Administration
Job level
2014/2015 2015/2016
Employees
(N)
Posts
(N)
Employees
(N)
Vacancies: full-time equivalent
(N)
Vacancies
(% of total posts)
0–3 7 7 6 1 1
4–6 3 3 3 0 0
7–9 3 3 3 0 0
10–12 2 3 2 1 1
13–15 1 1 1 0 0
16–18
19–20
Total 17 17 15 2 2

Annual Report 2015/2016 124
Table 3.15.2: Financial performance: Administration (R’000)
Financial Performance Administration
Details
2014/2015 2015/2016
Actual Original budget
Adjustments budget
Actual Variance from budget
Total Operating Revenue 13 042 5 000 5 000 10 044 200.88%
Expenditure:
Employees 3 519 753 5 130 830 4 256 260 3 841 180 90.25%
Repairs and maintenance 196 224 210 000 210 000 71 524 34.06%
Other 1 927 550 2 430 770 2 652 770 2 314 364 87.24%
Total Operating Expenditure 5 643 527 7 771 600 7 119 030 6 227 068 87.47%
Net Operating Expenditure
T3.15.2
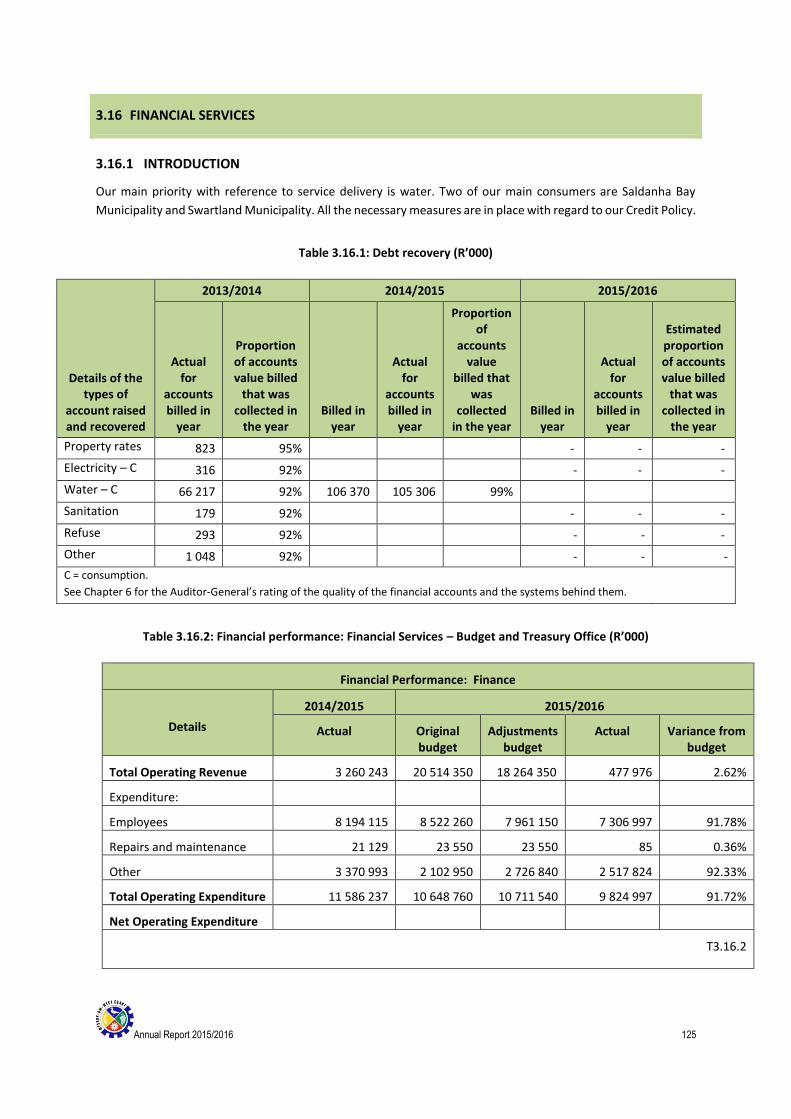
Annual Report 2015/2016 125
3.16 FINANCIAL SERVICES
3.16.1 INTRODUCTION
Our main priority with reference to service delivery is water. Two of our main consumers are Saldanha Bay
Municipality and Swartland Municipality. All the necessary measures are in place with regard to our Credit Policy.
Table 3.16.1: Debt recovery (R’000)
Details of the types of
account raised and recovered
2013/2014 2014/2015 2015/2016
Actual for
accounts billed in
year
Proportion of accounts value billed
that was collected in
the year Billed in
year
Actual for
accounts billed in
year
Proportion of
accounts value
billed that was
collected in the year
Billed in year
Actual for
accounts billed in
year
Estimated proportion of accounts value billed
that was collected in
the year
Property rates 823 95% - - -
Electricity – C 316 92% - - -
Water – C 66 217 92% 106 370 105 306 99%
Sanitation 179 92% - - -
Refuse 293 92% - - -
Other 1 048 92% - - -
C = consumption.
See Chapter 6 for the Auditor-General’s rating of the quality of the financial accounts and the systems behind them.
Table 3.16.2: Financial performance: Financial Services – Budget and Treasury Office (R’000)
Financial Performance: Finance
Details
2014/2015 2015/2016
Actual Original budget
Adjustments budget
Actual Variance from budget
Total Operating Revenue 3 260 243 20 514 350 18 264 350 477 976 2.62%
Expenditure:
Employees 8 194 115 8 522 260 7 961 150 7 306 997 91.78%
Repairs and maintenance 21 129 23 550 23 550 85 0.36%
Other 3 370 993 2 102 950 2 726 840 2 517 824 92.33%
Total Operating Expenditure 11 586 237 10 648 760 10 711 540 9 824 997 91.72%
Net Operating Expenditure
T3.16.2
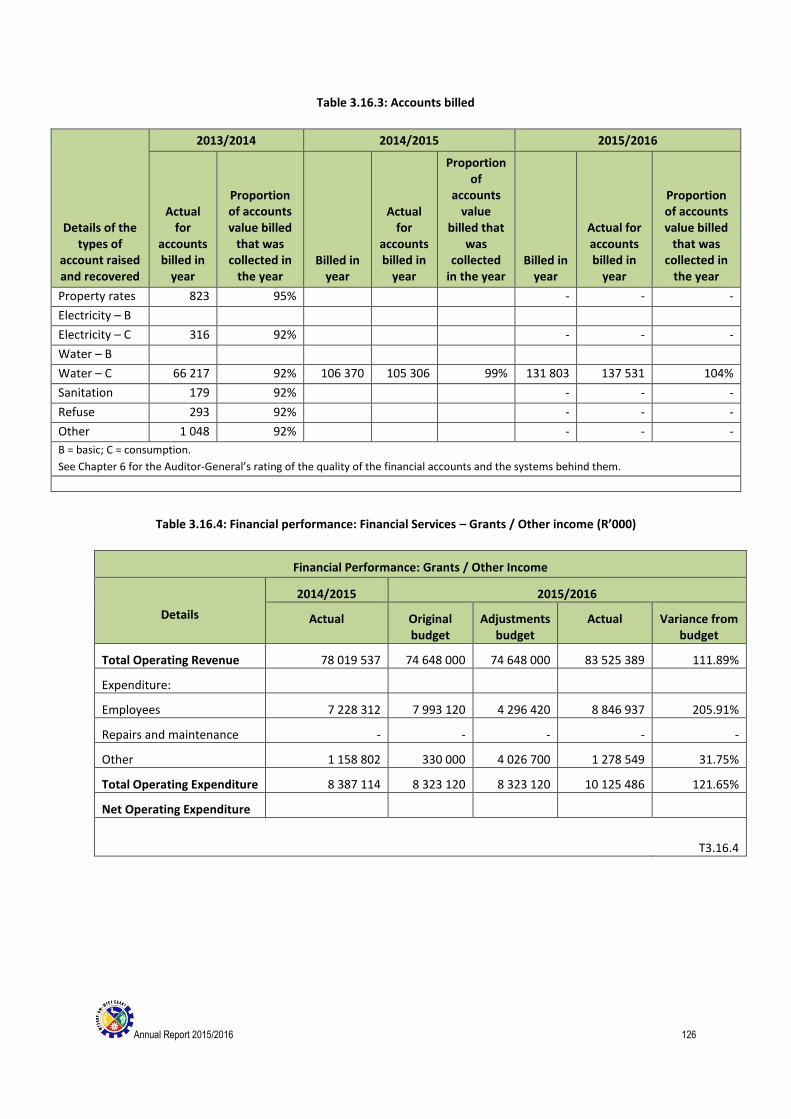
Annual Report 2015/2016 126
Table 3.16.3: Accounts billed
Details of the types of
account raised and recovered
2013/2014 2014/2015 2015/2016
Actual for
accounts billed in
year
Proportion of accounts value billed
that was collected in
the year Billed in
year
Actual for
accounts billed in
year
Proportion of
accounts value
billed that was
collected in the year
Billed in year
Actual for accounts billed in
year
Proportion of accounts value billed
that was collected in
the year
Property rates 823 95% - - -
Electricity – B
Electricity – C 316 92% - - -
Water – B
Water – C 66 217 92% 106 370 105 306 99% 131 803 137 531 104%
Sanitation 179 92% - - -
Refuse 293 92% - - -
Other 1 048 92% - - -
B = basic; C = consumption.
See Chapter 6 for the Auditor-General’s rating of the quality of the financial accounts and the systems behind them.
Table 3.16.4: Financial performance: Financial Services – Grants / Other income (R’000)
Financial Performance: Grants / Other Income
Details
2014/2015 2015/2016
Actual Original budget
Adjustments budget
Actual Variance from budget
Total Operating Revenue 78 019 537 74 648 000 74 648 000 83 525 389 111.89%
Expenditure:
Employees 7 228 312 7 993 120 4 296 420 8 846 937 205.91%
Repairs and maintenance - - - - -
Other 1 158 802 330 000 4 026 700 1 278 549 31.75%
Total Operating Expenditure 8 387 114 8 323 120 8 323 120 10 125 486 121.65%
Net Operating Expenditure
T3.16.4

Annual Report 2015/2016 127
Table 3.16.5 Capital expenditure: Financial Management (Interns) (R’000)
Financial Performance: Finance Management (INTERN)
Details
2014/2015 2015/2016
Actual Original budget
Adjustments budget
Actual Variance from budget
Total Operating Revenue - - 1 250 000 1 242 639 99.41%
Expenditure:
Employees - - 561 110 516 798 92.10%
Repairs and maintenance - - - - -
Other - - 688 890 675 354 98.03%
Total Operating Expenditure - - 1 250 000 1 192 152 95.37%
Net Operating Expenditure
T3.16.5
Table 3.16.6: Employees: Financial Services – Financial Management and Control
Job level
2014/2015 2015/2016
Employees
(N)
Posts
(N)
Employees
(N)
Vacancies: full-time equivalent
(N)
Vacancies
(% of total posts)
0–3
4–6
7–9
10–12
13–15
16–18 1 1 1 0 0
19–20
Total 1 1 1 0 0
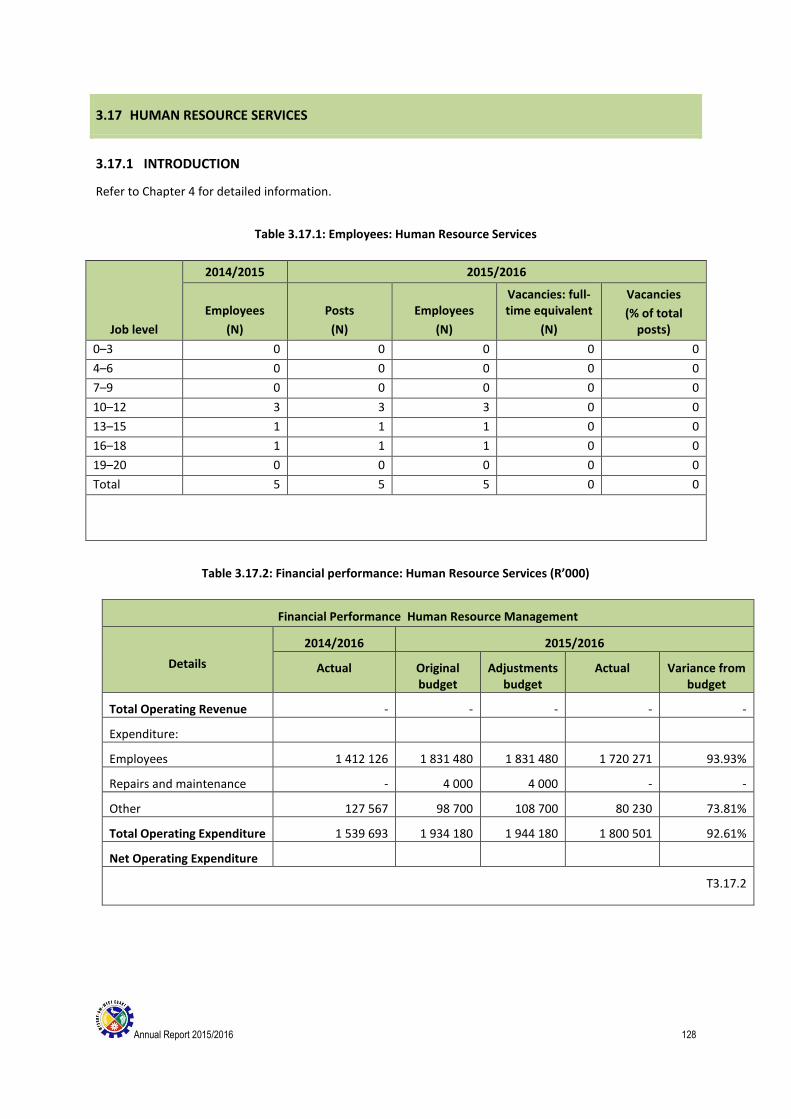
Annual Report 2015/2016 128
3.17 HUMAN RESOURCE SERVICES
3.17.1 INTRODUCTION
Refer to Chapter 4 for detailed information.
Table 3.17.1: Employees: Human Resource Services
Job level
2014/2015 2015/2016
Employees
(N)
Posts
(N)
Employees
(N)
Vacancies: full-time equivalent
(N)
Vacancies
(% of total posts)
0–3 0 0 0 0 0
4–6 0 0 0 0 0
7–9 0 0 0 0 0
10–12 3 3 3 0 0
13–15 1 1 1 0 0
16–18 1 1 1 0 0
19–20 0 0 0 0 0
Total 5 5 5 0 0
Table 3.17.2: Financial performance: Human Resource Services (R’000)
Financial Performance Human Resource Management
Details
2014/2016 2015/2016
Actual Original budget
Adjustments budget
Actual Variance from budget
Total Operating Revenue - - - - -
Expenditure:
Employees 1 412 126 1 831 480 1 831 480 1 720 271 93.93%
Repairs and maintenance - 4 000 4 000 - -
Other 127 567 98 700 108 700 80 230 73.81%
Total Operating Expenditure 1 539 693 1 934 180 1 944 180 1 800 501 92.61%
Net Operating Expenditure
T3.17.2
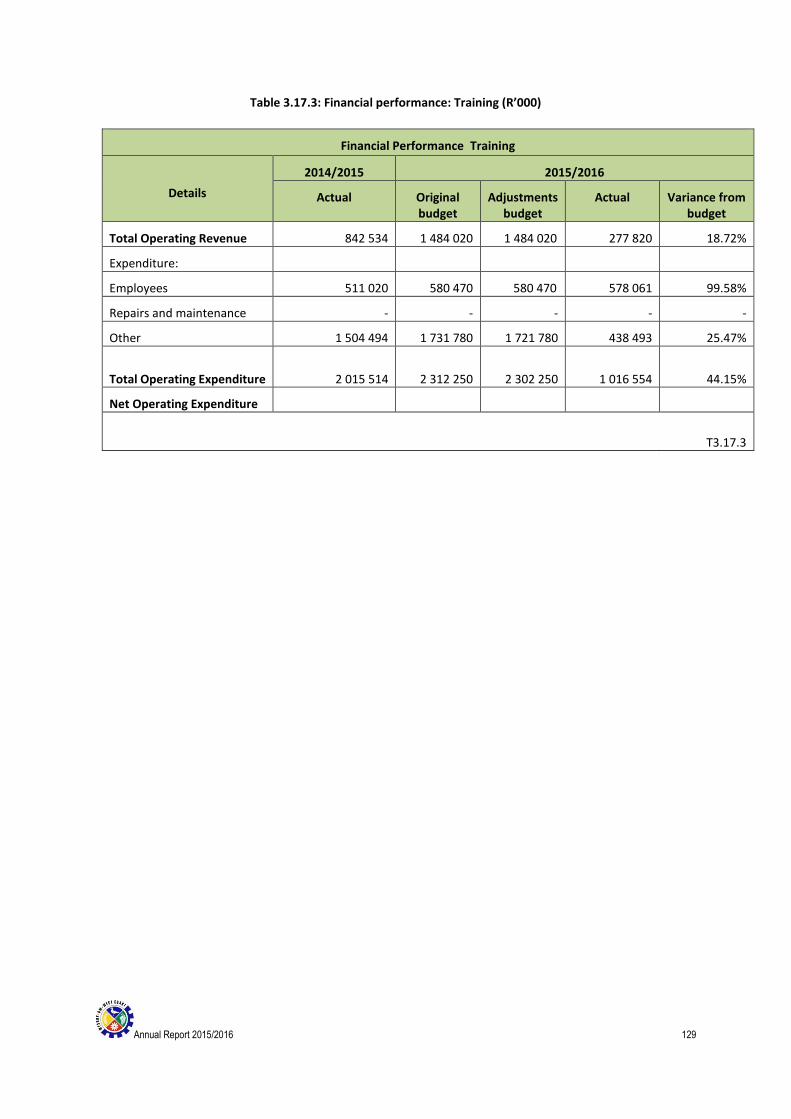
Annual Report 2015/2016 129
Table 3.17.3: Financial performance: Training (R’000)
Financial Performance Training
Details
2014/2015 2015/2016
Actual Original budget
Adjustments budget
Actual Variance from budget
Total Operating Revenue 842 534 1 484 020 1 484 020 277 820 18.72%
Expenditure:
Employees 511 020 580 470 580 470 578 061 99.58%
Repairs and maintenance - - - - -
Other 1 504 494 1 731 780 1 721 780 438 493 25.47%
Total Operating Expenditure
2 015 514 2 312 250 2 302 250 1 016 554 44.15%
Net Operating Expenditure
T3.17.3

Annual Report 2015/2016 130
3.18 INFORMATION AND COMMUNICATION TECHNOLOGY SERVICES
3.18.1 INTRODUCTION
The Information and Communication Technology (ICT) Services Section is responsible for the purchase,
installation and maintenance of all information technology equipment. This includes computers, printers, audio-
visual equipment, telephones and the network infrastructure. The main objective of the ICT Section is to assist
management with decision making and the streamlining of objectives regarding reaching its goals. ICT is a tool
which can be used to automate, monitor and identify areas where the Municipality could improve on service
delivery.
Strategic Goal:
Our strategic goal is to provide efficient and effective ICT services to the computer users of the West Coast
District Municipality. Thus striving for improved Governance and service delivery.
Projects:
Virtualization is almost completed. The second stage of the completion is almost done. Hardware has been
purchased and implementation is at hand. The final phase would be redundancy which will be completed in
2017.
Upgrades to our radio communication backbone has also been completed. This will enable us to have radio
communication throughout our region between Roads, Firefighting and also Water Purification personnel. The
next step will be to utilize the radio backbone for data and voice transfer between offices. This will improve
communication and sharing of information.
One of our future projects is to upgrade our website to make it more user friendly and to accommodate Afrikaans
and English speaking people within our district.
IT is preparing for the new mSCOA. Part of the virtualization was to be prepared for the Hardware compliance
of SCOA.
Our newest project will be to implement a centralized monitoring and control system. Microsoft System Centre
will be utilized to monitor and centrally control all aspects of our network environment.
Challenges:
Our challenges are budget restraints. ICT could improve service delivery with some sort of Help Desk and a call
logging system. This will enable us to have more statistical information regarding what improvements can be
done regarding training, hardware or software upgrades, etc

Annual Report 2015/2016 131
Table 3.18.1: Employees: ICT
Job level
2014/2015 2015/2016
Employees
(N)
Posts
(N)
Employees
(N)
Vacancies: full-time equivalent
(N)
Vacancies
(% of total posts)
0–3
4–6
7–9
10–12
13–15 Hendrik Matthews Manager- IT
16–18 Heinrich Coetzer Senior Network
Administrator
19–20
Total
Table 3.18.2: Financial performance: ICT (R’000)
Financial Performance: Information Technology
Details
2014/2015 2015/2016
Actual Original budget
Adjustments budget
Actual Variance from budget
Total Operating Revenue - - - - -
Expenditure:
Employees 887 575 997 720 997 720 979 993 98.22%
Repairs and maintenance 9 428 100 000 62 000 42 568 68.66%
Other 526 308 1 740 520 2 001 060 937 898 46.87%
Total Operating Expenditure 1 423 311 2 838 240 3 060 780 1 960 459 64.05%
Net Operating Expenditure
T3.18.2

Annual Report 2015/2016 132
3.19 OFFICE OF THE MUNICIPAL MANAGER
Table 3.19.1: Employees: Office of the Municipal Manager
Job level
2015/2016 2015/2016
Employees
(N)
Posts
(N)
Employees
(N)
Vacancies: full-time equivalent
(N)
Vacancies
(% of total posts)
0–3 0 0 0 0 0%
4–6 0 0 0 0 0%
7–9 1 1 1 0 0%
10–12 16 16 16 0 0%
13–15 5 5 5 0 0%
16–18 2 2 2 0 0%
19–20 0 0 0 0 0%
Total 24 24 24 0 0%
Table 3.19.1
Table 3.19.2: Financial performance: Office of the Municipal Manager (R’000)
Financial Performance: Office of the Municipal Manager
Details
2014/2015 2015/2016
Actual Original budget
Adjustments budget
Actual Variance from budget
Total Operating Revenue 934 000 930 000 930 000 823 856 88.59%
Expenditure:
Employees 2 473 107 2 222 440 2 821 350 2 774 655 98.34%
Repairs and maintenance 18 500 17 000 17 000 - -
Other 226 261 1 317 610 1 198 040 1 045 211 87.24%
Total Operating Expenditure 2 717 868 3 557 050 4 036 390 3 819 866 94.64%
Net Operating Expenditure
T3.19.2

Annual Report 2015/2016 133
3.20 INTERNAL AUDIT
3.20.1 INTRODUCTION
The West Coast District Municipality has an efficient Internal Audit Unit, as prescribed in terms of Section 165
of the Municipal Finance Management Act, Act 56 of 2003.
The Internal audit unit gives the municipality assurance on governance, risk management and controls.
During the year under review there were no significant breakdowns in internal controls.
The municipality has a strong governance structure in place and the risk management process was adequate
and effective.
The unit faces the challenge to conform to the IIA’s (International Standards for the Professional
Practice of Internal Auditing Standards).This requires the unit to be internally and externally assessed by a
independent internal audit professional to ensure that they comply with the IIA standards.
To address this unit has embarked to implement a Quality assurance assessment and improvement program which
will outline when and how this will be done.
During the year the unit has also managed to add value by evaluating tenders for risks identification before it is
submitted to the bid evaluation and adjudication committees.
These evaluations primarily focused on identifying risks relating to governance and compliance, which gave
management the opportunity to consider mitigating controls, before these tenders were submitted for evaluation.
Table 3.20.1: Employees: Internal Audit
Job level
2014/2015 2015/2016
Employees
(N)
Posts
(N)
Employees
(N)
Vacancies: full-time equivalent
(N)
Vacancies
(% of total posts)
0–3
4–6
7–9 2 0 0 0
10–12 0 2 2 0 0
13–15 1 1 1 0 0
16–18
19–20
Total 3 3 3 0 0

Annual Report 2015/2016 134
Table 3.20.2: Financial performance: Internal Audit (R’000)
Financial Performance: Internal Audit
Details
2014/2015 2015/2016
Actual Original budget
Adjustments budget
Actual Variance from budget
Total Operating Revenue - - - - -
Expenditure:
Employees 1 248 176 1 407 270 1 407 270 1 365 889 97.06%
Repairs and maintenance - 2 250 2 250 - -
Other 34 596 33 430 33 430 30 729 91.92%
Total Operating Expenditure 1 282 772 1 442 950 1 442 950 1 396 618 96.79%
Net Operating Expenditure
Net expenditure to be consistent with summary table T5.1.2 in Chapter 5. Variances are calculated by dividing the difference between the actual and original Budget by the actual. T3.20.2
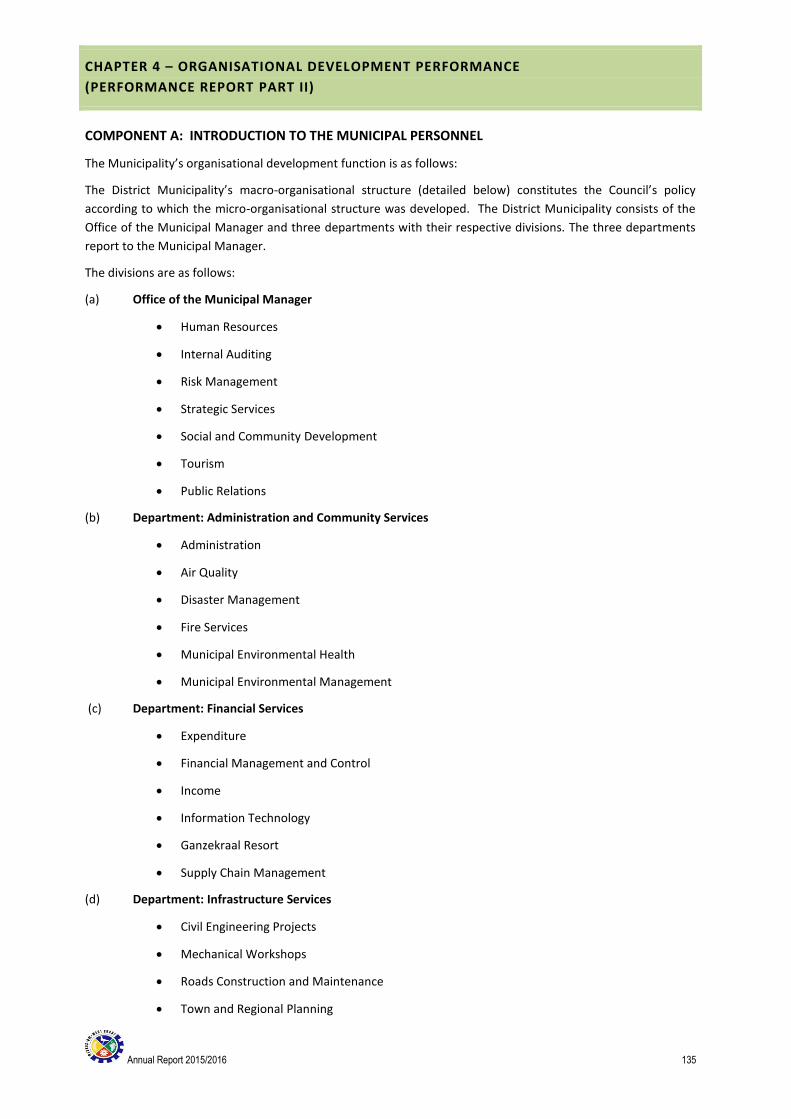
Annual Report 2015/2016 135
CHAPTER 4 – ORGANISATIONAL DEVELOPMENT PERFORMANCE
(PERFORMANCE REPORT PART II)
COMPONENT A: INTRODUCTION TO THE MUNICIPAL PERSONNEL
The Municipality’s organisational development function is as follows:
The District Municipality’s macro-organisational structure (detailed below) constitutes the Council’s policy
according to which the micro-organisational structure was developed. The District Municipality consists of the
Office of the Municipal Manager and three departments with their respective divisions. The three departments
report to the Municipal Manager.
The divisions are as follows:
(a) Office of the Municipal Manager
Human Resources
Internal Auditing
Risk Management
Strategic Services
Social and Community Development
Tourism
Public Relations
(b) Department: Administration and Community Services
Administration
Air Quality
Disaster Management
Fire Services
Municipal Environmental Health
Municipal Environmental Management
(c) Department: Financial Services
Expenditure
Financial Management and Control
Income
Information Technology
Ganzekraal Resort
Supply Chain Management
(d) Department: Infrastructure Services
Civil Engineering Projects
Mechanical Workshops
Roads Construction and Maintenance
Town and Regional Planning
Annual Report 2015/2016 136
Water Purification
Water Distribution

Annual Report 2015/2016 137
4.1 EMPLOYEE TOTALS, TURNOVER AND VACANCIES
4.1.1 EMPLOYEE TOTALS, TURNOVER AND VACANCIES
Table 4.1: Employees
Description
2015/2016
Approved posts
(N)
Employees
(N)
Vacancies
(N)
Vacancies
(%)
Water 123 97 26 21.1%
Health 30 29 1 3.33%
Security and Safety 79 73 6 7.5%
Roads 230 193 37 15.6%
Planning 1 1 0 0%
Planning (strategic and regulatory) 11 11 0 0%
Community and social services 6 6 0 0%
Environmental protection 3 2 1 3.33%
Corporate policy offices and other 108 101 7 6.48%
T4.1.1
Table 4.2: Vacancy rate for 2015/2016
Designations Approved
posts
Variances
(N)
Variances
(%)
Municipal manager 1 0 0%
CFO 1 0 0%
Other S57 managers (excluding finance posts) 2 0 0%
Other S57 managers (finance managers) 0 0 0%
Fire fighters 79 6 7.5%
Senior managers: levels 13–18 (excluding finance posts) 28 2 7.14%
Senior managers: levels 13–18 (finance posts) 6 0 0%
Highly skilled supervisors: levels 9–12 (excluding
finance posts)
104 16 15.38%
Highly skilled supervisors: levels 9–12 (finance posts) 10 0 0%
T4. 2
Table 4.3: Turnover rate
Details
Total appointments from beginning of financial
year
Total terminations during financial
year Turnover rate
2015/2016 43 40 7.7%
T4.3
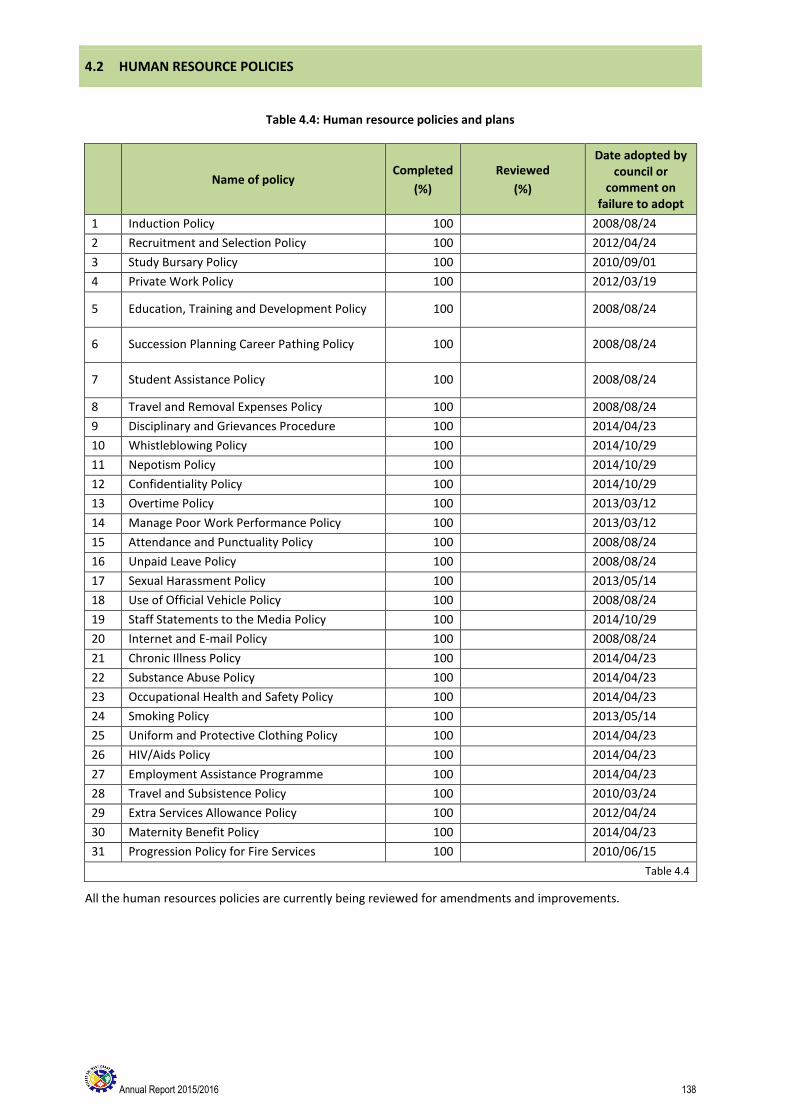
Annual Report 2015/2016 138
4.2 HUMAN RESOURCE POLICIES
Table 4.4: Human resource policies and plans
Name of policy Completed
(%)
Reviewed
(%)
Date adopted by council or
comment on failure to adopt
1 Induction Policy 100 2008/08/24
2 Recruitment and Selection Policy 100 2012/04/24
3 Study Bursary Policy 100 2010/09/01
4 Private Work Policy 100 2012/03/19
5 Education, Training and Development Policy 100 2008/08/24
6 Succession Planning Career Pathing Policy 100 2008/08/24
7 Student Assistance Policy 100 2008/08/24
8 Travel and Removal Expenses Policy 100 2008/08/24
9 Disciplinary and Grievances Procedure 100 2014/04/23
10 Whistleblowing Policy 100 2014/10/29
11 Nepotism Policy 100 2014/10/29
12 Confidentiality Policy 100 2014/10/29
13 Overtime Policy 100 2013/03/12
14 Manage Poor Work Performance Policy 100 2013/03/12
15 Attendance and Punctuality Policy 100 2008/08/24
16 Unpaid Leave Policy 100 2008/08/24
17 Sexual Harassment Policy 100 2013/05/14
18 Use of Official Vehicle Policy 100 2008/08/24
19 Staff Statements to the Media Policy 100 2014/10/29
20 Internet and E-mail Policy 100 2008/08/24
21 Chronic Illness Policy 100 2014/04/23
22 Substance Abuse Policy 100 2014/04/23
23 Occupational Health and Safety Policy 100 2014/04/23
24 Smoking Policy 100 2013/05/14
25 Uniform and Protective Clothing Policy 100 2014/04/23
26 HIV/Aids Policy 100 2014/04/23
27 Employment Assistance Programme 100 2014/04/23
28 Travel and Subsistence Policy 100 2010/03/24
29 Extra Services Allowance Policy 100 2012/04/24
30 Maternity Benefit Policy 100 2014/04/23
31 Progression Policy for Fire Services 100 2010/06/15
Table 4.4
All the human resources policies are currently being reviewed for amendments and improvements.
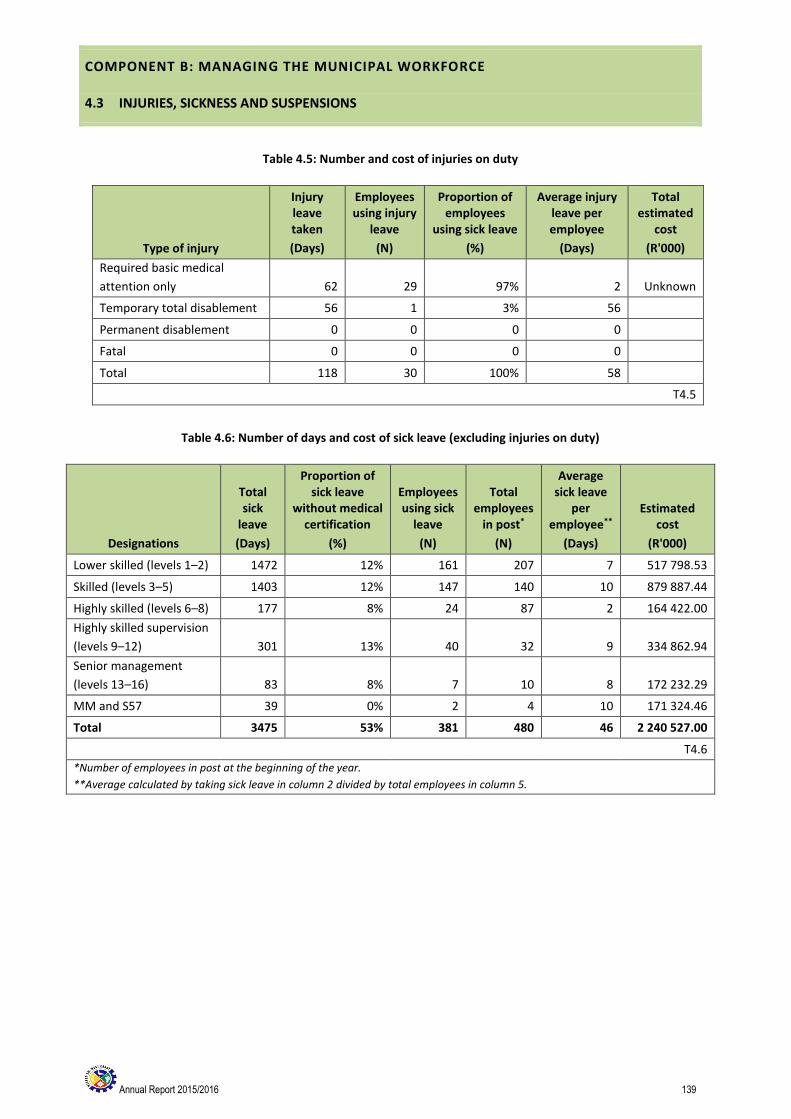
Annual Report 2015/2016 139
COMPONENT B: MANAGING THE MUNICIPAL WORKFORCE
4.3 INJURIES, SICKNESS AND SUSPENSIONS
Table 4.5: Number and cost of injuries on duty
Type of injury
Injury leave taken
(Days)
Employees using injury
leave
(N)
Proportion of employees
using sick leave
(%)
Average injury leave per employee
(Days)
Total estimated
cost
(R'000)
Required basic medical
attention only 62 29 97% 2 Unknown
Temporary total disablement 56 1 3% 56
Permanent disablement 0 0 0 0
Fatal 0 0 0 0
Total 118 30 100% 58
T4.5
Table 4.6: Number of days and cost of sick leave (excluding injuries on duty)
Designations
Total sick
leave
(Days)
Proportion of sick leave
without medical certification
(%)
Employees using sick
leave
(N)
Total employees
in post*
(N)
Average sick leave
per employee**
(Days)
Estimated cost
(R'000)
Lower skilled (levels 1–2) 1472 12% 161 207 7 517 798.53
Skilled (levels 3–5) 1403 12% 147 140 10 879 887.44
Highly skilled (levels 6–8) 177 8% 24 87 2 164 422.00
Highly skilled supervision
(levels 9–12) 301 13% 40 32 9 334 862.94
Senior management
(levels 13–16) 83 8% 7 10 8 172 232.29
MM and S57 39 0% 2 4 10 171 324.46
Total 3475 53% 381 480 46 2 240 527.00
T4.6
*Number of employees in post at the beginning of the year.
**Average calculated by taking sick leave in column 2 divided by total employees in column 5.
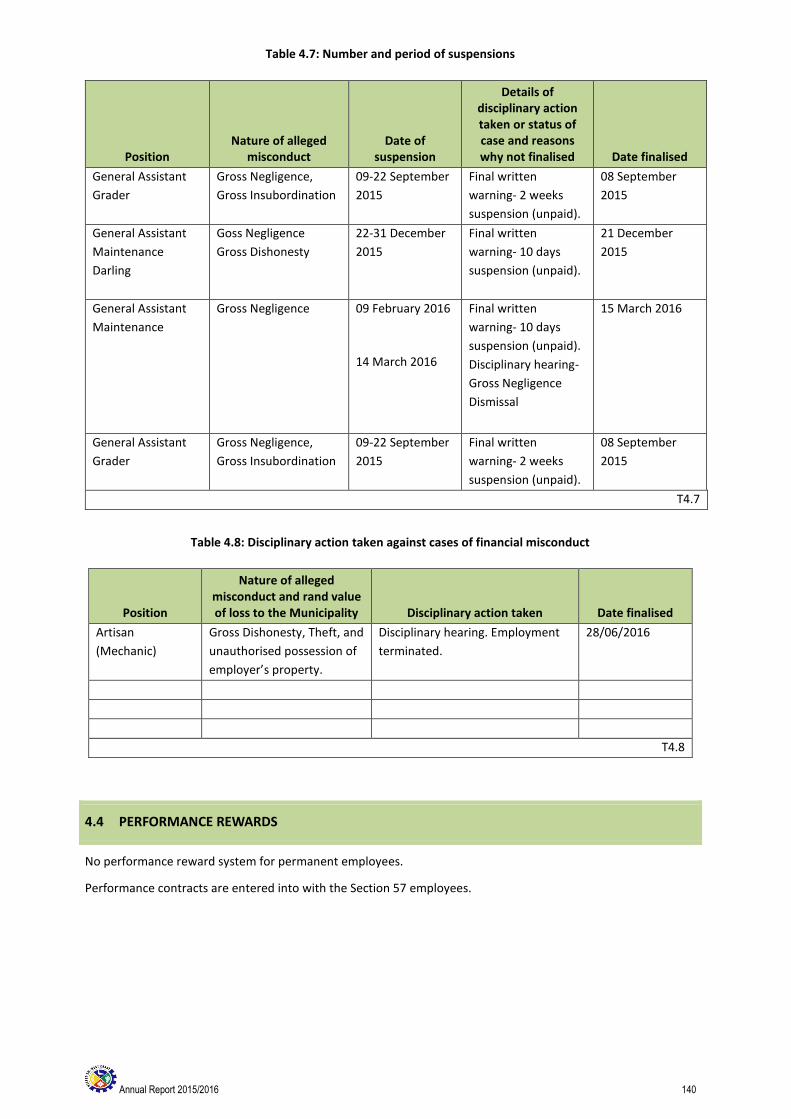
Annual Report 2015/2016 140
Table 4.7: Number and period of suspensions
Position Nature of alleged
misconduct Date of
suspension
Details of disciplinary action taken or status of case and reasons why not finalised Date finalised
General Assistant
Grader
Gross Negligence,
Gross Insubordination
09-22 September
2015
Final written
warning- 2 weeks
suspension (unpaid).
08 September
2015
General Assistant
Maintenance
Darling
Goss Negligence
Gross Dishonesty
22-31 December
2015
Final written
warning- 10 days
suspension (unpaid).
21 December
2015
General Assistant
Maintenance
Gross Negligence 09 February 2016
14 March 2016
Final written
warning- 10 days
suspension (unpaid).
Disciplinary hearing-
Gross Negligence
Dismissal
15 March 2016
General Assistant
Grader
Gross Negligence,
Gross Insubordination
09-22 September
2015
Final written
warning- 2 weeks
suspension (unpaid).
08 September
2015
T4.7
Table 4.8: Disciplinary action taken against cases of financial misconduct
Position
Nature of alleged misconduct and rand value of loss to the Municipality Disciplinary action taken Date finalised
Artisan
(Mechanic)
Gross Dishonesty, Theft, and
unauthorised possession of
employer’s property.
Disciplinary hearing. Employment
terminated.
28/06/2016
T4.8
4.4 PERFORMANCE REWARDS
No performance reward system for permanent employees.
Performance contracts are entered into with the Section 57 employees.
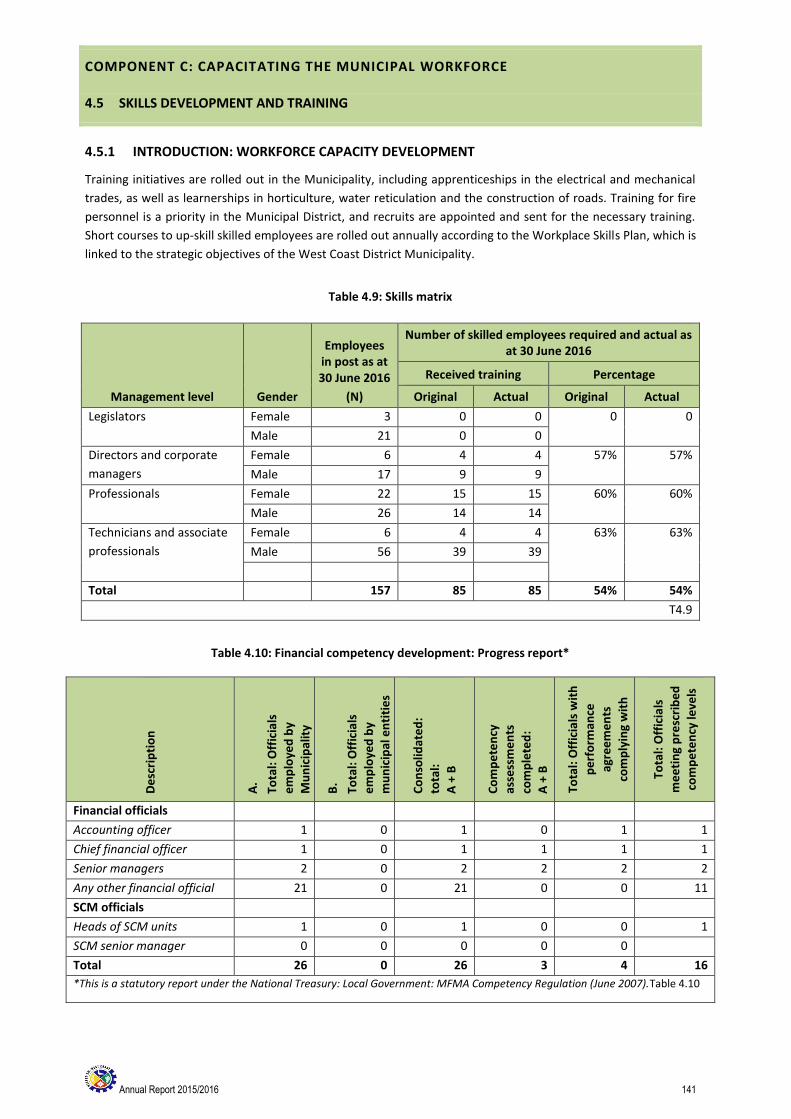
Annual Report 2015/2016 141
COMPONENT C: CAPACITATING THE MUNICIPAL WORKFORCE
4.5 SKILLS DEVELOPMENT AND TRAINING
4.5.1 INTRODUCTION: WORKFORCE CAPACITY DEVELOPMENT
Training initiatives are rolled out in the Municipality, including apprenticeships in the electrical and mechanical
trades, as well as learnerships in horticulture, water reticulation and the construction of roads. Training for fire
personnel is a priority in the Municipal District, and recruits are appointed and sent for the necessary training.
Short courses to up-skill skilled employees are rolled out annually according to the Workplace Skills Plan, which is
linked to the strategic objectives of the West Coast District Municipality.
Table 4.9: Skills matrix
Management level Gender
Employees in post as at 30 June 2016
(N)
Number of skilled employees required and actual as at 30 June 2016
Received training Percentage
Original Actual Original Actual
Legislators Female 3 0 0 0 0
Male 21 0 0
Directors and corporate
managers
Female 6 4 4 57% 57%
Male 17 9 9
Professionals Female 22 15 15 60% 60%
Male 26 14 14
Technicians and associate
professionals
Female 6 4 4 63% 63%
Male 56 39 39
Total 157 85 85 54% 54%
T4.9
Table 4.10: Financial competency development: Progress report*
De
scri
pti
on
A.
Tota
l: O
ffic
ials
em
plo
yed
by
Mu
nic
ipal
ity
B.
Tota
l: O
ffic
ials
em
plo
yed
by
mu
nic
ipal
en
titi
es
Co
nso
lidat
ed
:
tota
l:
A +
B
Co
mp
ete
ncy
asse
ssm
en
ts
com
ple
ted
: A
+ B
Tota
l: O
ffic
ials
wit
h
pe
rfo
rman
ce
agre
em
en
ts
com
ply
ing
wit
h
Re
gula
tio
n 1
6
Tota
l: O
ffic
ials
me
eti
ng
pre
scri
be
d
com
pe
ten
cy le
vels
Financial officials
Accounting officer 1 0 1 0 1 1
Chief financial officer 1 0 1 1 1 1
Senior managers 2 0 2 2 2 2
Any other financial official 21 0 21 0 0 11
SCM officials
Heads of SCM units 1 0 1 0 0 1
SCM senior manager 0 0 0 0 0
Total 26 0 26 3 4 16
*This is a statutory report under the National Treasury: Local Government: MFMA Competency Regulation (June 2007).Table 4.10

Annual Report 2015/2016 142
Table 4.11: Skills development and expenditure (R’000)
Management level Gender
Employees in post as at 30
June 2016
(N)
Total number of employees who received training and percentage
Received training %
Original Actual Original Actual
Legislators Female 3 0 0 0 0
Male 21 0 0
Directors and corporate
managers
Female 6 4 4 57% 57%
Male 17 9 9
Professionals Female 22 15 15 60% 60%
Male 26 14 14
Technicians and associate
professionals
Female 6 4 4 63% 63%
Male 56 39 39
Clerical and administrative
workers
Female 20 15 15 52% 52%
Male 13 2 2
Community and personal
services workers
Female 9 4 4 35% 35%
Male 70 24 24
Machine operators and
drivers
Female 0 0 0 45% 45%
Male 44 20 20
Elementary occupations Female 31 20 20 38% 38%
Male 186 63 63
Total 530 233 233 44% 44%
Table 4.11
Total actual training spend for the year: R1 300 793.09
Annual Report 2015/2016 143
CHAPTER 5: FINANCIAL PERFORMANCE
INTRODUCTION Chapter 5 contains information regarding financial performance and highlights specific accomplishments. The chapter comprises of three components:
Component A: Statement of Financial Performance
Component B: Spending Against Capital Budget
Component C: Other Financial Matter

Annual Report 2015/2016 144
COMPONENT A: STATEMENTS OF FINANCIAL PERFORMANCE
5.1 STATEMENTS OF FINANCIAL PERFORMANCE
Note: Statements of Revenue Collection Performance by vote and by source are included at Appendix K
Description
R thousands
Original
Budget
Budget
Adjustments
(i.t.o. s28 and
s31 of the
MFMA)
Final
adjustments
budget
Shifting of
funds
(i.t.o. s31 of the
MFMA)
Virement
(i.t.o. Council
approv ed
policy )
Final Budget Actual
Outcome
Unauthorised
expenditure
Variance Actual
Outcome as %
of Final
Budget
Actual
Outcome as %
of Original
Budget
Reported
unauthorised
expenditure
Expenditure
authorised in
terms of
section 32 of
MFMA
Balance to be
recovered
Restated
Audited
Outcome
1 2 3 4 5 6 7 8 9 10 11 12 13 14 15
Financial Performance
Property rates – – – – – – – – – 0.00 0.00 – – – –
Serv ice charges 110 708 – 110 708 – – 110 708 113 875 3 167 102.86 102.86 – – – 107 439
Inv estment rev enue 8 250 – 8 250 – – 8 250 17 176 – 8 926 208.20 208.20 – – – 13 526
Transfers recognised - operational 86 057 1 654 87 711 – – 87 711 88 624 – 913 101.04 102.98 – – – 84 418
Other ow n rev enue 133 684 44 488 178 172 – – 178 172 154 719 – (23 453) 86.84 115.73 – – – 126 627
Total Revenue (excluding capital transfers and contributions)
338 699 46 142 384 841 – – 384 841 374 394 – (10 447) 97.29 110.54 – – – 332 010
Employ ee costs 154 256 149 154 405 – – 154 405 146 033 – (8 372) 94.58 94.67 – – – 132 635
Remuneration of councillors 5 931 395 6 326 – – 6 326 6 153 – (174) 97.26 103.74 – – – 5 883
Debt impairment 750 – 750 – – 750 282 – (468) 37.55 37.55 – – – 361
Depreciation & asset impairment 14 134 – 14 134 – – 14 134 13 598 – (537) 96.20 96.20 – – – 12 695
Finance charges 10 664 – 10 664 – – 10 664 8 943 – (1 721) 83.86 83.86 – – – 10 454
Materials and bulk purchases 51 417 41 819 93 236 – – 93 236 92 823 – (412) 99.56 180.53 – – – 66 706
Transfers and grants – – – – – – – – – 0.00 0.00 – – – –
Other ex penditure 95 430 24 955 120 385 – – 120 385 92 618 – (27 767) 76.94 97.05 – – – 64 910
Total Expenditure 332 582 67 318 399 900 – – 399 900 360 449 – (39 450) 90.13 108.38 – – – 293 644
Surplus/(Deficit) 6 117 (21 176) (15 059) – – (15 059) 13 944 – 29 003 -92.60 227.94 – – – 38 366
Transfers recognised - capital – – – – – – – – – 0 (0) – – – –
Contributions recognised - capital & contributed assets – – – – – – – – – 0.00 0.00 – – – –
Surplus/(Deficit) after capital transfers & contributions 6 117 (21 176) (15 059) – – (15 059) 13 944 – 29 003 -92.60 227.94 – – – 38 366
Share of surplus/ (deficit) of associate – – – – – – – – – 0 #DIV/0! – – – –
Surplus/(Deficit) for the year 6 117 (21 176) (15 059) – – (15 059) 13 944 – 29 003 -92.60 227.94 – – – 38 366
Capital expenditure & funds sources
Capital expenditure 8 315 (1 153) 7 162 – – 7 162 6 440 – (722) 89.91 77.45 – – – 16 155
Transfers recognised - capital – – – – – – – – – 0.00 0.00 – – – –
Public contributions & donations – – – – – – – – 0 0.00 0.00 – – – –
Borrow ing – – – – – – – – – 0.00 0.00 – – – –
Internally generated funds 8 315 (1 153) 7 162 – – 7 162 6 440 – (722) 89.91 77.45 – – – 16 155
Total sources of capital funds 8 315 (1 153) 7 162 – – 7 162 6 440 – (722) 89.91 77.45 – – – 16 155
Cash flows
Net cash from (used) operating 21 002 (2 040) 18 962 – – 18 962 49 113 – 30 151 259.00 233.85 – – – 58 904
Net cash from (used) inv esting (8 315) 1 153 (7 162) – – (7 162) (6 168) – 995 86.11 74.17 – – – (15 460)
Net cash from (used) financing (14 127) – (14 127) – – (14 127) (14 998) – (870) 106.16 106.16 – – – (13 516)
Cash/cash equivalents at the year end 167 598 (887) 166 711 – – 166 711 226 915 – 60 204 136.11 135.39 – – – 198 967 199
2015/2016 2014/2015
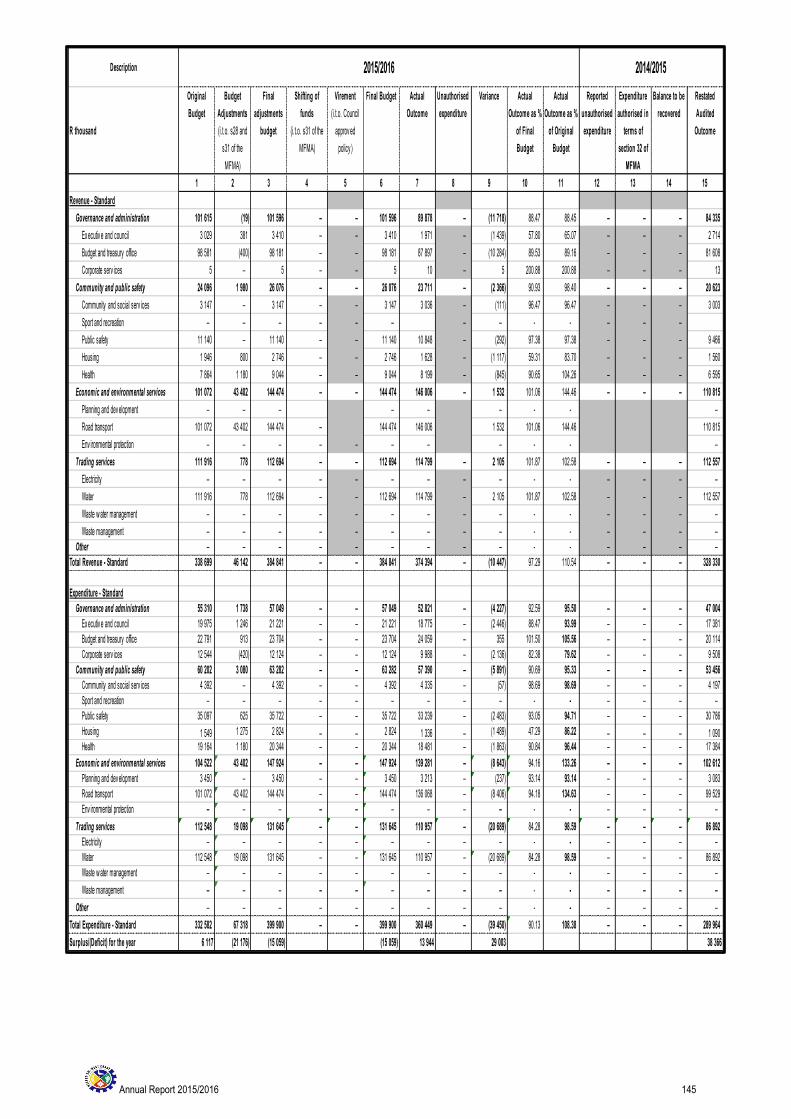
Annual Report 2015/2016 145
Description
R thousand
Original
Budget
Budget
Adjustments
(i.t.o. s28 and
s31 of the
MFMA)
Final
adjustments
budget
Shifting of
funds
(i.t.o. s31 of the
MFMA)
Virement
(i.t.o. Council
approv ed
policy )
Final Budget Actual
Outcome
Unauthorised
expenditure
Variance Actual
Outcome as %
of Final
Budget
Actual
Outcome as %
of Original
Budget
Reported
unauthorised
expenditure
Expenditure
authorised in
terms of
section 32 of
MFMA
Balance to be
recovered
Restated
Audited
Outcome
1 2 3 4 5 6 7 8 9 10 11 12 13 14 15
Revenue - Standard
Governance and administration 101 615 (19) 101 596 – – 101 596 89 878 – (11 718) 88.47 88.45 – – – 84 335
Ex ecutiv e and council 3 029 381 3 410 – – 3 410 1 971 – (1 439) 57.80 65.07 – – – 2 714
Budget and treasury office 98 581 (400) 98 181 – – 98 181 87 897 – (10 284) 89.53 89.16 – – – 81 608
Corporate serv ices 5 – 5 – – 5 10 – 5 200.88 200.88 – – – 13
Community and public safety 24 096 1 980 26 076 – – 26 076 23 711 – (2 366) 90.93 98.40 – – – 20 623
Community and social serv ices 3 147 – 3 147 – – 3 147 3 036 – (111) 96.47 96.47 – – – 3 003
Sport and recreation – – – – – – – – - - – – –
Public safety 11 140 – 11 140 – – 11 140 10 848 – (292) 97.38 97.38 – – – 9 466
Housing 1 946 800 2 746 – – 2 746 1 628 – (1 117) 59.31 83.70 – – – 1 560
Health 7 864 1 180 9 044 – – 9 044 8 199 – (845) 90.65 104.26 – – – 6 595
Economic and environmental services 101 072 43 402 144 474 – – 144 474 146 006 – 1 532 101.06 144.46 – – – 110 815
Planning and dev elopment – – – – – – - - –
Road transport 101 072 43 402 144 474 – 144 474 146 006 1 532 101.06 144.46 110 815
Env ironmental protection – – – – – – – – - - –
Trading services 111 916 778 112 694 – – 112 694 114 799 – 2 105 101.87 102.58 – – – 112 557
Electricity – – – – – – – – – - - – – – –
Water 111 916 778 112 694 – – 112 694 114 799 – 2 105 101.87 102.58 – – – 112 557
Waste w ater management – – – – – – – – – - - – – – –
Waste management – – – – – – – – – - - – – – –
Other – – – – – – – – – - - – – – –
Total Revenue - Standard 338 699 46 142 384 841 – – 384 841 374 394 – (10 447) 97.29 110.54 – – – 328 330
Expenditure - Standard
Governance and administration 55 310 1 738 57 049 – – 57 049 52 821 – (4 227) 92.59 95.50 – – – 47 004
Ex ecutiv e and council 19 975 1 246 21 221 – – 21 221 18 775 – (2 446) 88.47 93.99 – – – 17 381
Budget and treasury office 22 791 913 23 704 – – 23 704 24 059 – 355 101.50 105.56 – – – 20 114
Corporate serv ices 12 544 (420) 12 124 – – 12 124 9 988 – (2 136) 82.38 79.62 – – – 9 508
Community and public safety 60 202 3 080 63 282 – – 63 282 57 390 – (5 891) 90.69 95.33 – – – 53 456
Community and social serv ices 4 392 – 4 392 – – 4 392 4 335 – (57) 98.69 98.69 – – – 4 197
Sport and recreation – – – – – – – – – - - – – – –
Public safety 35 097 625 35 722 – – 35 722 33 239 – (2 483) 93.05 94.71 – – – 30 786
Housing 1 549 1 275 2 824 – – 2 824 1 336 – (1 489) 47.29 86.22 – – – 1 090
Health 19 164 1 180 20 344 – – 20 344 18 481 – (1 863) 90.84 96.44 – – – 17 384
Economic and environmental services 104 522 43 402 147 924 – – 147 924 139 281 – (8 643) 94.16 133.26 – – – 102 612
Planning and dev elopment 3 450 – 3 450 – – 3 450 3 213 – (237) 93.14 93.14 – – – 3 083
Road transport 101 072 43 402 144 474 – – 144 474 136 068 – (8 406) 94.18 134.63 – – – 99 529
Env ironmental protection – – – – – – – – – - - – – – –
Trading services 112 548 19 098 131 645 – – 131 645 110 957 – (20 689) 84.28 98.59 – – – 86 892
Electricity – – – – – – – – – - - – – – –
Water 112 548 19 098 131 645 – – 131 645 110 957 – (20 689) 84.28 98.59 – – – 86 892
Waste w ater management – – – – – – – – – - - – – – –
Waste management – – – – – – – – – - - – – – –
Other – – – – – – – – – - - – – – –
Total Expenditure - Standard 332 582 67 318 399 900 – – 399 900 360 449 – (39 450) 90.13 108.38 – – – 289 964
Surplus/(Deficit) for the year 6 117 (21 176) (15 059) (15 059) 13 944 29 003 38 366
2015/2016 2014/2015
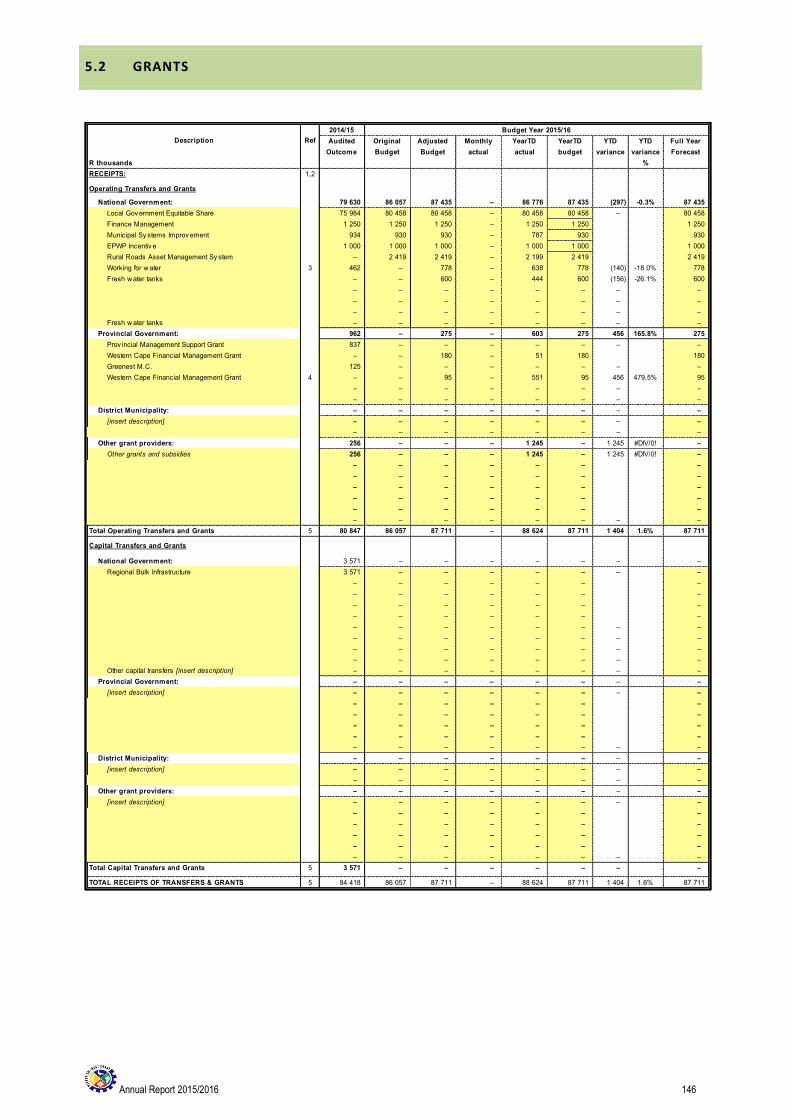
Annual Report 2015/2016 146
5.2 GRANTS
2014/15 Budget Year 2015/16
Audited
Outcome
Original
Budget
Adjusted
Budget
Monthly
actual
YearTD
actual
YearTD
budget
YTD
variance
YTD
variance
Full Year
Forecast
R thousands %
RECEIPTS: 1,2
Operating Transfers and Grants
National Government: 79 630 86 057 87 435 – 86 776 87 435 (297) -0.3% 87 435
Local Gov ernment Equitable Share 75 984 80 458 80 458 – 80 458 80 458 – 80 458
Finance Management 1 250 1 250 1 250 – 1 250 1 250 1 250
Municipal Sy stems Improv ement 934 930 930 – 787 930 930
EPWP Incentiv e 1 000 1 000 1 000 – 1 000 1 000 1 000
Rural Roads Asset Management Sy stem – 2 419 2 419 – 2 199 2 419 2 419
Working for w ater 3 462 – 778 – 638 778 (140) -18.0% 778
Fresh w ater tanks – – 600 – 444 600 (156) -26.1% 600
– – – – – – – –
– – – – – – – –
– – – – – – – –
Fresh w ater tanks – – – – – – – –
Provincial Government: 962 – 275 – 603 275 456 165.8% 275
Prov incial Management Support Grant 837 – – – – – – –
Western Cape Financial Management Grant – – 180 – 51 180 180
Greenest M.C. 125 – – – – – – –
Western Cape Financial Management Grant 4 – – 95 – 551 95 456 479.5% 95
– – – – – – – –
– – – – – – – –
District Municipality: – – – – – – – –
[insert description] – – – – – – – –
– – – – – – – –
Other grant providers: 256 – – – 1 245 – 1 245 #DIV/0! –
Other grants and subsidies 256 – – – 1 245 – 1 245 #DIV/0! –
– – – – – – –
– – – – – – –
– – – – – – –
– – – – – – –
– – – – – – –
– – – – – – – –
Total Operating Transfers and Grants 5 80 847 86 057 87 711 – 88 624 87 711 1 404 1.6% 87 711
Capital Transfers and Grants
National Government: 3 571 – – – – – – –
Regional Bulk Infrastructure 3 571 – – – – – – –
– – – – – – –
– – – – – – –
– – – – – – –
– – – – – – –
– – – – – – – –
– – – – – – – –
– – – – – – – –
– – – – – – – –
Other capital transfers [insert description] – – – – – – – –
Provincial Government: – – – – – – – –
[insert description] – – – – – – – –
– – – – – – –
– – – – – – –
– – – – – – –
– – – – – – –
– – – – – – – –
District Municipality: – – – – – – – –
[insert description] – – – – – – – –
– – – – – – – –
Other grant providers: – – – – – – – –
[insert description] – – – – – – – –
– – – – – – –
– – – – – – –
– – – – – – –
– – – – – – –
– – – – – – – –
Total Capital Transfers and Grants 5 3 571 – – – – – – –
TOTAL RECEIPTS OF TRANSFERS & GRANTS 5 84 418 86 057 87 711 – 88 624 87 711 1 404 1.6% 87 711
Description Ref
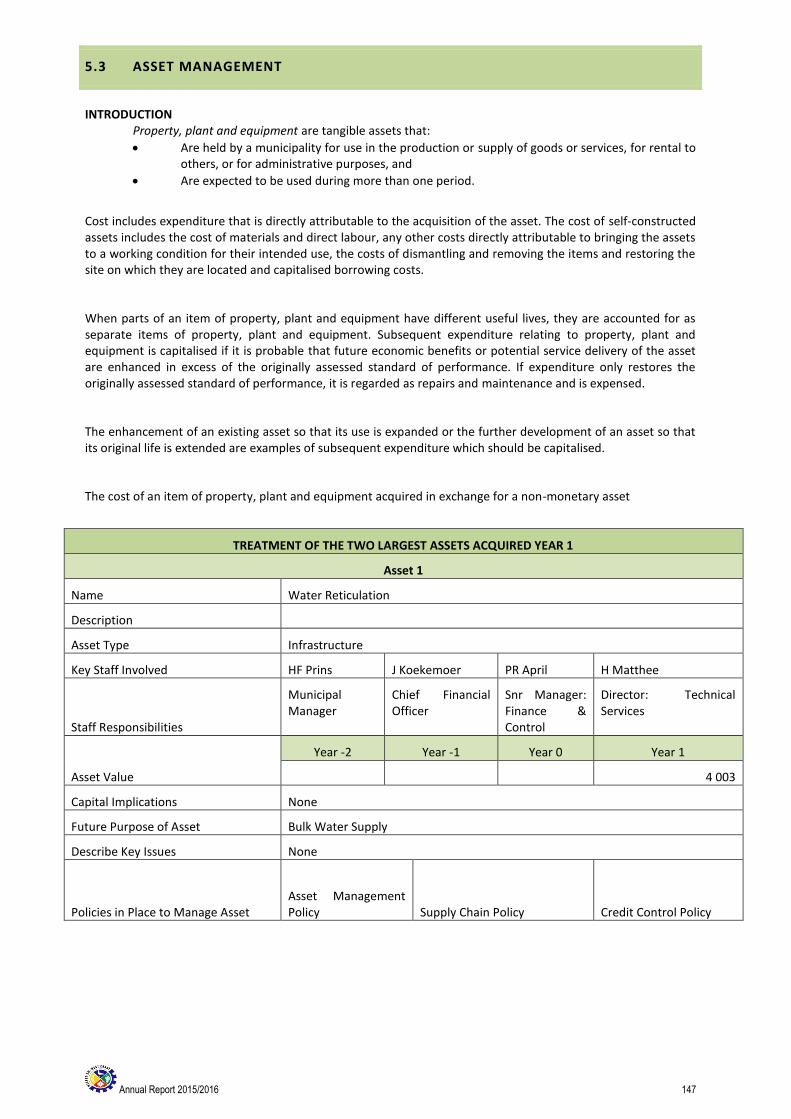
Annual Report 2015/2016 147
5.3 ASSET MANAGEMENT
INTRODUCTION Property, plant and equipment are tangible assets that:
Are held by a municipality for use in the production or supply of goods or services, for rental to others, or for administrative purposes, and
Are expected to be used during more than one period.
Cost includes expenditure that is directly attributable to the acquisition of the asset. The cost of self-constructed assets includes the cost of materials and direct labour, any other costs directly attributable to bringing the assets to a working condition for their intended use, the costs of dismantling and removing the items and restoring the site on which they are located and capitalised borrowing costs.
When parts of an item of property, plant and equipment have different useful lives, they are accounted for as separate items of property, plant and equipment. Subsequent expenditure relating to property, plant and equipment is capitalised if it is probable that future economic benefits or potential service delivery of the asset are enhanced in excess of the originally assessed standard of performance. If expenditure only restores the originally assessed standard of performance, it is regarded as repairs and maintenance and is expensed.
The enhancement of an existing asset so that its use is expanded or the further development of an asset so that its original life is extended are examples of subsequent expenditure which should be capitalised.
The cost of an item of property, plant and equipment acquired in exchange for a non-monetary asset
TREATMENT OF THE TWO LARGEST ASSETS ACQUIRED YEAR 1
Asset 1
Name Water Reticulation
Description
Asset Type Infrastructure
Key Staff Involved HF Prins J Koekemoer PR April H Matthee
Staff Responsibilities
Municipal Manager
Chief Financial Officer
Snr Manager: Finance & Control
Director: Technical Services
Asset Value
Year -2 Year -1 Year 0 Year 1
4 003
Capital Implications None
Future Purpose of Asset Bulk Water Supply
Describe Key Issues None
Policies in Place to Manage Asset Asset Management Policy Supply Chain Policy Credit Control Policy
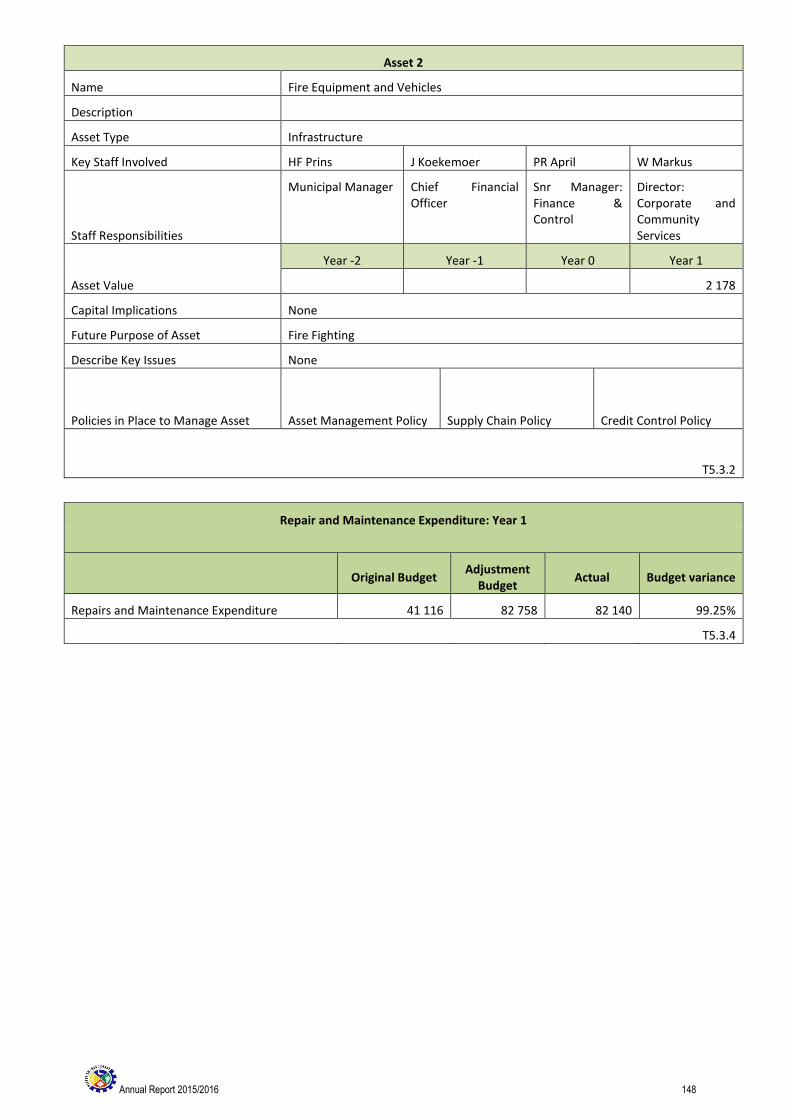
Annual Report 2015/2016 148
Asset 2
Name Fire Equipment and Vehicles
Description
Asset Type Infrastructure
Key Staff Involved HF Prins J Koekemoer PR April W Markus
Staff Responsibilities
Municipal Manager Chief Financial Officer
Snr Manager: Finance & Control
Director: Corporate and Community Services
Asset Value
Year -2 Year -1 Year 0 Year 1
2 178
Capital Implications None
Future Purpose of Asset Fire Fighting
Describe Key Issues None
Policies in Place to Manage Asset Asset Management Policy Supply Chain Policy Credit Control Policy
T5.3.2
Repair and Maintenance Expenditure: Year 1
Original Budget
Adjustment Budget
Actual Budget variance
Repairs and Maintenance Expenditure 41 116 82 758 82 140 99.25%
T5.3.4
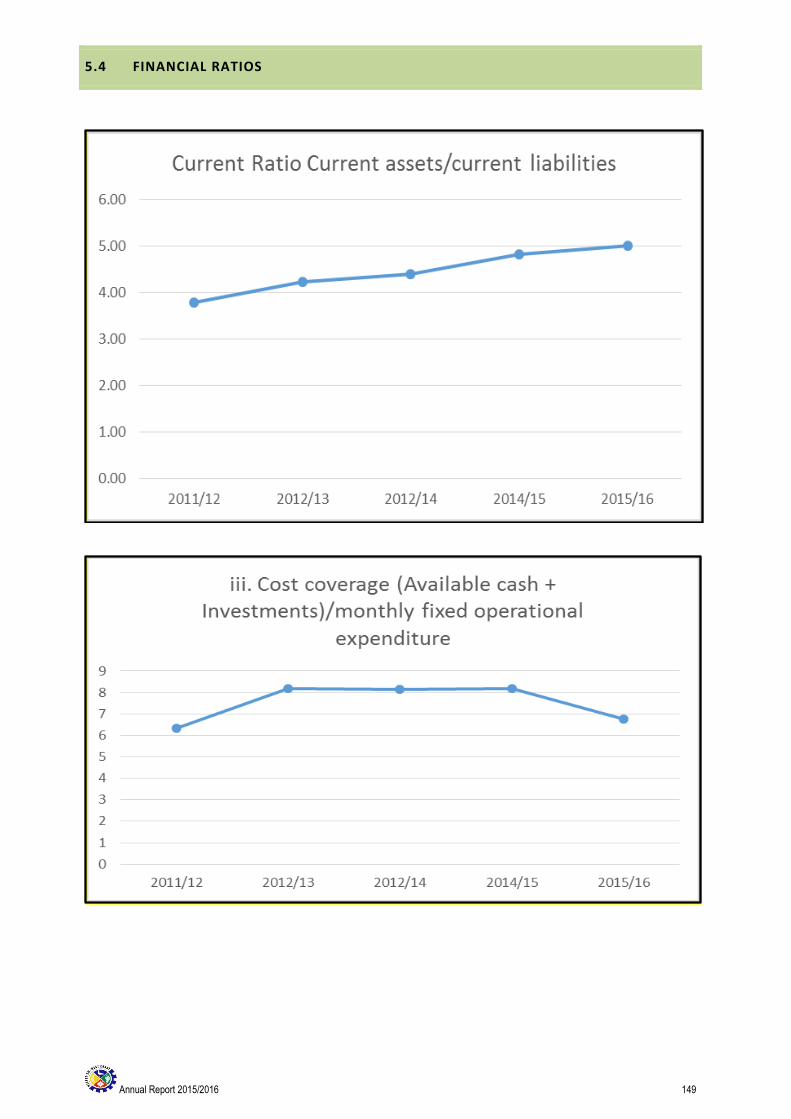
Annual Report 2015/2016 149
5.4 FINANCIAL RATIOS
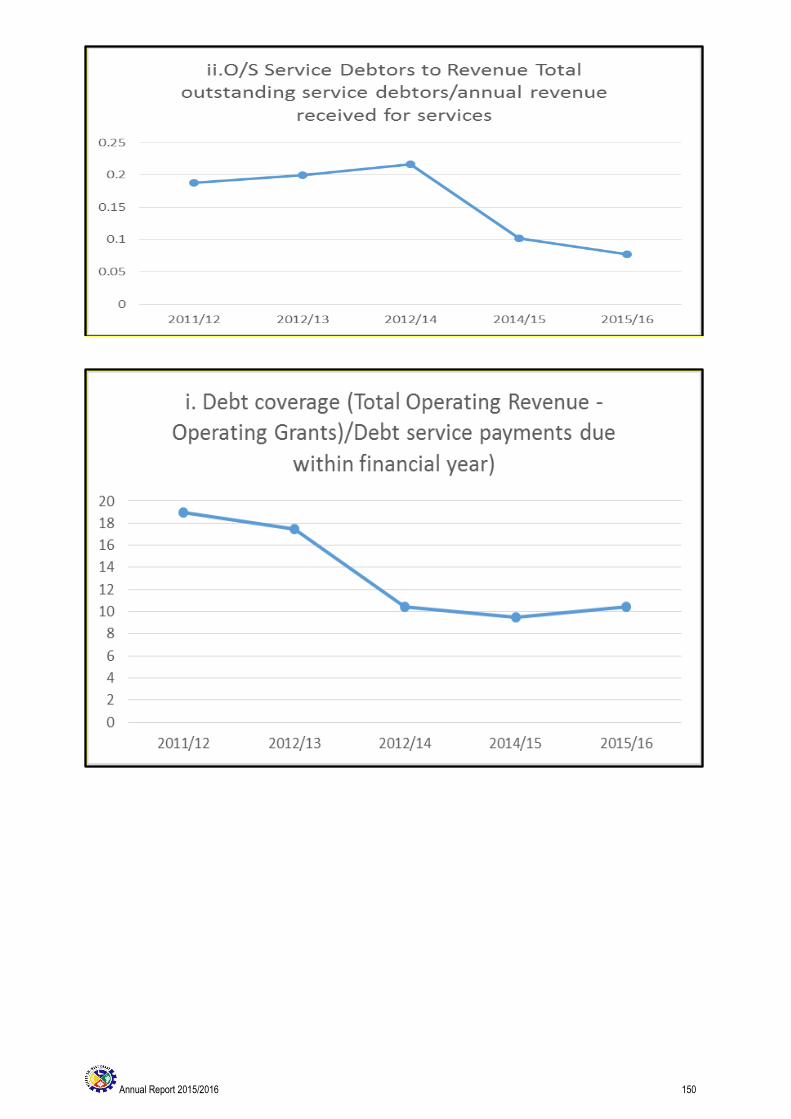
Annual Report 2015/2016 150
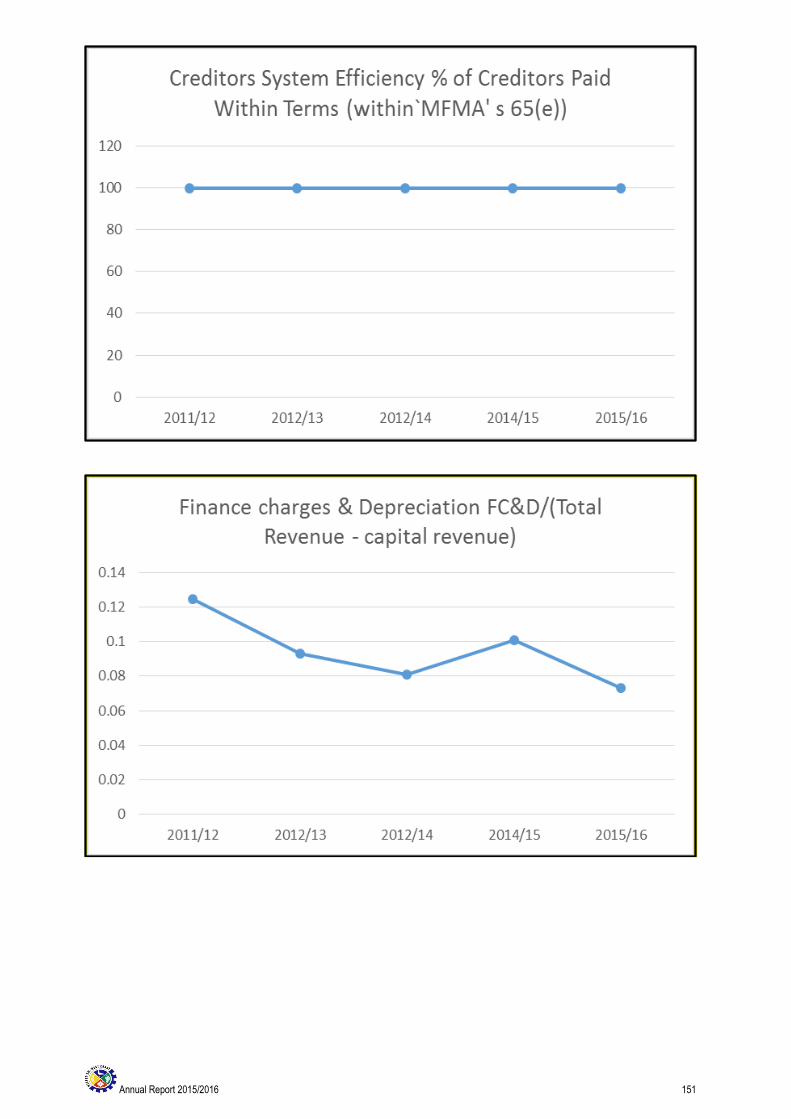
Annual Report 2015/2016 151

Annual Report 2015/2016 152

Annual Report 2015/2016 153
COMPONENT B
5.5 CAPITAL EXPENDITURE BY STANDARD CLASSIFICATION
Vote Description
R thousand
Original
Budget
Budget
Adjustments
(i.t.o. s28 and
s31 of the
MFMA)
Final
adjustments
budget
Shifting of
funds
(i.t.o. s31 of the
MFMA)
Virement
(i.t.o. Council
approv ed
policy )
Final Budget Actual
Outcome
Unauthorised
expenditure
Variance Actual
Outcome as %
of Final
Budget
Actual
Outcome as %
of Original
Budget
Reported
unauthorised
expenditure
Expenditure
authorised in
terms of
section 32 of
MFMA
Balance to be
recovered
Restated
Audited
Outcome
1 2 3 4 5 6 7 8 9 10 11 12 13 14 15
Capital expenditure - Vote
Multi-year expenditure
Vote 1 - COMMUNITY SERVICES – – – – – – – – – – – – –
Vote 2 - SUBSIDISED SERVICES – – – – – – – – – – – – –
Vote 3 - ECONOMIC SERVICES – – – – – – – – – – – – –
Vote 4 - HOUSING – – – – – – – – – – – – –
Vote 5 - TRADING SERVICES – – – – – – – – – – – – 8 340
Vote 6 - AGENCIES – – – – – – – – – – – – –
Vote 7 - {NAME OF VOTE 7] – – – – – – – – – – – – –
Vote 8 - {NAME OF VOTE 8] – – – – – – – – – – – – –
Vote 9 - {NAME OF VOTE 9] – – – – – – – – – – – – –
Vote 10 - {NAME OF VOTE 10] – – – – – – – – – – – – –
Vote 11 - {NAME OF VOTE 11] – – – – – – – – – – – – –
Vote 12 - {NAME OF VOTE 12] – – – – – – – – – – – – –
Vote 13 - {NAME OF VOTE 13] – – – – – – – – – – – – –
Vote 14 - {NAME OF VOTE 14] – – – – – – – – – – – – –
Vote 15 - {NAME OF VOTE 15] – – – – – – – – – – – – –
Capital multi-year expenditure sub-total – – – – – – – – – – – – – – 8 340
Single-year expenditure
Vote 1 - COMMUNITY SERVICES 610 (512) 98 – – 98 118 – – 120.08 19.31 – – – 1 648
Vote 2 - SUBSIDISED SERVICES 2 261 – 2 261 – – 2 261 2 178 – – 96.33 96.33 – – – 2 872
Vote 3 - ECONOMIC SERVICES 130 12 141 – – 141 141 – – 100.04 108.93 – – – 97
Vote 4 - HOUSING – – – – – – – – – – – – –
Vote 5 - TRADING SERVICES 5 315 (653) 4 662 – – 4 662 4 003 – – 85.86 75.32 – – – 3 198
Vote 6 - AGENCIES – – – – – – – – – – – – –
Vote 7 - {NAME OF VOTE 7] – – – – – – – – – – – – –
Vote 8 - {NAME OF VOTE 8] – – – – – – – – – – – – –
Vote 9 - {NAME OF VOTE 9] – – – – – – – – – – – – –
Vote 10 - {NAME OF VOTE 10] – – – – – – – – – – – – –
Vote 11 - {NAME OF VOTE 11] – – – – – – – – – – – – –
Vote 12 - {NAME OF VOTE 12] – – – – – – – – – – – – –
Vote 13 - {NAME OF VOTE 13] – – – – – – – – – – – – –
Vote 14 - {NAME OF VOTE 14] – – – – – – – – – – – – –
Vote 15 - {NAME OF VOTE 15] – – – – – – – – – – – – –
Capital single-year expenditure sub-total 8 315 (1 153) 7 162 – – 7 162 6 440 – – 7 815
Total Capital Expenditure - Vote 8 315 (1 153) 7 162 – – 7 162 6 440 – – 89.91 77.45 – – – 16 155
Capital Expenditure - Standard
Governance and administration 590 (512) 78 – – 78 99 – – 126.82 16.78 – – – 1 599
Ex ecutiv e and council – – – – – – – – – – – – –
Budget and treasury office – – – – – – – – – - - – – – 76
Corporate serv ices 590 (512) 78 – – 78 99 – – 126.82 16.78 – – – 1 524
Community and public safety 2 411 12 2 422 – – 2 422 2 338 – (83) 96.52 96.98 – – – 3 017
Community and social serv ices 130 12 141 – – 141 141 – – 100.04 108.93 – – – 97
Sport and recreation – – – – – – – – – – –
Public safety 2 261 – 2 261 – – 2 261 2 178 – (83) 96.33 96.33 – – – 2 872
Housing – – – – – – – – – – –
Health 20 – 20 – – 20 19 – – 93.82 93.82 – – – 49
Economic and environmental services – – – – – – – – – – – – –
Planning and dev elopment – – – – – – – – – – – – –
Road transport – – – – – – – – – – – – –
Env ironmental protection – – – – – – – – – – – – –
Trading services 5 315 (653) 4 662 – – 4 662 4 003 – (659) 85.86 75.32 – – – 11 538
Electricity – – – – – – – – – – – – –
Water 5 315 (653) 4 662 – – 4 662 4 003 – (659) 85.86 75.32 – – – 11 538
Waste w ater management – – – – – – – – – – – – –
Waste management – – – – – – – – – – – – –
Other – – – – – – – – – – – – –
Total Capital Expenditure - Standard 8 315 (1 153) 7 162 – – 7 162 6 440 – (742) 89.91 77.45 – – – 16 155
Funded by:
National Gov ernment – – – – – – – – – – – – –
Prov incial Gov ernment – – – – – – – – – – – – –
District Municipality – – – – – – – – – – – – –
Other transfers and grants – – – – – – – – – – – – –
Transfers recognised - capital – – – – – – – – – - - – – – –
Public contributions & donations – – – – – – – – – – – – –
Borrowing – – – – – – – – – - - – – – –
Internally generated funds 8 315 (1 153) 7 162 – – 7 162 6 440 – (722) 89.91 77.45 – – – 16 155
Total Capital Funding 8 315 (1 153) 7 162 – – 7 162 6 440 – (722) 89.91 77.45 – – – 16 155
2015/2016 2014/2015

Annual Report 2015/2016 154

Annual Report 2015/2016 155
5.6 SOURCES OF FINANCE
Vote Description
R thousand
Original
Budget
Budget
Adjustments
(i.t.o. s28 and
s31 of the
MFMA)
Final
adjustments
budget
Shifting of
funds
(i.t.o. s31 of the
MFMA)
Virement
(i.t.o. Council
approv ed
policy )
Final Budget Actual
Outcome
Unauthorised
expenditure
Variance Actual
Outcome as %
of Final
Budget
Actual
Outcome as %
of Original
Budget
Reported
unauthorised
expenditure
Expenditure
authorised in
terms of
section 32 of
MFMA
Balance to be
recovered
Restated
Audited
Outcome
2015/2016 2014/2015
Funded by:
National Gov ernment – – – – – – – – – – – – –
Prov incial Gov ernment – – – – – – – – – – – – –
District Municipality – – – – – – – – – – – – –
Other transfers and grants – – – – – – – – – – – – –
Transfers recognised - capital – – – – – – – – – - - – – – –
Public contributions & donations – – – – – – – – – – – – –
Borrowing – – – – – – – – – - - – – – –
Internally generated funds 8 315 (1 153) 7 162 – – 7 162 6 440 – (722) 89.91 77.45 – – – 16 155
Total Capital Funding 8 315 (1 153) 7 162 – – 7 162 6 440 – (722) 89.91 77.45 – – – 16 155
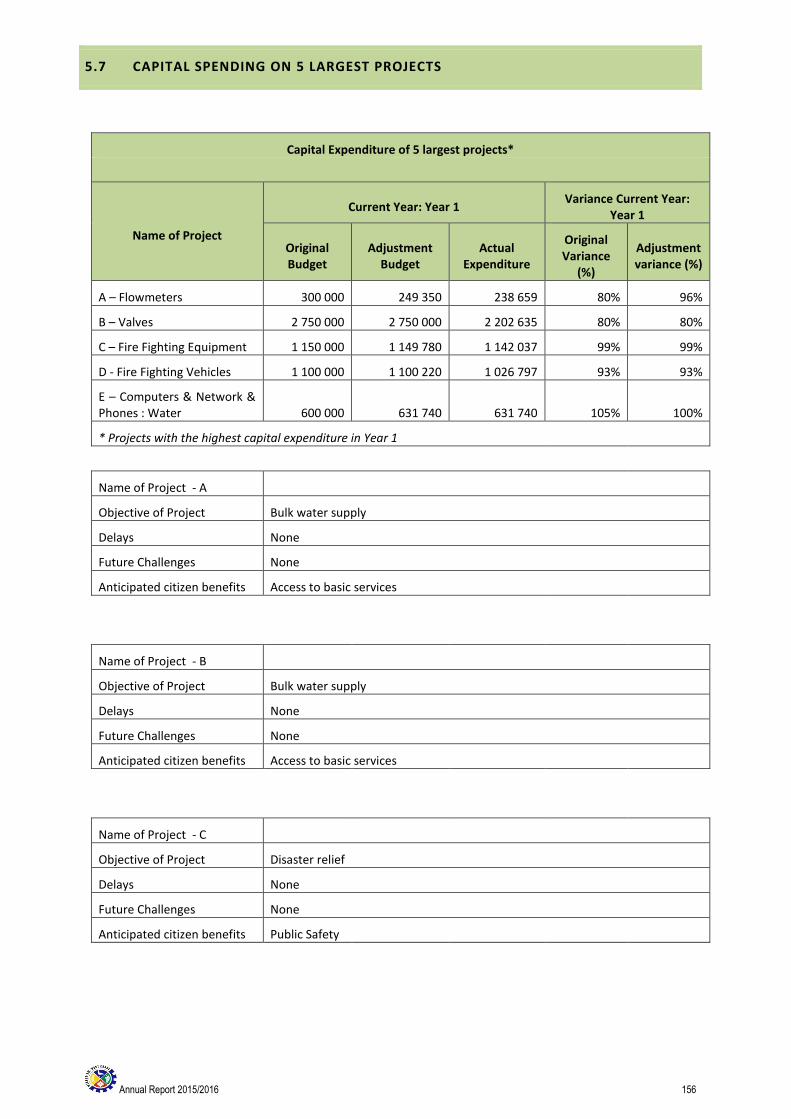
Annual Report 2015/2016 156
5.7 CAPITAL SPENDING ON 5 LARGEST PROJECTS
Capital Expenditure of 5 largest projects*
Name of Project
Current Year: Year 1 Variance Current Year:
Year 1
Original Budget
Adjustment Budget
Actual Expenditure
Original Variance
(%)
Adjustment variance (%)
A – Flowmeters 300 000 249 350 238 659 80% 96%
B – Valves 2 750 000 2 750 000 2 202 635 80% 80%
C – Fire Fighting Equipment 1 150 000 1 149 780 1 142 037 99% 99%
D - Fire Fighting Vehicles 1 100 000 1 100 220 1 026 797 93% 93%
E – Computers & Network & Phones : Water 600 000 631 740 631 740 105% 100%
* Projects with the highest capital expenditure in Year 1
Name of Project - A
Objective of Project Bulk water supply
Delays None
Future Challenges None
Anticipated citizen benefits Access to basic services
Name of Project - B
Objective of Project Bulk water supply
Delays None
Future Challenges None
Anticipated citizen benefits Access to basic services
Name of Project - C
Objective of Project Disaster relief
Delays None
Future Challenges None
Anticipated citizen benefits Public Safety

Annual Report 2015/2016 157
Name of Project - D
Objective of Project Disaster relief
Delays None
Future Challenges None
Anticipated citizen benefits Public safety
Name of Project - E
Objective of Project Upgrading of computer network
Delays None
Future Challenges None
Anticipated citizen benefits None
T5.7.1
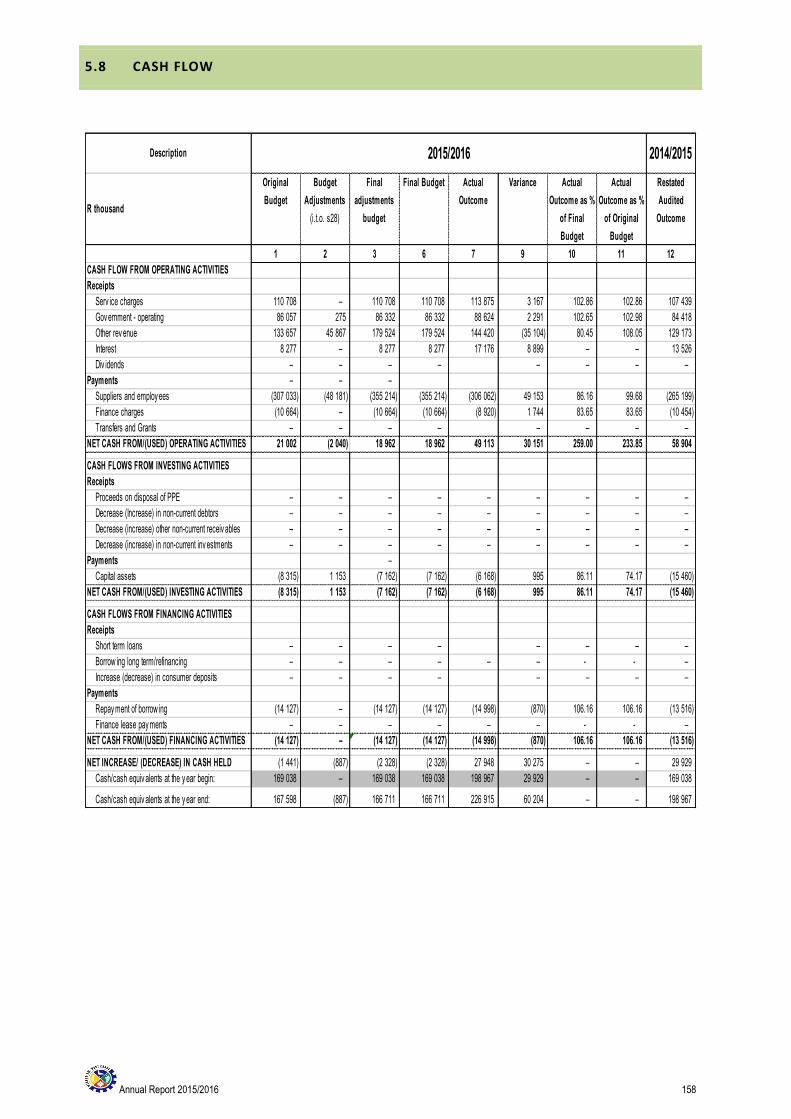
Annual Report 2015/2016 158
5.8 CASH FLOW
Description 2014/2015
R thousand
Original
Budget
Budget
Adjustments
(i.t.o. s28)
Final
adjustments
budget
Final Budget Actual
Outcome
Variance Actual
Outcome as %
of Final
Budget
Actual
Outcome as %
of Original
Budget
Restated
Audited
Outcome
1 2 3 6 7 9 10 11 12
CASH FLOW FROM OPERATING ACTIVITIES
Receipts
Serv ice charges 110 708 – 110 708 110 708 113 875 3 167 102.86 102.86 107 439
Gov ernment - operating 86 057 275 86 332 86 332 88 624 2 291 102.65 102.98 84 418
Other rev enue 133 657 45 867 179 524 179 524 144 420 (35 104) 80.45 108.05 129 173
Interest 8 277 – 8 277 8 277 17 176 8 899 – – 13 526
Div idends – – – – – – – –
Payments – – –
Suppliers and employ ees (307 033) (48 181) (355 214) (355 214) (306 062) 49 153 86.16 99.68 (265 199)
Finance charges (10 664) – (10 664) (10 664) (8 920) 1 744 83.65 83.65 (10 454)
Transfers and Grants – – – – – – – –
NET CASH FROM/(USED) OPERATING ACTIVITIES 21 002 (2 040) 18 962 18 962 49 113 30 151 259.00 233.85 58 904
CASH FLOWS FROM INVESTING ACTIVITIES
Receipts
Proceeds on disposal of PPE – – – – – – – – –
Decrease (Increase) in non-current debtors – – – – – – – – –
Decrease (increase) other non-current receiv ables – – – – – – – – –
Decrease (increase) in non-current inv estments – – – – – – – – –
Payments –
Capital assets (8 315) 1 153 (7 162) (7 162) (6 168) 995 86.11 74.17 (15 460)
NET CASH FROM/(USED) INVESTING ACTIVITIES (8 315) 1 153 (7 162) (7 162) (6 168) 995 86.11 74.17 (15 460)
CASH FLOWS FROM FINANCING ACTIVITIES
Receipts
Short term loans – – – – – – – –
Borrow ing long term/refinancing – – – – – – - - –
Increase (decrease) in consumer deposits – – – – – – – –
Payments
Repay ment of borrow ing (14 127) – (14 127) (14 127) (14 998) (870) 106.16 106.16 (13 516)
Finance lease pay ments – – – – – – - - –
NET CASH FROM/(USED) FINANCING ACTIVITIES (14 127) – (14 127) (14 127) (14 998) (870) 106.16 106.16 (13 516)
NET INCREASE/ (DECREASE) IN CASH HELD (1 441) (887) (2 328) (2 328) 27 948 30 275 – – 29 929
Cash/cash equiv alents at the y ear begin: 169 038 – 169 038 169 038 198 967 29 929 – – 169 038
Cash/cash equiv alents at the y ear end: 167 598 (887) 166 711 166 711 226 915 60 204 – – 198 967
2015/2016
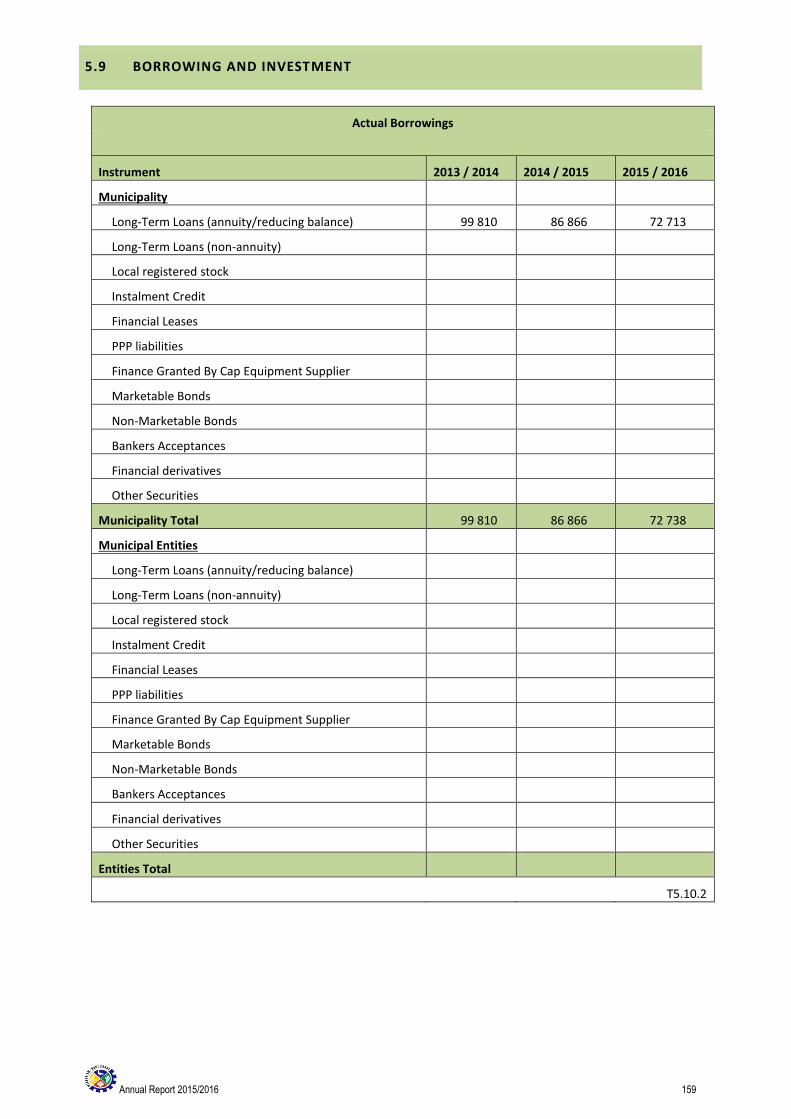
Annual Report 2015/2016 159
5.9 BORROWING AND INVESTMENT
Actual Borrowings
Instrument 2013 / 2014 2014 / 2015 2015 / 2016
Municipality
Long-Term Loans (annuity/reducing balance) 99 810 86 866 72 713
Long-Term Loans (non-annuity)
Local registered stock
Instalment Credit
Financial Leases
PPP liabilities
Finance Granted By Cap Equipment Supplier
Marketable Bonds
Non-Marketable Bonds
Bankers Acceptances
Financial derivatives
Other Securities
Municipality Total 99 810 86 866 72 738
Municipal Entities
Long-Term Loans (annuity/reducing balance)
Long-Term Loans (non-annuity)
Local registered stock
Instalment Credit
Financial Leases
PPP liabilities
Finance Granted By Cap Equipment Supplier
Marketable Bonds
Non-Marketable Bonds
Bankers Acceptances
Financial derivatives
Other Securities
Entities Total
T5.10.2

Annual Report 2015/2016 160
Municipal and Entity Investments
Investment* type 2013 / 2014 2014 / 2015 2015 / 2016
Actual Actual Actual
Municipality
Deposits - Bank
FNB 9 151 27 429 465
NEDBANK - 20 791 -
ABSA 62 942 67 568 -
NEDBANK 37 702 40 352 -
INVESTEC 52 130 15 256 -
NEDBANK - 20 411 -
Municipality Total 161 926 191 807 465
T5.10.4

Annual Report 2015/2016 161

Annual Report 2015/2016 162
5.10 SUPPLY CHAIN MANAGEMENT
The West Coast District Municipality has established a fully operational Supply Chain Unit in line with the approved SCM Policy. No councillor of the municipality is a member of a municipal bid committee or any other committee evaluating or approving tenders, quotations, contracts or other bids, nor attend such meeting as a observer. The Municipal Regulations on Minimum Competency Levels only indicates the minimum competency levels for Heads and Managers in Supply Chain Management and do not make reference to the minimum compentency levels for SCM officials who are not in management positions. The Senior SCM Manager, one (1) Senior SCM Practitioner and two (2) SCM Official comply with the prescribed minimum competency levels. One (1) SCM Official and one (1) SCM Official Stores are still busy with the prescribed minimum competency levels. The other SCM officials has the required minimum years of relevant SCM working experience as required by their job funtions. The also have the qualifications related to their job functions and has a general understanding of the Municipality’s SCM Policy and SCM procedures.
Annual Report 2015/2016 163
CHAPTER 6 – AUDITOR-GENERAL AUDIT FINDINGS
INTRODUCTION
The Constitution Section 188(1)(b) states that the functions of the Auditor-General include the auditing of and
reporting on the accounts, financial statements and financial management of all municipalities. The Local
Government: Municipal Systems Act, Act 32 of 2000, Section 45 states that the results of performance
measurement must be audited annually by the Auditor-General.
The West Coast District Municipality received clean audit reports for the financial years from 2010/2011 to
2015/2016.

Annual Report 2015/2016 164
COMPONENT A: AUDITOR-GENERAL OPINION OF FINANCIAL STATEMENTS
6.1 AUDITOR-GENERAL REPORT 2014/2015
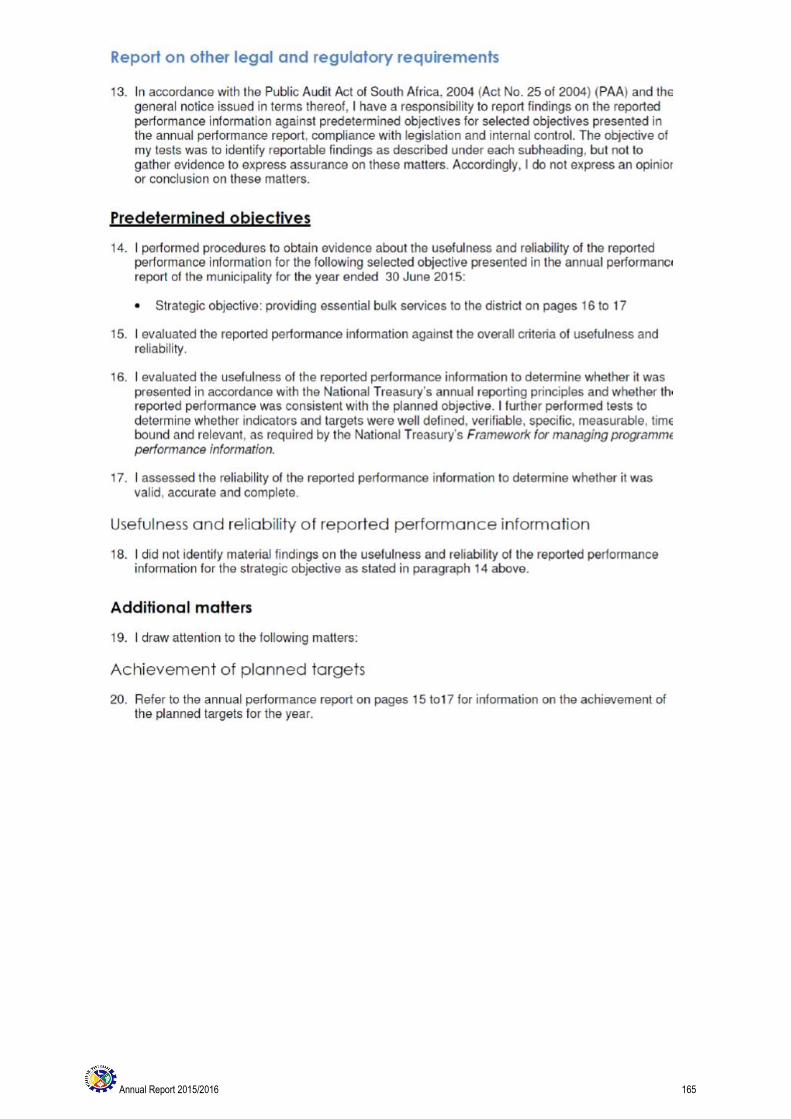
Annual Report 2015/2016 165
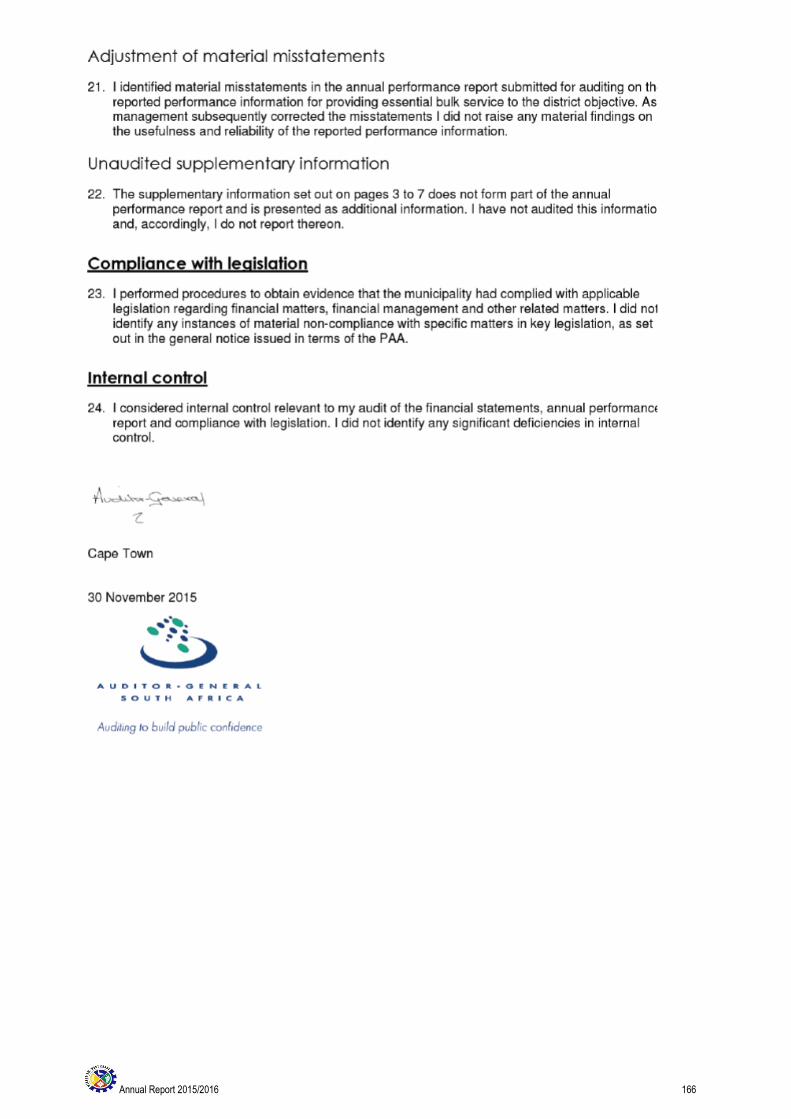
Annual Report 2015/2016 166
Annual Report 2015/2016 167
COMPONENT B: AUDITOR-GENERAL OPINION OF FINANCIAL STATEMENTS
6.2 AUDITOR-GENERAL REPORT 2015/2016
Annual Report 2015/2016 168
Annual Report 2015/2016 169
Annual Report 2015/2016 170
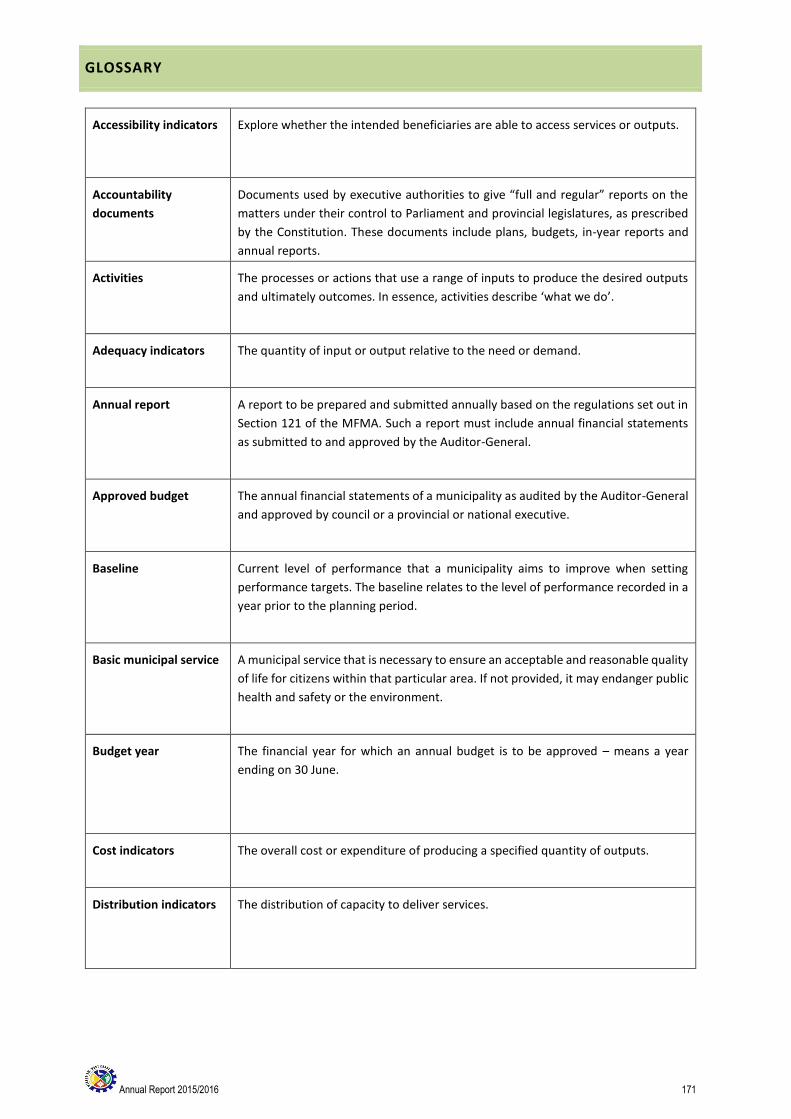
Annual Report 2015/2016 171
GLOSSARY
Accessibility indicators Explore whether the intended beneficiaries are able to access services or outputs.
Accountability
documents
Documents used by executive authorities to give “full and regular” reports on the
matters under their control to Parliament and provincial legislatures, as prescribed
by the Constitution. These documents include plans, budgets, in-year reports and
annual reports.
Activities The processes or actions that use a range of inputs to produce the desired outputs
and ultimately outcomes. In essence, activities describe ‘what we do’.
Adequacy indicators The quantity of input or output relative to the need or demand.
Annual report A report to be prepared and submitted annually based on the regulations set out in
Section 121 of the MFMA. Such a report must include annual financial statements
as submitted to and approved by the Auditor-General.
Approved budget The annual financial statements of a municipality as audited by the Auditor-General
and approved by council or a provincial or national executive.
Baseline Current level of performance that a municipality aims to improve when setting
performance targets. The baseline relates to the level of performance recorded in a
year prior to the planning period.
Basic municipal service A municipal service that is necessary to ensure an acceptable and reasonable quality
of life for citizens within that particular area. If not provided, it may endanger public
health and safety or the environment.
Budget year The financial year for which an annual budget is to be approved – means a year
ending on 30 June.
Cost indicators The overall cost or expenditure of producing a specified quantity of outputs.
Distribution indicators The distribution of capacity to deliver services.

Annual Report 2015/2016 172
Financial statements These include at least a statement of financial position, statement of financial
performance, cash-flow statement, notes to these statements and any other
statements that may be prescribed.
General key
performance indicators
(KPIs)
After consultation with MECs for local government, the minister may prescribe
general KPIs that are appropriate and applicable to local government generally.
Impact The results of achieving specific outcomes, such as reducing poverty and creating
jobs.
Inputs All the resources that contribute to the production and delivery of outputs. Inputs
are ‘what we use to do the work’. They include finances, personnel, equipment and
buildings.
Integrated
development plan (IDP)
Sets out municipal goals and development plans.
National key
performance areas
• Service delivery and infrastructure
• Economic development
• Municipal transformation and institutional development
• Financial viability and management
• Good governance and community participation
Outcomes The medium-term results for specific beneficiaries that are the consequence of
achieving specific outputs. Outcomes should relate clearly to an institution’s
strategic goals and objectives set out in its plans. Outcomes are ‘what we wish to
achieve’.
Outputs The final products or goods and services produced for delivery. Outputs may be
defined as ‘what we produce or deliver’. An output is a concrete achievement (i.e. a
product such as a passport, an action such as a presentation or immunisation or a
service such as processing an application) that contributes to the achievement of a
key result area.
Performance indicator 31 October 2014
Performance
information
Generic term for nonfinancial information about municipal services and activities.
Can also be used interchangeably with ‘performance measure’.
Performance standards The minimum acceptable level of performance or the level of performance that is
generally accepted. Standards are informed by legislative requirements and service
level agreements. Performance standards are mutually agreed-upon criteria to
describe how well work must be done in terms of quantity and/or quality and how

Annual Report 2015/2016 173
promptly, in order to clarify the outputs and related activities of a job by describing
what the required result should be. In this employee performance management and
development system, performance standards are divided into indicators and the
time factor.
Performance targets The level of performance that municipalities and their employees strive to achieve.
Performance targets relate to current baselines and express a specific level of
performance that a municipality aims to achieve within a given time period.
Service Delivery Budget
Implementation Plan
Detailed plan approved by the mayor for implementing the municipality’s delivery
of services, including projections of the revenue collected and operational and
capital expenditure by vote for each month. Service delivery targets and
performance indicators must also be included.
Vote One of the main segments into which a budget of a municipality is divided for
appropriation of money for the different departments or functional areas of the
municipality. The vote specifies the total amount that is appropriated for the
purpose of a specific department or functional area.
Section 1 of the MFMA defines a ‘vote’ as
a) one of the main segments into which a budget of a municipality is divided for the
appropriation of money for the different departments or functional areas of the
municipality; and
b) which specifies the total amount that is appropriated for the purposes of the
department or functional area concerned.

Annual Report 2015/2016 174
APPENDIX A – COUNCILLORS, COMMITTEE ALLOCATION AND COUNCIL ATTENDANCE
Councillors, committees allocated and Council attendance 2015-2016
Council
members
Full-time / Part-
time
Committees allocated Ward and/or
party represented
Council
meetings
attendance
Apologies
for non-
attendance
J Swart Proportional Portfolio Committee Administration and
Community Services
Portfolio Committee Strategic Support and
Economic Development
Chairperson: Oversight Committee / MPAC
ANC 4 3
R Skei Proportional Portfolio Committee Infrastructure Services
Portfolio Committee Strategic Support and
Economic Development
Rules Committee
ANC 6 1
E Plaatjies Proportional Portfolio Committee Finance ANC 5 2
SA Gxabalashe
(28 August
2015)
Proportional Portfolio Committee Administration and
Community Services
Portfolio Committee Infrastructure Services
ANC 3 3
CH Heyns Proportional Portfolio Committee Strategic Support and
Economic Development
Portfolio Committee Infrastructure Services
Secundi: SALGA: Economic Development
and Planning
Secundi: SALGA: Municipal Infrastructure and Services
DA 7 0
M Koen Proportional Executive Mayoral Committee Member
Chairperson: Portfolio Committee Strategic
Support and Economic Development
Local Labour Forum
SALGA: Human Resource and Development
SALGA: Economic Development and
Planning
IDP: Local Municipalities (Saldanha Bay
Municipality)
West Coast Regional Tourism Organisation (RTO)
DA 7 0
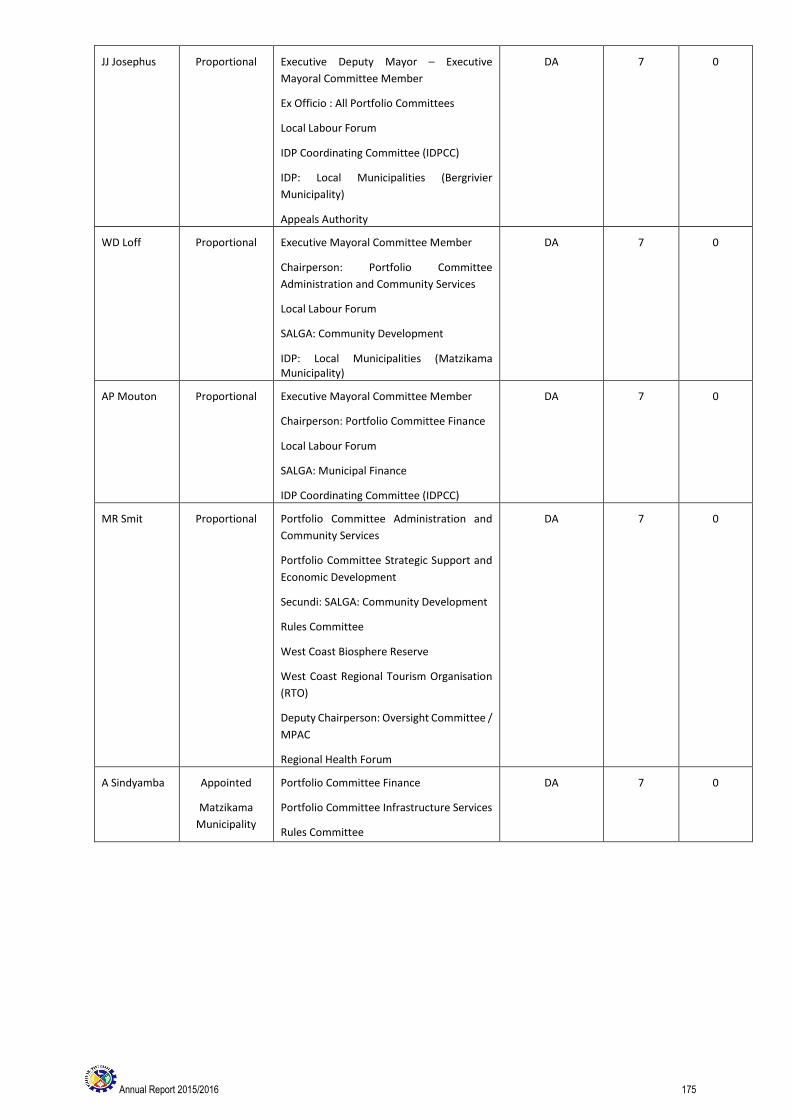
Annual Report 2015/2016 175
JJ Josephus Proportional Executive Deputy Mayor – Executive
Mayoral Committee Member
Ex Officio : All Portfolio Committees
Local Labour Forum
IDP Coordinating Committee (IDPCC)
IDP: Local Municipalities (Bergrivier
Municipality)
Appeals Authority
DA 7 0
WD Loff Proportional Executive Mayoral Committee Member
Chairperson: Portfolio Committee
Administration and Community Services
Local Labour Forum
SALGA: Community Development
IDP: Local Municipalities (Matzikama Municipality)
DA 7 0
AP Mouton Proportional Executive Mayoral Committee Member
Chairperson: Portfolio Committee Finance
Local Labour Forum
SALGA: Municipal Finance
IDP Coordinating Committee (IDPCC)
DA 7 0
MR Smit Proportional Portfolio Committee Administration and
Community Services
Portfolio Committee Strategic Support and
Economic Development
Secundi: SALGA: Community Development
Rules Committee
West Coast Biosphere Reserve
West Coast Regional Tourism Organisation
(RTO)
Deputy Chairperson: Oversight Committee /
MPAC
Regional Health Forum
DA 7 0
A Sindyamba Appointed
Matzikama
Municipality
Portfolio Committee Finance
Portfolio Committee Infrastructure Services
Rules Committee
DA 7 0

Annual Report 2015/2016 176
EL Mgingqi Appointed
Matzikama
Municipality
None
ANC 7 0
JJ Fransman Appointed
Cederberg
Municipality
None
ANC 2 5
J Barnard Appointed
Cederberg
Municipality
Portfolio Committee Finance
Portfolio Committee Administration and
Community Services
IDP: Local Municipalities (Cederberg
Municipality)
Greater Cederberg Biodiversity Corridor
DA 7 0
C Snyders Appointed
Bergrivier
Municipality
Portfolio Committee Infrastructure Services
Portfolio Committee Strategic Support and Economic Development
DA 7 0
SR Claassen Appointed
Bergrivier
Municipality
Portfolio Committee Finance
ANC 4 3
A Kruger Appointed
Saldanha Bay
Municipality
Speaker
Ex officio: Executive Mayoral Committee
Ex officio: All Portfolio Committees
Secundi: SALGA: Governance and
Intergovernmental Relations
Chairperson: Rules Committee
West Coast Coastal Management Committee
Appeal Authority
DA 7 0
JJ Cillie Appointed
Saldanha Bay
Municipality
Portfolio Committee Finance
Portfolio Committee Infrastructure Services
Secundi: SALGA: Municipal Finance
DA 5 2
ST Vries Appointed
Saldanha Bay
Municipality
Portfolio Committee Administration and
Community Services
Portfolio Committee Strategic Support and
Economic Development
Secundi: SALGA: Human Resources and
Development
Rules Committee
West Coast Coastal Management Committee
DA 7 0
NV Mgoqi Appointed
Saldanha Bay
Municipality
Rules Committee ANC 5 2
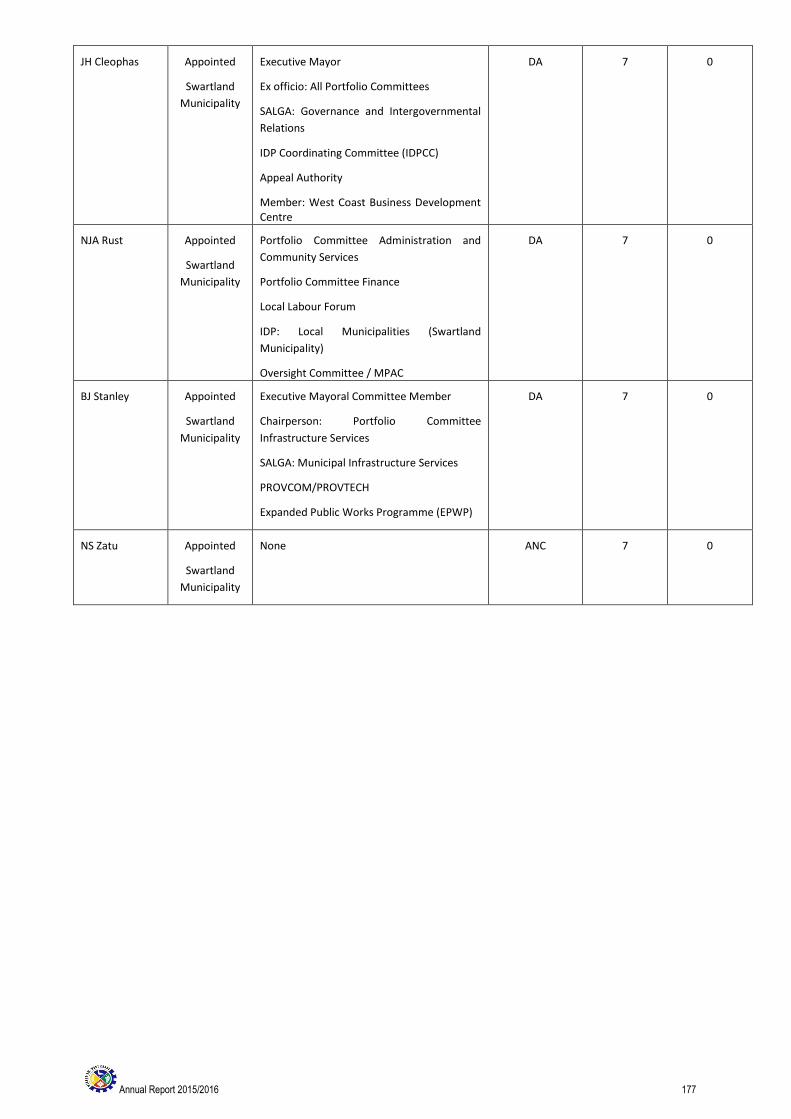
Annual Report 2015/2016 177
JH Cleophas Appointed
Swartland
Municipality
Executive Mayor
Ex officio: All Portfolio Committees
SALGA: Governance and Intergovernmental
Relations
IDP Coordinating Committee (IDPCC)
Appeal Authority
Member: West Coast Business Development Centre
DA 7 0
NJA Rust Appointed
Swartland
Municipality
Portfolio Committee Administration and
Community Services
Portfolio Committee Finance
Local Labour Forum
IDP: Local Municipalities (Swartland
Municipality)
Oversight Committee / MPAC
DA 7 0
BJ Stanley Appointed
Swartland
Municipality
Executive Mayoral Committee Member
Chairperson: Portfolio Committee
Infrastructure Services
SALGA: Municipal Infrastructure Services
PROVCOM/PROVTECH
Expanded Public Works Programme (EPWP)
DA 7 0
NS Zatu Appointed
Swartland
Municipality
None ANC 7 0
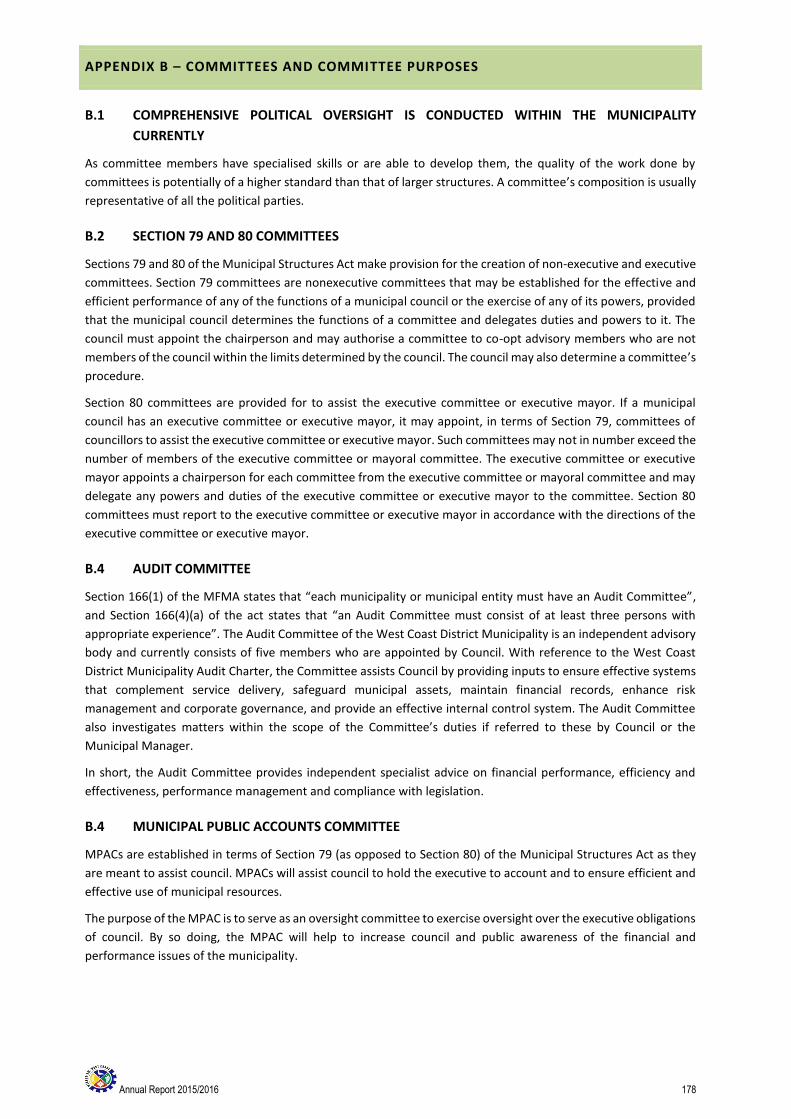
Annual Report 2015/2016 178
APPENDIX B – COMMITTEES AND COMMITTEE PURPOSES
B.1 COMPREHENSIVE POLITICAL OVERSIGHT IS CONDUCTED WITHIN THE MUNICIPALITY
CURRENTLY
As committee members have specialised skills or are able to develop them, the quality of the work done by
committees is potentially of a higher standard than that of larger structures. A committee’s composition is usually
representative of all the political parties.
B.2 SECTION 79 AND 80 COMMITTEES
Sections 79 and 80 of the Municipal Structures Act make provision for the creation of non-executive and executive
committees. Section 79 committees are nonexecutive committees that may be established for the effective and
efficient performance of any of the functions of a municipal council or the exercise of any of its powers, provided
that the municipal council determines the functions of a committee and delegates duties and powers to it. The
council must appoint the chairperson and may authorise a committee to co-opt advisory members who are not
members of the council within the limits determined by the council. The council may also determine a committee’s
procedure.
Section 80 committees are provided for to assist the executive committee or executive mayor. If a municipal
council has an executive committee or executive mayor, it may appoint, in terms of Section 79, committees of
councillors to assist the executive committee or executive mayor. Such committees may not in number exceed the
number of members of the executive committee or mayoral committee. The executive committee or executive
mayor appoints a chairperson for each committee from the executive committee or mayoral committee and may
delegate any powers and duties of the executive committee or executive mayor to the committee. Section 80
committees must report to the executive committee or executive mayor in accordance with the directions of the
executive committee or executive mayor.
B.4 AUDIT COMMITTEE
Section 166(1) of the MFMA states that “each municipality or municipal entity must have an Audit Committee”,
and Section 166(4)(a) of the act states that “an Audit Committee must consist of at least three persons with
appropriate experience”. The Audit Committee of the West Coast District Municipality is an independent advisory
body and currently consists of five members who are appointed by Council. With reference to the West Coast
District Municipality Audit Charter, the Committee assists Council by providing inputs to ensure effective systems
that complement service delivery, safeguard municipal assets, maintain financial records, enhance risk
management and corporate governance, and provide an effective internal control system. The Audit Committee
also investigates matters within the scope of the Committee’s duties if referred to these by Council or the
Municipal Manager.
In short, the Audit Committee provides independent specialist advice on financial performance, efficiency and
effectiveness, performance management and compliance with legislation.
B.4 MUNICIPAL PUBLIC ACCOUNTS COMMITTEE
MPACs are established in terms of Section 79 (as opposed to Section 80) of the Municipal Structures Act as they
are meant to assist council. MPACs will assist council to hold the executive to account and to ensure efficient and
effective use of municipal resources.
The purpose of the MPAC is to serve as an oversight committee to exercise oversight over the executive obligations
of council. By so doing, the MPAC will help to increase council and public awareness of the financial and
performance issues of the municipality.
Annual Report 2015/2016 179
The MFMA assigns specific oversight responsibilities to council with regard to the annual report and the
preparation of an oversight report. The MPACs primary role will be to consider the annual report, receive input
from various role players and prepare a draft oversight report for consideration by council.
The primary functions of MPACs are to consider and evaluate the content of the annual report and to make
recommendations to council when adopting an oversight report on the annual report, evaluate in-year and mid-
year assessments and examine the Annual Financial Statements and Audit reports. In doing so, the MPAC must
consider improvements from previous statements and reports and must evaluate the extent to which the audit
committee and the Auditor-General’s recommendations have been implemented and other matters pertaining to
MPACs.
The MPAC is responsible for the detailed analysis and review of the annual report and then for drafting an
Oversight report that are taken to full council for discussion. Such a committee may receive and review
representations made by the public.
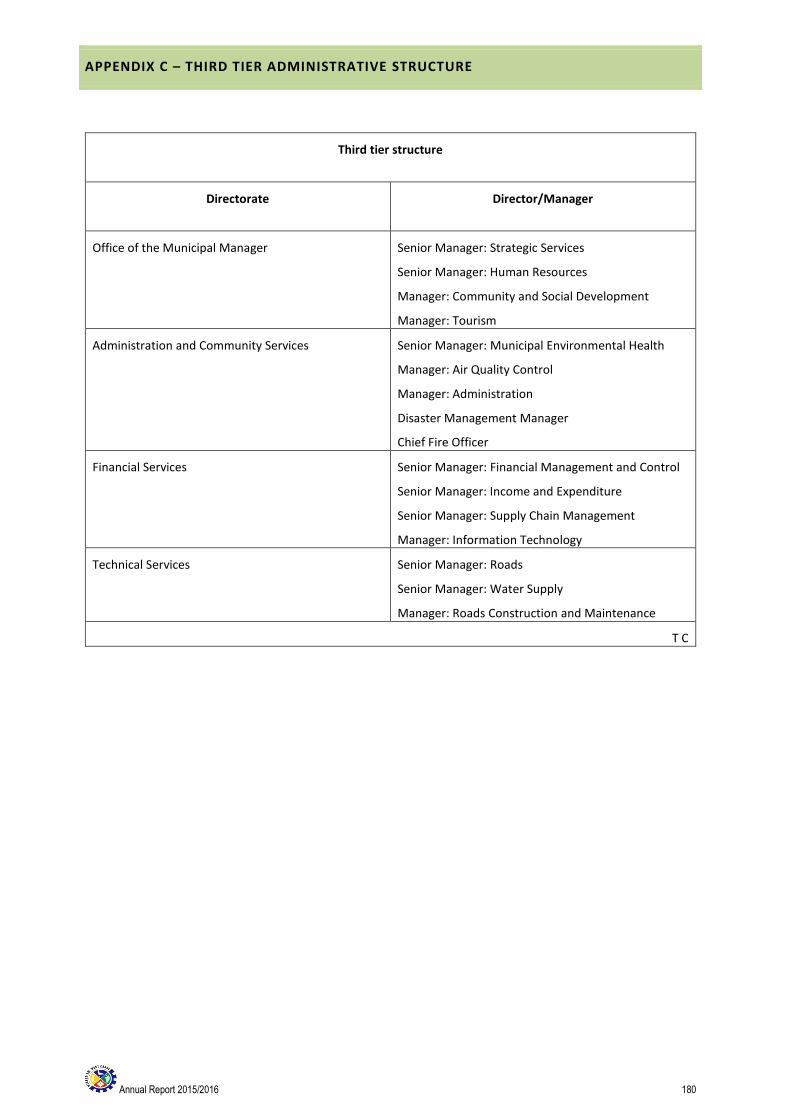
Annual Report 2015/2016 180
APPENDIX C – THIRD TIER ADMINISTRATIVE STRUCTURE
Third tier structure
Directorate Director/Manager
Office of the Municipal Manager Senior Manager: Strategic Services
Senior Manager: Human Resources
Manager: Community and Social Development
Manager: Tourism
Administration and Community Services Senior Manager: Municipal Environmental Health
Manager: Air Quality Control
Manager: Administration
Disaster Management Manager
Chief Fire Officer
Financial Services Senior Manager: Financial Management and Control
Senior Manager: Income and Expenditure
Senior Manager: Supply Chain Management
Manager: Information Technology
Technical Services Senior Manager: Roads
Senior Manager: Water Supply
Manager: Roads Construction and Maintenance
T C
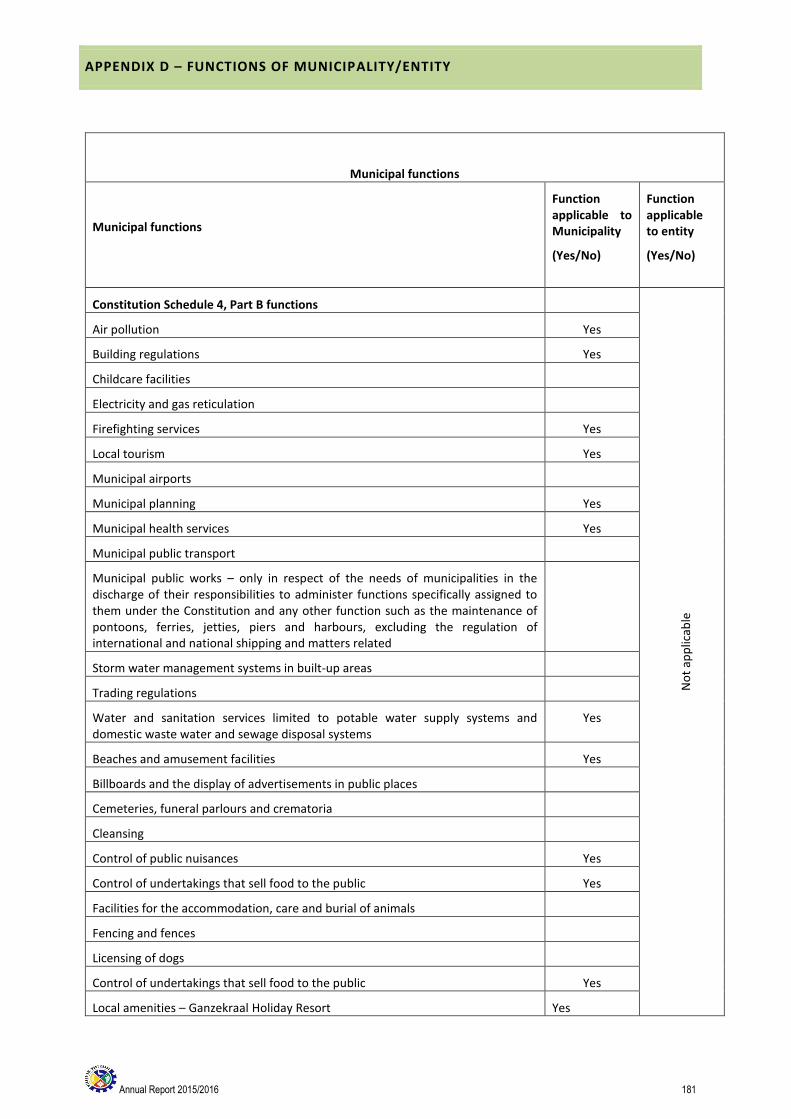
Annual Report 2015/2016 181
APPENDIX D – FUNCTIONS OF MUNICIPALITY/ENTITY
Municipal functions
Municipal functions
Function applicable to Municipality
(Yes/No)
Function applicable to entity
(Yes/No)
Constitution Schedule 4, Part B functions
No
t ap
plic
able
Air pollution Yes
Building regulations Yes
Childcare facilities
Electricity and gas reticulation
Firefighting services Yes
Local tourism Yes
Municipal airports
Municipal planning Yes
Municipal health services Yes
Municipal public transport
Municipal public works – only in respect of the needs of municipalities in the discharge of their responsibilities to administer functions specifically assigned to them under the Constitution and any other function such as the maintenance of pontoons, ferries, jetties, piers and harbours, excluding the regulation of international and national shipping and matters related
Storm water management systems in built-up areas
Trading regulations
Water and sanitation services limited to potable water supply systems and domestic waste water and sewage disposal systems
Yes
Beaches and amusement facilities Yes
Billboards and the display of advertisements in public places
Cemeteries, funeral parlours and crematoria
Cleansing
Control of public nuisances Yes
Control of undertakings that sell food to the public Yes
Facilities for the accommodation, care and burial of animals
Fencing and fences
Licensing of dogs
Control of undertakings that sell food to the public Yes
Local amenities – Ganzekraal Holiday Resort Yes

Annual Report 2015/2016 182
Local sport facilities
Markets
Municipal abattoirs
Municipal parks and recreation
Municipal roads
Noise pollution Yes
Pounds
Public places
Refuse removal, refuse dumps and solid waste disposal Yes
Street trading
Street lighting
Traffic and parking
Annual Report 2015/2016 183
APPENDIX E – WARD REPORTING
Not applicable to the District Municipality.
Annual Report 2015/2016 184
APPENDIX F – WARD INFORMATION
Not applicable to the District Municipality.

Annual Report 2015/2016 185
APPENDIX G – RECOMMENDATIONS OF THE AUDIT COMMITTEE
Date of Committee
Meeting
Committee recommendations during
2015/2016
Recommendation adopted (Yes);
not adopted (provide
explanation)
13/08/2015 ITEM 15/08/26/8.3.2.3: Review audit-and Performance Audit Committee Charter
RESOLVED: THAT THE REVISED AUDIT AND PERFORMANCE AUDIT COMMITTEE CHARTER BE APPROVED
Yes
ITEM 15/08/26/8.3.2.4: Internal Audit Charter
RESOLVED: THAT THE REVISED INTERNAL AUDIT CHARTER BE APPROVED. Yes
28/08/2015 ITEM 15/08/26/8.2.1.4: DRAFT FINANCIAL STATEMENTS- 2014/2015
RESOLVED: THAT THE FINANCIAL STATEMENTS OF 2014/2015 BE APPROVED
Yes
21/04/2016 Fraud Declarations
RESOLVED: On a quarterly basis, managements declaration of instances fraud detected during the quarter
Yes
Process around MSCOA
RESOLVED: that the audit committee be informed about the process regarding the Municipal Standard of Accounts(MSCOA)
Yes
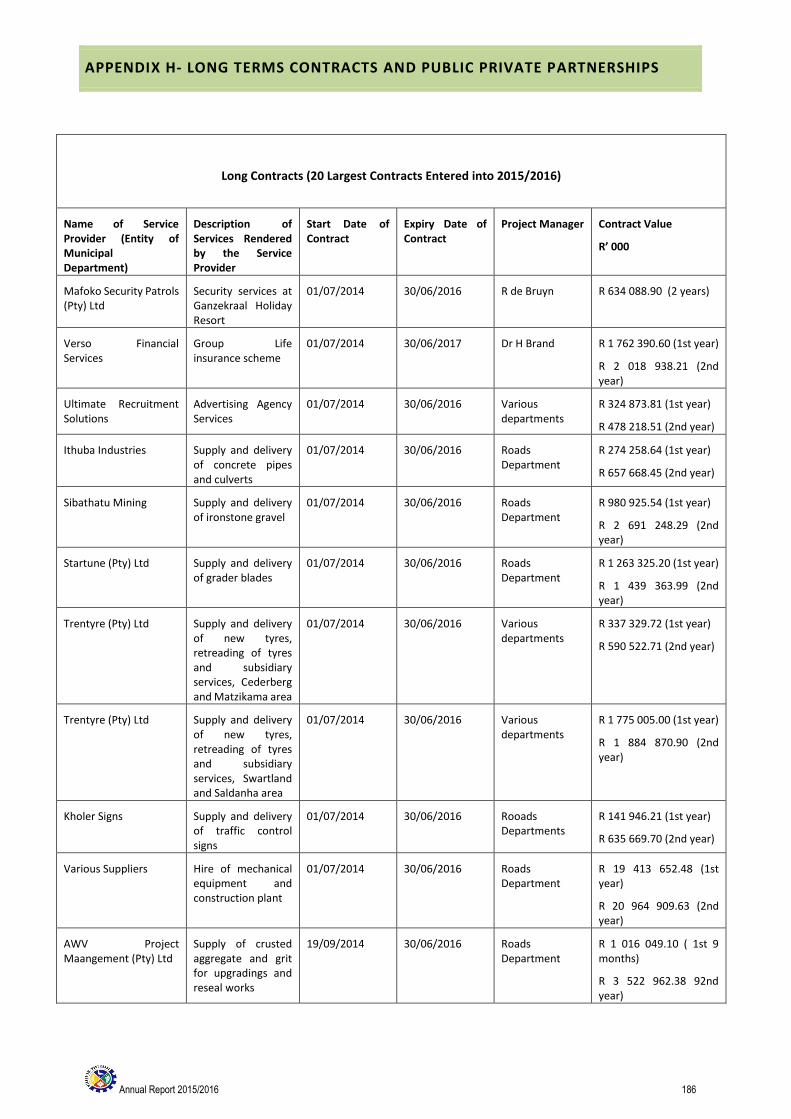
Annual Report 2015/2016 186
APPENDIX H- LONG TERMS CONTRACTS AND PUBLIC PRIVATE PARTNERSHIPS
Long Contracts (20 Largest Contracts Entered into 2015/2016)
Name of Service Provider (Entity of Municipal Department)
Description of Services Rendered by the Service Provider
Start Date of Contract
Expiry Date of Contract
Project Manager Contract Value
R’ 000
Mafoko Security Patrols (Pty) Ltd
Security services at Ganzekraal Holiday Resort
01/07/2014 30/06/2016 R de Bruyn R 634 088.90 (2 years)
Verso Financial Services
Group Life insurance scheme
01/07/2014 30/06/2017 Dr H Brand R 1 762 390.60 (1st year)
R 2 018 938.21 (2nd year)
Ultimate Recruitment Solutions
Advertising Agency Services
01/07/2014 30/06/2016 Various departments
R 324 873.81 (1st year)
R 478 218.51 (2nd year)
Ithuba Industries Supply and delivery of concrete pipes and culverts
01/07/2014 30/06/2016 Roads Department
R 274 258.64 (1st year)
R 657 668.45 (2nd year)
Sibathatu Mining Supply and delivery of ironstone gravel
01/07/2014 30/06/2016 Roads Department
R 980 925.54 (1st year)
R 2 691 248.29 (2nd year)
Startune (Pty) Ltd Supply and delivery of grader blades
01/07/2014 30/06/2016 Roads Department
R 1 263 325.20 (1st year)
R 1 439 363.99 (2nd year)
Trentyre (Pty) Ltd Supply and delivery of new tyres, retreading of tyres and subsidiary services, Cederberg and Matzikama area
01/07/2014 30/06/2016 Various departments
R 337 329.72 (1st year)
R 590 522.71 (2nd year)
Trentyre (Pty) Ltd Supply and delivery of new tyres, retreading of tyres and subsidiary services, Swartland and Saldanha area
01/07/2014 30/06/2016 Various departments
R 1 775 005.00 (1st year)
R 1 884 870.90 (2nd year)
Kholer Signs Supply and delivery of traffic control signs
01/07/2014 30/06/2016 Rooads Departments
R 141 946.21 (1st year)
R 635 669.70 (2nd year)
Various Suppliers Hire of mechanical equipment and construction plant
01/07/2014 30/06/2016 Roads Department
R 19 413 652.48 (1st year)
R 20 964 909.63 (2nd year)
AWV Project Maangement (Pty) Ltd
Supply of crusted aggregate and grit for upgradings and reseal works
19/09/2014 30/06/2016 Roads Department
R 1 016 049.10 ( 1st 9 months)
R 3 522 962.38 92nd year)
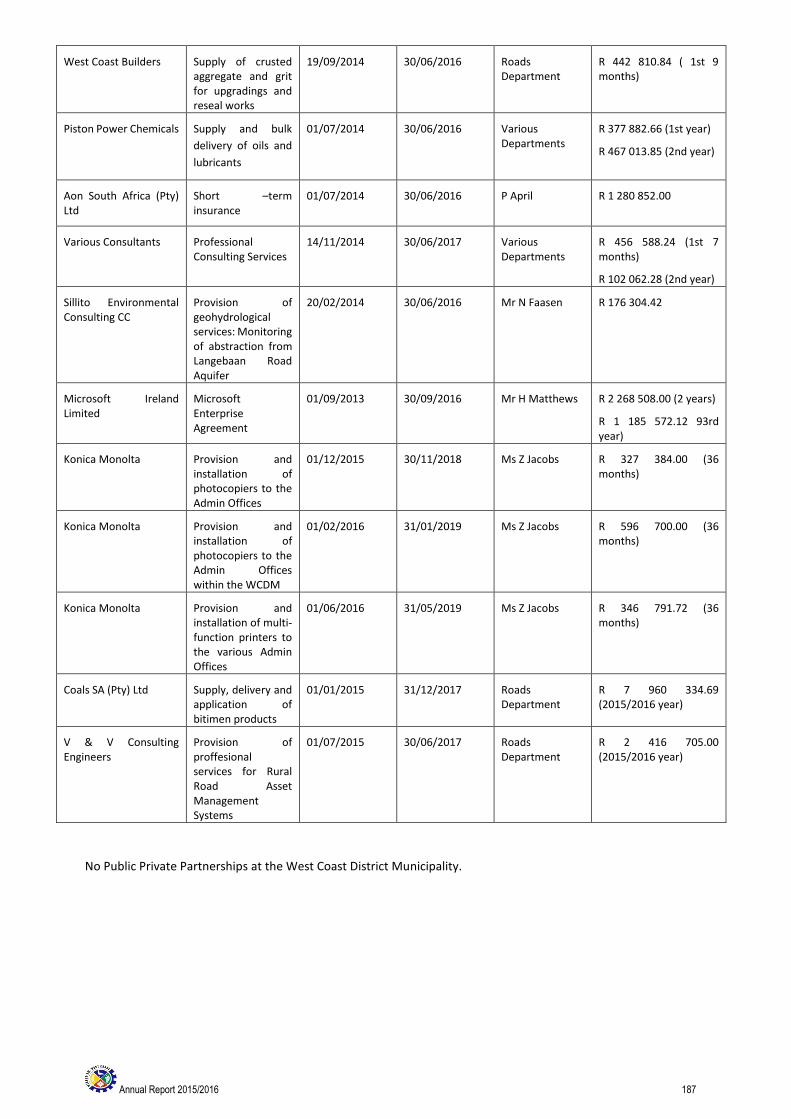
Annual Report 2015/2016 187
West Coast Builders Supply of crusted aggregate and grit for upgradings and reseal works
19/09/2014 30/06/2016 Roads Department
R 442 810.84 ( 1st 9 months)
Piston Power Chemicals Supply and bulk
delivery of oils and
lubricants
01/07/2014 30/06/2016 Various Departments
R 377 882.66 (1st year)
R 467 013.85 (2nd year)
Aon South Africa (Pty) Ltd
Short –term insurance
01/07/2014 30/06/2016 P April R 1 280 852.00
Various Consultants Professional Consulting Services
14/11/2014 30/06/2017 Various Departments
R 456 588.24 (1st 7 months)
R 102 062.28 (2nd year)
Sillito Environmental Consulting CC
Provision of geohydrological services: Monitoring of abstraction from Langebaan Road Aquifer
20/02/2014 30/06/2016 Mr N Faasen R 176 304.42
Microsoft Ireland Limited
Microsoft Enterprise Agreement
01/09/2013 30/09/2016 Mr H Matthews R 2 268 508.00 (2 years)
R 1 185 572.12 93rd year)
Konica Monolta Provision and installation of photocopiers to the Admin Offices
01/12/2015 30/11/2018 Ms Z Jacobs R 327 384.00 (36 months)
Konica Monolta Provision and installation of photocopiers to the Admin Offices within the WCDM
01/02/2016 31/01/2019 Ms Z Jacobs R 596 700.00 (36 months)
Konica Monolta Provision and installation of multi-function printers to the various Admin Offices
01/06/2016 31/05/2019 Ms Z Jacobs R 346 791.72 (36 months)
Coals SA (Pty) Ltd Supply, delivery and application of bitimen products
01/01/2015 31/12/2017 Roads Department
R 7 960 334.69 (2015/2016 year)
V & V Consulting Engineers
Provision of proffesional services for Rural Road Asset Management Systems
01/07/2015 30/06/2017 Roads Department
R 2 416 705.00 (2015/2016 year)
No Public Private Partnerships at the West Coast District Municipality.
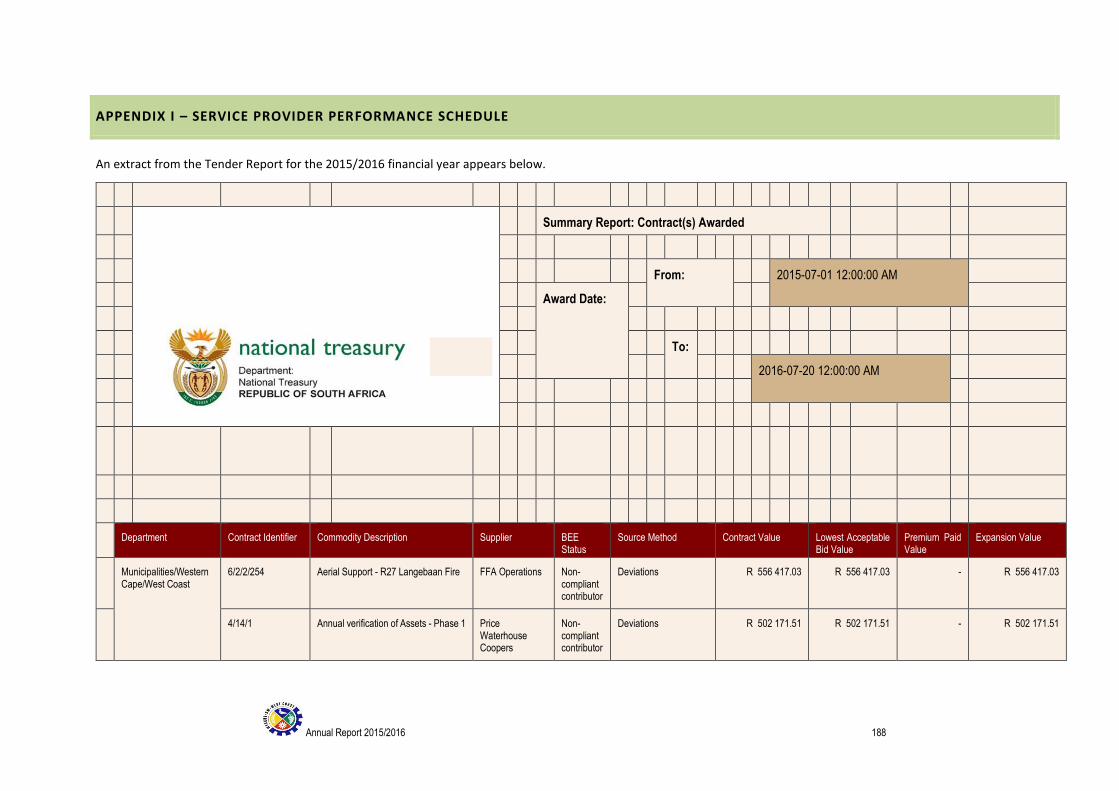
Annual Report 2015/2016 188
APPENDIX I – SERVICE PROVIDER PERFORMANCE SCHEDULE
An extract from the Tender Report for the 2015/2016 financial year appears below.
Summary Report: Contract(s) Awarded
From: 2015-07-01 12:00:00 AM
Award Date:
To:
2016-07-20 12:00:00 AM
Department Contract Identifier Commodity Description Supplier BEE Status
Source Method Contract Value Lowest Acceptable Bid Value
Premium Paid Value
Expansion Value
Municipalities/Western Cape/West Coast
6/2/2/254 Aerial Support - R27 Langebaan Fire FFA Operations Non-compliant contributor
Deviations R 556 417.03 R 556 417.03 - R 556 417.03
4/14/1 Annual verification of Assets - Phase 1 Price Waterhouse Coopers
Non-compliant contributor
Deviations R 502 171.51 R 502 171.51 - R 502 171.51

Annual Report 2015/2016 189
4/14/1 Annual verification of assets- Phase 2 Price Waterhouse Coopers
Non-compliant contributor
Deviations R 364 324.93 R 364 324.93 - R 364 324.93
5/2/2/6 Appointment of Microsoft International for purchasing Microsoft products and Licences - Award 19/11/2014
Microsoft Ireland Non-compliant contributor
Deviations R 901 731.97 R 901 731.97 - R 901 731.97
5/2/2/6 Appointment of Microsoft International for purchasing of Microsoft products and licences
Microsoft Ireland Non-compliant contributor
Deviations R 1 185 572.12 R 1 185 572.12 - R 1 185 572.12
WDM 01/2015 Banking Services from 01 July 2015 to 30 June 2020 - Awarded 18/05/2015
First National Bank
Level 2 Competitive Bids R 133 261.20 R 133 261.20 - R 133 261.20
6/5/2/128 Building of Wingwalls at Hexriver, Citrusdal
West Coast Builders
Level 1 Price Quotations R 191 520.00 R 180 000.00 R 11 520.00 R 191 520.00
6/5/2/241 Construction of Divisional Road 2266 Smit Ingenieurswerke & Transport BK
Non-compliant contributor
Price Quotations R 188 100.00 R 188 100.00 - R 188 100.00
T 2014/32 Food and Water Microbiological Sample Analyses for the period 01 July 2015 to 30 June 2016
Swift Silliker (Pty) Ltd
Level 6 Deviations R 255 000.00 R 255 000.00 - R 302 883.75
WDM 11/2015 Geeldam: Supply of Butterfly and Non-return Valve
Tricom Africa Level 5 Competitive Bids R 1 207 953.12 R 1 207 953.12 - R 1 207 953.12
6/5/2/56 Hire of 10m Tipper West Coast Builders
Level 1 Price Quotations R 191 086.80 R 191 086.80 - R 191 086.80
6/5/2/56 Hire of 20 ton Excavator for works in Citrusdal
West Coast Builders
Level 1 Price Quotations R 149 340.00 R 149 340.00 - R 149 340.00
6/5/2/56 Hire of 20 ton Excavator for works in Lambertsbay
West Coast Builders
Level 1 Price Quotations R 144 780.00 R 135 000.00 R 9 780.00 R 144 780.00
6/5/2/56 Hire of 5.5 ton Excavator at Hexriver, Citrusdal
Johnson Plant Hire and Civils
Level 4 Price Quotations R 160 557.60 R 160 557.60 - R 160 557.60
6/5/2/56 Hire of Excavator at Muisbos Annelle Bothma Level 4 Price Quotations R 126 000.00 R 126 000.00 - R 126 000.00
6/5/2/56 Hire of Excavator at Volmoed, Klipfontein, Sauer, Wegloperheuwel, Wit Cutting
WN Samuels Level 1 Price Quotations R 103 900.00 R 103 900.00 - R 103 900.00
6/5/2/56 Hire of Grader at Middelbergpas T and F Construction
Level 2 Price Quotations R 114 570.00 R 114 570.00 - R 114 570.00
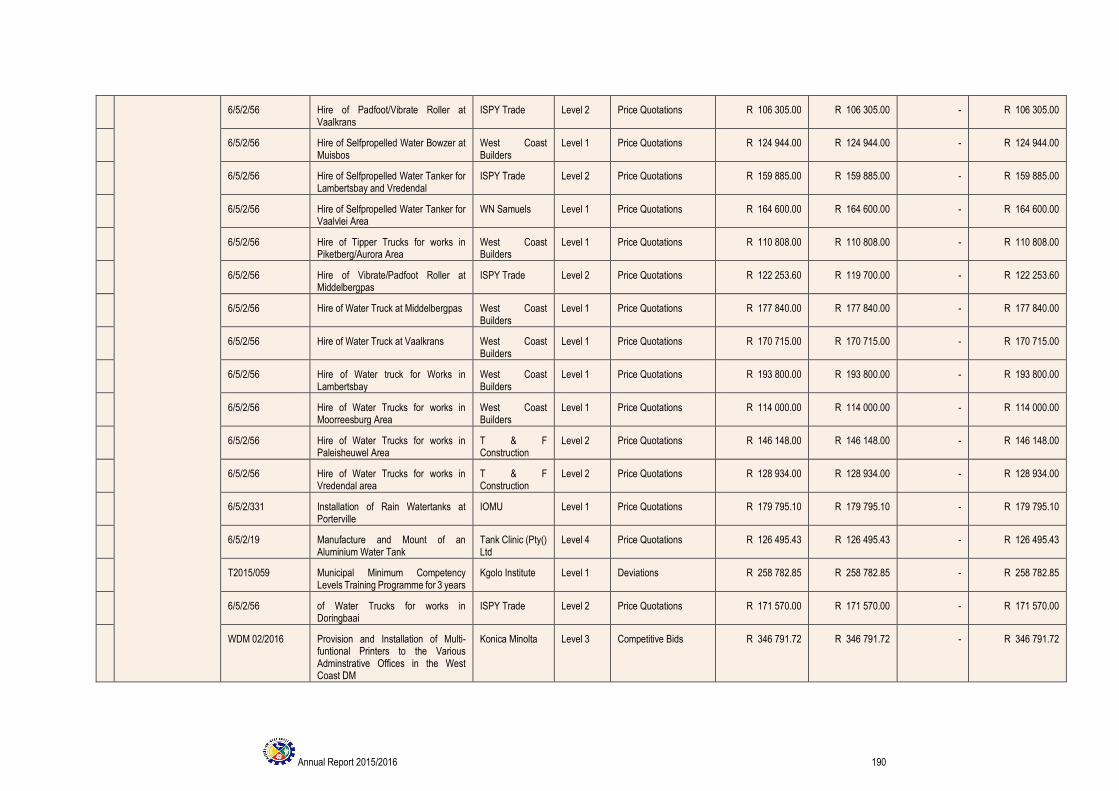
Annual Report 2015/2016 190
6/5/2/56 Hire of Padfoot/Vibrate Roller at Vaalkrans
ISPY Trade Level 2 Price Quotations R 106 305.00 R 106 305.00 - R 106 305.00
6/5/2/56 Hire of Selfpropelled Water Bowzer at Muisbos
West Coast Builders
Level 1 Price Quotations R 124 944.00 R 124 944.00 - R 124 944.00
6/5/2/56 Hire of Selfpropelled Water Tanker for Lambertsbay and Vredendal
ISPY Trade Level 2 Price Quotations R 159 885.00 R 159 885.00 - R 159 885.00
6/5/2/56 Hire of Selfpropelled Water Tanker for Vaalvlei Area
WN Samuels Level 1 Price Quotations R 164 600.00 R 164 600.00 - R 164 600.00
6/5/2/56 Hire of Tipper Trucks for works in Piketberg/Aurora Area
West Coast Builders
Level 1 Price Quotations R 110 808.00 R 110 808.00 - R 110 808.00
6/5/2/56 Hire of Vibrate/Padfoot Roller at Middelbergpas
ISPY Trade Level 2 Price Quotations R 122 253.60 R 119 700.00 - R 122 253.60
6/5/2/56 Hire of Water Truck at Middelbergpas West Coast Builders
Level 1 Price Quotations R 177 840.00 R 177 840.00 - R 177 840.00
6/5/2/56 Hire of Water Truck at Vaalkrans West Coast Builders
Level 1 Price Quotations R 170 715.00 R 170 715.00 - R 170 715.00
6/5/2/56 Hire of Water truck for Works in Lambertsbay
West Coast Builders
Level 1 Price Quotations R 193 800.00 R 193 800.00 - R 193 800.00
6/5/2/56 Hire of Water Trucks for works in Moorreesburg Area
West Coast Builders
Level 1 Price Quotations R 114 000.00 R 114 000.00 - R 114 000.00
6/5/2/56 Hire of Water Trucks for works in Paleisheuwel Area
T & F Construction
Level 2 Price Quotations R 146 148.00 R 146 148.00 - R 146 148.00
6/5/2/56 Hire of Water Trucks for works in Vredendal area
T & F Construction
Level 2 Price Quotations R 128 934.00 R 128 934.00 - R 128 934.00
6/5/2/331 Installation of Rain Watertanks at Porterville
IOMU Level 1 Price Quotations R 179 795.10 R 179 795.10 - R 179 795.10
6/5/2/19 Manufacture and Mount of an Aluminium Water Tank
Tank Clinic (Pty() Ltd
Level 4 Price Quotations R 126 495.43 R 126 495.43 - R 126 495.43
T2015/059 Municipal Minimum Competency Levels Training Programme for 3 years
Kgolo Institute Level 1 Deviations R 258 782.85 R 258 782.85 - R 258 782.85
6/5/2/56 of Water Trucks for works in Doringbaai
ISPY Trade Level 2 Price Quotations R 171 570.00 R 171 570.00 - R 171 570.00
WDM 02/2016 Provision and Installation of Multi-funtional Printers to the Various Adminstrative Offices in the West Coast DM
Konica Minolta Level 3 Competitive Bids R 346 791.72 R 346 791.72 - R 346 791.72
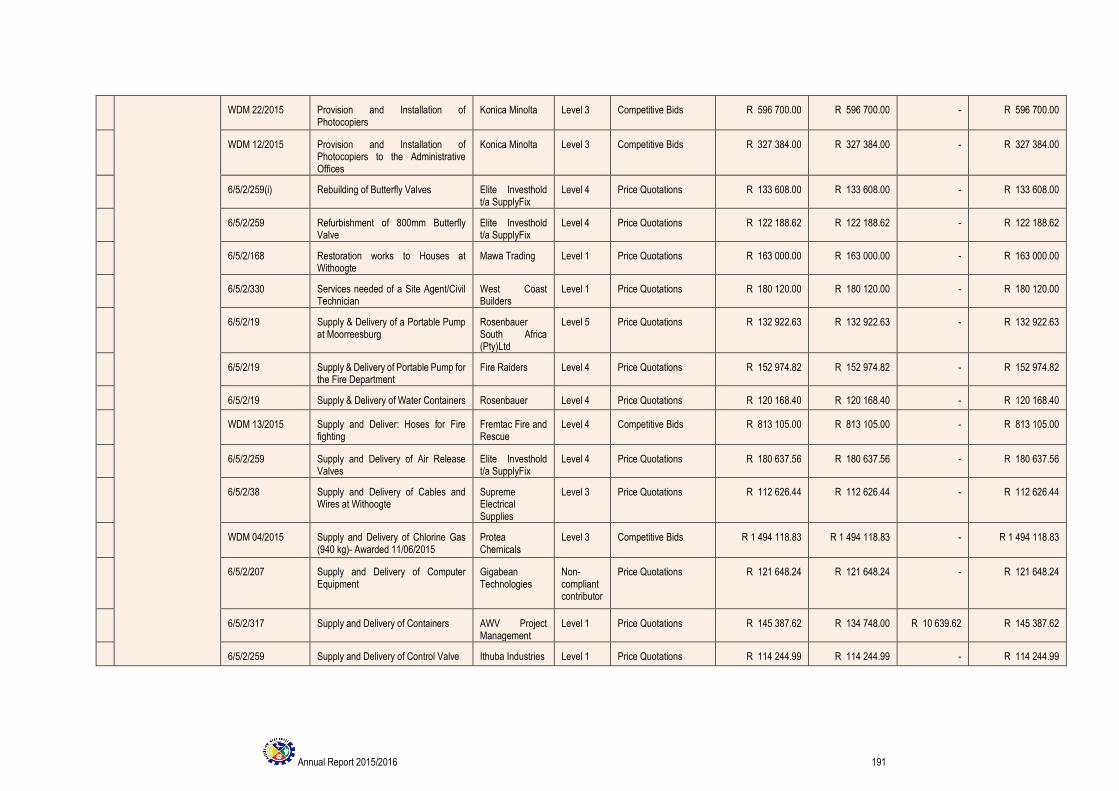
Annual Report 2015/2016 191
WDM 22/2015 Provision and Installation of Photocopiers
Konica Minolta Level 3 Competitive Bids R 596 700.00 R 596 700.00 - R 596 700.00
WDM 12/2015 Provision and Installation of Photocopiers to the Administrative Offices
Konica Minolta Level 3 Competitive Bids R 327 384.00 R 327 384.00 - R 327 384.00
6/5/2/259(i) Rebuilding of Butterfly Valves Elite Investhold t/a SupplyFix
Level 4 Price Quotations R 133 608.00 R 133 608.00 - R 133 608.00
6/5/2/259 Refurbishment of 800mm Butterfly Valve
Elite Investhold t/a SupplyFix
Level 4 Price Quotations R 122 188.62 R 122 188.62 - R 122 188.62
6/5/2/168 Restoration works to Houses at Withoogte
Mawa Trading Level 1 Price Quotations R 163 000.00 R 163 000.00 - R 163 000.00
6/5/2/330 Services needed of a Site Agent/Civil Technician
West Coast Builders
Level 1 Price Quotations R 180 120.00 R 180 120.00 - R 180 120.00
6/5/2/19 Supply & Delivery of a Portable Pump at Moorreesburg
Rosenbauer South Africa (Pty)Ltd
Level 5 Price Quotations R 132 922.63 R 132 922.63 - R 132 922.63
6/5/2/19 Supply & Delivery of Portable Pump for the Fire Department
Fire Raiders Level 4 Price Quotations R 152 974.82 R 152 974.82 - R 152 974.82
6/5/2/19 Supply & Delivery of Water Containers Rosenbauer Level 4 Price Quotations R 120 168.40 R 120 168.40 - R 120 168.40
WDM 13/2015 Supply and Deliver: Hoses for Fire fighting
Fremtac Fire and Rescue
Level 4 Competitive Bids R 813 105.00 R 813 105.00 - R 813 105.00
6/5/2/259 Supply and Delivery of Air Release Valves
Elite Investhold t/a SupplyFix
Level 4 Price Quotations R 180 637.56 R 180 637.56 - R 180 637.56
6/5/2/38 Supply and Delivery of Cables and Wires at Withoogte
Supreme Electrical Supplies
Level 3 Price Quotations R 112 626.44 R 112 626.44 - R 112 626.44
WDM 04/2015 Supply and Delivery of Chlorine Gas (940 kg)- Awarded 11/06/2015
Protea Chemicals
Level 3 Competitive Bids R 1 494 118.83 R 1 494 118.83 - R 1 494 118.83
6/5/2/207 Supply and Delivery of Computer Equipment
Gigabean Technologies
Non-compliant contributor
Price Quotations R 121 648.24 R 121 648.24 - R 121 648.24
6/5/2/317 Supply and Delivery of Containers AWV Project Management
Level 1 Price Quotations R 145 387.62 R 134 748.00 R 10 639.62 R 145 387.62
6/5/2/259 Supply and Delivery of Control Valve Ithuba Industries Level 1 Price Quotations R 114 244.99 R 114 244.99 - R 114 244.99
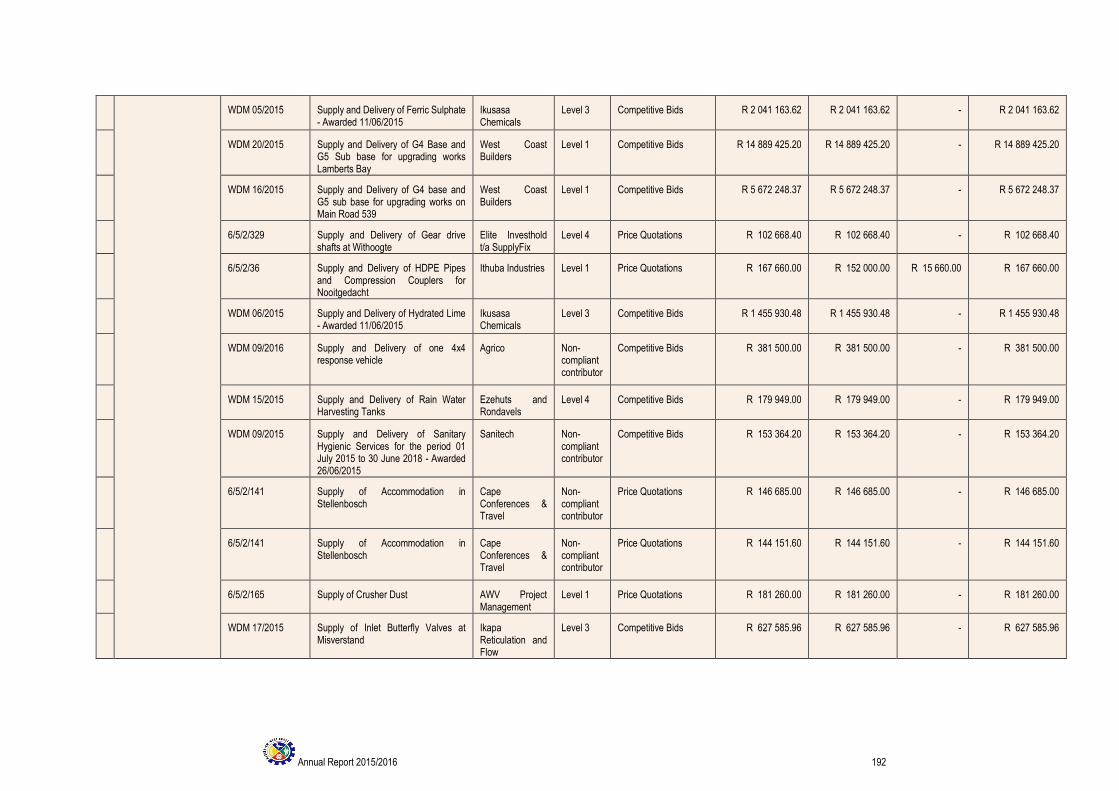
Annual Report 2015/2016 192
WDM 05/2015 Supply and Delivery of Ferric Sulphate - Awarded 11/06/2015
Ikusasa Chemicals
Level 3 Competitive Bids R 2 041 163.62 R 2 041 163.62 - R 2 041 163.62
WDM 20/2015 Supply and Delivery of G4 Base and G5 Sub base for upgrading works Lamberts Bay
West Coast Builders
Level 1 Competitive Bids R 14 889 425.20 R 14 889 425.20 - R 14 889 425.20
WDM 16/2015 Supply and Delivery of G4 base and G5 sub base for upgrading works on Main Road 539
West Coast Builders
Level 1 Competitive Bids R 5 672 248.37 R 5 672 248.37 - R 5 672 248.37
6/5/2/329 Supply and Delivery of Gear drive shafts at Withoogte
Elite Investhold t/a SupplyFix
Level 4 Price Quotations R 102 668.40 R 102 668.40 - R 102 668.40
6/5/2/36 Supply and Delivery of HDPE Pipes and Compression Couplers for Nooitgedacht
Ithuba Industries Level 1 Price Quotations R 167 660.00 R 152 000.00 R 15 660.00 R 167 660.00
WDM 06/2015 Supply and Delivery of Hydrated Lime - Awarded 11/06/2015
Ikusasa Chemicals
Level 3 Competitive Bids R 1 455 930.48 R 1 455 930.48 - R 1 455 930.48
WDM 09/2016 Supply and Delivery of one 4x4 response vehicle
Agrico Non-compliant contributor
Competitive Bids R 381 500.00 R 381 500.00 - R 381 500.00
WDM 15/2015 Supply and Delivery of Rain Water Harvesting Tanks
Ezehuts and Rondavels
Level 4 Competitive Bids R 179 949.00 R 179 949.00 - R 179 949.00
WDM 09/2015 Supply and Delivery of Sanitary Hygienic Services for the period 01 July 2015 to 30 June 2018 - Awarded 26/06/2015
Sanitech Non-compliant contributor
Competitive Bids R 153 364.20 R 153 364.20 - R 153 364.20
6/5/2/141 Supply of Accommodation in Stellenbosch
Cape Conferences & Travel
Non-compliant contributor
Price Quotations R 146 685.00 R 146 685.00 - R 146 685.00
6/5/2/141 Supply of Accommodation in Stellenbosch
Cape Conferences & Travel
Non-compliant contributor
Price Quotations R 144 151.60 R 144 151.60 - R 144 151.60
6/5/2/165 Supply of Crusher Dust AWV Project Management
Level 1 Price Quotations R 181 260.00 R 181 260.00 - R 181 260.00
WDM 17/2015 Supply of Inlet Butterfly Valves at Misverstand
Ikapa Reticulation and Flow
Level 3 Competitive Bids R 627 585.96 R 627 585.96 - R 627 585.96

Annual Report 2015/2016 193
R/MT 306/2013 Supply, Delivery and application of bitumen products - awarded 12/12/2014
Colas SA (Pty) Ltd
Level 5 Deviations R 7 960 334.69 R 7 960 334.69 - R 7 960 334.69
WDM 03/2016 Supply, Delivery and Installation of SAN (Network Storage) Equipment
First Technology Non-compliant contributor
Competitive Bids R 342 090.04 R 342 090.04 - R 342 090.04
WDM 14/2015 Supply, Manufacture & Fitment: Plumbing and Lockers for an Iveco 4x4 Truck
Marce Projects Level 1 Competitive Bids R 376 628.43 R 376 628.43 - R 376 628.43
WDM 01/2016 Supply, Packaging and Delivery of Seven Sports and Educational Combo's
TRF Sport Level 1 Competitive Bids R 139 757.80 R 139 757.80 - R 139 757.80
6/5/2/197 Transport and Off-Load of Gravel in Vredendal Area
West Coast Builders
Level 1 Price Quotations R 167 067.00 R 160 740.00 R 6 327.00 R 167 067.00
6/5/2/197 Transport and Off-Load of Reseal Stone at Lambertsbay
Lezora Trading Level 3 Price Quotations R 165 699.00 R 165 699.00 - R 165 699.00
6/5/2/44 West Coast Tourism Brochure Your Travel Guide
Level 4 Price Quotations R 169 557.00 R 169 557.00 - R 169 557.00
Total R 49 655 514.92 R 49 599 034.70 R 53 926.62 R 49 703 398.67

Annual Report 2015/2016 194
Detailed Report
BEE Level Total Contracts Total Current Contract Value Total Lowest Acceptable Bid Value
Total Premium Paid Value
Level 1 25 R 24 472 711.16 R 24 418 784.54 R 53 926.62
Level 2 8 R 1 082 926.80 R 1 080 373.20 -
Level 3 9 R 7 168 000.05 R 7 168 000.05 -
Level 4 12 R 2 387 909.83 R 2 387 909.83 -
Level 5 3 R 9 301 210.44 R 9 301 210.44 -
Level 6 1 R 302 883.75 R 255 000.00 -
Non-compliant contributor 12 R 4 987 756.64 R 4 987 756.64 -
Total 70 R 49 703 398.67 R 49 599 034.70 R 53 926.62
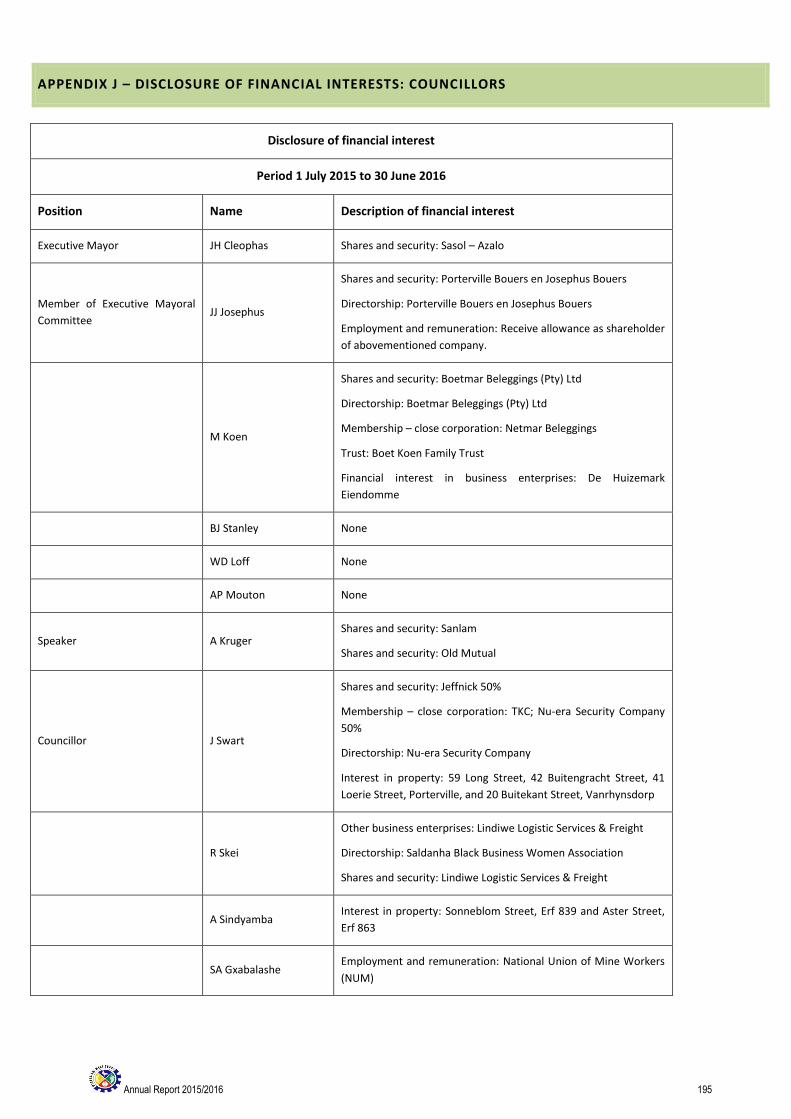
Annual Report 2015/2016 195
APPENDIX J – DISCLOSURE OF FINANCIAL INTERESTS: COUNCILLORS
Disclosure of financial interest
Period 1 July 2015 to 30 June 2016
Position Name Description of financial interest
Executive Mayor JH Cleophas Shares and security: Sasol – Azalo
Member of Executive Mayoral
Committee JJ Josephus
Shares and security: Porterville Bouers en Josephus Bouers
Directorship: Porterville Bouers en Josephus Bouers
Employment and remuneration: Receive allowance as shareholder
of abovementioned company.
M Koen
Shares and security: Boetmar Beleggings (Pty) Ltd
Directorship: Boetmar Beleggings (Pty) Ltd
Membership – close corporation: Netmar Beleggings
Trust: Boet Koen Family Trust
Financial interest in business enterprises: De Huizemark
Eiendomme
BJ Stanley None
WD Loff None
AP Mouton None
Speaker A Kruger Shares and security: Sanlam
Shares and security: Old Mutual
Councillor J Swart
Shares and security: Jeffnick 50%
Membership – close corporation: TKC; Nu-era Security Company
50%
Directorship: Nu-era Security Company
Interest in property: 59 Long Street, 42 Buitengracht Street, 41
Loerie Street, Porterville, and 20 Buitekant Street, Vanrhynsdorp
R Skei
Other business enterprises: Lindiwe Logistic Services & Freight
Directorship: Saldanha Black Business Women Association
Shares and security: Lindiwe Logistic Services & Freight
A Sindyamba Interest in property: Sonneblom Street, Erf 839 and Aster Street,
Erf 863
SA Gxabalashe Employment and remuneration: National Union of Mine Workers
(NUM)

Annual Report 2015/2016 196
CH Heyns
Shares and security: Paardeberg Wynboere Koöperasie
Directorship: Paardeberg Wynboere Koöperasie Trust: Heyns
Family Trust – Arnaud
Partnership: PJ Heyns (father) and CH Heyns – Arnaud
E Plaatjies Directorship: Vital Connections
Partnership: Biko & Plaatjies Pty Ltd
M Smit None
CJ Snyders None
SR Claassen Membership - Close Corporation: SR Claassen Consulting CC
Membership - Close Corporation: TWC Consulting (TWC Peak IV CC)
J Barnard None
JJ Fransman None
EL Mgingqi Shares and Security: SAB
Other: Business Enterprises: Elias Eyona Yona Tavern
JJ Cilliè None
ST Vries Directorship: Inyameko Trading CC
NV Mgoqi
Membership - Close Corporation: Ezakwantu Creations
Shares and Security: NV Mgoqi Transport, MTN (Welkom Yizani),
Old Mutual
Directorship: Vivid Minds (Pty) Ltd
NJA Rust
Shares and Security: SK Handelshuis, Pioneer Foods, ABSA, Nedcor,
Old Mutual, RMBH, Sanlam
Trust: Rust Family Trust
NS Zatu Partnerships: Vemma Brand Partners, SOLAL Network Marketing
Other: Soyaxova Construction (Pty) Ltd

Annual Report 2015/2016 197
APPENDIX J2 – DISCLOSURE OF FINANCIAL INTERESTS: SECTION 57 OFFICIALS
Disclosure of financial interest
Period 1 July 2015 to 30 June 2016
Position Name Description of financial interest
Municipal Manager HF Prins
Yizani/Welkom
River Five CC (Property Investment)
Chief Financial Officer J Koekemoer None
Director: Administration and Community Services
W Markus Media 24 (Naspers)
Director: Technical Service
H Matthee None
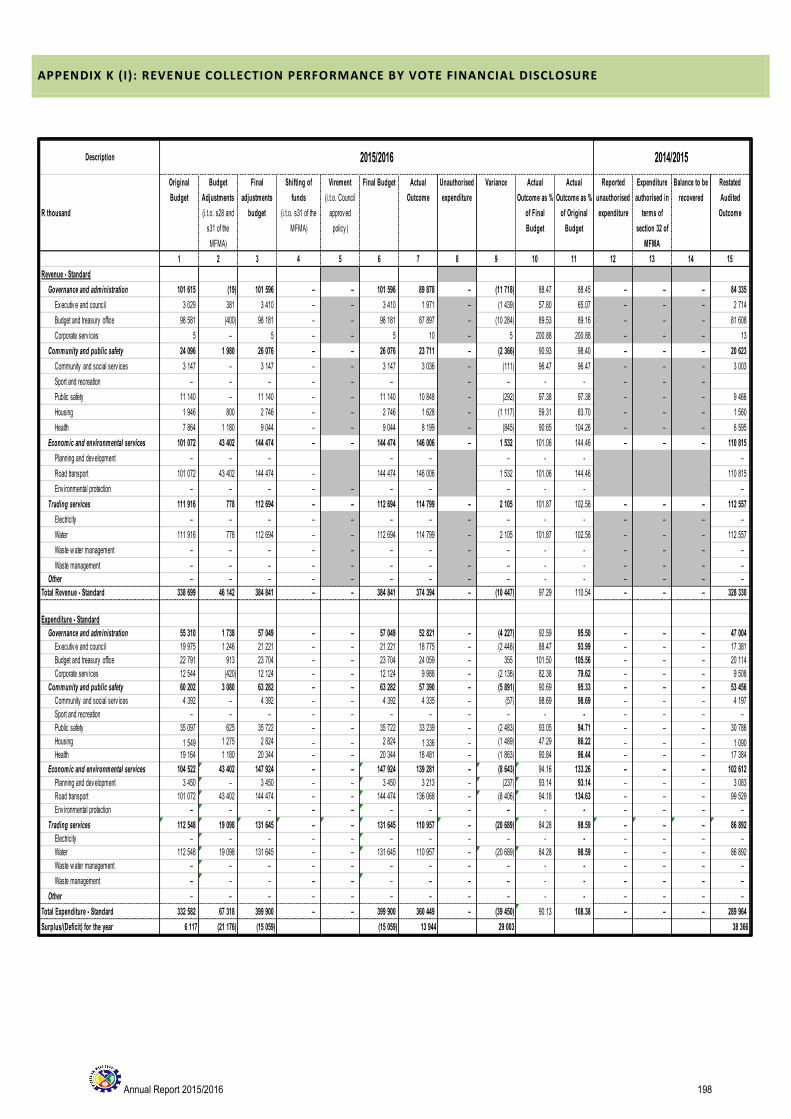
Annual Report 2015/2016 198
APPENDIX K (I): REVENUE COLLECTION PERFORMANCE BY VOTE FINANCIAL DISCLOSURE
Description
R thousand
Original
Budget
Budget
Adjustments
(i.t.o. s28 and
s31 of the
MFMA)
Final
adjustments
budget
Shifting of
funds
(i.t.o. s31 of the
MFMA)
Virement
(i.t.o. Council
approv ed
policy )
Final Budget Actual
Outcome
Unauthorised
expenditure
Variance Actual
Outcome as %
of Final
Budget
Actual
Outcome as %
of Original
Budget
Reported
unauthorised
expenditure
Expenditure
authorised in
terms of
section 32 of
MFMA
Balance to be
recovered
Restated
Audited
Outcome
1 2 3 4 5 6 7 8 9 10 11 12 13 14 15
Revenue - Standard
Governance and administration 101 615 (19) 101 596 – – 101 596 89 878 – (11 718) 88.47 88.45 – – – 84 335
Ex ecutiv e and council 3 029 381 3 410 – – 3 410 1 971 – (1 439) 57.80 65.07 – – – 2 714
Budget and treasury office 98 581 (400) 98 181 – – 98 181 87 897 – (10 284) 89.53 89.16 – – – 81 608
Corporate serv ices 5 – 5 – – 5 10 – 5 200.88 200.88 – – – 13
Community and public safety 24 096 1 980 26 076 – – 26 076 23 711 – (2 366) 90.93 98.40 – – – 20 623
Community and social serv ices 3 147 – 3 147 – – 3 147 3 036 – (111) 96.47 96.47 – – – 3 003
Sport and recreation – – – – – – – – - - – – –
Public safety 11 140 – 11 140 – – 11 140 10 848 – (292) 97.38 97.38 – – – 9 466
Housing 1 946 800 2 746 – – 2 746 1 628 – (1 117) 59.31 83.70 – – – 1 560
Health 7 864 1 180 9 044 – – 9 044 8 199 – (845) 90.65 104.26 – – – 6 595
Economic and environmental services 101 072 43 402 144 474 – – 144 474 146 006 – 1 532 101.06 144.46 – – – 110 815
Planning and dev elopment – – – – – – - - –
Road transport 101 072 43 402 144 474 – 144 474 146 006 1 532 101.06 144.46 110 815
Env ironmental protection – – – – – – – – - - –
Trading services 111 916 778 112 694 – – 112 694 114 799 – 2 105 101.87 102.58 – – – 112 557
Electricity – – – – – – – – – - - – – – –
Water 111 916 778 112 694 – – 112 694 114 799 – 2 105 101.87 102.58 – – – 112 557
Waste w ater management – – – – – – – – – - - – – – –
Waste management – – – – – – – – – - - – – – –
Other – – – – – – – – – - - – – – –
Total Revenue - Standard 338 699 46 142 384 841 – – 384 841 374 394 – (10 447) 97.29 110.54 – – – 328 330
Expenditure - Standard
Governance and administration 55 310 1 738 57 049 – – 57 049 52 821 – (4 227) 92.59 95.50 – – – 47 004
Ex ecutiv e and council 19 975 1 246 21 221 – – 21 221 18 775 – (2 446) 88.47 93.99 – – – 17 381
Budget and treasury office 22 791 913 23 704 – – 23 704 24 059 – 355 101.50 105.56 – – – 20 114
Corporate serv ices 12 544 (420) 12 124 – – 12 124 9 988 – (2 136) 82.38 79.62 – – – 9 508
Community and public safety 60 202 3 080 63 282 – – 63 282 57 390 – (5 891) 90.69 95.33 – – – 53 456
Community and social serv ices 4 392 – 4 392 – – 4 392 4 335 – (57) 98.69 98.69 – – – 4 197
Sport and recreation – – – – – – – – – - - – – – –
Public safety 35 097 625 35 722 – – 35 722 33 239 – (2 483) 93.05 94.71 – – – 30 786
Housing 1 549 1 275 2 824 – – 2 824 1 336 – (1 489) 47.29 86.22 – – – 1 090
Health 19 164 1 180 20 344 – – 20 344 18 481 – (1 863) 90.84 96.44 – – – 17 384
Economic and environmental services 104 522 43 402 147 924 – – 147 924 139 281 – (8 643) 94.16 133.26 – – – 102 612
Planning and dev elopment 3 450 – 3 450 – – 3 450 3 213 – (237) 93.14 93.14 – – – 3 083
Road transport 101 072 43 402 144 474 – – 144 474 136 068 – (8 406) 94.18 134.63 – – – 99 529
Env ironmental protection – – – – – – – – – - - – – – –
Trading services 112 548 19 098 131 645 – – 131 645 110 957 – (20 689) 84.28 98.59 – – – 86 892
Electricity – – – – – – – – – - - – – – –
Water 112 548 19 098 131 645 – – 131 645 110 957 – (20 689) 84.28 98.59 – – – 86 892
Waste w ater management – – – – – – – – – - - – – – –
Waste management – – – – – – – – – - - – – – –
Other – – – – – – – – – - - – – – –
Total Expenditure - Standard 332 582 67 318 399 900 – – 399 900 360 449 – (39 450) 90.13 108.38 – – – 289 964
Surplus/(Deficit) for the year 6 117 (21 176) (15 059) (15 059) 13 944 29 003 38 366
2015/2016 2014/2015

Annual Report 2015/2016 199
APPENDIX K – REVENUE COLLECTION PERFORMANCE BY SOURCE
Description
R thousands
Original
Budget
Budget
Adjustments
(i.t.o. s28 and
s31 of the
MFMA)
Final
adjustments
budget
Shifting of
funds
(i.t.o. s31 of the
MFMA)
Virement
(i.t.o. Council
approv ed
policy )
Final Budget Actual
Outcome
Unauthorised
expenditure
Variance Actual
Outcome as %
of Final
Budget
Actual
Outcome as %
of Original
Budget
Reported
unauthorised
expenditure
Expenditure
authorised in
terms of
section 32 of
MFMA
Balance to be
recovered
Restated
Audited
Outcome
1 2 3 4 5 6 7 8 9 10 11 12 13 14 15
Financial Performance
Property rates – – – – – – – – – 0.00 0.00 – – – –
Serv ice charges 110 708 – 110 708 – – 110 708 113 875 3 167 102.86 102.86 – – – 107 439
Inv estment rev enue 8 250 – 8 250 – – 8 250 17 176 – 8 926 208.20 208.20 – – – 13 526
Transfers recognised - operational 86 057 1 654 87 711 – – 87 711 88 624 – 913 101.04 102.98 – – – 84 418
Other ow n rev enue 133 684 44 488 178 172 – – 178 172 154 719 – (23 453) 86.84 115.73 – – – 126 627
Total Revenue (excluding capital transfers and contributions)
338 699 46 142 384 841 – – 384 841 374 394 – (10 447) 97.29 110.54 – – – 332 010
Employ ee costs 154 256 149 154 405 – – 154 405 146 033 – (8 372) 94.58 94.67 – – – 132 635
Remuneration of councillors 5 931 395 6 326 – – 6 326 6 153 – (174) 97.26 103.74 – – – 5 883
Debt impairment 750 – 750 – – 750 282 – (468) 37.55 37.55 – – – 361
Depreciation & asset impairment 14 134 – 14 134 – – 14 134 13 598 – (537) 96.20 96.20 – – – 12 695
Finance charges 10 664 – 10 664 – – 10 664 8 943 – (1 721) 83.86 83.86 – – – 10 454
Materials and bulk purchases 51 417 41 819 93 236 – – 93 236 92 823 – (412) 99.56 180.53 – – – 66 706
Transfers and grants – – – – – – – – – 0.00 0.00 – – – –
Other ex penditure 95 430 24 955 120 385 – – 120 385 92 618 – (27 767) 76.94 97.05 – – – 64 910
Total Expenditure 332 582 67 318 399 900 – – 399 900 360 449 – (39 450) 90.13 108.38 – – – 293 644
Surplus/(Deficit) 6 117 (21 176) (15 059) – – (15 059) 13 944 – 29 003 -92.60 227.94 – – – 38 366
Transfers recognised - capital – – – – – – – – – 0 (0) – – – –
Contributions recognised - capital & contributed assets – – – – – – – – – 0.00 0.00 – – – –
Surplus/(Deficit) after capital transfers & contributions 6 117 (21 176) (15 059) – – (15 059) 13 944 – 29 003 -92.60 227.94 – – – 38 366
Share of surplus/ (deficit) of associate – – – – – – – – – 0 #DIV/0! – – – –
Surplus/(Deficit) for the year 6 117 (21 176) (15 059) – – (15 059) 13 944 – 29 003 -92.60 227.94 – – – 38 366
Capital expenditure & funds sources
Capital expenditure 8 315 (1 153) 7 162 – – 7 162 6 440 – (722) 89.91 77.45 – – – 16 155
Transfers recognised - capital – – – – – – – – – 0.00 0.00 – – – –
Public contributions & donations – – – – – – – – 0 0.00 0.00 – – – –
Borrow ing – – – – – – – – – 0.00 0.00 – – – –
Internally generated funds 8 315 (1 153) 7 162 – – 7 162 6 440 – (722) 89.91 77.45 – – – 16 155
Total sources of capital funds 8 315 (1 153) 7 162 – – 7 162 6 440 – (722) 89.91 77.45 – – – 16 155
Cash flows
Net cash from (used) operating 21 002 (2 040) 18 962 – – 18 962 49 113 – 30 151 259.00 233.85 – – – 58 904
Net cash from (used) inv esting (8 315) 1 153 (7 162) – – (7 162) (6 168) – 995 86.11 74.17 – – – (15 460)
Net cash from (used) financing (14 127) – (14 127) – – (14 127) (14 998) – (870) 106.16 106.16 – – – (13 516)
Cash/cash equivalents at the year end 167 598 (887) 166 711 – – 166 711 226 915 – 60 204 136.11 135.39 – – – 198 967 199
2015/2016 2014/2015

Annual Report 2015/2016 200
APPENDIX L: CONDITIONAL GRANTS RECEIVED: EXCLUDING MIG
2014/15 Budget Year 2015/16
Audited
Outcome
Original
Budget
Adjusted
Budget
Monthly
actual
YearTD
actual
YearTD
budget
YTD
variance
YTD
variance
Full Year
Forecast
R thousands %
RECEIPTS: 1,2
Operating Transfers and Grants
National Government: 79 630 86 057 87 435 – 86 776 87 435 (297) -0.3% 87 435
Local Gov ernment Equitable Share 75 984 80 458 80 458 – 80 458 80 458 – 80 458
Finance Management 1 250 1 250 1 250 – 1 250 1 250 1 250
Municipal Sy stems Improv ement 934 930 930 – 787 930 930
EPWP Incentiv e 1 000 1 000 1 000 – 1 000 1 000 1 000
Rural Roads Asset Management Sy stem – 2 419 2 419 – 2 199 2 419 2 419
Working for w ater 3 462 – 778 – 638 778 (140) -18.0% 778
Fresh w ater tanks – – 600 – 444 600 (156) -26.1% 600
– – – – – – – –
– – – – – – – –
– – – – – – – –
Fresh w ater tanks – – – – – – – –
Provincial Government: 962 – 275 – 603 275 456 165.8% 275
Prov incial Management Support Grant 837 – – – – – – –
Western Cape Financial Management Grant – – 180 – 51 180 180
Greenest M.C. 125 – – – – – – –
Western Cape Financial Management Grant 4 – – 95 – 551 95 456 479.5% 95
– – – – – – – –
– – – – – – – –
District Municipality: – – – – – – – –
[insert description] – – – – – – – –
– – – – – – – –
Other grant providers: 256 – – – 1 245 – 1 245 #DIV/0! –
Other grants and subsidies 256 – – – 1 245 – 1 245 #DIV/0! –
– – – – – – –
– – – – – – –
– – – – – – –
– – – – – – –
– – – – – – –
– – – – – – – –
Total Operating Transfers and Grants 5 80 847 86 057 87 711 – 88 624 87 711 1 404 1.6% 87 711
Capital Transfers and Grants
National Government: 3 571 – – – – – – –
Regional Bulk Infrastructure 3 571 – – – – – – –
– – – – – – –
– – – – – – –
– – – – – – –
– – – – – – –
– – – – – – – –
– – – – – – – –
– – – – – – – –
– – – – – – – –
Other capital transfers [insert description] – – – – – – – –
Provincial Government: – – – – – – – –
[insert description] – – – – – – – –
– – – – – – –
– – – – – – –
– – – – – – –
– – – – – – –
– – – – – – – –
District Municipality: – – – – – – – –
[insert description] – – – – – – – –
– – – – – – – –
Other grant providers: – – – – – – – –
[insert description] – – – – – – – –
– – – – – – –
– – – – – – –
– – – – – – –
– – – – – – –
– – – – – – – –
Total Capital Transfers and Grants 5 3 571 – – – – – – –
TOTAL RECEIPTS OF TRANSFERS & GRANTS 5 84 418 86 057 87 711 – 88 624 87 711 1 404 1.6% 87 711
Description Ref
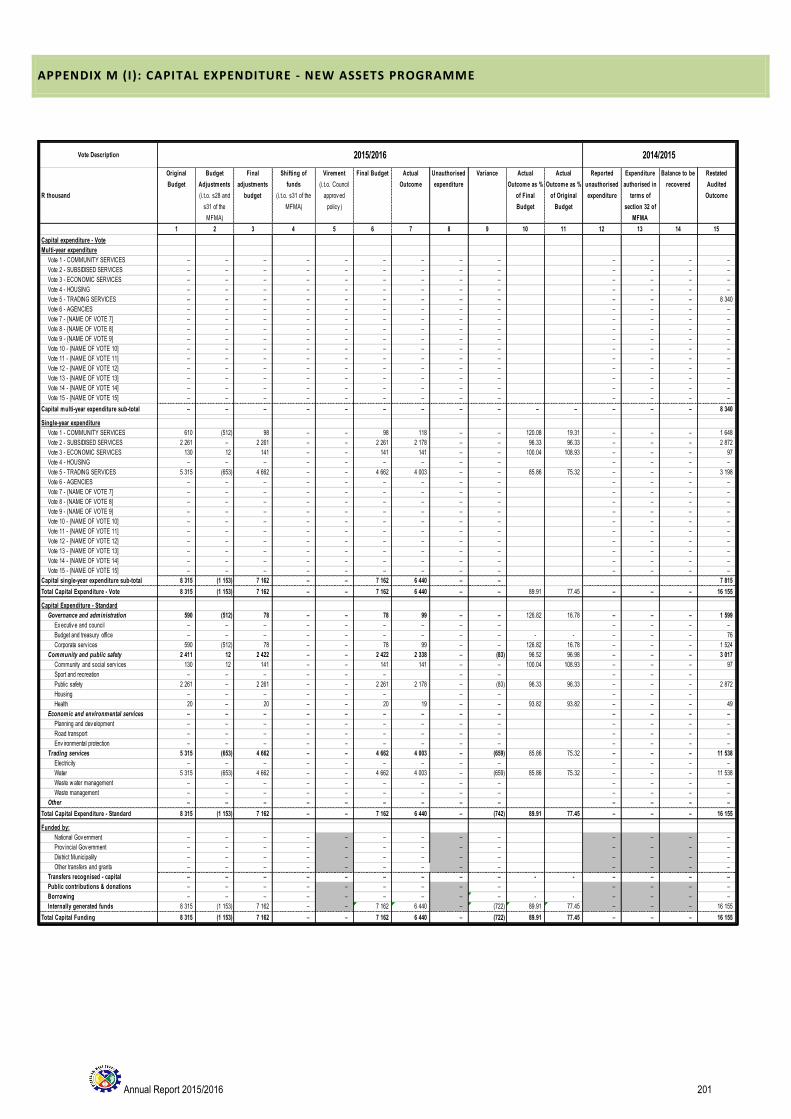
Annual Report 2015/2016 201
APPENDIX M (I): CAPITAL EXPENDITURE - NEW ASSETS PROGRAMME
Vote Description
R thousand
Original
Budget
Budget
Adjustments
(i.t.o. s28 and
s31 of the
MFMA)
Final
adjustments
budget
Shifting of
funds
(i.t.o. s31 of the
MFMA)
Virement
(i.t.o. Council
approv ed
policy )
Final Budget Actual
Outcome
Unauthorised
expenditure
Variance Actual
Outcome as %
of Final
Budget
Actual
Outcome as %
of Original
Budget
Reported
unauthorised
expenditure
Expenditure
authorised in
terms of
section 32 of
MFMA
Balance to be
recovered
Restated
Audited
Outcome
1 2 3 4 5 6 7 8 9 10 11 12 13 14 15
Capital expenditure - Vote
Multi-year expenditure
Vote 1 - COMMUNITY SERVICES – – – – – – – – – – – – –
Vote 2 - SUBSIDISED SERVICES – – – – – – – – – – – – –
Vote 3 - ECONOMIC SERVICES – – – – – – – – – – – – –
Vote 4 - HOUSING – – – – – – – – – – – – –
Vote 5 - TRADING SERVICES – – – – – – – – – – – – 8 340
Vote 6 - AGENCIES – – – – – – – – – – – – –
Vote 7 - {NAME OF VOTE 7] – – – – – – – – – – – – –
Vote 8 - {NAME OF VOTE 8] – – – – – – – – – – – – –
Vote 9 - {NAME OF VOTE 9] – – – – – – – – – – – – –
Vote 10 - {NAME OF VOTE 10] – – – – – – – – – – – – –
Vote 11 - {NAME OF VOTE 11] – – – – – – – – – – – – –
Vote 12 - {NAME OF VOTE 12] – – – – – – – – – – – – –
Vote 13 - {NAME OF VOTE 13] – – – – – – – – – – – – –
Vote 14 - {NAME OF VOTE 14] – – – – – – – – – – – – –
Vote 15 - {NAME OF VOTE 15] – – – – – – – – – – – – –
Capital multi-year expenditure sub-total – – – – – – – – – – – – – – 8 340
Single-year expenditure
Vote 1 - COMMUNITY SERVICES 610 (512) 98 – – 98 118 – – 120.08 19.31 – – – 1 648
Vote 2 - SUBSIDISED SERVICES 2 261 – 2 261 – – 2 261 2 178 – – 96.33 96.33 – – – 2 872
Vote 3 - ECONOMIC SERVICES 130 12 141 – – 141 141 – – 100.04 108.93 – – – 97
Vote 4 - HOUSING – – – – – – – – – – – – –
Vote 5 - TRADING SERVICES 5 315 (653) 4 662 – – 4 662 4 003 – – 85.86 75.32 – – – 3 198
Vote 6 - AGENCIES – – – – – – – – – – – – –
Vote 7 - {NAME OF VOTE 7] – – – – – – – – – – – – –
Vote 8 - {NAME OF VOTE 8] – – – – – – – – – – – – –
Vote 9 - {NAME OF VOTE 9] – – – – – – – – – – – – –
Vote 10 - {NAME OF VOTE 10] – – – – – – – – – – – – –
Vote 11 - {NAME OF VOTE 11] – – – – – – – – – – – – –
Vote 12 - {NAME OF VOTE 12] – – – – – – – – – – – – –
Vote 13 - {NAME OF VOTE 13] – – – – – – – – – – – – –
Vote 14 - {NAME OF VOTE 14] – – – – – – – – – – – – –
Vote 15 - {NAME OF VOTE 15] – – – – – – – – – – – – –
Capital single-year expenditure sub-total 8 315 (1 153) 7 162 – – 7 162 6 440 – – 7 815
Total Capital Expenditure - Vote 8 315 (1 153) 7 162 – – 7 162 6 440 – – 89.91 77.45 – – – 16 155
Capital Expenditure - Standard
Governance and administration 590 (512) 78 – – 78 99 – – 126.82 16.78 – – – 1 599
Ex ecutiv e and council – – – – – – – – – – – – –
Budget and treasury office – – – – – – – – – - - – – – 76
Corporate serv ices 590 (512) 78 – – 78 99 – – 126.82 16.78 – – – 1 524
Community and public safety 2 411 12 2 422 – – 2 422 2 338 – (83) 96.52 96.98 – – – 3 017
Community and social serv ices 130 12 141 – – 141 141 – – 100.04 108.93 – – – 97
Sport and recreation – – – – – – – – – – –
Public safety 2 261 – 2 261 – – 2 261 2 178 – (83) 96.33 96.33 – – – 2 872
Housing – – – – – – – – – – –
Health 20 – 20 – – 20 19 – – 93.82 93.82 – – – 49
Economic and environmental services – – – – – – – – – – – – –
Planning and dev elopment – – – – – – – – – – – – –
Road transport – – – – – – – – – – – – –
Env ironmental protection – – – – – – – – – – – – –
Trading services 5 315 (653) 4 662 – – 4 662 4 003 – (659) 85.86 75.32 – – – 11 538
Electricity – – – – – – – – – – – – –
Water 5 315 (653) 4 662 – – 4 662 4 003 – (659) 85.86 75.32 – – – 11 538
Waste w ater management – – – – – – – – – – – – –
Waste management – – – – – – – – – – – – –
Other – – – – – – – – – – – – –
Total Capital Expenditure - Standard 8 315 (1 153) 7 162 – – 7 162 6 440 – (742) 89.91 77.45 – – – 16 155
Funded by:
National Gov ernment – – – – – – – – – – – – –
Prov incial Gov ernment – – – – – – – – – – – – –
District Municipality – – – – – – – – – – – – –
Other transfers and grants – – – – – – – – – – – – –
Transfers recognised - capital – – – – – – – – – - - – – – –
Public contributions & donations – – – – – – – – – – – – –
Borrowing – – – – – – – – – - - – – – –
Internally generated funds 8 315 (1 153) 7 162 – – 7 162 6 440 – (722) 89.91 77.45 – – – 16 155
Total Capital Funding 8 315 (1 153) 7 162 – – 7 162 6 440 – (722) 89.91 77.45 – – – 16 155
2015/2016 2014/2015
Annual Report 2015/2016 202
APPENDIX M ( ii): CAPITAL EXPENDITURE – UPGRADE/RENEWAL PROGRAMME
Not Applicable
APPENDIX N – CAPITAL PROGRAMME BY PROJECT YEAR
Not Applicable
APPENDIX O – CAPITAL PROGRAMME BY PROJECT BY WARD YEAR 1
Not Applicable
Annual Report 2015/2016 203
APPENDIX P – SERVICE CONNECTION BACKLOGS AT SCHOOLS AND CLINICS
Service Backlogs: Schools and Clinics
Establishments lacking basic
services
Water Sanitation Electricity Solid Waste
Collection
Schools (NAMES,
LOCATIONS) N
ot
Ap
plic
able
No
t A
pp
licab
le
No
t A
pp
licab
le
No
t A
pp
licab
le
Clinics (NAMES, LOCATIONS)
Names and locations of schools and clinics lacking one or more services. Use 'x' to mark lack of service at appropriate level
for the number of people attending the school/clinic, allowing for the proper functioning of the establishment concerned.
TP
Annual Report 2015/2016 204
APPENDIX Q: CAPITAL EXPENDITURE – UPGRADE/RENEWAL PROGRAMME
Not applicable.
APPENDIX R: CAPITAL PROGRAMME BY PROJECT: YEAR 1
Not applicable.
APPENDIX S: CAPITAL PROGRAMME BY WARD: YEAR 1
Not applicable.
Annual Report 2015/2016 205
APPENDIX T – SERVICE CONNECTION BACKLOGS AT SCHOOLS AND CLINICS
Service backlogs: Schools and clinics
Establishments lacking basic
services
Water Sanitation Electricity Solid waste
collection
Schools (names, locations)
No
t ap
plic
able
No
t ap
plic
able
31
Oct
ob
er 2
01
4
No
t ap
plic
able
Clinics (names, locations)
Names and locations of schools and clinics lacking one or more services. Use 'x' to mark lack of service at appropriate level
for the number of people attending the school/clinic, allowing for the proper functioning of the establishment concerned.
Annual Report 2015/2016 206
APPENDIX U – SERVICE BACKLOGS EXPERIENCED BY THE COMMUNITY WHERE ANOTHER SPHERE OF
GOVERNMENT IS RESPONSIBLE FOR SERVICE PROVISION
Service backlogs experienced by the community where another sphere of government is the service provider (whether or not the municipality acts on an agency basis)
Services and locations Scale of backlogs Impact of backlogs
Clinics
No
t ap
plic
able
– D
istr
ict
Mu
nic
ipal
ity
No
t ap
plic
able
– D
istr
ict
Mu
nic
ipal
ity
Housing
Licensing and Testing Centre
Reservoir schools (primary and high)
Sports fields
Annual Report 2015/2016 207
APPENDIX V – DECLARATION OF LOANS AND GRANTS MADE BY THE MUNICIPALITY
Declaration of loans and grants made by the Municipality: Year 1*
All organisations or persons in receipt of loans*/grants* provided by the Municipality
Nature of project Conditions attached to funding
Value Year 1
(R' 000)
Total amount committed over previous and future years
No
t ap
plic
able
No
t ap
plic
able
No
t ap
plic
able
No
t ap
plic
able
No
t ap
plic
able
* Loans/grants whether in cash or in kind
Annual Report 2015/2016 208
APPENDIX W – DECLARATION OF RETURNS NOT MADE IN DUE TIME UNDER MFMA SECTION 71
MFMA Section 71 returns not made during Year 1 according to reporting requirements
Return Reason return has not been properly made on due date
No
ne
No
t ap
plic
able

Annual Report 2015/2016 209
APPENDIX X – NATIONAL AND PROVINCIAL OUTCOMES FOR LOCAL GOVERNMENT
National and provincial outcomes for local government*
Outcome/Output Progress to date Number or percentage achieved
Output: Improving access to basic services
All basic services backlogs have been addressed earlier by the District Municipality and it is now pursuing alternative bulk water sources through desalination, as well as the development of a regional waste disposal site within the District.
Not measured or quantifiable
Output: Implementation of the Community Work Programme
Extensive public works programmes have been implemented by the district, especially in the field of environmental management.
District Municipality has not participated in CWP, only EPWP.
Output: Deepen democracy through a refined Ward Committee model
The local municipality IDP Ward has been strengthened and the municipal public participation process has been implemented and coordinated with provincial and local government at district level.
The District municipality does not have ward committees, however the district municipality do participate in the local municipal public participation/ public meeting processes/ share with local municipalities their ward level and or public participation platforms
Output: Administrative and financial capability
Continuous corporate improvement of administrative and financial capabilities and systems have been carried out.
District municipality is rolling out the attendance on the MMC/ MFMP programme training to most staff in order to strengthen administrative and financial capabilities.
Output: Improving access to basic services
All basic services backlogs have been addressed earlier by the District Municipality and it is now pursuing alternative bulk water sources through desalination, as well as the development of a regional waste disposal site within the District.
Not measured or quantifiable
Output: Implementation of the Community Work Programme
Extensive public works programmes have been implemented by the district, especially in the field of environmental management.
District Municipality has not participated in CWP, only EPWP.
Output: Deepen democracy through a refined Ward Committee model
The local municipality IDP Ward has been strengthened and the municipal public participation process has been implemented and coordinated with provincial and local government at district level.
The District municipality does not have ward committees but participates in the local municipal public participation/ public meeting processes/ share with local municipalities their ward level and or public participation platforms
Annual Report 2015/2016 210
VOLUME 1 – ANNUAL PERFORMANCE REPORT 2015/2016
TABLE OF CONTENTS
LIST OF TABLES 211
LIST OF FIGURES 211
LIST OF GRAPHS 211
1.1 OVERVIEW OF PERFORMANCE WITHIN THE ORGANISATION 212
1.1.1 Legislative requirements 213
1.1.2 Organisation performance 214
1.1.3 The performance system followed for the financial year 2015/16 215
1.1.4 Actual Performance 216
1.1.5 Individual Performance Management 217
1.1.6 Strategic Service Delivery Budget Implementation Plan (Top Layer) 218
1.2 COMPONENT E: ORGANISATIONAL PERFOMANCE SCORECARD 224
1.2.1 Ensuring Environmental Integrity for the West Coast 225
1.2.2 Ensuring Good Governance and Financial Viability 226
1.2.3 Promoting Social well-being of the community 228
1.2.4 Providing essential Bulk services to the District 229
1.2.5 To pursue Economic Growth and facilitation of job opportunities 230
Annual Report 2015/2016 211
LIST OF TABLES
Table 1.: Top Layer SDBIP – Ensuring Environmental Integrity for the West Coast................................................................. 220
Table 2.: Top Layer SDBIP – Ensuring Good Governance and Financial Viability ..................................................................... 222
Table 3.: Top Layer SDBIP – Promoting Social well-being of the community .......................................................................... 222
Table 4.: Top Layer SDBIP – Providing essential Bulk services to the District .......................................................................... 223
Table 5.: Top Layer SDBIP – To pursue Economic Growth and facilitation of job opportunities ............................................. 224
Table 6.: Service delivery priorities 2016/17: Ensuring Environmental Integrity for the West Coast ..................................... 225
Table 7.: Service delivery priorities 2016/17: Ensuring Good Governance and Financial Viability ......................................... 227
Table 8.: Service delivery priorities 2016/17: Promoting Social well-being of the community ............................................... 228
Table 9.: Service delivery priorities 2016/17: Providing essential Bulk services to the District............................................... 229
Table 10.: Service delivery priorities 2016/17: To pursue Economic Growth and facilitation of job opportunities.................. 230
LIST OF FIGURES
Figure 1.: SDBIP Measurement Categories ............................................................................................................................... 218
LIST OF GRAPHS
Graph 1.: Overall performance per Strategic Objective............................................................................................................ 219

Annual Report 2015/2016 212
1.1 OVERVIEW OF PERFORMANCE WITHIN THE ORGANISATION
Performance management is a process which measures the implementation of the organisation’s strategy. It is also
a management tool to plan, monitor, measure and review performance indicators to ensure efficiency, effectiveness
and the impact of service delivery by the municipality.
At local government level performance management is institutionalized through the legislative requirements of the
performance management process for local government. Performance management provides the mechanism to
measure whether targets to meet its strategic goals, set by the organisation and its employees, are met.
The constitution of S.A (1996), section 152, indicates the objectives of local government and paves the way for
performance management with the requirements for an “accountable government”. The democratic values and
principles in terms of section 195 (1) are also linked with the concept of performance management, with reference
to the principles of inter alia:
the promotion of efficient, economic and effective use of resources,
accountable public administration
to be transparent by providing information,
to be responsive to the needs of the community; and
to facilitate a culture of public service and accountability amongst staff.
The Municipal Systems Act (MSA), 2000 requires municipalities to establish a performance management system.
Further, the MSA and the Municipal Finance Management Act (MFMA) requires the Integrated Development Plan
(IDP) to be aligned to the municipal budget and to be monitored for the performance of the budget against the IDP
via the service delivery budget implementation plan (SDBIP). The Mayor approved the Top Layer SDBIP for 2015/16
in terms of Section 53(1)(c)(ii) of the Municipal Finance Management Act (MFMA), MFMA Circular No. 13 and the
Budgeting and Reporting Regulation on 5 June 2015 which include the municipality’s key performance indicators for
2015/16.
Annual Report 2015/2016 213
1.1.1 LEGISLATIVE REQUIREMENTS
In terms of Section 46(1)(a) of the MSA a municipality must prepare for each financial year a performance report
reflecting the municipality’s and any service provider’s performance during the financial year, including comparison
with targets of and with performance in the previous financial year. The report must, furthermore, indicate the
development and service delivery priorities and the performance targets set by the municipality for the following
financial year and measures that were or are to be taken to improve performance.
Annual Report 2015/2016 214
1.1.2 ORGANISATION PERFORMANCE
Strategic performance indicates how well the municipality achieve its objectives and which policies and processes
are working. All government institutions must report on strategic performance to ensure that service delivery is
efficient, effective and economical. Municipalities must develop strategic plans and allocate resources for the
implementation. The implementation must be monitored on an on-going basis and the results must be reported on
during the financial year to various role-players to enable them to timeously implement corrective measures where
required.
This report highlights the performance of the municipality as measured in the Top Layer SDBIP, in terms of its
strategic objectives and National Key Performance Indicators prescribed in Section 43 of the MSA.

Annual Report 2015/2016 215
1.1.3 THE PERFORMANCE SYSTEM FOLLOWED FOR THE FINANCIAL YEAR 2015/16
A) ADOPTION OF A PERFORMANCE MANAGEMENT FRAMEWORK
Performance management is prescribed by chapter 6 of the MSA and the Municipal Planning and Performance
Management Regulations, 796 of August 2001. Section 7(1) of the aforementioned regulation states that “A
Municipality’s Performance Management System entails a framework that describes and represents how the
municipality’s cycle and processes of performance planning, monitoring, measurement, review, reporting and
improvement will be conducted, organized and managed, including determining the responsibilities of the different
role players.” This framework, inter alia, reflects the linkage between the IDP, Budget, SDBIP and individual and
service provider performance. The municipality adopted a performance management framework that was approved
by Council on 26 September 2009.
B) THE IDP AND THE BUDGET
The revised IDP and the budget for 2015/16 was approved by Council on 25 May 2016. The IDP process and the
performance management process are integrated. The IDP fulfils the planning stage of performance management.
Performance management in turn, fulfils the implementation management, monitoring and evaluation of the IDP.
C) THE SERVICE DELIVERY BUDGET IMPLEMENTATION PLAN
Strategic performance indicates how well the municipality achieve its objectives and which policies and processes
are working. All government institutions must report on strategic performance to ensure that service delivery is
efficient, effective and economical. Municipalities must develop strategic plans and allocate resources for the
implementation. The implementation must be monitored on an on-going basis and the results must be reported on
during the financial year to various role-players to enable them to timeously implement corrective measures where
required.
The municipal scorecard (Top Layer SDBIP) consolidates service delivery targets set by Council/senior management
and provide an overall picture of performance for the municipality as a whole, reflecting performance on its strategic
priorities.
The SDBIP converts the budget into measurable indicators of how, where and when strategies, objectives and
normal business process of the municipality is implemented. It also allocates responsibility to directorates to deliver
the services in terms of the IDP and budget.
Annual Report 2015/2016 216
1.1.4 ACTUAL PERFORMANCE
This report highlights the performance of the municipality as measured in the Top Layer SDBIP, in terms of its
strategic objectives and National Key Performance Indicators prescribed in Section 43 of the MSA.
The municipality utilizes an electronic web based system on which KPI owners update actual performance on a
monthly basis. KPI owners report on the results of the KPI by documenting the following information on the
performance system:
The actual result in terms of the target set.
A performance comment.
Actions to improve the performance against the target set, if the target was not achieved.
It is the responsibility of every KPI owner to maintain a portfolio of evidence to support actual
performance results updated.
Performance results are monitored and reviewed in terms of:
Quarterly KPI monitoring sessions held by the Municipal Manager with all managers;
Quarterly reports tabled before the Portfolio Committees of the Mayor; and
Quarterly reports tabled before the Executive Mayoral Committee and Council.
Annual Report 2015/2016 217
1.1.5 INDIVIDUAL PERFORMANCE MANAGEMENT
A) MUNICIPAL MANAGER AND MANAGERS DIRECTLY ACCOUNTABLE TO THE
MUNICIPAL MANAGER
The Municipal Systems Act, 2000 (Act 32 of 2000) prescribes that the municipality must enter into performance
based agreements with the all s57-employees and that performance agreements must be reviewed annually. This
process and the format are further regulated by Regulation 805 (August 2006). The performance agreements for
the 2015/16 financial year were signed during July 2015 as prescribed.
The appraisal of the actual performance in terms of the singed agreements takes place twice per annum as regulated. The final evaluation of the 2014/15 financial year (1 January 2015 to 30 June 2015) took place on 4 March 2015 and the mid-year performance of 2015/16 (1 July 2015 to 31 December 2015) took place on 15 March 2016. Internal Audit submitted their quarterly performance management audits to the Municipal Manager and the Performance Audit Committee during the meetings held in October 2015 and April 2016 as required in terms of Regulation 14(1)(c) of the Municipal Planning and Performance Management Regulations of 2001.

Annual Report 2015/2016 218
1.1.6 STRATEGIC SERVICE DELIVERY BUDGET IMPLEMENTATION PLAN (TOP LAYER)
The purpose of strategic performance reporting is to report specifically on the implementation and achievement of
IDP outcomes. This section provide an overview on the achievement of the municipality in terms of the strategic
intent and deliverables achieved as stated in the IDP. The Top Layer (strategic) SDBIP is the municipality’s strategic
plan and shows the strategic alignment between the different documents. (IDP, Budget and Performance
Agreements)
In the paragraphs below the performance achieved is illustrated against the Top Layer SDBIP according to the
strategic objectives.
The following figure explains the method by which the overall assessment of actual performance against targets set for the key performance indicators (KPI’s) of the SDBIP is measured:
Category Color Explanation
KPI Not Yet Measured KPI’s with no targets or actuals in the selected period
KPI Not Met 0% > = Actual/Target< 75%
KPI Almost Met 75% > = Actual/Target < 100%
KPI Met Actual/Target = 100%
KPI Well Met 100% > Actual/Target < 150%
KPI Extremely Well Met Actual/Target > = 150%
Figure 1 . : SDBIP Measurement Categor ies

Annual Report 2015/2016 219
The graph below displays the overall performance per strategic objective for 2015/16:
Measurement Category
Objective 1 Objective 2 Objective 3 Objective 4 Objective 5
Total Ensuring
Environmental Integrity for the West
Coast
Ensuring Good Governance and
Financial Viability
Promoting Social well-being of the
community
Providing essential Bulk services to the
District
To pursue Economic Growth and
facilitation of job opportunities
KPI Not Met 0 0 0 0 0 0
KPI Almost Met 0 2 0 0 0 2
KPI Met 0 6 1 1 0 8
KPI Well Met 2 0 0 4 2 8
KPI Extremely Well Met
1 4 0 4 3 12
Total 3 12 1 9 5 30
Graph 1.: Overall performance per Strategic Objective
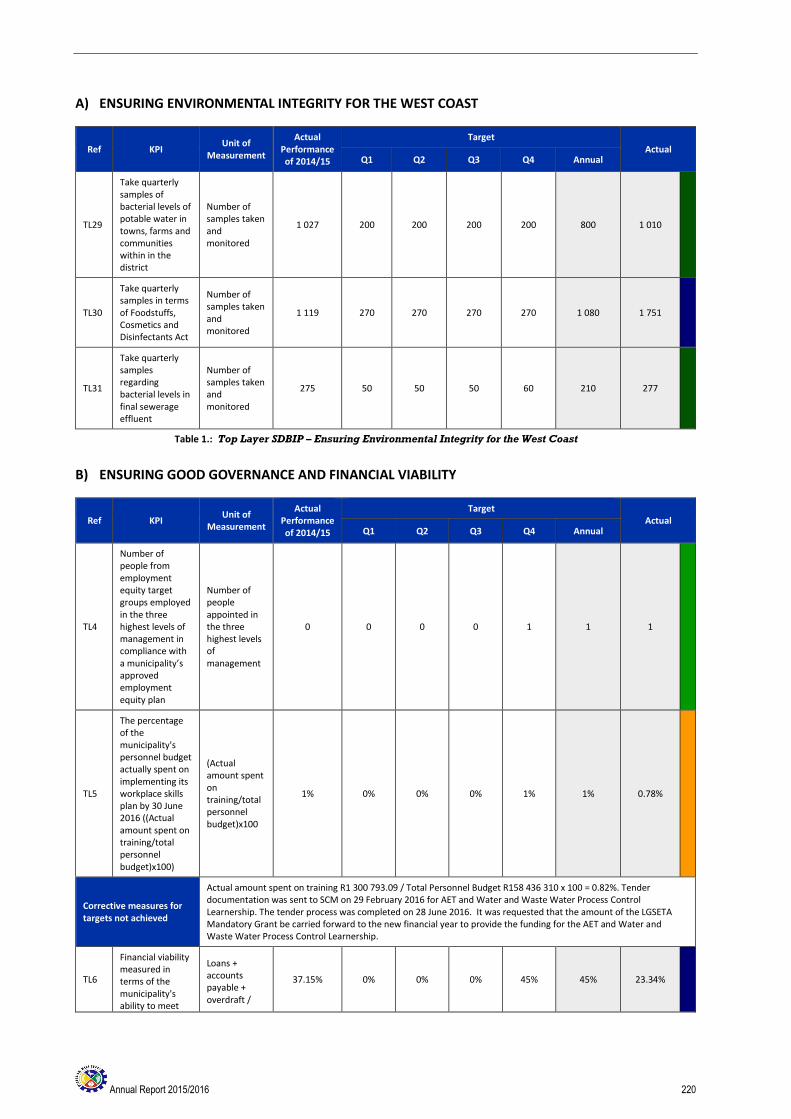
Annual Report 2015/2016 220
A) ENSURING ENVIRONMENTAL INTEGRITY FOR THE WEST COAST
Ref KPI Unit of
Measurement
Actual Performance of 2014/15
Target Actual
Q1 Q2 Q3 Q4 Annual
TL29
Take quarterly samples of bacterial levels of potable water in towns, farms and communities within in the district
Number of samples taken and monitored
1 027 200 200 200 200 800 1 010
TL30
Take quarterly samples in terms of Foodstuffs, Cosmetics and Disinfectants Act
Number of samples taken and monitored
1 119 270 270 270 270 1 080 1 751
TL31
Take quarterly samples regarding bacterial levels in final sewerage effluent
Number of samples taken and monitored
275 50 50 50 60 210 277
Table 1.: Top Layer SDBIP – Ensuring Environmental Integrity for the West Coast
B) ENSURING GOOD GOVERNANCE AND FINANCIAL VIABILITY
Ref KPI Unit of
Measurement
Actual Performance of 2014/15
Target Actual
Q1 Q2 Q3 Q4 Annual
TL4
Number of people from employment equity target groups employed in the three highest levels of management in compliance with a municipality’s approved employment equity plan
Number of people appointed in the three highest levels of management
0 0 0 0 1 1 1
TL5
The percentage of the municipality's personnel budget actually spent on implementing its workplace skills plan by 30 June 2016 ((Actual amount spent on training/total personnel budget)x100)
(Actual amount spent on training/total personnel budget)x100
1% 0% 0% 0% 1% 1% 0.78%
Corrective measures for targets not achieved
Actual amount spent on training R1 300 793.09 / Total Personnel Budget R158 436 310 x 100 = 0.82%. Tender documentation was sent to SCM on 29 February 2016 for AET and Water and Waste Water Process Control Learnership. The tender process was completed on 28 June 2016. It was requested that the amount of the LGSETA Mandatory Grant be carried forward to the new financial year to provide the funding for the AET and Water and Waste Water Process Control Learnership.
TL6
Financial viability measured in terms of the municipality's ability to meet
Loans + accounts payable + overdraft /
37.15% 0% 0% 0% 45% 45% 23.34%

Annual Report 2015/2016 221
Ref KPI Unit of
Measurement
Actual Performance of 2014/15
Target Actual
Q1 Q2 Q3 Q4 Annual
it's service debt obligations as at 30 June 2016
funds and reserves
TL7
Financial viability measured in terms of the outstanding service debtors as at 30 June 2016
(Total outstanding service debtors/ revenue received for services)
3.98% 0% 0% 0% 5% 5% 4.70%
TL8
Financial viability measured in terms of the available cash to cover fixed operating expenditure as at 30 June 2016
Monitory assets (current assets-inventory) / current liabilities
844% 0 0 0 3 3 6
TL10
Limit the vacancy rate to less than 15% of budgeted posts by 30 June 2016 ((Number of budgeted posts filled/Number of budgeted posts on the organogram) x 100)
((Number of vacancies/Number of posts on the organogram) x 100)
14% 0% 0% 0% 15% 15% 13%
TL11
Compile the Risk based audit plan and submit to the Audit Committee for consideration by 30 June 2016
RBAP submitted to Audit Committee by 30 June 2016
1 0 0 0 1 1 1
TL12
Submit progress reports on the implementation of the RBAP to the Audit Committee
Number of progress reports submitted
32 1 2 1 2 6 6
TL13
Co-ordinate the functioning of the audit committee
Number of meetings held
6 1 1 1 1 4 6
TL14
Perform quarterly risk assessments per the Risk Implementation Plan
Number of risk assessments performed
4 1 1 1 1 4 5
TL15
Initiate the meeting of the District coordinating forum (Technical)
Number of meetings initiated
4 1 1 1 1 4 4
TL28
100% of operational conditional grants spent by 30 June 2016 ((Actual amount spent of operational conditional
(Actual amount spent of operational conditional grants/Total budget for operational
100.87% 0% 0% 0% 100% 100% 85.15%
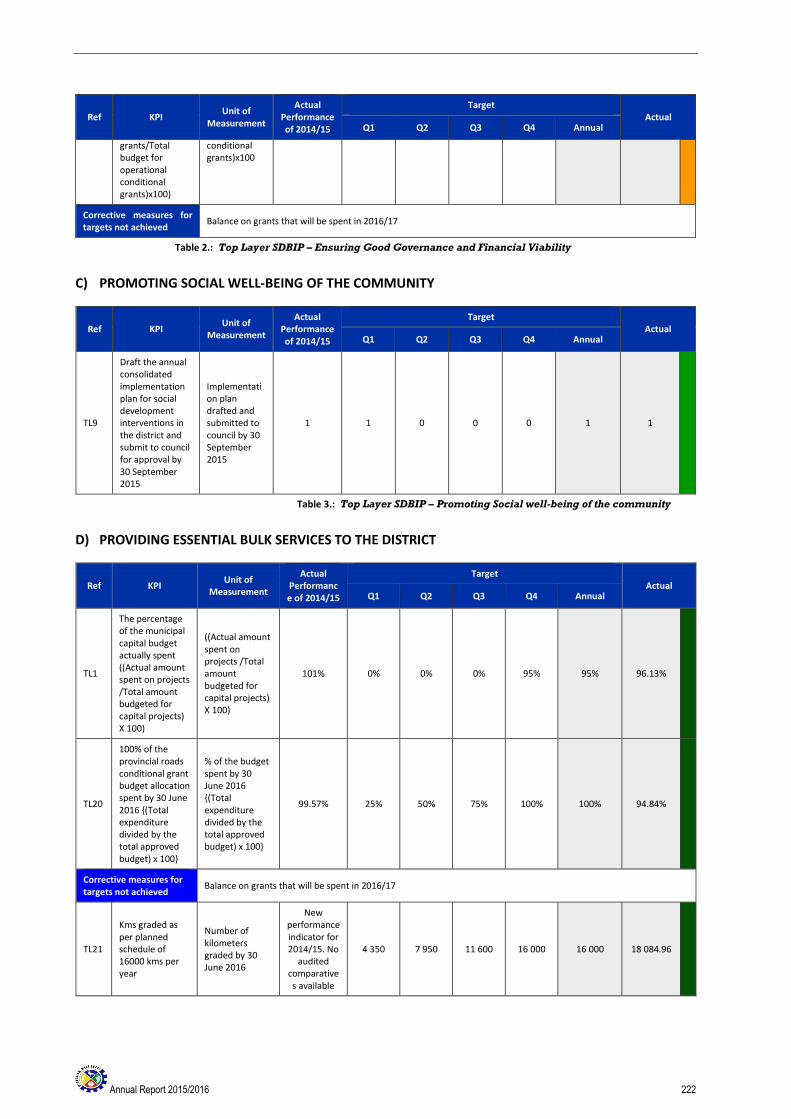
Annual Report 2015/2016 222
Ref KPI Unit of
Measurement
Actual Performance of 2014/15
Target Actual
Q1 Q2 Q3 Q4 Annual
grants/Total budget for operational conditional grants)x100)
conditional grants)x100
Corrective measures for targets not achieved
Balance on grants that will be spent in 2016/17
Table 2.: Top Layer SDBIP – Ensuring Good Governance and Financial Viability
C) PROMOTING SOCIAL WELL-BEING OF THE COMMUNITY
Ref KPI Unit of
Measurement
Actual Performance of 2014/15
Target Actual
Q1 Q2 Q3 Q4 Annual
TL9
Draft the annual consolidated implementation plan for social development interventions in the district and submit to council for approval by 30 September 2015
Implementation plan drafted and submitted to council by 30 September 2015
1 1 0 0 0 1 1
Table 3.: Top Layer SDBIP – Promoting Social well-being of the community
D) PROVIDING ESSENTIAL BULK SERVICES TO THE DISTRICT
Ref KPI Unit of
Measurement
Actual Performance of 2014/15
Target Actual
Q1 Q2 Q3 Q4 Annual
TL1
The percentage of the municipal capital budget actually spent ((Actual amount spent on projects /Total amount budgeted for capital projects) X 100)
((Actual amount spent on projects /Total amount budgeted for capital projects) X 100)
101% 0% 0% 0% 95% 95% 96.13%
TL20
100% of the provincial roads conditional grant budget allocation spent by 30 June 2016 {(Total expenditure divided by the total approved budget) x 100}
% of the budget spent by 30 June 2016 {(Total expenditure divided by the total approved budget) x 100}
99.57% 25% 50% 75% 100% 100% 94.84%
Corrective measures for targets not achieved
Balance on grants that will be spent in 2016/17
TL21
Kms graded as per planned schedule of 16000 kms per year
Number of kilometers graded by 30 June 2016
New performance indicator for 2014/15. No
audited comparatives available
4 350 7 950 11 600 16 000 16 000 18 084.96
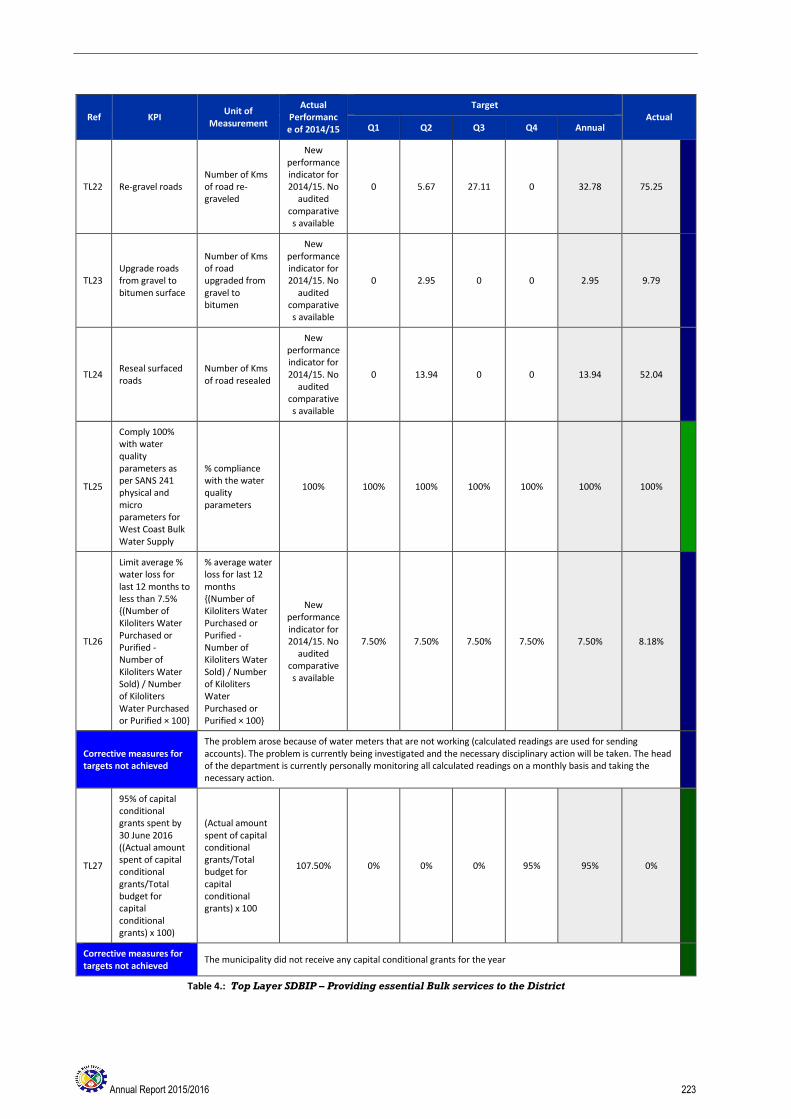
Annual Report 2015/2016 223
Ref KPI Unit of
Measurement
Actual Performance of 2014/15
Target Actual
Q1 Q2 Q3 Q4 Annual
TL22 Re-gravel roads Number of Kms of road re-graveled
New performance indicator for 2014/15. No
audited comparatives available
0 5.67 27.11 0 32.78 75.25
TL23 Upgrade roads from gravel to bitumen surface
Number of Kms of road upgraded from gravel to bitumen
New performance indicator for 2014/15. No
audited comparatives available
0 2.95 0 0 2.95 9.79
TL24 Reseal surfaced roads
Number of Kms of road resealed
New performance indicator for 2014/15. No
audited comparatives available
0 13.94 0 0 13.94 52.04
TL25
Comply 100% with water quality parameters as per SANS 241 physical and micro parameters for West Coast Bulk Water Supply
% compliance with the water quality parameters
100% 100% 100% 100% 100% 100% 100%
TL26
Limit average % water loss for last 12 months to less than 7.5% {(Number of Kiloliters Water Purchased or Purified - Number of Kiloliters Water Sold) / Number of Kiloliters Water Purchased or Purified × 100}
% average water loss for last 12 months {(Number of Kiloliters Water Purchased or Purified - Number of Kiloliters Water Sold) / Number of Kiloliters Water Purchased or Purified × 100}
New performance indicator for 2014/15. No
audited comparatives available
7.50% 7.50% 7.50% 7.50% 7.50% 8.18%
Corrective measures for targets not achieved
The problem arose because of water meters that are not working (calculated readings are used for sending accounts). The problem is currently being investigated and the necessary disciplinary action will be taken. The head of the department is currently personally monitoring all calculated readings on a monthly basis and taking the necessary action.
TL27
95% of capital conditional grants spent by 30 June 2016 ((Actual amount spent of capital conditional grants/Total budget for capital conditional grants) x 100)
(Actual amount spent of capital conditional grants/Total budget for capital conditional grants) x 100
107.50% 0% 0% 0% 95% 95% 0%
Corrective measures for targets not achieved
The municipality did not receive any capital conditional grants for the year
Table 4.: Top Layer SDBIP – Providing essential Bulk services to the District
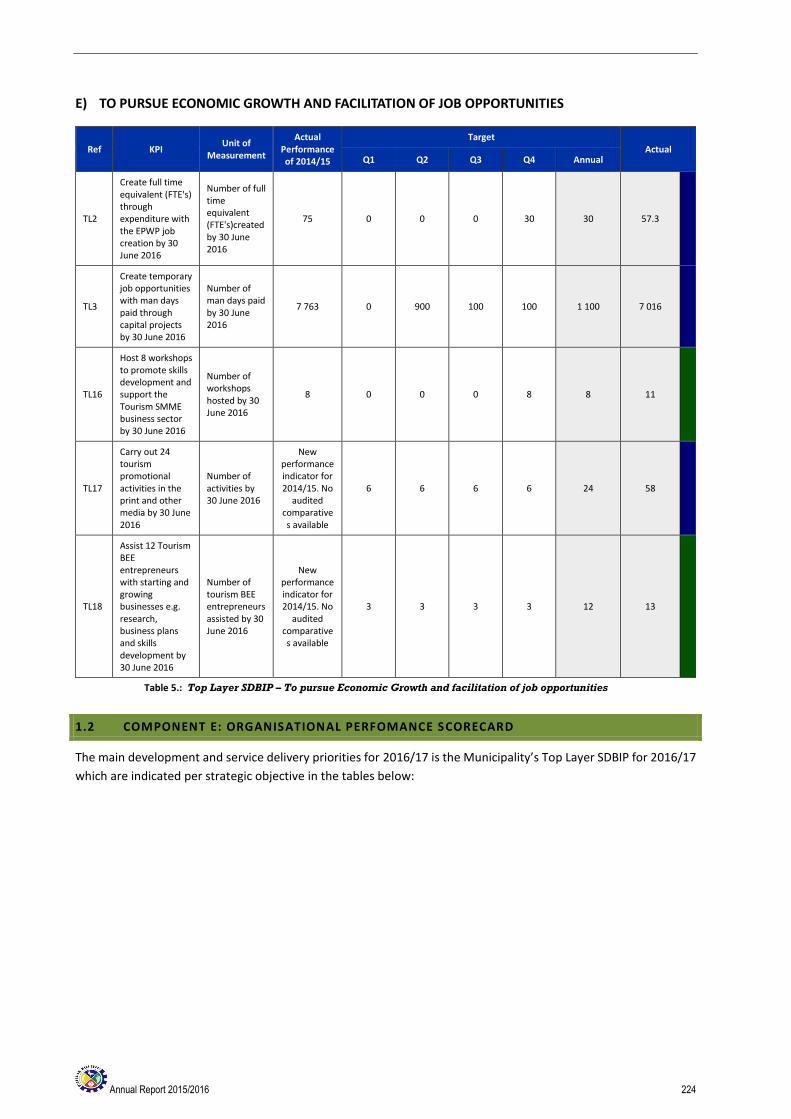
Annual Report 2015/2016 224
E) TO PURSUE ECONOMIC GROWTH AND FACILITATION OF JOB OPPORTUNITIES
Ref KPI Unit of
Measurement
Actual Performance of 2014/15
Target Actual
Q1 Q2 Q3 Q4 Annual
TL2
Create full time equivalent (FTE's) through expenditure with the EPWP job creation by 30 June 2016
Number of full time equivalent (FTE's)created by 30 June 2016
75 0 0 0 30 30 57.3
TL3
Create temporary job opportunities with man days paid through capital projects by 30 June 2016
Number of man days paid by 30 June 2016
7 763 0 900 100 100 1 100 7 016
TL16
Host 8 workshops to promote skills development and support the Tourism SMME business sector by 30 June 2016
Number of workshops hosted by 30 June 2016
8 0 0 0 8 8 11
TL17
Carry out 24 tourism promotional activities in the print and other media by 30 June 2016
Number of activities by 30 June 2016
New performance indicator for 2014/15. No
audited comparatives available
6 6 6 6 24 58
TL18
Assist 12 Tourism BEE entrepreneurs with starting and growing businesses e.g. research, business plans and skills development by 30 June 2016
Number of tourism BEE entrepreneurs assisted by 30 June 2016
New performance indicator for 2014/15. No
audited comparatives available
3 3 3 3 12 13
Table 5.: Top Layer SDBIP – To pursue Economic Growth and facilitation of job opportunities
1.2 COMPONENT E: ORGANISATIONAL PERFOMANCE SCORECARD
The main development and service delivery priorities for 2016/17 is the Municipality’s Top Layer SDBIP for 2016/17
which are indicated per strategic objective in the tables below:

Annual Report 2015/2016 225
1.2.1 ENSURING ENVIRONMENTAL INTEGRITY FOR THE WEST COAST
Ref KPI Unit of Measurement Annual Target
TL9
Take quarterly samples of bacterial levels of potable water in towns, farms and communities within in the district during the 2016/17 financial year
Number of samples taken and monitored 800
TL10 Take quarterly samples in terms of Foodstuffs, Cosmetics and Disinfectants Act during the 2016/17 financial year
Number of samples taken and monitored 1 080
TL11 Take quarterly samples regarding bacterial levels in final sewerage effluent during the 2016/17 financial year
Number of samples taken and monitored 210
Table 6.: Service delivery priorities 2016/17: Ensuring Environmental Integrity for the West Coast
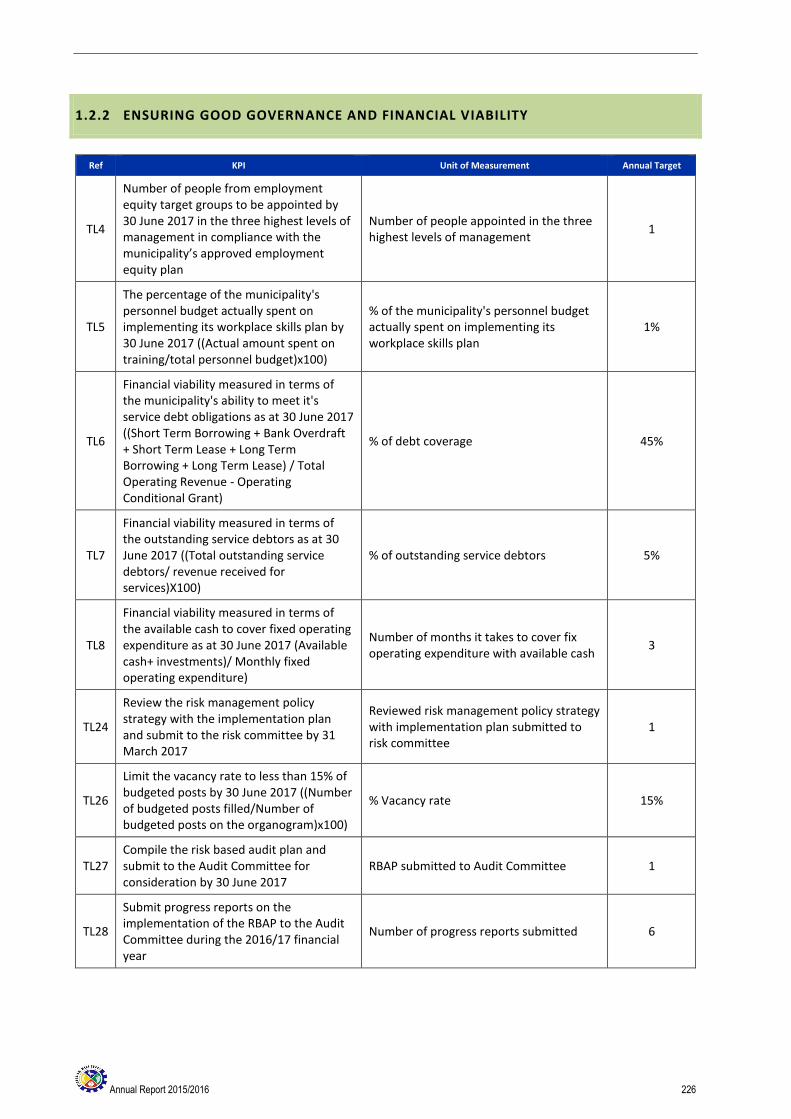
Annual Report 2015/2016 226
1.2.2 ENSURING GOOD GOVERNANCE AND FINANCIAL VIABILITY
Ref KPI Unit of Measurement Annual Target
TL4
Number of people from employment equity target groups to be appointed by 30 June 2017 in the three highest levels of management in compliance with the municipality’s approved employment equity plan
Number of people appointed in the three highest levels of management
1
TL5
The percentage of the municipality's personnel budget actually spent on implementing its workplace skills plan by 30 June 2017 ((Actual amount spent on training/total personnel budget)x100)
% of the municipality's personnel budget actually spent on implementing its workplace skills plan
1%
TL6
Financial viability measured in terms of the municipality's ability to meet it's service debt obligations as at 30 June 2017 ((Short Term Borrowing + Bank Overdraft + Short Term Lease + Long Term Borrowing + Long Term Lease) / Total Operating Revenue - Operating Conditional Grant)
% of debt coverage 45%
TL7
Financial viability measured in terms of the outstanding service debtors as at 30 June 2017 ((Total outstanding service debtors/ revenue received for services)X100)
% of outstanding service debtors 5%
TL8
Financial viability measured in terms of the available cash to cover fixed operating expenditure as at 30 June 2017 (Available cash+ investments)/ Monthly fixed operating expenditure)
Number of months it takes to cover fix operating expenditure with available cash
3
TL24
Review the risk management policy strategy with the implementation plan and submit to the risk committee by 31 March 2017
Reviewed risk management policy strategy with implementation plan submitted to risk committee
1
TL26
Limit the vacancy rate to less than 15% of budgeted posts by 30 June 2017 ((Number of budgeted posts filled/Number of budgeted posts on the organogram)x100)
% Vacancy rate 15%
TL27 Compile the risk based audit plan and submit to the Audit Committee for consideration by 30 June 2017
RBAP submitted to Audit Committee 1
TL28
Submit progress reports on the implementation of the RBAP to the Audit Committee during the 2016/17 financial year
Number of progress reports submitted 6
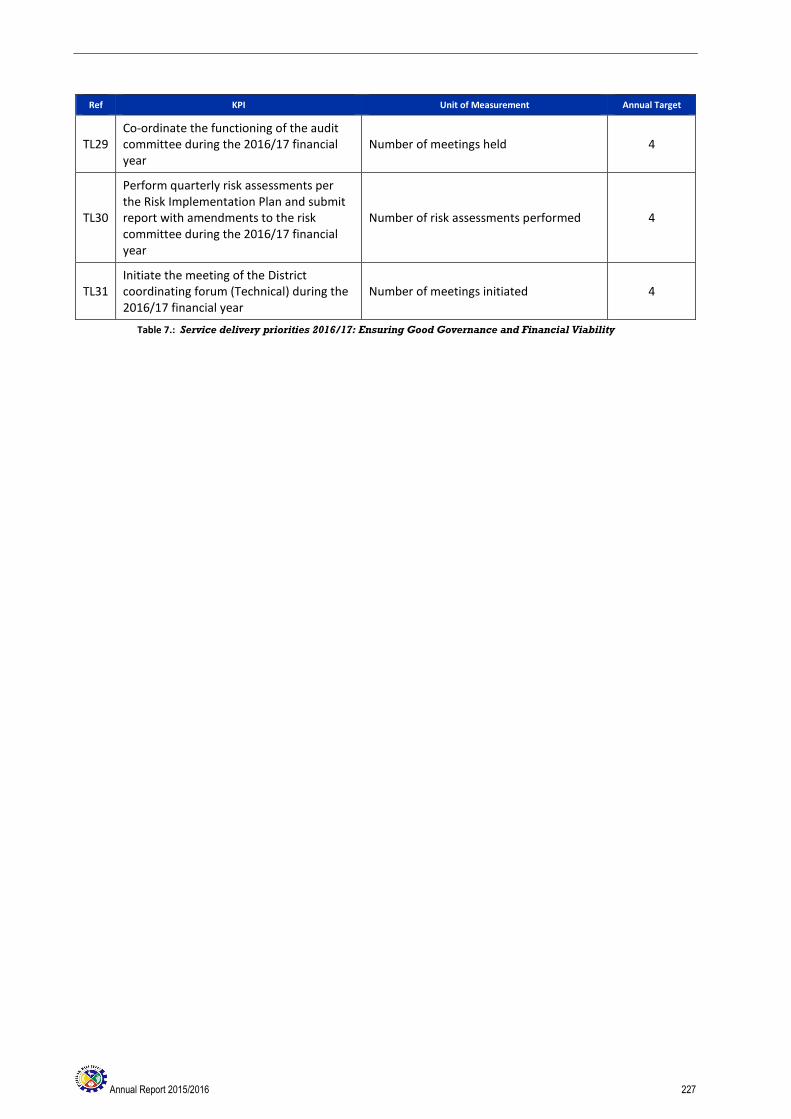
Annual Report 2015/2016 227
Ref KPI Unit of Measurement Annual Target
TL29 Co-ordinate the functioning of the audit committee during the 2016/17 financial year
Number of meetings held 4
TL30
Perform quarterly risk assessments per the Risk Implementation Plan and submit report with amendments to the risk committee during the 2016/17 financial year
Number of risk assessments performed 4
TL31 Initiate the meeting of the District coordinating forum (Technical) during the 2016/17 financial year
Number of meetings initiated 4
Table 7.: Service delivery priorities 2016/17: Ensuring Good Governance and Financial Viability

Annual Report 2015/2016 228
1.2.3 PROMOTING SOCIAL WELL-BEING OF THE COMMUNITY
Ref KPI Unit of Measurement Annual Target
TL12 Review and submit the Fire Master Plan to Council by the end of May 2017
Fire Master Plan reviewed and submitted 1
TL13 Review and submit the Disaster Management Framework to Council by the end of May 2017
Disaster Management Framework reviewed and submitted
1
TL25
Draft the annual consolidated operational plan for social development interventions in the district and submit to MAYCO for approval by 30 September 2016
Consolidated operational plan for social development interventions in the district drafted and submitted to MAYCO
1
Table 8.: Service delivery priorities 2016/17: Promoting Social well-being of the community

Annual Report 2015/2016 229
1.2.4 PROVIDING ESSENTIAL BULK SERVICES TO THE DISTRICT
Ref KPI Unit of Measurement Annual Target
TL1
The percentage of the municipal capital budget actually spent on capital projects by 30 June 2017 {(Actual amount spent on projects /Total amount budgeted for capital projects)X100}
% of capital budget spent 95%
TL14
95% of the provincial roads conditional grant budget allocation spent by 30 June 2017 {(Total expenditure divided by the total approved budget) x 100}
% of the budget spent 95%
TL15 Kilometres of road graded as per planned schedule of 16000 kilometres per year by 30 June 2017
Number of kilometres graded 16 000
TL16 Re-gravel 57.11 kilometres of roads by 30 June 2017
Number of kilometres of road re-gravelled 57.11
TL17 Upgrade 10.26 kilometres of roads from gravel to bitumen surface by 30 June 2017
Number of kilometres of road upgraded from gravel to bitumen
10.26
TL18 Reseal 31.4 kilometres of surfaced roads by 30 June 2017
Number of kilometres of road resealed 31.4
TL19 Rehabilitate 2 kilometres of existing roads by 30 June 2017
Number of kilometres rehabilitated 2
TL20 Complete 3 road concrete structures by 30 June 2017
Number of concrete structures completed 3
TL21
Comply 100% with water quality parameters as per SANS 241 physical and micro parameters for West Coast Bulk Water Supply during the 2016/17 financial year
% compliance with the water quality parameters
100%
TL22
Limit average % water loss for last 12 months to less than 10% {(Number of Kilolitres Water Purchased or Purified - Number of Kilolitres Water Sold) / Number of Kilolitres Water Purchased or Purified × 100}
% average water loss for last 12 months {(Number of Kilolitres Water Purchased or Purified - Number of Kilolitres Water Sold) / Number of Kilolitres Water Purchased or Purified × 100}
10%
TL23 95% of the water capital budget spent by 30 June 2017 {(Actual expenditure divided by the total approved budget)x100}
% of budget spent 95%
Table 9.: Service delivery priorities 2016/17: Providing essential Bulk services to the District

Annual Report 2015/2016 230
1.2.5 TO PURSUE ECONOMIC GROWTH AND FACILITATION OF JOB OPPORTUNITIES
Ref KPI Unit of Measurement Annual Target
TL2 Create full time equivalent (FTE's) through expenditure with the EPWP job creation by 30 June 2017
Number of full time equivalent (FTE's) created by 30 June 2017
30
TL3 Create temporary job opportunities with man days paid through capital projects by 30 June 2017
Number of man days paid 1 000
TL32 Host 8 workshops to promote skills development and support the Tourism SMME business sector by 30 June 2017
Number of workshops hosted 8
TL33 Carry out 24 tourism promotional activities in the print and other media by 30 June 2017
Number of activities 24
TL34
Assist 12 Tourism BEE entrepreneurs with starting and growing businesses e.g. research, business plans and skills development by 30 June 2017
Number of tourism BEE entrepreneurs assisted
12
Table 10.: Service delivery priorities 2016/17: To pursue Economic Growth and facilitation of job opportunities

Annual Report 2015/2016 231
VOLUME II – ANNUAL FINANCIAL STATEMENTS