annual report 2015 - pakomanpakoman.com/.../3712018_345169annual_report_2015.pdf · annual report...
TRANSCRIPT

ANNUAL REPORT 2015
PAK OMAN INVESTMENT COMPANY LIMITED

Board and Sub Committees
Board of Directors
H.E. Yahya Bin Said Bin Abdullah Al‐Jabri Chairman
Mr. Bahauddin Khan Managing Director & Chief Executive Officer
Mr. Hamed Sloom Mubarak Al Athobi Director
Mr. Muhammad Zubair Motiwala Director
Mr. Mustafa Bin Ali Sulaiman Director
Mr. Awais Manzur Sumra Director
Audit Committee
Mr. Hamed Sloom Mubarak Al Athobi Chairman
Mr. Muhammad Zubair Motiwala Member
Mr. Mustafa Bin Ali Sulaiman Member
Mr. Awais Manzur Sumra Member
Executive Committee
H.E. Yahya Bin Said Bin Abdullah Al‐Jabri Chairman
Mr. Bahauddin Khan Member
Mr. Muhammad Zubair Motiwala Member
Mr. Awais Manzur Sumra Member
Mr. Mustafa Bin Ali Sulaiman Member
Remuneration & Compensation
Committee
Mr. Muhammad Zubair Motiwala Chairman
Mr. Hamed Sloom Mubarak Al Athobi Member
Mr. Bahauddin Khan Member
Mr. Mustafa Bin Ali Sulaiman Member

Chairman’s Review I am pleased to report that your Company delivered another set of good results. Our performance has shown that we are in the right markets, with the right strategy to deliver consistent value for our shareholders.
o Alhamdulillah, your Company has recorded a profit after tax of Rs 602 million (US$ 5.8 million) compared to a profit after tax of Rs 384 million (US$ 3.7 million) in 2014 in a challenging environment. As at December 31, 2015, Company’s total assets stood at Rs 27 billion (US$ 259.6 million).
o It continued to focused on its core business of lending
o The Company maintained its Credit Rating of AA+ and Corporate Governance Rating of CGR 9 by JCR-VIS Credit Rating Company
Overview of Operations
Corporate Banking The revival of growth in economy that started in 2013-14 has accelerated in 2014-15 and has resulted in Gross Domestic Product (GDP) growth of 4.24% which accelerated from 4.03%. Major successes include increase in economic growth, low inflation, rise in foreign exchange buffers, growth in remittances and proceeds from privatization. Other positives for the economy included the decrease in the policy rate to 6%, improvement in country’s rating by international rating agencies, historical agreement with the Chinese Government on China Pak Economic Corridor (CPEC), successfully reviews with IMF, issuance of Ijara Sukuk Bond after a period of 9 years and decline in unemployment rate from 6.2% to 6.0%. However, despite all these positives, the challenge of energy shortage remains. The growth in FY2015 was led by the Services sector as growth in manufacturing slowed. Industrial growth was affected by a slowdown in Large-Scale Manufacturing to 3.3% owing to continued power shortages and weaker external demand. The resilience of small-scale manufacturing and construction sustained industrial growth at 3.6%. Agriculture growth remained modest at 2.9%. Private fixed investment slipped to equal 9.7% of Gross Domestic Product (GDP) from 10% a year earlier because of continuing energy constraints.
In 2015, Corporate Banking Department continued its approach of booking select quality customers in key growth areas. This was successfully achieved with

advances of Rs 4.8 billion made during 2015 thereby maintaining its portfolio as largest amongst the DFIs.
Major advances during the year were made to Food & Beverages, Finance, Oil & Gas Marketing and Textile sectors. While Textile continued to remain the dominant sector of the portfolio, comprising 16.03% of the total loan portfolio; Finance, Power and Sugar sectors followed with exposures of 15.13%, 11.34% and 10.66% of the overall portfolio respectively.
In 2015, medium term finance constituted the largest share of the portfolio with long term finance in close pursuit.
Focus on recoveries continued to pay dividends as the Company was able to affect reversals of Rs 95 million during the year. In the process, ten flagged (watch list) accounts were also fully settled as the company continued to closely monitor such accounts. One litigation account was also in final stage of settlement / negotiations.
A brief snapshot of Pak Oman’s Corporate Banking portfolio mix is as follows:

Investment Banking In 2015, Pak Oman appointed to act as Advisor & Arranger to Transworld Associated (Pvt.) Ltd. for raising Rs 900 million long term finance facility for partly financing its share in SEA-ME-WE 5 - a submarine fibre optic cable system and successfully closed the Rs 1,000 million Privately Placed TFC issue of Pak Libya Holding Company (Pvt.) Ltd. as Advisor. It also underwrote ordinary shares of Amreli Steels Ltd., Al Shaheer Corporation Ltd. and The Searle Company Ltd. In addition, Pak Oman is also acting as Trustee to various TFC/ sukuk issues. Treasury Treasury department continued to play an important role in generating healthy profits for the company. It not only managed the liquidity requirements of the company but also took advantage of the decline in policy rate of 350 basis points. The treasury book was aligned in such a manner that the department not only booked a capital gain of approximately Rs 457 million on Government and corporate debt instruments but also earned net interest income of Rs 248 million. Another significant achievement was securing of low cost funds from Islamic Banks which reduced the company's reliance on high cost deposits. Company’s corporate sales desk is also very active and trade government and corporate debt securities with its corporate clients. The corporate sales team also provides investment advisory services to its client. Pak Oman was reappointed as Primary Dealer by State Bank of Pakistan; acknowledging the contribution of Pak Oman, in the development of secondary market of Government securities. Treasury department is well aligned to capitalize on stable interest rate outlook in 2016 via its money market and corporate sales desk. Risk Management The Company’s constantly endeavours to follow the best practices for risk management framework resulting in stringent and robust risk management policies and procedures. This is further reflected in a low NPL to assets ratio. It is compliant with State Bank of Pakistan requirements for implementation of BASEL Accords and its Capital Adequacy Ratio is well above the stipulated requirement, hence giving it ample cushion to cover any unforeseen events.

Support Operations Finance, Information Technology, Human Resources and Administration played their role in supporting core operations of the Company. Information Technology Department placed special emphasis on the re-development of existing application systems in order to bring necessary improvements. The company’s IT infrastructure was upgraded in order to improve system availability and performance. Human Resources on the other hand worked on managing turnover rate and facilitated training and development of all employees. Management Committees To implement prudent practices, foster joint decision making and bring into play participation from all areas, the following Management Committees functioned actively during the year: (i) Credit Committee (ii) Assets & Liabilities Committee (ALCO) (iii) Risk Management Committee (iv) Coordination Committee (v) Purchase & Works Committee (vi) Friends of Life Committee (vii) Information Technology Committee (viii)Capital Market Review Committee (CMRC) (ix) Performance Evaluation Committee Contribution to Social Responsibility As a responsible corporate citizen, it has been the vision of your Company to empower the community through socio-economic development of underprivileged and weaker sections. Pak Oman acknowledges its responsibility in a manner that its activities influence its customers, employees and stake holders. Your Company strives to proactively encourage community growth and development, thereby contributing in building a sustainable future. To help the weaker section of the society in their efforts of poverty alleviation, your Company has established a country wide Microfinance bank in association with the Government of the Sultanate of Oman. Pak Oman Investment Company Limited has also an affiliated concern called Friends of Life (FOL), which aims to promote social welfare, through active participation in forums pertaining to health and education of underprivileged.

Some of Pak Oman's ongoing CSR initiatives are as follows: Education for Underprivileged The company financially supported The Citizens Foundation. The Citizens Foundation is currently running 730 schools nationwide for the education of less privileged. Reached over 102,000 children across Pakistan the Citizens Foundation provides quality education. Healthcare POICL partners with various institutions involved in health sector to improve the health status of the society we operate in. Darul Sukun We provide monthly financial assistance to Darul Sukun, a home for mentally challenged children. Located in Karachi, it is run almost exclusively on donations and charity. Burns Centre, Civil Hospital Karachi
To support Civil Hospital Karachi’s role in provision of free of cost surgical and medical health relief to the underprivileged, POICL supports its Burns Centre, the first of its kind in Pakistan, operating according to International medical standards. It is run by a Committee “Friends of Burns Centre”. The Centre manages to cater to approximately 20,000 patients per year, with an average of 500-600 in-patients from all over Pakistan with severe burns, completely free of cost. POICL sponsors the monthly salary of a professionally trained, highly qualified burns doctor for the Centre. The company is also associated with Al-Mehrab Tibbi Imdad (AMTI), an organization that treats terminal under privileged patients absolutely free of cost. POICL provides medicinal aid to AMTI on a quarterly basis. In addition, Pak Oman also extended financial support to Patients’ Aid Foundation of Jinnah Postgraduate Medical Centre. The foundation, to date, has completed nine large–scale projects at Jinnah Hospital, Karachi including the installation of CyberKnife- robotic radio surgery for the treatment of cancerous tumours and offers free of cost treatment to the poor and needy patients.

2016 and Beyond We remain cautious on the economic outlook in view of the energy shortage and the law and order situation in Pakistan. Further, going forward the financial sector is likely to face greater challenges and pressure due to stiff competition and increasing complexities in the financial market. However, monetary policies remained supportive of growth. Development under the China Pakistan Economic Corridor (CPEC) is expected to be a boost for Pakistan’s economy. We believe that we are well positioned to capitalize on growth opportunities in the coming year to the benefit of our shareholders, employees and customers. The process to increase the equity in Pak Oman Asset Management Company Limited (POAMCL) to meet SECP requirement has been completed. However, your Board has now decided for injecting further equity into POAMCL to ensure successful operations through its restructuring and re-organisation. Your company has taken certain steps to improve the performance of Pak Oman Microfinance Bank Limited, which are expected to result in better performance thus increasing the value of shareholders. Acknowledgement On behalf of the Board of Directors of the Company and myself, I take this opportunity to acknowledge the dedicated services of the employees of the Company. I feel delighted to say that we take great pride in our team, who are motivated and much focused towards a collective goal. It is a pleasure to see such diversification within the organisation. We are an equal opportunity employer and encourage people from all walks of life to apply. Pak Oman’s key strength remains its highly qualified and forward looking management, which under the able guidance of the Managing Director has created and sustained a leading position in an increasingly competitive environment. I would like to express my gratitude to our stakeholders, the respective Governments of Sultanate of Oman and the Islamic Republic of Pakistan, and customers for their valuable support and cooperation & the regulatory bodies for their guidance. Yahya Bin Said Bin Abdullah Al-Jabri Chairman Lahore: February 20, 2016

DIRECTORS’ REPORT On behalf of the Board of Directors, I am pleased to present the Fourteenth Annual Report and Financial Statements of your Company, along with the Consolidated Audited Financial Statements for the year ended December 31, 2015, together with Auditors’ Report thereon. Economy Pakistan‘s macroeconomic situation is gradually improving. Country‘s fiscal accounts has further improved after disbursement made by IMF under its extended fund facility. Current account deficit has narrowed due to declining oil price which has substantially reduced the oil import payments, robust workers’ remittances and the realization of Coalition Support Fund. Large-scale Manufacturing also increased to 4.4 percent during July – November 2015 as compared to 3.1 percent in the same period of 2014. Further boost is expected from construction activities as per planned development spending monetary easing and improving energy supply at the back of recent LNG imports. A marginal increase in inflation in the coming months is expected when a high base effect kicks in. However, the average inflation would remain below the 2016 target of 6 percent. Considering the macroeconomic variables and growing foreign exchange reserves, SBP has reduced its policy rate to 6%. Although private sector uptake remains constrained due to energy issues, it is expected to pick up in future. Plans to build an economic corridor linking Kashgar in the People’s Republic of China to the Pakistani port of Gwadar were announced in April, and this megaproject would significantly boost private investments and growth in the coming years. However, broadening of tax base, reducing the energy crises, increasing FDI, restructuring / privatization of State Owned Enterprises and divert funds to more productive developments will remain major challenges for 2016. Operational Review Alhamdulillah, growth of your Company’s core business has been strong. During the year, SBP reduced its policy rate to 6% showing a reduction of 350 basis points since January 2015, which resulted in a decline in

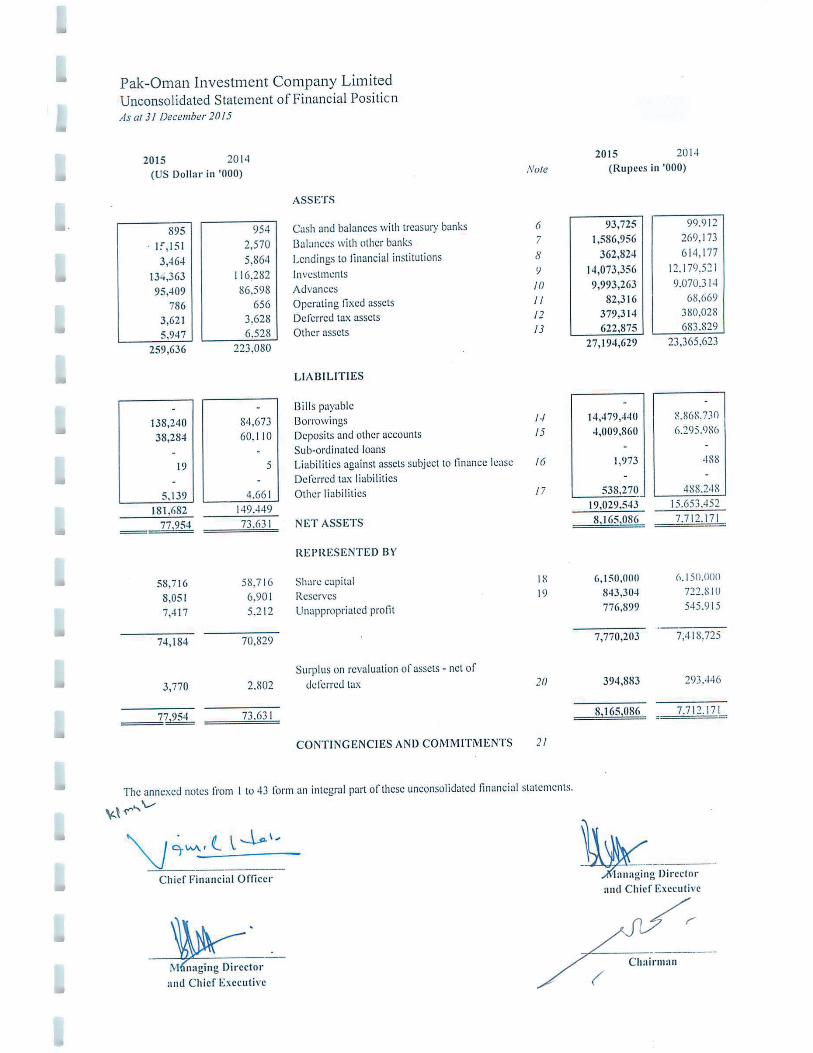
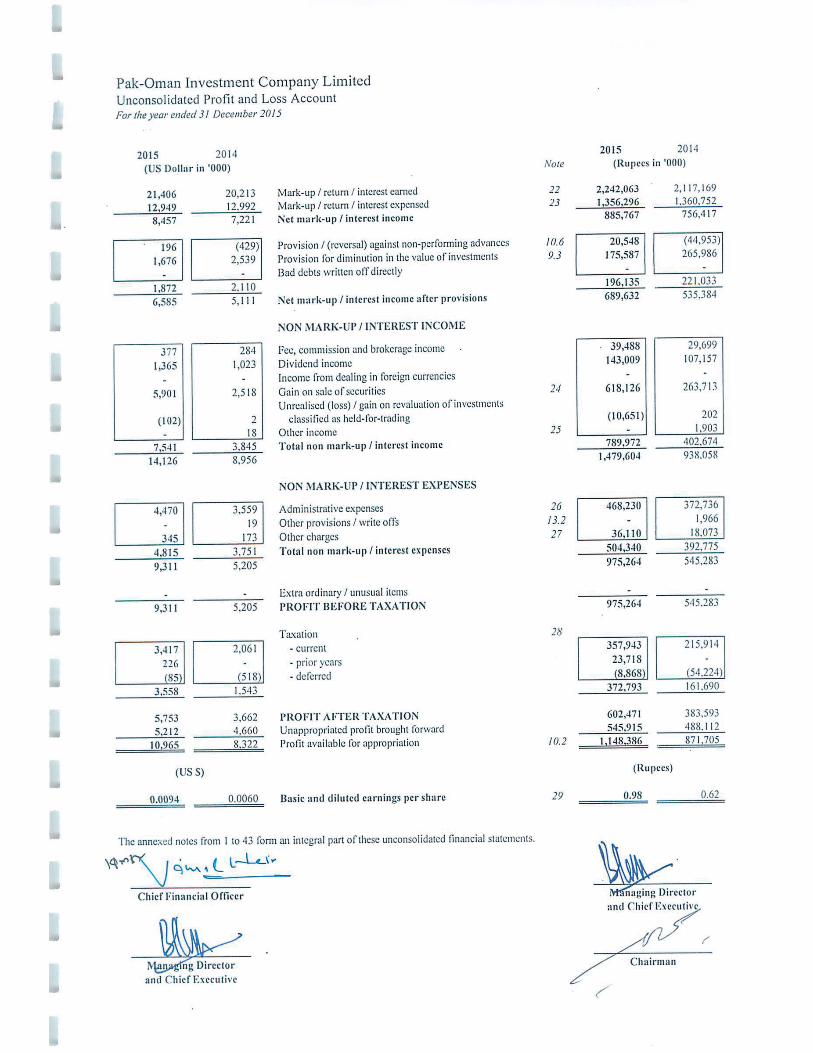
average spreads. In this back drop, Pak Oman has recorded a profit before tax of Rs 975 million (US$ 9.3 million) as compared to a profit before tax of Rs 545 million (US$ 5.2 million) in 2014. Your company also took advantage of decreasing yield on Government securities by booking gains of Rs 438 million on the sale of such Government securities in the secondary market. In 2015, total revenue from operations increased by 20% and recorded at Rs 3,031million (US$ 28.9 million). After accounting for mark-up and interest expense of Rs 1,356 million (US$ 12.9 million) and total administrative and other expenses of Rs 504 million (US$ 4.8 million), your company achieved a profit before provisions of Rs 1,171 million (US$ 11.2 million). However, during the year total provisions on loans / investments- net were of Rs 196 million (US$ 1.9 million). As a result the company achieved profit before tax of Rs 975 million (US$ 9.3 million) [2014: Rs 545 million (US$ 5.2 million)]. However, the company has booked a one time additional tax expense of Rs 87 million (US$ 0.8 million) has been recorded which included super tax of Rs 24 million (US$ 0.2 million) enforced through finance act 2015 and reversal of Rs 63 million (US$ 0.6 million) in deferred tax assets due to a reduction of 4% in corporate tax rates. Therefore, after accounting for the tax liability profit after tax was Rs 602 million (US$ 5.8 million) [2014: Rs 384 million (US$ 3.7 million)]. During 2015, Pak Oman Investment Company Limited continued to build a well-diversified asset portfolio, comprising of loans and leases, corporate bonds and investment in government securities. As at December 31, 2015, Company’s Total Assets stood at Rs 27 billion (US$ 259.6 million). Financial Results
For the Year ended 2015 Rs million US$ million Total Assets 27,195 259.6
Advances 9,993 95.4
Investments 14,073 134.4
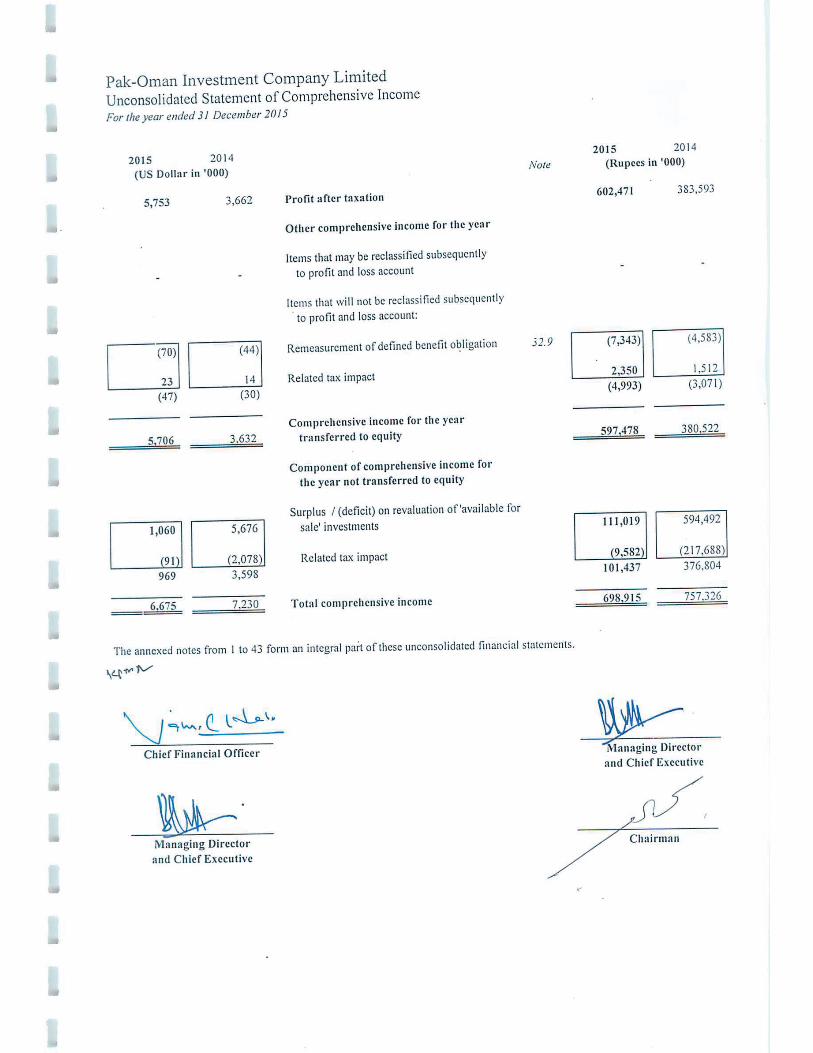
Profit after taxation 602 5.8
Earning per Share (basic &
diluted) of Rs 10/- each Rs 0.98 US$ 0.0094

Appropriations
The Board has recommended following appropriations:
For the Year ended 2015 Rs million US$ million To Statutory Reserve 120.5 1.15
Cash Dividend @ Rs 0.60 per share 369 3.52
Credit Rating Your Company has been assigned a medium to long-term rating of AA+ (Double A Plus) and short-term rating of A1+ (A one Plus) by JCR-VIS Credit Rating Company Limited. This rating indicates a superior quality of credit and strength of protection factors. The assigned rating is primarily driven by development of a sustainable profit base for the Company and its relative position amongst peer group institutions. Corporate Governance Rating Your Company has also been assigned a corporate governance rating of CGR-9 by JCR-VIS Credit Rating Company Limited. The assigned rating denotes a very high level of corporate governance and is the result of adoption of best practices within the Company. Primary Dealer of State Bank of Pakistan Acknowledging Pak Oman’s role in the development of the primary and secondary markets for Government Bonds, the State Bank of Pakistan has reappointed Pak Oman as a Primary Dealer for the financial year 2015-2016.
Pak Oman Microfinance Bank
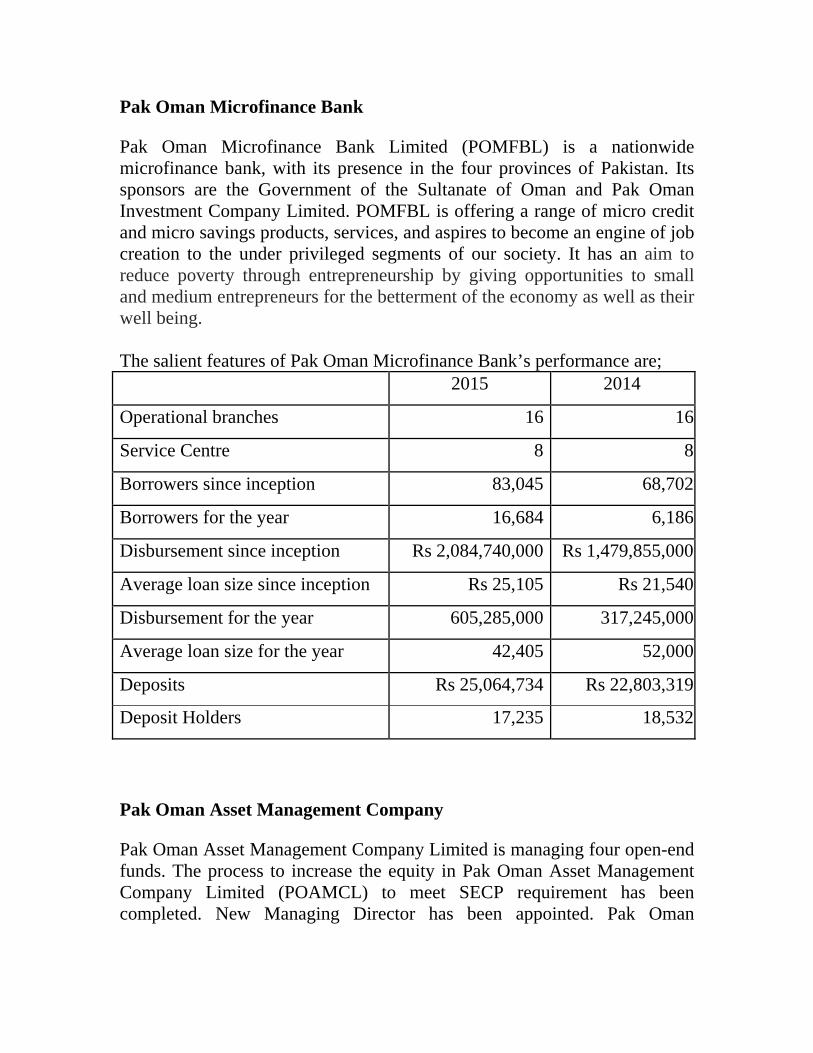
Pak Oman Microfinance Bank Limited (POMFBL) is a nationwide microfinance bank, with its presence in the four provinces of Pakistan. Its sponsors are the Government of the Sultanate of Oman and Pak Oman Investment Company Limited. POMFBL is offering a range of micro credit and micro savings products, services, and aspires to become an engine of job creation to the under privileged segments of our society. It has an aim to reduce poverty through entrepreneurship by giving opportunities to small and medium entrepreneurs for the betterment of the economy as well as their well being. The salient features of Pak Oman Microfinance Bank’s performance are; 2015 2014
Operational branches 16 16
Service Centre 8 8
Borrowers since inception 83,045 68,702
Borrowers for the year 16,684 6,186
Disbursement since inception Rs 2,084,740,000 Rs 1,479,855,000
Average loan size since inception Rs 25,105 Rs 21,540
Disbursement for the year 605,285,000 317,245,000
Average loan size for the year 42,405 52,000
Deposits Rs 25,064,734 Rs 22,803,319
Deposit Holders 17,235 18,532
Pak Oman Asset Management Company
Pak Oman Asset Management Company Limited is managing four open-end funds. The process to increase the equity in Pak Oman Asset Management Company Limited (POAMCL) to meet SECP requirement has been completed. New Managing Director has been appointed. Pak Oman

Investment Company Limited has now decided for injecting further equity into POAMCL to ensure successful operations through its restructuring and re-organisation. Risk Management Framework The responsibility of risk management stems down from the Board of Directors to the management for operational assessment / mitigation. Pak Oman’s risk management framework has stringent but adaptable parameters to keep up with the changing risk requirement by being innovative and proactive throughout the company’s operations. The Company is fully compliant with SBP’s guidelines on BASEL and risk management. Internal Control The Directors endorsed the management’s evaluation related to internal control over financial reporting and also endorsed the statement made by management relating to internal controls. Corporate Governance & Financial Reporting The Directors declare that:
These financial statements, prepared by the Management, present
fairly its state of affairs, the result of its operations, cash flows, and changes in equity.
Proper books of account of the Company have been maintained.
Appropriate accounting policies have been consistently applied in the
preparation of financial statements and accounting estimates are based on reasonable and prudent judgment.
International Financial Reporting Standards, as applicable in
Pakistan, have been followed in preparation of financial statements and any departure from them has been appropriately disclosed.

The system of internal control is sound in design and has been effectively implemented and monitored.
There are no doubts regarding the Company’s ability to continue as a
going concern.
Two directors of the Company have completed the “Directors Training Certification”. One Director is exempted from said certification. Other directors have attended “Directors’ Orientation Workshop”.
There has been no material departure from the best practices of
corporate governance. Number of Board and sub-committee meetings held and attendance by each Director
Name Board of Directors
Meetings Held 5
Board’s Executive
Committee
Meetings Held 5
Board’s Audit
Committee
Meetings Held 4
Board’s Remuneration &
Compensation Committee
Meeting Held 2
H.E. Yahya Bin Said Bin Abdullah Al-Jabri
5 5 * *
Mr. M. Zubair Motiwala
4 4 3 1
Mr. Mustafa Bin Ali Sulaiman
5 5 4 2
Mr. Hamed Sloom Mubarak Al Athobi
5 * 4 2
Mr. Yusuf Khan 2 2 2 * Mr. Awais Manzur Sumra
3 2 1 *
Mr. Bahauddin Khan 2 2 * ** Mr. Agha Ahmed Shah 3 3 * 1
* Not member. ** Not member on the day of meeting. Leave of absence was granted to Directors who could not attend the Board Meeting. There was a change in Board of Directors, during the year Mr. Awais Manzur Sumra joined as a nominee of the Government of Pakistan in place
of Mr. Yusuf Khan. Further, w.e.f. October 01, 2015, Mr. Bahauddin Khan joined as Managing Director & Chief Executive Officer of the Company in place of Mr. Agha Ahmed Shah. Statement of Investments of Provident & Gratuity funds Investments of Provident & Gratuity funds as at December 31, 2015 according to their un-audited financial statements were Rs 157.5 million and Rs 106.6 million respectively. Auditors The present Auditors, M/s KPMG Taseer Hadi & Co. Chartered Accountants retire and being eligible, offer themselves for re-appointment. The Board of Directors, on the recommendation of the Audit Committee, recommended the appointment of M/s KPMG Taseer Hadi & Co. Chartered Accountants, as auditors of the Company for the year ending December 31, 2016 for consideration and approval at the Annual General Meeting. Pattern of Shareholding Government of Pakistan: Ministry of Finance 49.99% Secretary - Economic Affairs Division 0.01% Sultanate of Oman: Ministry of Finance 49.99% Ministry of Commerce & Industry 0.01% Acknowledgements Sponsors The Board is grateful to the respective Governments of Sultanate of Oman and the Islamic Republic of Pakistan for their commitment and support to the Company. Regulators The Board also takes this opportunity to express its gratitude to the State Bank of Pakistan for its continued guidance and support.

Management The Board acknowledges the staff for their exceptional efforts in positioning the Company as a strong player in the financial sector. This is the result of collective team work, commitment and dedication towards achieving the Company’s objectives. Bahauddin Khan Managing Director & Chief Executive Lahore: February 20, 2016

Pak Oman Investment Company LimitedSix Years Financial Summary
Rupees in '000
2015 2014 2013 2012 2011 2010December 31
STATEMENT OF FINANCIAL POSITION
ASSETS
Cash and balances with treasury and other banks 1,680,681 369,085 284,645 260,159 275,705 731,123 Lendings to financial institutions 362,824 614,177 1,206,521 833,119 1,321,745 2,454,610 Investments 14,073,356 12,179,521 7,629,301 10,229,027 10,589,968 9,143,686 Advances 9,993,263 9,070,314 7,493,690 6,347,059 5,767,026 5,947,929 Operating fixed assets 82,316 68,669 51,086 58,725 63,811 65,082 Other assets 1,002,189 1,063,857 1,062,467 849,852 798,082 832,559 Total assets 27,194,629 23,365,623 17,727,710 18,577,941 18,816,337 19,174,989
LIABILITIES
Borrowings 14,479,440 8,868,730 5,721,831 6,546,367 6,648,716 6,145,349 Deposits and other accounts 4,009,860 6,295,986 4,433,848 4,351,000 4,695,693 5,561,165 Other liabilities 540,243 488,736 371,186 519,504 626,355 731,585 Total Liabilities 19,029,543 15,653,452 10,526,865 11,416,871 11,970,764 12,438,099
NET ASSETS 8,165,086 7,712,171 7,200,845 7,161,070 6,845,573 6,736,890
REPRESENTED BY
Share capital 6,150,000 6,150,000 6,150,000 6,150,000 6,150,000 6,150,000 Reserves & Unappropriated profit 1,620,203 1,268,725 1,134,203 1,008,022 794,918 692,896
7,770,203 7,418,725 7,284,203 7,158,022 6,944,918 6,842,896 Surplus / (deficit) on revaluation of assets - net of deferred tax 394,883 293,446 (83,358) 3,048 (99,345) (106,006)
8,165,086 7,712,171 7,200,845 7,161,070 6,845,573 6,736,890
PROFITABILITY
Mark-up/Return/Interest earned 2,242,063 2,117,169 1,564,799 2,048,783 2,264,147 2,224,130 Mark-up/Return/Interest expensed (1,356,296) (1,360,752) (892,690) (1,304,300) (1,513,542) (1,462,002) Net mark-up/interest income 885,767 756,417 672,109 744,483 750,605 762,128 Fee, commission and brokerage income 39,488 29,699 9,900 13,969 11,185 22,013 Capital gain & dividend income 750,484 371,072 270,560 331,868 119,437 181,968 Other income - 1,903 1,039 1,978 2,355 2,332 Total non markup/interest income 789,972 402,674 281,499 347,815 132,977 206,313 Gross Income 1,675,739 1,159,091 953,608 1,092,298 883,582 968,441 Administrative expenses and other charges (504,340) (392,775) (339,705) (311,967) (269,204) (248,755) Profit before provisions 1,171,399 766,316 613,903 780,331 614,378 719,686 Provisions (196,135) (221,033) (126,139) (174,808) (35,085) (337,929) Profit before taxation 975,264 545,283 487,764 605,523 579,293 381,757 Taxation (372,793) (161,690) (112,224) (177,169) (231,271) (103,781) Profit after taxation 602,471 383,593 375,540 428,354 348,022 277,976
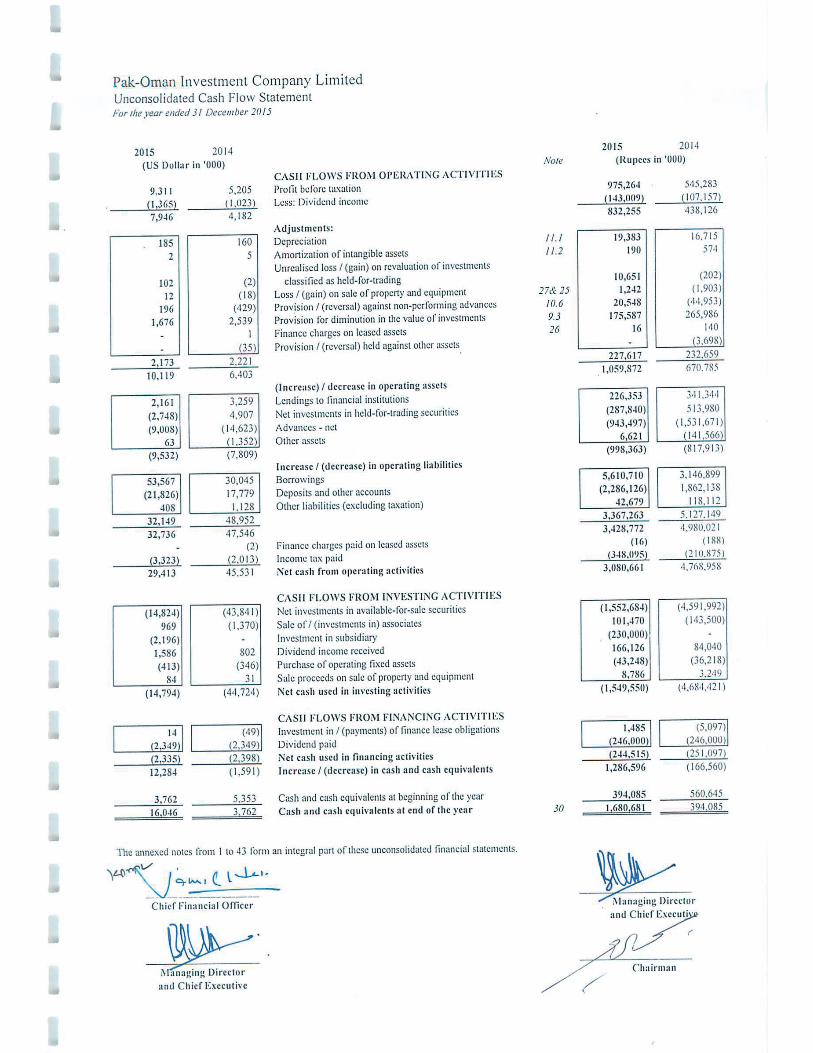
CASH FLOW STATEMENT - SUMMARYCash flow from operating activities 3,080,661 4,768,958 (1,839,497) 2,533,492 (2,451,484) 1,810,305 Cash flow from investing activities (1,549,550) (4,684,421) 2,390,954 (2,324,966) 2,251,437 (1,733,597) Cash flow from financing activities (244,515) (251,097) (250,971) (224,072) (255,371) (9,915) Cash and cash equivalents at the beginning of the year 394,085 560,645 260,159 275,705 731,123 664,330 * Cash and cash equivalents at the end of the year 1,680,681 394,085 560,645 260,159 275,705 731,123
Financial RatiosReturn on Equity 7.9% 5.2% 5.2% 6.1% 5.0% 4.1%
Return on Assets 2.4% 1.9% 2.1% 2.3% 1.8% 1.4%
Profit before tax ratio 58.2% 47.0% 51.1% 55.4% 65.6% 39.4%
Gross spread ratio 39.5% 35.7% 43.0% 36.3% 33.2% 34.3%
Total Assets to shareholders' fund 3.33 3.03 2.46 2.59 2.75 2.85
Weighted average cost of debt 8.06% 10.75% 8.48% 11.73% 13.13% 11.62%
Capital adequacy ratio (CAR) 35.62% 31.17% 36.60% 41.45% 41.72% 37.48%
Share InformationCash dividend per share 6% 4% 4% 4% 3.5% 4%
Basic and diluted earnings per share 0.98 0.62 0.61 0.70 0.57 0.45
Breakup value per shares - Without surplus on revaluation of assets 12.63 12.06 11.84 11.64 11.29 11.13
Breakup value per shares - With surplus on revaluation of assets 13.28 12.54 11.71 11.64 11.13 10.95
* Cash and cash equivalents comprise cash and balances with treasury banks, balances with other banks and placements with financial institutions having maturities of three (3) months or less.

Statement of Compliance with the Applicable Clauses of Public Sector Companies (Corporate Governance) Rules, 2013 and Code of Corporate Governance
For the Year Ended December 31, 2015
This statement is being presented to comply with the applicable clauses of Public Sector Companies (Corporate Governance) Rules, 2013 (hereinafter called "the Rules") issued for the purpose of establishing a framework of good governance and the clauses of Code of Corporate Governance (CCG) issued by the Securities and Exchange Commission of Pakistan (SECP). The SECP through its letter dated February 10, 2014 has granted the exemption to the Company from applicability of Rules subject to the condition that the training of directors, performance evaluation of the Board and audit of the financial statement of the Company through QCR rated firms shall be ensured.
I. The Company has complied with the applicable clauses of the Rules in the following manner:
(a) The Board has carried out the performance evaluation of its members, including the Chairman and the Chief Executive, on the basis of ‘Board Self Evaluation’ (BSE) process. The Self Evaluation of the Members of the Board and its Sub-Committees was conducted under the supervision of Pakistan Institute of Corporate Governance (PICG). The Board has also monitored and assessed the performance of senior management on annual basis.
(b) All the board members underwent an orientation course arranged by the company. The purpose of the ‘Director Orientation Workshop (DOW) conducted through Pakistan Institute of the Corporate Governance (PICG) was to appraise the Board regarding the material developments and information as specified in the Rules. Currently two directors have completed the Director’s Training Certification under the Directors Training Program as prescribed by SECP and one director is exempt from the said certification. The Board is encouraging other members to get the Directors Training Certification as soon as possible.
(c) The statutory audit of the Company has been carried out by the audit firm which has been given the satisfactory rating under the ‘Quality Control Review’ (QCR) Rating Program of the Institute of Chartered Accountant of Pakistan (ICAP).
II. The Company as good governance practice has also complied with CCG and other relevant clauses of Rules in the following manner: 1. The Board of Directors (“the Board”) of the Company comprises of 5 non-executive
directors and one executive director. All the directors are nominees of the respective joint venture partner governments under requirements of the Joint Venture Agreement (JVA) between them. At present the Board includes:
Category Names Executive Director Mr. Bahauddin Khan, MD & CEO Non-Executive Directors
H.E. Yahya Bin Said Bin Abdullah Al-Jabri Mr. M. Zubair Motiwala Mr. Mustafa Bin Ali Sulaiman Mr. Hamed Sloom Mubarak Al Athobi Mr. Awais Manzur Sumra
2. During the year two casual vacancies were occurred on the Board and were filled up immediately.
3. All the resident directors of the Company are registered as tax payers and none of them has defaulted in payment of any loan to a banking Company, a DFI or an NBFI or, being a member of a Stock Exchange has been declared as a defaulter by that Stock Exchange.
4. The directors have confirmed that none of them is serving as a director on more than seven listed companies, including this company (excluding the listed subsidiaries of listed holding companies where applicable).
5. (a) The Company has prepared a "Statement of Ethics & Business Practices (“the Code of Conduct”) and has ensured that appropriate steps have been taken to disseminate it throughout the Company along with its supporting policies and procedures, including posting the same on the Company's website (www.pakoman.com).
(b) The Board has set in place adequate systems and controls for the identification and redressal of grievances arising from unethical practices.
6. The Board has established a system of sound internal control, to ensure compliance with the fundamental principles of probity and propriety; objectivity, integrity and honesty; and relationship with the stakeholders, in the manner prescribed in the Rules.
7. The Board has developed and enforced appropriate policy related matters on conflict of interest, the clauses of which are contained in relevant policies to lay down circumstances or considerations when person may be deemed to have actual or potential conflict of interests, and the procedures for disclosing such interest.
8. The Board has developed and implemented policy related matters on anti-corruption, the clause of which are contained in the relevant policies to minimize actual or perceived corruption in the Company.
9. The Board has ensured equality of opportunity by establishing open and fair procedures for making appointments and for determining terms and conditions of service.

10. The Board has developed a vision or mission statement, corporate strategy and significant
policies of the Company. A complete record of particulars of significant policies along with the dates on which they were approved or amended has been maintained.
11. The meetings of the Board of Directors were presided over by the Chairman and, in his absence, by a Director elected by the Board for this purpose; and
(a) The Board has met at least four times during the year.
(b) Written notices of the Board meetings, along with agenda and working papers, were circulated at least seven days before the meetings.
(c) The minutes of the meetings were appropriately recorded and circulated.
12. The Board has reviewed and approved the related party transactions placed before it after recommendations of the Audit Committee. A party wise record of transactions entered into with the related parties during the year has been maintained.
13. The Board has approved the profit and loss account for, and Statement of Financial Position as at the end of, the first, second and third quarter of the year as well as the financial year end, and has placed the annual financial statements on the company's website. Monthly accounts were also prepared and circulated amongst the board members.
14. The Board has formed the following Board Sub- Committees:
Committee Name of Chairman / Members Audit Committee
Mr. Hamed Sloom Mubarak Al Athobi - Chairman Mr. M. Zubair Motiwala – Member Mr. Mustafa Bin Ali Sulaiman – Member Mr. Awais Manzur Sumra – Member
Executive Committee
H.E. Yahya Bin Said Bin Abdullah Al-Jabri - Chairman Mr. Bahauddin Khan – Member Mr. M. Zubair Motiwala– Member Mr. Mustafa Bin Ali Sulaiman – Member Mr. Mr. Awais Manzur Sumra – Member
Remuneration & Compensation Committee
Mr. M. Zubair Motiwala - Chairman Mr. Bahauddin Khan – Member Mr. Mustafa Bin Ali Sulaiman – Member Mr. Hamed Sloom Mubarak Al Athobi – Member
15. The Board has approved appointment of Chief Financial Officer, Company Secretary and Head of Internal Audit, with their remuneration and terms and conditions of employment, and as per their prescribed qualifications.

16. The Directors' Report for this year has been prepared in compliance with the requirements of the CCG and Ordinance and fully describes the salient matters required to be disclosed.
17. The Directors, Chief Executive and Executives do not hold any interest in the shares of the Company.
18. A formal and transparent procedure for fixing the remuneration packages of Executive Director has been set in place.
19. The financial statements of the Company were duly endorsed by the Chief Executive and Chief Financial Officer, before approval of the Board.
20. The Audit Committee has met at least once every quarter of the financial year ended December 31, 2015. These meetings were held prior to the approval of interim results by the Board of Directors. The Chief Executive and Chairman of the Board are not members of the Audit Committee.
21. The Board has set up an effective internal audit function, which has an Audit Charter, duly approved by the Audit Committee, and which worked in accordance with the applicable standards.
22. The statutory auditors or the persons associated with them have not been appointed to provide other services except in accordance with the listing regulations and the auditors have confirmed that they have observed IFAC guidelines and all its partners are in compliance with International Federation of Accountants (IFAC) guidelines on Code of Ethics as adopted by the ICAP.
23. The Company has complied with all the corporate and financial reporting requirements of applicable clauses of the Rules and CCG.
24. All the powers of the Board have been duly exercised and decisions on material transactions, including appointment and determination of remuneration and terms and conditions of employment of the Chief Executive, other executive and non-executive directors have been taken by the Board.
Yahya Bin Said Bin Abdullah Al-Jabri Bahauddin Khan Chairman Managing Director & Chief Executive Officer Lahore: February 20, 2016

STATEMENT OF INTERNAL CONTROLS For the year ended December 31, 2015 REPORTING ON INTERNAL CONTROL SYSTEM It is the management’s responsibility to establish and maintain an adequate and effective system of internal control that would help to attain a professional and efficient working environment. The internal control system comprises of control procedures and control environment. The Management has taken steps to ensure that an efficient and effective internal control system is in place by identifying control objectives, reviewing pertinent policies / procedures and establishing relevant control procedures. All policies and procedures are reviewed on an ongoing basis and necessary amendments are made where needed. Alongside this, appropriate test of transactions, observation of control environment, sharing of findings on internal control systems and ensuring relevant follow up / corrective actions are also carried out. The Internal control system is designed to manage rather than eliminate the risk of failure to achieve business objectives, and can only provide reasonable and not absolute assurance against material misstatement or loss. EVALUATION OF EXISTING INTERNAL CONTROL SYSTEMS The Company has made an effort to ensure that an effective and efficient internal control system is in place and no compromise is made in implementing desired procedures and maintaining a suitable control environment in general. However it is an ongoing process that includes identification, evaluation and management of significant risks faced by the Company. The observations and weaknesses found and identified by the auditors, both internal and external, have been noted and necessary steps have been taken by Management to ensure elimination of these weaknesses. Management has given a timely and satisfactory response to the recommendations and suggestions made by the auditors. The observations have also been discussed at the Audit Committee and Board of Directors meetings. We assess that the internal control system and operations have improved over previous years in all business areas. Furthermore, due importance is given to the training needs of staff in order to ensure that their knowledge and skill levels are constantly enhanced and updated. Recognizing it to be an ongoing process, the management of Pak Oman Investment Company Limited (POICL) has adopted an internationally accepted Internal Control COSO Framework, in accordance with guidelines on Internal Controls from the State Bank of Pakistan. Through continuing review of policies and testing of internal controls Company ensure effectiveness over internal control over financial reporting. POICL has completed the seven stages of Internal Control Program as per these guidelines. Mohammad Jamal Nasir Syed Abdullah Jamal Ahmed Chief Financial Officer Chief Internal Auditor Lahore: February 20, 2016

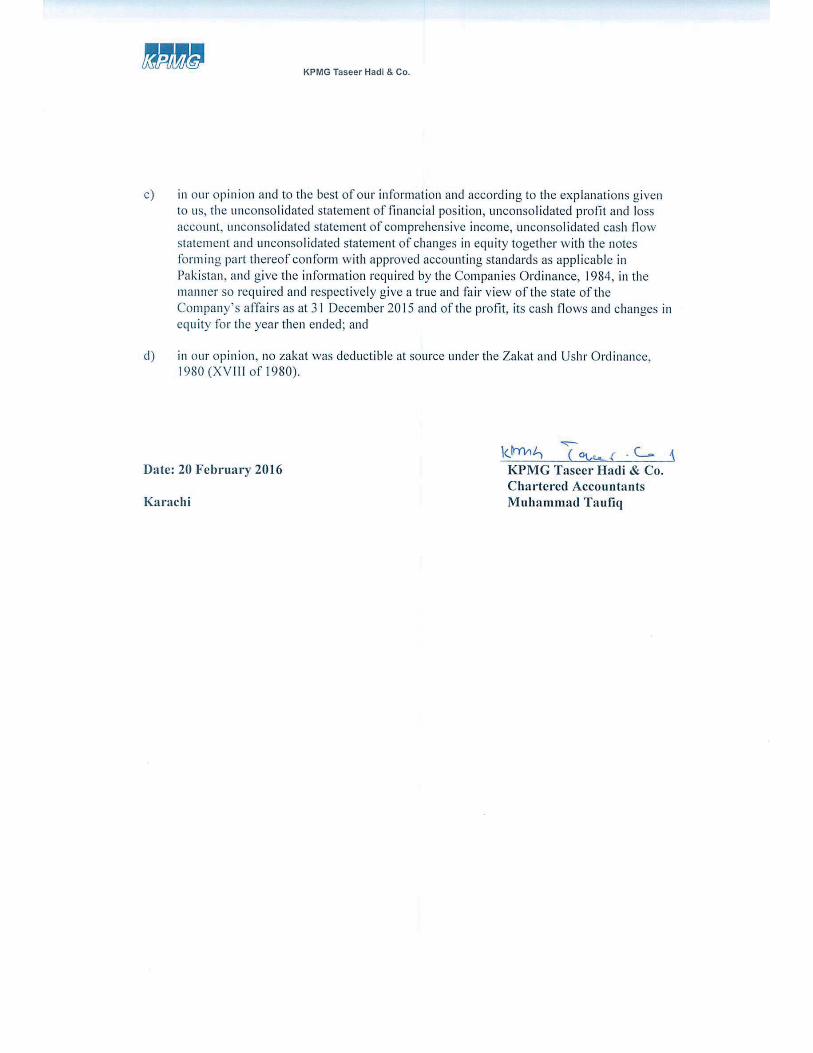
ABCD KPMG Taseer Hadi & Co. Chartered Accountants
Pak Oman Investment Company Limited
Unconsolidated Interim Financial Statements
For the year ended 31 December 2015


Pak-Oman Investment Company LimitedNotes to the Unconsolidated Financial Statements For the year ended 31 December 2015
1. LEGAL STATUS AND NATURE OF BUSINESS
2. BASIS OF PRESENTATION
2.1 Separate financial statements
2.2 US Dollar equivalent
2.3 Use of estimates and judgments
a) Provision against non-performing advances
b) Impairment of available-for-sale investments
c) Classification of investments
The investments which are not classified as 'held-for-trading' or 'held-to-maturity' are classified as "available-for-sale".
Pak-Oman Investment Company Limited (the Company) was incorporated as a private limited company on 23 July 2001. Subsequently, on 17 March 2004 the Company was converted into a public company. The Company is a joint venture between the Government of Pakistan and the Government of the Sultanate of Oman. The Company's objectives interalia include promotion of the economic growth of Pakistan and Oman through industrial development and agro-based industries on commercial basis and to carry on the business of finance and / or investment bank. The registered office of the Company is situated at 1st Floor, Block A, Finance and Trade Centre, Shahrah-e-Faisal, Karachi, Pakistan. The Company operates a branch at Lahore and other representative offices at Islamabad, Gwadar and Muscat. The Company is designated as a development financial institution (DFI) under the BPD Circular Letter No. 35 dated October 28, 2003 issued by the State Bank of Pakistan.
These unconsolidated financial statements are separate financial statements of the Company in which the investments in subsidiary and associates are stated at cost and have not been accounted for on the basis of reported results and net assets of the investees (equity method) which is done in the consolidated financial statements of the Company.
The US Dollar amounts shown in the statement of financial position, profit and loss account, statement of comprehensive income and cash flow statement are stated as additional information solely for the convenience of readers. For the purpose of conversion to US Dollars, the rate of Rs. 104.7410 to 1 US Dollar has been used for 2015 and 2014 as it was the prevalent rate as on 31 December 2015.
In classifying investments as "held-for-trading", the Company has determined securities which are acquired with the intention to trade by taking advantage of short-term market / interest rate movements and are to be sold within 90 days.
The preparation of financial statements in conformity with approved accounting standards requires the use of certain critical accounting estimates. It also requires management to exercise its judgment in the process of applying the Company’s accounting policies. The estimates / judgments and associated assumptions used in the preparation of the financial statements are based on historical experience and other factors, including expectations of future events that are believed to be reasonable under the circumstances. The key areas of estimate and judgments in relation to these financial statements are as follows:
The Company reviews its loan portfolio to assess amount of non-performing advances and determine provision required there against on quarterly basis. While assessing this requirement various factors including the past dues, delinquency in the account, financial position of the borrower, value of collateral held and other requirements of Prudential Regulations are considered.
In classifying investments as "held-to-maturity" the Company follows the guidance provided in SBP circulars on classifying non-derivative financial assets with fixed or determinable payments and fixed maturity. In making this judgment, the Company evaluates its intention and ability to hold such investments to maturity.
The Company considers that available-for-sale investments are impaired when there has been a significant or prolonged decline in the fair value below its cost. This determination of what is significant or prolonged requires judgment. In addition, impairment may be appropriate when there is evidence of deterioration in the financial health of the investee, industry and sector performance.

d) Income taxes
e) Fixed assets, depreciation and amortization
f) Employees' benefit plans
3. STATEMENT OF COMPLIANCE
4. BASIS OF MEASUREMENT
4.1
5. SUMMARY OF SIGNIFICANT ACCOUNTING POLICIES
The principal accounting policies applied in the preparation of these financial statements are stated below:
5.1 Standards, interpretations and amendments effective in current year
-
-
IFRS 8, 'Operating Segments' is effective for the Company's accounting period beginning on or after 1 January 2009. All DFIs in Pakistan are required to prepare their annual financial statements in line with the format prescribed under BSD Circular No. 4 dated 17 February 2006, 'Revised Forms of Annual Financial Statements', effective from the accounting year ended 31 December 2006. The management of the Company believes that as the SBP has defined the segment categorisation in the above mentioned circular, the SBP requirements prevail over the requirements specified in IFRS 8. Accordingly, segment information disclosed in these financial statements is based on the requirements laid down by the SBP.
In making estimates of the depreciation / amortization method, the management uses method which reflects the pattern in which economic benefits are expected to be consumed by the Company. The method applied is reviewed at each financial year end and if there is a change in the expected pattern of consumption of the future economic benefits embodied in the assets, the method would be changed to reflect the change in pattern.
The liabilities for employees' benefit plans are determined using actuarial valuations. The actuarial valuations involve assumptions about discount rates, expected rates of return on assets and future salary increases as disclosed in note 32. Due to the long term nature of these plans, such estimates are subject to significant uncertainty.
These unconsolidated financial statements have been prepared in accordance with the approved accounting standards as applicable in Pakistan. Approved accounting standards comprise of such International Financial Reporting Standards (IFRSs) issued by the International Accounting Standards Board (IASB) as are notified under the Companies Ordinance, 1984, the provisions of and directives issued under the Companies Ordinance, 1984 and the directives issued by the SBP. In case requirements differ, the provisions of and directives issued under the Companies Ordinance, 1984 and directives issued by the SBP shall prevail.
The SBP has deferred the applicability of International Accounting Standard (IAS) 39, 'Financial Instruments: Recognition and Measurement' and IAS 40, 'Investment Property' for DFIs through BSD Circular Letter No. 11 dated 11 September 2002 till further instructions. Further, SECP has deferred the implementation of IFRS 7 Financial Instruments : Disclosures through SRO 411(1) / 2008 dated 28 April 2008. Accordingly, the requirements of these standards have not been considered in the preparation of these unconsolidated financial statements. However, investments have been classified and valued in accordance with the requirements of various circulars issued by the SBP.
In making the estimates for current and deferred income taxes, the management looks at the income tax law and the decisions of appellate authorities on certain issues in the past. There are certain matters where the Company’s view differs with the view taken by the income tax department and such amounts are shown as contingent liability.
The accounting policies adopted in the preparation of these unconsolidated financial statements are consistent with those of the previous financial year, except for the following standards, which became effective during the year:
These unconsolidated financial statements have been prepared under the historical cost convention except that certain investments have been stated at revalued amounts in accordance with the directives of the SBP and obligations in respect of certain staff retirement benefits are carried at present value.
The unconsolidated financial statements are prepared in Pakistani rupees which is the Company's functional and presentation currency.
IFRS 10 'Consolidated Financial Statements' replaces the current guidance on consolidation in IAS 27 Consolidated and Separate Financial Statements. It introduces a single model of assessing control whereby an investor controls an investee when it has the power, exposure to variable returns and the ability to use its power to influence the returns of the investee. IFRS 10 also includes specific guidance on de-facto control, protective rights and the determination of whether a decision maker is acting as principal or agent, all of which is influence the assessment of control. the application of IFRS 10 did not result in any investee being in control of the Company.
IFRS 11 'Joint Arrangements' replaces IAS 31 'Interests in Joint Ventures' it requires all joint ventures to be equity accounted

-
-
5.2 Approved accounting standards not yet effective
-
-
-
-
-
-
Annual Improvements 2012-2014 cycles (amendments are effective for annual periods beginning on or after 1 January 2016). The new cycle of improvements contain amendments to the following standards:
Investment Entities: Applying the Consolidation Exception (Amendments to IFRS 10 – Consolidated Financial Statements and IAS 28 – Investments in Associates and Joint Ventures) [effective for annual periods beginning on or after 1 January 2016) clarifies (a) which subsidiaries of an investment entity are consolidated; (b) exemption to present consolidated financial statements is available to a parent entity that is a subsidiary of an investment entity; and (c) how an entity that is not an investment entity should apply the equity method of accounting for its investment in an associate or joint venture that is an investment entity. The amendments are not likely to have an impact on Company’s financial statements.
Agriculture: Bearer Plants [Amendment to IAS 16 and IAS 41] (effective for annual periods beginning on or after 1 January 2016). Bearer plants are now in the scope of IAS 16 Property, Plant and Equipment for measurement and disclosure purposes. Therefore, a company can elect to measure bearer plants at cost. However, the produce growing on bearer plants will continue to be measured at fair value less costs to sell under IAS 41 Agriculture. A bearer plant is a plant that: is used in the supply of agricultural produce; is expected to bear produce for more than one period; and has a remote likelihood of being sold as agricultural produce. Before maturity, bearer plants are accounted for in the same way as self-constructed items of property, plant and equipment during construction. The amendments are not likely to have an impact on Company’s financial statements.
IFRS 5 Non-current Assets Held for Sale and Discontinued Operations. IFRS 5 is amended to clarify that if an entity changes the method of disposal of an asset (or disposal group) i.e. reclassifies an asset from held for distribution to owners to held for sale or vice versa without any time lag, then such change in classification is considered as continuation of the original plan of disposal and if an entity determines that an asset (or disposal group) no longer meets the criteria to be classified as held for distribution, then it ceases held for distribution accounting in the same way as it would cease held for sale accounting.
Accounting for Acquisitions of Interests in Joint Operations – Amendments to IFRS 11 ‘Joint Arrangements’ (effective for annual periods beginning on or after 1 January 2016) clarify the accounting for the acquisition of an interest in a joint operation where the activities of the operation constitute a business. They require an investor to apply the principles of business combination accounting when it acquires an interest in a joint operation that constitutes a business. The amendments are not likely to have an impact on Company’s financial statements.
Amendment to IAS 27 ‘Separate Financial Statement’ (effective for annual periods beginning on or after 1 January 2016) allows entities to use the equity method to account for investments in subsidiaries, joint ventures and associates in their separate financial statements. The amendment is not likely to have an impact on Company’s financial statements.
IFRS 13 'Fair Value Measurement' consolidates the guidance on how to measure fair value, which was spread across various IFRS, into one comprehensive standard. It introduces the use of an exact price, as well as extensive disclosure requirements, particularly the inclusion of non-financial instruments into the fair value hierarchy. The application of IFRS 13 does not have an impact on the unconsolidated financial statements of the Company except for certain disclosures as mentioned in note 35.
hereby removing the option in IAS 31 for proportionate consolidation. It also removes the IAS 31 concept to jointly controlled assets. The application of IFRS 11 did not result in identification of any associate as joint venture.
IFRS 12 'Disclosure of Interests in Other Entities' prescribes additional disclosures around significant judgments and assumptions meet in determining whether an entity controls another entity and has joint control or significant influence over another entity. The standard also requires disclosures on the nature and risks associated with interest in unconsolidated structured entities. The application of IFRS 12 does not have an impact on the unconsolidated financial statements of the Company.
Amendments to IAS 38 Intangible Assets and IAS 16 Property, Plant and Equipment (effective for annual periods beginning on or after 1 January 2016) introduce severe restrictions on the use of revenue-based amortization for intangible assets and explicitly state that revenue-based methods of depreciation cannot be used for property, plant and equipment. The rebuttable presumption that the use of revenue-based amortization methods for intangible assets is inappropriate can be overcome only when revenue and the consumption of the economic benefits of the intangible asset are ‘highly correlated’, or when the intangible asset is expressed as a measure of revenue. The amendments are not likely to have an impact on Company’s financial statements.
The following standards, amendments and interpretations of approved accounting standards will be effective for accounting periods beginning on or after 01 January 2016:

-
-
-
5.3 Cash and cash equivalents
5.4 Revenue recognition
5.5 Investments
IAS 34 ‘Interim Financial Reporting’. IAS 34 is amended to clarify that certain disclosures, if they are not included in the notes to interim financial statements and disclosed elsewhere should be cross referred.
Interest income is recognized on a time proportion basis that takes into account effective yield on the asset. Premium or discount on investments classified as held-for-trading, available-for-sale and held-to-maturity securities is amortised using the effective interest method and taken to profit and loss account.
The above amendments are not likely to have an impact on Company’s financial statements.
Financing method is used in accounting for income from lease financing. Under this method, the unearned lease income (excess of the sum of total lease rentals and estimated residual value over the cost of leased assets) is deferred and taken to income over the term of the lease period so as to produce a constant periodic rate of return on the outstanding net investment in lease.
Dividend income on equity investments and mutual funds is recognized when right to receive is established.
Fee, brokerage and commission income other than commission on letters of credit and guarantees and remuneration for trustee services are recognized upon performance of services.
Held-to-maturity – These are investments which are acquired with the intention and ability to hold them up to maturity. These are carried at amortised cost.
Available-for-sale – These are investments that do not fall under held-for-trading or held-to-maturity categories. These are carried at market value with related gain / (loss) on revaluation being taken to ‘surplus / (deficit) on revaluation of assets’ account shown below equity. On derecognition or impairment in available-for-sale investments, the cumulative gain or loss previously reported as 'surplus / (deficit) on revaluation of assets' below equity is included in the profit and loss account for the period.
Cash and cash equivalents comprise cash and balances with treasury banks, balances with other banks and placements with financial institutions having maturities of three (3) months or less.
Gains and losses on disposal of securities are recognised in the profit and loss account in the year in which they arise.
In case of advances including finance lease and debt security investments classified under the Prudential Regulations, interest / mark-up is recognized on receipt basis. Interest / mark-up on rescheduled / restructured advances and investments is recognized in accordance with the Prudential Regulations of SBP.
IFRS 7 ‘Financial Instruments- Disclosures’. IFRS 7 is amended to clarify when servicing arrangements on continuing involvement in transferred financial assets in cases when they are derecognized in their entirety are in the scope of its disclosure requirements. IFRS 7 is also amended to clarify that additional disclosures required by ‘Disclosures: Offsetting Financial Assets and Financial Liabilities (Amendments to IFRS7)’ are not specifically required for inclusion in condensed interim financial statements for all interim periods.
IAS 19 ‘Employee Benefits’. IAS 19 is amended to clarify that high quality corporate bonds or government bonds used in determining the discount rate should be issued in the same currency in which the benefits are to be paid.
The Company classifies its investments other than those in subsidiary and associates based on the criteria set out in BSD Circular Nos. 10, 11 and 14 dated July 13, 2004, August 04, 2004 and September 24, 2004 respectively. The investments are classified in the following categories as per SBP guidelines:
Gains / losses on termination of lease contracts, documentation charges, front-end fees and other lease income are recognized as income on receipt basis.
Commission on letters of credit and guarantees is recognized on time proportion basis.
Held-for-trading – These are investments which are acquired with the intention to trade by taking advantage of short-term market / interest rate movements and are to be sold within 90 days. These are carried at market value, with the related gain / (loss) on revaluation being taken to profit and loss account.

Provision for diminution in value of investments for debt securities is calculated as per the SBP's Prudential Regulations.
Investments in subsidiary and associates are stated at cost. Provision is made for any impairment in value, if any.
5.6 Derivatives
5.7 Advances and net investment in finance lease
5.7.1 Advances
5.7.2 Provision against non-performing advances
5.7.3 Net investment in lease
5.8 Operating fixed assets
5.8.1 Property and equipment – owned
Subsequent costs are included in the asset’s carrying amount or recognised as a separate item of property and equipment, as appropriate, only when it is probable that future economic benefits associated with the item will flow to the Company and the cost of the item can be measured reliably. The carrying amount of the replaced part is derecognised. All other repairs and maintenance are charged to the profit and loss account during the period in which they are incurred.
Residual values and useful lives are reviewed at each balance sheet date and adjusted if impact is considered significant.
Property and equipment are stated at cost less accumulated depreciation and impairment losses, if any. Depreciation is charged to profit and loss account applying the straight-line method at rates stated in note 11.1.
All regular way purchases / sales of investment are recognised on the trade date, i.e., the date the Company commits to purchase / sell the investments. Regular way purchases or sales of investments require delivery of securities within the time frame generally established by regulation or convention in the market place.
Derivatives are initially recognised at fair value on the date on which a derivative contract is entered into and are subsequently remeasured at their fair values. All derivatives are carried as assets when fair value is positive and as liabilities when fair value is negative. Any change in the fair value of derivative financial instruments is taken to the profit and loss account.
Leases are classified as finance lease when substantially all the risks and rewards incidental to ownership of an asset are transferred to the lessee. A receivable is recognized at an amount equal to the present value of the lease payments, including guaranteed residual value, if any. Finance lease receivables are included in advances.
Advances are stated net of specific and general provisions against non-performing advances, if any, which are charged to profit and loss account.
Specific provisions are made in accordance with the requirements of the Prudential Regulations issued by SBP and charged to the profit and loss account. These regulations prescribe an age based criteria (as supplemented by subjective evaluation of advances) for classification of non-performing advances and computing provision / allowance there against.
Held-for-trading and quoted available-for-sale securities are marked to market with reference to ready quotes on Reuters page (PKRV) or Mutual Funds Association of Pakistan (MUFAP) or the Stock Exchanges.
The carrying values of investments are reviewed for impairment when indications exist that the carrying values may exceed the estimated recoverable amounts.
Investments other than those categorised as held-for-trading are initially recognised at fair value which includes transaction costs associated with the investments. Investments classified as held-for-trading are initially recognised at fair value, and transaction costs are expensed in the profit and loss account.
Unquoted securities whose market value is not available are carried at cost less provision for diminution in value, if any. Provision for diminution in value of investments in respect of unquoted shares is calculated with reference to book value of the same.
Depreciation on additions and deletions of property and equipment during a year is charged in proportion to the period of use.
Advances and finance lease receivables are written off when it is considered that there is no realistic prospect of recovery.

5.8.2 Property and equipment - leased
5.8.3
5.8.4 Intangible assets
5.9 Repurchase and resale agreements
5.10 Taxation
5.10.1 Current
5.10.2 Deferred
Amortization on additions and deletions of intangible assets during the year is charged in proportion to the period of use.
The estimated useful life and amortisation method are reviewed at the end of each annual reporting period, with the effect of any changes in estimate being accounted for on a prospective basis.
Intangible assets having a finite life are amortised using the straight-line method over their estimated useful lives, at the rate stated in note 11.2.
The carrying amount of deferred tax assets are reviewed at each statement of financial position date and reduced to the extent that it is no longer probable that sufficient taxable profit will be available to allow all or part of the deferred income tax asset to be utilised.
Deferred tax assets are recognised for all deductible temporary differences, carry forward of unused tax assets and any unused tax losses, to the extent that it is probable that taxable profits will be available against which the deductible temporary differences, carry forward of unused tax assets and unused tax losses can be utilised.
Capital work-in-progress
Item of property and equipment is derecognised when disposed off or when no future economic benefits are expected from its use or disposal. Gains and losses on disposal of property and equipment are included in profit and loss account.
Assets held under finance lease are accounted for by recording the assets and related liabilities at the amounts determined on the basis of the lower of fair value of assets and the present value of minimum lease payments at inception of lease and subsequently stated net of accumulated depreciation. Finance charges are allocated over the period of lease term so as to provide a constant periodic rate of charge on the outstanding liability. Depreciation is charged on leased assets on a basis similar to that of owned assets.
Securities sold with a simultaneous commitment to repurchase at a specified future date (repos) continue to be recognised in thestatement of financial position and are measured in accordance with accounting policies for investments. The counterparty liabilityfor amounts received under these agreements is included in borrowings. The difference between sale and repurchase price istreated as mark-up / return / interest expense and accrued over the life of the repo agreement using effective yield method.
Capital work-in-progress is stated at cost less impairment losses, if any. These are transferred to specific assets as and when assets are available for use.
Expenditure incurred to acquire software licenses is capitalised as intangible assets and stated at cost less accumulated amortization and impairment losses, if any.
The Company accounts for deferred taxation using the balance sheet liability method on temporary differences arising between the tax base of assets and liabilities and their carrying amounts in the financial statements. The amount of deferred tax provided is based on the expected manner of realisation or settlement of the carrying amount of assets and liabilities.
The charge for current taxation is based on taxable income at the current rate of taxation after taking into account applicable tax credits, rebates and exemption available, if any, or minimum taxation as per the Income Tax Ordinance, 2001 whichever is higher. However, for income covered under final tax regime, taxation is based on applicable tax rates under such regime. The charge for the current tax also includes adjustments wherever considered necessary relating to prior year, arising from assessments framed during the year.
Securities purchased with a corresponding commitment to resell at a specified future date (reverse repos) are not recognised in the statement of financial position, as the Company does not obtain control over the securities. Amounts paid under these agreements are included in lendings to financial institutions. The difference between purchase and resale price is treated as mark-up / return / interest income and accrued over the life of the reverse repo agreement using effective yield method.

5.11 Borrowings
5.12 Staff retirement benefits
5.12.1 Defined benefit plan
5.12.2 Defined contribution plan
5.13 Compensated absences
5.14 Foreign currencies translation
5.15 Provisions
5.16 Offsetting
5.17 Dividend and reserves
Borrowings are recognised initially at the value of consideration received. Difference between the consideration received and the redemption value is recognised in profit and loss account over the period of the borrowings by applying effective rate of interest / markup.
Dividend declared and appropriations, except appropriations which are required by the law are recognised as liability and recorded as changes in reserves in the period in which these are approved by the directors / shareholders as appropriate.
Deferred tax assets and liabilities are measured at the tax rates that are expected to apply to the period when the asset is realised or the liability is settled, based on tax rates (and tax laws) that have been enacted or substantively enacted at the reporting date.
Financial assets and financial liabilities are offset and the net amount reported in the financial statement when there is a legally enforceable right to set off the recognised amounts and the Company intends to settle on a net basis, or to realise the asset and settle the liability simultaneously.
Provisions are recognised when the Company has a present, legal or constructive obligation as a result of past event, it is probable that an outflow of resources embodying economic benefits will be required to settle the obligation and a reliable estimate can be made of the amount of obligation.
The Company operates a funded-gratuity scheme for all its permanent employees. The scheme was established on 1 November 2002 and approved by the Commissioner of Income Tax with effect from 31 January 2003. Contribution to the fund is made every year based on actuarial valuation. The actuarial valuation is carried out using the Projected Unit Credit Method (PUCM). Under this method, the cost of providing gratuity is charged to the profit and loss account so as to spread the cost over the service lives of the employees in accordance with the actuarial valuation. All actuarial gains and losses are recognized in Other Comprehensive Income (OCI) in the periods in which they occur. The actuarial valuation was conducted as at 31 December 2015.
However, provisions are reviewed at each statement of financial position date and adjusted to reflect the current best estimate.
Foreign currency transactions are translated into Pakistani Rupees (functional currency) using the exchange rate prevailing at the dates of transactions. Monetary assets and liabilities in foreign currencies are translated into Pakistani Rupees using the exchange rate prevailing at the reporting date. Foreign exchange gains and losses resulting from the settlement of foreign currency transactions and from the translations of monetary assets and liabilities denominated in foreign currencies at statement of financial position date are included in profit and loss account.
Deferred tax related to gain / (loss) recognised in surplus / (deficit) on revaluation of assets is charged / credited to such account.
Compensated absences (leaves) of employees are accounted for in the period in which these absences are earned.
The Company also operates a provident fund scheme for all its permanent employees. Equal monthly contributions at the rate of 8.33 percent per annum of salary are made by the Company and its employees. The scheme was established on 1 November 2002 and approved by the Commissioner of Income Tax with effect from 31 January 2003. Contributions from the Company are charged to profit and loss account for the year.

5.18 Impairment
5.19 Earnings per share
5.20 Financial instruments
5.21 Certificates of investment (COI)
5.22 Segment information
Business segments
- Corporate finance
- Trading & sales
Involves the businesses of equity trading and fixed income securities.
- Commercial banking
A segment is a distinguishable component of the Company that is engaged in either providing products or services (business segment), or in providing products or services within a particular economic environment (geographical segment), which is subject to risks and rewards that are different from those of other segments.
Corporate finance includes services provided in connection with mergers and acquisitions, underwriting, privatization, securitization, research, debts (government, high yield), equity, syndication, Initial Public Offers (IPO) and secondary private placements.
Commercial banking includes project finance, real estate, export finance, trade finance, factoring, leasing, lending, guarantees, bills of exchange and deposits.
Where impairment loss subsequently reverses, the carrying amount of the asset is increased to the revised recoverable amount but limited to the extent of the amount which would have been determined had there been no impairment. Reversal of impairment loss is recognized as income.
The Company assesses at each balance sheet date whether there is any indication that non-financial assets except deferred tax assets may be impaired. If such indication exists, the carrying amounts of such assets are reviewed to assess whether they are recorded in excess of their recoverable amount. Where carrying values exceed the respective recoverable amount, assets are written down to their recoverable amounts and the resulting impairment loss is recognized in profit and loss account. The recoverable amount is the higher of an asset's fair value less costs to sell and value in use.
The Company presents basic and diluted earnings per share (EPS) for its shareholders. Basic EPS is calculated by dividing the profit or loss attributable to ordinary shareholders of the Company by the weighted average number of ordinary shares outstanding during the year. Diluted EPS, if any, is determined by adjusting the profit or loss attributable to ordinary shareholders and the weighted average number of ordinary shares outstanding for the effects of all dilutive potential ordinary shares. There were no dilutive potential ordinary shares in issue at 31 December 2015.
COI are initially recorded at the amount of proceeds received. Mark-up accrued is recognized separately as part of liabilities and is charged to profit and loss account on a time proportion basis.
Financial assets and liabilities are recognized at the time when the Company becomes party to the contractual provision of the instrument. Financial assets are de-recognized when the contractual right to future cash flows from the asset expires or is transferred along with the risk and reward of the asset. Financial liabilities are de-recognized when obligation specific in the contract is discharged, cancelled or expired. Any gain or loss on de-recognition of the financial asset and liability is recognized in the profit and loss account of the current period. The particular recognition and subsequent measurement method for significant financial assets and financial liabilities are disclosed in the individual policy statements associated with them.

Note 2015 2014
6. CASH AND BALANCES WITH TREASURY BANKS
Cash in hand:local currency 106 90 foreign currency 150 143 Balances with State Bank of Pakistan in local currency - current account 6.1 93,469 99,679
93,725 99,912
6.1 This represent the amount required to be maintained by the Company in accordance with the SBP's Regulations.
7 BALANCES WITH OTHER BANKS
In Pakistan:current accounts 1,685 9,882 deposit accounts 7.1 1,585,031 258,771
1,586,716 268,653
Outside Pakistan - current accounts 240 520
1,586,956 269,173
7.1
2015 2014Note
8 LENDINGS TO FINANCIAL INSTITUTIONS
Placements 8.1 - 25,000 Repurchase agreement lendings 8.2 & 8.5 362,824 389,177 Certificate of investments (COIs) 8.3 - 200,000
362,824 614,177
8.1
8.2
8.3
8.4 Particulars of lendings
In local currency 362,824 614,177 In foreign currency - -
362,824 614,177
8.5 Securities held as collateral against lendings to financial institutions
Note
Market Treasury Bills - 142,824 142,824 289,177 - 289,177 Pakistan Investment Bonds - 220,000 220,000 - 100,000 100,000
8.5.1 - 362,824 362,824 289,177 100,000 389,177
8.5.1 Market value of these securities amount to Rs. 370 million (2014: Rs. 393 million).
(Rupees in '000)
These include term deposit receipts (TDRs) of Rs. 1,350 million (2014: Rs. 250 million) maturing between January 2016 to February 2016. These carry mark-up rates ranging from 6.75 to 7.25 (2014: 10.40 to 10.75) percent per annum.
The rates of return on these placements is NIL (2014: 9.6) percent per annum, maturing in NIL (2014: January 2015).
(Rupees in '000)
2014
Held by the
Company
Given as collateral
Given as collateral
These are short-term lendings to different financial institutions secured against government securities as disclosed in note 8.5 which are purchased under resale obligations. These carry mark-up rates ranging from 6.55 to 7.25 (2014: 9.6 to 9.85) percent per annum and will mature in Janaury 2016 (2014: January 2015).
2015
----------------------------------------- (Rupees in '000) -------------------------------------------
COIs are due for maturity within NIL (2014: January 2015 to March 2015 ). The rate of return on COIs is NIL (2014: 10.95) percent per annum.
Total Held by the Company
Total

9 INVESTMENTS
Note
9.1 Investments by types 9.5
Held-for-trading securities
Pakistan Investment Bonds (PIBs) 9.4 & 9.5.1 181,573 243,056 424,629 132,289 7,815 140,104 Market Treasury Bills (T-Bills) 9.4 & 9.5.1 247,051 215,250 462,301 514,762 - 514,762 Listed ordinary shares 9.5.2.1 110,705 - 110,705 54,929 - 54,929
539,329 458,306 997,635 701,980 7,815 709,795
Available-for-sale securities
Pakistan Investment Bonds (PIBs) 9.4 & 9.5.1 111,455 7,513,935 7,625,390 760,494 5,861,428 6,621,922 Ijara Sukuks 9.4 & 9.5.1 300,000 - 300,000 - - - Market Treasury Bills (T-Bills) 9.4 & 9.5.1 74,201 144,555 218,756 - - - Listed ordinary shares 9.5.2.2 682,716 - 682,716 608,691 - 608,691 Unlisted ordinary shares 9.5.3 121,333 226,000 347,333 131,333 226,000 357,333 Term finance certificates (TFCs) 9.5.4 & 9.5.5 2,233,215 - 2,233,215 2,119,506 - 2,119,506 Sukuk certificates 9.5.6 966,619 - 966,619 1,158,039 - 1,158,039
4,489,539 7,884,490 12,374,029 4,778,063 6,087,428 10,865,491
Associates 9.5.7
Japan Power Generation Limited 51,921 70,726 122,647 51,921 70,726 122,647 Pak Oman Microfinance Bank Limited 384,708 - 384,708 384,708 - 384,708 Pak Oman Advantage Fund - - - 262,828 - 262,828 Pak Oman Advantage Islamic Income Fund 65,025 - 65,025 92,667 - 92,667 Pak Oman Islamic Asset Allocation Fund 92,414 - 92,414 92,414 - 92,414 Pak Oman Advantage Asset Allocation Fund 84,078 - 84,078 84,078 - 84,078 Pak Oman Government Securities Fund 249,000 - 249,000 60,000 - 60,000
927,146 70,726 997,872 1,028,616 70,726 1,099,342
Subsidiary
Pak Oman Asset Management Company Limited 9.5.8 398,300 - 398,300 168,300 - 168,300
6,354,314 8,413,522 14,767,836 6,676,959 6,165,969 12,842,928
Less: Provision for diminution in the value of investments 9.3 1,198,160 59,271 1,257,431 1,066,719 59,271 1,125,990
Investments - net of provisions 5,156,154 8,354,251 13,510,405 5,610,240 6,106,698 11,716,938
(Deficit) / surplus on revaluation of held-for-trading securities 9.6 (7,325) 782 (6,543) 3,948 160 4,108
Surplus on revaluation of available-for-sale securities 20 15,335 554,159 569,494 16,384 442,091 458,475
Total investments 5,164,164 8,909,192 14,073,356 5,630,572 6,548,949 12,179,521
Investments at cost
Given as collateral
20142015 Total Held by the
Company Held by
the Company
----------------------------------------- (Rupees in '000) --------------------------------------------
Given as collateral
Total

2015 2014Note
9.2 Investments by segments
Federal Government Securities
Pakistan Investment Bonds (PIBs) 9.4, 9.5 & 9.6 8,050,019 6,762,026 Ijara Sukuk 9.4, 9.5 & 9.6 300,000 - Market Treasury Bills (MTBs) 9.4, 9.5 & 9.6 681,057 514,762
9,031,076 7,276,788
Fully paid up ordinary shares
Listed companies 9.5.2 793,421 663,620 Unlisted companies 9.5.3 347,333 357,333
1,140,754 1,020,953
Term finance certificates (TFCs)
Listed 9.5.4 1,210,499 1,370,351 Unlisted 9.5.5 1,022,716 749,155
2,233,215 2,119,506
Sukuk certificates - unlisted 9.5.6 966,619 1,158,039
Investment in associates 9.5.7 997,872 1,099,342
Investments in subsidiary 9.5.8 398,300 168,300
Total investments at cost 14,767,836 12,842,928
Less: Provision for diminution in the value of investments 9.3 1,257,431 1,125,990
Investments (net of provisions) 13,510,405 11,716,938
(Deficit) / surplus on revaluation of held-for-trading securities 9.6 (6,543) 4,108 Surplus on revaluation of available-for-sale securities 20 569,494 458,475
Total investments 14,073,356 12,179,521
9.3 Particulars of provision for diminution in the value of investments
Opening balance 1,125,990 877,474
Charge for the year 265,013 283,015 Reversals for the year (89,426) (17,029)
175,587 265,986
Transfer to capital gain due to disposal of relevant investments (44,146) (17,470)
Closing balance 9.3.1 1,257,431 1,125,990
(Rupees in '000)

2015 2014
9.3.1 Particulars of provision in respect of types and segments
Available-for-sale securitiesShares- Listed 73,076 82,743 - Unlisted 104,426 98,568 Term Finance Certificates- Listed 466,435 361,702 - Unlisted 179,455 149,419 Sukuk-unlisted 173,881 173,881 Investment in Mutual Funds - -
997,273 866,313
Associate 102,783 102,783
Subsidiary 157,375 156,894
1,257,431 1,125,990
9.4
9.5 Detailed information relating to investments including quality of available-for-sale securities is given below:
9.5.1 Government Securities
Market Value
Rating Market Value
Rating
(Rupees in '000)
(Rupees in '000)
9.5.1.1 Held-for-trading
Pakistan Investment Bonds (PIBs)10 years 114,824 Unrated 142,692 Unrated5 years 76,360 Unrated - Unrated3 years 235,063 Unrated - Unrated
426,247 142,692
Market Treasury Bills (MTBs)3 months 19,931 Unrated 144,730 Unrated6 months 195,490 Unrated - - 12 months 246,899 Unrated 371,359 Unrated
462,320 516,089
9.5.1.2 Available-for-sale
Pakistan Investment Bonds (PIBs)20 years - 19,307 Unrated15 years 466,028 Unrated 327,151 Unrated10 years 3,904,909 Unrated 3,991,576 Unrated5 years 1,601,972 Unrated 2,307,215 Unrated3 years 2,208,512 Unrated 468,211 Unrated
8,181,421 7,113,460
Ijara Sukuk 303,390 Unrated - -
Market Treasury Bills (MTBs)6 months 19,643 Unrated - - 12 months 199,118 Unrated - -
218,761 -
9,592,139 7,772,241
2015 2014
The rates of return on PIBs maturing between May 2016 to July 2022 (2014: July 2015 to July 2024), range from 6.50 to 13.20 (2014: 10.80 to 13.20) percent per annum. The rates of return on Ijara Sukuk maturing in December 2018 (2014: NIL) is 5.89 (2014: NIL) percent per annum. The rate of return on market treasury bills maturing between January 2016 to September 2016 (2014: January 2015 to October 2015), range from 6.37 to 6.49 (2014: 9.96 to 9.99) percent per annum.
(Rupees in '000)

9.5.2 Listed shares Rating2015 2014 2015 2014 2015 2014
9.5.2.1 Held-for-trading
ChemicalEngro Corporation Limited AA / A1+ 45,500 20,000 13,782 4,232 12,712 4,430 Fauji Fertilizer Company Limited Unrated - 39,500 - 4,699 - 4,626
ElectricityKot Addu Power Company Limited AA+/A1+ 61,000 - 5,365 - 4,941 -
Cable & Electrical GoodsPak Elektron Limited A/A1 225,000 - 15,541 - 14,072 - TPL Trakker Limited A-/A2 875,000 - 14,470 - 13,064 -
Technology and CommunicationSystems Limited Unrated 200,000 - 13,669 - 12,606 -
Oil and Gas Attock Petroleum Limited Unrated - 3,000 - 1,597 - 1,619 Hascol Petroleum Limited A+/A-1 70,000 - 11,124 - 10,098 - Mari Petroleum Company Limited Unrated 9,100 - 6,407 - 6,343 - Oil & Gas Development Company Limited Unrated - 1,000 - 205 - 205 Pakistan Oilfields Limited Unrated - 2,000 - 975 - 759 Pakistan Petroleum Limited Unrated - 10,000 - 1,770 - 1,765
Construction and materials (Cement)Attock Cement Limited Unrated - 45,300 - 8,810 - 8,841 D.G.Khan Cement Company Limited Unrated 25,000 - 3,700 - 3,690 - Lafarge Pakistan Cement Limited Unrated - 500,000 - 8,673 - 8,675 Lucky Cement Limited Unrated 50,500 - 26,647 - 24,999 -
Commercial BanksFaysal Bank Limited AA / A1+ - 35,000 - 624 - 637 MCB Bank Limited AAA / A1+ - 15,000 - 4,446 - 4,585 United Bank Limited AA+ / A1+ - 63,000 - 11,158 - 11,133
Food ProducersEngro Foods Limited Unrated - 50,000 - 5,297 - 5,427
TextileNishat Mills Limited AA / A1+ - 20,000 - 2,443 - 2,420
110,705 54,929 102,525 55,122
9.5.2.2 Available-for-sale
Construction and materials (Cement)Attock Cement Limited Unrated - 105,700 - 19,328 - 20,630 Cherat Cement Limited A/A1 103,000 180,000 9,256 11,665 9,288 12,362 Fauji Cement Company Limited Unrated 200,000 - 6,825 - 7,364 - Kohat Cement Limited Unrated 15,500 - 3,102 - 3,733 - Lucky Cement Limited Unrated - 5,000 - 2,426 - 2,501 Maple Leaf Cement Factory Limited A/A1 100,000 - 7,075 - 7,458 -
ElectricityHUB Power Company Limited AA+ / A1+ 200,000 - 20,391 - 20,520 - Kot Addu Power Company Limited AA+/A1+ 285,000 75,000 22,573 4,737 23,085 5,921 Lalpir Power Limited AA / A1+ 903,000 200,000 27,522 4,402 26,855 5,980 Nishat Chunian Power Limited A+/A2 650,000 - 35,911 - 35,782 - Nishat Power Limited A+ / A1 402,500 750,000 22,502 34,984 21,606 34,200
ChemicalAgritech Limited ( Note 9.5.5.2) Unrated 1,629,911 1,629,911 57,046 57,046 15,240 12,632 Engro Corporation Limited AA/ A1+ 30,000 20,000 8,498 4,430 8,382 4,430 Engro Fertilizer Company Limited AA-/A1+ 120,000 - 10,172 - 10,096 - Fauji Fertilizer Company Limited Unrated 300,000 535,000 39,395 63,076 35,394 62,654
Commercial BanksAllied Bank Limited AA+ / A1+ 215,000 250,000 24,839 28,883 20,265 28,395 Habib Bank Limited AAA/A1+ 140,000 - 29,384 - 28,017 - Habib Metro Bank Limited AA+/A1+ 1,000,000 - 36,407 - 30,470 - JS Bank Limited A+ / A1+ 1,850,000 7,137,500 12,833 49,523 14,337 50,962 United Bank Limited AA+ / A1+ 315,700 10,000 50,310 1,698 48,918 1,767
Financial ServicesNext Capital Limited Unrated - 808,400 - 8,084 - 4,648
Refinery / Oil & GasAttock Petroleum Limited Unrated 22,050 - 11,372 - 11,138 - Oil & Gas Development Company Limited Unrated 50,000 201,700 9,024 53,955 5,867 41,524 Pak Refinery Limited A-/A2 437,000 - 25,131 - 19,757 - Pakistan Oilfield Limited Unrated 30,000 121,000 10,553 61,617 8,040 45,902 Pakistan Petroleum Limited Unrated - 202,000 - 45,823 - 35,657 Pakistan State Oil Company Limited AA+ / A1+ 80,000 188,050 28,585 73,685 26,062 67,305 Sui Northern Gas Company Limited AA+/A1 294,500 - 9,904 - 7,080 - Sui Southern Gas Company Limited AA-/A1 500,000 - 22,058 - 18,675 -
Paper and BoardCentury Paper & Board A+/A1 200,500 100,000 12,503 6,553 10,263 5,421 Cherat Packaging Limited Unrated 50,000 - 13,091 - 15,155 -
Food ProducersFarhan Sugar Mills Limited Unrated - 60,000 - 2,532 - 2,369
TextileNishat Mills Limited AA/ A1+ 140,000 435,900 17,649 58,647 13,282 52,740
Technology and CommunicationSystems Limited Unrated 1,465,000 - 70,941 - 92,339 -
Equity Investments InstrumentsPICIC Growth Fund Unrated 462,000 - 12,668 - 10,409 - PICIC Investment Fund Unrated 407,500 - 5,198 - 4,658 -
Industrial TransportationPakistan International Bulk Terminal Limited Unrated 435,500 604,000 9,998 15,597 12,181 14,912
682,716 608,691 621,716 512,912
793,421 663,620 724,241 568,034
------------------- (Rupees in '000) -------------------
No. of shares held Cost Market value

9.5.3
9.5.3.1 Available-for-saleShare Break-up / Latest Name of
2015 2014 2015 2014 holding carrying available the Chief
% value per financial Executive
share statements
Shareholding upto 10% (Rupees)
Alhamra Avenue (Private) Limited 5,000,000 5,000,000 50,000 50,000 3.12 9.21 30-June-2012*** Mr. Muhammad Hammad
Arshad
Systems Limited - 1,868,106 - 10,000 2.18 24.63 31-Dec-2014* Mr. Asif Peer
Pakistan Textile City Limited 5,000,000 5,000,000 50,000 50,000 4.00 3.38 30-Jun-2015* Mr. Mohammad Hanif
Kasbati
Techlogix International Limited 1,872,197 1,872,197 21,333 21,333 1.84 3.02 31-Dec-2014** Mr. Kewan Qadre Khawaja
/ Mr. Salman Akhter (Co CEOs)
Orient Power Company (Private) Limited 22,600,000 22,600,000 226,000 226,000 5.43 20.26 30-Jun-2015* Mr. Nadeem Baber
(Note 21.2)
347,333 357,333
*Audited financial statements
**Audited consolidated financial statements
*** Unaudited financial statements
9.5.4 Listed Term Finance Certificates
9.5.4.1 Available-for-saleRate of Interest
2015 2014 2015 2014
Commercial banks / DFIs
Allied Bank Limited II 6 month Kibor + 0.85% Half yearly 28-Aug-19 AA - 13,962 - 68,157
Askari Bank Limited III 6 month Kibor + 2.5% Half yearly 18-Nov-19 AA- - 50,949 - 249,339
Bank Al-Falah Limited V 6 month Kibor + 1.25% Half yearly 20-Feb-21 AA- 29,500 29,500 150,042 146,366
NIB Bank Limited 6 month Kibor + 1.15% Half yearly 19-Jun-22 A+ 35,000 30,000 173,146 147,845
Summit Bank Limited 6 month Kibor + 3.25% Half yearly 27-Oct-18 A (SO) 10,000 10,000 51,197 42,714
Soneri Bank Limited 6 month Kibor + 1.35% Half yearly 8-Jul-23 A+ 60,000 - 293,915 -
Technology and communication
Telecard Limited 3 month Kibor + 5.04% Half yearly 27-May-15 Unrated - 56,716 - -
WorldCall Telecom Limited 6 month Kibor + 1.6% Half yearly 7-Oct-21 Unrated 108,623 108,623 - 162,836
Personal goods
Azgard Nine Limited 6 month Kibor + 2.4% Half yearly 20-Sep-17 Unrated 15,000 15,000 - 2,662
Electricity
KESC AZM Certificate 14.75% Quarterly 3-Jul-15 AA - 10,000 - 49,587
Miscellaneous
Pace (Pakistan) Limited 6 month Kibor + 2% Half yearly 15-Feb-17 Unrated 60,230 60,230 72,273 108,409
740,573 977,915
9.5.4.2
9.5.5 Unlisted Term Finance Certificate
9.5.5.1 Available-for-sale
2015 2014 2015 2014
Commercial banks
Faysal Bank Limited - PPTFC Half yearly 27-Dec-17 AA- 30,000 30,000 153,068 156,691
Bank Al-Falah Limited - IV Half yearly 2-Dec-17 AA- 33,000 33,000 167,192 170,405
(Rupees in '000)
Maturity Long Term rating
Particulars of investments held in shares of unlisted companies
Number of shares held Cost
The face value of each certificate held in listed TFCs is Rs. 5,000 (2014: Rs. 5,000) per certificate as at issue date.
(Rupees in '000)
Profit Payment
Market valueNo. of certificates held
Rate of Interest No. of certificates held Market value
(Rupees in '000)
Long Term Rating
6 month Kibor + 2.5%
6 month Kibor + 2.25%
MaturityProfit Payment
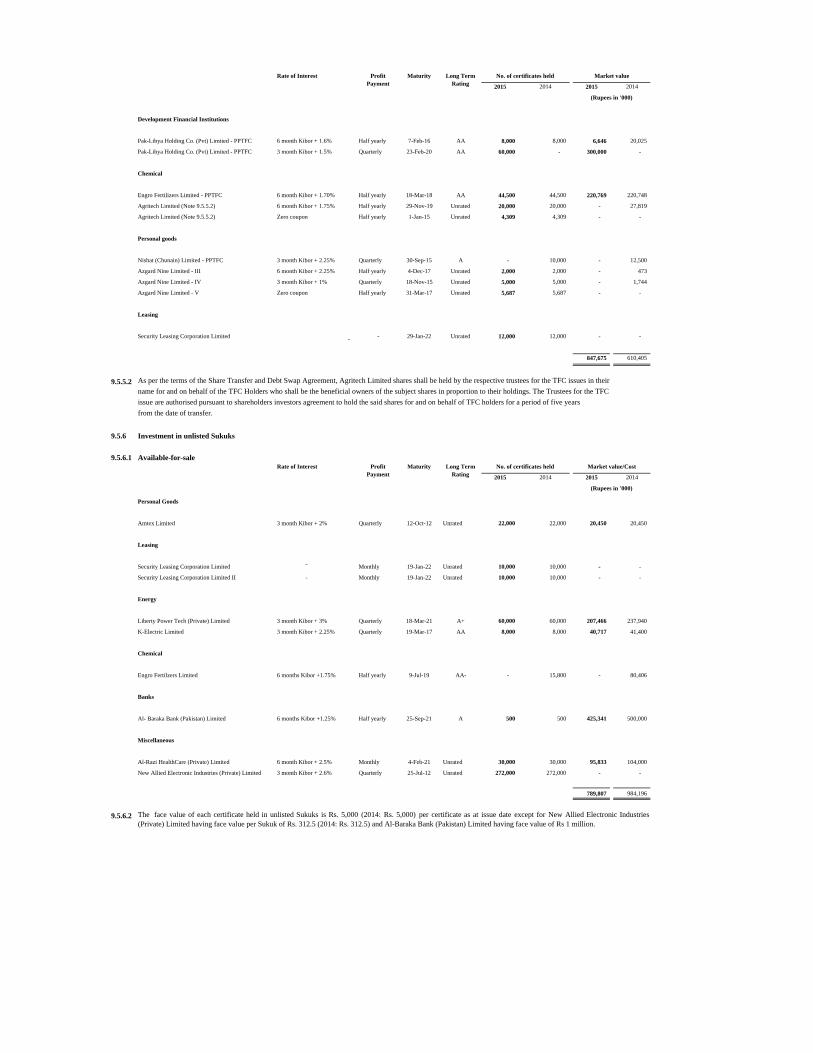
2015 2014 2015 2014
Development Financial Institutions
Pak-Libya Holding Co. (Pvt) Limited - PPTFC Half yearly 7-Feb-16 AA 8,000 8,000 6,646 20,025
Pak-Libya Holding Co. (Pvt) Limited - PPTFC Quarterly 23-Feb-20 AA 60,000 - 300,000 -
Chemical
Engro Fertilizers Limited - PPTFC Half yearly 18-Mar-18 AA 44,500 44,500 220,769 220,748
Agritech Limited (Note 9.5.5.2) Half yearly 29-Nov-19 Unrated 20,000 20,000 - 27,819
Agritech Limited (Note 9.5.5.2) Zero coupon Half yearly 1-Jan-15 Unrated 4,309 4,309 - -
Personal goods
Nishat (Chunain) Limited - PPTFC Quarterly 30-Sep-15 A - 10,000 - 12,500
Azgard Nine Limited - III Half yearly 4-Dec-17 Unrated 2,000 2,000 - 473
Azgard Nine Limited - IV Quarterly 18-Nov-15 Unrated 5,000 5,000 - 1,744
Azgard Nine Limited - V Zero coupon Half yearly 31-Mar-17 Unrated 5,687 5,687 - -
Leasing
Security Leasing Corporation Limited - 29-Jan-22 Unrated 12,000 12,000 - -
847,675 610,405
9.5.5.2 As per the terms of the Share Transfer and Debt Swap Agreement, Agritech Limited shares shall be held by the respective trustees for the TFC issues in their
name for and on behalf of the TFC Holders who shall be the beneficial owners of the subject shares in proportion to their holdings. The Trustees for the TFC
issue are authorised pursuant to shareholders investors agreement to hold the said shares for and on behalf of TFC holders for a period of five years
from the date of transfer.
9.5.6 Investment in unlisted Sukuks
9.5.6.1 Available-for-sale
2015 2014 2015 2014
Personal Goods
Amtex Limited Quarterly 12-Oct-12 Unrated 22,000 22,000 20,450 20,450
Leasing
Security Leasing Corporation Limited - Monthly 19-Jan-22 Unrated 10,000 10,000 - -
Security Leasing Corporation Limited II - Monthly 19-Jan-22 Unrated 10,000 10,000 - -
Energy
Liberty Power Tech (Private) Limited Quarterly 18-Mar-21 A+ 60,000 60,000 207,466 237,940
K-Electric Limited Quarterly 19-Mar-17 AA 8,000 8,000 40,717 41,400
Chemical
Engro Fertilzers Limited 6 months Kibor +1.75% Half yearly 9-Jul-19 AA- - 15,800 - 80,406
Banks
Al- Baraka Bank (Pakistan) Limited 6 months Kibor +1.25% Half yearly 25-Sep-21 A 500 500 425,341 500,000
Miscellaneous
Al-Razi HealthCare (Private) Limited Monthly 4-Feb-21 Unrated 30,000 30,000 95,833 104,000
New Allied Electronic Industries (Private) Limited Quarterly 25-Jul-12 Unrated 272,000 272,000 - -
789,807 984,196
9.5.6.2
3 month Kibor + 2%
The face value of each certificate held in unlisted Sukuks is Rs. 5,000 (2014: Rs. 5,000) per certificate as at issue date except for New Allied Electronic Industries(Private) Limited having face value per Sukuk of Rs. 312.5 (2014: Rs. 312.5) and Al-Baraka Bank (Pakistan) Limited having face value of Rs 1 million.
3 month Kibor + 2.6%
3 month Kibor + 3%
6 month Kibor + 2.5%
3 month Kibor + 2.25%
(Rupees in '000)
6 month Kibor + 1.6%
6 month Kibor + 1.70%
Rate of Interest Profit Payment
Maturity Long Term Rating
No. of certificates held Market value/Cost
3 month Kibor + 1.5%
Rate of Interest
(Rupees in '000)
No. of certificates held Market value
-
3 month Kibor + 2.25%
3 month Kibor + 1%
6 month Kibor + 1.75%
6 month Kibor + 2.25%
Profit Payment
Maturity Long Term Rating

9.5.7 Investment in associates
9.5.7.1 The Company holds investment in ordinary shares of Rs. 10 each in the following entity:
2015 2014 2015 20149.5.7.2 Quoted (Rupees)
Japan Power Generation Limited (JPGL)(Note 9.5.7.3 and 21.1)
30,560,189 30,560,189 122,647 122,647 19.59% (33.38) 30-Sep-15* Mr. Amjad Awan
Pak Oman Advantage Fund - 27,109,000 - 262,828 - 10.39 30-Jun-15** Mr. Adeel Ahmad Khan
Pak Oman Islamic Asset Allocation Fund
2,000,000 2,000,000 92,414 92,414 99.96% 56.08 31-Dec-15** Mr. Adeel Ahmad Khan
Pak Oman Advantage Asset Allocation Fund
2,000,000 2,000,000 84,078 84,078 99.98% 51.59 31-Dec-15** Mr. Adeel Ahmad Khan
Pak Oman Advantage Islamic Income Fund
1,395,374 2,003,976 65,025 92,667 72.13% 52.40 31-Dec-15** Mr. Adeel Ahmad Khan
Pak Oman Government Securities Fund
23,660,643 5,872,795 249,000 60,000 99.09% 10.62 31-Dec-15** Mr. Adeel Ahmad Khan
Unquoted
Pak Oman Microfinance Bank Limited
38,470,788 38,470,788 384,708 384,708 33.40% 9.33 31-Dec-15 Mr. Munawar Suleman
997,872 1,099,342 **Reviewed financial statements.* Unaudited financial statements
9.5.7.3
9.5.7.4
9.5.7.5 Associates - Key Information
Assets - 105,077 116,128 107,109 407,710 10,820,082 1,155,013
Liabilities - 3,705 3,931 3,919 1,959 16,029,223 79,831
Total income 49,355 7,301 18,022 13,287 10,335 401,027 191,666
Profit / (loss) before taxation 38,095 1,816 11,614 7,113 11,493 (580,693) 10,260
Profit / (loss) after taxation 38,095 1,816 11,614 7,113 11,493 (580,693) 6,669
* Audited financial statements
**Reviewed financial statements.
*** Unaudited financial statements
9.5.8 Investments in Subsidiary
2015 2014 2015 2014
% (Rupees)
Pak Oman Asset Management Company Limited ( Note 9.5.10)
356,208,200 16,830,000 398,300 168,300 95.66% 0.626 31-Dec-15 Mr. Adeel Ahmad Khan
Name ofthe chief executive
Pak Oman Government
Securities Fund **
Number of shares / units
Pak Oman Advantage
Fund *
Break-up value per
share / unit
The Company exercises significant influence on the financial and operational policies of JPGL due to representation of four directors out of thirteen directors.Accordingly, investment in JPGL is accounted for as investment in associate in these unconsolidated financial statements.
Pak Oman Microfinance Bank
***
Latest available unaudited financial t t t
(Rupees in '000)
The above associates are incorporated in Pakistan.
Holding
Name of the chief executive
(Rupees in '000)
Pak Oman Advantage
Islamic Income Fund **
Japan Power Generation Limited ***
Pak Oman Islamic Asset
Allocation Fund **
Pak Oman Advantage
Asset Allocation Fund **
Percentage of holding
(Rupees in '000) Number of shares / units
Break-up value per
share / units
Latest available unaudited financial
statements

9.5.9
9.5.10
9.6 (Deficit) / surplus on revaluation of 2015 2014 held-for-trading securities Note
Federal Government Securities- Market Treasury Bills 19 1,327 - Pakistan Investment Bonds 1,618 2,588
1,637 3,915
Shares - listed (8,180) 193 (6,543) 4,108
10 ADVANCES
In Pakistan
Loans, cash credits, running finances, etc. 9,021,789 8,565,685 Net investment in finance leases 10.3 1,751,575 1,268,825 Advance against leases 8,138 6,373 Staff loans 10.4 126,223 123,345
Advances - Gross 10.1 10,907,725 9,964,228
Less: Provision for non-performing loans and advances 10.6 914,462 893,914
Advances - net of provision 9,993,263 9,070,314
10.1 Particulars of advances (Gross)
10.1.1 In local currency 10.1.3 10,907,725 9,964,228
10.1.2 In foreign currency - -
10.1.3 Short term (for upto one year) 3,619,297 3,718,994 Long term (for over one year) 7,288,428 6,245,234
10,907,725 9,964,228
10.2 In accordance with Prudential Regulations issued by the SBP, the Company has availed the benefit of FSV against the non-performing advances and term finance certificates. As of 31 December 2015, the Company has availed total accumulated FSV benefit amounting to Rs. 99.391 million (net of tax Rs. 68.580 million). Accordingly, accumulated profit of Rs. 68.580 million (net of transfer to statutory reserves Rs. 54.864 million) will not be available for the distribution as cash or stock dividend to the shareholders / bonus to employees of the Company as required by the aforementioned SBP directives.
(Rupees in '000)
Investment in Pak Oman Asset Management Company Limited is part of strategic investment of the Company. These shares are in the custody of CDC and cannot be sold without the prior approval of the SECP in accordance with Circular Letter No. 9 of 2006 dated 15 June 2006 in addition to mandatory holding period of five years from the last date purchase of these shares.
Investment in these securities forms part of strategic investment of the Company and can not be sold for a period of five years from the last date of purchase of securities.
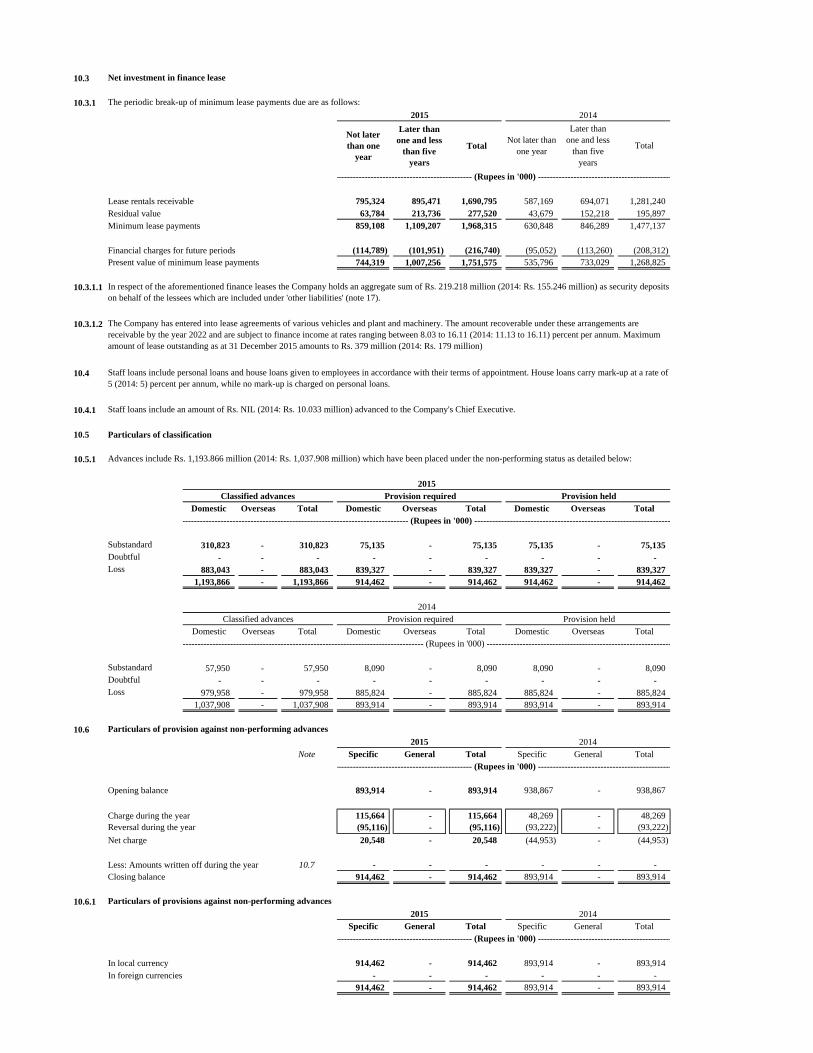
10.3 Net investment in finance lease
10.3.1 The periodic break-up of minimum lease payments due are as follows:
Not later than one
year
Later than one and less
than five years
Total Not later than
one year
Later than one and less
than five years
Total
Lease rentals receivable 795,324 895,471 1,690,795 587,169 694,071 1,281,240 Residual value 63,784 213,736 277,520 43,679 152,218 195,897 Minimum lease payments 859,108 1,109,207 1,968,315 630,848 846,289 1,477,137
Financial charges for future periods (114,789) (101,951) (216,740) (95,052) (113,260) (208,312) Present value of minimum lease payments 744,319 1,007,256 1,751,575 535,796 733,029 1,268,825
10.3.1.1
10.3.1.2
10.4
10.4.1 Staff loans include an amount of Rs. NIL (2014: Rs. 10.033 million) advanced to the Company's Chief Executive.
10.5 Particulars of classification
10.5.1
Domestic Overseas Total Domestic Overseas Total Domestic Overseas Total
Substandard 310,823 - 310,823 75,135 - 75,135 75,135 - 75,135 Doubtful - - - - - - - - - Loss 883,043 - 883,043 839,327 - 839,327 839,327 - 839,327
1,193,866 - 1,193,866 914,462 - 914,462 914,462 - 914,462
Domestic Overseas Total Domestic Overseas Total Domestic Overseas Total
Substandard 57,950 - 57,950 8,090 - 8,090 8,090 - 8,090 Doubtful - - - - - - - - - Loss 979,958 - 979,958 885,824 - 885,824 885,824 - 885,824
1,037,908 - 1,037,908 893,914 - 893,914 893,914 - 893,914
10.6 Particulars of provision against non-performing advances
Note Specific General Total Specific General Total
Opening balance 893,914 - 893,914 938,867 - 938,867
Charge during the year 115,664 - 115,664 48,269 - 48,269 Reversal during the year (95,116) - (95,116) (93,222) - (93,222)
Net charge 20,548 - 20,548 (44,953) - (44,953)
Less: Amounts written off during the year 10.7 - - - - - - Closing balance 914,462 - 914,462 893,914 - 893,914
10.6.1 Particulars of provisions against non-performing advances
Specific General Total Specific General Total
In local currency 914,462 - 914,462 893,914 - 893,914 In foreign currencies - - - - - -
914,462 - 914,462 893,914 - 893,914
2015 2014
---------------------------------------------- (Rupees in '000) ---------------------------------------------
---------------------------------------------------------------------------- (Rupees in '000) ------------------------------------------------------------------
2014
2015
Advances include Rs. 1,193.866 million (2014: Rs. 1,037.908 million) which have been placed under the non-performing status as detailed below:
In respect of the aforementioned finance leases the Company holds an aggregate sum of Rs. 219.218 million (2014: Rs. 155.246 million) as security deposits on behalf of the lessees which are included under 'other liabilities' (note 17).
The Company has entered into lease agreements of various vehicles and plant and machinery. The amount recoverable under these arrangements are receivable by the year 2022 and are subject to finance income at rates ranging between 8.03 to 16.11 (2014: 11.13 to 16.11) percent per annum. Maximum amount of lease outstanding as at 31 December 2015 amounts to Rs. 379 million (2014: Rs. 179 million)
Staff loans include personal loans and house loans given to employees in accordance with their terms of appointment. House loans carry mark-up at a rate of 5 (2014: 5) percent per annum, while no mark-up is charged on personal loans.
Classified advances Provision required Provision held
---------------------------------------------- (Rupees in '000) ---------------------------------------------
2015 2014
Provision required Provision held
--------------------------------------------------------------------------------- (Rupees in '000) --------------------------------------------------------------
Classified advances
---------------------------------------------- (Rupees in '000) ---------------------------------------------
2015 2014

2015 2014
10.7 Particulars of write offs
Against provisions - - Directly charged to profit and loss account - -
- -
10.7.1 Write offs of Rs. 500,000 and above - - Write offs of below Rs 500,000 - -
- -
10.7.2 Statement showing written off loans or any other financial relief of five hundred thousand rupees or above provided during the year ended 31 December 2015.
(9+10+11)
1 2 4 5 6 7 8 9 10 11 12
1 Coastal Refinery Limited Lt Gen (R) Amjad Shuaib 37405-0296136-7 Mr. Abdul Hamid 44,595 13,753 14,957 73,305 - 13,753 15,696 29,449
Mr. Ali Faizan Syed 42301-3270649-7 Syed Ashfaq Hussain
Mr. Ali Salman Syed 42301-6981568-1 Syed Ashfaq Hussain
Syed Ashfaq Hussain 42301-4051598-3 Syed Sher Shah
2 Dewan Automotive Enginering Limited Mr. Haroon Iqbal 42301-9916370-5 Mian M. Sharif 6,000 5,199 10,850 22,049 - 5,199 10,850 16,049
Mr. Waseem-ul-Haque Ansari 42000-0384884-7 Mr. Tehsin ul Haque Ansari
Mr. Manzoor Ahmed 42201-1209367-3 Mr. Rehmat Ali
Syed Maqbool Ali 42201-7761421-7 Syed Mahfooz Ali
Mr. Ishtiaq Ahmed 42201-0301293-3 Mr. Abdul Rashid
Mr. Mohammad Baqar Jafferi 33202-1194635-9 Mr. Faiz Muhammad
Mr. Aziz-ul-Haque 42301-8514003-5 Mr. Noor-ul-Haq
3 Dewan Cement Limited Mr. Dewan Muhammad Yousuf Farooqui 42301-6948978-9 Mr. Dewan M. Umer Farooque
7,860 21,503 21,316 50,679 - 10,316 21,316 31,632
Syed Muhammad Anwar 42101-5101100-1 Syed Muhammad Aijaz
Mr. Haroon Iqbal 42301-9916370-5 Mian M. Sharif
Mr. Dewan Abdul Rehman Farooqui 42301-0862043-3 Mr. M. Salman Farooqui
Mr. Ghazanfar Baber Siddiqui 42101-4251145-9 Mr. Nizam uddin
Mr. Aziz-ul-Haque 42301-8514003-5 Mr. Noor-ul-Haq
Mr. Ishtiaq Ahmed 42201-0301293-3 Mr. Abdul Rashid
4 Marvi Pharmaceuticals (Pvt.) Ltd. Mr. Nizar Fazwani 501-40-213808 Mr. Mohammad Ali 2,607 779 - 3,386 - 665 - 665
Address: 'Plot 70, Sector 24, Korangi Industrial AreaKarachi
Ms. Samina 501-089-800662 Mr. Nadir S. Fazwani
61,062 41,234 47,123 149,419 - 29,933 47,862 77,795
10.8 Particulars of loans and advances to directors, associated companies etc. 2015 2014Note
Debts due by directors, executives or officers of the Company or any of them either severally or jointly with any other persons.
Balance at beginning of the year 123,345 120,483 Loans granted during the year 43,118 33,332 Repayments (40,240) (30,470)
Balance at end of the year 126,223 123,345
Debts due by subsidiary company, controlled firms and other related parties
Balance at beginning of the year 278,654 303,278 Loans granted during the year - - Repayments (28,024) (24,624) Balance at end of the year 250,630 278,654
10.8.1 376,853 401,999
10.8.1
10.9
11 OPERATING FIXED ASSETS
Property and equipments 11.1 78,646 66,611 Intangible assets 11.2 115 305 Advance for capital expenditure 3,555 1,753
82,316 68,669
Maximum total amount of advances including temporary advances granted during the year amounts to Rs. 404 million (2014: Rs. 421 million). The maximum amount has been calculated by reference to month end balance.
Outstanding liabilities at beginning of year
3
Father's / Husband's name
(Rupees in '000)
Principal
This includes an amount of Rs. 68.2 million due from Japan Power Generation Limited (an associated company) classified as non performing loan under loss category. The Company has recorded provision for entire amount due as at 31 December 2015.
Address: 10-C, Bukhari Commercial Lane 3,Phase VI, DHA, Karachi.
Address: Block A, 7th Floor, FTC Building, Shahrah-e-Faisal, Karachi
Address: Block A, 7th Floor, FTC Building, Shahrah-e-Faisal, Karachi
(Rupees in '000)
TotalPrincipal written-off
Interest/ mark-up
written off
Other financial relief
provided
Name and address of the borrowerS.No.
---------------------------------------------------------- (Rupees in '000) --------------------------------------------------------------
Name of individuals /partners / directors with CNIC No.
Interest/mark-up
Others Total

11.1 Property and equipments Net book
Owned
Office premises* 42,126 - 42,126 21,763 2,106 23,869 18,257 5
Improvements 12,805 411 13,216 8,295 1,198 9,493 3,723 20- -
Office equipments 9,943 2,356 10,230 8,485 510 7,149 3,081 20(2,069) (1,846)
Computer equipments 17,909 4,398 21,969 15,849 1,867 17,388 4,581 33.33(338) (328)
Furniture and fixtures 12,514 1,826 12,940 11,085 600 10,690 2,250 20(1,400) (995)
Vehicles 66,025 30,483 71,689 29,522 12,782 26,875 44,814 20(24,819) (15,429)
Vehicles 1,727 1,972 1,972 1,439 320 32 1,940 20(1,727) (1,727)
163,049 41,446 174,142 96,438 19,383 95,496 78,646
(30,353) (20,325)
Net book value
Owned
Office premises* 42,126 - 42,126 19,657 2,106 21,763 20,363 5
Improvements 9,863 3,208 12,805 7,836 724 8,295 4,510 20(266) (265)
Office equipments 9,270 931 9,943 8,114 539 8,485 1,458 20(258) (168)
Computer equipments 18,098 1,664 17,909 16,246 1,456 15,849 2,060 33.33(1,853) (1,853)
Furniture and fixtures 12,593 200 12,514 10,729 635 11,085 1,429 20(279) (279)
Vehicles 17,788 28,218 66,025 5,635 10,910 29,522 36,503 2033,342 ** 25,045 **
(13,323) (12,068)
Vehicles 35,069 - 1,727 26,139 345 1,439 288 20(33,342) ** (25,045) **
144,807 34,221 163,049 94,356 16,715 96,438 66,611
(15,979) (2,565)
* The transfer of title of office premises in the Company's name is in process.
value as at 31 December
2015 %
As at 1 January
2015
Additions / (deletions) during the
year
Rate During the year / (on disposals)
Depreciation Cost
--------------------------------------------------------- (Rupees in '000) ------------------------------------------------------------
As at 1 January
2014
Additions / **transfers / (deletions)
during the year
During the year /
**transfers / (on disposals)
As at 1 January
2014
Cost As at 31
December 2015
As at 1 January
2015
Depreciation
Assets subject to finance lease
As at 31 December
2015
%
As at 31 December
2014
Assets subject to finance lease
2014
2015
-------------------------------------------------------- (Rupees in '000) ------------------------------------------------------------
As at 31 December
2014
Rate As at 31 December
2014
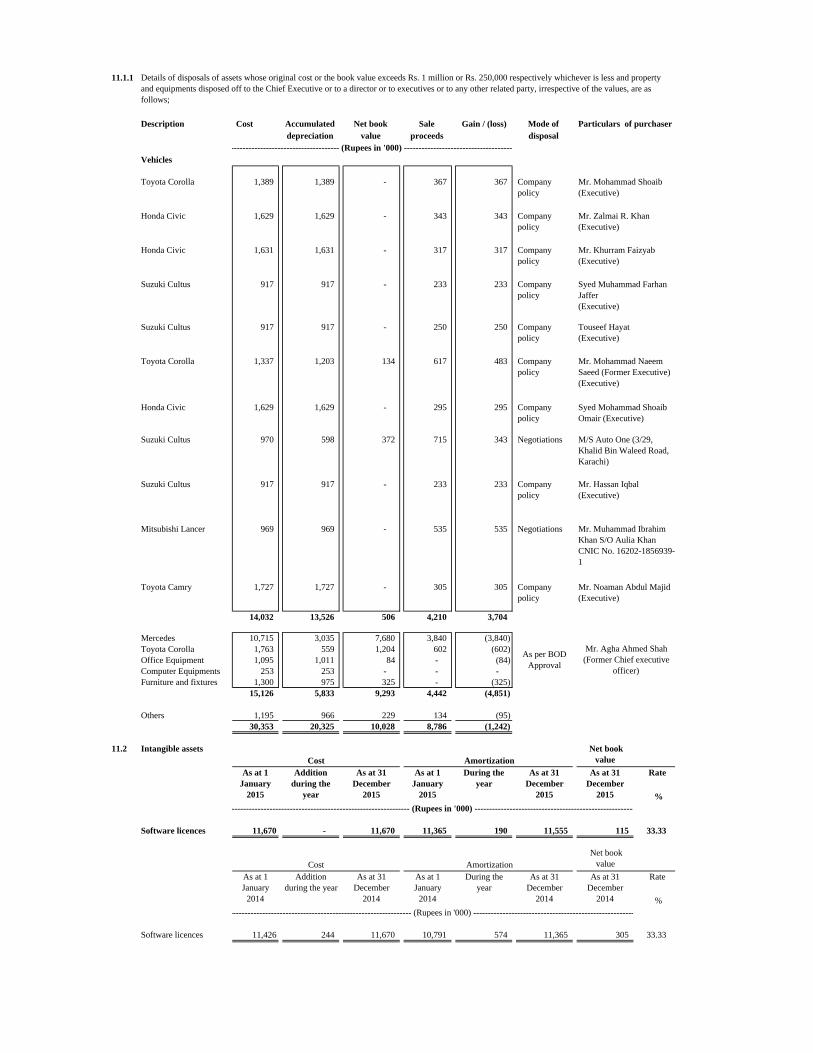
11.1.1
Description Cost Accumulated Net book Sale Gain / (loss) Mode of depreciation value proceeds disposal
Vehicles
Toyota Corolla 1,389 1,389 - 367 367
Honda Civic 1,629 1,629 - 343 343
Honda Civic 1,631 1,631 - 317 317
Suzuki Cultus 917 917 - 233 233
Suzuki Cultus 917 917 - 250 250
Toyota Corolla 1,337 1,203 134 617 483
Honda Civic 1,629 1,629 - 295 295 Company policy
Suzuki Cultus 970 598 372 715 343 Negotiations
Suzuki Cultus 917 917 - 233 233 Company policy
Mitsubishi Lancer 969 969 - 535 535 Negotiations
Toyota Camry 1,727 1,727 - 305 305 Company policy
14,032 13,526 506 4,210 3,704
Mercedes 10,715 3,035 7,680 3,840 (3,840) Toyota Corolla 1,763 559 1,204 602 (602) Office Equipment 1,095 1,011 84 - (84) Computer Equipments 253 253 - - - Furniture and fixtures 1,300 975 325 - (325)
15,126 5,833 9,293 4,442 (4,851)
Others 1,195 966 229 134 (95) 30,353 20,325 10,028 8,786 (1,242)
11.2 Intangible assets
%
Software licences 11,670 - 11,670 11,365 190 11,555 115 33.33
%
Software licences 11,426 244 11,670 10,791 574 11,365 305 33.33
-------------------------------------------------------------- (Rupees in '000) -------------------------------------------------------
Amortization As at 1 January
2014
Addition during the year
As at 31 December
2014
As at 1 January
2014
Net book value
During the year
As at 31 December
2014
As at 31 December
2014
Rate
As at 31 December
2015
------------------------------------- (Rupees in '000) -------------------------------------
Addition during the
year
As at 31 December
2015
During the year
Amortization As at 1
January 2015
As per BOD Approval
Mr. Muhammad Ibrahim Khan S/O Aulia Khan CNIC No. 16202-1856939-1
Cost
Syed Mohammad Shoaib Omair (Executive)
M/S Auto One (3/29, Khalid Bin Waleed Road, Karachi)
Rate
------------------------------------------------------------- (Rupees in '000) -------------------------------------------------------
Mr. Hassan Iqbal (Executive)
Company policy
Company policy
Mr. Zalmai R. Khan(Executive)
Mr. Khurram Faizyab(Executive)
Mr. Mohammad Shoaib(Executive)
Details of disposals of assets whose original cost or the book value exceeds Rs. 1 million or Rs. 250,000 respectively whichever is less and property and equipments disposed off to the Chief Executive or to a director or to executives or to any other related party, irrespective of the values, are as follows;
Particulars of purchaser
Company policy
Touseef Hayat(Executive)
Mr. Mohammad Naeem Saeed (Former Executive)(Executive)
Company policy
As at 31 December
2015
Net book value
As at 1 January
2015
Syed Muhammad Farhan Jaffer(Executive)
Cost
Mr. Agha Ahmed Shah (Former Chief executive
officer)
Mr. Noaman Abdul Majid (Executive)
Company policy
Company policy

11.3 Included in cost of property and equipments are fully depreciated items still in use having cost of:2015 2014
Note
Improvements 6,851 6,851 Office equipments 6,369 7,754 Computer equipments 12,675 14,146 Furniture and fixtures 8,440 9,470 Vehicles 2,494 4,854 Intangible assets 11,426 11,071
48,255 54,146
12. DEFERRED TAX ASSETS Deferred tax assets arising in respect of:
Provision for diminution in the value of investments 319,793 311,670 Assets subject to finance leases 10 70 Provision against other assets - - Amortisation of premium on Federal Government Securities 7,281 573 Provision against non-performing advances 283,483 312,870
610,567 625,183
Less: Deferred tax liabilities arising in respect of:
Accelerated tax depreciation allowances 204 (21) Revaluation on investments classified as available-for-sale 20 (174,611) (165,029) Revaluation on investments classified as held-for-trading 720 (1,394) Net investment in finance leases (57,566) (76,399) Dividend receivable - (2,312)
(231,253) (245,155) 12.1 379,314 380,028
12.1 Movement of deferred tax
1 January 2014
Profit and loss account
Deficit on revaluation of available
for sale securities
Profit and loss
account
Surplus on revaluation of available
for sale securities
Deferred tax assets arising in respect of:
Provision for diminution in the value of investments 233,751 77,919 - 311,670 8,123 - 319,793 Assets subject to finance leases (1,170) 1,240 - 70 (60) - 10 Provision against other assets 1,294 (1,294) - - - - - Amortisation of premium on Federal Government Securities 778 (205) - 573 6,708 - 7,281 Provision against non- performing advances 328,603 (15,733) - 312,870 (29,387) - 283,483
563,256 61,927 - 625,183 (14,616) - 610,567
Less: deferred tax liabilities
arising in respect of:
Accelerated tax depreciation allowances 601 (622) - (21) 225 - 204 Revaluation on investments classified as available-for-sale 52,659 - (217,688) (165,029) - (9,582) (174,611) Revaluation on investments classified as held-for-trading (1,402) 8 - (1,394) 2,114 - 720 Net Investment in finance leases (71,622) (4,777) - (76,399) 18,833 - (57,566) Dividend receivable - (2,312) - (2,312) 2,312 - -
(19,764) (7,703) (217,688) (245,155) 23,484 (9,582) (231,253)
543,492 54,224 (217,688) 380,028 8,868 (9,582) 379,314
(Rupees in '000)
--------------------------------------------------- (Rupees in '000) -------------------------------------------------
Recognized in Recognized in 31 December
2014
31 December 2015

13 OTHER ASSETS 2015 2014Note
Mark-up / return / interest receivable in local currency 428,704 435,238
Dividend income receivable - 23,117 Mark-up / profit receivable on purchase of securities 107,734 111,345 Security deposits 3,938 3,913 Prepayments 10,432 9,486 Receivable against sale of investments 16,240 18,107 Taxation 19,311 50,527 Non-banking assets acquired in satisfaction of claims 13.1 32,096 32,096 Others 4,420 -
622,875 683,829 Less: Provision held against other assets 13.2 - -
622,875 683,829
13.1 Market value of non-banking assets acquired in satisfaction of claims 37,760 37,760
13.2 Provision against other assets
Opening balance - 3,698 Charge for the year - 5,664 Reversals - (3,698)
- 1,966
Amount written off - (5,664) Closing balance - -
14 BORROWINGS
In Pakistan 14,479,440 8,868,730
Outside Pakistan - -
14,479,440 8,868,730
14.1 Particulars of borrowings with respect to currencies
In local currency 14,479,440 8,868,730 In foreign currencies - -
14,479,440 8,868,730
14.2 Particulars of borrowings
Secured Borrowings from the State Bank of Pakistan:- Long term financing for export oreinted projects (LTF - EOP) 14.3 - 14,904 - Long term financing facility (LTFF) 14.3 226,709 777,096 - Financing facility for storage of agricultural produce (FFSAP) 14.3 10,031 13,375
Repurchase agreement borrowings 14.4 9,006,240 5,979,208 Long term borrowings 14.5 1,550,000 516,667 Short term running finance 14.6 187,460 112,980
10,980,440 7,414,230 UnsecuredPlacements 14.7 799,000 1,454,500 Murabaha financing 14.8 2,700,000 -
14,479,440 8,868,730
(Rupees in '000)

14.3
14.4
14.5
14.6
14.7
14.8
15 DEPOSITS AND OTHER ACCOUNTS 2015 2014
Certificates of investment - remunerative (in local currency): Financial institutions 985,726 2,888,748 Others 3,024,134 3,407,238
4,009,860 6,295,986
15.1 Particular of deposits
In local currency 4,009,860 6,295,986 In foreign currency - -
` 4,009,860 6,295,986
15.2
15.3
15.4
16 LIABILITIES AGAINST ASSETS SUBJECT TO FINANCE LEASE
Not later than one year 431 130 301 504 16 488 Later than one year but not later than five years 1,921 249 1,672 - - -
2,352 379 1,973 504 16 488
16.1
The Company has entered into agreements for financing with the SBP of long term finance for export oriented projects to customers. According to the terms of the respective agreements, the SBP has the right to receive the outstanding amount from the Company at the date of maturity of the finances by directly debiting the current account maintained by the Company with the SBP. The rate of return ranges from 6.25 to 10.10 (2014: 5 to 10.10) percent per annum. These are repayable within 7 years (2014: 6 years).
The rate of return on these repurchase agreement borrowings, maturing in January 2016 (2014: January 2015), ranges between 6.20 to 6.45 (2014: 9.5 to 10.30) percent per annum. Securities having cost of Rs 8,479.620 million (2014: Rs 5,969.243 million) have been pledged against these borrowings.
The rate of return on these long-term borrowings ranges from 6.83 to 7.54 (2014: 9.98 to 10.44) percent per annum. The above facilities are secured against advances receivable.
Minimum lease
Payments
Financial charges for
future periods
Financial charges for
future periods
Minimum lease
Payments
The rates of return on these murabaha financing, maturing in January 2016 (2014: NIL) ranges between 6.25 to 6.35 (2014: NIL) percent per annum.
The rate of return on these short-term running finance facility is three months KIBOR + 0.25% (2014: three months KIBOR + 0.25%). The above facility are secured against loan and advances receivable.
The rates of return on these placements, maturing between January 2016 to February 2016 (2014: January 2015 to April 2015) ranges between 6.10 to 7 (2014: 9.50 to 10.15) percent per annum.
(Rupees in '000)
These include Certificate of Investments purchased by gratuity fund of the Company as disclosed in note 32.7.1 and by provident fund of the Company amounting to Rs. 5.36 million (2014: NIL).
The rate of return on deposits maturing between January 2016 to May 2017 (2014: January 2015 to July 2017) ranges between 6.05 to 12 (2014: 9 to 12) percent per annum.
The Company has entered into lease agreements with financial institutions for lease of vehicle. Lease rentals are payable in monthly installments. Financial charges included in lease rentals are determined on the basis of discount factors applied at the rate of 7.90 (2014: 10.58) percent per annum. At the end of lease term, the Company has option to acquire the assets, subject to adjustment of security deposits.
---------------------------------------------- (Rupees in '000) ---------------------------------------------
These include Certificate of Investments purchased by Pak Oman Microfinance Bank Limited (associate) of the Company amounting to Rs. 536 million (2014: 733 million).
2014
Principal outstanding
Principal outstanding
2015

17 OTHER LIABILITIES 2015 2014Note
Mark-up / return / interest payable in local currency 127,724 190,110
Accrued expenses 81,559 68,151 Staff gratuity 32.2 8,961 4,817 Security deposits against investment in finance leases 10.3.1.1 219,218 155,246 Payable against purchase of investments 11,566 36,259 Others 89,242 33,665
538,270 488,248
18 SHARE CAPITAL
18.1 Authorized Capital
2014
1,000,000,000 Ordinary shares of Rs.10 each 10,000,000 10,000,000
18.2 Issued, subscribed and paid-up
615,000,000 Ordinary shares of Rs. 10 each 6,150,000 6,150,000 - Fully paid in cash
615,000,000 6,150,000 6,150,000
18.3
19 RESERVES
19.1 This represents a reserve created at 20% of the profit for the year in compliance with the SBP's requirements.
20 SURPLUS ON REVALUATION OF ASSETS - net of deferred tax
20.1 Surplus on revaluation of available-for-sale securities
Federal Government Securities
- Pakistan Investment Bonds (PIBs) 556,031 491,538 - Ijara Sukuk 3,390 - - Treasury Bills (T-Bills) 5 -
559,426 491,538
Shares - listed 12,076 (13,036)
Term Finance Certificates
- Listed (3,491) (30,734) - Unlisted 4,414 10,669
923 (20,065)
Sukuks - unlisted (2,931) 38
569,494 458,475 Deferred tax recognized 12 (174,611) (165,029)
394,883 293,446
The Ministry of Finance on behalf of the Government of Pakistan and the Sultanate of Oman through its Ministry of Finance each holds 307,495,900 (2014: 307,495,900) ordinary shares of the Company, while 4,100 (2014: 4,100) ordinary shares each are held by the Secretary - Economic Affairs Division, Government of Pakistan and Ministry of Commerce and Industry, Sultanate of Oman.
(Rupees in '000)
615,000,000
615,000,000
1,000,000,000
(Number of shares)2015
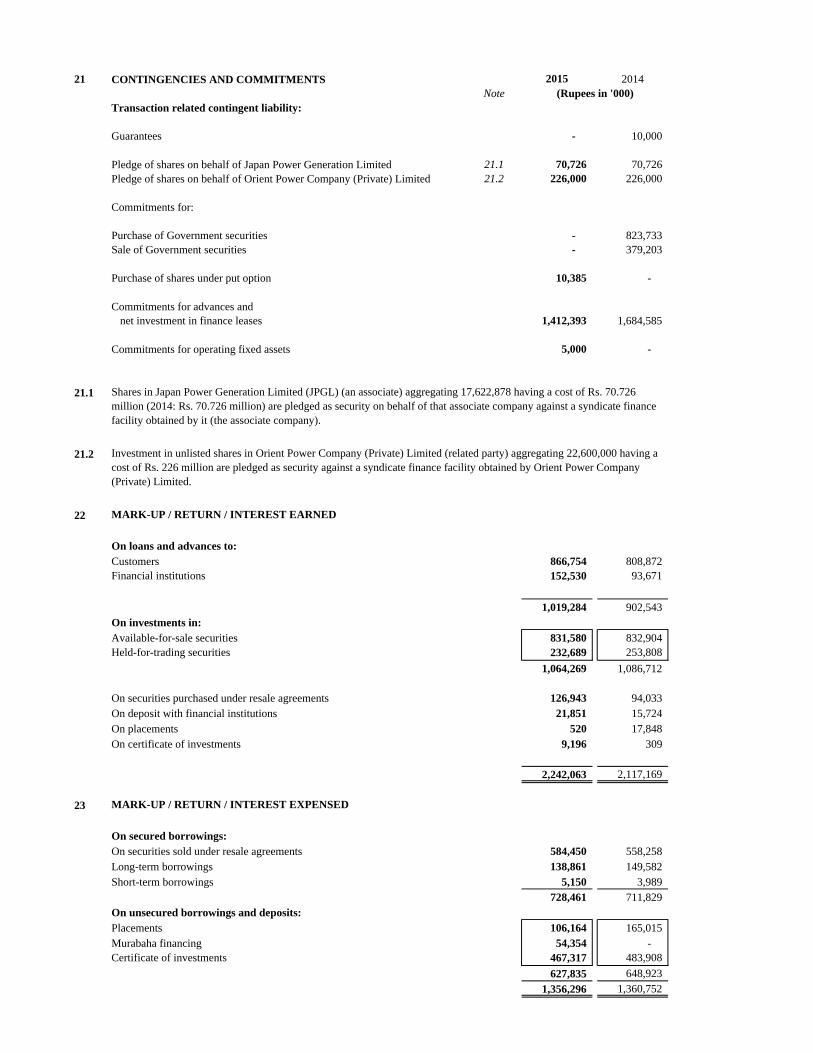
21 CONTINGENCIES AND COMMITMENTS 2015 2014Note
Transaction related contingent liability:
Guarantees - 10,000
Pledge of shares on behalf of Japan Power Generation Limited 21.1 70,726 70,726 Pledge of shares on behalf of Orient Power Company (Private) Limited 21.2 226,000 226,000
Commitments for:
Purchase of Government securities - 823,733 Sale of Government securities - 379,203
Purchase of shares under put option 10,385 -
Commitments for advances and net investment in finance leases 1,412,393 1,684,585
Commitments for operating fixed assets 5,000 -
21.1
21.2
22 MARK-UP / RETURN / INTEREST EARNED
On loans and advances to:Customers 866,754 808,872 Financial institutions 152,530 93,671
1,019,284 902,543 On investments in:Available-for-sale securities 831,580 832,904 Held-for-trading securities 232,689 253,808
1,064,269 1,086,712
On securities purchased under resale agreements 126,943 94,033 On deposit with financial institutions 21,851 15,724 On placements 520 17,848 On certificate of investments 9,196 309
2,242,063 2,117,169
23 MARK-UP / RETURN / INTEREST EXPENSED
On secured borrowings:On securities sold under resale agreements 584,450 558,258 Long-term borrowings 138,861 149,582 Short-term borrowings 5,150 3,989
728,461 711,829 On unsecured borrowings and deposits:Placements 106,164 165,015 Murabaha financing 54,354 - Certificate of investments 467,317 483,908
627,835 648,923
1,356,296 1,360,752
(Rupees in '000)
Investment in unlisted shares in Orient Power Company (Private) Limited (related party) aggregating 22,600,000 having a cost of Rs. 226 million are pledged as security against a syndicate finance facility obtained by Orient Power Company (Private) Limited.
Shares in Japan Power Generation Limited (JPGL) (an associate) aggregating 17,622,878 having a cost of Rs. 70.726 million (2014: Rs. 70.726 million) are pledged as security on behalf of that associate company against a syndicate finance facility obtained by it (the associate company).

24 GAIN ON SALE OF SECURITIES 2015 2014Note
Federal Government Securities- Market Treasury Bills 47,232 5,656 - Pakistan Investment Bonds 390,658 138,029
437,890 143,685 Term Finance Certificates and sukuk certificates (16,329) 2,389 Mutual funds 13,120 11,759 Shares:- Listed 183,445 96,778 - Unlisted - 9,102
618,126 263,713
25 OTHER INCOME
Gain on sale of property and equipment - 1,903
- 1,903
26 ADMINISTRATIVE EXPENSES
Salaries, allowances and employees' benefits 221,883 188,489 Contribution to defined contribution plan 14,375 12,216 Charge for defined benefit plan 32.8 14,250 11,325 Non-executive directors' fee / remuneration 34 19,028 17,897 Chief executive's remuneration 34 75,971 33,392 Traveling and accommodation 11,272 10,017 Rent, rates and taxes 18,628 17,892 Utilities 3,538 2,997 Communications 7,789 7,289 Professional training 2,801 1,419 Advertisement and business promotion 1,668 347 Membership and subscriptions 2,195 2,224 Printing, stationery and periodicals 4,527 2,515 Depreciation 11.1 19,383 16,715 Amortization of intangible assets 11.2 190 574 Auditors' remuneration 26.1 2,909 2,250 Legal and professional charges 13,219 8,449 Repairs and maintenance 8,998 8,211 Transportation 10,237 13,477 Insurance 8,713 7,552 Finance charges on leased assets 16 140 Entertainment and canteen expenses 3,495 2,926 Donations 26.2 1,180 2,356 Others 1,965 2,067
468,230 372,736
26.1 Auditors' remuneration
Audit fee 508 462 Half yearly review 177 161 Special certifications and others 2,003 1,573 Out of pocket expenses 221 54
2,909 2,250
26.2
(Rupees in '000)
Donations were not made to any donee in which a director or his spouse had any interest at any time during the year.

26.2.1 Donations made in excess of Rs. 0.1 million to a single donee are as follows:
2015 2014Note
The Cardiovascular Foundation - 1,000 The Kidney Centre Post Graduation Training Institute - 500 The Citizen Foundation 154 200 Al-Mehrab Tibbi Imdad 140 105 Burns Centre 140 105 Patients' Aid Foundation of Jinnah Post Graduate Medical Centre 550 -
984 1,910
27 OTHER CHARGES
Fees, commission and others 34,768 16,505 Loss on sale of fixed assets 1,242 - SBP penalties 100 1,568
36,110 18,073
28 TAXATION
For the yearCurrent 357,943 215,914 Prior 23,718 - Deferred (8,868) (54,224)
372,793 161,690
28.1 Relationship between tax expense and accounting profit
Profit before taxation 975,264 545,283
Tax at the applicable rate of 32% (2014: 33%) 312,084 179,943 Tax effect due to change in tax rate 62,559 - Tax effect of income taxed at different rate (18,169) (19,256) Tax effect of capital loss / (gain) on listed shares and mutual funds (20,229) (11,808) Tax effect of provision for diminution in the value of listed shares and mutual funds 13,470 14,310 Prior year 23,718 - Net tax effect of income not subject to tax and expenses that are not allowable in determining taxable income tax charge (640) (1,499)
372,793 161,690
28.2 Tax contingencies
28.3 Taxation - prior
The Income tax Department has amended the deemed assessment orders for the tax years 2004, 2009, 2010, 2011, 2012 and 2013, wherein major issues raised by the authorities were related to applicability of Workers Welfare Fund (WWF), disallowance of allocation of common expenses and disallowance of losses claimed on early termination of leased assets. The Company's appeals are pending at various appellate forums. Management estimates that sufficient provisions have been made and no further provision is required.
(Rupees in '000)
Finance Act, 2015 imposed super tax at 3% on the taxable income for the tax year 2015 for rehabilitation of temporarily displaced persons.

29 EARNINGS PER SHARE 2015 2014
Profit after taxation 602,471 383,593
Weighted average number of ordinary shares in issue 615,000 615,000
Basic and diluted earnings per share 0.98 0.62
29.1 There were no convertible dilutive potential ordinary shares outstanding on 31 December 2015 and 2014.
30 CASH AND CASH EQUIVALENTS 2015 2014Note
Cash and balances with treasury banks 6 93,725 99,912 Balances with other banks 7 1,586,956 269,173 Placements 8 - 25,000
1,680,681 394,085
31 STAFF STRENGTH (Number)
Permanent 68 66 Temporary / contractual 3 6 Company's own staff strength at end of the year 71 72
Outsourced 27 26 Total staff strength 98 98
32 DEFINED BENEFIT PLAN
32.1 General Description
32.1.1 Principal actuarial assumptions
2015 2014
Discount rate 10.00 11.25Expected rate of increase in salary levels 10.00 11.25Expected rate of return on plan assets 10.00 11.25
Mortality rates assumed were based on the SLIC 2001-2005 mortality table.
2015 2014Note
32.2 Reconciliation of amount payable to defined benefit plan
Present value of defined benefit obligation 32.3 111,643 93,349 Fair value of plan assets 32.5 (102,682) (88,532)
32.4 8,961 4,817
(Rupees in '000)
Rupees in '000
(Rupees in '000)
The latest actuarial valuation for defined benefit plan scheme was carried out as at 31 December 2015 using the Projected Unit Credit Method (PUCM). The following significant assumptions were used for the actuarial valuation:
Numbers in '000
Rupees
The expected return on plan assets is based on the market expectations and depends upon the asset portfolio of the Company, at the beginning of the period, for returns over the entire life of the related obligation.
(Percent per annum)
General description of the defined benefit plan and accounting policy for recognising actuarial gains and losses is disclosed in note 5.12.1 to the financial statements.

2015 2014Note
32.3 Movement in the defined benefit obligation:
Present value of obligation as at 1 January 93,349 68,821 Current service cost 14,690 11,729 Interest cost 9,730 8,842 Benefits paid (13,721) (1,608) Actuarial loss on remeasurement of obligation 7,595 5,565 Present value of obligation as at 31 December 111,643 93,349
32.4 Movement in payable to defined benefit plan:
Opening liability 4,817 4,876 Expense for the year 32.8 14,250 11,325 Other Comprehensive Income 7,343 4,583 Contributions to the fund (17,449) (15,967) Closing liability 8,961 4,817
32.5 Movement in the fair value of plan assets:
Fair value of plan assets as at 1 January 88,532 63,945 Expected return on plan assets 10,170 9,246 Contributions 17,449 15,967 Benefits paid (13,721) (1,608) Actuarial gain on remeasurement of plan assets 252 982 Fair value of plan assets as at 31 December 32.7 102,682 88,532
32.6 Actual return on plan assets during the year was Rs. 10.422 million (2014: Rs. 10.228 million).
32.7 The plan assets are comprised as follows:
Particulars 2015 2014 Note Rating Rating (Rupees in % (Rupees in %
'000) '000)
Market Treasury Bills Unrated Unrated - - 3,030 3.42 Pakistan Investment Bonds Unrated Unrated 39,086 38.07 37,827 42.73 Special Saving Certificates (SSCs) Unrated Unrated 60,239 58.67 46,547 52.58 Term Finance Certificates - WorldCall Telecom Limited D D 747 0.73 885 1.00
Certificate of Investments 32.7.1 Unrated Unrated 2,223 2.16 - - Bank balance Unrated Unrated 387 0.37 243 0.27
102,682 100.00 88,532 100.00
32.7.1
2015 2014
32.8 The amount recognised in the profit and loss account is as follows:
Current service cost 14,690 11,729 Net Interest (440) (404) Expected return on plan assets - - Actuarial loss - -
14,250 11,325
These include Certificate of Investment held with the Company. These carry mark-up at rates ranging from 6.35 to 6.50 (2014: NIL) percent per annum.
(Rupees in '000)
2015 2014
(Rupees in '000)
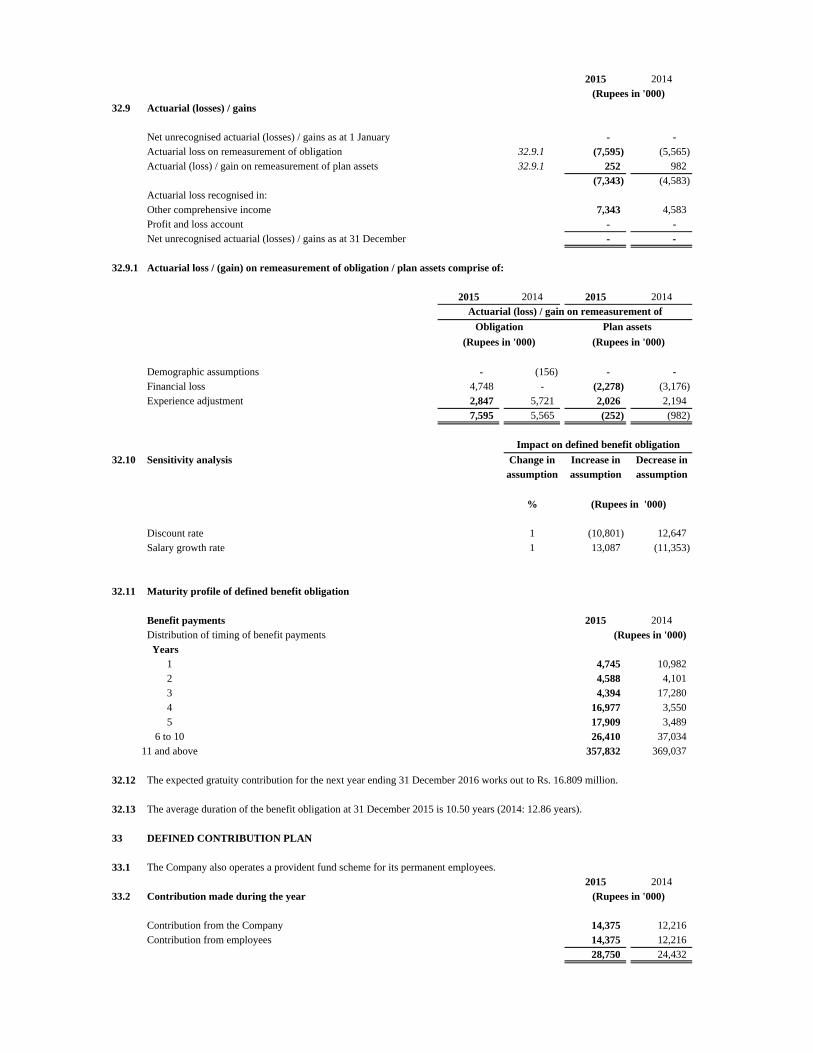
2015 2014
32.9 Actuarial (losses) / gains
Net unrecognised actuarial (losses) / gains as at 1 January - - Actuarial loss on remeasurement of obligation 32.9.1 (7,595) (5,565) Actuarial (loss) / gain on remeasurement of plan assets 32.9.1 252 982
(7,343) (4,583) Actuarial loss recognised in:Other comprehensive income 7,343 4,583 Profit and loss account - - Net unrecognised actuarial (losses) / gains as at 31 December - -
32.9.1 Actuarial loss / (gain) on remeasurement of obligation / plan assets comprise of:
2015 2014 2015 2014
Demographic assumptions - (156) - - Financial loss 4,748 - (2,278) (3,176) Experience adjustment 2,847 5,721 2,026 2,194
7,595 5,565 (252) (982)
32.10 Sensitivity analysis Change in Increase in Decrease inassumption assumption assumption
%
Discount rate 1 (10,801) 12,647 Salary growth rate 1 13,087 (11,353)
32.11 Maturity profile of defined benefit obligation
Benefit payments 2015 2014Distribution of timing of benefit payments
Years1 4,745 10,982 2 4,588 4,101 3 4,394 17,280 4 16,977 3,550 5 17,909 3,489
6 to 10 26,410 37,034 11 and above 357,832 369,037
32.12 The expected gratuity contribution for the next year ending 31 December 2016 works out to Rs. 16.809 million.
32.13 The average duration of the benefit obligation at 31 December 2015 is 10.50 years (2014: 12.86 years).
33 DEFINED CONTRIBUTION PLAN
33.1 The Company also operates a provident fund scheme for its permanent employees.
2015 2014
33.2 Contribution made during the year
Contribution from the Company 14,375 12,216 Contribution from employees 14,375 12,216
28,750 24,432
(Rupees in '000)
(Rupees in '000)
Obligation
Actuarial (loss) / gain on remeasurement of
(Rupees in '000)
(Rupees in '000)
Plan assets
Impact on defined benefit obligation
(Rupees in '000)
(Rupees in '000)

34 COMPENSATION OF DIRECTORS AND EXECUTIVES
2015 2014 2015 2014 2015 2014
Fees / remuneration - - 19,028 17,897 - - Managerial remuneration 73,809 31,931 - - 195,338 163,503 Charge for defined benefit plan 2,395 1,138 - - 11,671 9,905 Contribution to defined contribution plan 2,085 1,737 - - 12,209 10,149 Medical 763 400 - - - - Utilities 979 626 - - 258 251 Membership fee 156 100 - - 44 33 Others 264 335 - - 638 597
80,451 36,267 19,028 17,897 220,158 184,438
Number of persons 2 1 5 5 65 63
34.1
34.2
35 FAIR VALUE OF FINANCIAL INSTRUMENTS
The re-pricing profile, effective rates and maturity are stated in notes 39.3.5 and 39.4.1 respectively.
35.1 On-balance sheet financial instruments
Book value Fair value Book value Fair value
Assets Cash and balances with treasury banks 93,725 93,725 99,912 99,912 Balances with other banks 1,586,956 1,586,956 269,173 269,173 Lendings to financial institutions 362,824 362,824 614,177 614,177 Investments 14,073,356 14,182,538 12,179,521 12,306,799 Advances 9,993,263 9,993,263 9,070,314 9,070,314 Other assets 561,036 561,036 591,720 591,720
26,671,160 26,780,342 22,824,817 22,952,095
Liabilities Borrowings from financial institutions 14,479,440 14,479,440 8,868,730 8,868,730
Deposits and other accounts 4,009,860 4,009,860 6,295,986 6,295,986 Liabilities against assets subject to finance lease 1,973 1,973 488 488 Other liabilities 529,309 529,309 483,431 483,431
19,020,582 19,020,582 15,648,635 15,648,635
7,650,578 7,759,760 7,176,182 7,303,460
Federal Government Securities PKRV rates (Reuters page)Listed securities Market pricesMutual funds Net asset valuesUnlisted equity investments
35.2 The carrying value of all financial assets and liabilities in the financial statements approximate to their fair values except for certain investment in an associate.
-------------------------------------------------- (Rupees in '000) ---------------------------------------------------
2014
---------------------------- (Rupees in '000) --------------------------------
The managing director and certain executives are provided with free use of Company’s maintained cars. Executive means employees other than managing director and directors, whose basic salary exceeds five hundred thousand rupees in a financial year.
The fair value of traded investments is based on quoted market prices and has been disclosed in note 9. Unquoted equity investments, other than investments in associates and subsidiary, are determined on the basis of break-up value of these investments as per the latest available audited financial statements. The provision for impairment of investments has been determined in accordance with the Company's accounting policy as stated in notes 2.3 and 5.5 to these unconsolidated financial statements.
Fair value of fixed term advances of over one year, staff loans and fixed term deposits of over one year cannot be calculated with sufficient reliability due to non - availability of relevant active market for similar assets and liabilities. The provision for impairment of debt securities and loans and advances has been calculated in accordance with the accounting policies of the company.
Fair value is the amount for which an asset could be exchanged, or a liability settled, between knowledgeable willing parties in an arm's length transaction. Fair value of financial instruments is based on:
Break - up value as per latest available audited financial statements.
Chief Executive Non-Executive Directors Executives
2015
Fair value of fixed term loans, other assets, other liabilities and fixed term deposits cannot be calculated with sufficient reliability due to the absence of current and active market for such assets and liabilities and reliable data regarding market rates for similar instruments. The provision against advances has been calculated in accordance with the Company's accounting policy as stated in note 5.7.2.
In the opinion of management, the fair value of the remaining financial assets and liabilities are not significantly different from their carrying values since assets and liabilities are either short-term in nature or in the case of customer loans and deposits are frequently repriced.
This includes an amount of Rs 30.998 million being compensation package in addition to the remuneration of Rs 40.704 million paid till 9 October2015 to ougoing Chief Executive Officer.

35.3 The table below analyses financial instruments measured at the end of the reporting period by the level in the fair value hierarchy into which the fair value measurement is categorised:
On balance sheet financial instruments
Note HFT Available for HTM Loans and Other financial Other financial Total Level 1 Level 2 Level 3 Total
sale receivables assets liabilities
Financial assets measured at fair value
- Investments
Government Securities 888,567 8,703,572 - - - - 9,592,139 - 9,592,139 - 9,592,139
Listed Term Finance Certificates - 740,573 - - - - 740,573 - 740,573 - 740,573
Unlisted Term Finance Certificates - 847,675 - - - - 847,675 - 847,675 - 847,675
Sukuk Certificates - 789,807 789,807 - 789,807 - 789,807
Listed shares 102,525 621,716 - - - - 724,241 724,241 - - 724,241
- Associates - -
Listed shares - - - - 19,864 - 19,864 121,018 - - 121,018
Mutual funds - - - - 490,517 - 490,517 539,798 - - 539,798
- -
Financial assets not measured at fair value
- Cash and bank balances with treasury banks 35.3.1 - - - 93,725 - - 93,725 - - - -
- Balances with other banks 35.3.1 - - - 1,586,956 - - 1,586,956 - - - -
- Lending to financial instruments 35.3.1 - - - 362,824 - - 362,824 - - - -
- Unlisted shares 35.3.1 - 242,907 - - - - 242,907 - - - -
- Associates - unlisted shares 35.3.1 - - - - 384,708 - 384,708 - - - -
- Subsidiary - unlisted shares 35.3.1 - - - - 240,925 - 240,925 - - - -
- Advances 35.3.1 - - - 9,993,263 - - 9,993,263 - - - -
- Other assets 35.3.1 - - - - 561,036 - 561,036 - - - -
991,092 11,946,250 - 12,036,768 1,697,050 - 26,671,160 1,385,057 11,970,194 - 13,355,251
Financial liabilities not measured at fair value
- Borrowings from financial institutions 35.3.1 - - - - - 14,479,440 14,479,440 - - - -
- Deposits and other accounts 35.3.1 - - - - - 4,009,860 4,009,860 - - - -
- Liabilities against assets subject to finance lease 35.3.1 - - - - - 1,973 1,973 - - - -
- Other liabilities 35.3.1 - - - - - 529,309 529,309 - - - -
- - - - - 19,020,582 19,020,582 - - - -
991,092 11,946,250 - 12,036,768 1,697,050 (19,020,582) 7,650,578 1,385,057 11,970,194 - 13,355,251
31 December 2015
Fair value
------------------------------------------------------------------------------------------- (Rupees in '000) -------------------------------------------------------------------------------------------

The table below analyses financial instruments measured at the end of the reporting period by the level in the fair value hierarchy into which the fair value measurement is categorised:
On balance sheet financial instruments
Note HFT Available for HTM Loans and Other financial Other financial Total Level 1 Level 2 Level 3 Total
sale receivables assets liabilities
Financial assets measured at fair value
- Investments
Government Securities 658,781 7,113,460 - - - - 7,772,241 - 7,772,241 - 7,772,241
Listed Term Finance Certificates - 977,915 - - - - 977,915 - 977,915 - 977,915
Unlisted Term Finance Certificates - 610,405 - - 610,405 - 610,405 - 610,405
Sukuk Certificates - 984,196 - - - - 984,196 - 984,196 - 984,196
Listed shares 55,122 512,912 - - - - 568,034 568,034 - - 568,034
- Associates
Listed shares - - - - 19,864 - 19,864 105,433 - - 105,433
Mutual funds - - - - 591,987 - 591,987 658,702 - - 658,702
Financial assets not measured at fair value - -
- Cash and bank balances with treasury banks 35.3.1 - - - 99,912 - - 99,912 - - - -
- Balances with other banks 35.3.1 - - - 269,173 - - 269,173 - - - -
- Lending to financial instruments 35.3.1 - - - 614,177 - - 614,177 - - - -
- Unlisted shares 35.3.1 - 258,765 - - - - 258,765 - - - -
- Associates - unlisted shares 35.3.1 - - - - 384,708 - 384,708 - - - -
- Subsidiary - unlisted shares 35.3.1 - - - - 11,406 - 11,406 - - - -
- Advances 35.3.1 - - - 9,070,314 - - 9,070,314 - - - -
- Other assets 35.3.1 - - - - 591,720 - 591,720 - - - -
713,903 10,457,653 - 10,053,576 1,599,685 - 22,824,817 1,332,169 10,344,757 - 11,676,926
Financial liabilities not measured at fair value
- Borrowings from financial institutions 35.3.1 - - - - - 8,868,730 8,868,730 - - - -
- Deposits and other accounts 35.3.1 - - - - - 6,295,986 6,295,986 - - - -
- Liabilities against assets subject to finance lease 35.3.1 - - - - - 488 488 - - - -
- Other liabilities 35.3.1 - - - - - 483,431 483,431 - - - -
- - - - - 15,648,635 15,648,635 - - - -
713,903 10,457,653 - 10,053,576 1,599,685 (15,648,635) 7,176,182 1,332,169 10,344,757 - 11,676,926
The Company measures fair values using the following fair value hierarchy that reflects the significance of the inputs used in making the measurements:
Level 1: Fair value measurements using quoted prices (unadjusted) in active markets for identical assets or liabilities.
Level 2: Fair value measurements using inputs other than quoted prices included within Level 1 that are observable for the assets or liability, either directly (i.e. as prices) or indirectly (i.e. derived from prices).
Level 3: Fair value measurements using input for the asset or liability that are not based on observable market data (i.e. unobservable inputs).
35.3.1 The Company has not disclosed the fair values for these financial assets and liabilities, as these are for short term or reprice over short term. Therefore their carrying amounts are reasonable approximation of fair value.
31 December 2014
Fair value
----------------------------------------------------------------------------------------- (Rupees in '000) ----------------------------------------------------------------------------------

36 SEGMENT ANALYSIS WITH RESPECT TO BUSINESS ACTIVITIES
The segment analysis with respect to business activity is as follows:
Corporate Trading & Commercial Finance Sales Banking
2015
Total income 15,026 1,989,646 1,027,363 Total expenses 73,365 1,147,109 836,297
Net (loss) / income (58,339) 842,537 191,066 Segment assets (gross) - 18,061,190 11,305,332 Segment non-performing advances - - 1,193,866 Investments provided for - 1,773,913 - Segment provision required * - 1,257,431 914,462 Segment liabilities - 11,528,129 7,501,414 Segment return on net assets (%) - 15.97% 6.61%Segment return on assets (ROA) (%) - 5.01% 1.84%Segment cost of funds (%) - 5.50% 5.64%
2014
Total income 5,090 1,588,873 925,880 Total expenses 56,754 1,231,468 686,338
Net (loss) / income (51,664) 357,405 239,542 Segment assets (gross) - 14,963,198 10,422,329 Segment non-performing advances - - 1,037,908 Investments provided for - 1,664,234 - Segment provision required* - 1,125,990 893,914 Segment liabilities - 8,775,239 6,878,213 Segment return on net assets (%) - 7.06% 9.04%Segment return on assets (ROA) (%) - 2.58% 2.51%Segment cost of funds (%) - 6.72% 6.93%
* The provision against each segment represents provision held in advances and investments.
37 RELATED PARTY TRANSACTIONS
37.1 Subsidiary
Pak Oman Asset Management Company Limited
37.2 Associates
Japan Power Generation LimitedPak Oman Microfinance Bank LimitedPak Oman Advantage FundPak Oman Advantage Islamic Income FundPak Oman Islamic Asset Allocation Fund Pak Oman Advantage Asset Allocation Fund Pak Oman Government Securities Fund
37.3 Key management personnel
All heads of departments Directors
37.4 Retirement benefit fund
Defined benefit planDefined contribution plan
37.5 Other related party
Orient Power Company (Private) Limited
---------------- (Rupees in '000) ----------------
The Company has related party relationship with its associates, subsidiary company, employee benefit plans, company having common directors and its key management personnel (including their associates). The details of investments in subsidiary company and associates are stated in note 9 to these financial statements.
Contributions to the accounts in respect of staff retirement benefits are made in accordance with actuarial valuation / terms of the contribution plan. Remuneration of the key management personnel are in accordance with the terms of their employment. Advances are given to employees as per the Company's Policy. Transactions with other related parties are carried out on commercial terms and as per market rates.
The nature of the relationships and transactions with related parties, other than those which have been specifically disclosed elsewhere in the financial statements are as follows:
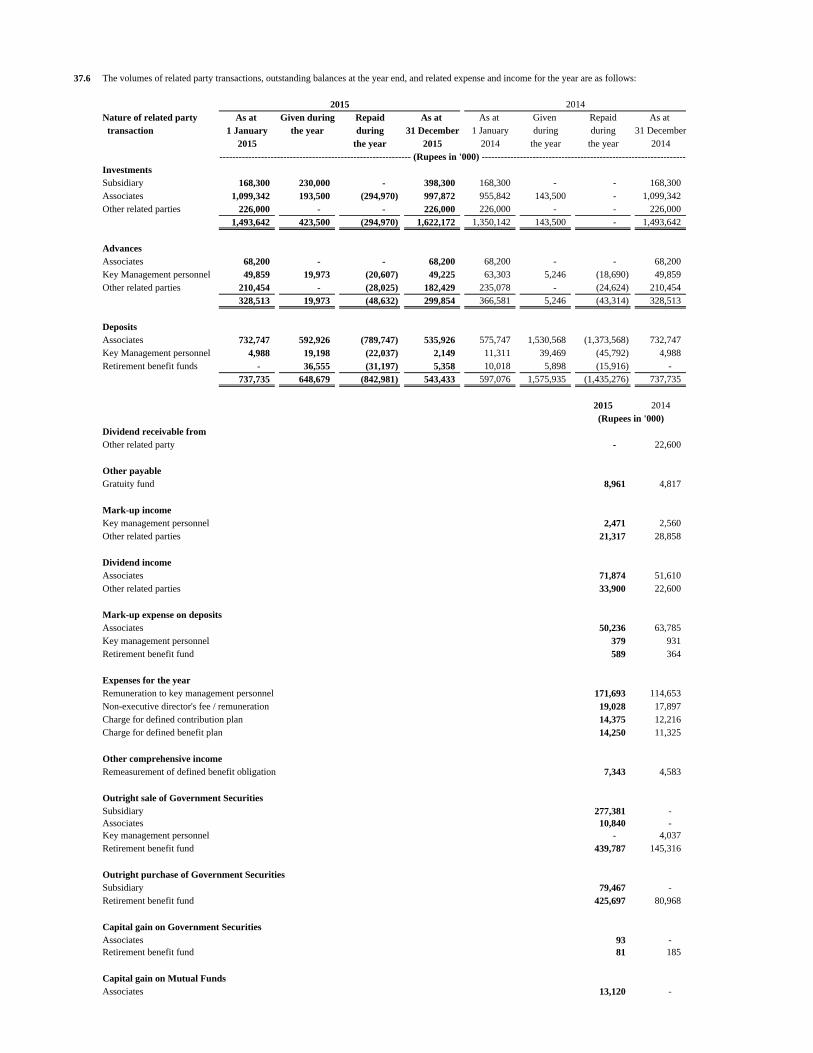
37.6
Nature of related party As at Given during Repaid As at As at Given Repaid As at transaction 1 January the year during 31 December 1 January during during 31 December
2015 the year 2015 2014 the year the year 2014
InvestmentsSubsidiary 168,300 230,000 - 398,300 168,300 - - 168,300 Associates 1,099,342 193,500 (294,970) 997,872 955,842 143,500 - 1,099,342 Other related parties 226,000 - - 226,000 226,000 - - 226,000
1,493,642 423,500 (294,970) 1,622,172 1,350,142 143,500 - 1,493,642
AdvancesAssociates 68,200 - - 68,200 68,200 - - 68,200 Key Management personnel 49,859 19,973 (20,607) 49,225 63,303 5,246 (18,690) 49,859 Other related parties 210,454 - (28,025) 182,429 235,078 - (24,624) 210,454
328,513 19,973 (48,632) 299,854 366,581 5,246 (43,314) 328,513
DepositsAssociates 732,747 592,926 (789,747) 535,926 575,747 1,530,568 (1,373,568) 732,747 Key Management personnel 4,988 19,198 (22,037) 2,149 11,311 39,469 (45,792) 4,988 Retirement benefit funds - 36,555 (31,197) 5,358 10,018 5,898 (15,916) -
737,735 648,679 (842,981) 543,433 597,076 1,575,935 (1,435,276) 737,735
2015 2014
Dividend receivable fromOther related party - 22,600
Other payableGratuity fund 8,961 4,817
Mark-up incomeKey management personnel 2,471 2,560 Other related parties 21,317 28,858
Dividend incomeAssociates 71,874 51,610 Other related parties 33,900 22,600
Mark-up expense on depositsAssociates 50,236 63,785 Key management personnel 379 931 Retirement benefit fund 589 364
Expenses for the yearRemuneration to key management personnel 171,693 114,653 Non-executive director's fee / remuneration 19,028 17,897 Charge for defined contribution plan 14,375 12,216 Charge for defined benefit plan 14,250 11,325
Other comprehensive incomeRemeasurement of defined benefit obligation 7,343 4,583
Outright sale of Government SecuritiesSubsidiary 277,381 - Associates 10,840 - Key management personnel - 4,037 Retirement benefit fund 439,787 145,316
Outright purchase of Government SecuritiesSubsidiary 79,467 - Retirement benefit fund 425,697 80,968
Capital gain on Government SecuritiesAssociates 93 - Retirement benefit fund 81 185
Capital gain on Mutual FundsAssociates 13,120 -
2015 2014
------------------------------------------------------------- (Rupees in '000) ----------------------------------------------------------------
(Rupees in '000)
The volumes of related party transactions, outstanding balances at the year end, and related expense and income for the year are as follows:

38 CAPITAL ADEQUACY
38.1 Capital management policies and procedures
The Company’s objectives when managing capital are:
- to comply with the capital requirements set by the regulators of the Company;
- to safeguard the Company’s ability to continue as a going concern so that it can continue to provide returns for shareholders and benefits for other stakeholders; and
- to acquire, develop and maintain a strong capital base to support the development of its business.
The Company’s regulatory capital is divided into three tiers:
The Company calculates capital reqruirement as per Basel III regulatory framework, using the following approaches:
- Credit risk Standardized approach- Market risk Standardized approach- Operational risk Basic indicator approach
38.2 The Company's CAR as at 31 December 2015 was 35.62% of its risk weighted exposure.
The capital adequacy ratio of the Bank was subject to the Basel III capital adequacy guidelines stipulated by the State Bank of Pakistan through its circular BPRD Circular No. 06 of 2013 dated 15 August 2013. These instructions are effective from 31 December 2013 in a phased manner with full implementation intended by 31 December 2019.
The calculation of capital adequacy enables the DFIs' to assess the long term soundness. The Company has successfully managed in the past and will in the future its Capital requirements/ needs. Based on the directives of the Board, the Company has built a health portfolio of assets and liabilities focusing on quality. CAR of 35.62% demonstrates that the company is geared to absorb major risks / shocks in the present market scenario. The Company meets its capital needs through clean placements (LOP & COI) and short and long term lines from commercial institutions.
Capital adequacy and the use of regulatory capital are monitored frequently by the Company’s management, employing techniques based on the guidelines issued by State Bank of Pakistan (SBP).
The risk-weighted assets are measured by means of a hierarchy of five risk weights classified according to the nature of and reflecting an estimate of credit, market and other risks associated with each asset and counterparty, taking into account any eligible collateral or guarantees. A similar treatment is adopted for off-balance sheet exposure, with some adjustments to reflect the more contingent nature of the potential losses.
- Common Equity Tier 1 capital (CET1), which includes fully paid up capital (including the bonus shares), balance in share premium account, general reserves, statutory reserves as per the financial statements and net unappropriated profits after all regulatory adjustments applicable on CET1 (refer note 38.3).
The table refer in note 38.3 summarizes the composition of regulatory capital and the ratios of the Company for the year ended 31 December 2015.
Additional Tier 1 Capital (AT1), which includes perpetual non-cumulative preference shares and Share premium resulting from the issuance of preference shares balance in share premium account after all regulatory adjustments applicable on AT1 (refer note 38.3).
Tier 2 capital, which includes Subordinated debt/ Instruments, share premium of issuance of Subordinated debt/ Instruments, general provisions for loan losses (up to a maximum of 1.25 % of credit risk weighted assets), Net of tax reserves on revaluation of fixed assets and equity investments up to a maximum of 45 % of the balance and foreign exchange translation reserves after all regulatory adjustments applicable on Tier-2 (refer note 38.3).
SBP requires each development financial institution to: (a) hold the minimum level of the regulatory capital of Rs. 6 billion as at 31 December 2009 and in future periods till further notification issued by SBP, and (b) maintain a ratio of total regulatory capital to the risk-weighted asset as per the CAMELS Rating assigned to the institution or above the minimum prescribed level of 10%.

38.3 Capital Adequacy Ratio (CAR) disclosure template:2015 2014
Amount Amount Rows # Common Equity Tier 1 capital (CET1): Instruments and reserves
1 Fully Paid-up Capital/ Capital deposited with SBP 6,150,000 6,150,000 2 Balance in Share Premium Account3 Reserve for issue of Bonus Shares4 Discount on Issue of shares5 General/ Statutory Reserves 843,304 722,810 6 Gain/(Losses) on derivatives held as Cash Flow Hedge7 Unappropriated/unremitted profits/ (losses) 776,899 545,915 8 Minority Interests arising from CET1 capital instruments issued to third parties by consolidated
bank subsidiaries (amount allowed in CET1 capital of the consolidation group) - 9 CET 1 before Regulatory Adjustments 7,770,203 7,418,725 10 Total regulatory adjustments applied to CET1 (Note 38.3.1) 631,839 1,044,930 11 Common Equity Tier 1 7,138,364 6,373,795
Additional Tier 1 (AT 1) Capital12 Qualifying Additional Tier-1 capital instruments plus any related share premium13 of which: Classified as equity - 14 of which: Classified as liabilities - 15 Additional Tier-1 capital instruments issued to third parties by consolidated subsidiaries (amount
allowed in group AT 1) - 16 of which: instrument issued by subsidiaries subject to phase out - 17 AT1 before regulatory adjustments - 18 Total regulatory adjustment applied to AT1 capital (Note 38.3.2) 460,474 786,342 19 Additional Tier 1 capital after regulatory adjustments - 20 Additional Tier 1 capital recognized for capital adequacy -
21 Tier 1 Capital (CET1 + admissible AT1) (11+20) 7,138,364 6,373,795
Tier 2 Capital22 Qualifying Tier 2 capital instruments under Basel III plus any related share premium - 23 Tier 2 capital instruments subject to phaseout arrangement issued under pre-Basel 3 rules - 24 Tier 2 capital instruments issued to third parties by consolidated subsidiaries (amount allowed in
group tier 2) - 25 of which: instruments issued by subsidiaries subject to phase out - 26 General provisions or general reserves for loan losses-up to maximum of 1.25% of Credit Risk
Weighted Assets - 27 Revaluation Reserves (net of taxes) - 28 of which: Revaluation reserves on fixed assets - 29 of which: Unrealized gains/losses on AFS 221,134 164,330 30 Foreign Exchange Translation Reserves - 31 Undisclosed/Other Reserves (if any) - 32 T2 before regulatory adjustments33 Total regulatory adjustment applied to T2 capital (Note 38.3.3) 340,804 507,136 34 Tier 2 capital (T2) after regulatory adjustments35 Tier 2 capital recognized for capital adequacy36 Portion of Additional Tier 1 capital recognized in Tier 2 capital37 Total Tier 2 capital admissible for capital adequacy - - 38 TOTAL CAPITAL (T1 + admissible T2) (21+37) 7,138,364 6,373,795
39 Total Risk Weighted Assets (RWA) {for details refer Note 38.6} 20,039,488 20,448,383
Capital Ratios and buffers (in percentage of risk weighted assets)40 CET1 to total RWA 35.62% 31.17%41 Tier-1 capital to total RWA 35.62% 31.17%42 Total capital to total RWA 35.62% 31.17%43 Bank specific buffer requirement (minimum CET1 requirement plus capital conservation buffer
plus any other buffer requirement) - - 44 of which: capital conservation buffer requirement - - 45 of which: countercyclical buffer requirement - - 46 of which: D-SIB or G-SIB buffer requirement - - 47 CET1 available to meet buffers (as a percentage of risk weighted assets) - -
National minimum capital requirements prescribed by SBP48 CET1 minimum ratio 6.0% 5.5%49 Tier 1 minimum ratio 7.5% 7.0%50 Total capital minimum ratio 10.25% 10.0%
(Rupees in '000)
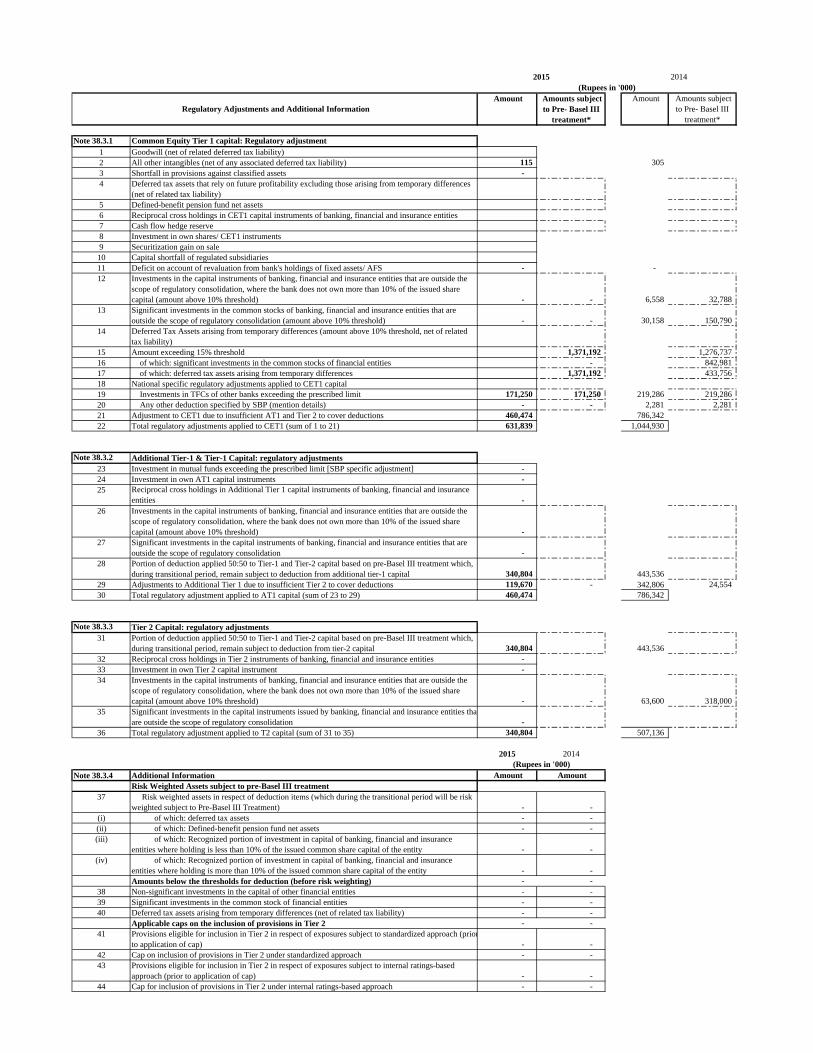
Amount Amounts subject to Pre- Basel III
treatment*
Amount Amounts subject to Pre- Basel III
treatment*
Note 38.3.1 Common Equity Tier 1 capital: Regulatory adjustments1 Goodwill (net of related deferred tax liability)2 All other intangibles (net of any associated deferred tax liability) 115 305 3 Shortfall in provisions against classified assets - 4 Deferred tax assets that rely on future profitability excluding those arising from temporary differences
(net of related tax liability)5 Defined-benefit pension fund net assets 6 Reciprocal cross holdings in CET1 capital instruments of banking, financial and insurance entities7 Cash flow hedge reserve8 Investment in own shares/ CET1 instruments9 Securitization gain on sale 10 Capital shortfall of regulated subsidiaries 11 Deficit on account of revaluation from bank's holdings of fixed assets/ AFS - - 12 Investments in the capital instruments of banking, financial and insurance entities that are outside the
scope of regulatory consolidation, where the bank does not own more than 10% of the issued share capital (amount above 10% threshold) - - 6,558 32,788
13 Significant investments in the common stocks of banking, financial and insurance entities that are outside the scope of regulatory consolidation (amount above 10% threshold) - - 30,158 150,790
14 Deferred Tax Assets arising from temporary differences (amount above 10% threshold, net of related tax liability)
15 Amount exceeding 15% threshold 1,371,192 1,276,737 16 of which: significant investments in the common stocks of financial entities - 842,981 17 of which: deferred tax assets arising from temporary differences 1,371,192 433,756 18 National specific regulatory adjustments applied to CET1 capital19 Investments in TFCs of other banks exceeding the prescribed limit 171,250 171,250 219,286 219,286 20 Any other deduction specified by SBP (mention details) - - 2,281 2,281 21 Adjustment to CET1 due to insufficient AT1 and Tier 2 to cover deductions 460,474 786,342 22 Total regulatory adjustments applied to CET1 (sum of 1 to 21) 631,839 1,044,930
Note 38.3.2 Additional Tier-1 & Tier-1 Capital: regulatory adjustments23 Investment in mutual funds exceeding the prescribed limit [SBP specific adjustment] - 24 Investment in own AT1 capital instruments - 25 Reciprocal cross holdings in Additional Tier 1 capital instruments of banking, financial and insurance
entities - 26 Investments in the capital instruments of banking, financial and insurance entities that are outside the
scope of regulatory consolidation, where the bank does not own more than 10% of the issued share capital (amount above 10% threshold) -
27 Significant investments in the capital instruments of banking, financial and insurance entities that are outside the scope of regulatory consolidation -
28 Portion of deduction applied 50:50 to Tier-1 and Tier-2 capital based on pre-Basel III treatment which, during transitional period, remain subject to deduction from additional tier-1 capital 340,804 443,536
29 Adjustments to Additional Tier 1 due to insufficient Tier 2 to cover deductions 119,670 - 342,806 24,554 30 Total regulatory adjustment applied to AT1 capital (sum of 23 to 29) 460,474 786,342
Note 38.3.3 Tier 2 Capital: regulatory adjustments31 Portion of deduction applied 50:50 to Tier-1 and Tier-2 capital based on pre-Basel III treatment which,
during transitional period, remain subject to deduction from tier-2 capital 340,804 443,536 32 Reciprocal cross holdings in Tier 2 instruments of banking, financial and insurance entities - 33 Investment in own Tier 2 capital instrument - 34 Investments in the capital instruments of banking, financial and insurance entities that are outside the
scope of regulatory consolidation, where the bank does not own more than 10% of the issued share capital (amount above 10% threshold) - - 63,600 318,000
35 Significant investments in the capital instruments issued by banking, financial and insurance entities thatare outside the scope of regulatory consolidation -
36 Total regulatory adjustment applied to T2 capital (sum of 31 to 35) 340,804 507,136
2015 2014
Note 38.3.4 Additional Information Amount Amount Risk Weighted Assets subject to pre-Basel III treatment
37 Risk weighted assets in respect of deduction items (which during the transitional period will be risk weighted subject to Pre-Basel III Treatment) - -
(i) of which: deferred tax assets - - (ii) of which: Defined-benefit pension fund net assets - - (iii) of which: Recognized portion of investment in capital of banking, financial and insurance
entities where holding is less than 10% of the issued common share capital of the entity - - (iv) of which: Recognized portion of investment in capital of banking, financial and insurance
entities where holding is more than 10% of the issued common share capital of the entity - - Amounts below the thresholds for deduction (before risk weighting) - -
38 Non-significant investments in the capital of other financial entities - - 39 Significant investments in the common stock of financial entities - - 40 Deferred tax assets arising from temporary differences (net of related tax liability) - -
Applicable caps on the inclusion of provisions in Tier 2 - - 41 Provisions eligible for inclusion in Tier 2 in respect of exposures subject to standardized approach (prior
to application of cap) - - 42 Cap on inclusion of provisions in Tier 2 under standardized approach - - 43 Provisions eligible for inclusion in Tier 2 in respect of exposures subject to internal ratings-based
approach (prior to application of cap) - - 44 Cap for inclusion of provisions in Tier 2 under internal ratings-based approach - -
Regulatory Adjustments and Additional Information
(Rupees in '000)
2015 2014(Rupees in '000)

38.4 Capital Structure Reconciliation
Table: 38.4.1Balance sheet of the published
financial statementsUnder regulatory scope of
consolidation(in thousand PKR) As at period end As at period endAssets (1) (2) (3)Cash and balances with treasury banks 93,725 93,725 Balanced with other banks 1,586,956 1,586,956 Lending to financial institutions 362,824 362,824 Investments 14,073,356 14,073,356 Advances 9,993,263 9,993,263 Operating fixed assets 82,316 82,316 Deferred tax assets 379,314 379,314 Other assets 622,875 622,875 Total assets 27,194,629 27,194,629
Liabilities & EquityBills payable - - Borrowings 14,479,440 14,479,440 Deposits and other accounts 4,009,860 4,009,860 Sub-ordinated loans - - Liabilities against assets subject to finance lease 1,973 1,973 Deferred tax liabilities - - Other liabilities 538,270 538,270 Total liabilities 19,029,543 19,029,543
Share capital/ Head office capital account 6,150,000 6,150,000 Reserves 843,304 843,304 Unappropriated/ Unremitted profit/ (losses) 776,899 776,899 Minority Interest - - Surplus on revaluation of assets 394,883 394,883 Total liabilities & equity 27,194,629 27,194,629
Table: 38.4.2Balance sheet as in published
financial statementsUnder regulatory scope of
consolidationReference
As at period end As at period endAssets (1) (2) (3) (4)Cash and balances with treasury banks 93,725 93,725 Balanced with other banks 1,586,956 1,586,956 Lending to financial institutions 362,824 362,824 Investments 14,073,356 14,073,356 of which: Non-significant investments in the capital instruments of banking, financial and insurance entities exceeding 10% threshold a of which: significant investments in the capital instruments issued by banking, financial and insurance entities exceeding regulatory threshold b of which: Mutual Funds exceeding regulatory threshold c of which: reciprocal crossholding of capital instrument (separate for CET1, AT1, T2) d of which: others (mention details) eAdvances 9,993,263 9,993,263 shortfall in provisions/ excess of total EL amount over eligible provisions under IRB f general provisions reflected in Tier 2 capital gFixed Assets 82,316 82,316 Deferred Tax Assets 610,567 610,567 of which: DTAs that rely on future profitability excluding those arising from temporary differences h of which: DTAs arising from temporary differences exceeding regulatory threshold iOther assets 622,875 622,875 of which: Goodwill j of which: Intangibles k of which: Defined-benefit pension fund net assets lTotal assets 27,425,882 27,425,882
Liabilities & EquityBills payable - - Borrowings 14,479,440 14,479,440 Deposits and other accounts 4,009,860 4,009,860 Sub-ordinated loans - - of which: eligible for inclusion in AT1 m of which: eligible for inclusion in Tier 2 nLiabilities against assets subject to finance lease 1,973 1,973 Deferred tax liabilities 231,253 231,253 of which: DTLs related to goodwill o of which: DTLs related to intangible assets p of which: DTLs related to defined pension fund net assets q of which: other deferred tax liabilities rOther liabilities 538,270 538,270 Total liabilities 19,260,796 19,260,796
Share capital 6,150,000 6,150,000 of which: amount eligible for CET1 6,150,000 6,150,000 s of which: amount eligible for AT1 tReserves 843,304 843,304 of which: portion eligible for inclusion in CET1(provide breakup) 843,304 843,304 u of which: portion eligible for inclusion in Tier 2 vUnappropriated profit/ (losses) 776,899 776,899 wMinority Interest - of which: portion eligible for inclusion in CET1 - x of which: portion eligible for inclusion in AT1 y of which: portion eligible for inclusion in Tier 2 zSurplus on revaluation of assets 394,883 394,883 of which: Revaluation reserves on Fixed Assets of which: Unrealized Gains/Losses on AFS 394,883 394,883 In case of Deficit on revaluation (deduction from CET1) abTotal liabilities & Equity 27,425,882 27,425,882
aa

Table: 38.4.3
Component of regulatory capital reported by bank
Source based on reference number from step 2
Common Equity Tier 1 capital (CET1): Instruments and reserves1 Fully Paid-up Capital/ Capital deposited with SBP 6,150,000 2 Balance in Share Premium Account - 3 Reserve for issue of Bonus Shares - 4 General/ Statutory Reserves 843,304 5 Gain/(Losses) on derivatives held as Cash Flow Hedge - 6 Unappropriated/unremitted profits/ (losses) 776,899 (w)7 Minority Interests arising from CET1 capital instruments issued to third party by consolidated bank
subsidiaries (amount allowed in CET1 capital of the consolidation group)-
(x)
8 CET 1 before Regulatory AdjustmentsCommon Equity Tier 1 capital: Regulatory adjustments
9 Goodwill (net of related deferred tax liability) - (j) - (o)10 All other intangibles (net of any associated deferred tax liability) 115 (k) - (p)11 Shortfall of provisions against classified assets - (f)12 Deferred tax assets that rely on future profitability excluding those arising from temporary differences (net of
related tax liability) - {(h) - (r} * x%
13 Defined-benefit pension fund net assets - {(l) - (q)} * x%14 Reciprocal cross holdings in CET1 capital instruments - (d)15 Cash flow hedge reserve - 16 Investment in own shares/ CET1 instruments - 17 Securitization gain on sale - 18 Capital shortfall of regulated subsidiaries - 19 Deficit on account of revaluation from bank's holdings of fixed assets/ AFS - (ab)20 Investments in the capital instruments of banking, financial and insurance entities that are outside the scope of
regulatory consolidation, where the bank does not own more than 10% of the issued share capital (amount above 10% threshold)
- (a) - (ac) - (ae)
21 Significant investments in the capital instruments issued by banking, financial and insurance entities that are outside the scope of regulatory consolidation (amount above 10% threshold)
- (b) - (ad) - (af)
22 Deferred Tax Assets arising from temporary differences (amount above 10% threshold, net of related tax liability)
- (i)
23 Amount exceeding 15% threshold - 24 of which: significant investments in the common stocks of financial entities - 25 of which: deferred tax assets arising from temporary differences - 26 National specific regulatory adjustments applied to CET1 capital - 27 of which: Investment in TFCs of other banks exceeding the prescribed limit 171,250 28 of which: Any other deduction specified by SBP (mention details) - 29 Regulatory adjustment applied to CET1 due to insufficient AT1 and Tier 2 to cover deductions 460,474 30 Total regulatory adjustments applied to CET1 (sum of 9 to 29) 631,839 31 Common Equity Tier 1 7,138,364
Additional Tier 1 (AT 1) Capital32 Qualifying Additional Tier-1 instruments plus any related share premium - 33 of which: Classified as equity - (t)34 of which: Classified as liabilities - (m)35 Additional Tier-1 capital instruments issued by consolidated subsidiaries and held by third parties (amount
allowed in group AT 1) - (y)36 of which: instrument issued by subsidiaries subject to phase out - 37 AT1 before regulatory adjustments -
Additional Tier 1 Capital: regulatory adjustments - 38 Investment in mutual funds exceeding the prescribed limit (SBP specific adjustment) - 39 Investment in own AT1 capital instruments - 40 Reciprocal cross holdings in Additional Tier 1 capital instruments - 41 Investments in the capital instruments of banking, financial and insurance entities that are outside the scope of
regulatory consolidation, where the bank does not own more than 10% of the issued share capital (amount above 10% threshold) - (ac)
42 Significant investments in the capital instruments issued by banking, financial and insurance entities that are outside the scope of regulatory consolidation - (ad)
43 Portion of deduction applied 50:50 to core capital and supplementary capital based on pre-Basel III treatment which, during transitional period, remain subject to deduction from tier-1 capital 340,804
44 Regulatory adjustments applied to Additional Tier 1 due to insufficient Tier 2 to cover deductions 119,670 45 Total of Regulatory Adjustment applied to AT1 capital (sum of 38 to 44) 460,474 46 Additional Tier 1 capital 47 Additional Tier 1 capital recognized for capital adequacy -
48 Tier 1 Capital (CET1 + admissible AT1) (31+47) 7,138,364
Tier 2 Capital49 Qualifying Tier 2 capital instruments under Basel III plus any related share premium - 50 Capital instruments subject to phase out arrangement from tier 2 (Pre-Basel III instruments) - 51 Tier 2 capital instruments issued to third party by consolidated subsidiaries (amount allowed in group tier 2) - (z)52 of which: instruments issued by subsidiaries subject to phase out - 53 General Provisions or general reserves for loan losses-up to maximum of 1.25% of Credit Risk Weighted Assets
- (g)54 Revaluation Reserves - 55 of which: Revaluation reserves on fixed assets - 56 of which: Unrealized Gains/Losses on AFS 221,134 57 Foreign Exchange Translation Reserves - (v)58 Undisclosed/Other Reserves (if any) - 59 T2 before regulatory adjustments -
Tier 2 Capital: regulatory adjustments60 Portion of deduction applied 50:50 to core capital and supplementary capital based on pre-Basel III treatment
which, during transitional period, remain subject to deduction from tier-2 capital - 61 Reciprocal cross holdings in Tier 2 instruments62 Investment in own Tier 2 capital instrument 63 Investments in the capital instruments of banking, financial and insurance entities that are outside the scope of
regulatory consolidation, where the bank does not own more than 10% of the issued share capital (amount above 10% threshold) - (ae)
64 Significant investments in the capital instruments issued by banking, financial and insurance entities that are outside the scope of regulatory consolidation - (af)
65 Amount of Regulatory Adjustment applied to T2 capital (sum of 60 to 64) - 66 Tier 2 capital (T2)67 Tier 2 capital recognized for capital adequacy68 Excess Additional Tier 1 capital recognized in Tier 2 capital69 Total Tier 2 capital admissible for capital adequacy - 70 TOTAL CAPITAL (T1 + admissible T2) (48+69) 7,138,364
(n)
portion of (aa)
Basel III Disclosure Template (with added column)
(s)
(u)

38.5 Main Features Template of Regulatory Capital Instruments
1 Issuer
2 Unique identifier (eg KSE Symbol or Bloomberg identifier etc.) Not Applicable
3 Governing law(s) of the instrument SECP
Regulatory treatment
4 Transitional Basel III rules
5 Post-transitional Basel III rules
6 Eligible at solo/ group/ group&solo
7 Instrument type
8 Amount recognized in regulatory capital (Currency in PKR thousands, as of reporting date)
6,150,000
9 Par value of instrument PKR 10
10 Accounting classification Shareholder Equity
11 Original date of issuance 23-Jul-01
12 Perpetual or dated Perpetual
13 Original maturity date No maturity
14 Issuer call subject to prior supervisory approval No maturity
15 Optional call date, contingent call dates and redemption amount Not Applicable
16 Subsequent call dates, if applicable Not Applicable
Coupons / dividends
17 Fixed or floating dividend/ coupon Not Applicable
18 coupon rate and any related index/ benchmark Not Applicable
19 Existence of a dividend stopper No
20 Fully discretionary, partially discretionary or mandatory Fully discretionary
21 Existence of step up or other incentive to redeem No
22 Noncumulative or cumulative Not Applicable
23 Convertible or non-convertible Not Convertible
24 If convertible, conversion trigger (s) Not Applicable
25 If convertible, fully or partially Not Applicable
26 If convertible, conversion rate Not Applicable
27 If convertible, mandatory or optional conversion Not Applicable
28 If convertible, specify instrument type convertible into Not Applicable
29 If convertible, specify issuer of instrument it converts into Not Applicable
30 Write-down feature Not Applicable
31 If write-down, write-down trigger(s) Not Applicable
32 If write-down, full or partial Not Applicable
33 If write-down, permanent or temporary Not Applicable
34 If temporary write-down, description of write-up mechanism Not Applicable
35 Position in subordination hierarchy in liquidation (specify instrument type immediately senior to instrument
Not Applicable
36 Non-compliant transitioned features No
37 If yes, specify non-compliant features Not Applicable
Pak Oman Investment Company Limited
Common Equity Tier 1
Common Equity Tier 1
Group and stand alone
Common shares

38.6 Risk Weighted Assets
2015 2014 2015 2014Credit Risk
On-Balance sheet
Portfolios subject to standardized approach (Simple or Comprehensive)
Public Sector entities 3,595 6,154 35,949 61,541 Banks 137,575 33,259 1,375,751 332,585 Corporate 853,205 725,654 8,532,049 7,256,535 Retail 1,016 891 10,163 8,905 Residential Mortgages 3,944 3,902 39,436 39,015 Past Due loans 25,755 10,858 257,546 108,581 Operating Fixed Assets 8,220 6,836 82,201 68,364 Other assets 157,116 163,390 1,571,160 1,633,897
Off-Balance sheet
Non-market related 96,280 110,252 962,801 1,102,520
Equity Exposure Risk in the Banking Book 133,465 204,505 1,334,653 2,045,048
Total Credit Risk 1,420,171 1,265,701 14,201,709 12,656,991
Market Risk
Capital Requirement for portfolios subject to Standardized Approach
Interest rate risk 192,757 372,233 2,409,458 4,652,915 Equity position risk 115,879 109,863 1,448,488 1,373,292
Total Market Risk 308,636 482,096 3,857,946 6,026,207
Operational Risk
Capital Requirement for operational risks 158,387 141,215 1,979,833 1,765,185
TOTAL 1,887,194 1,889,012 20,039,488 20,448,383
Capital Adequacy RatiosRequired Actual Required Actual
CET1 to total RWA 10.00% 35.62% 10.00% 31.17%Tier-1 capital to total RWA 10.00% 35.62% 10.00% 31.17%Total capital to total RWA 10.00% 35.62% 10.00% 31.17%Leverage Ratio 3.00% 24.68% 3.00% 24.02%
Capital Requirements Risk Weighted Assets
2015 2014
------------------------------ (Rupees in '000) -----------------------------

39. RISK MANAGEMENT
Risk management organisation
39.1 Credit risk
Exposures
Corporate Yes Yes xBanks Yes Yes xSovereigns x x xSME's x x xSecuritizations x x xOthers (Specify) x x x
Credit exposures subject to Standardised Approach
Rating Amount Deduction Net amount Amount Deduction Net amount
Category Outstanding CRM* Outstanding CRM*
Corporate 0 - - - - 289,177 289,177 1 876,589 362,824 1,239,413 200,000 - 200,000 2 3,754,116 (292,824) 3,461,292 3,537,525 (289,177) 3,248,348
3-4 - - - 286,250 - 286,250 5-6 92,723 - 92,723 - - -
Unrated 1,451,898 (70,000) 1,381,898 4,473,170 - 4,473,170
6,175,326 - 6,175,326 8,496,945 - 8,496,945
Banks 0 - - - - 100,000 100,000 1 1,957,259 - 1,957,259 294,173 (100,000) 194,173
2-3 1,768,598 - 1,768,598 587,500 - 587,500 4-5 100,000 100,000 - - -
Unrated - - - - - -
3,825,857 - 3,825,857 881,673 - 881,673 Sovereigns etc.Unrated*CRM = Credit Risk Mitigation
The accounting policies and methods used by the Company are in accordance with the requirements of the Prudential Regulations of the SBP. These policies are disclosed in note 5 to these financial statements. Reconciliation in the provision against non-performing advances has been disclosed in note 10.5 of these financial statements.
A multi-tiered approach is being followed in the management of credit risk with the organizational structure, roles and responsibilities clearly outlined in the Credit Policy Manual. The Board is responsible for final approval of overall risk tolerance, limits for sectors and pricing strategies. Various business units responsible for undertaking risks are expected to comply with the credit policy and adhere to the independent risk management function. This is ensured through the implementation of a credit approval and documentation process adopted by the Company.
Other (specify)
Exposures
JCR-VIS
The Company uses both external and internal ratings to evaluate risk. The Company obtains external ratings from PACRA and JCR-VIS whereas a comprehensive risk assessment matrix model is used for internal ratings.
------------------------------------------------- (Rupees in '000) -------------------------------------------------
The Company's risk management, compliance and internal audit department support the risk management function. The compliance department ensures that all the directives and guidelines issued by SBP are being complied with. Internal audit department reviews the compliance of internal control procedures with internal and regulatory standards.
2015 2014
PACRA
The Company has set up objectives and policies to manage the risks that arise in connection with financial instruments. The risk management framework and policies of the Company are guided by specific objectives to ensure that comprehensive and adequate risk management policies are established to mitigate the salient risk elements in operations of the Company. The establishment of the overall financial risk management objectives is consistent and in tandem with the strategy to create and enhance shareholders' value, whilst guided by a prudent and robust framework of risk management policies. In achieving the objective of maximizing returns to shareholders, the board of directors takes cognizance of the risk elements that the Company is confronted with in its operations. In view of the multi-faceted risks inherent in the financial sector, the Company places great emphasis on the importance of risk management and has put in place clear and comprehensive risk management mechanisms and strategies to identify, monitor, manage and control the relevant risk factors.
Risk Management Department ensures that risks remain within the boundaries as defined by the board, comply with the risk parameters and prudential limits, establish systems and procedures and work out remedial measures.
Credit Committee implements credit risk policy and monitors credit risk in light with credit policy and prudential regulations.
Credit risk is the risk that one party to a financial instrument will fail to discharge an obligation and cause the other party to incur a financial loss. Exposure to credit risks for the Company arises primarily from lending activities and investments in fixed income securities.
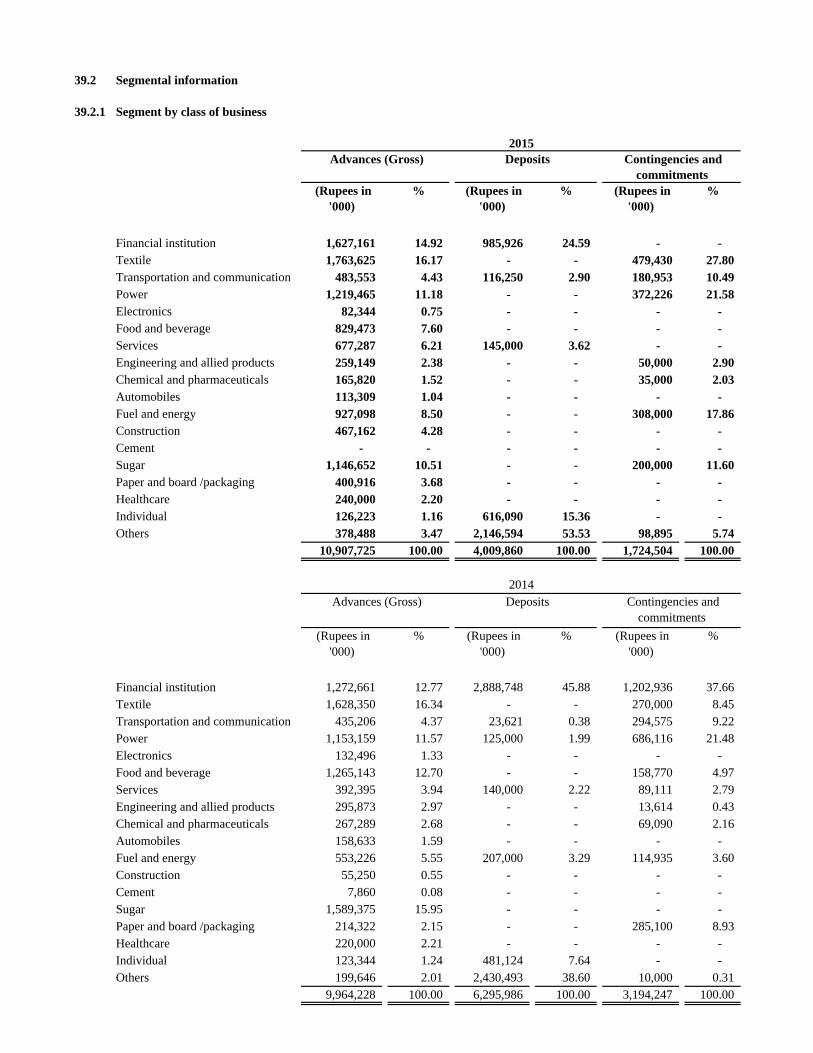
39.2 Segmental information
39.2.1 Segment by class of business
(Rupees in '000)
% (Rupees in '000)
% (Rupees in '000)
%
Financial institution 1,627,161 14.92 985,926 24.59 - - Textile 1,763,625 16.17 - - 479,430 27.80 Transportation and communication 483,553 4.43 116,250 2.90 180,953 10.49 Power 1,219,465 11.18 - - 372,226 21.58 Electronics 82,344 0.75 - - - - Food and beverage 829,473 7.60 - - - - Services 677,287 6.21 145,000 3.62 - - Engineering and allied products 259,149 2.38 - - 50,000 2.90 Chemical and pharmaceuticals 165,820 1.52 - - 35,000 2.03 Automobiles 113,309 1.04 - - - - Fuel and energy 927,098 8.50 - - 308,000 17.86 Construction 467,162 4.28 - - - - Cement - - - - - - Sugar 1,146,652 10.51 - - 200,000 11.60 Paper and board /packaging 400,916 3.68 - - - - Healthcare 240,000 2.20 - - - - Individual 126,223 1.16 616,090 15.36 - - Others 378,488 3.47 2,146,594 53.53 98,895 5.74
10,907,725 100.00 4,009,860 100.00 1,724,504 100.00
(Rupees in '000)
% (Rupees in '000)
% (Rupees in '000)
%
Financial institution 1,272,661 12.77 2,888,748 45.88 1,202,936 37.66 Textile 1,628,350 16.34 - - 270,000 8.45 Transportation and communication 435,206 4.37 23,621 0.38 294,575 9.22 Power 1,153,159 11.57 125,000 1.99 686,116 21.48 Electronics 132,496 1.33 - - - - Food and beverage 1,265,143 12.70 - - 158,770 4.97 Services 392,395 3.94 140,000 2.22 89,111 2.79 Engineering and allied products 295,873 2.97 - - 13,614 0.43 Chemical and pharmaceuticals 267,289 2.68 - - 69,090 2.16 Automobiles 158,633 1.59 - - - - Fuel and energy 553,226 5.55 207,000 3.29 114,935 3.60 Construction 55,250 0.55 - - - - Cement 7,860 0.08 - - - - Sugar 1,589,375 15.95 - - - - Paper and board /packaging 214,322 2.15 - - 285,100 8.93 Healthcare 220,000 2.21 - - - - Individual 123,344 1.24 481,124 7.64 - - Others 199,646 2.01 2,430,493 38.60 10,000 0.31
9,964,228 100.00 6,295,986 100.00 3,194,247 100.00
Advances (Gross)
2015 Contingencies and
commitments
2014 Contingencies and
commitments Deposits
Deposits Advances (Gross)
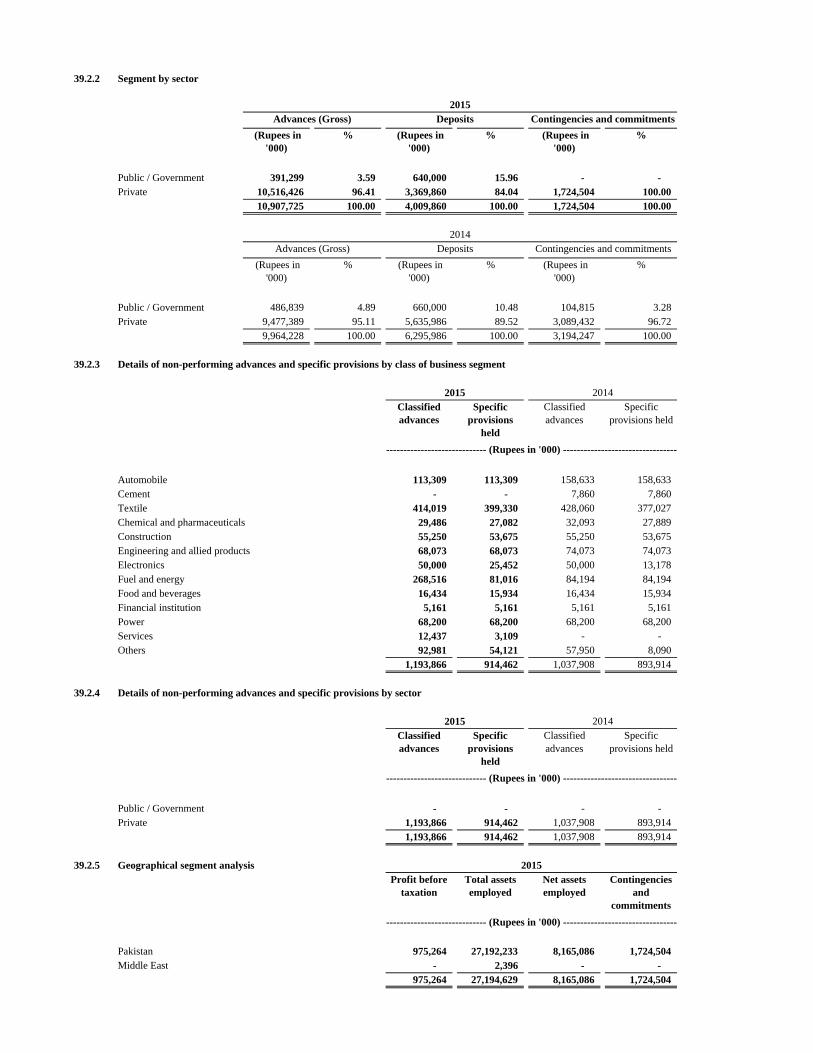
39.2.2 Segment by sector
Public / Government 391,299 3.59 640,000 15.96 - - Private 10,516,426 96.41 3,369,860 84.04 1,724,504 100.00
10,907,725 100.00 4,009,860 100.00 1,724,504 100.00
(Rupees in '000)
% (Rupees in '000)
% (Rupees in '000)
%
Public / Government 486,839 4.89 660,000 10.48 104,815 3.28 Private 9,477,389 95.11 5,635,986 89.52 3,089,432 96.72
9,964,228 100.00 6,295,986 100.00 3,194,247 100.00
39.2.3 Details of non-performing advances and specific provisions by class of business segment
Automobile 113,309 113,309 158,633 158,633 Cement - - 7,860 7,860 Textile 414,019 399,330 428,060 377,027 Chemical and pharmaceuticals 29,486 27,082 32,093 27,889 Construction 55,250 53,675 55,250 53,675 Engineering and allied products 68,073 68,073 74,073 74,073 Electronics 50,000 25,452 50,000 13,178 Fuel and energy 268,516 81,016 84,194 84,194 Food and beverages 16,434 15,934 16,434 15,934 Financial institution 5,161 5,161 5,161 5,161 Power 68,200 68,200 68,200 68,200 Services 12,437 3,109 - - Others 92,981 54,121 57,950 8,090
1,193,866 914,462 1,037,908 893,914
39.2.4 Details of non-performing advances and specific provisions by sector
Public / Government - - - - Private 1,193,866 914,462 1,037,908 893,914
1,193,866 914,462 1,037,908 893,914
39.2.5 Geographical segment analysis
Pakistan 975,264 27,192,233 8,165,086 1,724,504 Middle East - 2,396 - -
975,264 27,194,629 8,165,086 1,724,504
2015
Specific provisions held
2014
Profit before taxation
Total assets employed
Net assets employed
Contingencies and
commitments
(Rupees in '000)
%
Contingencies and commitmentsAdvances (Gross)
Classified advances
------------------------------ (Rupees in '000) ---------------------------------
Specific provisions
held
2014
Deposits
%
2014Specific
provisions heldClassified advances
Advances (Gross)
2015
(Rupees in '000)
Deposits Contingencies and commitments
(Rupees in '000)
------------------------------ (Rupees in '000) ---------------------------------
%
2015
------------------------------ (Rupees in '000) ---------------------------------
Specific provisions
held
2015Classified advances
Classified advances
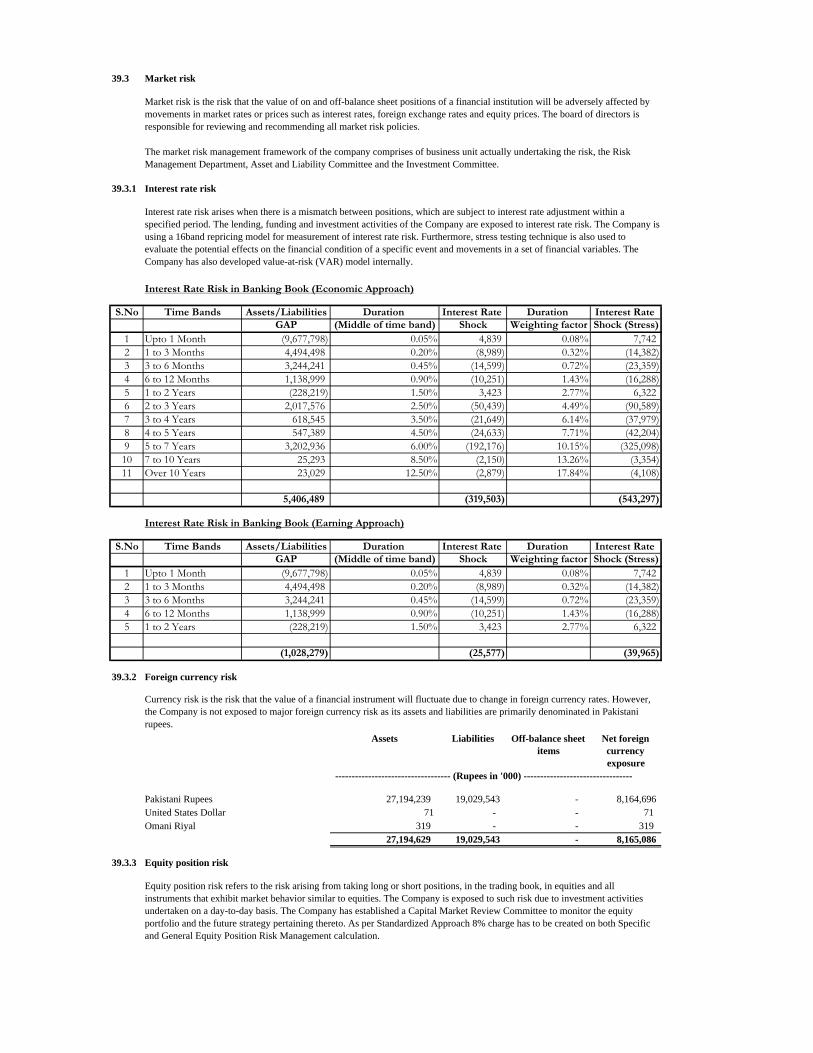
39.3 Market risk
39.3.1 Interest rate risk
Interest Rate Risk in Banking Book (Economic Approach)
S.No Time Bands Assets/Liabilities Duration Interest Rate Duration Interest Rate GAP (Middle of time band) Shock Weighting factor Shock (Stress)
1 Upto 1 Month (9,677,798) 0.05% 4,839 0.08% 7,742 2 1 to 3 Months 4,494,498 0.20% (8,989) 0.32% (14,382) 3 3 to 6 Months 3,244,241 0.45% (14,599) 0.72% (23,359) 4 6 to 12 Months 1,138,999 0.90% (10,251) 1.43% (16,288) 5 1 to 2 Years (228,219) 1.50% 3,423 2.77% 6,322 6 2 to 3 Years 2,017,576 2.50% (50,439) 4.49% (90,589) 7 3 to 4 Years 618,545 3.50% (21,649) 6.14% (37,979) 8 4 to 5 Years 547,389 4.50% (24,633) 7.71% (42,204) 9 5 to 7 Years 3,202,936 6.00% (192,176) 10.15% (325,098) 10 7 to 10 Years 25,293 8.50% (2,150) 13.26% (3,354) 11 Over 10 Years 23,029 12.50% (2,879) 17.84% (4,108)
5,406,489 (319,503) (543,297)
Interest Rate Risk in Banking Book (Earning Approach)
S.No Time Bands Assets/Liabilities Duration Interest Rate Duration Interest Rate GAP (Middle of time band) Shock Weighting factor Shock (Stress)
1 Upto 1 Month (9,677,798) 0.05% 4,839 0.08% 7,742 2 1 to 3 Months 4,494,498 0.20% (8,989) 0.32% (14,382) 3 3 to 6 Months 3,244,241 0.45% (14,599) 0.72% (23,359) 4 6 to 12 Months 1,138,999 0.90% (10,251) 1.43% (16,288) 5 1 to 2 Years (228,219) 1.50% 3,423 2.77% 6,322
(1,028,279) (25,577) (39,965)
39.3.2 Foreign currency risk
Assets Liabilities Off-balance sheet items
Net foreign currency exposure
----------------------------------- (Rupees in '000) ---------------------------------
Pakistani Rupees 27,194,239 19,029,543 - 8,164,696 United States Dollar 71 - - 71 Omani Riyal 319 - - 319
27,194,629 19,029,543 - 8,165,086
39.3.3 Equity position risk
Market risk is the risk that the value of on and off-balance sheet positions of a financial institution will be adversely affected by movements in market rates or prices such as interest rates, foreign exchange rates and equity prices. The board of directors is responsible for reviewing and recommending all market risk policies.
The market risk management framework of the company comprises of business unit actually undertaking the risk, the Risk Management Department, Asset and Liability Committee and the Investment Committee.
Interest rate risk arises when there is a mismatch between positions, which are subject to interest rate adjustment within a specified period. The lending, funding and investment activities of the Company are exposed to interest rate risk. The Company is using a 16band repricing model for measurement of interest rate risk. Furthermore, stress testing technique is also used to evaluate the potential effects on the financial condition of a specific event and movements in a set of financial variables. The Company has also developed value-at-risk (VAR) model internally.
Currency risk is the risk that the value of a financial instrument will fluctuate due to change in foreign currency rates. However, the Company is not exposed to major foreign currency risk as its assets and liabilities are primarily denominated in Pakistani rupees.
Equity position risk refers to the risk arising from taking long or short positions, in the trading book, in equities and all instruments that exhibit market behavior similar to equities. The Company is exposed to such risk due to investment activities undertaken on a day-to-day basis. The Company has established a Capital Market Review Committee to monitor the equity portfolio and the future strategy pertaining thereto. As per Standardized Approach 8% charge has to be created on both Specific and General Equity Position Risk Management calculation.

39.3.4 Liquidity risk
Liquidity risk is the potential for loss arising from either inability to meet obligations or to fund increases in assets as they fall due without incurring unacceptable cost or losses.
- A reasonable amount of liquid assets are maintained at all times.- Measurement and projection of funding requirements during various scenarios.- Excess funds are profitably deployed.
Beside the Board which will be responsible for formulation of over all policy, the following will be involved in Liquidity Risk Management Process with roles and responsibilities defined hereunder:
- Risk Management Department- Finance Department- Treasury Department - Asset Liability Committee
The ALCO will be responsible for monitoring of the tolerance limits.
39.3.5 Mismatch of interest rate sensitive assets and liabilities as at 31 December 2015
On-balance sheet financial instruments
Assets Cash and balances with treasury banks 93,725 - - - - - - - - - 93,725 Balances with other banks 7.10% 1,586,956 1,435,031 150,000 - - - - - - - 1,925 Lending to financial institutions 6.77% 362,824 362,824 - - - - - - - - - Investments 8.02% 14,073,356 852,844 1,411,278 641,948 2,251,026 205,386 2,309,831 1,110,572 3,187,309 - 2,103,162 Advances 8.95% 9,993,263 1,876,549 4,516,911 3,105,007 93,954 151,083 81,869 76,436 54,875 23,029 13,550 Other assets 561,036 - - - - - - - - - 561,036
26,671,160 4,527,248 6,078,189 3,746,955 2,344,980 356,469 2,391,700 1,187,008 3,242,184 23,029 2,773,398
Liabilities Borrowings from financial institutions 6.38% 14,479,440 12,496,165 460,309 180,441 360,355 574,362 373,771 20,082 13,955 - - Deposits and other accounts 6.80% 4,009,860 1,708,857 1,123,333 322,198 845,472 10,000 - - - - - Liabilities against assets subject to finance leases 7.91% 1,973 24 49 75 154 326 353 992 - - - Other liabilities 529,309 - - - - - - - - - 529,309
19,020,582 14,205,046 1,583,691 502,714 1,205,981 584,688 374,124 21,074 13,955 - 529,309 On-balance sheet gap 7,650,578 (9,677,798) 4,494,498 3,244,241 1,138,999 (228,219) 2,017,576 1,165,934 3,228,229 23,029 2,244,089
Non-Financial assets 523,469 Non-Financial liabilities 8,961
Total Net Assets 8,165,086
Total yield/profit risk sensitivity gap (9,677,798) 4,494,498 3,244,241 1,138,999 (228,219) 2,017,576 1,165,934 3,228,229 23,029
Cumulative yield/profit risk sensitivity gap (9,677,798) (5,183,300) (1,939,059) (800,060) (1,028,279) 989,297 2,155,231 5,383,460 5,406,489
Effective yield /
interest rate
Upto 1month
Over 1to 3
months
Above 10 years
Non-interest bearing financial
Over 3to 5
years
Over 5to 10years
Total
Large off-balance sheet exposures or heavy reliance on large corporate deposits gives rise to relatively high level of liquidity risk. Rapid growth in assets also increases the liquidity risk. Objectives of liquidity management in Pak Oman are that:
Exposed to yield / interest risk Over 3
to 6months
Over 6months
to 1 year
Over 1to 2
years
Over 2to 3
years
--------------------------------------------------------------------------------------------------- (Rupees in '000) ---------------------------------------------------------------------------------------------------

Mismatch of interest rate sensitive assets and liabilities as at 31 December 2014
On-balance sheet financial instruments
Assets
Cash and balances with treasury banks 99,912 - - - - - - - - - 99,912 Balances with other banks 10.49% 269,173 258,771 - - - - - - - - 10,402 Lending to financial institutions 10.16% 614,177 414,177 200,000 - - - - - - - - Investments 11.83% 12,179,521 587,526 1,120,265 959,866 422,464 399,926 1,013,027 2,615,764 3,225,918 - 1,834,765 Advances 12.49% 9,070,314 1,786,686 4,754,427 1,619,447 155,549 272,466 229,447 174,085 46,881 19,453 11,873 Other assets 591,720 - - - - - - - - - 591,720
22,824,817 3,047,160 6,074,692 2,579,313 578,013 672,392 1,242,474 2,789,849 3,272,799 19,453 2,548,672
Liabilities
Borrowings from financial institutions 10.03% 8,868,730 7,234,379 677,017 313,263 115,161 204,240 178,454 139,987 6,229 - - Deposits and other accounts 9.96% 6,295,986 568,336 3,255,550 1,418,239 1,035,579 16,182 2,100 - - - - Liabilities against assets subject to finance leases 10.58% 488 31 62 96 299 - - - - - - Other liabilities 483,431 - - - - - - - - - 483,431
15,648,635 7,802,746 3,932,629 1,731,598 1,151,039 220,422 180,554 139,987 6,229 - 483,431
On-balance sheet gap 7,176,182 (4,755,586) 2,142,063 847,715 (573,026) 451,970 1,061,920 2,649,862 3,266,570 19,453 2,065,241
Non - financial assets 540,806 Non - financial liabilities 4,817
Total Net Assets 7,712,171
Total yield/profit risk sensitivity gap (4,755,586) 2,142,063 847,715 (573,026) 451,970 1,061,920 2,649,862 3,266,570 19,453
Cumulative yield/profit risk sensitivity gap (4,755,586) (2,613,523) (1,765,808) (2,338,834) (1,886,864) (824,944) 1,824,918 5,091,488 5,110,941
39.3.6 Yield risk is the risk of decline in earnings due to adverse movement of the yield curve.
39.3.7 Profit rate risk is the risk that the value of the financial instruments will fluctuate due to changes in the market profit rates. The company is not exposed to any major profit rate risk as it mainly invests in equity securities.
TotalExposed to yield / interest risk
--------------------------------------------------------------------------------------------------- (Rupees in '000) ---------------------------------------------------------------------------------------------------
Effective yield /
interest rate Upto 1month
Over 1to 3
months
Over 3to 6
months
Above 10 years
Non-interest bearing
financial i
Over 2to 3
years
Over 5to 10years
Over 6months
to 1 year
Over 1to 2
years
Over 3to 5
years

39.4 Operational risk
39.4.1 Maturities of assets and liabilities - Based on contractual maturity of assets and liabilities
Maturities of assets and liabilities as at 31 December 20152015
Assets
Cash and balances with treasury banks 93,725 93,725 - - - - - - - - Balances with other banks 1,586,956 1,436,956 150,000 - - - - - - - Lending to financial institutions 362,824 362,824 - - - - - - - - Investments 14,073,356 328,064 315,916 110,293 2,348,594 1,163,514 2,846,918 2,888,780 4,071,277 - Advances 9,993,263 108,690 535,448 691,474 1,420,753 2,447,346 2,090,138 2,162,924 495,697 40,793 Other assets 622,875 338,848 159,299 119,048 1,742 - - 3,938 - - Operating fixed assets 82,316 6,290 5,241 7,861 12,645 18,960 16,845 6,751 7,723 - Deferred tax assets 379,314 (49,600) (18,460) (34,443) (234,292) (94,977) (38,468) 601,946 248,867 (1,259)
27,194,629 2,625,797 1,147,444 894,233 3,549,442 3,534,843 4,915,433 5,664,339 4,823,564 39,534
Liabilities
Borrowings from financial institutions 14,479,440 12,496,165 460,309 180,441 360,355 574,362 373,771 20,082 13,955 - Deposits and other accounts 4,009,860 1,708,857 1,123,333 322,198 845,472 10,000 - - - - Liabilities against assets subject to finance leases 1,973 24 49 75 154 326 353 992 - - Others liabilities 538,270 84,856 228,381 25,696 30,595 32,665 65,356 65,346 5,375 - Deferred tax liabilities - - - - - - - - - -
19,029,543 14,289,902 1,812,072 528,410 1,236,576 617,353 439,480 86,420 19,330 -
Net assets 8,165,086 (11,664,105) (664,628) 365,823 2,312,866 2,917,490 4,475,953 5,577,919 4,804,234 39,534
Share capital 6,150,000 Reserves 843,304 Unappropriated profit 776,899
7,770,203 Surplus on revaluation of assets - net of tax 394,883
8,165,086
Operational risk is the risk of loss resulting from inadequate or failed internal processes, people and system or from external events. Operational risk is inherent in the company's business and operational activities.
The Company has instituted sound internal controls through policies, plans and processes approved by the board of directors for controlling and mitigating potential operational risk. The system of internal controls include financial, operational and compliance controls and is performed on continuous basis by the senior management and all levels of employees within the Company.
The objectives of internal controls include the safeguarding of assets from inappropriate use or from loss and fraud, ensuring that liabilities are identified and managed and that the quality of internal and external reporting is maintained. The Company monitors its Key Risk Indicators (KRI) and Loss Data reporting through an operational risk software.
The company has also formulated a business continuity plan, a disaster recovery plan and guidelines for information security, employee conduct and for prevention of fraud and forgery to ensure smooth functioning of the Company'soperations.
Total Upto 1month
Over 3to 6
months
Over 2to 3
years
Over 1to 3
months
Above 10 years
Over 3to 5
years
Over 6months
to 1 year
Over 5to 10years
Over 1to 2
years
------------------------------------------------------------------------------------------ (Rupees in '000) --------------------------------------------------------------------------------------

Maturities of assets and liabilities as at 31 December 2014
2014
Assets
Cash and balances with treasury banks 99,912 99,912 - - - - - - - - Balances with other banks 269,173 269,173 - - - - - - - - Lending to financial institutions 614,177 414,177 200,000 - - - - - - - Investments 12,179,521 301,545 79,801 335,369 524,978 1,064,845 1,362,299 4,570,161 3,940,523 - Advances 9,070,314 440,922 261,212 868,478 1,335,060 2,088,949 1,614,762 1,995,636 419,104 46,191 Other assets 683,829 325,661 197,555 155,074 1,626 - - 3,913 - - Operating fixed assets 68,669 4,447 4,780 6,245 9,752 17,606 11,797 4,212 9,830 - Deferred tax assets 380,028 (61,669) (19,325) (18,825) (205,800) (78,639) (24,979) 789,284 (1,443) 1,424
23,365,623 1,794,168 724,023 1,346,341 1,665,616 3,092,761 2,963,879 7,363,206 4,368,014 47,615
Liabilities
Borrowings from financial institutions 8,868,730 7,234,379 443,683 179,930 265,161 420,907 178,454 139,987 6,229 -
Deposits and other accounts 6,295,986 568,336 3,255,550 1,418,239 1,035,579 16,182 2,100 - - - Liabilities against assets subject to finance leases 488 31 62 96 299 - - - - - Others Liabilities 488,248 120,270 198,485 29,846 24,276 39,412 31,730 44,229 - -
15,653,452 7,923,016 3,897,780 1,628,111 1,325,315 476,501 212,284 184,216 6,229 -
Net assets 7,712,171 (6,128,848) (3,173,757) (281,770) 340,301 2,616,260 2,751,595 7,178,990 4,361,785 47,615
Share capital 6,150,000 Reserves 722,810 Unappropriated profit 545,915
7,418,725 Surplus on revaluation of investment - net of tax 293,446
7,712,171
------------------------------------------------------------------------------------------ (Rupees in '000) --------------------------------------------------------------------------------------
Over 5to 10years
Above 10 years
Over 1to 2
years
Over 3to 5
years
Over 2to 3
years
Over 1to 3
months
Upto 1month
Over 3to 6
months
Total Over 6monthsto 1 year
The contractual maturities of assets and liabilities do not significantly differ with the expected maturities except operating fixed assets and deferred tax assets which do not have any contractual maturities. The maturities of operating fixed assets and deferred tax assets have been reported based on their patter of usage and recoverability of the underlying assets on which deferred tax asset has been recorded.

39.4.2 Maturities of assets and liabilities - Based on the working prepared by the Asset and Liabilities Management Committee (ALCO)
Maturities of assets and liabilities as at 31 December 2015
2015
Assets
Cash and balances with treasury banks 93,725 93,725 - - - - - - - - Balances with other banks 1,586,956 1,436,956 150,000 - - - - - - - Lending to financial institutions 362,824 362,824 - - - - - - - - Investments 14,073,356 328,064 315,916 110,293 2,348,594 1,163,514 2,846,918 2,888,780 4,071,277 - Advances 9,993,263 108,690 535,448 691,474 1,420,753 2,447,346 2,090,138 2,162,924 495,697 40,793 Other assets 622,875 338,848 159,299 119,048 1,742 - - 3,938 - - Operating fixed assets 82,316 6,290 5,241 7,861 12,645 18,960 16,845 6,751 7,723 - Deferred tax assets 379,314 (49,600) (18,460) (34,443) (234,292) (94,977) (38,468) 601,946 248,867 (1,259)
27,194,629 2,625,797 1,147,444 894,233 3,549,442 3,534,843 4,915,433 5,664,339 4,823,564 39,534
Liabilities
Borrowings from financial institutions 14,479,440 12,496,165 460,309 180,441 360,355 574,362 373,771 20,082 13,955 - Deposits and other accounts 4,009,860 1,708,857 1,123,333 322,198 845,472 10,000 - - - - Liabilities against assets subject to finance leases 1,973 24 49 75 154 326 353 992 - - Others liabilities 538,270 84,856 228,381 25,696 30,595 32,665 65,356 65,346 5,375 - Deferred liabilities - - - - - - - - - -
19,029,543 14,289,902 1,812,072 528,410 1,236,576 617,353 439,480 86,420 19,330 -
Net assets 8,165,086 (11,664,105) (664,628) 365,823 2,312,866 2,917,490 4,475,953 5,577,919 4,804,234 39,534
Share capital 6,150,000 Reserves 843,304 Unappropriated profit 776,899
7,770,203
Surplus on revaluation of investment - net of tax 394,883
8,165,086
Total Over 6months
to 1 year
Over 1to 2
years
Over 2to 3
years
Over 3to 5
years
Over 5to 10years
Above 10 years
Upto 1month
Over 1to 3
months
Over 3to 6
months
------------------------------------------------------------------------------------------ (Rupees in '000) --------------------------------------------------------------------------------------

Maturities of assets and liabilities as at 31 December 2014
2014
Assets
Cash and balances with treasury banks 99,912 99,912 - - - - - - - - Balances with other banks 269,173 269,173 - - - - - - - - Lending to financial institutions 614,177 414,177 200,000 - - - - - - - Investments 12,179,521 301,545 79,801 335,369 524,978 1,064,845 1,362,299 4,570,161 3,940,523 - Advances 9,070,314 440,922 261,212 868,478 1,335,060 2,088,949 1,614,762 1,995,636 419,104 46,191 Other assets 683,829 325,661 197,555 155,074 1,626 - - 3,913 - - Operating fixed assets 68,669 4,447 4,780 6,245 9,752 17,606 11,797 4,212 9,830 - Deferred tax assets 380,028 (61,669) (19,325) (18,825) (205,800) (78,639) (24,979) 789,284 (1,443) 1,424
23,365,623 1,794,168 724,023 1,346,341 1,665,616 3,092,761 2,963,879 7,363,206 4,368,014 47,615
Liabilities
Borrowings from financial institutions 8,868,730 7,234,379 443,683 179,930 265,161 420,907 178,454 139,987 6,229 -
Deposits and other accounts 6,295,986 568,336 3,255,550 1,418,239 1,035,579 16,182 2,100 - - - Liabilities against assets subject to finance leases 488 31 62 96 299 - - - - - Others Liabilities 488,248 120,270 198,485 29,846 24,276 39,412 31,730 44,229 - -
15,653,452 7,923,016 3,897,780 1,628,111 1,325,315 476,501 212,284 184,216 6,229 -
Net assets 7,712,171 (6,128,848) (3,173,757) (281,770) 340,301 2,616,260 2,751,595 7,178,990 4,361,785 47,615
Share capital 6,150,000 Reserves 722,810 Unappropriated profit 545,915
7,418,725
Surplus on revaluation of investment - net of tax 293,446 7,712,171
The contractual maturities of assets and liabilities do not significantly differ with the expected maturities except operating fixed assets and deferred tax assets which do not have any contractual maturities. The maturities of operating fixed assets and deferred tax assets have been reported based on their pattern of usage and recoverability of the underlying assets on which deferred tax asset has been recorded.
------------------------------------------------------------------------------------------ (Rupees in '000) --------------------------------------------------------------------------------------
Over 2to 3
years
Over 5to 10years
Upto 1month
Over 3to 5
years
Above 10 years
Over 1to 2
years
Total Over 1to 3
months
Over 6monthsto 1 year
Over 3to 6
months


ABCDKPMG Taseer Hadi & Co.Chartered Accountants
Pak Oman Investment Company Limited
Consolidated Financial Statements
For the Year ended 31 December 2015

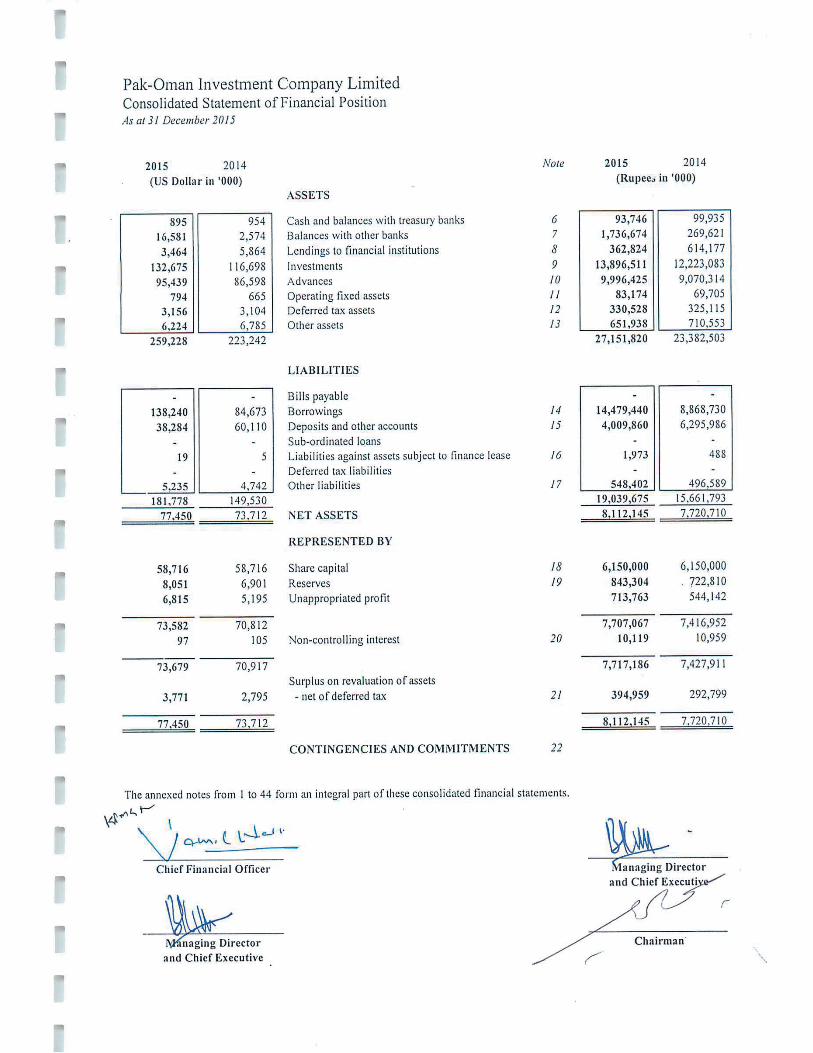


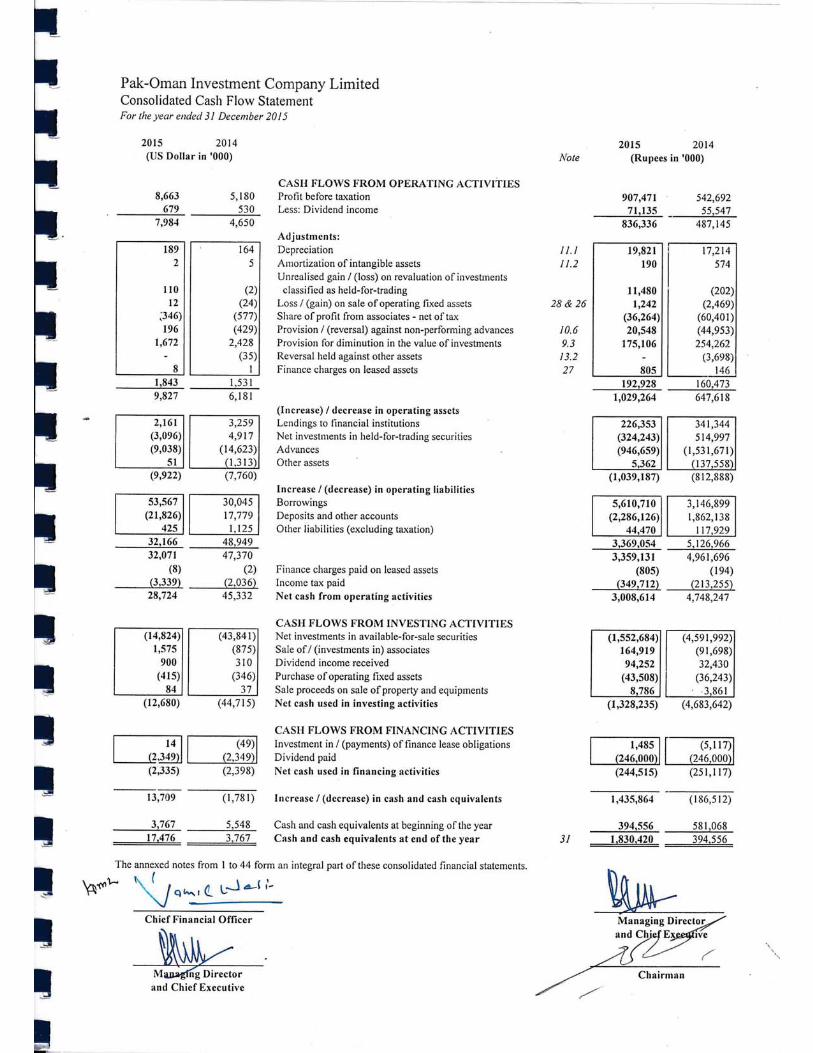


Pak-Oman Investment Company LimitedNotes to the Consolidated Financial Statements For the year ended 31 December 2015
1 LEGAL STATUS AND NATURE OF BUSINESS
1.1
1.1.1 Holding Company
1.1.2 Subsidiary Company
1.2 The Group’s associates are as follows:
Entity Nature of business2015 2014
Pakistan 99.09 96.37
19.59 Pakistan Incorporated under the Companies Ordinance, 1984 and is engaged in generation of power and its supply to WAPDA.
33.40
19.59
Pakistan
Pakistan
33.40
Established as an open-end scheme under the Non-Banking Finance Companies Rules, 2003 and Notified Entities Regulations, 2008.
Japan Power Generation Limited
Pak Oman Government Securities Fund
99.98
Pak Oman Microfinance Bank Limited
Established as an open-end scheme under the Non-Banking Finance Companies Rules, 2003 and Notified Entities Regulations, 2008.
Established as an open-end scheme under the Non-Banking Finance Companies Rules, 2003 and Notified Entities Regulations, 2008.
96.50
Pak Oman Advantage Asset Allocation Fund
Pak Oman Islamic Asset Allocation fund
Pakistan
Incorporated under the Companies Ordinance, 1984 and is engaged in providing micro finance services to the poor and under served segment of the society.
The Group comprises of Pak-Oman Investment Company Limited - POICL (the "holding company" or "parent"), a subsidiary, Pak Oman Asset Management Company Limited (POAMCL) and associates. The Group is principally engaged in promotion of the economic growth of Pakistan and Oman through industrial development and agro-based industries on commercial basis and to carry on the business of finance and / or investment bank, asset management and investment advisory services. Brief profile of the holding company and its subsidiary is as follows:
72.48
99.96 99.74
Pak Oman Advantage Fund Pakistan Established as a closed-end scheme under the Non-Banking Finance Companies Rules, 2003 and Notified Entities Regulations, 2008.
Holding %
Pak-Oman Investment Company Limited (the "holding company" or "POICL" or "parent") was incorporated as a private limited company on 23 July 2001. Subsequently, on 17 March 2004 the holding company was converted into a public limited company. It is a joint venture between the Government of Pakistan and the Government of the Sultanate of Oman. The objectives of the holding company include promotion of the economic growth of Pakistan and Oman through industrial development and agro-based industries on commercial basis and to carry on the business of finance and/or investment bank. Its registered office is situated at 1st Floor, Block A, Finance and Trade Centre, Shahrah-e-Faisal, Karachi, Pakistan. The holding company operates a branch at Lahore and other representative offices at Islamabad, Gwadar and Muscat. The holding company is designated as a development financial institution (DFI) under the BPD Circular Letter No. 35 dated 28 October 2003 issued by the State Bank of Pakistan (SBP).
Pakistan
Pak-Oman Asset Management Company Limited (the "subsidiary company" or "POAMCL") was incorporated in Pakistan underthe Companies Ordinance, 1984 on 28 July 2006 as an unlisted public limited company having its registered office at Horizon Vista, Mezzanine Floor-2, Plot No Com-10, Scheme-5, Block 4 Clifton, Karachi, Pakistan. POAMCL obtained certificate of commencement of business on 31 October 2006. The principal activities of the company includes investment advisory and asset management services.
Country of incorporation
- 27.36
Pak Oman Advantage Islamic Income Fund
99.98 Established as an open-end scheme under the Non-Banking Finance Companies Rules, 2003 and Notified Entities Regulations, 2008.

2 BASIS OF PRESENTATION
2.1 Consolidated Financial Statements
2.2 US Dollar equivalent
2.3 Use of estimates and judgements
a) Provision against non-performing advances
b) Impairment of available-for-sale investments
c) Classification of investments
The investments which are not classified as 'held-for-trading' or 'held-to-maturity' are classified as "available-for-sale".
d) Income taxes and deferred taxes
The Group considers that available-for-sale investments are impaired when there has been a significant or prolonged decline in the fair value below its cost. This determination of what is significant or prolonged requires judgment. In addition, impairment may be appropriate when there is evidence of deterioration in the financial health of the investee, industry and sector performance.
These consolidated financial statements have been prepared from the information available in the audited financial statements of the holding company for the year ended 31 December 2015 and the condensed interim financial information of the subsidiary (POAMCL) as on and for the half year ended 31 December 2015 which have only been subjected to a review but are not audited. The financial statements used for the equity accounting of associates are disclosed in Note 9.5.7.2.
The US Dollar amounts shown on the consolidated statement of financial position, consolidated profit and loss account, consolidated statement of comprehensive income and consolidated cash flow statement are stated as additional information solely for the convenience of readers. For the purpose of conversion to US Dollars, the rate of Rs. 104.7410 to 1 US Dollar has been used for 2015 and 2014 as it was the prevalent rate as on 31 December 2015.
The preparation of consolidated financial statements in conformity with approved accounting standards requires the use of certain critical accounting estimates. It also requires management to exercise its judgment in the process of applying the Group’s accounting policies. The estimates / judgments and associated assumptions used in the preparation of the consolidated financial statements are based on historical experience and other factors, including expectations of future events that are believed to be reasonable under the circumstances. The key areas of estimate and judgments in relation to these consolidated financial statements are as follows:
In classifying investments as "held-for-trading", the Group has determined securities which are acquired with the intention to trade by taking advantage of short-term market / interest rate movements and are to be sold within 90 days.
In classifying investments as "held-to-maturity", the Group follows the guidance provided in SBP circulars on classifying non-derivative financial assets with fixed or determinable payments and fixed maturity. In making this judgment, the Group evaluates its intention and ability to hold such investments to maturity.
In making the estimates for current and deferred income taxes, the management looks at the income tax law and the decisions of appellate authorities on certain issues in the past. There are certain matters where the Group’s view differs with the view taken by the income tax department and such amounts are shown as contingent liability.
The Group reviews its loan portfolio to assess amount of non-performing advances and determine provision required there against on quarterly basis. While assessing this requirement various factors including the past dues, delinquency in the account, financial position of the borrower, value of collateral held and other requirements of Prudential Regulations are considered.
e) Fixed assets, depreciation and amortization
f) Employees' benefit plans
3 STATEMENT OF COMPLIANCE
4 BASIS OF MEASUREMENT
4.1
5 SUMMARY OF SIGNIFICANT ACCOUNTING POLICIES
5.1 Standards, interpretations and amendments effective in current year
-
The SBP has deferred the applicability of International Accounting Standard (IAS) 39, 'Financial Instruments: Recognition and Measurement' and IAS 40, 'Investment Property' for DFIs through BSD Circular Letter No. 11 dated 11 September 2002 till further instructions. Further, SECP has deferred the implementation of IFRS 7 Financial Instruments: Disclosures through SRO 411(1)/2008 dated 28 April 2008. Accordingly, the requirements of these standards have not been considered in the preparation of these consolidated financial statements. However, investments have been classified and valued in accordance with the requirements of various circulars issued by the SBP.
The accounting policies adopted in the preparation of these consolidated financial statements are consistent with those of the previous financial year, except for the following standards, which became effective during the year:
IFRS 10 'Consolidated Financial Statements' replaces the current guidance on consolidation in IAS 27 Consolidated and Separate Financial Statements. It introduces a single model of assessing control whereby an investor controls an investee when it has the power, exposure to variable returns and the ability to use its power to influence the returns of the investee. IFRS 10 also includes specific guidance on de-facto control, protective rights and the determination of whether a decision maker is acting as principal or agent, all of which is influence the assessment of control. the application of IFRS 10 did not result in any investee being in control of the Group.
IFRS 8, 'Operating Segments' is effective for the Group's accounting period beginning on or after 01 January 2009. All DFIs in Pakistan are required to prepare their annual financial statements in line with the format prescribed under BSD Circular No. 4 dated 17 February 2006, 'Revised Forms of Annual Financial Statements', effective from the accounting year ended 31 December 2006. The management of the holding company believes that as the SBP has defined the segment categorisation in the above mentioned circular, the SBP requirements prevail over the requirements specified in IFRS 8. Accordingly, segment information disclosed in these consolidated financial statements is based on the requirements laid down by the SBP.
The SECP through a notification no. SRO 56(1)/2016 dated 28 January 2016, directed that the requirements of consolidation under section 237 of the Companies Ordinance, 1984 and IFRS 10 "Consolidated Financial Statements" is not applicable in case of investment by companies in mutual funds established under Trust Structure. Accordingly, the aforesaid requirements have not been considered in the preparation of these consoildated financial statements.
These consolidated financial statements have been prepared in accordance with the approved accounting standards as applicable in Pakistan. Approved accounting standards comprise of such International Financial Reporting Standards (IFRSs) issued by the International Accounting Standards Board (IASB) as are notified under the Companies Ordinance, 1984, the provisions of and directives issued under the Companies Ordinance, 1984 and the directives issued by the SBP. In case requirements differ, the provisions of and directives issued under the Companies Ordinance, 1984 and directives issued by the SBP shall prevail.
The liabilities for employees' benefit plans are determined using actuarial valuations. The actuarial valuations involve assumptions about discount rates, expected rates of return on assets and future salary increases as disclosed in note 33.1. Due to the long term nature of these plans, such estimates are subject to significant uncertainty.
In making estimates of the depreciation / amortization method, the management uses method which reflects the pattern in which economic benefits are expected to be consumed by the Group. The method applied is reviewed at each financial year end and if there is a change in the expected pattern of consumption of the future economic benefits embodied in the assets, the method would be changed to reflect the change in pattern.
These consolidated financial statements have been prepared under the historical cost convention except that certain investments have been stated at revalued amounts in accordance with the directives of the SBP and obligations in respect of certain staff retirement benefits are carried at present value.
The consolidated financial statements are prepared in Pakistani Rupees which is the Group's functional and presentation currency.

-
-
-
5.2 Approved accounting standards not yet effective
-
-
-
-
-
-
Agriculture: Bearer Plants [Amendment to IAS 16 and IAS 41] (effective for annual periods beginning on or after 1 January 2016). Bearer plants are now in the scope of IAS 16 Property, Plant and Equipment for measurement and disclosure purposes. Therefore, a company can elect to measure bearer plants at cost. However, the produce growing on bearer plants will continue to be measured at fair value less costs to sell under IAS 41 Agriculture. A bearer plant is a plant that: is used in the supply of agricultural produce; is expected to bear produce for more than one period; and has a remote likelihood of being sold as agricultural produce. Before maturity, bearer plants are accounted for in the same way as self-constructed items of property, plant and equipment during construction. The amendments are not likely to have an impact on the Group’s consolidated financial statements.
The following standards, amendments and interpretations of approved accounting standards will be effective for accounting periods beginning on or after 01 January 2016:
IFRS 5 Non-current Assets Held for Sale and Discontinued Operations. IFRS 5 is amended to clarify that if an entity changes the method of disposal of an asset (or disposal group) i.e. reclassifies an asset from held for distribution to owners to held for sale or vice versa without any time lag, then such change in classification is considered as continuation of the original plan of disposal and if an entity determines that an asset (or disposal group) no longer meets the criteria to be classified as held for distribution, then it ceases held for distribution accounting in the same way as it would cease held for sale accounting.
Amendments to IAS 38 Intangible Assets and IAS 16 Property, Plant and Equipment (effective for annual periods beginning on or after 1 January 2016) introduce severe restrictions on the use of revenue-based amortization for intangible assets and explicitly state that revenue-based methods of depreciation cannot be used for property, plant and equipment. The rebuttable presumption that the use of revenue-based amortization methods for intangible assets is inappropriate can be overcome only when revenue and the consumption of the economic benefits of the intangible asset are ‘highly correlated’, or when the intangible asset is expressed as a measure of revenue. The amendments are not likely to have an impact on the Group's consolidated financial statements.
Investment Entities: Applying the Consolidation Exception (Amendments to IFRS 10 – Consolidated Financial Statements and IAS 28 – Investments in Associates and Joint Ventures) [effective for annual periods beginning on or after 1 January 2016] clarifies (a) which subsidiaries of an investment entity are consolidated; (b) exemption to present consolidated financial statements is available to a parent entity that is a subsidiary of an investment entity; and (c) how an entity that is not an investment entity should apply the equity method of accounting for its investment in an associate or joint venture that is an investment entity. The amendments are not likely to have an impact on the Group's consolidated financial statements.
Accounting for Acquisitions of Interests in Joint Operations – Amendments to IFRS 11 ‘Joint Arrangements’ (effective for annual periods beginning on or after 1 January 2016) clarify the accounting for the acquisition of an interest in a joint operation where the activities of the operation constitute a business. They require an investor to apply the principles of business combination accounting when it acquires an interest in a joint operation that constitutes a business. The amendments are not likely to have an impact on the Group's consolidated financial statements.
Amendment to IAS 27 ‘Separate Financial Statement’ (effective for annual periods beginning on or after 1 January 2016) allows entities to use the equity method to account for investments in subsidiaries, joint ventures and associates in their separate financial statements. The amendment is not likely to have an impact on the Group's consolidated financial
Annual Improvements 2012-2014 cycles (amendments are effective for annual periods beginning on or after 1 January 2016). The new cycle of improvements contain amendments to the following standards:
IFRS 11 'Joint Arrangements' replaces IAS 31 'Interests in Joint Ventures' it requires all joint ventures to be equity accounted hereby removing the option in IAS 31 for proportionate consolidation. It also removes the IAS 31 concept to jointly controlled assets. The application of IFRS 11 did not result in identification of any associate as joint venture.
IFRS 12 'Disclosure of Interests in Other Entities' prescribes additional disclosures around significant judgments and assumptions meet in determining whether an entity controls another entity and has joint control or significant influence over another entity. The standard also requires disclosures on the nature and risks associated with interest in unconsolidated structured entities. The application of IFRS 12 does not have an impact on the consolidated financial statements of the Group.
IFRS 13 'Fair Value Measurement' consolidates the guidance on how to measure fair value, which was spread across various IFRS, into one comprehensive standard. It introduces the use of an exact price, as well as extensive disclosure requirements, particularly the inclusion of non-financial instruments into the fair value hierarchy. The application of IFRS 13 does not have an impact on the consolidated financial statements of the Group except for certain disclosures as mentioned in note 36.
-
-
-
5.3 Business Combination
5.3.1 Basis of consolidation
-
-
-
-
-
- Material intra-group balances and transactions have been eliminated.
5.4 Cash and cash equivalents
IFRS 7 ‘Financial Instruments- Disclosures’. IFRS 7 is amended to clarify when servicing arrangements on continuing involvement in transferred financial assets in cases when they are derecognized in their entirety are in the scope of its disclosure requirements. IFRS 7 is also amended to clarify that additional disclosures required by ‘Disclosures: Offsetting Financial Assets and Financial Liabilities (Amendments to IFRS7)’ are not specifically required for inclusion in condensed interim financial statements for all interim periods.
IAS 19 ‘Employee Benefits’. IAS 19 is amended to clarify that high quality corporate bonds or government bonds used in determining the discount rate should be issued in the same currency in which the benefits are to be paid.
IAS 34 ‘Interim Financial Reporting’. IAS 34 is amended to clarify that certain disclosures, if they are not included in the notes to interim financial statements and disclosed elsewhere should be cross referred.
The above amendments are not likely to have an impact on the Group’s consolidated financial statements.
At the acquisition date, the identifiable assets acquired and the liabilities assumed are recognised at their fair value at the acquisition date.
Subsidiary company is consolidated from the date on which more than 50 percent of voting rights are transferred to the Group or power to control the company is established and excluded from consolidation from the date of disposal or when the control is lost.
The financial statements of the subsidiary is prepared for the same reporting year as the Group for the purpose of consolidation, using consistent accounting policies except where specified otherwise.
Non-Controlling Interest in equity of the subsidiary company is measured at the portion of operation and of net assets of subsidiary company attributable to interest which is not owned by the holding company.
The assets, liabilities, income and expenses of subsidiary have been consolidated on a line by line basis and the carrying value of investment in subsidiary held by the Group is eliminated against the shareholders' equity in the consolidated financial statements.
Acquisitions of businesses are accounted for using the acquisition method. The consideration transferred in a business combination is measured at fair value, which is calculated as the sum of fair values of the assets transferred by the Group, liabilities incurred by the Group to the former owners of the acquiree and the equity interests issued by the Group in exchange for control of the acquiree at acquisition date. Acquisition related costs are recognised in consolidated profit and loss account as incurred.
Cash and cash equivalents comprise cash and balances with treasury banks, balances with other banks and placements with financial institutions having maturities of three (3) months or less.
Subsidiary is the enterprise in which the Group directly or indirectly controls, beneficially owns or holds more than 50 percent of its voting securities or otherwise has power to elect and appoint more than 50 percent of its directors.
Non-Controlling Interest in equity of the subsidiary company is measured at proportionate share of net assets of the acquiree.
Goodwill is measured as the excess of the sum of the consideration transferred, the amount of any non-controlling interests in the acquiree, and the fair value of the acquirer's previously held equity interest in the acquiree (if any) over the net of the acquisition date amounts of the identifiable assets acquired and the liabilities assumed. If, after reassessment, net of the acquisition date amounts of the identifiable assets acquired and liabilities assumed exceeds the sum of the consideration transferred, the amount of any non-controlling interests in the acquiree and the fair value of the acquirer's previously held interest in the acquiree (if any), the excess is recognised immediately in profit or loss as a bargain purchase gain.
When a business combination is achieved in stages, the Group's previously held equity interest in the acquiree is re-measured to fair value at the acquisition date (i.e. the date when the Group obtains control) and the resulting gain or loss, if any, is recognised in consolidated profit or loss account.

5.5 Revenue recognition
5.6 Investments
Held-for-trading and quoted available-for-sale securities are marked to market with reference to ready quotes on Reuters page (PKRV) or MUFAP or the Stock Exchanges.
Interest income is recognized on a time proportion basis that takes into account effective yield on the asset. Premium or discount on investments classified as held-for-trading, available-for-sale and held-to-maturity securities is amortised using the effective interest method and taken to profit and loss account.
Unquoted securities whose market value is not available are carried at cost less provision for diminution in value, if any. Provision for diminution in value of investments in respect of unquoted shares is calculated with reference to book value of the same.
All regular way purchases / sales of investment are recognised on the trade date, i.e., the date the Group commits to purchase / sell the investments. Regular way purchases or sales of investments require delivery of securities within the time frame generallyestablished by regulation or convention in the market place.
Advisory fee is recognized on accrual basis as and when services are rendered.
The Group has classified its investment portfolio, except for investments in associates, into ‘held-for-trading’, ‘held-to-maturity’ and ‘available-for-sale’ portfolios as follows:
Investments other than those categorised as held-for-trading are initially recognised at fair value which includes transactions costs associated with the investments. Investments classified as held-for-trading are initially recognised at fair value, and transaction costs are expensed in the consolidated profit and loss account.
Management fee is recognised on accrual basis on the average annual net assets of the funds calculated on a monthly basis.
Commission on letters of credit and guarantees is recognized on time proportion basis.
Gains / losses on termination of lease contracts, documentation charges, front-end fees and other lease income are recognized as income on receipt basis.
Gains and losses on disposal of securities are recognised in the consolidated profit and loss account in the year in which they arise.
The holding company classifies its investments other than those in subsidiary and associates based on the criteria set out in BSD Circular Nos. 10, 11 and 14 dated 13 July 2004, 04 August 2004 and 24 September 2004 respectively. The investments are classified in the following categories as per SBP guidelines:
Held-for-trading – These are investments which are acquired with the intention to trade by taking advantage of short-term market / interest rate movements and are to be sold within 90 days. These are carried at market value, with the related gain / (loss) on revaluation being taken to consolidated profit and loss account.
Held-to-maturity – These are investments which are acquired with the intention and ability to hold them up to maturity. These are carried at amortised cost.
Dividend income on equity investments and mutual funds is recognized when right to receive is established.
Financing method is used in accounting for income from lease financing. Under this method, the unearned lease income (excess of the sum of total lease rentals and estimated residual value over the cost of leased assets) is deferred and taken to income over the term of the lease period so as to produce a constant periodic rate of return on the outstanding net investment in lease.
Fee, brokerage and commission income other than commission on letters of credit and guarantees and remuneration for trustee services are recognized upon performance of services.
In case of advances including finance lease and debt security investments classified under the Prudential Regulations, interest / mark-up is recognized on receipt basis. Interest / mark-up on rescheduled / restructured advances and investments is recognized in accordance with the Prudential Regulations of SBP.
Available-for-sale – These are investments that do not fall under held-for-trading or held-to-maturity categories. These are carried at market value with related gain / (loss) on revaluation being taken to ‘surplus / (deficit) on revaluation of assets’ account shown below equity. On derecognition or impairment in available-for-sale investments, the cumulative gain or loss previously reported as 'surplus / (deficit) on revaluation of assets' below equity is included in the consolidated profit and loss account for the period.
5.7 Derivatives
5.8 Advances and net investment in finance lease
5.8.1 Advances
5.8.2 Provision against non-performing advances
5.8.3 Net investment in lease
5.9 Operating fixed assets
5.9.1 Property and equipment – owned
Subsequent costs are included in the asset’s carrying amount or recognised as a separate item of property and equipment, as appropriate, only when it is probable that future economic benefits associated with the item will flow to the Group and the cost of the item can be measured reliably. The carrying amount of the replaced part is derecognised. All other repairs and maintenance are charged to the consolidated profit and loss account during the period in which they are incurred.
Property and equipment are stated at cost less accumulated depreciation and impairment losses, if any. Depreciation is charged to the consolidated profit and loss account applying the straight-line method at rates stated in note 11.1.
Advances and finance lease receivables are written off when it is considered that there is no realistic prospect of recovery.
Residual values and useful lives are reviewed at each balance sheet date, and adjusted if impact is considered significant.
Provision for diminution in value of investments for debt securities is calculated as per the SBP's Prudential Regulations.
Associates – Associates are all entities over which the Group has significant influence but not control, generally accompanying a shareholding between 20% and 50% of the voting rights. Investments in associates are accounted for under the equity method of accounting.
Item of property and equipment is derecognised when disposed of or when no future economic benefits are expected from its use or disposal. Gains and losses on disposal of property and equipment are included in consolidated profit and loss account.
Under the equity method, the Group’s share of its associates’ post-acquisition profits or losses is recognized in the consolidated profit and loss account, its share of post-acquisition movements in reserves is recognized in reserves. The cumulative post-acquisition movements are adjusted against the carrying amount of the investment. When the Group’s share of losses in an associate equals or exceeds its interest in the associate, including any other unsecured receivables, the Group does not recognize further losses, unless it has incurred obligations or made payments on behalf of the associate.
Depreciation on additions and deletions of property and equipment during a year is charged in proportion to the period of use.
Specific provisions are made in accordance with the requirements of the Prudential Regulations issued by SBP and charged to the consolidated profit and loss account. These regulations prescribe an age based criteria (as supplemented by subjective evaluation of advances) for classification of non-performing loans and advances and computing provision / allowance there against.
Leases are classified as finance lease when substantially all the risks and rewards incidental to ownership of an asset are transferred to the lessee. A receivable is recognized at an amount equal to the present value of the lease payments, including guaranteed residual value, if any. Finance lease receivables are included in advances.
The carrying values of investments are reviewed for impairment when indications exist that the carrying values may exceed the estimated recoverable amounts.
Advances are stated net of specific and general provisions against non-performing advances, if any, which are charged to consolidated profit and loss account.
Derivatives are initially recognised at fair value on the date on which a derivative contract is entered into and are subsequently remeasured at their fair values. All derivatives are carried as assets when fair value is positive and as liabilities when fair value is negative. Any change in the fair value of derivative financial instruments is taken to the consolidated profit and loss account.

5.9.2 Property and equipment - Leased
5.9.3 Capital work-in-progress
5.9.4 Intangible assets
5.10 Repurchase and resale agreements
5.11 Taxation
5.11.1 Current
5.11.2 Deferred
The estimated useful life and amortisation method are reviewed at the end of each annual reporting period, with the effect of any changes in estimate being accounted for on a prospective basis.
Securities sold with a simultaneous commitment to repurchase at a specified future date (repos) continue to be recognised in the consolidated statement of financial position and are measured in accordance with accounting policies for investments. The counterparty liability for amounts received under these agreements is included in borrowings. The difference between sale and repurchase price is treated as mark-up / return / interest expense and accrued over the life of the repo agreement using effective yield method.
Assets held under finance lease are accounted for by recording the assets and related liabilities at the amounts determined on the basis of the lower of fair value of assets and the present value of minimum lease payments at inception of lease and subsequently stated net of accumulated depreciation. Finance charges are allocated over the period of lease term so as to provide a constant periodic rate of charge on the outstanding liability. Depreciation is charged on leased assets on a basis similar to that of owned assets.
Securities purchased with a corresponding commitment to resell at a specified future date (reverse repos) are not recognised in the consolidated statement of financial position, as the Group does not obtain control over the securities. Amounts paid under these agreements are included in lendings to financial institutions. The difference between purchase and resale price is treated as mark-up / return / interest income and accrued over the life of the reverse repo agreement using effective yield method.
Deferred tax assets are recognised for all deductible temporary differences, carry forward of unused tax assets and any unused tax losses, to the extent that it is probable that taxable profits will be available against which the deductible temporary differences, carry forward of unused tax assets and unused tax losses can be utilised.
The Group accounts for deferred taxation using the balance sheet liability method on temporary differences arising between the tax base of assets and liabilities and their carrying amounts in the financial statements. The amount of deferred tax provided is based on the expected manner of realisation or settlement of the carrying amount of assets and liabilities.
Amortization on additions and deletions of intangible assets during the year is charged in proportion to the period of use.
Intangible assets having a finite life are amortised using the straight-line method over their estimated useful lives, at the rate stated in note 11.2.
Capital work-in-progress is stated at cost less impairment losses, if any. These are transferred to specific assets as and when assets are available for use.
The carrying amount of deferred tax assets are reviewed at each statement of financial position date and reduced to the extent that it is no longer probable that sufficient taxable profit will be available to allow all or part of the deferred income tax asset to be utilised.
The charge for current taxation is based on taxable income at the current rate of taxation after taking into account applicable tax credits, rebates and exemption available if any or minimum taxation as per the Income Tax Ordinance, 2001 whichever is higher. However, for income covered under final tax regime, taxation is based on applicable tax rates under such regime. The charge for the current tax also includes adjustments wherever considered necessary relating to prior year, arising from assessments framed during the year.
Expenditure incurred to acquire software licenses is capitalised as intangible assets and stated at cost less accumulated amortization and impairment losses, if any.

5.12 Borrowings
5.13 Staff retirement benefits
5.13.1 Defined benefit plan
5.13.2 Defined contribution plan - the holding company
5.13.3 Defined contribution plan - the subsidiary company
5.13.4 Compensated absences
5.14 Foreign currencies translation
5.15 Provisions
5.16 Offsetting
5.17 Dividend and reserves
Deferred tax assets and liabilities are measured at the tax rates that are expected to apply to the period when the asset is realised or the liability is settled, based on tax rates (and tax laws) that have been enacted or substantively enacted at the reporiting date.
Dividend declared and appropriations, except appropriations which are required by the law are recognised as liability and recorded as changes in reserves in the period in which these are approved by the directors / shareholders as appropriate.
However, provisions are reviewed at each statement of financial position date and adjusted to reflect the current best estimate.
The holding company also operates a provident fund scheme for all its permanent employees. Equal monthly contributions at the rate of 8.33 percent per annum of salary are made by the holding company and its employees. The scheme was established on 01 November 2002 and approved by the Commissioner of Income Tax with effect from 31 January 2003. Contributions from the holding company are charged to consolidated profit and loss account for the year.
The holding company operates a funded-gratuity scheme for all its permanent employees. The scheme was established on 01 November 2002 and approved by the Commissioner of Income Tax with effect from 31 January 2003. Contribution to the fund is made every year based on actuarial valuation. The actuarial valuation is carried out using the Projected Unit Credit Method (PUCM). Under this method, the cost of providing gratuity is charged to the profit and loss account so as to spread the cost over the service lives of the employees in accordance with the actuarial valuation. All actuarial gains and losses are recognized in Other Comprehensive Income (OCI) in the periods in which they occur. The actuarial valuation was conducted as at 31 December 2015.
Foreign currency transactions are translated into Pakistani Rupees (functional currency) using the exchange rate prevailing at thedates of transactions. Monetary assets and liabilities in foreign currencies are translated into Pakistani Rupees using theexchange rate prevailing at the reporting date. Foreign exchange gains and losses resulting from the settlement of foreigncurrency transactions and from the translations of monetary assets and liabilities denominated in foreign currencies at statementof financial position date are included in consolidated profit and loss account.
Compensated absences (leaves) of employees are accounted for in the period in which these absences are earned.
Provisions are recognised when the Group has a present, legal or constructive obligation as a result of past event, it is probable that an outflow of resources embodying economic benefits will be required to settle the obligation and a reliable estimate can be made of the amount of obligation.
Financial assets and financial liabilities are offset and the net amount reported in the consolidated financial statement when there is a legally enforceable right to set off the recognised amounts and the Group intends to settle on a net basis, or to realise the asset and settle the liability simultaneously.
The subsidiary company operates a provident fund scheme for all its permanent employees. Equal monthly contributions at the rate of 8.33 percent per annum of salary are made by the subsidiary company and its employees. The scheme was established on 01 July 2007 and approved by the Commissioner of Income Tax with effect from 01 May 2008. Contributions from the subsidiary company are charged to consolidated profit and loss account for the year.
Borrowings are recognised initially at the value of consideration received. Difference between the consideration received and theredemption value is recognised in consolidated profit and loss account over the period of the borrowings by applying effective rate of interest / markup.
Deferred tax related to gain / loss recognised in surplus / (deficit) on revaluation of assets is charged / credited to such account.
5.18 Impairment
5.19 Earnings per share
5.20 Financial instruments
5.21 Certificates of investment (COI)
5.22 Receivables from funds
5.23 Segment information
Business segments
- Corporate finance
- Trading & sales
Involves the businesses of equity trading and fixed income securities.
- Commercial banking
- Asset management
Asset management includes services under the Non-Banking Finance Companies (Establishment and Regulation) Rules, 2003 (the Rules) and the Non-Banking Finance Companies and Notified Entities Regulations, 2008 (the Regulations).
Financial assets and liabilities are recognized at the time when the Group becomes party to the contractual provision of the instrument. Financial assets are de-recognized when the contractual right to future cash flows from the asset expires or is transferred along with the risk and reward of the asset. Financial liabilities are de-recognized when obligation specific in the contract is discharged, cancelled or expired. Any gain or loss on de-recognition of the financial asset and liability is recognized in the consolidated profit and loss account of the current period. The particular recognition and subsequent measurement method for significant financial assets and financial liabilities are disclosed in the individual policy statements associated with them.
Corporate finance includes services provided in connection with mergers and acquisitions, underwriting, privatization, securitization, research, debts (government, high yield), equity, syndication, Initial Public Offers (IPO) and secondary private placements.
The Group presents basic and diluted earnings per share (EPS) for its shareholders. Basic EPS is calculated by dividing the profit or loss attributable to ordinary shareholders of the Group by the weighted average number of ordinary shares outstanding during the year. Diluted EPS, if any, is determined by adjusting the profit or loss attributable to ordinary shareholders and the weighted average number of ordinary shares outstanding for the effects of all dilutive potential ordinary shares. There were no dilutive potential ordinary shares in issue at 31 December 2015.
These are carried at original invoice amount made to the fund in respect of management fee. No estimate is made for doubtful receivables as amount receivable from funds is received on monthly basis.
COI are initially recorded at the amount of proceeds received. Mark-up accrued is recognized separately as part of liabilities andis charged to profit and loss account of a time proportion basis.
A segment is a distinguishable component of the Group that is engaged in either providing products or services (business segment), or in providing products or services within a particular economic environment (geographical segment), which is subject to risks and rewards that are different from those of other segments.
Commercial banking includes project finance, real estate, export finance, trade finance, factoring, leasing, lending, guarantees, bills of exchange and deposits.
Where impairment loss subsequently reverses, the carrying amount of the asset is increased to the revised recoverable amount but limited to the extent of the amount which would have been determined had there been no impairment. Reversal of impairment loss is recognized as income.
The Group assesses at each balance sheet date whether there is any indication that non-financial assets except deferred tax assets may be impaired. If such indication exists, the carrying amounts of such assets are reviewed to assess whether they are recorded in excess of their recoverable amount. Where carrying values exceed the respective recoverable amount, assets are written down to their recoverable amounts and the resulting impairment loss is recognized in consolidated profit and loss account. The recoverable amount is the higher of an asset's fair value less costs to sell and value in use.
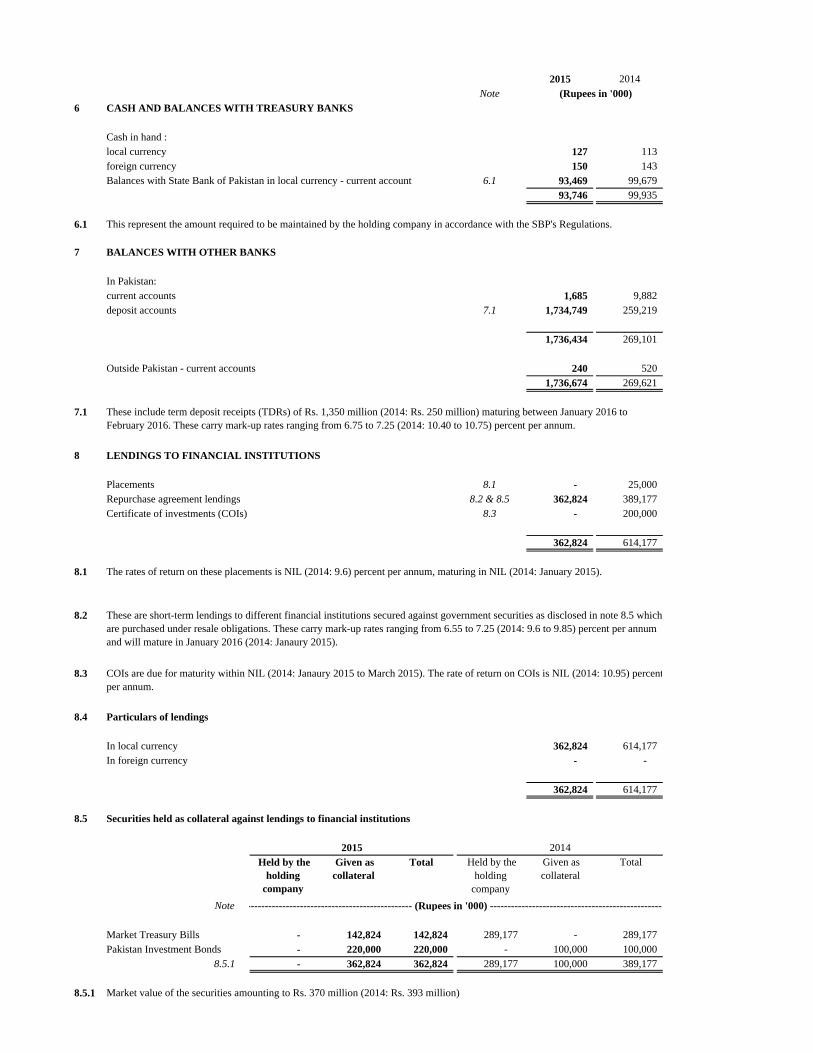
2015 2014Note
6 CASH AND BALANCES WITH TREASURY BANKS
Cash in hand :local currency 127 113 foreign currency 150 143 Balances with State Bank of Pakistan in local currency - current account 6.1 93,469 99,679
93,746 99,935
6.1 This represent the amount required to be maintained by the holding company in accordance with the SBP's Regulations.
7 BALANCES WITH OTHER BANKS
In Pakistan:current accounts 1,685 9,882 deposit accounts 7.1 1,734,749 259,219
1,736,434 269,101
Outside Pakistan - current accounts 240 520
1,736,674 269,621
7.1
8 LENDINGS TO FINANCIAL INSTITUTIONS
Placements 8.1 - 25,000 Repurchase agreement lendings 8.2 & 8.5 362,824 389,177 Certificate of investments (COIs) 8.3 - 200,000
362,824 614,177
8.1
8.2
8.3
8.4 Particulars of lendings
In local currency 362,824 614,177 In foreign currency - -
362,824 614,177
8.5 Securities held as collateral against lendings to financial institutions
Note
Market Treasury Bills - 142,824 142,824 289,177 - 289,177 Pakistan Investment Bonds - 220,000 220,000 - 100,000 100,000
8.5.1 - 362,824 362,824 289,177 100,000 389,177
8.5.1 Market value of the securities amounting to Rs. 370 million (2014: Rs. 393 million)
The rates of return on these placements is NIL (2014: 9.6) percent per annum, maturing in NIL (2014: January 2015).
----------------------------------------------- (Rupees in '000) --------------------------------------------------
Held by the holding
company
2015 Given as collateral
(Rupees in '000)
Held by the holding
company
These include term deposit receipts (TDRs) of Rs. 1,350 million (2014: Rs. 250 million) maturing between January 2016 to February 2016. These carry mark-up rates ranging from 6.75 to 7.25 (2014: 10.40 to 10.75) percent per annum.
2014 Total
These are short-term lendings to different financial institutions secured against government securities as disclosed in note 8.5 which are purchased under resale obligations. These carry mark-up rates ranging from 6.55 to 7.25 (2014: 9.6 to 9.85) percent per annum and will mature in January 2016 (2014: Janaury 2015).
COIs are due for maturity within NIL (2014: Janaury 2015 to March 2015). The rate of return on COIs is NIL (2014: 10.95) percentper annum.
Given as collateral
Total

9 INVESTMENTS
Note
9.1 Investments by types 9.5
Held-for-trading securities
Pakistan Investment Bonds (PIBs) 9.4 & 9.5.1 181,573 243,056 424,629 132,289 7,815 140,104
Market Treasury Bills (T-Bills) 9.4 & 9.5.1 247,051 215,250 462,301 514,762 - 514,762
Listed ordinary shares 9.5.2.1 110,705 - 110,705 54,929 - 54,929
Term finance certificates (TFCs) 9.5.4.1 34,950 - 34,950 - - -
574,279 458,306 1,032,585 701,980 7,815 709,795
Available-for-sale securities
Pakistan Investment Bonds (PIBs) 9.4 & 9.5.1 111,455 7,513,935 7,625,390 760,494 5,861,428 6,621,922
Market Treasury Bills (T-Bills) 9.4 & 9.5.1 74,201 144,555 218,756 - - -
Ijara Sukuk 9.4 & 9.5.1 300,000 - 300,000 - - -
Listed ordinary shares 9.5.2.2 682,716 - 682,716 608,691 - 608,691
Unlisted ordinary shares 9.5.3 121,333 226,000 347,333 131,333 226,000 357,333
Term finance certificates (TFCs) 9.5.4.2 & 2,233,215 - 2,233,215 2,119,506 - 2,119,506
9.5.5.2
Sukuk certificates 9.5.6 966,619 - 966,619 1,158,039 - 1,158,039
4,489,539 7,884,490 12,374,029 4,778,063 6,087,428 10,865,491
Associates 9.5.7
Japan Power Generation Limited - - - - - -
Pak Oman Advantage Fund - - - 301,220 - 301,220
Pak Oman Advantage Islamic Income Fund 97,832 - 97,832 106,408 - 106,408
Pak Oman Islamic Asset Allocation Fund 112,161 - 112,161 113,781 - 113,781
Pak Oman Advantage Asset Allocation Fund 103,179 - 103,179 108,140 - 108,140
Pak Oman Government Securities Fund 251,378 - 251,378 61,991 - 61,991
Pak Oman Microfinance Bank Limited 359,045 359,045 359,987 - 359,987
923,595 - 923,595 1,051,527 - 1,051,527 5,987,413 8,342,796 14,330,209 6,531,570 6,095,243 12,626,813
Less: Provision for diminution in the value of investments 9.3 997,273 - 997,273 866,313 - 866,313
Investments - net of provisions 4,990,140 8,342,796 13,332,936 5,665,257 6,095,243 11,760,500
(Deficit) / surplus on revaluation of held-for-trading securities 9.6 (6,701) 782 (5,919) 3,948 160 4,108
Surplus on revaluation of available-for-sale securities 21 15,335 554,159 569,494 16,384 442,091 458,475
Total investments 4,998,774 8,897,737 13,896,511 5,685,589 6,537,494 12,223,083
-------------------------------------------- (Rupees in '000) -----------------------------------------------
Held by the Group
Investments at cost
2015 2014 Held by the
Group Given as collateral
Total Given as collateral
Total

2015 2014Note
9.2 Investments by segments
Federal Government Securities
Pakistan Investment Bonds (PIBs) 9.4, 9.5 & 9.6 8,050,019 6,762,026 Ijara Sukuk 9.4, 9.5 & 9.6 300,000 - Market Treasury Bills (MTBs) 9.4, 9.5 & 9.6 681,057 514,762
9,031,076 7,276,788 Fully paid up ordinary shares
Listed companies 9.5.2 793,421 663,620 Unlisted companies 9.5.3.1 347,333 357,333
1,140,754 1,020,953 Term finance certificates (TFCs)
Listed 9.5.4 1,235,453 1,370,351 Unlisted 9.5.5 1,032,712 749,155
2,268,165 2,119,506
Sukuk certificates - unlisted 9.5.6 966,619 1,158,039
Investments in associates 9.5.7 923,595 1,051,527
Total investments at cost 14,330,209 12,626,813
Less: Provision for diminution in the value of investments 9.3 997,273 866,313
Investments - net of provisions 13,332,936 11,760,500
(Deficit) / surplus on revaluation of held-for-trading securities 9.6 (5,919) 4,108 Surplus on revaluation of available-for-sale securities 21 569,494 458,475
Total investments 13,896,511 12,223,083
9.3 Particulars of provision for diminution in the value of investments
Opening balance 866,313 629,521
Charge for the year 264,532 271,291 Reversal for the year (89,426) (17,029)
175,106 254,262
Transfer to capital gain due to disposal of relevant investments (44,146) (17,470) Closing balance 9.3.1 997,273 866,313
9.3.1 Particulars of provision in respect of types and segments
Available-for-sale securities
Shares- Listed 73,076 82,743 - Unlisted 104,426 98,568 Term Finance Certificates- Listed 466,435 361,702 - Unlisted 179,455 149,419 Sukuk-unlisted 173,881 173,881
997,273 866,313
Rupees in '000

9.4
9.5
9.5.1 Government Securities
Market Market
Value Rating Value Rating
(Rupees Securities (Rupees Securities
in '000) in '000)
9.5.1.1 Held-for-trading
Pakistan Investment Bonds (PIBs)
10 years 114,824 Unrated 142,692 Unrated
5 years 76,360 Unrated - -
3 years 235,063 Unrated - -
426,247 142,692
Market Treasury Bills (MTBs)
3 months 19,931 Unrated 144,730 Unrated
6 months 195,490 Unrated - -
12 months 246,899 Unrated 371,359 Unrated
462,320 516,089
9.5.1.2 Available-for-sale
Pakistan Investment Bonds (PIBs)
20 years - - 19,307 Unrated
15 years 466,028 Unrated 327,151 Unrated
10 years 3,904,909 Unrated 3,991,576 Unrated
5 years 1,601,972 Unrated 2,307,215 Unrated
3 years 2,208,512 Unrated 468,211 Unrated
8,181,421 7,113,460
Ijara Sukuk 303,390 Unrated - -
Market Treasury Bills (MTBs)
6 months 19,643 Unrated - - 12 months 199,118 Unrated - -
218,761 -
9,592,139 7,772,241
The rates of return on PIBs maturing between May 2016 to July 2022 (2014: July 2015 to July 2024), range from 6.50 to 13.20 (2014: 10.80 to 13.20) percent per annum. The rates of return on Ijara Sukuk maturing in December 2018 (2014: NIL) is 5.89 (2014: NIL) percent per annum. The rates of return on market treasury bills maturing between January 2016 to September 2016 (2014: January 2015 to October 2015), range from 6.37 to 6.49 (2014: 9.96 to 9.99) percent per annum.
2015 2014
Detailed information relating to investments including quality of available-for-sale securities is given below:

9.5.2 Listed shares Rating2015 2014 2015 2014 2015 2014
9.5.2.1 Held-for-trading
ChemicalEngro Corporation Limited AA / A1+ 45,500 20,000 13,782 4,232 12,712 4,430 Fauji Fertilizer Company Limited Unrated - 39,500 - 4,699 - 4,626
ElectricityKot Addu Power Company Limited AA+/A1+ 61,000 - 5,365 - 4,941 -
Cable & Electrical GoodsPak Elektron Limited A/A1 225,000 - 15,541 - 14,072 - TPL Trakker Limited A-/A2 875,000 - 14,470 - 13,064 -
Technology and CommunicationSystems Limited Unrated 200,000 - 13,669 - 12,606 -
Oil and Gas Attock Petroleum Limited Unrated - 3,000 - 1,597 - 1,619 Hascol Petroleum Limited A+/A-1 70,000 - 11,124 - 10,098 - Mari Petroleum Company Limited Unrated 9,100 - 6,407 - 6,343 - Oil & Gas Development Company Limited Unrated - 1,000 - 205 - 205 Pakistan Oilfields Limited Unrated - 2,000 - 975 - 759 Pakistan Petroleum Limited Unrated - 10,000 - 1,770 - 1,765
Construction and materials (Cement)Attock Cement Limited Unrated - 45,300 - 8,810 - 8,841 D.G.Khan Cement Company Limited Unrated 25,000 - 3,700 - 3,690 - Lafarge Pakistan Cement Limited Unrated - 500,000 - 8,673 - 8,675 Lucky Cement Limited Unrated 50,500 - 26,647 - 24,999 -
Commercial BanksFaysal Bank Limited AA / A1+ - 35,000 - 624 - 637 MCB Bank Limited AAA / A1+ - 15,000 - 4,446 - 4,585 United Bank Limited AA+ / A1+ - 63,000 - 11,158 - 11,133
Food ProducersEngro Foods Limited Unrated - 50,000 - 5,297 - 5,427
TextileNishat Mills Limited AA / A1+ - 20,000 - 2,443 - 2,420
110,705 54,929 102,525 55,122
9.5.2.2 Available-for-sale
Construction and materials (Cement)Attock Cement Limited Unrated - 105,700 - 19,328 - 20,630 Cherat Cement Limited A/A1 103,000 180,000 9,256 11,665 9,288 12,362 Fauji Cement Company Limited Unrated 200,000 - 6,825 - 7,364 - Kohat Cement Limited Unrated 15,500 - 3,102 - 3,733 - Lucky Cement Limited Unrated - 5,000 - 2,426 - 2,501 Maple Leaf Cement Factory Limited A/A1 100,000 - 7,075 - 7,458 -
ElectricityHUB Power Company Limited AA+ / A1+ 200,000 - 20,391 - 20,520 - Kot Addu Power Company Limited AA+/A1+ 285,000 75,000 22,573 4,737 23,085 5,921 Lalpir Power Limited AA / A1+ 903,000 200,000 27,522 4,402 26,855 5,980 Nishat Chunian Power Limited A+/A2 650,000 - 35,911 - 35,782 - Nishat Power Limited A+ / A1 402,500 750,000 22,502 34,984 21,606 34,200
ChemicalAgritech Limited (Note 9.5.5.2) Unrated 1,629,911 1,629,911 57,046 57,046 15,240 12,632 Engro Corporation Limited AA/ A1+ 30,000 20,000 8,498 4,430 8,382 4,430 Engro Fertilizer Company Limited AA-/A1+ 120,000 - 10,172 - 10,096 - Fauji Fertilizer Company Limited Unrated 300,000 535,000 39,395 63,076 35,394 62,654
Commercial BanksAllied Bank Limited AA+ / A1+ 215,000 250,000 24,839 28,883 20,265 28,395 Habib Bank Limited AAA/A1+ 140,000 - 29,384 - 28,017 - Habib Metro Bank Limited AA+/A1+ 1,000,000 - 36,407 - 30,470 - JS Bank Limited A+ / A1+ 1,850,000 7,137,500 12,833 49,523 14,337 50,962 United Bank Limited AA+ / A1+ 315,700 10,000 50,310 1,698 48,918 1,767
Financial ServicesNext Capital Limited Unrated - 808,400 - 8,084 - 4,648
Refinery / Oil & GasAttock Petroleum Limited Unrated 22,050 - 11,372 - 11,138 - Oil & Gas Development Company Limited Unrated 50,000 201,700 9,024 53,955 5,867 41,524 Pak Refinery Limited A-/A2 437,000 - 25,131 - 19,757 - Pakistan Oilfield Limited Unrated 30,000 121,000 10,553 61,617 8,040 45,902 Pakistan Petroleum Limited Unrated - 202,000 - 45,823 - 35,657 Pakistan State Oil Company Limited AA+ / A1+ 80,000 188,050 28,585 73,685 26,062 67,305 Sui Northern Gas Company Limited AA+/A1 294,500 - 9,904 - 7,080 - Sui Southern Gas Company Limited AA-/A1 500,000 - 22,058 - 18,675 -
Paper and BoardCentury Paper & Board A+/A1 200,500 100,000 12,503 6,553 10,263 5,421 Cherat Packaging Limited Unrated 50,000 - 13,091 - 15,155 -
Food ProducersFarhan Sugar Mills Limited Unrated - 60,000 - 2,532 - 2,369
TextileNishat Mills Limited AA/ A1+ 140,000 435,900 17,649 58,647 13,282 52,740
Technology and CommunicationSystems Limited Unrated 1,465,000 - 70,941 - 92,339 -
Equity Investments InstrumentsPICIC Growth Fund Unrated 462,000 - 12,668 - 10,409 - PICIC Investment Fund Unrated 407,500 - 5,198 - 4,658 -
Industrial TransportationPakistan International Bulk Terminal Limited Unrated 435,500 604,000 9,998 15,597 12,181 14,912
682,716 608,691 621,716 512,912
793,421 663,620 724,241 568,034
No. of shares held Cost Market value
------------------- (Rupees in '000) -------------------

9.5.3
9.5.3.1 Available-for-saleShare Break-up / Latest Name of the Chief Executive
2015 2014 2015 2014 holding carrying value available% per share financial
Shareholding upto 10% (Rupees) statements
Alhamra Avenue (Private) Limited 5,000,000 5,000,000 50,000 50,000 3.12 9.21 30-June-2012*** Arshad
Systems Limited - 1,868,106 - 10,000 2.18 24.63 31-Dec-2014* Mr. Asif Peer
Pakistan Textile City Limited 5,000,000 5,000,000 50,000 50,000 4.00 3.38 30-Jun-2015* Mr. Mohammad Hanif
Techlogix International Limited 1,872,197 1,872,197 21,333 21,333 1.84 3.02 31-Dec-2014** Mr. Kewan Qadre Khawaja /Mr. Salman Akhter (Co CEO)
Orient Power Company (Private) Limited (Note 21.2) 22,600,000 22,600,000 226,000 226,000 5.43 20.26 30-Jun-2015* Mr. Nadeem Baber
347,333 357,333
*Audited financial statement**Audited consolidated financial statements*** Unaudited financial statements
9.5.4 Listed Term Finance Certificates
Rate of Interest Profit Maturity LongPayment Term 2015 2014 2015 2014
rating
9.5.4.1 Held-for-trading
Commercial bank / DFI
Summit Bank Limited 6 month Kibor + 3.25% Half yearly 27-Oct-18 A (SO) 5,000 - 25,600 -
9.5.4.2 Available-for-sale
Commercial banks / DFIs
Allied Bank Limited II 6 month Kibor + 0.85% Half yearly 28-Aug-19 AA - 13,962 - 68,157
Askari Bank Limited III 6 month Kibor + 2.5% Half yearly 18-Nov-19 AA- - 50,949 - 249,339
Bank Al-Falah Limited V 6 month Kibor + 1.25% Half yearly 20-Feb-21 AA- 29,500 29,500 150,042 146,366
NIB Bank Limited 6 month Kibor + 1.15% Half yearly 19-Jun-22 A+ 35,000 30,000 173,146 147,845
Summit Bank Limited 6 month Kibor + 3.25% Half yearly 27-Oct-18 A (SO) 10,000 10,000 51,197 42,714
Soneri Bank Limited 6 month Kibor + 1.35% Half yearly 8-Jul-23 A+ 60,000 - 293,915 -
Technology and communication
Telecard Limited 3 month Kibor + 5.04% Half yearly 27-May-15 Unrated - 56,716 - - WorldCall Telecom Limited 6 month Kibor + 1.6% Half yearly 7-Oct-21 Unrated 108,623 108,623 - 162,836
Personal goods
Azgard Nine Limited 6 month Kibor + 2.4% Half yearly 20-Sep-17 Unrated 15,000 15,000 - 2,662
Electricity
KESC AZM Certificate 14.75% Quarterly 3-Jul-15 AA - 10,000 - 49,587
Miscellaneous
Pace (Pakistan) Limited 6 month Kibor + 2% Half yearly 15-Feb-17 Unrated 60,230 60,230 72,273 108,409
766,173 977,915
9.5.4.3 The face value of each certificate held in listed TFCs is Rs. 5,000 (2014: Rs. 5,000) per certificate as at issue date.
Market value
(Rupees in '000)
Particulars of investments held in shares of unlisted companies
Number of shares held Cost
(Rupees in '000)
Mr. Muhammad Hammad
No. of certificates held

9.5.5 Unlisted Term Finance Certificate
2015 2014 2015 2014
9.5.5.1 Held-for-trading
Askari Bank Limited Half yearly 30-Sep-24 AA- 2,000 - 9,974 -
9.5.5.2 Available-for-sale
Commercial banks
Faysal Bank Limited - PPTFC Half yearly 27-Dec-17 AA- 30,000 30,000 153,068 156,691
Bank Al-Falah Limited - IV Half yearly 2-Dec-17 AA- 33,000 33,000 167,192 170,405
Development Financial Institutions
Pak-Libya Holding Co. (Pvt) Limited - PPTFC Half yearly 7-Feb-16 AA 8,000 8,000 6,646 20,025
Pak-Libya Holding Co. (Pvt) Limited - PPTFC Quarterly 23-Feb-20 AA 60,000 - 300,000 -
Chemical
Engro Fertilizers Limited - PPTFC Half yearly 18-Mar-18 AA 44,500 44,500 220,769 220,748
Agri Tech Limited (Note 9.5.5.3) Half yearly 29-Nov-19 Unrated 20,000 20,000 - 27,819
Agri Tech Limited (Note 9.5.5.3) Zero coupon Half yearly 1-Jan-15 Unrated 4,309 4,309 - -
Personal goods
Nishat (Chunain) Limited - PPTFC Quarterly 30-Sep-15 A - 10,000 - 12,500
Azgard Nine Limited - III Half yearly 4-Dec-17 Unrated 2,000 2,000 - 473
Azgard Nine Limited - IV Quarterly 18-Nov-15 Unrated 5,000 5,000 - 1,744
Azgard Nine Limited - V Zero coupon Half yearly 31-Mar-17 Unrated 5,687 5,687 - -
Leasing
Security Leasing Corporation Limited - 29-Jan-22 Unrated 12,000 12,000 - -
857,649 610,405
9.5.5.3
9.5.6 Investment in unlisted Sukuks
9.5.6.1 Available-for-sale
2015 2014 2015 2014
Personal Goods
Amtex Limited Quarterly 12-Oct-12 Unrated 22,000 22,000 20,450 20,450
Leasing
Security Leasing Corporation Limited - Monthly 19-Jan-22 Unrated 10,000 10,000 - -
Security Leasing Corporation Limited II - Monthly 19-Jan-22 Unrated 10,000 10,000 - -
Energy
Liberty Power Tech (Private) Limited Quarterly 18-Mar-21 A+ 60,000 60,000 207,466 237,940
K-Electric Limited Quarterly 19-Mar-17 AA 8,000 8,000 40,717 41,400
Chemical
Engro Fertilzers Limited 6 months Kibor +1.75% Half yearly 9-Jul-19 AA- - 15,800 - 80,406
Banks
Al- Baraka Bank (Pakistan) Limited 6 months Kibor +1.25% Half yearly 25-Sep-21 A 500 500 425,341 500,000
Miscellaneous
Al-Razi HealthCare (Private) Limited Monthly 4-Feb-21 Unrated 30,000 30,000 95,833 104,000
New Allied Electronic Industries (Private) Limited Quarterly 25-Jul-12 Unrated 272,000 272,000 - -
789,807 984,196
9.5.6.2
3 month Kibor + 2.25%
3 month Kibor + 3%
3 month Kibor + 2.25%
Market value/CostLong Term Rating
No. of certificates held
6 month Kibor + 2.25%
3 month Kibor + 1%
-
Rate of Interest
Rate of Interest Profit Payment
Maturity Long Term Rating
No. of certificates held Market value/Cost
(Rupees in '000)
6 month Kibor + 2.5%
6 month Kibor + 1.6%
3 month Kibor + 1.5%
6 month Kibor + 1.70%
6 month Kibor + 1.75%
6 month Kibor + 2.25%
6 month Kibor + 1.20%
As per the terms of the Share Transfer and Debt Swap Agreement, Agritech Limited shares shall be held by the respective trustees for the TFC issues in their name for and on behalf of the TFC Holders who shall be the beneficial owners of the subject shares in proportion to their holdings. The Trustees for the TFC issue are authorised pursuant to shareholders investors agreement to hold the said ordinary shares for and on behalf of TFC holders for a period of five years from the date of transfer.
3 month Kibor + 2.6%
The face value of each certificate held in unlisted Sukuks is Rs. 5,000 (2014: Rs. 5,000) per certificate as at issue date except for New Allied Electronic Industries (Private)Limited having face value per Sukuk of Rs. 312.5 (2014: Rs. 312.5) and Al-Baraka Bank (Pakistan) Limited having face value of Rs 1 million.
Profit Payment
Maturity
(Rupees in '000)
3 month Kibor + 2%
6 month Kibor + 2.5%

9.5.7 Investment in associates
9.5.7.1 The holding company holds investment in ordinary shares / units of Rs. 10 each in the following entities:
2015 2014 2015 2014
(Rupees)9.5.7.2 Quoted
Japan Power Generation Company Limited (JPGL) 30,560,189 30,560,189 - - 19.59% (33.38) 30-Sep-15* Mr. Amjad (Note 9.5.7.3 & 22.1) Awan
Pak Oman Advantage Fund - 27,359,000 - 301,220 - 10.39 30-Jun-15** Mr. Adeel Ahmad Khan
Pak Oman Islamic Asset Allocation Fund 2,000,000 2,000,000 112,161 113,781 99.96% 56.08 31-Dec-15** Mr. Adeel Ahmad
Khan
Pak Oman Advantage Asset Allocation Fund 2,000,000 2,000,000 103,179 108,140 99.98% 51.59 31-Dec-15** Mr. Adeel Ahmad
Khan
Pak Oman Advantage Islamic Income Fund 1,866,994 2,003,976 97,832 106,408 96.50% 52.40 31-Dec-15** Mr. Adeel Ahmad
Khan
Pak Oman Government Securities Fund 23,660,643 5,872,795 251,378 61,991 99.09% 10.62 31-Dec-15** Mr. Adeel Ahmad
Khan
Unquoted
Pak Oman Microfinance Bank Limited (Note 9.5.8)
38,470,788 38,470,788 359,045 359,987 33.40% 9.33 31-12-2015*** Mr. Munawar Suleman
923,595 1,051,527
* Unaudited financial statements **Reviewed financial statements.
***Audited financial statement
9.5.7.3
9.5.7.4 The above associates are incorporated in Pakistan.
9.5.7.5 Associates - Key Information
Particulars
Assets - 105,077 116,128 107,109 407,710 10,820,082 1,127,183
Total income - 3,705 3,931 3,919 1,959 16,029,223 192,527
Liabilities 49,355 7,301 18,022 13,287 10,335 401,027 52,722
Profit before taxation 38,095 1,816 11,614 7,113 11,493 (580,693) 11,471
Profit after taxation 38,095 1,816 11,614 7,113 11,493 (580,693) 5,748
* Audited financial statements
**Reviewed financial statements.
*** Unaudited financial statements
9.5.8
Pak Oman Advantage
Islamic IncomeFund **
(Rupees in '000)
Holding
Pak Oman Advantage
Fund *
Pak Oman Government Securities
Fund **
Pak Oman Advantage
Asset Allocation Fund **
Investment in these securities forms part of strategic investment of the holding company and can not be sold for a period of five years from the last date of purchase of securities.
Pak Oman Islamic Asset
Allocation Fund **
The holding company exercises significant influence on the financial and operational policies of JPGL due to representation of four directors out of thirteen directors. Accordingly, investment in JPGL is accounted for as investment in associate in these consolidated financial statements.
Latest available financial
statements
Name ofthe chief executive
Number of shares / units
Japan Power Generation
Limited ***
--------------------------------------------------------------------- (Rupees in '000) ------------------------------------------------
Break-up value per
share / unit
Pak Oman Microfinance Bank Limited
***

9.6 (Deficit) / surplus on revaluation of Note 2015 2014
held-for-trading securities
Federal Government Securities
- Market Treasury Bills 19 1,327 - Pakistan Investment Bonds 1,618 2,588
1,637 3,915 Shares-listed (8,180) 193 Term finance certificates (TFCs) - listed 646 - Term finance certificates (TFCs) - unlisted (22)
(5,919) 4,108
10 ADVANCES
In Pakistan
Loans, cash credit, running finance, etc. in Pakistan 9,021,789 8,565,685
Net investment in finance leases in Pakistan 10.3 1,751,575 1,268,825
Advance against leases 8,138 6,373
Staff loans 10.4 129,385 123,345
Advances - Gross 10.1 10,910,887 9,964,228
Less: Provision for non-performing advances 10.6 914,462 893,914
Advances - net of provision 9,996,425 9,070,314
10.1 Particulars of advances (Gross)
10.1.1 In local currency 10.1.3 10,910,887 9,964,228
10.1.2 In foreign currency - -
10.1.3 Short term (for upto one year) 3,619,297 3,718,994
Long term (for over one year) 7,291,590 6,245,234
10,910,887 9,964,228
10.2 In accordance with Prudential Regulations issued by the SBP, the holding company has availed the benefit of FSV against the non-performing advances and term finance certificates. As of 31 December 2015, the holding company has availed total accumulated FSV benefit amounting to Rs. 99.391 million (net of tax Rs. 68.580 million). Accordingly, accumulated profit of Rs. 68.580 million (net of transfer to statutory reserves Rs. 54.864 million) will not be available for the distribution as cash or stock dividend to the shareholders of the holding company / bonus to employees of the holding company as required by the aforementioned SBP directives.
(Rupees in '000)

10.3 Net investment in finance lease
10.3.1 The periodic break-up of minimum lease payments due are as follows :
Total Total
Lease rentals receivable 795,324 895,471 1,690,795 587,169 694,071 1,281,240 Residual value 63,784 213,736 277,520 43,679 152,218 195,897 Minimum lease payments 859,108 1,109,207 1,968,315 630,848 846,289 1,477,137 Financial charges for future periods (114,789) (101,951) (216,740) (95,052) (113,260) (208,312) Present value of minimum lease payments 744,319 1,007,256 1,751,575 535,796 733,029 1,268,825
10.3.1.1
10.3.1.2
10.4
10.4.1 Staff loans include an amount of Rs NIL million (2014: Rs. 10.033 million) advanced to the holding company's Chief Executive.
10.4.2 Staff loans include an amount of Rs 3.162 million (2014: NIL) provided by subsidiary company to its Chief Executive.
10.5 Particulars of classification
10.5.1
Domestic Overseas Total Domestic Overseas Total Domestic Overseas Total
Substandard 310,823 - 310,823 75,135 - 75,135 75,135 - 75,135 Doubtful - - - - - - - - - Loss 883,043 - 883,043 839,327 - 839,327 839,327 - 839,327
1,193,866 - 1,193,866 914,462 - 914,462 914,462 - 914,462
Domestic Overseas Total Domestic Overseas Total Domestic Overseas Total
Substandard 57,950 - 57,950 8,090 - 8,090 8,090 - 8,090 Doubtful - - - - - - - - - Loss 979,958 - 979,958 885,824 - 885,824 885,824 - 885,824
1,037,908 - 1,037,908 893,914 - 893,914 893,914 - 893,914
10.6 Particulars of provisions against non-performing advances
Specific General Total Specific General TotalNote
Opening balance 893,914 - 893,914 938,867 - 938,867
Charge during the year 115,664 - 115,664 48,269 - 48,269 Reversal during the year (95,116) - (95,116) (93,222) - (93,222) Net charge / (reversal) 20,548 - 20,548 (44,953) - (44,953) Less: Amounts written off during the year 10.7 - - - - - - Closing balance 914,462 - 914,462 893,914 - 893,914
10.6.1 Particulars of provisions against non-performing advances
Specific General Total Specific General Total
In local currency 914,462 - 914,462 893,914 - 893,914 In foreign currencies - - - - - -
914,462 - 914,462 893,914 - 893,914
---------------------------------------------- (Rupees in '000) ----------------------------------------------
Not later than one
year
Later than one and less
than five
2015 2014
-------------------------------------------- (Rupees in '000) --------------------------------------------
Staff loans include personal loans and house loans given to employees in accordance with their terms of appointment. House loans carry mark-up at a rate of 5 (2014: 5) percent per annum, while no mark-up is charged on personal loans.
In respect of the aforementioned finance leases the Group holds an aggregate sum of Rs. 219.218 million (2014: Rs. 155.246 million) as security deposits on behalf of the lessees which are included under 'other liabilities' (note 17).
The holding company has entered into lease agreements of various vehicles and plant and machinery. The amount recoverable under these arrangements are receivable by the year 2022 and are subject to finance income at rates ranging between 8.03 to 16.11 (2014: 11.13 to 16.11) percent per annum. Maximum amount of lease outstanding as at 31 December 2015 amounts to Rs. 379 million (2014: Rs. 179 million).
Not later than one year
Later than one and less
than five
Provision required
Classified advances Provision required Provision held
Advances include Rs. 1,193.866 million (2014: Rs. 1,037.908 million) which have been placed under the non-performing status as detailed below:
2015
2014
Classified advances Provision held
2015 2014
---------------------------------------------- (Rupees in '000) ----------------------------------------------
20142015
------------------------------------------------------------------------- (Rupees in '000) -----------------------------------------------------------------------------
------------------------------------------------------------------------------ (Rupees in '000) ------------------------------------------------------------------------

10.7 Particulars of write offs 2015 2014
Against provisions - -
Directly charged to profit and loss account - -
- -
10.7.1 Write offs of Rs. 500,000 and above - -
Write offs of below Rs 500,000 - -
- -
10.7.2 Statement showing written off loans or any other financial relief of five hundred thousand rupees or above provided during the year ended December 31, 2015.
Name and
address of the
borrower (9+10+11)
1 2 4 5 6 7 8 9 10 11 12
1 Coastal Refinery Limited Lt Gen (R) Amjad Shuaib 37405-0296136-7 Mr. Abdul Hamid 44,595 13,753 14,957 73,305 - 13,753 15,696 29,449
Mr. Ali Faizan Syed 42301-3270649-7 Syed Ashfaq Hussain
Mr. Ali Salman Syed 42301-6981568-1 Syed Ashfaq Hussain
Syed Ashfaq Hussain 42301-4051598-3 Syed Sher Shah
2 Dewan Automotive Enginering Limited Mr. Haroon Iqbal 42301-9916370-5 Mian M. Sharif 6,000 5,199 10,850 22,049 - 5,199 10,850 16,049
Mr. Waseem-ul-Haque Ansari 42000-0384884-7 Mr. Tehsin ul Haque Ansari
Mr. Manzoor Ahmed 42201-1209367-3 Mr. Rehmat Ali
Syed Maqbool Ali 42201-7761421-7 Syed Mahfooz Ali
Mr. Ishtiaq Ahmed 42201-0301293-3 Mr. Abdul Rashid
Mr. Mohammad Baqar Jafferi 33202-1194635-9 Mr. Faiz Muhammad
Mr. Aziz-ul-Haque 42301-8514003-5 Mr. Noor-ul-Haq
3 Dewan Cement Limited Mr. Dewan Muhammad Yousuf Farooqui 42301-6948978-9 Mr. Dewan M. Umer Farooque 7,860 21,503 21,316 50,679 - 10,316 21,316 31,632
Syed Muhammad Anwar 42101-5101100-1 Syed Muhammad Aijaz
Mr. Haroon Iqbal 42301-9916370-5 Mian M. Sharif
Mr. Dewan Abdul Rehman Farooqui 42301-0862043-3 Mr. M. Salman Farooqui
Mr. Ghazanfar Baber Siddiqui 42101-4251145-9 Mr. Nizam uddin
Mr. Aziz-ul-Haque 42301-8514003-5 Mr. Noor-ul-Haq
Mr. Ishtiaq Ahmed 42201-0301293-3 Mr. Abdul Rashid
4 Marvi Pharmaceuticals (Pvt.) Ltd. Mr. Nizar Fazwani 501-40-213808 Mr. Mohammad Ali 2,607 779 - 3,386 - 665 - 665
Address: 'Plot 70, Sector 24, Korangi Industrial AreaKarachi
Ms. Samina 501-089-800662 Mr. Nadir S. Fazwani
61,062 41,234 47,123 149,419 - 29,933 47,862 77,795
2015 2014
10.8 Particulars of loans and advances to directors, associated companies etc. Note
Balance at beginning of the year 123,345 120,483
Loans granted during the year 46,280 33,332
Repayments (40,240) (30,470)
Balance at end of the year 129,385 123,345
Debts due by other related parties
Balance at beginning of the year 278,654 303,278
Loans granted during the year - -
Repayments (28,024) (24,624)
Balance at end of the year 250,630 278,654
10.8.1 380,015 401,999
10.8.1
10.9
11 OPERATING FIXED ASSETS 2015 2014
Note
Property and equipments 11.1 79,504 67,647
Intangible assets 11.2 115 305
Advance for capital expenditure 3,555 1,753
83,174 69,705
--------------------------------------------------------------- (Rupees in '000) ----------------------------------------------------------
Others TotalPrincipal
Name of individuals/partners/
directors with CNIC No.
3
Outstanding liabilities at beginning of yearS. No.
Interest/ mark-up
Principal written-off
(Rupees in '000)
Interest/ mark-up
written-off
Other financial relief
provided
TotalFather's/Husband's name
(Rupees in '000)
Address: Block A, 7th Floor, FTC Building, Shahrah-e-Faisal, Karachi
Debts due by directors, executives or officers of the holding company or any of them either severally or jointly with any other persons.
(Rupees in '000)
Address: 10-C, Bukhari Commercial Lane 3,Phase VI, DHA, Karachi.
Address: Block A, 7th Floor, FTC Building, Shahrah-e-Faisal, Karachi
Maximum total amount of advances including temporary advances granted during the year amounts to Rs. 404 (2014: Rs. 421) million. The maximum amount has been calculated by reference to
This includes an amount of Rs. 68.2 million due from Japan Power Generation Limited (an associated company) classified as non performing loan under loss category. The holding company has recorded provision for entire amount due as at 31 December 2015.

11.1 Property and equipments Net book
OwnedOffice premises * 42,126 - 42,126 21,763 2,106 23,869 18,257 5
Improvements 22,889 411 23,300 17,833 1,399 19,232 4,068 20- -
Office equipments 13,984 2,331 14,246 12,281 605 11,040 3,206 20(2,069) (1,846)
Computer equipments 24,379 4,635 28,676 22,205 1,968 23,845 4,831 33.33(338) (328)
Furniture and fixtures 15,849 1,874 16,323 14,304 634 13,943 2,380 20(1,400) (995)
Vehicles 66,628 30,483 72,292 30,110 12,789 27,470 44,822 20(24,819) (15,429)
Assets subject to finance leaseVehicles 1,727 1,972 1,972 1,439 320 32 1,940 20
(1,727) (1,727) 187,582 41,706 198,935 119,935 19,821 119,431 79,504
(30,353) (20,325)
Net book
Owned
Office premises* 42,126 - 42,126 19,657 2,106 21,763 20,363 5
Improvements 19,947 3,208 22,889 17,171 927 17,833 5,056 20(266) (265)
Office equipments 13,360 956 13,984 11,840 683 12,281 1,703 20(332) (242)
Computer equipments 25,264 1,664 24,379 23,265 1,535 22,205 2,174 33.33(2,549) (2,595)
Furniture and fixtures 15,649 200 15,849 13,623 681 14,304 1,545 20- -
Vehicles 20,109 28,218 66,628 7,836 10,937 30,110 36,518 2032,842 ** 24,531 **
(14,541) (13,194)
Assets subject to finance leaseVehicles 34,569 - 1,727 25,625 345 1,439 288 20
(32,842) ** (24,531) **171,024 34,246 187,582 119,017 17,214 119,935 67,647
(17,688) (16,296)
* The transfer of title of office premises in the holding company's name is in process.
As at 31 December
2015
During the year/
(on disposals)
Rate
%
%
As at 31 December
2014
As at 1 January
2014
As at 31 December
2014
As at 31 December
2014
Rate
2014
As at 1 January
2014
During the year/
**transfers /(on disposals)
Cost Depreciation
Cost
-------------------------------------------------- (Rupees in '000) ---------------------------------------------------------
Additions / (deletions) during the
year
As at 31 December
2015
Depreciation
As at 1 January
2015
As at 1 January
2015
As at31
December 2015
2015
Additions / **transfers / (deletions)
during the year
------------------------------------------------------- (Rupees in '000) ----------------------------------------------------

11.1.1
Description Cost Accumulated Net book Sale Gain / (loss) Mode of depreciation value proceeds disposal
Vehicles
Toyota Corolla 1,389 1,389 - 367 367
Honda Civic 1,629 1,629 - 343 343
Honda Civic 1,631 1,631 - 317 317
Suzuki Cultus 917 917 - 233 233
Suzuki Cultus 917 917 - 250 250
Toyota Corolla 1,337 1,203 134 617 483
Honda Civic 1,629 1,629 - 295 295
Suzuki Cultus 970 598 372 715 343 Negotiations
Suzuki Cultus 917 917 - 233 233
Mitsubishi Lancer 969 969 - 535 535 Negotiations
Toyota Camry 1,727 1,727 - 305 305
14,032 13,526 506 4,210 3,704
Mercedes 10,715 3,035 7,680 3,840 (3,840) Toyota Corolla 1,763 559 1,204 602 (602) Office Equipments 1,095 1,011 84 - (84) Computer Equipments 253 253 - - - Furniture and fixtures 1,300 975 325 - (325)
15,126 5,833 9,293 4,442 (4,851)
Others 1,195 966 229 134 (95)
30,353 20,325 10,028 8,786 (1,242)
11.2 Intangible assets
%
Software licenses 20,081 - 20,081 19,776 190 19,966 115 33.33
%
Software licenses 19,837 244 20,081 19,202 574 19,776 305 33.33
Group's policy
Group's policy
Group's policy
Syed Mohammad Shoaib Omair (Executive)
Particulars of purchaser
-------------------------------- (Rupees in '000) ------------------------------------
Details of disposals of assets whose original cost or the book value exceeds Rs. 1 million or Rs. 250,000 respectively whichever is less and property and equipment disposed off to the Chief Executive or to a director or to executives or to any other related party, irrespective of the values, are as follows:
Net book value
As at 31 December
2015
Cost Net book
value
---------------------------------------------------- (Rupees in '000) -------------------------------------------------------
Amortization As at 1
January 2015
--------------------------------------------------------- (Rupees in '000) ---------------------------------------------------
Rate As at 31 December
2014
As at 1 January
2014
During the year
Cost Amortization As at 1 January
2014
Addition during the year
As at 31 December
2014
During the year
As at 1 January
2015
Addition during the
year
Rate As at 31 December
2015
As at 31 December
2015
As at 31 December
2014
Group's policy
Mr. Mohammad Shoaib(Executive)
Group's policy
Mr. Zalmai R. Khan(Executive)
Group's policy
Mr. Khurram Faizyab(Executive)
Group's policy
Syed Muhammad Farhan Jaffer
Group's policy
Touseef Hayat(Executive)
Group's policy
Mr. Mohammad Naeem Saeed (Former Executive)(Executive)
M/S Auto One (3/29, Khalid bin waleed road, karachi)
Mr. Hassan Iqbal
Mr. Muhammad Ibrahim Khan S/O Aulia Khan CNIC No. 16202-1856939-1
Mr. Noaman Abdul Majid
As per BOD Approval
Mr. Agha Ahmed Shah (Former Chief executive
officer)

11.3 Included in cost of property and equipments are fully depreciated items still in use having cost of:
Note 2015 2014
Improvements 6,851 15,929 Office equipments 6,369 11,320 Computer equipments 12,675 20,435 Furniture and fixtures 8,440 12,619 Vehicles 2,494 5,430 Intangible assets 11,426 19,483
48,255 85,216
12 DEFERRED TAX ASSETS
Deferred tax assets arising in respect of:
Provision for diminution in the value of investments 271,007 256,757
Assets subject to finance leases 10 70
Amortisation of premium on Federal Government Securities 7,281 573
Provision against non-performing advances 283,483 312,870
561,781 570,270
Less: Deferred tax liabilities arising in respect of:
Accelerated tax depreciation allowances 204 (21)
Revaluation on investments classified as available-for-sale 21 (174,611) (165,029)
Revaluation on investments classified as held-for-trading 720 (1,394)
Net investment in finance leases (57,566) (76,399)
Dividend receivable - (2,312)
(231,253) (245,155) 12.1 330,528 325,115
12.1 Movement of deferred tax
Profit and loss account
Deficit on revaluation of available for
securities
Profit and loss
account
Surplus on revaluation of available
for sale securities
Deferred tax assets arising in respect of:
Provision for diminution in
the value of investments 182,941 73,816 - 256,757 14,250 - 271,007
Assets subject to finance leases (1,170) 1,240 - 70 (60) - 10
Provision against other assets 1,294 (1,294) - - - - -
Amortisation of premium on
Federal Government securities 778 (205) - 573 6,708 - 7,281
Provision against non-performing
advances 328,603 (15,733) - 312,870 (29,387) - 283,483
512,446 57,824 - 570,270 (8,489) - 561,781
Less: deferred tax liabilities arising in respect of:
Accelerated tax depreciation
allowances 601 (622) - (21) 225 - 204
Revaluation on investments
classified as available-for-sale 52,659 - (217,688) (165,029) - (9,582) (174,611)
Revaluation on investments
classified as held-for-trading (1,402) 8 - (1,394) 2,114 - 720
Net Investment in finance leases (71,622) (4,777) - (76,399) 18,833 - (57,566)
Dividend receivable - (2,312) - (2,312) 2,312 - -
(19,764) (7,703) (217,688) (245,155) 23,484 (9,582) (231,253)
492,682 50,121 (217,688) 325,115 14,995 (9,582) 330,528
----------------------------------------------------- (Rupees in '000) ---------------------------------------------------
31 December 2014 31 December 2015
Recognized in Recognized in 1 January 2014
(Rupees in '000)

13 OTHER ASSETS 2015 2014Note
Mark-up / return / interest receivable in local currency 429,515 436,914 Dividend income receivable - 23,117 Mark-up / profit receivable on purchase of securities 107,734 111,345 Security deposits 4,237 4,188 Prepayments 13,077 10,780 Receivable against sale of investments 16,240 18,107 Taxation 39,933 70,069 Non-banking assets acquired in satisfaction of claims 13.1 32,096 32,096 Receivable from funds 4,617 3,937 Others 4,489 -
651,938 710,553 Less: Provision held against other assets 13.2 - -
651,938 710,553
13.1 Market value of non-banking assets acquired in satisfaction of claims. 37,760 37,760
13.2 Provision against other assets
Opening balance - 3,698 Charge for the year - 5,664 Reversals - (3,698)
- 1,966
Amount written off - (5,664) Closing balance - -
14 BORROWINGS
In Pakistan 14,479,440 8,868,730 Outside Pakistan - -
14,479,440 8,868,730
14.1 Particulars of borrowings with respect to currencies
In local currency 14,479,440 8,868,730 In foreign currency - -
14,479,440 8,868,730
14.2 Particulars of borrowings
Secured Borrowings from the State Bank of Pakistan:- Long term financing for export oriented projects (LTF - EOP) 14.3 - 14,904 - Long term financing facility (LTFF) 14.3 226,709 777,096 - Financing facility for storage of agricultural produce (FFSAP) 14.3 10,031 13,375 Repurchase agreement borrowings 14.4 9,006,240 5,979,208 Long term borrowings 14.5 1,550,000 516,667 Short term running finance 14.6 187,460 112,980
10,980,440 7,414,230
UnsecuredPlacements 14.7 799,000 1,454,500
Murabaha financing 14.8 2,700,000 -
14,479,440 8,868,730
(Rupees in '000)

14.3
14.4
14.5
14.6
14.7
14.8
15 DEPOSITS AND OTHER ACCOUNTS 2015 2014
Certificates of investment - remunerative (in local currency)Financial institutions 985,726 2,888,748 Others 3,024,134 3,407,238
4,009,860 6,295,986
15.1 Particular of deposits
In local currency 4,009,860 6,295,986 In foreign currency - -
4,009,860 6,295,986
15.2
15.3
15.4
16 LIABILITIES AGAINST ASSETS SUBJECT TO FINANCE LEASE
Not later than one year 431 130 301 504 16 488 Later than one year but not later than five years 1,921 249 1,672 - - -
2,352 379 1,973 504 16 488
The holding company has entered into agreements for financing with the SBP of long term finance for export oriented projects to customers. According to the terms of the respective agreements, the SBP has the right to receive the outstanding amount from the holding company at the date of maturity of the finances by directly debiting the current account maintained by the holding company with the SBP. The rate of return ranges from 6.25 to 10.10 (2014: 5 to 10.10) percent per annum. These are repayable within 7 years (2014: 6 years).
The rate of return on these repurchase agreement borrowings, maturing in January 2016 (2014: January 2015), ranges between 6.20 to 6.45 (2014: 9.5 to 10.30) percent per annum. Securities having cost of Rs 8,479.620 million (2014: Rs 5,969.243 million) have been pledged against these borrowings.
The rate of return on these long-term borrowings ranges from 6.83 to 7.54 (2014: 9.98 to 10.44) percent per annum. The above facilities are secured against advances receivable.
The rate of return on these short-term running finance facilities is three month KIBOR + 0.25% (2014: three month KIBOR + 0.25%). The above facility are secured against loan and advances receivable.
The rates of return on these placements, maturing in January to February 2016 (2014: January 2015 to April 2015) ranges between 6.10 to 7 (2014: 9.50 to 10.15) percent per annum.
Principal outstanding
(Rupees in '000)
2015
These include Certificate of Investments purchased by gratuity fund of the holding company as disclosed in note 33.7.1 and by provident fund of the holding company amounting to Rs. 5.36 million (2014: NIL).
These include Certificate of Investments purchased by Pak Oman Microfinance Bank Limited (associate) of the holding company amounting to Rs. 536 million (2014: 733 million).
Minimum lease
payments
Minimum lease
payments
2014 Financial
charges for future period
Principal outstanding
The rates of return on these murabaha financing, maturing in January 2016 (2014: NIL) ranges between 6.25 to 6.35 (2014: NIL) percent per annum.
-------------------------------------------- (Rupees in '000) ----------------------------------------------
Financial charges for
future period
The rate of return on deposits maturing between January 2016 to May 2017 (2014: January 2015 to July 2017) ranges between 6.05 to 12 (2014: 9 to 12) percent per annum.
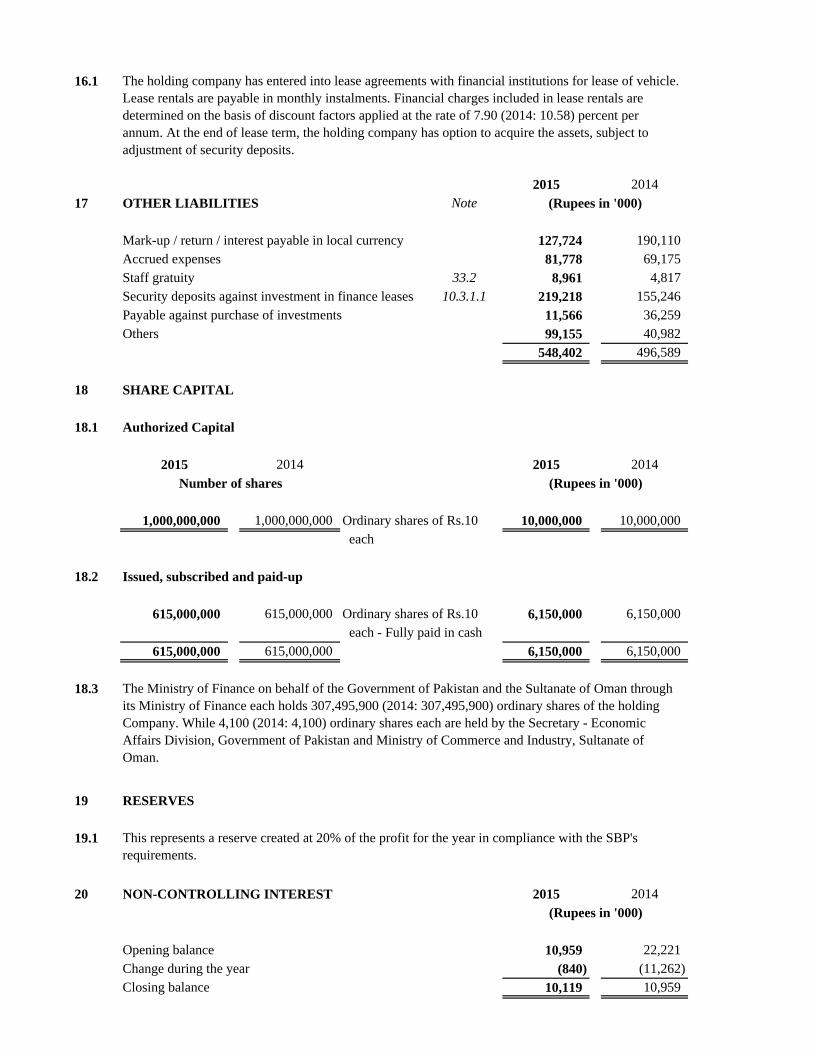
16.1
2015 2014
17 OTHER LIABILITIES Note
Mark-up / return / interest payable in local currency 127,724 190,110 Accrued expenses 81,778 69,175 Staff gratuity 33.2 8,961 4,817 Security deposits against investment in finance leases 10.3.1.1 219,218 155,246 Payable against purchase of investments 11,566 36,259 Others 99,155 40,982
548,402 496,589
18 SHARE CAPITAL
18.1 Authorized Capital
2015 2014 2015 2014
1,000,000,000 1,000,000,000 Ordinary shares of Rs.10 10,000,000 10,000,000 each
18.2 Issued, subscribed and paid-up
615,000,000 615,000,000 Ordinary shares of Rs.10 6,150,000 6,150,000 each - Fully paid in cash
615,000,000 615,000,000 6,150,000 6,150,000
18.3
19 RESERVES
19.1
20 NON-CONTROLLING INTEREST 2015 2014
Opening balance 10,959 22,221 Change during the year (840) (11,262) Closing balance 10,119 10,959
The holding company has entered into lease agreements with financial institutions for lease of vehicle. Lease rentals are payable in monthly instalments. Financial charges included in lease rentals are determined on the basis of discount factors applied at the rate of 7.90 (2014: 10.58) percent per annum. At the end of lease term, the holding company has option to acquire the assets, subject to adjustment of security deposits.
(Rupees in '000)
This represents a reserve created at 20% of the profit for the year in compliance with the SBP's requirements.
(Rupees in '000)
The Ministry of Finance on behalf of the Government of Pakistan and the Sultanate of Oman through its Ministry of Finance each holds 307,495,900 (2014: 307,495,900) ordinary shares of the holding Company. While 4,100 (2014: 4,100) ordinary shares each are held by the Secretary - Economic Affairs Division, Government of Pakistan and Ministry of Commerce and Industry, Sultanate of Oman.
(Rupees in '000)
Number of shares

21 SURPLUS ON REVALUATION OF ASSETS 2015 2014
- net of deferred tax Note
21.1 Surplus on revaluation of available-for-sale securities
Federal Government Securities- Pakistan Investment Bonds (PIBs) 556,031 491,538 - Ijara Sukuk 3,390 - -Treasury Bills (T-Bills) 5 -
559,426 491,538
Shares-listed 12,076 (13,036)
Term Finance Certificates- Listed (3,491) (30,734) - Unlisted 4,414 10,669
923 (20,065)
Sukuk-unlisted (2,931) 38
569,494 458,475
Deferred tax asset recognized 12 (174,611) (165,029)
394,883 293,446
Associate's share of deficit on revaluation of available-for-sale securities 76 (647)
394,959 292,799
22 CONTINGENCIES AND COMMITMENTS
Transaction related contingent liability:
Guarantees - 10,000
Pledge of shares on behalf of Japan Power Generation Limited 22.1 70,726 70,726
Pledge of shares on behalf of Orient Power Company (Pvt.) Limited 22.2 226,000 226,000
Commitments for:
- Purchase of government securities - 823,733 - Sale of government securities - 379,203
Purchase of shares under put option 10,385 -
Commitments for advances and net investment in finance leases 1,412,393 1,684,585
Commitments for operating fixed assets 5,000 -
22.1
22.2
22.3
Shares in Japan Power Generation Limited (JPGL) (an associate) aggregating 17,622,878 having a cost of Rs. 70.726 million(2014: Rs. 70.726 million) are pledged as security on behalf of that associate company against a syndicate finance facility obtained by it (the associate company).
(Rupees in '000)
Investment in unlisted shares in Orient Power Company (Private) Limited (related party) aggregating 22,600,000 having a cost of Rs. 226 million are pledged as security against a syndicate finance facility obtained by Orient Power Company (Private) Limited.
In the year 2013, BOP had filed a suit against POAMCL before the Honourable High Court of Sindh claiming damages of Rs. 100.4 million in respect of the alleged losses suffered by BOP due to non-honouring of its redemption requests by the POAMCL in year 2009 allegedly violating the NBFC regulations and provisions of the trust deed.
In year 2007, the Pak Oman Asset Management Company Limited (POAMCL) had launched POBOP Advantage Plus Fund (the Fund) under the capital subscription and fee sharing agreement with The Bank of Punjab (BOP). BOP had subscribed five million core units and ten million non-core units of the aggregate face value of Rs. 250 million and 500 million respectively. During year 2011 the management rights of the Fund were transferred to another asset management company.

23 MARK-UP / RETURN / INTEREST EARNED 2015 2014
On loans and advances to Customers 866,754 808,872 Financial institutions 152,530 93,671
1,019,284 902,543
On investments inAvailable-for-sale securities 831,580 832,904 Held-for-trading securities 241,015 254,099
1,072,595 1,087,003
On securities purchased under resale agreements 126,943 94,033 On deposit with financial institutions 23,779 16,450 On placements 520 17,848 On certificate of investments 9,196 309
2,252,317 2,118,186
24 MARK-UP / RETURN / INTEREST EXPENSED
On secured borrowings Securities sold under repurchase agreements 584,450 558,258 Long-term borrowings 138,861 149,582 Short-term borrowings 5,150 3,989
728,461 711,829
On unsecured borrowings and depositsPlacements 106,164 165,015 Murabaha borrowing 54,354 - Certificate of investments 467,317 483,908
627,835 648,923
1,356,296 1,360,752
25 GAIN ON SALE OF SECURITIES
Federal Government Securities- Market Treasury Bills (MTBs) 47,142 5,656 - Pakistan Investment Bonds (PIBs) 392,432 138,029
439,574 143,685 Term Finance Certificates and sukuk certificates (16,329) 2,730 Mutual funds - 11,759 Shares / units- Listed 183,445 96,778 - Unlisted - 9,102
183,445 105,880
606,690 264,054
26 OTHER INCOME
Net gain on sale of property and equipment - 2,469 Others 733 -
733 2,469
The legal advisor of POAMCL has opined that the suit is based on factual inconsistencies and the POAMCL has sound defense on legal grounds. In the previous year, POAMCL had also lodged a counter claim of Rs. 250 million against BOP for damaging the image and reputation of the POAMCL.
(Rupees in '000)
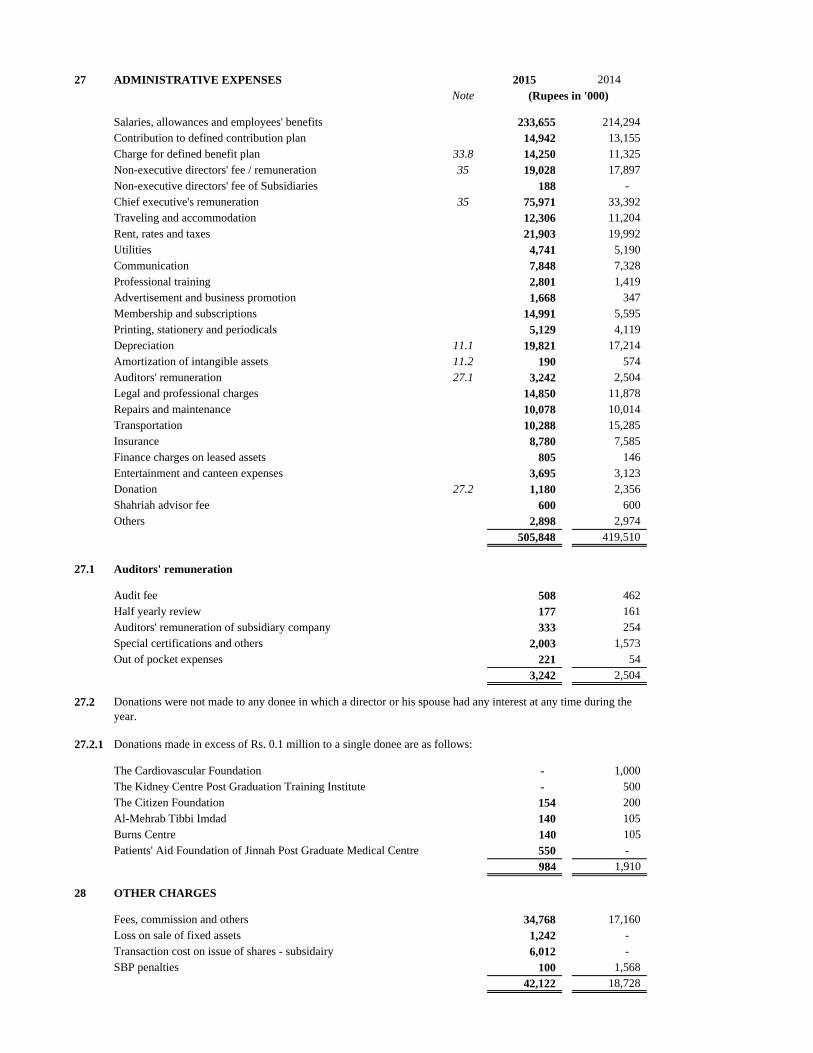
27 ADMINISTRATIVE EXPENSES 2015 2014Note
Salaries, allowances and employees' benefits 233,655 214,294 Contribution to defined contribution plan 14,942 13,155 Charge for defined benefit plan 33.8 14,250 11,325 Non-executive directors' fee / remuneration 35 19,028 17,897 Non-executive directors' fee of Subsidiaries 188 - Chief executive's remuneration 35 75,971 33,392 Traveling and accommodation 12,306 11,204 Rent, rates and taxes 21,903 19,992 Utilities 4,741 5,190 Communication 7,848 7,328 Professional training 2,801 1,419 Advertisement and business promotion 1,668 347 Membership and subscriptions 14,991 5,595 Printing, stationery and periodicals 5,129 4,119 Depreciation 11.1 19,821 17,214 Amortization of intangible assets 11.2 190 574 Auditors' remuneration 27.1 3,242 2,504 Legal and professional charges 14,850 11,878 Repairs and maintenance 10,078 10,014 Transportation 10,288 15,285 Insurance 8,780 7,585 Finance charges on leased assets 805 146 Entertainment and canteen expenses 3,695 3,123 Donation 27.2 1,180 2,356 Shahriah advisor fee 600 600 Others 2,898 2,974
505,848 419,510
27.1 Auditors' remuneration
Audit fee 508 462 Half yearly review 177 161 Auditors' remuneration of subsidiary company 333 254 Special certifications and others 2,003 1,573 Out of pocket expenses 221 54
3,242 2,504
27.2
27.2.1 Donations made in excess of Rs. 0.1 million to a single donee are as follows:
The Cardiovascular Foundation - 1,000 The Kidney Centre Post Graduation Training Institute - 500 The Citizen Foundation 154 200 Al-Mehrab Tibbi Imdad 140 105 Burns Centre 140 105 Patients' Aid Foundation of Jinnah Post Graduate Medical Centre 550 -
984 1,910
28 OTHER CHARGES
Fees, commission and others 34,768 17,160 Loss on sale of fixed assets 1,242 - Transaction cost on issue of shares - subsidairy 6,012 - SBP penalties 100 1,568
42,122 18,728
(Rupees in '000)
Donations were not made to any donee in which a director or his spouse had any interest at any time during the year.

29 TAXATION 2015 2014Note
For the year- Current 358,482 216,197 - Prior 23,716 388 - Deferred 12.1 (14,995) (50,121)
367,203 166,464
29.1 Relationship between tax expense and accounting profit
Profit before taxation 907,471 542,692
Tax at the applicable rate of 32% (2014: 33%) 290,391 179,088 Tax effect due to change in tax rate 62,559 - Tax effect of income taxed at different rate (18,169) (19,256) Tax effect of capital loss / (gain) on listed shares and mutual funds (20,229) (11,808) Tax effect of provision for diminution in the value of listed shares and mutual funds 13,470 14,310 Prior 23,718 - Net tax effect of income not subject to tax and expenses that are not allowable in determining taxable income tax charge 15,463 4,130
367,203 166,464
29.1.1
29.2 Tax contingencies
Pak Oman Investment Company Limited
Pak Oman Asset Management Company Limited
29.3 Taxation - prior
30 EARNINGS PER SHARE 2015 2014
Profit attributable to shareholders of the holding company Rupees in '000 541,108 387,490
Weighted average number of ordinary shares in issue Numbers in '000 615,000 615,000
Basic earnings per share Rupees 0.88 0.63
Diluted earnings per share Rupees 0.88 0.63
30.1 There were no convertible dilutive potential ordinary shares outstanding on 31 December 2014 and 2015.
Finance Act, 2015 imposed super tax at 3% on the taxable income for the tax year 2015 for rehabilitation of temporarily displaced persons.
Rupees in '000
The Income tax Department has amended the deemed assessment orders of the holding company for the tax years 2004, 2009, 2010, 2011 ,2012 and 2013, wherein major issues raised by the authorities were related to applicability of Workers Welfare Fund (WWF), disallowance of allocation of common expenses and disallowance of losses claimed on early termination of leased assets. The holding company's appeals are pending at various appellate forums. Management estimates that sufficient provisions have been made and no further provision is required.
POAMCL has not recognised deferred tax asset due to uncertainty with regards to availability of future taxable profits against which deferred tax asset would be utilised. As on 31 December 2015, the total unrecognised deferred tax asset is amounting to Rs. 63.485 million (31 December 2014: Rs. 76.770 million) mainly arising on account of accumulated tax losses and deductible temporary differences.
The POAMCL has been selected for audit under section 214-C of the Ordinance for the tax year 2012. Tax authorities have passed orders under section 122(1) of the ordinance making certain amendments to loss declared in the return filed by the POAMCL. Further Taxation Officer has charged capital gain tax amounting to Rs. 1.514 million at 10%. As a result total tax payable for tax year 2012 increased by Rs. 1.05 million. Tax officer has also disallowed the total tax credit in respect of advance tax paid / collected during the tax year 2012 except for the tax collected under section 153 of the Ordinance amounted to Rs. 2.092 million. The POAMCL has filed an appeal before the Commissioner Inland Revenue (Appeals) against the orders passed by the tax officer, hearing of which is still pending. However, based on opinion of the tax advisor, management is confident that the matter would be decided in favor of the POAMCL.
The tax charge for the current year represents minimum tax at the rate of 1% on gross income under section 113, tax on dividend under section 5 and the capital gain tax under the section 37A of the Income Tax Ordinance, 2001 (the Ordinance). The income tax assessments of the POAMCL have been finalised up to tax year 2015 (income year ended 30 June 2015).

31 CASH AND CASH EQUIVALENTS 2015 2014Note
Cash and balances with treasury banks 6 93,746 99,935 Balances with other banks 7 1,736,674 269,621 Placements 8 - 25,000
1,830,420 394,556
32 STAFF STRENGTH 2015 2014
Permanent 77 75 Temporary / contractual 4 7
Group's own staff strength at end of the year 81 82 Outsource 30 29 Total staff strength 111 111
33 DEFINED BENEFIT PLAN
General Description
33.1
Principal actuarial assumptions
2015 2014
Discount rate 10.00 11.25Expected rate of increase in salary levels 10.00 11.25Expected rate of return on plan assets 10.00 11.25
Mortality rates assumed were based on the SLIC 2001-2005 mortality table.
33.2 Reconciliation of amount payable to defined benefit plan 2015 2014Note
Present value of defined benefit obligation 33.3 111,643 93,349 Fair value of plan assets 33.5 (102,682) (88,532)
33.4 8,961 4,817
33.3 Movement in the defined benefit obligation over the year is as follows:
Present value of obligation as at January 1 93,349 68,821 Current service cost 14,690 11,729 Interest cost 9,730 8,842 Benefits paid (13,721) (1,608) Actuarial loss on remeasurment of obligation 7,595 5,565 Present value of obligation as at 31 December 111,643 93,349
The expected return on plan assets is based on the market expectations and depends upon the asset portfolio of the holding company, at the beginning of the period, for returns over the entire life of the related obligation.
(Rupees in '000)
(Percent per annum)
(Rupees in '000)
(Number )
General description of the holding company's defined benefit plan and accounting policy for recognising actuarial gains and losses is disclosed in note 5.13.1 to the consolidated financial statements.
The latest actuarial valuation for defined benefit plan scheme was carried out as at 31 December 2015 using the Projected Unit Credit method (PUCM). The following significant assumptions were used for the actuarial valuation:

33.4 Movement in payable to defined benefit plan: 2015 2014Note
Opening liability 4,817 4,876 Expense for the year 33.8 14,250 11,325 Other Comprehensive Income 7,343 4,583 Contributions to the fund (17,449) (15,967) Closing liability 8,961 4,817
33.5 Movement in the fair value of plan assets is as follows:
Fair value of plan assets as at 1 January 88,532 63,945 Expected return on plan assets 10,170 9,246 Contributions 17,449 15,967 Benefits paid (13,721) (1,608) Actuarial gain on remeasurement of plan assets 252 982 Fair value of plan assets as at 31 December 33.7 102,682 88,532
33.6 Actual return on plan assets during the year was Rs. 10.422 million (2014: Rs. 10.228 million).
33.7 The plan assets are comprised as follows: 2015 2014
Note Rating Rating (Rupees % (Rupees %in '000) in '000)
Market Treasury Bills - Unrated - - 3,030 3.42 Pakistan Investment Bonds Unrated Unrated 39,086 38.07 37,827 42.73 Special Saving Certificates (SSCs) Unrated Unrated 60,239 58.67 46,547 52.58 Term Finance Certificates- WorldCall Telecom Limited D D 747 0.73 885 1.00 Certificate of Investments 33.7.1 Unrated Unrated 2,223 2.16 - - Bank balance Unrated Unrated 387 0.37 243 0.27
102,682 100.00 88,532 100.00
33.8 The amount recognised in the profit and loss account is as follows: 2015 2014Note
Current service cost 14,690 11,729 Net Interest (440) (404) Expected return on plan assets - - Actuarial loss recognised - -
14,250 11,325
33.9 Actuarial (losses) / gains
Net unrecognised actuarial (losses) / gains as at 1 January - - Actuarial loss on remeasurement of obligation 33.9.1 (7,595) (5,565) Actuarial gain on remeasurement of plan assets 33.9.1 252 982
(7,343) (4,583) Actuarial loss recognised in: - Other comprehensive income 7,343 4,583 - Profit and loss account - - Net unrecognised actuarial (losses) / gains as at 31 December - -
(Rupees in '000)
2014
(Rupees in '000)
2015
33.7.1 These include Certificate of Investment held with the holding company. These carry mark-up at rates ranging from 6.35 to 6.50 (2014: NIL) percent per annum.

33.9.1 Actuarial loss / (gains) on remeasurement of obligation / plan assets comprise of:
2015 2014 2015 2014
Demographic assumptions - (156) - - Financial loss 4,748 - (2,278) (3,176) Experience adjustment 2,847 5,721 2,026 2,194
7,595 5,565 (252) (982)
33.10 Sensitivity analysis
%
Discount rate 1 (10,801) 12,647 Salary growth rate 1 13,087 (11,353)
33.11 Maturity profile of defined benefit obligation
Benefit payments 2015 2014Distribution of timing of benefit payments
Years1 4,745 10,982 2 4,588 4,101 3 4,394 17,280 4 16,977 3,550 5 17,909 3,489 6 to 10 26,410 37,034 11 and above 357,832 369,037
33.12 The expected gratuity expense for the next year ending 31 December 2016 works out to Rs. 16.809 million.
33.13 The average duration of the benefit obligation at 31 December 2015 is 10.50 years (2014: 12.86 years).
34 DEFINED CONTRIBUTION PLAN
34.1 The Group also operates a provident fund scheme for all its permanent employees. 2015 2014
34.2 Contribution to the fund made during the year by the holding company
Contribution from the holding company 14,375 12,216 Contribution from the employees of holding company 14,375 12,216
28,750 24,432
34.3 Contribution to the fund made during the year by the subsidiary company
Contribution from the subsidiary company 567 939 Contribution from the employees of subsidiary company 567 939
1,134 1,878
Change in assumption
(Rupees in '000)
Increase in assumption
(Rupees in '000)
Decrease in assumption
(Rupees in '000)
(Rupees in '000)
Impact on defined benefit obligation
Plan assets Obligation(Rupees in '000)
Actuarial loss / (gain) on remeasurement of
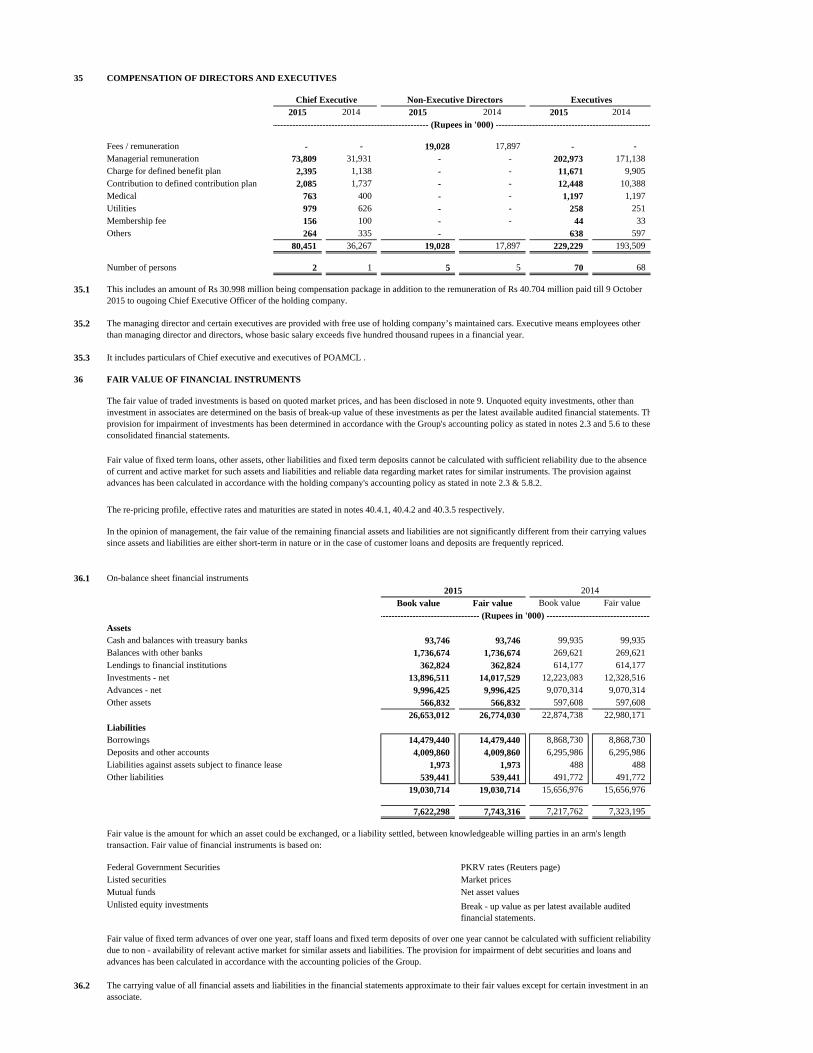
35 COMPENSATION OF DIRECTORS AND EXECUTIVES
2015 2014 2015 2014 2015 2014
Fees / remuneration - - 19,028 17,897 - - Managerial remuneration 73,809 31,931 - - 202,973 171,138 Charge for defined benefit plan 2,395 1,138 - - 11,671 9,905 Contribution to defined contribution plan 2,085 1,737 - - 12,448 10,388 Medical 763 400 - - 1,197 1,197 Utilities 979 626 - - 258 251 Membership fee 156 100 - - 44 33 Others 264 335 - 638 597
80,451 36,267 19,028 17,897 229,229 193,509
Number of persons 2 1 5 5 70 68
35.1
35.2
35.3 It includes particulars of Chief executive and executives of POAMCL .
36 FAIR VALUE OF FINANCIAL INSTRUMENTS
36.1 On-balance sheet financial instruments
Book value Fair value Book value Fair value
Assets Cash and balances with treasury banks 93,746 93,746 99,935 99,935 Balances with other banks 1,736,674 1,736,674 269,621 269,621 Lendings to financial institutions 362,824 362,824 614,177 614,177 Investments - net 13,896,511 14,017,529 12,223,083 12,328,516 Advances - net 9,996,425 9,996,425 9,070,314 9,070,314 Other assets 566,832 566,832 597,608 597,608
26,653,012 26,774,030 22,874,738 22,980,171
Liabilities Borrowings 14,479,440 14,479,440 8,868,730 8,868,730 Deposits and other accounts 4,009,860 4,009,860 6,295,986 6,295,986 Liabilities against assets subject to finance lease 1,973 1,973 488 488 Other liabilities 539,441 539,441 491,772 491,772
19,030,714 19,030,714 15,656,976 15,656,976
7,622,298 7,743,316 7,217,762 7,323,195
Federal Government Securities PKRV rates (Reuters page)Listed securities Market pricesMutual funds Net asset valuesUnlisted equity investments
36.2
Fair value of fixed term advances of over one year, staff loans and fixed term deposits of over one year cannot be calculated with sufficient reliability due to non - availability of relevant active market for similar assets and liabilities. The provision for impairment of debt securities and loans and advances has been calculated in accordance with the accounting policies of the Group.
The carrying value of all financial assets and liabilities in the financial statements approximate to their fair values except for certain investment in an associate.
2015
The fair value of traded investments is based on quoted market prices, and has been disclosed in note 9. Unquoted equity investments, other than investment in associates are determined on the basis of break-up value of these investments as per the latest available audited financial statements. Thprovision for impairment of investments has been determined in accordance with the Group's accounting policy as stated in notes 2.3 and 5.6 to these consolidated financial statements.
--------------------------------- (Rupees in '000) -----------------------------------
The re-pricing profile, effective rates and maturities are stated in notes 40.4.1, 40.4.2 and 40.3.5 respectively.
2014
Fair value of fixed term loans, other assets, other liabilities and fixed term deposits cannot be calculated with sufficient reliability due to the absence of current and active market for such assets and liabilities and reliable data regarding market rates for similar instruments. The provision against advances has been calculated in accordance with the holding company's accounting policy as stated in note 2.3 & 5.8.2.
In the opinion of management, the fair value of the remaining financial assets and liabilities are not significantly different from their carrying values since assets and liabilities are either short-term in nature or in the case of customer loans and deposits are frequently repriced.
The managing director and certain executives are provided with free use of holding company’s maintained cars. Executive means employees other than managing director and directors, whose basic salary exceeds five hundred thousand rupees in a financial year.
Chief Executive Non-Executive Directors Executives
Break - up value as per latest available audited financial statements.
Fair value is the amount for which an asset could be exchanged, or a liability settled, between knowledgeable willing parties in an arm's length transaction. Fair value of financial instruments is based on:
---------------------------------------------------- (Rupees in '000) ---------------------------------------------------
This includes an amount of Rs 30.998 million being compensation package in addition to the remuneration of Rs 40.704 million paid till 9 October 2015 to ougoing Chief Executive Officer of the holding company.

36.3 The table below analyses financial instruments measured at the end of the reporting period by the level in the fair value hierarchy into which the fair value measurement is categorised:
On balance sheet financial instruments
Note HFT Available for HTM Loans and Other financial Other financial Total Level 1 Level 2 Level 3 Total
sale receivables assets liabilities
Financial assets measured at fair value
- Investments
Government Securities 888,567 8,703,572 - - - - 9,592,139 - 9,592,139 - 9,592,139
Listed Term Finance Certificates 25,600 740,573 - - - - 766,173 - 766,173 - 766,173
Unlisted Term Finance Certificates 9,974 847,675 - - - - 857,649 - 857,649 - 857,649
Sukuk Certificates - 789,807 789,807 - 789,807 - 789,807
Listed shares 102,525 621,716 - - - - 724,241 724,241 - - 724,241
- Associates
Listed shares - - - - - - - 121,018 - 121,018
Mutual funds - - - - 564,550 - 564,550 564,550 - - 564,550
- -
Financial assets not measured at fair value
- Cash and bank balances with treasury banks 36.3.1 - - - 93,746 - - 93,746 - - - -
- Balances with other banks 36.3.1 - - - 1,736,674 - - 1,736,674 - - - -
- Lending to financial instruments 36.3.1 - - - 362,824 - - 362,824 - - - -
- Unlisted shares 36.3.1 - 242,907 - - - - 242,907 - - - -
- Associates - unlisted shares 36.3.1 - - - - 359,045 - 359,045 - - - -
- Advances 36.3.1 - - - 9,996,425 - - 9,996,425 - - - -
- Other assets 36.3.1 - - - - 566,832 - 566,832 - - - -
1,026,666 11,946,250 - 12,189,669 1,490,427 - 26,653,012 1,409,809 12,005,768 - 13,415,577
Financial liabilities not measured at fair value
- Borrowings from financial institutions 36.3.1 - - - - - 14,479,440 14,479,440 - - - -
- Deposits and other accounts 36.3.1 - - - - - 4,009,860 4,009,860 - - - -
- Liabilities against assets subject to finance lease 36.3.1 - - - - - 1,973 1,973 - - - -
- Other liabilities 36.3.1 - - - - - 539,441 539,441 - - - -
- - - - - 19,030,714 19,030,714 - - - -
1,026,666 11,946,250 - 12,189,669 1,490,427 (19,030,714) 7,622,298 1,409,809 12,005,768 - 13,415,577
31 December 2015
Fair value
-------------------------------------------------------------------------------------------------- (Rupees in '000) ----------------------------------------------------------------------------------------------

The table below analyses financial instruments measured at the end of the reporting period by the level in the fair value hierarchy into which the fair value measurement is categorised:
On balance sheet financial instruments
Note HFT Available for HTM Loans and Other financial Other financial Total Level 1 Level 2 Level 3 Total
sale receivables assets liabilities
Financial assets measured at fair value
- Investments
Government Securities 658,781 7,113,460 - - - - 7,772,241 - 7,772,241 - 7,772,241
Listed Term Finance Certificates - 977,915 - - - - 977,915 - 977,915 - 977,915
Unlisted Term Finance Certificates - 610,405 - - 610,405 - 610,405 - 610,405
Sukuk Certificates 984,196 - - - - 984,196 - 984,196 - 984,196
Listed shares 55,122 512,912 - - - - 568,034 568,034 - - 568,034
- Associates
Listed shares - - - - - - - 105,433 - - 105,433
Mutual funds - - - - 691,540 - 691,540 691,540 - - 691,540
Financial assets not measured at fair value - -
- Cash and bank balances with treasury banks 36.3.1 - 99,935 - 99,935 - - - -
- Balances with other banks 36.3.1 - 269,621 - 269,621 - - - -
- Lending to financial instruments 36.3.1 - 614,177 - 614,177 - - - -
- Unlisted shares 36.3.1 - 258,765 - 258,765 - - - -
- Associates - unlisted shares 36.3.1 - 359,987 - 359,987 - - - -
- Advances 36.3.1 - 9,070,314 - 9,070,314 - - - -
- Other assets 36.3.1 - 597,608 - 597,608 - - - -
713,903 10,457,653 - 10,054,047 1,649,135 - 22,874,738 1,365,007 10,344,757 - 11,709,764
Financial liabilities not measured at fair value
- Borrowings from financial institutions 36.3.1 - - - - - 8,868,730 8,868,730 - - - -
- Deposits and other accounts 36.3.1 - - - - - 6,295,986 6,295,986 - - - -
- Liabilities against assets subject to finance lease 36.3.1 - - - - - 488 488 - - - -
- Other liabilities 36.3.1 - - - - - 491,772 491,772 - - - -
- - - - - 15,656,976 15,656,976 - - - -
713,903 10,457,653 - 10,054,047 1,649,135 (15,656,976) 7,217,762 1,365,007 10,344,757 - 11,709,764
The Group measures fair values using the following fair value hierarchy that reflects the significance of the inputs used in making the measurements:
Level 1: Fair value measurements using quoted prices (unadjusted) in active markets for identical assets or liabilities.
Level 2: Fair value measurements using inputs other than quoted prices included within Level 1 that are observable for the assets or liability, either directly (i.e. as prices) or indirectly (i.e. derived from prices).
Level 3: Fair value measurements using input for the asset or liability that are not based on observable market data (i.e. unobservable inputs).
36.3.1 The Group has not disclosed the fair values for these financial assets and liabilities, as these are for short term or reprice over short term. Therefore their carrying amounts are reasonable approximation of fair value.
31 December 2014
Fair value
------------------------------------------------------------------------------------------- (Rupees in '000) ------------------------------------------------------------------------------------

37 SEGMENT ANALYSIS WITH RESPECT TO BUSINESS ACTIVITIES
The segment analysis with respect to business activity is as follows:
Corporate Trading & Commercial Assetfinance sales banking management
2015
Total income 15,026 1,940,225 1,027,363 24,777
Total expenses 73,365 1,146,628 836,297 43,630
Net (loss) / income (58,339) 793,597 191,066 (18,853)
Segment assets (Gross) - 17,515,114 11,305,332 243,109 Segment non-performing advances - - 1,193,866 -
Investments provided for - 1,252,966 - - Segment provision required * - 997,273 914,462 - Segment liabilities - 11,528,129 7,501,414 10,132
Segment return on net assets (%) - 15.90% 6.61% -8.09%Segment return on assets (ROA) (%) - 4.80% 1.84% -7.75%Segment cost of funds (%) - 5.50% 5.64% -
2014
Total income 5,090 1,596,871 925,880 25,116
Total expenses 56,754 1,219,744 686,338 47,429
Net (loss) / income (51,664) 377,127 239,542 (22,313)
Segment assets (Gross) - 14,689,695 10,422,329 30,706 Segment non-performing advances - - 1,037,908 - Investments provided for - 1,373,287 - - Segment provision required* - 866,313 893,914 - Segment liabilities - 8,775,239 6,878,213 8,341
Segment return on net assets (%) - 7.47% 9.04% -99.77%Segment return on assets (ROA) (%) - 2.73% 2.51% -72.67%Segment cost of funds (%) - 6.72% 6.93% -
* The provision against each segment represents provision held in advances and investments.
---------------------------- (Rupees in '000) ------------------------------

38 RELATED PARTY TRANSACTIONS
38.1 Associates
Japan Power Generation Limited
Pak Oman Microfinance Bank LimitedPak Oman Advantage Fund
Pak Oman Advantage Islamic Income Fund
Pak Oman Islamic Asset Allocation Fund
Pak Oman Advantage Asset Allocation Fund
Pak Oman Government Securities Fund
38.2 Key management personnel
All heads of departments
Directors
38.3 Retirement benefit fund
Defined benefit plan
Defined contribution plan
38.4 Other related party
Orient Power Company (Private) Limited
The nature of the relationships and transactions with related parties, other than those which have been specifically disclosed elsewhere in the consolidated financial statements are as follows:
The Group has related party relationship with its associates, employee benefit plans, company having common directors and its key management personnel (including their associates). The details of investments in associates are stated in note 9 to these consolidated financial statements.
Contributions to the accounts in respect of staff retirement benefits are made in accordance with actuarial valuation / terms of the contribution plan. Remuneration of the key management personnel are in accordance with the terms of their employment. Advances are given to employees as per the Group's Policy. Transactions with other related parties are carried out on commercial terms and as per market rates.

38.5
As at Given Repaid As at As at Given Repaid As at
January during during December January during during December
1, 2015 the year the year 31, 2015 1, 2014 the year the year 31, 2014
InvestmentsAssociates 1,051,527 219,000 (346,932) 923,595 897,921 153,606 - 1,051,527 Other related parties 226,000 - - 226,000 226,000 - - 226,000
1,277,527 219,000 (346,932) 1,149,595 1,123,921 153,606 - 1,277,527
AdvancesAssociates 68,200 - - 68,200 68,200 - - 68,200 Key Management personnel 49,859 19,973 (20,607) 49,225 63,303 5,246 (18,690) 49,859 Other related parties 210,454 - (28,025) 182,429 235,078 - (24,624) 210,454
328,513 19,973 (48,632) 299,854 366,581 5,246 (43,314) 328,513
DepositsAssociates 732,747 592,926 (789,747) 535,926 575,747 1,530,568 (1,373,568) 732,747 Key Management personnel 4,988 19,198 (22,037) 2,149 11,311 39,469 (45,792) 4,988 Retirement benefit fund - 36,555 (31,197) 5,358 10,018 5,898 (15,916) -
737,735 648,679 (842,981) 543,433 597,076 1,575,935 (1,435,276) 737,735
2015 2014
Dividend receivables from:Other related party - 22,600
Other payableGratuity fund 8,961 4,817
Management fee receivable from associates 4,618 3,936
Management fee received from associates 11,562 22,672
Mark-up incomeKey Management personnel 2,471 2,560 Other related parties 21,317 28,858
Dividend incomeAssociates 73,231 51,802 Other related parties 33,900 22,600
Mark-up expense on depositsAssociates 50,236 63,785 Key Management personnel 379 931 Retirement benefit fund 589 364
Expenses for the yearRemuneration to key management personnel 173,773 130,787 Non-executive director's fee / remuneration 19,028 17,897 Charge for defined contribution plan 14,942 13,155 Charge for defined benefit plan 14,250 11,325
Other comprehensive incomeRetirement benefit fund 7,343 4,583
Outright sale of Government SecuritiesAssociates 10,840 - Key Management personal - 4,037 Retirement benefit fund 439,787 145,316
Outright purchase of Government SecuritiesRetirement benefit fund 425,697 80,968
Capital gain on Government SecuritiesRetirement benefit fund 81 185
Capital gain on Mutual FundsAssociates 13,120 -
The volumes of related party transactions, outstanding balances at the year end, and related expense and income for the year are as follows:
2015 2014
-------------------------------------------------------------- (Rupees in '000) -----------------------------------------------------------
(Rupees in '000)
Nature of related party transaction

39 CAPITAL ADEQUACY
39.1 Capital management policies and procedures
The Group’s objectives when managing capital are:
- to comply with the capital requirements set by the regulators of the Group;
- to acquire, develop and maintain a strong capital base to support the development of its business.
The Group’s regulatory capital is divided into three tiers:
The Group calculates capital requirement as per Basel III regulatory framework, using the following approaches:
- Credit risk Standardized approach- Market risk Standardized approach- Operational risk Basic indicator approach
39.2 The Group's CAR as at 31 December 2015 was 36.56% of its risk weighted exposure.
The risk-weighted assets are measured by means of a hierarchy of five risk weights classified according to the nature of and reflecting an estimate of credit, market and other risks associated with each asset and counterparty, taking into account any eligible collateral or guarantees. A similar treatment is adopted for off-balance sheet exposure, with some adjustments to reflect the more contingent nature of the potential losses.
Tier 2 capital, which includes Subordinated debt/ Instruments, share premium of issuance of Subordinated debt/ Instruments, general provisions for loan losses (up to a maximum of 1.25 % of credit risk weighted assets), Net of tax reserves on revaluation of fixed assets and equity investments up to a maximum of 45 % of the balance and foreign exchange translation reserves after all regulatory adjustments applicable on Tier-2 (refer note 39.3).
SBP requires each development financial institution to: (a) hold the minimum level of the regulatory capital of Rs. 6 billion as at 31 December 2009 and in future periods till further notification issued by SBP, and (b) maintain a ratio of total regulatory capital to the risk-weighted asset as per the CAMELS Rating assigned to the institution or above the minimum prescribed level of 10%.
- to safeguard the Group’s ability to continue as a going concern so that it can continue to provide returns for shareholders and benefits for other stakeholders; and
The capital adequacy ratio of the DFI was subject to the Basel III capital adequacy guidelines stipulated by the State Bank ofPakistan through its circular BPRD Circular No. 06 of 2013 dated 15 August 2013. These instructions are effective from 31December 2013 in a phased manner with full implementation intended by 31 December 2019.
The calculation of capital adequacy enables the DFIs' to assess the long term soundness. The Group has successfully managed in the past and will in the future its Capital requirements/ needs. Based on the directives of the Board, the Group has built a healthy portfolio of assets and liabilities focusing on quality. CAR of 36.56% demonstrates that the Group is geared to absorb major risks / shocks in the present market scenario. The Group meets its capital needs through clean placements (LOP & COI) and short and long term lines from commercial institutions.
The table refer in note 39.3 summarizes the composition of regulatory capital and the ratios of the Group for the year ended 31 December 2015.
- Common Equity Tier 1 capital (CET1), which includes fully paid up capital (including the bonus shares), balance in share premium account, general reserves, statutory reserves as per the financial statements and net unappropriated profits after all regulatory adjustments applicable on CET1 (refer note 39.3)
Additional Tier 1 Capital (AT1), which includes perpetual non-cumulative preference shares and Share premium resulting from the issuance of preference shares balance in share premium account after all regulatory adjustments applicable on AT1 (refer note 39.3).
Capital adequacy and the use of regulatory capital are monitored frequently by the Group’s management, employing techniques based on the guidelines issued by State Bank of Pakistan (SBP).

39.3 Capital Adequacy Ratio (CAR) disclosure template: 2015 2014
Amount Amount Rows # Common Equity Tier 1 capital (CET1): Instruments and reserves
1 Fully Paid-up Capital/ Capital deposited with SBP 6,150,000 6,150,000 2 Balance in Share Premium Account3 Reserve for issue of Bonus Shares4 Discount on Issue of shares5 General/ Statutory Reserves 843,304 722,810 6 Gain/(Losses) on derivatives held as Cash Flow Hedge7 Unappropriated/unremitted profits/ (losses) 713,763 544,142 8 Minority Interests arising from CET1 capital instruments issued to third parties by consolidated bank
subsidiaries (amount allowed in CET1 capital of the consolidation group)6,384 10,093
9 CET 1 before Regulatory Adjustments 7,713,451 7,427,045 10 Total regulatory adjustments applied to CET1 (Note 39.3.1) 544,589 1,098,336 11 Common Equity Tier 1 7,168,862 6,328,709
Additional Tier 1 (AT 1) Capital12 Qualifying Additional Tier-1 capital instruments plus any related share premium13 of which: Classified as equity - 14 of which: Classified as liabilities - 15 Additional Tier-1 capital instruments issued to third parties by consolidated subsidiaries (amount allowed in
group AT 1)-
16 of which: instrument issued by subsidiaries subject to phase out - 17 AT1 before regulatory adjustments - 18 Total regulatory adjustment applied to AT1 capital (Note 39.3.2) 332,980 833,975 19 Additional Tier 1 capital after regulatory adjustments - 20 Additional Tier 1 capital recognized for capital adequacy -
21 Tier 1 Capital (CET1 + admissible AT1) (11+20) 7,168,862 6,328,709
Tier 2 Capital22 Qualifying Tier 2 capital instruments under Basel III plus any related share premium - 23 Tier 2 capital instruments subject to phase-out arrangement issued under pre-Basel 3 rules - 24 Tier 2 capital instruments issued to third parties by consolidated subsidiaries (amount allowed in group tier 2) -
25 of which: instruments issued by subsidiaries subject to phase out - 26 General provisions or general reserves for loan losses-up to maximum of 1.25% of Credit Risk Weighted
Assets-
27 Revaluation Reserves (net of taxes) - 28 of which: Revaluation reserves on fixed assets - 29 of which: Unrealized gains/losses on AFS 221,177 163,968 30 Foreign Exchange Translation Reserves - 31 Undisclosed/Other Reserves (if any) - 32 T2 before regulatory adjustments33 Total regulatory adjustment applied to T2 capital (Note 39.3.3) 277,079 530,728 34 Tier 2 capital (T2) after regulatory adjustments35 Tier 2 capital recognized for capital adequacy36 Portion of Additional Tier 1 capital recognized in Tier 2 capital37 Total Tier 2 capital admissible for capital adequacy - - 38 TOTAL CAPITAL (T1 + admissible T2) (21+37) 7,168,862 6,328,709
39 Total Risk Weighted Assets (RWA) {for details refer Note 39.6} 19,609,286 20,222,209
Capital Ratios and buffers (in percentage of risk weighted assets)40 CET1 to total RWA 36.56% 31.30%41 Tier-1 capital to total RWA 36.56% 31.30%42 Total capital to total RWA 36.56% 31.30%43 Bank specific buffer requirement (minimum CET1 requirement plus capital conservation buffer plus any other
buffer requirement)- -
44 of which: capital conservation buffer requirement - - 45 of which: countercyclical buffer requirement - - 46 of which: D-SIB or G-SIB buffer requirement - - 47 CET1 available to meet buffers (as a percentage of risk weighted assets) - -
National minimum capital requirements prescribed by SBP48 CET1 minimum ratio 6.0% 5.5%49 Tier 1 minimum ratio 7.5% 7.0%50 Total capital minimum ratio 10.25% 10.0%
(Rupees in '000)

Amount Amounts subject to Pre- Basel III
treatment*
Amount Amounts subject to Pre- Basel III
treatment*
Note 39.3.1 Common Equity Tier 1 capital: Regulatory adjustments1 Goodwill (net of related deferred tax liability)2 All other intangibles (net of any associated deferred tax liability) 115 305 3 Shortfall in provisions against classified assets - 4 Deferred tax assets that rely on future profitability excluding those arising from temporary differences (net of
related tax liability)5 Defined-benefit pension fund net assets 6 Reciprocal cross holdings in CET1 capital instruments of banking, financial and insurance entities7 Cash flow hedge reserve8 Investment in own shares/ CET1 instruments9 Securitization gain on sale
10 Capital shortfall of regulated subsidiaries 11 Deficit on account of revaluation from bank's holdings of fixed assets/ AFS - - 12 Investments in the capital instruments of banking, financial and insurance entities that are outside the scope of
regulatory consolidation, where the bank does not own more than 10% of the issued share capital (amount above 10% threshold)
- - 6,548 (32,742)
13 Significant investments in the common stocks of banking, financial and insurance entities that are outside the scope of regulatory consolidation (amount above 10% threshold)
- - 39,076 195,378
14 Deferred Tax Assets arising from temporary differences (amount above 10% threshold, net of related tax liability)
15 Amount exceeding 15% threshold 1,358,314 1,269,733 16 of which: significant investments in the common stocks of financial entities - 881,816 17 of which: deferred tax assets arising from temporary differences 1,358,314 387,917 18 National specific regulatory adjustments applied to CET1 capital19 Investments in TFCs of other banks exceeding the prescribed limit 211,494 212,556 218,432 218,432 20 Any other deduction specified by SBP (mention details) - 21 Adjustment to CET1 due to insufficient AT1 and Tier 2 to cover deductions 332,980 833,975 22 Total regulatory adjustments applied to CET1 (sum of 1 to 21) 544,589 1,098,336
Note 39.3.2 Additional Tier-1 & Tier-1 Capital: regulatory adjustments23 Investment in mutual funds exceeding the prescribed limit [SBP specific adjustment] - 24 Investment in own AT1 capital instruments - 25 Reciprocal cross holdings in Additional Tier 1 capital instruments of banking, financial and insurance entities - 26 Investments in the capital instruments of banking, financial and insurance entities that are outside the scope of
regulatory consolidation, where the bank does not own more than 10% of the issued share capital (amount above 10% threshold)
-
27 Significant investments in the capital instruments of banking, financial and insurance entities that are outside the scope of regulatory consolidation
-
28 Portion of deduction applied 50:50 to Tier-1 and Tier-2 capital based on pre-Basel III treatment which, during transitional period, remain subject to deduction from additional tier-1 capital
277,079 467,216
29 Adjustments to Additional Tier 1 due to insufficient Tier 2 to cover deductions 55,901 - 366,759 24,761 30 Total regulatory adjustment applied to AT1 capital (sum of 23 to 29) 332,980 833,975
Note 39.3.3 Tier 2 Capital: regulatory adjustments31 Portion of deduction applied 50:50 to Tier-1 and Tier-2 capital based on pre-Basel III treatment which, during
transitional period, remain subject to deduction from tier-2 capital277,079 467,216
32 Reciprocal cross holdings in Tier 2 instruments of banking, financial and insurance entities - 33 Investment in own Tier 2 capital instrument - 34 Investments in the capital instruments of banking, financial and insurance entities that are outside the scope of
regulatory consolidation, where the bank does not own more than 10% of the issued share capital (amount above 10% threshold)
- - 63,512 317,560
35 Significant investments in the capital instruments issued by banking, financial and insurance entities that are outside the scope of regulatory consolidation
-
36 Total regulatory adjustment applied to T2 capital (sum of 31 to 35) 277,079 530,728
2015 2014
Note 39.3.4 Additional Information Amount Amount Risk Weighted Assets subject to pre-Basel III treatment
37 Risk weighted assets in respect of deduction items (which during the transitional period will be risk weighted subject to Pre-Basel III Treatment)
- -
(i) of which: deferred tax assets - - (ii) of which: Defined-benefit pension fund net assets - - (iii) of which: Recognized portion of investment in capital of banking, financial and insurance entities where
holding is less than 10% of the issued common share capital of the entity - -
(iv) of which: Recognized portion of investment in capital of banking, financial and insurance entities where holding is more than 10% of the issued common share capital of the entity
- -
Amounts below the thresholds for deduction (before risk weighting) - - 38 Non-significant investments in the capital of other financial entities - - 39 Significant investments in the common stock of financial entities - - 40 Deferred tax assets arising from temporary differences (net of related tax liability) - -
Applicable caps on the inclusion of provisions in Tier 2 - - 41 Provisions eligible for inclusion in Tier 2 in respect of exposures subject to standardized approach (prior to
application of cap)- -
42 Cap on inclusion of provisions in Tier 2 under standardized approach - - 43 Provisions eligible for inclusion in Tier 2 in respect of exposures subject to internal ratings-based approach
(prior to application of cap)- -
44 Cap for inclusion of provisions in Tier 2 under internal ratings-based approach - -
2015 2014(Rupees in '000)
Regulatory Adjustments and Additional Information
(Rupees in '000)

39.4 Capital Structure ReconciliationTable: 39.4.1 Balance sheet of
the published financial
statements
Under regulatory scope of
consolidation
(in thousand PKR) As at period end As at period endAssets (1) (2) (3)Cash and balances with treasury banks 93,746 93,746 Balanced with other banks 1,736,674 1,736,674 Lending to financial institutions 362,824 362,824 Investments 13,896,511 13,896,511 Advances 9,996,425 9,996,425 Operating fixed assets 83,174 83,174 Deferred tax assets 330,528 330,528 Other assets 651,938 651,938 Total assets 27,151,820 27,151,820
Liabilities & EquityBills payable - - Borrowings 14,479,440 14,479,440 Deposits and other accounts 4,009,860 4,009,860 Sub-ordinated loans - - Liabilities against assets subject to finance lease 1,973 1,973 Deferred tax liabilities - - Other liabilities 548,402 548,402 Total liabilities 19,039,675 19,039,675
Share capital/ Head office capital account 6,150,000 6,150,000 Reserves 843,304 843,304 Unappropriated/ Unremitted profit/ (losses) 713,763 713,763 Minority Interest 10,119 10,119 Surplus on revaluation of assets 394,959 394,959 Total liabilities & equity 27,151,820 27,151,820
Table: 39.4.2 Balance sheet as in published
financial statements
Under regulatory scope of
consolidation
Reference
As at period end As at period endAssets (1) (2) (3) (4)Cash and balances with treasury banks 93,746 93,746 Balanced with other banks 1,736,674 1,736,674 Lending to financial institutions 362,824 362,824 Investments 13,896,511 13,896,511 of which: Non-significant investments in the capital instruments of banking, financial and insurance entities exceeding 10% threshold a of which: significant investments in the capital instruments issued by banking, financial and insurance entities exceeding regulatory threshold b
of which: Mutual Funds exceeding regulatory threshold c of which: reciprocal crossholding of capital instrument (separate for CET1, AT1, T2) d of which: others (mention details) eAdvances 9,996,425 9,996,425 shortfall in provisions/ excess of total EL amount over eligible provisions under IRB f general provisions reflected in Tier 2 capital gFixed Assets 83,174 83,174 Deferred Tax Assets 561,781 561,781 of which: DTAs that rely on future profitability excluding those arising from temporary differences h of which: DTAs arising from temporary differences exceeding regulatory threshold iOther assets 651,938 651,938 of which: Goodwill j of which: Intangibles k of which: Defined-benefit pension fund net assets lTotal assets 27,383,073 27,383,073
Liabilities & EquityBills payable - - Borrowings 14,479,440 14,479,440 Deposits and other accounts 4,009,860 4,009,860 Sub-ordinated loans - - of which: eligible for inclusion in AT1 m of which: eligible for inclusion in Tier 2 nLiabilities against assets subject to finance lease 1,973 1,973 Deferred tax liabilities 231,253 231,253 of which: DTLs related to goodwill o of which: DTLs related to intangible assets p of which: DTLs related to defined pension fund net assets q of which: other deferred tax liabilities rOther liabilities 548,402 548,402 Total liabilities 19,270,928 19,270,928
Share capital 6,150,000 6,150,000 of which: amount eligible for CET1 6,150,000 6,150,000 s of which: amount eligible for AT1 tReserves 843,304 843,304 of which: portion eligible for inclusion in CET1(provide breakup) 843,304 843,304 u of which: portion eligible for inclusion in Tier 2 vUnappropriated profit/ (losses) 713,763 713,763 wMinority Interest 10,119 10,119 of which: portion eligible for inclusion in CET1 - x of which: portion eligible for inclusion in AT1 y of which: portion eligible for inclusion in Tier 2 zSurplus on revaluation of assets 394,959 394,959 of which: Revaluation reserves on Fixed Assets of which: Unrealized Gains/Losses on AFS 394,959 394,959 In case of Deficit on revaluation (deduction from CET1) abTotal liabilities & Equity 27,383,073 27,383,073
aa

Table: 39.4.3 Component of regulatory
capital reported by bank
Source based on reference
number from step 2
Common Equity Tier 1 capital (CET1): Instruments and reserves1 Fully Paid-up Capital/ Capital deposited with SBP 6,150,000 2 Balance in Share Premium Account - 3 Reserve for issue of Bonus Shares - 4 General/ Statutory Reserves 843,304 5 Gain/(Losses) on derivatives held as Cash Flow Hedge - 6 Unappropriated/unremitted profits/ (losses) 713,763 (w)7 Minority Interests arising from CET1 capital instruments issued to third party by consolidated bank subsidiaries (amount allowed in CET1 capital of the
consolidation group)- (x)
8 CET 1 before Regulatory AdjustmentsCommon Equity Tier 1 capital: Regulatory adjustments
9 Goodwill (net of related deferred tax liability) - (j) - (o)10 All other intangibles (net of any associated deferred tax liability) 115 (k) - (p)11 Shortfall of provisions against classified assets - (f)12 Deferred tax assets that rely on future profitability excluding those arising from temporary differences (net of related tax liability) - {(h) - (r} * x%13 Defined-benefit pension fund net assets - {(l) - (q)} * x%14 Reciprocal cross holdings in CET1 capital instruments - (d)15 Cash flow hedge reserve - 16 Investment in own shares/ CET1 instruments - 17 Securitization gain on sale - 18 Capital shortfall of regulated subsidiaries - 19 Deficit on account of revaluation from bank's holdings of fixed assets/ AFS - (ab)20 Investments in the capital instruments of banking, financial and insurance entities that are outside the scope of regulatory consolidation, where the bank
does not own more than 10% of the issued share capital (amount above 10% threshold)- (a) - (ac) - (ae)
21 Significant investments in the capital instruments issued by banking, financial and insurance entities that are outside the scope of regulatory consolidation (amount above 10% threshold)
- (b) - (ad) - (af)
22 Deferred Tax Assets arising from temporary differences (amount above 10% threshold, net of related tax liability) - (i)23 Amount exceeding 15% threshold - 24 of which: significant investments in the common stocks of financial entities - 25 of which: deferred tax assets arising from temporary differences - 26 National specific regulatory adjustments applied to CET1 capital - 27 of which: Investment in TFCs of other banks exceeding the prescribed limit 211,494 28 of which: Any other deduction specified by SBP (mention details) - 29 Regulatory adjustment applied to CET1 due to insufficient AT1 and Tier 2 to cover deductions 332,980 30 Total regulatory adjustments applied to CET1 (sum of 9 to 29) 544,589 31 Common Equity Tier 1 7,162,478
Additional Tier 1 (AT 1) Capital32 Qualifying Additional Tier-1 instruments plus any related share premium - 33 of which: Classified as equity - (t)34 of which: Classified as liabilities - (m)35 Additional Tier-1 capital instruments issued by consolidated subsidiaries and held by third parties (amount allowed in group AT 1) - (y)36 of which: instrument issued by subsidiaries subject to phase out - 37 AT1 before regulatory adjustments -
Additional Tier 1 Capital: regulatory adjustments - 38 Investment in mutual funds exceeding the prescribed limit (SBP specific adjustment) - 39 Investment in own AT1 capital instruments - 40 Reciprocal cross holdings in Additional Tier 1 capital instruments - 41 Investments in the capital instruments of banking, financial and insurance entities that are outside the scope of regulatory consolidation, where the bank
does not own more than 10% of the issued share capital (amount above 10% threshold)- (ac)
42 Significant investments in the capital instruments issued by banking, financial and insurance entities that are outside the scope of regulatory consolidation
- (ad)
43 Portion of deduction applied 50:50 to core capital and supplementary capital based on pre-Basel III treatment which, during transitional period, remain subject to deduction from tier-1 capital
277,079
44 Regulatory adjustments applied to Additional Tier 1 due to insufficient Tier 2 to cover deductions 55,901 45 Total of Regulatory Adjustment applied to AT1 capital (sum of 38 to 44) 332,980 46 Additional Tier 1 capital 47 Additional Tier 1 capital recognized for capital adequacy -
48 Tier 1 Capital (CET1 + admissible AT1) (31+47) 7,162,478
Tier 2 Capital49 Qualifying Tier 2 capital instruments under Basel III plus any related share premium - 50 Capital instruments subject to phase out arrangement from tier 2 (Pre-Basel III instruments) - 51 Tier 2 capital instruments issued to third party by consolidated subsidiaries (amount allowed in group tier 2) - (z)52 of which: instruments issued by subsidiaries subject to phase out - 53 General Provisions or general reserves for loan losses-up to maximum of 1.25% of Credit Risk Weighted Assets - (g)54 Revaluation Reserves - 55 of which: Revaluation reserves on fixed assets - 56 of which: Unrealized Gains/Losses on AFS 221,177 57 Foreign Exchange Translation Reserves - (v)58 Undisclosed/Other Reserves (if any) - 59 T2 before regulatory adjustments -
Tier 2 Capital: regulatory adjustments60 Portion of deduction applied 50:50 to core capital and supplementary capital based on pre-Basel III treatment which, during transitional period, remain
subject to deduction from tier-2 capital-
61 Reciprocal cross holdings in Tier 2 instruments62 Investment in own Tier 2 capital instrument 63 Investments in the capital instruments of banking, financial and insurance entities that are outside the scope of regulatory consolidation, where the bank
does not own more than 10% of the issued share capital (amount above 10% threshold)- (ae)
64 Significant investments in the capital instruments issued by banking, financial and insurance entities that are outside the scope of regulatory consolidation
- (af)
65 Amount of Regulatory Adjustment applied to T2 capital (sum of 60 to 64) - 66 Tier 2 capital (T2)67 Tier 2 capital recognized for capital adequacy68 Excess Additional Tier 1 capital recognized in Tier 2 capital69 Total Tier 2 capital admissible for capital adequacy - 70 TOTAL CAPITAL (T1 + admissible T2) (48+69) 7,162,478
(n)
portion of (aa)
Basel III Disclosure Template (with added column)
(s)
(u)

39.5 Main Features Template of Regulatory Capital Instruments
1 Issuer
2 Unique identifier (eg KSE Symbol or Bloomberg identifier etc.) Not Applicable
3 Governing law(s) of the instrument SECP
Regulatory treatment
4 Transitional Basel III rules
5 Post-transitional Basel III rules
6 Eligible at solo/ group/ group & solo
7 Instrument type
8 Amount recognized in regulatory capital (Currency in PKR thousands, as of reporting date) 6,150,000
9 Par value of instrument PKR 10
10 Accounting classification Shareholder Equity
11 Original date of issuance 23-Jul-01
12 Perpetual or dated Perpetual
13 Original maturity date No maturity
14 Issuer call subject to prior supervisory approval No maturity
15 Optional call date, contingent call dates and redemption amount Not Applicable
16 Subsequent call dates, if applicable Not Applicable
Coupons / dividends
17 Fixed or floating dividend/ coupon Not Applicable
18 coupon rate and any related index/ benchmark Not Applicable
19 Existence of a dividend stopper No
20 Fully discretionary, partially discretionary or mandatory Fully discretionary
21 Existence of step up or other incentive to redeem No
22 Noncumulative or cumulative Not Applicable
23 Convertible or non-convertible Not Convertible
24 If convertible, conversion trigger (s) Not Applicable
25 If convertible, fully or partially Not Applicable
26 If convertible, conversion rate Not Applicable
27 If convertible, mandatory or optional conversion Not Applicable
28 If convertible, specify instrument type convertible into Not Applicable
29 If convertible, specify issuer of instrument it converts into Not Applicable
30 Write-down feature Not Applicable
31 If write-down, write-down trigger(s) Not Applicable
32 If write-down, full or partial Not Applicable
33 If write-down, permanent or temporary Not Applicable
34 If temporary write-down, description of write-up mechanism Not Applicable
35 Position in subordination hierarchy in liquidation (specify instrument type immediately senior to instrument
Not Applicable
36 Non-compliant transitioned features No
37 If yes, specify non-compliant features Not Applicable
Pak Oman Investment Company Limited
Common Equity Tier 1
Common Equity Tier 1
Group and stand alone
Common shares

39.6 Risk Weighted Assets
2015 2014 2015 2014Credit Risk
On-Balance sheet
Portfolios subject to standardized approach (Simple or Comprehensive)
Public Sector entities 3,595 6,154 35,949 61,541 Banks 142,049 33,267 1,420,489 332,674 Corporate 816,769 725,654 8,167,690 7,256,535 Retail 1,253 891 12,534 8,905 Residential Mortgages 3,944 3,902 39,436 39,015 Past Due loans 25,755 10,858 257,546 108,581 Operating Fixed Assets 8,306 6,940 83,059 69,400 Other assets 147,826 152,334 1,478,258 1,523,339
Off-Balance sheet
Non-market related 96,280 110,252 962,801 1,102,520
Equity Exposure Risk in the Banking Book 128,795 184,763 1,287,953 1,847,633
Total Credit Risk 1,374,572 1,235,015 13,745,715 12,350,143
Market Risk
Capital Requirement for portfolios subject to Standardized Approach
Interest rate risk 192,757 372,233 2,409,457 4,652,912 Equity position risk 115,879 109,621 1,448,488 1,370,263
Total Market Risk 308,636 481,854 3,857,945 6,023,175
Operational Risk
Capital Requirement for operational risks 160,450 147,911 2,005,626 1,848,891
TOTAL 1,843,658 1,864,780 19,609,286 20,222,209
Required Actual Required Actual
CET1 to total RWA 10.00% 36.56% 10.00% 31.30%Tier-1 capital to total RWA 10.00% 36.56% 10.00% 31.30%Total capital to total RWA 10.00% 36.56% 10.00% 31.30%Leverage Ratio 3.00% 24.83% 3.00% 23.83%
Capital Requirements Risk Weighted Assets
Capital Adequacy Ratios 2015 2014
The capital requirements for the banking group as per the major risk categories should be indicated in the manner given below:

40 RISK MANAGEMENT
Risk management organisation
40.1 Credit risk
Corporate Yes Yes xBanks Yes Yes xSovereigns x x xSME's x x xSecuritizations x x xOthers (Specify) x x x
Credit exposures subject to Standardised Approach
Rating Amount Deduction Net amount Amount Deduction Net amountCategory Outstanding CRM* Outstanding CRM*
Corporate 0 - - - - 289,177 289,177 1 876,589 362,824 1,239,413 200,000 - 200,000 2 3,754,116 (292,824) 3,461,292 3,537,525 (289,177) 3,248,348
3-4 - - - 286,250 - 286,250 5-6 92,723 - 92,723 - - -
Unrated 1,451,898 (70,000) 1,381,898 4,473,170 - 4,473,170
6,175,326 - 6,175,326 8,496,945 - 8,496,945
Banks 0 - - - - 100,000 100,000 1 2,116,951 - 2,116,951 294,621 (100,000) 194,621
2-3 1,794,198 - 1,794,198 587,500 - 587,500 4-5 100,000 100,000 - - -
Unrated - - - - - -
4,011,149 - 4,011,149 882,121 - 882,121 Sovereigns etc.Unrated*CRM= Credit Risk Mitigation
JCR-VIS OTHER (Specify)
The Group has set up objectives and policies to manage the risks that arise in connection with financial instruments. The risk management framework and policies of the Group are guided by specific objectives to ensure that comprehensive and adequate risk management policies are established to mitigate the salient risk elements in operations of the Group. The establishment of the overall financial risk management objectives is consistent and in tandem with the strategy to create and enhance shareholders' value, whilst guided by a prudent and robust framework of risk management policies. In achieving the objective of maximizing returns to shareholders, the board of directors takes cognizance of the risk elements that the Group is confronted with in its operations. In view ofthe multi-faceted risks inherent in the financial sector, the Group places great emphasis on the importance of risk management and has put in place clear and comprehensive risk management mechanisms and strategies to identify, monitor, manage and control the relevantrisk factors.
2014
Risk Management Department ensures that risks remain within the boundaries as defined by the board, comply with the risk parameters and prudential limits, establish systems and procedures and work out remedial measures.
Credit Committee implements credit risk policy and monitors credit risk in light with credit policy and Prudential Regulations.
A multi-tiered approach is being followed in the management of credit risk with the organizational structure, roles and responsibilities clearly outlined in the Credit Policy Manual. The Board is responsible for final approval of overall risk tolerance, limits for sectors and pricing strategies. Various business units responsible for undertaking risks are expected to comply with the credit policy and adhere to the independent risk management function. This is ensured through the implementation of a credit approval and documentation process adopted by the Group.
The Group's risk management, compliance and internal audit department support the risk management function. The compliance department ensures that all the directives and guidelines issued by SBP are being complied with. Internal audit department reviews the compliance of internal control procedures with internal and regulatory standards.
Exposures
Credit risk is the risk that one party to a financial instrument will fail to discharge an obligation and cause the other party to incur a financial loss. Exposure to credit risks for the Group arises primarily from lending activities and investments in fixed income securities.
The Group uses both external and internal ratings to evaluate risk. The Group obtains external ratings from PACRA and JCR-VIS whereas a comprehensive risk assessment matrix model is used for internal ratings.
2015
PACRAExposures
---------------------------------------------- (Rupees in '000) ----------------------------------------------------

40.2 Segmental information
40.2.1 Segment by class of business
(Rupees in '000)
% (Rupees in '000)
% (Rupees in '000)
%
Financial institution 1,627,161 14.91 985,926 24.59 - - Textile 1,763,625 16.16 - - 479,430 27.80 Transportation and communication 483,553 4.43 116,250 2.90 180,953 10.49 Power 1,219,465 11.18 - - 372,226 21.58 Electronics 82,344 0.75 - - - - Food and beverage 829,473 7.60 - - - - Services 677,287 6.21 145,000 3.62 - - Engineering and allied products 259,149 2.38 - - 50,000 2.90 Chemical and pharmaceuticals 165,820 1.52 - - 35,000 2.03 Automobiles 113,309 1.04 - - - - Fuel and energy 927,098 8.50 - - 308,000 17.86 Construction 467,162 4.28 - - - - Cement - - - - - - Sugar 1,146,652 10.51 - - 200,000 11.60 Paper and board /packaging 400,916 3.67 - - - - Healthcare 240,000 2.20 - - - - Individual 126,223 1.16 616,090 15.36 - - Others 381,650 3.50 2,146,594 53.53 98,895 5.74
10,910,887 100.00 4,009,860 100.00 1,724,504 100.00
(Rupees in '000)
% (Rupees in '000)
% (Rupees in '000)
%
Financial institution 1,272,661 12.77 2,888,748 45.88 1,202,936 37.66 Textile 1,628,350 16.34 - - 270,000 8.45 Transportation and communication 435,206 4.37 23,621 0.38 294,575 9.22 Power 1,153,159 11.57 125,000 1.99 686,116 21.48 Electronics 132,496 1.33 - - - - Food and beverage 1,265,143 12.70 - - 158,770 4.97 Services 392,395 3.94 140,000 2.22 89,111 2.79 Engineering and allied products 295,873 2.97 - - 13,614 0.43 Chemical and pharmaceuticals 267,289 2.68 - - 69,090 2.16 Automobiles 158,633 1.59 - - - - Fuel and energy 553,226 5.55 207,000 3.29 114,935 3.60 Construction 55,250 0.55 - - - - Cement 7,860 0.08 - - - - Sugar 1,589,375 15.95 - - - - Paper and board /packaging 214,322 2.15 - - 285,100 8.93 Healthcare 220,000 2.21 - - - - Individual 123,344 1.24 481,124 7.64 - - Others 199,646 2.00 2,430,493 38.60 10,000 0.31
9,964,228 100.00 6,295,986 100.00 3,194,247 100.00
The accounting policies and methods used by the Group are in accordance with the requirements of the prudential regulations of the SBP. These policies are disclosed in note 5 to these financial statements. Reconciliation in the provision against non-performing advances has been disclosed in note 10.5 of these consolidated financial statements.
Contingencies and commitments
2014
Contingencies and commitments
Deposits 2015
Advances (Gross)
Advances (Gross) Deposits

40.2.2 Segment by sector
(Rupees in '000)
% (Rupees in '000)
% (Rupees in '000)
%
Public / Government 391,299 3.59 640,000 15.96 - - Private 10,519,588 96.41 3,369,860 84.04 1,724,504 100.00
10,910,887 100.00 4,009,860 100.00 1,724,504 100.00
(Rupees in '000)
% (Rupees in '000)
% (Rupees in '000)
%
Public / Government 486,839 4.89 660,000 10.48 104,815 3.28 Private 9,477,389 95.11 5,635,986 89.52 3,089,432 96.72
9,964,228 100.00 6,295,986 100.00 3,194,247 100.00
40.2.3 Details of non-performing advances and specific provisions by class of business segment
Automobile 113,309 113,309 158,633 158,633 Cement - - 7,860 7,860 Textile 414,019 399,330 428,060 377,027 Chemical and pharmaceuticals 29,486 27,082 32,093 27,889 Construction 55,250 53,675 55,250 53,675 Engineering and allied products 68,073 68,073 74,073 74,073 Electronics 50,000 25,452 50,000 13,178 Fuel and energy 268,516 81,016 84,194 84,194
Food and beverages 16,434 15,934 16,434 15,934 Financial institution 5,161 5,161 5,161 5,161 Power 68,200 68,200 68,200 68,200 Services 12,437 3,109 - - Others 92,981 54,121 57,950 8,090
1,193,866 914,462 1,037,908 893,914
40.2.4 Details of non-performing advances and specific provisions by sector
Public / Government - - - - Private 1,193,866 914,462 1,037,908 893,914
1,193,866 914,462 1,037,908 893,914
40.2.5 Geographical segment analysis
Pakistan 907,471 27,149,424 8,112,145 1,724,504
Middle East - 2,396 - -
907,471 27,151,820 8,112,145 1,724,504
------------------------------ (Rupees in '000) ----------------------------
Specific provisions
held
Net assets employed
Total assets employed
Profit before taxation
Classified advances
Classified advances
------------------------------ (Rupees in '000) ----------------------------
Contingencies and
commitments
Advances (Gross) Deposits
------------------------------ (Rupees in '000) ----------------------------
Specific provisions held
Advances (Gross)
2015
Classified advances
2014
Specific provisions held
Specific provisions
held
Contingencies and commitments
Contingencies and commitments
Classified advances
2015
Deposits
20142015
2014

40.3 Market risk
40.3.1 Interest rate risk
Interest Rate Risk in Banking Book (Economic Approach)
S.No Time Bands Assets/Liabilities Duration Interest Rate Duration Interest Rate GAP (Middle of time band) Shock Weighting factor Shock (Stress)
1 Upto 1 Month (9,528,080) 0.05% 4,764 0.08% 7,622 2 1 to 3 Months 4,497,660 0.20% (8,995) 0.32% (14,393) 3 3 to 6 Months 3,244,241 0.45% (14,599) 0.72% (23,359) 4 6 to 12 Months 1,138,999 0.90% (10,251) 1.43% (16,288) 5 1 to 2 Years (228,219) 1.50% 3,423 2.77% 6,322 6 2 to 3 Years 2,017,576 2.50% (50,439) 4.49% (90,589) 7 3 to 4 Years 618,545 3.50% (21,649) 6.14% (37,979) 8 4 to 5 Years 547,389 4.50% (24,633) 7.71% (42,204) 9 5 to 7 Years 3,202,936 6.00% (192,176) 10.15% (325,098) 10 7 to 10 Years 25,293 8.50% (2,150) 13.26% (3,354) 11 Over 10 Years 23,029 12.50% (2,879) 17.84% (4,108)
5,559,369 (319,584) (543,428)
Interest Rate Risk in Banking Book (Earning Approach)
S.No Time Bands Assets/Liabilities Duration Interest Rate Duration Interest Rate GAP (Middle of time band) Shock Weighting factor Shock (Stress)
1 Upto 1 Month (9,528,080) 0.05% 4,764 0.08% 7,622 2 1 to 3 Months 4,497,660 0.20% (8,995) 0.32% (14,393) 3 3 to 6 Months 3,244,241 0.45% (14,599) 0.72% (23,359) 4 6 to 12 Months 1,138,999 0.90% (10,251) 1.43% (16,288) 5 1 to 2 Years (228,219) 1.50% 3,423 2.77% 6,322
(875,399) (25,658) (40,096)
40.3.2 Foreign currency risk
Assets Liabilities Off-balance sheet items Net foreign currency exposure
----------------------------------- (Rupees in '000) ------------------------------------
Pakistan Rupees 27,151,430 19,039,675 - 8,111,755 United States Dollar 71 - - 71 Omani Riyal 319 - - 319
27,151,820 19,039,675 - 8,112,145
40.3.3 Equity position risk
40.3.4 Liquidity risk
- A reasonable amount of liquid assets are maintained at all times.- Measurement and projection of funding requirements during various scenarios.- Excess funds are profitably deployed.
- Risk Management Department- Finance Department- Treasury Department - Asset Liability Committee (ALCO)
The ALCO will be responsible for monitoring of the tolerance limits.
Market risk is the risk that the value of on and off-balance sheet positions of a financial institution will be adversely affected by movements in market rates or prices such as interest rates, foreign exchange rates and equity prices. The board of directors is responsible for reviewing and recommending all market risk policies.
The market risk management framework of the Group comprises of business unit actually undertaking the risk, the Risk Management Department, Asset and Liability Committee and the Investment Committee.
Interest rate risk arises when there is a mismatch between positions, which are subject to interest rate adjustment within a specified period. The lending, funding and investment activities of the Group are exposed to interest rate risk. The Group is using a 16band reprising model for measurement of interest rate risk. Furthermore, stress testing, technique is also used to evaluate the potential effects on the financial condition of a specific event and movements in a set of financial variables. The Group has also developed value-at-risk (VAR) model internally.
Currency risk is the risk that the value of a financial instrument will fluctuate due to change in foreign currency rates. However, the Group is not exposed to major foreign currency risk as its assets and liabilities are primarily denominated in Pakistani rupees.
Equity position risk refers to the risk arising from taking long or short positions, in the trading book, in equities and all instruments that exhibit market behaviour similar to equities. The Group is exposed to such risk due to investment activities undertaken on a day-to-day basis. The Group has established a Capital Market Review Committee to monitor the equity portfolio and the future strategy pertaining thereto. As per Standardized Approach 8% charge has to be created on both Specific and General Equity Position Risk Management calculation.
Liquidity risk is the potential for loss arising from either inability to meet obligations or to fund increases in assets as they fall due without incurring unacceptable cost or losses.
Large off-balance sheet exposures or heavy reliance on large corporate deposits gives rise to relatively high level of liquidity risk. Rapid growth in assets also increases the liquidity risk. Objectives of liquidity management in the Group are that:
Beside the Board which will be responsible for formulation of over all policy, the following will be involved in Liquidity Risk Management Process with roles and responsibilities defined hereunder:
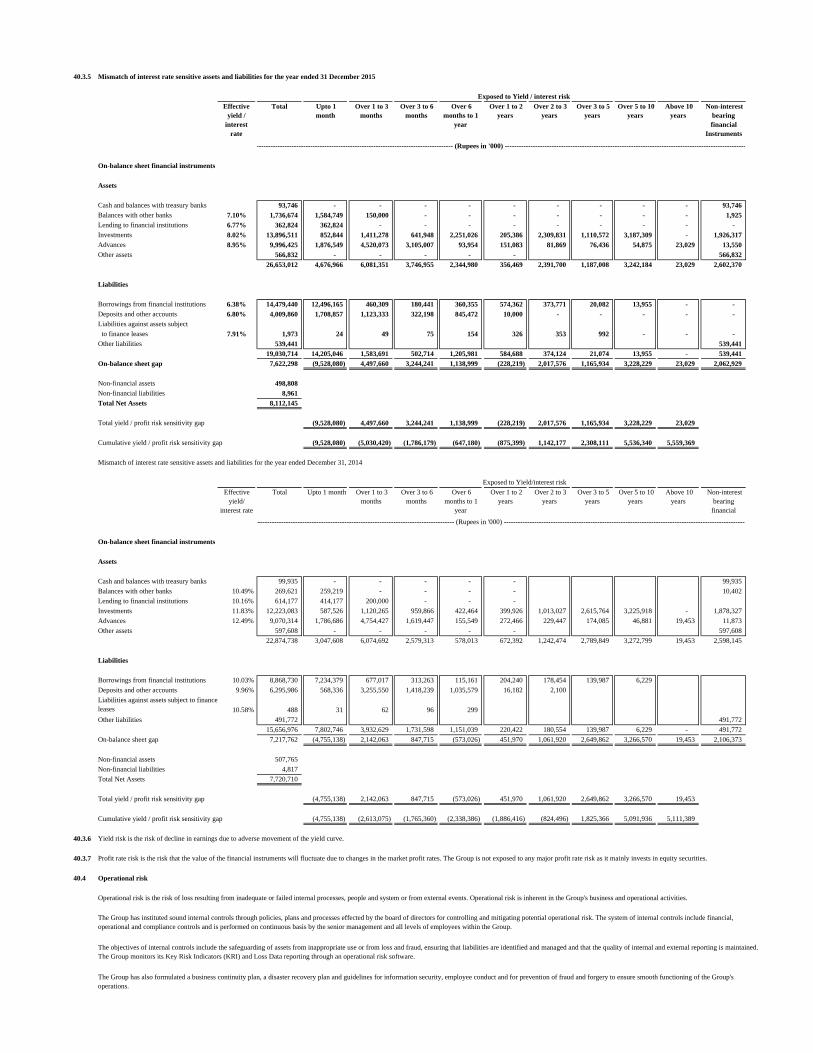
40.3.5 Mismatch of interest rate sensitive assets and liabilities for the year ended 31 December 2015
On-balance sheet financial instruments
Assets
Cash and balances with treasury banks 93,746 - - - - - - - - - 93,746
Balances with other banks 7.10% 1,736,674 1,584,749 150,000 - - - - - - - 1,925
Lending to financial institutions 6.77% 362,824 362,824 - - - - - - - - -
Investments 8.02% 13,896,511 852,844 1,411,278 641,948 2,251,026 205,386 2,309,831 1,110,572 3,187,309 - 1,926,317
Advances 8.95% 9,996,425 1,876,549 4,520,073 3,105,007 93,954 151,083 81,869 76,436 54,875 23,029 13,550
Other assets 566,832 - - - - - 566,832
26,653,012 4,676,966 6,081,351 3,746,955 2,344,980 356,469 2,391,700 1,187,008 3,242,184 23,029 2,602,370
Liabilities
Borrowings from financial institutions 6.38% 14,479,440 12,496,165 460,309 180,441 360,355 574,362 373,771 20,082 13,955 - -
Deposits and other accounts 6.80% 4,009,860 1,708,857 1,123,333 322,198 845,472 10,000 - - - - -
Liabilities against assets subject
to finance leases 7.91% 1,973 24 49 75 154 326 353 992 - - -
Other liabilities 539,441 539,441
19,030,714 14,205,046 1,583,691 502,714 1,205,981 584,688 374,124 21,074 13,955 - 539,441
On-balance sheet gap 7,622,298 (9,528,080) 4,497,660 3,244,241 1,138,999 (228,219) 2,017,576 1,165,934 3,228,229 23,029 2,062,929
Non-financial assets 498,808
Non-financial liabilities 8,961
Total Net Assets 8,112,145
Total yield / profit risk sensitivity gap (9,528,080) 4,497,660 3,244,241 1,138,999 (228,219) 2,017,576 1,165,934 3,228,229 23,029
Cumulative yield / profit risk sensitivity gap (9,528,080) (5,030,420) (1,786,179) (647,180) (875,399) 1,142,177 2,308,111 5,536,340 5,559,369
Mismatch of interest rate sensitive assets and liabilities for the year ended December 31, 2014
On-balance sheet financial instruments
Assets
Cash and balances with treasury banks 99,935 - - - - - 99,935
Balances with other banks 10.49% 269,621 259,219 - - - - 10,402
Lending to financial institutions 10.16% 614,177 414,177 200,000 - - -
Investments 11.83% 12,223,083 587,526 1,120,265 959,866 422,464 399,926 1,013,027 2,615,764 3,225,918 - 1,878,327
Advances 12.49% 9,070,314 1,786,686 4,754,427 1,619,447 155,549 272,466 229,447 174,085 46,881 19,453 11,873
Other assets 597,608 - - - - - 597,608
22,874,738 3,047,608 6,074,692 2,579,313 578,013 672,392 1,242,474 2,789,849 3,272,799 19,453 2,598,145
Liabilities
Borrowings from financial institutions 10.03% 8,868,730 7,234,379 677,017 313,263 115,161 204,240 178,454 139,987 6,229
Deposits and other accounts 9.96% 6,295,986 568,336 3,255,550 1,418,239 1,035,579 16,182 2,100
10.58% 488 31 62 96 299
Other liabilities 491,772 491,772
15,656,976 7,802,746 3,932,629 1,731,598 1,151,039 220,422 180,554 139,987 6,229 - 491,772
On-balance sheet gap 7,217,762 (4,755,138) 2,142,063 847,715 (573,026) 451,970 1,061,920 2,649,862 3,266,570 19,453 2,106,373
Non-financial assets 507,765
Non-financial liabilities 4,817
Total Net Assets 7,720,710
Total yield / profit risk sensitivity gap (4,755,138) 2,142,063 847,715 (573,026) 451,970 1,061,920 2,649,862 3,266,570 19,453
Cumulative yield / profit risk sensitivity gap (4,755,138) (2,613,075) (1,765,360) (2,338,386) (1,886,416) (824,496) 1,825,366 5,091,936 5,111,389
40.3.6 Yield risk is the risk of decline in earnings due to adverse movement of the yield curve.
40.3.7
40.4 Operational risk
The Group has also formulated a business continuity plan, a disaster recovery plan and guidelines for information security, employee conduct and for prevention of fraud and forgery to ensure smooth functioning of the Group's operations.
Operational risk is the risk of loss resulting from inadequate or failed internal processes, people and system or from external events. Operational risk is inherent in the Group's business and operational activities.
Profit rate risk is the risk that the value of the financial instruments will fluctuate due to changes in the market profit rates. The Group is not exposed to any major profit rate risk as it mainly invests in equity securities.
Over 3 to 6 months
Over 6 months to 1
year
Over 1 to 2 years
------------------------------------------------------------------------------------ (Rupees in '000) -------------------------------------------------------------------------------------------------------
Effective yield /
interest rate
Non-interest bearing
financial I
Above 10 years
The Group has instituted sound internal controls through policies, plans and processes effected by the board of directors for controlling and mitigating potential operational risk. The system of internal controls include financial, operational and compliance controls and is performed on continuous basis by the senior management and all levels of employees within the Group.
The objectives of internal controls include the safeguarding of assets from inappropriate use or from loss and fraud, ensuring that liabilities are identified and managed and that the quality of internal and external reporting is maintained. The Group monitors its Key Risk Indicators (KRI) and Loss Data reporting through an operational risk software.
Over 3 to 6 months
Over 6 months to 1
year
Upto 1 month
------------------------------------------------------------------------------------- (Rupees in '000) --------------------------------------------------------------------------------------------------------
Effective yield/
interest rate
Total Upto 1 month Over 1 to 3 months
Exposed to Yield / interest risk
Over 3 to 5 years
Over 5 to 10 years
Over 2 to 3 years
Non-interest bearing financial
Instruments
Total Over 1 to 3 months
Exposed to Yield/interest risk
Liabilities against assets subject to finance leases
Over 1 to 2 years
Over 2 to 3 years
Over 3 to 5 years
Over 5 to 10 years
Above 10 years
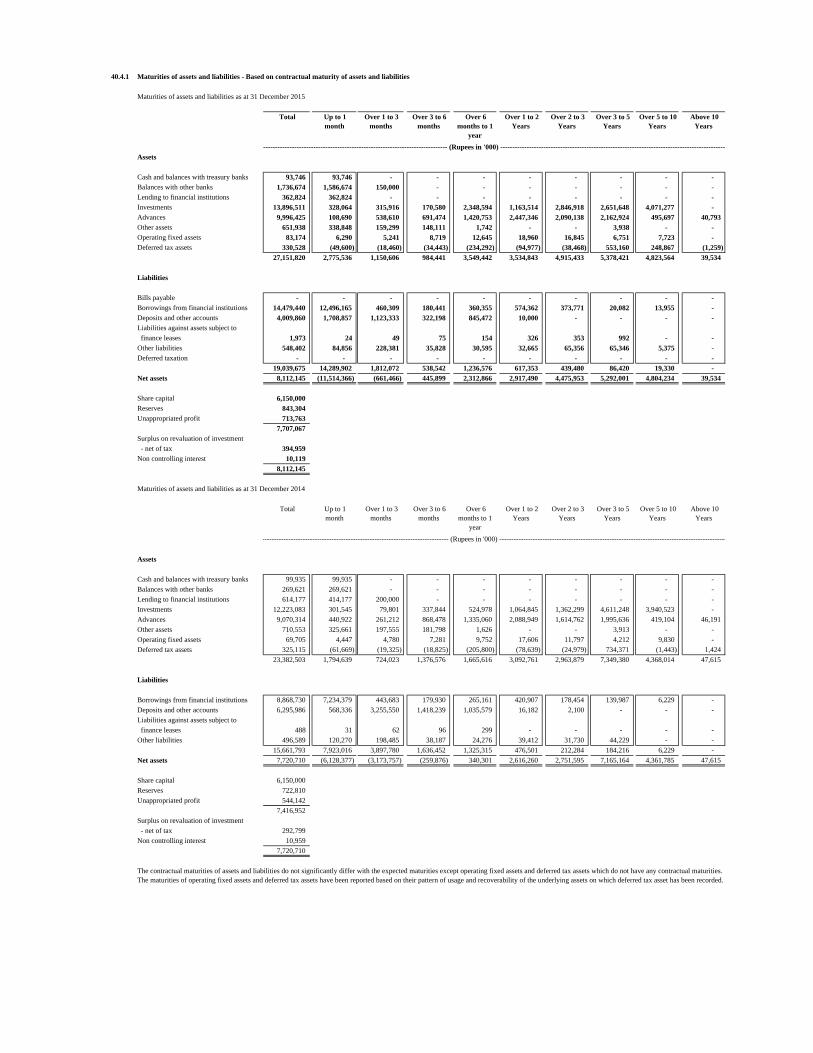
40.4.1 Maturities of assets and liabilities - Based on contractual maturity of assets and liabilities
Maturities of assets and liabilities as at 31 December 2015
Assets
Cash and balances with treasury banks 93,746 93,746 - - - - - - - - Balances with other banks 1,736,674 1,586,674 150,000 - - - - - - - Lending to financial institutions 362,824 362,824 - - - - - - - - Investments 13,896,511 328,064 315,916 170,580 2,348,594 1,163,514 2,846,918 2,651,648 4,071,277 - Advances 9,996,425 108,690 538,610 691,474 1,420,753 2,447,346 2,090,138 2,162,924 495,697 40,793 Other assets 651,938 338,848 159,299 148,111 1,742 - - 3,938 - - Operating fixed assets 83,174 6,290 5,241 8,719 12,645 18,960 16,845 6,751 7,723 - Deferred tax assets 330,528 (49,600) (18,460) (34,443) (234,292) (94,977) (38,468) 553,160 248,867 (1,259)
27,151,820 2,775,536 1,150,606 984,441 3,549,442 3,534,843 4,915,433 5,378,421 4,823,564 39,534
Liabilities
Bills payable - - - - - - - - - - Borrowings from financial institutions 14,479,440 12,496,165 460,309 180,441 360,355 574,362 373,771 20,082 13,955 - Deposits and other accounts 4,009,860 1,708,857 1,123,333 322,198 845,472 10,000 - - - - Liabilities against assets subject to
finance leases 1,973 24 49 75 154 326 353 992 - - Other liabilities 548,402 84,856 228,381 35,828 30,595 32,665 65,356 65,346 5,375 - Deferred taxation - - - - - - - - - -
19,039,675 14,289,902 1,812,072 538,542 1,236,576 617,353 439,480 86,420 19,330 -
Net assets 8,112,145 (11,514,366) (661,466) 445,899 2,312,866 2,917,490 4,475,953 5,292,001 4,804,234 39,534
Share capital 6,150,000 Reserves 843,304 Unappropriated profit 713,763
7,707,067 Surplus on revaluation of investment
- net of tax 394,959 Non controlling interest 10,119
8,112,145
Maturities of assets and liabilities as at 31 December 2014
Assets
Cash and balances with treasury banks 99,935 99,935 - - - - - - - -
Balances with other banks 269,621 269,621 - - - - - - - -
Lending to financial institutions 614,177 414,177 200,000 - - - - - - -
Investments 12,223,083 301,545 79,801 337,844 524,978 1,064,845 1,362,299 4,611,248 3,940,523 -
Advances 9,070,314 440,922 261,212 868,478 1,335,060 2,088,949 1,614,762 1,995,636 419,104 46,191
Other assets 710,553 325,661 197,555 181,798 1,626 - - 3,913 - -
Operating fixed assets 69,705 4,447 4,780 7,281 9,752 17,606 11,797 4,212 9,830 -
Deferred tax assets 325,115 (61,669) (19,325) (18,825) (205,800) (78,639) (24,979) 734,371 (1,443) 1,424
23,382,503 1,794,639 724,023 1,376,576 1,665,616 3,092,761 2,963,879 7,349,380 4,368,014 47,615
Liabilities
Borrowings from financial institutions 8,868,730 7,234,379 443,683 179,930 265,161 420,907 178,454 139,987 6,229 -
Deposits and other accounts 6,295,986 568,336 3,255,550 1,418,239 1,035,579 16,182 2,100 - - -
Liabilities against assets subject to
finance leases 488 31 62 96 299 - - - - -
Other liabilities 496,589 120,270 198,485 38,187 24,276 39,412 31,730 44,229 - -
15,661,793 7,923,016 3,897,780 1,636,452 1,325,315 476,501 212,284 184,216 6,229 -
Net assets 7,720,710 (6,128,377) (3,173,757) (259,876) 340,301 2,616,260 2,751,595 7,165,164 4,361,785 47,615
Share capital 6,150,000
Reserves 722,810
Unappropriated profit 544,142
7,416,952
Surplus on revaluation of investment
- net of tax 292,799
Non controlling interest 10,959
7,720,710
The contractual maturities of assets and liabilities do not significantly differ with the expected maturities except operating fixed assets and deferred tax assets which do not have any contractual maturities. The maturities of operating fixed assets and deferred tax assets have been reported based on their pattern of usage and recoverability of the underlying assets on which deferred tax asset has been recorded.
------------------------------------------------------------------------------ (Rupees in '000) -----------------------------------------------------------------------------------------------
Over 5 to 10 Years
Over 2 to 3 Years
Over 3 to 5 Years
Up to 1 month
Over 1 to 3 months
Total
Total Above 10 Years
Above 10 Years
Over 3 to 5 Years
Over 5 to 10 Years
----------------------------------------------------------------------------- (Rupees in '000) ----------------------------------------------------------------------------------------------
Over 3 to 6 months
Over 6 months to 1
year
Over 1 to 2 Years
Up to 1 month
Over 1 to 3 months
Over 3 to 6 months
Over 6 months to 1
year
Over 1 to 2 Years
Over 2 to 3 Years

40.4.2 Maturities of assets and liabilities - Based on the working prepared by the Asset and Liabilities Management Committee (ALCO)
Maturities of assets and liabilities as at 31 December 2015
Assets
Cash and balances with treasury banks 93,746 93,746 - - - - - - - - Balances with other banks 1,736,674 1,586,674 150,000 - - - - - - - Lending to financial institutions 362,824 362,824 - - - - - - - - Investments 13,896,511 328,064 315,916 170,580 2,348,594 1,163,514 2,846,918 2,651,648 4,071,277 - Advances 9,996,425 108,690 538,610 691,474 1,420,753 2,447,346 2,090,138 2,162,924 495,697 40,793 Other assets 651,938 338,848 159,299 148,111 1,742 - - 3,938 - - Operating fixed assets 83,174 6,290 5,241 8,719 12,645 18,960 16,845 6,751 7,723 - Deferred tax assets 330,528 (49,600) (18,460) (34,443) (234,292) (94,977) (38,468) 553,160 248,867 (1,259)
27,151,820 2,775,536 1,150,606 984,441 3,549,442 3,534,843 4,915,433 5,378,421 4,823,564 39,534
Liabilities
Bills payable - - - - - - - - - - Borrowings from financial institutions 14,479,440 12,496,165 460,309 180,441 360,355 574,362 373,771 20,082 13,955 - Deposits and other accounts 4,009,860 1,708,857 1,123,333 322,198 845,472 10,000 - - - - Liabilities against assets subject to - - - - - - - - - finance leases 1,973 24 49 75 154 326 353 992 - - Other liabilities 548,402 84,856 228,381 35,828 30,595 32,665 65,356 65,346 5,375 - Deferred taxation - - - - - - - - - -
19,039,675 14,289,902 1,812,072 538,542 1,236,576 617,353 439,480 86,420 19,330 -
Net assets 8,112,145 (11,514,366) (661,466) 445,899 2,312,866 2,917,490 4,475,953 5,292,001 4,804,234 39,534
Share capital 6,150,000 Reserves 843,304 Unappropriated profit 713,763
7,707,067 Surplus on revaluation of investment
- net of tax 394,959 Non controlling interest 10,119
8,112,145
Maturities of assets and liabilities as at 31 December 2014
Assets
Cash and balances with treasury banks 99,935 99,935 - - - - - - - -
Balances with other banks 269,621 269,621 - - - - - - - -
Lending to financial institutions 614,177 414,177 200,000 - - - - - - -
Investments 12,223,083 301,545 79,801 337,844 524,978 1,064,845 1,362,299 4,611,248 3,940,523 -
Advances 9,070,314 440,922 261,212 868,478 1,335,060 2,088,949 1,614,762 1,995,636 419,104 46,191
Other assets 710,553 325,661 197,555 181,798 1,626 - - 3,913 - -
Operating fixed assets 69,705 4,447 4,780 7,281 9,752 17,606 11,797 4,212 9,830 -
Deferred tax assets 325,115 (61,669) (19,325) (18,825) (205,800) (78,639) (24,979) 734,371 (1,443) 1,424
23,382,503 1,794,639 724,023 1,376,576 1,665,616 3,092,761 2,963,879 7,349,380 4,368,014 47,615
Liabilities
Borrowings from financial institutions 8,868,730 7,234,379 443,683 179,930 265,161 420,907 178,454 139,987 6,229 -
Deposits and other accounts 6,295,986 568,336 3,255,550 1,418,239 1,035,579 16,182 2,100 - - -
Liabilities against assets subject to
finance leases 488 31 62 96 299 - - - - -
Other liabilities 496,589 120,270 198,485 38,187 24,276 39,412 31,730 44,229 - -
15,661,793 7,923,016 3,897,780 1,636,452 1,325,315 476,501 212,284 184,216 6,229 -
Net assets 7,720,710 (6,128,377) (3,173,757) (259,876) 340,301 2,616,260 2,751,595 7,165,164 4,361,785 47,615
Share capital 6,150,000
Reserves 722,810
Unappropriated Profit 544,142
7,416,952
Surplus on revaluation of investment
- net of tax 292,799
Non controlling interest 10,959
7,720,710
Over 6 months to 1
year
Over 2 to 3 Years
Over 1 to 3 months
Above 10 Years
Over 2 to 3 Years
Over 3 to 5 Years
Over 5 to 10 Years
Over 1 to 3 months
Over 3 to 6 months
Over 3 to 6 months
Over 6 months to 1
year
Over 1 to 2 Years
------------------------------------------------------------------------------ (Rupees in '000) -----------------------------------------------------------------------------------------------
Over 5 to 10 Years
Above 10 Years
----------------------------------------------------------------------------- (Rupees in '000) ----------------------------------------------------------------------------------------------
Total Up to 1 month
Over 3 to 5 Years
Over 1 to 2 Years
Total Up to 1 month
The contractual maturities of assets and liabilities do not significantly differ with the expected maturities except operating fixed assets and deferred tax assets which do not have any contractual maturities. The maturities of operating fixed assets and deferred tax assets have been reported based on their pattern of usage and recoverability of the underlying assets on which deferred tax asset has been recorded.