annual report 2014 on track. to a successful … report 2014 on track. ... 1 on track. to a...
TRANSCRIPT

ANNUAL REPORT 2014
ON TRACK. To a successful future.
SC
HM
OLZ
+ B
ICK
EN
BA
CH
ANN
UAL
REPO
RT 2
014
S + BI is one of the leading producers of premium special steel long products, operating with a global sales and service network. We focus on meeting our customers’ specific needs and delivering high-quality products.
Providing special steel solutions.
Our profile
1 ON TRACK.
To a successful future.
28 Chairman’s foreword
29 Letter to the shareholders
30 Management report
76 Corporate governance
96 Compensation report
114 Financial reporting
182 Glossary
183 List of abbreviations
184 Contact
184 Legal notice
Contents

Our key figures
Unit 2014 2013Change on
prior year % Q4 2014 Q4 2013Change on
prior year %
SCHMOLZ + BICKENBACH GROUP
Sales volume kilotonnes 2 135 2 054 3.9 488 491 – 0.6
Revenue million EUR 3 338.4 3 276.7 1.9 785.3 752.0 4.4
Adjusted EBITDA million EUR 261.7 178.8 46.4 62.3 43.0 44.9
Operating profit before depreciation and amortisation (EBITDA) million EUR 252.6 141.7 78.3 59.2 15.1 > 100
Adjusted EBITDA margin (%) % 7.8 5.5 41.8 7.9 5.7 38.6
EBITDA margin (%) % 7.6 4.3 76.7 7.5 2.0 > 100
Operating profit (loss) (EBIT) million EUR 130.6 17.8 > 100 28.9 – 16.1 > 100
Earnings before taxes (EBT) million EUR 79.7 – 87.6 > 100 11.4 – 48.5 > 100
Net income (loss) (EAT) million EUR 50.0 – 83.7 > 100 4.2 – 39.2 > 100
Investments million EUR 100.8 105.7 – 4.6 41.0 44.0 – 6.8
Free cash flow million EUR 82.9 73.7 12.5 61.0 56.2 8.5
Capital employed million EUR 1 891.2 1 841.3 2.7 – – –
Total assets million EUR 2 509.6 2 377.5 5.6 – – –
Shareholders' equity million EUR 900.9 889.9 1.2 – – –
Equity ratio % 35.9 37.4 – 4.0 – – –
Net debt million EUR 587.2 610.1 – 3.8 – – –
Gearing % 65.2 68.6 – 5.0 – – –
Employees as at closing date positions 10 000 10 095 – 0.9 – – –
SCHMOLZ + BICKENBACH AG
Net income million CHF 10.1 15.6 – 35.3 – – –
Share capital million CHF 472.5 472.5 0.0 – – –
Shareholders' equity million CHF 1 501.5 1 491.4 0.7 – – –
Total dividend million CHF 0.0 0.0 0.0 – – –
SCHMOLZ + BICKENBACH SHARE
Earnings per share 1) EUR/CHF 0.05/0.06 – 0.26/– 0.32 – – – –
Shareholders' equity per share EUR/CHF 0.94/1.13 0.93/1.14 – – – –
Highest/lowest share price CHF 1.51/1.00 1.34/0.58 – – – –
Dividend per share CHF 0.0 0.0 – – – –
Payout ratio of net income % 0.0 0.0 – – – –
1) The earnings per share are based on the net income (loss) of the Group after deduction of the portions allocable to the non-controlling interests.
REVENUE BY MARKET SEGMENT 2014
End-user in %
Engineering 30.9
Construction 5.1
Further market segments * 2.9
Other vehicle manufacturer
3.0
Energy 9.7
Chemistry 1.4
Other 15.8
Automotive 28.8
Plastic2.5
* Aerospace 0.6%, Mining 1.0%, Food and beverage 1.3%
REVENUE BY REGION 2014
in %
Switzerland 1.8
Italy 8.9
Africa /Asia /Australia 4.7
Other Europe 19.0
America 13.7
Germany 45.5
France6.4

Our business model
DIVISIONS
PRODUCTION
› S + BI has nine steelworks of
its own as well as ten processing plants in Europe and
North America.
› The Group stands out from the competition thanks to
its know-how and expertise, coupled with state-of-the-art-
facilities
› Our own steelworks cover the entire special long steel
product portfolio
› Products in the portfolio range from the finest 0.013mm
wire to 40t ingots
› Energy-efficient steelworks
› Innovation – Ugitech with its state-of-the-art research facility –
DEW with its new secondary metallurgic centre
SALES & SERVICES
› Consistent and reliable supply of special steel and end-
to-end solutions to around 85 sales and service branches
around the world
› Finely meshed network of global distribution channels in our
key markets and continuous information exchange between
Production and Sales & Services guarantee customised solu-
tions from a single source
› Technical advice around product requirements
› Downstream mechanical preprocessing, thermal treat-
ment and supply chain management services
1.1.– 31.12.2014
Change on prior year %
in million EUR
Revenue 2 668.6 4.1
Adjusted EBITDA 239.2 42.0
1.1.– 31.12.2014
Change on prior year %
in million EUR
Revenue 1 074.4 – 7.2
Adjusted EBITDA 30.5 > 100
KEY FIGURES PRODUCTION
KEY FIGURES SALES & SERVICES
47% share in revenue
No. 2 in Europe
36% share in revenue
No. 2 worldwide
SPECIAL LONG STEEL PRODUCT LINES
3 › ENGINEERING STEEL
Engineering steel can withstand perma-
nent high mechanical loads and is used
in components that need to combine
reliability and durability. Some examples
of engineering steel applications include
the automotive industry, power gene-
ration facilities or wind turbines.
2 › STAINLESS STEEL
Resistant to corrosion, acids and heat,
this steel is an attractive material for
numerous industry applications, includ-
ing automotive and machine construc-
tion, food and chemicals, oil and gas
and aviation.
1› TOOL STEEL
The product range spans cold work
steel, hot work tool steel, highspeed
steel and mould steel. Examples of
applications for our tool steel include
the automotive and food packaging
industries.
13% share in revenue
No. 2 worldwide
INTEGRATED PROVIDER OF SPECIAL LONG STEEL
FOCUSING ON CORE COMPETENCES IN THE SUPPLY CHAIN
Upstream
integration
Downstream
integrationDISTRIBUTIONPRODUCTION PROCESSING


ON TRACK
The Group is making good progress. In the fiscal year 2014, we successfully rolled out the new business model and shifted our focus to our core competence in the production of premium special long steel solutions. Our activities are geared towards our customers – and their individual require-ments. With new structures in place, we are implementing the strategy with a CLEAR FOCUS.
Strong success factors add up to a SOUND BASIS. As a technological leader, we enjoy close proximity to our customers, who appreciate our excellent service quality and technical application advice.
We pursue a uniform Group strategy. With motivated and qualified employees and an experienced management team, our FUTURE IS SET FOR SUCCESS.

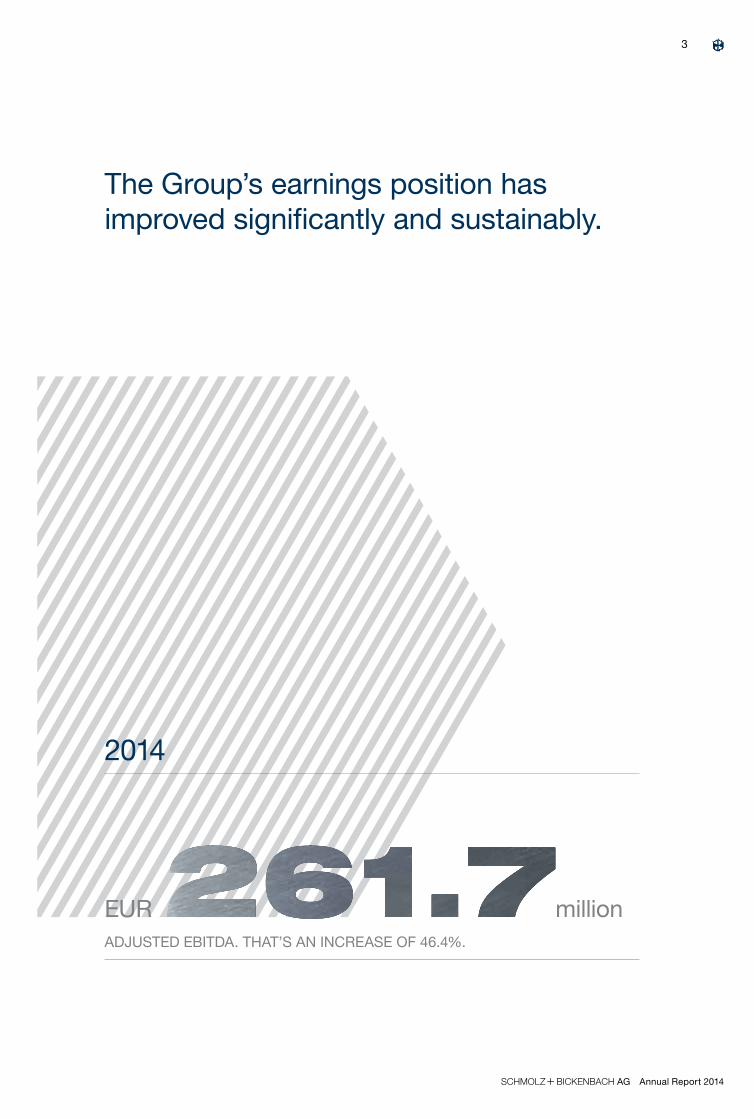
EUR million ADJUSTED EBITDA
2013
TO A SUCCESSFUL FUTURE
S+Bi AG Annual Report 2014
3
2014
The Group’s earnings position has improved significantly and sustainably.
ADJUSTED EBITDA. THAT’S AN INCREASE OF 46.4%.
EUR million

AUF DEM RICHTIGEN WEG › Fokus: Kernkompetenzen
S+Bi AG Annual Report 2014
FOCUS: CORE COMPETENCES
A one-stop shop for a broad range of special long steel products and service
S+Bi AG Annual Report 2014
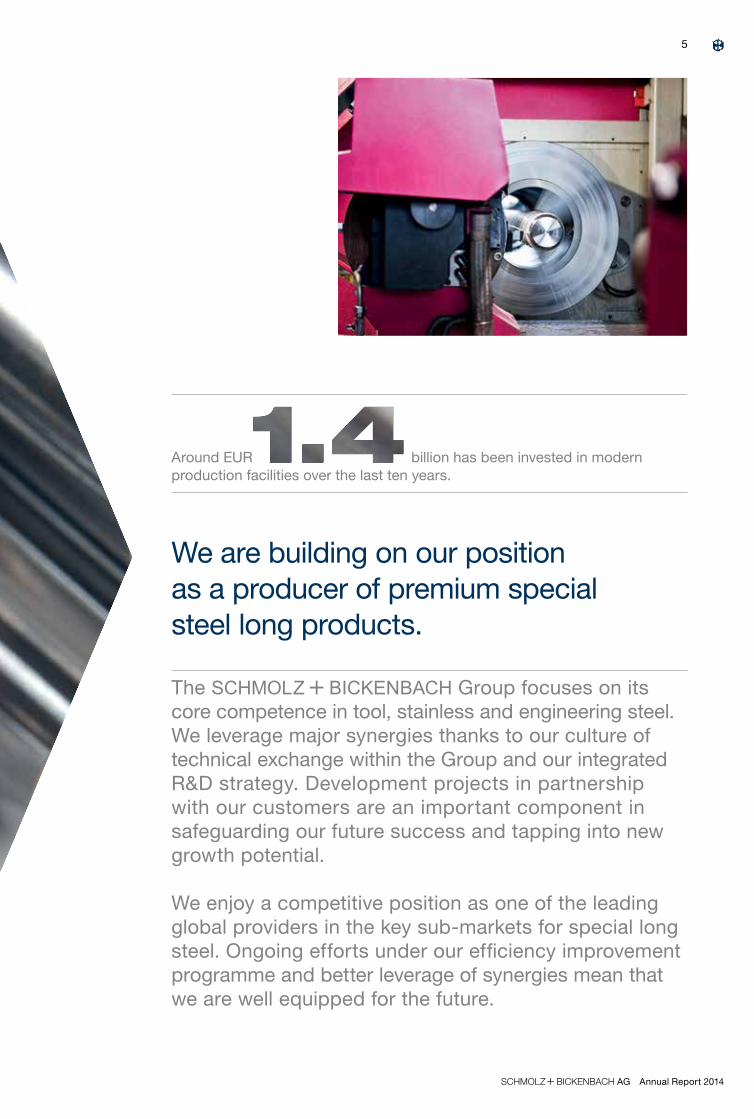
The S + BI Group focuses on its core competence in tool, stainless and engineering steel. We leverage major synergies thanks to our culture of technical exchange within the Group and our integrated R&D strategy. Development projects in partnership with our customers are an important component in safeguarding our future success and tapping into new growth potential.
We enjoy a competitive position as one of the leading global providers in the key sub-markets for special long steel. Ongoing efforts under our efficiency improvement programme and better leverage of synergies mean that we are well equipped for the future.
We are building on our position as a producer of premium special steel long products.
Around EUR billion has been invested in modern production facilities over the last ten years.
5
S+Bi AG Annual Report 2014
ON TRACK › Focus: Core competences
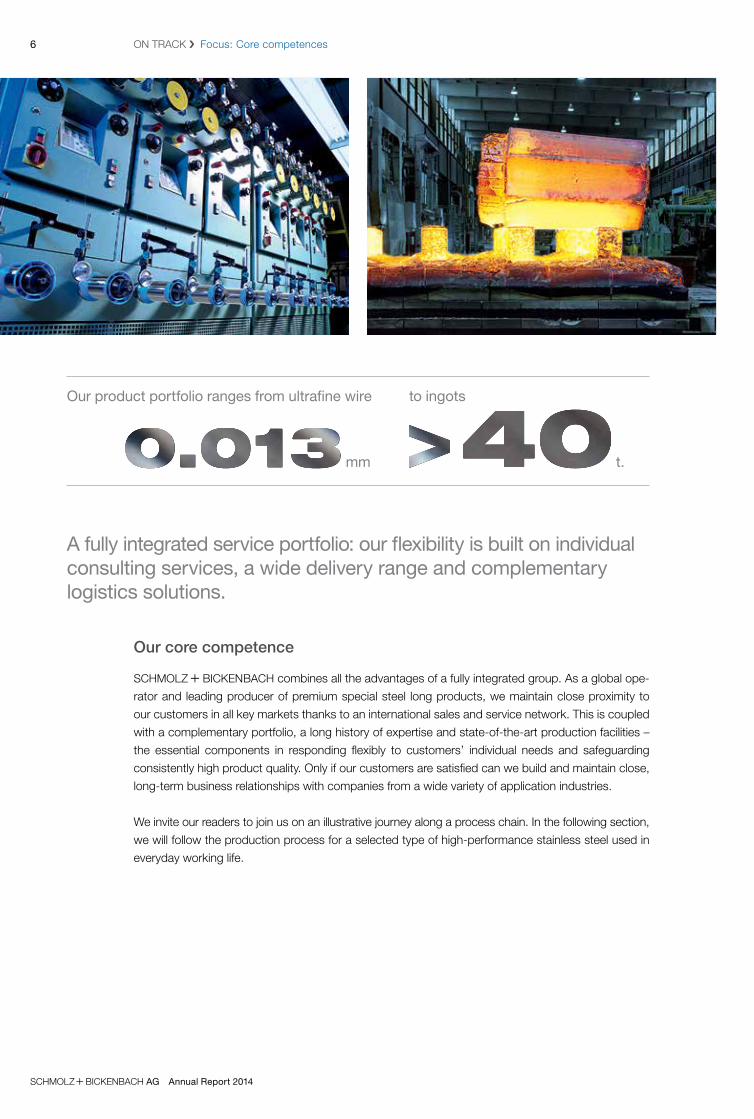
Our core competence
s + bi combines all the advantages of a fully integrated group. As a global ope-
rator and leading producer of premium special steel long products, we maintain close proximity to
our customers in all key markets thanks to an international sales and service network. This is coupled
with a complementary portfolio, a long history of expertise and state-of-the-art production facilities –
the essential components in responding flexibly to customers’ individual needs and safeguarding
consistently high product quality. Only if our customers are satisfied can we build and maintain close,
long-term business relationships with companies from a wide variety of application industries.
We invite our readers to join us on an illustrative journey along a process chain. In the following section,
we will follow the production process for a selected type of high-performance stainless steel used in
everyday working life.
A fully integrated service portfolio: our flexibility is built on individual consulting services, a wide delivery range and complementary logistics solutions.
Our product portfolio ranges from ultrafine wire to ingots mm t.
6
S+Bi AG Annual Report 2014
Routes of our steel
A valuable contribution to life-saving protective measures
Stainless steel ring mesh inserts for protective work clothing
Working together, two subsidiaries of the s + bi Group supply key products used
in the production of stainless steel mesh for creative architecture and design elements or protective
clothing for everyday working life. Examples of the latter include gloves, aprons and boleros for the
food-processing industry as well as stab-proof police vests. Friedrich Münch GmbH + Co KG is a
customer of ours that supplies national and international manufacturers of protective work clothing.
Looking back on a long tradition, the company offers expertise based on extensive experience and has
a reputation for being pioneering and innovative.
High quality standards protect employees from dangerous injuries
in their everyday working life
When used in protective clothing, the main job of stainless steel ring mesh is to protect the body from
direct contact with sharp objects as well as bladed or pointed weapons such as knives, scissors or
glass. In a police context, disarming the opponent is the primary goal. Stab-proof mesh is produced
using a range of raw materials categorised by protection class and based on various wire alloys and
ring mesh dimensions.
Friedrich Münch Easyfit glove
right
left
Stainless steel mesh close-up
7

S+Bi AG Annual Report 2014
ON TRACK › Focus: Core competences
Strong links!
In our product example, the s + bi Group benefits from internal production and
service synergies to consistently safeguard the requisite quality standards. The companies Deutsche
Edelstahlwerke GmbH (DEW) and Sprint Metal Edelstahlziehereien GmbH cooperate closely and
work with customers to serve the market for fine and ultrafine stainless steel wire. Our aim is to meet the
increasingly ambitious demands of this market. We make a valuable contribution to life-saving protec-
tive measures by leveraging the symbiotic potential of production and processing facilities and availa-
ble know-how as well as working tirelessly to meet our customers’ individual needs.
Protection starts with stainless steel
The basic material used in our application example is stainless steel. This non-corrosive steel type can
be subdivided into four materials categories according to chemical composition. The different micro
structures of the four groups refer to the microscopic arrangement of building blocks in a particular
material, defined by shape, size, type, alignment and distribution. These four materials groups have
either ferritic, martensitic, austenitic or duplex characteristics. For our example, we will focus solely on
the duplex group.
Sprint Metal EdelstahlziehereienAs a specialist producer of special applica-tion wires (e.g. mesh for electronic screen printing), the SCHMOLZ + BICKENBACH Group is represented by Sprint Metal Edelstahlziehereien, which has more than 300 local and inter national customers and more than 80 years’ experience. A specialist subsidiary of Ugitech SA, Sprint Metal Edelstahlziehereien is a global leader in its market segment for fine and ultrafine stainless steel wire with dimensions of 1.40 mm to 0.013 mm.
left i
Friedrich Münch mesh installation in front of the Swarovski headquarters, Wattens
8

S+Bi AG Annual Report 2014
Our duplex steel – a cut and stab-proof combination structure
The duplex steel produced by Deutsche Edelstahlwerke and processed into stab-proof mesh by
Sprint Metal Edelstahlziehereien combines ferritic and austenitic structures (50% each). Among other
things, ferrite lends the steel good resistance to corrosion and stress corrosion cracking. Austenite
also provides excellent resistance to corrosion plus additional ductility (plasticity without breaking).
Combining the two materials in duplex steel blends the ideal properties for a long-life, corrosion-
resistant structure with maximum stability (high tensile and yield strength) as the basic material for pro-
ducing ring mesh. The duplex steel used in our example was developed by Deutsche Edelstahlwerke
in 1975. In summary, the advantages of this duplex steel are the good ductility of the austenite, excel-
lent corrosion properties and suitability for welding without forming coarse grains or compromising on
strength – important considerations for the end application as stab-proof mesh.
FerriteFerrite is characterised by a chrome content of 13-17% and a carbon content of less than 0.07%. Among other things, this composition lends the steel good resistance to corrosion and stress corrosion cracking.
AusteniteAustenite is characterised by a chrome content of 18%, an additional nickel content of 8% and a carbon content of up to 0.07, likewise providing excellent resistance to corrosion but with improved ductility (plasticity without breaking).
Duplex steel cross section
left
right i
9

S+Bi AG Annual Report 2014
ON TRACK › Focus: Core competences
Station 1 – Deutsche Edelstahlwerke GmbH, Siegen/Hagen
Following careful advance coordination with our customer, who awards the contract to Sprint Metal
Edelstahlziehereien, the initial production steps are passed on to DEW. The handover involves very
close cooperation and coordination, taking into account relevant deadlines to ensure that our custo-
mer receives the order on time and in an appropriate quality.
Together with the required alloying elements (such as chrome and nickel), the scrap metal is melted
in DEW’s 120 t electric arc furnace at the Siegen plant. Scrap is tipped from baskets into the top of
the furnace. The swiveling cover is then closed before three graphite electrodes are lowered to strike
an electric arc on the cold scrap. Using this method, molten steel can reach a temperature of up to
1800 °C. Oxygen is blown into the furnace to speed up the melting process. Ultra high power electric
arc furnaces are particularly well suited to the production of non-corrosive steels because a portion of
the alloying elements can be reclaimed from the pre-sorted scrap. Once the predefined temperature
and chemical composition have been reached, the furnace is tipped and emptied into a ladle for
further processing.
The liquid steel is heated or kept warm in the ladle furnace and prepared for the continuous casting
line, where our steel undergoes fine-tuning as part of secondary metallurgical treatment. The precise
casting temperature is once again reached using electric arcs. Through the addition of aluminium
rods, the remaining oxygen is bound in the molten steel (deoxidation), preventing oxidation of other
alloys which could affect the properties of the finished product. Additional alloying elements are
added to the ladle furnace to create the desired chemical composition of the liquid steel.
From raw material to ring mesh insert
Our high-performance stainless steel passes through several stations before finding its way into everyday working life.
DEW electric arc furnace, Siegen
left
DEW VOD unit, Siegen
10

S+Bi AG Annual Report 2014
The ladle with the liquid steel alloy is then transferred to a vacuum vessel for further treatment. The
carbon in the molten steel is mixed with oxygen in our duplex vacuum oxygen decarburisation
(VOD) unit to create carbon monoxide which rises to the surface of the molten metal bath and leaves
the steel. This method reduces the carbon content to the required level and also keeps damaging
hydrogen to a minimum in the composition. Besides very low levels of hydrogen and oxygen, the
exact chemical composition needed for production is set; this is significantly more precise than in a
normal analysis and is also calculated digitally, together with all trace elements, in mathematical for-
mulas to give the best resistance to corrosion and optimum cold formability. This phase sets the
foundations for a product that displays decent processing qualities across all stages and exhibits
good resistance to corrosion throughout its life span.
The melt solidifies in a six-strand bow-type continuous casting machine. The liquid steel is transported
to the continuous casting machine and placed in the ladle turret ready for casting. It then passes
through a floor basin into the tundish, which feeds liquid steel into the individual strands. This conti-
nuous casting process takes place under airtight conditions and without interruptions, even if the ladle
gets changed halfway through. The melt flows through the tundish and into the waiting dies. To prevent
reoxidation, the steel meniscus is covered with slag which binds any additional impurities that rise to the
top of the liquid steel. The die oscillates throughout the casting process. By bending the strand until the
melt has completely solidified, a length of up to 20 m can be achieved, in our case giving a square rod
with a 265 mm diameter. Once hard, the strands are cut to the required length of 4.5 m on the roller bed
using cutting torches.
After transfer to a downstream two-stand reverse rolling mill, the raw steel billets (265 mm square
rods) are pre-rolled in ten roll passes to 135 mm square rods. The billets are then honed on all sides,
applying a very small tolerance to the surface roughness to create the best starting point for a perfect
rolled wire surface finish. Pre-rolling and polishing the billets are important steps to improve the quality
of the wire to be produced.
DEW continuous casting machine, Siegen
right
page 10, right
left
DEW ladles on the ladle turret, Siegen
11
S+Bi AG Annual Report 2014
ON TRACK › Focus: Core competences
The 135 mm square billets are sent to the Hagen plant for further processing at the wire mill. Several
stands with carbide rolls make short work of the billets, producing 5.50 mm wire in a hot rolling
forming process. Applying consistent volume, the 8 m billets are transformed into approx. 5 km of
rolled wire at a final rolling speed of approx. 60 m/s (250 km/h).
The next steps are a homogenising hot-working treatment and a multi-stage pickling process which
causes a passive coating to form that protects against corrosive attack. The pre-treated duplex wire
is extremely well suited to further processing in a multi-wire drawing line. The diameter is reduced
again to the final dimension of Ø 1.60 mm in a cold forming process known as pre-drawing, where
the material is pulled through dies with pliers, resulting in a better surface quality (smoothed) and
closer tolerance. Once the pre-drawing process is completed, the wire undergoes normalisation in a
protective atmosphere to ensure good machinability of the wire at smaller dimensions when it arrives
at Sprint Metal Edelstahlziehereien GmbH. The bare wire is wound around multi-prong reels made
of bent pipes in the shape of a crown and packed for transfer from DEW in Hagen to Sprint Metal
Edelstahlziehereien in Reichshof, where further processing awaits it.
Station 2 – Sprint Metal Edelstahlziehereien GmbH, Reichshof
Upon arrival and following a thorough inspection, the bundles, still on their reels, are transported to
the drawing machine for further processing. Once in place, the coiled wire is fed into the drawing
machine and pulled through. Depending on the required wire thickness and properties, this cold for-
ming process has to be repeated up to 38 times until the desired quality is achieved, reducing the
diameter of the material from its starting dimension to the ultimate size. Drawing dies are also used
to draw our stainless steel wire. Featuring a natural diamond core with a geometric opening set to the
target dimensions, the dies can compensate the forces needed to form the wire. A push-pull forming
process is applied to reduce the diameter of the ingoing wire, which lengthens the wire overall. Oil is
added as a lubricant and coolant in the wet drawing process used in this kind of work hardening.
Plastic deformation changes the micro structure and hardens the material. This strengthens the
tensile strength but can make our stainless steel brittle – an effect which is countered in the next
processing step.
middle
DEW wire mill, Hagen
DEW wire mill, Hagen DEW reels, Hagen Sprint Metal drawing dies, Reichshof
left
right
12

S+Bi AG Annual Report 2014
middle
Friedrich Münch, Niroflex boleroSprint Metal furnace, Reichshof Sprint Metal coiling line, Reichshof
right
left
13
The wire is treated in a furnace to change the structure and realise the desired forming capacity of
the material. This involves annealing the coils in a continuous furnace. The end of the wire is fed into
the special annealing tube and emerges at the other end. Reaching a temperature of around 1 100
°C, the wire is treated for a defined period of time (throughput speed). To avoid oxidation during hea-
ting, the annealing tubes are flooded with a protective gas (a mixture of hydrogen and nitrogen). The
annealed wire passes through a cooling zone before being coiled onto the reel type ordered by the
customer. To ensure smooth, problem-free winding, the wire surface is coated with a special subs-
tance which depends on the next processing steps planned by the customer. The annealing process
does not affect the length of the wire originally fed into the furnace for processing. In a quality as-
surance process, spot testing is performed on the finished material – wires with a diameter of 0.50
mm and 1.10 mm. Only after successful completion of this step is the product delivered to our client,
Friedrich Münch GmbH + Co KG.
Station 3 – Friedrich Münch GmbH + Co KG, Mühlacker
After arrival, the material undergoes final processing at our customer’s plant to create ring mesh for
use in protective clothing. The wire is fed into the processing machine, where it is cut to the required
length and bent into a ring shape, with the ends pressed together and welded shut. This process
continues automatically and is repeated millions of times until the required product is finished: the
wire ring mesh. In a final step, the mesh is cut to size in a wire cutting machine and then tailored to
give the finished product.
Results you can see!
Working together, Deutsche Edelstahlwerke GmbH and Sprint Metal Edelstahlziehereien GmbH
produce materials where every centimeter of quality counts. Together with our customer,
Friedrich Münch GmbH + Co KG, we have had our duplex steel and its application officially certified.

AUF DEM RICHTIGEN WEG › Fokus: Kernkompetenzen
S+Bi AG Annual Report 2014
The catalogue of measures is growing into a continuous improvement process.
FOCUS: IMPROVING PERFORMANCE
S+Bi AG Annual Report 2014
All Group companies benefit from improved processes
The earnings improvement programme, which was expanded significantly in 2013, has a major impact on our Company’s earnings power, as seen in the results generated in the past fiscal year. The existing programme is planned to be completely imple-mented by 2016. But our plans do not stop there. S + BI is taking the existing programme one step further by establishing a conti-nuous improvement process. Already today we are seeing new ideas being generated as project groups work together on the individual measures.
This, coupled with our new structures, adds up to a powerful and modern Group.
individual measures are being worked on by the project groups in the earnings improvement programme.
15

S+Bi AG Annual Report 2014
ON TRACK › Focus: Improving performance
New Technical Development department condenses innovative power
Steel is both an old and a new material. Its history began more than 5 000 years ago when the Egypti-
ans started to process iron meteorites. In the Iron Age (1200 – 600 B.C.), weapons and jewellery were
already being produced from iron. Stainless steel was first produced more than 100 years ago when
Benno Strauss and Eduard Maurer created the first corrosion-resistant steel in 1912. Since these early
beginnings, the production and finishing processes for stainless steel have been developed and refined.
Today, stainless steel can be found in a wide variety of applications and forms: from uses in storage,
transport and foodstuffs to state-of-the-art automotive engines, load-bearing aircraft parts, attractively
designed steel-surfaced furniture or fine wire in smartphones. Nowadays, it is difficult to imagine a world
without stainless steel. And the development phase is by no means over. That is why we are still
working on it with highly specialised experts in our own laboratories.
A global company like S + BI needs strong leadership. That is why we have transformed our purely financial holding structure into an effective management holding structure in the past fiscal year. We leverage the synergies released by our new structures.
The earnings improvement programme contains individual steps, with each and every one helping us boost our profitability.
16

S+Bi AG Annual Report 2014
Our new centralised Technical Development department has a clear vision for the Group in this area.
We want to stay that bit faster and better than the competition. And we want to be more productive
and innovative than our competitors, to offer our customers the added value that they need for their
own success. Internal transparency is the key to achieving this. It is vital to know which plant is cur-
rently working on what solutions. Where are we investing money in our technology leadership? Who
else in the Group could benefit from this investment? To get these answers, it is essential to ensure
Group-wide efficiency in information transparency and the optimum allocation of necessary resour-
ces. Stronger communication across business units and country borders facilitates the transfer of
knowledge and best practice. So that we can develop the stainless steel of tomorrow.
New sales coordination task force leverages synergies
To produce a product that exactly meets our customers’ high demands is quite something. But get-
ting that product to the customer – in the right volume, at the right time, and with the right technical
advice – is quite something else. And how do we respond when we hear about new trends from our
global customers or receive detailed feedback? How do information and suggestions make their way
from our experienced sales team to our production plants and the Company as a whole? Starting this
year, our new sales coordination task force has been tackling these questions.
Led by the Group CEO, the general managers of the production units and the Sales & Services Division
meet regularly to exchange ideas and discuss international and intercontinental sales concepts. The
meetings are a chance to find out about current trends and developments, and to act even more as a
Group. What this means for our customers is that their local contacts can always explain and offer
them the latest products from a global portfolio. And if necessary, the account manager can put the
customer in touch with the relevant production plant directly. For s + bi as
a company, this task force is an effective way to strengthen our image as a cohesive Group and leve-
rage the synergies within it. For our own – and our customers’ – benefit.
17
S+Bi AG Annual Report 2014
ON TRACK › Focus: Improving performance
Central purchasing as a lever for corporate efficiency
The steel industry has always been cyclical and subject to economic and seasonal fluctuations affec-
ting both our customers and ourselves as a special long steel producer. Even in this environment, we
want to offer our customers an attractive portfolio at all times and also work to create value for our
shareholders. To achieve this, a modern special long steel company such as s + bi
needs to leverage all the advantages that come with being a globally active company.
The cost of materials stood at about two thirds of revenue in 2014. In other words, we paid more than
EUR 2 billion for raw materials, services and energy! In our efforts to make the Company as efficient
as possible, procurement of these items has been identified as a key area for leverage. It is not about
purchasing as cheaply as possible, but about establishing reliable and long-term supplier relation-
ships where the large volumes we purchase are reflected in pricing. For us, then, a sensible pro-
curement strategy covers not only reasonable prices, but also reliability of supply, quality of primary
products and timeliness of delivery. At the same time, it would be no good optimising supplier rela-
tionships based solely on these aspects if they came at the cost of people’s health and safety. That is
why we are always careful to ensure fairness in our dealings with people and the environment. This
is a central point for us in every way and applies for ourselves and our suppliers.
18

S+Bi AG Annual Report 2014
Earnings improvement programme in action: two original examples
1. Minimising logistics cost in the Swiss Steel Business Unit
A project to optimise wagon downtime was launched as far back as 2012 in the Swiss Steel Business
Unit with the aim of saving logistics and transport costs. The project’s primary purpose was to reduce
the fees incurred for railway wagons during the time between arrival and departure when they stand
idle at the steel plant. Furthermore, the project was designed to improve the loading and unloading
cycles. A specially developed software tool is now in place to manage the stream of goods and wa-
gons centrally as a way to optimise the entire logistics process. This concept is featured in
s + bi’s earnings improvement programme as a pilot project for Group-wide
synergies. Originally only implemented at the steelworks, the process was so successful that it was
extended to the rolling mill in 2014, where it also made a significant contribution to a more efficient
logistics structure. The involvement of all parties is transparent, enabling everyone to make their own
contribution to optimum management.
2. Group-wide savings in commodities use
As part of our efforts to cut the cost of materials and energy continuously, s + bi
launched a Group-wide procurement project for the Production Division in February 2014. The pro-
ject began with a detailed analysis of the individual Business Units’ procurement behaviour, which
until then had been been largely autonomous. In an initial step, various pilot and primary commodity
groups were defined for the new organisational concept. The Group then looked at what that meant
for implementing central procurement and a lead buyer concept. One essential component of the
project is extending the use of scrap alloys for use in the production process as a substitute for major,
more expensive, primary alloys. This should bring about permanent savings in the area of materials. A
thorough test phase was performed to rule out the risk of reduced quality as a result of tramp ele-
ments (such as sulphur or phosphorus). We maintain permanently high quality standards in the ope-
rating business by carrying out ongoing sample testing. This approach was based on the established
procurement practice of a producing Business Unit within the s + bi Group.
By leveraging internal synergies within the Group, the economic and technical aspects were exten-
ded to other Business Units and are now being developed continuously.
19
S+Bi AG Annual Report 2014
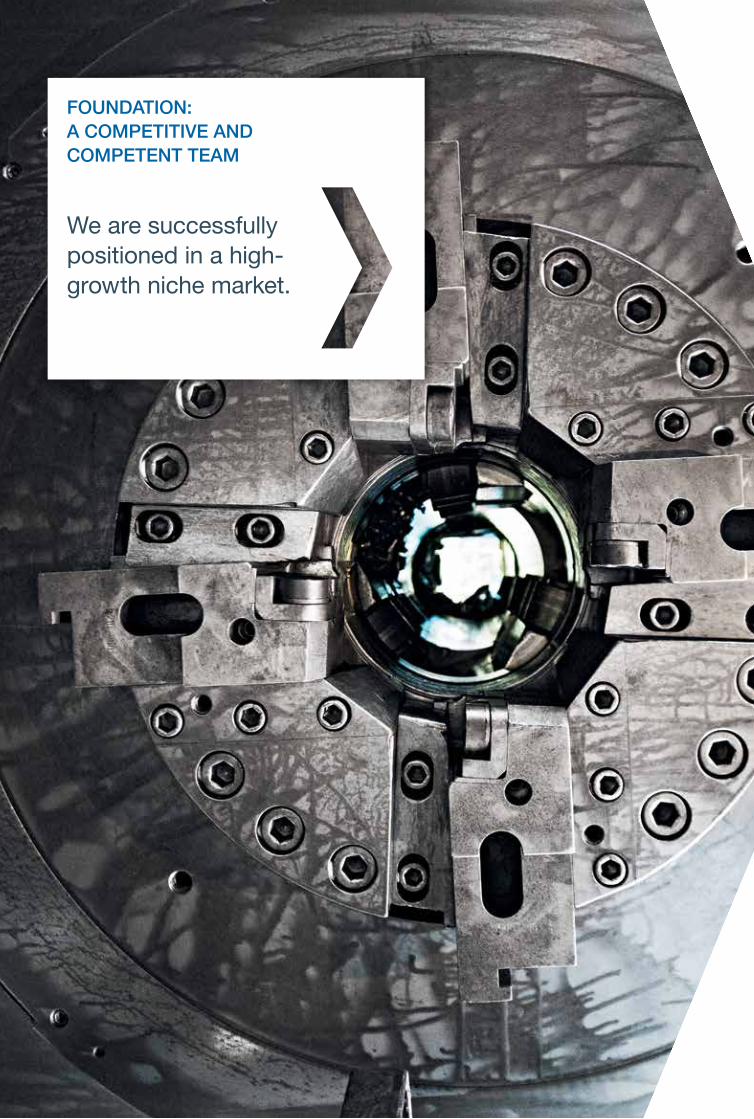
We are successfully positioned in a high-growth niche market.
FOUNDATION: A COMPETITIVE AND COMPETENT TEAM

S+Bi AG Annual Report 2014
S + BI has highly competent employ ees, modern tools and production facilities, long-term customer relationships and an experienced management team.
Our unique positioning is backed up by a comprehen-sive product portfolio, a high real net output ratio and our power to innovate. Partnerships for development are instrumental in meeting our cus tomers’ specific requirements around special long steel. We see our-selves as a leader in innovation. Innovation that is born of development projects with our customers and our own ideas for products and processes.
Our customers value the individual solutions we offer
customers around the world rely on us to develop or co-develop products for and with them.
21

S+Bi AG Annual Report 2014
ON TRACK › Foundation: A competitive and competent team
We lead in all three product areas, supported by the following characteristics:
• Unique position thanks to our comprehensive product portfolio with high real net output ratio
• Strong innovative power across Business Units
• Extensive product know-how of operational managers plus experienced senior management
Unique product range
Unlike most of our competitors, s + bi serves customers along the entire supply
chain as a one-stop shop for all special steel solutions and services. This approach enables us to
meet the requirements of today’s modern production world, where the individual elements of the
supply chain need to be perfectly aligned. We also cover the three major sub-segments of the special
long steel market, which allows us to offer our customers a broad product spectrum. With highly
diverse products (20 000 to 30 000 products) and a wide range of processing options, the market as
a whole offers significantly greater potential for product differentiation than e.g. flat-rolled stainless
steel (five to ten times the number of products).
s + bi has made targeted investments in production facilities and processing
capacity. For instance, we invested EUR 50 million at our Witten (DE) plant to boost quality across
all product groups through the secondary metallurgic centre and the specially designed plant. Roller-
bearing steel, duplex and superduplex grades for offshore applications, premium gear steel and mould
steel are just some examples of the products that benefit. The investment is an important step in helping
s + bi meet customers’ growing and increasingly individual needs.
S + BI focuses on its core competence in tool, engineering and stainless steel.
DEW secondary metallurgic centre, Witten
Bottling plant for the food industry
left
22

S+Bi AG Annual Report 2014
We have invested over recent years to widen our product range in specific areas. For instance, when
Deutsche Edelstahlwerke expanded the business for special materials, the Business Unit gained a
new focus on abrasion and corrosion resistant alloys. As a highly specialised partner for demanding
sectors such as the automotive industry, we work with our customers to develop tailored high-tech
solutions. For example, we have specialised in the production of alloys for engine valves. The materi-
als used in this application must stand up to extreme temperatures and pressures as well as corrosive
exhaust gases. The automotive industry strives for zero error production, which can only be achieved
if the materials used offer the right level of precision.
Investments in the electroslag remelting (ESR) facilities at Ugitech are another example of how
our Group is increasingly specialising in certain areas. The high level of purity and the optimised steel
structure meet the exacting requirements for high-tech applications. This enables extremely specific
products to be created where purity is paramount – from aviation components to materials used in
surgical implants or plant production.
s + bi has secured a unique market position as an innovative producer of steel:
the result of its expertise in developing and producing a wide range of customised products.
Innovative power along the entire supply chain
At s + bi, there are many paths to innovation, and these are an important diffe-
rentiator – more so than ever in the highly competitive steel industry.
Partnerships for development are instrumental in meeting our customers’ individual needs. They lead
to innovation that helps our customers cement their position as a high-quality supplier and secure our
shared technical advantage. We always have our eye on the entire supply chain in order to not only
meet the market-specific production requirements but also the high demands around component
application.
Ugitech ESR facilities Cutaway model of a turbocharger
left
23

S+Bi AG Annual Report 2014
ON TRACK › Foundation: A competitive and competent team
Steeltec’s special steel HSX® 90 is a prime example of our Group’s innovative power. With a modular
materials concept, customers involved in development partnerships can design the material to meet
their exact individual requirements. Customers’ specific production and construction needs are trans-
lated one to one into highly customised materials specifications achieved by the high variance in
mechanical properties.
The UGIMA® family of stainless steel products is another example of how our Group innovates at our
subsidiary Ugitech. UGIMA® 4005 steel stands out for being extremely economical compared to the
standard 1.4005 steel. Users benefit from improved productivity of 30% to 50% without tool life being
affected. The new stainless steel is particularly well suited for components in the automotive and
process industries.
The new type, UGIMA® 4509, was especially designed for use in heat-exposed automotive compo-
nents. Resistant to intercrystalline corrosion, it remains stable even at high temperatures such as in
exhaust pipes. Through improved machinability, the cutting speed can be boosted by 40% in deep
drilling with rotations up to 10% faster. The amount of time saved is amplified as the volume of pro-
duced parts increases.
With its mould steel Corroplast® FM, Deutsche Edelstahlwerke (DEW) offers a special solution for
the packaging industry, e.g. in the area of PET products. Compared to traditional mould steel,
Corroplast® FM performs better in terms of machinability but offers the same resistance to corrosion
over long time periods. This material is well suited to precise measurement and durable tools, contri-
buting to long tool life and low-maintenance moulds. This products meets our customers’ demand
for economic series production of plastic components.
Process innovation is also a major driver of technical progress at s + bi and
often starts with our employees’ ideas. One of our steelworkers at Ugitech suggested a new dosage
method for alloying elements, which was implemented to enable more precise use of these high-cost
ingredients. We are keen to cultivate a corporate culture where employees compete to deliver the
best ideas to benefit all stakeholders.
Corroplast® FM in action
left
Steel bars UGIMA®
right
24

S+Bi AG Annual Report 2014
Highly competent team
Our highly competent and committed employees are the key to achieving a strong performance, our
dominant market position and our technology leadership. They are the pillars on which our Group
stands. That is why our employees’ health and safety is a top priority for us. In order to embed this
attitude throughout the Company, we have defined our own code of conduct that is mandatory for
everyone. Principles at the heart of this code are respect for human dignity, health and occupational
protection; responsible and ethical business dealings; and responsible, careful use of Company pro-
perty and scarce resources. They apply as central guidelines across country borders to every single
one of our employees as they go about their daily work and interact with one another. Strict imple-
mentation of our principles safeguards transparency and trust for our customers and business part-
ners and is an important way for us to promote our success, keep employees and the Company from
harm and make an important contribution to social and corporate development.
We support our employees continuously in their personal and professional development, starting with
daily support and encouragement by line managers and extending to training programmes and high
potential development schemes as well as succession planning when key personnel retire. We act
responsibly towards society by creating apprenticeship places and taking on trainees as permanent
employees once they have qualified. We also cultivate an open corporate culture where people can
discuss matters frankly and constructively across hierarchical levels. After all, we know that our
employees can only achieve their full potential if they are valued as people and if their suggestions are
taken seriously.
Our employees know the business like the back of their hand. Many of them have been working in
the steel industry for years or even decades. They are supported by our Executive Board, a manage-
ment team that has the strategic vision to lead s + bi into a successful future.
25

AUF DEM RICHTIGEN WEG › Fokus: Kernkompetenzen
S+Bi AG Annual Report 2014
We aim to generate sustainable profit as an innovative, global and diversified special steel group.
› Our product portfolio strategy is focused on high- quality products made of tool steel, stainless steel and engineering steel.
› We strive for further diversification, both geographi-cally and in terms of customer industries, by leveraging our Group-wide know-how and culture of knowledge transfer.
› It is our express wish to continue growing with our customers in the future, working with them to tap into new markets and develop innovative products.
› Our medium-term target is an adjusted EBITDA of more than EUR 300 million on average over an economic cycle.
› We have set our target for an adjusted EBITDA margin at > 8%.
› Our medium-term goals also include reducing our adjusted EBIDTA leverage to < 2.5.
S+Bi AG Annual Report 2014
26
S+Bi AG Annual Report 2014
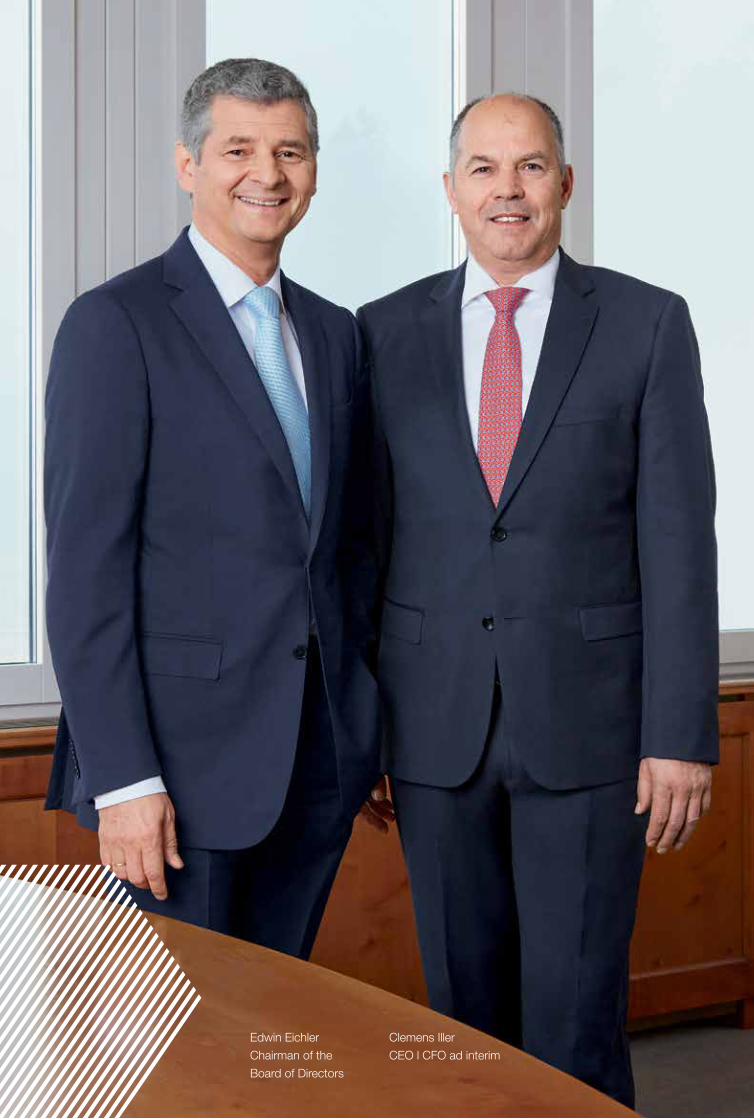
Edwin Eichler
Chairman of the
Board of Directors
Clemens Iller
CEO l CFO ad interim

S+Bi AG Annual Report 2014
Dear shareholders,
This time last year, I underlined our commitment to helping s + bi return to sustainable growth.
Today, I am pleased to report that the Board of Directors, supported by the Executive Board, has successfully pursued our
goals in 2014. We have largely completed the necessary process of restructuring the Group. The management holding
structure is a strong one and we are now in a position to grow together and leverage the synergies of a solid group. Earlier
in this report, we provide an example of how close cooperation with – and for – our customers is the order of the day.
For us, the last two years were about focusing on our organisational structure and improving processes and performance.
I can confirm that we are focusing on our core competence in the production of premium special long steel solutions,
supported by our strong Sales & Services organisation. Following this period of upheaval, it is time to take the next steps.
Technology leader with potential for innovation
The steel industry, including the special steel sector, is very competitive. That’s why it’s so important to focus on quality and
technological innovation as a way of safeguarding and building on our position as a leading steel producer and business
partner for our customers. We have our own laboratories at all production sites so that we can offer our customers the
exact solutions that they need for their exacting individual requirements. Beyond that, we are working independently on
answers to the questions of tomorrow at our designated research centres. At the beginning of this annual report, we invite
you to learn about some of the results that have come of our development activities.
Thanks to our shareholders, employees, customers and business partners
Our earnings improvement programme continued to bear fruit in 2014. For you as a shareholder, this means that we were
able to report steadily increasing earnings. Following the losses incurred in recent years, s + bi
has returned to profitability with a positive bottom line. Allow me to thank you on behalf of the entire Board of Directors for
your loyalty to our Company, even in difficult times. These results would not have been possible without our committed
employees, who make a huge contribution every day to helping s + bi take the next steps to
success. Thank you! Last but not least, our position is down to our customers and business partners. We look forward to
continuing these strong working relationships based on trust.
Edwin Eichler, Chairman of the Board of Directors
On track In the fiscal year 2014, we took some important steps forward on our path to a successful future. The Board of Directors actively supports the Executive Board in these endeavours.
FOREWORD OF THE CHAIRMAN OF THE BOARD AND THE CEO28
S+Bi AG Annual Report 2014
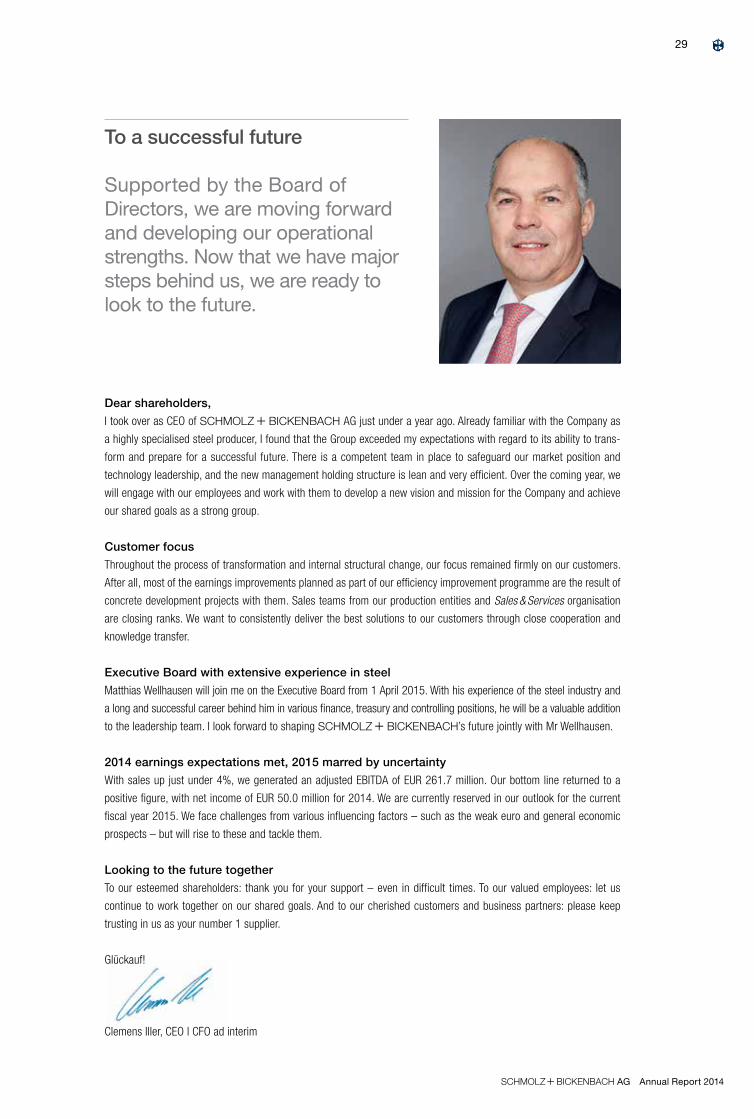
Dear shareholders,
I took over as CEO of s + bi AG just under a year ago. Already familiar with the Company as
a highly specialised steel producer, I found that the Group exceeded my expectations with regard to its ability to trans-
form and prepare for a successful future. There is a competent team in place to safeguard our market position and
technology leadership, and the new management holding structure is lean and very efficient. Over the coming year, we
will engage with our employees and work with them to develop a new vision and mission for the Company and achieve
our shared goals as a strong group.
Customer focus
Throughout the process of transformation and internal structural change, our focus remained firmly on our customers.
After all, most of the earnings improvements planned as part of our efficiency improvement programme are the result of
concrete development projects with them. Sales teams from our production entities and Sales & Services organisation
are closing ranks. We want to consistently deliver the best solutions to our customers through close cooperation and
knowledge transfer.
Executive Board with extensive experience in steel
Matthias Wellhausen will join me on the Executive Board from 1 April 2015. With his experience of the steel industry and
a long and successful career behind him in various finance, treasury and controlling positions, he will be a valuable addition
to the leadership team. I look forward to shaping s + bi’s future jointly with Mr Wellhausen.
2014 earnings expectations met, 2015 marred by uncertainty
With sales up just under 4%, we generated an adjusted EBITDA of EUR 261.7 million. Our bottom line returned to a
positive figure, with net income of EUR 50.0 million for 2014. We are currently reserved in our outlook for the current
fiscal year 2015. We face challenges from various influencing factors – such as the weak euro and general economic
prospects – but will rise to these and tackle them.
Looking to the future together
To our esteemed shareholders: thank you for your support – even in difficult times. To our valued employees: let us
continue to work together on our shared goals. And to our cherished customers and business partners: please keep
trusting in us as your number 1 supplier.
Glückauf!
Clemens Iller, CEO l CFO ad interim
To a successful future Supported by the Board of Directors, we are moving forward and developing our operational strengths. Now that we have major steps behind us, we are ready to look to the future.
29

Management report
Business environment
Capital market
Business development of the Group
Business development of the divisions
Financial position and net assets
Non-financial performance indicators
Opportunities and risks
Outlook
32
42
48
55
59
64
68
74
Man
agem
ent R
epor
t
BUSINESS ENVIRONMENT AND STRATEGY
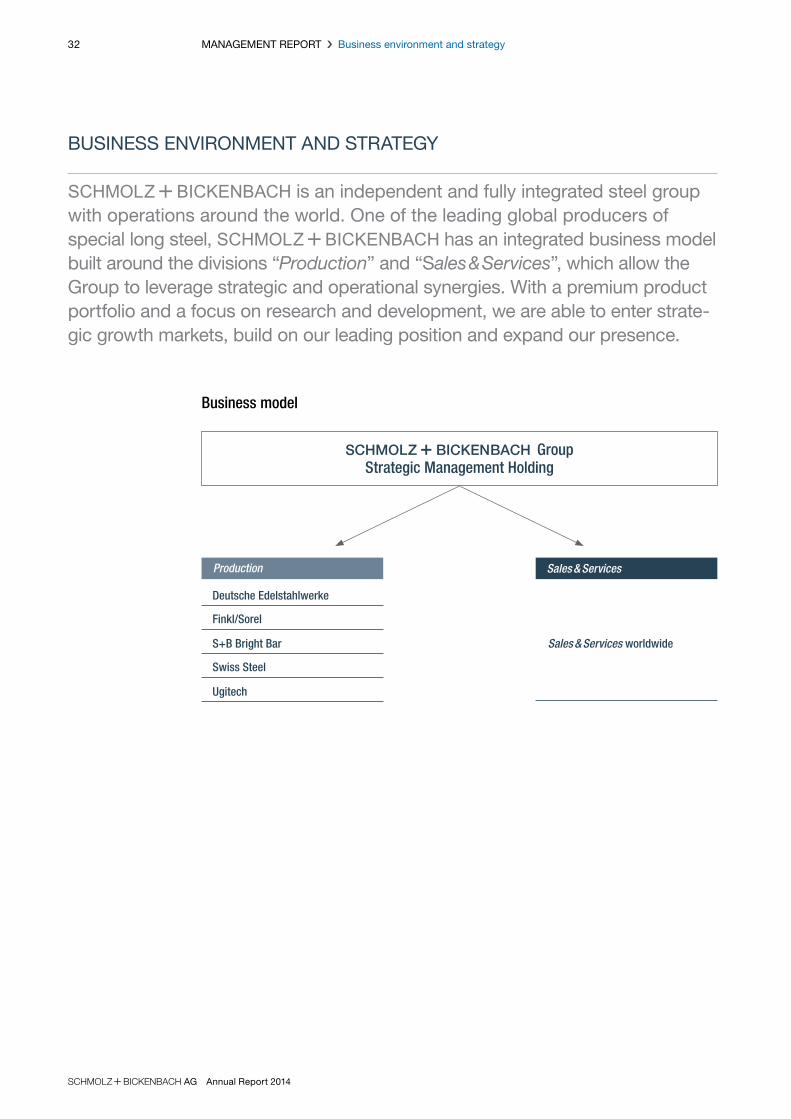
S + BI is an independent and fully integrated steel group with operations around the world. One of the leading global producers of special long steel, S + BI has an integrated business model built around the divisions “Production” and “Sales & Services”, which allow the Group to leverage strategic and operational synergies. With a premium product portfolio and a focus on research and development, we are able to enter strate-gic growth markets, build on our leading position and expand our presence.
Business model
S + Bi GroupStrategic Management Holding
Production Sales & Services
Deutsche Edelstahlwerke
Finkl/Sorel
S+B Bright Bar Sales & Services worldwide
Swiss Steel
Ugitech
32 MANAGEMENT REPORT Business environment and strategy
S+Bi AG Annual Report 2014

33
Our divisions
Production – specialised steelmaking, forging and rolling plants in Europe and North America; drawing
mills, bright steel production and heat treatment in northern and western Europa and Turkey
S + BI operates a total of nine production plants in Canada, France, Germany, Switzerland
and the USA. Of these, six have their own melting furnaces, while three operate without on-site melting facilities.
The steel plants complement each other in terms of formats and qualities, covering the entire spectrum for special
long steel. Besides the three main product groups – engineering steel, stainless steel and tool steel – the range
includes special steel products. The mills sell their products via Sales & Services or directly to external customers.
S + BI is represented in Denmark, France, Germany, Italy, Sweden, Switzerland and Turkey,
where it operates its own processing plants. These include bar- and wire-drawing mills, bright-steel production plants
and heat treatment facilities, where high-grade steel is processed to produce bespoke long steel products to the
customer’s exact specifications. Characteristics such as close dimensional tolerance, strength and surface quality
are precisely matched to the customer’s brief.
The Production Division encompasses the business units Deutsche Edelstahlwerke (DE), Finkl/Sorel (CA, US), S+B
Bright Bar (CH, DE, DK, SE, TR), Swiss Steel (CH) and Ugitech (DE, FR).
Sales & Services – a reliable global partner in steel consulting, processing and supply We combine our global sales activities within Sales & Services. The aim of this organisation is to offer our customers
global access to our products in the high quality they expect and when they need them.
With around 85 distribution and service branches in over 38 countries, the Sales & Services organisation guaran-
tees the consistent and reliable supply of special steel and end-to-end customer solutions. These include technical
consulting and downstream processes such as sawing, milling and hardening as well as supply chain management.
The product range is dominated by special steel long products from our own Production Division, supplemented by
a selection of products purchased externally from third-party providers.
We consciously and continuously extend our distribution network. As part of this expansion strategy, we have
opened a new location in the emerging Indian market and are planning to open new sites in the coming years.
S + BI’s integrated and complementary structure helps us realise important synergies across
the Group.
33MANAGEMENT REPORT Business environment and strategy
S+Bi AG Annual Report 2014
Our market
We operate in the niche market for special long steel, i.e. long steel with specific properties resulting from the chemical
composition of the steel, a defined crystalline structure (achieved through heat treatment), or a combination of the two.
The special long steel niche market accounts for around 7% of total steel production worldwide. It differs significantly in
a number of respects from the rest of the steel market, which tends to have standard grades and flat products. Special
long steel can be tailored to customers’ exact needs and specific application properties, enabling considerable product
differentiation. The production of tailored products calls for extensive know-how in the individual application industries.
We often work closely with our customers at the development stage, which results in a high degree of loyalty to us as
a supplier. Substitution pressure is less severe than for other materials as special steel solutions combine a number of
properties for a given application. Megatrends such as population growth, urbanisation and increased mobility go hand
in hand with a shortage of resources. This development is forcing more sustainable behaviour, which will in turn drive
demand for special steel solutions in terms of both volume and value.
Our special long steel is produced from scrap with the addition of alloys. Prices are determined using base prices
plus an industry-standard surcharge system for scrap and alloys. This system enables commodity price fluctuations
to be passed on to customers without the need for renegotiation. Compared to conventional steel, special long steel is
therefore considerably less exposed to the volatility of commodity prices.
http://www1.schmolz-bickenbach.
com/en/group/group-structure//
34 MANAGEMENT REPORT Business environment and strategy
S+Bi AG Annual Report 2014

Our customised solutions
Each of our special steel long products fulfils specific requirements. Besides production itself, customised service also
means guaranteeing the global and punctual availability of our products in uniform quality.
Engineering steel – special materials for extreme loads
Engineering steel is used in a multitude of applications. However, it is especially called for in applications with high
mechanical loads and when components need to be both reliable and durable. Examples include drive, engine
and chassis components for the automotive industry, turbine parts for power generation and gear components for
wind energy systems. S + BI has a leading position in this area. Adapted to the respective
applications, materials range from comparatively simple case-hardened or heat-treated steel to micro-alloyed or
nitrided steel as well as roller bearing steel, which is characterised by extreme hardness and purity. In addition
to high strength, engineering steel must possess outstanding machining qualities to enable efficient automated
processing such as turning and milling. Our special steel developments enable us to reduce lifecycle costs, among
other things, by improving working properties and durability, for example. For instance, our ETG® special steel
eliminates the need for costly additional operations such as hardening and straightening. The result is an inexpensive
material – despite its premium properties.
Stainless steel – resistant to corrosion, acids and heat
Stainless steel is resistant to corrosion, acids and extreme thermal stresses. It is strong but ductile. These charac-
teristics, paired with aesthetic design options, make stainless long steel an attractive material for many specialised
applications. Key application areas include the automotive, mechanical engineering, food and chemical industries
as well as medical engineering, the oil and gas industry and aviation. In this segment, S + BI
possesses proven expertise in the manufacture of austenitic, ferritic and martensitic grades and special steel qual-
ities (for example duplex grades or bars with non-magnetic properties) in various shapes and with dimensions from
0.013 mm (ultrafine wire) to 250 mm (bar).
Tool steel – technical application consulting as the key to success
S + BI leads the global market for tool steel, with many years of extensive know-how in cus-
tomers’ specific application areas. It is this expertise that enables us to advise customers on the technical aspects
of their products. We work closely with them to find the best special steel solutions for their individual requirements.
Our expertise extends across the tool steel spectrum: cold work steel, hot work steel, plastic mould steel and high
speed steel. In an integrated process along the entire manufacturing chain, material properties can be matched to
specific customer requirements, including production, pre-processing and refinement with heat and surface treat-
ments. In the area of plastic mould steel, we offer processing until close to the final mould using state-of-the-art
CNC (Computerised Numerical Control) machines. Countless customers worldwide appreciate the comprehensive
service that we offer under one roof and reward us with their loyalty.
35MANAGEMENT REPORT Business environment and strategy
S+Bi AG Annual Report 2014
Strategy and corporate management
Our long-term goal is to create a robust, profitable, innovative and global group for special long steel. Our strategy,
geared towards sustainable earnings growth, dictates the tactical moves in our corporate development, including
realising the market and structural synergy potential of an integrated group.
Thanks to a successful buy-and-build investment strategy launched back in 2003, S + BI has
developed into a fully integrated supplier of special long steel and is today a global leader. Our core competence – and
the focus of our corporate strategy – is production. Committed to this alignment, we will strengthen and expand on
our leading position in the key markets for engineering steel, stainless steel and tool steel.
S + BI has a broad product range covering the entire application spectrum of special long
steel. This puts us in a unique position as a dependable and quality-conscious partner for our global customers
operating in a variety of industries. Sectors we serve include automotive manufacturing and components supply,
mechanical engineering, power and mining, chemical and food industries, medical engineering and aerospace. Some
of these industries are subject to diverging economic cycles, which helps even out fluctuating demand in individual
sectors and keep demand for our products and services stable overall.
With two divisions, “Production” and “Sales & Services”, the Group operates along the entire supply chain. This inte-
grated structure and management facilitates the release of synergies, particularly in the areas of sales, procurement,
market and product segmentation, R&D and technical knowledge transfer.
S + BI is clearly positioned in the market for high-grade special long steel – a considerable
advantage in terms of competition and differentiation:
> As a fully integrated and leading global supplier for the entire special long steel products range
> Excellent potential for differentiation in products and customised solutions
> Strong customer loyalty through technical application consulting, high quality of service as well as operating and
functional reliability
> Low substitution pressure, since often only special long steel can embody all of the required properties
> Technological expertise and many years of management experience
These qualities secure our leading position in the three main product segments – engineering steel, stainless steel
and tool steel.
36 MANAGEMENT REPORT Business environment and strategy
S+Bi AG Annual Report 2014

In 2013, the Executive Board launched an extensive programme across all business units to boost growth and earn-
ings and improve operational earning power and the capital structure in a sustainable manner. This is expected to
increase the operating profit (EBITDA) by around EUR 230 million in the medium term (based on the 2012 earnings
level). Just over EUR 100 million of this relates to cost-cutting and efficiency measures alone. The earnings contri-
bution from the growth and earnings improvement programme met the budgeted target in 2014, demonstrating the
considerable impact of this initiative on the positive development of key financial performance indicators within the
S + BI Group.
Strategic growth potential
We strive to extend our leading position in our core business and have identified key potential to do so as follows:
> Enhance and optimise the product portfolio continuously (focusing on technical products) and expand sales
activities by strengthening our international sales network
> Continue to deepen know-how in key application industries and expand operations in new application areas as a
way to strengthen customer loyalty and safeguard our position as technology leader
> Strengthen our innovative capacity through internal measures and targeted collaboration with customers and
other external partners such as universities and trade associations
> Position and strengthen S + BI as an attractive brand in the sales, capital and employment
markets
> Exploit synergies and complementary strengths within the Group to the fullest extent
> Take M&A opportunities as they arise with a focus on growth regions and consolidation opportunities
Management KPIs
In keeping with our sustainable strategic alignment, our corporate management focuses on key performance indi-
cators that include:
> Absolute EBITDA contribution
> EBITDA margin
> Equity ratio
> Adjusted EBITDA leverage (ratio of net debt to adjusted EBITDA)
> ROCE
37MANAGEMENT REPORT Business environment and strategy
S+Bi AG Annual Report 2014

Development of markets and industries
General economic conditions
The global economy has been relatively robust in general given the economic uncertainty and political conflicts pre-
vailing at present, developing positively overall in the reporting period and once again generating growth, as in 2013,
of 3.3%. The economic development of different regions is levelling out – while growth in emerging markets is slowing
down slightly, the recovery in developed markets is becoming more stable.
In particular, S + BI’s core markets in Asia, Europe and the USA exhibited stable GDP devel-
opment in 2014. For us, this is confirmation that our regional structure and global positioning are essentially the right
approach.
Eurozone growth slight but sound, USA enjoys considerable growth – uncertainties remain
The sales markets in the industrialised nations of particular economic relevance for S + BI
were stable in 2014, enjoying positive development overall with GDP growth of 1.8%.
Following a period of recession and stagnation, the eurozone saw GDP return to growth of 0.8%. In particular, the
major eurozone economies – apart from Italy (– 0.4%) – recorded strong economic growth: Germany + 1.6%, France
+ 0.4% and Spain + 1.3%. Low inflation in the eurozone overall and high unemployment in certain countries underline
ongoing economic uncertainty, however.
Economic output in the USA increased steadily by 2.4%. The American economy was fuelled primarily by the fracking
and exploration boom in the USA. In addition, the effects of falling unemployment made themselves felt in increased
private consumption at year-end, pointing to the sustainability of this development.
Developing and emerging economies hold on to solid growth
Positive global economic growth was once again primarily driven by the developing and emerging economies in 2014.
Their GDP growth has been slowing steadily since 2010 but was nevertheless still 4.4% in 2014.
Development in the BRIC countries was varied: China’s economy stabilised at 7.4%, the prior-year level. India managed
to turn around the sliding growth trend of recent years, increasing GDP by 5.8% in 2014. Russia managed to generate
positive economic growth of 0.6% despite the oil price development and sanctions from the West. Suffering the effects
of its high budget deficit, among other things, Brazil only managed growth of 0.1%.
GDP DEVELOPMENT OF SELECTED MARKETS | 2013/2014
in %
DE FR IT ES US CA CN BR IN RU
2013 2014
2.50.1
2.02.4
7.77.4
0.41.6 0.2
0.4
4.75.8
1.30.6
2.22.4
– 1.9– 0.4
1.3
– 1.2
38 MANAGEMENT REPORT Business environment and strategy
S+Bi AG Annual Report 2014

Development of steel demand
Global demand for steel was up 2.0% in the reporting period, a renewed positive but modest development compared
to growth of 3.8% in 2013.
The niche market for special long steel – relevant for S + BI – accounts for around 7% of the
total market. In our segments, tool steel, engineering steel and stainless steel, it outperformed the overall market
level of 2%.
Steel industry enjoys further recovery on sales markets, but differences are considerable
In 2014, global demand for steel increased in a challenging market by 2.0% to 1 562 million tonnes. At 748 million
tonnes, demand in China was once again the highest by some margin.
Looking at the regions, strong dependency on the overall economic development of individual countries and a
reversal of the 2013 situation emerge as major trends. Demand in Asia/Oceania was up by a considerable 4.9% in
2013, but grew just 1.7% in 2014. The EU and North America – where growth almost stagnated or even fell in 2013
(+ 0.8% and – 2.4%, respectively) – performed visibly well at +4.0% and +6.4%. In the CIS countries and Central/
South America, demand actually fell by 3.8% and 2.4%, respectively, in 2014 (2013: + 2.8% and + 4.2%).
Industry sectors
Our customers’ industries also look back on a successful year 2014. S + BI’s core sec-
tors exhibited robust development in 2014, although considerable regional differences were apparent. Driven
by the fracking and exploration boom, the American oil and gas industry enjoyed a particularly successful fiscal
year, which stabilised in the second half. The automotive sector saw strong growth in the largest markets: China,
Europe and the USA. Growth rates on the mechanical and plant engineering market were low, especially in Europe.
S + BI’s business development reflected the trends in these core markets.
Energy: oil and gas boom in the USA has far-reaching effects
The oil and gas industry was extremely lively in 2014, especially in the American market, where the fracking boom
continued. The number of active US oil rigs was high, exceeding 1 900 at certain points during the year and up 0.6%
over the year as a whole. Partly driven by higher capacity, the oil price, which had been relatively stable at USD 114/
barrel of Brent crude in June 2014, slid to less than USD 60/barrel of Brent crude in December 2014.
The year 2014 was also a successful one in the oil and gas industry for the S + BI Group.
Our American and European Business Units sell products for use in the exploration and production of oil production
plants. Such products were in high demand, so we benefited from the booming North American market.
Automotive sector: strong growth in demand in the largest markets China, the EU and North America
The automotive sector saw global growth of 3% in 2014, with sales of almost 86 million vehicles. This positive
development was fuelled by the two largest sales markets: China (+ 9%) and North America (+ 5%) (source: IHS).
Within the EU, new vehicle registrations were up significantly (+ 5%).
Vehicle production was also up 3%, with positive development across the board in the major producing regions and
countries (China, Europe, North America, Japan/South Korea).
39MANAGEMENT REPORT Business environment and strategy
S+Bi AG Annual Report 2014

Mechanical and plant engineering: slight upturn following tough 2013
Following a weak performance in the prior year (– 3.8%), the European mechanical and plant engineering market
recovered slightly (+ 1.2%). The economic development was particularly modest in the sector for heavy machine
construction. Overall, however, the economic situation appeared to be picking up slightly.
Commodity prices – mixed development with high volatility at times
Prices for the key commodities needed by S + BI – mainly nickel and molybdenum – were
characterised by high volatility. Scrap prices also seesawed throughout the year, while ferrochrome was less volatile.
As the most important industrial metal and an essential component in corrosion protection, nickel is crucial for special
steel production from both an economic and technical perspective. The price development for nickel was particularly
volatile in 2014, starting the year at a spot price of USD 13 905/tonne and then increasing to USD 21 200/tonne by
March. The price fluctuated for the rest of the year, settling at USD 14 855/tonne at year-end – up 6% on the level
seen in January. Key factors contributing to these lively market movements include the nickel export ban in Indonesia
and speculation that the Chinese were buying up nickel-containing pig iron.
The story was similar for molybdenum. At the beginning of January, the price stood at USD 21 000/tonne but had
climbed more than 50% by early June (USD 32 500/tonne) before plummeting to below the January level in December
(USD 20 500/tonne).
The scrap price opened the year at EUR 288/tonne and stayed at around that level for most of the year. At year-end
it fell to EUR 255/tonne (– 11%), giving an annual average of EUR 265/tonne and a decrease of around EUR 20/
tonne on the average for 2013.
Ferrochrome prices also fell in 2014, dropping a good 3.5% and then stabilising in a narrow corridor of
USD 1 797/tonne to USD 1 874/tonne.
Jan. Feb. March April May June July Aug. Sept. Oct. Nov. Dec.10
12
14
16
18
20
22
Development of the nickel price 2014
in 1 000 USD/tonne
40 MANAGEMENT REPORT Business environment and strategy
S+Bi AG Annual Report 2014
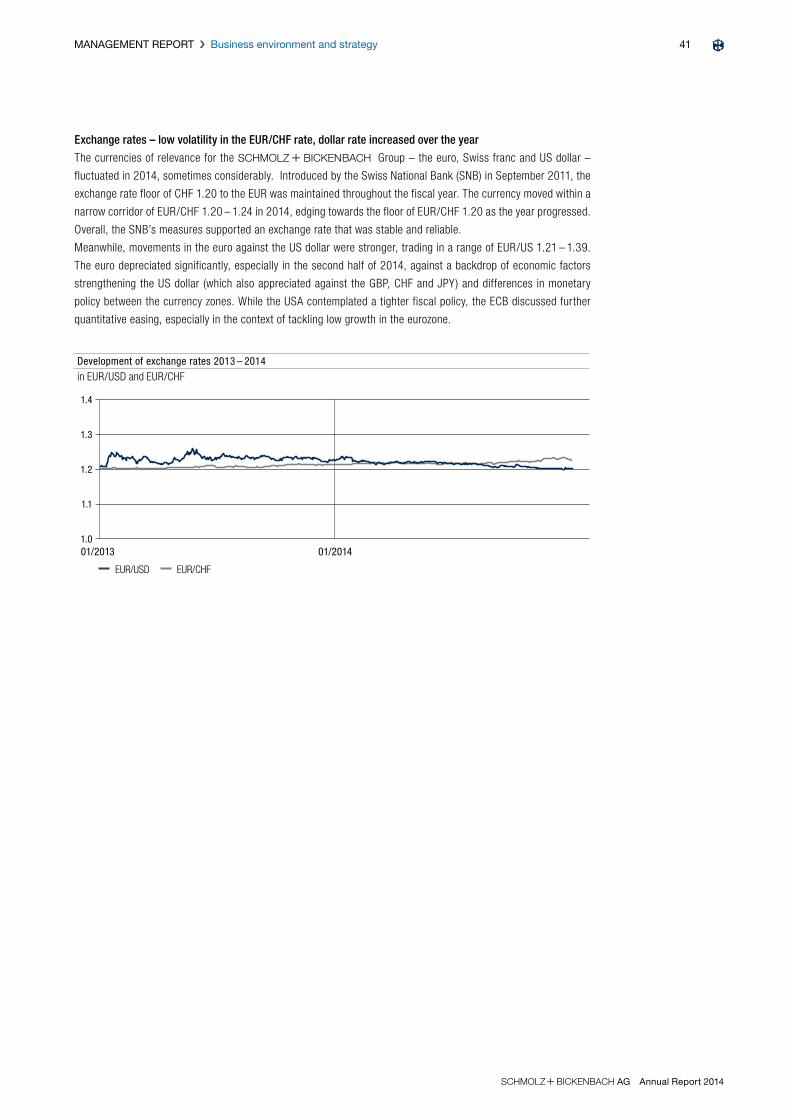
Exchange rates – low volatility in the EUR/CHF rate, dollar rate increased over the year
The currencies of relevance for the S + BI Group – the euro, Swiss franc and US dollar –
fluctuated in 2014, sometimes considerably. Introduced by the Swiss National Bank (SNB) in September 2011, the
exchange rate floor of CHF 1.20 to the EUR was maintained throughout the fiscal year. The currency moved within a
narrow corridor of EUR/CHF 1.20 – 1.24 in 2014, edging towards the floor of EUR/CHF 1.20 as the year progressed.
Overall, the SNB’s measures supported an exchange rate that was stable and reliable.
Meanwhile, movements in the euro against the US dollar were stronger, trading in a range of EUR/US 1.21 – 1.39.
The euro depreciated significantly, especially in the second half of 2014, against a backdrop of economic factors
strengthening the US dollar (which also appreciated against the GBP, CHF and JPY) and differences in monetary
policy between the currency zones. While the USA contemplated a tighter fiscal policy, the ECB discussed further
quantitative easing, especially in the context of tackling low growth in the eurozone.
01/2013 01/20141.0
1.1
1.2
1.3
1.4
Development of exchange rates 2013 – 2014
in EUR/USD and EUR/CHF
EUR/USD EUR/CHF
41MANAGEMENT REPORT Business environment and strategy
S+Bi AG Annual Report 2014

S + bi share price development in 2014
It was a roller coaster of a year for market participants. Indices in Europe reached record highs. The market environment
was favourable, especially in Europe, thanks to ongoing commitment to expansionary fiscal policies, buoyed by the
sustained recovery of the US economy. At the same time, important support lines were breached in the course of the
year. Geopolitical risks such as the Ukraine crisis or the conflict in Syria and Iraq had a particularly negative impact.
This was compounded by signs of economic slowdown in China and other countries.
Following a turbulent 2013, S + BI entered calmer waters in 2014. The new CEO took up
his post in April, and the capital market rewarded the steady earnings progress each quarter. Improved ratings by
Standard & Poor’s and Moody’s was taken by the market as endorsement of the new strategic direction. The share
price suffered, however, following announcements in December 2014 that the CFO was to step down at the end of
February 2015 and that sales negotiations for certain distribution entities had been suspended.
The S + BI share closed the first quarter with a price increase of 8.8%, increasing by a further
11.8% in the second quarter. Achieving an annual high of CHF 1.50 in the second quarter, the share price increased
by 32.7% at its peak. The upward trend was not sustainable in the second half of the year, however, with the price
slipping 13.4% in the third quarter followed by another 10.0% in the fourth. Overall, the share price closed the year
2014 with a loss of 4.4%.
Highly volatile share prices were also apparent in the comparative indices. The SPI, which includes the
S + BI share, saw growth of 12.1% in the same period, while the STOXX Europe 600 was up
4.1%. At year-end, the SPI was up 14.5% on the annual low and down 2.3% on the annual high, while the STOXX
Europe 600 saw prices settle at 2.8% below the annual peak – an increase of 10.0% at year-end on the lowest figure
recorded that year. With an average daily trading volume of 3.2 million S + BI shares in 2014,
the share was once again more liquid than in the previous year, which had an average daily volume of 2.8 million shares.
CAPITAL MARKET
The S + BI share is listed on the SIX Swiss Exchange in accordance with the Main Standard and traded daily on a liquid market. Reputable banks and other financial institutions regularly observe and analyse the Company’s development.
Jan. Feb. March April May June July Aug. Sept. Oct. Nov. Dec.80
100
120
140
Development of share price 1.1.2014 until 31.12.2014 | S + Bi share compared to Swiss Performance Index (indexed) and to STOXX® Europe 600 (indexed)
S + Bi SPI STOXX® Europe 600
42 MANAGEMENT REPORT Capital market
S+Bi AG Annual Report 2014

Key share figures Unit 2010 2011 2012 2013 2014
Share capital million CHF 367.5 413.4 413.4 472.5 472.5
Number of registered shares shares 105 000 000 118 125 000 118 125 000 945 000 000 945 000 000
Market capitalisation, year-end million CHF 933 633 338 1 040 1 021
Share price as at closing date CHF 9.46 5.36 2.86 1.10 1.08
Share price, highest CHF 16.63 12.00 7.80 1.34 1.51
Share price, lowest CHF 6.62 4.81 2.28 0.58 1.00
Dividend per share CHF 0.00 0.10 0.00 0.00 0.00
Total dividend million CHF 0.0 11.8 0.0 0.0 0.0
Earnings per share EUR/CHF 0.63 / 0.87 0.33/0.41 -1.38/-1.66 -0.26/-0.32 0.05/0.06
Shareholders' equity per share EUR/CHF 6.78 / 8.48 7.10/8.62 5.29/6.35 0.93/1.14 0.94/1.13
http://www1.schmolz-bickenbach.
com/en/investor-relations/share/
share-price-and-chart/
Capital decrease with simulta-
neous increase in 2013; see
“Corporate Governance”, p. 81
Facts and figures on the share
ISIN CH0005795668Securities number 579566Ticker symbol STLNBloomberg STLN SEReuters STLN.SType of security Registered shareTrading currency CHFListed on SIX Swiss ExchangeIndices SPI, SPI Extra, SPI ex SLI, Swiss All Share IndexNumber of shares outstanding 945 000 000Nominal value in CHF 0.50
2010 2011 2012 2013 20140
20
40
60
80
100
120
140
160
180
Development of share price 2010 until 2014 | S + Bi share compared to Swiss Performance Index (indexed) and to STOXX® Europe 600 (indexed)
S + Bi SPI STOXX® Europe 600
43MANAGEMENT REPORT Capital market
S+Bi AG Annual Report 2014
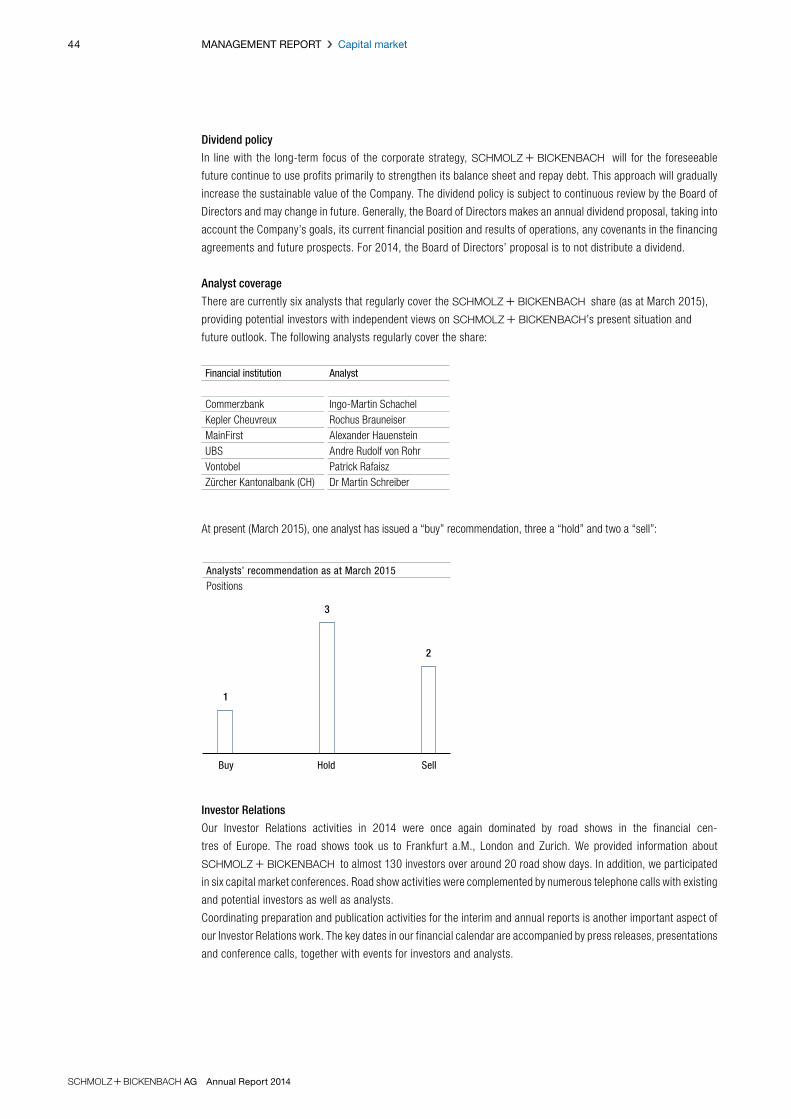
Dividend policy
In line with the long-term focus of the corporate strategy, S + BI will for the foreseeable
future continue to use profits primarily to strengthen its balance sheet and repay debt. This approach will gradually
increase the sustainable value of the Company. The dividend policy is subject to continuous review by the Board of
Directors and may change in future. Generally, the Board of Directors makes an annual dividend proposal, taking into
account the Company’s goals, its current financial position and results of operations, any covenants in the financing
agreements and future prospects. For 2014, the Board of Directors’ proposal is to not distribute a dividend.
Analyst coverage
There are currently six analysts that regularly cover the S + BI share (as at March 2015),
providing potential investors with independent views on S + BI’s present situation and
future outlook. The following analysts regularly cover the share:
Financial institution Analyst
Commerzbank Ingo-Martin SchachelKepler Cheuvreux Rochus BrauneiserMainFirst Alexander HauensteinUBS Andre Rudolf von RohrVontobel Patrick RafaiszZurcher Kantonalbank (CH) Dr Martin Schreiber
At present (March 2015), one analyst has issued a “buy” recommendation, three a “hold” and two a “sell”:
Investor Relations
Our Investor Relations activities in 2014 were once again dominated by road shows in the financial cen-
tres of Europe. The road shows took us to Frankfurt a.M., London and Zurich. We provided information about
S + BI to almost 130 investors over around 20 road show days. In addition, we participated
in six capital market conferences. Road show activities were complemented by numerous telephone calls with existing
and potential investors as well as analysts.
Coordinating preparation and publication activities for the interim and annual reports is another important aspect of
our Investor Relations work. The key dates in our financial calendar are accompanied by press releases, presentations
and conference calls, together with events for investors and analysts.
Analysts’ recommendation as at March 2015
Positions
1
3
2
Buy Hold Sell
44 MANAGEMENT REPORT Capital market
S+Bi AG Annual Report 2014
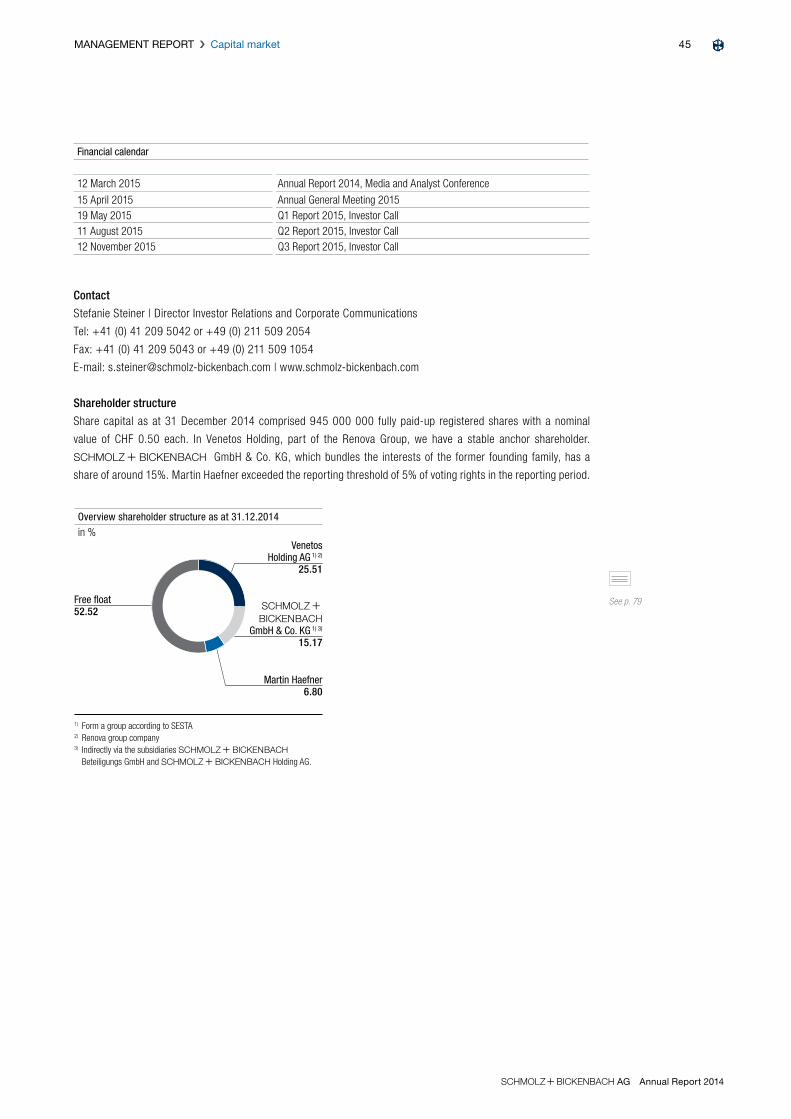
Financial calendar
12 March 2015 Annual Report 2014, Media and Analyst Conference
15 April 2015 Annual General Meeting 201519 May 2015 Q1 Report 2015, Investor Call11 August 2015 Q2 Report 2015, Investor Call12 November 2015 Q3 Report 2015, Investor Call
Contact
Stefanie Steiner | Director Investor Relations and Corporate Communications
Tel: +41 (0) 41 209 5042 or +49 (0) 211 509 2054
Fax: +41 (0) 41 209 5043 or +49 (0) 211 509 1054
E-mail: [email protected] | www.schmolz-bickenbach.com
Shareholder structure
Share capital as at 31 December 2014 comprised 945 000 000 fully paid-up registered shares with a nominal
value of CHF 0.50 each. In Venetos Holding, part of the Renova Group, we have a stable anchor shareholder.
S + BI GmbH & Co. KG, which bundles the interests of the former founding family, has a
share of around 15%. Martin Haefner exceeded the reporting threshold of 5% of voting rights in the reporting period.
See p. 79
Overview shareholder structure as at 31.12.2014
in %Venetos
Holding AG 1) 2)
25.51
S +
Bi GmbH & Co. KG 1) 3)
15.17
Martin Haefner 6.80
Free float 52.52
1) Form a group according to SESTA2) Renova group company3) Indirectly via the subsidiaries S + Bi
Beteiligungs GmbH and S + Bi Holding AG.
45MANAGEMENT REPORT Capital market
S+Bi AG Annual Report 2014
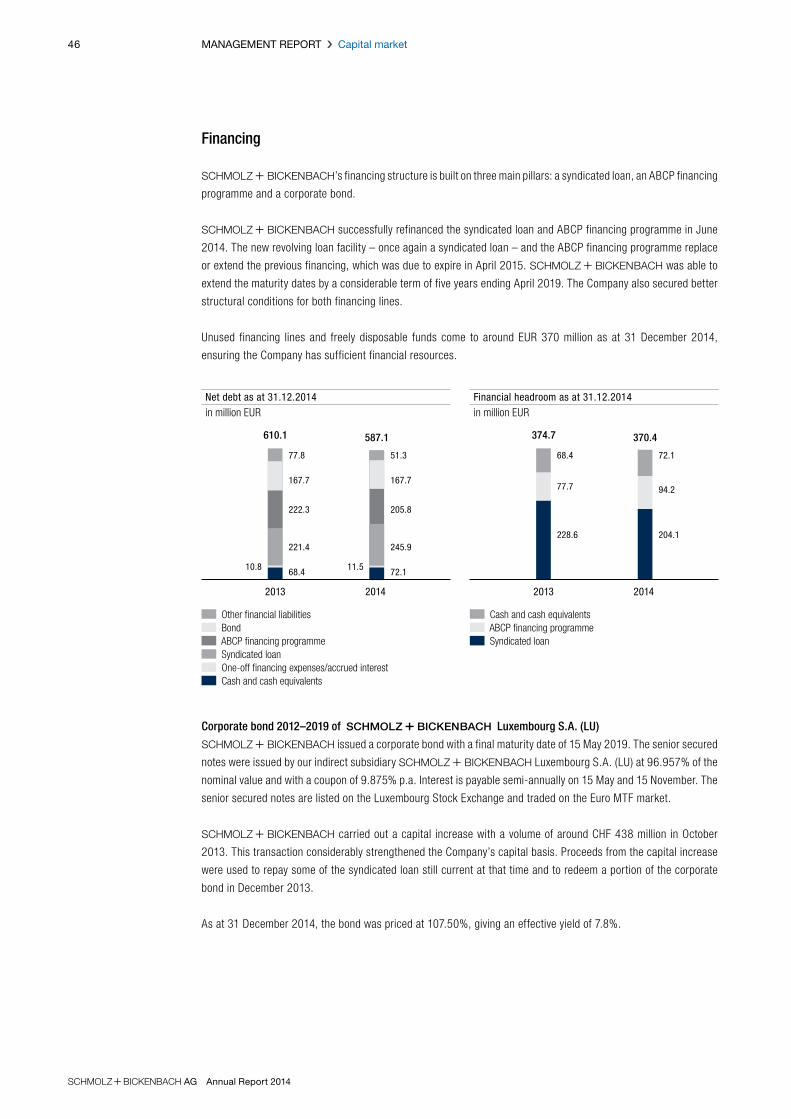
Financing
S + BI’s financing structure is built on three main pillars: a syndicated loan, an ABCP financing
programme and a corporate bond.
S + BI successfully refinanced the syndicated loan and ABCP financing programme in June
2014. The new revolving loan facility – once again a syndicated loan – and the ABCP financing programme replace
or extend the previous financing, which was due to expire in April 2015. S + BI was able to
extend the maturity dates by a considerable term of five years ending April 2019. The Company also secured better
structural conditions for both financing lines.
Unused financing lines and freely disposable funds come to around EUR 370 million as at 31 December 2014,
ensuring the Company has sufficient financial resources.
Corporate bond 2012–2019 of S + Bi Luxembourg S.A. (LU)
S + BI issued a corporate bond with a final maturity date of 15 May 2019. The senior secured
notes were issued by our indirect subsidiary S + BI Luxembourg S.A. (LU) at 96.957% of the
nominal value and with a coupon of 9.875% p.a. Interest is payable semi-annually on 15 May and 15 November. The
senior secured notes are listed on the Luxembourg Stock Exchange and traded on the Euro MTF market.
S + BI carried out a capital increase with a volume of around CHF 438 million in October
2013. This transaction considerably strengthened the Company’s capital basis. Proceeds from the capital increase
were used to repay some of the syndicated loan still current at that time and to redeem a portion of the corporate
bond in December 2013.
As at 31 December 2014, the bond was priced at 107.50%, giving an effective yield of 7.8%.
Net debt as at 31.12.2014
in million EURFinancial headroom as at 31.12.2014
in million EUR
610.1 374.7587.1 370.4
2013 20132014 2014
Other financial liabilities Bond ABCP financing programme Syndicated loan One-off financing expenses/accrued interest Cash and cash equivalents
Cash and cash equivalents ABCP financing programme Syndicated loan
77.8 68.4 72.151.3
167.777.7 94.2
167.7
222.3 205.8
221.4228.6 204.1
245.9
10.8 11.568.4 72.1
46 MANAGEMENT REPORT Capital market
S+Bi AG Annual Report 2014
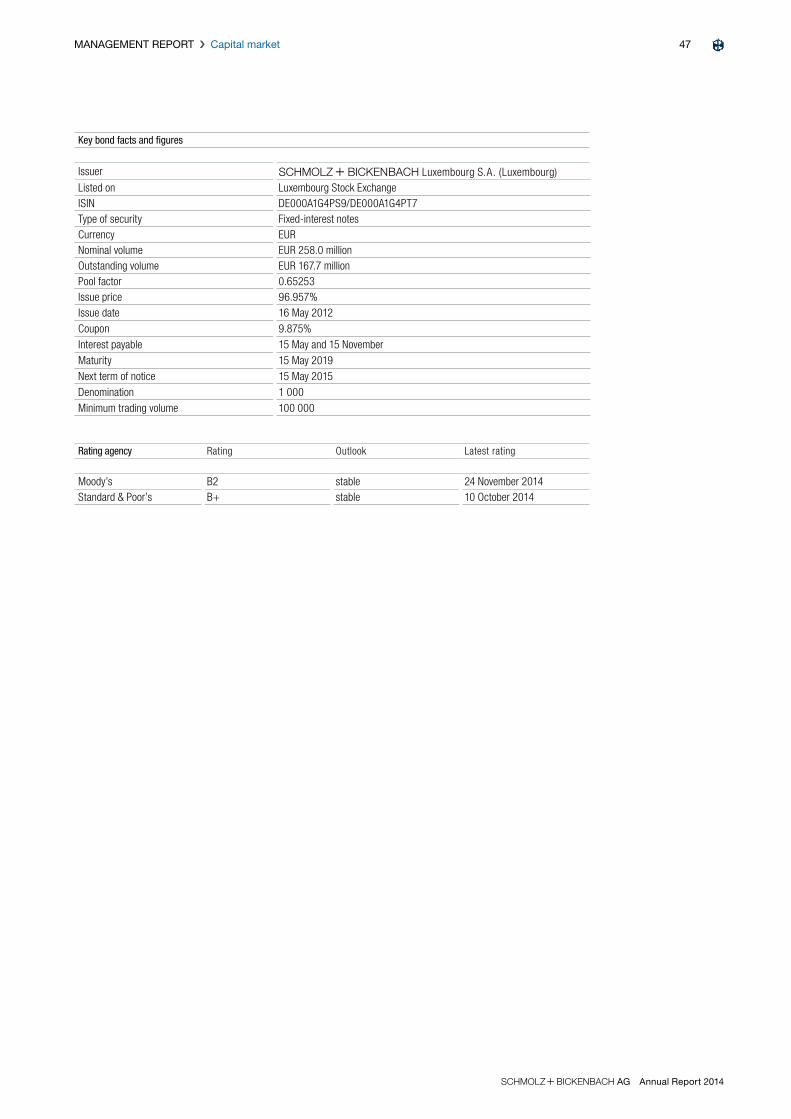
Key bond facts and figures
Issuer S + BI Luxembourg S.A. (Luxembourg)Listed on Luxembourg Stock ExchangeISIN DE000A1G4PS9/DE000A1G4PT7Type of security Fixed-interest notesCurrency EURNominal volume EUR 258.0 millionOutstanding volume EUR 167.7 millionPool factor 0.65253Issue price 96.957%Issue date 16 May 2012Coupon 9.875%Interest payable 15 May and 15 NovemberMaturity 15 May 2019Next term of notice 15 May 2015Denomination 1 000 Minimum trading volume 100 000
Rating agency Rating Outlook Latest rating
Moody’s B2 stable 24 November 2014Standard & Poor’s B+ stable 10 October 2014
47MANAGEMENT REPORT Capital market
S+Bi AG Annual Report 2014

Key figures on results of operations 2014 2013Change on
prior year % Q4 2014 Q4 2013Change on
prior year %in million EUR
Sales volume (kilotonnes) 2 135 2 054 3.9 488 491 – 0.6
Revenue 3 338.4 3 276.7 1.9 785.3 752.0 4.4
Adjusted EBITDA 261.7 178.8 46.4 62.3 43.0 44.9
Operating profit before depreciation and amortisation (EBITDA) 252.6 141.7 78.3 59.2 15.1 > 100
Adjusted EBITDA margin (%) 7.8 5.5 41.8 7.9 5.7 38.6
EBITDA margin (%) 7.6 4.3 76.7 7.5 2.0 > 100
Operating profit (loss) (EBIT) 130.6 17.8 > 100 28.9 – 16.1 > 100
Earnings before taxes (EBT) 79.7 – 87.6 > 100 11.4 – 48.5 > 100
Net income (loss) (EAT) 50.0 – 83.7 > 100 4.2 – 39.2 > 100
BUSINESS DEVELOPMENT OF THE GROUP
The Group successfully increased both sales volume and revenue in 2014. The effects of our earnings improvement programme are plain to see: earn-ings figures were up substantially in the reporting period and we returned to a positive bottom line for the first time since 2011.
General economic situation
Business development in 2014 continued to be influenced by base prices, which had stabilised but nevertheless
remained below the prior-year level. While revenue in Europe stagnated, a significant increase was seen in North
America and the rest of the world. Net income was clearly positive at EUR 50.0 million – an improvement of
EUR 133.7 million on the prior year – and reflects the success of our earnings improvement programme as well as
better financing conditions.
Order backlog Q4 2013 – Q4 2014
in kt
452
571539
498 497
31.12.13 31.3.14 30.6.14 30.9.14 31.12.14
Order backlog 2010 – 2014
in kt
619
521
351
452
2010 2011 2012 2013 2014
497
48 MANAGEMENT REPORT Business development of the Group
S+Bi AG Annual Report 2014
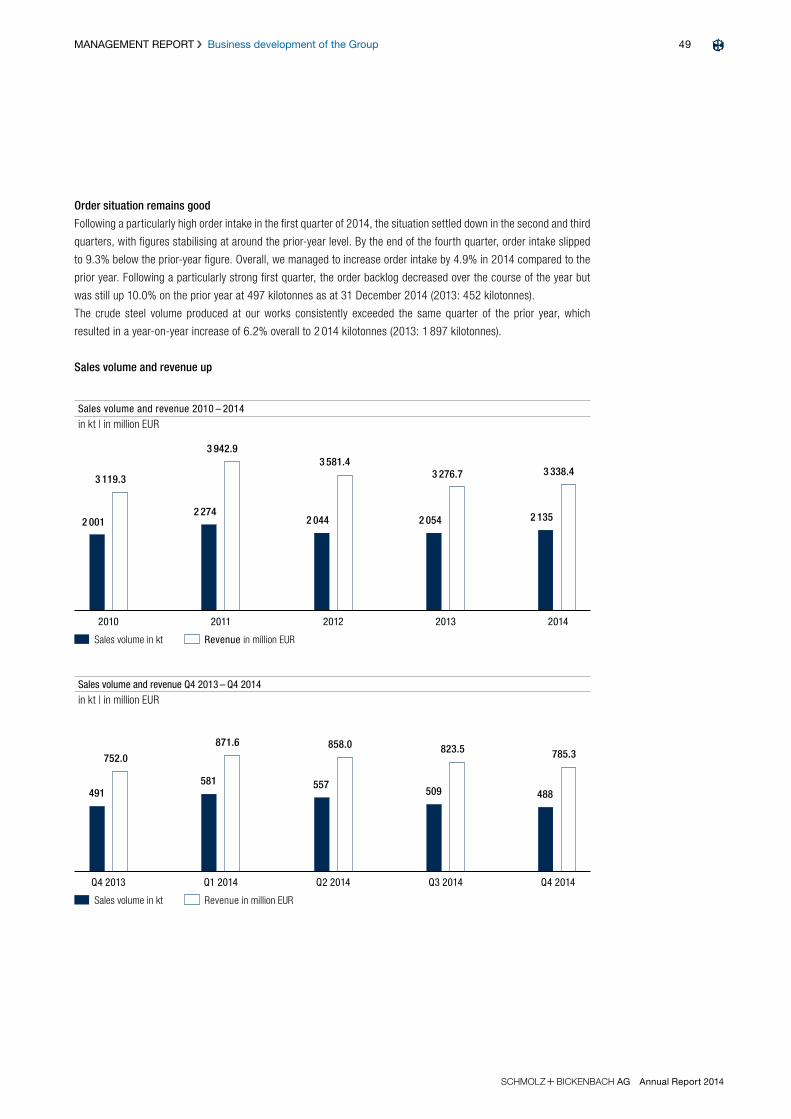
Order situation remains good
Following a particularly high order intake in the first quarter of 2014, the situation settled down in the second and third
quarters, with figures stabilising at around the prior-year level. By the end of the fourth quarter, order intake slipped
to 9.3% below the prior-year figure. Overall, we managed to increase order intake by 4.9% in 2014 compared to the
prior year. Following a particularly strong first quarter, the order backlog decreased over the course of the year but
was still up 10.0% on the prior year at 497 kilotonnes as at 31 December 2014 (2013: 452 kilotonnes).
The crude steel volume produced at our works consistently exceeded the same quarter of the prior year, which
resulted in a year-on-year increase of 6.2% overall to 2 014 kilotonnes (2013: 1 897 kilotonnes).
Sales volume and revenue up
Sales volume and revenue 2010 – 2014
in kt | in million EUR
3 119.3
3 942.93 581.4
3 276.7 3 338.4
2 0012 274
2 044 2 054 2 135
2010 2011 2012 2013 2014
Sales volume in kt Revenue in million EUR
Sales volume and revenue Q4 2013 – Q4 2014
in kt | in million EUR
752.0
871.6 858.0 823.5 785.3
491581 557
509 488
Q4 2013 Q1 2014 Q2 2014 Q3 2014 Q4 2014
Sales volume in kt Revenue in million EUR
49MANAGEMENT REPORT Business development of the Group
S+Bi AG Annual Report 2014

At 488 kilotonnes, the sales volume in the fourth quarter fell slightly short of the prior-year level (Q4 2013: 491
kilotonnes). However, it increased by 81 kilotonnes or 3.9% to 2 135 kilotonnes (2013: 2 054 kilotonnes) overall in
the reporting period thanks to strong sales activities in the first two quarters of the year. In a quarter-for-quarter
comparison, revenue was up in the last three months of the year due to a better product mix and higher alloy sur-
charges compared to the same period of the prior year. Revenue came to EUR 785.3 million (Q4 2013: EUR 752.0
million) – an increase of EUR 33.3 million or 4.4% on the figure recorded in the same quarter of the prior year. For the
year as a whole, revenue was up just EUR 61.7 million or 1.9% to EUR 3 338.4 million, however (2013: EUR 3 276.7
million). This was primarily due to persisting pressure on base prices and the low alloy surcharges, at least in the first
two quarters of the current year. Furthermore, the exchange rates of relevance for us underwent a mildly negative
development compared to the same period of the prior year. Adjusted for exchange rate effects, revenue would have
increased by 2.2% compared to the prior year to EUR 3 348.1 million.
Closer analysis of revenue development reveals an extremely mixed regional picture. In the fourth quarter of 2014,
we saw revenue fall 1.8% in Europe. In North America it was up 10.3%, while in the rest of the world it more than
doubled. For the year 2014 as a whole, revenue in Europe remained stable at around the prior-year level (–0.1%).
Growth of 9.3% and 18.0% was reported in North America and the rest of the world, respectively.
The development of sales volume and revenue was equally dissimilar in the individual product groups. The sales
volume of tool steel, which generates higher margins, climbed 15.8% in the fourth quarter and 7.1% for the year as
a whole. In contrast, the sales volume for both stainless steel and engineering steel decreased in the fourth quarter,
dropping 2.5% and 1.6%, respectively. For the year as a whole, sales volume was up 0.8% and 4.5%, respectively,
however. Revenue was up across the board in the fourth quarter. The increase came to 8.9% for tool steel, 6.7% for
stainless steel and 2.2% for engineering steel. For the year as a whole, revenue was up 2.2% for tool steel and 3.7%
for engineering steel, but slipped by a slight 0.4% for stainless steel.
Germany 45.5 (45.4)
Italy 8.9 (10.1)
France 6.4 (6.8)
Revenue by region 2014
in %
America 13.7 (12.4)
Other Europe19.0 (19.3)
Switzerland 1.8 (1.7)
Revenue | Compared to 2013 (in brackets)
Africa/Asia/Australia 4.7 (4.3)
Revenue | Compared to 2013 (in brackets)
Other 3.6 (3.6)
Revenue by product group 2014
in %
Engineering steel47.4 (46.5)
Tool steel 12.7 (12.7)
Stainless steel 36.3 (37.2)
50 MANAGEMENT REPORT Business development of the Group
S+Bi AG Annual Report 2014

Renewed improvement in absolute and percentage gross margin
Gross margin absolute amount and in %2010 – 2014
in million EUR | in %
1 034.7
1 222.51 081.7 1 056.4
1 167.3
2010 2011 2012 2013 2014
Gross margin absolute amount Gross margin in %
33.2 31.0 30.2 32.235.0
Gross margin absolute amount and in %Q4 2013 – Q4 2014
in million EUR | in %
251.5
296.9 307.3282.9 280.2
Q4 2013 Q1 2014 Q2 2014 Q3 2014 Q4 2014
Gross margin absolute amount Gross margin in %
33.4 34.1 35.8 34.435.7
Adjusted for the change in semi-finished and finished products, the cost of materials came to EUR 505.1 million in
the fourth quarter – a slight increase on the prior-year level (Q4 2013: 500.5 million). For the year as a whole, it fell
by EUR 49.2 million or 2.2% to EUR 2 171.1 million (2013: EUR 2 220.3 million) despite the higher sales volume.
The absolute gross margin thus increased by EUR 28.7 million or 11.4% to EUR 280.2 million in the fourth quarter
(Q4 2013: EUR 251.5 million) and by EUR 110.9 million or 10.5% to EUR 1 167.3 million (2013: EUR 1 056.4 million)
for the year as a whole. We therefore managed to improve the percentage gross margin markedly, with an increase to
35.7% (Q4 2013: 33.4%) in the fourth quarter and 35.0% for the year as a whole (2013: 32.2%).
Other operating income and expenses down year on year, slight increase in personnel costs adjusted for
non-recurring expenses
At EUR 17.7 million in the fourth quarter, other operating income increased EUR 4.1 million or 30.1% on the prior-year
level (Q4 2013: EUR 13.6 million). This development mainly reflects income from the release of restructuring provi-
sions set up in prior years and the reversal of impairment losses or recovery of bad debts. Other operating income for
the year as a whole fell by EUR 40.3 million on the prior year (2013: EUR 42.8 million), a drop of EUR 2.5 million or
5.8% despite income from the release of provisions. This is first and foremost due to lower indemnity payments as
well as lower income from the disposal of property, plant and equipment.
Personnel costs decreased by EUR 14.1 million or 8.8% to EUR 145.5 million in the fourth quarter (Q4 2013: EUR
159.6 million) and by EUR 1.2 million or 0.2% to EUR 597.0 million (2013: EUR 598.2 million) for the year as a whole.
The fall in personnel costs in the reporting period is mainly attributable to the fact that this year did not include the
2013 expenses for downsizing the workforce as a result of restructuring measures launched in 2012 and extended
again in 2013. Non-recurring expenses of EUR 5.7 million (2013: EUR 23.6 million) were included in personnel costs
– a significant drop on the prior-year level. Without special effects, adjusted personnel costs would have increased
by 2.9% on the prior year to EUR 591.3 million (2013: EUR 574.6 million) as a result of the higher sales volume and
collectively bargained wages. The headcount decreased by 95 to 10 000 employees (2013: 10 095 employees) as a
result of restructuring measures.
Other operating expenses increased by EUR 2.8 million or 3.1% to EUR 93.2 million in the fourth quarter (Q4 2013:
EUR 90.4 million). For the year as a whole, however, the figure decreased slightly by EUR 1.3 million or 0.4% to
EUR 358.0 million (2013: EUR 359.3 million). Not including the special effects of EUR 8.0 million (2013: EUR 15.0
million), which were significantly lower in 2014 than in the prior year, other operating expenses would have increased
by EUR 5.8 million or 1.7% to EUR 350.1 million compared to the prior year (2013: EUR 344.3 million) due to higher
activity levels.
51MANAGEMENT REPORT Business development of the Group
S+Bi AG Annual Report 2014
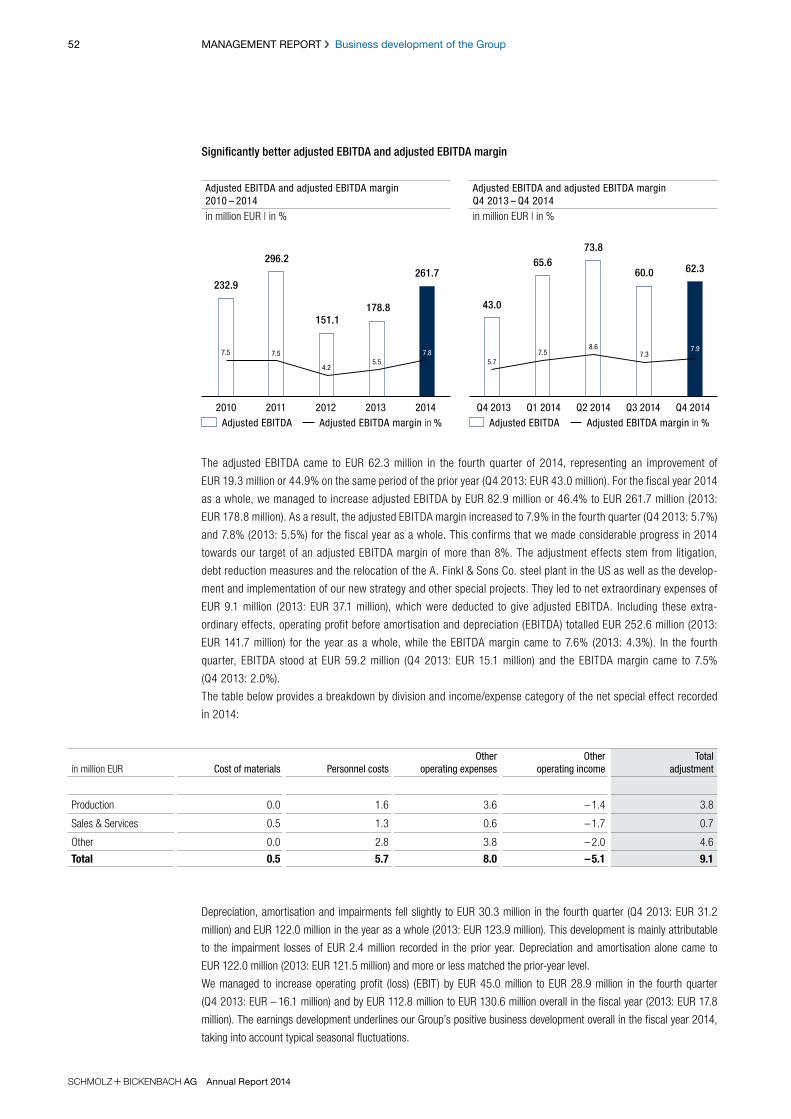
Significantly better adjusted EBITDA and adjusted EBITDA margin
Adjusted EBITDA and adjusted EBITDA margin 2010 – 2014
in million EUR | in %
232.9
296.2
151.1178.8
261.7
2010 2011 2012 2013 2014
Adjusted EBITDA Adjusted EBITDA margin in %
7.5 7.5
4.25.5
7.8
Adjusted EBITDA and adjusted EBITDA margin Q4 2013 – Q4 2014
in million EUR | in %
43.0
65.673.8
60.0 62.3
Q4 2013 Q1 2014 Q2 2014 Q3 2014 Q4 2014
Adjusted EBITDA Adjusted EBITDA margin in %
5.77.5
8.67.3
7.9
The adjusted EBITDA came to EUR 62.3 million in the fourth quarter of 2014, representing an improvement of
EUR 19.3 million or 44.9% on the same period of the prior year (Q4 2013: EUR 43.0 million). For the fiscal year 2014
as a whole, we managed to increase adjusted EBITDA by EUR 82.9 million or 46.4% to EUR 261.7 million (2013:
EUR 178.8 million). As a result, the adjusted EBITDA margin increased to 7.9% in the fourth quarter (Q4 2013: 5.7%)
and 7.8% (2013: 5.5%) for the fiscal year as a whole. This confirms that we made considerable progress in 2014
towards our target of an adjusted EBITDA margin of more than 8%. The adjustment effects stem from litigation,
debt reduction measures and the relocation of the A. Finkl & Sons Co. steel plant in the US as well as the develop-
ment and implementation of our new strategy and other special projects. They led to net extraordinary expenses of
EUR 9.1 million (2013: EUR 37.1 million), which were deducted to give adjusted EBITDA. Including these extra-
ordinary effects, operating profit before amortisation and depreciation (EBITDA) totalled EUR 252.6 million (2013:
EUR 141.7 million) for the year as a whole, while the EBITDA margin came to 7.6% (2013: 4.3%). In the fourth
quarter, EBITDA stood at EUR 59.2 million (Q4 2013: EUR 15.1 million) and the EBITDA margin came to 7.5%
(Q4 2013: 2.0%).
The table below provides a breakdown by division and income/expense category of the net special effect recorded
in 2014:
in million EUR Cost of materials Personnel costsOther
operating expensesOther
operating incomeTotal
adjustment
Production 0.0 1.6 3.6 – 1.4 3.8
Sales & Services 0.5 1.3 0.6 – 1.7 0.7
Other 0.0 2.8 3.8 – 2.0 4.6
Total 0.5 5.7 8.0 – 5.1 9.1
Depreciation, amortisation and impairments fell slightly to EUR 30.3 million in the fourth quarter (Q4 2013: EUR 31.2
million) and EUR 122.0 million in the year as a whole (2013: EUR 123.9 million). This development is mainly attributable
to the impairment losses of EUR 2.4 million recorded in the prior year. Depreciation and amortisation alone came to
EUR 122.0 million (2013: EUR 121.5 million) and more or less matched the prior-year level.
We managed to increase operating profit (loss) (EBIT) by EUR 45.0 million to EUR 28.9 million in the fourth quarter
(Q4 2013: EUR – 16.1 million) and by EUR 112.8 million to EUR 130.6 million overall in the fiscal year (2013: EUR 17.8
million). The earnings development underlines our Group’s positive business development overall in the fiscal year 2014,
taking into account typical seasonal fluctuations.
52 MANAGEMENT REPORT Business development of the Group
S+Bi AG Annual Report 2014
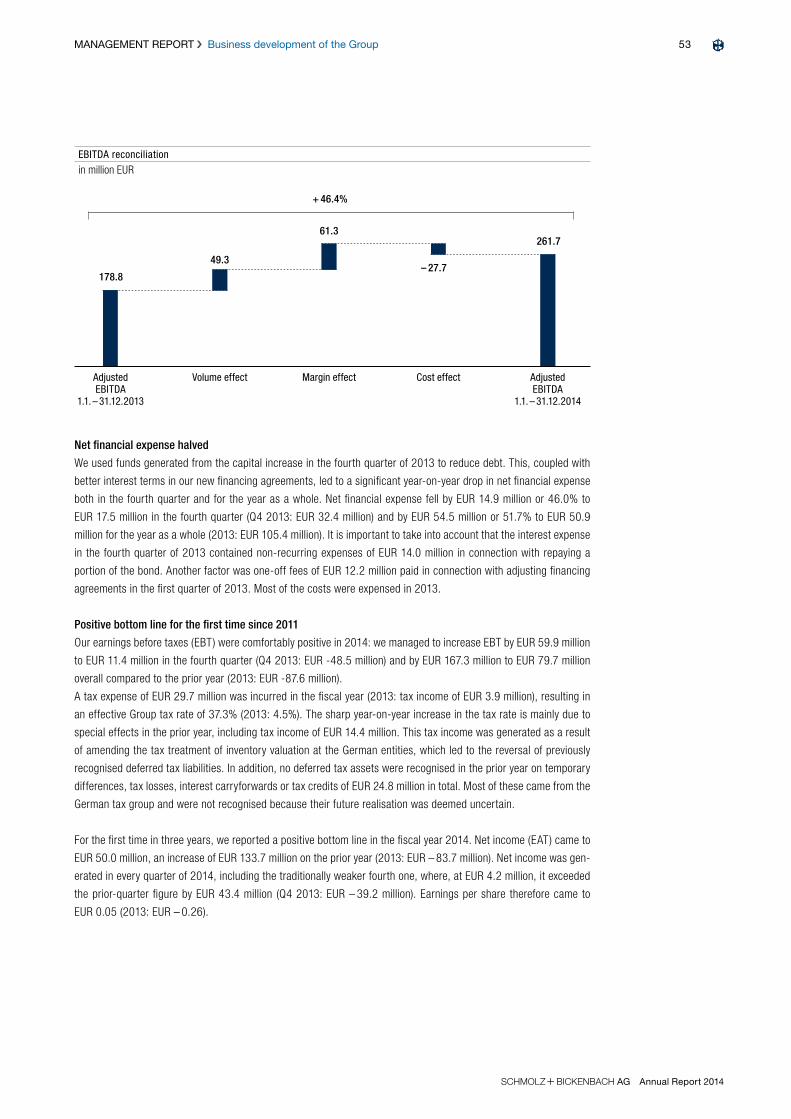
Net financial expense halved
We used funds generated from the capital increase in the fourth quarter of 2013 to reduce debt. This, coupled with
better interest terms in our new financing agreements, led to a significant year-on-year drop in net financial expense
both in the fourth quarter and for the year as a whole. Net financial expense fell by EUR 14.9 million or 46.0% to
EUR 17.5 million in the fourth quarter (Q4 2013: EUR 32.4 million) and by EUR 54.5 million or 51.7% to EUR 50.9
million for the year as a whole (2013: EUR 105.4 million). It is important to take into account that the interest expense
in the fourth quarter of 2013 contained non-recurring expenses of EUR 14.0 million in connection with repaying a
portion of the bond. Another factor was one-off fees of EUR 12.2 million paid in connection with adjusting financing
agreements in the first quarter of 2013. Most of the costs were expensed in 2013.
Positive bottom line for the first time since 2011
Our earnings before taxes (EBT) were comfortably positive in 2014: we managed to increase EBT by EUR 59.9 million
to EUR 11.4 million in the fourth quarter (Q4 2013: EUR -48.5 million) and by EUR 167.3 million to EUR 79.7 million
overall compared to the prior year (2013: EUR -87.6 million).
A tax expense of EUR 29.7 million was incurred in the fiscal year (2013: tax income of EUR 3.9 million), resulting in
an effective Group tax rate of 37.3% (2013: 4.5%). The sharp year-on-year increase in the tax rate is mainly due to
special effects in the prior year, including tax income of EUR 14.4 million. This tax income was generated as a result
of amending the tax treatment of inventory valuation at the German entities, which led to the reversal of previously
recognised deferred tax liabilities. In addition, no deferred tax assets were recognised in the prior year on temporary
differences, tax losses, interest carryforwards or tax credits of EUR 24.8 million in total. Most of these came from the
German tax group and were not recognised because their future realisation was deemed uncertain.
For the first time in three years, we reported a positive bottom line in the fiscal year 2014. Net income (EAT) came to
EUR 50.0 million, an increase of EUR 133.7 million on the prior year (2013: EUR – 83.7 million). Net income was gen-
erated in every quarter of 2014, including the traditionally weaker fourth one, where, at EUR 4.2 million, it exceeded
the prior-quarter figure by EUR 43.4 million (Q4 2013: EUR – 39.2 million). Earnings per share therefore came to
EUR 0.05 (2013: EUR – 0.26).
EBITDA reconciliation
in million EUR
49.3
+ 46.4%
261.7
Adjusted EBITDA
1.1. – 31.12.2013
Adjusted EBITDA
1.1. – 31.12.2014
Cost effectMargin effectVolume effect
178.8
61.3
– 27.7
53MANAGEMENT REPORT Business development of the Group
S+Bi AG Annual Report 2014

EBIT, EBT and EAT 2010 – 2014
in million EUR
121.9
179.6
– 14.5
17.8
130.6
33.3
67.6
– 89.1 – 87.6
38.6 42.7
– 162.8
– 83.7
79.750.0
2010 2011 2012 2013 2014
EBIT EBT EAT
EBIT, EBT and EAT Q4 2013 – Q4 2014
in million EUR
Q4 2013 Q1 2014 Q2 2014 Q3 2014 Q4 2014
EBIT EBT EAT
– 16.1
34.0
42.5
25.228.9
– 48.5
19.0
33.2
16.1
– 39.2
12.4
22.8
10.6 11.44.2
54 MANAGEMENT REPORT Business development of the Group
S+Bi AG Annual Report 2014
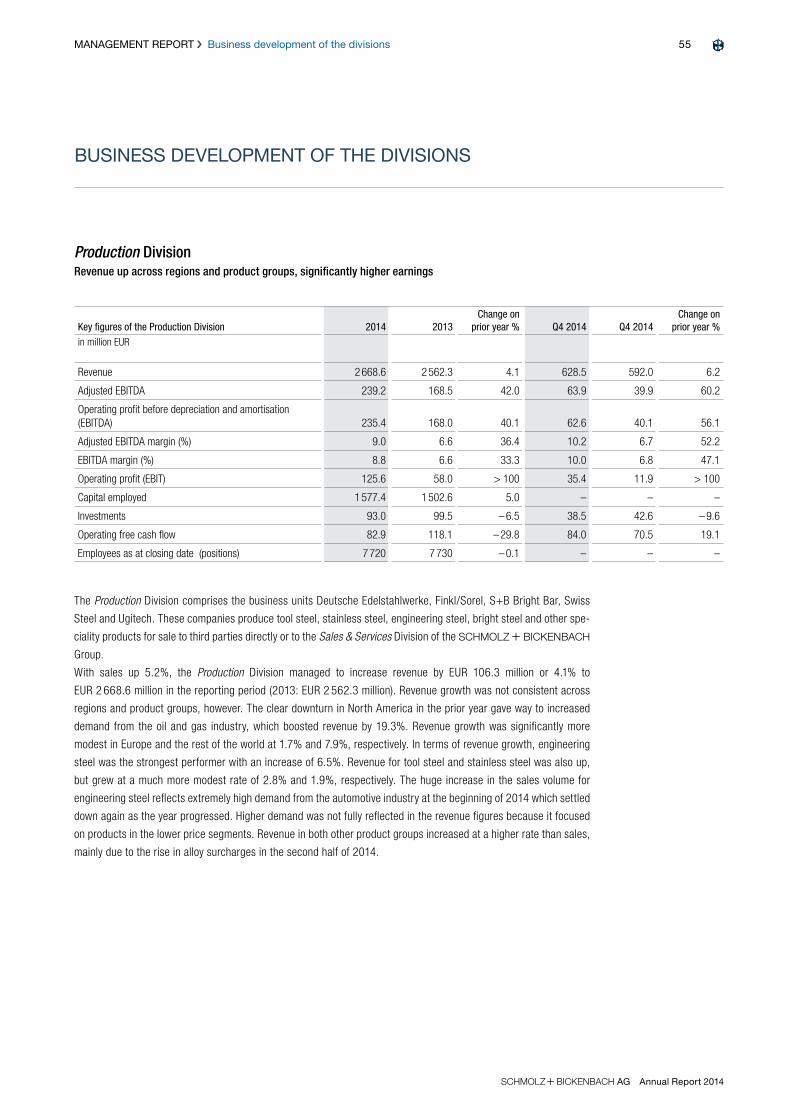
Key figures of the Production Division 2014 2013Change on
prior year % Q4 2014 Q4 2014Change on
prior year %in million EUR
Revenue 2 668.6 2 562.3 4.1 628.5 592.0 6.2
Adjusted EBITDA 239.2 168.5 42.0 63.9 39.9 60.2
Operating profit before depreciation and amortisation (EBITDA) 235.4 168.0 40.1 62.6 40.1 56.1
Adjusted EBITDA margin (%) 9.0 6.6 36.4 10.2 6.7 52.2
EBITDA margin (%) 8.8 6.6 33.3 10.0 6.8 47.1
Operating profit (EBIT) 125.6 58.0 > 100 35.4 11.9 > 100
Capital employed 1 577.4 1 502.6 5.0 – – –
Investments 93.0 99.5 – 6.5 38.5 42.6 – 9.6
Operating free cash flow 82.9 118.1 – 29.8 84.0 70.5 19.1
Employees as at closing date (positions) 7 720 7 730 – 0.1 – – –
BUSINESS DEVELOPMENT OF THE DIVISIONS
Production DivisionRevenue up across regions and product groups, significantly higher earnings
The Production Division comprises the business units Deutsche Edelstahlwerke, Finkl/Sorel, S+B Bright Bar, Swiss
Steel and Ugitech. These companies produce tool steel, stainless steel, engineering steel, bright steel and other spe-
ciality products for sale to third parties directly or to the Sales & Services Division of the S + BI
Group.
With sales up 5.2%, the Production Division managed to increase revenue by EUR 106.3 million or 4.1% to
EUR 2 668.6 million in the reporting period (2013: EUR 2 562.3 million). Revenue growth was not consistent across
regions and product groups, however. The clear downturn in North America in the prior year gave way to increased
demand from the oil and gas industry, which boosted revenue by 19.3%. Revenue growth was significantly more
modest in Europe and the rest of the world at 1.7% and 7.9%, respectively. In terms of revenue growth, engineering
steel was the strongest performer with an increase of 6.5%. Revenue for tool steel and stainless steel was also up,
but grew at a much more modest rate of 2.8% and 1.9%, respectively. The huge increase in the sales volume for
engineering steel reflects extremely high demand from the automotive industry at the beginning of 2014 which settled
down again as the year progressed. Higher demand was not fully reflected in the revenue figures because it focused
on products in the lower price segments. Revenue in both other product groups increased at a higher rate than sales,
mainly due to the rise in alloy surcharges in the second half of 2014.
S+Bi AG Annual Report 2014
55MANAGEMENT REPORT Business development of the divisions

Revenue Production Q4 2013 – Q4 2014
in million EUR
592.0
698.4 690.3651.4 628.5
Q4 2013 Q1 2014 Q2 2014 Q3 2014 Q4 2014
Adjusted EBITDA and adjusted EBITDA margin Production Q4 2013 – Q4 2014
in million EUR | in %
39.9
59.2
66.6
49.5
63.9
Q4 2013 Q1 2014 Q2 2014 Q3 2014 Q4 2014
Adjusted EBITDA Adjusted EBITDA margin in %
6.78.5
9.67.6
10.2
The Production Division managed to increase adjusted EBITDA by EUR 70.7 million or 42.0% to EUR 239.2 million in
the reporting period (2013: EUR 168.5 million). The adjusted EBITDA margin thus improved to 9.0% (2013: 6.6%).
The adjustment effects stem from restructuring provisions, the relocation of the A. Finkl & Sons Co. steel plant in
the US and the development and implementation of our new strategy. They led to net extraordinary expenses of
EUR 3.8 million in the Production Division (2013: EUR 0.5 million), which were deducted to give adjusted EBITDA. At
EUR 235.4 million including these special effects, operating profit before depreciation and amortisation (EBITDA) was
up EUR 67.4 million or 40.1% on the prior year (2013: EUR 168.0 million). The EBITDA margin therefore increased by
8.8% compared to the prior year (2013: 6.6%).
The marked improvement in earnings is attributable to better capacity utilisation at the plants, consistent implemen-
tation of efficiency-boosting measures and high demand from the North American oil and gas industry.
Ongoing investments in state-of-the-art technology and industrial safety
Investment activity focused on maintaining and modernising existing production capacity in 2014. A significant
portion of the Production Division’s EUR 93.0 million investment budget (2013: EUR 99.5 million) was spent on
replacing existing plant and machinery as part of ongoing efforts to improve efficiency and at the same time meet
growing requirements around environmental protection and safety in the workplace.
One example is the new secondary metallurgic centre at Deutsche Edelstahlwerke GmbH (DE), which went into oper-
ation at the Witten plant in June 2014. With a price tag of EUR 50 million, the facility took three years to construct.
It allows us to meet our customers’ demands for even higher quality, while also being significantly more energy-
efficient and environmentally friendly. Further important investment projects this year were the initial construction
steps to build a new cooling bed for our combi mill in Siegen in order to expand production of stainless valve steel.
In North America, the process of relocating our steelworks to Chicago’s South Side was successfully completed.
Besides that, we mainly invested in the expansion of downstream activities.
S+Bi AG Annual Report 2014
56 MANAGEMENT REPORT Business development of the divisions
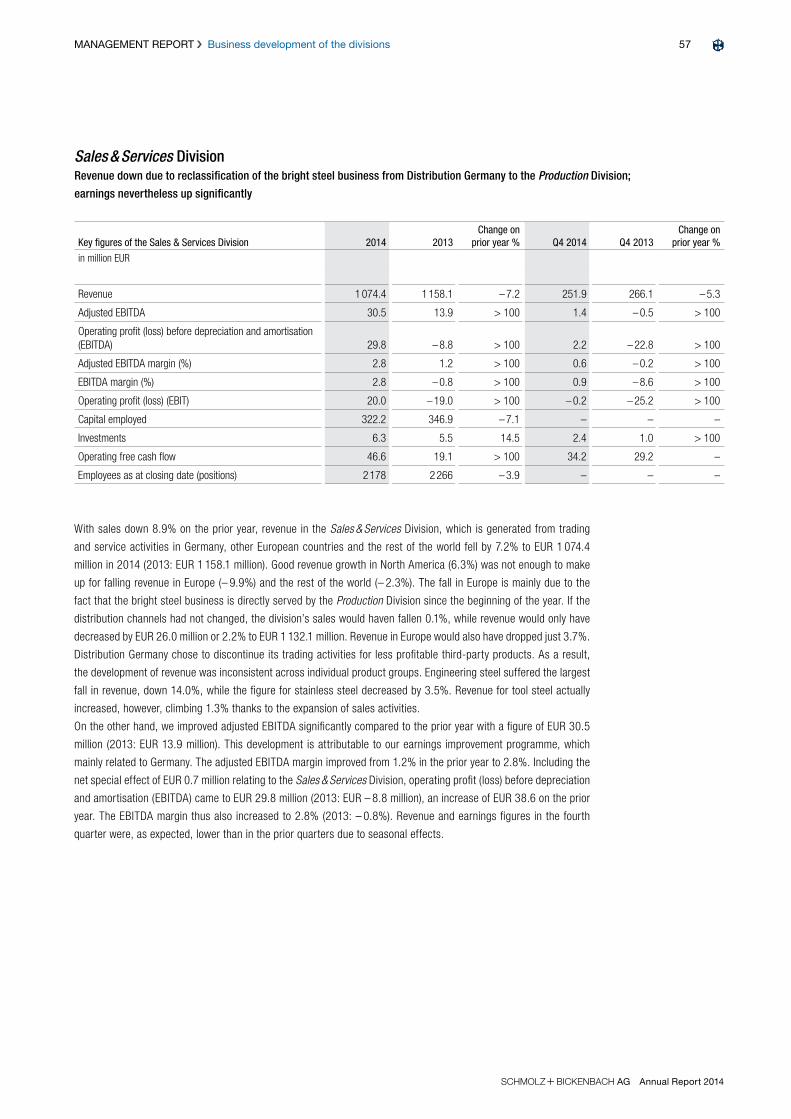
With sales down 8.9% on the prior year, revenue in the Sales & Services Division, which is generated from trading
and service activities in Germany, other European countries and the rest of the world fell by 7.2% to EUR 1 074.4
million in 2014 (2013: EUR 1 158.1 million). Good revenue growth in North America (6.3%) was not enough to make
up for falling revenue in Europe (– 9.9%) and the rest of the world (– 2.3%). The fall in Europe is mainly due to the
fact that the bright steel business is directly served by the Production Division since the beginning of the year. If the
distribution channels had not changed, the division’s sales would haven fallen 0.1%, while revenue would only have
decreased by EUR 26.0 million or 2.2% to EUR 1 132.1 million. Revenue in Europe would also have dropped just 3.7%.
Distribution Germany chose to discontinue its trading activities for less profitable third-party products. As a result,
the development of revenue was inconsistent across individual product groups. Engineering steel suffered the largest
fall in revenue, down 14.0%, while the figure for stainless steel decreased by 3.5%. Revenue for tool steel actually
increased, however, climbing 1.3% thanks to the expansion of sales activities.
On the other hand, we improved adjusted EBITDA significantly compared to the prior year with a figure of EUR 30.5
million (2013: EUR 13.9 million). This development is attributable to our earnings improvement programme, which
mainly related to Germany. The adjusted EBITDA margin improved from 1.2% in the prior year to 2.8%. Including the
net special effect of EUR 0.7 million relating to the Sales & Services Division, operating profit (loss) before depreciation
and amortisation (EBITDA) came to EUR 29.8 million (2013: EUR – 8.8 million), an increase of EUR 38.6 on the prior
year. The EBITDA margin thus also increased to 2.8% (2013: – 0.8%). Revenue and earnings figures in the fourth
quarter were, as expected, lower than in the prior quarters due to seasonal effects.
Key figures of the Sales & Services Division 2014 2013Change on
prior year % Q4 2014 Q4 2013Change on
prior year %
in million EUR
Revenue 1 074.4 1 158.1 – 7.2 251.9 266.1 – 5.3
Adjusted EBITDA 30.5 13.9 > 100 1.4 – 0.5 > 100
Operating profit (loss) before depreciation and amortisation (EBITDA) 29.8 – 8.8 > 100 2.2 – 22.8 > 100
Adjusted EBITDA margin (%) 2.8 1.2 > 100 0.6 – 0.2 > 100
EBITDA margin (%) 2.8 – 0.8 > 100 0.9 – 8.6 > 100
Operating profit (loss) (EBIT) 20.0 – 19.0 > 100 – 0.2 – 25.2 > 100
Capital employed 322.2 346.9 – 7.1 – – –
Investments 6.3 5.5 14.5 2.4 1.0 > 100
Operating free cash flow 46.6 19.1 > 100 34.2 29.2 –
Employees as at closing date (positions) 2 178 2 266 – 3.9 – – –
Sales & Services DivisionRevenue down due to reclassification of the bright steel business from Distribution Germany to the Production Division;
earnings nevertheless up significantly
S+Bi AG Annual Report 2014
57MANAGEMENT REPORT Business development of the divisions
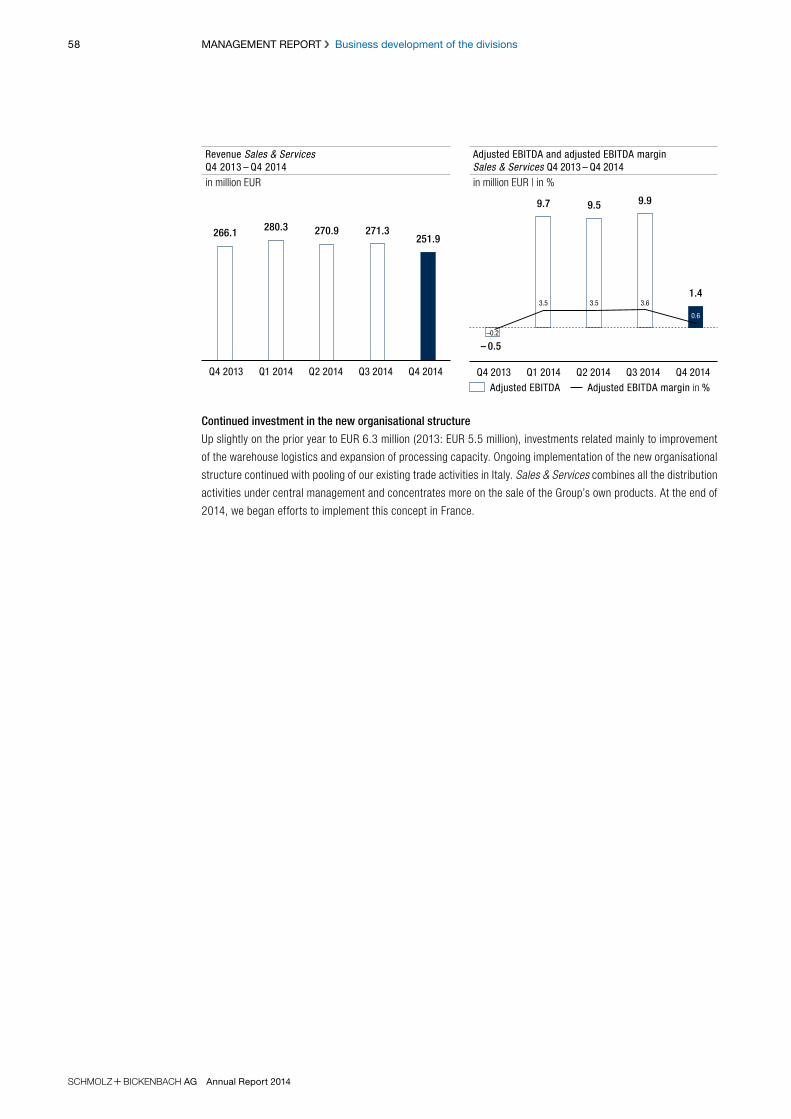
Continued investment in the new organisational structure
Up slightly on the prior year to EUR 6.3 million (2013: EUR 5.5 million), investments related mainly to improvement
of the warehouse logistics and expansion of processing capacity. Ongoing implementation of the new organisational
structure continued with pooling of our existing trade activities in Italy. Sales & Services combines all the distribution
activities under central management and concentrates more on the sale of the Group’s own products. At the end of
2014, we began efforts to implement this concept in France.
Revenue Sales & Services Q4 2013 – Q4 2014
in million EUR
266.1 280.3 270.9 271.3251.9
Q4 2013 Q1 2014 Q2 2014 Q3 2014 Q4 2014
Adjusted EBITDA and adjusted EBITDA marginSales & Services Q4 2013 – Q4 2014
in million EUR | in %
– 0.5
9.7 9.5 9.9
1.4
Q4 2013 Q1 2014 Q2 2014 Q3 2014 Q4 2014
Adjusted EBITDA Adjusted EBITDA margin in %
–0.2
3.5 3.5 3.6
0.6
S+Bi AG Annual Report 2014
58 MANAGEMENT REPORT Business development of the divisions
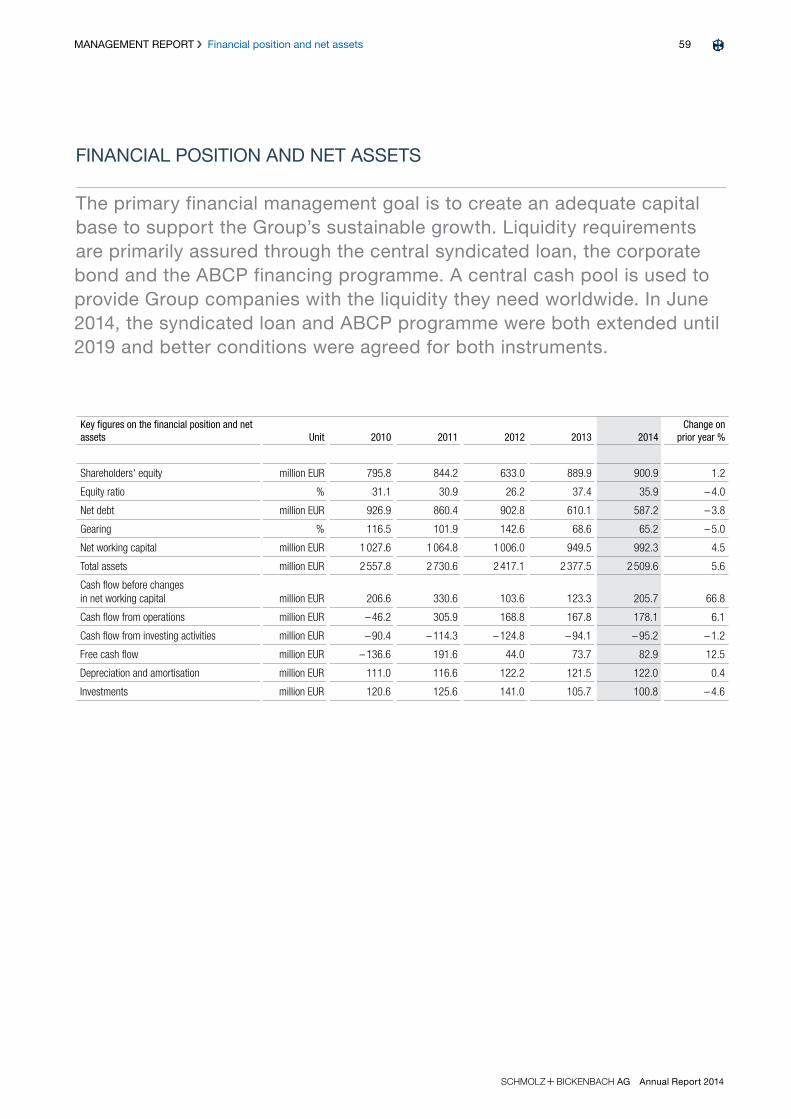
FINANCIAL POSITION AND NET ASSETS
The primary financial management goal is to create an adequate capital base to support the Group’s sustainable growth. Liquidity requirements are primarily assured through the central syndicated loan, the corporate bond and the ABCP financing programme. A central cash pool is used to provide Group companies with the liquidity they need worldwide. In June 2014, the syndicated loan and ABCP programme were both extended until 2019 and better conditions were agreed for both instruments.
Key figures on the financial position and net assets Unit 2010 2011 2012 2013 2014
Change on prior year %
Shareholders' equity million EUR 795.8 844.2 633.0 889.9 900.9 1.2
Equity ratio % 31.1 30.9 26.2 37.4 35.9 – 4.0
Net debt million EUR 926.9 860.4 902.8 610.1 587.2 – 3.8
Gearing % 116.5 101.9 142.6 68.6 65.2 – 5.0
Net working capital million EUR 1 027.6 1 064.8 1 006.0 949.5 992.3 4.5
Total assets million EUR 2 557.8 2 730.6 2 417.1 2 377.5 2 509.6 5.6
Cash flow before changes in net working capital million EUR 206.6 330.6 103.6 123.3 205.7 66.8
Cash flow from operations million EUR – 46.2 305.9 168.8 167.8 178.1 6.1
Cash flow from investing activities million EUR – 90.4 – 114.3 – 124.8 – 94.1 – 95.2 – 1.2
Free cash flow million EUR – 136.6 191.6 44.0 73.7 82.9 12.5
Depreciation and amortisation million EUR 111.0 116.6 122.2 121.5 122.0 0.4
Investments million EUR 120.6 125.6 141.0 105.7 100.8 – 4.6
S+Bi AG Annual Report 2014
59MANAGEMENT REPORT Financial position and net assets
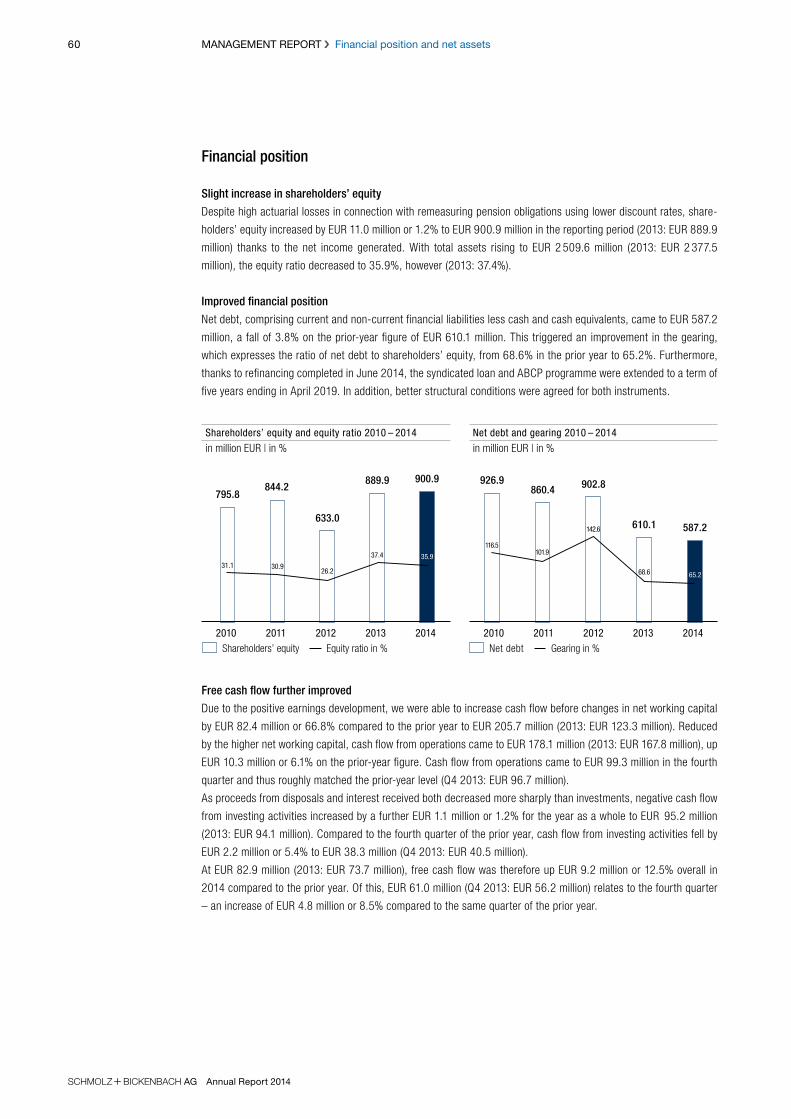
Financial position
Slight increase in shareholders’ equity
Despite high actuarial losses in connection with remeasuring pension obligations using lower discount rates, share-
holders’ equity increased by EUR 11.0 million or 1.2% to EUR 900.9 million in the reporting period (2013: EUR 889.9
million) thanks to the net income generated. With total assets rising to EUR 2 509.6 million (2013: EUR 2 377.5
million), the equity ratio decreased to 35.9%, however (2013: 37.4%).
Improved financial position
Net debt, comprising current and non-current financial liabilities less cash and cash equivalents, came to EUR 587.2
million, a fall of 3.8% on the prior-year figure of EUR 610.1 million. This triggered an improvement in the gearing,
which expresses the ratio of net debt to shareholders’ equity, from 68.6% in the prior year to 65.2%. Furthermore,
thanks to refinancing completed in June 2014, the syndicated loan and ABCP programme were extended to a term of
five years ending in April 2019. In addition, better structural conditions were agreed for both instruments.
Shareholders’ equity and equity ratio 2010 – 2014
in million EUR | in %
795.8844.2
633.0
889.9 900.9
2010 2011 2012 2013 2014
Shareholders’ equity Equity ratio in %
31.1 30.926.2
37.4 35.9
Net debt and gearing 2010 – 2014
in million EUR | in %
926.9860.4 902.8
610.1 587.2
2010 2011 2012 2013 2014
Net debt Gearing in %
116.5101.9
142.6
68.6 65.2
Free cash flow further improved
Due to the positive earnings development, we were able to increase cash flow before changes in net working capital
by EUR 82.4 million or 66.8% compared to the prior year to EUR 205.7 million (2013: EUR 123.3 million). Reduced
by the higher net working capital, cash flow from operations came to EUR 178.1 million (2013: EUR 167.8 million), up
EUR 10.3 million or 6.1% on the prior-year figure. Cash flow from operations came to EUR 99.3 million in the fourth
quarter and thus roughly matched the prior-year level (Q4 2013: EUR 96.7 million).
As proceeds from disposals and interest received both decreased more sharply than investments, negative cash flow
from investing activities increased by a further EUR 1.1 million or 1.2% for the year as a whole to EUR 95.2 million
(2013: EUR 94.1 million). Compared to the fourth quarter of the prior year, cash flow from investing activities fell by
EUR 2.2 million or 5.4% to EUR 38.3 million (Q4 2013: EUR 40.5 million).
At EUR 82.9 million (2013: EUR 73.7 million), free cash flow was therefore up EUR 9.2 million or 12.5% overall in
2014 compared to the prior year. Of this, EUR 61.0 million (Q4 2013: EUR 56.2 million) relates to the fourth quarter
– an increase of EUR 4.8 million or 8.5% compared to the same quarter of the prior year.
S+Bi AG Annual Report 2014
60 MANAGEMENT REPORT Financial position and net assets

As part of the refinancing, a repayment of EUR 221.4 million was made on the utilised portion of the previous syn-
dicated loan in the second quarter of 2014. EUR 236.7 million of the new syndicated loan had been drawn as at
31 December 2014. This, coupled with borrowings and repayments of other financial liabilities, resulted in net repay-
ment of financial liabilities of EUR 27.5 million (2013: EUR 300.9 million); the prior-year figure was much higher due
to the capital increase. At the same time, interest paid decreased by EUR 33.7 million or 39.8% to EUR 50.9 million
(2013: EUR 84.6 million). This figure includes one-off payments of EUR 8.3 million made in connection with refinancing.
Overall, negative cash flow from financing activities increased by EUR 30.2 million or 57.9% to EUR 82.4 million
(2013: EUR 52.2 million). In the fourth quarter of 2014, cash flow from financing activities came to EUR 76.4 million,
an increase of EUR 40.1 million on the prior-year figure (Q4 2013: EUR 36.3 million).
Cash flow 2010 – 2014
in million EUR
before changes in net working capital from operations
206.6
– 46.2
330.6305.9
103.6
168.8123.3
167.8205.7
178.1
2010 20102011 20112012 20122013 20132014 2014
from investing activities free cash flow
– 90.4– 136.6
– 114.3
191.6
– 124.8
44.0
– 94.1
73.7
– 95.2
82.9
2010 20102011 20112012 20122013 20132014 2014
S+Bi AG Annual Report 2014
61MANAGEMENT REPORT Financial position and net assets

Investments, depreciation/amortisation and investment ratio 2010 – 2014
in million EUR | as a ratio
111.0 116.6 122.2 121.5 122.0120.6 125.6141.0
105.7 100.8
2010 2011 2012 2013 2014
Investments Depreciation/amortisation Investment ratio
1.1 1.2 0.9 0.81.1
Investments, depreciation/amortisation and investment ratio Q4 2013 – Q4 2014
in million EUR | as a ratio
30.0 29.8 30.0 31.9 30.3
44.0
12.3
19.3
28.2
41.0
Q4 2013 Q1 2014 Q2 2014 Q3 2014 Q4 2014
Investments Depreciation/amortisation Investment ratio
0.4 0.6 0.9 1.41.5
Net assets
Total assets up
The Group recorded total assets of EUR 2 509.6 million (2013: EUR 2 377.5 million), up EUR 132.1 million or 5.6% on
the prior-year level. This development is primarily attributable to increases in inventories, deferred tax assets and VAT
receivables. Another factor is currency translation effects accounting for around EUR 60 million.
Slight fall in share of non-current assets
Compared to the prior year, non-current assets increased by 2.2% to EUR 1 006.3 million (2013: EUR 984.4 million).
This is mainly due to higher deferred tax assets recognised on temporary differences, which is the result of the corre-
sponding increase in pension provisions. As total assets were also up overall, the share of non-current assets in total
assets fell from 41.4% to 40.1%.
Investments decreased by EUR 4.9 million or 4.6% to EUR 100.8 million (2013: EUR 105.7 million). As a result, the ratio
of investments to depreciation and amortisation fell to 0.8 (2013: 0.9). Due to seasonal effects, investments in the fourth
quarter increased compared to prior quarters to EUR 41.0 million (Q4 2013: EUR 44.0 million). This is because certain
investment measures were only possible during the winter plant closures.
S+Bi AG Annual Report 2014
62 MANAGEMENT REPORT Financial position and net assets
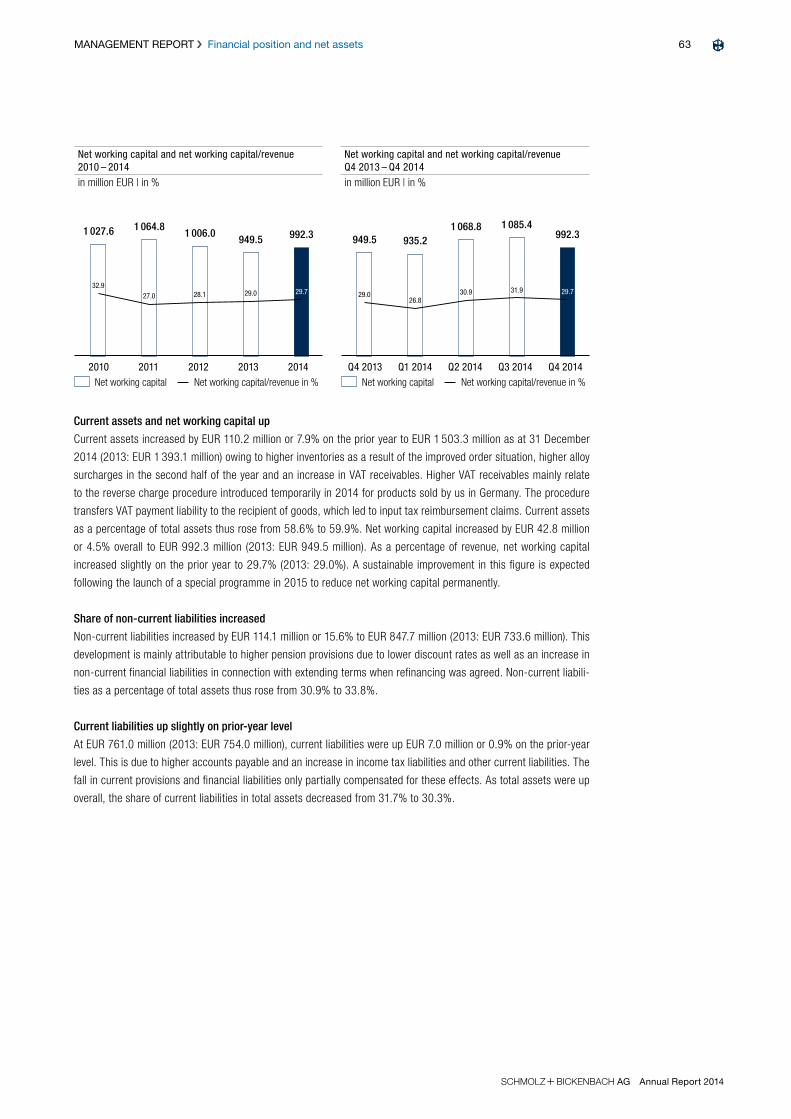
Net working capital and net working capital/revenue 2010 – 2014
in million EUR | in %
1 027.6 1 064.81 006.0
949.5 992.3
2010 2011 2012 2013 2014
Net working capital Net working capital/revenue in %
32.927.0 28.1 29.0 29.7 29.7
Net working capital and net working capital/revenue Q4 2013 – Q4 2014
in million EUR | in %
949.5 935.21 068.8 1 085.4
992.3
Q4 2013 Q1 2014 Q2 2014 Q3 2014 Q4 2014
Net working capital Net working capital/revenue in %
29.026.8
30.9 31.9
Current assets and net working capital up
Current assets increased by EUR 110.2 million or 7.9% on the prior year to EUR 1 503.3 million as at 31 December
2014 (2013: EUR 1 393.1 million) owing to higher inventories as a result of the improved order situation, higher alloy
surcharges in the second half of the year and an increase in VAT receivables. Higher VAT receivables mainly relate
to the reverse charge procedure introduced temporarily in 2014 for products sold by us in Germany. The procedure
transfers VAT payment liability to the recipient of goods, which led to input tax reimbursement claims. Current assets
as a percentage of total assets thus rose from 58.6% to 59.9%. Net working capital increased by EUR 42.8 million
or 4.5% overall to EUR 992.3 million (2013: EUR 949.5 million). As a percentage of revenue, net working capital
increased slightly on the prior year to 29.7% (2013: 29.0%). A sustainable improvement in this figure is expected
following the launch of a special programme in 2015 to reduce net working capital permanently.
Share of non-current liabilities increased
Non-current liabilities increased by EUR 114.1 million or 15.6% to EUR 847.7 million (2013: EUR 733.6 million). This
development is mainly attributable to higher pension provisions due to lower discount rates as well as an increase in
non-current financial liabilities in connection with extending terms when refinancing was agreed. Non-current liabili-
ties as a percentage of total assets thus rose from 30.9% to 33.8%.
Current liabilities up slightly on prior-year level
At EUR 761.0 million (2013: EUR 754.0 million), current liabilities were up EUR 7.0 million or 0.9% on the prior-year
level. This is due to higher accounts payable and an increase in income tax liabilities and other current liabilities. The
fall in current provisions and financial liabilities only partially compensated for these effects. As total assets were up
overall, the share of current liabilities in total assets decreased from 31.7% to 30.3%.
S+Bi AG Annual Report 2014
63MANAGEMENT REPORT Financial position and net assets
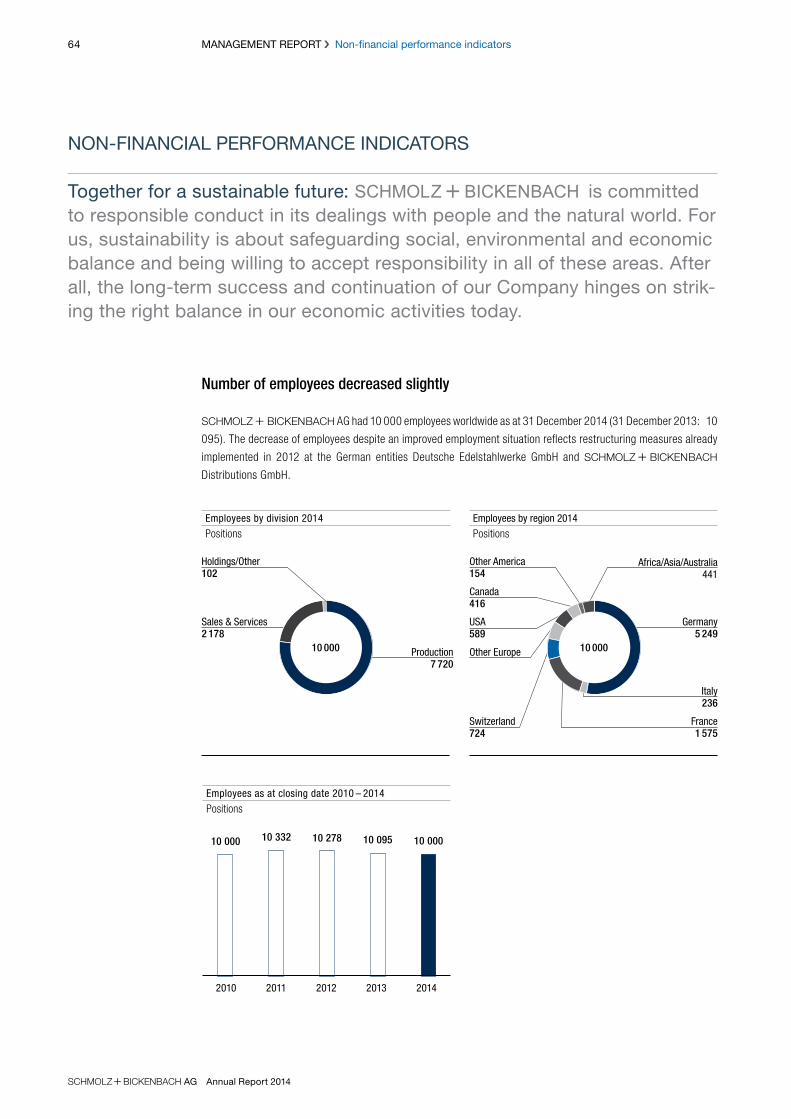
NON-FINANCIAL PERFORMANCE INDICATORS
Together for a sustainable future: S + BI is committed to responsible conduct in its dealings with people and the natural world. For us, sustainability is about safeguarding social, environmental and economic balance and being willing to accept responsibility in all of these areas. After all, the long-term success and continuation of our Company hinges on strik-ing the right balance in our economic activities today.
Number of employees decreased slightly
S + BI AG had 10 000 employees worldwide as at 31 December 2014 (31 December 2013: 10
095). The decrease of employees despite an improved employment situation reflects restructuring measures already
implemented in 2012 at the German entities Deutsche Edelstahlwerke GmbH and S + BI
Distributions GmbH.
Employees as at closing date 2010 – 2014
Positions
10 000 10 332 10 278 10 095 10 000
2010 2011 2012 2013 2014
Employees by region 2014
Positions
Africa/Asia/Australia 441
Germany 5 249
France 1 575
Other America 154
Canada 416
USA589
Other Europe
Switzerland 724
Italy 236
10 000
Employees by division 2014
Positions
Production7 720
Sales & Services 2 178
10 000
Holdings/Other 102
S+Bi AG Annual Report 2014
64 MANAGEMENT REPORT Non-financial performance indicators
Thanks to open cooperation with the co-determination bodies, socially responsible packages and a high degree of
transparency, notable conflicts were avoided and the restructuring plan was quickly implemented. A continued focus
on flexibility, productivity and activities will be required in the coming year due to changes in the market conditions,
including, but not limited to, those affecting the European distribution business. These efforts will once again be
underpinned by the requisite transparency and fairness that we pledge to deliver as an employer.
The relationship between employee representatives and the Company is subject to particular strain when restructur-
ing measures become inevitable. We managed to maintain a fair and constructive working relationship nonetheless.
Deutsche Edelstahlwerke GmbH – TOP employer 2014
The German magazine “Focus” ran a special edition on the best employers in Germany and featured Deutsche
Edelstahlwerke GmbH as the winning company in the category “Production and processing of basic and building
materials, metals and paper”. The article particularly highlighted our commitment to education and training with the
help of our subsidiary, KarriereWERKSTATT.
Vocational training
Given the far-reaching impact of demographic change, vocational training for young people is an important way
of maintaining a balanced employee structure and remains an absolute priority even when jobs are being shed
elsewhere. At 388, the number of young trainees in vocational training programmes roughly matched the prior-year
level in 2014. Our express intention to take on all trainees as permanent employees once they finish their training
demonstrates our clear commitment to vocational training for young people and our focus on developing talent from
within our ranks.
S + BI continues to train up employees for third parties wishing to benefit from the expertise
of our instructors and the excellent facilities at our two training centres, especially DEW’s subsidiary KarriereWERK-
STATT. The number of such candidates increased once again, which speaks for the quality of vocational training for
young people at S + BI. Two of our trainees were singled out as the best in the German state
of North Rhine-Westphalia, while another from Deutsche Edelstahlwerke in Witten was awarded the title of best in
Germany at an event in Berlin. An exchange programme has been set up for trainees, initially just in Switzerland and
Germany, with a view to helping participants broaden their horizons and boosting employee retention rates.
Further training and high potentials
At S + BI, we firmly stand by our commitment to invest strongly in our own earning power
and our people, even – or indeed especially – when times are tough. This approach was reflected in this fiscal year,
which once again saw us focus on further training and development for our employees. We update our existing
catalogue of further training programmes continuously as demands change and develop. Furthermore, we identify
high-potential employees throughout the Group and place them in central development programmes which support
them on their way to becoming future specialists and leaders. We regularly fill key positions from our pool of high
potentials as part of the Group’s succession planning. The resulting networks are exploited in the course of inter-
company projects. As such, the direct financial contribution of these programmes is an additional benefit besides
their important role in retaining and developing our future corporate leaders.
Health and industrial safety
Our efforts to provide a health and safety-conscious workplace evolve continuously throughout the entire Group.
Various permanent programmes and arrangements have been implemented in cooperation with employee represen-
tatives to facilitate the systematic reintegration of employees with long-term health issues. Other measures include
cancer screening for high-risk groups, influenza vaccines and health and safety training for employees. Despite this,
there were unfortunately 22 serious workplace accidents in the reporting period; these serve as a timely reminder
to step up our efforts.
S+Bi AG Annual Report 2014
65MANAGEMENT REPORT Non-financial performance indicators

Environmental protection and energy management
The S + BI Group is committed to the steady and sustainable development of our environmen-
tal and climate protection activities as one of our corporate goals. That is why all of our companies use environmental
management systems, most of which are certified to the internationally recognised standard ISO 14001. These days,
an energy management system is an economic necessity for all production and service processes. The main Group
entities, especially those with particularly energy-intensive processes, already use energy management systems cer-
tified to ISO 50001.
Within the S + BI Group, a variety of comprehensive environmental and climate protection
measures were implemented once again in 2014, alongside energy efficiency and energy conservation initiatives. We
are pleased to provide some examples of these from the Group entities:
Environmental protection
> The new secondary metallurgic centre at Deutsche Edelstahlwerke in Witten finally went into operation in the
spring of 2014 after a construction period lasting more than three years. Almost one third of the EUR 50 million
investment was spent on environmental protection measures. A new dedusting system has cut the level of particle
dust to such an extent that it is now 90% below the statutory limit. At the same time, a new treatment plant was
installed for waste water from the SMC.
> An energy-efficient, environmentally friendly forging furnace was put into operation at Finkl in the USA. This new
machinery boasts a ceramic fibre lining and a compact, low-emission regenerative burner. Furnaces like this use
just a quarter of the energy needed to power traditional ones. The largest quench tank also went into operation.
The cooling circuit uses evaporation cooling to minimise water consumption. A test of compliance with emissions
limits confirmed that all forges and reheating ovens meet the criteria set by the US Environmental Protection
Agency.
> Sorel Forge in Canada successfully reduced CO2 emissions significantly in 2014. Thanks to more efficient use of
gas, Sorel Forge used 20% less than the emissions volume allocated under the Quebec/California Cap and Trade
Program.
> A new precision cutting line was installed in Rattunde for the S+B Bright Bar Group in February 2014. All cutting
processes are now carried out using cutting fluid mist, which reduces consumption of cutting fluid to a minimum.
At the same time, the process for handling waste oil was improved to reduce the risk of oil pollution.
> Swiss Steel AG is trialling a new method to exploit secondary materials where processed casting ladle slag is
used as fertiliser in agricultural applications. A new company-wide disposal coordination desk, targeted employee
training on hazardous waste and legal compliance controls have strengthened efforts to ensure the environmen-
tally responsible disposal of waste. The steelworks benefit from a new online dust measurement device which was
installed to enable a more rapid response to filter operating disruptions and reduce dust emissions even further.
> Ugitech in Ugine explored options to use slag in concrete production; results are promising. Ugitech replaced the
sludge elimination systems in the washdown areas of the mechanical workshops, improving quality for discharge
into surface water. The company continued its program to replace cooling units containing greenhouse gas. In
addition, the volume of nitrogen entering the water system was reduced by 25% compared to 2013.
S+Bi AG Annual Report 2014
66 MANAGEMENT REPORT Non-financial performance indicators

Energy management
> In 2014, the S + BI Group companies pressed ahead with the energy saving initiative that
was launched in 2007.
> At Deutsche Edelstahlwerke, projects launched as part of the energy-saving campaign have saved a total of
68 million kilowatt hours of electricity and natural gas per year – that is 19 500 tonnes of CO2. For instance, at
the Siegen plant, a ladle heater was converted to a natural gas/oxygen burner, while the cooling circuit in the heat
treatment at the Krefeld location was fitted with new controlling technology. The Hagen site has a new oven lining,
while the hydraulic pumps in Witten have been updated with speed-control motors.
> The Group’s global Sales & Services Division offers special training programmes to teach lorry drivers more fuel-
efficient driving styles. We also apply strict criteria at the vehicle selection stage, opting for “Blue Tec” vehicles.
> The S+B Bright Bar Group’s Dusseldorf site has installed new software to collect consumption data; this step is
part of the energy management system certified to DIN ISO 50001. Data is consolidated in a database and used
to generate automatic reports. Also in Dusseldorf, an independent compressor station was set up in the heat
treatment area, enabling the main air supply to to the whole plant be cut off at the weekends. This saves 200 000
kWh per year. Successful energy saving projects have been under way for many years at the remaining S+B Bright
Bar Group locations and were continued in the past fiscal year, as was cooperation with universities that conduct
research in this area.
> Sorel Forge in Canada successfully reduced its gas consumption – and carbon footprint – thanks to improved
forging technology and optimised use of heat treatment furnaces.
> Swiss Steel successfully obtained ISO 50001 certification for its energy management system. A target commit-
ment was agreed with the government in the context of refunding surcharges levied on high-voltage grid transmis-
sion. Swiss Steel undertakes to meet a pre-defined level of energy efficiency in return for a refund of surcharges
paid. The natural gas meters on the entire plant site have been modernised so that individual consumption load
profiles can be viewed and statements automatically generated. The project to use exhaust heat for district heating
was developed further with the aim of feeding exhaust heat from the rolling mill and steelworks into the public
district heating network. The new frequency converter used internally in the distribution of district heating saves
100 000 kWh of electricity each year.
> At Ugitech’s Imphy site, a closed coolant circuit was set up for tools, which led to significant cost savings.
Ongoing product and process development guarantees special steel solutions for the future
It is difficult to imagine a life without steel today. Sectors such as the automotive, medical technology, power engi-
neering, construction and oil and gas industries – to name but a few – would simply not work without this material.
Although more than 2 300 different steel types are registered, e.g. DIN EN 10020:2000, all with their own use and
processing properties, experts agree that there is still considerable potential for the development of steel as a mate-
rial.
S + BI has made targeted investment to successfully modernise its production plant in recent
years. Thanks to this investment, which is enhanced by decentralised and market-relevant R&D facilities, the Group
is well equipped to meet customers’ future needs for materials that are lighter, tougher, more tensile or easier to
process. And to do so using highly efficient, innovative production processes.
A new Technical Development department was created in 2014 with the aim of boosting the Group’s innovative power
even further. The department ensures that investment is ideally targeted from a product and process perspective and
is responsible for a coordinated and focused approach to using the Group companies’ R&D resources.
S+Bi AG Annual Report 2014
67MANAGEMENT REPORT Non-financial performance indicators

Risk management The Group’s risk management objective is to detect opportunities and risks at an early stage and respond in a way
that is conducive to achieving corporate goals and continuously increasing the value of the Company. As part of the
evaluation process, the Group consciously enters into appropriate, transparent and manageable risks. If certain risks
become too significant, the Group explores options for transferring them to third parties. The Group does not permit
speculation or other high-risk transactions. Our conduct towards suppliers, customers, other business partners,
employees and Group companies is fair and responsible.
Led by S + BI AG, the Group employs a standardised Enterprise Risk Management (ERM)
system across the Group to ensure consistent guidelines for systematic and efficient risk management. The ERM is
an integral component of the annual strategy process, enabling a comprehensive risk analysis including probability of
occurrence, potential damages and corresponding damage limitation measures. This approach helps maintain a high
level of awareness among managers. The risk management duties are defined and explained in our Corporate Policy
Manual and are illustrated with examples. According to the policy, the objective of the ERM is to ensure that risks are
identified and optimised and that opportunities are exploited. Operational management is directly responsible for the
early detection, monitoring and communication of risks, while responsibility for control lies with the Executive Board
and ultimately the Board of Directors.
Insurance policies have been taken out for the majority of insurable risks when this makes commercial sense. As a
result, the corresponding risks have been transferred to the insurance companies. Where necessary, preventive mea-
sures to avert and avoid loss have been implemented by the operating entities. Aspects covered by the ERM include
currency, interest rate and credit risk management. For details of the instruments available for this purpose, please
refer to the information on financial instruments in the notes to the consolidated financial statements.
The IT landscape is regularly reviewed and adjusted to ensure the professional operation of computer assisted busi-
ness processes within the Group and with customers, suppliers and business partners. Existing information security
measures are continually refined to eliminate, or at least minimise, the risks associated with IT processes.
Key factors affecting the Group’s economic development are the volatility of steel prices and the Group’s economic
dependence on the automotive and mechanical engineering industries. The Group strives to balance risks by contin-
ually developing its broad product portfolio, adopting an international sales focus, diversifying the business portfolio,
focusing on niche products and optimising the supply chain.
OPPORTUNITIES AND RISKS
S + BI adopts a central risk management system to minimise or completely eliminate risks (commodity prices, currencies, changes in the sales markets, etc.) through appropriate measures. As all business activities are associated with an element of risk, and in order to best exploit the opportunities that arise from these, we enter into risks as necessary in a controlled manner.
See p. 150
68 MANAGEMENT REPORT Opportunities and risks
S+Bi AG Annual Report 2014

Internal Audit
Internal Audit is an independent auditing and advisory body. For administrative purposes, it is allocated to the portfolio
of the Chief Financial Officer (CFO) and receives audit engagements from the Executive Board and the Audit Commit-
tee. An important component of the ERM, Internal Audit produces risk analyses and assesses the effectiveness and
efficiency of the internal control systems. The Board of Directors and the Audit Committee request periodic reports on
ERM results. In accordance with the audit plan approved by the Executive Board and Audit Committee, Internal Audit
conducted several audits and analyses in the reporting period. These were then discussed by the Audit Committee,
which passed resolutions on any necessary measures and monitored the implementation of these in cooperation with
the responsible Group and Business Unit Heads.
Compliance
Additional employees joined the compliance team in 2014, strengthening this area within the S +
BI Group. Led by the head of Internal Audit + Compliance, this function is primarily responsible for
ensuring compliance with legal requirements and internal corporate guidelines. For administrative purposes, it is allo-
cated to the portfolio of the CFO. Key compliance activities in the past fiscal year included revising and updating the
Code of Conduct as well as the anti-corruption and antitrust guidelines. Numerous industry-specific training sessions
were held at the production plants and Sales & Services entities, with a significant year-on-year increase in the num-
ber of employees trained at classroom events. This has significantly raised employees’ understanding and awareness
of compliance. Training was complemented by targeted compliance audits in 2014. The program to develop and
implement a Group-wide Compliance Management System progressed according to plan. The plan for the Group-wide
Compliance Management System was successfully audited by an external audit firm at the end of the fiscal year.
Internal control system related to preparing the consolidated and separate financial statements
The internal control system related to the preparation of the consolidated and separate financial statements is
designed, implemented and maintained with the aim of ensuring that these are free from misstatements.
Assigned to the portfolio of the CFO for administrative purposes, Group Accounting + Controlling is responsible for coor-
dinating the process of preparing the separate and consolidated financial statements of S + BI
AG. It issues uniform Group reporting guidelines setting out requirements for the local entities. These are regularly
updated and made available to the relevant employees on the intranet. In addition, Group Accounting + Controlling
defines schedules and processes for preparing the consolidated financial statements, and monitors their observance.
S + BI employs a standard software product for the IT side of consolidation and reporting.
Material developments in IFRS as well as changes to the reporting process or IT application are communicated
promptly. Where necessary, the relevant employees receive classroom training. This approach ensures that reporting
is of a consistent high quality.
Financial reporting is subdivided into separately identifiable sub-processes at each level. Segregation of functions,
dual control and clearly defined responsibilities reduce the risk of possible misstatements in financial reporting. The
financial figures supplied by local entities undergo technical validation before being processed further. Furthermore,
Group Accounting + Controlling tests them for completeness and plausibility by comparing the prior-year, actual and
budget figures.
The internal control system, consisting of processes, systems and controls, is regularly assessed for effectiveness by
Internal Audit, and ensures that the separate and consolidated financial statements are prepared in accordance with
IFRSs, the Swiss Code of Obligations (CO) and other accounting-related laws and regulations.
69MANAGEMENT REPORT Opportunities and risks
S+Bi AG Annual Report 2014

Risk factors – risk categories and individual risks
Political and regulatory risks
Some of the Group’s business activities depend heavily on the legal and regulatory environment both nationally and
internationally. Changes in submarkets can therefore be associated with risks, leading to higher costs or other dis-
advantages. The Company monitors national and European legislative processes via industrial associations and is a
proactive voice in consultation procedures, drawing attention to potential competitive imbalances.
The third EU emissions trading period (2013–2020) is expected to result in substantial costs for electricity and
gas suppliers which will be reflected in price increases for consumers. As an energy-intensive industrial and trad-
ing group, we risk damage to our results of operations if the costs cannot be completely passed on to customers.
S + BI is actively following the discussion process via the respective associations (e.g. Inter-
national Stainless Steel Forum (ISSF) and World Steel Association (WSA)).
S + BI operates in an energy-intensive industry. Several of its German entities were entitled
to a reduction on the surcharge in accordance with the German Renewable Energies Act (EEG).
In December 2013, the EU Commission launched an in-depth investigation into the Federal Republic of Germany’s
EEG for compatibility with EU state aid rules. Proceedings have since been concluded. The Commission approved
the applicable German laws with certain amendments. We do not expect additional payment obligations for Group
companies. At the same time, a revised version of the EEG was issued in Germany, with new provisions governing the
period from 1 January 2015. Our production companies meet the requirements contained therein and have therefore
received the relevant exemptions.
Risks relating to the future economic development
The entrepreneurial activity of S + BI depends on the economic development not only of
international markets but also of individual industries. A change in the overall economic situation is linked to a risk that
prices and sales volumes will fluctuate more. S + BI employs various measures to counter
this risk. Our global structure allows us to launch a robust response to local crises, while our broad, fragmented
industry mix and our uniquely wide product range ensure wide risk diversification. In crisis situations, this diversified
base, coupled with a lean and flexible organisation, allows us to react quickly and effectively. Our business perfor-
mance is strongly influenced by the Group’s economic dependency on the automotive and mechanical engineering
industries. We aim to balance risks by continuously developing our broad product portfolio as well as maintaining an
international sales focus, diversifying the business portfolio, focusing on niche products and optimising the supply
chain. Prices on the sales and procurement markets, as well as energy prices, are also of fundamental importance to
S + BI. We operate a price surcharge system for scrap and alloys to reduce price fluctuations
and have entered into long-term contracts with the suppliers to secure gas and electricity prices over time.
Environmental and health risks
The production processes in our industrial plants are associated with intrinsic risks of potential environmental pollution.
Taking responsibility for protecting the environment and climate is therefore of major significance and an important
corporate goal for S + BI. Efficient use of resources and energy, recyclable products, minimum
environmental impact of activities, and open dialogue with neighbours, authorities and stakeholders are the principles
that underpin our environmental behaviour. For further information about environmental and climate protection, please
refer to “Environmental protection and energy management”.
See p. 66
70 MANAGEMENT REPORT Opportunities and risks
S+Bi AG Annual Report 2014

Risks from IT/security and internal processes
The IT landscape is regularly reviewed and adjusted to ensure the professional operation of computer-assisted busi-
ness processes within the Group and with customers, suppliers and business partners. Existing data security mea-
sures are continually refined to eliminate, or at least minimise, the risks associated with IT processes.
Personnel risks
S + BI’s success hinges on the expertise and commitment of its employees. The major chal-
lenge is therefore to recruit and retain qualified specialists. S + BI emphasises further educa-
tion and training as one way to achieve this. For further information about ongoing employee training and development,
please refer to “Non-financial performance indicators”.
In view of demographic developments and the later statutory retirement age in many countries, it will be increasingly
important to have a human resources policy that is aligned to these trends. Existing structures need to be analysed in
this context in order to identify any required action. Besides the age structure analysis agreed within some collectively
bargained wage agreements, one example is the workplace stress analysis. This process examines individual stressors
in the workplace so that measures can be determined to support ergonomic standards for physical working conditions,
employee motivation, etc. Ultimately, the key challenges that we face in the years ahead will be occupational health and
safety, age-appropriate workplaces, employee retention, and maintaining a motivating corporate culture.
Financial risks
Foreign currency risk
Foreign currency risks arise mainly when trade accounts receivable and payable are settled in foreign currencies,
future revenue is planned in a foreign currency, or existing or planned fixed-price commodity supply contracts are in a
foreign currency. Currency management is country-specific, with foreign currency amounts being translated regularly
into the respective functional currency, mainly by means of forward exchange contracts.
Interest rate risk
Interest rate risks arise mainly on interest-bearing liabilities that are denominated in euro. The Executive Board stip-
ulates an appropriate target ratio of fixed and floating-rate liabilities and monitors compliance with the target on an
ongoing basis. Interest rates are primarily managed using interest rate swaps.
Commodity price risk
Commodity price risks result from fluctuations in the prices of raw materials and energy required for steel production.
Fluctuations in commodity prices can usually be passed on to customers in the form of alloy surcharges. Where this is
not possible, commodity derivative instruments are used to hedge some of the risk. Currently, these mainly comprise
forward exchange contracts for nickel. S + BI receives payments depending on the nickel
price development, and is therefore protected against price hikes.
See p. 64
71MANAGEMENT REPORT Opportunities and risks
S+Bi AG Annual Report 2014

Credit risk
Credit risks are mainly linked to trade accounts receivable, bank balances and derivative financial instruments. In
view of the broadly diversified customer base, which spans a variety of regions and industries, the credit risk on trade
accounts receivable is limited. Moreover, some of the trade accounts receivable are covered by credit insurance with
varying deductibles.
Credit risks from operating activities are mitigated by selecting external business partners based on internal credit
checks and a credit approval process. A credit risk limit is set for each contractual partner based on the internal
credit check. Each subsidiary is essentially responsible for setting and monitoring its own limits, with various approval
processes applicable depending on the credit limit. In addition, the credit and collection policies of the local entities
are captured by the internal control system and are therefore audited periodically by Internal Audit.
All of the banks with which S + BI maintains business relationships have good credit ratings
considering the prevailing market conditions and are in most cases members of deposit guarantee funds. Derivative
financial instruments are only entered into with these banks.
Liquidity risk
The Group ensures solvency at all times through a largely centralised cash management system. This involves
preparing liquidity plans comparing all the anticipated cash receipts and payments for a specified time period. In
addition, balances and irrevocable credit facilities are held with banks as liquidity reserves. Financial covenants
in most of our financing agreements are one potential source of liquidity risk and are tested for compliance at the
end of each quarter. Although compliance with the covenants is monitored on an ongoing basis, they depend on a
large number of external factors, including the general economic development. As such, they are not entirely within
S + BI’s control. Depending on the financing agreement in question, failure to comply with
the covenants can lead to a substantial increase in financing costs or trigger an obligation to settle all or part of the
relevant financial liabilities.
72 MANAGEMENT REPORT Opportunities and risks
S+Bi AG Annual Report 2014
Opportunity management
From its starting point as a collection of complementary companies, the Group became increasingly cohesive between
2003 and 2014. The Group’s market success is attributable in no small way to its consistent and systematic strategy
process which is managed and supported by the Board of Directors, Executive Board and Central Business Develop-
ment. We collect and analyse information about the market, production and R&D both at division level and centrally
from a Group perspective as the basis for strategic decision-making. This allows well-informed strategic decisions to
be taken at Group level and then implemented in cooperation with the Business Unit Heads. Our approach allows us
to derive opportunities for our Company from the risks inherent in all business activities.
Opportunities and potential for increasing the value of the Company
With global growth driven by factors such as increasing urbanisation and mobility, S + BI can
look forward to many strategic and operational opportunities in the coming years. We already offer the appropriate
products for these markets. At the same time, efficient use of resources will move up corporate agendas, creating
demand for materials with increasingly sophisticated technical qualities. The process of adapting and optimising our
high-tech materials is an ongoing one as customers’ applications demand lighter and more stress-resilient products.
In the last few years, S + BI has evolved from a medium-sized company into an international
leader in the special long steel segment. The Group’s economic success is founded on its ability to identify opportu-
nities in market and technological trends, and develop operational strategies based on these. This approach is a key
component of the Group-wide strategic dialogue and consists of three strategic moves: long-term systematic market
observation and analysis; refinement of the industrial production basis and employee development; consistent appli-
cation-relevant alignment of our product development activities.
As a unique full-range supplier with a broad portfolio of highly sophisticated products, we consider ourselves well
positioned to serve both growth markets and technically demanding segments. Our business model is aligned to the
constantly evolving demands of the applications. With such an application-driven strategy, we detect trends as they
emerge, offering tailored solutions in response. We track these trends through long-term and systematic analysis of
developments in our sales industries. We work closely with Research & Development teams to constantly optimise
production processes and the product portfolio, ensuring they are adapted to meet future challenges at all times.
73MANAGEMENT REPORT Opportunities and risks
S+Bi AG Annual Report 2014
This section contains forward-looking statements, including presentations of developments, plans, intentions, assump-
tions, expectations, beliefs and potential impacts as well as descriptions of future events, income, results, situations
or outlook. They are based on the Company’s current expectations, beliefs and assumptions, which are subject to
uncertainty and may differ materially from the current facts, situation, impact or developments.
Economic development
Global economic forecasts for 2015 are more positive than in the prior year, with the World Bank, OECD and IMF
predicting growth of between 3.0% and 3.7%. However, the regional picture will be quite mixed in 2015. The USA is
expected to drive growth, with a plus of 3.1% to 3.6%, while recovery in the eurozone will probably be much slower
with growth of 1.1% to 1.2%. Within the eurozone, the major economies are only set for modest growth. The OECD
and the MF anticipate an increase of just 1.1% to 1.3% for Germany and 0.8% to 0.9% for France. The geopolitical
landscape is still marred by uncertainty, e.g. in Ukraine, Gaza and Iraq, which is likely to dampen economic growth
again in 2015.
Development of steel demand
The World Steel Association expects steel consumption to grow by 2% in 2015, which more or less matches the
2014 level. Closer inspection, however, reveals that growth is slowing down even more, particularly in the Asian
market. Accounting for the highest steel consumption in terms of tonnes (2014: 1 050 million tonnes), appetite in
this region is expected to increase by just 1.4%. The second-largest steel consumer is the European Union with
around 150 million tonnes. After a strong year in 2014 (+ 4.0%), consumption is expected to grow just 2.9% in
2015. The third-largest market is NAFTA where steel consumption is set to increase by just 2.2% following on from
6.4% in 2014. The difficult geopolitical development mentioned above could also dampen general demand for steel.
Development of relevant sectors
The global automotive industry is set to continue the 2014 trend with growth of around 2% once again in 2015. As
in the last two years, China seems likely to be the growth driver although other major sales markets, such as the
USA and Europe, are also expected to match at least the performance of the global market. The significantly lower
oil price compared to recent years could stoke demand.
Following feeble growth in 2014, the mechanical engineering sector started 2015 on a more positive note. The
VDMA (German Engineering Association) anticipates an increase of around 2%. Due to the high level of exports, the
association expects to benefit if the euro remains weak.
The year 2015 got off to a mixed start for the oil and gas industry – and especially the fracking sector. The number
of active wells has already decreased following the sharp fall in the oil price from mid-2014 onwards. Only the most
efficient fracking firms with sound financing are expected to survive the current crisis.
Development of commodity prices and currencies
For 2015, commodity analysts forecast a significant increase in the nickel price compared to the 2014 closing
price of USD 14 855/tonne. This expectation is based on the assumption that Indonesia’s continuing export ban will
trigger supply shortages by the second half of 2015 at the latest. At the same time, demand for special steel will
increase, driven largely by China. In the first two months of the new fiscal year, however, there were no signs of a
higher nickel price.
OUTLOOK
We stand by our medium-term goals: from 2016 onwards, we intend to generate an adjusted EBITDA of > EUR 300 million and an adjusted EBITDA margin of > 8% over an economic cycle. We want to reduce the adjusted EBITDA leverage to a sustainable figure of < 2.5x.
S+Bi AG Annual Report 2014
74 MANAGEMENT REPORT Outlook

The oil price, which was squeezed massively in 2014, is unlikely to recover to its previous level of over USD 100/
barrel any time soon. Experts put the average price per barrel of North Sea Brent Crude at around USD 60 for 2015.
At the same time, the general economy stands to benefit from lower price levels due to falling consumer prices for
petrol and heating oil.
After several years where the Swiss National Bank defended a CHF/EUR exchange rate of 1.20, the certainty no
longer applies in 2015. The policy was abandoned on 15 January 2015 and the exchange rate has hovered in a
corridor of CHF/EUR 1.00 to 1.07. Experts do not expect the Swiss franc to weaken significantly against the euro.
The euro is set to remain weak against the dollar in conditions that favour the export business.
Development of the s + bi Group
As presented above, forecasts around the general economy and steel consumption specifically paint a mixed picture.
We begin the fiscal year 2015 with cautious expectations. Our sales volumes in 2015 should roughly match the 2014
level. Price changes for alloying elements, such as nickel, and scrap are largely passed on to our customers via a
surcharge system. This means that revenue fluctuates – sometimes significantly – due to external factors beyond our
control. We will therefore no longer guide revenue for the Group in future.
With the Swiss franc stronger against the euro since January 2015, we expect negative effects on earnings for 2015
as a whole. EBITDA was burdened by a one-off negative effect of around EUR 7 million (as at the end of February
2015) as a result of translating the net trade receivables denominated in euro in the balance sheets of our Swiss
operating companies. A positive currency effect from translating financial liabilities into euro as well as hedging will
partially make up for this burden. There is also a current effect due to the appreciation of the Swiss franc against
the euro. Preliminary sensitivity analyses show that every increase of one centime in the Swiss franc against the
euro would see EBITDA fall by around CHF 1.5 million per year. Translation effects in the opposite direction will only
partially make up for this.
Influenced by the effects described above, our EBITDA for 2015 is expected to come in at between EUR 210 million
and EUR 250 million. This estimate is also based on the assumption that forecasts as to the development of the
economy and commodity prices prove accurate and that no other unexpected events occur that impact negatively on
our business activities.
We plan to invest more heavily in 2015, with a total volume of around EUR 150 million. This is due to the planned
acquisition of additional land at the main Dusseldorf site, which is home to S + BI Distribu-
tions GmbH and S + BI Blankstahl GmbH, as well as the purchase in January 2015 of a slag
disposal site at Deutsche Edelstahlwerke’s Siegen plant.
Following its launch in 2013, our comprehensive earnings improvement programme is clearly progressing success-
fully. The Group will step up efforts and expand the programme with additional measures in response to the currency
challenges we face in 2015.
We stand by our medium-term goals: from 2016 onwards, we intend to generate an adjusted EBITDA of > EUR 300
million and an adjusted EBITDA margin of > 8% over an economic cycle. We hope to bring down adjusted EBITDA
leverage (ratio of net debt to adjusted EBITDA) sustainably to < 2.5x.
S+Bi AG Annual Report 2014
75MANAGEMENT REPORT Outlook

S+Bi AG Annual Report 2014
S+Bi AG Annual Report 2014
Corp
orat
e Go
vern
ance
Corporate Governance
Group structure and shareholders
Capital structure
Board of Directors
Executive Board
Compensation, participations and loans
Shareholders’ rights of participation
Change of control and defence measures
External auditor
Information policy
78
80
82
90
92
93
93
94
95
78 CORPORATE GOVERNANCE
S+Bi AG Annual report 2014
CORPORATE GOVERNANCE
Corporate governance was once again a topic of focus in 2014. Several important policies were revised, including the Group’s guidelines on anti- corruption and antitrust law. The Board of Directors analysed the Swiss Code of Best Practice for Corporate Governance, which was overhauled in September 2014. An in-depth requirement analysis was initiated in certain areas to identify any appropriate amendments.
1_ Group structure and shareholders
1.1 Group structure
S + Bi AG is a company organised under Swiss law. Headquartered in Emmen, the Company
was first entered in the commercial register of the canton of Lucerne on 20 September 1887 under the name “Aktien-
gesellschaft der Von Moosschen Eisenwerke”. The registry code is CH-100.3.010.656-7.
1.1.1 Group operating structure
The operating organisation is described in the segment reporting on pages 160 to 163 of this annual report.
Management and supervision of the S + Bi Group are based on the Company’s articles of
incorporation, organisational regulations, organisational charts, mission statement and other documents that set out
the corporate policy and business principles.
The management structure is aligned to the Group’s business strategy. As a global leader in special long steel, the
Group’s organisation reflects the supply chain, with two divisions: Production and Sales & Services. This structure
leverages global synergies, enabling the Group to secure a stable business basis even in a difficult market environment
and pursue its goal of defending and expanding on its position. Please refer to pages 167 to 168 of this annual report
for a breakdown of companies by division.
1.1.2 Listed company
Name S + Bi AG
Registered office Emmenweidstrasse 90, EmmenListed on SIX Swiss Exchange, Main StandardMarket capitalisation CHF 1 020.6 million (Closing price on 30 December 2014: CHF 1.08)Symbol STLNSecurities number 579 566ISIN CH000 579 566 8
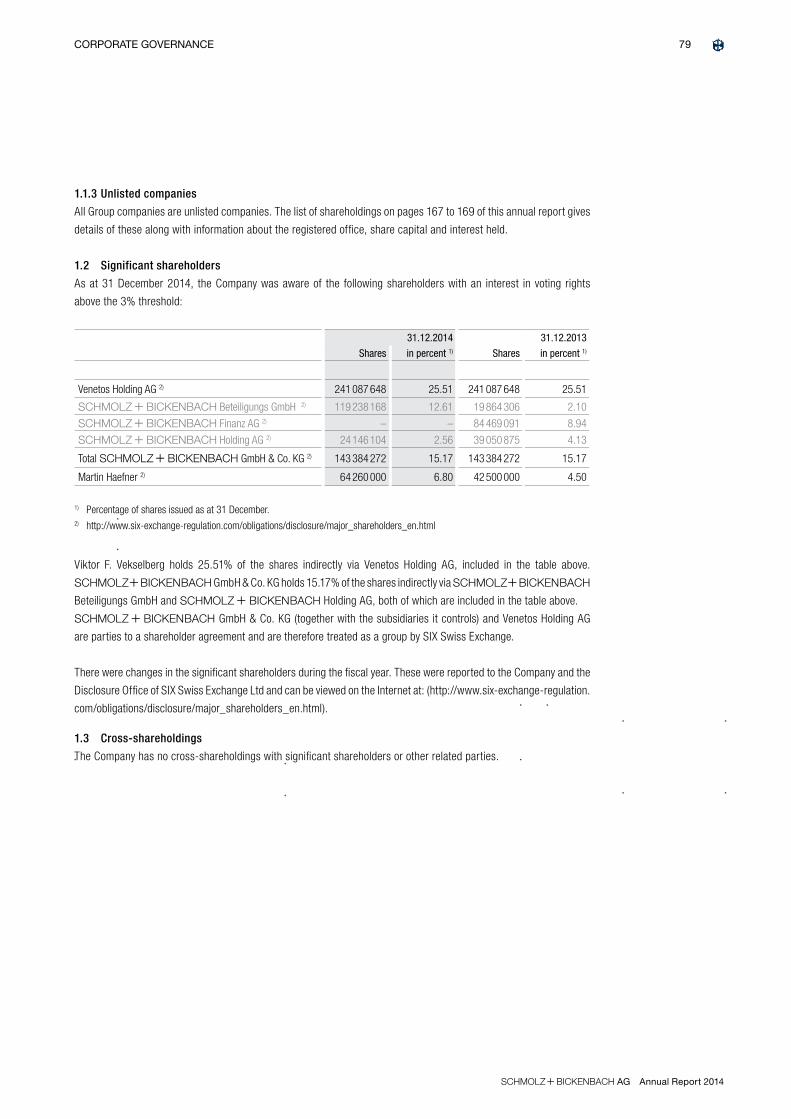
79CORPORATE GOVERNANCE
S+Bi AG Annual Report 2014
1.1.3 Unlisted companies
All Group companies are unlisted companies. The list of shareholdings on pages 167 to 169 of this annual report gives
details of these along with information about the registered office, share capital and interest held.
1.2 Significant shareholders
As at 31 December 2014, the Company was aware of the following shareholders with an interest in voting rights
above the 3% threshold:
31.12.2014 31.12.2013
Shares in percent 1) Shares in percent 1)
Venetos Holding AG 2) 241 087 648 25.51 241 087 648 25.51
S + Bi Beteiligungs GmbH 2) 119 238 168 12.61 19 864 306 2.10
S + Bi Finanz AG 2) – – 84 469 091 8.94
S + Bi Holding AG 2) 24 146 104 2.56 39 050 875 4.13
Total S + Bi GmbH & Co. KG 2) 143 384 272 15.17 143 384 272 15.17
Martin Haefner 2) 64 260 000 6.80 42 500 000 4.50
1) Percentage of shares issued as at 31 December.2) http://www.six-exchange-regulation.com/obligations/disclosure/major_shareholders_en.html
Viktor F. Vekselberg holds 25.51% of the shares indirectly via Venetos Holding AG, included in the table above.
S+Bi GmbH & Co. KG holds 15.17% of the shares indirectly via S+Bi
Beteiligungs GmbH and S + Bi Holding AG, both of which are included in the table above.
S + Bi GmbH & Co. KG (together with the subsidiaries it controls) and Venetos Holding AG
are parties to a shareholder agreement and are therefore treated as a group by SIX Swiss Exchange.
There were changes in the significant shareholders during the fiscal year. These were reported to the Company and the
Disclosure Office of SIX Swiss Exchange Ltd and can be viewed on the Internet at: (http://www.six-exchange-regulation.
com/obligations/disclosure/major_shareholders_en.html).
1.3 Cross-shareholdings
The Company has no cross-shareholdings with significant shareholders or other related parties.
80 CORPORATE GOVERNANCE
S+Bi AG Annual report 2014
2_ Capital structure
2.1 Capital
Share capital
As at 31 December 2014, the ordinary share capital of S + Bi AG amounted to
CHF 472 500 000, divided into 945 000 000 registered shares with a par value of CHF 0.50 per share. All registered
shares are fully paid up and there are no further capital contribution obligations on the part of shareholders.
Under the terms of the articles of incorporation, the Annual General Meeting may at any time convert existing registered
shares into bearer shares.
The Company also has authorised and conditional capital as described in section 2.2.
2.2 Authorised and conditional capital in particular
The Company has authorised capital in accordance with Art. 3d of the articles of incorporation. The Board of Directors
is authorised until 17 April 2016 to increase the share capital by a maximum of CHF 236 250 000 through the issue
of no more than 472 500 000 fully paid-up registered shares with a par value of CHF 0.50 each. The capital increase
may be staggered and/or carried out through underwriting. The Board of Directors is free to define the specific issue
amount, date of dividend entitlement, conditions for exercising subscription rights and type of deposits. The statutory
restrictions on transferability apply to these registered shares as well. The Board of Directors is also authorised to
exclude shareholders’ subscription rights and to assign to third parties if such new shares are intended to be used for
company acquisitions by way of share swap or to finance acquisitions of companies, parts of companies or sharehold-
ings, or new investment undertakings of the Company. Shares for which subscription rights have been issued, but not
exercised, are available for use by the Board of Directors in the interests of the Company.
The Company has conditional capital in accordance with Art. 3e of the articles of incorporation. Share capital may
conditionally be increased by a maximum of CHF 110 000 000 through the issue of no more than 220 000 000 fully
paid-up registered shares with a par value of CHF 0.50 each. Of this, up to CHF 94 500 000 can be exercised in the
form of options and/or conversion rights granted in connection with bonds or similar debt instruments of the Com-
pany or a Group company. Also exercisable are up to CHF 15 500 000 of options granted to employees, members of
the Board of Directors and executive management of the Company or its Group companies, excluding shareholders’
subscription rights. The statutory restrictions on transferability apply to the purchase of registered shares through
exercise of options or conversion rights and onward transfer of registered shares. If options and/or conversion rights are
granted to finance the acquisition of companies, parts of companies, shareholdings or new investment undertakings
and/or the placement of options and/or conversion rights or similar capital instruments on international markets, the
Board of Directors may pass a resolution to exclude preferential subscription rights. If preferential subscription rights
are granted, the Board of Directors may use any preferential subscription rights not exercised by the shareholders in
the interests of the Company. In the case of convertible bonds, options or similar capital instruments not offered for
preferential subscription, the new shares are issued in accordance with the conversion or option conditions. Convertible
bonds and options or other capital instruments should be issued at customary market conditions. The exercise period
should be set at no more than 10 years from the date of issue for options and no more than 20 years from the date
of issue for conversion rights. The conversion or option price for the new registered shares must be in line with the
market conditions prevailing on the issue date. Preferential subscription rights are excluded for options granted to
employees, members of the Board of Directors and executives of the Company or its Group companies. Rather, the
Board of Directors creates specific plans for the issue of such options.

81CORPORATE GOVERNANCE
S+Bi AG Annual Report 2014
2.3 Changes in capital
There were no changes to the share capital in 2012.
As agreed by resolution on 26 September 2013, the share capital was reduced and simultaneously increased in 2013.
The par value of the 118 125 000 old shares was first reduced from CHF 3.50 to CHF 0.50 per share. Simultaneously,
the share capital was increased by the issue of 826 875 000 shares with a par value of CHF 0.50 per share. As a
result, the share capital of the Company as at 31 December 2013 comprised 945 000 000 registered shares with
a par value of CHF 0.50 per share.
There were no changes to the share capital in 2014.
Neither the approved nor the conditional capital as described in section 2.2. had been exercised as at the end of the
reporting period.
2.4 Shares and participation certificates
Share capital comprised 945 000 000 registered shares with a par value of CHF 0.50 per share as at 31 December
2014. The Company held 22 985 treasury shares as at year-end; these ensure that it is in a position to meet its
obligations from the management participation programmes. Each share entitles the holder to one vote. Voting rights
may only be exercised if the shareholder has been registered in the Company’s share register as a shareholder with
voting rights in time for a given vote. Certificates are not issued for registered shares; rather, they are recorded by
book entry in the central depository system of areg.ch ag. Shareholders are not entitled to request a printed copy
or delivery of share certificates. All shareholders can, however, request from the Company at any time a document
confirming the shares in their ownership.
S + Bi AG has not issued any participation certificates.
2.5 Dividend-right certificates
S + Bi AG has not issued any dividend-right certificates.
2.6 Limitations on transferability and nominee registrations
Certificated shares can be physically deposited with a depositary; paperless shares can be entered in the principal
register of a depositary and credited to a securities account (creation of intermediated securities). Intermediated secu-
rities can only be disposed of, or pledged as collateral, in accordance with the provisions of the Swiss Federal Act on
Intermediated Securities. Paperless securities that do not qualify as intermediated securities can only be transferred
by assignment. The Company must be notified of such assignment for it to be valid. In accordance with the articles of
incorporation, nominees of registered shares may upon request be entered without restriction in the share register as
a shareholder with voting rights if they expressly declare that they acquired the registered shares in their own name
and for their own account. If no such declaration is made, nominees are registered with voting rights up to a maximum
of 2% of the share capital. Beyond this limit, nominees with registered shares are registered with voting rights only if
they provide a written declaration that they are prepared to disclose the addresses and shareholdings of persons for
whose account they hold 0.5% or more of the outstanding share capital. Except for the nominee clause there are no
restrictions on transferability, nor are any privileges granted under the articles of incorporation; therefore, no exceptions
had to be granted in 2014. Revocation or amendment of these stipulations requires the agreement of at least two thirds
of the represented votes and the absolute majority of the represented nominal share values.
2.7 Convertible bonds and options
The Company had no convertible bonds or options outstanding as at 31 December 2014.

82 CORPORATE GOVERNANCE
S+Bi AG Annual Report 2014
3_ Board of Directors
3.1 Members of the Board of Directors
This section provides details of the composition of the Board of Directors as at 31 December 2014.
Edwin Eichler (DE) 1
Year of birth 1958 Chairman Member of the Strategy CommitteeMember since 2013 Elected until 2015
Vladimir V. Kuznetsov (RU) 2
Year of birth 1961 Vice Chairman Chairman of the Compensation Committee Member of the Strategy CommitteeMember since 2013 Elected until 2015
Michael Büchter (DE) 1 Year of birth 1949 Member Member of the Audit Committee Member since 2013 Elected until 2015
Dr Oliver Thum (DE) 3
Year of birth 1971 MemberMember of the Strategy CommitteeMember since 2013 Elected until 2015
Marco Musetti (CH) 2 Year of birth 1969 Member Chairman of the Strategy Committee Member of the Audit CommitteeMember since 2013 Elected until 2015
Dr Heinz Schumacher (DE) 1 Year of birth 1948 MemberMember of the Compensation Committee Member since 2013 Elected until 2015
Hans Ziegler (CH) 1 Year of birth 1952 MemberChairman of the Audit CommitteeMember of the Compensation CommitteeMember since 2013 Elected until 2015
S + Bi Board of Directors
Unless otherwise stated, the members of the Board have no significant business relationships with Group companies.
For details of business relationships with certain companies represented by members of the Board of Directors,
including, but not limited to, the Renova Group and associates of S + Bi GmbH & Co. KG,
see the notes to the consolidated financial statements, note 13_Related party disclosures, on pages 164 to 165 of
this annual report.
1 Independent member.2 Representative of Renova.3 Representative of S + Bi GmbH & Co. KG.
See p. 164

S+Bi AG Annual Report 2014
Vladimir V. Kuznetsov (RU)_Vice-Chairman_Non-executive member
Vladimir Kuznetsov graduated in economics from Moscow State Uni-
versity and holds a PhD from the Institute of World Economy and In-
ternational Relations, Moscow (Soviet Union/Russia), and a Master of
International Affairs, Columbia University, New York (USA). He was first
elected to the Board of Directors on 26 September 2013. From 1982 to
1994 Vladimir Kuznetsov was Head of the Financial Markets Research
Department of the Institute for Economics and International Relations,
Moscow. From 1992 to 1994 Mr Kuznetsov was Deputy Director and
Director at Goldman Sachs, Moscow, and from 1994 to 1998 Head of
the Moscow subsidiary of Salomon Brothers, Moscow. From 2001 to
2009 Mr Kuznetsov was Vice President of Renova Inc., New York, and
from 2004 to 2011 Chief Investment Officer of Renova Management
AG, Zurich (Switzerland). From 2007 to 2011 he served as Chairman of
the Board of Directors of OC Oerlikon Corporation AG, Pfäffikon (Swit-
zerland). From 2008 to 2010 Vladimir Kuznetsov was the Chairman of
the Board of Directors of Venetos Management AG, Zurich, and from
2011 until 2014 he was Managing Director of Strategic Development at
Renova Management AG, Zurich. From 2007 till 2014 he served on the
Board of Directors of Sulzer AG, Winterthur (Switzerland), including as
Vice Chairman. Mr Kuznetsov is also a member of the Board of Directors
of Renova Management AG, Zurich.
Edwin Eichler (DE)_Chairman_Non-executive member
Edwin Eichler has a degree (Diplom) in computer science from the
University of the German Federal Armed Forces in Munich (Germany).
He was first elected to the Board of Directors on 26 September 2013.
Alongside his German Federal Armed Forces obligations, Edwin Eichler
took care of the family-owned business, the church bell foundry Perner
GmbH & Co KG, Passau (Germany), from 1978 to 1990. For the next
twelve years, Mr Eichler worked for Bertelsmann AG, Gutersloh (Ger-
many), serving on the Executive Committee of Bertelsmann Arvato AG
from 1996 to 2002. Between 2002 and 2012, Edwin Eichler occupied
various positions on the Executive Board of ThyssenKrupp AG, Essen
(Germany): CEO of TK Material Services AG (2002 to 2009), CEO of TK
Elevator AG (2005 to 2009), CEO of TK Stainless AG (2009), Chairman
of the Supervisory Board of TK Stainless AG (2009 to 2012), CEO of
TK Steel Americas (2009 to 2012), CEO of ThyssenKrupp Steel Europe
AG (2009 to 2012) and Chairman of the Supervisory Board of TK Mate-
rial Services AG (2009 to 2012). Edwin Eichler has been a member of
the Supervisory Boards of SGL Carbon SE, Wiesbaden (Germany) since
2009, Heidelberg Druck AG, Heidelberg (Germany) since 2005, and
SMS Holding GmbH, Dusseldorf (Germany) since 2013. Edwin Eichler is
also a member of the University Council of the University of Dortmund
(Germany). He has been CEO of the Sapinda Group since January 2014.
83CORPORATE GOVERNANCE

S+Bi AG Annual Report 2014
84 CORPORATE GOVERNANCE
Marco Musetti (CH) _ Non-executive member
Marco Musetti majored in economics at the University of Lausanne
(Switzerland) and holds a Master of Science in Accounting and Finance,
London School of Economics and Political Science (United Kingdom).
He was first elected to the Board of Directors on 26 September 2013.
From 1992 to 1998, Marco Musetti was Deputy Head of the Metals
Desk at Banques Bruxelles Lambert (Suisse) S.A., Geneva (Switzerland)
and from 1998 to 2000, he worked for Banque Cantonale Vadoise,
Lausanne (Switzerland) as Head of the Metals and Structured Finance
Desk. Between 2000 and 2007, Mr Musetti acted as COO and Deputy
CEO for Aluminium Silicon Marketing GmbH, Zug (Switzerland). Since
2007 he has been a senior officer at Renova Management AG, Zurich
(Switzerland). From 2007 to 2014 he served on various boards of Re-
nova group companies and was Deputy Chairman of Venetos Holding
AG, Zurich, Chairman of the Board of Directors of Avelar Energy Ltd,
Zurich, and Chairman of the Board of Energetic Source Spa, Milano,
(Italy). Marco Musetti has served on the Supervisory Board of Renova
U.S. Holdings Ltd. (USA) since 2009 and on the Board of Directors of
Sulzer AG, Winterthur (Switzerland) since 2011.
Michael Büchter (DE) _ Non-executive member
Michael Buchter completed an apprenticeship in international trade at H.K.
Westendorff, Dusseldorf (Germany) in 1970. He was first elected to the
Board of Directors on 26 September 2013. From 1970 to 1972, Michael
Buchter worked for Stalco International Inc. New York (USA) and from 1972
to 1986 for Brandeis Goldschmidt & Co. Ltd. London (United Kingdom) in
roles ranging from junior trader in New York, General Manager Far East
in Tokyo (Japan) and director in London. Brandeis Goldschmidt & Co. Ltd.
is a founding member of the London Metal Exchange and International
Metal Merchants. Between 1986 and 1991, Michael Buchter was Director
and Global Head of Metal Trading for Hoffling House & Co. Ltd., London.
From 1991 to 2014, Mr Buchter headed up the Metal Desk and served as
a member of the branch Executive Committee of ING Belgium in Geneva
(Switzerland). Since 2014, he has been a member of the Board of Traxys
Sarl (Luxembourg).

S+Bi AG Annual Report 2014
85CORPORATE GOVERNANCE
Dr Oliver Thum (DE) _ Non-executive member
Dr Oliver Thum holds a PhD and an M.Sc. in Engineering-Economic Systems from
Stanford University, Stanford (USA). He was first elected to the Board of Directors
on 26 September 2013. From 1990 to 1992, Dr Oliver Thum worked for BHF Bank,
Stuttgart (Germany). From 1998 to 2000, he was a consultant at Bain & Company,
San Francisco (USA). From 2000 to 2001, Mr Thum was a principal of Earlybird
Venture Capital, Munich (Germany) and from 2001 to 2009, managing director of
General Atlantic, Dusseldorf (Germany) and London (United Kingdom). He has been
managing partner of the private equity firm Elvaston Partners, London since 2009
and Elvaston Capital Management GmbH, Berlin (Germany) since 2013. Since 2013,
he has been managing director at S + Bi GmbH & Co.
KG, Dusseldorf.
Dr Heinz Schumacher (DE) _ Non-executive member
Dr Heinz Schumacher, attorney-at-law, was first elected as a member of
the Board of Directors on 26 September 2013. Since 1977 he has been
practicing law in his own firm and he has also been managing director
at Arenbergische Gesellschaften (Germany), a group of corporations for
asset and participation management since 1984. He is, inter alia, Chair-
man of the Board of Directors of Bergbahnen Disentis AG (Switzerland),
Chairman of the Management Board of Stiftung Prosper-Hospital (Ger-
many), Chairman of the Supervisory Board of KVVR Klinik Verbund Vest
Recklinghausen gGmbH (Germany), VKKD Verbund Katholischer Kliniken
Dusseldorf gGmbH (Germany), Arenberg Consult GmbH (Germany), Chair-
man of the Advisory Committee of Eggert KG (Germany) and member of
the Board of Directors of TownTalker Media AG (Germany).
Hans Ziegler (CH) _ Non-executive member
Hans Ziegler has a degree as a business economist (“KSZ”) and completed
a post-graduate course in business administration and information tech-
nology at TCU in Dallas-Fort Worth (USA). He was first elected to the Board
of Directors on 26 September 2013. After holding a number of positions at
SBG and Ericsson, he joined Alcon Pharmaceuticals Cham, Fort Worth as
CFO/controller. From 1988 to 1991, Hans Ziegler was CFO at the Usego
Trimerco Group. Between 1991 and 1995, he held the position of CFO at
the Globus Group. In 1996, he founded a consultancy firm, operating in
Switzerland and abroad and specialising in corporate restructuring, turn-
around management and repositioning. He was a member of the Board
of Directors of Elma Electronic AG, Wetzikon (Switzerland) from 2001 to
2009 and of Schlatter Holding AG, Schlieren (Switzerland) from 2006 to
2010. He is Chairman of the Board of Directors of Swisslog Holding AG,
Buchs (Switzerland) as well as a Chairman of the Board of Directors of
Charles Vögele Holding AG in Pfäffikon (Switzerland). Furthermore, he
serves on the Board of Directors of OC Oerlikon Corporation AG, Pfäffikon.

86 CORPORATE GOVERNANCE
S+Bi AG Annual report 2014
3.2 Other activities and vested interests
The above profiles of members of the Board of Directors provide information on their activities and commitments in
addition to their functions at S + Bi AG.
3.3 Elections and term of office
The Board of Directors consists of between five and nine members. At the Annual General Meeting of 17 April 2014, all
members of the Board of Directors were re-elected until the 2015 Annual General Meeting. The members of the Board
of Directors are elected individually. The Chairman of the Board of Directors is elected by the Annual General Meeting.
In accordance with the articles of incorporation and organisational regulations, the Board appoints from among its
members a Vice Chairman for each term of office, and designates a Secretary, who need not be a member of the Board.
At the latest, the term of office of each member and the Chairman of the Board of Directors expires at the end of the
Annual General Meeting following their election. Re-election is possible.
3.4 Internal organisational structure
The organisational regulations provide that the Board of Directors meet as often as business requires, usually once
per quarter. The Board of Directors convened on ten occasions in fiscal 2014 to discuss current business. These
meetings typically last between one and six hours, and are normally attended by the members of the Executive Board.
In the reporting period, external consultants were called upon for assistance with various legal and financial issues.
The Board of Directors requests regular reports about the Compliance organisation and current Compliance issues
within the S + Bi Group. The Board of Directors is quorate when at least half of its members
are present. For the notarisation of resolutions related to capital increases, only one member needs to be present (Art.
651a, 652g, 653g Swiss Code of Obligations (CO)). Resolutions and elections require a simple majority of the votes
cast. Abstentions do not count as votes cast. In the event of a tie, the Chairman has the casting vote. In urgent cases,
the Board of Directors can also pass resolutions by correspondence for inclusion in the minutes of the next meeting,
provided that no member requests their verbal discussion.
The Board of Directors has set up three committees from its midst:
Audit Committee
The members of this committee are Hans Ziegler (Chairman), Marco Musetti (member) and Michael Buchter (mem-
ber). The regulations provide that the Audit Committee meet as often as business requires, usually at least twice per
fiscal year. The Audit Committee met six times in fiscal 2014. The external auditor, the Head of Group Accounting
& Controlling, the Head of Internal Audit + Compliance and the Group Risk Manager attended the relevant meetings
as required. The members of the Executive Board also participated. Generally, such meetings last between two and
three hours. There are separate regulations governing the specific tasks and responsibilities of the Audit Committee.
These stipulate that the Audit Committee should consist of at least three members of the Board of Directors who are
not actively involved in the Company’s business activities. The main tasks of the Audit Committee are as follows:
Financial reporting
> Assessing and monitoring the efficiency of the financial reporting system of the Group (IFRS), the efficiency of the
financial information and the necessary internal control instruments
> Ensuring compliance with the Group accounting policies and assessing the effects of departures from these
External auditor
> Assisting the Board of Directors with the selection and appointment of the external auditor
> Reviewing and approving the audit plan
> Evaluating the performance, fees and independence of the external auditor
> Evaluating cooperation with Internal Audit

87CORPORATE GOVERNANCE
S+Bi AG Annual Report 2014
Internal Audit
> Assisting with the selection of Internal Audit and its tasks
> Evaluating the performance of Internal Audit
> Reviewing and approving the audit plan
> Evaluating cooperation with the external auditor
Other duties
> Evaluating the internal control and information system
> Taking receipt of and discussing the annual report on important, threatened, pending, and closed litigation with
significant financial consequences
> Verbal and written reporting to the Board of Directors
> Reviewing the measures to prevent and detect fraud, illegal activities, or conflicts of interest
The Audit Committee is also responsible for submitting regular verbal and written reports to the full Board of Directors.
Compensation Committee
The members of this committee are elected individually once a year by the Annual General Meeting in accordance with
the law and the articles of incorporation. At the latest, the term of office of each member of the Compensation Com-
mittee expires at the end of the Annual General Meeting following their election. Re-election is possible. The members
of this committee are Vladimir Kuznetsov (Chairman), Dr Heinz Schumacher (member) and Hans Ziegler (member).
The regulations provide that the Compensation Committee meets as often as business requires, usually at least once
per fiscal year. The Compensation Committee met nine times in fiscal 2014 with meetings lasting between one and
four hours. There are separate regulations governing the tasks and responsibilities of the Compensation Committee.
The Committee consists of at least three members of the Board of Directors. The committee is tasked with preparing
the resolution of the Board of Directors on the Board of Directors’ and Executive Board’s compensation, and issuing a
proposal to this effect to the Board of Directors. Its duties include, but are not limited to, the following:
> Determining the principles for selecting candidates for election or re-election to the Board of Directors
> Determining the principles for selecting members of the Executive Board
> Preparing proposals for the Board of Directors regarding the appointment of members of the Executive Board
> Preparing proposals for the Board of Directors regarding personnel developments and succession planning for the Group
management
> Preparing proposals regarding compensation of the members of the Board of Directors of the Company, the committees
and the Executive Board and drafting a proposal for the resolution on such compensation for the attention of the Board
of Directors; the Annual General Meeting votes on whether to approve the resolution of the Board of Directors
> Determining the specific compensation of the members of the Board of Directors, the committees and the Executive
Board in accordance with the principles approved by the Board of Directors
> Preparing the compensation report
> Approving any mandates of the Executive Board beyond the S + Bi Group
The Compensation Committee reports to the full Board of Directors on the content and scope of decisions made.
88 CORPORATE GOVERNANCE
S+Bi AG Annual report 2014
Strategy Committee
The members of this committee are Marco Musetti (Chairman), Vladimir Kuznetsov (member), Edwin Eichler (mem-
ber) and Dr Oliver Thum (member). The regulations provide that the Strategy Committee meet as often as business
requires, usually at least twice per fiscal year. The committee met four times in fiscal 2014 with meetings lasting
between two and three hours. The members of the Board of Directors and Executive Board were entitled to attend
as guests. The Strategy Committee supports the Board of Directors in meeting its responsibilities for developing and
rolling out the corporate strategy across the Group. The duties of the Strategy Committee include, but are not limited
to, the following:
> Reaching major strategic decisions, including ones about acquisitions and disposals, and collaboration/joint
venture opportunities that are material for the Group
> Strategic planning and defining development priorities
> Defining corporate policy
Besides the Strategy Committee members, the CEO and CFO also usually attend Strategy Committee meetings in an
advisory capacity. If not already a regular member of the Strategy Committee, the Chairman of the Board of Directors
is entitled to attend as a guest. The Strategy Committee reports to the full Board of Directors on the content and
scope of decisions made.
3.5 Definition of areas of responsibility
The Board of Directors is the most senior executive body in the Group’s management structure and rules on all matters
that are not expressly entrusted to another governing body in accordance with the law, the articles of incorporation
or the organisational regulations.
The Board of Directors has delegated all duties except for those that are non-transferable and inalienable in accordance
with the law. The non-transferable and inalienable duties of the Board of Directors include, but are not limited to:
> Managing the Company as the supreme governing body and issuing all necessary directives
> Defining the Company’s organisation
> Designing the accounting, financial control and financial planning systems as required for the management of the
Company
> Appointing and dismissing persons entrusted with managing and representing the Company
> Assuming overall supervision of the persons entrusted with managing the Company, in particular with regard to
compliance with the law, articles of incorporation, regulations and directives
> Compiling the annual report and the compensation report, preparing and leading the Annual General Meeting, and
implementing its resolutions
> Notifying the court in the event of overindebtedness
> Preparing resolutions on the payment of subsequent contributions to shares that are not fully paid up
> Preparing resolutions on capital increases and the associated amendments to the articles of incorporation
> Other non-transferable and inalienable duties, in relation to the Swiss Merger Act, for example
The Board of Directors is the supreme governing body of the Company, responsible for supervising and monitoring
the Executive Board, and issuing corporate policies. It also defines the strategic objectives and allocates general
resources required to achieve them. With the exception of duties reserved for the Board of Directors or its committees,
all executive management tasks within the Company and Group are delegated to the Executive Board. The CEO chairs
the Executive Board, which consists of the CEO and CFO. Until 31 March 2014, the Executive Board was composed
of just one member who assumed the duties of both CFO and CEO (the latter ad interim). The Executive Board was
restored to full strength with two members as at 1 April 2014. The CEO issues supplementary guidelines governing
the duties and authority of members of the Executive Board and Business Unit Management. The Board of Directors
receives notification of these responsibilities and any subsequent changes at the next meeting of the Board of Direc-
89CORPORATE GOVERNANCE
S+Bi AG Annual Report 2014
tors at the latest. Members of the Executive Board are appointed by the Board of Directors on the recommendation
of the Compensation Committee, while other members of the Executive Committee (until 12 March 2014 including
Business Unit Heads) are appointed by the Executive Board. The Chairman of the Board of Directors monitors the
implementation of measures approved by resolution of the Board of Directors, supervises the CEO and his activities,
and evaluates performance with him regularly.
3.6 Instruments for reporting and control: Executive Committee
A transparent management information system (MIS) is used to support the Board of Directors’ reporting and control
activities relating to the Executive Board and Business Unit Management. The MIS sources information from monthly,
quarterly and end-of-year reports, among other things. Every member of the Board of Directors may request infor-
mation from the Executive Board about any Company matter, provided the Chairman of the Board is informed of the
request. The Executive Board updates the Board of Directors at every meeting on current business developments and
significant business transactions. Between meetings, all members of the Board of Directors can request information
from the Executive Board about the progress of business and, with the authorisation of the Chairman, about specific
business transactions.
Enterprise Risk Management (ERM)
The Group’s risk management objective is to detect opportunities and risks at an early stage and respond in a way
that is conducive to achieving corporate goals and continuously increasing the value of the Company. As part of the
evaluation process, the Group consciously enters into appropriate, transparent and manageable risks. If certain risks
become too significant, the Group explores options for transferring them to third parties. There are codes of conduct
and guidelines in place at the individual subgroups to monitor their compliance and control. The Group does not per-
mit speculation or other high-risk transactions. Our conduct towards suppliers, customers, other business partners,
employees and Group companies is fair and responsible.
Led by S + Bi AG, a Group-wide standardised Enterprise Risk Management (ERM) system
is deployed as a cohesive framework ensuring systematic and efficient risk management. The ERM enables the com-
prehensive analysis of risks, including probability of occurrence, potential damages and damage limitation measures,
and is an integral component of the annual strategy process. This approach helps maintain a high level of awareness
among managers. The risk management duties are defined and explained in our Corporate Policy Manual and are
illustrated with examples. According to the policy, the objective of the ERM is to ensure that risks are identified and
optimised and that opportunities are exploited. Operational management is directly responsible for the early detection,
monitoring and communication of risks, while responsibility for control lies with the Executive Board and ultimately
with the Board of Directors.
Insurance policies have been taken out for the majority of insurable risks, when this makes commercial sense. As a
result, the corresponding risks have been transferred to the insurance companies. Where necessary, preventive mea-
sures to avert and avoid loss have been implemented by the operating entities. Aspects covered by the ERM include
currency, interest-rate and credit risk management. For details of the instruments available for this purpose, please
refer to the information on financial instruments in the notes to the consolidated financial statements.
The IT landscape is regularly reviewed and adjusted to ensure the professional operation of computer-assisted business
processes within the Group and with customers, suppliers and business partners. Existing data security measures are
continually refined to eliminate, or at least minimise, the risks associated with IT processes.
Key factors affecting the Group’s economic development are the volatility of steel prices and the Group’s economic
dependence on the automotive and mechanical engineering industries. The Group strives to balance risks by contin-
ually developing its broad product portfolio, adopting an international sales focus, diversifying the business portfolio,
focusing on niche products and optimising the supply chain.
See p. 150

90 CORPORATE GOVERNANCE
S+Bi AG Annual report 2014
4_ Executive Board
4.1 Members of the Executive Board
By resolution of 12 March 2014, the Board of Directors redefined “Executive Committee” to mean the members of
the Executive Board only from 2014 onwards. In accordance with the organisational regulations applicable as at the
reporting date, the Executive Board consists of the Chief Executive Officer (CEO) and the Chief Financial Officer (CFO).
Hans-Jurgen Wiecha (CFO) was the only member of the Executive Board until 31 March 2014, assuming the duties of
CEO ad interim as well. Hans-Jurgen Wiecha left the Company as at 28 February 2015. The Executive Board consisted
of the following members between 1 April 2014 and the reporting date:
Internal Audit
Internal Audit is an independent auditing and advisory body. For administrative purposes it is allocated to the division
of the Chief Financial Officer and receives audit engagements from the Executive Board and the Audit Committee.
An important component of the ERM, Internal Audit produces risk analyses and assesses the effectiveness and effi-
ciency of the internal control systems. The Board of Directors and the Audit Committee request periodic reports on
ERM results. In accordance with the audit plan approved by the Executive Board and Audit Committee, Internal Audit
conducted several audits and analyses in the reporting period. These were then discussed by the Audit Committee
which passed resolutions on any necessary measures and monitored the implementation of these in cooperation with
the responsible Group and Business Unit Head.
Name Function Period
Clemens Iller CEOCFO ad interim
Since 1.4.20141.3.2015 – 31.3.2015
Hans-Jurgen Wiecha CFOCEO ad interim
1.1.2014 – 28.2.20151.1.2014 – 31.3.2014

S+Bi AG Annual Report 2014
Clemens Iller, CEO, CFO ad interim
Clemens Iller, a business graduate of the University of Tubingen, joined S + Bi AG as CEO
on 1 April 2014. From 1 March 2015 until 31 March 2015 he assumes additionally the function as CFO ad interim of
S + Bi AG. He launched his career at Amphenol-Tuchel-Electronics in 1989, moving into the
steel industry initially as General Manager Export Sales at Rasselstein Hoesch GmbH. He assumed various positions of
responsibility at ThyssenKrupp Stahl AG from 1999 onwards. From 2009 to the end of 2012 he headed up the Business
Area Stainless Global/Inoxum of the listed German entity ThyssenKrupp AG and served as Chairman of the Management
Board of ThyssenKrupp Nirosta GmbH. As Hold Separate Manager in 2013, he was responsible for compliance with EU
requirements in the Inoxum/Outokumpu merger. Since 2002, Clemens Iller has been on the Shareholders’ Committee
of UnionStahl Holding GmbH. He has served on the Advisory Board of Panopa Logistik GmbH since 2014.
Hans-Jürgen Wiecha, CFO
Hans-Jurgen Wiecha, who holds a degree in business administration from the University of Siegen, was CFO of
S + Bi AG from 1 February 2013 until 28 February 2015. He began his professional career in
1989 at what is now Pricewaterhouse Coopers. From 1993 until 2000, Hans-Jurgen Wiecha held various positions of
responsibility within the VEBA Oel AG Group, ultimately as Manager of Controlling, Accounting and Treasury. In 2000,
he moved to Gerresheimer AG as Director of Corporate Finance, with responsibility for treasury, accounting and taxes.
He was granted general power of attorney in 2004 when his responsibilities were expanded to include mergers and
acquisitions. From 2005 to 2013 he was CFO of Gerresheimer AG, which is listed on Germany’s MDAX.
91CORPORATE GOVERNANCE

92 CORPORATE GOVERNANCE
S+Bi AG Annual report 2014
Prior to the resolution of the Board of Directors on 12 March 2014, the following Business Unit Heads were also members
of the Executive Committee:
Thierry Crémailh
CEO Sales & Services
Patrick Lamarque d’Arrouzat
CEO Ugitech
Bruce C. Liimatainen
CEO A. Finkl & Sons Co.
Dr Martin Löwendick
CEO Deutsche Edelstahlwerke
Carlo Mischler
CEO Swiss Steel
Gerd Munch
CEO S+B Bright Bar
See the 2013 annual report, page 95 onwards, for further information on the above Business Unit Heads (http://www1.
schmolz-bickenbach.com/uploads/tx_sbagnews/SB_Inhalt_GB13_WEB_en_GS.pdf).
4.2 Other activities and vested interests
The above profiles of members of the Executive Board provide information on their activities and commitments in
addition to their functions at S + Bi.
4.3 Management contracts
S + Bi Edelstahl GmbH, a subsidiary of S + Bi AG, provides ser-
vices for the Group companies of S + Bi. These services are invoiced at market rates.
5_ Compensation, participations and loans
Refer to the compensation report, starting on page 98 for full details.

93CORPORATE GOVERNANCE
S+Bi AG Annual Report 2014
6_ Shareholders’ rights of participation
6.1 Restrictions on voting rights and representation
With the exception of the 2% clause for nominees, there are no restrictions on voting rights.
According to Art. 6 (2) of the articles of incorporation, any shareholder may be represented by any other person, who
need not be a shareholder, provided that person has written power of attorney.
6.2 Statutory quorum
The articles of incorporation do not contain any special provisions governing quorums beyond the provisions of
company law.
6.3 Convening the Annual General Meeting
The Annual General Meeting is convened by the Board of Directors or the external auditor, indicating the agenda as
well as proposals of the Board of Directors and any motions put forward by shareholders who have requested the
General Meeting or asked for an item to be included on the agenda. The meeting is held at the registered office of the
Company or at a different location determined by the Board of Directors.
A written invitation is sent at least 20 days before the date of the Annual General Meeting, which must take place
within six months of the end of the fiscal year, or the extraordinary General Meeting. Meetings are convened either
by a resolution of the Annual General Meeting or of the Board of Directors, at the request of the external auditor, or if
requested by one or more shareholders who together represent at least one tenth of the share capital (see Art. 5 of
the articles of incorporation). If the meeting is convened by shareholders or the external auditor, the Board of Directors
must, if expressly requested, hold the meeting within 60 days.
6.4 Inclusion of items on the agenda
Shareholders who represent shares with a par value of CHF 1 million may submit a written request, no later than
45 days before the General Meeting, asking for an item to be placed on the agenda.
6.5 Entry in the share register
The cut-off date for entering registered shareholders in the share register is indicated in the invitation to the General
Meeting. It is normally around ten calendar days before the date of the General Meeting.
7_ Changes of control and defence measures
7.1 Duty to make a public offer
The articles of incorporation do not contain any provisions on opting out or opting up.
7.2 Clauses on changes of control
The Executive Board members’ employment contracts do not contain any change-of-control clauses.

94 CORPORATE GOVERNANCE
S+Bi AG Annual report 2014
8_ External auditor
8.1 Duration of engagement and term of office of the auditor in charge
The auditors are elected by the Annual General Meeting for a period of one year. Ernst & Young Ltd has been the
external auditor since the fiscal year 2005 and was re-elected for fiscal 2014. Roland Ruprecht has been Engagement
Partner and signatory of the auditor’s report since the fiscal year 2012.
8.2 Audit fees
The auditor in charge is generally rotated every seven years. Fees of EUR 1.7 million (2013: EUR 1.6 million) were
paid for financial statement audits and EUR 0.4 million (2013: EUR 0.9 million) for other assurance services in 2014.
8.3 Additional fees
Fees of EUR 1.0 million (2013: EUR 1.4 million) were paid for tax consultancy services and EUR 0.2 million (2013:
EUR 0.4 million) for transaction support.
8.4 Instruments for supervision and control: external auditor
The Audit Committee annually reviews the performance, fees and independence of the auditors and makes a proposal
to the Board of Directors, and then the Annual General Meeting, concerning the appointment of the statutory and Group
auditors. The Audit Committee decides annually on the scope of the internal audit and coordinates this with the external
auditor’s audit plans. The Audit Committee agrees the audit scope and plan with the external auditor and discusses the
audit findings with the external auditors, who usually attend two meetings per year (see also the detailed description
of the duties and authority of the Audit Committee, section 3.4, on page 86). There is no definitive rule governing the
engagement of providers for non-audit services. Such engagements are usually awarded by the Executive Board in
consultation with the Chairman of the Audit Committee, and are evaluated annually as part of the process to assess
the independence of the external auditor.
See p. 86 onwards.
See p. 133

95CORPORATE GOVERNANCE
S+Bi AG Annual Report 2014
9_ Information policy
The Company publishes an annual report. In addition, a half-year report is released in August and quarterly reports in
May and November. All of the reports are available in both German and English. The German version of any given pub-
lication is binding. Shareholders, investors and other stakeholders can join the mailing list for media communication via
the S + Bi website: http://www1.schmolz-bickenbach.com/en/pressmedia/media-reporter/.
The regulations relating to ad hoc publicity also apply.
Financial calendar
12 March 2015 Annual Report 2014, Media and Analyst Conference15 April 2015 Annual General Meeting19 May 2015 Q1 Report 2015, Investor Call11 August 2015 Q2 Report 2015, Investor Call12 November 2015 Q3 Report 2015, Investor Call
Investor Relations
Stefanie Steiner | Director Investor Relations and Corporate Communications
Tel: +41 (0) 41 209 5042 or +49 (0) 211 509 2054
Fax: +41 (0) 41 209 5043 or +49 (0) 211 509 1054
E-mail: [email protected] | www.schmolz-bickenbach.com
S + Bi AG
Emmenweidstrasse 90
CH-6020 Emmenbrucke
Press releases and other information are publicly available on our website www.schmolz-bickenbach.com.
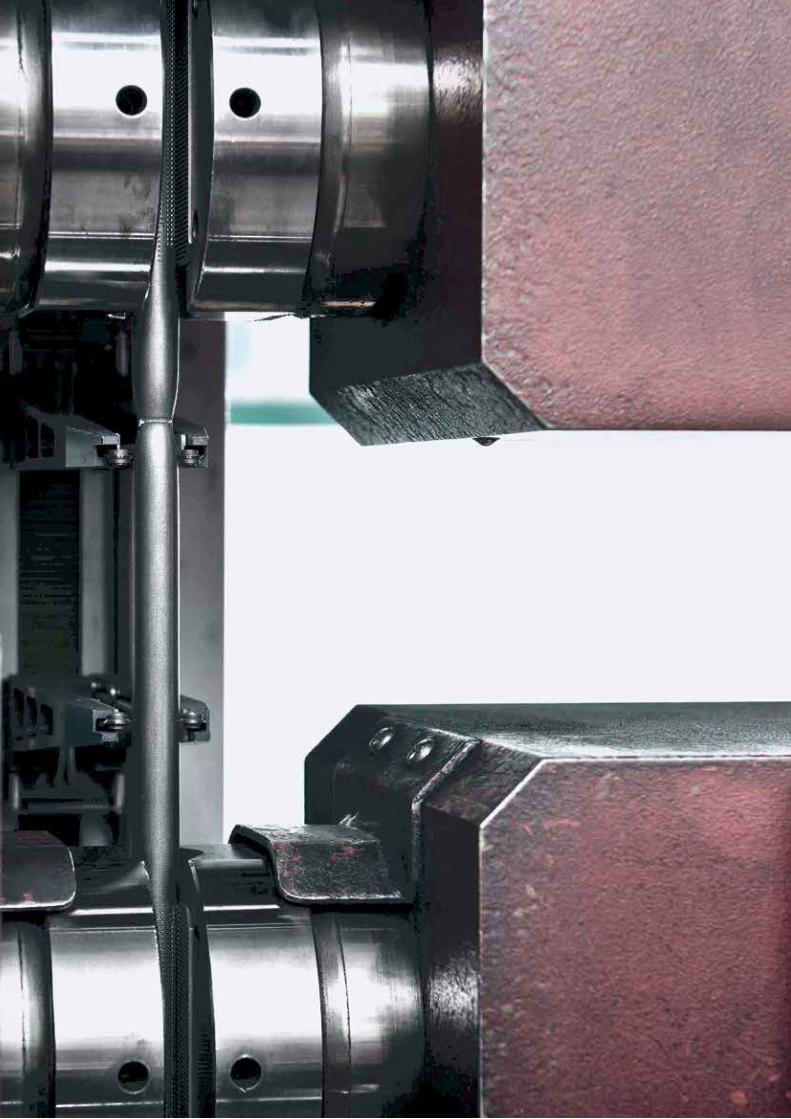

97COMPENSATION REPORT
S+Bi AG Annual Report 2014
Com
pens
atio
n re
port
Compensation report
Introduction
Compensation policy
Compensation system
Compensation of the Executive Board
Compensation of the Board of Directors
Loans and credits
Shareholdings
Report of the statutory auditor on the compensation report
98
99
102
103
108
111
111
113
98 COMPENSATION REPORT
S+Bi AG Annual Report 2014
COMPENSATION REPORT
S + BI is reporting separately on the compensation of the Board of Directors and Executive Board for the first time this year.The intention of the compensation report is to provide the necessary expla-nations in a way that is transparent and comprehensible to all readers.
1_ Introduction
1.1 Foreword
Dear shareholders,
The S + Bi Group is committed to attracting, motivating and retaining the best specialists
and leaders to secure our Company’s sustainable success. The S + Bi Group’s compensation
policy is an integral component of its strategy, and is designed to motivate all employees to pull together to make the
Company more successful than its competitors and add sustainable value for its shareholders.
Following the entry into force of the Swiss Ordinance against Excessive Compensation (VeguV) on 1 January 2014, the
articles of incorporation were amended at the Annual General Meeting (AGM) of S + Bi AG
on 17 April 2014.
The revised articles of incorporation govern performance-related compensation (Art. 16b, 2), allocation of shares,
conversion rights and options (Art. 16b, 2-4), credits, loans and pension payments (Art. 16c), arrangements for the
AGM’s vote on compensation, and the applicable premium for the Executive Committee’s compensation should an
approved total amount not suffice (Art. 16e).
The regulations are provided in full on our website in the section “Investor Relations/Corporate Governance”:
http://www1.schmolz-bickenbach.com/fileadmin/files/schmolz-bickenbach.com/documents/corporate_gover-
nance/171014_Articles_of_Incorporation_new_S_B_.pdf.
This compensation report sets out the principles governing compensation of the Board of Directors and Executive
Board. In addition, it describes the duties of the Compensation Committee and the process for defining compensation
and contains details of compensation paid in the fiscal year 2014. The report will be presented to the 2015 Annual
General Meeting for consultative vote. It is based on the principles laid down by economiesuisse’s Swiss Code of Best
Practice and was prepared in accordance with Art. 663b and 663c of the Swiss Code of Obligations (CO) and the SIX
Swiss Exchange’s Corporate Governance Guidelines.
Sincerely yours,
Vladimir Kuznetsov
Chairman of the Compensation Committee

99COMPENSATION REPORT
S+Bi AG Annual Report 2014
1.2. Statutory principles governing voting on compensation
According to the articles of incorporation, the Annual General Meeting approves annually, separately and in a binding
manner the total amounts proposed by the Board of Directors for: (i) the compensation of the Board of Directors and
any Advisory Board for the period until the following Annual General Meeting, and (ii) the compensation of the Executive
Committee for the fiscal year following the Annual General Meeting.
If the total amount approved for the compensation of the Executive Committee is insufficient to compensate members
of the Executive Committee appointed after the resolution of the General Meeting until the beginning of the following
approval period, the Company may use per person an additional amount of not more than 40% of the previously
approved total compensation of the Executive Committee for the respective approval period. The General Meeting does
not vote on the additional amount used. No additional amounts were utilised in the reporting year.
Besides the above approval, the General Meeting may annually, at the request of the Board of Directors, pass a sepa-
rate and binding resolution to increase the approved compensation amounts for the Board of Directors, the Executive
Committee and any Advisory Board for the current approval period or the previous approval period. The Board of
Directors is entitled to pay all kinds of compensation out of the total approved and additional amounts.
The Board of Directors may submit the prior-year compensation report to the General Meeting for a consultative vote.
2_ Compensation policy
2.1 Organisation and duties of the Compensation Committee
The Compensation Committee is the first authority in preparing the information needed for a proposal on the compen-
sation of the Board of Directors and Executive Board for submission to the entire Board of Directors. The Compensation
Committee’s primary duty is to monitor the organisation, qualifications, performance and compensation of the Executive
Board and the Board of Directors in order to ensure fair, adequate and competitive compensation that is consistent with the
strategic goals of the S + Bi Group. The Compensation Committee consists of three members
of the Board of Directors. Vladimir Kuznetsov was Chairman and Dr Heinz Schumacher and Hans Ziegler were regular
members of the Compensation Committee during the reporting period. The committee met nine times in 2014, with
meetings lasting between one and four hours. Compensation-relevant topics were presented without delay to the Board
of Directors for a decision. All members of the Compensation Committee have the requisite experience, are familiar with
compensation practice and understand market developments. Ernst & Young Ltd was engaged in an advisory capacity
to support the Company with the applicable disclosure requirements as this is the first time a separate compensation
report has been prepared.
100 COMPENSATION REPORT
S+Bi AG Annual Report 2014
Principles are laid down in the articles of incorporation to govern the organisation and assumption of tasks of the Com-
pensation Committee. In addition, the Board of Directors has adopted regulations describing the composition and duties
of the Compensation Committee in more detail.
The main duties of the Compensation Committee are:
> Determining the principles for selecting candidates for election or re-election to the Board of Directors
> Determining the principles for selecting members of the Executive Board
> Preparing proposals for the Board of Directors regarding the appointment of members of the Executive Board
> Preparing proposals for the Board of Directors regarding personnel developments and succession planning for the
Group management
> Preparing proposals regarding compensation of the members of the Board of Directors of the Company, the commit-
tees and the Executive Board and drafting a proposal for the resolution on such compensation for the attention of the
Board of Directors; the Annual General Meeting votes on whether to approve the resolution of the Board of Directors
> Determining the specific compensation of the members of the Board of Directors, the committees and the Executive
Board in accordance with the principles approved by the Board of Directors
> Preparing the compensation report
> Approving any mandates of the Executive Board beyond the S + Bi Group
2.2. Decision-making process for determining compensation
Each year, the Compensation Committee examines the structure and amount of compensation paid to members of
the Executive Board and Board of Directors. It then proposes any amendments for approval by the entire Board of
Directors. This process includes, but is not limited to, examining the basic salary and fringe benefits as well as per-
formance-related short-term and long-term compensation. Furthermore, the Compensation Committee is responsible
for managing the performance review process of individual members of the Executive Board, preparing succession
planning and submitting recruitment proposals.
The members of the Executive Board are not involved in determining their own compensation. However, the Chief
Executive Officer (CEO) is consulted on the compensation proposed for other members of the Executive Board.
Recommendations relating to the compensation of the Board of Directors must be in line with internal guidelines and
are subject to the approval of all members of the Board of Directors.
The Compensation Committee consults external advisors where necessary. External advisors are generally consulted
for support with compensation benchmarking and compensation plan design. For instance, the companies Mercer,
Hengeler Muller and Baker & McKenzie advised the Company on designing the Long Term Incentive Plan (LTIP).

101COMPENSATION REPORT
S+Bi AG Annual Report 2014
The table below summarises the roles of the Compensation Committee (CC), the Board of Directors (BoD) and certain
members of the Executive Board (CEO) in recommending and approving compensation of the Executive Board and
Board of Directors:
Decisions on compensation level Proposal Consultation Approval
Basic salary for the Executive Board CC CEO 1) BoDTarget compensation level for short-term incentive of the Executive Board
CC CEO 1) BoD
Target compensation level for long-term incentive of the Executive Board
CC CEO 1) BoD
Compensation of the Board of Directors CC – BoD 1)
Decisions on performance targets Proposal Consultation Approval
Performance targets for short-term incentives of the Executive Board (excl. CEO) Chairman of the BoD CEO BoDPerformance targets for short-term incentives of the CEO Chairman of the BoD – BoDPerformance targets for long-term incentives of the Executive Board (incl. CEO) CC CEO 1) BoD
1) In accordance with the general provisions on absence/abstention.
2.3. Significant changes in 2014 and for subsequent years
2.3.1 Members of the Executive Committee
By resolution of 12 March 2014, the Board of Directors redefined “Executive Committee” to mean the members of
the Executive Board only from 2014 onwards. In accordance with the organisational regulations applicable as at the
reporting date, the Executive Board consists of the Chief Executive Officer (CEO) and the Chief Financial Officer (CFO).
The Executive Committee consisted of the following members over the course of the fiscal year:
Name Function Period
Clemens Iller CEOCFO ad interim
Since 1.4.20141.3.2015 – 31.3.2015
Hans-Jurgen Wiecha CFO CEO ad Interim
1.1.2014 – 28.2.20151.1.2014 – 31.3.2014
Thiery Crémailh Business Unit Head 1.1.2014 – 12.3.2014Patrick Lamarque d’Arrouzat Business Unit Head 1.1.2014 – 12.3.2014Bruce C. Liimatainen Business Unit Head 1.1.2014 – 12.3.2014Dr Martin Löwendick Business Unit Head 1.1.2014 – 12.3.2014Carlo Mischler Business Unit Head 1.1.2014 – 12.3.2014Gerd Munch Business Unit Head 1.1.2014 – 12.3.2014
102 COMPENSATION REPORT
S+Bi AG Annual Report 2014
2.3.2. Compensation of the Executive Board
In 2014, the Board of Directors decided to supplement the compensation of the Executive Board to include
a Long Term Incentive Plan (LTIP) in future. This move reflects efforts to align compensation better to the
S + Bi Group’s corporate strategy and to create value for shareholders. The first payments
under the LTIP will be made to the CEO on a pro rata basis for 2014. The target to be reached under the LTIP is 75%
of the basic salary, with the actual amount under the LTIP not exceeding 200% or falling below 50% of the target
LTIP (i.e. 150% maximum and 37.5% minimum of the annual basic salary). Payments under the LTIP will be settled in
shares or cash after a vesting period of three years. The sub-targets for the LTIP are based on absolute shareholder
return (ASR) and return on capital employed (ROCE) and will also be measured over three years (i.e. starting for the
period April 2014 – 2016). From 2015 onwards the LTIP will also include the CFO. Section 4.2.3 provides full details
of the LTIP.
2.3.3. Major changes expected for 2015
Total rewards packages are expected to be higher overall for the Executive Board in 2015. The main reasons for this
are as follows:
1. Clemens Iller ( joined: 1 April 2014) will receive compensation for the full twelve months in 2015.
2. Payments for Hans-Jurgen Wiecha, who stepped down as CFO as at 28 February 2015, were due in accordance
with the 12-month notice period provided for in his contract. As at 1 April 2015, Matthias Wellhausen will join the
Company as new CFO.
3. The Long Term Incentive Plan will be extended to the entire Executive Board in 2015.
The performance indicators and weightings under the Short Term Incentive Plan, on the other hand, will remain
unchanged. The following targets and target weightings have been defined for 2015: (i) Adjusted EBITDA 1/3, (ii)
operating free cash flow 1/3, (iii) individual targets 1/3. The Board of Directors believes that the heavy weighting of
the financial targets will enable better alignment with investor interests.
3_ Compensation system
3.1. Compensation principles
Compensation of members of the Board of Directors and Executive Board is set so that it is appropriate, competitive and
performance-based and is aligned to the strategic goals and success of the Group.
As part of the process of designing the Long Term Incentive Plan, an external service provider analysed the competitive
situation of the Executive Board.
3.2. Compensation components
The articles of incorporation provide that the Company can award a performance-related component besides the fixed
compensation. The amount of this additional component depends on qualitative and quantitative targets and parameters
set by the Board of Directors. Performance-related compensation can be paid in cash or by allocation of participation
share certificates, convertible rights or options, or other participation rights.
As explained in detail below, the members of the Executive Board receive a performance-based component, part of which
may be settled in shares, in addition to the fixed component.
The members of the Board of Directors only received fixed fees which are payable partly in cash and partly in shares.

103COMPENSATION REPORT
S+Bi AG Annual Report 2014
4_ Compensation of the Executive Board
4.1 Determining compensation
The S + Bi Group’s policy is to position the Executive Board’s compensation so that it reflects
the median of peer companies. There are provisions in place to reward members of the Executive Board if they consis-
tently over-perform with regard to the targets set under the Short Term and Long Term Incentive Plans. Such additional
compensation reflects the degree by which targets are exceeded.
4.2 Individual components of compensation
The rewards package for the Executive Board consists of fixed and performance-based components as well as social
security contributions. The fixed component is a basic salary, while performance-based components consist of a Short
Term Incentive Plan (STIP) and a Long Term Incentive Plan (LTIP).
The table below shows the general composition of compensation for the Executive Board in 2014:
Fixed Salary
0%
Long Term Incentive
100%
Short Term Incentive
50%
Short Term Incentive Long Term Incentive
Participants Executive Board Executive Board 1)
Purpose Recognise short-term financial perfor-mance
Recognise sustainable growth in the Company’s value
Allocated Annually AnnuallyExercised Annually After three yearsMeasured by Adjusted EBITDA, Operating Free
Cash Flow, personal goalsReturn on Capital Employed, Absolute Shareholder Return
Minimum as a percentage of basic salary 37.5% 37.5%Percentage of basic salary if targets are reached 75% 75%Maximum as a percentage of basic salary if targets are exceeded 150% 150%Compensation Cash Shares and/or cash
1) Only Clemens Iller took part in the Long Term Incentive Plan in 2014. This Long Term Incentive Plan will be applied to all members of
the Executive Board in 2015.
4.2.1. Basic salary
The Compensation Committee is responsible for proposing the basic salary of the members of the Executive Board.
The proposals then have to be approved by the Board of Directors. In examining whether to amend the basic salary,
comparative information and the performance of the individual in the past fiscal year are taken into account.
Hans-Jurgen Wiecha assumed for a transition period the role of CEO ad interim in addition to his duties as CFO from
January 2014 onwards and therefore received a higher basic salary up to and including 30 June 2014.
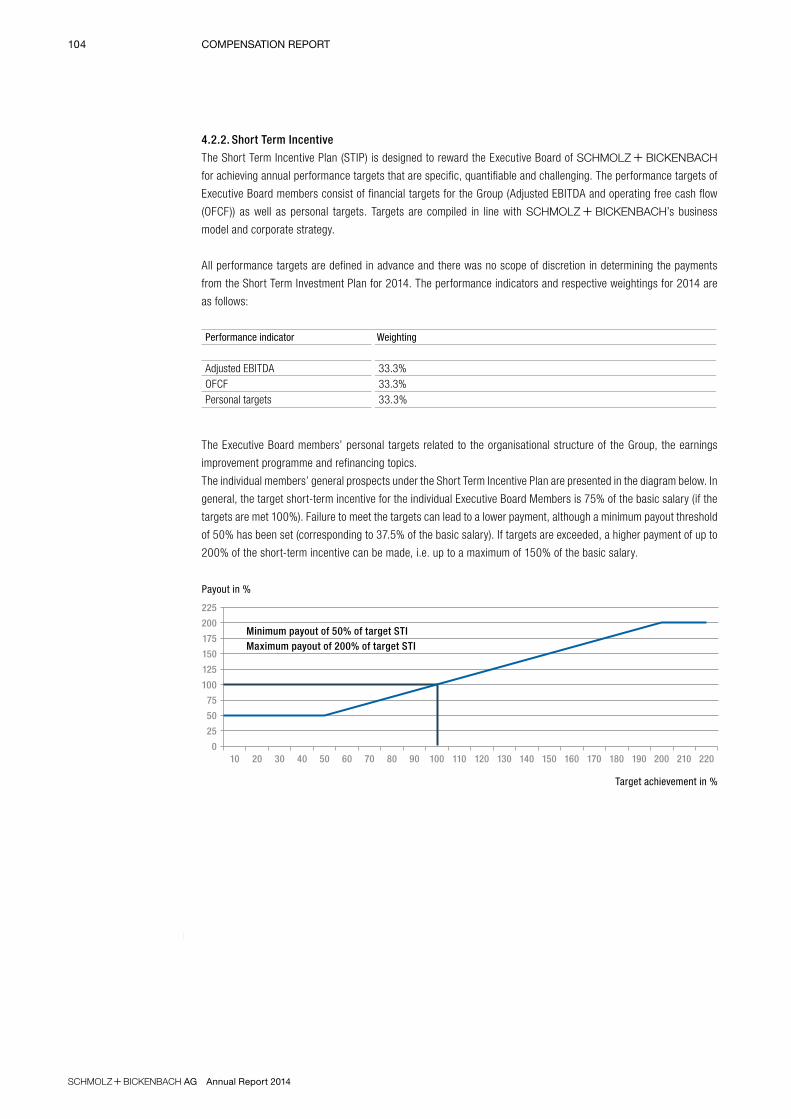
104 COMPENSATION REPORT
S+Bi AG Annual Report 2014
4.2.2. Short Term Incentive
The Short Term Incentive Plan (STIP) is designed to reward the Executive Board of S + Bi
for achieving annual performance targets that are specific, quantifiable and challenging. The performance targets of
Executive Board members consist of financial targets for the Group (Adjusted EBITDA and operating free cash flow
(OFCF)) as well as personal targets. Targets are compiled in line with S + Bi’s business
model and corporate strategy.
All performance targets are defined in advance and there was no scope of discretion in determining the payments
from the Short Term Investment Plan for 2014. The performance indicators and respective weightings for 2014 are
as follows:
Performance indicator Weighting
Adjusted EBITDA 33.3%OFCF 33.3%Personal targets 33.3%
The Executive Board members’ personal targets related to the organisational structure of the Group, the earnings
improvement programme and refinancing topics.
The individual members’ general prospects under the Short Term Incentive Plan are presented in the diagram below. In
general, the target short-term incentive for the individual Executive Board Members is 75% of the basic salary (if the
targets are met 100%). Failure to meet the targets can lead to a lower payment, although a minimum payout threshold
of 50% has been set (corresponding to 37.5% of the basic salary). If targets are exceeded, a higher payment of up to
200% of the short-term incentive can be made, i.e. up to a maximum of 150% of the basic salary.
Target achievement in %
Minimum payout of 50% of target STI Maximum payout of 200% of target STI
10 20 30 40 50 60 70 80 90 100 110 120 130 140 150 160 170 180 190 200 210 2200
25
50
75
100
125
150
175
200
225
Payout in %

105COMPENSATION REPORT
S+Bi AG Annual Report 2014
In 2014, the financial targets of the Group and the members’ personal targets were all met or exceeded. This resulted
in an average payment of 159% of the STIP to members of the Executive Board. The short-term incentive for the fiscal
year 2014 will be paid out in cash to all members of the Executive Board in 2015.
4.2.3. Long Term Incentive Plan
A Long Term Incentive Plan (LTIP) was developed for the Executive Board in 2014. Initially applicable for the CEO in
2014, the plan will be extended to all members of the Executive Board from 2015 onwards.
The target to be reached under the LTIP is 75% of the annual basic salary of the specific Executive Board member, with
the actual amount under the LTIP not exceeding 200% or falling below 50% of the target LTIP (i.e. 150% maximum
and 37.5% minimum of the annual basic salary).
The LTIP is based on two different performance indicators: return on capital employed (ROCE) and absolute share-
holder return (ASR). The Company uses these indicators to create long-term incentives for LTIP participants, which
serve to align the S + Bi Group’s corporate strategy with the interests of the equity owners.
Each performance indicator has a threshold as well as a target, stretch and maximum value defined by the Board of
Directors. All values are defined exactly and with the aim of rewarding outstanding performance.
The plan differentiates between the one-year compensation period and the three-year performance period in which to
achieve the performance targets for the indicators described (ROCE, ASR). For Clemens Iller, the first compensation
period is the fiscal year 2014 while the corresponding performance period covers the fiscal years 2014 – 2016.
The percentage target achievement comprises the percentage achievement of the two components (ROCE growth and
absolute share performance), each multiplied by 50%.
As a formula, the calculation is as follows:
ROCE growth = 3 x ROCE year 1 + 2 x ROCE year 2 + ROCE year 3
and 6
Absolute shareholder return, ASR = Closing price year 3 – opening price year 1
x 100
opening price year 1
At the discretion of the Board of Directors, the compensation payable under the LTIP can be paid in cash,
S + Bi AG shares or a mixture of the two. This decision has to be made by the allocation date.

106 COMPENSATION REPORT
S+Bi AG Annual Report 2014
The individuals do not have voting rights or rights to dividends from potentially receivable shares during the three-year
performance period. As soon as shares have been finally allocated and transferred, the owners have full rights relating
to them, excepting any internal trading restriction periods..
Target achievement in %
Minimum payout of 50% of target LTI 100% payout at 100% target achievement
10 20 30 40 50 60 70 80 90 100 110 120 130 140 150 160 170 180 190 200 210 2200
25
50
75
100
125
150
175
200
225
Payout in %
If the employment contract of a member of the Executive Board is terminated before the end of the compensation
period, that member is entitled to a pro rata allocation of the compensation due under the LTIP. The pro rata allocation
is calculated based on the number of days from the beginning of the compensation period up to and including the day
on which employment ends, divided by the total number of days in the compensation period. Claims for the remainder
of the compensation period after employment ends are explicitly excluded. Achievement of target ROCE and ASP is
not assessed until the end of the performance period, including in the case of pro rata allocation.
4.2.4. Social security contributions
The members of the Executive Board are covered by an accident and term life insurance policy for the duration of
their time in office. The policy provides for benefits in the event of death or invalidity. In cases of temporary illness,
an accident or other absence from work through no fault of the individual concerned, the members of the Executive
Board receive their basic salary for a maximum period of 12 months, but not beyond the termination date of this
agreement. Executive Board members are also covered by other Group insurance (including D&O, corporate legal
protection insurance and luggage insurance).
Until potentially changing his residence to Switzerland, Hans-Jurgen Wiecha receives an additional salary of
EUR 62 500 p.a. (gross) (equivalent to CHF 75 000) in lieu of the Company’s contribution to a voluntary pension fund.
No further social security benefits, in particular for pensions, were granted
4.2.5. Compensation in kind
The Company provides the members of the Executive Board with an appropriate vehicle for business and private use
for the duration of their contracts. The costs to acquire, operate, maintain and service the company car are covered
by the Company. Any taxes resulting from private use have to be paid by the Executive Board member in question.
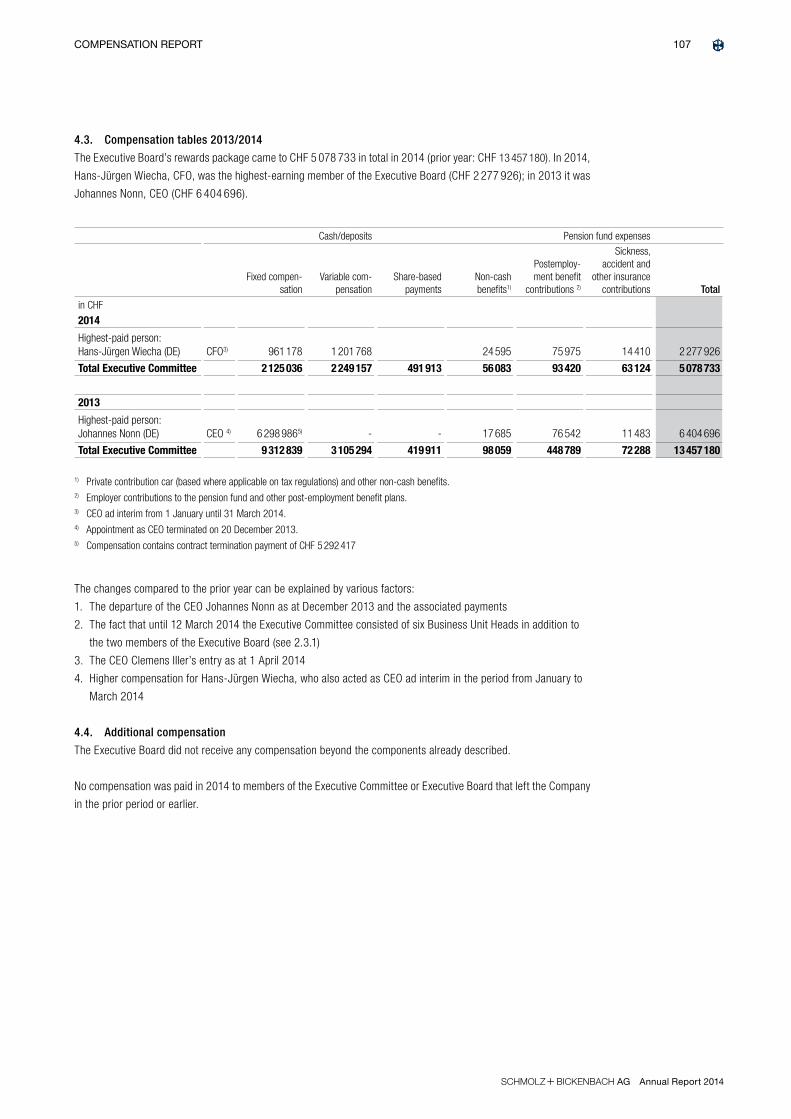
107COMPENSATION REPORT
S+Bi AG Annual Report 2014
4.3. Compensation tables 2013/2014
The Executive Board’s rewards package came to CHF 5 078 733 in total in 2014 (prior year: CHF 13 457 180). In 2014,
Hans-Jurgen Wiecha, CFO, was the highest-earning member of the Executive Board (CHF 2 277 926); in 2013 it was
Johannes Nonn, CEO (CHF 6 404 696).
Cash/deposits Pension fund expenses
Fixed compen-sation
Variable com-pensation
Share-based payments
Non-cash benefits1)
Postemploy-ment benefit
contributions 2)
Sickness, accident and
other insurance contributions Total
in CHF
2014
Highest-paid person: Hans-Jurgen Wiecha (DE) CFO3) 961 178 1 201 768 24 595 75 975 14 410 2 277 926
Total Executive Committee 2 125 036 2 249 157 491 913 56 083 93 420 63 124 5 078 733
2013
Highest-paid person: Johannes Nonn (DE) CEO 4) 6 298 9865) - - 17 685 76 542 11 483 6 404 696
Total Executive Committee 9 312 839 3 105 294 419 911 98 059 448 789 72 288 13 457 180
1) Private contribution car (based where applicable on tax regulations) and other non-cash benefits.2) Employer contributions to the pension fund and other post-employment benefit plans.3) CEO ad interim from 1 January until 31 March 2014.4) Appointment as CEO terminated on 20 December 2013.5) Compensation contains contract termination payment of CHF 5 292 417
The changes compared to the prior year can be explained by various factors:
1. The departure of the CEO Johannes Nonn as at December 2013 and the associated payments
2. The fact that until 12 March 2014 the Executive Committee consisted of six Business Unit Heads in addition to
the two members of the Executive Board (see 2.3.1)
3. The CEO Clemens Iller’s entry as at 1 April 2014
4. Higher compensation for Hans-Jurgen Wiecha, who also acted as CEO ad interim in the period from January to
March 2014
4.4. Additional compensation
The Executive Board did not receive any compensation beyond the components already described.
No compensation was paid in 2014 to members of the Executive Committee or Executive Board that left the Company
in the prior period or earlier.
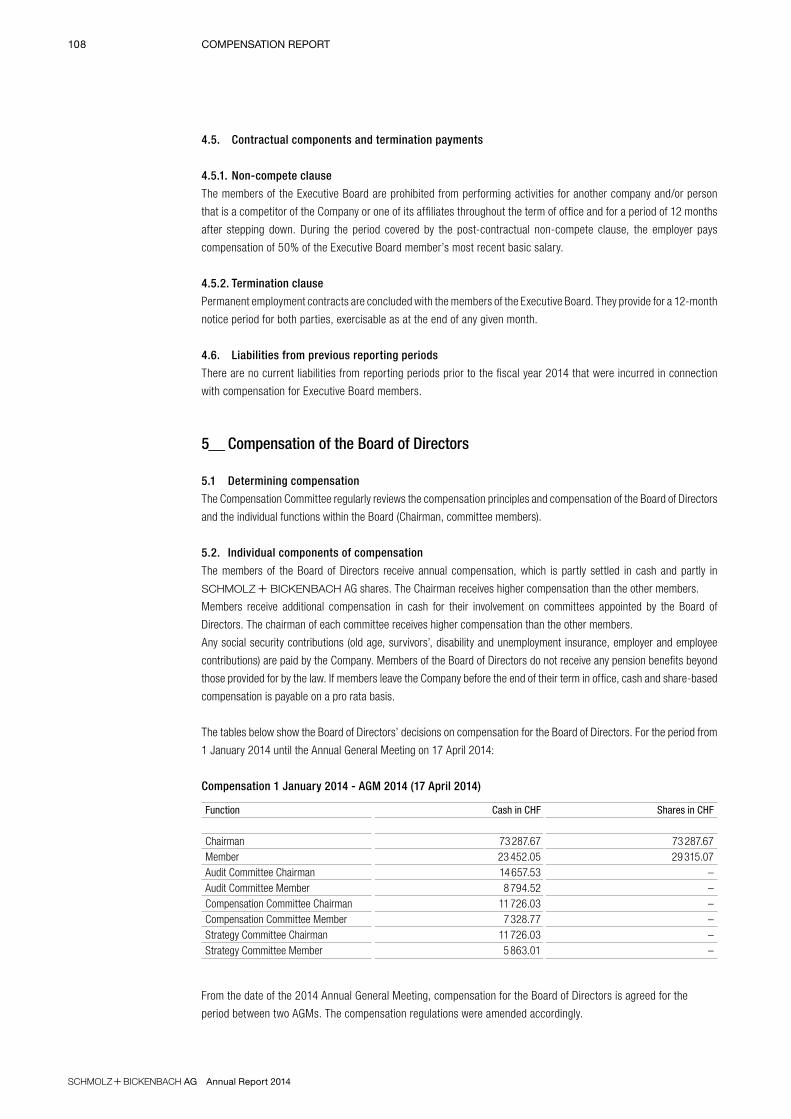
108 COMPENSATION REPORT
S+Bi AG Annual Report 2014
4.5. Contractual components and termination payments
4.5.1. Non-compete clause
The members of the Executive Board are prohibited from performing activities for another company and/or person
that is a competitor of the Company or one of its affiliates throughout the term of office and for a period of 12 months
after stepping down. During the period covered by the post-contractual non-compete clause, the employer pays
compensation of 50% of the Executive Board member’s most recent basic salary.
4.5.2. Termination clause
Permanent employment contracts are concluded with the members of the Executive Board. They provide for a 12-month
notice period for both parties, exercisable as at the end of any given month.
4.6. Liabilities from previous reporting periods
There are no current liabilities from reporting periods prior to the fiscal year 2014 that were incurred in connection
with compensation for Executive Board members.
5_ Compensation of the Board of Directors
5.1 Determining compensation
The Compensation Committee regularly reviews the compensation principles and compensation of the Board of Directors
and the individual functions within the Board (Chairman, committee members).
5.2. Individual components of compensation
The members of the Board of Directors receive annual compensation, which is partly settled in cash and partly in
s + bi AG shares. The Chairman receives higher compensation than the other members.
Members receive additional compensation in cash for their involvement on committees appointed by the Board of
Directors. The chairman of each committee receives higher compensation than the other members.
Any social security contributions (old age, survivors’, disability and unemployment insurance, employer and employee
contributions) are paid by the Company. Members of the Board of Directors do not receive any pension benefits beyond
those provided for by the law. If members leave the Company before the end of their term in office, cash and share-based
compensation is payable on a pro rata basis.
The tables below show the Board of Directors’ decisions on compensation for the Board of Directors. For the period from
1 January 2014 until the Annual General Meeting on 17 April 2014:
Compensation 1 January 2014 - AGM 2014 (17 April 2014)
Function Cash in CHF Shares in CHF
Chairman 73 287.67 73 287.67Member 23 452.05 29 315.07Audit Committee Chairman 14 657.53 –Audit Committee Member 8 794.52 –Compensation Committee Chairman 11 726.03 –Compensation Committee Member 7 328.77 –Strategy Committee Chairman 11 726.03 –Strategy Committee Member 5 863.01 –
From the date of the 2014 Annual General Meeting, compensation for the Board of Directors is agreed for the
period between two AGMs. The compensation regulations were amended accordingly.

109COMPENSATION REPORT
S+Bi AG Annual Report 2014
Compensation from AGM 2014 (17 April 2014) until AGM 2015 (15 April 2015)
Function Cash in CHF Shares in CHF
Chairman 250 000.00 250 000.00 Member 80 000.00 100 000.00 Audit Committee Chairman 50 000.00 –Audit Committee Member 30 000.00 –Compensation Committee Chairman 40 000.00 –Compensation Committee Member 25 000.00 –Strategy Committee Chairman 40 000.00 –Strategy Committee Member 20 000.00 –
Cash compensation is paid every three months at the end of the quarter. The Company makes the social security
contributions associated with compensation based on the information available and provides confirmation statements
to the members. Otherwise, the members are each responsible for proper taxation.
The members receive reimbursement of any out-of-pocket expenses upon production of receipts (to the extent per-
mitted by tax provisions). There is no lump-sum reimbursement of expenses.
For the share-based portion of compensation, the number of shares at the beginning of the term in office is calculated
based on market data (volume-weighted average price, VWAP) from the tenth trading day before until the tenth trad-
ing day after publication of the financial statements approved by the Annual General Meeting. Shares are allocated at
the end of each term in office or when a member steps down prematurely. Members of the Board of Directors do not
have any voting rights or rights of ownership to these shares.
The first ever allocation of shares will be based on the VWAP from the tenth trading day before until the tenth trading
day after the publication of the 2013 financial statements.

110 COMPENSATION REPORT
S+Bi AG Annual Report 2014
5.3. Compensation tables 2013/2014
Total compensation for members of the Board of Directors in 2014 came to CHF 2 064 008 (2013: CHF 1 739 351). The
respective Chairman of the Board of Directors was the highest-earning member of the Board of Directors in both 2014 and
2013 (2014: CHF 583 881 and 2013: CHF 107 500 and CHF 315 000).
Cash/deposits Pension fund expenses Additional
Fixed com-pensation
Variable com-pensation
Fixed com-pensation in
shares
Postemploy-ment benefit
contributions1)
Sickness, accident
and other insurance
contributions
Compensa-tion
Expenses Total
in CHF
2014
Edwin Eichler (DE)2) Chairman 286 970 264 971 28 425 3 516 583 881
Vlaidimir Kuznetsov (RU)2)
Vice-Chair-man 149 185 105 988 13 141 2 032 270 347
Michael Buchter (DE)2) Member 116 336 105 430 13 296 1 032 236 093
Marco Musetti (CH)2) Member 159 784 105 988 13 687 2 085 281 544
Dr Heinz Schumacher (DE)2) Member 105 000 100 000 205 000
Dr Oliver Thum (DE)2) Member 100 000 100 000 200 000
Hans Ziegler (CH)2) Member 165 083 105 988 13 960 2 111 287 143
Total 1 082 358 888 366 82 509 10 776 2 064 008
2013
Edwin Eichler (DE)2) Chairman 96 638 5 279 583 5 000 107 500
Vlaidimir Kuznetsov (RU)2)
Vice-Chair-man 58 308 3 193 499 3 000 65 000
Michael Buchter (DE)2) Member 42 000 3 000 45 000
Marco Musetti (CH)2) Member 51 231 2 807 462 3 000 57 500
Dr Heinz Schumacher (DE)2) Member 37 079 2 034 387 3 000 42 500
Dr Oliver Thum (DE)2) Member 42 000 3 000 45 000
Hans Ziegler (CH)2) Member 48 873 2 678 449 3 000 55 000
Dr Hans-Peter Zehnder (CH)3) Chairman 282 802 15 450 1 748 15 000 315 000
Dr Alexander von Tippelskirch (DE)4)
Vice-Chair-man 131 223 6 669 6 000 143 892
Manfred Breuer (DE)3) Member 116 000 9 000 125 000
Dr Gerold Buttiker (CH)3) Member 141 000 9 000 150 000
Dr Helmut Burmester (DE)4) Member 94 769 4 690 6 000 105 459
Roland Eberle (CH)3) Member 104 161 5 717 1 122 9 000 120 000
Carl M. Eichler (DE)5) Member 34 500 3 000 37 500
Dr Marc Feiler (DE)3) Member 121 000 9 000 130 000
Benoît D. Ludwig (CH)3) Member 141 501 6 999 9 000 157 500
Roger Schack (DE)5) Member 34 500 3 000 37 500
Total 1 577 585 55 516 5 250 101 000 1 739 351
1) Employer contributions to the pension fund and other post-employment benefit plans.2) Member of the Board of Directors since 26 September, 20133) Member of the Board of Directors until 26 September, 20134) Member of the Board of Directors until 30 June, 20135) Member of the Board of Directors from 1 July until 26 September, 2013

111COMPENSATION REPORT
S+Bi AG Annual Report 2014
5.4. Additional compensation
No compensation was paid in 2014 to members of the Board of Directors that left the Company in the prior period or earlier.
No options were allocated in the reporting period. Where members of the Board of Directors were involved in related party
transactions, this is indicated in the notes to the consolidated financial statements, p. 162 onwards.
6_ Loans and credits
The articles of incorporation provide that loans or credits of up to CHF 1 million may be granted to members of the Board
of Directors or Executive Committee, including, but not limited to, advances for the costs of civil, penal or administrative
proceedings relating to the activities of the respective person as a member of the Board of Directors
or Executive Committee of the Company (in particular court and lawyers’ fees).
As at 31 December 2014, the s + bi Group had not granted any collateral, loans, advances or
credits to members, or related parties of members, of the Executive Committee or Board of Directors.
7_ Shareholdings
The following members of the Board of Directors own shares in s + bi AG:
Number of shares Number of options 2)
Board of Directors 31.12.2014 31.12.2013 31.12.2014 31.12.2013
Edwin Eichler (DE)1) Chairman – – 59 032 –
Vladimir V. Kuznetsov (RU)1) Vice-Chairman – – 23 613 –
Michael Buchter (DE)1) Member – – 23 613 –
Marco Musetti (CH)1) Member – – 23 613 –
Dr Heinz Schumacher (DE)1) Member 8 000 8 000 23 613 –
Dr Oliver Thum (DE)1) Member – – 23 613 –
Hans Ziegler (CH)1) Member 40 000 40 000 23 613 –
Total Board of Directors 48 000 48 000 200 710 –
1) Member of the Board of Directors since 26 September 2013.2) Members of the Board of Directors are entitled to share-based payments from the date of the 2014 Annual General Meeting (17 April
2014). These shares had not yet been physically allocated as at 31 December 2014 so are disclosed as options. The actual number
of shares allocated may be smaller due to the effective tax withheld at source.

112 COMPENSATION REPORT
S+Bi AG Annual Report 2014
The following members of the Executive Board own shares in s + bi AG:
Number of shares (votes)
Executive Committee 31.12.2014 31.12.2013
Hans-Jurgen Wiecha (DE) 1) CFO 201 938 201 938
Bruce Liimatainen 3)
Head Business Unit Finkl / Sorel n.a. 38 000
Dr Martin Löwendick (DE) 2) 3)
Head Business Unit Deutsche Edelstahlwerke n.a. 1 500
Total Executive Committee 201 938 241 438
1) CFO since 1 February 2013, also CEO a.i. from 20 December 2013 to 31 March 2014.2) Since 1 July 2013.3) Business Unit Heads are no longer part of the Executive Committee with effect as at 12 March 2014.

113
S+Bi AG Annual Report 2014
COMPENSATION REPORT Report of the statutory auditor on the compensation report
Report of the statutory auditor on the compensation report of
s + bi AG, Emmen
To the General Meeting of s + bi AG, Emmen
Zurich, 11 March 2015
Report of the statutory auditor on the compensation report
We have audited the compensation report (section 4.3 to 7) dated 11 March 2015 of s +
bi AG for the year ended 31 December 2014.
Responsibility of the Board of Directors
The Board of Directors is responsible for the preparation and overall fair presentation of the compensation report in accor-
dance with Swiss law and the Ordinance against Excessive Compensation in Stock Exchange Listed Companies (Ordinance).
The Board of Directors is also responsible for designing the compensation system and defining individual compensation
packages.
Auditor’s responsibility
Our responsibility is to express an opinion on the accompanying compensation report. We conducted our audit in accor-
dance with Swiss Auditing Standards. Those standards require that we comply with ethical requirements and plan and
perform the audit to obtain reasonable assurance about whether the compensation report complies with Swiss law and
articles 14 – 16 of the Ordinance.
An audit involves performing procedures to obtain audit evidence on the disclosures made in the compensation report with
regard to compensation, loans and credits in accordance with articles 14 – 16 of the Ordinance. The procedures selected
depend on the auditor’s judgment, including the assessment of the risks of material misstatements in the compensation
report, whether due to fraud or error. This audit also includes evaluating the reasonableness of the methods applied to value
components of compensation, as well as assessing the overall presentation of the compensation report. We believe that the
audit evidence we have obtained is sufficient and appropriate to provide a basis for our opinion.
Opinion
In our opinion, the compensation report for the year ended 31 December 2014 of s + bi AG
complies with Swiss law and articles 14 – 16 of the Ordinance.
Ernst & Young Ltd
Roland Ruprecht Beat Rölli
Licensed audit expert (Auditor in charge) Licensed audit expert

Fina
ncia
l Rep
ortin
g Gr
oup
Financial ReportingS + Bi Group
Consolidated financial statements
Consolidated income statement
Consolidated statement of comprehensive income
Consolidated statement of financial position
Consolidated statement of cash flows
Consolidated statement of changes in shareholders’ equity
Notes to the consolidated financial statements
Report of the statutory auditor on the consolidated financial statements
Five-year overview
Five-quarter overview
116
117
118
119
120
121
169
170
171
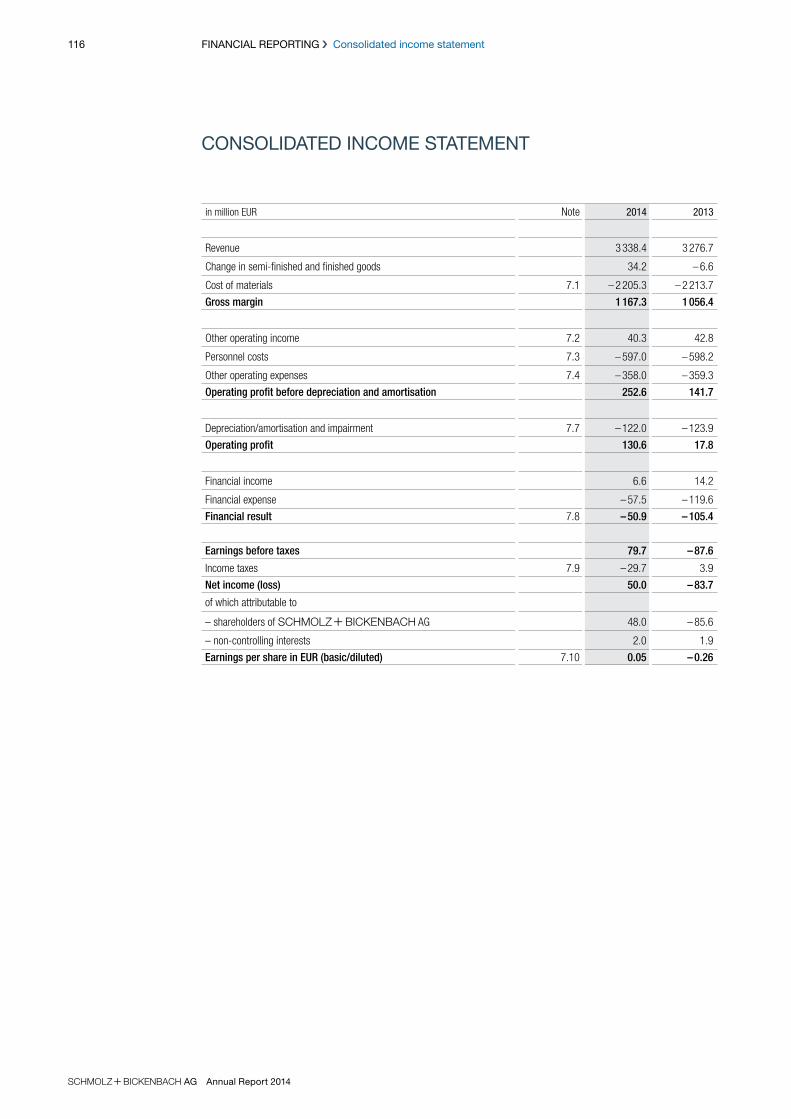
116 FINANCIAL REPORTING Consolidated income statement
S+Bi AG Annual Report 2014
CONSOLIDATED INCOME STATEMENT
in million EUR Note 2014 2013
Revenue 3 338.4 3 276.7
Change in semi-finished and finished goods 34.2 – 6.6
Cost of materials 7.1 – 2 205.3 – 2 213.7
Gross margin 1 167.3 1 056.4
Other operating income 7.2 40.3 42.8
Personnel costs 7.3 – 597.0 – 598.2
Other operating expenses 7.4 – 358.0 – 359.3
Operating profit before depreciation and amortisation 252.6 141.7
Depreciation/amortisation and impairment 7.7 – 122.0 – 123.9
Operating profit 130.6 17.8
Financial income 6.6 14.2
Financial expense – 57.5 – 119.6
Financial result 7.8 – 50.9 – 105.4
Earnings before taxes 79.7 – 87.6
Income taxes 7.9 – 29.7 3.9
Net income (loss) 50.0 – 83.7
of which attributable to
– shareholders of S+Bi AG 48.0 – 85.6
– non-controlling interests 2.0 1.9
Earnings per share in EUR (basic/diluted) 7.10 0.05 – 0.26
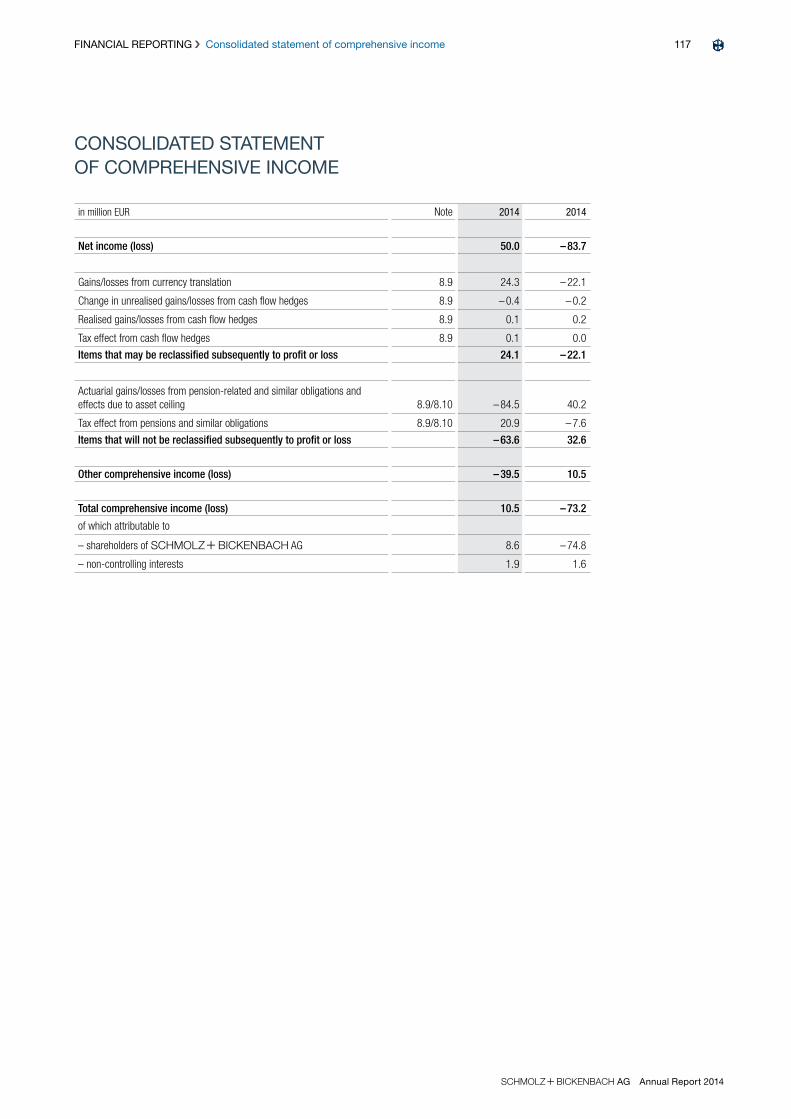
117FINANCIAL REPORTING Consolidated statement of comprehensive income
S+Bi AG Annual Report 2014
CONSOLIDATED STATEMENT OF COMPREHENSIVE INCOME
in million EUR Note 2014 2014
Net income (loss) 50.0 – 83.7
Gains/losses from currency translation 8.9 24.3 – 22.1
Change in unrealised gains/losses from cash flow hedges 8.9 – 0.4 – 0.2
Realised gains/losses from cash flow hedges 8.9 0.1 0.2
Tax effect from cash flow hedges 8.9 0.1 0.0
Items that may be reclassified subsequently to profit or loss 24.1 – 22.1
Actuarial gains/losses from pension-related and similar obligations and effects due to asset ceiling 8.9/8.10 – 84.5 40.2
Tax effect from pensions and similar obligations 8.9/8.10 20.9 – 7.6
Items that will not be reclassified subsequently to profit or loss – 63.6 32.6
Other comprehensive income (loss) – 39.5 10.5
Total comprehensive income (loss) 10.5 – 73.2
of which attributable to
– shareholders of S+Bi AG 8.6 – 74.8
– non-controlling interests 1.9 1.6
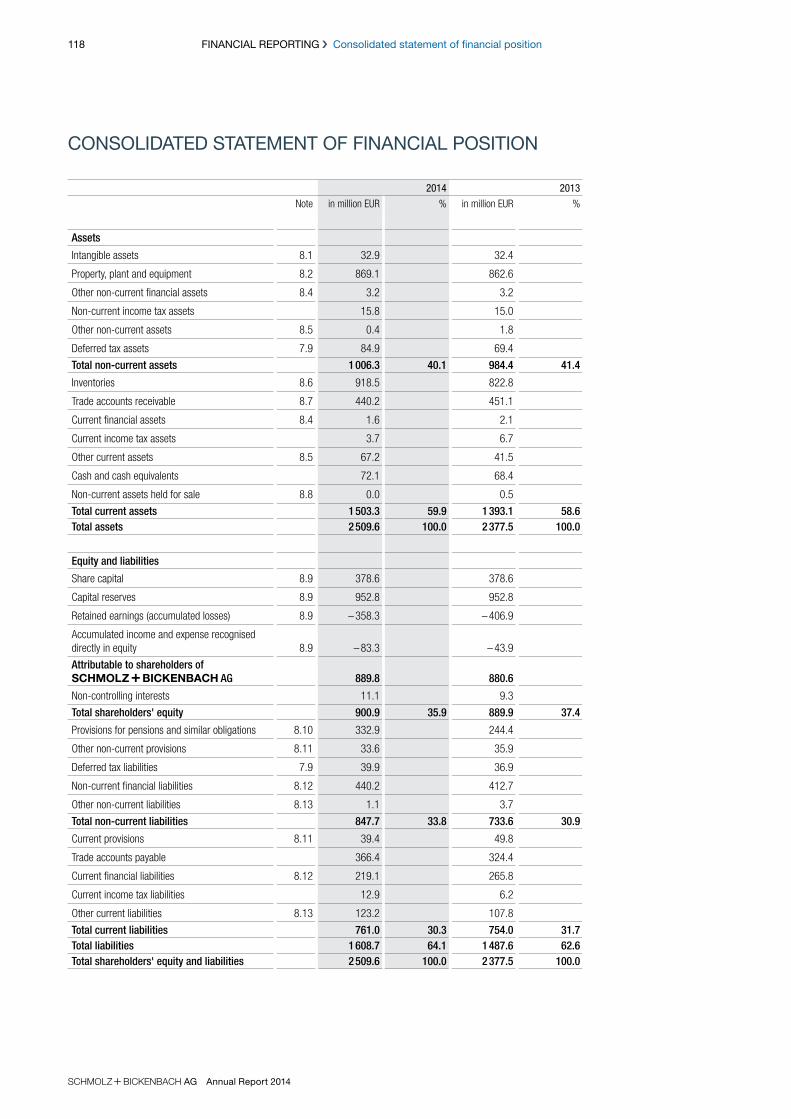
118 FINANCIAL REPORTING Consolidated statement of financial position
S+Bi AG Annual Report 2014
CONSOLIDATED STATEMENT OF FINANCIAL POSITION
2014 2013
Note in million EUR % in million EUR %
Assets
Intangible assets 8.1 32.9 32.4
Property, plant and equipment 8.2 869.1 862.6
Other non-current financial assets 8.4 3.2 3.2
Non-current income tax assets 15.8 15.0
Other non-current assets 8.5 0.4 1.8
Deferred tax assets 7.9 84.9 69.4
Total non-current assets 1 006.3 40.1 984.4 41.4
Inventories 8.6 918.5 822.8
Trade accounts receivable 8.7 440.2 451.1
Current financial assets 8.4 1.6 2.1
Current income tax assets 3.7 6.7
Other current assets 8.5 67.2 41.5
Cash and cash equivalents 72.1 68.4
Non-current assets held for sale 8.8 0.0 0.5
Total current assets 1 503.3 59.9 1 393.1 58.6Total assets 2 509.6 100.0 2 377.5 100.0
Equity and liabilities
Share capital 8.9 378.6 378.6
Capital reserves 8.9 952.8 952.8
Retained earnings (accumulated losses) 8.9 – 358.3 – 406.9
Accumulated income and expense recognised directly in equity 8.9 – 83.3 – 43.9
Attributable to shareholders of S+Bi AG 889.8 880.6
Non-controlling interests 11.1 9.3
Total shareholders' equity 900.9 35.9 889.9 37.4
Provisions for pensions and similar obligations 8.10 332.9 244.4
Other non-current provisions 8.11 33.6 35.9
Deferred tax liabilities 7.9 39.9 36.9
Non-current financial liabilities 8.12 440.2 412.7
Other non-current liabilities 8.13 1.1 3.7
Total non-current liabilities 847.7 33.8 733.6 30.9
Current provisions 8.11 39.4 49.8
Trade accounts payable 366.4 324.4
Current financial liabilities 8.12 219.1 265.8
Current income tax liabilities 12.9 6.2
Other current liabilities 8.13 123.2 107.8
Total current liabilities 761.0 30.3 754.0 31.7Total liabilities 1 608.7 64.1 1 487.6 62.6Total shareholders' equity and liabilities 2 509.6 100.0 2 377.5 100.0
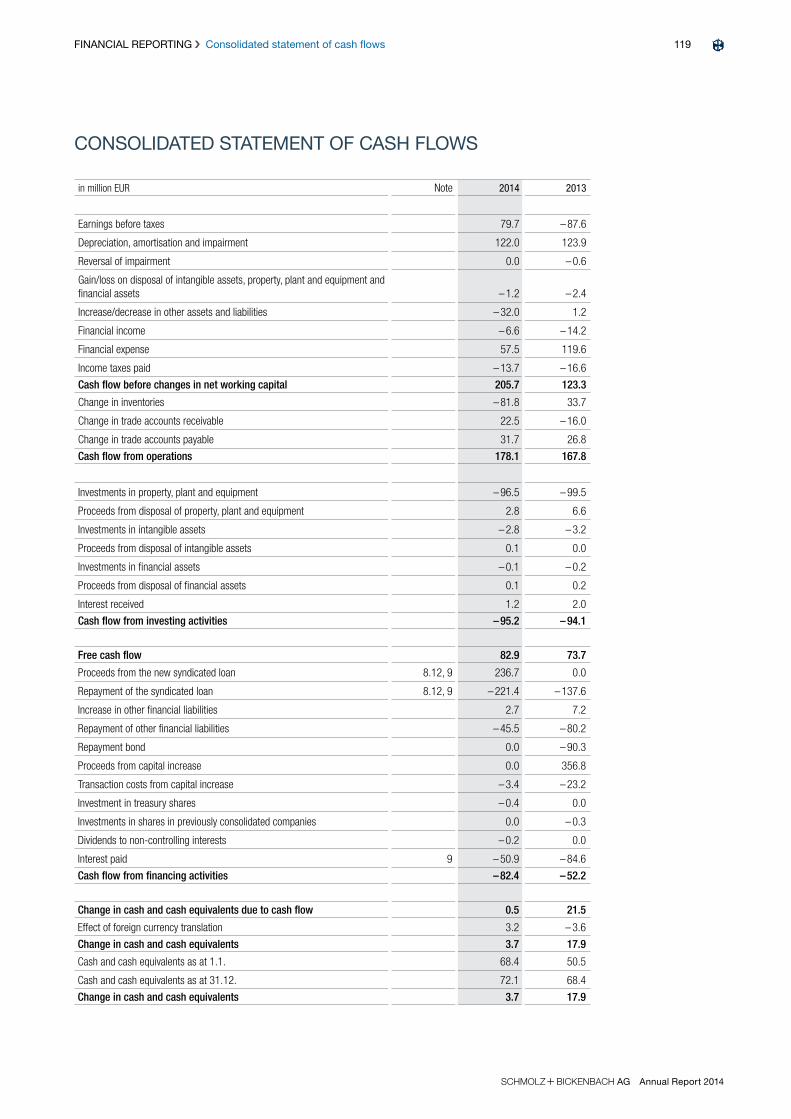
119FINANCIAL REPORTING Consolidated statement of cash flows
S+Bi AG Annual Report 2014
CONSOLIDATED STATEMENT OF CASH FLOWS
in million EUR Note 2014 2013
Earnings before taxes 79.7 – 87.6
Depreciation, amortisation and impairment 122.0 123.9
Reversal of impairment 0.0 – 0.6
Gain/loss on disposal of intangible assets, property, plant and equipment and financial assets – 1.2 – 2.4
Increase/decrease in other assets and liabilities – 32.0 1.2
Financial income – 6.6 – 14.2
Financial expense 57.5 119.6
Income taxes paid – 13.7 – 16.6
Cash flow before changes in net working capital 205.7 123.3
Change in inventories – 81.8 33.7
Change in trade accounts receivable 22.5 – 16.0
Change in trade accounts payable 31.7 26.8
Cash flow from operations 178.1 167.8
Investments in property, plant and equipment – 96.5 – 99.5
Proceeds from disposal of property, plant and equipment 2.8 6.6
Investments in intangible assets – 2.8 – 3.2
Proceeds from disposal of intangible assets 0.1 0.0
Investments in financial assets – 0.1 – 0.2
Proceeds from disposal of financial assets 0.1 0.2
Interest received 1.2 2.0
Cash flow from investing activities – 95.2 – 94.1
Free cash flow 82.9 73.7
Proceeds from the new syndicated loan 8.12, 9 236.7 0.0
Repayment of the syndicated loan 8.12, 9 – 221.4 – 137.6
Increase in other financial liabilities 2.7 7.2
Repayment of other financial liabilities – 45.5 – 80.2
Repayment bond 0.0 – 90.3
Proceeds from capital increase 0.0 356.8
Transaction costs from capital increase – 3.4 – 23.2
Investment in treasury shares – 0.4 0.0
Investments in shares in previously consolidated companies 0.0 – 0.3
Dividends to non-controlling interests – 0.2 0.0
Interest paid 9 – 50.9 – 84.6
Cash flow from financing activities – 82.4 – 52.2
Change in cash and cash equivalents due to cash flow 0.5 21.5
Effect of foreign currency translation 3.2 – 3.6
Change in cash and cash equivalents 3.7 17.9
Cash and cash equivalents as at 1.1. 68.4 50.5
Cash and cash equivalents as at 31.12. 72.1 68.4
Change in cash and cash equivalents 3.7 17.9
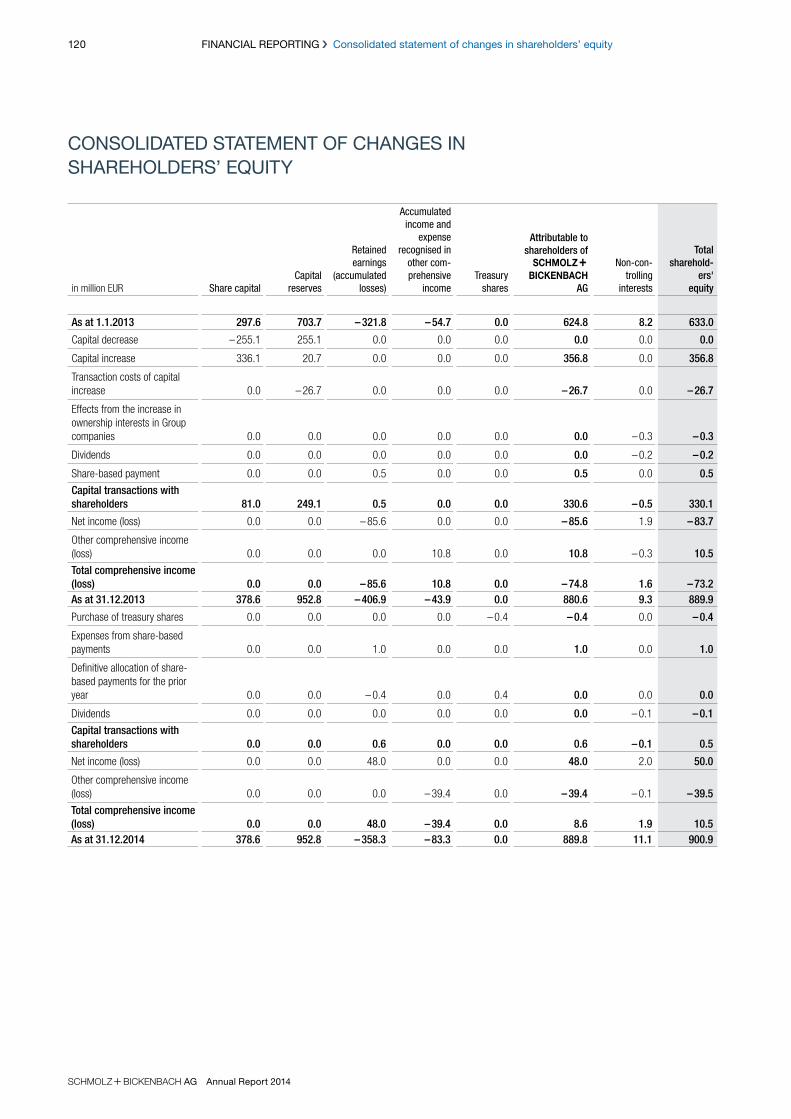
120 FINANCIAL REPORTING Consolidated statement of changes in shareholders’ equity
S+Bi AG Annual Report 2014
CONSOLIDATED STATEMENT OF CHANGES INSHAREHOLDERS’ EQUITY
in million EUR Share capitalCapital
reserves
Retained earnings
(accumulated losses)
Accumulated income and
expense recognised in
other com-prehensive
incomeTreasury
shares
Attributable to shareholders of s+
bi AG
Non-con-trolling
interests
Total sharehold-
ers' equity
As at 1.1.2013 297.6 703.7 – 321.8 – 54.7 0.0 624.8 8.2 633.0
Capital decrease – 255.1 255.1 0.0 0.0 0.0 0.0 0.0 0.0
Capital increase 336.1 20.7 0.0 0.0 0.0 356.8 0.0 356.8
Transaction costs of capital increase 0.0 – 26.7 0.0 0.0 0.0 – 26.7 0.0 – 26.7
Effects from the increase in ownership interests in Group companies 0.0 0.0 0.0 0.0 0.0 0.0 – 0.3 – 0.3
Dividends 0.0 0.0 0.0 0.0 0.0 0.0 – 0.2 – 0.2
Share-based payment 0.0 0.0 0.5 0.0 0.0 0.5 0.0 0.5
Capital transactions with shareholders 81.0 249.1 0.5 0.0 0.0 330.6 – 0.5 330.1
Net income (loss) 0.0 0.0 – 85.6 0.0 0.0 – 85.6 1.9 – 83.7
Other comprehensive income (loss) 0.0 0.0 0.0 10.8 0.0 10.8 – 0.3 10.5
Total comprehensive income (loss) 0.0 0.0 – 85.6 10.8 0.0 – 74.8 1.6 – 73.2As at 31.12.2013 378.6 952.8 – 406.9 – 43.9 0.0 880.6 9.3 889.9
Purchase of treasury shares 0.0 0.0 0.0 0.0 – 0.4 – 0.4 0.0 – 0.4
Expenses from share-based payments 0.0 0.0 1.0 0.0 0.0 1.0 0.0 1.0
Definitive allocation of share-based payments for the prior year 0.0 0.0 – 0.4 0.0 0.4 0.0 0.0 0.0
Dividends 0.0 0.0 0.0 0.0 0.0 0.0 – 0.1 – 0.1
Capital transactions with shareholders 0.0 0.0 0.6 0.0 0.0 0.6 – 0.1 0.5
Net income (loss) 0.0 0.0 48.0 0.0 0.0 48.0 2.0 50.0
Other comprehensive income (loss) 0.0 0.0 0.0 – 39.4 0.0 – 39.4 – 0.1 – 39.5
Total comprehensive income (loss) 0.0 0.0 48.0 – 39.4 0.0 8.6 1.9 10.5As at 31.12.2014 378.6 952.8 – 358.3 – 83.3 0.0 889.8 11.1 900.9

S+Bi AG Annual Report 2014
121FINANCIAL REPORTING Notes to the consolidated financial statements
NOTES TO THE CONSOLIDATED FINANCIAL STATEMENTS
1_ About the Company
S + Bi AG (s +
bi) is a Swiss company limited by shares
which is listed on the SIX Swiss Exchange (SIX) and has
its registered office at Emmenweidstrasse 90 in Emmen.
s + bi is a global steel company
operating in the special and long steel business. Its
activities are divided into two divisions: Production and
Sales & Services.
These consolidated financial statements were autho-
rised for issue by the Board of Directors on 11 March
2015, subject to the approval of the Annual General
Meeting on 15 April 2015.
2_Accounting policies
The consolidated financial statements of s +
bi AG for the fiscal year 2014 were pre-
pared in accordance with International Financial Report-
ing Standards (IFRSs). They are based on the standards
and interpretations that were mandatory or early adopted
as at 31 December 2014. Note 4 presents information
about the standards and interpretations that became
mandatory during fiscal year 2014, the standards
and interpretations that have already been published
but are not yet mandatory and the decisions of the
S + Bi Group regarding early
adoption.
The consolidated financial statements are presented in
euro. Unless otherwise stated, monetary amounts are
denominated in millions of euro.
The financial reporting period is the calendar year. The
consolidated income statement, consolidated statement
of comprehensive income, consolidated statement of
financial position, consolidated statement of cash flows
and consolidated statement of changes in shareholders’
equity all contain comparative figures from the prior year.
3_Significant accounting judgements, estimates and assumptions
In preparing these consolidated financial statements,
assumptions and estimates have been made which
affect the carrying amounts and disclosure of the rec-
ognised assets and liabilities, income and expenses,
and contingent liabilities.
All assumptions and estimates are made according
to the best of management’s knowledge and belief in
order to present a true and fair view of the net assets,
financial position and results of operations of the Group.
Since the actual values may, in some cases, differ from
the assumptions and estimates that were made, these
are continuously reviewed. Adjustments to estimates
that are relevant for financial reporting are considered
in the period in which the change occurs, provided that
the change relates only to this period. If the change
relates not only to the reporting period but also to sub-
sequent periods, the change is taken into account both
in the period of the change and in all subsequent peri-
ods affected.
Impairment of deferred tax assets
(see note 7.9)
Future tax relief in the form of deferred tax assets should
only be recognised to the extent that it is considered
probable that these will be realised on the basis of future
taxable income. At the end of each reporting period,
deferred tax assets are assessed for recoverability
based on multi-year tax plans. These plans are based on
the Group companies’ medium-term planning, which is
approved by the Board of Directors.
The estimate of future taxable income is also affected by
the Group’s strategic tax planning.
S+Bi AG Annual Report 2014
122 FINANCIAL REPORTING Notes to the consolidated financial statements
Depreciation and amortisation of non-current
assets with finite useful lives
(see notes 8.1 and 8.2)
Assets with finite useful lives are subject to amortisation
or depreciation. For this purpose, the useful life of each
asset is estimated upon initial recognition, reviewed at
each reporting date and adjusted when necessary.
Impairment testing of non-current, non-financial
assets
(see note 8.3)
Goodwill and other intangible assets with indefinite use-
ful lives are subject to an impairment test at least annu-
ally as at 30 November. In addition, all assets are tested
for indications of possible impairment at each reporting
date.
Impairment testing uses the discounted cash flow method
to determine the recoverable amount of a cash-generat-
ing unit. This is then compared to the carrying amount
of the net assets. Cash flows are measured based on
the Group companies’ medium-term plans, which are
prepared for a five-year detailed planning period and
have been approved by the Board of Directors. A uni-
form Group-wide growth rate is used to determine the
cash flows beyond the detailed planning period. The cash
flows are discounted using an appropriate discount rate.
Measurement of provisions
(see notes 8.10 and 8.11)
Provisions are generally measured on the basis of the
best estimate of the expenditure required to settle the
present obligation upon recognition, taking into account
all risks and uncertainties affecting the estimate.
Provisions for pensions and similar obligations in par-
ticular are based on estimates and assumptions with
respect to the discount rate, expected salary and pen-
sion increases and mortality rates.
4_Standards and interpretations applied
The accounting policies and measurement principles
applied in these consolidated financial statements are con-
sistent with those used for the 2013 consolidated financial
statements with the exception of new and revised stan-
dards and interpretations applied for the first time during
the fiscal year 2014.
Amendments, interpretations of published stan-
dards or new standards that are mandatory for the
first time in the fiscal year 2014
The following revised standards and new interpretation
were applicable for the first time in 2014:
> IAS 27 “Separate Financial Statements”
> IAS 32 “Financial Instruments: Presentation”
> IAS 39 “Financial Instruments: Recognition and Mea-
surement”
> IFRS 10 “Consolidated Financial Statements”
> IFRS 12 “Disclosure of Interests in Other Entities” and
> IFRIC 21 “Levies”.
The revised standards and the new interpretation did not
have a material impact on these consolidated financial
statements of S + Bi AG.
Amendments, interpretations of published standards
or new standards that were published in 2014 and
that the Group has decided not to early adopt
In 2014, the IASB published an accounting standard on
revenue recognition: IFRS 15 “Revenue from Contracts
with Customers”. The aim of the new standard is to com-
bine the requirements previously contained in numerous
other standards and interpretations. At the same time,
uniform principles were established applicable to all
industries and all categories of revenue transactions.
The main element of IFRS 15 is a five-step model that
will be used in future to determine the amount and tim-
ing of revenue recognition. In addition, the standard
contains a number of requirements governing specific
issues, including the treatment of contract costs and
contract modifications.

S+Bi AG Annual Report 2014
123FINANCIAL REPORTING Notes to the consolidated financial statements
IFRS 15 is applicable for the first time for fiscal years
beginning on or after 1 January 2017. Early adoption is
not planned for the time being. The future impact of the
new standard on the consolidated financial statements is
currently being analysed.
In 2014, the IASB also published the final version of
IFRS 9 “Financial Instruments”, including the chapters
that were previously missing or that had to be revised
concerning the classification and measurement of finan-
cial assets and on impairment. In addition, the standard
contains requirements already published in 2013 on the
treatment of hedging relationships. Compared to the
previous IAS 39 “Financial Instruments: Recognition and
Measurement”, the requirements of IFRS 9 on scope,
recognition and derecognition are largely unchanged.
In contrast to IAS 39, the new standard prescribes a
new classification model for financial assets. In future,
financial assets will be subsequently measured depend-
ing on their classification into three categories with
different measurement standards and a differing recog-
nition of changes in value. Classification is based both
on the asset’s contractual cash flows and the entity’s
business model for managing the financial asset. The
existing requirements on financial liabilities were largely
assumed in IFRS 9 unchanged. The new impairment
model shifts the focus toward earlier risk provisioning
and prescribes three levels for determining the amount
of the losses to be recognised and the interest income
in future.
IFRS 9 is applicable for the first time for fiscal years
beginning on or after 1 January 2018. Early adoption is
not planned for the time being. The future impact of the
new standard on the consolidated financial statements is
currently being analysed.
Furthermore, the following new standards and
amendments to existing standards were published
in 2014; however, these will not have any material
impact on the consolidated financial statements of
S + Bi AG:
> IAS 1 “Presentation of Financial Statements”
> IAS 16 “Property, Plant and Equipment”
> IAS 27 “Separate Financial Statements”
> IAS 28 “Investments in Associates and Joint Ven-
tures”
> IAS 38 “Intangible Assets”
> IAS 41 “Agriculture”
> IFRS 10 “Consolidated Financial Statements”
> IFRS 11 “Joint Arrangements”
> IFRS 12 “Disclosure of Interests in Other Entities” and
> IFRS 14 “Regulatory Deferral Accounts”.
Furthermore, a new omnibus of minor amendments to vari-
ous standards was also published.
5_Significant accounting policies and measurement principles
With the exception of certain financial instruments that
are measured at fair value, these consolidated financial
statements have been prepared on a historical cost basis.
Consolidation principles
These consolidated financial statements include
S + Bi AG and all companies
that s + bi AG controls directly
or indirectly. S + Bi AG con-
trols an investee when it is exposed, or has rights, to
variable returns from its involvement with the investee
and has the ability to affect those returns through its
power over the investee. These companies are included
in the consolidated financial statements from the date
on which S + Bi AG obtains
the possibility of direct or indirect control and are decon-
solidated when the possibility is lost.

S+Bi AG Annual Report 2014
124 FINANCIAL REPORTING Notes to the consolidated financial statements
Foreign currency translation
The consolidated financial statements are prepared in
the reporting currency, the euro, which is also the func-
tional currency of S + Bi AG.
The annual financial statements of subsidiaries that are
included in the consolidated financial statements and
whose functional currency is not the euro are translated
from their functional currency – usually the local cur-
rency – into the Group’s presentation currency (euro).
Items are translated using the closing-rate method
according to which the statements of financial position
are translated from the functional currency into the
presentation currency at the average spot rate on the
reporting date, while items of profit and loss are trans-
lated at the average rates over the reporting period.
Gains and losses arising from the currency translation
are aggregated and initially included in other compre-
hensive income. Upon sale or loss of control over the
respective company, the accumulated exchange differ-
ences are recycled to profit and loss.
In the consolidated statement of cash flows, amounts
are generally translated at the average exchange rates
over the period or at the historical rates prevailing on
the date of the cash flows. For companies whose func-
tional currency is the local currency, transactions in a
foreign currency are normally initially measured at the
exchange rate prevailing on the date of initial recogni-
tion. Exchange gains and losses resulting from the sub-
sequent measurement of foreign currency receivables
and liabilities at the spot rate on the reporting date are
recognised in profit and loss.
The following exchange rates were used for foreign cur-
rency translation:
Average rates Year-end rates
2014 2013 2014 2013
EUR/BRL 3.12 2.87 3.22 3.25
EUR/CAD 1.47 1.37 1.41 1.46
EUR/CHF 1.21 1.23 1.20 1.23
EUR/GBP 0.81 0.85 0.78 0.83
EUR/USD 1.33 1.33 1.21 1.38
Subsidiaries
The net income or loss of subsidiaries that are acquired
or disposed of during the year are included in the con-
solidated financial statements from the date on which
control begins, or until the date on which it ends,
respectively.
The financial statements of the subsidiaries are prepared
using uniform accounting policies and have the same
reporting date as s + bi AG.
Non-controlling interests represent the portion of equity
not directly or indirectly attributable to the shareholders
of S + Bi AG.
All intercompany receivables, liabilities, income, expenses,
profit and loss are eliminated in the consolidated finan-
cial statements.
Joint ventures
Joint ventures are companies over which the Group has
joint control through an interest in capital and contrac-
tual agreements, together with one or more joint ven-
turers.
Interests in joint ventures are recognised using the
equity method. Any intercompany profits and losses
from transactions with joint ventures accounted for using
the equity method are eliminated on a pro rata basis.
A complete list of shareholdings is presented in note 16.
Business combinations
Business combinations are recognised using the acquisi-
tion method according to which the consideration trans-
ferred for the business combination is offset against
the Group’s interest in the fair values of the identifiable
assets, liabilities, and contingent liabilities as at the date
on which it obtains control. Any resulting positive dif-
ference (goodwill) is capitalised, whereas any negative
difference (negative goodwill) is reassessed and then
immediately recorded through profit and loss. Upon sub-
sequent disposal of a subsidiary, the allocable portion of
the goodwill is included in the calculation of the gain or
loss on disposal.
S+Bi AG Annual Report 2014
125FINANCIAL REPORTING Notes to the consolidated financial statements
Intangible assets
(excluding goodwill)
Intangible assets acquired for a consideration are rec-
ognised at cost and, if they have a finite useful life, are
amortised on a straight-line basis over their expected
economic useful life. If the contractual useful life is less
than the economic useful life, the asset is amortised on
a straight-line basis over the contractual useful life.
Intangible assets with an indefinite useful life are tested
for impairment at least annually, or whenever there are
indications of impairment. Any impairment is immedi-
ately recognised through profit and loss. Reversals of
impairment are also recognised through profit and loss
and are limited to the amortised cost of the asset.
The useful lives and amortisation methods are reviewed
annually.
Internally generated intangible assets are capitalised if it
is probable – based on a reliable estimate – that a future
economic benefit will flow to the entity from the use of
the asset and the cost of the asset can be determined
reliably.
Emissions rights are treated as intangible assets with
indefinite useful lives.
Emissions rights that were allocated free of charge are
recognised at zero cost. Emissions rights acquired for a
consideration are recognised at cost. Increases in the
value of capitalised emissions rights are only recognised
when they are realised on disposal. If the existing emis-
sions rights are insufficient to cover the actual emissions
of the current year, a provision is made for the purchase
of the emissions rights needed to make up the shortfall.
The provision is calculated based on the respective mar-
ket prices and the addition recognised as an expense.
The useful lives of intangible assets are as follows:
in years 2014 2013
Concessions, licences, similar rights 3 to 5 3 to 5
Customer lists 10 to 15 10 to 15
Goodwill
Goodwill resulting from business combinations is not
amortised but is tested for impairment at least annually
or whenever there are indications of possible impair-
ment.
Goodwill acquired in a business combination is allocated
as at the acquisition date to the cash-generating unit
(CGU) that is expected to benefit from the synergies of
the business combination. According to IAS 36, the unit
to which goodwill can be allocated must not be larger
than an operating segment determined in accordance
with IFRS 8. For Sales & Services, the whole operating
segment is defined as a CGU, while Production is sub-
divided into CGUs at the level of the individual business
units.
The annual impairment test is performed as at 30 Novem-
ber, taking into account the medium-term planning of
the respective CGU prepared using the discounted cash
flow method. If the carrying amount of the CGU exceeds
its recoverable amount, any goodwill is impaired. If the
impairment exceeds the carrying amount of the goodwill,
the difference is normally allocated on a pro rata basis
to the assets of the CGU that fall within the scope of
IAS 36.
Impairment losses recorded on goodwill cannot be
reversed.
Property, plant and equipment
Property, plant and equipment is measured at cost,
including any decommissioning costs and borrowing
costs that must be capitalised, less accumulated depre-
ciation and impairment losses. The assets are depreci-
ated on a straight-line basis.
The useful lives and depreciation methods are reviewed
annually.
Routine maintenance and repair costs are expensed as
incurred. Costs for the replacement of components or for
general overhauls of property, plant and equipment are
recognised as an asset if it is probable that future eco-
nomic benefits associated with the item will flow to the
Group and the costs can be reliably determined. If prop-
erty, plant and equipment subject to wear and tear com-
prises significant identifiable components with different
useful lives, these components are treated as separate
units for accounting purposes and depreciated over their
respective useful lives.

S+Bi AG Annual Report 2014
126 FINANCIAL REPORTING Notes to the consolidated financial statements
Upon sale or decommissioning of an item of property,
plant and equipment, the cost and accumulated depre-
ciation of the respective items are derecognised from
the statement of financial position. Any resulting gains
or losses are recognised in profit or loss.
The useful lives of property, plant and equipment are
as follows:
in years 2014 2013
Property
Solid buildings 25 to 50 25 to 50
Lightweight and heavily used solid buildings (e.g. steelworks) 20 20
Plant and equipment
Operating plant and equipment 3 to 20 3 to 20
Machines 3 to 20 3 to 20
Road vehicles and railway waggons 5 to 10 5 to 10
Office equipment 5 to 10 5 to 10
IT hardware 3 to 5 3 to 5
Impairment of non-current, non-financial assets
Non-current, non-financial assets are assessed for
indications of possible impairment as at each reporting
date. If there are indications of possible impairment,
the residual carrying amounts of intangible assets and
of property, plant and equipment are tested for actual
impairment by comparing the carrying amount of an
asset with its respective recoverable amount. The recov-
erable amount is the higher of fair value less costs to
sell and the value in use. If the residual carrying amount
exceeds the recoverable amount, the carrying amount of
the asset is reduced to the recoverable amount.
If the reason for an earlier impairment loss no longer
applies, the impairment loss – with the exception of
goodwill – is reversed. Impairments cannot be reversed
beyond the carrying amount net of amortisation and
depreciation that would have resulted without the past
impairment.
Leasing
The Group acts as both lessee and lessor. Leases are
classified as either finance leases or operating leases.
Whether an arrangement is, or contains, a lease
depends on the economic substance of the arrangement
and requires a decision to be made on whether fulfilment
of the agreement depends on the use of a particular
asset or assets and whether the arrangement conveys
the right to use these assets.
At the commencement of the lease term, finance leases
are recognised at the fair value of the leased asset or,
if lower, the present value of the minimum lease pay-
ments. The corresponding payment obligations from
future lease instalments are recognised as financial lia-
bilities and released over subsequent periods using the
effective interest method. The leased asset is depreci-
ated over the shorter of the lease term and its useful life.
All other leases in which the Group acts as a lessee are
treated as operating leases, with the lease instalments
expensed on a straight-line basis. Leases where the
Group as lessor transfers substantially all the risks and
rewards incidental to ownership of a leased asset are
recognised as finance leases at the lessor. A receivable
is recognised at the amount of the net investment in the
lease with interest income recorded in profit and loss.
All other leases in which the Group acts as a lessor are
treated as operating leases. Assets leased under operat-
ing leases remain in the consolidated statement of finan-
cial position and are depreciated. The lease payments
are recognised as income on a straight-line basis over
the term of the lease.

S+Bi AG Annual Report 2014
127FINANCIAL REPORTING Notes to the consolidated financial statements
Non-current assets held for sale
The Group classifies non-current assets and disposal
groups as held for sale if their carrying amounts will be
recovered principally through a sale transaction rather
than through continuing use. These assets are measured
at the lower of carrying amount or fair value less costs
to sell and are classified as “assets held for sale”. The
assets are no longer amortised/depreciated. Impairment
losses are recorded on these assets only if the fair value
less costs to sell falls below the carrying amount. Should
the fair value less costs to sell subsequently increase,
the previously recognised impairment is reversed. The
reversal is limited to the impairment losses that were
previously recognised on the asset in question.
Financial assets
Financial assets include, but are not limited to, cash
and cash equivalents, trade accounts receivable, other
receivables and loans granted by the Company as well
as primary and derivative financial instruments held for
trading.
Financial assets are initially recognised at fair value plus,
in the case of investments not at fair value through profit
or loss, directly attributable transaction costs.
Financial assets are designated to the respective cat-
egories upon initial recognition. They are reclassified
where necessary and permissible.
For regular way purchases or sales, the trade date is the
relevant date for initial recognition and for derecognition
from the statement of financial position. Financial assets
and financial liabilities are generally reported gross; they
are netted only if the Group currently has a right to off-
set amounts and intends to settle the amounts on a net
basis.
Loans and receivables
After initial recognition, trade accounts receivable and
other current receivables are measured at amortised
cost less any impairment.
Other non-current loans and receivables and non-inter-
est-bearing or low-interest receivables are measured
at amortised cost using the effective interest method.
A discount is included in financial income on a pro rata
basis until the loans and receivables fall due.
The Group sells selected trade accounts receivable on
a revolving basis through an international asset-backed
commercial paper (ABCP) financing programme. Since
the significant risks and rewards remain with the Group,
the trade accounts receivable are still reported in the
statement of financial position as collateral for a financial
liability in accordance with IFRS requirements.
Cash and cash equivalents as shown in the statement
of financial position are measured at amortised cost and
comprise cash on hand, bank balances and short-term
deposits with an initial term to maturity of less than three
months, provided they are not subject to restrictions on
disposal.
Financial assets at fair value through profit or loss
This category mainly comprises derivatives, including
separately recognised embedded derivatives, except
such derivatives that are designated as effective hedg-
ing instruments. Gains or losses on financial assets held
for trading are recognised in the consolidated income
statement.
Available-for-sale financial assets
Available-for-sale financial assets are non-derivative
financial instruments that are designated as available
for sale and are not included in one of the above cat-
egories. After their initial recognition, available-for-sale
financial assets are measured at fair value. Unrealised
gains and losses are recorded in other comprehensive
income. When such financial assets are derecognised or
impaired, the cumulative gain or loss is reclassified from
other comprehensive income to profit or loss.

S+Bi AG Annual Report 2014
128 FINANCIAL REPORTING Notes to the consolidated financial statements
Impairment of financial assets
The carrying amounts of financial assets not measured
at fair value through profit or loss are reviewed for objec-
tive evidence of impairment at each reporting date.
Examples of objective evidence are significant financial
difficulty of the borrower, probability that the borrower
will enter bankruptcy, the disappearance of an active
market for the financial asset, significant changes in the
technological, economic, market or legal environment in
which the issuer operates, and a prolonged decline in
the fair value of a financial asset below amortised cost.
If there is objective evidence that an impairment loss
on assets carried at amortised cost has been incurred,
the amount of the loss is measured as the difference
between the asset’s carrying amount and the present
value of estimated future cash flows discounted at the
financial asset’s original effective interest rate. Impair-
ment losses are recorded in profit or loss.
If, in a subsequent period, the amount of the impair-
ment loss decreases and the decrease can be related
objectively to an event occurring after the impairment
was recognised, the previously recognised impairment
loss shall be reversed through profit or loss. The rever-
sal shall not result in a carrying amount of the financial
asset that exceeds what the amortised cost would have
been had the impairment not been recognised at the
date the impairment is reversed.
For trade accounts receivable, impairment is recognised
by adjusting the allowance accounts on an individ-
ual basis. Specific defaults lead to receivables being
derecognised. Receivables with a similar risk of default
are grouped and examined for impairment collectively on
the basis of past experience. Any impairment is recorded
in profit or loss.
Inventories
Inventories are measured at the lower of cost or net
realisable value. They are measured using the weighted
average cost method. Cost includes direct material and
labour costs as well as material and production over-
heads allocated proportionally on the assumption of nor-
mal utilisation of production capacity.
Value adjustments are made in an amount sufficient to
take account of all identifiable storage and quantity risks
affecting the expected net realisable value.
Taxes
Current taxes
Current income tax receivables and liabilities for the cur-
rent and earlier reporting periods are measured at the
expected amount of reimbursement from or payment to
the tax authorities. This amount is calculated applying
the tax rates and tax laws that are enacted or substan-
tively enacted at the reporting date.
Deferred taxes
Deferred taxes are recognised using the liability method
on temporary differences between carrying amounts
in the consolidated financial statements and the tax
accounts, as well as on tax-loss and interest carry-for-
wards and tax credits. Apart from initial recognition of
goodwill, for which no deferred tax liabilities are rec-
ognised, such differences are always recognised if they
create deferred tax liabilities. Deferred tax assets are
only recognised if it is probable that the associated tax
benefits will be realised.

S+Bi AG Annual Report 2014
129FINANCIAL REPORTING Notes to the consolidated financial statements
Deferred taxes are calculated using the tax rates that
are expected to apply at the date on which the tempo-
rary differences are expected to reverse. Future tax rates
may be used on condition that they are already enacted
or substantively enacted.
Changes in the deferred taxes in the statement of finan-
cial position result in deferred tax expense or income.
If transactions that result in changes in deferred taxes
are recognised directly in equity or in other comprehen-
sive income, the change in deferred taxes is recognised
within the same item.
Deferred tax assets and deferred tax liabilities are offset
if there is a legally enforceable right to offset current
tax assets against current tax liabilities and the deferred
taxes relate to the same taxable entity and the same tax
authority.
Provisions for pensions and similar obligations
Provisions for pensions and similar obligations are mea-
sured using the projected unit credit method.
Actuarial gains and losses are recognised directly in
other comprehensive income in the period in which they
occur. When there is a surplus in a defined benefit plan
over the amount recognised, the surplus amount rec-
ognised is limited to the asset ceiling (present value of
any economic benefits available in the form of refunds
from the plan or reductions in future contributions to the
plan).
Service cost for pensions and similar obligations is
reported as personnel costs within operating profit. The
net interest on the net defined benefit liability (asset)
is included in the financial result in the consolidated
income statement.
The total past service cost resulting from plan amend-
ments is recognised in profit and loss as soon as the
improvements are announced.
Payments by the Group for defined contribution plans
are recognised in personnel costs.
Other provisions
Provisions are recognised if the Group has a current obli-
gation from a past event, it is probable that an outflow of
resources embodying economic benefits will be required
to settle the obligation and the amount of the obligation
can be reliably estimated. Provisions are measured at
the amount that reflects the best estimate of the expen-
diture required to settle the present obligation as at the
reporting date, with expected reimbursements from third
parties not netted but instead recognised as a separate
asset if it is virtually certain that they will be realised.
Material non-current provisions are discounted at a mar-
ket rate of interest adequate for the risk.
Warranty provisions are created when the respective
products are sold or the respective services rendered.
The amount of the provision is based on the historical
development of warranties as well as consideration of all
future possible warranty cases weighted by their proba-
bilities of occurrence.
Provisions for restructuring measures are recognised to
the extent that a detailed formal restructuring plan has
been prepared and communicated to the parties con-
cerned.
Provisions for potential losses from onerous contracts
are created if the expected economic benefit resulting
from the contract is less than the unavoidable costs of
fulfilling the contract.
S+Bi AG Annual Report 2014
130 FINANCIAL REPORTING Notes to the consolidated financial statements
Financial liabilities
Financial liabilities are initially recognised at fair value
plus, in the case of financial liabilities not subsequently
measured at fair value through profit or loss, directly
attributable transaction costs.
Financial liabilities at fair value through profit or
loss
This category mainly comprises derivatives, including
separately recognised embedded derivatives, except
those that are designated as effective hedging instru-
ments. Gains and losses from financial liabilities held for
trading are recorded in profit or loss.
Other financial liabilities
Trade accounts payable and other primary financial
instruments are generally measured at amortised cost
using the effective interest method.
Derivatives
The Group uses derivative financial instruments to hedge
price, interest and currency risks that result from operating
activities, financial transactions and investments. Derivative
financial instruments are neither held nor issued for specu-
lative purposes.
Derivative financial instruments are initially recognised at
fair value on the date on which a contract is entered into
and are subsequently remeasured at fair value. Derivative
financial instruments are carried as assets when the fair
value is positive and as liabilities when the fair value is neg-
ative. If no market values are available, the fair values are
calculated using recognised valuation models.
Changes in the fair value of derivative financial instru-
ments are immediately recognised in profit or loss unless
the special criteria of IAS 39 for hedge accounting are
satisfied. Cash flow hedges are used to hedge future
cash flows from firm commitments or from the highly
probable forecast purchase of commodities. The effec-
tive portion of the hedging instrument is recorded in
other comprehensive income, while the ineffective por-
tion is recorded in profit or loss. Amounts recorded in
other comprehensive income are reclassified to profit or
loss when the hedged transaction affects profit or loss.
For commodity derivatives, reclassification adjustments
are made in cost of materials; for interest derivatives they
are made in financial income or expense and for cur-
rency derivatives in other operating income or expenses.
In accordance with the hedge accounting principles,
hedges are initially tested for effectiveness upon desig-
nation of the hedging instrument as an effective hedge.
Effectiveness is subsequently monitored periodically.
If a hedge becomes ineffective within the ranges stipu-
lated in IAS 39, the ineffective portion is recognised in
profit or loss. The effective portion remains in equity until
the underlying transaction is recognised through profit or
loss. If a recognised hedge becomes completely ineffec-
tive, the contract is terminated or future payments are
no longer expected to occur, hedge accounting is dis-
continued immediately and the transaction is recognised
in profit or loss from that date. The accumulated gains
or losses previously recorded in other comprehensive
income remain in equity. They are reclassified to profit
and loss when the hedged transaction actually affects
profit or loss or as soon as the future transaction is no
longer expected to occur.

S+Bi AG Annual Report 2014
131FINANCIAL REPORTING Notes to the consolidated financial statements
The underlying is recognised in accordance with the
applicable provisions. Hedge accounting reduces the
volatilities in the income statement since the effects on
profit or loss of the underlying and hedging transaction
are recognised in the same period and in the same line
item of the income statement.
IAS 39 stipulates strict criteria for hedge accounting.
These are fulfilled by the S + Bi
Group, with regard to the required formal documenta-
tion on designation and the ongoing assessment of the
effectiveness and occurrence of the forecast future cash
flows.
Revenue recognition
Revenue from product sales is reported as soon as the
significant risks and rewards of ownership have been
transferred to the purchaser and the amount of the real-
isable revenue can be reliably determined.
Revenue is reported net of VAT, returns, discounts and
price reductions.
Interest income is recorded pro rata temporis using the
effective interest method based on the outstanding cap-
ital amount and the applicable interest rate. Dividend
income is recognised when the right to receive payment
has been legally established.
Government grants
Government grants are not recognised until there is
reasonable assurance that the entity will comply with
the conditions attaching to it, and that the grant will be
received. Government investment grants are reported
as a reduction of the cost of the asset concerned,
with a corresponding reduction of amortisation and
depreciation in subsequent periods. Grants not related
to investments are deducted from the expenses to be
compensated by the grants in the period in which the
expenses are incurred.
Research & Development
Research expenses are recorded immediately in profit
and loss. Development expenses are capitalised if a
newly developed product or method can, among other
things, be unequivocally identified, if the product or
process is technically and economically feasible, the
development is marketable, the expenses can be reli-
ably measured, and the Group has adequate resources
to complete the development project. All other develop-
ment expenses are recorded immediately in profit and
loss. Capitalised development expenses of completed
projects are reported at cost less any accumulated
depreciation. Cost includes all costs directly allocable to
development as well as a portion of directly attributable
development overheads.
Borrowing costs
Borrowing costs which can be attributed to the acquisi-
tion, construction or production of a qualifying asset are
capitalised and depreciated over the economic useful life
of the qualifying asset.
6_Scope of consolidation and business combinations
Business combinations in 2014
There were no business combinations in 2014.
Other changes in the scope of consolidation in
2014
In the second quarter of 2014, the joint venture Stahl-
Logistik & ServiceCenter GmbH (AT) went into liquida-
tion.
With the aim of further simplifying the Group’s legal struc-
ture, S + Bi Europe GmbH (DE)
was merged with S + Bi Inter-
national GmbH (DE), S + Bi
Vertriebsunterstutzungs GmbH (DE) was merged with
S + Bi Edelstahl GmbH (DE)
and Ugitech Precision SAS (FR) was merged with
Ugitech S.A. (FR) in the third quarter of 2014.
In addition, S + Bi Deutsch-
land GmbH (DE) was founded and allocated to Sales &
Services in the fourth quarter of 2014.

S+Bi AG Annual Report 2014
132 FINANCIAL REPORTING Notes to the consolidated financial statements
7.2 Other operating income
in million EUR 2014 2013
Income from reversal of provisions 7.2 4.3
Rent and lease income 3.1 3.1
Income from recovery of previously written off receivables and reversal of allowances on receivables 2.4 1.9
Insurance reimbursement 2.3 4.5
Gains on disposal of intangible assets, property, plant and equipment, and financial assets 1.7 3.0
Grants and allowances 1.4 2.3
Own work capitalised 0.6 1.6
Net exchange gains/losses 0.0 0.1
Miscellaneous income 21.6 22.0
Total 40.3 42.8
Miscellaneous income comprises a number of individ-
ually immaterial items which cannot be allocated to
another line item.
7.3 Personnel costs
in million EUR 2014 2013
Wages and salaries 471.3 457.4
Social security contributions 109.0 109.6
Other personnel costs 16.7 31.2
Total 597.0 598.2
Personnel costs contain expenses in connection with
termination benefits and contractual adjustments
amounting to EUR 5.7 million (2013: EUR 23.6 million).
Business combinations in 2013
There were no business combinations in 2013.
Other changes in the scope of consolidation in
2013
The remaining 24.9% of shares in the previously con-
solidated subsidiary Ardenacier S.A.R.L. (FR) were
acquired in February 2013.
The following mergers took place in December
2013 with retroactive effect as at 1 July 2013:
S + Bi Engineering GmbH (DE)
was merged with S + Bi Edel-
stahl GmbH (DE); S + Bi Anar-
beitung GmbH (DE) with S + Bi
Distributions GmbH (DE); Präzisionsteile Oberkochen
GmbH (DE) with Gunther + Schramm GmbH (DE). Ugitech
TFA S.r.l. (IT ), which was founded in early 2013 and is
wholly owned by S + Bi via its
subsidiary Ugitech Italia S.r.l. (IT ), was included in the
consolidated financial statements for the first time as at
31 December 2013 and allocated to Production.
7_Notes to the consolidated income statement
7.1 Cost of materials
in million EUR 2014 2013
Cost of raw materials, consumables, supplies and merchandise 1 882.5 1 900.5
Other purchased services 322.8 313.2
Total 2 205.3 2 213.7
Losses of EUR 0.1 million (2013: EUR 0.2 million) on
commodity derivatives were reclassified from other
comprehensive income to cost of materials in the current
year because the underlying transaction of the cash flow
hedge was also recognised in profit and loss or ceased
to exist.

S+Bi AG Annual Report 2014
133FINANCIAL REPORTING Notes to the consolidated financial statements
7.4 Other operating expenses
in million EUR 2014 2013
Freight 104.5 101.2
Maintenance, repairs 71.4 66.4
Rent and lease expenses 30.1 33.8
Advisory, audit and IT services 26.3 33.8
Insurance fees 13.0 12.7
Travel, advertisement and distribution costs 18.5 19.4
Non-income taxes 9.6 9.7
Commission expense 6.6 9.6
Energy costs 5.9 6.9
Net exchange gains/losses 5.9 0.0
Cost of allowances on receivables and bad debts 5.5 5.8
Cost for environmental protection measures 3.5 3.7
Vehicle fleet 3.1 3.0
Voluntary social security contributions 2.0 3.9
Licenses and patents 1.8 1.7
Expenses for the Board of Directors 1.8 1.4
Losses on disposal of intangible assets, property, plant and equipment, and financial assets 0.5 0.6
Miscellaneous expense 48.0 45.7
Total 358.0 359.3
The item advisory, audit and IT services also includes
the total fees billed by the auditor Ernst & Young. In
2014, the auditor billed fees of EUR 1.7 million (2013:
EUR 1.6 million) for the audit of the financial statements
and fees of EUR 0.1 million (2013: EUR 0.9 million) for
other assurance services. In the reporting period, the
auditor also billed fees of EUR 0.9 million (2013: EUR 1.4
million) for tax advisory services and of EUR 0.2 million
(2013: EUR 0.4 million) for other services.
Exchange rate gains and losses on the measurement of
trade accounts receivable and payable are stated net in
the income statement and presented in other operating
income or expenses depending on whether the net figure
is positive or negative.
The net figure breaks down as follows
in million EUR 2014 2013
Exchange gains 22.8 16.7
Exchange losses 28.7 16.6
Net exchange gains/losses – 5.9 0.1
Miscellaneous expenses comprise a number of indi-
vidually immaterial items which cannot be allocated to
another line item.
7.5 Research and development expenses
Research and development expenses of EUR 7.5 million
were incurred in 2014 (2013: EUR 7.3 million). They
relate to third-party expenses for new product appli-
cations and process improvements. The conditions for
capitalising the development costs were not fulfilled in
either of the reporting periods.
7.6 Government grants
Government investment grants totalling EUR 0.9 million
(2013: EUR 0.7 million) were recognised in the fiscal year
as a reduction in the cost of the corresponding assets.
These grants are linked to certain conditions which are
currently met.
In addition, government grants to reimburse expenses
of EUR 1.8 million (2013: EUR 5.1 million) incurred by
the Group were recognised in the fiscal year. These
mainly relate to reimbursements for welfare benefits and
employee qualification measures. The refunds were rec-
ognised as deductions from the respective expense items
in the income statement.
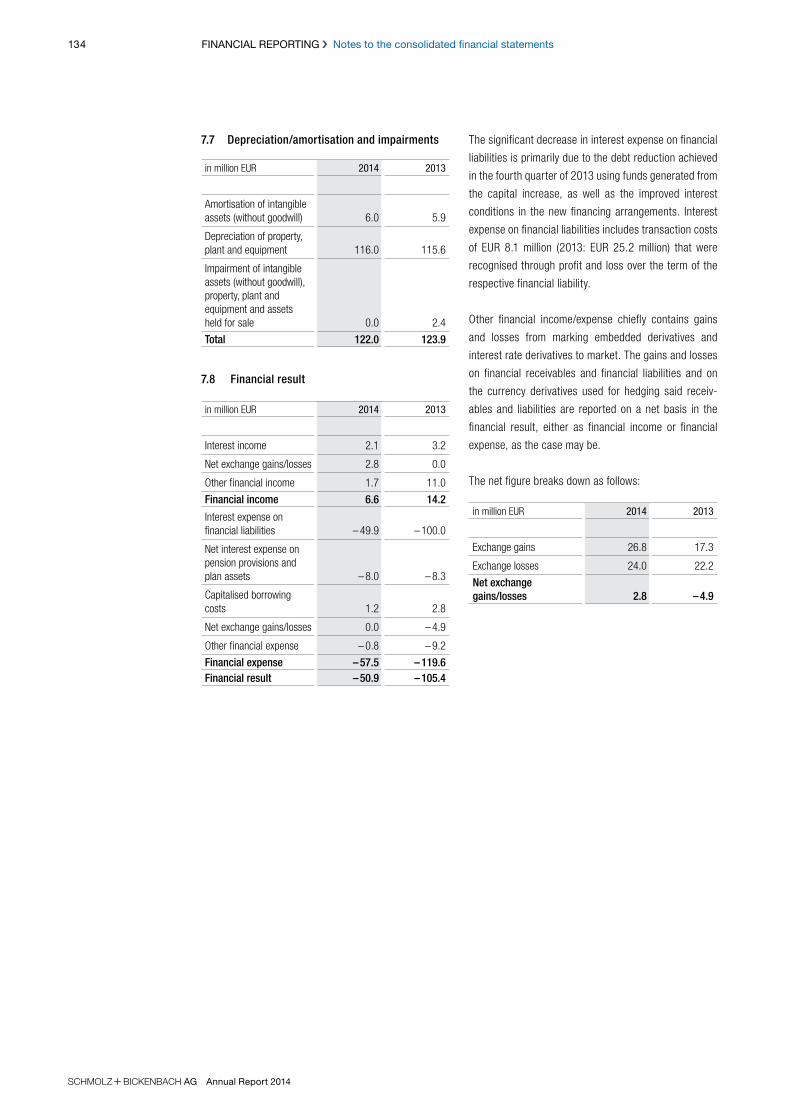
S+Bi AG Annual Report 2014
134 FINANCIAL REPORTING Notes to the consolidated financial statements
7.7 Depreciation/amortisation and impairments
in million EUR 2014 2013
Amortisation of intangible assets (without goodwill) 6.0 5.9
Depreciation of property, plant and equipment 116.0 115.6
Impairment of intangible assets (without goodwill), property, plant and equipment and assets held for sale 0.0 2.4
Total 122.0 123.9
7.8 Financial result
in million EUR 2014 2013
Interest income 2.1 3.2
Net exchange gains/losses 2.8 0.0
Other financial income 1.7 11.0
Financial income 6.6 14.2
Interest expense on financial liabilities – 49.9 – 100.0
Net interest expense on pension provisions and plan assets – 8.0 – 8.3
Capitalised borrowing costs 1.2 2.8
Net exchange gains/losses 0.0 – 4.9
Other financial expense – 0.8 – 9.2
Financial expense – 57.5 – 119.6Financial result – 50.9 – 105.4
The significant decrease in interest expense on financial
liabilities is primarily due to the debt reduction achieved
in the fourth quarter of 2013 using funds generated from
the capital increase, as well as the improved interest
conditions in the new financing arrangements. Interest
expense on financial liabilities includes transaction costs
of EUR 8.1 million (2013: EUR 25.2 million) that were
recognised through profit and loss over the term of the
respective financial liability.
Other financial income/expense chiefly contains gains
and losses from marking embedded derivatives and
interest rate derivatives to market. The gains and losses
on financial receivables and financial liabilities and on
the currency derivatives used for hedging said receiv-
ables and liabilities are reported on a net basis in the
financial result, either as financial income or financial
expense, as the case may be.
The net figure breaks down as follows:
in million EUR 2014 2013
Exchange gains 26.8 17.3
Exchange losses 24.0 22.2
Net exchange gains/losses 2.8 – 4.9

S+Bi AG Annual Report 2014
135FINANCIAL REPORTING Notes to the consolidated financial statements
in million EUR 2014 2013
Earnings before taxes 79.7 – 87.6
Domestic income tax rate 12.30% 12.30%
Expected income tax expense/(income) 9.8 – 10.8
Effects of different income tax rates 14.2 – 0.9
Non-deductible expense/tax-free income 9.7 – 1.0
Tax effects from prior years – 0.6 – 15.7
Tax effects due to changes in tax rates or changes in tax laws 1.3 – 0.6
Deferred tax assets not recognised on temporary differences, tax credits, tax-loss and interest carry-forwards of the current year 1.3 24.8
Effects from the utilisation of deferred tax assets on temporary differences, tax credits, tax-loss and interest carry-forwards not capitalised in prior years for the reduction of the current tax expense – 1.2 – 0.4
Effects from the utilisation of deferred tax assets on temporary differences, tax credits, tax-loss and interest carry-forwards not capitalised in prior years for the reduction of the deferred tax expense – 4.3 – 0.2
Valuation adjustments on deferred tax assets on temporary differences, tax credits, tax-loss and interest carry-forwards capitalised in prior years – 0.5 0.9
Effective income tax expense/(income) 29.7 – 3.9
Effective tax rate 37.3% 4.5%
7.9 Income taxes
The main components of income tax in the fiscal years
2014 and 2013 are as follows:
in million EUR 2014 2013
Current taxes 24.7 11.5– of which: tax expense/(income) in the reporting period 25.3 12.8– of which: tax expense/(income) from prior years – 0.6 – 1.3Deferred taxes 5.0 – 15.4– of which: deferred tax expense/(income) from the origination and reversal of temporary
differences 0.6 – 13.0– of which: deferred tax expense/(income) from tax-loss carry-forwards, interest carry-for-
wards and tax credits 4.4 – 2.4Income tax expense/(income) 29.7 – 3.9
Deferred tax assets on tax-loss carry-forwards, inter-
est carry-forwards and tax credits are only recognised
when it is probable that future economic benefits will be
derived, based on the companies’ multi-year tax planning
in accordance with the medium-term plan approved by the
Board of Directors. Income taxes are derived as follows
from the expected income tax expense that would have
applied using the average tax rate of the Swiss operating
companies:
S+Bi AG Annual Report 2014
136 FINANCIAL REPORTING Notes to the consolidated financial statements
The average tax rate for Switzerland was unchanged
on the prior year at 12.30% in the reporting period. As
s + bi AG is not an operating
company, it benefits from the Swiss tax holding privilege
and is therefore not included in the calculation of average
tax rate. In the current year, future tax rate changes had a
small negative impact on deferred taxes of EUR 1.3 million
(2013: positive impact of EUR 0.6 million).
An income tax expense of EUR 29.7 million (2013: tax
income of EUR 3.9 million) was incurred for the fiscal year
2014, resulting in an effective Group tax rate of 37.3%
(2013: 4.5%). Regarding the effective Group tax rate for
the prior year, it is important to consider that no deferred
tax assets were recognised on temporary differences, tax
losses, interest carryforwards or tax credits of EUR 24.8
million in total. Most of these came from the German tax
group and were not recognised because their future reali-
sation was deemed uncertain. A portion of these deferred
tax assets were subsequently recognised in 2014 due to
an improvement in the earnings situation. Furthermore,
tax income of EUR 14.4 million was generated in 2013
as a result of amending the tax treatment of inventory
valuation at the German entities, which led to the reversal
of previously recognised deferred tax liabilities.
Total unrecognised deferred tax assets for temporary dif-
ferences, tax-loss and interest carry-forwards as well as
tax credits fell compared to the prior year to EUR 250.3
million (2013: EUR 264.0 million). Their maturity profile
is set out below:
in million EUR 31.12.2014 31.12.2013
Expiry within
– 1 year 1.0 2.8
– 2 to 5 years 17.0 16.4
– over 5 years 232.3 244.8
Total 250.3 264.0
The table below shows the amount of temporary dif-
ferences, tax-loss and interest carry-forwards and tax
credits broken down by tax rate of the companies to
which they pertain:
in million EUR 31.12.2014 31.12.2013
Tax rate
– less than 20% 8.7 12.6
– 20% to 30% 22.9 30.7
– more than 30% 218.7 220.7
Total 250.3 264.0
The table below shows a breakdown of the deferred
taxes recorded on material items of the statement of
financial position as well as tax-loss and interest carry-
forwards and tax credits:
Deferred tax assets Deferred tax liabilities
in million EUR 31.12.2014 31.12.2013 31.12.2014 31.12.2013
Non-current assets 24.6 26.7 73.5 70.1– Intangible assets 9.2 10.5 2.0 2.1– Property, plant and equipment 13.3 14.3 68.9 67.5– Financial assets 1.0 0.9 2.2 0.1– Other assets 1.1 1.0 0.4 0.4Current assets 11.3 11.1 7.1 5.5– Inventories 9.0 8.6 3.3 3.3– Other assets 2.3 2.5 3.8 2.2Non-current liabilities 64.2 45.0 31.3 33.0– Provisions 56.4 38.7 31.3 32.9– Other liabilities 7.8 6.3 0.0 0.1Current liabilities 8.2 7.5 2.3 2.8– Provisions 2.7 4.1 2.1 2.1– Other liabilities 5.5 3.4 0.2 0.7
Tax credits 1.4 1.8
Tax-loss and interest carry-forwards 49.5 51.8
Total 159.2 143.9 114.2 111.4
Netting – 74.3 – 74.5 – 74.3 – 74.5
Amount recognised 84.9 69.4 39.9 36.9
S+Bi AG Annual Report 2014
137FINANCIAL REPORTING Notes to the consolidated financial statements
The net change in deferred tax assets and liabilities
breaks down as follows:
in million EUR 2014 2013
Balance as at 1.1. 32.5 23.3
Changes recognised in profit and loss – 5.0 15.4
Changes recognised in other comprehensive income 21.0 – 7.6
Foreign currency effects – 3.5 1.4
Balance as at 31.12. 45.0 32.5
Accumulated taxes recognised in other comprehensive
income amounted to EUR 40.2 million (2013: EUR 19.3
million) as at the reporting date.
IAS 12.39 requires entities to recognise a deferred
tax liability for all taxable temporary differences asso-
ciated with investments in subsidiaries, joint ventures
and associates. These temporary differences, known
as outside basis differences, arise when the net assets
of the subsidiaries and associates differ from the tax
bases of the entity concerned. No deferred tax liabilities
were recognised for outside basis differences of around
EUR 272 million, of which EUR 14.0 million was taxable
(2013: EUR 273 million, of which EUR 14.1 million was
taxable) because the reversal of temporary differences
is controlled by s + bi and is not
expected for the foreseeable future.
7.10 Earnings per share
2014 2013
Net loss attributable to registered shareholders of S+
Bi AG in million EUR 48.0 – 85.6
Average number of shares 945 000 000 324 843 750
Earnings per share in EUR (basic/diluted) 0.05 – 0.26
Basic earnings per share is calculated by dividing the
net income/loss attributable to the holders of regis-
tered shares of s + bi AG by
the weighted average number of shares outstanding
during the fiscal year. The number of shares increased
from 118 125 000 to 945 000 000 following the capital
increase carried out in October 2013. The weighted
average number of shares outstanding was therefore
324 843 50 in 2013, compared to a stable number of
945 000 000 in 2014.
The average diluted number of shares was 946 155 530
in 2014. Diluted earnings per share was the same as
basic earnings per share.

138 FINANCIAL REPORTING Notes to the consolidated financial statements
S+Bi AG Annual Report 2014
8_Notes to the consolidated statement of financial position
8.1 Intangible assets
Intangible assets developed as follows:
in million EURConcessions, licences
and similar rightsPurchased brands and customer lists
Prepayments on intangible assets Goodwill Total
Cost as at 1.1.2013 81.6 25.7 0.2 5.9 113.4
Additions 2.9 0.0 0.3 0.0 3.2
Disposals – 2.9 0.0 0.0 0.0 – 2.9
Reclassifications 0.3 0.0 – 0.3 0.0 0.0
Foreign currency effects – 0.7 – 1.0 0.0 – 0.2 – 1.9
Cost as at 31.12.2013 81.2 24.7 0.2 5.7 111.8
Additions 1.9 0.0 0.9 0.0 2.8
Disposals – 2.0 0.0 – 0.1 0.0 – 2.1
Reclassifications 3.2 0.0 – 3.2 0.0 0.0
Foreign currency effects 1.3 1.4 2.8 0.0 5.5
Cost as at 31.12.2014 85.6 26.1 0.6 5.7 118.0
Accumulated amortisation and impairments as at 1.1.2013 – 69.5 – 5.1 0.0 – 2.6 – 77.2
Amortisation – 5.1 – 0.8 0.0 0.0 – 5.9
Disposals 2.9 0.0 0.0 0.0 2.9
Foreign currency effects 0.6 0.1 0.0 0.1 0.8
Accumulated amortisation and impairments as at 31.12.2013 – 71.1 – 5.8 0.0 – 2.5 – 79.4
Amortisation – 5.2 – 0.8 0.0 0.0 – 6.0
Disposals 2.0 0.0 0.0 0.0 2.0
Foreign currency effects – 1.3 – 0.2 0.0 – 0.2 – 1.7
Accumulated amortisation and impairments as at 31.12.2014 – 75.6 – 6.8 0.0 – 2.7 – 85.1
Net carrying amount as at 31.12.2013 10.1 18.9 0.2 3.2 32.4Net carrying amount as at 31.12.2014 10.0 19.3 0.6 3.0 32.9
There were no restrictions on ownership and disposal as
at each reporting date.

139FINANCIAL REPORTING Notes to the consolidated financial statements
S+Bi AG Annual Report 2014
8.2 Property, plant and equipment
Property, plant and equipment developed as follows:
in million EURLand and buildings
Plant and equipment
Prepayments/plant under construction Total
Cost as at 1.1.2013 657.0 2 115.6 74.9 2 847.5
Additions 12.4 43.9 46.2 102.5
Disposals – 5.0 – 33.3 – 0.6 – 38.9
Reclassifications 14.2 47.8 – 62.0 0.0
Foreign currency effects – 9.9 – 23.5 – 1.0 – 34.4
Cost as at 31.12.2013 668.7 2 150.5 57.5 2 876.7
Reclassifications from assets held for sale 0.0 0.5 0.0 0.5
Additions 6.3 60.1 31.6 98.0
Disposals – 0.7 – 47.9 – 0.2 – 48.8
Reclassifications 7.5 37.6 – 45.1 0.0
Foreign currency effects 14.1 33.0 – 1.7 45.4
Cost as at 31.12.2014 695.9 2 233.8 42.1 2 971.8
Accumulated depreciation and impairments as at 1.1.2013 – 372.9 – 1 576.0 0.0 – 1 948.9
Depreciation – 15.8 – 99.8 0.0 – 115.6
Impairment – 1.3 – 1.1 0.0 – 2.4
Reversal of impairment 0.0 0.6 0.0 0.6
Disposals 2.8 31.7 0.0 34.5
Foreign currency effects 3.4 14.3 0.0 17.7
Accumulated depreciation and impairments as at 31.12.2013 – 383.8 – 1 630.3 0.0 – 2 014.1
Depreciation – 16.3 – 99.7 0.0 – 116.0
Disposals 0.3 46.8 0.0 47.1
Foreign currency effects – 4.4 – 15.3 0.0 – 19.7
Accumulated depreciation and impairments as at 31.12.2014 – 404.2 – 1 698.5 0.0 – 2 102.7
Net carrying amount as at 31.12.2013 284.9 520.2 57.5 862.6Net carrying amount as at 31.12.2014 291.7 535.3 42.1 869.1Fire insurance value as at 31.12.2013 1 424.7 3 162.4 15.2 4 602.3Fire insurance value as at 31.12.2014 1 451.3 3 295.4 4.5 4 751.2
Assets from finance leases are disclosed under land and
buildings at a carrying amount of EUR 4.4 million (2013:
EUR 4.6 million) and under plant and equipment at a car-
rying amount of EUR 5.3 million (2013: EUR 7.3 million).
Of the additions, EUR 0.3 million (2013: EUR 0.2 million)
relates to finance leases.
Restrictions on ownership and disposal decreased to
EUR 38.6 million as at the reporting date (2013:
EUR 49.8 million). This development is primarily attrib-
utable to the lower security pledged due to the partial
repayment of the loan in connection with the investment
in the secondary metallurgic centre at Deutsche Edel-
stahlwerke GmbH (DE).
Borrowing costs of EUR 1.2 million (2013: EUR 2.8 mil-
lion) were capitalised in fiscal 2014 and are included in
additions. They mainly relate to investment projects asso-
ciated with the construction of the secondary metallurgic
centre at Deutsche Edelstahlwerke GmbH (DE). The aver-
age rate applied for borrowing costs was 6.7% in 2014
(2013: 9.7%).

140 FINANCIAL REPORTING Notes to the consolidated financial statements
S+Bi AG Annual Report 2014
8.3 Impairment testing
No impairments were charged on goodwill or other intan-
gible assets in 2014 and 2013. Following the impair-
ments of EUR 2.4 million charged on property, plant and
equipment in 2013, no further impairment losses had to
be recognised on this item in 2014.
Goodwill impairment test
Goodwill resulting from business combinations is not
amortised but is tested for impairment at the level of
its cash-generating unit (CGU) at least annually as at
30 November or whenever there are indications of impair-
ment.
The impairment test determines the fair value less costs
to sell of the CGU using the discounted cash flow method.
This is measured on the basis of medium-term plans,
which are prepared for a five-year detailed planning period
and have been approved by the Board of Directors. Key
assumptions in determining fair value less costs to sell
include projections of future gross profit margins as well
as growth and discount rates. The weighted average cost
of capital (WACC) used for discounting assumes a risk-
free interest rate and considers risk premiums for equity
and debt. Furthermore, a specific beta factor based on the
relevant peer group, the tax rate and the capital structure
are considered individually for each CGU.
Goodwill from business combinations amounted to EUR 3.0
million as at 31 December 2014 (2013: EUR 3.2 million);
the difference is due to currency effects. Following realign-
ment of the segments in 2013, the goodwill previously
allocated to the former Processing segment was fully
transferred to the Production segment and allocated to the
S+B Bright Bar CGU.
Cash flows in the Production segment were discounted
using a post-tax rate of 7.7% (2013: 7.9%) or a pre-tax
rate of 9.5% (2013: 9.9%). A growth rate of 1.5% (2013:
1.5%) is assumed to determine the cash flows beyond the
detailed planning period.
Impairment testing of other intangible assets with
indefinite useful lives
The brands recognised in connection with the acquisi-
tion of the Finkl Group and Boxholm Stål AB (SE) were
recorded as intangible assets with an indefinite useful
life. This reflects the intention to use these brands for
an indefinite period of time, meaning that no useful life
can be determined. The brands are therefore not amor-
tised but are tested at CGU level at least annually as at
30 November, or when there are indications of possible
impairment.
With a carrying amount of EUR 14.4 million (2013:
EUR 13.3 million), the brands were reallocated in full
from the former Processing segment to the Production
segment in 2013 following the realignment of the seg-
ments.
Within the Production segment, the brands are alloca-
ted to A. Finkl & Sons Co. (US) with a carrying amount
of EUR 9.6 million (2013: EUR 8.4 million), to Sorel
Forge Co. (CA) with a carrying amount of EUR 2.6 mil-
lion (2013: EUR 2.5 million) and to Boxholm Stål AB
(SE) with a carrying amount of EUR 2.2 million (2013:
EUR 2.4 million). Year-on-year movements are attributa-
ble to currency effects.
Key assumptions in determining fair value less costs to
sell include projections of future gross profit margins as
well as growth and discount rates.
The following rates are used to discount cash flows:
Discount rates 2014 in %
Discount rates 2013 in %
USD CAD SEK USD CAD SEK
Pre-tax 11.7 10.9 9.6 12.2 10.2 9.9
Post-tax 7.8 8.3 7.9 8.0 7.8 7.7
A growth rate of 1.5% (2013: 1.5%) is assumed to deter-
mine the cash flows beyond the detailed planning period.
Impairment testing of intangible assets with definite
useful lives and property, plant and equipment
s + bi evaluates at each
reporting date whether there are internal or external indi-
cations that assets could be impaired. No impairment
losses had to be recognised in 2014 (2013: EUR 2.4
million).

141FINANCIAL REPORTING Notes to the consolidated financial statements
S+Bi AG Annual Report 2014
8.4 Financial assets
in million EUR 2014 2013
Receivables from finance leases 1.2 1.2
Other financial receivables 2.0 2.0
Total non-current 3.2 3.2
Receivables from finance leases 0.1 0.1
Current securities 0.0 0.3
Other financial receivables 1.5 1.7
Total current 1.6 2.1
8.5 Other assets
in million EUR 2014 2013
Other receivables 0.4 1.8
Total non-current 0.4 1.8
Tax receivables (excluding current income tax receivables) 46.0 19.5
Prepaid expenses 7.0 6.5
Positive market values of derivatives 6.7 4.7
Other receivables 6.1 9.0
Prepayments for invento-ries/maintenance 1.4 1.8
Total current 67.2 41.5
The large increase in tax receivables mainly relates to
the reverse charge procedure introduced temporarily in
Germany in 2014 under which the duty to pay VAT is
transferred to the recipient of goods. This led to input tax
reimbursement claims.
8.6 Inventories
in million EUR 2014 2013
Raw materials, consum-ables and supplies 125.1 103.6
Semi-finished goods and work in progress 313.7 284.1
Finished products and merchandise 479.7 435.1
Total 918.5 822.8
Inventories of EUR 226.9 million (2013: EUR 188.2 million)
were recognised at net realisable value. There were restric-
tions on ownership and disposal of EUR 489.9 million (2013:
EUR 437.6 million) as at the reporting date.
Inventory allowances developed as follows in the fiscal year:
in million EUR 2014 2013
As at 1.1. 19.5 21.8
Additions 8.6 8.6
Reversals – 0.5 – 1.6
Utilisation – 8.2 – 8.3
Foreign currency effects 0.4 – 1.0
As at 31.12. 19.8 19.5
8.7 Trade accounts receivable
in million EUR 2014 2013
Gross accounts receivable 457.5 468.9
Value adjustments for bad debts – 17.3 – 17.8
Net accounts receivable 440.2 451.1
Under an ABCP financing programme, S +
Bi regularly sells credit-insured trade accounts
receivable. Trade accounts receivable of EUR 210.4 million
(2013: EUR 227.3 million) had been sold as at the report-
ing date. As the majority of risks and rewards remain with
s + bi, these accounts receiv-
able continue to be recorded in the statement of financial
position in accordance with IFRS requirements. They are
offset by financial liabilities of EUR 205.7 million (2013:
EUR 221.8 million).
There were restrictions on ownership and disposal of
EUR 88.7 million (2013: EUR 102.0 million) beyond the
scope of the receivables sold under the ABCP financing
programme as at the reporting date.
142 FINANCIAL REPORTING Notes to the consolidated financial statements
S+Bi AG Annual Report 2014
The allowance accounts developed as follows:
in million EUR 2014 2013
As at 1.1. 17.8 16.6
Additions 3.2 7.9
Reversals – 2.4 – 1.7
Utilisation – 1.5 – 4.6
Foreign currency effects 0.2 – 0.4
As at 31.12. 17.3 17.8
The age structure of the trade accounts receivable past
due but not impaired was as follows as at the reporting
date:
in million EUR 31.12.2014 31.12.2013
Past due by
≤ 30 days 94.0 88.1
31 to 60 days 17.4 16.1
61 to 90 days 3.9 8.4
91 to 120 days 1.6 6.4
> 120 days 6.9 7.0
Total 123.8 126.0
There were no indications as at the reporting date
that the debtors of accounts receivable past due but
not impaired would not fulfil their payment obligations.
Accounts receivable past due by more than 90 days but
not impaired are mostly covered by credit insurance or
had been settled by the time the consolidated financial
statements were prepared.
8.8 Assets held for sale
During the restructuring process for the Brazilian dis-
tribution company, a line of business was discontinued.
The assets allocated to this line of business were written
down to fair value less costs to sell and reclassified to
assets held for sale as at 31 December 2012. The fair
value was calculated based on market prices for assets
of a similar type and age (level 3 of the fair value hier-
archy).
As the assets were transferred within the Group in 2014
for continued use and there was no longer any intention
to sell them as at 31 December 2014, they were reclas-
sified to property, plant and equipment at their present
carrying amount. The carrying amount matched the
recoverable amount determined as fair value less costs
to sell.
8.9 Shareholders’ equity
Share capital
The share capital of EUR 378.6 million (2013: EUR 378.6
million) comprises 945 000 000 fully paid-up registered
shares with a nominal value of CHF 0.50 each.
Capital reserves
The capital reserves contain premiums generated upon
issue of shares in the course of capital increases,
less directly allocable transaction costs of the capital
increases. There were no changes in capital reserves in
2014.
Retained earnings (accumulated losses)
Retained earnings (accumulated losses) comprise the
net income/loss accumulated in the past, less dividend
payments to the shareholders and – until 2011 – interest
payments to the providers of hybrid capital. Until con-
version of financial reporting to IFRS from 1 January
2007, any goodwill or negative goodwill resulting from
acquisitions of companies was offset against retained
earnings. In accordance with the provisions of the new
syndicated loan agreement, dividend payments are linked
to the attainment of certain key figures relating to the
ratio of net debt to EBITDA. No dividend was distributed
in 2014 and 2013 and the Board of Directors will submit
a proposal to the Annual General Meeting not to distribute
a dividend in 2015 either.
143FINANCIAL REPORTING Notes to the consolidated financial statements
S+Bi AG Annual Report 2014
Accumulated income and expense recognised
directly in other comprehensive income of the
shareholders of s + bi AG
The individual items are as follows:
> Gains and losses resulting from translation into the
reporting currency of the financial statements of sub-
sidiaries whose financial statements are not already
prepared in the functional currency euro.
in million EUR 2014 2013
As at 1.1. 26.0 47.8
Change in unrealised gains/losses from currency translation 24.4 – 21.8
As at 31.12. 50.4 26.0
> Gains/losses from changes in the fair values of deriv-
ative financial instruments designated as cash flow
hedges of future cash flows.
in million EUR 2014 2013
As at 1.1. – 0.2 – 0.2
Unrealised gains/losses from cash flow hedges – 0.4 – 0.2
Realised gains/losses from cash flow hedges – recognised in profit and loss 0.1 0.2
Tax effect 0.1 0.0
As at 31.12. – 0.4 – 0.2
See the table in note 10 for details of the realisation of
gains and losses from cash flow hedges.
> Actuarial gains and losses from pensions and similar
obligations as well as changes in amounts not rec-
ognised as assets due to an asset ceiling according to
IFRIC 14.
in million EUR 2014 2013
As at 1.1. – 69.7 – 102.3
Defined benefit obligation (demographic assump-tions) – 1.5 – 0.4
Defined benefit obligation (financial assumptions) – 94.8 24.9
Defined benefit obligation (experience gains/losses) 3.2 5.4
Return on plan assets less interest income 8.6 10.0
Changes in amounts not recognised as assets on account of an asset ceiling 0.0 0.3
Tax effect 20.9 – 7.6
As at 31.12. – 133.3 – 69.7
8.10 Pension provisions and similar obligations
S + Bi offers both defined con-
tribution plans and defined benefit plans at individual group
companies.
Defined contribution plans
Some of the post-employment benefit plans in the Group
are defined contribution plans where a company has an
obligation to transfer a contractually defined amount to
an external pension institution. Beyond the payment of
these contributions, the company does not enter into any
obligations in relation to post-employment benefits.
The contributions paid for private and statutory pension
plans are recognised in personnel costs in the current
year. In 2014, they amounted to EUR 38.3 million (2013:
EUR 38.0 million).
Defined benefit plans
Most of the Group’s occupational pension schemes are
defined benefit plans in which the employer undertakes
to deliver the agreed pension benefits.
Employees of the Swiss Group companies are members
of the pension fund of Swiss Steel AG, an independent
pension institution. This direct defined benefit obligation
is financed by contributions to the fund from the respec-
tive companies. The contributions are based on a certain
percentage of the insured salary as defined in the plan
regulations. If a deficit emerges, various measures can

144 FINANCIAL REPORTING Notes to the consolidated financial statements
S+Bi AG Annual Report 2014
be taken (increase contributions, adjust benefits). The
deduction and investment of contributions are audited
regularly by independent auditors.
For some schemes, mainly those operated in Germany,
the agreed pension benefits are financed by the com-
panies themselves through pension provisions. Benefits
are paid on the basis of voluntary commitments, but
are subject to Germany’s Occupational Pensions Act
(Betriebsrentengesetz).
There are also direct benefit obligations to employees
mainly in the USA, Canada, France and the Netherlands.
These are funded to varying degrees. Pension provisions
have been recognised in the statement of financial posi-
tion for obligations that exceed the plan assets.
The defined benefit plans in the USA are subject to US
rules regarding closure of coverage gaps, which have to
be closed within seven years.
In some European countries there are also limited obli-
gations to make one-off payments to employees upon
termination of employment. The amount due is linked
to the employee’s length of service. These benefits are
recognised in the statement of financial position as pro-
visions for pensions and similar obligations.
Through the defined benefit plans, s +
bi is exposed to various risks, some of
which are company- or commitment-specific. This means
that the defined benefit obligation depends on factors
including average life expectancy of the beneficiaries,
length of service and interest rates. For the German
plans, pension benefit payments also have to be adjusted
regularly to reflect the development of consumer prices
and net salaries in accordance with legal provisions
(Sec. 16 Betriebsrentengesetz) and trade association
requirements.
Based on the legal provisions and court rulings in Ger-
many, there is also a risk that voluntary commitments
could be made binding for the company in individual
cases. This would make it difficult to terminate or reduce
the commitments. In principle, the pension schemes in
the USA are subject to the same risks as the other plans.
Defined benefit obligation, plan assets and asset
ceiling
The tables below present the changes in defined benefit
obligations, the fair value of plan assets and the effect of
limiting a net defined benefit asset to the asset ceiling:
in million EUR 2014 2013
Present value of defined benefit obligations as at 1.1. 505.2 545.0
Current service cost 8.7 9.4
Interest cost 14.7 13.2
Employee contributions 3.7 3.7
Actuarial gains (losses) from change in demo-graphic assumptions 1.5 0.4
Actuarial gains (losses) from change in financial assumptions 94.8 – 24.9
Actuarial gains (losses) from experience adjust-ments – 3.2 – 5.4
Benefit payments – 24.2 – 28.7
Past service costs – 0.2 – 2.2
Foreign currency effects 8.7 – 5.3
Present value of defined benefit obligations as at 31.12. 609.7 505.2
Of the present value of the defined benefit obligations as
at 31 December 2014, EUR 395.8 million (2013: EUR
336.6 million) relates to plans that are wholly or partly
financed from a fund and EUR 213.9 million (2013: EUR
168.6 million) to plans that are not funded.
in million EUR 2014 2013
Fair value of plan assets as at 1.1. 260.8 262.3
Interest income 6.7 4.9
Return on plan assets less interest income 8.6 10.0
Employer contributions 14.7 13.5
Employee contributions 3.7 3.7
Benefit payments – 24.2 – 28.7
Administration expenses – 0.4 – 0.4
Foreign currency effects 6.9 – 4.5
Fair value of plan assets as at 31.12. 276.8 260.8

145FINANCIAL REPORTING Notes to the consolidated financial statements
S+Bi AG Annual Report 2014
In line with international practice, the pension payments
for unfunded pension plans are now reported under
employer contributions together with the actual contri-
butions paid for partly or wholly funded pension plans.
At the same time, the benefit payments were increased
by these pension payments. The prior-year figures were
restated accordingly. The actual return on plan assets
was EUR 15.3 million (2013: EUR 14.9 million) and com-
prises the return on plan assets and the interest income.
in million EUR 2014 2013
Effect of asset ceiling as at 1.1. 0.0 0.3
Change 0.0 – 0.3
Effect of asset ceiling as at 31.12. 0.0 0.0
The difference between the plan assets and the pres-
ent value of the defined benefit obligation on partially or
wholly funded pension plans represents the funded sta-
tus, which can be reconciled with the reported amounts
as follows:
in million EUR 2014 2013
Fair value of plan assets as at 31.12. 276.8 260.8
Present value of funded defined benefit obligations as at 31.12. – 395.8 – 336.6
Funded status – 119.0 – 75.8
Present value of unfunded defined benefit obligations as at 31.12. – 213.9 – 168.6
Recognised amount – 332.9 – 244.4
Net pension costs
Net pension costs break down as follows:
in million EUR 2014 2013
Net interest cost 8.0 8.3
Current service cost incl. plan amendments and curtailments 8.5 7.2
Administration cost 0.4 0.4
Net pension costs 16.9 15.9
The net interest on the net defined benefit liability is
included within financial expense in the consolidated
income statement.
Actuarial gains and losses
Actuarial gains and losses are recognised in other com-
prehensive income in the period in which they occur. They
developed as follows:
in million EUR 2014 2013
Cumulative actuarial gains/(losses) recognised in other comprehensive income as at 1.1. (without tax effects) – 85.7 – 125.9
Actuarial gains/(losses)
- on pension obligations – 93.1 29.9
- on plan assets 8.6 10.0
Change in the effect of asset ceiling 0.0 0.3
Cumulative actuarial gains/(losses) recognised in other comprehensive income as at 31.12. (without tax effects) – 170.2 – 85.7
The actuarial losses are mainly attributable to lower dis-
count rates used in comparison to the prior year.
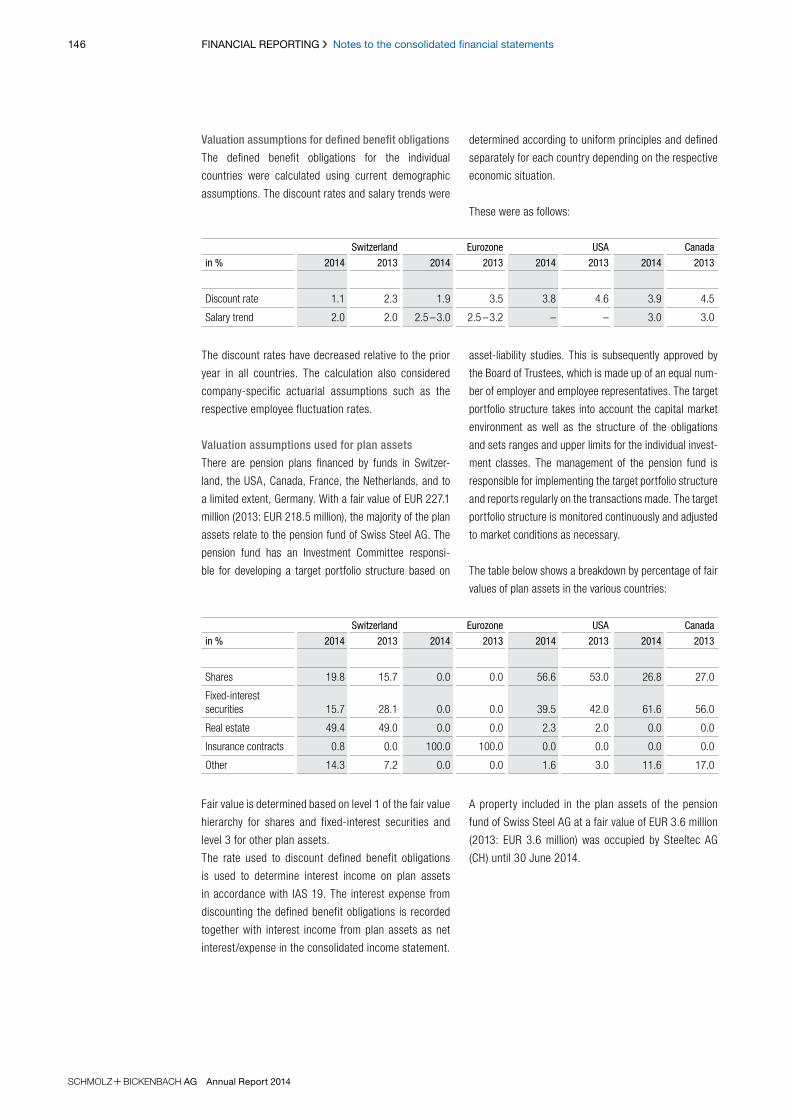
146 FINANCIAL REPORTING Notes to the consolidated financial statements
S+Bi AG Annual Report 2014
Valuation assumptions for defined benefit obligations
The defined benefit obligations for the individual
countries were calculated using current demographic
assumptions. The discount rates and salary trends were
Switzerland Eurozone USA Canada
in % 2014 2013 2014 2013 2014 2013 2014 2013
Discount rate 1.1 2.3 1.9 3.5 3.8 4.6 3.9 4.5
Salary trend 2.0 2.0 2.5 – 3.0 2.5 – 3.2 – – 3.0 3.0
Switzerland Eurozone USA Canada
in % 2014 2013 2014 2013 2014 2013 2014 2013
Shares 19.8 15.7 0.0 0.0 56.6 53.0 26.8 27.0
Fixed-interest securities 15.7 28.1 0.0 0.0 39.5 42.0 61.6 56.0
Real estate 49.4 49.0 0.0 0.0 2.3 2.0 0.0 0.0
Insurance contracts 0.8 0.0 100.0 100.0 0.0 0.0 0.0 0.0
Other 14.3 7.2 0.0 0.0 1.6 3.0 11.6 17.0
Fair value is determined based on level 1 of the fair value
hierarchy for shares and fixed-interest securities and
level 3 for other plan assets.
The rate used to discount defined benefit obligations
is used to determine interest income on plan assets
in accordance with IAS 19. The interest expense from
discounting the defined benefit obligations is recorded
together with interest income from plan assets as net
interest/expense in the consolidated income statement.
The discount rates have decreased relative to the prior
year in all countries. The calculation also considered
company-specific actuarial assumptions such as the
respective employee fluctuation rates.
Valuation assumptions used for plan assets
There are pension plans financed by funds in Switzer-
land, the USA, Canada, France, the Netherlands, and to
a limited extent, Germany. With a fair value of EUR 227.1
million (2013: EUR 218.5 million), the majority of the plan
assets relate to the pension fund of Swiss Steel AG. The
pension fund has an Investment Committee responsi-
ble for developing a target portfolio structure based on
asset-liability studies. This is subsequently approved by
the Board of Trustees, which is made up of an equal num-
ber of employer and employee representatives. The target
portfolio structure takes into account the capital market
environment as well as the structure of the obligations
and sets ranges and upper limits for the individual invest-
ment classes. The management of the pension fund is
responsible for implementing the target portfolio structure
and reports regularly on the transactions made. The target
portfolio structure is monitored continuously and adjusted
to market conditions as necessary.
The table below shows a breakdown by percentage of fair
values of plan assets in the various countries:
A property included in the plan assets of the pension
fund of Swiss Steel AG at a fair value of EUR 3.6 million
(2013: EUR 3.6 million) was occupied by Steeltec AG
(CH) until 30 June 2014.
determined according to uniform principles and defined
separately for each country depending on the respective
economic situation.
These were as follows:

147FINANCIAL REPORTING Notes to the consolidated financial statements
S+Bi AG Annual Report 2014
Contribution and benefit payments
In principle, the Group contributes to the plans based on
the legal and/or minimum funding requirements stipu-
lated by collective agreement in the respective country
of each fund. In 2014, employer contributions totalling
EUR 14.7 million (including pension payments of EUR
8.6 million for unfunded plans) were made to the plan
assets of the existing defined benefit plans (2013: EUR
13.5 million including pension payments of EUR 7.7 mil-
lion for unfunded pension plans). For 2015, contribution
payments are expected to total EUR 14.9 million (includ-
ing pension payments of EUR 8.4 million for unfunded
pension plans).
Benefit payments of EUR 8.6 million (2013: EUR 7.7 million)
were made to settle unfunded pension obligations in
2014. Benefit payments of EUR 8.4 million are expected
to be paid in 2015 based on current unfunded commit-
ments.
Sensitivity analysis
The Group discloses defined benefit obligations of
EUR 609.7 million as at 31 December 2014 (2013:
EUR 505.2 million). The expected service cost for 2015
is EUR 9.9 million based on current interest rates. If the
significant actuarial assumptions for the material plans
listed in the table below had increased or decreased by
0.5% as at 31 December 2014 (31 December 2013),
pension provisions and service cost would have been
adjusted as follows for the subsequent fiscal year:
The table below shows the payments expected by
s + bi and the pension funds
over the coming years:
Expected cash outflow
in million EURAs at
31.12.2014As at
31.12.2013
Year 1 23.5 23.5
Year 2 26.2 24.7
Year 3 26.1 26.5
Year 4 27.0 26.5
Year 5 28.7 26.8
Years 6 –10 143.1 144.0
Total 274.6 272.0
The weighted average term of the defined benefit obli-
gation was 15 years as at 31 December 2014 (2013:
14 years).
Actuarial assumptions as at 31.12.2013 in million EUR Discount rate Salary Pension increase
Sensitivity level +0.5% -0.5% +0.5% -0.5% +0.5% -0.5%
Impact on the net defined benefit obligation as at 31.12.2013 – 29.4 33.1 2.2 – 1.9 21.8 – 20.3
Impact on the service costs 2014 – 0.7 0.9 0.2 – 0.2 0.4 – 0.3
Actuarial assumptions as at 31.12.2014 in million EUR Discount rate Salary Pension increase
Sensitivity level +0.5% -0.5% +0.5% -0.5% +0.5% -0.5%
Impact on the net defined benefit obligation as at 31.12.2014 – 41.2 46.8 3.2 – 2.9 29.3 – 27.4
Impact on the service costs 2015 – 1.2 1.4 0.4 – 0.3 0.4 – 0.5

148 FINANCIAL REPORTING Notes to the consolidated financial statements
S+Bi AG Annual Report 2014
Other provisions of EUR 21.0 million (2013: EUR 22.2
million) comprise various relatively small amounts that
are not reported separately for reasons of materiality.
8.12 Financial liabilities
Financial liabilities break down as follows as at
31 December 2014:
in million EUR 2014 2013
Syndicated loan 238.7 204.3
Other bank loans 33.3 39.6
Bond 160.7 159.0
Liabilities from finance leases 6.1 8.2
Other financial liabilities 1.4 1.6
Total non-current 440.2 412.7
Syndicated loan 0.0 12.4
Other bank loans 7.6 24.5
ABCP financing pro-gramme 205.7 221.8
Liabilities from finance leases 2.3 2.9
Other financial liabilities 3.5 4.2
Total current 219.1 265.8
in million EUR
WarrantiesPhased
retirement Jubilee Personnel Restructuring Other Total
As at 1.1.2014 6.7 5.5 16.4 9.3 25.6 22.2 85.7
Additions 4.0 3.8 2.6 5.0 0.3 7.7 23.4
Utilisations – 3.4 – 3.3 – 2.5 – 3.5 – 11.8 – 5.9 – 30.4
Reversal – 0.5 0.0 0.0 0.0 – 3.1 – 3.6 – 7.2
Increase to reflect passage of time 0.0 0.2 0.5 0.0 0.0 0.0 0.7
Foreign currency effects 0.0 0.0 0.0 0.2 0.0 0.6 0.8
As at 31.12.2014 6.8 6.2 17.0 11.0 11.0 21.0 73.0– of which non-current 0.0 3.8 15.1 4.8 1.3 8.6 33.6– of which current 6.8 2.4 1.9 6.2 9.7 12.4 39.4
8.11 Other provisions
Other provisions developed as follows in the fiscal year:
The warranty provisions of EUR 6.8 million (2013:
EUR 6.7 million) comprise accrued amounts for legally
required warranty obligations as well as amounts for
warranties provided over and above the legal liability.
The provisions for phased retirement (“Altersteilzeit”)
agreements of EUR 6.2 million (2013: EUR 5.5 million)
are accumulated on a pro rata basis during the employ-
ment phase of the employee to enable continued pay-
ment to the employee in the release phase. The corre-
sponding cash outflows are expected over the next five
years.
The provisions for jubilee awards of EUR 17.0 million
(2013: EUR 16.4 million) are recorded in line with the
amounts of monetary or non-monetary benefits provided
for in some company agreements for employees that
attain a certain length of service. A cash outflow of EUR
11.3 million is expected in connection with such pay-
ments over the next five years. For the years thereafter,
a cash outflow of EUR 5.7 million is expected.
In addition to the provisions for phased retirement
agreements and jubilee awards, there are various other
personnel-related provisions totalling EUR 11.0 million
(2013: EUR 9.3 million). In most cases, cash outflows
are expected within the next five years.
Provisions for restructuring measures are recognised
to the extent that a detailed formal restructuring plan
has been prepared and communicated to the parties
concerned. The provisions amount to EUR 11.0 million
in total (2013: EUR 25.6 million) and relate principally
to s + bi Distributions GmbH
(DE) (EUR 8.1 million; 2013: EUR 18.6 million) and Deut-
sche Edelstahlwerke GmbH (DE) (EUR 2.3 million; 2013:
EUR 6.6 million). A total cash outflow of EUR 9.7 million
is expected for 2015.
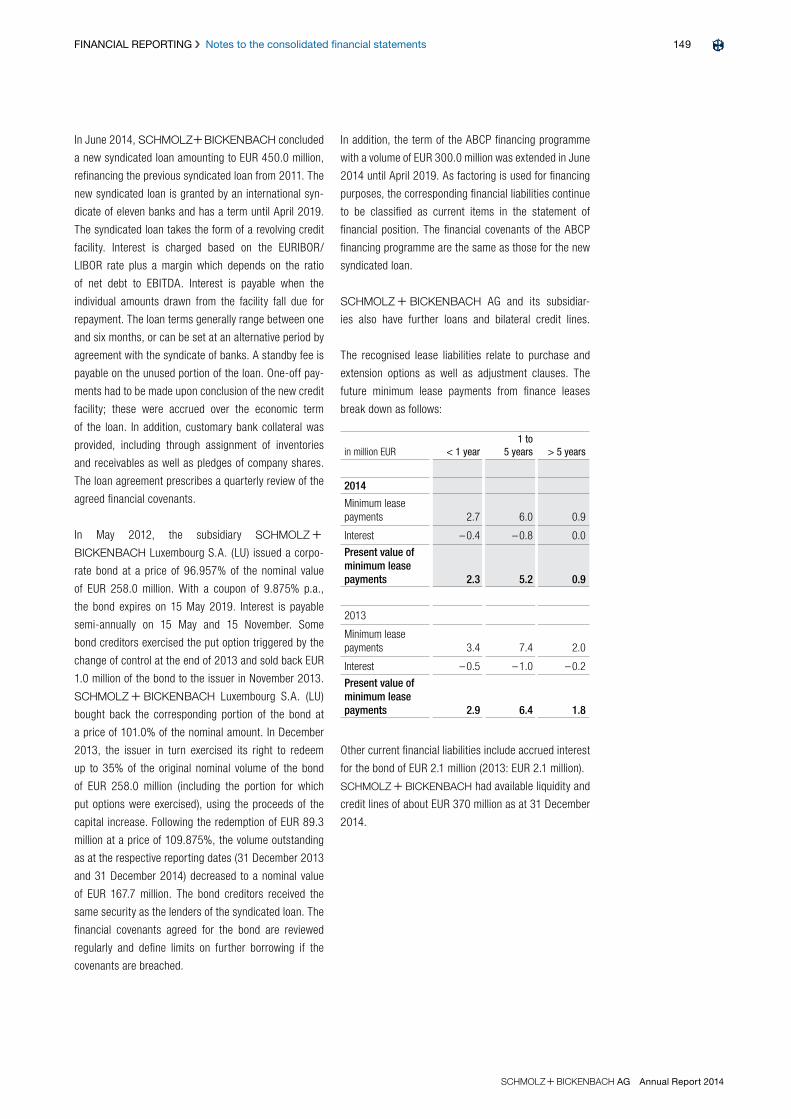
149FINANCIAL REPORTING Notes to the consolidated financial statements
S+Bi AG Annual Report 2014
In June 2014, S+Bi concluded
a new syndicated loan amounting to EUR 450.0 million,
refinancing the previous syndicated loan from 2011. The
new syndicated loan is granted by an international syn-
dicate of eleven banks and has a term until April 2019.
The syndicated loan takes the form of a revolving credit
facility. Interest is charged based on the EURIBOR/
LIBOR rate plus a margin which depends on the ratio
of net debt to EBITDA. Interest is payable when the
individual amounts drawn from the facility fall due for
repayment. The loan terms generally range between one
and six months, or can be set at an alternative period by
agreement with the syndicate of banks. A standby fee is
payable on the unused portion of the loan. One-off pay-
ments had to be made upon conclusion of the new credit
facility; these were accrued over the economic term
of the loan. In addition, customary bank collateral was
provided, including through assignment of inventories
and receivables as well as pledges of company shares.
The loan agreement prescribes a quarterly review of the
agreed financial covenants.
In May 2012, the subsidiary S +
Bi Luxembourg S.A. (LU) issued a corpo-
rate bond at a price of 96.957% of the nominal value
of EUR 258.0 million. With a coupon of 9.875% p.a.,
the bond expires on 15 May 2019. Interest is payable
semi-annually on 15 May and 15 November. Some
bond creditors exercised the put option triggered by the
change of control at the end of 2013 and sold back EUR
1.0 million of the bond to the issuer in November 2013.
S + Bi Luxembourg S.A. (LU)
bought back the corresponding portion of the bond at
a price of 101.0% of the nominal amount. In December
2013, the issuer in turn exercised its right to redeem
up to 35% of the original nominal volume of the bond
of EUR 258.0 million (including the portion for which
put options were exercised), using the proceeds of the
capital increase. Following the redemption of EUR 89.3
million at a price of 109.875%, the volume outstanding
as at the respective reporting dates (31 December 2013
and 31 December 2014) decreased to a nominal value
of EUR 167.7 million. The bond creditors received the
same security as the lenders of the syndicated loan. The
financial covenants agreed for the bond are reviewed
regularly and define limits on further borrowing if the
covenants are breached.
In addition, the term of the ABCP financing programme
with a volume of EUR 300.0 million was extended in June
2014 until April 2019. As factoring is used for financing
purposes, the corresponding financial liabilities continue
to be classified as current items in the statement of
financial position. The financial covenants of the ABCP
financing programme are the same as those for the new
syndicated loan.
S + Bi AG and its subsidiar-
ies also have further loans and bilateral credit lines.
The recognised lease liabilities relate to purchase and
extension options as well as adjustment clauses. The
future minimum lease payments from finance leases
break down as follows:
in million EUR < 1 year1 to
5 years > 5 years
2014
Minimum lease payments 2.7 6.0 0.9
Interest – 0.4 – 0.8 0.0
Present value of minimum lease payments 2.3 5.2 0.9
2013
Minimum lease payments 3.4 7.4 2.0
Interest – 0.5 – 1.0 – 0.2
Present value of minimum lease payments 2.9 6.4 1.8
Other current financial liabilities include accrued interest
for the bond of EUR 2.1 million (2013: EUR 2.1 million).
s + bi had available liquidity and
credit lines of about EUR 370 million as at 31 December
2014.

150 FINANCIAL REPORTING Notes to the consolidated financial statements
S+Bi AG Annual Report 2014
8.13 Other liabilities
in million EUR 2014 2013
Negative market values of derivative financial instruments 0.7 0.6
Other liabilities 0.4 3.1
Total non-current 1.1 3.7
Accrued unused vacation, overtime and flexitime accounts 31.4 28.2
Liabilities for wages and salaries 28.9 23.0
Tax liabilities (excluding current income tax liabilities) 19.8 22.2
Social security obligations 12.6 11.8
Negative market values of derivative financial instruments 10.2 0.7
Deferred income 1.5 1.7
Other liabilities 18.8 20.2
Total current 123.2 107.8
Other non-current and current liabilities comprise a
number of individually immaterial items which cannot be
allocated to another line item.
9_Notes to the consolidated statement of cash flows
The previous syndicated loan of EUR 221.4 million was
replaced by the new credit facility concluded at the end
of June 2014 as part of the Group’s refinancing. As at
31 December 2014, EUR 236.7 million had been drawn
from the new syndicated loan agreement.
The one-off payments made in 2014 in connection with
the refinancing came to EUR 8.3 million and are included
within interest paid. In the prior-year period, this item
contained one-off payments of EUR 12.2 million made
in connection with adjusting the financing agreements
at the beginning of March 2013.
Transaction fees of EUR 3.4 million already recorded
without affecting income in the prior year were paid in
2014.
10_Financial instruments
10.1 Financial instruments according to measure-
ment category and class
Financial assets and liabilities are presented below
according to measurement category and class. The
table also shows finance lease receivables and liabili-
ties as well as derivatives which constitute a hedging
relationship even though these are not measurement
categories pursuant to IAS 39.
The carrying amount of trade accounts receivable, other
current receivables and cash and cash equivalents is
the fair value. The fair value of fixed-rate loans is the
present value of the expected future cash flows dis-
counted based on the interest rates applicable on the
reporting date.
Financial assets available for sale mainly comprise
equity instruments and debt securities. Where possible,
they are measured at fair value determined on the basis
of observable market data as at the reporting dates.
If no quoted prices in an active market are available,
and if the fair value cannot be reliably determined, the
financial assets are measured at cost.
The fair value of forward exchange contracts is cal-
culated on the basis of the average exchange rate on
the reporting date, taking into account the forward
premiums and discounts for the remaining term of the
contract relative to the contractually agreed forward
exchange rate. For currency options, recognised mod-
els are used for calculating the option price. Besides
the remaining term, the fair value of an option is also
affected by other factors, including the current level and
volatility of the respective underlying exchange rate or
underlying base interest rate.
The fair value of interest swaps and interest/currency
swaps is determined by discounting the future expected
cash flows based on the market rates that apply for the
remaining term of the contracts. Additionally, exchange
rates of the respective foreign currencies in which the
cash flows occur are included for interest/currency
swaps.
The fair value of commodities futures is based on official
exchange listings.
Derivatives are valued as at the reporting date by exter-
nal financial partners.

151FINANCIAL REPORTING Notes to the consolidated financial statements
S+Bi AG Annual Report 2014
Cash flow hedges
In the reporting period there were cash flow hedges only
to the extent of the commodity price risk resulting from
commodity supply contracts at fixed prices.
The effectiveness of hedging relationships is assessed
prospectively and retrospectively. Hedge effectiveness
is measured prospectively using the critical terms match
method (i.e. matching the material contract terms of the
hedged transaction and the hedging instrument) and ret-
rospectively using the change-in-fair-value method (i.e.
reversed-sign matching of changes in fair value of the
hedged transaction and the hedging instrument).
All derivatives in a hedging relationship are recognised
at fair value in the statement of financial position. They
are split into an effective and an ineffective portion. The
effective portion is recorded in the reserve for cash flow
hedges within other comprehensive income until the
hedged transaction is realised. The ineffective portion is
recorded in profit or loss immediately.
For the ineffective portion, IAS 39 stipulates a permis-
sible range of 80% to 125%. All hedges that do not fall
within this range are terminated immediately and rec-
ognised through profit or loss from this date onwards.
The accumulated gains or losses previously recorded in
other comprehensive income remain in equity. They are
transferred to profit or loss once the hedged transac-
tions also affect profit and loss.
As at the reporting date, commodity derivatives with a
total negative fair value of EUR 0.4 million (2013: EUR
0.1 million) were designated as hedging instruments
with a remaining term of up to one year. The underlying
transactions are recorded through profit or loss in the
subsequent period. The foreign currency effects result-
ing from the hedged items are, however, already rec-
ognised through profit or loss before delivery. In 2014,
losses of EUR 0.1 million (2013: EUR 0.2 million) were
transferred from other comprehensive income to cost of
materials in the income statement.
The carrying amount of trade accounts payable and
other current liabilities approximates fair value. The fair
value of fixed-rate liabilities is the present value of the
expected future cash flows discounted based on the
interest rates applicable on the reporting date. Liabil-
ities that bear interest at floating rates are carried at
fair value.
The net gain/loss from financial instruments breaks
down as follows:
in million EUR 2014 2013
Loans and receivables – LaR 3.2 – 7.5
Financial assets and liabilities at fair value through profit or loss – FAFVPL/FLFVPL – 5.6 4.5
Financial liabilities measured at amortised cost – FLAC – 49.4 – 99.7
The net gain/loss from the category “Loans and receiv-
ables” primarily results from interest income from
financial receivables, allowances on trade accounts
receivable and exchange rate gains and losses from
receivables denominated in foreign currency.
The gains and losses from changes in the fair value of
currency, interest, and commodity derivatives that do not
fulfil the requirements of IAS 39 for hedge accounting
are included in the category “Financial assets/liabilities
at fair value through profit or loss (FAFVPL/FLFVPL)”.
The net profit/loss from this category therefore only
relates to financial instruments held for trading.
The category “Financial liabilities measured at amortised
cost (FLAC)” comprises the interest expense on financial
liabilities as well as gains and losses on foreign currency
liabilities.
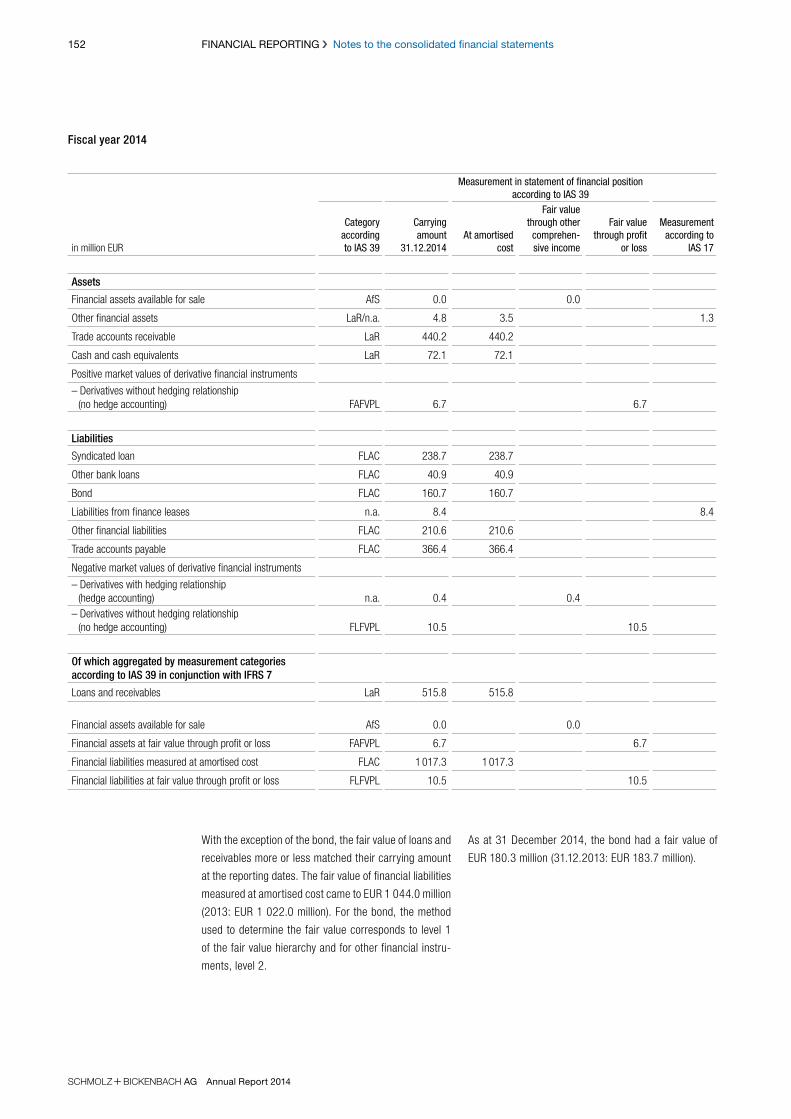
152 FINANCIAL REPORTING Notes to the consolidated financial statements
S+Bi AG Annual Report 2014
Fiscal year 2014
Measurement in statement of financial position according to IAS 39
in million EUR
Category according to IAS 39
Carrying amount
31.12.2014At amortised
cost
Fair value through other comprehen-sive income
Fair value through profit
or loss
Measurement according to
IAS 17
Assets
Financial assets available for sale AfS 0.0 0.0
Other financial assets LaR/n.a. 4.8 3.5 1.3
Trade accounts receivable LaR 440.2 440.2
Cash and cash equivalents LaR 72.1 72.1
Positive market values of derivative financial instruments
– Derivatives without hedging relationship (no hedge accounting) FAFVPL 6.7 6.7
Liabilities
Syndicated loan FLAC 238.7 238.7
Other bank loans FLAC 40.9 40.9
Bond FLAC 160.7 160.7
Liabilities from finance leases n.a. 8.4 8.4
Other financial liabilities FLAC 210.6 210.6
Trade accounts payable FLAC 366.4 366.4
Negative market values of derivative financial instruments
– Derivatives with hedging relationship (hedge accounting) n.a. 0.4 0.4
– Derivatives without hedging relationship (no hedge accounting) FLFVPL 10.5 10.5
Of which aggregated by measurement categories according to IAS 39 in conjunction with IFRS 7
Loans and receivables LaR 515.8 515.8
Financial assets available for sale AfS 0.0 0.0
Financial assets at fair value through profit or loss FAFVPL 6.7 6.7
Financial liabilities measured at amortised cost FLAC 1 017.3 1 017.3
Financial liabilities at fair value through profit or loss FLFVPL 10.5 10.5
With the exception of the bond, the fair value of loans and
receivables more or less matched their carrying amount
at the reporting dates. The fair value of financial liabilities
measured at amortised cost came to EUR 1 044.0 million
(2013: EUR 1 022.0 million). For the bond, the method
used to determine the fair value corresponds to level 1
of the fair value hierarchy and for other financial instru-
ments, level 2.
As at 31 December 2014, the bond had a fair value of
EUR 180.3 million (31.12.2013: EUR 183.7 million).
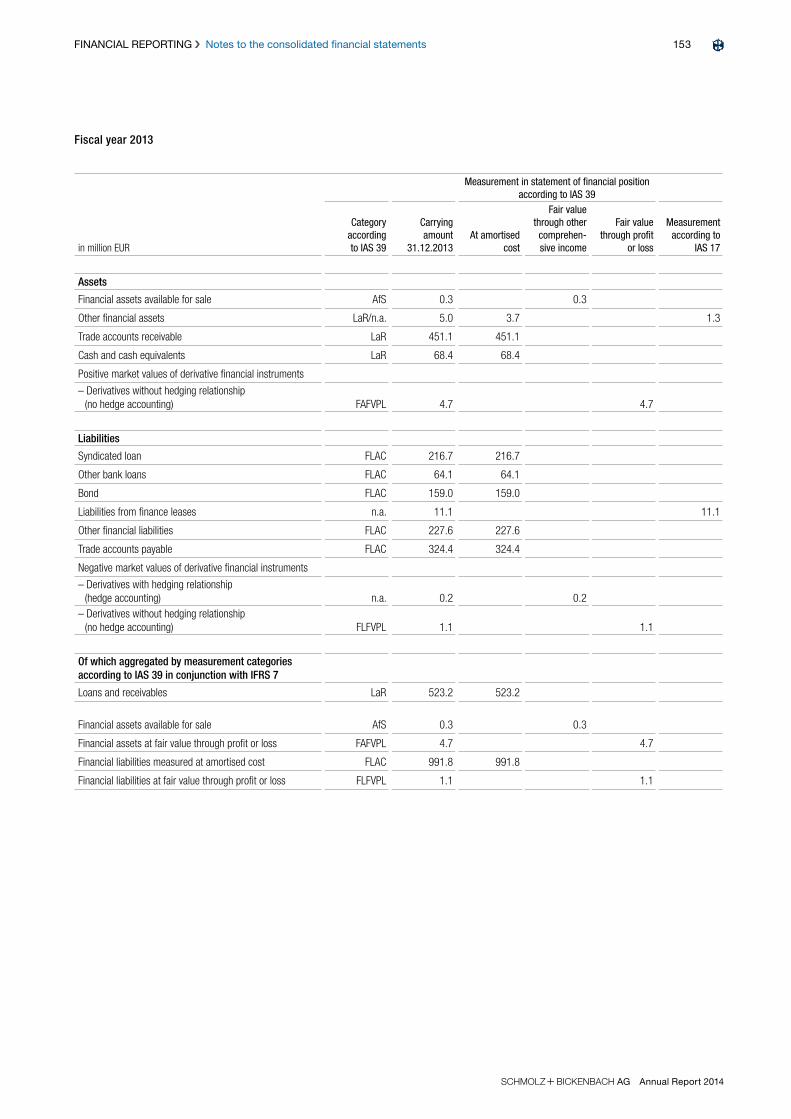
153FINANCIAL REPORTING Notes to the consolidated financial statements
S+Bi AG Annual Report 2014
Fiscal year 2013
Measurement in statement of financial position according to IAS 39
in million EUR
Category according to IAS 39
Carrying amount
31.12.2013At amortised
cost
Fair value through other comprehen-sive income
Fair value through profit
or loss
Measurement according to
IAS 17
Assets
Financial assets available for sale AfS 0.3 0.3
Other financial assets LaR/n.a. 5.0 3.7 1.3
Trade accounts receivable LaR 451.1 451.1
Cash and cash equivalents LaR 68.4 68.4
Positive market values of derivative financial instruments
– Derivatives without hedging relationship (no hedge accounting) FAFVPL 4.7 4.7
Liabilities
Syndicated loan FLAC 216.7 216.7
Other bank loans FLAC 64.1 64.1
Bond FLAC 159.0 159.0
Liabilities from finance leases n.a. 11.1 11.1
Other financial liabilities FLAC 227.6 227.6
Trade accounts payable FLAC 324.4 324.4
Negative market values of derivative financial instruments
– Derivatives with hedging relationship (hedge accounting) n.a. 0.2 0.2
– Derivatives without hedging relationship (no hedge accounting) FLFVPL 1.1 1.1
Of which aggregated by measurement categories according to IAS 39 in conjunction with IFRS 7
Loans and receivables LaR 523.2 523.2
Financial assets available for sale AfS 0.3 0.3
Financial assets at fair value through profit or loss FAFVPL 4.7 4.7
Financial liabilities measured at amortised cost FLAC 991.8 991.8
Financial liabilities at fair value through profit or loss FLFVPL 1.1 1.1
154 FINANCIAL REPORTING Notes to the consolidated financial statements
S+Bi AG Annual Report 2014
10.2 Financial instruments at fair value through
profit or loss
In accordance with the requirements of IFRS 13, items
recognised at fair value in the statement of financial posi-
tion or reported at fair value are allocated to one of the
following three levels of the fair value hierarchy. The table
below only presents the financial instruments of relevance
for the S + Bi Group. Please
refer to note 8.8 for details of assets held for sale that
are measured at fair value less costs to sell. The fair value
hierarchy distinguishes between the following levels:
Level 1:
Quoted prices (unadjusted) in active markets for identi-
cal assets or liabilities.
Level 2:
Inputs other than quoted prices included within Level 1
that are observable for the asset or liability, either directly
or indirectly.
Level 3:
Unobservable inputs for the asset or liability that affect
the fair value.
As at their respective reporting dates, financial instru-
ments measured at fair value were categorised as follows:
Level 1 Level 2 Level 3Fair value as
at 31.12.
in million EUR 2014 2013 2014 2013 2014 2013 2014 2013
Financial assets
Financial assets available for sale 0.0 0.3 0.0 0.0 0.0 0.0 0.0 0.3
Positive market values of derivative financial instruments
– Derivatives without hedging relationship (no hedge accounting) 0.0 0.0 6.7 4.7 0.0 0.0 6.7 4.7
Financial liabilities
Negative market values of derivative financial instruments
– Derivatives with hedging relationship (hedge accounting) 0.0 0.0 0.4 0.2 0.0 0.0 0.4 0.2
– Derivatives without hedging relationship (no hedge accounting) 0.0 0.0 10.5 1.1 0.0 0.0 10.5 1.1
s + bi regularly reviews
the procedure for measuring items at fair value. If the
material input parameters change, the Group assesses
whether an item needs to be transferred between the
levels. There were no transfers between the individual
levels during the reporting period.

155FINANCIAL REPORTING Notes to the consolidated financial statements
S+Bi AG Annual Report 2014
Currency risks mainly related to the US dollar, Swiss
franc, pound sterling and Canadian dollar relative to the
euro as at the reporting date and throughout the report-
ing period.
The table below shows the movements in these curren-
cies if the euro were to appreciate or depreciate by 10%.
Change in Effect on net income
in million EUR EUR 2014 2013
Currency USD
+10% – 2.7 – 7.5
– 10% 3.3 9.1
Currency CHF
+10% – 2.4 – 2.6
– 10% 2.9 3.2
Currency GBP
+10% 0.6 – 0.4
– 10% – 0.8 0.5
Currency CAD
+10% – 0.8 0.3
– 10% 1.0 – 0.3
The sensitivities were calculated based on the values
that would have resulted if the closing exchange rate
of the euro against the other currencies had been 10%
higher or lower on the reporting date.
A time value of money of 5.0% p.a. (2013: 5.0% p.a.)
was assumed. Given the average life of 6 months for
currency derivatives, the amounts were discounted at a
rate of 2.5% p.a. (2013: 2.5% p.a.).
10.3 Financial risk management objectives and
policies
Principles
With regard to its assets, liabilities, pending transactions,
and planned transactions, S + Bi
is exposed to risks, including but not limited to, exchange
rate fluctuations, interest rates and commodity prices, as
well as credit risks, i.e. the risk of default by counterpar-
ties. Solvency must also be assured at all times (liquidity
risk).
The risk management objective is to control these risks
where they affect the cash flows of the Group, using
appropriate measures. Derivative financial instruments
are used only for hedging purposes; they are not used
for trading or speculative purposes. The Group does not
hedge exchange effects from translating financial state-
ments denominated in foreign currencies into the reporting
currency of the Group. The Executive Board defines and
continuously monitors the hedging policy and implemen-
tation thereof.
The sensitivity analyses required by IFRS 7 relate exclu-
sively to hypothetical changes in market prices and inter-
est rates for primary and derivative financial instruments.
The sensitivity analyses do not consider all effects from
opposite movements of a non-financial underlying even
though these could substantially reduce the effects that
are presented.
Currency risk
Foreign currency risks arise mainly when trade accounts
receivable and payable are settled in foreign currencies,
future revenue is planned in a foreign currency, or exist-
ing or planned fixed-price commodity supply contracts
are in a foreign currency. Currency management is
country-specific, with foreign currency amounts being
translated regularly into the respective functional cur-
rency, mainly by means of forward exchange contracts.
Currency risks as defined by IFRS 7 arise from financial
instruments that are denominated in a currency other
than the functional currency. Fluctuations in the value of
non-monetary financial instruments do not represent an
exchange risk in the meaning of IFRS 7 and nor do the
effects of translating financial statements denominated
in foreign currencies into the Group’s reporting currency
(euro).
156 FINANCIAL REPORTING Notes to the consolidated financial statements
S+Bi AG Annual Report 2014
Interest risk
Interest rate risks arise mainly on floating-rate liabilities
that are denominated in euro. The Executive Board stipu-
lates an appropriate target ratio of fixed and floating-rate
liabilities and monitors adherence to the target on an
ongoing basis. Interest rates are primarily managed using
interest rate swaps.
The following assumptions are applied in calculating the
interest sensitivities:
1. Interest rate risks of primary floating-rate financial
instruments normally only affect profit or loss.
2. a) Interest rate risks of derivative financial instru-
ments which are part of a hedging relationship in a
cash flow hedge pursuant to IAS 39 affect equity.
As at both reporting dates, there were no interest
rate derivatives designated to hedging relation-
ships.
b) Interest rate risks of derivative financial instru-
ments which are not part of a hedging relationship
in a cash flow hedge pursuant to IAS 39 affect
profit or loss.
If euro interest rates had been 100 base points higher
(lower) as at the reporting date, net income/loss would
have developed as follows:
Change in Effect on net income (loss)
in million EUR basis points 2014 2013
EUR interest rates
+100 – 3.1 – 3.4
– 100 3.1 3.4
USD interest rates
+100 – 1.1 – 0.8
– 100 1.1 0.8
Commodity price risk
The commodity price risks result from fluctuations in
the prices of raw materials required for steel produc-
tion. Fluctuations in commodity prices can usually be
passed on to customers in the form of alloy surcharges.
If this is not possible, hedging is undertaken with mar-
ketable instruments in some cases. Currently, these
mainly comprise forward exchange contracts for nickel.
S + Bi receives payments
depending on the development of the nickel price, and is
therefore protected against price hikes.
There would have been no significant impact on the Group’s
net income/loss or shareholders’ equity if the price of nickel
had been 10% higher (lower) as at the reporting date.
Credit risk
Credit risks are mainly linked to trade accounts receiv-
able, bank balances, guarantees and derivative financial
instruments. In view of the broadly diversified customer
list, which spans a variety of regions and industries, the
credit risk on trade accounts receivable is limited.
Moreover, some of the trade accounts receivable are
covered by credit insurance with varying deductibles.
Approximately 53% (2013: 47%) of the trade accounts
receivable were covered by credit insurance as at the
reporting date.
Credit risks from operating activities are mitigated by
selecting external business partners based on internal
credit checks and a credit approval process. A credit
risk limit is set for each contractual partner based on
the internal credit check. Each subsidiary is essentially
responsible for setting and monitoring their own limits
under observation of the various approval processes
that apply depending on the credit limit. The credit and
collections policies of the local entities are captured by
the internal control system and are therefore audited
periodically by Internal Audit.
Where possible, and particularly in the case of new
business relationships, external business partners are
required to provide security/collateral to minimise the
credit risk. Bank guarantees, assignment of receiv-
ables, assignment of collateral and personal guarantees
are all acceptable forms of security.
Default risks are monitored continuously by the indi-
vidual Group companies and are taken into account
through allowance accounts if necessary. Impairments
of trade accounts receivable are recognised in part on
special allowance accounts. However, if the probability
of default is assessed to be very high, the respective
accounts receivable are immediately derecognised.
157FINANCIAL REPORTING Notes to the consolidated financial statements
S+Bi AG Annual Report 2014
All of S + Bi’s partner banks
have good credit ratings considering the prevailing
market conditions and most are members of deposit
guarantee schemes. Derivative financial instruments
are only entered into with these banks.
The carrying amount represents the maximum credit
risk for all classes of recognised financial assets.
As at each reporting date, the financial assets that are
not measured at fair value through profit or loss are
assessed for any objective evidence of impairment.
Objective evidence includes significant financial diffi-
culty of the borrower, actual breach of contract by the
debtor, the disappearance of an active market for the
financial asset, a prolonged decline in the fair value of
a financial asset below amortised cost and significant
changes in the technological, economic or legal envi-
ronment in which the debtor operates. If impairment has
occurred, the difference between the carrying amount
and the expected future cash flows discounted at the
original effective interest rate is recognised in profit or
loss, while changes in value that were recognised in
other comprehensive income are released through profit
or loss. If the fair value of financial assets other than
those categorised as “available for sale” objectively
increases over time, a reversal of the impairment is rec-
ognised through profit or loss provided that the original
amortised costs are not exceeded.
Liquidity risk
Solvency is monitored at all times by a largely cen-
tralised cash management system. In particular, this
involves preparing liquidity plans in which the expected
cash receipts and payments for a specified time period
are offset against each other. In addition, liquidity
reserves are maintained in the form of bank balances
and irrevocable credit facilities with banks.
The tables below present the contractually agreed
undiscounted cash outflows from primary financial
liabilities and cash flows from derivative financial instru-
ments:
Carrying amount 31.12.2014
Cash outflows 2015
Cash outflows 2016 to 2019
Cash outflows after 2019
Total cash outflows
in million EUR
Primary financial instruments
Syndicated loan 238.7 7.8 271.9 0.0 279.7
Other bank loans 40.9 9.8 27.6 11.4 48.8
Bond 160.7 16.6 225.7 0.0 242.3
Liabilities from finance leasing 8.4 2.7 6.0 0.9 9.6
Other financial liabilities 210.6 209.2 1.5 0.0 210.7
Trade accounts payable 366.4 366.4 0.0 0.0 366.4
Total primary financial instruments 1 025.7 612.5 532.7 12.3 1 157.5
Derivative financial instruments
Derivatives with hedging relationship (hedge accounting) – 0.4 – 0.4 0.0 0.0 – 0.4
– thereof outflow – 0.4 0.0 0.0 – 0.4
– thereof inflow 0.0 0.0 0.0 0.0
Derivatives without hedging relationship (no hedge accounting) – 3.8 – 8.0 – 0.7 0.0 – 8.7
– thereof outflow – 222.1 – 5.4 0.0 – 227.5
– thereof inflow 214.1 4.7 0.0 218.8
Total derivative financial instruments – 4.2 – 8.4 – 0.7 0.0 – 9.1Total 31.12.2014 1 021.5 604.1 532.0 12.3 1 148.4

158 FINANCIAL REPORTING Notes to the consolidated financial statements
S+Bi AG Annual Report 2014
Carrying amount 31.12.2013
Cash outflows 2014
Cash outflows 2015 to 2018
Cash outflows after 2018
Total cash outflows
in million EUR
Primary financial instruments
Syndicated loan 216.7 24.2 212.8 0.0 237.0
Other bank loans 64.1 27.5 30.0 17.6 75.1
Bond 159.0 16.6 66.2 176.0 258.8
Liabilities from finance leasing 11.1 3.4 7.4 2.0 12.8
Other financial liabilities 227.6 226.0 2.1 0.0 228.1
Trade accounts payable 324.4 324.4 0.0 0.0 324.4
Total primary financial instruments 1 002.9 622.1 318.5 195.6 1 136.2
Derivative financial instruments
Derivatives with hedging relationship (hedge accounting) 0.2 0.2 0.0 0.0 0.2
– thereof outflow 0.2 0.0 0.0 0.2
– thereof inflow 0.0 0.0 0.0 0.0
Derivatives without hedging relationship (no hedge accounting) – 3.6 – 1.2 0.4 0.0 – 0.8
– thereof outflow 126.3 3.7 0.0 130.0
– thereof inflow – 127.5 – 3.3 0.0 – 130.8
Total derivative financial instruments – 3.4 – 1.0 0.4 0.0 – 0.6Total 31.12.2013 999.5 621.1 318.9 195.6 1 135.6
The tables above include all financial liabilities carried as
at the reporting date. Amounts denominated in foreign
currencies were translated into euro using the exchange
rates as at the reporting date; floating-rate interest
payments were determined on the basis of the current
rate. Payments are shown in the periods in which pay-
ment can first be demanded according to the contrac-
tual arrangements. The amounts of derivative financial
instruments shown above represent the net balance of
undiscounted payments and receipts.
Capital management
The overriding capital management objective is to main-
tain an adequate capital basis for the long-term growth
of the Group in order to create added value for the share-
holders and safeguard the solvency of the Group at all
times. Fulfilment of this objective is measured against an
appropriate ratio of shareholders’ equity to total assets
(equity ratio) and an appropriate level of net debt.
Due to the increase in total assets, the equity ratio
decreased to 35.9% as at 31 December 2014 (2013:
37.4%), despite the increase in shareholders’ equity as a
result of the Group’s positive bottom line.
Net debt, comprising current and non-current financial
liabilities less cash and cash equivalents, dropped to
EUR 587.2 million as at 31 December 2014 (2013: EUR
610.1 million). The gearing, which expresses the ratio of
net debt to shareholders’ equity, thus improved slightly,
decreasing to 65.2% (2013: 68.6%). Since the amount
of the borrowing costs for the syndicated loan is linked
to the ratio of net debt to EBITDA, this debt factor, as
well as the other financial covenants, are monitored on
an ongoing basis within the capital management frame-
work, to secure the most favourable conditions possible
for the Group’s financing. The Group complied with all
financial covenants as at 31 December 2014.
159FINANCIAL REPORTING Notes to the consolidated financial statements
S+Bi AG Annual Report 2014
A further capital management objective is to ensure an
appropriate distribution of net income for sharehold-
ers. The ratio of net debt to EBITDA is also monitored
because the syndicated loan agreement contains provi-
sions governing dividend distributions depending on this
indicator. The Group can modify its capital structure by
adjusting the amount of the dividend payments, repaying
capital to the shareholders, issuing new shares or selling
assets in order to reduce financial liabilities.
11_Contingent liabilities and other finan-cial obligations
in million EUR 2014 2013
Pledges, guarantees 21.8 20.2
Purchase commitments
– for intangible assets 0.2 0.1– for property, plant and
equipment 43.2 25.4Total 65.2 45.7
Up slightly on the prior year, the purchase commit-
ments result from the investment programmes at indi-
vidual Group companies with the majority relating to
multiple-year investments of Deutsche Edelstahlwerke
GmbH (DE) and Ugitech S.A. (FR).
Operating leases are associated with minimum lease
payments as follows:
in million EUR 2014 2013
< 1 year 17.8 18.5
1 to 5 years 28.2 36.5
> 5 years 3.8 5.6
Total 49.8 60.6
Furthermore, Deutsche Edelstahlwerke GmbH (DE)
entered into a hereditary lease in 2003 with a total lease
term of 99 years for properties at the Siegen and Hagen
sites. The total area of approximately 650 000 m² is
leased for an annual payment of EUR 1.6 million. This
obligation is not included in the table above.
There are rent and lease agreements at SB Acciai Speciali
S.r.l. (IT ) for buildings and technical equipment which
include provisions potentially requiring the company in
question to assume the buildings and plant, together with
the remaining operations, in the event of insolvency on
the part of the contracting party. The Board of Directors
and Executive Board consider the risk of a claim to be
low at the time of preparing these consolidated financial
statements.
In 2012, a bond creditor in the USA filed a prospectus
liability suit against s + bi in
connection with the bond issue, which was dismissed in
the court of first instance in 2014. We believe the action
to be without merit.
S + Bi operates in what is
referred to as an energy-intensive sector. Several of its
German entities were until now entitled to a reduction on
the surcharge in accordance with the German Renewable
Energies Act (EEG). In December 2013, the EU Commis-
sion launched an in-depth investigation into the Federal
Republic of Germany’s EEG for compatibility with EU state
aid rules. Proceedings have since been concluded. The
Commission approved the applicable German laws with
certain amendments. We do not expect any material back
payments. At the same time, a revised version of the EEG
was issued in Germany, with new provisions governing
the period from 1 January 2015. Our production compa-
nies meet the requirements contained therein and have
therefore received the relevant exemptions.
S + Bi operates on an interna-
tional scale. There is a risk in each of the countries in
which S + Bi operates that the
local tax authorities will challenge transfer prices for
goods and services exchanged between the individual
Group companies as well as management fees within
the Group. Interpretation of tax provisions on intercom-
pany financing agreements and currency translation dif-
ferences can lead to uncertainty around tax positions.
S + Bi regularly assesses the
tax expense that will be payable following tax field audits
and provides for them by estimating the results of tax
field audits for all open years. The actual outcome of the
tax field audits can differ significantly from the estimates
considered in these consolidated financial statements
and may impact the tax expense/income in subsequent
periods.

160 FINANCIAL REPORTING Notes to the consolidated financial statements
S+Bi AG Annual Report 2014
12_Segment reporting
The Group is presented in accordance with its internal
reporting and organisational structure, comprising the
two divisions (hereafter also referred to as operating
segments): Production and Sales & Services.
The chief decision-makers of the Group monitor the
operating results of each operating segment individually
in order to assess their performance and decide on the
allocation of resources. Earnings before interest, tax,
depreciation and amortisation (EBITDA) is the key indi-
cator used to assess the segment performance of the
individual operating segments in accordance with IFRS.
Adjusted EBITDA is therefore segment profit/loss in the
meaning of IFRS 8. Independent thereof, the Executive
Board also receives regular reports at the level of the
operating segments on further key performance indica-
tors up to earnings before taxes (EBT), based on IFRS
accounting. These additional indicators are also dis-
closed in the present segment reporting.
The Group’s operating segments are summarised below:
ProductionProduction comprises the business units Deutsche
Edelstahlwerke, Finkl/Sorel, S+B Bright Bar, Swiss
Steel and Ugitech. These companies produce tool
steel, stainless steel, engineering steel, bright steel
and other speciality products for sale to third parties
directly or to the Sales & Services organisation of the
s + bi Group.
Sales & Services
The Sales & Services segment comprises the distri-
bution and service activities of the S +
Bi Group in Germany, Europe and other
countries.
It carries a range of products manufactured by the produc-
tion companies of the s + bi
Group as well as third parties.
Transactions within the individual segments have
been eliminated for segment reporting purposes. The
exchange of goods and services between the operating
segments takes place at transfer prices in accordance
with the arm’s length principle and international transfer
pricing regulations. The segments’ measures of profit or
loss are determined using the same accounting policies
as those used for Group accounting, i.e. Group compa-
nies are included in management reporting based on
accounting in accordance with IFRS. The reconciliation
of the segment figures to the Group figures is thus lim-
ited to eliminations (in particular expense and income
elimination and the elimination of intrasegment profits
and losses) and other activities (Other segment) which
are not allocated to the operating segments.
The Other segment only comprises holding activities.
The reconciliation of segment assets and segment lia-
bilities also considers adjustments to reflect the fact
that not all assets and liabilities are allocated to the
operating segments for management purposes.
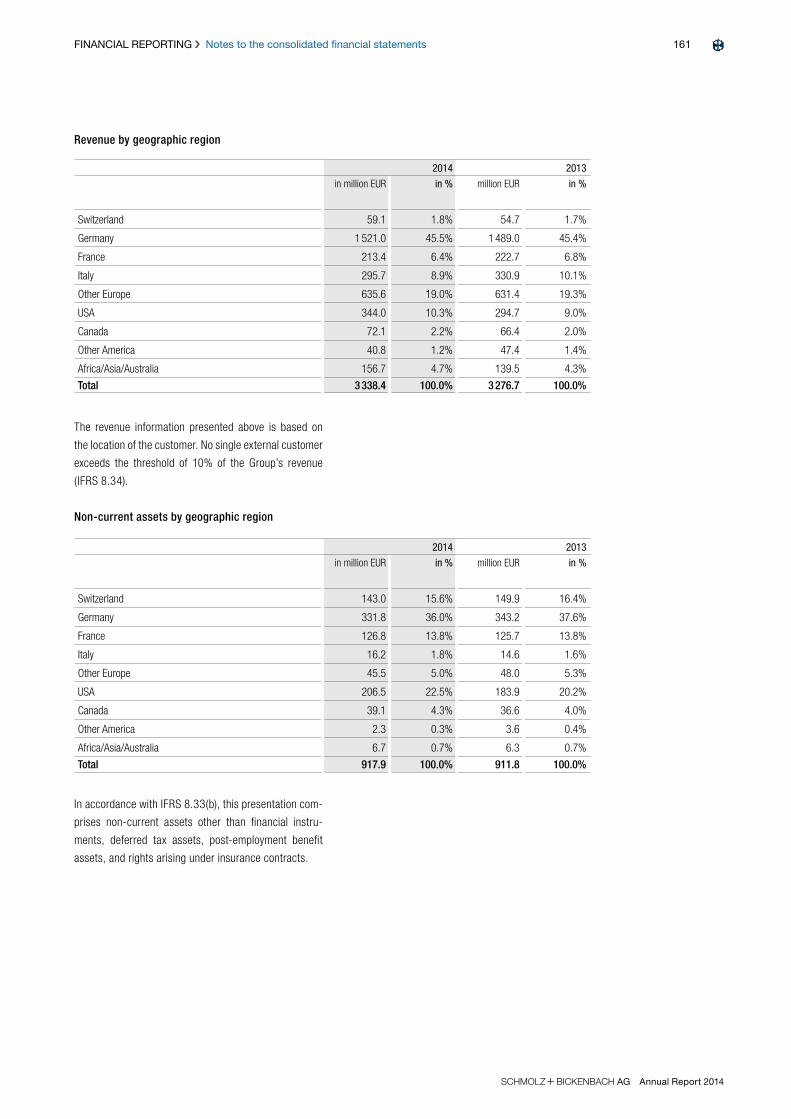
161FINANCIAL REPORTING Notes to the consolidated financial statements
S+Bi AG Annual Report 2014
Revenue by geographic region
2014 2013
in million EUR in % million EUR in %
Switzerland 59.1 1.8% 54.7 1.7%
Germany 1 521.0 45.5% 1 489.0 45.4%
France 213.4 6.4% 222.7 6.8%
Italy 295.7 8.9% 330.9 10.1%
Other Europe 635.6 19.0% 631.4 19.3%
USA 344.0 10.3% 294.7 9.0%
Canada 72.1 2.2% 66.4 2.0%
Other America 40.8 1.2% 47.4 1.4%
Africa/Asia/Australia 156.7 4.7% 139.5 4.3%
Total 3 338.4 100.0% 3 276.7 100.0%
The revenue information presented above is based on
the location of the customer. No single external customer
exceeds the threshold of 10% of the Group’s revenue
(IFRS 8.34).
Non-current assets by geographic region
2014 2013
in million EUR in % million EUR in %
Switzerland 143.0 15.6% 149.9 16.4%
Germany 331.8 36.0% 343.2 37.6%
France 126.8 13.8% 125.7 13.8%
Italy 16.2 1.8% 14.6 1.6%
Other Europe 45.5 5.0% 48.0 5.3%
USA 206.5 22.5% 183.9 20.2%
Canada 39.1 4.3% 36.6 4.0%
Other America 2.3 0.3% 3.6 0.4%
Africa/Asia/Australia 6.7 0.7% 6.3 0.7%
Total 917.9 100.0% 911.8 100.0%
In accordance with IFRS 8.33(b), this presentation com-
prises non-current assets other than financial instru-
ments, deferred tax assets, post-employment benefit
assets, and rights arising under insurance contracts.
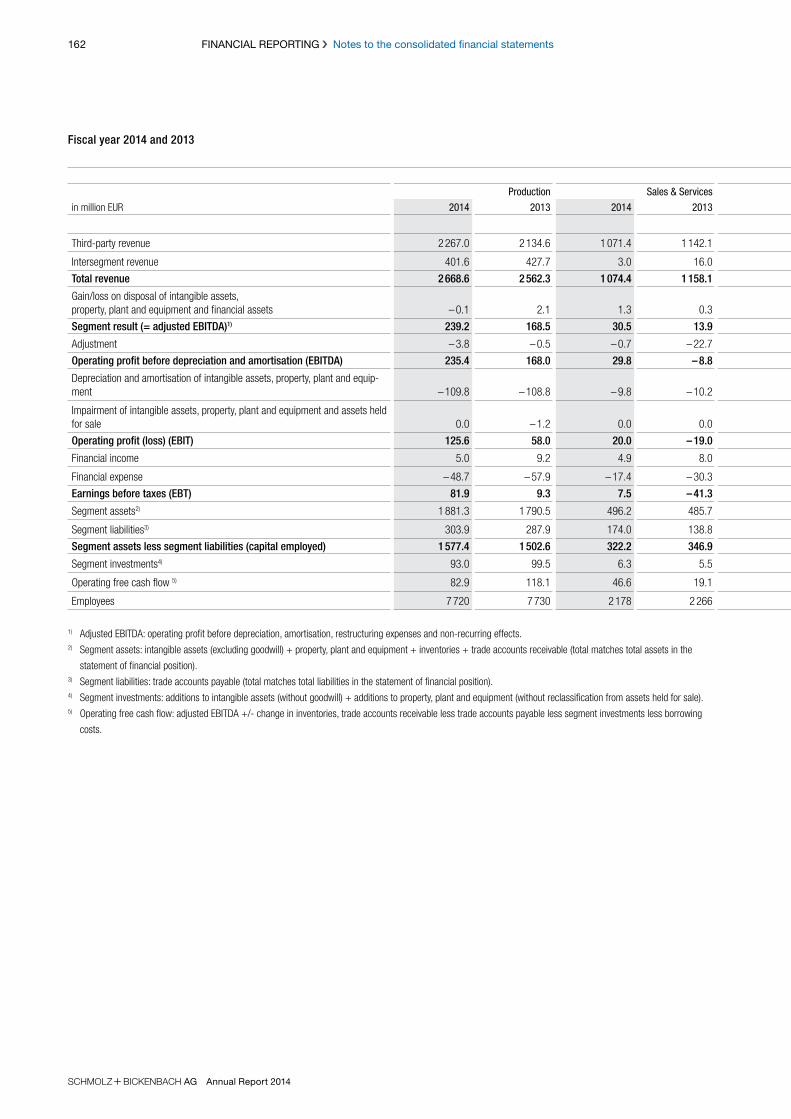
162 FINANCIAL REPORTING Notes to the consolidated financial statements
S+Bi AG Annual Report 2014
Fiscal year 2014 and 2013
Reconciliation
Production Sales & Services Total operating segments Other Eliminations/adjustments Total
in million EUR 2014 2013 2014 2013 2014 2013 2014 2013 2014 2013 2014 2013
Third-party revenue 2 267.0 2 134.6 1 071.4 1 142.1 3 338.4 3 276.7 0.0 0.0 0.0 0.0 3 338.4 3 276.7
Intersegment revenue 401.6 427.7 3.0 16.0 404.6 443.7 0.0 0.0 – 404.6 – 443.7 0.0 0.0
Total revenue 2 668.6 2 562.3 1 074.4 1 158.1 3 743.0 3 720.4 0.0 0.0 – 404.6 – 443.7 3 338.4 3 276.7
Gain/loss on disposal of intangible assets, property, plant and equipment and financial assets – 0.1 2.1 1.3 0.3 1.2 2.4 0.0 0.0 0.0 0.0 1.2 2.4
Segment result (= adjusted EBITDA)1) 239.2 168.5 30.5 13.9 269.7 182.4 – 9.5 – 6.7 1.5 3.1 261.7 178.8
Adjustment – 3.8 – 0.5 – 0.7 – 22.7 – 4.5 – 23.2 – 4.6 – 13.9 0.0 0.0 – 9.1 – 37.1
Operating profit before depreciation and amortisation (EBITDA) 235.4 168.0 29.8 – 8.8 265.2 159.2 – 14.1 – 20.6 1.5 3.1 252.6 141.7
Depreciation and amortisation of intangible assets, property, plant and equip-ment – 109.8 – 108.8 – 9.8 – 10.2 – 119.6 – 119.0 – 2.4 – 2.5 0.0 0.0 – 122.0 – 121.5
Impairment of intangible assets, property, plant and equipment and assets held for sale 0.0 – 1.2 0.0 0.0 0.0 – 1.2 0.0 – 1.2 0.0 0.0 0.0 – 2.4
Operating profit (loss) (EBIT) 125.6 58.0 20.0 – 19.0 145.6 39.0 – 16.5 – 24.3 1.5 3.1 130.6 17.8
Financial income 5.0 9.2 4.9 8.0 9.9 17.2 77.3 99.1 – 80.6 – 102.1 6.6 14.2
Financial expense – 48.7 – 57.9 – 17.4 – 30.3 – 66.1 – 88.2 – 72.0 – 133.5 80.6 102.1 – 57.5 – 119.6
Earnings before taxes (EBT) 81.9 9.3 7.5 – 41.3 89.4 – 32.0 – 11.2 – 58.7 1.5 3.1 79.7 – 87.6
Segment assets2) 1 881.3 1 790.5 496.2 485.7 2 377.5 2 276.2 5.9 6.9 126.2 94.4 2 509.6 2 377.5
Segment liabilities3) 303.9 287.9 174.0 138.8 477.9 426.7 1.3 1.9 1 129.5 1 059.0 1 608.7 1 487.6
Segment assets less segment liabilities (capital employed) 1 577.4 1 502.6 322.2 346.9 1 899.6 1 849.5
Segment investments4) 93.0 99.5 6.3 5.5 99.3 105.0 1.5 0.7 0.0 0.0 100.8 105.7
Operating free cash flow 5) 82.9 118.1 46.6 19.1 129.5 137.2 – 11.5 – 4.0 1.4 – 0.8 119.4 132.4
Employees 7 720 7 730 2 178 2 266 9 898 9 996 102 99 0 0 10 000 10 095
1) Adjusted EBITDA: operating profit before depreciation, amortisation, restructuring expenses and non-recurring effects. 2) Segment assets: intangible assets (excluding goodwill) + property, plant and equipment + inventories + trade accounts receivable (total matches total assets in the
statement of financial position).3) Segment liabilities: trade accounts payable (total matches total liabilities in the statement of financial position).4) Segment investments: additions to intangible assets (without goodwill) + additions to property, plant and equipment (without reclassification from assets held for sale).5) Operating free cash flow: adjusted EBITDA +/- change in inventories, trade accounts receivable less trade accounts payable less segment investments less borrowing
costs.
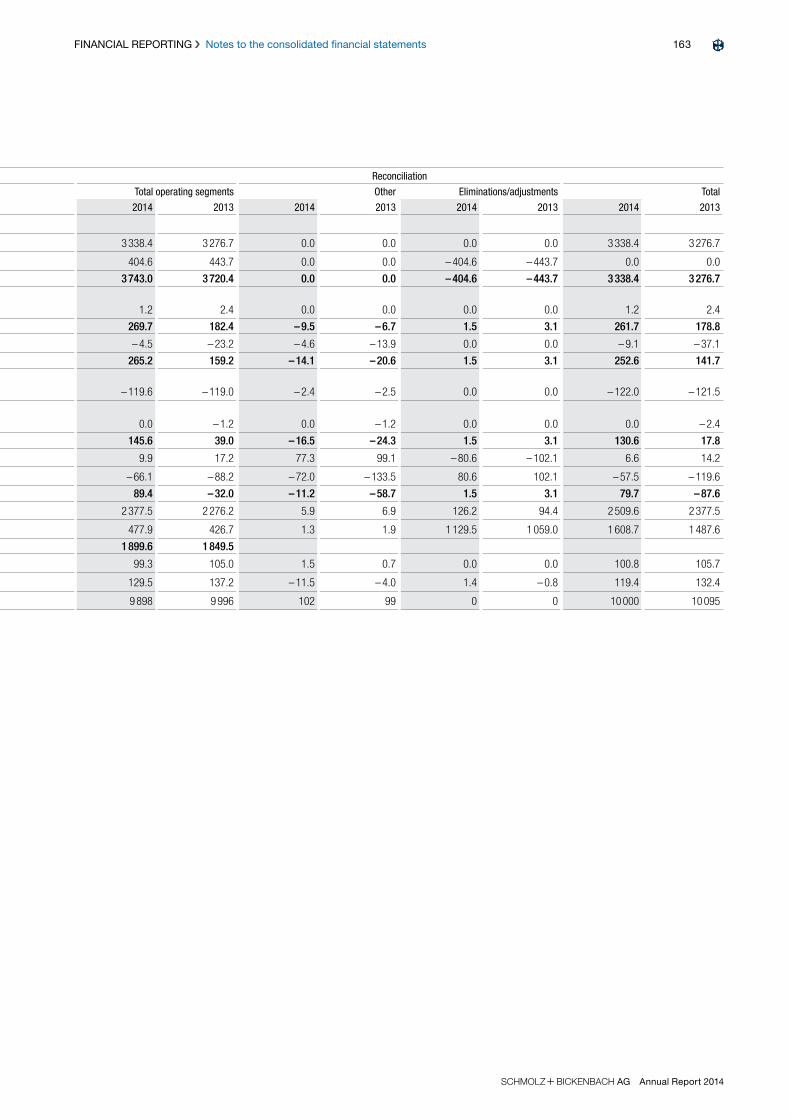
163FINANCIAL REPORTING Notes to the consolidated financial statements
S+Bi AG Annual Report 2014
Fiscal year 2014 and 2013
Reconciliation
Production Sales & Services Total operating segments Other Eliminations/adjustments Total
in million EUR 2014 2013 2014 2013 2014 2013 2014 2013 2014 2013 2014 2013
Third-party revenue 2 267.0 2 134.6 1 071.4 1 142.1 3 338.4 3 276.7 0.0 0.0 0.0 0.0 3 338.4 3 276.7
Intersegment revenue 401.6 427.7 3.0 16.0 404.6 443.7 0.0 0.0 – 404.6 – 443.7 0.0 0.0
Total revenue 2 668.6 2 562.3 1 074.4 1 158.1 3 743.0 3 720.4 0.0 0.0 – 404.6 – 443.7 3 338.4 3 276.7
Gain/loss on disposal of intangible assets, property, plant and equipment and financial assets – 0.1 2.1 1.3 0.3 1.2 2.4 0.0 0.0 0.0 0.0 1.2 2.4
Segment result (= adjusted EBITDA)1) 239.2 168.5 30.5 13.9 269.7 182.4 – 9.5 – 6.7 1.5 3.1 261.7 178.8
Adjustment – 3.8 – 0.5 – 0.7 – 22.7 – 4.5 – 23.2 – 4.6 – 13.9 0.0 0.0 – 9.1 – 37.1
Operating profit before depreciation and amortisation (EBITDA) 235.4 168.0 29.8 – 8.8 265.2 159.2 – 14.1 – 20.6 1.5 3.1 252.6 141.7
Depreciation and amortisation of intangible assets, property, plant and equip-ment – 109.8 – 108.8 – 9.8 – 10.2 – 119.6 – 119.0 – 2.4 – 2.5 0.0 0.0 – 122.0 – 121.5
Impairment of intangible assets, property, plant and equipment and assets held for sale 0.0 – 1.2 0.0 0.0 0.0 – 1.2 0.0 – 1.2 0.0 0.0 0.0 – 2.4
Operating profit (loss) (EBIT) 125.6 58.0 20.0 – 19.0 145.6 39.0 – 16.5 – 24.3 1.5 3.1 130.6 17.8
Financial income 5.0 9.2 4.9 8.0 9.9 17.2 77.3 99.1 – 80.6 – 102.1 6.6 14.2
Financial expense – 48.7 – 57.9 – 17.4 – 30.3 – 66.1 – 88.2 – 72.0 – 133.5 80.6 102.1 – 57.5 – 119.6
Earnings before taxes (EBT) 81.9 9.3 7.5 – 41.3 89.4 – 32.0 – 11.2 – 58.7 1.5 3.1 79.7 – 87.6
Segment assets2) 1 881.3 1 790.5 496.2 485.7 2 377.5 2 276.2 5.9 6.9 126.2 94.4 2 509.6 2 377.5
Segment liabilities3) 303.9 287.9 174.0 138.8 477.9 426.7 1.3 1.9 1 129.5 1 059.0 1 608.7 1 487.6
Segment assets less segment liabilities (capital employed) 1 577.4 1 502.6 322.2 346.9 1 899.6 1 849.5
Segment investments4) 93.0 99.5 6.3 5.5 99.3 105.0 1.5 0.7 0.0 0.0 100.8 105.7
Operating free cash flow 5) 82.9 118.1 46.6 19.1 129.5 137.2 – 11.5 – 4.0 1.4 – 0.8 119.4 132.4
Employees 7 720 7 730 2 178 2 266 9 898 9 996 102 99 0 0 10 000 10 095
1) Adjusted EBITDA: operating profit before depreciation, amortisation, restructuring expenses and non-recurring effects. 2) Segment assets: intangible assets (excluding goodwill) + property, plant and equipment + inventories + trade accounts receivable (total matches total assets in the
statement of financial position).3) Segment liabilities: trade accounts payable (total matches total liabilities in the statement of financial position).4) Segment investments: additions to intangible assets (without goodwill) + additions to property, plant and equipment (without reclassification from assets held for sale).5) Operating free cash flow: adjusted EBITDA +/- change in inventories, trade accounts receivable less trade accounts payable less segment investments less borrowing
costs.
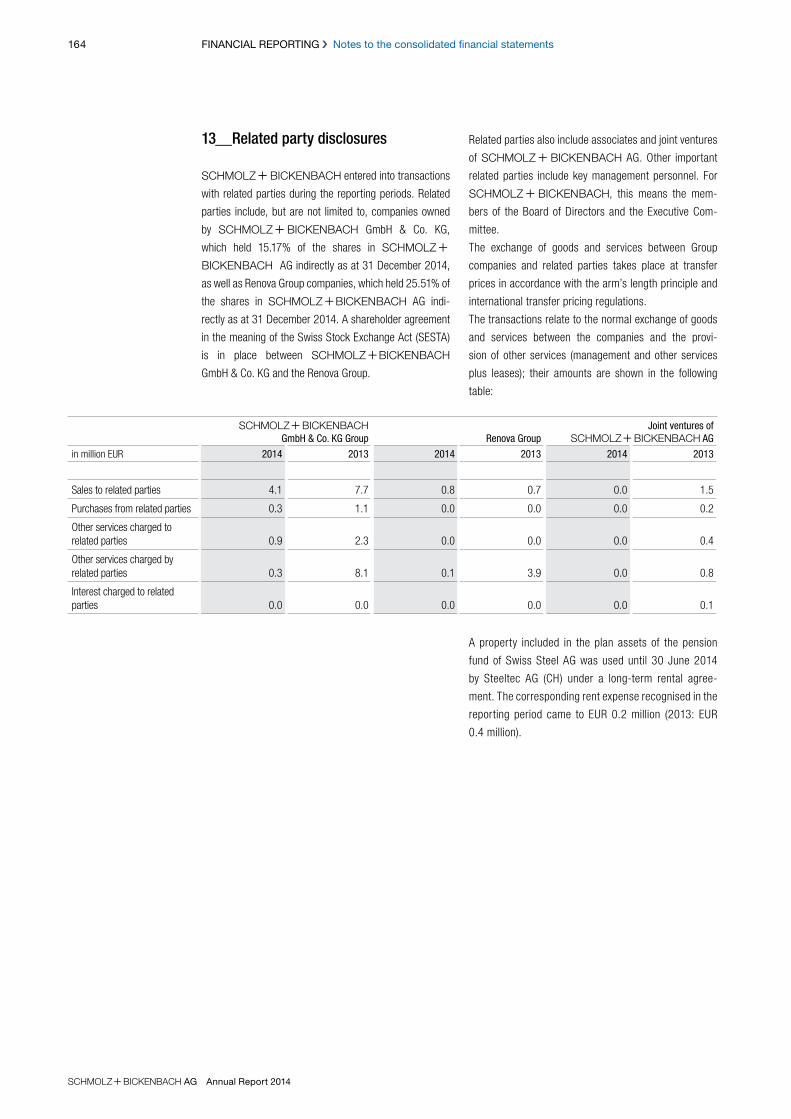
164 FINANCIAL REPORTING Notes to the consolidated financial statements
S+Bi AG Annual Report 2014
S+Bi GmbH & Co. KG Group Renova Group
Joint ventures of S+Bi AG
in million EUR 2014 2013 2014 2013 2014 2013
Sales to related parties 4.1 7.7 0.8 0.7 0.0 1.5
Purchases from related parties 0.3 1.1 0.0 0.0 0.0 0.2
Other services charged to related parties 0.9 2.3 0.0 0.0 0.0 0.4
Other services charged by related parties 0.3 8.1 0.1 3.9 0.0 0.8
Interest charged to related parties 0.0 0.0 0.0 0.0 0.0 0.1
13_Related party disclosures
S + Bi entered into transactions
with related parties during the reporting periods. Related
parties include, but are not limited to, companies owned
by S + Bi GmbH & Co. KG,
which held 15.17% of the shares in S +
Bi AG indirectly as at 31 December 2014,
as well as Renova Group companies, which held 25.51% of
the shares in S +Bi AG indi-
rectly as at 31 December 2014. A shareholder agreement
in the meaning of the Swiss Stock Exchange Act (SESTA)
is in place between S +Bi
GmbH & Co. KG and the Renova Group.
Related parties also include associates and joint ventures
of S + Bi AG. Other important
related parties include key management personnel. For
S + Bi, this means the mem-
bers of the Board of Directors and the Executive Com-
mittee.
The exchange of goods and services between Group
companies and related parties takes place at transfer
prices in accordance with the arm’s length principle and
international transfer pricing regulations.
The transactions relate to the normal exchange of goods
and services between the companies and the provi-
sion of other services (management and other services
plus leases); their amounts are shown in the following
table:
A property included in the plan assets of the pension
fund of Swiss Steel AG was used until 30 June 2014
by Steeltec AG (CH) under a long-term rental agree-
ment. The corresponding rent expense recognised in the
reporting period came to EUR 0.2 million (2013: EUR
0.4 million).

165FINANCIAL REPORTING Notes to the consolidated financial statements
S+Bi AG Annual Report 2014
S+
Bi GmbH & Co. KG Group Renova Group Other related parties
in million EUR 2014 2013 2014 2013 2014 2013
Operating receivables from related parties 0.5 0.8 0.0 0.1 0.0 0.2
Financial liabilities to related parties 0.0 1.2 0.0 2.1 0.0 0.0
Operating liabilities to related parties 0.5 0.2 0.0 0.0 0.0 0.3
There were items outstanding as at 31 Decem-
ber 2014 relating to Renova Group companies,
S + Bi GmbH & Co. KG, joint
ventures of S + Bi AG and
other related parties as shown in the table below:
Since 2013, part of the variable remuneration of the
Executive Board of S + Bi AG
is paid out in shares. In 2014, this share-based payment
program was amended and further developed to create
a Long Term Incentive Plan (LTIP) according to which the
amount of remuneration depends on the development of
the performance indicators return on capital employed
(ROCE) and absolute shareholder return (ASR) within a
three-year performance period. At the end of the three-
year performance period, remuneration is paid out in
shares or in cash; s + bi
is solely entitled to choose how to settle the pay-
ments. Furthermore, a share-based payment plan for
the Board of Directors was introduced in 2014. The
average fair value of equity instruments granted as at
31 December 2014 was EUR 1; equity instruments total-
ling EUR 1.3 million (2013: EUR 0.5 million) were granted
and recorded as an expense in the consolidated income
statement. The expense of EUR 1.0 million (2013:
EUR 0.5 million) was debited from retained earnings.
The difference compared to the total amount of equity
instruments granted relates to withholding tax. A total
of 1.2 million equity instruments were outstanding as
at 31 December. Historical share price development
and the expected development of ROCE and ASR was
taken into account in particular in measuring equity ins-
truments.
Compensation came to EUR 1.8 million in 2014 (2013:
EUR 1.4 million) for the Board of Directors and EUR
5.4 million (2013: EUR 10.9 million) for the Executive
Committee. Of that compensation, EUR 4.7 million
(2013: EUR 7.2 million) relates to short-term benefits,
EUR 1.1 million (2013: EUR 4.4 million) to termination
benefits, EUR 0.1 million (2013: EUR 0.4 million) to
post-employment benefits and EUR 1.3 million (2013:
EUR 0.3 million) to share-based payments including
withholding tax.
166 FINANCIAL REPORTING Notes to the consolidated financial statements
S+Bi AG Annual Report 2014
14_Risk assessment
The S + Bi Group employs a
standardised Enterprise Risk Management (ERM) sys-
tem across the Group which provides uniform guidelines
for systematic and efficient risk management. All Group
companies have to prepare a risk assessment which is
regularly updated. This risk assessment includes, but is
not limited to, measuring potential damages before and
after implementing countermeasures as well as estimat-
ing the probability of occurrence. The risk assessment is
audited by Internal Audit.
The risk managers of the Group companies regularly
notify the Group Risk Manager of any risks identified.
These are then summarised and reported to the Exec-
utive Board and the Audit Committee. Unless there is a
specific need for special discussions, the risks are dis-
cussed and evaluated in detail at an annual meeting of
the Executive Board and Audit Committee.
15_Subsequent events
On 15 January 2015, the Swiss National Bank discon-
tinued the Swiss franc’s fixed exchange rate against the
euro. The previous minimum exchange rate of CHF 1.20
per EUR no longer applies. The exchange rate currently
stands at between CHF 1.00 and 1.07 per EUR. This
will have a negative impact on our Swiss operating com-
panies. Remeasurement of these companies’ net trade
accounts receivable in EUR led to a one-off negative
effect on EBITDA of around EUR 7 million as at the end
of February 2015. A positive currency effect from trans-
lating financial liabilities into euro as well as hedging will
partially make up for the above. There is also a current
effect due to the appreciation of the Swiss franc against
the euro.
Preliminary sensitivity analyses show that every increase
of one centime in the Swiss franc against the euro would
see EBITDA fall by around CHF 1.5 million per year.
Translation effects in the opposite direction will only par-
tially make up for this. Additional compensating effects
can be expected from the favourable development of the
USD/EUR exchange rate, which has a positive impact on
the results of our North American operations translated
into euro, while buoying the export business of our Euro-
pean operations.
At the beginning of March 2015, S +
Bi Edelstahl GmbH acquired the real
estate at Eupener Straße in Dusseldorf, which has
already been rented by several Group companies of
S + Bi AG, from Mietverwal-
tungsgesellschaft S +Bi mbH
& Co. KG, a company owned by S +
Bi GmbH & Co. KG. Depending on the
acquisition date, which is subject to the involvement of
third parties, the purchase price will amount to up EUR
36.9 million and will increase the planned investment
volume for 2015 accordingly.
After being terminated in December 2014, sales negoti-
ations for certain distribution companies were resumed
in the first quarter of 2015. Discussions are under way
without any expectations as to outcome.
167FINANCIAL REPORTING Notes to the consolidated financial statements
S+Bi AG Annual Report 2014
Name Registered office CurrencyShare capital
31.12.2014Group holding in %
31.12.2014
Production
A. Finkl & Sons Co. Chicago US USD 10.00 100.00
Ardenacier S.A.R.L. Charleville-Mézières FR EUR 16 000.00 100.00
Boxholm Stål AB Boxholm SE SEK 7 000 000.00 100.00
Composite Forgings L.P. Detroit US USD 1 236 363.00 100.00
Deutsche Edelstahlwerke GmbH Witten DE EUR 50 000 000.00 100.00
Deutsche Edelstahlwerke Härterei Technik GmbH Ludenscheid DE EUR 1 100 000.00 94.90
Deutsche Edelstahlwerke Karrierewerkstatt GmbH Witten DE EUR 100 000.00 94.90
dhi Rohstoffmanagement GmbH Siegen DE EUR 4 000 000.00 51.00
Edelstahlwerke Witten-Krefeld Vermögensverwaltungs-gesellschaft mbH Krefeld DE EUR 511 350.00 94.90
Finkl De Mexico S de R.L. de C.V. Edo. De Mexico C.P. MX MXN 200 088.00 51.00
Finkl Holdings LLC Chicago US USD 1 000.00 100.00
Finkl Outdoor Services Inc. Chicago US USD 1 000.00 100.00
Finkl Thai Co. Ltd. Samutprakarn TH THB 6 500 000.00 49.00
Panlog AG Emmen CH CHF 1 500 000.00 100.00
S+Bi A/S Norresundby DK DKK 50 000 000.00 100.00
S+Bi Blankstahl GmbH Dusseldorf DE EUR 2 000 000.00 100.00
S+Bi Celik A.S. Istanbul TR TRY 89 889 143.00 100.00
Sorel Forge Co. St. Joseph-de-Sorel CA CAD 252 129.00 100.00
Sprint Metal Edelstahlziehereien GmbH Hemer DE EUR 6 500 000.00 100.00
Steeltec AG Emmen CH CHF 33 000 000.00 100.00
Steeltec FIC S.A.R.L. Cluses-Cedex FR EUR 1 120 000.00 100.00
Steeltec Praezisa GmbH Niedereschach DE EUR 1 540 000.00 100.00
Steeltec Toselli Srl Cassina Nuova di Bollate IT EUR 780 000.00 100.00
Swiss Steel AG Emmen CH CHF 40 000 000.00 100.00
Ugitech GmbH Renningen DE EUR 25 000.00 100.00
Ugitech Italia S.r.l. Peschiera Borromeo IT EUR 3 000 000.00 100.00
Ugitech S.A. Ugine Cedex FR EUR 80 297 295.87 100.00
Ugitech Suisse S.A. Bévilard CH CHF 1 350 000.00 100.00
Ugitech TFA S.r.l. (IT) Peschiera Borromeo IT EUR 100 000.00 100.00
von Moos Stahl AG Emmen CH CHF 100 000.00 100.00
Sales & Services
Alta Tecnologia en Tratamientos Termicos S.A. de C.V. Queretaro MX MXN 15 490 141.00 100.00
Dongguan German-Steels Products Co. Ltd. Dongguan CN CNY 73 266 975.89 100.00
Dongguan S – Bi Co. Ltd. Dongguan CN CNY 57 940 707.43 100.00
Dr. Wilhelm Mertens GmbH Berlin DE EUR 25 564.59 100.00
Finkl U.K. Ltd. Langley GB GBP 3 899 427.00 100.00
Gunther + Schramm GmbH Oberkochen DE EUR 5 000 000.00 100.00
Jiangsu S – Bi Co. Ltd. Jiangsu CN CNY 47 066 459.31 100.00
SB Acciai Speciali S.r.l. Cambiago IT EUR 500 000.00 100.00
S+Bi Australia Pty. Ltd. Victoria AU AUD 900 000.00 100.00
S+Bi Austria GmbH Vienna AT EUR 8 000 000.00 100.00
S+Bi Baltic OÜ Tallinn EE EUR 4 469.96 100.00
S+Bi Baltic SIA Riga LV EUR 298 804.78 100.00
16_List of shareholdings

168 FINANCIAL REPORTING Notes to the consolidated financial statements
S+Bi AG Annual Report 2014
Name Registered office CurrencyShare capital
31.12.2014Group holding in %
31.12.2014
S+Bi Baltic UAB Kaunas LT LTL 2 711 700.00 100.00
S+Bi Belgium SA Brussels BE EUR 330 000.00 100.00
S+Bi B.V. Zwijndrecht NL EUR 22 689.00 100.00
S+Bi Canada Inc. Mississauga CA CAD 2 369 900.00 100.00
S+Bi Deutschland GmbH Dusseldorf DE EUR 100 000.00 100.00
S+Bi Distributions GmbH Dusseldorf DE EUR 20 000 000.00 100.00
S+Bi do Brasil Indústria e Comércio de Acos Ltda São Paulo BR BRL 79 565 338.29 100.00
S+Bi France S.A.S. Chambly FR EUR 278 508.40 100.00
S+Bi Iberica S.A. Madrid ES EUR 2 718 227.63 99.90
S+Bi India Pvt. Ltd. Thane (West) IN INR 119 155 500.00 100.00
S+Bi International GmbH Dusseldorf DE EUR 2 000 000.00 100.00
S+Bi Italy S.r.l. Peschiera Borromeo IT EUR 90 000.00 100.00
S+Bi Magyarország Kft. Budapest HU HUF 3 000 000.00 100.00
S+Bi Malaysia Sdn. Bhd. Port Klang MY MYR 2 500 000.00 100.00
S+Bi Mexico S.A. de C.V. Tlalnepantla MX MXN 98 218 665.00 100.00
S+Bi Middle East FZCO Dubai AE AED 6 449 050.00 100.00
S+Bi Oy Espoo FI EUR 500 000.00 60.00
S+Bi Polska Sp.z o.o. Myslowice PL PLN 7 000 000.00 100.00
S+Bi Portugal S.A. Matosinhos PT EUR 200 000.00 99.90
S+Bi Romania SRL Bucharest RO RON 3 363 932.00 100.00
S+Bi Russia OOO Moscow RU RUB 9 000 000.00 100.00
S+Bi s.r.o. Kladno CZ CZK 7 510 000.00 60.05
S+Bi Singapore Pte. Ltd. Singapore SG SGD 5 405 500.00 100.00
S+Bi Slovakia s.r.o. Trencianske Stankovce SK EUR 99 584.00 58.02
S+Bi UK Ltd. Birmingham GB GBP 6 899 427.00 100.00
S+Bi USA Inc. Carol Stream, Illinois US USD 1 935 000.00 100.00
S – Bi (Hong Kong) Trading Ltd. Fo Tan Shatin HK HKD 5 900 000.00 100.00
S – Bi Hong Kong Co. Ltd. Fo Tan Shatin HK HKD 98 140 676.00 100.00
S and Bi South Africa (Pty.) Ltd. Johannesburg ZA ZAR 2 155 003.00 100.00
Ugitech UK Ltd. Birmingham GB GBP 2 500 000.00 100.00
Zhejiang S – Bi Co. Ltd. Zhejiang CN CNY 37 387 196.01 100.00
Holdings/Other
S+Bi AB Granna SE SEK 100 000.00 100.00
S+Bi Edelstahl GmbH Dusseldorf DE EUR 10 000 000.00 100.00
S+Bi Luxembourg S.A. Luxembourg LU EUR 2 000 000.00 100.00
S+Bi USA Holdings Inc. Carol Stream, Illinois US USD 80 000 000.00 100.00
169FINANCIAL REPORTING Report of the statutory auditor on the consolidated financial statements
S+Bi AG Annual Report 2014
Report of the statutory auditor on the consolidated financial statements
To the General Meeting of S + Bi AG, Emmen
Zurich, 11 March 2015
Report of the statutory auditor on the consolidated financial statements
As statutory auditor, we have audited the consolidated financial statements of S + Bi AG, which comprise the consolidated
income statement, consolidated statement of comprehensive income, consolidated balance sheet, consolidated cash flow statement, consolidated
statement of changes in shareholders’ equity and notes (pages 116 to 168), for the year ended 31 December 2014.
Board of Directors’ responsibility
The Board of Directors is responsible for the preparation of these consolidated financial statements in accordance with International Financial
Reporting Standards (IFRS) and the requirements of Swiss law. This responsibility includes designing, implementing and maintaining an internal
control system relevant to the preparation of consolidated financial statements that are free from material misstatement, whether due to fraud or
error. The Board of Directors is further responsible for selecting and applying appropriate accounting policies and making accounting estimates that
are reasonable in the circumstances.
Auditor’s responsibility
Our responsibility is to express an opinion on these consolidated financial statements based on our audit. We conducted our audit in accordance
with Swiss law and Swiss Auditing Standards and International Standards on Auditing. Those standards require that we plan and perform the audit
to obtain reasonable assurance whether the consolidated financial statements are free from material misstatement.
An audit involves performing procedures to obtain audit evidence about the amounts and disclosures in the consolidated financial statements. The
procedures selected depend on the auditor’s judgment, including the assessment of the risks of material misstatement of the consolidated finan-
cial statements, whether due to fraud or error. In making those risk assessments, the auditor considers the internal control system relevant to the
entity’s preparation of the consolidated financial statements in order to design audit procedures that are appropriate in the circumstances, but not
for the purpose of expressing an opinion on the effectiveness of the entity’s internal control system. An audit also includes evaluating the appro-
priateness of the accounting policies used and the reasonableness of accounting estimates made, as well as evaluating the overall presentation of
the consolidated financial statements. We believe that the audit evidence we have obtained is sufficient and appropriate to provide a basis for our
audit opinion.
Opinion
In our opinion, the consolidated financial statements for the year ended 31 December 2014 give a true and fair view of the financial position, the
results of operations and the cash flows in accordance with IFRS and comply with Swiss law.
Report on other legal requirements
We confirm that we meet the legal requirements on licensing according to the Auditor Oversight Act (AOA) and independence (article 728 CO and
article 11 AOA) and that there are no circumstances incompatible with our independence.
In accordance with article 728a paragraph 1 item 3 CO and Swiss Auditing Standard 890, we confirm that an internal control system exists, which
has been designed for the preparation of consolidated financial statements according to the instructions of the Board of Directors.
We recommend that the consolidated financial statements submitted to you be approved.
Ernst & Young Ltd
Roland Ruprecht Beat Rölli
Licensed audit expert (Auditor in charge) Licensed audit expert

170 FINANCIAL REPORTING Five-year overview
FIVE-YEAR OVERVIEW
Unit 2010 2011 2012 2013 2014
Key operational figures
Sales volume kilotonnes 2 001 2 274 2 044 2 054 2 135
Order backlog kilotonnes 619 521 351 452 497
Income statement
Revenue million EUR 3 119.3 3 942.9 3 581.4 3 276.7 3 338.4
Gross margin million EUR 1 034.7 1 222.5 1 081.7 1 056.4 1 167.3
Adjusted EBITDA million EUR 232.9 296.2 151.1 178.8 261.7
Operating profit (loss) before depreciation and amortisation (EBITDA) million EUR 232.9 296.2 121.8 141.7 252.6
Operating profit (loss) (EBIT) million EUR 121.9 179.6 – 14.5 17.8 130.6
Earnings before taxes (EBT) million EUR 33.3 67.6 – 89.1 – 87.6 79.7
Net income (loss) (EAT) million EUR 38.6 42.7 – 162.8 – 83.7 50.0
Cash flow/investments/depreciation/amortisation
Cash flow before changes in net working capital million EUR 206.6 330.6 103.6 123.3 205.7
Cash flow from operations million EUR – 46.2 305.9 168.8 167.8 178.1
Cash flow from investing activities million EUR – 90.4 – 114.3 – 124.8 – 94.1 – 95.2
Free cash flow million EUR – 136.6 191.6 44.0 73.7 82.9
Investments million EUR 120.6 125.6 141.0 105.7 100.8
Depreciation and amortisation million EUR 111.0 116.6 122.2 121.5 122.0
Net assets and financial structure
Non-current assets million EUR 1 056.6 1 054.3 1 008.3 984.4 1 006.3
Current assets million EUR 1 501.2 1 676.3 1 408.8 1 393.1 1 503.3
Net working capital million EUR 1 027.6 1 064.8 1 006.0 949.5 992.3
Total assets million EUR 2 557.8 2 730.6 2 417.1 2 377.5 2 509.6
Shareholders' equity million EUR 795.8 844.2 633.0 889.9 900.9
Non-current liabilities million EUR 1 026.1 954.2 1 005.3 733.6 847.7
Current liabilities million EUR 735.9 932.2 778.8 754.0 761.0
Net debt million EUR 926.9 860.4 902.8 610.1 587.2
Employees
Employees as at closing date positions 10 000 10 332 10 278 10 095 10 000
Value management
Capital employed million EUR 1 953 2 002.8 1 937.5 1 841.3 1 891.2
Key figures on profit/ net assets and financial structure
Gross margin/revenue % 33.2 31.0 30.2 32.2 35.0
EBITDA margin before restructuring costs % 7.5 7.5 4.2 5.5 7.8
EBITDA margin % 7.5 7.5 3.4 4.3 7.6
EBIT margin % 3.9 4.6 – 0.4 0.5 3.9
EBT margin % 1.1 1.7 – 2.5 – 2.7 2.4
Equity ratio % 31.1 30.9 26.2 37.4 35.9
Gearing % 116.5 101.9 142.6 68.6 65.2
Key share figures
Number of registered shares shares 105 000 000 118 125 000 118 125 000 945 000 000 945 000 000
Share capital million EUR 261.7 297.6 297.6 378.6 378.6
Earnings per share EUR / CHF 0.63/0.87 0.33/0.41 -1.38/-1.66 -0.26/-0.32 0.05/0.06
Shareholders' equity per share EUR / CHF 6.78/8.48 7.10/8.62 5.29/6.35 0.93/1.14 0.94/1.13
Dividend per share CHF 0.00 0.10 0.00 0.00 0.00
Share price, highest CHF 16.63 12.00 7.80 1.34 1.51
Share price, lowest CHF 6.62 4.81 2.28 0.58 1.00
Share price as at closing date CHF 9.46 5.36 2.86 1.10 1.08
171
S+Bi AG Annual Report 2014
FINANCIAL REPORTING Five-quarter overview
FIVE-QUARTER OVERVIEW
Unit Q4 2013 Q1 2014 Q2 2014 Q3 2014 Q4 2014
Key operational figures
Sales volume kilotonnes 491 581 557 509 488
Order backlog kilotonnes 452 571 539 498 497
Income statement
Revenue million EUR 752.0 871.6 858.0 823.5 785.3
Gross margin million EUR 251.5 296.9 307.3 282.9 280.2
Adjusted EBITDA million EUR 43.0 65.6 73.8 60.0 62.3
Operating profit (loss) before depreciation and amortisation (EBITDA) million EUR 15.1 63.8 72.5 57.1 59.2
Operating profit (loss) (EBIT) million EUR – 16.1 34.0 42.5 25.2 28.9
Earnings before taxes (EBT) million EUR – 48.5 19.0 33.2 16.1 11.4
Net income (loss) (EAT) million EUR – 39.2 12.4 22.8 10.6 4.2
Cash flow/investments/depreciation/amortisation
Cash flow before changes in net working capital million EUR – 1.1 75.9 77.3 49.7 2.8
Cash flow from operations million EUR 96.7 89.9 – 53.6 42.5 99.3
Cash flow from investing activities million EUR – 40.5 – 11.4 – 18.5 – 27.0 – 38.3
Free cash flow million EUR 56.2 78.5 – 72.1 15.5 61.0
Investments million EUR 44.0 12.3 19.3 28.2 41.0
Depreciation and amortisation million EUR 30.0 29.8 30.0 31.9 30.3
Net assets and financial structure
Non-current assets million EUR 984.4 965.5 956.9 975.3 1 006.3
Current assets million EUR 1 393.1 1 478.0 1 566.0 1 577.7 1 503.3
Net working capital million EUR 949.5 935.2 1 068.8 1 085.4 992.3
Total assets million EUR 2 377.5 2 443.5 2 522.9 2 553.0 2 509.6
Shareholders' equity million EUR 889.9 886.1 900.7 910.9 900.9
Non-current liabilities million EUR 733.6 667.1 809.4 855.8 847.7
Current liabilities million EUR 754.0 890.3 812.8 786.3 761.0
Net debt million EUR 610.1 549.2 633.7 627.4 587.2
Employees
Employees as at closing date positions 10 095 10 015 10 018 10 036 10 000
Value management
Capital employed million EUR 1 841.3 1 808.5 1 934.1 1 965.6 1 891.2
Key figures on profit/net assets and financial structure
Gross margin/revenue % 33.4 34.1 35.8 34.4 35.7
EBITDA margin before restructuring costs % 5.7 7.5 8.6 7.3 7.9
EBITDA margin % 2.0 7.3 8.4 6.9 7.5
EBIT margin % – 2.1 3.9 5.0 3.1 3.7
EBT margin % – 6.4 2.2 3.9 2.0 1.5
Equity ratio % 37.4 36.3 35.7 35.7 35.9
Gearing % 68.6 62.0 70.4 68.9 65.2


Financial reportingS + Bi AG
Financial statements
Financial statements of S + Bi AG
Notes to the financial statements
Report of the statutory auditor on the the financial statements
174
176
181
Fina
ncia
l Rep
ortin
g AG

S+Bi AG Annual Report 2014
174 FINANCIAL REPORTING Income statement
INCOME STATEMENT
in million CHF Note 2014 2013
Income from investments 9.0 45.8
Financial income 38.3 51.9
Other income 23.1 18.6
Total income 70.4 116.3
Personnel expense 8.3 12.0
Financial expense 28.5 54.4
Other expense 23.5 34.3
Total expense 60.3 100.7
Net income 10.1 15.6

S+Bi AG Annual Report 2014
175FINANCIAL REPORTING Balance sheet
BALANCE SHEET
in million CHF Note 31.12.2014 31.12.2013
Investments 1 1 126.7 1 126.7
Other financial assets 0.0 0.0
Total non-current assets 1 126.7 1 126.7
Current receivables, Group 473.0 542.3
Current receivables, third parties 2.4 0.2
Accrued income and prepaid expenses, third parties 1.1 1.2
Accrued income and prepaid expenses, Group 0.1 0.2
Securities 8 0.0 0.0
Cash and cash equivalents 0.1 1.8
Total current assets 476.7 545.7
Total assets 1 603.4 1 672.4
Share capital 472.5 472.5
Legal reserves 6.9 6.9
Legal reserves from capital contributions 2 852.8 852.8
Legal reserves for treasury shares 8 0.0 0.0
Retained earnings available for appropriation 169.3 159.2
Total shareholders' equity 1) 1 501.5 1 491.4
Non-current financing, third parties 67.9 117.9
Provisions 1.2 1.2
Total non-current liabilities 69.1 119.1
Current liabilites, third parties 0.3 4.4
Current liabilites, Group 0.4 0.4
Current financing, third parties 10.7 22.3
Current financing, Group 14.1 22.6
Accrued liabilities and deferred income 7.3 12.2
Total current liabilities 32.8 61.9
Total liabilities 101.9 181.0
Total liabilities and shareholders' equity 1 603.4 1 672.4
1) Before appropriation of available earnings.
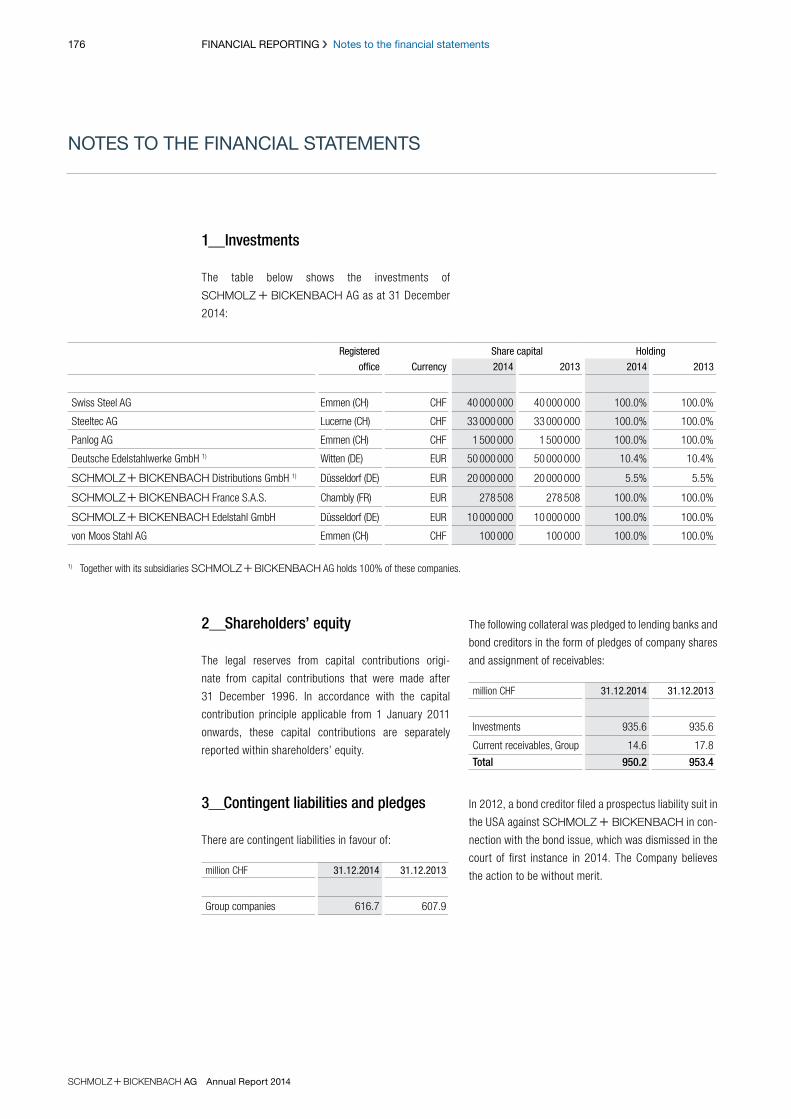
S+Bi AG Annual Report 2014
176 FINANCIAL REPORTING Notes to the financial statements
2_Shareholders’ equity
The legal reserves from capital contributions origi-
nate from capital contributions that were made after
31 December 1996. In accordance with the capital
contribution principle applicable from 1 January 2011
onwards, these capital contributions are separately
reported within shareholders’ equity.
3_Contingent liabilities and pledges
There are contingent liabilities in favour of:
million CHF 31.12.2014 31.12.2013
Group companies 616.7 607.9
The following collateral was pledged to lending banks and
bond creditors in the form of pledges of company shares
and assignment of receivables:
million CHF 31.12.2014 31.12.2013
Investments 935.6 935.6
Current receivables, Group 14.6 17.8
Total 950.2 953.4
In 2012, a bond creditor filed a prospectus liability suit in
the USA against S + Bi in con-
nection with the bond issue, which was dismissed in the
court of first instance in 2014. The Company believes
the action to be without merit.
NOTES TO THE FINANCIAL STATEMENTS
1_Investments
The table below shows the investments of
S + Bi AG as at 31 December
2014:
Registered Share capital Holding
office Currency 2014 2013 2014 2013
Swiss Steel AG Emmen (CH) CHF 40 000 000 40 000 000 100.0% 100.0%
Steeltec AG Lucerne (CH) CHF 33 000 000 33 000 000 100.0% 100.0%
Panlog AG Emmen (CH) CHF 1 500 000 1 500 000 100.0% 100.0%
Deutsche Edelstahlwerke GmbH 1) Witten (DE) EUR 50 000 000 50 000 000 10.4% 10.4%
S+Bi Distributions GmbH 1) Dusseldorf (DE) EUR 20 000 000 20 000 000 5.5% 5.5%
S+Bi France S.A.S. Chambly (FR) EUR 278 508 278 508 100.0% 100.0%
S+Bi Edelstahl GmbH Dusseldorf (DE) EUR 10 000 000 10 000 000 100.0% 100.0%
von Moos Stahl AG Emmen (CH) CHF 100 000 100 000 100.0% 100.0%
1) Together with its subsidiaries S+Bi AG holds 100% of these companies.

S+Bi AG Annual Report 2014
177FINANCIAL REPORTING Notes to the financial statements
4_Significant shareholders
As at 31 December 2014 the Company was aware of the
following shareholders with an interest in voting rights
above the 3% threshold:
Viktor F. Vekselberg holds 25.51% of the shares
indirectly via Venetos Holding AG, included in the
table above. S + Bi GmbH
& Co. KG holds 15.17% of the shares indirectly via
S + Bi Beteiligungs GmbH and
S + Bi Holding AG, all of which
are included in the table above.
S + Bi GmbH & Co. KG and
Venetos Holding AG are parties to a shareholder agree-
ment and are therefore treated as a group by SIX Swiss
Exchange.
31.12.2014 31.12.2013
Shares in percent 1) Shares in percent 1)
Venetos Holding AG 2) 241 087 648 25.51 241 087 648 25.51
S + Bi Beteiligungs GmbH 2) 119 238 168 12.61 19 864 306 2.10
S + Bi Finanz AG 2) – – 84 469 091 8.94
S + Bi Holding AG 2) 24 146 104 2.56 39 050 875 4.13
Total S + Bi GmbH & Co. KG 2) 143 384 272 15.17 143 384 272 15.17
Martin Haefner 2) 64 260 000 6.80 42 500 000 4.50
1) Percentage of shares issued as at 31 December.2) http://www.six-exchange-regulation.com/obligations/disclosure/major_shareholders_en.html
There were changes in the significant shareholders
during the fiscal year. These were reported to the Com-
pany and the Disclosure Office of SIX Exchange AG and
can be viewed on the Internet at: :
http://www.six-exchange-regulation.com/obligations/
disclosure/major_shareholders_en.html

S+Bi AG Annual Report 2014
178 FINANCIAL REPORTING Notes to the financial statements
5_Authorised capital
There was authorised capital of CHF 236 250 000 as at
31 December 2014 (31 December 2013: no authorised
capital).
6_Contingent capital
There was contingent capital of CHF 110 000 000 as at
31 December 2014 (31 December 2013: no contingent
capital).
7_Shareholdings
7.1 Shares owned by members of the Board of
Directors
The following members of the Board of Directors own
shares in S + Bi AG:
7.2 Shares owned by members of the Executive
Committee
The following members of the Executive Committee own
shares in S + Bi AG:
Number of shares Number of options 2)
Board of Directors 31.12.2014 31.12.2013 31.12.2014 31.12.2013
Edwin Eichler (DE)1) Chairman – – 59 032 –
Vladimir V. Kuznetsov (RU)1) Vice-Chairman – – 23 613 –
Michael Buchter (DE)1) Member – – 23 613 –
Marco Musetti (CH)1) Member – – 23 613 –
Dr Heinz Schumacher (DE)1) Member 8 000 8 000 23 613 –
Dr Oliver Thum (DE)1) Member – – 23 613 –
Hans Ziegler (CH)1) Member 40 000 40 000 23 613 –
Total Board of Directors 48 000 48 000 200 710 –
1) Member of the Board of Directors since 26 September 2013.2) Members of the Board of Directors are entitled to share-based payments from the date of the 2014 Annual General Meeting (17 April
2014). These shares had not yet been physically allocated as at 31 December 2014 so are disclosed as options. The actual number of
shares allocated may be smaller due to the effective tax withheld at source.
Number of shares
Executive Committee 31.12.2014 31.12.2013
Hans-Jurgen Wiecha (DE) 1) CFO 201 938 201 938
Bruce Liimatainen 3)
Head Business Unit Finkl / Sorel n.a. 38 000
Dr Martin Löwendick (DE) 2) 3)
Head Business Unit Deutsche Edelstahlwerke n.a. 1 500
Total Executive Committee 201 938 241 438
1) CFO since 1 February 2013, also CEO a.i. from 20 December 2013 to 31 March 2014.2) Since 1 July 2013.3) Business Unit Heads are no longer part of the Executive Committee with effect as at 12 March 2014.
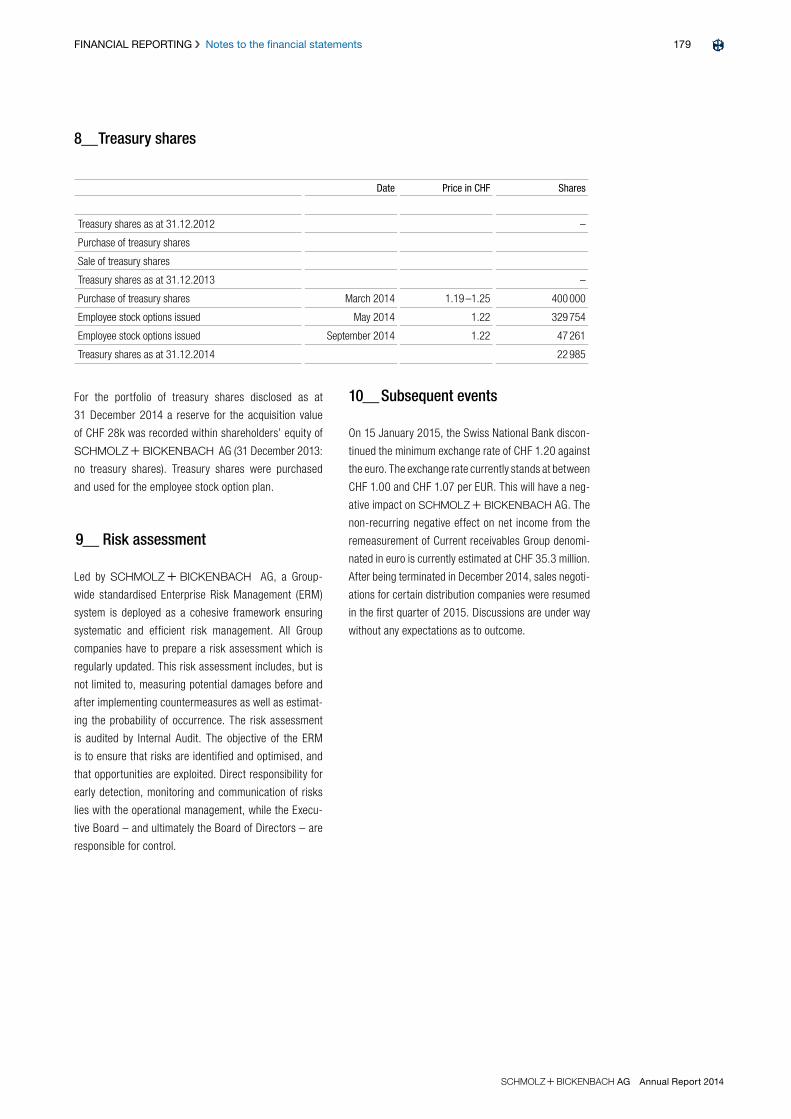
S+Bi AG Annual Report 2014
179FINANCIAL REPORTING Notes to the financial statements
8_Treasury shares
Date Price in CHF Shares
Treasury shares as at 31.12.2012 –
Purchase of treasury shares
Sale of treasury shares
Treasury shares as at 31.12.2013 –
Purchase of treasury shares March 2014 1.19 –1.25 400 000
Employee stock options issued May 2014 1.22 329 754
Employee stock options issued September 2014 1.22 47 261
Treasury shares as at 31.12.2014 22 985
For the portfolio of treasury shares disclosed as at
31 December 2014 a reserve for the acquisition value
of CHF 28k was recorded within shareholders’ equity of
S + Bi AG (31 December 2013:
no treasury shares). Treasury shares were purchased
and used for the employee stock option plan.
9_ Risk assessment
Led by S + Bi AG, a Group-
wide standardised Enterprise Risk Management (ERM)
system is deployed as a cohesive framework ensuring
systematic and efficient risk management. All Group
companies have to prepare a risk assessment which is
regularly updated. This risk assessment includes, but is
not limited to, measuring potential damages before and
after implementing countermeasures as well as estimat-
ing the probability of occurrence. The risk assessment
is audited by Internal Audit. The objective of the ERM
is to ensure that risks are identified and optimised, and
that opportunities are exploited. Direct responsibility for
early detection, monitoring and communication of risks
lies with the operational management, while the Execu-
tive Board – and ultimately the Board of Directors – are
responsible for control.
10_ Subsequent events
On 15 January 2015, the Swiss National Bank discon-
tinued the minimum exchange rate of CHF 1.20 against
the euro. The exchange rate currently stands at between
CHF 1.00 and CHF 1.07 per EUR. This will have a neg-
ative impact on S + Bi AG. The
non-recurring negative effect on net income from the
remeasurement of Current receivables Group denomi-
nated in euro is currently estimated at CHF 35.3 million.
After being terminated in December 2014, sales negoti-
ations for certain distribution companies were resumed
in the first quarter of 2015. Discussions are under way
without any expectations as to outcome.

S+Bi AG Annual Report 2014
180 FINANCIAL REPORTING Proposed appropriation of available earnings
PROPOSED APPROPRIATON OF AVAILABLE EARNINGS
At the General Meeting on 15 April 2015, the Board
of Directors will present the following proposal for the
appropriation of available earnings:
in million CHF 2014 2013
Balance carried forward 159.2 143.6
Allocation to reserve for treasury shares 0.0
Balance carried forward after allocation 159.2 143.6
Net income 10.1 15.6
Retained earnings available for appropriation 169.3 159.2
Dividend distribution 0.0 0.0
Balance to be carried forward 169.3 159.2
S+Bi AG Annual Report 2014
181FINANCIAL REPORTING Report of the statutory auditor
Report of the statutory auditor with financial statements as of 31 December 2014 of
s + bi AG, Emmen
To the General Meeting of S + Bi AG, Emmen
Zurich, 11 March 2015
Report of the statutory auditor on the financial statements
As statutory auditor, we have audited the accompanying financial statements of S + Bi AG, which comprise the income
statement, balance sheet and notes (pages 174 to 180), for the year ended 31 December 2014.
Board of Directors’ responsibility
The Board of Directors is responsible for the preparation of the financial statements in accordance with the requirements of Swiss law and the Com-
pany’s articles of incorporation. This responsibility includes designing, implementing and maintaining an internal control system relevant to the prepa-
ration of financial statements that are free from material misstatement, whether due to fraud or error. The Board of Directors is further responsible for
selecting and applying appropriate accounting policies and making accounting estimates that are reasonable in the circumstances.
Auditor’s responsibility
Our responsibility is to express an opinion on these financial statements based on our audit. We conducted our audit in accordance with Swiss law
and Swiss Auditing Standards. Those standards require that we plan and perform the audit to obtain reasonable assurance whether the financial
statements are free from material misstatement.
An audit involves performing procedures to obtain audit evidence about the amounts and disclosures in the financial statements. The procedures
selected depend on the auditor’s judgment, including the assessment of the risks of material misstatement of the financial statements, whether
due to fraud or error. In making those risk assessments, the auditor considers the internal control system relevant to the entity’s preparation of the
financial statements in order to design audit procedures that are appropriate in the circumstances, but not for the purpose of expressing an opinion
on the effectiveness of the entity’s internal control system. An audit also includes evaluating the appropriateness of the accounting policies used
and the reasonableness of accounting estimates made, as well as evaluating the overall presentation of the financial statements. We believe that
the audit evidence we have obtained is sufficient and appropriate to provide a basis for our audit opinion.
Opinion
In our opinion, the financial statements for the year ended 31 December 2014 comply with Swiss law and the Company’s articles of incorporation.
Report on other legal requirements
We confirm that we meet the legal requirements on licensing according to the Auditor Oversight Act (AOA) and independence (article 728 CO and
article 11 AOA) and that there are no circumstances incompatible with our independence.
In accordance with article 728a paragraph 1 item 3 CO and Swiss Auditing Standard 890, we confirm that an internal control system exists, which
has been designed for the preparation of financial statements according to the instructions of the Board of Directors.
We further confirm that the proposed appropriation of available earnings complies with Swiss law and the company’s articles of incorporation. We
recommend that the financial statements submitted to you be approved.
Ernst & Young Ltd
Roland Ruprecht Beat Rölli
Licensed audit expert (Auditor in charge) Licensed audit expert
182
S+Bi AG Annual Report 2014
GLOSSARY
A_
Adjusted EBITDA EBITDA before non-recurring expenses
(in 2013 and 2014 e.g. restructuring costs and income from
the release of restructuring provisions, expenses for the
development and roll-out of our new strategy, expenses in
connection with the search for investors, litigation and mea-
sures to reduce debt, payments for terminating or amending
contracts with the Executive Board)
Adjusted EBITDA margin (%) Ratio of adjusted EBITDA
to revenue
C_
Capital Employed Net working capital plus intangible
assets (excl. goodwill) plus property, plant and equipment
Cash flow before changes in net working capital
Cash flow from operations without changes in net working
capital
E_
EAT Earnings after taxes
EBT Ergebnis vor Steuern (Earnings before taxes)
EBIT Earnings before interest and taxes
EBITDA Earnings before interest, taxes, depreciation
and amortisation
EBITDA leverage Ratio of net debt to adjusted EBITDA
EBITDA margin (%) Ratio of EBITDA to revenue
Equity ratio Ratio of shareholders’ equity to total assets
F_
Free cash flow Cash flow from operations plus cash
flow from investing activities
G_
Gearing Ratio of net debt to shareholders’ equity
Gross margin Revenue plus change in semi-finished
and finished goods less cost of materials
Gross margin (%) Ratio of gross margin to revenue
I_
Investment ratio Ratio of investments to depreciation/
amortisation
N_
Net financial expense Financial expense less financial
income
Net debt Current and non-current financial liabilities
less cash and cash equivalents
Net working capital Inventories plus trade accounts
receivable less trade accounts payable
O_
Operating free cash flow Adjusted EBITDA plus/less
change in inventories, trade accounts receivable
and trade accounts payable less segment investments
less borrowing costs.
R_
ROCE Return on Capital Employed
FINANCIAL REPORTING Glossary

183
S+Bi AG Annual Report 2014
LIST OF ABBREVIATIONS
a.i. ad interim
ABCP Asset Backed Commercial Paper
CEO Chief Executive Officer
CFO Chief Financial Officer
CGU Cash Generating Unit
CHF Swiss franc
CO Swiss Code of Obligations
COO Chief Operating Officer
ERM Enterprise Risk Management
EUR Euro
IAS International Accounting Standards
IASB International Accounting Standards Board
IFRIC International Financial Reporting Interpretations
Committee
IFRS International Financial Reporting Standards
KfW Kreditanstalt fur Wiederaufbau (Development Loan
Corporation)
kg kilogramme
Kt kilotonne
m³ cubic metre
m³ p.a. cubic metres per year
mg milligramme
mm millimetre
p.a. per year
R&D Research & Development
SPI Swiss Performance Index
t tonne
t p.a. tonnes per year
USD US dollar
VegüV Swiss Ordinance against Excessive
Compensation
FINANCIAL REPORTING List of abbreviations
184
S+Bi AG Annual Report 2014
LEGAL NOTICE
LEGAL NOTICE
S + Bi AG
Switzerland
Emmenweidstrasse 90
CH-6020 Emmenbrücke
Phone +41 (0) 41 209 5000
Fax +41 (0) 41 209 5104
Germany
Eupener Str. 70
D-40549 Düsseldorf
Phone +49 (0) 211 5090
Fax +49 (0) 211 2594
www.schmolz-bickenbach.com
Every care has been taken to ensure that we do not exclude
either gender in this annual report.
This annual report contains forward-looking statements,
including presentations of developments, plans, inten-
tions, assumptions, expectations, beliefs and potential
impacts as well as descriptions of future events, income,
results, situations or outlook. They are based on the Com-
pany’s current expectations, beliefs and assumptions,
which are subject to uncertainty and may differ materially
from the current facts, situation, impact or developments.
This company brochure is also available in German.
The German version is binding.

Images
Images on pages 27, 28, 29, 83 left:
Andreas Mader, Winterthur
Images on pages inside cover, 15, 17, 21: istock.
On page 14: Getty images.
Page 7 – 13, 22 – 24 (Camera icons): Fotolia.
Remaining images: S + BI
Product images by Friedrich Münch, pages 7 – 13
Friedrich Münch GmbH + Co KG
In den Waldaeckern 10 | D-75417 Mühlacker
www.friedrich-muench.de
Concept, design and production
HGB Hamburger Geschäftsberichte GmbH & Co. KG
Rentzelstr. 10a | D-20146 Hamburg
www.hgb.de
Editorial system and printing
Hartung Druck + Medien GmbH (printing)
Asbrookdamm 38 | D-22115 Hamburg
Multimedia Solutions AG (editorial system)
Dorfstrasse 29 | CH-8037 Zurich
Printed on chlorine-free bleached paper.
Urkunde
klimaneutral
Dieses Zertifikat bescheinigt dieKompensation von Treibhausgasendurch zusätzliche Klimaschutz-maßnahmen in Höhe von
CO2-ÄQUIVALENTEN
151 kg
UNTERSTÜTZTES PROJEKT
Waldschutz, Oberallmig, Schweiz
VERLIEHEN AN
Schmolz & BickenbachEmmenweidstrasse 906020 Emmenbrücke
AUFTRAG
Vorabauflage GB 2014
DATUM
03.03.2015
ClimatePartner-ID: 53047-1503-1001www.climatepartner.com

SCHMOLZ + BICKENBACH AG
www.schmolz-bickenbach.com
SC
HM
OLZ
+ B
ICK
EN
BA
CH
ANN
UAL
REPO
RT 2
014