annual report 2012 - hypo noe
TRANSCRIPT

125 years of quality
ANNUAL REPORT 2012


HYPO NOE GROUP ANNUAL REPORT 2012 | 3
GROUP fiNANciAL HiGHLiGHTs
EUR ’000 2012 2011
IFRS consolidated income statement
Net interest income 135,371 138,795
credit provisions -21,157 -20,125
Net fee and commission income 11,985 12,439
Net trading income -804 -900
General administrative expenses -106,965 -94,240
Net other operating income 17,199 20,076
Net gains or losses on financial assets -5,403 62,574
Profit before tax 30,226 118,619
income tax expense -7,418 -29,105
Profit for the year 22,808 89,514
Non-controlling interests -37 -46
Profit attributable to owners of the parent 22,771 89,468
IFRS consolidated statement of financial position
Total assets 14,861,697 13,233,058
Loans and advances to customers 10,735,077 9,702,478
financial assets 1,840,271 1,856,771
Deposits from customers 2,254,455 2,473,410
Debts evidenced by certificates 7,911,349 6,831,752
Consolidated regulatory capital resources (as defined by the Austrian Banking Act)
Eligible core capital 505,457 486,265
supplementary capital (tier 2 and tier 3) 165,000 205,000
Eligible capital under section 23 Austrian Banking Act 668,463 689,401
Assessment base under section 22(2) Austrian Banking Act 4,099,035 3,668,983
surplus capital 317,381 373,904
core capital ratio 12.33% 13.25%
Equity ratio 16.31% 18.79%
Operational information
Average number of employees 894 658
Number of employees at end of year 917 670
Number of branches 29 28

sTRONGER TOGETHER
One core market with many regions: Lower Austria and Vienna
One bank with a tradition of success: HYPO NOE Group

AnnuAl RepoRt
Statement by the SuperviSory board 7
Statement by the management board 8
our philoSophy
the HYpo noe Group’s responsibilities 11
the HYpo noe Gruppe Bank mission statement 12
Business and ethical principles 14
personal relationship banking 15
Code of conduct 16
125th anniversary HYpo niederösterreich 18
HYpo Invest Club: top speakers, hot topics, high-profile guests 30
group Strategy
Danube region strategy 35
our core business and expertise 36
Fully integrated real estate value chain for one-stop services 37
expert panel discussion: a vision for the Danube region 38
the eu Danube Region Strategy – Guest contribution by eu Commissioner Johannes Hahn 44
economic development in the Danube region – an overview 46
hypo noe in itS core market
lower Austria and Vienna – the heart of Austria 51
the HYpo noe Group’s contribution to lower Austria and Vienna 55
Group partnerships 60
HYpo noe landesbank – 29 local branches 62
group operational and Financial revieW
economic climate 68
Financial review 78
operational review 80
Human resources management 90
Risk report 92
Internal control and risk management system (ICS) 112
Research and development 115
Communications 116
Group outlook for 2013 117
events after the reporting period 118
conSolidated Financial StatementS For the year ended 31 december 2012 according to iFrS 119
noteS to the conSolidated Financial StatementS and governing bodieS 125
declaration by the company’S legal repreSentativeS 217
auditorS’ report 218
report oF the SuperviSory board 221


HYpo noe GRoup AnnuAl RepoRt 2012 | 7
StAtement BY tHe SupeRVISoRY BoARD
2012 was a successful year for the HYpo noe Group. the Supervisory Board fulfilled its responsibilites as set out by law, supervising the management Board and providing it with advice on the management of the Group, and was involved in all decisions of fundamental importance. We were kept informed in detail and in a timely manner of all financial and commercial developments in the HYpo noe Group at regular meetings.
this enabled the Supervisory Board to gain a full picture of the Group’s effective strategic positioning of itself and its product portfolio, with its strong regional focus on lower Austria and Vienna, and selective approach to the rest of Austria and the Danube region.
the main highlight of 2012 was the expansion of the real estate business model through the purchase of first facility GmbH, renamed HYpo noe First Facility GmbH after the takeover. this acquisition will contribute to the future growth and stability of the Group as a whole.
We were also able to satisfy ourselves that the risk management system in place at HYpo noe Gruppe Bank AG and the main subsidiaries is very well designed.
the Supervisory Board is pleased to report that both strategically and operationally, the Group made good progress in 2012, and its business policies are in line with its mission as a regional bank owned by the state of lower Austria.
burkhard hofer Chairman of the Supervisory Board
Burkhard Hofer Chairman of the Supervisory Board

8 | StAtement BY tHe mAnAGement BoARD
StAtement BY tHe mAnAGement BoARD
125 years of reliability, trust, excellence and tradition
For the eurozone banking sector, including the financial industries of Central and eastern europe (Cee), 2012 was strongly coloured by the obdurate sovereign debt crisis – though this ultimately eased somewhat – and related money market interven-tion by the european Central Bank, as well as Basel III and overall economic trends.
Despite the troubled international financial and economic environment, the HYpo noe Group again returned a solid profit in 2012. At euR 22.8 million (m), the profit for the year was above the level of the past few years – with the exception of 2011, when a one-time effect in the shape of the disposal of our interest in Raiffeisen Zentralbank led to an exceptionally high figure. total assets were up by over euR 1.6 billion (bn) or 12% year on year, to euR 14.9bn as at year-end 2012. this was largely due to growth in loans and advances to customers and banks. Consolidated equity also remained at high levels, and well above the Basel III requirements, with a core capital ratio of 12.3% (2011: 13.3%) and an equity ratio of 16.3% (2011: 18.8%).
identifying and managing risk
operational and strategic risk management is extremely important to the HYpo noe Group, since achieving commercial sucess is inextricably linked to risk. Controlling the risk inherent in earnings opportunities is central to our customer business. the Group wishes to compete on the basis of the quality of its products and customer service, and not aggressive pricing.
Active credit portfolio management is a high priority at the HYpo noe Group. Due to the crisis in the eurozone peripherals and Hungary, we continued to watch develop-ments in these countries very closely in 2012. During the reporting period the Group adhered to its policy of selectively reducing risk in these markets.
the Group is working proactively to meet the challenges presented by changes in banking regulation and oversight. our medium-term planning has been designed to meet all of the new capital, liquidity, legal and reporting requirements in good time.
a full range of services under one strong roof
Besides the good financial performance, 2012 will be remembered for the drive to increase the Group’s cohesion. For example, we opened our new Group new head-quarters building at Hypogasse 1, St. pölten during the autumn – on schedule and on budget.
nikolai de Arnoldi member of the management Board
peter Harold Chairman of the management Board

HYpo noe GRoup AnnuAl RepoRt 2012 | 9
Besides real estate finance from the HYpo noe Gruppe Bank, we were already able to offer project development, project management, property management and estate agency services through our HYpo noe Real Consult subsidiary, but until last year we were missing the final link in the real estate value chain that would allow us to be involved in the entire property life cycle. Following the acquisition of our new subsidiary HYpo noe First Facility, since summer 2012 we can offer full line real estate services.
Fit and flexible
the Group-wide Fit for Future project, initiated in 2011, became firmly anchored in 2012. this innovation programme involves a strong customer focus, streamlined in-ternal processes and increased support for our sales efforts. the common objective of all these strands is improving the Group’s cost-benefit structure.
2013 – a jubilee year
In 2013, the HYpo noe Group is celebrating the 125th anniversary of the founda-tion of HYpo niederösterreich. throughout the year HYpo noe landesbank will be offering special promotions aimed at our loyal customers – and prospective clients. We would like to take this opportunity to thank our investors and customers for the faith they have placed in us over the last 125 years. We can assure all of you that the HYpo noe Group will continue to do all in its power to be a dependable partner in all financial matters, and will remain true to its traditional values: reliability, trust and excellence.
dr. peter harold mag. nikolai de arnoldi Chairman of the management Board member of the management Board Ceo, HYpo noe Gruppe Bank AG CRo/CFo, HYpo noe Gruppe Bank AG


HYpo noe GRoup AnnuAl RepoRt 2012 | 11
As an Austrian bank with an outstanding reputation, we have a responsibility to consistently deliver excellent performance – in our relationships with our customers, our business partners and regulators.
Business relationships only work if they are founded on trust. this is especially true when it comes to banks, and the money and information entrusted to them. the HYpo noe Group lives up to this responsibility at all times, and sets itself extremely high standards which are encapsulat-ed in:
�the HYpo noe Gruppe Bank’s mission statement �our business and ethical principles �personal relationship banking �our code of conduct
ouR philoSophytHe HYpo noe GRoup’S ReSponSIBIlItIeS

12 | ouR pHIloSopHY
tHe HYpo noe GRuppe BAnk mISSIon StAtement
the mission statement summarises our Group philosophy.
Internally, the formulation of a corporate mission state-ment for the HYpo noe Group has created a guide that staff can refer to in their daily work, providing constant ori-entation and motivation. externally, the statement commu-nicates to customers and the general public what the HYpo noe Group stands for, and the organisational culture that the lower Austrian state bank strives for.
the guiding principles state that:
We are the regional bank for lower austria.
As a regional bank that is wholly owned by the state of lower Austria, we make an important contribution to the economic devlopment of the province – to growth, progress and innovation. We have the know-how and experience to provide financial solutions of the highest quality to local au-thorities and other public sector bodies, as well as to busi-nesses and retail customers in lower Austria, Vienna and across the Danube region. Another staple business is real estate services, where we focus on the entire value chain. However, our commitment to the region is not limited to our business segments – it includes our sponsoring activities and support for social initiatives, culture and sport.
our success is rooted in traditional values and durability.
the roots of the HYpo noe Group in lower Austria go back to 1888. Support for projects that are consonant with our values is an article of faith. our business model is conser-vative and focused on sustainable growth. thanks to our long experience we know what we are talking about, and provide advice in the areas where our expertise lies.
We value reliability and stability.
We take pride in the faith placed in us by our customers. Safe, stable investments are a cornerstone of our business. We cultivate risk awareness and work for sustainable cor-porate earnings, expanding our services and capacity step by step. this approach is the hallmark of our treatment of our customers as well as our relationships with our staff. It
enables us to look back with pride on 125 years as a stable banking partner and employer – and the experience and trust that go with them.
closeness to customers is at the heart of everything we do.
the customer is at the centre of all our efforts. our tradi-tional headquarters location in St. pölten puts us on the customer’s doorstep, in line with our claim to be “the Bank at your side.” We work for our customers’ future in growth markets, developing bespoke solutions. our customer rela-tionships are based on sustainability, dependability, quality and trust. the Group’s versatility means that we can pro-vide customers with excellent advice in a wide variety of areas.
our people are the key to our success.
Staff who are committed to high quality and performance underpin our success. mutual respect and teamwork create a constructive climate, in which we are all equal partners. A functional organisation chart and clear lines of communi-cation allow us to respond rapidly to changes in the operat-ing environment. efficiency is maximised by a high degree of creativity, flexibility and personal responsibility. our peo-ple make the Group a centre of excellence. entrepeneurial thinking combined with social responsibility informs all of our activities. Staff are able to make decisions in the roles assigned to them. Staff training is a high priority, and to this end our people are given frequent opportunities to develop professionally and personally. this is the lifeblood of our pursuit of excellence.
We take our responsibilities to our region seriously.
In line with our role as the lower Austrian state bank and a flagship of lower Austrian enterprise, we make sure we give something back to our home region. We are committed to sustainable business practices. And beyond our banking business, too, we want to be a reliable partner to the region and its people, as well as to the institutions and associa-tions that are involved in shaping the future of the state of lower Austria. We give a helping hand to the people in our

HYpo noe GRoup AnnuAl RepoRt 2012 | 13
core market, through marketing partnerships, sponsorship and other forms of support. together with them, we take the lead on intiatives that we believe we will be proud of in
future, lending strong support for our owner’s vision and actively promoting the development of the Danube region.

14 | ouR pHIloSopHY
BuSIneSS AnD etHICAl pRInCIpleS
Customer needs are central to everything the HYpo noe Group does. A detailed knowledge of our target groups’ business activities is vital to identifying the Bank’s risk ex-posures and those of its customers, and to developing opti-mum lending structures.
Across the entire Group, we expect particular care to be exercised with regard to the following types of lending, and in case of doubt we refrain from engaging in the banking relationships concerned.
�Finance for transactions or investments that pose a po-tential threat to the environment (e.g. nuclear power);
�Finance for arms trading; �Finance for businesses involved in prostitution; �Finance for countries engaged in armed conflicts (as de-fined in the oekB country list); �Finance for the betting and gaming industry.
Reputational risks are particularly likely to arise in connec-tion with borrowers operating in industries that are incom-patible with the image and values of the HYpo noe Group and its owner, the lower Austrian state government. Here, too, increased vigilance is required, and where necessary the Group refuses to engage in banking relationships.

HYpo noe GRoup AnnuAl RepoRt 2012 | 15
peRSonAl RelAtIonSHIp BAnkInG
one of the HYpo noe Group’s core objectives is to estab-lish close relationships with banking customers, founded on trust. these relationships consist of much more than just administrating accounts. our aim is to gain a complete un-derstanding our customers’ needs, so that we can work with them to develop solutions and offer them ideal products.
personal relationship banking is a recurrent theme in the Group’s activities, connecting all of them. many projects have only been possible because we have focused our en-ergies on understanding the customer’s business model in detail, and on gaining an accurate assessment of the risk involved, in the customer’s interests.
We follow these principles in both our business and retail banking relationships. Retail customers particularly value
personal service, and this is often reflected by relationships based on reliability and trust.
Closeness to the customer and the human factor mean that we can be there for customers when the going gets tough, working out solutions with them if they face critical situations. Because of the trust we have steadily built up over the years, and the understanding we have of our cus-tomers’ activities, they can rely on us to stand shoulder to shoulder with them in testing times.
this approach is the main factor behind the positive earn-ings contributions delivered by our various areas of busi-ness – success that would not be possible without close personal relationships with customers, and that vindicates our way of doing business.

16 | ouR pHIloSopHY
CoDe oF ConDuCt
the Group’s code of conduct serves as a guide for meet-ing all of the challenges we face. It helps us live out our commitment to reconciling excellent business performance with the highest ethical standards.
our behaviour in the marketplacethe hypo noe group distinguishes itself by delivering outstanding performance whilst competing fairly.
the Group is committed to the principles of a market econ-omy and to upholding the corresponding laws, regulations and standards, including applicable cartel and competi-tion law. our dealings with customers, business partners, competitors, suppliers, the general public and colleagues must always be characterised by honesty, professionalism and fairness. Information about our competitors is only ac-quired by legal and ethically unimpeachable means. We do not seek to gain competitive advantage by unfair business practices such as misrepresentation, manipulation or con-cealment of information: the first consideration is always ethical and fair conduct.
our conduct toWardS cuStomerSthe hypo noe group aims to build and maintain long-term relationships with customers based on trust.
our customers’ needs and their trust in us always come first. We strive to identify and meet their requirements and expectations. the Group’s interests must therefore always be reconciled with external demands, in a spirit of partner-ship. We are committed to professionalism, fairness and dis-cretion in our dealings with customers. our decision-mak-ing processes and behaviour are shaped by our legal and ethical responsibilities to the customer. the Group acts in the best interests of all customers, without giving prefer-ence to particular clients or client groups. personal finan-cial interests, friendships and family ties cannot be allowed to have any influence on our work. We take care of money entrusted to us in full awareness of the responsibility this involves; its security is a matter of the highest importance to us as well as an obligation to our customers.
the Group maintains the highest standards with regard to data security. Safeguarding customer confidentiality is a top priority. Information is a key factor in our success and that of our customers. We handle all information entrust-ed to us by our customers in the strictest confidence, and only disclose such information when authorised to do so by the customer. the only exception to this is disclosure of information to comply with legal or regulatory require-ments (see the Austrian Banking Act as amended). Intern-ally, all information is treated with the appropriate level of discretion and confidentiality. We take all due care in the acceptance, processing and storage of data. the Group has implemented all of the data security standards and pro-cesses required to prevent unauthorised access to and use, modification or destruction of information.
our conduct toWardS StakeholderSWhen making public announcements, the hypo noe group undertakes to provide information that is as up-to-date, accurate and clearly presented as possible, in a manner that is timely and accessible to the general public, without favouring individual stakeholders.
the Group’s financial reporting is in line with best practice and the applicable accounting, legal and regulatory re-quirements. Disclosures regarding risks in the consolidated financial statements are arrived at using the Group’s inter-nal risk management and risk information systems, and in conformity with the applicable accounting standards. In line with its reporting, legal and regulatory obligations, the Group is committed to prompt, precise and comprehensive communications with all of its stakeholders, and to conti-nuously providing them with clear, accurate and up-to-date information. Such communications are not limited to infor-mation about our products and services, but comprise all areas of our business, and especially all publications as well as any crisis pR. We respond to questions and suggestions from stakeholders promptly, and nurture open dialogue with them, based on fairness, professionalism, integrity and respect.

HYpo noe GRoup AnnuAl RepoRt 2012 | 17
the hypo noe group undertakes to handle inside in-formation ethically and with all due care.
the Group is scrupulous in its efforts to identify un disclosed material information – otherwise known as inside informa-tion. Inside information is only made available to persons within or outside the Group in strict accordance with our internal rules, the applicable laws and regulations, and the
requirements imposed by Chinese walls. Sensitive and con-fidential information is shared exclusively with authorised parties, and only to the extent required for the diligent, responsible execution of tasks, actions and decisions. the Group is determined to avoid any conflicts of interest that may arise in the course of business, and where this is not possible to identify them, impose mandatory controls on them and keep them to an absolute minimum.

18 | 125TH ANNIVERSARY HYPO NIEDERÖSTERREICH
Giving agricultural communities access to credit has been the core objective of the Landeshypothek-enanstalt für Niederösterreich since its incorporation. A traditional Streckhof farmhouse in Marchfeld, 1925.

HYPO NOE GROUP ANNUAL REPORT 2012 | 19
125th anniversary HYPO NIEDERÖSTERREICHA LONG TRACk RECORD Of SUCCESS wORkING fOR THE STATE Of LOwER AUSTRIA, ITS ECONOMY AND ITS PEOPLE fOR OVER A CENTURY
The early 19th century saw the emergence of mortgage banks known as Bodenkreditinstitute in Germany, Bohemia, Moravia and Silesia. They were set up by provincial and national gov-ernments, which assumed liability for loans extended to agricultural enterprises, mortgages granted on municipal land and funding provided to local authorities. Politicians in the Lower Austrian parliament first voiced their support for establishing such an institution in the state in 1824, but it took another sixty years before the process was finally set in motion. A resolu-tion adopted by the state parliament in 1888 laid the groundwork for a bank that is still go-ing strong to this day. Landeshypothekenanstalt für Niederösterreich, the first institution of its kind in modern-day Austria and a vital precursor for the incorporation of other mortgage banks, opened for business in summer 1889.

20 | 125TH ANNIVERSARY HYPO NIEDERÖSTERREICH
abolishing peasant servitude
The formation of the Landeshypothekenanstalten is closely related to the peasant emancipation of 1848. with the ab-olition of manoralism, farmers were able to run their own businesses, al-though they also lost their claims to support from their landlord. The newly liberated farmers increas-ingly abandoned barter in favour of participation in the monetary economy. The advent of free trade in land, the di-visibility of agricultural property, and inheritance payouts, as well as the need for investment meant that money and lending played an increasingly important part in farmers’ lives, especially in Lower Austria.
a booming imperial heartland
Landeshypothekenanstalt’s base in Vienna – the financial capital of the Habsburg empire and seat of the monarchy – was a catalyst for the bank’s growth, and it quickly be-came a leading mortgage lender, as well as the model for similar institutions in Carinthia, Salzburg, Tyrol and Upper Austria. Although agricultural lending was the main priori-ty, the bank’s first managing director, Josef Ritter von Hat-tingberg, had the population of Vienna firmly in his sights. Unlike in Germany, where separate mortgage banks sprang up for rural and urban residents, the strategy of Landeshy-pothekenanstalt für Niederösterreich centred on a combi-nation of the two. Extending mortgages secured against properties in the city and the countryside quickly created a broad lending base – and paved the way for the bank’s future success.
Founding principles
Throughout its history, the ethos of Landeshypothekenan-stalt has been shaped by two key principles: not-for-profit operations and the guardianship of the state of Lower Aus-tria. By issuing covered bonds, the bank was able to raise capital and then lend it on to customers on identical terms, giving them access to low-cost financing. In return, borrow-ers were only obliged to pay a half-yearly lump-sum annuity and to make a small contribution to the bank’s overheads and reserves.
Detailed regulations designed to underpin the bank’s sta-bility and its economic objectives were included in the stat-utes. The total value of the covered bonds issued by the bank was not permitted to exceed that of the mortgages it
extended, and all of the bank’s assets could be used to fund covered bond interest and principal payments.
In contrast to public limited companies, Landeshypothek-enanstalt für Niederösterreich was not compelled to raise share capital, thanks to the guarantee provided by the state government. As a result of this guarantee, since its incor-poration the bank has had close ties to the Lower Austrian government. Besides providing administrative support, the state of Lower Austria also assumed an important supervi-sory role, making it in integral part of the bank’s operations from day one.
1889 following in-depth preparatory work, Landeshypothekenanstalt für Niederösterreich opens on 1 July in offices at the seat of the Lower Austrian state administration
1884 A new, more urgent motion gives rise to a committee charged with examining in detail the potential founding of a state mortgage bank
1824 Initial calls for the establishment of a Lower Austrian mortgage bank
1863 Second motion in the Lower Austrian parliament proposing the incorporation of a mort-gage bank in the state
1888 On 29 September, the Lower Aus-trian parliament passes a resolution founding Landeshypothekenanstalt für Niederösterreich

HYPO NOE GROUP ANNUAL REPORT 2012 | 21
Dissolution, re-establishment and amendments to the statutes
The foundation of the first Republic had a direct impact on Landeshypothekenanstalt. The former crown land of Lower Austria was divided into the autonomous provinces of Low-er Austria and Vienna. following the abolition of its main guarantor, Landeshypothekenanstalt für Niederösterreich was wound up on 1 January 1922 after 33 years in opera-tion. Convinced that its own mortgage bank was an essen-tial part of the newly founded province, the Lower Austrian parliament voted on 22 March 1922 to establish a succes-sor institution, Landes-Hypothekenanstalt für Niederöst-erreich. The new bank adopted its predecessor’s statutes, but in a significantly expanded form. The new Landes-Hy-pothekenanstalt was permitted to accept current account deposits, and the bank was empowered to collect savings deposits from 1925. This supply of funds was vital during the economic upheaval of the 1920s. The ability to extend bank loans made up to some extent for the initial difficulty faced by the bank in finding a market for its covered bond issues. The Schilling Conversion Act (Schillingsrechnungs-gesetz) passed in December 1924 prompted the resurgence of the currency, and Landes-Hypothekenanstalt resumed its core activity of issuing covered bonds the following year.
The bank’s rapid growth was also reflected in the fact that its offices in Herrengasse in Vienna soon became too small. At first, space was rented for the cashiers and the account-ing department in a property opposite, before all of the bank’s operations were relocated to the newly acquired headquarters at wipplingerstrasse 2, on a prominent site at the corner of Hoher Markt. The move also triggered the establishment of a branch network. The rental property in Herrengasse became the bank’s first branch, followed in 1929 – the year in which the Great Depression took hold – by locations on Mariahilfer Strasse and at Althanplatz. In 1928 the bank was instrumental in the founding of Landes-Hy-pothekenbank für das Burgenland, which operated at its own risk, but was under the management of a dedicated board of trustees consisting of members of the Landes-Hy-pothekenbank für Niederösterreich management board.
the 1920s and 1930s: modernisation
The enactment of the Housing Subsidies Act (Wohn-bauförderungsgesetz) in 1929 was a shot in the arm for Landes-Hypothekenbank für Niederösterreich. within a few years the bank had extended mortgages for the construc-tion of around 1,000 new residential properties. This surge
in the bank’s growth was so significant that for the first time in its history urban borrowers outnumbered rural cus-tomers. However, the institution remained a vital partner for farmers. Mortgages helped agricultural businesses get to grips with matters such as retirement and inheritance payouts, as well as operational tasks including irrigation, drainage, and purchasing fodder and seed. The Provincial Chamber of Agriculture threw its weight behind the pro-vision of viniculture loans – a key investment in the Lower Austrian winemaking industry. Lending to local authorities grew in importance during the 1920s and 1930s, and the bank’s borrowers included the Austrian and Lower Austrian governments, the City of Vienna and various Lower Aus-trian municipalities. As a result, Landes-Hypothekenbank für Niederösterreich played an essential part in the Lower Austrian government’s infrastructure modernisation pro-gramme. The bank funded the construction of poorhouses,

22 | 125TH ANNIVERSARY HYPO NIEDERÖSTERREICH

HYPO NOE GROUP ANNUAL REPORT 2012 | 23
orphanages, hospitals, schools, residential facilities, water pipes, public baths and electricity generating plants, while long-term loans went towards the building and upkeep of roads, bridges and railways.
the national socialist era
Shortly after Austria was annexed by Germany in 1938, its legal system was harmonised with that of the German Reich. As a vital source of support for agricultural business-es, Landes-Hypothekenanstalt für Niederösterreich was se-verely affected by the Hereditary Estate Act (Erbhofgesetz), which came into force in August 1938. The Act made herita-ble farms unmortgageable and unsaleable, temporarily rob-bing the bank of an important customer group. In addition, the National Socialist government’s plans to revive residen-tial construction were dashed by the outbreak of world war II. Virtually the only option open to the bank was to finance the construction of housing for armament factory workers and employees. In 1939 Burgenland lost its status as an in-dependent administrative unit and the northern and cen-tral parts of the province were integrated into the Nieder-donau administrative division (or Gau). As a result, an order was enacted that transferred Landes-Hypothekenanstalt für das Burgenland to Landes-Hypothekenanstalt für Nied-erdonau by way of universal succession, which significantly expanded the latter’s loan book. This move can partly be traced back to the fact that the two banks had been man-aged jointly since 1928, and that Landes-Hypothekenan-stalt für Niederösterreich had played a major part in setting
up its counterpart in Burgenland. Burgenland regained its status as an independent federal state in 1945, and after that time, Landes-Hypothekenanstalt für Niederösterreich maintained its close ties with the Burgenland lender in the course of the re-establishment of Landes-Hypothekenan-stalt für das Burgenland. However, with the Second world war still raging, many Landes-Hypothekenanstalt für Nied-erösterreich employees were drafted into the armed forc-es and replacements filled the resulting vacancies at the bank. And even the wipplingerstrasse headquarters did not
From mortgage bank to universal bankIn the course of its history, the bank’s name has been slightly changed a number of times. The present-day HYPO NOE Group was founded as Landeshypothekenanstalt für Niederösterreich, purely as a mortgage lender and issuer. It was mainly involved in selling covered and municipal bonds. The move towards becoming a universal bank dates back to 1922, as the bank’s statutes were amended as part of its re-establishment. The company retained the name Landes-Hypothekenanstalt für Niederösterreich until 1974. After 1945, the bank’s structure and services increasingly came to resemble those of a universal institution, as reflected in the name changes since 1974, which saw the first occurrence of the word “bank” in the company name. Although still formally known as Landes-Hypothekenbank Nied-erösterreich, NÖ Hypo-Bank became the moniker of choice in the bank’s advertising and logo from 1980 onwards. The bank’s transformation into a public limited company in 1992 saw the company christened Niederösterreichische Landesbank-Hypothekenbank AG, and this was followed 15 years later by the separation into HYPO Investmentbank AG and HYPO Landesbank. In 2010, HYPO NOE Gruppe came into being, with HYPO NOE Landesbank AG as the bank’s key retail division.
1926 The bank moves to its new headquar-ters in Vienna’s wipplingerstrasse
1921 The Separation Act (Trennungsgesetz) of 20 December results in the liquidation of Landeshypothekenanstalt
1922 The Lower Austrian parliament resolves to set up a new mortgage bank, Landes-Hypothekenanstalt, and to amend its predecessor’s statutes

24 | 125TH ANNIVERSARY HYPO NIEDERÖSTERREICH
A picture of devastation (top): Hoher Markt was bombed in May 1945. The site was quickly restored to its former glory and a few years later became a vibrant corner of Vienna’s city centre once again (bot-tom – the headquarters of Landes-Hypothekenanstalt für Niederösterreich is visible in the lower right of the picture).
emerge unscathed from the war – the building was hit by a bomb towards the end of the conflict.
reconstruction and the post-war economy
The Second world war left behind a shattered monetary system and rampant inflation. The temporary closure of fi-nancial institutions came to an end with the Counter Act (Schaltergesetz) of July 1945, which permitted banks to re-sume payments to customers. However, at the same time around 60 percent of all deposits were frozen. The schilling replaced the Reichsmark as Austria’s currency in Novem-ber 1945 with the passing of the Schilling Conversion Act. In late 1945, Landes-Hypothekenanstalt für Niederöster-reich began receiving loan applications again, albeit only at a trickle. The Lower Austrian government also did its bit to give added impetus to the post-war reconstruction process by assuming contingent liability for mortgages on war-damaged residential and commercial properties of up to 80 percent of the estimated property value. Landes- Hypothekenanstalt was soon in a position to play a key sup-porting role in this process. The period from 1945–1948 was a testing one for the bank, since the lack of building mate-rials for reconstruction throttled demand for loans. In addi-tion, many borrowers paid off their loans early, anxious that the government’s monetary policies would impose a levy on their cash holdings. fortunately, covered and munici-pal bonds were exempt from such measures and retained their value, making them a popular investment. In 1948, confidence in securities began to pick up as the economy found its feet, but monetary policy uncertainties persisted over the next few years. However, the 1954 Schilling Open-ing Balance Sheet Act (Schillingeröffnungsbilanzengesetz) helped to shore up the schilling and gradually restore the Austrian population’s confidence in the fledgling currency.
kickstarting the economic miracle
In 1955, Landes-Hypothekenanstalt für Niederösterreich had 145 employees. They were mainly involved in distrib-uting residential construction loans financed under the European Recovery Programme – better known as the Mar-shall Plan. In 1957 the Lower Austrian government gave the bank responsibility for extending low-cost loans aimed at promoting tourism and supporting the modernisation of tourism infrastructure, as well as various other kinds of municipal projects. This was followed by lending drives that targeted businesses, and in 1961 the Agricultural Promotion Act (Landwirtschaftsförderungsgesetz) – also known as the

HYPO NOE GROUP ANNUAL REPORT 2012 | 25
Green Plan – gave farmers access to investment credits on favourable terms. In addition, local authorities were pro-vided with funding for road construction, water supplies, and new nursery schools and school buildings. At this point Landes-Hypothekenanstalt für Niederösterreich had five branches in Vienna besides the wipplingerstrasse head office. The late 1960s saw the addition of further branch-es in the main towns across Lower Austria, a move which brought the bank much closer to its customers. Landes-Hy-pothekenanstalt für Niederösterreich was well on the way to becoming a universal bank.
Centenary celebrations
The 1988 annual report was devoted to the 100th anni-versary of the bank’s incorporation. The report focused in particular on the 1888 resolution of the Lower Austrian parliament that called Landeshypothekenanstalt into be-ing. By this time, the bank had 20 branches, seven of them in Vienna – underlining the bank’s standing in the Austrian capital. Later in 1988, the bank celebrated its centenary at a special event in St Pölten, with then provincial governor Siegfried Ludwig and other members of the Lower Austrian government among the guests. One of the highlights of the celebration was a reenactment of the parliamentary ses-sion of 29 September 1888 which paved the way for the bank’s establishment.
1986: a new state capital
A major landmark in Lower Austria’s history also had im-portant implications for Landes-Hypothekenanstalt. In a 1986 referendum, the people of Lower Austria chose St Pölten as their new state capital. The construction of new administrative facilities for the state government turned into one of the defining economic projects in the bank’s recent history, as it invested in NÖ Landeshaupt-stadt-Planungsgesellschaft and other project companies involved in the massive undertaking. In view of the close relations between the bank and the state of Lower Austria, the Landes- Hypothekenanstalt Management and Supervi-sory boards adopted a resolution to relocate the company’s headquarters to St Pölten. In 1992 a wide-ranging analy-sis of the organisation laid the groundwork for a detailed restructuring and process optimisation programme. In addition, a new corporate vision was introduced to guide the bank’s future operations. New market segments were defined as the company repositioned itself in line with the requirements of the Europe-wide banking market. Besides
The setting for a number of landmark decisions – the elegant and historic boardroom at the bank’s wipplingerstrasse headquarters.
1972 Horn is chosen as the location for the third Lower Austrian branch
1969 first Lower Austrian branch opens at wiener Strasse 28 in Amstetten
1971 Second branch outside Vienna opens its doors in wiener Neustadt

26 | 125TH ANNIVERSARY HYPO NIEDERÖSTERREICH
A Landes-Hypothekenanstalt branch in central Vienna in the late 1960s

HYPO NOE GROUP ANNUAL REPORT 2012 | 27
capitalising on the opportunities for expansion into Eastern Europe, the bank also aimed to raise the profile of Lower Austria within the EU – a contemporary adaptation of the bank’s original mission. The introduction of a new cross-re-gional hippo logo in 1994 helped to enhance staff and cus-tomer loyalty. Meanwhile, the company participated in the founding of two specialist businesses: HYPO-wohnbau-bank AG, a resi dential construction finance provider, and HYPO Bausparkasse, which focused on home loan savings. The integration of Niederösterreichische Landesbank-Hy-pothekenbank AG into the Österreichische Volksbanken AG (ÖVAG) group in 1996 not only served to leverage syner-gies in IT and payment; it also opened up a host of strategic development options for the Lower Austrian lender. Con-struction work at the new government quarter in St Pölten – at that time the largest construction project in Austria’s history – was completed in 1997, and the bank’s expertise in specialised financing proved invaluable throughout the un-dertaking. Niederösterreichische Landesbank-Hypotheken-bank’s 70 or so staff finally relocated to the new head office in St Pölten’s kremser Gasse on 28 August 1998 – a hugely symbolic move, as the bank followed in the footsteps of its main shareholder and majority owner, the government of
Lower Austria, and reaffirmed its position as a driving force in the state’s economy and the leading provider of financ-ing, investment and consulting services to the state admin-istration, local authorities and the people of the province.
moving into the new millennium
To mark the 1999 world Savings Day, the bank’s original head office on wipplingerstrasse was renovated and its technical infrastructure brought up to the state of the art. That same year saw a change in Landesbank-Hypothek-enbank’s ownership structure, with ÖVAG raising its stake from 26 to 41 percent. The remaining 59 percent was owned by the state of Lower Austria. The bank was also contin-ually expanding its branch network in the province. with corporate image playing an increasingly important role, the bank made fundamental changes to its customer commu-nications to incorporate the use of modern media includ-ing the internet. The greatest challenge facing the bank in 2001 was undoubtedly the run-up to the launch of the euro, and starter packs weighing a total of some 2.5 tonnes were distributed. Niederösterreichische Landesbank-Hypothek-
The opening of the Amstetten branch coincided with the 200th anniversary of the first covered bond issue; the pho-to shows the new cash desks at the branch in October 1969.

28 | 125TH ANNIVERSARY HYPO NIEDERÖSTERREICH
The ceremonial handover of the keys to the new HYPO NOE head-quarters at Hypogasse 1 in St Pölten: (from left to right) Matthias Stadler (mayor of St. Pölten), Erwin Pröll (provincial governor of Lower Austria), Peter Harold (HYPO NOE Group CEO) and wolfgang Sobotka (deputy provincial governor of Lower Austria)

HYPO NOE GROUP ANNUAL REPORT 2012 | 29
enbank retained its position as a leading sponsor of sports and the arts.
A major turning point in the bank’s history came in 2007, with its division into two institutions – HYPO Investmentbank AG and Niederösterreichische Landesbank Hypothekenbank AG. This separation into an investment bank and a retail bank serving private and corporate customers significant-ly boosted the bank’s market muscle. 2007 also saw ÖVAG transfer its stake in the bank to the Lower Austrian govern-ment. Three years later the bank underwent a significant rebranding, with all Group companies included under the umbrella HYPO NOE Gruppe brand. The new blue and yel-low logo underscored the group’s close ties to its owner, the state of Lower Austria.
new head office in the government quarter
The HYPO NOE Group’s move into its new headquarters at Hypogasse 1 in St Pölten was perfectly timed, coinciding with the company’s 125th anniversary. “The choice of lo-cation for the new head office is a mark of our dedication to the bank’s owner, the state of Lower Austria, and the state capital. The new headquarters combines a number of key aspects: full-line customer service areas, tailor-made workspaces, a low-energy carbon-neutral building, a com-mitment to the arts and a contemporary appearance. Our shared facilities in the heart of St Pölten will enable us to respond even more quickly and effectively to the needs of our customers,” commented CEO Peter Harold at the open-ing of the new head office on 9 November 2012. Provin-cial governor Erwin Pröll said: “The HYPO NOE Group has found a new home in the state capital, a stunning example of contemporary architecture just a stone’s throw from
the Lower Austrian parliament and the striking klangturm tower.” whereas the bank’s staff were previously based at a number of different locations, the new headquarters brings together all of the group’s operations under one roof. This state-of-the-art structure was designed by Johannes Zies-er and features sun shades which adjust automatically de-pending on the natural light conditions. The unmistakeable building stands out for its unique combination of aesthetic appeal and functionality. It also reflects the bank’s success over the past century and a quarter, illustrating how far the institution has come from its early days, when it was based in a small corner of the Lower Austrian government offices in Vienna’s Herrengasse. The new location, visible for miles around, provides the backdrop for the next phase in the HYPO NOE Group’s growth.
2007 ÖVAG disposes of its stake in HYPO Landesbank, leaving the state of Lower Austria as the sole owner once again
1996 The first part-privatisation in the bank’s history, as Österreichische Volksbanken AG (ÖVAG) acquires a 26 percent stake in Niederöst-erreichische Landesbank-Hypothekenbank AG
1998 The bank relocates its head office to the new capital of Lower Austrian, St Pölten
This overview of the 125-year history of HYPO NOE is an abstract of a special commemorative book due for publication in summer 2013.
Written by Verena Hahn-Oberthaler and Gerhard Obermüller, rubicom Agentur für Unternehmensgeschichte

A pioneering expert network
Lothar Späth
norbert walter
peter Harold and theo waigel
peer Steinbrück Hans-werner Sinn

HYpo noe groUp AnnUAL report 2012 | 31
in 2009 the HYpo noe group launched the HYpo invest Club, a series of regular networking events attended by leading figures from the worlds of business and politics, and public life. the events are now red-letter days for decision-makers in Austria and abroad.
At least once a year around 150 guests are invited to attend the invest Club to hear the thoughts of big-name keynote speakers on the burning economic issues of the day. the insightful presentations are followed by panel discussions featuring the HYpo noe group Ceo and experts from the bank, who then field questions from the audience. the lavish renaissance-style Landhaussaal at Vienna’s palais niederösterreich – formerly the seat of the Lower Austrian state government – provides the perfect setting for these high-level get-togethers.
Lothar Späth: “SMEs are the driving force behind the economy”
the keynote speaker at the inaugural invest Club event in May 2009 was Lothar Späth, former premier of Baden-württemberg and chairman of Merrill Lynch germa-ny. in his speech he singled out the Mittelstand and small and medium-sized enterprises (SMes) as a vital factor in escaping the economic and financial crisis. As Mr Späth pointed out, “the economy is a dynamic system and SMes are the driving force behind it.” in line with this view, he identified a change in the operating environment as one of the keys to economic success. Späth voiced his belief that current countercyclical economic policies should gradual-
ly be replaced with structural initiatives aimed particularly at promoting education and training. Austrian Minister of economy, Family and Youth reinhold Mitterlehner spoke of the prevailing political will to undertake structural reforms aimed at “nurturing and boosting the innovative capabili-ties of the Mittelstand”.
Hans-Dietrich Genscher speaking on the 20th anniversary of the fall of the Berlin Wall: “The time was ripe”
guest speaker at the second HYpo invest Club in autumn 2009 was former german foreign minister Hans-Dietrich genscher. Looking back on the tumultuous events of au-tumn 1989, genscher said: “the time was ripe. the cracks were showing, but no-one could have imagined that the piecemeal easing of controls would be interpreted as the opening of the borders.” in genscher’s view, two historic decisions have been instrumental in shaping present-day europe: monetary union, which is essential to steering a path out of the current financial crisis, and the eastward expansion of the eU. this has given rise to a new world or-der in which the principle of equality between the member states plays a decisive role.
HYpo inVeSt CLUB top SpeAkerS, Hot topiCS, HigH-proFiLe gUeStS

32 | HYpo inVeSt CLUB
Günter Verheugen at the HYPO Invest Club: “Cooperation is the only option”
in 2010 günter Verheugen, a former vice-president of the european Commission, spoke about the achievements of the european Union. “the countries of europe don’t stand a chance without political unity. Cooperation is the only op-tion,” he emphasised. with this in mind Verheugen made a plea for stronger political leadership and an increased sense of responsibility in europe. “we have achieved a lot by expanding the eU. But after all these successes we cannot afford to succumb to fatigue. the people of europe need guidance as well as a strong, healthy and pragmatic political set-up. Sound fiscal and financial policies in the in-dividual member states are the cornerstone of an effective overarching european policy,” he commented. According to HYpo noe group Ceo peter Harold, in such a turbulent economic climate “the banks are responsible for provid-ing security. SMes in particular need a safe environment in which to operate, and HYpo noe gruppe Bank is fully committed to achieving that.”
Norbert Walter: “The failure of financial institutions’ risk management systems was a key factor in the onset of the crisis”
the fourth invest Club event, also held in 2010, saw norbert walter, an internationally renowned economist and former chief economist at Deutsche Bank, take to the podium. Mr
walter, who sadly passed away in August 2012, spoke about the need for a radical overhaul of the global financial sys-tem based on a new regulatory culture for financial mar-ket institutions. He called for a stronger european Central Bank (eCB) acting as an independent provider of liquidity to economic stakeholders. in walter’s view, the capital require-ments under Basel iii were an effective compromise given the wide variety of bank structures. peter Harold shared norbert walter’s take on the issue of equity hedging: “A banking tax is a de facto obstacle to equity capital forma-tion,” said the HYpo noe Ceo, who also saw room for inno-vation in financial service providers’ business models with a view to offering customers tailored financing opportunities. “if you have the right model, then you can offer innovative products,” he said.
Hans-Werner Sinn: “The stabilisation mechanism won’t save the euro”
the spring 2011 invest Club event saw Hans-werner Sinn, president of the Munich-based ifo institute, deliver a key-note address on the rationale behind the european Finan-cial Stabilisation Mechanism and the problems it entails. in his speech, Mr Sinn split the story of the euro crisis into three chapters: firstly, excessive capital flows, followed by central banks’ clandestine financing of current account deficits by means of target loans, and finally official bailout measures. He said that the eU had reached the third stage in 2011, commenting that “the stabilisation mechanism won’t save the euro, but it will pile huge risks on germany.” Sinn went on to outline two logical consequences for the euro – its collapse or the transformation of the eU into a transfer union. the ifo president expressed his view that the only effective lifeline for the euro was not a safety net, but the “controlled cut-off of funding” to debt-ridden coun-tries through a kind of “insurance policy with an excess”.
Peer Steinbrück: “A haircut on Greek debt is inevitable”
in autumn 2011 the former german finance minister warned that “the collapse of the euro will set the ongoing process of european integration back 20 years.” As a result, europe would have to mobilise its strengths and work as a closely knit union. For that reason he called for debt forgiveness for greece, europe-wide bank insolvency legislation, the repositioning of the eCB, an economic recovery programme for greece and a reduction in debt across the continent. peter Harold agreed, stating that “a haircut on greek debt is inevitable owing to the country’s huge indebtedness, and
günter Verheugen with peter Harold and wolfgang Sobotka

HYpo noe groUp AnnUAL report 2012 | 33
the banks have pre-empted this to the greatest possible extent.” Steinbrück also highlighted the widening gap be-tween the capital market and the real economy as another serious shortcoming in the global financial system: “we are faced with a situation where global capital market flows amount to eUr 900 trillion a year, compared with global gDp of eUr 60 trillion.”
Theo Waigel: “The aim is to create a United States of Europe”
in December 2012 the invest Club welcomed another for-mer german finance minister, theo waigel, who shared his thoughts on the future of europe and the single currency. He cut an impressive cross-section through europe’s recent history, from the Second world war through to the emer-
gence of a peaceful, united europe. waigel believed that the introduction of the euro was the correct move – and essential for europe’s survival in today’s global financial markets. But he saw greece’s accession to the eurozone as a mistake: “Looking at the numbers, greece should never have been allowed to join,” he said. in conclusion Mr waigel highlighted the importance of creating a politically and le-gally adaptable United States of europe. He added that the continent was also in need of a distinctive economic and social model. “we need to freshen up the european ideal by forming an ‘alliance for europe’ consisting of church bodies, economic associations, trade unions, agricultural and youth organisations, artists and foundations, as well as cities and local authorities. Such a pioneering network would beat an irreversible path to a flourishing, united europe,” as the for-mer minister put it.
Hans-Dietrich genscher and peter Harold


HYPO NOE GROUP ANNUAL REPORT 2012 | 35
Group sTRATEGYKEEPiNG OUR fEET ON THE GROUNd
Danube reGion strateGy
Apart from Austria, our core markets are Bulgaria, Ger-many (in particular Baden-Württemberg and Bavaria), Hungary, Romania and slovakia. We also regard the Czech Republic and Poland as part of the wider danube region, and hence as important elements of our regional strategy. While our retail banking operations, which serve consumers and sMEs, are confined to our home Lower Austrian and Viennese market, the rest of our product range is offered in focus markets spread across the entire strategic area. The HYPO NOE Group sets out to finance business ventures that promote sustainable economic development in the ex-tended danube region. These include projects aimed at:
Connecting the Danube region to europe: projects that promote mobility, renewable energy use, culture and tour-ism.
protecting the environment in the Danube region: pro-jects designed to restore water quality, manage environ-mental risks, maintain biodiversity and protect the environ-ment in general.
building prosperity in the Danube region: projects aimed at increasing research capacity, raising educational stand-ards, developing information technology and enhancing business competitiveness. Efforts to improve vocational training are a priority.
strengthening the Danube region: projects intended to enhance institutional capacity.

36 | GROUP sTRATEGY
Real Estate Project development and management
Lending and leasing
Property management, facility management
Retail Traditional regional bank for
Lower Austria and Vienna
Focus on families, health care and education
Public FinancePublic Finance
Long-term customer relationships
Tailored finance models
Corporate & Project Finance Social Infrastructure projects
Renewable energy
Mortgages Home mortgages
for private individuals
Non-profit housing associations
our Core business anD expertise
Our Group markets itself as a single unit, under the HYPO NOE Group umbrella brand. Within the Group, we of-fer bespoke solutions and products aimed at specific cus-tomer target groups. in order to provide a comprehensive range of services, we cooperate with distribution and refi-nancing partners, and maximise synergies by utilising links within our organisation.
Working in harness with HYPO NOE Landesbank, HYPO NOE Leasing, HYPO NOE Real Consult, HYPO NOE first facility and HYPO NOE Valuation & Advisory, HYPO NOE Gruppe Bank provides one-stop solutions for public sector clients – the bank is the dominant force in the Lower Aus-trian public finance market – as well as retail and business customers.
The Group’s extensive experience enables it to come up with ideal funding solutions that give it a distinctive edge in the public finance market.
The main focus of the corporate and project finance opera-tions is on renewable energy and social infrastructure.
High street banking subsidiary HYPO NOE Landesbank gives retail customers and sMEs a partner that offers a full range of financial services and is strongly rooted in Lower Austria and Vienna. it specialises in housing construction finance and mortgage lending and has relationship man-agers with outstanding expertise in these areas, which ex-tends to public building subsidies. Our long-standing clients include the non-profit housing developers that rely on the HYPO NOE Group as a strong financial partner.
While the Group has a wealth of experience in these lines of business it also works to keep up to date with the latest developments in the industry, and to respond to customers’ needs by coming up with innovative solutions. The latest breakthrough is our end-to-end property services value chain.

HYPO NOE GROUP ANNUAL REPORT 2012 | 37
Fully inteGrateD real estate value Chain fOR ONE-sTOP sERViCEs
The “personal relationship banking” approach to which the HYPO NOE Group is committed is based on close custo mer relationships built on trust. This involves providing custom-ers with long-term support that goes far beyond pure lending services. We are now looking to provide more com-prehensive assistance with real estate projects than was previously the case. 2012 brought a change in our strategic positioning, with the creation of a comprehensive service portfolio that for the first time spans the entire life cycle of a real estate project and pools all of the Group’s proper-
ty expertise in a single core business. The new end-to-end real estate value chain provides a fully integrated product portfolio. Every staff member clients encounter along the real estate value chain acts as a single point of contact and source of expertise. This is in line with our conception of personal relationship banking.
The new core process also enables us to forge strategic op-erational partnerships with domestic and foreign partners, leveraging competitive advantages and synergies.
Project management
Project development Finance Property
managementReal estate brokerage Valuation Facility
managementFacility services
HYPO NOELANDESBANK
HYPO NOEGRUPPE
HYPO NOELEASING
HYPO NOEREAL CONSULT
HYPO NOEVALUATION & ADVISORY
HYPO NOEFIRST FACILITY

38 | GROUP sTRATEGY
former Austrian Vice-Chancellor and long-serving minister Erhard Busek, CEO Peter Harold and fellow Management Board member Nikolai de Arnoldi (CfO/CRO) discussed the future of the danube region. The discussion was moderated by senior investor Relations Manager Georg Lehmann.
lehMann: i suggest that we start with opening state-ments on strategies for the danube region. dr. Busek, in your capacity as chairman of the institute for the danube Region and Central Europe you recently made the inter-esting comment that “the danube is an agent of European integration.” How do you see the danube region and the strategies for it?
buseK: i think anyone who lives here, in Vienna or Lower Austria, must be aware of the importance of the danube. for many centuries the river held the key to the fate of the region, and had a major political, social and economic im-pact on it. That’s how i have always seen it. sadly, the river’s influence was undermined by the break-up of the Habsburg Empire, and suffered a massive blow from the establish-ment of the iron Curtain and the political developments that followed from it. However, more recently it was actu-ally the danube that inspired the second step towards the creation of a united Europe. The first was the “crossing of the Rhine” by france and Germany, along with the Benelux countries. The current danube initiatives are ultimately in-tended to lead in a similar direction.
Here in Austria, we make a large part of our living from our neighbours in the danube region. That naturally carries a responsibility that we need to live up to. despite all the problems they face, and the difficulties caused by the poli-cies of some governments, Austrian businesses have opted to remain in these countries.
harolD:As the Lower Austrian state bank we have a duty to advance the interests of our east Austrian home market. We would not be true to ourselves if we did otherwise. As Mr. Busek has said, many Austrian companies have a strong focus on our country’s eastern neighbours. Our owner, the Lower Austrian state government, has highlighted the im-portance of this region for Lower Austria and Vienna by launching its danube Region initiative. This is aimed at pro-moting economic development and cooperation between the countries concerned at a variety of levels. We aim to support these efforts, particularly with regard to economic and infrastructure development.
buseK: i have learned from personal experience that the Austrians are so successful in the danube region – for ex-ample, in Prague – because their mentality is very close to that of their neighbours, despite the different languages and political cultures.
lehMann: Would you agree, dr. Harold, that the culture and mindset of the danube countries is similar?
harolD: Yes, i see similarities in their mentality, and be-cause of that it makes sense for an Austrian bank to invest in them. We often forget just how close these neighbours are. Mr. Busek once noted that if you take a pair of dividers and point them at st. Pölten – where our bank has its head-quarters – and Vorarlberg in the West, rotating them to the East lands you in Ukraine.
expert panel DisCussion: A VisiON fOR THE dANUBE REGiON

HYPO NOE GROUP ANNUAL REPORT 2012 | 39
erhard busek, a former Austrian Vice-Chancellor, is the chairman of the institute for the danube Region and Central Europe and the honorary president of the European forum Alpbach.
His long political career began in 1964 when he become the secretary of the ÖVP (Austrian People’s Party) parliament-ary group. He served in Austrian federal governments as a Minister of science and Research, a Minister of Education and Cultural Affairs, and as Vice-Chancellor. After stepping down as the leader of the ÖVP he devoted himself to European and cultural issues. At the institute for the danube Region he focuses on regional scientific, cultural, politi-cal, economic and administrative cooperation.
Erhard Busek has received honorary doctorates from the Krakow University of Mining and Metallurgy, the universities of Bratislava, Chernivtsi, Ruse, Brasov and Liberec, and Webster University, Vienna. He is a holder of the Grand Gold Medal of the City of Vienna, and a Grand Officer of the star of Romania. Among many other honours he has also received the Grand Cross of the Order of st. sylvester, the Julius Raab Medal of the Austrian Economic League, the Corvinus Prize of the Europainstitut Budapest and the slovakian Order of the White double Cross.

40 | GROUP sTRATEGY
buseK: in Uzhgorod, actually.
harolD: Really in Ukraine – surprising!
buseK: Of course, there are differences, but the shared history and culture have left their mark. for example, Vien-na used to be the second-largest Czech city. But there is too little awareness of the common ground we share, despite the strong cultural affinities. Many of the figures we take pride in because of their cultural achievements were not born in today’s Austria but came to Vienna and Lower Aus-tria from the surrounding countries.
harolD: for a bank like ours it’s vital to be familiar with other countries and the people who live there, speak their languages, and understand local conditions and the legal environment. That’s why it’s vital to employ staff from these countries. The expertise we gain in this way creates added value for our customers.
De arnolDi: We know our customers, and confine our-selves to transactions where we have specialist knowledge. We visit our customers, and find solutions for them by talk-ing things over.
lehMann: Why have you chosen to map out a danube strategy, and not an overall Central and Eastern Europe strategy like other banks?
harolD: We identify particularly strongly with this region because we are based in one of its main population cen-tres. Also, as i’ve already mentioned, there is a connection with the danube Region initiative launched by our owner, the Lower Austrian state government, so there are obvious attractions to branding our approach as a “danube region strategy”. The region covers a lot of countries that are of interest to us – Austria, Bulgaria, the Czech Republic, Ger-many, Hungary, Romania and slovakia – and there is a clear business logic to tagging Poland on to it.
buseK: That’s how the Poles themselves want to be seen. People in Krakow tend to look towards Austria – Vienna is closer to them than Warsaw.
harolD: for us, the danube strategy is an extension of our Austrian operations. That makes us very different from the large Austrian banks, which do a lot of their business in south-Eastern and Eastern Europe.
De arnolDi: i’d like to underline that – our core mar-kets are of course Lower Austria and Vienna, and that is not about to change. Our activities in the danube region represent a selective approach to expansion. They’re im-portant, too, and help diversify our risk exposures. We nor-mally steer clear of any speculative investments in the re-gion, and concentrate on public finance and infrastructure projects.
buseK: in reality, that’s precisely where the opportunities lie. i can only agree that the region’s economic prospects mainly depend on developing its infrastructure – which takes us back to the danube Region initiative. Of course, this is about road and rail links as well as navigation. These transport modes are still underdeveloped. The origins of the Working Community of the danube Regions go back to Communist times. Lower Austrian governors played a key role in this. Cold War politics were set aside, and it was seen that it was possible to cooperate at lower levels. That was also the reason why Austrian companies began operating in neighbouring countries before the fall of the iron Curtain in 1989.
lehMann: Hungary in particular?
buseK: Yes, especially Hungary. Czechoslovakia was a bit more difficult in those days. Then there was Croatia, and of course slovenia, which chiefly attracted investment from the banks.
harolD: We tailor our business activities to the varying pace of development in the countries concerned. Legal security and the enforceability of law in particular are es-sential for banks.. That’s why EU membership is immensely important to me. i was working in Bulgaria when it became a member state, so i was able to experience the expect-ations of a better life in the EU and increased legal security at first hand.
buseK: i’d like to stress that tackling legal security is crucial. The trouble is that you can replace justice minis-ters, but not judges, so these countries need education programmes to foster the new way of thinking. The iron
european investment bank (eib): The EiB is the European Union's bank, and is owned by the 27 mem-ber states. The world’s largest multilateral bond issuer and lender, it provides finance and expertise for invest-ment projects; most of its activity is focused on the EU. The EiB supports projects that make a significant con-tribution to growth, employment, economic and social cohesion and environmental sustainability in Europe and beyond.

HYPO NOE GROUP ANNUAL REPORT 2012 | 41
Curtain didn’t disappear from one day to the next, it is still there, in people’s minds. That’s an argument for know-how transfer programmes and corporate staff development schemes, which are usually more effective than govern-ment measures. European development is a process of osmosis, in which change gradually percolates through the borders to the East.
De arnolDi: it takes time for the necessary changes to unfold and be assimilated – you can’t force people to change. That reminds me of an apt observation: “it takes five years to integrate a bank, and it still takes five years even if you’re prepared to throw a lot of money at it.”
lehMann: The EU strategy for the danube region has four pillars: connecting the region; protecting the environ-ment; building prosperity; and strengthening the region. does your bank have certain priorities among these, or do you see it as your role to support all four types of projects?
harolD: We apply our core expertise to financing projects relating to all four pillars. These include projects aimed at improving mobility, encouraging the use of sustainable en-
ergy sources, protecting the environment in the danube re-gion, developing the knowledge society through research, education and information technologies, and enhancing business competitiveness.
De arnolDi: We’re familiar with the problems faced by public sector clients, and especially the larger local authori-ties. We know how to facilitate projects supported by the EU – for example, in tandem with the EiB or using EU funding.
harolD: Besides our public finance expertise, another key competency is our ability to work with our subsidiar-ies to provide local services that span the entire life cycle of a real estate project. for example, our facility manage-ment subsidiary, HYPO NOE first facility, acquired in 2012, already has a very strong footprint in the danube region.
lehMann: What risks are you definitely not prepared to accept?
harolD: We’re not prepared to allow our foreign business to amount to more than a quarter of total lending – and, in-deed, that is not the case at present. And we don’t have any operating subsidiaries or branch networks abroad. Our re-

42 | GROUP sTRATEGY
tail banking subsidiary, HYPO NOE Landesbank, serves re-tail and sME customers, but only in eastern Austria. That’s a big difference from our competitors.
buseK: Banks and other companies with a long-standing presence in the region have a vital role to play in providing project finance, as local firms lack experience in this area.
harolD: We see ourselves as “relationship bankers” who seek to establish long-term customer relationships, rather than “transaction bankers” who make deals and take the next plane out. This is apparent from our investment strat-egy – we don’t speculate.
lehMann: Going forward, what aspects of the operating environment would you like to change? in what direction will the danube region need to go up to 2020 and 2030 if it is to remain successful?
buseK: i’d like to comment on the “three no’s” clause of the strategy for the danube Region (“no new EU funds, no new EU legislation, no new EU structures”). i think this is the right approach, because there is enough unused mon-
ey in the various existing funds. That’s particularly true of Bulgaria and Romania. Neither do we need any new regu-lations or institutions. What’s lacking is ways of overcom-ing the obstacles to cross-border cooperation. To take one simple example, there is still resistance to cooperation be-tween Bulgaria and Romania, partly for historical reasons. i believe we should put more faith in the problem solving capabilities of public administrators and the private sector than those of the politicians.
De arnolDi: There’s still a gap between living standards in Austria and in the eastern danube region countries, and the latter’s infrastructure and legal framework are still in need of improvement. We would like to see more action to address these problems.
harolD: “We’d like to know within one or two weeks whether or not you’re going to grant us the loan”. Those were the blunt words of a businessman when i was working in south-Eastern Europe. We need to ask ourselves what customers expect of us. The answer is quick decisions that stick. And what does our bank expect of public institutions?

HYPO NOE GROUP ANNUAL REPORT 2012 | 43
The same thing: quick, binding and transparent decisions and selection processes, and clear and straightforward EU support processes. Get that right and you have a win-win situation.
lehMann: Could i ask you to sum up in a few words?
buseK: The danube region is the next big integration stage for the European Union. integration is not just a mat-ter of a country joining, the common ground has to grow. That’s a long drawn-out process that demands patience. The enlargements of 2004 and 2007 are only now being turned into a living reality by the danube Region initiative. There are parallels with the Baltic sea Region, which has the same function. Until now the European Union has been a West European exercise with a few countries tagged on to it. We must seize the opportunity to connect with the Black sea, the Caucasus, the Middle East and Central Asia via the danube region. A central issue for Europe’s stability is nar-rowing the economic divide – because emigration is asso-ciated with a lack of prospects and poor living conditions, so in a sense economic policy is also social policy.
De arnolDi: To take that point further, for me integration of the region with the European Union is also a question of national security. That’s not just the banker in me talking, but the opinion of someone who has often worked in this region and continues to do so.
harolD: We see the danube region as a market to di-versify into and steadily develop, building on our existing commitment and know-how. Because of this we will invest selecti vely in projects that contribute to the implementa-tion of the EU strategy for the danube Region, without weakening our focus on our Austrian base. in our home market our aims as a group – including HYPO NOE Landes-bank, HYPO NOE Real Consult, HYPO NOE Leasing, HYPO NOE first facility and our latest addition HYPO NOE immo-bilienmanagement – are to provide optimum bespoke solu-tions for retail, corporate and public sector clients.
lehMann: Thank you for your sharing your insights on the danube region and the bank’s danube region strategy.
baltic sea region: The EU strategy for the Baltic sea Region is aimed at closer cooperation between the Baltic states. Like the danube Region strategy, it is intended to serve as a model for regional economic and social cooperation. implementation is financed by a variety of EU funds including the Baltic sea Region Programme.

44 | GROUP sTRATEGY
At the suggestion of Austria and other danube Basin coun-tries, in december 2010 the European Commission put for-ward a proposal for an EU strategy for the danube region. This marked the beginning of an ambitious project. imple-mentation of this “macro-regional strategy” – a framework for integrating a variety of sectoral policies, and coordinat-ing the activities of different players and an array of finan-cial instruments – has now been under way for 13 months. Many concrete projects were developed during the first year – about 70, in a total of 11 priority areas.
developing the danube into an environmentally sustaina-ble, energy efficient transport corridor is only one of the major goals of the strategy. The 14 countries along the dan-ube, eight of which are EU member states, did not embark on this initiative with the intention of creating new EU leg-islation or structures. instead, the aim is to improve links between stakeholders in the danube region, and to launch concrete projects in a variety of areas, including economic development, mobility, the environment and energy, as well as cultural and social initiatives. it is also to make better use of existing EU-funded programmes and projects in the region through improved coordination and interconnection. These financial resources amount to EUR 100bn over the 2007–2013 period.
some 115m people live in an area of about 800,000 square kilometres in the danube region, which makes up about one-fifth of the territory and population of the EU, and en-compasses all of Europe’s economic and social extremes. it runs the gamut from the EU’s most competitive areas to the poorest with the lowest quality of life. One of the main objectives of the strategy is therefore to lift living stand-ards in the region and to transform it into a true “21st-cen-tury region”.
investment in people and skills will be vital if the workforce is to be equipped for the demands of the labour market and if employment levels in the region are to rise. This requires more open labour markets, which can only be achieved by transregional cooperation. stepping up research coopera-tion and strengthening competitiveness – particularly that of small and medium-sized enterprises – is a major policy focus. factors such as innovation, technology transfers, environmental technologies, renewable energy sources, en-ergy efficiency and vocational education and training will play a crucial part in competitiveness. for example, indus-trial enterprises will need support from regional policies to prevent them from being forced out into peripheral areas, and to concentrate them at European transport nodes.
Austria has a key role to play in many areas, and its location in the heart of the danube region allows it to lead the way.
the eu Danube reGion strateGy GUEsT CONTRiBUTiON BY EU COMMissiONER JOHANNEs HAHN

HYPO NOE GROUP ANNUAL REPORT 2012 | 45
for example, last year the danube Business forum 2012 was staged in Vienna. Over 200 representatives of the business community exchanged information on environmental tech-nology at this event, and many new projects were devel-oped and partnerships formed. Because of the success of
this initiative the exercise will be repeated this year. it is just one instance of the ways in which the danube strate-gy promotes economic development. in short, this regional partnership has already shown its worth in the 13 months since its inception.

46 | GROUP sTRATEGY
lower austria anD viennaOur positioning as a bank that principally serves Lower Austria and Vienna is well chosen in view of the fact that these states are among Austria’s wealthiest in terms of per capita income and purchasing power. Moreover, these two federal states recorded the country’s highest population growth rates in both 2011 and 2012.
regional comparison of income and purchasing power
The latest regional income report from the Austrian Court of Audit shows that Lower Austria and Vienna are among the richest states in terms of employees’ income. The most recent study of purchasing power reveals that, together with salzburg, the two states have the populations with the highest purchasing power. in terms of per capita income Lower Austria is the best-off state, followed by Vienna.
population growth
Over the 1991–2011 period population growth was fastest in Lower Austria, Tyrol, Vorarlberg and Vienna, at rates of 10–12%. This naturally helped to drive economic growth in the states concerned. Carinthia and styria recorded slow – albeit positive – population growth rates of about 2%. A long-term forecast for the 2010–2050 period projects pop-ulation growth of 19.1% and 18.2%, respectively, for Lower Austria and Vienna, which again places them top. The study predicts the population of Carinthia to decline by 2.1% by 2050. The key drivers of further population growth are likely to be good infrastructure and transport links, suffi-cient job opportunities and high quality of life. HYPO NOE Gruppe Bank will play an active part in enhancing quality of life by financing public and quasi-public infrastructure, and by advising its retail and business customers.
26,349
27,744
28,229
28,260
28,804
29,769
29,920
30,567
31,708
0 5,000 10,000 15,000 20,000 25,000 30,000 35,000
Tyrol
Sbg.
Car.
Styria
Vbg.
U. Aust.
Bgld.
Vienna
L. Aust.
Gross incomes of employees in eur, 2011
17,800
17,900
17,900
18,300
18,700
18,700
19,400
19,500
19,500
16,500 17,000 17,500 18,000 18,500 19,000 19,500
Tyrol
Sbg.
Car.
Styria
Vbg.
U. Aust.
Bgld.
Vienna
L. Aust.
per capita purchasing power in eur, 2011
eConoMiC DevelopMent in the Danube reGion – AN OVERViEW
sources: Austrian Court of Audit; HYPO NOE Group analysis
sources: market research by GfK; HYPO NOE Group analysis

HYPO NOE GROUP ANNUAL REPORT 2012 | 47
15.0
10.0
5.0
-5.0
0.0
TyrolVbg.Vienna Sbg.L. Aust. Austria U. Aust.Bgld. Styria Car.
% c
hang
e
19.118.2
13.011.9 11.6 11.0
8.4
7.0
4.1
-2.1
population growth, 2010–2050
% c
hang
e
2.0
12.0
10.0
8.0
6.0
4.0
0.0
12.611.9 11.8
10.49.6
8.0
6.15.4
2.31.9
Tyrol Vbg. Vienna Sbg. L. Aust. Aust. U. Aust. Bgld. Styria Car.
population growth, 1991–2011
1.5
3.1
1.11.6
-0.5-0.1
-6
-4
-2
0
2
4
6
2004
2005 2006
2007
2008
2009
2010 2011
2012 2013As
% o
f G
DP
CEE (agg.) eurozone (agg.) Sources: Statistics Austria and Economist Intelligence Unit
economic growth comparison, Cee vs. eurozone
Central anD eastern europeThe HYPO NOE Group will maintain its recent focus on building up banking relationships with customers in the danube region. This strategy is vindicated by the economic progress being made in Central and Eastern Europe. The CEE countries’ GdP growth has already outpaced the Euro-pean average for more than a decade.
Austria, the Czech Republic, Germany, Poland and slovakia are set to be our fastest growing preferred markets over the 2008–2013 period. The Czech Republic, Poland and slovakia have continued to outperform similar economies during the euro crisis.
Consumption and investment
Personal consumption is forecast to edge up in 2013 after faltering in 2012, and business investment is expected to support growth in the region in 2013 after making a nega-tive contribution in 2012. Public sector spending has been contracting since 2011 because of the austerity policies in places across the region, and is thus making a negative growth contribution.
sovereign risk spreads
The European Central Bank’s announcement that it was prepared to make unlimited purchases of sovereign bonds if necessary, and to establish a permanent European stabil-ity Mechanism did much to calm financial markets. These policies have resulted in a significant narrowing of the risk
source: statistics Austria 2011 population forecast
source: statistics Austria 2011 population forecast
sources: Economist intelligence Unit; HYPO NOE Group analysis

48 | GROUP sTRATEGY
premiums on the sovereign debt of all CEE countries. The risk spreads of all HYPO NOE Bank’s focus countries have returned to pre-crisis levels (i.e. before the collapse of Leh-man Brothers in september 2008).
industrial production in the Cee region
Because of the current economic catch-up process in Cen-tral and Eastern Europe, industrial production in the region has grown considerably faster than in the eurozone since
2005 (see chart above). following the crisis-induced slump in 2009 industrial output only recovered marginally in 2010 and 2011 in the euro area, but registered significantly higher growth rates in the CEE region. forecast declines in euro-zone industrial production in 2012 and 2013 contrast with continued expansion in CEE. However, the close trade links of the CEE economies with the eurozone mean that there is likely to be a slight, lagged narrowing of the gap between the two in the medium term.
-20 -15 -10 -5 0 5 10 15
2008
2009
2010
2011
2012
2013
Slovakia Poland Germanyeurozone (agg.) CEE (agg.)Czech Republic Austria
industrial production (annual change in %)
2005
2006
2007
2008
2009
20102011 2012 2013
60
70
80
90
100
110
120
130
Inde
x po
ints
CEE (agg.) eurozone (agg.)
industrial production (2005 = 100)
sources: Economist intelligence Unit; HYPO NOE Group analysis
sources: Economist intelligence Unit; HYPO NOE Group analysis

HYPO NOE GROUP ANNUAL REPORT 2012 | 49
While all of the countries concerned registered increases in industrial production in 2010 and 2011, Germany experi-enced a slight fall and the eurozone as a whole a sharp re-duction in 2012. slovakia has recorded exceptionally rapid industrial output growth over the past few years because of investment in the automotive sector. Hungarian output flatlined in 2012 but is expected to return to growth in 2013.
export growth in the Cee region
Exports from the CEE region posted solid growth in 2010. This was mainly because some investments put on hold during the 2009 crisis were carried out in the following year. in 2011 exports from the CEE region climbed by 9.6% by volume, significantly outpacing the 6.3% growth regis-tered in the eurozone. final statistics are expected to show that export growth eased to 2–3% in both regions in 2013.
nuanCeD approaCh to MarKet DevelopMent in the Danube reGionThe divergent economic trends – in terms of economic growth, industrial production and public spending – de-scribed above call for a differentiated approach to market development.
due to their higher economic growth rates even in crisis and recession years, and their more robust regulatory en-
vironments, we will provide the Czech Republic, Poland and slovakia, as well as our core Austrian and German markets, with our full range of financial products.
As a result of the generally low level of public debt in the other focus countries (especially Bulgaria and Roma-nia), the Group is concentrating on projects with public or quasi-public funding in these markets.
A highly selective approach is taken to private sector pro-jects, and they are assessed on a case by case basis. infra-structure development (water supply and sewerage, waste separation and recycling, transport and education) offers major growth opportunities in the CEE region. investment in these areas is favoured by the many EU support pro-grammes, and the policies of the EiB and the EBRd.
Other attractive opportunities are being created by the EU’s 20-20-20 targets. These call for a 20% reduction in CO2 emissions from 1990 levels, and will require accele-rated investment in renewable energy sources by danube region countries because of the mounting time pressures as the 2020 deadline nears.
HYPO NOE Gruppe Bank is watching current developments at national and European level – such as the design and sta-bility of regulatory regimes – very closely. We are keeping the implications of the regional impact of new EU funding programmes for our strategy under constant review.
02007
2008
2009
2010
2011
20122013
-40
-30
-20
-10
10
20
30
Ann
ual %
cha
nge
Sources: Economist Intelligence Unit; HYPO NOE Group analysis
Austria
Bulgaria
Czech Republic
CEE (agg.)
EU27 (agg.)
eurozone (agg.)
Germany
Poland
Romania
Slovakia
industrial production (2005 = 100)
sources: Economist intelligence Unit; HYPO NOE Group analysis

50 | HYPO NOE IN ITS CORE MARKET

HYPO NOE GROUP ANNUAL REPORT 2012 | 51
Together, Lower Austria and Vienna have over 3.3 million inhabitants, and represent Austria’s largest regional economy. Traditionally divided into four districts – the Weinviertel, Waldviertel, Mostviertel and Industrieviertel – Lower Austria is home to 1.6m people and has an area of 19,178 square kilometres. Vienna, the federal capital, has 1.7m inhabitants and an area of 415 square kilometres.
Situated close to the Slovakian capital, Bratislava, and on a straight line between Munich and Budapest as the crow flies, the region is at the geographical centre of the Central European economic activity. It is also home to a European success story that forms a focal point of the HYPO NOE Group’s activities. The current and future prosperity of Lower Austria and the city of Vienna is the key to our long-term economic success. Wholly owned by the Lower Austri-an state government, our Group not only has an interest in the region’s development, it believes it has a strong obliga-tion to drive social and economic progress in Lower Austria and Vienna.
HYPO NOE IN ITS core marketLOWER AUSTRIA ANd VIENNA – THE HEART Of AUSTRIA
“The current and future prosperity of Lower Austria and the city of Vienna is the key to our long-term economic success.”

52 | HYPO NOE IN ITS CORE MARKET
Historically inseparableLower Austria and Vienna are the heartland of modern Austria. This is the area that was originally simply called Austria, and later gave its name to the whole country. In the second half of the 20th century, the region faced a diffi-cult situation. The long Soviet occupation after the Second World War obstructed investment in the area until 1955, while reconstruction proceeded rapidly in the rest of Aus-tria. Even after the withdrawal of Soviet troops, Lower Aus-tria’s economic development was inhibited by its location next to the Iron Curtain, which did not fall until 1989. Over the last 30 years, Lower Austria has shaken off the fetters of the past and emerged as a dynamic, innovative state.
Vienna had been the capital of Lower Austria since the mid-dle ages. The city became a federal state in its own right in 1920; however, Vienna’s Herrengasse remained the seat of the Lower Austrian state government until a referendum in 1986 made St. Pölten the capital.
The state government and administration moved to St. Pölten in 1996. The HYPO NOE Group completed the construction of a new headquarters building in the thriv-ing new state capital in 2012. After the move the former home of the Lower Austrian state government, the Nied-erösterreichisches Landhaus in Herrengasse, was renamed the Palais Niederösterreich. It is now the grand setting for many events, including the HYPO Invest Club which takes place at least once a year.
impressive growtH recordToday, the Vienna and Lower Austria region is an industrial powerhouse, and makes a steadily growing contribution to Austrian manufacturing output. The state’s industrial com-panies and their innovative, high quality products are more successful internationally than ever before. The impor-tance of the eurozone as a trade partner of Lower Austrian and Viennese industry has greatly increased, overtaking
the share of output that goes to the home market. Both states have also benefited from rapid economic growth in the new EU member states as well as Russia and the Asian emerging markets.
lower austria’s goalsThe overall vision of the Lower Austrian state government centres on a sustainable and competitive economy and so-cial justice. This implies a triangle of regional planning ob-jectives. The three corners are equal living conditions for all social groups, a competitive, innovative regional economy, and a sustainable approach to the environment that con-serves resources. The HYPO NOE Group is actively involved in delivering the state’s wider social goals; for example, we support welfare initiatives and emergency services.
Lower Austria’s forward-looking spatial planning and re-gional development strategy encompasses environmental, social and educational initiatives as well as economic pol-icies. The Group has helped the state government to exe-cute many of these measures, and is a strong and influen-tial partner in the realisation of its regional development concept.
Health care – making timely provision for the future
In line with the trend throughout the industrial world, life expectancy has been steadily increasing in Lower Austria and Vienna, as has the average age of the population. The proportion of elderly people is growing, and their pensions must be paid by a shrinking working population. There are 105,000 more people over the age of 60 in Lower Austria and Vienna today than there were in 1961.
This trend has not only called for major policy adjustments but has also resulted in a heavy demand for new and adapt-ed health care facilities. Existing institutions such as hospi-tals need to be expanded and altered to cope with higher patient numbers. This applies to acute medical care as well as preventive medicine and aftercare.
Hospitals in Lower Austria and Vienna are to be converted into state of the art health centres. In addition to additional health care provision, preventive care facilities for nutrition, exercise and relaxation are being set up. The package also includes general services such as shops and pharmacies.
“Lower Austria and Vienna are the heartland of modern Austria.”

HYPO NOE GROUP ANNUAL REPORT 2012 | 53
The HYPO NOE Group has partnered many of these vision-ary projects in the past. An example is the extensions, alterations and new buildings at the Tulln danube region provincial clinic, constructed in cooperation with HYPO NOE Leasing. HYPO NOE first facility also provides serv-ices to a number of health centres. due to this ongoing collaboration, the HYPO NOE Group has become a trusted, long-standing partner to the Lower Austrian state hospital holding company, Landeskliniken Holding Niederösterreich.
education – fertile ground for science and research
The strong role of industrial companies in the regional economy results in above-average investment in research and development. More than 6% of total Austrian R&d spending is concentrated in Lower Austria. The private sec-tor accounts for 77% of the funding of R&d in the state.
The fact that Lower Austria is such fertile ground for small and medium enterprises as well as large-scale industrial development is of fundamental importance to our Group’s business model. HYPO NOE Landesbank finances many of the projects undertaken by large industrial companies and SMEs, and supports these companies in their develop-ment. As a result the Group is not only a partner to Lower Austrian companies but is also an important engine of eco-nomic growth in the state.
Lower Austria can be proud not just of the burgeoning R&d activity in the state but also of its higher education sec-tor. There are universities across the state. Campus Krems is a mainstay of university teaching, offering a wide range of training in fields including medicine, business, law, me-dia and culture. The department for Agrobiotechnology in Tulln has become a major centre of scientific research. The University of Natural Resources and Life Sciences, Vi-enna, Vienna University of Technology and the University of Veterinary Medicine, Vienna have been collaborating at the Tulln technology centre since 1994. Equally important is the Institute of Science and Technology Austria (IST Aus-tria) in Gugging, Klosterneuburg, established in 2006. IST Austria offers outstanding opportunities for highly gifted doctoral students, and produces scientific and mathema-tical research.
The most recent research sector project is the new Me-dAustron cancer research and treatment centre in Wiener Neustadt, due to open in 2013. It will offer up to 1,400 pa-tients new hope in their fight against cancer. The HYPO NOE Group and the EIB helped make the project possible by extending a loan of over EUR 100 million to finance the construction of this international cancer research centre.
energy – conserving resources
The HYPO NOE Group cooperates with the Energy and En-vironment Agency of Lower Austria, which has a major role to play in meeting the state’s new energy targets. Renew-ables are to account for 100% of Lower Austria’s electric-ity by 2015, and for 50% of all energy consumed by 2020. This puts in black and white what was long regarded as inconceivable, or at best unrealistic: a shift from a global energy system dependent on fossil fuels and nuclear power to one based on efficient, decentralised renewable energy supplies. Increased energy efficiency and the use of local renewable energy sources are pivotal to this transition.
The most important policy lever for Lower Austria is hous-ing construction. Because of this, public money has long been made available to support the construction of energy efficient new homes and low energy renovation of existing homes. HYPO NOE Landesbank provides advice on Lower Austria’s eligibility criteria for subsidies, as well as on feder-al grants such the 2013 “renovation cheque” for thermal up-grading. Customers are offered assistance with all stages of the application process, from submission to disbursement. In this way we are promoting a trend that brings a wide range of benefits – modern buildings use little energy whilst meeting high comfort standards, and renovation work pro-vides employment for local craftsmen, as well as helping to reduce oil and gas imports. The money stays in the region and continues to circulate in the local economy. The same goes for the use of renewables. Wind, solar, biomass and hy-droelectric power are available locally. Use of these energy sources is growing, and creates jobs that support the Lower Austrian economy. The success of photovoltaics in Lower Austria shows that the people of the state share its goals – and HYPO NOE Landesbank offers advice in this area, too. The planned expansion of wind power capacity is supported by a large majority of the population, as is the utilisation of Lower Austria’s hydropower potential.

54 | HYPO NOE IN ITS CORE MARKET
Building a future-proof energy system will call for a great deal of innovation and investment. It will only be possible to meet the state targets by achieving maximum energy
efficiency. Everyone can play a part: private individuals, companies, the state administration and local authorities. Energy efficiency touches all areas of life, and starts with simple actions such as buying efficient appliances and en-ergy-saving light bulbs. Transport is another area where it is easy to make a difference: the use of efficient forms of transportation like bicycles, e-bikes, demand-adjusted pub-lic transport and electric vehicles cuts energy consumption and emissions, as well as enhancing quality of life. Ener-gy produced in and for Lower Austria also adds up to in-creased security of supply for consumers and businesses, and provides a good springboard for sustainable develop-ment throughout the state.
“The fact that Lower Austria is such fertile ground for small and medium enterprises as well as large-scale industrial development is of fundamental importance to our Group’s business model.”

HYPO NOE GROUP ANNUAL REPORT 2012 | 55
tHe Hypo noe group’s contribution to lower austria and vienna
Reference project in Vienna kindergarten in the stadtpark
“Vienna City Council joined forces with architect Martin Kohlbauer and the HYPO NOE Group to build an ultra-modern kindergarten in the Stadtpark for 180 children. When it comes to kindergartens, including new builds, we aim for top quality and functionality, so as to provide the best possible educational environment. I am especially grateful to the HYPO NOE Group and all the other project partners for the excellent teamwork and the highly suc-cessful implementation of the project,” said Christian Ox-onitsch, Executive City Councillor for Education, Youth, Information and Sports.

56 | HYPO NOE IN ITS CORE MARKET
One-stop solutions eichgraben municipal centre — a Hypo noe showcase project
In 2009 the market town of Eichgraben decided to build a new municipal centre, opting for lease finance as well as construction management services and an energy use guarantee. The innovative building took about a year to build, and was opened by state governor Erwin Pröll.
In his speech at the inauguration ceremony, mayor Martin Michalitsch highlighted the HYPO NOE Group’s “success-ful all-inclusive leasing model”, which included cost and energy efficiency guarantees. Close cooperation with the council by experts from the Gruppe Bank Public finance department and HYPO NOE Leasing meant that the key project milestones were all met by a single contractor. “With HYPO NOE Leasing as general contractor, we were able to make a spot landing when it came to project fi-nance,” Martin Michalitsch commented.
Martin Kweta, chief executive of HYPO NOE Leasing, pointed to the company’s close partnerships with local authorities: “The HYPO NOE Group is leading the way in innovative financing models for local authorities, and es-pecially leasing.” This was demonstrated well by the com-pletion and opening of the Eichgraben Municipal Centre on time and on budget, he said.
project details �Aside from the present value of the lease payments, the reasons for the award of the project tender includ-ed the heating energy demand guarantee, expressed in kilowatt hours and euros; � In order to avoid cost overruns, a binding construction cost ceiling was agreed; �This greatly reduced the risk of unbudgeted costs for the client; �HYPO NOE Real Consult was responsible for project supervision and for verification and clearance of in-coming invoices, and assisted with the evaluation of potential cost savings.

HYPO NOE GROUP ANNUAL REPORT 2012 | 57
Reference project in Leobersdorf rathausplatz town centre remodelling
The town hall square in the market town of Leobersdorf, created in 1970, was visually and functionally redesigned to form an interaction area as part of an integrated over-all concept.
The remodelling took account of environmental and sustain ability aspects, improved safety, amenity value and aesthetic design.
Mayor Anton Bosch, who commissioned the project, re-flected on the outcome with pride: “The new Rathaus-platz is a clearly demarcated public space, which marks the centre of the town and serves as an inviting ‘welcome mat’ for visitors.” Local authority chief executive Andre-as Morgenbesser, who also heads Leobersdorfer Kom-munalimmobiliengesellschaft (Leo-KIG), commented: “Thanks to the outsourcing of the project to Leo-KIG and our partnership with HYPO NOE Group, who provided technical support on this and remained closely involved, we managed to realise an exemplary project from the planning stage through to completion.” Tax advantages and having a single entity responsible for property man-agement are just two of the significant efficiency ben-efits of outsourcing to an ‘external’ property company.
Reference project in Krems extension to the krems university of applied sciences
A key element of this project was a multifunctional sem-inar and events area on the ground floor of the new building. This provides space for small-group seminars and workshops, as well as conferences, symposia and ac-ademic events with up to 600 participants. A modern of-fice wing for the university administration was also add-ed, along with storage and building services rooms. The new extension at Krems campus puts IMC Krems’ health care degree programmes under one roof. These comprise courses in midwifery, physiotherapy, music therapy, occu-pational therapy, general nursing and advanced nursing practice.

58 | HYPO NOE IN ITS CORE MARKET
At the opening ceremony, the IMC Krems University of Applied Sciences signed cooperation agreements with Belgrade’s Singidunum University, the Bangkok Christian University and Hanoi University.
The IMC Krems opened in 1994 with an intake of just 45 students. Currently, over 2,000 people are enrolled at the university, which will now be able to offer high quality education to a total of around 2,500 students.
project details
New university building project key figures: �Gross floor area: 7,719.8 m2
�Total cost: EUR 20 million �Commencement of works: March 2011 �Completion: May 2012 �Project management: HYPO NOE Real Consult
Ingeborg Rinke, Mayor of Krems at the time this project was completed, singled out the HYPO NOE group’s pro-fessionalism for praise. As she put it: “The Krems an der donau riverboat terminal and World Heritage centre is a showcase project for the Lower Austrian tourist industry. Since its opening a few months ago, it has also become a popular meeting place on the danube for the people of Krems, who enjoy spending their free time there. We needed a strong, reliable partner for a project on this scale, and we found one in the HYPO NOE Group. I would like to extend my heartfelt thanks for the close coopera-tion with them on financing and managing the project.”
The riverboat terminal and World Heritage centre offers all the amenities one would expect of a welcome cen-tre for tourists. Ticket desks for ddSG Blue danube and Brandner river cruises are located in the foyer. The tour-ist centre provides information on the town of Krems and the Wachau area. Souvenirs and local products, including
Group project management expertise krems-stein riverboat terminal and world Heritage centre

HYPO NOE GROUP ANNUAL REPORT 2012 | 59
wine from the Krems and Wachau valleys, can be pur-chased at the shop and the wine store. The Wellenspiel café-restaurant has already become a watchword for Wa-chau hospitality.
Architects Najjar & Najjar designed the riverboat termi-nal and World Heritage centre. Visitors are welcomed by a distinctive, oversize gateway that leads them into the centre, where they can learn about various aspects of the UNESCO World Heritage site in an exhibition area designed to recall rows of vines.
Merten Trompler, Chief Executive of HYPO NOE Real Con-sult, enthused about the project’s appeal: “HYPO NOE Real Consult was responsible for managing the project that created this spectacular landmark building. It was a great experience for us to follow this gate to the Wachau all the way from the ideas phase to its opening.”
project details �Project management: HYPO NOE Real Consult �financed by: HYPO NOE Group �floor space: approx. 560 m2
�Total cost: EUR 3 million �Commencement of works: October 2010 �Opening: September 2011
public-private partnerships (ppps): The European Commission defines public-private partnerships as a form of cooperation between public bodies and private enterprise for the purpose of financing, building, renovating, operating or maintaining infrastructure or providing a service.

60 | HYPO NOE IN ITS CORE MARKET
security, trust, traditionAs a Lower Austrian regional bank, we believe we have a duty to be a stable, trusted partner to our region and its people, and this goes beyond our banking business. We are proud to have been an active promoter and partner of initiati ves and projects that have been important to Low-er Austria over the years, in line with our claim to be “the bank at your side.” We stepped up our commitment to such activities last year, and made 2012 a year of partnerships.
united by common valuesOur choice of partnerships reflects our values of tradition, reliability, expertise, trust, professionalism and solidarity. In addition to many smaller-scale sponsorship arrangements, we partner the Lower Austrian Red Cross, the Lower Austri-
an fire Brigade federation and a number of Austrian Armed forces units, including the air and air defence personnel school at Langenlebarn, the Allentstieg military training area, the Jagdkommando (special forces) base in Wiener Neustadt, and the Vienna Hoch- und deutschmeister infan-try regiment.
In connection with these relationships, we see it as our role to be a platform for networking and information exchanges between key institutions in Lower Austria. These activities are intended to position the Bank, raise awareness of it in the region and help it win new customers. It is also impor-tant to us to pay tribute to the major contribution made by volunteers in Lower Austria, and to bring it to the attention of our staff, customers and the general public. We aim to provide all of our partners with both financial and moral support, to the best of our ability.
GROUP partnersHips
Peter Harold

HYPO NOE GROUP ANNUAL REPORT 2012 | 61
active partnersHips on botH sidesThe Red Cross, the voluntary fire brigades and the armed forces have long entered into partnerships with a variety of public and private sector organisations. As part of our cooperation with the Lower Austrian fire Brigade federa-tion – the umbrella organisation for all the voluntary fire brigades in Lower Austria – the Group joined other partners in supporting a campaign to provide free immunisation against hepatitis to all fire fighters in the state.
We are also pleased to be able to support the Lower Austrian annual Red Cross day at Stift Göttweig, which in 2013 takes place in May.
Numerous meet and greet events were held with the units of the armed forces that we partner for the first time in 2012, and many have already taken place in 2013. A cycling
tour of the Grossglockner and Kitzbüheler Horn mountains together with the special forces base was a particular high-light, and joint involvement in lectures, seminars and public festivities is set to continue.
There are two sides to any partnership, whether for busi-ness or pleasure, and HYPO NOE receives active support from its partners, too. We were able to experience this first hand at the opening of our new headquarters in St. Pölten in the autumn of 2012. Voluntary organisations and the Austrian Armed forces staged demonstrations and assist-ed with catering.
Our partnerships are not restricted to events – a loyal rela-tionship with the Group is encouraged by offering partners a range of bespoke banking products on preferential terms such as the HYPO NOE Red Cross account and the HYPO NOE Armed forces account.

62 | HYPO NOE IN ITS CORE MARKET
HYPO NOE LANdESBANK – 29 local brancHes
Your satisfaction comes first. Our team of well trained staff stand ready to provide you with top-quality service at 29 branches in Lower Austria and Vienna.
7 Vienna branches
10 Industrieviertel branches
Hypo noe landesbank headquarters in St. Pölten
6 Mostviertel branches
2 Weinviertel branches
4 Waldviertel branches

HYPO NOE GROUP ANNUAL REPORT 2012 | 63
Hypo noe landesbank headquartersHypogasse 1, 3100 st. pölten tel. +43 (0)5 90910 [email protected]
expert advice on your doorstep: branches in lower austria
Lothringerplatz 122020 HollabrunnTel. +43 (0)5 90910 [email protected]
Wiener Strasse 42100 KorneuburgTel. +43 (0)5 90910 [email protected]
franz Josef Strasse 172130 MistelbachTel. +43 (0)5 90910 [email protected]
Schlosshoferstrasse 42301 Gross EnzersdorfTel. +43 (0)5 90910 [email protected]
freiheitsplatz 72340 MödlingTel. +43 (0)5 90910 [email protected]
Wiener Gasse 272380 PerchtoldsdorfTel. +43 (0)5 90910 [email protected]
Wiener Gasse 32460 Bruck an der LeithaTel. +43 (0)5 90910 [email protected]
Josefsplatz 62500 BadenTel. +43 (0)5 90910 [email protected]
Herrengasse 152620 NeunkirchenTel. +43 (0)5 90910 [email protected]
Hauptplatz 162700 Wiener NeustadtTel. +43 (0)5 90910 [email protected]
Corvinus Ring 3–52700 Wiener NeustadtTel. +43 (0)5 90910 [email protected]
Kremser Gasse 203100 St. PöltenTel. +43 (0)5 90910 [email protected]
Landhaus Boulevard Haus 3/253100 St. PöltenTel. +43 (0)5 90910 [email protected]
Hypogasse 13100 St. PöltenTel. +43 (0)5 90910 [email protected]
Wiener Strasse 283300 AmstettenTel. +43 (0)5 90910 [email protected]
Jakob Prandtauer Strasse 93390 MelkTel. +43 (0)5 90910 [email protected]
Niedermarkt 9–113400 KlosterneuburgTel. +43 (0)5 90910 [email protected]
Bahnhofstrasse 153430 TullnTel. +43 (0)5 90910 [email protected]
Mitterweg 10A3500 KremsTel. +43 (0)5 90910 [email protected]
Obere Landstrasse 143500 KremsTel. +43 (0)5 90910 [email protected]
Kirchenplatz 113580 HornTel. +43 (0)5 90910 [email protected]
Neuer Markt 63910 ZwettlTel. +43 (0)5 90910 [email protected]
branches in vienna
Wipplingerstrasse 21010 ViennaTel. +43 (0)5 90910 [email protected]
Herrengasse 101010 ViennaTel. +43 (0)5 90910 [email protected]
Operngasse 211040 ViennaTel. +43 (0)5 90910 [email protected]
Mariahilfer Strasse 1211060 ViennaTel. +43 (0)5 90910 [email protected]
Porzellangasse 641090 ViennaTel. +43 (0)5 90910 [email protected]
Linzer Strasse 4021140 ViennaTel. +43 (0)5 90910 [email protected]
Schlosshoferstrasse 531210 ViennaTel. +43 (0)5 90910 [email protected]


HYPO NOE GROUP ANNUAL REPORT 2012 | 65
GROUP OPERATiONAL ANd fiNANciAL REviEw 2012

66 | GROUP OPERATiONAL ANd fiNANciAL REviEw

HYPO NOE GROUP ANNUAL REPORT 2012 | 67
GROUP OPERATiONAL ANd fiNANciAL REviEw 65
Economic climate 68
financial review 78
Operational performance 80
Gruppe Bank segment 80
Public finance 80
Real Estate finance 82
corporate and Project finance 82
Treasury & ALM 83
funding 84
investor Relations 84
institutional customers 85
Public Loan Management 85
Participations 86
foreign branches 86
Branch offices 86
Landesbank segment 87
Leasing segment 88
Other segment 88
Human resources management 90
Risk report 92
internal control and risk management system (icS) 112
Research and development 115
communications 116
Group outlook for 2013 116
Events after the reporting period 118

68 | GROUP OPERATiONAL ANd fiNANciAL REviEw
EcONOMic cLiMATE
Global economic and financial market developments
2012 was an unusual year for the capital markets. contra-ry to most forecasts, markets performed remarkably well – surprisingly in view of the severe downside risks already visible in 2011. On top of the global economic downturn and a looming recession, fears of a break-up of the euro, the Greek default and the impending fiscal cliff in the USA all cast a shadow over the year. These factors are good reason for caution in making predictions at the start of 2013.
The unexpected upturn was made possible by the measures taken by central banks and governments. during the sum-mer of 2012 the threat of the disintegration of the single currency forced eurozone leaders and the European central Bank (EcB) to take decisive action to turn markets round. The adoption of the outright monetary transaction (OMT) programme allowing unlimited purchases of eurozone gov-ernment bonds by the EcB was a milestone in moves to de-fuse the euro crisis. European politicians’ determination to save the euro meant that the main players showed greater flexibility and put aside long-held convictions.
The tax increases and spending cuts that came into force at the start of 2013 will weigh on the US economy but are unlikely to derail the recovery.
This review of recent events brings into focus the econom-ic problems that lie ahead, but there is no doubt that last year’s expansionary monetary policies helped take some of the sting out of the global slowdown. Of the 29 central banks of the world’s largest economies, 17 cut their key in-terest rates last year. Ten left them unchanged and only two put them up. in addition, the USA, the UK, Japan and the eurozone made increased use of unconventional measures. in September 2012 the fed launched its QE3 programme – a quantitative easing programme involving expanded pur-chases of government bonds with no time or volume limits. in the space of a few months the Bank of Japan stepped up quantitative easing three times, by a total of 30bn yen (approx. EUR 270bn). The easing of monetary policy in many countries, combined with action by china to stimu-late growth, led to a watershed in the global economy at the turn of the year. with hindsight, it is clear that all these measures played a part in financial market developments.
16
14
12
10
8
6
4
2
0
-2
-4
6
4
2
0
-2
-4
-6
-8
-102003 2004 2005 2006 2007 2008 2009 2010 2011 2012
United States eurozoneChina (right scale) JapanUnited Kingdom Source: Datastream
GDP growth in China, the eurozone, Japan, UK and USA

HYPO NOE GROUP ANNUAL REPORT 2012 | 69
The bond market
Bond market interest rates exhibited an almost unbroken downward trend throughout 2012, and reached historic lows. during the first half of the year these developments were driven by the worsening euro crisis, and in the second half emerging economic worries and the resultant further relaxation of monetary policy across the world maintained
the downward pressure on yields. despite the visible easing of the euro crisis after July, the persistent liquidity glut and special factors such as the investment of the capital con-tributed by EMU members to the European Stability Mech-anism (ESM) in the form of top-rated government bonds fuelled sustained demand for safe sovereign bonds, keeping
-100
0
100
200
300
400
500
600
2 Jan. 20132 Dec. 20122 Nov. 20122 Oct. 20122 Sep. 20122 Aug. 2012
Austria BelgiumIreland FinlandFrance ItalySpain Netherlands Sources: Bloomberg and HYPO NOE Group
Term to maturity: approx. 5 years
Ass
et s
wap
spr
ead,
bas
is p
oint
s
Interest rates on selected eurozone sovereign bonds
Asset swap spreads, selected eurozone sovereign bonds
5
4
3
2
1
0
Jan. 12 Jan. 13Jan. 11Jan. 10Jan. 09Jan. 08Jan. 07Jan. 06Jan. 05Jan. 04Jan. 03Jan. 02Jan. 01Jan. 00
Inte
rest
rat
e le
vel
3M Euribor 2 years 5 years 10 years Sources: Bloomberg and HYPO NOE Group
Euro swap rates

70 | GROUP OPERATiONAL ANd fiNANciAL REviEw
Stock market performance (indexed, base year 2008)
2008 2009 2010 2011 2012
100
80
60
40
20
100
80
60
40
20
S&P 500 DAX 30EURO STOXX 50 NIKKEI 225 MSCI WORLD US$ATX Source: Datastream
interest rates at historically low levels. Owing to the EcB’s decision to buy unlimited amounts of government bonds issued by eurozone peripherals in certain circumstances, the risk premiums on these countries’ bonds plunged dur-ing the second half of 2012. Once the disbursement of aid to Greece was assured, after protracted negotiations and agreement to additional spending cuts investors were able to cross a further risk factor off the list of worries. The EcB made the last of its recent interest rate reductions in July,
trimming the key rate to 0.75% and the base deposit rate to 0.0%. The EcB also extended its armoury of unconvention-al monetary measures by launching the OMT programme and supplying the financial system with unlimited amounts of liquidity – for example, by relaxing its collateral rules. in view of the continuing woes of the eurozone and bleak growth prospects the bank is likely to keep its accommoda-tive monetary policy in place for some time.
The equity market
The stock markets made a bright start to 2012, buoyed by good corporate results. The central banks’ moves to inject liquidity into the financial system played a key role in the upbeat sentiment. The EcB alone pumped an extra billion euro of liquidity into the system at the turn of 2011/12.
Markets began losing steam in the spring as a result of the increasingly noticeable economic slowdown caused by the escalating euro crisis. The risk premium on lending to the euro peripherals did not fall significantly until the second half of the year, after the EcB President’s announcement
that the bank would do “whatever it takes to preserve the euro” and the adoption of the OMT programme in Septem-ber.
Helped by the central banks’ expansionary monetary pol-icies, such as the fed’s QE3 programme, multiple moves by the Bank of Japan to step up its bond buying pro-gramme, and action by countries including china to stim-ulate growth, the global economic environment improved towards the end of the year, opening the way for a strong climb in equity prices.

HYPO NOE GROUP ANNUAL REPORT 2012 | 71
The world’s stock exchanges posted widespread gains on the year despite the shadow cast by of a number of threat-ening scenarios. Almost all the main markets put in good or excellent performances. However, it should not be for-gotten that this was only made possible by highly accom-
modative, unconventional monetary policies. The medium to long-term consequences are unpredictable. An exit from these policies, which is not in sight at present, would lead to turmoil on the equity markets.
Economic trends in the Group’s core markets
AUStrIARecent forecasts from the European commission and the wifO (Austrian institute of Economic Research) see Aus-tria continuing to significantly outperform the eurozone as a whole in terms of economic growth, sovereign debt and unemployment. The country is also consistently running a higher balance of payments surplus than the euro area, and the government’s budget consolidation policies are on course to bring the budget deficit down in 2013.
in 2011 Lower Austria was among the leaders, with a growth rate of 3.4%, whereas the viennese economy grew compar-atively slowly, at 2.2%. in the first half of 2012 both Lower
Austria and vienna were in the upper-mid field, recording growth rates of 1.4% and 1.5%, respectively.
The Lower Austria-vienna region is living up to its role as the powerhouse of the Austrian economy, and contributed 42% of the country’s GdP last year. with regard to the GdP contributions of the two provinces, it should be noted that some 250,000 Lower Austrian commuters add to vienna’s GdP, and pay their taxes and social security there. This dis-torts the regional statistics.
Unemployment rates in the federal states are chiefly influ-enced by the major conurbations, the structures of the reg-ional economies, the level of education of the population,
%
Austria eurozone
2011 2012 2013 2011 2012 2013
Real GdP growth 2.7 0.6 1.0 1.4 -0.4 0.1
inflation (HicP) 3.3 2.3 2.1 2.7 2.5 1.8
Unemployment 4.2 4.4 4.8 10.1 11.3 11.8
Balance of payments as % of GdP 1.9 2.3 2.6 0.3 1.1 1.5
Budget deficit as % of GdP -2.5 -3.1 -2.3 -4.1 -3.3 -2.5
Government debt as % of GdP 72.4 74.7 75.4 88.1 92.9 94.5
Sources: European commission 2012 autumn forecast, wifO September 2012 outlook and Austrian Ministry of finance October 2012 report

72 | GROUP OPERATiONAL ANd fiNANciAL REviEw
topographical conditions and infrastructure. At state lev-el, unemployment is calculated according to the Austrian method, and there are no statistics based on the EU meth-odology. At national level unemployment according to the Austrian measure was 6.7% in december 2011, and climbed to reach 7.2% by September 2012. Unemployment was con-siderably above the national average in Burgenland, carin-thia and vienna, and was equal to it in Lower Austria.
Turning to the budgetary situation of Austrian local author-ities, the combined operating surplus improved markedly between 2010 and 2011 thanks to higher revenues (+4%), a modest increase in expenses (approximately 2%) and the positive effect of low interest rates. The number of local authorities that were unable to balance their operat-ing budgets fell by 50%, to about 600. Aggregate funds available to local authorities after debt servicing increased slightly as a result of the significant improvement in op-
Source: wifO, dec. 2012
0.0
1.0
2.0
3.0
4.0
2.4
0.7
2.2
1.5
2.0
3.4
2.3
0.8
4.0
1.7
2.7
1.6
4.1
1.2
3.4
1.4
3.0
1.2
2011 H1 2012 Austria 2011 Austria H1 2012 Source: WIFO, Dec. 2012
CarinthiaViennaVorarlbergTyrolStyriaSalzburgUpper AustriaLower AustriaBurgenland
0.0
1.0
2.0
3.0
4.0
2.4
0.7
2.2
1.5
2.0
3.4
2.3
0.8
4.0
1.7
2.7
1.6
4.1
1.2
3.4
1.4
3.0
1.2
Growth rates in the Austrian federal states Annual change in real regional GdP (based on previous year’s prices)
of each federal state, excluding agriculture and forestry (%)
0%
5%
10%
15%
20%
25%
2%
16%17%
7%
13%
9%
26%
6%5%
Sources: Statistics Austria and HYPO NOE Group analysis
CarinthiaViennaVorarlbergTyrolStyriaSalzburgUpper AustriaLower AustriaBurgenland
Contribution to national GDP by federal state

HYPO NOE GROUP ANNUAL REPORT 2012 | 73
erating performance. Nevertheless, capital investment by local authorities remained at very low levels. The rising costs of mandatory social security contributions continued to present a severe challenge to local authority budgets. On the whole, the overall budgetary situation of Austrian local
authorities has brightened considerably due to the signifi-cant improvement in Austrian economic performance since the 2009 crisis, and the related growth in revenue in 2010 and 2011.1
0%
2%
4%
6%
8%
10%
8.2%7.5%
6.8%7.3%
9.7%9.2%
5.6%5.6%6.0%5.9%
6.9%6.4%
4.8%4.5%4.7%4.2%
9.4%8.9%
7.2%
Unemployment rate in 2011 Unemployment rate in Sep. 2012 Sources: Statistics Austria and HYPO NOE Group analysis
Carinthia AustriaViennaVorarlbergTyrolStyriaSalzburgUpper AustriaLower AustriaBurgenland
Unemployment, Dec. 2011 to Sep. 2012
1 The effects of the current economic situation at any given time normally only become visible during the following year, due to the deferred accounting method used in the fiscal equalisation system to calculate significant sources of income.

74 | GROUP OPERATiONAL ANd fiNANciAL REviEw
CEntrAl AnD EAStErn EUroPEA comparison of economic growth in central and Eastern Europe (cEE) and the eurozone shows that the cEE region has always enjoyed higher growth rates. This is mainly be-cause of the economic divide between western and emerg-ing Europe, and related efforts to achieve convergence.
The cEE economies expanded by an average of 3.1% and the eurozone by 1.5% in 2011, but in 2012 there was a sharp slowdown to 1.1% in cEE and 0.5% in the eurozone. The cEE
region is forecast to record average growth of 1.6% in 2013 – again well ahead of the eurozone average of -0.1%.
This results in significant variations in the growth rates of the economies that make up the HYPO NOE Group’s focus markets. Among these markets, Austria, the czech Re-public, Germany, Poland and Slovakia have been the fast-est-growing since 2008. The main factors responsible for slower expansion in the cEE region are discussed below.
Economic growth, 2008-2013
-6
-8
-4
-2
0
2
4
6
8 2008
2009
2010
2011
2012
2013
As
% o
f G
DP
Austria
Bulgaria
Czech Republic
eurozone (aggregate)
Germany
Hungary
Poland
Romania
Slovakia
Sources: Economist Intelligence Unit and HYPO NOE Group analysis
1.5
3.1
1.11.6
-0.5-0.1
-6
-4
-2
0
2
4
6
2004
2005 2006
2007
2008
2009
2010 2011
2012 2013As
% o
f G
DP
CEE (agg.) eurozone (agg.) Sources: Statistics Austria and Economist Intelligence Unit
Economic growth comparison, CEE vs. eurozone

HYPO NOE GROUP ANNUAL REPORT 2012 | 75
Euro crisis abatingThe euro crisis intensified in the first half of 2012, but ac-tion by the EcB and EU member states has since calmed the situation.
Global economic downturn affecting Western Europe’s main trading partners – falling overseas demand
cEE countries’ exports rose markedly in 2010. This was partly because some investments put on ice due to the
2009 crisis were carried out in the following year. in 2011 industrial production in the cEE region climbed by 9.6%, significantly outpacing the 6.3% growth registered in the eurozone. final statistics are expected to show that indus-trial output growth decelerated to 2–3% in both regions in 2012. Hungarian exports declined in 2012.
600
500
400
300
200
100
0
CD1967 Hungary USD Sr. CDS curve 5Y(CHUN1U5) 279.70
CD2165 Slovak USD Sr. CDS curve 5Y(CSLVK1U5) 90.54
CD2877 Poland USD Sr. CDS curve 5Y(CPOLD1U5) 81.50
CD662 Czech USD Sr. CDS curve 5Y(CT3499231U5) 60.00
CD977 Germany USD Sr. CDS curve 5Y(CCBR1U5) 40.00
CD977 Austria USD Sr. CDS curve 5Y(CAUT1U5) 44.335
Jan. 2013Mar. 2012 May 2012 Jul. 2012 Sep. 2012 Nov. 2012 Source: Bloomberg, as of 18 Jan. 2013
2007
2008
2009
2010
2011
20122013
-40
-30
-20
-10
0
10
20
30
Austria
eurozone (aggregate)
Eu27 (Agg.)
Hungary
Czech Republic
Poland
CEE (aggregate)
Romania
BulgariaGermany
Slovakia
Ann
ual c
hang
e (%
)
Sources: Economist Intelligence Unitand HYPO NOE Group analysis
CDS curves, selected CEE countries
Export growth, 2007-2013

76 | GROUP OPERATiONAL ANd fiNANciAL REviEw
Declining domestic demand chiefly reflects increased budget consolidation efforts, subdued or contracting con-sumer demand and investment, and credit squeezes in some countries.
Positive trade balances have been the main growth driv-er in the cEE region after 2011. Personal consumption is
forecast to pick up slightly in 2013 after faltering in 2012, and business investment is predicted to support demand in the region in 2013 after making a negative contribution in 2012. Public sector spending has been in decline since 2011 because of the ubiquitous austerity policies, and has been making a negative growth contribution.
4
2
0
-2
-4
-6
-82009
2010 20112012
2013
Investment Trade Government spendingPrivate consumption Sources: Economist Intelligence Unit and HYPO NOE Group analysis
Sectoral growth contributions, CEE region

HYPO NOE GROUP ANNUAL REPORT 2012 | 77
Banking sector trends in the eurozone and cEE
for the eurozone banking sector, and hence for the finan-cial industries of central and Eastern Europe, the main features of 2012 were the obdurate sovereign debt crisis – though this ultimately subsided – and related money mar-ket intervention by the EcB, as well as Basel iii and overall economic trends.
Owing to the prevalent risk aversion among investors, the first half of 2012 was marked by high and volatile credit risk premiums, which had a major impact on the banks’ capi-tal market operations. Market conditions were reflected in a significant reduction in issuance in comparison to the previous few years. Long-term borrowings fell sharply as a proportion of overall refinancing, and this changed the structures of many banks’ balance sheets as it meant that maturities of both assets and liabilities became shorter.
Many banks were restricted to issuing covered bonds. Some banks in peripheral countries found it virtually impossible to find takers for their bonds. Thanks to the EcB’s long-
term refinancing operations (LTRO) programme the banks were nevertheless able to meet their refinancing needs and there was no liquidity crunch. At the same time there was a big increase in interbank refinancing. when market con-ditions eased in the fourth quarter and the spreads rapidly narrowed the banks began returning the EcB funding.
Meanwhile Basel iii led to considerably more restrictive div-idend policies and to a rundown of risk weighted assets. The banks increased their equity and core capital in both abso-lute and relative terms.
Low credit demand, high refinancing costs and the banks’ efforts to shed risk weighted assets resulted in a corre-sponding reduction in outstanding loans. There is a strong correlation between GdP growth and lending volume.
The current weakness of economic activity is also mirrored in the pronounced rise in nonperforming loan ratios in the course of 2012.

78 | GROUP OPERATiONAL ANd fiNANciAL REviEw
fiNANciAL REviEw
financial performance in 2012
2012 was a successful year for the HYPO NOE Group de-spite the persistent strains on the international financial system. At EUR 22.8m the profit attributable to the owners of the parent was above the level of the past few years, with the exception of 2011 (EUR 89.5m), when a one-time effect in the shape of the disposal of our interest in Raiffei-sen Zentralbank AG resulted in exceptionally high net gains on financial assets. in 2012 the Gruppe Bank segment was again the business that made the largest contribution to profits, but the Landesbank and Leasing segments also recorded profits for the year, as they had in 2011.
HYPO NOE first facility GmbH (ff), included in consolida-tion since the third quarter, posted a profit before tax of EUR 0.8m.
due to continued low interest rates and the growth of our business, net interest income was close to the previous year’s high level at EUR 135.4m (2011: EUR 138.8m).
The cost of risk in the Bank’s lending business held steady, edging up by just EUR 1.0m to EUR 21.2m.
Net fee and commission income dipped by EUR 0.5m to EUR 12.0m, largely as a result of lower income from lending.
The Bank made a net trading loss of EUR 0.8m which arose from the fair value measurement of derivatives used for economic hedges.
General administrative expenses, including those of ff, rose by 13.5% to EUR 107.0m (ff: EUR 5.5m). Staff costs were up by 18.1% to EUR 61.9m (ff: EUR 4.5m) and other admin-istrative expenses by 10.9% to EUR 39.8m (ff: EUR 0.8m), while depreciation, amortisation and impairment fell by EUR 0.7m (ff: EUR 0.3m). The rise in staff costs was mainly caused by an increase of 236 in the average head count (ff: 189) to a total of 894. The statutory financial stability contribution reported under other administrative expenses climbed by EUR 1.3m to EUR 6.3m.
Net other operating expense/income was positive by EUR 17.2m (2011: EUR 20.1m); ff contributed EUR 5.8m. The pre-vious year’s high figure mainly reflected income from ma-tured forex derivatives.
Net gains or losses on financial assets were negative by EUR 7.1m due to losses on the disposal of bonds issued by the PiiGS2 economies, as well as cypriot and Hungarian government bonds.
The profit before tax was EUR 30.2m – a year-on-year de-crease of EUR 88.4m (2011: EUR 118.6m).
The downturn was also mirrored in the following financial performance indicators:
2012 2011 2010 2009
Return on equity before tax Profit before tax/average equity 6.5% 29.2% 1.9% 6.8%
Return on equity after tax Profit for the year/average equity 4.9% 22.0% 1.8% 5.5%
cost/income ratio Operating expenses/operating income 67.6% 40.4% 76.4% 57.3%
Risk/earnings ratio credit provisions/net interest income 15.6% 14.5% 13.1% 24.6%
2 Portugal, ireland, italy, Greece and Spain

HYPO NOE GROUP ANNUAL REPORT 2012 | 79
The previous year’s ratios were mainly driven by the one-time effect of the disposal of our interest in Raiffeisen Zen-tralbank AG, recognised in net gains on financial assets.
ASSEtS AnD lIAbIlItIESThe Group’s total assets grew by EUR 1.6bn or 12.3% year on year to stand at EUR 14.9bn at the end of the reporting period, lifted by gains of EUR 1.0bn in loans and advances to customers and of EUR 0.3bn in loans and advances to banks.
On the equity and liabilities side of the balance sheet there were increases of EUR 1.1bn in debts evidenced by certifi-cates and of EUR 0.3bn in deposits from banks. deposits from customers were down by EUR 0.2bn.
EqUIty (IFrS)ifRS consolidated equity including non-controlling inter-ests was EUR 497.5m – up by EUR 66.4m year on year. The main reasons for the growth in equity were the annual prof-it and the rise in the AfS reserve for remeasurement of financial assets to fair value.
rEGUlAtory CAPItAl (AUStrIAn bAnKInG ACt)consolidated eligible capital as defined by the Austrian Banking Act was EUR 668.5m as at 31 december 2012 (2011: EUR 689.4m). Surplus capital was EUR 317.4m (2011: EUR 373.9m), compared to a capital requirement of EUR 351.1m (2011: EUR 315.5m). The core capital ratio was 12.3% (2011: 13.3%), and the equity ratio was 16.3% (2011: 18.8%).

80 | GROUP OPERATiONAL ANd fiNANciAL REviEw
OPERATiONAL REviEw
Gruppe Bank segment
The Group’s parent, HYPO NOE Gruppe Bank AG, can now build on 125 years’ experience of working to maximise cus-tomer benefits, in line with its creed of “dependability and excellence”. The Bank is one of the main financial insti-tutions in Lower Austria, and in 2012 again showed itself to be a solid and reliable source of public, business, real estate and lease finance, as well as treasury services for customers in Austria and the danube region. its long expe-rience enables the bank to offer optimum solutions across a wide range of products and services. The confirmation of the bank’s A/stable/A-1 rating by Standard & Poor’s (S&P) provides strong backing for its strategy of working for sta-bility and shareholder value, and concentrating on its core business. due to the continuing strains in the eurozone, in december 2012 all comparable Austrian banks reviewed by S&P were given a single-A rating with a negative outlook.
The HYPO NOE Group provides its customers with financing solutions in its core areas of expertise: public finance and real estate finance. The Group takes a selective approach
to operations outside Austria, and is active in Bulgaria, the czech Republic, Germany, Hungary, Poland, Romania and Slovakia.
Staff at the representative offices in Budapest and Prague, and in vienna who are native speakers of the relevant lan-guages follow developments in these markets and build relationships there. They are supported by experts in spe-cialist units in vienna, who ensure that solutions are struc-tured and documented to the highest professional stand-ards. This bespoke customer service facilitates the transfer of special financing models from Austria to the Group’s wid-er home market, the cEE region.
in 2012 loans were extended to new and existing customers with good credit ratings, taking a conservative approach. we will continue to attach great importance to detailed analysis of the market environment, as well as the signif-icance of the projects in question for economic develop-ment in the regions concerned.
Public finance
Our Public finance department partners local and regional authorities, and public agencies, as well as infrastructure companies. in 2012 the department focused on expanding its public sector and infrastructure project finance activi-ties. due to the spending constraints faced by state govern-ments and local authorities, innovative financing solutions and public-private partnerships (PPPs) are in growing de-mand.
At the beginning of 2012 HYPO NOE Gruppe Bank’s exten-sive experience of all aspects of housing construction fi-nance, and its history as a specialist mortgage bank, won it the tender for the purchase of around 16,700 Lower Aus-trian home construction loans. This was a resounding en-dorsement of the breadth of our expertise, and will make a significant contribution to long-term profitability.
HYPO NOE Gruppe Bank has established end-to-end pro-cesses for public construction projects, allowing it to serve as a one-stop shop for this sector in Austria. Throughout
the design-finance-build-operate cycle, our services are aimed at sustainable asset creation and management for public sector clients.
2012 was a memorable year in many respects. we finalised major projects, including some with an international dimen-sion. A number of healthcare and road building projects were successfully planned and implemented. The acquisi-tion of new customers in other Austrian federal states, in-cluding Burgenland, Styria and vienna, significantly raised the Public finance department’s profile. The department pursues opportunities abroad in accordance with our dan-ube region strategy, providing consultancy services and fi-nance for selected regions and large cities.
�Social infrastructure: in the education sector, HYPO NOE Gruppe Bank implemented a variety of projects in-cluding the construction of the new Oberes Ennstal vo-cational school for agriculture, forestry and nutrition in Styria, alterations and extensions to secondary schools in Bruck an der Leitha and Horn, and the construction of

HYPO NOE GROUP ANNUAL REPORT 2012 | 81
a federal training institute for kindergarten teachers in Oberwart, Burgenland. �Hard infrastructure: HYPO NOE Gruppe Bank provided finance for many hard infrastructure projects, including a multi-storey car park at St. Pölten station, a railway bridge in St. Pölten for the Leobersdorf line, and the comprehensive rehabilitation of sports facilities in Klos-terneuburg. The bank also continued its involvement with water supply and wastewater projects, and various road building projects. in the emergency services sector, the bank funded the conversion and extension of Loosdorf fire station, and the construction of a new emergency services centre in Leopoldsdorf. Long-standing partnerships with fire brigades, ambulance services and the armed forces are central to our philosophy in this market.True to our one-stop-shop approach, construction of a new kindergarten building in Korneuburg came with our new building and energy cost guarantee. This project was a one of the year’s outstanding success stories. in vienna, the bank won a public tender to finance the rebuilding of the donaustadt senior citizens’ centre and
the kindergarten in vienna’s Stadtpark – further advanc-es towards positioning HYPO NOE Gruppe Bank as a bank for the Austrian capital as well as for Lower Austria.
Another priority was closer cooperation with strategic part-ners in infrastructure banking, such as the European invest-ment Bank (EiB), on project finance.
The MedAustron project in wiener Neustadt is a fantastic example of what strategic partnerships can achieve. fi-nancing for MedAustron was secured in cooperation with the EiB at the beginning of 2012, enabling a project with European significance to go ahead.
The prime objective is to offer customers sound, holistic solutions, in cooperation with other departments, and to figure more prominently as a provider of expertise and ser-vices. Public finance always sets out to understand custom-ers’ special requirements, and deliver first-class, risk-aware advice and service.
2012 was a successful year for the department, which made a significant contribution to the Gruppe Bank segment’s profit.

82 | GROUP OPERATiONAL ANd fiNANciAL REviEw
Real Estate finance
The Real Estate finance department’s operations con-tinued to focus on our core real estate markets – Austria, Germany and the neighbouring EU member states in cen-tral and Eastern Europe. The Real Estate finance business model is based on the office, shopping centre, retail park, logistics facility and business hotel asset classes, and on relatively conservative lending terms. The key product used to fund these projects is conventional loan finance.
commercial real estate project finance remained a growth area for HYPO NOE Gruppe Bank in 2012, with the Bank providing EUR 200m of financing for projects in this sector during the year. Geographically, these activities were fo-cused on Austria, the czech Republic, Poland and Slovakia.
in cooperation with Group Treasury, the department also provided conventional loan finance customers with interest rate hedging instruments.
Operations concentrated on inner city asset classes in 2012, including apartment buildings, office buildings and hotels, as well as retail properties.
The Bank’s strategy for Real Estate finance will in future focus even more closely on the entire real estate value chain and generating additional income from real estate services, in order to build on the profit contribution of 2012. Geographically, commercial real estate financing and real estate services will continue to be concentrated on the danube region, and selectively on neighbouring EU mem-ber states.
The Real Estate finance department made a key contribution to the Gruppe Bank segment’s positive result for the year.
corporate and Project finance
The corporate & Project finance department provides tai-lored finance solutions for a highly diverse range of invest-ments in the corporate and infrastructure sectors, in Aus-tria and the danube region. The department provides local customers, and clients across the region, from Germany to Bulgaria, as well as in Poland, with comprehensive services.
it focuses on selected leading companies in these markets, and aims for an optimum balance of risks and returns. Thanks to the systematic build-up of expertise in the de-partment over the past few years it has succeeded in ex-panding its product portfolio to meet customer needs, and gaining wide-ranging expertise in the forms of finance it specialises in.
due to continued low interest rates, demand for all types of financing was up throughout 2012.
The department provided project finance as well as engag-ing in corporate lending. Alongside successful transactions involving hard infrastructure and regional social infrastruc-ture such as senor citizens’ homes, project finance solu-tions were developed for other sectors, including wind and
solar energy. Our involvement in renewable energy projects means that HYPO NOE Gruppe Bank is playing an active role in working towards the EU’s “20-20-20” energy policy targets, under which 20% of final energy consumption is to come from renewables by 2020.
demand from Austrian and German clients for finance for wind and solar generating stations is growing. in Austria, and in particular in Lower Austria, many wind farms are in search of funding, and these projects will have a major economic and environmental impact if they go ahead. in Germany, the bank financed free-standing solar arrays with an installed capacity measured in double figures of mega-watts.
for strategic reasons, HYPO NOE Gruppe Bank cooperates on many projects with other banks and international finan-cial institutions, including the European investment Bank (EiB), Kreditanstalt für wiederaufbau (Kfw) and the Euro-pean Bank for Reconstruction and development (EBRd). Such partnerships allow us to offer our customers a wider range of services.

HYPO NOE GROUP ANNUAL REPORT 2012 | 83
Our deposit taking business also performed well last year – a reflection of our good credit rating and stable ownership (by Lower Austrian state government).
The importance we attach to close relationships with cus-tomers and a profound understanding of their business processes means that we are well placed to develop and deliver the right solutions for their plans. The loyalty of our
existing customers and our ability to keep attracting new business shows how much this approach, combined with our investment grade credit rating and stable ownership structure, are valued.
corporate & Project finance made a positive contribution to segment earnings.
Treasury & ALM
The Treasury & ALM department played a part in the Gruppe Bank segment’s positive result for 2012.
An important initiative taken to help build up customer business was the establishment of a treasury solutions desk to brief clients on our treasury products. The focus is on providing advice in cooperation with account managers from the core business areas.
in 2012 the bank’s own investments were shaped by the coming Basel iii requirements, and the emphasis was sys-tematically shifted towards covered bonds and state gov-ernment bonds. Risk in the securities portfolio was substan-tially reduced, but the portfolio nevertheless performed well. The Aquarius bond was fully redeemed in 2012. fol-lowing extensive internal investigations with the assistance of independent auditors, it is now clear that HYPO NOE Gruppe Bank at no point sustained a loss as a result of the overall Aquarius transaction (the sale of Lehmann bonds and purchase of Aquarius bonds) and the modalities cho-sen for it, and indeed the bank made a profit from it.
Bank-wide interest rate risk has been managed by a sep-arate unit since 2011. The objective of Asset Liability Man-agement is to improve the trade-off between overall risk and returns on equity, as well as to ensure the best possible utilisation of capital. The department’s recommendations are discussed by the ALM committee which is the body responsible for coordinating the management of ALM pro-cesses. implementation of the proposals is on the basis of Management Board resolutions.
Last year’s low interest rates had a positive effect on the interest risk structure.
derivative financial instruments are used – mainly as hedg-es – to manage interest rate risk and the structure of the balance sheet.
A consistently applied benchmark rate system for the mar-ket prices of instruments with matching maturities ensures that risks are correctly allocated to market units.
institutional customers
close cooperation with institutional customers in Austria, other European countries and selected other countries around the world is central to HYPO NOE Gruppe Bank’s business model. This customer group comprises banks, insurance companies, pension funds, utilities and invest-ment companies. institutional customers value our flexible product design philosophy, our customer driven approach, our focus on long-term relationships and our quick deci-sion-making processes.
we provide holistic customer advice and support across the entire product range, via a central contact and specialists in the sales units.
Providing investors with up-to-date information on the HYPO NOE Group’s performance plays an especially impor-tant role. Events, roadshows, and regular meetings with and visits to investors all help to maintain open communication flows in both directions.
84 | GROUP OPERATiONAL ANd fiNANciAL REviEw
funding
The market environment in 2012 was ideal for the imple-mentation of planned measures to safeguard liquidity. in order to comply with stricter regulatory requirements and in preparation for the expiry of the state government guar-antee in 2017, priority was given to long-term refinancing.
Both of our two benchmark covered bond issues – EUR 500m issues due in seven and ten years, respectively – were heavily oversubscribed. issues of long-term senior un-secured bonds also raised EUR 94m (including promissory notes).
The issues attracted interest from new countries, and the bonds found buyers not just in the established markets in
the German-speaking world, but also in france, Scandinavia and Asia.
Private covered bond placement volume met our growth target, marking an important step towards achieving our liquidity goals. The bank’s strong position on the Austrian covered bond market was consolidated in 2012.
Our first venture into the long-term senior unsecured bond market also met with success. A total of EUR 358m of put-table bonds were issued in order to diversify the range of refinancing instruments used. General collateral pooling al-lowed us to increase the use of repos for intrayear funding.
investor Relations
investor relations activities were stepped up in 2012, with a focus on broadening the investor base for the bank’s is-sues, especially in Europe and Asia, and on opening up new foreign markets.
Our first-ever roadshows were staged in connection with the benchmark issues, and showcased HYPO NOE Gruppe Bank as a well established and stable issuer. The bank was also represented at a number of covered Bond days events in france and Germany, mainly aiming its message at in-vestors who were newcomers to the Austrian covered bond market. conferences in frankfurt, London and Munich also
provided many opportunities to talk to investors. we hosted our third round table for bank analysts, featuring an inter-national line-up of speakers, in vienna in May 2012.
All of these activities were very well received by represent-atives of our investors – principally insurance companies and pension funds – and enabled us to strike up many new business relationships.
investor Relations began issuing quarterly reports in 2012, to meet investors’ needs for timely information on the Group’s business performance during the year.

HYPO NOE GROUP ANNUAL REPORT 2012 | 85
Public Loan Management
The Lower Austrian state government currently extends preferential loans to around 200,000 people and business-es in the region. HYPO NOE Gruppe Bank manages these loans and is the first point of contact for recipients of Lower Austrian subsidies when they have queries about account administration, account balances and repayments. The bank provides Lower Austrian owner-builders, as well as other kinds of borrowers and the many housing coopera-tives in the state with cheap and efficient loan management services, sending out approximately 200,000 instalment schedules every year. with an online platform for borrowers up and running, they now have convenient online access to account information and tax office confirmations going back several years. This has contributed to sustainability by reducing the number of hardcopy account statements and
tax office confirmations traditionally sent out in January by about 60%, to 70,000 – at the same time as improving the service provided. Alongside the correspondence that is sent out automatically, the bank answers over 34,000 cus-tomer queries individually each year.
The number of loan applications processed for the Lower Austrian state government continued to rise in 2012, grow-ing by 4,000. This means that HYPO NOE Gruppe Bank now has about 302,000 direct loans, totalling over EUR 6bn, un-der management on behalf of the state government.
we also maintain the accounts of many Lower Austrian state government grants, including those related to envi-ronmental protection, schools and kindergartens.

86 | GROUP OPERATiONAL ANd fiNANciAL REviEw
Participations
The Participations department manages and coordinates the Group’s equity investments. 2012 was a year of major restructuring exercises.
The acquisition of HYPO NOE first facility GmbH was com-pleted in 2012. first facility GmbH, including its domestic and foreign subsidiaries, was acquired in July 2012, after being offered for sale by its previous owner, EvN AG, for strategic reasons. The company was purchased by NÖ Hypo Beteiligungsholding GmbH. One of the leading full-service
facility management companies in Austria and the cEE region, HYPO NOE first facility mainly offers facility man-agement, facility management consultancy and real estate management services. The takeover gave HYPO NOE Real consult GmbH additional property services which it has in-tegrated to form an end-to-end process chain, as well as an established brand, customer references and expertise, ena-bling it to enter this new market quickly and efficiently. As part of its integration in the HYPO NOE Group the company was renamed HYPO NOE first facility GmbH.
foreign branches
HYPO NOE Gruppe Bank AG had no foreign branches in 2012, but operated representative offices in the czech Republic (Prague) and in Hungary (Budapest).
Branch offices
HYPO NOE Gruppe Bank AG has operated a branch office at wipplingerstrasse 4, 1010 vienna since 2008.

HYPO NOE GROUP ANNUAL REPORT 2012 | 87
Landesbank segment
HyPo noE lAnDESbAnK AGHYPO NOE Landesbank is a byword for traditional values, stability and expertise. The bank builds stable long-term customer relationships, and sustainability, reliability and customer focus are central to its philosophy.
The bank’s branches continue to act as local organisation-al hubs and are in the front line of the sales effort. They are supported and supplemented by centres of expertise for home construction, business and premium banking cus-tomers, as well as mobile service delivered to customers at their own premises and outside banking hours.
The bank’s 29th branch came into being when the Group’s new headquarters in St. Pölten opened in November 2012. Located at the intersection of the town centre and the state government quarter, the new flagship branch is in a prominent location and makes all of the bank’s know-how available in one place. it marks another step forward in the steady, selective expansion of our service offerings.
in recent months the bank’s business policies have been marked by a still tighter focus on its three core markets:
�Home and family �Health care �Education
HYPO NOE Landesbank strives to be a competent and trustworthy partner for its customers in each of these three areas. Since top quality advisory services and custom
solutions are high on the bank’s agenda, staff training and development is a top priority.
HYPO NOE Landesbank is still operating in difficult market conditions, characterised by fierce competition for deposits and loans, and a challenging interest rate environment with money market and capital market rates at historic lows.
The flat and low interest rate curve, symptomatic of the harsh economic climate, has a marked negative impact on net interest income. while in most cases the bank is still paying the minimum interest rate (base rate) on deposits, the rates on loans and advances are continuing to decline. This in turn puts pressure on HYPO NOE Landesbank’s gross margin.
in spite of this, the bank returned a profit on ordinary ac-tivities in 2012. Given the exceptionally difficult operating environment this is clear proof that its business model is sustainably profitable.
deposits grew healthily in the course of the year. The bank’s core functions within the Group are attracting savings de-posits, issuing covered bonds and extending housing con-struction loans.
Also encouraging was the trend in the cost of risk during the reporting period; this came in significantly lower than in previous years. Past investments in risk and workout management, and topping up of the related resources had a highly positive effect on measured risk. The bank remains focused on risk-aware growth.

88 | GROUP OPERATiONAL ANd fiNANciAL REviEw
Leasing segment
HyPo noE lEASInG GmbH HYPO NOE Leasing GmbH is the Group’s product subsidiary for special-purpose finance solutions, and in particular for leasing. The company sets out to be a specialist provider of leasing solutions for the public sector in Lower Austria and vienna. its main areas of activity are real estate and medical equipment leasing, and equipment leasing for local authorities. vendor leasing plays an increasingly important role. car leasing is not part of the company’s operations.
The value added tax advantage enjoyed by real estate leas-es was significantly reduced by the 2012 Stability Act, sub-ject to long-term transitional provisions.
Alternative leasing models, such as life cycle lease solutions including energy efficiency measures were added to HYPO
NOE Leasing’s range of services in the course of the year. Real estate and equipment leasing grew in 2012, and the segment made a positive contribution to the consolidated profit for the year. HYPO NOE Leasing remains a leader in the Austrian real estate leasing market: verband Österre-ichischer Leasing-Gesellschaften (Association of Austrian Leasing companies) ranked HYPO NOE Leasing fourth in the domestic market in terms of existing leases.
Highly complex leasing projects were successfully initiated, and others completed and handed over during the year. for example, the new kindergarten in vienna’s Stadtpark was built (opening in february 2013). Another highlight was the conclusion of a framework agreement with NÖ Landesk-liniken-Holding to continue to provide leasing finance for medical equipment.
Other segment
HyPo noE rEAl ConSUlt GmbHHYPO NOE Real consult has always concentrated on the Lower Austrian and vienna markets, and continued to fol-low this policy in 2012. A new management team was in-stalled in good time, allowing a smooth transition which ensured continuity.
On the project development side, two high-end home building projects in attractive vienna green belt locations were launched in 2012. The company was also engaged to develop a high-profile project in Korneuburg, and work began in 2012, in cooperation with the Bundesimmobil-iengesellschaft (federal Property company), which will partner it when the time comes to execute the project. in addition, HYPO NOE Real consult formed a project consor-tium with a major construction company to build detached and semi-detached homes at a site in vienna’s 22nd dis-trict. As well as being responsible for activities related to the Group’s existing property portfolio, the Project devel-opment department undertakes new projects and acts as a developer for third parties.
Project management activities continued apace in 2012, and work on many major construction projects was suc-cessfully completed. These included the St. Pölten foot-ball stadium, the expansion of the iMc Krems campus, a lab building at the institute of Science and Technology (iST) Austria in Klosterneuburg, a technical centre at the University Research center Tulln and a variety of other projects for public sector clients. As usual, projects were handed over on time, on budget and to the satisfaction of the clients.
Management of a number of projects began in 2012, for Amstetten Provincial Hospital, iST Austria and Karl Landsteiner University, among other clients. HYPO NOE Real consult was awarded the contract to manage a major international project in the shape of Unter den Linden 74, Berlin Mitte.
The Property Management department also won the prop-erty management tender for the headquarters of the Low-er Austrian state hospital holding company, with a package that for the first time included services to be provided by HYPO NOE first facility. Another major focus of activity

HYPO NOE GROUP ANNUAL REPORT 2012 | 89
was implementation of the contract to manage about 480 housing units on behalf of Korneuburg council. A field of-fice was set up for this purpose. we also began partnering Traismauer council, and HYPO NOE Real consult is now responsible for the operational management of the town’s property company.
HYPO NOE Real consult successfully launched a new area of business, real estate brokerage, in the second half of 2012.
HyPo noE FIrSt FACIlIty GmbH HYPO NOE first facility GmbH joined the HYPO NOE Group on 2 July 2012.
The company is a non-captive, full-line provider of facility management services in Austria and cEE, offering facility management, fM consulting, energy and environmental consulting, real estate management and other property-re-lated services.
contract fulfilment is primarily by the company’s own staff. Subcontractors are mainly used to provide specialist exper-
tise, and security, cleaning, gardening and snow clearing services.
The company won the following major contracts in 2012: �Three-year contract to operate a large designer outlet centre; � 15 energy audits in various cEE countries for a property management company; �contract to operate the RPi Sky Tower in Bucharest; �Building alterations for various financial services compa-nies in Hungary; �Operating contracts in Slovakia and contracts to operate five out-of-town retail parks in Hungary.
in 2012 the product portfolio was widened by the addition of a four-stage resource and energy saving programme for commercial properties.
On 31 december 2012 the company’s financial year was ad-justed to match that of the HYPO NOE Group, with effect from 2013. HYPO NOE first facility ended its short financial year in 2012 on budget.

90 | GROUP OPERATiONAL ANd fiNANciAL REviEw
HUMAN RESOURcES MANAGEMENT
in today’s business environment, employees’ skills, sense of responsibility and health are fundamental to success. The challenge for both management and workforce is to main-tain legal and regulatory compliance whilst leaving enough leeway for staff development.
HR facts and figures
At year end 2011 the HYPO NOE Group had 917 employ-ees* (end-2010: 670), of whom 39 were on parental leave. The workforce comprised 504 male and 413 female staff
* The large year-on-year increase in the number of employees is due to the acquisition of first facility GmbH (183 employees in Austria) on 2 July 2012.
(end-2011: 332 male and 338 female). in terms of full-time equivalents (fTE), there were 851.0 employees at year end (end-2011: 629.3). The head count falls to 812.2 fTE as at 31 december 2012 if non-active employees are excluded.
five people were employed at our representative offices abroad (2011: six). in 2012 a total of 142 vacancies** were filled (2011: 106).
The table below shows changes in employee numbers over time.
** including staff replaced at HYPO NOE first facility GmbH from 2 July 2012.
Key: m = male; f = female; fTE = full time equivalents; Hc = head count
HyPo noE Gruppe
bank AG
HyPo noE landesbank
AG
HyPo noE real Consult
GmbH
HyPo noE leasing
GmbH
HyPo noE Valuation &
Advisory GmbH
HyPo noE First Facility
GmbH HyPo noE
Group
2011 HC total 268 326 43 33 – – 670
m 140 162 18 12 – – 332
f 128 164 25 21 – – 338
Ave. HC p.a. total 251.3 330.4 44.2 32.5 – – 658.4
FtE total 253.2 304.2 41.3 30.6 – – 629.3
m 135.2 161.4 18.0 12.0 – – 326.6
f 118.0 142.8 23.3 18.6 – – 302.7
2012 HC total 324 325 50 31 4 183 917
m 171 163 21 11 2 136 504
f 153 162 29 20 2 47 413
Ave. HC p.a. total 306.6 317.7 46.3 31.8 2.3 188.8 893.5
FtE total 296.4 297.9 45.6 28.9 4.0 178.2 851.0
m 160.5 160.0 19.5 11.0 2.0 136.0 489.0
f 135.9 137.9 26.1 17.9 2.0 42.2 362.0

HYPO NOE GROUP ANNUAL REPORT 2012 | 91
Organisational issues
changes to the Bank’s remuneration policy were imple-mented in 2012 to comply with the amendments to the Banking Act (transposition of cRd iii). in 2012 the Super-visory Board established a Remuneration committee as re-quired by the new legislation, and approved the principles of HYPO NOE Gruppe Bank’s remuneration policy and the guidelines for variable compensation for identified staff. The new performance review format was used, and was aligned to the revised remuneration policy.
A major challenge in 2012 was a changeover to new, inte-grated and hence significantly more efficient HR manage-ment software. Payroll and training administration were migrated to the new system on 1 January 2013.
Standardised customer satisfaction surveys were conduct-ed across the Group for the first time in 2012, taking in both internal and external customers. Measures to be taken on the basis of the survey results were drawn up in each de-partment, in the interests of continuous improvement. Sur-veys will be conducted again in 2014.
The relocation of staff from three offices in St. Pölten to the Group’s new headquarters was completed on schedule at the beginning of 2012. Around 400 staff are based in the new building.
The acquisition of first facility GmbH meant that 183 staff in Austria joined the Group, as well as about 100 people employed by the company’s subsidiaries in central and South-Eastern Europe.
HR development
Personal and professional development for executives and other staff members remains a high priority. 2012 saw the continuation of our established training programmes, as well as the launch of some new initiatives, meaning that a wide range of activities took place.
Alongside the existing Best of Leadership initiative, which supports staff across the Group when they take up new management positions, a high potentials programme was rolled out at the end of 2012. The programme offers staff with management potential and specialist expertise an op-portunity to explore their development options and pursue them in projects.
There was also a focus on team development in 2012, re-sulting in an increased number of team retreats and team coaching sessions.
Alongside the many external seminars, a number of inter-nal training courses were held on topics of special interest. Once again, in 2012 all participants completed the Group induction course, which is conducted by internal trainers.

92 | GROUP OPERATiONAL ANd fiNANciAL REviEw
RiSK REPORT
The HYPO NOE Group defines risk as the possibility of un-expected, unfavourable future developments that could have adverse effects on the assets, earnings or liquidity of the Group or of individual subsidiaries.
All major business activities in pursuit of the Group’s cor-porate strategic goals are planned to reflect strategic risk considerations, with very close attention to risk bearing ca-pacity. The Group attaches particular importance to ensur-ing that risks are incurred only where the potential rewards are commensurate. Risks are not ends in themselves; they are assumed in the interests of value creation, and may therefore only be incurred where risk bearing capacity is sufficient and the return on risk capital is adequate. The refinement of instruments and processes designed to main-tain an appropriate balance of risks and rewards is integral to the Group’s long-term strategy.
The HYPO NOE Group also maintains a healthy balance be-tween risk bearing capacity and the risks incurred. The eli-gible risk coverage capital is very carefully defined, and the confidence level for risk quantification (i.e. the probability of loss) is set at a conservative level.
The disclosure of risks is based on the Group’s internal risk management and risk reporting systems, and ifRS 7 finan-cial instruments: disclosures.
rISK mAnAGEmEnt SyStEmAchieving business success necessarily involves taking risks. The HYPO NOE Group practises active risk trans-formation – risks are incurred on the basis of considered decisions. The Group’s risk management objectives are to identify, quantify and actively manage all types of banking risks (credit, interest rate, market, liquidity, operational and reputational risk).
Our organisational structure provides for a clear separation of the front and back office functions (four-eye principle) at every level up to the Management Board. The front of-fice functions originate business and give initial clearance to transactions, while the back office functions cast a sec-ond vote (second opinion) that confers final approval. The unani mous approval of the front and back office functions is required for decisions going beyond the limits and col-laterals established by staff members’ decision-making authorities. There is also a clearly defined process for the approval of exposures requiring resolutions of the Group Supervisory Board.
in principle, all quantifiable risks throughout the HYPO NOE Group are subject to the Group-wide, uniform limit system, which is constantly monitored. No risk may be assumed un-less a corresponding limit is in place. The Group-wide risk reporting system ensures that reporting of all risks is reg-ular, timely and comprehensive. in addition to the monthly icAAP report, which provides an aggregated summary of all risks and their capital coverage, the Management and Supervisory boards receive separate, regular risk reports for each risk category. These provide comprehensive infor-mation on current risk developments.
The disclosures required by sections 26 and 26a Austri-an Banking Act in conjunction with the Offv (fMA disclo-sure Order) are on a consolidated basis for the HYPO NOE Group, in a separate document posted on our website.
The rules and procedures for introducing new areas of business or products, and entering new markets, require detailed prior analysis of the relevant business risks. with-out exception, transactions entailing risks are only permit-ted if the latter are explicitly covered and authorised in the Group’s risk documentation. we normally restrict our expo-sures to areas where we have the necessary expertise to assess and manage the specific risks involved. where the risk situation is unclear, or where there are methodological uncertainties, the principle of prudence prevails.
AGGrEGAtE rISK mAnAGEmEnt AnD rISK bEArInG CAPACIty (ICAAP)The quantification and monitoring of total bank risk at port-folio level is the responsibility of the Group Strategic Risk Management department, and encompasses the measure-ment, aggregation and analysis of all the risks assumed.
The HYPO NOE Group has observed the statutory require-ments arising from Basel ii since the start of 2008. Apart from calculating the minimum capital requirements on the basis of the standardised approach (Pillar 1 of the Basel ii regulations), this mainly involves active management of all material risks as part of the Group’s internal risk manage-ment process (Pillar 2, icAAP) and compliance with the dis-closure requirements (Pillar 3 of the Basel ii regulations). The key elements of this ongoing process are the planning, aggregation, management and monitoring of all risks, as-sessment of the adequacy of economic capital in relation to the risk profile, and the use and ongoing refinement of appropriate risk management systems.

HYPO NOE GROUP ANNUAL REPORT 2012 | 93
Maintenance of adequate risk bearing capacity is moni-tored by two control loops:
1) The economic capital management control loop is dedi-cated to creditor protection from a liquidation perspective. Risks are evaluated at a high confidence level (99.9% with a holding period of one year) and compared with the risk coverage capital available in the event of liquidation.
2) The going concern management control loop is designed to ensure that the Bank survives as a going concern. Risks are evaluated at a lower confidence level (95% with a hold-
ing period of one year) and compared with the realisable coverage capital available without endangering survival.
The HYPO NOE Group’s risks and risk limits (including buff-ers) for the purposes of economic capital management as at 31 december 2012 are shown below:
in spite of the adverse market environment created by the financial crisis, the HYPO NOE Group’s risk cover as at 31 december 2012 amounted to only 78.4% of the risk lim-it (including an adequate buffer), and was thus marginally better than at 31 december 2011 (78.5%).
risks and risk limits (including buffers) for the purposes of economic capital management as at 31 Dec. 2012
Interest rate risk
Market price risk
Operational risk
Credit risk
Aggregate risk: 333,549
Investment risk
Buffer
Undisclosed reserves
Risk coverage capital: 472,449
Risk limit
Accounted for using the equity method (esp. EWU)
Core capital
Liquidity risk
50,0000 100,000 150,000 200,000 250,000 300,000 350,000 400,000 450,000

94 | GROUP OPERATiONAL ANd fiNANciAL REviEw
SIGnIFICAnt rISK-rElAtED DEVEloPmEntS In 2012
credit risk
One of the key challenges is the worsening probability of default trend. Both higher risk provisions (increase in ex-pected losses) and a rise in credit value at risk (unexpect-ed loss) are likely. This has been taken into account in the budgetary planning process and, on the basis of an eco-nomic analysis, a conservative rating migration of existing customers and lower credit ratings for potential borrow-ers than in past years have been assumed. The Bank’s risk bearing capacity has been calculated on the basis of these conservative assumptions. The monthly icAAP and credit risk reporting analyse the changes in borrowers’ credit rat-ings in the course of the year as a result of migration.
The Bank made further progress in implementing credit rating procedures for Austrian local authorities and banks in 2012. The tools will become fully operational in a few months.
The theoretical and technical requirements for the medi-um-term introduction of the f-iRB approach in the HYPO NOE Group were evaluated as part of a project in 2012. A system for the introduction was designed and preparatory implementation steps were completed. This decision was prompted by the need to achieve a uniform Group-wide approach and savings in regulatory capital requirements, and to improve credit risk management, as well as overall internal control and the associated processes.
continued refinement of the Group’s credit risk manage-ment system is seen as a long-term growth driver. it includes improving organisational processes for the management of risk (watchlist and continuous evaluation of provisions), tighter monitoring, and active portfolio management (risk transfer and use of modern risk management techniques).
Liquidity risk
The central liquidity management issues in 2012 were: achieving compliance with the new supervisory review requirements; acting to meet the LcR and NSfR require-ments; making previously fallow Group liquidity reserves marketable; and refining the liquidity and cost of liquidity models.
Bank-wide stress testing
The annual internal bank-wide stress test, carried out in consultation with the risk management and portfolio man-agement functions in 2012, began with a wide-ranging eco-nomic analysis, and went on to map out scenarios relevant to the Group’s business model (e.g. a worsening EU sover-eign debt crisis), and to simulate their impact on credit, in-vestment, interest rate and liquidity risk at subsidiary and Group level, in terms of regulatory and economic risk bear-ing capacity. The results were presented to management and suitable responses formulated.
Basel iii
we made an early start to preparations for Basel iii, and thorough examination of the issues raised by it is a top pri-ority. in 2012 the focus was on compliance with the regula-tory changes brought by the cRd iv, cRR i and EMiR (the regulation dealing with OTc derivatives), and other draft European financial legislation. in addition, we evaluated the planned liquidity ratios and capital buffers.
ifRS 9
international financial Reporting Standard (ifRS) 9 finan-cial instruments is expected to replace the current stand-ard, iAS 39 financial instruments: Recognition and Meas-urement, on 1 January 2015. in 2012 we carried out a major evaluation of the new standard and its potential effects.
Risk management systems
in 2013 we will again be investing large amounts in iT infra-structure, as well as process, methodology and staff devel-opment, in order to ensure that our risk control systems re-main compatible with the authorised levels of risk tolerance and our business objectives.
Exposure to PiiGS*, cyprus and Hungary
due to the crisis in the eurozone peripherals and Hungary, we are continuing to watch developments in these coun-tries very closely. Last year the Group made further pro-gress in pursuing its strategy of selectively reducing risk in these countries, and the exposures to Greek and Portu-guese sovereign risk were completely unwound. Exposure to Hungarian government debt was significantly reduced.
* Portugal, ireland, italy, Greece and Spain.

HYPO NOE GROUP ANNUAL REPORT 2012 | 95
The interest on and principal of an existing, individually im-paired loan to a Greek local authority has been repaid on schedule.
in cyprus, a EUR 22m cypriot state-guaranteed loan to a government-related organisation is currently outstanding. Repayment is currently proceeding in line with the loan agreement, but this is dependent on the allocation of suffi-cient funding from the national budget.
There are no plans to increase our existing exposures to the PiiGS countries, cyprus and Hungary, and all are blacklisted by our risk management system.
CrEDIt rISKcredit risk is the risk of a deterioration in creditworthiness, and ultimately that of default by a counterparty. credit risks are of various different types, depending on the prod-ucts involved: loans involve classic credit risk, derivatives counterparty risk, and securities issuer risk. credit risk also includes investment risks.
The HYPO NOE Group calculates regulatory capital for credit risks using the standardised approach required by section 22a Banking Act, and the “simple” credit risk miti-gation method.
The internal risk management system uses the 25-level HYPO master scale, which is shown in condensed form be-low:
HyPo noE Group master scale Corresponding external ratings
Grade Description rating grade moody’s S&P
Investment
top grade 1A–1E Aaa–Aa3 AAA–AA-
Excellent or very good 2A–2E A1–baa3 A+–bbb
Non-invest-ment
Good, medium or acceptable 3A–3E Ba1–B1 BB+–B+
Unsatisfactory 4A–4B B2 B
watch list 4c–4E B3–c B–c
default 5A–5E d d

96 | GROUP OPERATiONAL ANd fiNANciAL REviEw
for internal customer credit ratings, we mainly use the Ös-terreichische volksbanken AG (vBAG) rating procedures. for private customers, the Group is currently employing an applications rating procedure together with behaviour rating for day-to-day evaluation. Business customers are assessed using different rating instruments for start-ups, businesses preparing accounts on a cash basis and those using accrual accounting. There is also a separate process for local authorities. credit ratings for specialised lend-ing are carried out using the slotting approach based on income-producing real estate (iPRE) and project finance ratings. Other customer categories are currently rated in-ternally on the basis of analyses and external data.
internal ratings are generally used for credit risks and in-vestment risks. The number of unrated customers is negli-gible, and they are constantly monitored. Unrated loans are generally assigned a conservative 4A rating.
credit risk analysis
Lending is one of the HYPO NOE Group’s core businesses, and assuming and managing credit risks, and keeping them within limits is one of the Bank’s core competencies. Lend-ing activities, the valuation and classification of collateral, and credit ratings are all governed by strict organisational and substantive rules, the basic principles of which are set out in the Group Risk Manual. These rules establish the de-cision-making authorities, credit rating and collateral clas-sification procedures, and guidelines for lending and loan management.
The operational credit risk management units are responsi-ble for the full range of activities related to the assessment, monitoring and management of all risks associated with on and off-balance sheet lending at the individual customer level.
The main emphasis is on checking both the form and con-tent of loan applications and providing the second opinions. These units also have sole responsibility for the rating as-sessments (apart from those in the low-volume retail lend-ing business).
in addition, the operational credit risk management depart-ments are responsible for monitoring early warning indica-tors (principally generated by the credit Services depart-ment) in order to identify potential problem customers as early as possible so as to initiate countermeasures in good time.
The workout Management department is responsible for the management of non-performing loans and provisioning (recognition of individual impairment allowances).
Below a given rating level, exposures are classified as “watch loans”, or transferred for intensive care by the workout Management department.
The HYPO NOE Group applies rigorous standards as to what constitutes default. All customers meeting at least one of the following criteria are immediately treated as in default:
�Substantial loan more than 90 days overdue (regulatory definition); �Recognition of an individual impairment allowance, or non-recognition where there is adequate collateral; �credit rating related restructuring; � insolvency, composition and bankruptcy; �Loan writedowns or write-offs.
Risk provisions
individual or collective impairment allowances are recog-nised for identifiable lending risks.
The individual impairment allowances are determined on the basis of an assessment of the customer’s financial situ-ation, taking into account the current valuations of collater-als, the repayment structure and maturities.
future cash flows (anticipated repayments) are discounted using the original effective interest rate. if there are col-laterals for receivables (e.g. charges on real property or guarantees), the future cash flows from their recoverable amounts less the selling costs must be deducted when measuring the impairment loss (paragraph AG84 iAS 39). Since paragraph 63 iAS 39 requires measurement of an im-pairment loss to reflect the present value of estimated fu-ture cash flows and their expected maturities, all expected interest payments must also be included.
collective impairment allowances are recognised for re-ductions in the value of the Group lending portfolio (losses incurred but not reported) as at the end of the reporting period. it is assumed that there are incurred but unreport-ed losses in respect of a given percentage of customers without default ratings at the end of the reporting period.
To calculate these risk provisions, all liability items af-fecting credit risk measured at amortised cost (loans and receivables, and liabilities held to maturity), and all out-standing lending facilities and contingent liabilities are al-located either to HYPO NOE Gruppe Bank or to HYPO NOE

HYPO NOE GROUP ANNUAL REPORT 2012 | 97
Landesbank, in accordance with paragraph 64 iAS 39. The treatment of these provisions differentiates between the two banks, due to their varying risk profiles. financial in-struments that are not classified as held to maturity and derivatives do not form part of the calculations, as they are measured at fair value. intra-group lending is not included because of its elimination due to ifRS consolidation. Hous-ing construction loans backed by the Lower Austrian state government are likewise excluded.
The calculation is based on the expected loss, taking into account: (a) the unsecured exposure net of the market val-ue of any collateral; (b) the historical probability of default (Pd), i.e. the results of backtesting the rating system; (c) loss given default (LGd) ratios for the individual portfolios; and (d) the period of time between occurrence of the loss and its identification, i.e. the loss identification period (LiP). for reasons of prudence no cure factor is recognised.
The collective impairment allowance is calculated for loans and advances to banks and customers with internal ratings of 2A to 4E, using the HYPO NOE Group master scale re-ferred to above. for 2012, the loss identification period was assumed to be four months for all loans (i.e. the LiP factor is 4/12).
The collective impairment allowance is calculated using the following formula:
Collective impairment allowance = (exposure + 50% range – market value of collaterals) * PD * “blanco” lGD * lIP
The collective impairment allowances are reported under “Risk provisions” on the assets side of the ifRS statement of financial position, and under “credit provisions” on the equity and liabilities side.
credit risk monitoring
As regards individual customers, risk monitoring is the res ponsibility of the operational credit risk management department concerned, which verifies the credit ratings, moni tors the blacklists drawn up by the workout Manage-ment department and processes loan applications poten-tially entailing significant risks. where customers’ situa-tions demand close observation, relationship managers are required to prepare reviews as necessary, and in all events at least once a year, irrespective of the amount of any lia-bilities and of the credit ratings. The reviews are submitted for the attention of the managers with the requisite deci-sion-making authority. customers giving cause for concern (where significant risk is involved) are monitored by the operational credit risk management units. where there is a significant deterioration in the risk situation, the expo-sures are transferred to the specialists in the workout Man-agement department, who are not involved in front office approval.
credit facilities for own investments, money market depos-its and derivatives are submitted to the Supervisory Board for authorisation twice a year. compliance with the limits imposed is monitored on an ongoing basis, and reports are regularly submitted to the Supervisory Board. Approval for such credit lines is chiefly requested for sovereigns, new business from Austrian and international banking groups with good investment grade ratings, or existing customers with good ratings defined by the above master scale.
The Group Strategic Risk Management department is res-ponsible for monitoring credit risk at portfolio level. Man-agement is kept up to date with changes in credit risks by monthly credit risk reports, and regular or case-by-case reports on risk-related issues (transfer of accounts to the collections function, overdraft trends, etc). There is also a regular report to management on the ten largest expo-sures in each strategic business. Management is compre-hensively briefed about the Group’s risk situation, includ-ing in-depth analysis of key issues, at meetings of the Risk Management committee (RicO), which are held at least six times per year.

98 | GROUP OPERATiONAL ANd fiNANciAL REviEw
2A–2E: 26%
1A–1E*: 54%
3A–3E: 14%
4A–4E: 4%
5A–5E: 2%
credit risk management
Exposures are also classified by credit ratings, as follows:
rating category
Exposure (EUr ’000)1
2012 2011
1A–1E* 8,082,493 7,853,861
2A–2E 3,883,408 3,056,652
3A–3E 2,068,194 2,224,318
4A–4E 564,488 478,914
5A–5E 247,546 218,631
total 14,846,128 13,832,376
*of which 1A (Pd=0.01%) EUR 5,730,525thsd (2010: EUR 5,320,347thsd)
investment grade 1A–2E
default 5A–5E
The credit risk management system is based on the following control units:*
Exposure (EUr ’000)1
Control unit 2012 2011
Public finance 8,505,463 7,770,134
corporate & Project finance 726,660 702,485
Real Estate finance 1,011,130 873,998
Group Treasury 2,585,064 2,422,928
HYPO NOE Landesbank (excl. nostro) 2,017,811 2,062,831
total 14,846,128 13,832,376
Public Finance: 57%
HYPO NOE Landesbank AG(excl. nostro): 14%
Group Treasury: 17%
Real Estate Finance: 7%
Corporate & Project Finance: 5%
1 The exposure volume is the exposure plus 50% of the unused agreed credit facility. The financial risks are recognised at fair value.

HYPO NOE GROUP ANNUAL REPORT 2012 | 99
The credit risk management system also exerts control via the portfolio segments shown below.
Exposure (EUr ’000)1
Segment 2012 2011
Banks 2,003,592 1,842,124
Governments 549,774 497,254
State governments and local authorities 1,854,469 1,865,034
Multilateral development banks 19,115 4,399
international organisations – –
Public sector entities 737,034 740,975
Special purpose finance (iPRE and project finance) 693,703 650,873
Business customers 4,988,964 4,376,747
Retail 1,767,666 1,545,198
church 6,371 1,447
Associations, insurance companies and leasing companies 2,225,442 2,308,325
total 14,846,128 13,832,376
International organisations: 0%Governments: 4%
Associations, insurance companies and leasing companies: 15%
State governments and local authorities: 12% Multilateral development banks: 0%
Retail: 11%
Banks: 13%
Business customers: 34%
Special purpose finance (IPRE and project finance): 5%
Public sector entities: 5%
Church: 0%
disclosures in accordance with ifRS 7
Credit risk mitigation
The measurement and classification of collateral are gov-erned by strict organisational rules and procedures, which distinguish between the fair value of collateral recognised for regulatory purposes and its economic value. As a gener-al rule the relationship manager checks the legal status and the economic value of the collateral when the application is
received, at least once every year when the loan or facility comes up for reapproval, and whenever circumstances re-quire. As part of the credit review process the operational credit risk management departments check the informa-tion, the assumptions and the underlying parameters. Bal-ance sheet and off-balance sheet netting is not applied in the HYPO NOE Group. Provided that the legal requirements are fulfilled, the positive and negative fair value of individ-ual derivatives held in connection with a single customer may be netted.
1 The exposure volume is the exposure plus 50% of the unused agreed credit facility. The financial risks are recognised at fair value.

100 | GROUP OPERATiONAL ANd fiNANciAL REviEw
The amounts shown in the table are gross of collateral and other credit enhancements.
EUr ’000 31 Dec. 2012 31 Dec. 2011 Change
cash and balances at central banks 71,644 78,739 -7,095
Loans and advances to banks 894,317 583,997 310,320
Loans and advances to customers 10,735,077 9,702,478 1,032,599
Risk provisions -112,899 -104,006 -8,893
Assets held for trading 607,414 471,080 136,334
Positive fair value of hedges (hedge accounting) 617,935 471,809 146,126
financial assets held to maturity 10,009 15,031 -5,022
Available-for-sale financial assets 1,825,600 1,837,180 -11,580
financial assets designated as at fair value through profit or loss 4,662 4,560 102
investments accounted for using the equity method 53,514 47,942 5,572
investment property 52,256 43,411 8,845
contingent liabilities
Acceptances and endorsements 327 327 –
Liabilities arising from guarantees and furnishing of collateral 149,564 132,741 16,823
credit risk 1,364,204 1,284,930 79,274
total 16,273,624 14,570,219 1,703,405
The principal categories of collateral admissible for Ba-sel ii purposes that are relevant to the HYPO NOE Group are guarantees (largely in the public sector), mortgages and other pledges. A considerable part of the lending con-cerned is represented by the purchase of subsidised home
loans from the Lower Austrian state government. Addition-al security for this lending is provided by a guarantee from the state government, and the credit risk on these expo-sures is therefore not a cause for concern.
Gross exposures in the Group for purposes of para. 36(a) IFrS 7
disclosures of maturities, collaterals and impaired or past due financial assets
The table below shows the fair value of the collater-al received as calculated for regulatory purposes. The
receivables of the leasing subsidiary, amounting to approx-imately EUR 1,403,974thsd (2011: EUR 1,344,676thsd), are shown gross of collateral.

HYPO NOE GROUP ANNUAL REPORT 2012 | 101
31 Dec. 2012 (EUr ’000) not past dueless than 90 days overdue
more than 90 days overdue total
Gross carrying amount (not individually impaired) 11,392,442 43,858 3,446 11,439,746
Gross carrying amount (individually impaired) 76,596 6,025 133,953 216,574
collective impairment allowances -4,827 -88 -61 -4,977
individual impairment allowances -27,453 -4,341 -76,129 -107,922
net carrying amount 11,436,758 45,454 61,209 11,543,421
31 Dec. 2012 (EUr ’000)Gross carrying
amountFair value of
collateral received
Loans and advances to customers and banks, and debt instruments not past due or individually impaired 11,392,442 5,096,065
Loans and advances to customers and banks, and debt instruments overdue but not individually impaired 47,304 18,495
Loans and advances to customers and banks, and debt instruments individually impaired (overdue and not past due) 216,574 46,369
total 11,656,320 5,160,929
31 Dec. 2011 (EUr ’000) not past dueless than 90 days overdue
more than 90 days overdue total
Gross carrying amount (not individually impaired) 10,073,287 43,722 10,235 10,127,244
Gross carrying amount (individually impaired) 73,143 6,670 100,823 180,636
collective impairment allowances -4,814 -117 -67 -4,998
individual impairment allowances -31,921 -3,714 -63,374 -99,008
net carrying amount 10,109,696 46,562 47,617 10,203,874
31 Dec. 2011 (EUr ’000)Gross carrying
amountFair value of
collateral received
Loans and advances to customers and banks, and debt instruments not past due or individually impaired 10,073,287 4,261,774
Loans and advances to customers and banks, and debt instruments overdue but not individually impaired 53,957 31,282
Loans and advances to customers and banks, debt instruments individually impaired (overdue and not past due) 180,636 41,538
total 10,307,880 4,334,594

102 | GROUP OPERATiONAL ANd fiNANciAL REviEw
current risk situation
The Group’s portfolio of loans and investments largely con-sists of low-risk loans to public sector borrowers such as sovereigns, the federal government, state governments and local authorities (and their associated enterprises), as well as loans to banks with good external ratings (predom-inantly own investments, derivatives and money market investments) and – generally well collateralised – loans to housing construction companies (both large housing devel-opers and private sector). within these low-risk areas there are nevertheless significant risk concentrations (unsecured lending per individual borrower) in the loan portfolio.
A considerable part of the lending concerned is represent-ed by the purchase of subsidised home loans from the
Lower Austrian state government. Additional security for this lending is provided by a guarantee from the state gov-ernment, and the credit risk on these exposures is there-fore not a cause for concern.
HYPO NOE Gruppe Bank also finances property projects with excellent or good credit ratings, as well as some public sector loans, infrastructure enterprises and foreign corpo-rate customers. HYPO NOE Landesbank specialises in retail banking, large-scale housing construction (both housing developers and private sector housing) and SME finance.
The credit portfolio shows no notable concentrations of risk from a Group perspective, with the exception of the loans mentioned above. The bulk of business activities is repre-sented by public sector financing in Austria.
31 Dec. 2012 (EUr ’000) not past dueless than 90 days overdue
more than 90 days overdue total
risk provisions for customers: indi-vidual impairment allowances -27,453 -4,340 -76,130 -107,922
Non credit institutions (banks) -3,997 – -54 -4,051
corporates -16,804 -3,836 -43,005 -63,645
Private customers -6,652 -504 -33,071 -40,226
risk provisions for customers and credit insti-tutions: collective impairment allowances -4,827 -88 -61 -4,977
total risk provisions for customers -32,280 -4,428 -76,191 -112,899
31 Dec. 2011 (EUr ’000) not past dueless than 90 days overdue
more than 90 days overdue total
risk provisions for customers: indi-vidual impairment allowances -31,921 -3,714 -63,374 -99,008
Non credit institutions (banks) -4,909 – – -4,909
corporates -15,582 -2,315 -32,402 -50,298
Private customers -11,430 -1,399 -30,972 -43,801
risk provisions for customers and credit insti-tutions: collective impairment allowances -4,814 -117 -67 -4,998
total risk provisions for customers -36,735 -3,830 -63,441 -104,006
collateral taken into possession in the meaning of para. 38 ifRS 7 represents rescue acquisitions where the intention is to dispose of the assets. HYPO NOE Landesbank made no such acquisitions in 2012 (2011: EUR 36thsd), and HYPO
NOE Gruppe Bank undertook no such transactions in 2012 or 2011.
The tables below show risk provisions grouped by the ma-turities of the underlying transactions and segmented as required for regulatory reporting purposes.

HYPO NOE GROUP ANNUAL REPORT 2012 | 103
The HYPO NOE Group regularly calculates the statistically expected loss associated with credit risk exposures on the basis of the default probabilities and the collateral struc-ture. The aim is to ensure that the expected loss on the overall portfolio is adequately covered by risk provisions, and that a conservative approach is taken to any possible shortfalls in risk coverage.
Group Strategic Risk Management regularly checks the non-performing asset (NPA) ratios and NPA coverage of in-dividual members of the Group. The NPA ratio is defined as the total exposure on all default (5A-5E rated) customers di-vided by total credit risk exposure. As at year end 2012, the HYPO NOE Group’s NPA ratio was 1.90% (2011: 1.95%). The NPA coverage is defined as risk provisions (individual and collective impairment allowances, and credit provisions) di-vided by the total exposure on default customers. Group coverage at 31 december 2012 was 53.6% (2011: 62.6%).
The non performing loan (NPL) ratio, defined as total ex-posure on default customers divided by total loans and advances to customers, is calculated at Group level. As at 31 december 2012, the HYPO NOE Group’s NPL ratio was 2.35% (2011: 2.14%).
IntErESt rAtE rISKin its approach to the measurement and control of interest rate risk, the HYPO NOE Group distinguishes between peri-od net interest income risk arising from timing differences between the repricing positions for like or different repric-ing indicators, and present value sensitivity to interest rate changes, which is mainly influenced by long-term interest risk positions. The effects are only partly recognised direct-ly as measurement gains or losses in the statement of com-prehensive income, or as net interest income in subsequent periods.
interest rate risk management
Monitoring and quantification of interest rate risk is the re-sponsibility of a back office department, Group Strategic Risk Management. The analysis is carried out in the SAP banking system. This generates interest rate gap and sen-sitivity analyses. Positions with unspecified fixed interest rates are modelled and regularly assessed on the basis of statistical methods and/or expert evaluations.
The management of intrayear interest rate risk positions is the responsibility of the Group Treasury department. fixed and non-linear interest rate risks are by and large eliminat-ed by the use of hedges. Strategic, long-term, interest rate sensitive positions in the banking book are discussed by the Asset Liability committee and – following approval by the Management Board – managed by Group Treasury. Equity is invested and reported in the form of a rolling fixed income portfolio.
The present value of interest rate risk is limited by means of an absolute limit to be applied in internal risk measure-ment, which is imposed during the annual risk budgeting process on the basis of the Bank’s total risk bearing capaci-ty and risk tolerance, and in line with the limit requirements set out in the Oesterreichische Nationalbank (OeNB) inter-est rate risk statistics.
current risk situation
The OeNB statistics indicate that in 2012 interest rate risk was low relative to the regulatory limit (20% of eligible cap-ital), at 2.45% (2011: 1.61%). This is due to the fact that mi-crohedges in the form of interest rate derivatives are used to eliminate interest rate risks on own debt issues, and on nostro securities and loans extended. Other derivative in-terest rate risks or open on-balance-sheet interest rate risk positions are only assumed within strictly defined internal limits and following a rigorous assessment. As a result, the level of such risks is low.

104 | GROUP OPERATiONAL ANd fiNANciAL REviEw
internal risk reporting
As part of the HYPO NOE Group’s risk monitoring activities, interest rate risk sensitivity is assessed on the basis of gap analysis and computed twice monthly using ten scenarios. Limits are imposed accordingly. The results are reported to the Bank’s relevant specialist departments and units, and discussed at monthly Asset Liability committee (ALcO) meetings. in addition to parallel shifts (100 and 200 base points), twists in the yield curve (both on money markets and on capital markets) are also modelled in the scenarios.
The sensitivity analysis captures interest rates in a varie-ty of currency areas as risk factors. This makes it possible to apply a constant, standard measure of risk to all inter-est rate sensitive products. The analysis enables interest rate risks in various areas of business to be compared, and positions aggregated and netted across the Bank as a whole. in addition, interest rate risk can be compared over time.
when using sensitivity analyses, the following problems need to be borne in mind:
�The scenarios may be not be good indicators of future events – especially where these are extreme. This could lead to underestimation or overestimation of the risks. �The assumptions about changes in the risk factors and the relationships between them (e.g. simultaneous twists in the euro and Swiss franc yield curves) may turn out to be false, particularly if extreme events occur. There is no standard methodology for developing interest rate scenarios, and applying other scenarios would generate different outputs. �The scenarios applied do not provide any indications of the potential losses in situations that are not modelled by them.
in 2012 risk utilisation averaged 39.6% of the total limit of EUR 33m (2011: 66.1% of total limit of EUR 33m).
The following table shows the outcomes of the interest risk positions taken by the HYPO NOE Group as at 31 december 2012 (left) and 31 december 2011 (right):
Interest rate risks (assets-liabilities)
31 Dec. 2012 31 Dec. 2011
on-balance sheet
off-balance sheet total
on-balance sheet
off-balance sheet total
Up to 1 month 1,434,990 -844,430 590,560 1,605,451 -275,090 1,330,361
from 1 to 3 months 548,361 -2,720,632 -2,172,272 963,545 -2,294,216 -1,330,671
from 3 to 6 months 2,122,576 -1,448,695 673,881 951,467 -1,159,205 -207,739
from 6 months to 1 year -99,214 552,846 453,632 -574,657 447,623 -127,035
from 1 to 2 years -546,106 359,902 -186,204 -373,699 338,068 -35,631
from 2 to 3 years 99,037 74,325 173,361 -271,534 359,926 88,392
from 3 to 4 years -314,382 478,684 164,302 -67,785 62,920 -4,865
from 4 to 5 years -1,276,902 1,635,015 358,114 -281,325 457,224 175,899
from 5 to 7 years –142,143 559,836 417,693 -1,136,451 1,712,887 576,437
from 7 to 10 years -533,295 427,910 -105,385 -20,326 99,712 79,385
from 10 to 15 years -284,589 51,007 -233,582 -282,201 11,482 -270,719
from 15 to 20 years -577,934 543,505 -34,429 -224,136 82,185 -141,951
Over 20 years -412,380 378,641 -33,738 -240,230 209,740 -30,489

HYPO NOE GROUP ANNUAL REPORT 2012 | 105
Interest rate scenario (EUr ‘000) As at 31 Dec. 2012 As at 31 Dec. 2011
Change in present value
negative change in
present value
Change in present value
negative change in
present value
No shift
Shift +100 bp -13,204 -13,204 -17,328 -17,328
Shift -100 bp 6,805 17,849
Shift +200 bp* -25,184 -25,184 -33,575 -33,575
Shift –200 bp 2,413 33,203
Twist cM +100 bp 8,037 -2,994 -2,994
Twist cM -100 bp -9,135 -9,135 -1,318 -1,318
Twist MM +100 bp -15,694 -15,694 -14,272 -14,272
Twist MM -100 bp 12,095 11,611
Twist 1d +100 bp 30y -250 bp -14,449 -14,449 -1,707 -1,707
Twist 1d -100 bp 30y +250 bp 12,647 -2,014 -2,014
internal risk** – -15,533 – -10,458
warning level (95% of limit) -39,900 -39,900
Limit/utilisation (%) -42,000 36.98% -42,000 24.90%
*Regulatory scenario **Average of five worst deteriorations in net present value
The table below shows the results of the various interest rate scenarios for the HYPO NOE Group as a whole, and of
observance of internal limits, as at 31 december 2012 (right-hand table: 31 dec. 2011).
during the reporting period a change was made in the methods and assumptions adopted in relation to interest rate risk management. As a result, the internal interest rate risk now corresponds to the average of the five largest reductions in net present value in the ten scenarios moni-
tored (previously, the average was calculated using all dete-riorations in net present value). Over time, this change and the resulting application of a constant number of values will lead to increasingly stable risk indicators calculated on the basis of average net present values.

106 | GROUP OPERATiONAL ANd fiNANciAL REviEw
mArKEt rISKMarket risks are the potential losses that may arise from negative changes in the fair value of positions held, due to movements in exchange rates (currency risk), share pric-es, indexes or fund unit prices (equity risk), credit spreads (spread risk) or volatility (volatility risk).
Risk management
The organisation of treasury business is based on a clear operational and disciplinary separation of trading activi-ties from processing and control. The division between the front and back office functions ensures that the four-eye principle is adhered to. Structures, decision-making au-thorities and processes are laid down by the authorisation rules, the minimum requirements for investment and trad-ing activities, and the procedures for the introduction of new products.
Market risk may only be incurred within the authorised limits and with respect to authorised products.
ifRS 7 requirements
The HYPO NOE Group’s conservative risk policies are under pinned by very strict limits on open currency posi-tions. Exposure to currency risk is therefore negligible.
current risk situation
The Group does not engage in any business that requires it to maintain a large trading book as defined by the Austrian Banking Act. it maintains a small trading book, subject to section 22q Banking Act.
Spread risks are particularly important in connection with the Group’s own investments, and these risks are managed on an ongoing basis in accordance with the risk manage-ment guidelines for investments.
Matching currency refinancing and the use of forex deriv-atives to all intents and purposes eliminate the HYPO NOE Group’s exposure to exchange risk. where foreign curren-cy exposures are not entirely covered, they are subject to strict limits.
Only a limited degree of volatility risk exists and the Group does not face any equity risk.
lIqUIDIty rISKLiquidity risk is defined as the risk that the HYPO NOE Group will be unable to meet its present and future pay-ment obligations in full and on time, or may only be able to do so at prohibitive cost.
Liquidity risk management
The task of the liquidity risk management function is to identify, analyse and manage the HYPO NOE Group’s liquid-ity risk position, and to maintain sufficient, cost-effective liquidity coverage at all times.
The HYPO NOE Group differentiates between operational (from intraday up to a maximum of two days), tactical (up to and including one year) and structural (beyond one year) liquidity risk management.
The Group’s liquidity risk management system centres on: �Regular analysis of the liquidity position; �Reporting to the Management Board; �determination of the Bank’s medium and long-term re-financing needs, and preparation of an issuance pro-gramme; �Maintenance and development of the liquidity model and liquidity cost model; �Regular reviewing and redetermination of internal trans-fer prices.
Liquidity management measures are based on the medi-um-term funding and issuance programme, which is drawn up by the Group Treasury department in the course of the annual budgeting process on the basis of liquidity maturity profiles, including forecast new business. The programme must be approved by the Management Board. Any deci-sions regarding issuance that deviate significantly from this framework are taken on a case-by-case basis by the Management Board, in response to recommendations from Group Treasury.
The Group refines its liquidity risk management system on an ongoing basis. during the report period the following progress was made:
�Adaptation of the Group-wide liquidity contingency plan; � improvements to the internal structural liquidity risk re-port; �Amendments to internal stress scenarios used to assess operational liquidity risk.

HYPO NOE GROUP ANNUAL REPORT 2012 | 107
As at 31 Dec. 2012 (EUr m) Expected liquidity gap
Additional available liquidity liquidity position after
measures taken
Up to 1 month -871 1,779 908
from 1 to 3 months -505 783 278
from 3 months to 1 year -1,532 1,459 -73
total -2,908 4,021 1,113
As at 31 Dec. 2011 (EUr m) Expected liquidity gap
Additional available liquidity liquidity position after
measures taken
Up to 1 month -1,149 2,014 865
from 1 to 3 months -417 454 37
from 3 months to 1 year -2,671 3,536 865
total -4,237 6,004 1,767
Operational liquidity risk (from intraday up to a maximum of two days)
in order to manage, plan and monitor the Group’s daily liqu idity requirements, each week the Group Strategic Risk Management department provides Group Treasury with a report on daily liquidity gaps in existing business for the next 30 days, broken down by currency. Group Treasury forecasts liquidity requirements for the following days by applying assumptions on rolling and new business. it man-ages liquidity by means of funding from the European cen-tral Bank (EcB) as well as collateralised and uncollateral-ised money market refinancing.
Tactical liquidity risk (up to and including one year)
Group Strategic Risk Management provides Group Treas-ury with a baseline and stress scenario for the next 12 months to assist it with its tactical liquidity management operations. These scenarios take account of contractual payment streams, as well as the anticipated proceeds of new issues, income from new business, extensions of repur-chase agreements, and liquidity needs arising from termi-nations of existing transactions and compare them with the liquidity reserve.
The table below shows the expected liquidity gaps project-ed by the baseline scenario as at 31 december 2012, the additional liquidity available from internal and external measures, and the liquidity position subsequent to these measures, for periods up to one year, as at the end of the reporting period, and the comparative figures for 2011.

108 | GROUP OPERATiONAL ANd fiNANciAL REviEw
The stress scenario envisages both bank-specific events (e.g. a rating downgrade) and market-wide shocks (e.g. per-sistent money or capital market dysfunctionality).
with the euro crisis an ever-present concern, the Manage-ment Board receives regular reports on the intrayear liquid-ity position from the ALcO.
Structural liquidity risk (beyond one year)
To support strategic liquidity management and structural analysis of the liquidity risk position, the HYPO NOE Group analyses the expected capital flows over the entire matur-ities of on and off-balance sheet transactions. Group Stra-tegic Risk Management monitors periodic and cumulative excess capital inflows and outflows, and reports on them to Group Treasury and the ALM & Strategic Planning Staff Unit on a fortnightly basis. The Asset Liability committee receives monthly reports on this subject. These reports also play a part in the preparation of the budget and serve as the basis for the medium-term funding and issuance pro-gramme. A monitoring system is in place to identify devia-tions and take corrective measures as required.
contingency plan
The liquidity contingency plan is aimed at maintaining ef-ficient liquidity management even in a crisis-hit market environment. The Group has a liquidity contingency plan that governs the lines of responsibility in an emergency, the composition of the crisis teams, the internal and ex-ternal communication channels, and the action to be taken if necessary. A crisis team would take control of liquidity management in an emergency, and in some cases would also decide on the action to be taken.
current risk situation
The liquidity situation of the HYPO NOE Group remains comfortable. The Group has sufficient access to short-term and long-term funds, as well as sufficient assets eligible as collateral for EcB tenders and a broad funding portfolio in the event that markets freeze up again – further proof that the current liquidity position on a 12-month horizon is sat-isfactory. Recourse to long-term sources of finance is also possible despite the challenging market environment. As a result, the steps taken to secure medium to long-term li-quidity have been extremely successful in the current cli-mate. we are continuing to give high priority to issues with long maturities as issues of bonds backed by state govern-ments are due to end in 2017. Both EUR 500m public sector mortgage bond benchmark issues – one in the seven year maturity segment and one in the ten year maturity seg-ment – were significantly oversubscribed. This meant that the Bank’s established position on the Austrian mortgage bond market was further consolidated in 2012. Last year the Bank made further progress in diversifying its funding portfolio by issuing its first-ever puttable bonds, including promissory notes, with a volume of EUR 358m. EUR 94m of long-term senior unsecured bonds (also including promis-sory notes) were also issued.
during the reporting period the planned Basel iii, LcR and NSfR regulatory liquidity indicators were calculated on the basis of the final versions of the standards. They were re-ported to Group management and analysed, and measures were put in place to ensure that they will be met.

HYPO NOE GROUP ANNUAL REPORT 2012 | 109
EUr ’000 31 Dec. 2012 31 Dec. 2011
Deposits from banks
Repayable on demand or no fixed term 55,641 52,004
Up to 3 months 937,005 976,143
from 3 months to 1 year 159,985 488,900
from 1 to 5 years 1,228,313 219,960
Over 5 years 336,341 647,453
total 2,717,286 2,384,461
Deposits from customers
Repayable on demand or no fixed term 669,272 592,434
Up to 3 months 229,624 242,599
from 3 months to 1 year 450,415 252,725
from 1 to 5 years 794,145 441,832
Over 5 years 111,000 943,820
total 2,254,455 2,473,410
Debts evidenced by certificates
Repayable on demand or no fixed term 603 682
Up to 3 months 398,414 46,763
from 3 months to 1 year 531,919 989,493
from 1 to 5 years 4,226,356 2,284,511
Over 5 years 2,754,056 3,510,303
total 7,911,349 6,831,752
liabilities held for trading
Repayable on demand or no fixed term – –
Up to 3 months 9 –
from 3 months to 1 year – 262
from 1 to 5 years 24,292 6,708
Over 5 years 500,741 373,504
total 525,043 380,474
negative fair value of derivatives (hedge accounting)
Repayable on demand or no fixed term – –
Up to 3 months 109 21
from 3 months to 1 year 2,709 819
from 1 to 5 years 65,852 37,872
Over 5 years 524,959 371,204
total 593,630 409,916

110 | GROUP OPERATiONAL ANd fiNANciAL REviEw
The maturities of existing financial guarantees are shown below.
EUr ’000 31 Dec. 2012 31 Dec. 2011
Repayable on demand 1,268 2,096
Up to 3 months 85,193 152
from 3 months to 1 year 9,577 23,550
from 1 to 5 years 21,700 54,697
Over 5 years 31,827 52,247
total 149,564 132,741
other liabilities (inc. economic hedges)
Repayable on demand or no fixed term – –
Up to 3 months 371 425
from 3 months to 1 year – –
from 1 to 5 years – –
Over 5 years – –
total 371 425
other liabilities (excl. economic hedges)
Repayable on demand or no fixed term 14,011 11,687
Up to 3 months 15,432 6,339
from 3 months to 1 year 16,173 12,371
from 1 to 5 years 26,886 14,649
Over 5 years 5,367 6,474
total 77,870 51,520
Subordinated capital
Repayable on demand or no fixed term – –
Up to 3 months – –
from 3 months to 1 year – –
from 1 to 5 years 202,435 –
Over 5 years – 202,244
total 202,435 202,244
Analysis of the maturities of financial liabilities
The table above presents a maturity analysis of the earliest possible undiscounted contractual cash flows arising from non-derivative financial liabilities and off-balance sheet
loan commitments as at 31 december 2012 and a year earli-er. The cash flows comprise payments of interest as well as principal. in the case of liabilities with variable cash flows, the future cash flows are calculated on the basis of forward rates.

HYPO NOE GROUP ANNUAL REPORT 2012 | 111
oPErAtIonAl rISKOperational risk is the danger of losses arising directly or indirectly from the inadequacy or failure of internal pro-cesses or systems, human error or external events.
in the HYPO NOE Group operational risks are kept un-der control by regularly adapting and improving internal guidelines, and by means of contingency plans, the four-eye principle, staff training and development, and insu-rance of various risks.
current risk situation
detailed information on operational losses in the year un-der review was collected in a database. A number of im-provements were also implemented. The contingency plans were revised and extended as necessary, as part of the business continuity management framework.
Several early warning and key risk indicators were identi-fied and applied retrospectively to the last two years. On-going process and system adjustments, and an assessment of the risks associated with internal service agreements, were carried out during the year. The annual operational risk review of insourcing and outsourcing agreements was also completed.
Outlook for 2013
in 2013 the focus will mainly be on improving the effective-ness and efficiency of operational processes, minimising operational risk by making improvements to those process-es, and refining the internal control system (icS).
Another priority for the year will be a project started last year to strengthen and develop the icS, with an emphasis on identifying and evaluating risks, identifying and drawing up control and validation procedures, and enhancing key processes.
rEPUtAtIonAl rISKThe HYPO NOE Group attaches great importance to the avoidance of reputational risk, and it is therefore treated as a separate risk category. Avoiding potential damage to the
reputation of the HYPO NOE Group is a vital consideration when making business decisions.
Reputational risk is the danger of direct or indirect harm to the Group’s reputation, and opportunity costs entailed by such damage. damage to the HYPO NOE Group’s reputa-tion can occur through problems with stakeholders in-cluding customers, lenders, staff, business partners and the community. The reasons may lie in failure to live up to stakeholders’ expectations.
fulfilling those expectations is essentially a matter of put-ting efficient business processes in place, and of sound risk monitoring and management. The HYPO NOE Group also takes care to avoid business policies and activities associ-ated with unusual tax or legal risks, or with major environ-mental risks.
otHEr rISKS“Other risks” consist largely of business risk (the danger of loss as a result of a deterioration in the economic environ-ment and the HYPO NOE Group’s business relationships) and strategic risks (the danger of losses arising from deci-sions concerning the Group’s strategic focus and business development). Our approaches to measuring these risks, based on those applied to credit or market risks, are being continuously improved.
lEGAl rISKSGenerally, provisions are recognised for those proceedings for which the outcome or any potential losses can be relia-bly predicted. in such cases, the provisions are recognised at a level deemed appropriate in the circumstances, in ac-cordance with the applicable accounting principles.
No provisions for latent legal risk were recognised in 2012. The proceedings initiated in 2011 in the Administrative court of Appeal contesting the interest penalty imposed by notice by the Austrian financial Market Authority (fMA) in connection with Augustus funding Limited are still pend-ing. Payment of the penalty has already been made. Provi-sion has been made for any legal costs.

112 | GROUP OPERATiONAL ANd fiNANciAL REviEw
iNTERNAL cONTROL ANd RiSK MANAGEMENT SYSTEM (icS)
internal audit
The importance of internal audit as part of a bank’s internal control systems is shown by the fact that it is one of the few functions that are statutory requirements under the Austri-an Banking Act (section 42[1]).
Banks must establish an internal audit department that reports directly to senior management, and is exclusively devoted to comprehensive, ongoing review of the legality, orderliness and expediency of the operations of the entire enterprise. internal audit must be adequately resourced to perform its role properly, taking account of the volume of business.
internal auditing activities in the HYPO NOE Group are based on annual audit plans approved by the Group Man-agement Board and the managements of the subsidiaries. These plans, in turn, form part of a multi-year audit road map. This ensures that the audit cycle takes in all areas of operations.
The main focus is on the auditing activities required by the law, and particularly close attention is also paid to the vari-ous categories of risk (risk based auditing), i.e. operational, market and credit risk, and to risk management as a whole, as well as efficiency and quality issues.
The purpose of our internal auditing activities is not only to identify weaknesses but also to provide independent and objective audit services and advice aimed at creating value, improving business processes, and as a result enhancing the overall performance of the HYPO NOE Group.
in addition, the internal audit function assists the organisa-tion in attaining its objectives by evaluating and helping to improve the effectiveness of its risk management, internal controls, and management and supervisory processes on the basis of a systematic and targeted approach.
in 2012, audits were carried out in accordance with the ap-proved annual plan. Special audit assignments were also undertaken as requested by the Management Board. As a rule, the audit reports contain suggestions for improve-ments. implementation of these recommendations is part of the quality assurance side of the auditing work.
The Management Board was notified of the audit findings orally and in writing, in a timely manner, and the Supervi-sory Board Audit committee regularly received information in written and oral form; additionally, this was sent to the Supervisory Board itself in summarised form.
The Audit department was also involved in a variety of pro-jects. The other departments made heavy use of the de-partment’s advisory services.
The provision of adequate human resources (and continu-ous staff training and development), an audit culture that is in line with current knowledge and needs, and effective networking within the organisation ensure that the Audit department is able to deliver optimum performance and fulfil its responsibilities to the Group.

HYPO NOE GROUP ANNUAL REPORT 2012 | 113
Relationship between the icS and the accounting process
in 2012 the ongoing development of methods for the iden-tification, quantification, monitoring and management of operational risk, and of the icS as a whole was once again a high priority.
The icS encompasses all of the control and audit activities directed to ensuring that our processes comply with the law and our internal standards, and are adhered to. within the system, distinctions are drawn between risk manage-ment and internal audit activities, and the accounting activ-ities associated with the preparation of the annual financial statements in conformity with the relevant standards.
The icS ensures that business information is correctly captured, analysed and assessed, and incorporated in the Bank’s accounting.
The main features of the Bank’s internal control and risk management system and their interaction with the ac-counting process are summarised below.
The Management Board is responsible for designing and es-tablishing an internal control and risk management system that meets the Bank’s needs with regard to its accounting process.
The Group Accounting department is responsible for all ac-counting matters and for issuing instructions designed to maintain compliance with Group-wide standards. directives have been drawn up to assist it in performing its duties.
The icS encompasses accounting-related instructions and processes aimed at correct and appropriate recording of business transactions, including:
�The employment of the Group’s assets; �Recording of all the information required to draw up the annual financial statements; �Prevention of unauthorised purchases and sales which could have a material impact on the annual results; and �Establishment of risk-based decision-making authorities and monitoring instruments. �The chart of accounts is tailored to the special require-ments of the Bank. �vouchers are stored according to systematic, chronologi-cal criteria, and provide an adequate audit trail. �The processes involved in the preparation of the separate parent entity and consolidated financial statements, and
parent and Group operational and financial reviews have been documented, as have the related risks and controls. �The departments involved in the accounting process are adequately resourced in terms of the quantity and qual-ity of their staff. Standardised training programmes en-sure that staff have the necessary skills for their roles in the system. However, the bedrock of the control system is the integrity and ethical standards of the individual em-ployees concerned. The example set by senior executives is extremely important. �The functions of the main departments involved in the accounting process – Group Accounting and controlling – are clearly demarcated and managed as separate de-partments at Management Board level. �departmental responsibilities are unambiguously as-signed. �The computer systems employed are protected against unauthorised access by appropriate control mechanisms. �Accounting data is audited for its completeness and cor-rectness on a sample basis. �All data entry processes related to accounting are sub-ject to the four-eye principle; checks are carried out by Accounting, or by trained staff in the various operational departments, in accordance with internal regulations. �The computer centre validates posting lists, revenue reports, valuation lists and lists of Banking Act require-ments, etc., and corrects them where necessary on a daily and monthly basis, subjecting them to automated checks. Group Accounting performs plausibility checks and prepares trial balances. �Monthly reports are sent to the Oesterreichische Nation-albank in accordance with the statutory reporting re-quirements for banks. These are forwarded via the com-puter centre, and Group Accounting performs plausibility checks and corrects any errors. � iT security checks are one of the cornerstones of the in-ternal control system. Sensitive activities are firewalled by taking a restrictive approach to iT authorisations. �Monitoring of the icS takes place at different levels. in-ternal organisational arrangements underpin monitoring of the icS at the process level. Supervisors ensure that controls are actually performed, for example, by per-forming spot checks. �All internal audit activities are subject to Group-wide standards based on the Austrian Banking Act, the fMA Minimum Standards for internal Auditing and interna-

114 | GROUP OPERATiONAL ANd fiNANciAL REviEw
tional best practice. The independent internal audit func-tion regularly reviews compliance by departments and other organisational units with the internal regulations. Accounting procedures were the subject of an internal audit in 2012, with a particular emphasis on process re-liability (i.e. quality) and efficiency, as well as identifying potential improvements. �The Management Board ensures that company-wide monitoring of the icS is in place by laying the organi-sational groundwork (designation of those responsible, creat ion of appropriate information systems, etc). �The Supervisory Board Audit committee exercises its oversight function by holding regular discussions on the current status of the icS.
The icS ensures that all transactions are properly recorded, processed and documented. it also makes sure that asset
and liability items in the annual financial statements are recognised, reported and measured in accordance with the applicable legal and regulatory requirements.
The icS is adapted to changed circumstances and require-ments on an ongoing basis. Like any control system, howev-er well it is resourced, operated and monitored, the internal accounting control system can only provide an adequate and not an absolute assurance that its objectives will be attained. The identification of any changes required in the light of new risks, and ongoing monitoring of the system and assessment of its effectiveness is seen as a key task. The main priorities in this respect will be improving the effective ness and efficiency of operational processes, mini-mising operational risk by making improvements to those processes, and refining the icS.

HYPO NOE GROUP ANNUAL REPORT 2012 | 115
RESEARcH ANd dEvELOPMENT
2012 was shaped by our efforts to nurture and enhance co-hesion within the HYPO NOE Group.
The Group-wide fit for future project, initiated in 2011, became firmly established. This innovation programme is aimed at achieving a stronger customer focus, streamlining internal processes and boosting sales performance.
The programme unites all of the Group’s internal projects that are designed to optimise workflows, increase iT auto-mation and boost quality. The common objective of all such initiatives is the improvement of the cost-benefit structure.
individual business processes were evaluated with a view to further improving the management of transactions, al-
lowing us to provide our customers with tailored services throughout our relationship with them.
A number of initiatives were implemented during the year, mainly aimed at diversifying the funding product range, and several new products were launched. Measures to com-ply with regulatory and market demands for greater trans-parency in all of the Group’s core businesses were imple-mented successfully.
Rating tools for the assessment of local authorities and other banks are currently being introduced.
A suggestions forum to which all employees can contribute is one of the key measures in the ongoing organisational development process.

116 | GROUP OPERATiONAL ANd fiNANciAL REviEw
cOMMUNicATiONS
The HYPO NOE Group’s external communications strategy is centred on our integrated communications concept and the HYPO NOE umbrella brand. A marketing policy manual containing specific targets and rules of procedure based on the Group’s general strategy was produced in 2012. This will promote consistent adherence to marketing strategy and the integrated communications concept across the Group.
The rules of procedure will allow us to raise the HYPO NOE Group’s profile through sponsoring, advertising and dona-tions while ensuring that these activities do not result in any financial or reputational damage to the company, its management or other staff.
As a Lower Austrian bank, our marketing, sponsorship and charitable activities mainly focus on the core geographic
markets of Lower Austria and vienna. Sponsoring activities are concentrated on sports, arts and culture, social projects and educational initiatives. Sports and the arts are ideal-ly suited to raising awareness of the Group and generat-ing a positive image, as both are high-profile channels and play important roles in society. As a dedicated corporate citizen, the Group primarily supports and donates funds to organisations and projects that focus on areas related to the Group’s own activities, and that have a sustainable local impact.
The policy manual was reviewed internally and externally against the applicable Austrian legal provisions, approved by the HYPO NOE Gruppe Bank AG Management and Su-pervisory boards, and communicated within the Group in 2012.

HYPO NOE GROUP ANNUAL REPORT 2012 | 117
GROUP OUTLOOK fOR 2013
we expect 2013 to be an eventful year for the HYPO NOE Group. The bank’s 125th anniversary demonstrates the im-portance and effectiveness of the Group’s business model as a mortgage bank capable of enduring through succes-sive eras and generations. Our customers are being includ-ed in the jubilee celebrations, which began at the start of 2013 and will continue throughout the year. A second major priority for the year, and one that is central to our future operations, will be the completion of the process begun in mid-2012 to create an end-to-end value chain in real estate services, and integrate it in our organisation and external communications. This will establish the real estate segment as the Group's third strategic pillar, alongside our tradition-al core business and the danube region strategy.
Step-by-step introduction of the Basel iii regulations will continue in 2013. Preparations for this have been under way for some years now, and the Group has one of the highest equity ratios in the Austrian banking industry.
The forecasts for 2013 reflect a broad consensus on the outlook for economic growth and for the various capital market segments. despite the burden imposed by the com-promise on fiscal policy the US is seen recording growth of about two percent, as in 2012, while the eurozone economy is expected to flatline at best, and the chinese economy should enjoy a modest pick-up in activity although it will not return the growth rates of past years.
we are cautiously optimistic about the eurozone’s pros-pects in 2013, since the measures taken last year by the peripherals and at the European level have already had a positive effect. interest rates are expected to be kept low, in order to give economic recovery programmes time to take root. we will continue to actively manage interest rate risk in 2013, and to take advantage of selected opportunities in connection with banking book management, in line with our conservative approach to risk.
further issues of senior unsecured bonds with longer ma-turities will be an important part of the Group’s refinancing strategy this year, and a vital step in developing a diver-sified, long-term refinancing base. following the success of the public covered bond issues in 2012, another issue is planned in 2013.
in 2013 we will further expand our policy of targeted com-munications, and providing current and potential investors with extensive information on the Group's performance, in order to enhance our reputation as an innovative and trust-worthy partner.
The business segments will press ahead with the selective expansion of our high quality loan portfolio in Austria and the danube region in 2013.
Another organisational development priority for the year will be a project launched in 2012 to strengthen and devel-op the internal control system (icS), with an emphasis on pinpointing and evaluating risks, identifying and drawing up control and validation procedures, and where necessary adapting key processes. improvements to the effectiveness and efficiency of these processes are planned, as well as refinements to the icS, with the aim of further minimising risks.
As in all other parts of the Group, Human Resources will fo-cus on boosting efficiency, by optimising and harmonising Group-wide processes, as well as completing the migration to an integrated software package.
A multi-stage leadership development programme is planned as a follow-up to the leadership forum. The main objectives will be to create a common management app-roach and to enhance leadership skills.
Employees, their line managers and HR will continue to work together to map out development activities tailored to individual needs, drawing on the outcomes of staff app-raisals.
A new group of trainees will take part in the HYPO NOE Trainee Programme in 2013. The programme offers talent-ed university students an opportunity to discover and con-tribute to the HYPO NOE Group.
The wide array of plans and initiatives for 2013 are all aimed at bringing the Group a major step further in our mission to secure long-term customer satisfaction and sustainable growth.

118 | GROUP OPERATiONAL ANd fiNANciAL REviEw
EvENTS AfTER THE REPORTiNG PERiOd
The easing of the eurozone crisis after mid-2012 continued in 2013, in spite of the political deadlock in italy following in-conclusive elections in late february. The financial markets' response to the country's inability to form a new government came in the form of sharp declines in italian government bond prices, but market sentiment calmed relatively quickly. in a positive sign, instability did not spread to the other peripherals.
The downward trend in irish, Portuguese and Spanish risk premiums continued almost unchecked. This is a clear indication of investors' increasing confidence in the survival of the eurozone, ultimately thanks to the European central Bank’s (EcB) Outright Monetary Transactions (OMT) programme. Although the EcB is highly pessimistic at present, and has downgraded its eurozone growth forecast from -0.3% to -0.5%, the outlook for the global and euro area economies has brightened – at least in the light of current data and early indications. As the large central banks look set continue to maintain relaxed monetary policies, the positive performance of the financial markets has continued in 2013.
The course set by the new Japanese government at the beginning of the year has also boosted confidence. its ambitious package of fiscal measures is aimed at finally overcoming the country’s economic stagnation, as is the new government’s readiness to exert greater pressure on the central bank to pursue a highly expansionary monetary policy. The outcome of this experiment is uncertain, but the markets have reacted favourably.
Among the peripheral members of the eurozone, ireland and Portugal continue to be viewed as object lessons by the troika. Spain has also made some progress in consolidating its public finances, and its move to establish a bad bank to tackle the problems in the financial sector was greeted with approval. A rescue package for cyprus was agreed in principle at the end of March. continuing uncertainty about the details and consequences of the bailout are likely to preoccupy politicians and the financial markets over the next few weeks.
discussions in Hungary concerning the consolidation of debts owed by the country’s municipalities have centred on the prospect of the Republic of Hungary taking on a large proportion of the debt. The details will not be ironed out until the middle of 2013 at the earliest. The international community is keeping a critical eye on the political situation in Hungary, and following a period of relative calm, the country may again find itself at the centre of the financial markets’ attention.
A decision on implementing the remaining aspects of Basel iii (cRd iv and cRR 1), originally scheduled for 2012, was finally agreed at the end of february 2013. implementation is now set to begin on 1 January 2014, adding to the list of changes facing the European banking sector, which already includes the implications of the financial transaction tax, MiR, fATcA, banking union and European banking supervision.
St. Pölten, 26 March 2013
The Management Board
Peter Harold chairman of the Management Board
nikolai de Arnoldi Member of the Management Board

Consolidated finanCial statements for the year ended 31 december 2012according to ifrS
consolidated statement of comprehensive income 120
consolidated statement of financial position 121
consolidated statement of changes in equity 122
consolidated statement of cash flows 123

120 | conSolidated financial StatementS
conSolidated Statement of comPrehenSiVe income
income statement (eUR ’000) (notes) 2012 2011 Change
interest and similar income (7.1) 552,314 445,488 106,827
thereof: income from investments ac-counted for using the equity method 3,686 5,222 -1,536
interest and similar expense (7.2) -416,944 -306,693 -110,251
net interest income 135,371 138,795 -3,424
credit provisions (7.4) -21,157 -20,125 -1,032
net interest income after risk provisions 114,214 118,670 -4,456
fee and commission income 15,104 15,551 -447
fee and commission expense -3,119 -3,112 -7
net fee and commission income (7.5) 11,985 12,439 -454
net trading income (7.6) -804 -900 96
general administrative expenses (7.7) -106,965 -94,240 -12,725
net other operating income (7.8) 17,199 20,076 -2,877
net gains or losses on available-for-sale financial assets (7.9) -7,217 62,036 -69,253
net gains or losses on financial assets designated as at fair value through profit or loss (7.10) 97 158 -61
net gains or losses on financial assets held to maturity (7.11) – 44 -44
net gains or losses on hedges (7.12) 1,973 382 1,591
net gains or losses on other financial investments (7.14) -256 -46 -210
Profit before tax 30,226 118,619 -88,393
income tax expense (7.15) -7,418 -29,105 21,687
Profit for the year 22,808 89,514 -66,706
non-controlling interests (7.16) -37 -46 9
Profit attributable to owners of the parent 22,771 89,468 -66,697
other comprehensive income (eUR '000) 2012 2011
Profit attributable to owners of the parent 22,771 89,468
items that will not be reclassified to profit or loss
change in actuarial gains or losses (before tax) -2,746 -2,415
change in deferred tax 686 604
change in deferred tax on untaxed retained earnings – 1,194
items that may be reclassified subsequently to profit or loss
change in available-for-sale financial instruments (before tax) 77,701 -55,920
change in cash flow hedge (before tax) -956 2,229
exchange differences on translating foreign operations accounted for using the equity method (before tax) -4 –
change in deferred tax -19,185 13,423
total other comprehensive income 55,497 -40,885
total comprehensive income attributable to owners of the parent 78,268 48,583
other comprehensive income is attributable to the owners of the parent.

hyPo noe groUP annUal rePort 2012 | 121
conSolidated Statement of financial PoSition
*a detailed presentation is given in the statement of changes in equity, overleaf.
assets (eUR ’000) (notes) 31 dec. 2012 31 dec. 2011 Change
cash and balances at central banks (8.1) 71,644 78,739 -7,095
loans and advances to banks (8.3) 894,317 583,997 310,320
loans and advances to customers (8.4) 10,735,077 9,702,478 1,032,599
risk provisions (8.6) -112,899 -104,006 -8,893
assets held for trading (8.7) 607,414 471,080 136,334
Positive fair value of hedges (hedge accounting) (8.8) 617,935 471,809 146,126
available-for-sale financial assets (8.9, 8.15) 1,825,600 1,837,180 -11,580
financial assets designated as at fair value through profit or loss (8.10) 4,662 4,560 102
financial assets held to maturity (8.11, 8.15) 10,009 15,031 -5,022
investments accounted for using the equity method (8.13, 8.15) 53,514 47,942 5,572
investment property (8.14, 8.15) 52,256 43,411 8,845
intangible assets (8.16) 2,194 765 1,429
Property, plant and equipment (8.16) 67,507 35,237 32,270
current tax assets (8.17) – 4,068 -4,068
deferred tax assets (8.17) 5,342 19,214 -13,872
other assets (8.18) 27,125 21,553 5,572
total assets 14,861,697 13,233,058 1,628,639
equity and liabilities (eUR ’000)
deposits from banks (8.20) 2,717,286 2,384,461 332,825
deposits from customers (8.21) 2,254,455 2,473,410 -218,955
debts evidenced by certificates (8.22) 7,911,349 6,831,752 1,079,597
liabilities held for trading (8.23) 525,043 380,474 144,569
negative fair value of hedges (hedge accounting) (8.24) 593,630 409,916 183,714
Provisions (8.25) 47,748 46,859 889
current tax liabilities (8.26) 17,006 8,901 8,105
deferred tax liabilities (8.26) 16,962 11,961 5,001
other liabilities (8.27) 78,241 51,945 26,296
Subordinated capital (8.28) 202,435 202,244 191
equity (including non-controlling interests)* (8.29) 497,542 431,135 66,407
equity attributable to owners of the parent 496,977 430,608 66,369
non-controlling interests 565 527 38
total equity and liabilities 14,861,697 13,233,058 1,628,639

122 | conSolidated financial StatementS
conSolidated Statement of changeS in eQUity
eUR ’000, as at 31 dec. 2012
Balance at 1 Jan. 2012
Profit/loss for the year
dividends paid
Changes in scope of consolida-
tion
other comprehensive
income transfers
Balance at 31 dec.
2012
Share capital 51,981 – – – – – 51,981
capital reserves 191,824 – – – – – 191,824
retained earnings 275,891 22,771 -11,900 – – – 286,762
iaS 19 reserve -3,439 – – – -2,059 – -5,498
available-for-sale reserve -88,240 – – – 58,276 – -29,964
cash flow hedge reserve 2,592 – – – -717 – 1,875
currency translation reserve – – – – -3 – -3
eQUitY attRiBUtaBle to oWneRs of tHe PaRent
430,608 22,771 -11,900 – 55,497 – 496,977
non-controlling interests 528 37 – – – – 565
total eQUitY 431,135 22,808 -11,900 – 55,497 – 497,542
eUR ’000, as at 31 dec. 2011
Balance at 1 Jan. 2011
Profit/loss for the year
dividends paid
Changes in scope of consolida-
tion
other comprehensive
income transfers
Balance at 31 dec.
2011
Share capital 51,981 – – 12 – -12 51,981
capital reserves 191,824 – – – – – 191,824
retained earnings 185,230 89,467 – 8 1,194 -8 275,891
iaS 19 reserve -1,628 – – – -1,811 – -3,439
available-for-sale reserve -46,300 – – – -41,940 – -88,240
cash flow hedge reserve 920 – – – 1,672 – 2,592
currency translation reserve – – – – – – –
eQUitY attRiBUtaBle to oWneRs of tHe PaRent
382,026 89,467 – 20 -40,885 -20 430,608
non-controlling interests 462 46 – – – 20 528
total eQUitY 382,488 89,513 – 20 -40,885 – 431,135
See note 4.17 for notes to the statement of changes in equity (including non-controlling interests), and note 8.29 equity for additional disclosures. the presentation of the statement of changes in equity has been modified in the interests of improved legibility.

hyPo noe groUP annUal rePort 2012 | 123
conSolidated Statement of caSh floWS
eUR ’00031 dec.
2012 31 dec.
2011
Profit for the year (before non-controlling interests) 22,808 89,514
non-cash comprehensive income items
amortisation and depreciation 10,671 43,134
allocations to and reversals of provisions and risk provisions 8,229 -50,277
gains on disposal of financial assets, and property, plant and equipment 5,343 -92,716
other adjustments -6,339 18,936
changes in assets and liabilities due to operating activities after adjustments for non-cash components
loans and advances to banks -310,182 -151,300
loans and advances to customers -895,226 -628,690
available-for-sale financial assets 60,637 143,588
other operating assets 78,712 3,716
deposits from banks 329,793 -234,625
deposits from customers -219,143 117,924
debts evidenced by certificates 929,734 714,585
other operating liabilities 18,176 -58,197
Cash flows from operating activities 33,214 -84,407
Proceeds from sale of/redemption of:
financial assets held to maturity 5,010 55,041
investments in associates 25 106,217
Property, plant and equipment, intangible assets and investment property 3,526 2,119
Purchase of:
investments in associates -1,397 -295
Property, plant and equipment, intangible assets and investment property -31,263 -39,263
acquisition of subsidiaries -4,500 –
Cash flows from investing activities -28,600 123,818
dividends paid -11,900 –
Subordinated debt 191 -285
Cash flows from financing activities -11,709 -285

124 | conSolidated financial StatementS
Cash and cash equivalents at end of previous period 78,739 39,613
cash flows from operating activities 33,214 -84,407
cash flows from investing activities -28,600 123,818
cash flows from financing activities -11,709 -285
Cash and cash equivalents at end of period 71,644 78,739
Payments for taxes, interest and dividends
income taxes refunded/paid 2,990 -3,088
interest received 541,701 432,952
interest paid -417,238 -309,172
dividends received 955 1,976
cash and cash equivalents consist of cash on hand and balances at central banks (see note 8.1 cash and balances at central banks). See note 6 for additional information on the consolidated statement of cash flows.

NOTESTO THE CONSOLIDATED FINANCIAL STATEMENTS AND GOVERNING BODIES
1. General information 126
2. Accounting principles 127
3. Accounting and measurement policies 130
4. Notes on individual items of the consolidated financial statements 147
5. Segment information 152
6. Statement of cash flows 153
7. Notes to the statement of comprehensive income 154
8. Notes to the statement of financial position 167
9. Segment information 191
10. Supplementary information 197

126 | NOTES
1. GENERAL INFORMATION
HYPO NOE Gruppe Bank AG, domiciled at Hypogasse 1, 3100 St. Pölten, Austria is the ultimate parent of the com-panies included in consolidation. It is registered in the register of companies at the state/commercial court in St. Pölten, under FN 99073 x. HYPO NOE Gruppe Bank AG has operated a branch office at Wipplingerstrasse 4, 1010 Vien-na since 2008.
HYPO NOE Gruppe Bank AG is one of Austria’s largest Landesbanken (state banks), and provides a comprehen-sive range of financial and facility management services in conjunction with its subsidiaries. As the parent company of a group that also includes HYPO NOE Leasing GmbH and HYPO NOE Real Consult GmbH, HYPO NOE Gruppe Bank AG mainly serves large state and local government clients. It specialises in providing services related to public finance,
real estate finance and treasury for clients based in Aus-tria and abroad. HYPO NOE Landesbank AG is a full-ser-vice bank for retail customers, professionals and business customers in Lower Austria and Vienna with 29 branches. HYPO NOE First Facility GmbH is one of the leading full-line facility management service providers in Austria and the CEE region.
The 2012 consolidated financial statements will be pub-lished in the Wiener Zeitung on 24 April 2013, and posted under Press room/Publications on the Group’s site (www.hyponoe.at).
Readers are referred to the Group operational and financial review for information on key events during the reporting period.

HYPO NOE GROUP ANNUAL REPORT 2012 | 127
2. ACCOUNTING POLICIES
The consolidated financial statements of the HYPO NOE Group for the year ended 31 December 2012 were drawn up in accordance with section 245a UGB (Austrian Business Code) and section 59a BWG (Banking Act), as well as Regu-lation (EC) No 1606/2002 of the European Parliament and of the Council of 19 July 2002. The statements were pre-pared on the basis of the International Financial Reporting Standards (IFRSs) and International Accounting Standards (IAS) issued by the International Accounting Standards Board (IASB), as well as the interpretations issued by the Standing Interpretations Committee (SIC) and the Inter-national Financial Reporting Interpretations Committee (IFRIC).
The consolidated financial statements have been prepared in accordance with the IFRS/IAS standards and interpreta-tions thereof adopted and published by the European Union up to 31 December 2012, and applicable to the business ac-tivities of the HYPO NOE Group.
AmENdEd STANdArdS APPLiEd TO THE 2012 FiNANciAL STATEmENTSApart from the Improvements to IFRSs, the following amended standards are relevant to the 2012 consolidated financial statements:
IAS 19 Employee Benefits, mandatory effective date 1 January 2013
The HYPO NOE Group adopted the revised IAS 19 early, and it was applied to the financial statements for the year ended 31 December 2011. The amendments to the stand-ard relate to the recognition of actuarial gains and losses in other comprehensive income (OCI) and the elimination of the “corridor” approach. The HYPO NOE Group’s finan-cial reporting was not affected by this change, as actuarial gains and losses were already shown in OCI before adoption of the revised standard. Another amendment concerns the expected return (at the discount rate) on plan assets. The HYPO NOE Group does not have any plan assets. The ad-ditional disclosures required by the revised standard were already made in the notes to the 2011 financial statements.
Presentation of Items of Other Comprehensive Income (amendments to IAS 1), mandatory effective date 1 July 2012
The Group’s consolidated financial statements for 2012 reflect the changes in the presentation of other compre-hensive income introduced by these amendments, with a distinction drawn between items that may subsequently or will not be reclassified to profit or loss.
NEw ANd AmENdEd STANdArdS NOT APPLiEd TO THE 2012 FiNANciAL STATEmENTSThe following standards which entered into effect in 2012 were not applied, as they were not relevant to any mate-rial transactions within the HYPO NOE Group. They might, however, affect the accounting treatment of future transac-tions or agreements.
IAS 12/SIC 21 Income Taxes, mandatory effective date 1 January 2012
Under the amendments to IAS 12, the treatment of invest-ment property (IAS 40) established by SIC 21 Income Taxes – Recovery of Revalued Non-Depreciable Assets is eliminat-ed, and the other rules established by the interpretation, for property, plant and equipment, and intangible assets (revaluation model, IAS 16 and IAS 38), are included in IAS 12. As the HYPO NOE Group recognises assets at the car-rying amounts when applying IAS 40, IAS 16 and IAS 38 the revaluation model is not relevant to the recognition of deferred tax.
NEw ANd AmENdEd STANdArdS NOT YET EFFEcTivE The following IFRS standards and interpretations which have already been issued but are not yet mandatory are relevant to the consolidated financial statements, but have not been applied early:
IFRS 10 Consolidated Financial Statements, mandatory effective date 1 January 2014
IFRS 10 creates a consistent definition of control, and thus a uniform basis for establishing whether a parent-subsid-iary relationship exists, and for determining the scope of

128 | NOTES
consolidation. This standard replaces IAS 27 Consolidated and Separate Financial Statements (2008) and SIC 12 Con-solidation – Special Purpose Entities, both of which were relevant to the Group’s financial reporting. As things stand it does not appear that this will result in any significant changes in the consolidation of the Group’s financial state-ments.
IFRS 11 Joint Arrangements, mandatory effective date 1 January 2014
IFRS establishes principles for financial reporting by par-ties to arrangements where there is joint control of a joint venture or joint operation. The new standard replaces IAS 31 Interests in Joint Ventures and SIC 13 Jointly Controlled Entities – Non-Monetary Contribution by Venturers. The main change from IAS 31 is the elimination of proportionate consolidation as a method of accounting for joint ventures; in future, the equity method will have to be used. As the HYPO NOE Group does not employ proportionate consoli-dation the new standard will not affect the manner in which it accounts for joint ventures.
IFRS 12 Disclosure of Interests in Other Entities, mandatory effective date 1 January 2014
IFRS 12 governs the disclosures in the notes regarding sub-sidiaries, associates, unconsolidated structured entities and joint arrangements. The additional disclosure require-ments will result in an increased administrative workload for the HYPO NOE Group.
IAS 27 (2011) Separate Financial Statements, mandatory effective date 1 January 2014
IAS 27 has been revised to bring it into line with IFRS 10, IFRS 11 and IFRS 12. These adjustments will have no influ-ence on the consolidated financial reporting of the HYPO NOE Group.
IAS 28 (2011) Investments in Associates and Joint Ventures, mandatory effective date 1 January 2014
IAS 28 has been revised to bring it into line with IFRS 10, IFRS 11 and IFRS 12.
These adjustments will have no influence on the consolidat-ed financial reporting of the HYPO NOE Group.
IFRS 13 Fair Value Measurement, mandatory effective date 1 January 2013
IFRS 13 provides a single definition of fair value, which was previously governed by a variety of standards. The focus is on the measurement of fair value. This new standard has resulted in the unification of the disclosures made in the notes, and in the provision of additional information.
The augmented disclosures will result in an increased ad-ministrative workload for the HYPO NOE Group.
Offsetting Financial Assets and Financial Liabilities (amendments to IAS 32), mandatory effective date 1 January 2014
in conjunction with
Disclosures – Offsetting Financial Assets and Financial Liabilities (amendments to IFRS 7), mandatory effective date 1 January 2013
The IASB has introduced additional disclosure require-ments to increase comparability with US GAAP. The offset-ting model established by IAS 32 is retained as such, but the new disclosure requirements call for the statement of the gross amounts before offsetting and the net amounts after offsetting in the notes (paragraph 42 IAS 32). The new requirements also affect financial instruments that are only subject to certain netting agreements, regardless of whether they are actually set off in the statement of finan-cial position.
IFRS 9 Financial Instruments, mandatory effective date 1 January 2015
On 16 December 2011 the IASB deferred initial application of this standard from 1 January 2013 to 1 January 2015. The background to this is the intention to ensure that all the provisions of IFRS 9 are applied simultaneously, as only the work on the recognition and measurement of financial instruments has so far been completed; impairment and hedge accounting are still being discussed as part of the IAS 39 replacement project.
The Board has also decided to dispense with the restate-ment of comparative period figures on initial application of IFRS 9. Nevertheless, the latter will lead to additional dis-closures under IFRS 7.

HYPO NOE GROUP ANNUAL REPORT 2012 | 129
IFRS 9 Financial Instruments: Classification and Measure-ment will bring considerable changes for the HYPO NOE Group with regard to the categorisation of financial instru-ments. The Group completed a classification and measure-ment project in 2012. A further IFRS 9 related project, deal-ing with impairment and risk provisions, is planned for 2013.
At present there are four categories of financial assets: 1. at fair value through profit or loss (held for trading and fair value option); 2. held to maturity (HTM); 3. loans and re-ceivables (LAR); and 4. available for sale (AFS). These will be replaced by two new categories (1. amortised cost; and 2. at fair value); classification will be according to the business model for managing the assets, and their characteristics. Measurement will be at amortised cost if an asset is held within a business model whose objective is to collect con-tractual cash flows, and if the contractual terms of the as-
set give rise on specified dates to cash flows that are solely payments of principal and interest. If it is not possible to identify these factors the financial instruments will normal-ly be measured at fair value through profit or loss.
It will be necessary to recognise all equity instruments that are subject to IFRS 9 at fair value, and any subsequent gains or losses in profit or loss. Exemptions will be possible if the entity elects to recognise equity instruments at fair value through other comprehensive income. In this case dividends from the investment will have to be recognised in profit or loss.
There will no longer be an obligation to separate embedded derivatives from the hosts. Embedded derivatives will be accounted for as combined instruments, and measured at fair value through profit or loss.

130 | NOTES
3. ACCOUNTING AND MEASUREMENT POLICIES
The consolidated financial statements of the HYPO NOE Group for the year ended 31 December 2012 comprise the statement of comprehensive income, the consolidated statement of financial position, the consolidated statement of changes in equity, the consolidated statement of cash flows and the notes. The segment information is contained in the notes.
The risk report forms part of the operational and financial review, prepared in compliance with section 267 UGB (Aus-trian Business Code).
These consolidated financial statements are based on the separate financial statements of all the consolidated Group companies as at 31 December 2012, drawn up in accordance with IFRS. The HYPO NOE Group applies uniform Group-wide accounting policies.
The consolidated financial statements have been prepared on a going concern basis.
The Group’s significant accounting policies are discussed below.
The methods described are uniformly and consistently ap-plied to these consolidated financial statements unless oth-erwise stated.
Income and expenses are recognised on an accrual basis. They are recorded and reported in the periods to which they are attributable. Premiums and discounts are amor-tised using the effective interest method; the accrued in-terest is included in the item under which the underlying financial instrument is carried.
All the estimates and judgements required by IFRS ac-counting are best estimates made in accordance with the relevant standards. The estimates are reviewed on an ongo-ing basis, and are based on experience and other factors in-cluding expectations regarding future events which appear reasonable under the circumstances. Particularly frequent use of estimates and assumptions was made when valuing investments, recognising deferred tax assets attributable to tax loss carry-forwards, recognising credit provisions (es-timating recoverable amounts and calculating default prob-abilities), and performing fair value measurement (on the basis of observable market data). Where heavy reliance on estimates was necessary, the assumptions made in respect of the items concerned are explained in separate notes.
Disclosures required by IFRS 7 that relate to the nature and extent of risks associated with financial instruments are
also discussed in the risk report (page 28 f). This forms part of the Group operational and financial review.
The reporting currency is the euro. All figures are present-ed in thousand euro (EUR thsd/EUR ’000) unless otherwise stated. The tables below may contain rounding differences.
3.1 BASiS OF cONSOLidATiONThe consolidated financial statements of the HYPO NOE Group include all the subsidiaries that are directly or in-directly controlled by the parent, and are material to the presentation of the Group’s assets, finances and earnings. Apart from the parent, HYPO NOE Gruppe Bank AG, the statements include a total of 57 domestic subsidiaries in which the Group holds more than half of the voting pow-er or which it controls by other means. Besides the parent bank a total of 53 domestic subsidiaries were included in consolidation in 2012.
In addition, 38 domestic and six foreign companies are accounted for using the equity method. In 2011 the equity method was used to account for 34 domestic companies in the Group’s consolidated financial statements.
The Group’s holdings in these companies are set out in Note 3.2.
Subsidiaries are included in the consolidated financial statements at the date on which control is obtained. Con-trol exists where the Bank has the power to govern the fi-nancial and operating policies of an entity so as to obtain benefits from its activities.
Consolidation is performed in accordance with IFRS 3 Busi-ness Combinations, using the purchase method. The iden-tifiable assets acquired, liabilities assumed and non-con-trolling interest are recognised at their acquisition date fair values. Any excess of the cost over the fair value of the net assets acquired is reported as goodwill. Negative differences are recognised directly in profit or loss. The carrying value of the goodwill is tested for impairment at least once a year. Under IFRS 1, it is not necessary to apply IFRS 3 to business combinations that occurred before the effective date of IFRS 3. Because of this the consolidation method used for the UGB consolidated financial statements was applied. The cost of the investments was netted against the share of the carrying value of their equity held at the date of consolidation. The resultant positive and negative differences arising on consolidation were set off against the reserves and reported as a separate item, “Differences

HYPO NOE GROUP ANNUAL REPORT 2012 | 131
arising on first-time adoption of IFRS”, in the statement of changes in equity.
The share of the equity and profit or loss of majority-owned subsidiaries of the HYPO NOE Group attributable to non- controlling interests is separately reported, respectively, as “Non-controlling interests” in the statement of chang-es in equity and in the item of the same name, after net profit, in the statement of comprehensive income (Note 7.16 Non-controlling interests).
The results of subsidiaries acquired or divested during the year are recognised in the statement of comprehensive in-come, in accordance with the actual acquisition or disposal dates.
All material intra-group transactions are eliminated on con-solidation.
The HYPO NOE Group does not apply proportionate con-solidation.
Joint ventures (IAS 31) and associates (IAS 28) are ac-counted for using the equity method unless they are im-material to the presentation of the Group’s assets, finances and earnings, are not associated with risks and rewards of ownership, or are not-for-profit organisations (Note 3.2 Investments). If an entity accounted for using the equity method applies accounting policies diverging from those of the Group, adjustments are made to align the investee’s ac-counting policies to the Group IFRS policies. Joint ventures and associates are reported under a separate item in the statement of financial position, “Investments accounted for using the equity method” (Note 8.13 Investments account-ed for using the equity method), and under “Income from investments accounted for using the equity method” as a sub-item of “Interest and similar income” (Note 7.1 Interest and similar income).
Interests in non-consolidated subsidiaries and other in-vestments are measured at fair value or at amortised cost. Impairment is recognised immediately, and is reported un-der “Available-for-sale financial assets” (Note 8.9. Availa-ble-for-sale financial assets and Note 3.2 Investments).
cHANGES iN 2012
Formations
The following new formations were included in the consoli-dated financial statements for the first time in 2012.
Benkerwiese Mietergemeinschaft GmbH was registered on 5 July 2012 as a wholly owned subsidiary of NÖ Hypo Beteiligungsholding GmbH.
Strategic Equity Beteiligungs-GmbH was registered on 11 December 2012 as a wholly owned subsidiary. HYPO NOE Gruppe Bank AG holds a 51% interest in the company, and HYPO NOE Landesbank AG 49%.
HYPO NOE Versicherungsservice GmbH was registered on 15 December 2012 as a wholly owned subsidiary of HYPO NOE Landesbank AG.
The following newly formed company was included in con-solidation on 31 December 2012, and is accounted for using the equity method:
BHN Sileo GmbH was registered on 15 December 2012 as a 44% subsidiary of Stategic Equity Beteiligungs-GmbH.
Acquisitions
Under an agreement signed on 2 July 2012, NÖ Hypo Beteili-gungsholding GmbH fully acquired first facility GmbH. The company was renamed as HYPO NOE First Facility GmbH, and the change registered on 28 August 2012, and was in-cluded in the consolidated financial statements for 2012.
The following subsidiaries of HYPO NOE First Facility GmbH are included in consolidation, and are accounted for using the equity method:
�Niederösterreichische Facility Management GmbH, Aus-tria (40%) �first facility d.o.o, Serbia (51%) �first facility Imobilie SRL, Romania (55%) �V2 FM GmbH, Austria (50%) �Ernst Hora Elektroinstallationen Gesellschaft m.b.H., Austria (100%) �first facility Ingatlankezelö Kft., Hungary (100%) �first facility Bulgaria EOOD, Bulgaria (100%) �first facility Macedonia dooel, Macedonia (100%) �first facility - Slovakia s.r.o., Slovakia (92.5%)

132 | NOTES
Changes of name
HYPO Real Estate Advisory GmbH was renamed as HYPO NOE Valuation & Advisory GmbH, and the change register-ed on 11 February 2012.
dETAiLEd diScLOSurES ON AcquiSiTiONSWith effect from 2 July 2012, NÖ Hypo Beteiligungsholding GmbH fully acquired first facility GmbH (renamed as HYPO NOE First Facility GmbH on 28 August 2012) by way of a share transaction. HYPO NOE First Facility GmbH was con-solidated on the acquisition date.
The acquisition was largely motivated by strategic consid-erations, namely, the wish to be able to service properties over their entire life cycle and to provide customers with optimum support from finance through to facility manage-ment.
The purchase price was a total of 4,500thsd.
The transaction costs of EUR 358thsd were reported as le-gal and consultancy costs in 2012.
The identified assets acquired and liabilities assumed as at the consolidation date, measured at fair value, are set out below.
Goodwill as at the acquisition date as defined by paragraph 32 IFRS 3, i.e. the excess of the purchase price over the net of the identifiable assets acquired and liabilities assumed, is EUR 845thsd.
The goodwill is explained by the anticipated synergies as a result of the Group’s ability, as a result of the acquisition, to offer full-line property management services.
None of the goodwill is expected to be tax deductible.
If the acquisition of HYPO NOE First Facility GmbH had taken place on 1 January 2012 its contribution to the HYPO NOE Group’s profit before tax would have been EUR 1,339thsd.

HYPO NOE GROUP ANNUAL REPORT 2012 | 133
As at 2 July 2012, Eur ’000 Fair value as at the acquisition date
Assets
Cash and balances at central banks 6
Loans and advances to banks 248
Loans and advances to customers 1,376
Risk provisions -33
Available-for-sale financial assets 66
Investments accounted for using the equity method 2,631
Intangible assets 172
Property, plant and equipment 449
Tax assets 117
Other assets 2,502
Total assets – assets acquired 7,534
Liabilities
Deposits from customers 43
Provisions 902
Tax liabilities 567
Other liabilities 2,367
Total equity and liabilities – liabilities assumed 3,879
Net assets 3,655
Goodwill 845
consideration (paid entirely in cash) 4,500
The goodwill is explained by the anticipated synergies created by the Group’s ability, as a result of the acquisition, to offer full-line property man-agement services.
None of the goodwill is expected to be tax deductible.

134 | NOTES
Contribution of HYPO NOE First Facility GmbH to the HYPO NOE Group’s profit before tax since consolidation:
2 July to 31 december 2012 Eur ’000
Interest and similar income 546
thereof: income from investments accounted for using the equity method 542
Credit provisions -27
Net interest income after risk provisions 519
General administrative expenses -5,526
Net other operating income 5,822
Profit before tax 815
If the acquisition of HYPO NOE First Facility GmbH had taken place on 1 January 2012 its contribution to the Group’s profit before tax would have been EUR 1,339thsd.

HYPO NOE GROUP ANNUAL REPORT 2012 | 135
3.2 iNvESTmENTSThe following consolidated, directly or indirectly held Group
companies were included in the IFRS consolidated financial statements of HYPO NOE Gruppe Bank AG as at 31 Decem-ber 2012:
company name domicile Holding
thereof indirect interest
reporting date Segment
54 consolidated subsidiaries
HYPO NOE Gruppe Bank AG St. Pölten 31 Dec. 2012 Gruppe Bank
HYPO NOE Landesbank AG St. Pölten 100.00% – 31 Dec. 2012 NOE Landesbank
HYPO NOE Leasing GmbH St. Pölten 100.00% – 31 Dec. 2012 Leasing
CALCULATOR Grundstückvermietungs Gesellschaft m.b.H. St. Pölten 100.00% 75.00% 31 Dec. 2012 Leasing
CURIA Grundstückvermietungs Gesellschaft m.b.H. St. Pölten 100.00% 75.00% 31 Dec. 2012 Leasing
FAVIA Grundstückvermietungs Gesellschaft m.b.H. St. Pölten 100.00% 100.00% 31 Dec. 2012 Leasing
NÖ. Verwaltungszentrum- Verwertungsgesellschaft m.b.H. St. Pölten 100.00% 100.00% 31 Dec. 2012 Leasing
PROVENTUS Grundstückvermietungs Gesellschaft m.b.H. St. Pölten 100.00% 100.00% 31 Dec. 2012 Leasing
Sana Grundstückverwaltungs Gesellschaft m.b.H. St. Pölten 100.00% 100.00% 31 Dec. 2012 Leasing
Telos Mobilien — Leasinggesellschaft m.b.H. St. Pölten 100.00% 100.00% 31 Dec. 2012 Leasing
Treisma Grundstücksverwaltungs Gesellschaft m.b.H. St. Pölten 100.00% 100.00% 31 Dec. 2012 Leasing
VIA-Grundstückverwaltungs Gesellschaft m.b.H. St. Pölten 100.00% 100.00% 31 Dec. 2012 Leasing
HYPO Niederösterreich-Immobilienleasinggesellschaft m.b.H. St. Pölten 100.00% 100.00% 31 Dec. 2012 Leasing
HYPO Niederösterreichische Liegenschaft GmbH St. Pölten 100.00% 100.00% 31 Dec. 2012 Other
NEUROM Grundstückvermietungs Gesellschaft m.b.H. St. Pölten 100.00% 100.00% 31 Dec. 2012 Leasing
NÖ. HYPO LEASING URBANITAS Grund-stückvermietungs Gesellschaft m.b.H. St. Pölten 100.00% 100.00% 31 Dec. 2012 Leasing
AELIUM Grundstückvermietungs Gesellschaft m.b.H. St. Pölten 100.00% 100.00% 31 Dec. 2012 Leasing
NÖ. HYPO LEASING Landesklinken Equipment GmbH St. Pölten 100.00% 100.00% 31 Dec. 2012 Leasing
Obere Donaustrasse 61 Liegenschaftser-richtungs- und -verwertungs GmbH St. Pölten 100.00% 100.00% 31 Dec. 2012 Other
NÖ. HYPO LEASING AGILITAS Grund-stücksvermietung Gesellschaft m.b.H. St. Pölten 100.00% 75.00% 31 Dec. 2012 Leasing
ALARIS Grundstückvermietungs Gesellschaft m.b.H. St. Pölten 100.00% 75.00% 31 Dec. 2012 Leasing
CALLIDUS Grundstückvermietungs Gesellschaft m.b.H. St. Pölten 100.00% 100.00% 31 Dec. 2012 Leasing
CLIVUS Grundstückvermietungs Gesellschaft m.b.H. St. Pölten 100.00% 100.00% 31 Dec. 2012 Leasing
COMITAS Grundstückvermietungs Gesellschaft m.b.H. St. Pölten 100.00% 100.00% 31 Dec. 2012 Leasing
NÖ. HYPO LEASING FIRMITAS Grundstückver-mietungs Gesellschaft m.b.H. St. Pölten 100.00% 100.00% 31 Dec. 2012 Leasing
NÖ. HYPO LEASING GERUSIA Grundstückver-mietungs Gesellschaft m.b.H. St. Pölten 100.00% 75.00% 31 Dec. 2012 Leasing
PINUS Grundstückvermietungs Gesellschaft m.b.H. St. Pölten 99.00% 99.00% 31 Dec. 2012 Leasing
NÖ. HYPO LEASING STRUCTOR Grund-stückvermietungs Gesellschaft m.b.H. St. Pölten 100.00% 75.00% 31 Dec. 2012 Leasing
VIRTUS Grundstückvermietungs Gesellschaft m.b.H. St. Pölten 100.00% 100.00% 31 Dec. 2012 Leasing
VOLUNTAS Grundstückvermietungs Gesellschaft m.b.H. St. Pölten 65.00% 65.00% 31 Dec. 2012 Leasing

136 | NOTES
company name domicile Holding
thereof indirect interest
reporting date Segment
VESCUM Grundstücksvermietungs GmbH St. Pölten 100.00% 100.00% 31 Dec. 2012 Leasing
SATORIA Grundstückvermietung GmbH St. Pölten 100.00% 100.00% 31 Dec. 2012 Leasing
HOSPES-Grundstückverwaltungs Gesellschaft m.b.H. St. Pölten 66.67% 66.67% 31 Dec. 2012 Leasing
Landeskrankenhaus Tulln-Immobilien-vermietung Gesellschaft m.b.H. St. Pölten 100.00% 56.42% 31 Dec. 2012 Leasing
HYPO-REAL 93 Mobilien-Leasinggesellschaft m.b.H. St. Pölten 100.00% 100.00% 31 Dec. 2012 Leasing
NÖ. HYPO LEASING DECUS Grundstückver-mietungs Gesellschaft m.b.H. St. Pölten 100.00% – 31 Dec. 2012 Other
NÖ. HYPO LEASING MENTIO Grundstücksver-mietungs Gesellschaft m.b.H. St. Pölten 100.00% 100.00% 31 Dec. 2012 Leasing
NÖ. HYPO LEASING NITOR Grundstücksver-mietungs Gesellschaft m.b.H. St. Pölten 100.00% 100.00% 31 Dec. 2012 Leasing
NÖ. HYPO LEASING MEATUS Grundstückver-mietungs Gesellschaft m.b.H. St. Pölten 100.00% 75.00% 31 Dec. 2012 Leasing
NÖ. HYPO LEASING ASTEWOG Grund-stückvermietungs Gesellschaft m.b.H. St. Pölten 100.00% 75.00% 31 Dec. 2012 Leasing
NEMUS Grundstückvermietungs Gesellschaft m.b.H. St. Pölten 100.00% 75.00% 31 Dec. 2012 Leasing
HYPO NOE Real Consult GmbH St. Pölten 100.00% 100.00% 31 Dec. 2012 Other
HBV Beteiligungs-GmbH St. Pölten 100.00% – 31 Dec. 2012 Other
ZELUS Grundstückvermietungs Gesellschaft m.b.H. St. Pölten 100.00% 100.00% 31 Dec. 2012 Leasing
Benkerwiese Verwaltungs- und Verwertungsgesellschaft m.b.H. St. Pölten 100.00% 100.00% 31 Dec. 2012 Other
Orchisgasse 66 Liegenschaftserrich-tungs- und -verwertungs GmbH St. Pölten 100.00% 100.00% 31 Dec. 2012 Other
Steinmüllergasse 64 Development GmbH St. Pölten 100.00% 100.00% 31 Dec. 2012 Other
Benkerwiese Mietergemeinschaft GmbH St. Pölten 100.00% 100.00% 31 Dec. 2012 Other
HYPO NOE First Facility GmbH Vienna 100.00% 100.00% 31 Dec. 2012 Other
HYPO NOE Versicherungsservice GmbH St. Pölten 100.00% 100.00% 31 Dec. 2012 NOE Landesbank
Strategic Equity Beteiligungs-GmbH St. Pölten 100.00% 49.00% 31 Dec. 2012 Other
HYPO NOE Valuation & Advisory GmbH St. Pölten 100.00% 10.00% 31 Dec. 2012 Other
NÖ Hypo Beteiligungsholding GmbH St. Pölten 100.00% – 31 Dec. 2012 Other
HYPO Immobilien-Beteiligungsholding GmbH St. Pölten 100.00% – 31 Dec. 2012 Other
HYPO Alpha Immobilienerrichtungs- und Verwertungs GmbH St. Pölten 100.00% 100.00% 31 Dec. 2012 Other
HYPO Beta Immobilienerrichtungs- und Verwertungs GmbH St. Pölten 100.00% 100.00% 31 Dec. 2012 Other
HYPO Gamma Immobilienerrichtungs- und Verwertungs GmbH St. Pölten 100.00% 100.00% 31 Dec. 2012 Other
HYPO Delta Immobilienerrichtungs- und Verwertungs GmbH St. Pölten 100.00% 100.00% 31 Dec. 2012 Other

HYPO NOE GROUP ANNUAL REPORT 2012 | 137
The following Group investments were accounted for using the equity method:
* Amounts in Eur ’000
company name domicile Holding
thereof indirect interest
iFrS share of equity*
valua-tion*
reporting date
21 joint ventures accounted for using the equity method in accordance with iAS 31
CULINA Grundstückvermietungs Gesellschaft m.b.H. St. Pölten 50.00% 25.00%
377 142 31 Dec. 2012
511 4 31 Dec. 2011
FACILITAS Grundstückvermietungs Gesellschaft m.b.H. St. Pölten 50.00% 25.00%
72 -3 31 Dec. 2011
75 – 31 Dec. 2010
FORIS Grundstückvermietungs Gesellschaft m.b.H. Vienna 50.00% 25.00%
912 50 31 Dec. 2011
862 -48 31 Dec. 2010
VALET-Grundstückverwaltungs Gesellschaft m.b.H. St. Pölten 50.00% 50.00%
937 -113 31 Dec. 2012
1,050 -62 31 Dec. 2011
NÖ. HYPO LEASING — Sparkasse Region St. Pölten Grundstückvermietungs Gesellschaft m.b.H. St. Pölten 50.00% 50.00%
164 -1 31 Dec. 2012
179 – 31 Dec. 2011
LITUS Grundstückvermietungs Gesellschaft m.b.H. St. Pölten 50.00% 25.00%
1,352 26 31 Dec. 2012
1,326 70 31 Dec. 2011
TRABITUS Grundstückvermietungs Gesellschaft m.b.H. Vienna 50.00% 25.00%
159 -194 31 Dec. 2011
352 78 31 Dec. 2010
Adoria Grundstückvermietungs Gesellschaft m.b.H. Vienna 50.00% 25.00%
603 13 31 Dec. 2011
591 22 31 Dec. 2010
CONATUS Grundstückvermietungs Gesellschaft m.b.H. St. Pölten 50.00% 25.00%
217 -22 31 Dec. 2011
238 -12 31 Dec. 2010
UNDA Grundstückvermietungs Gesellschaft m.b.H. St. Pölten 50.00% 25.00%
48 -2 31 Dec. 2011
50 – 31 Dec. 2010
Aventin Grundstückverwaltungs Gesellschaft m.b.H. Horn 50.00% 50.00%
1,431 -13 31 Dec. 2011
1,443 58 31 Dec. 2010
Esquilin Grundstücksverwaltungs Gesellschaft m.b.H. Vienna 50.00% 50.00%
1,256 89 31 Dec. 2011
1,168 -24 31 Dec. 2010
Palatin Grundstückverwaltungs Gesellschaft m.b.H. St. Pölten 50.00% 50.00%
1,008 628 31 Dec. 2012
597 -381 31 Dec. 2011
Purge Grundstücksverwaltungs-Gesellschaft m.b.H. Vienna 50.00% 50.00%
18 -4 31 Dec. 2011
36 – 31 Dec. 2010
Viminal Grundstückverwaltungs Gesellschaft m.b.H. Vienna 50.00% 50.00%
655 4 31 Dec. 2011
882 51 31 Dec. 2010
NÖ Raiffeisen Kommunalprojekte Service Gesellschaft m.b.H. & NÖ. HYPO Leasinggesellschaft m.b.H. — Strahlentherapie OG St. Pölten 50.00% 50.00%
72 6 31 Dec. 2012
65 24 31 Dec. 2011
N.Ö. Gemeindegebäudeleasing Gesellschaft m.b.H. Vienna 33.30% –
104 -6 31 Dec. 2011
316 -6 31 Dec. 2010

138 | NOTES
* Amounts in Eur ’000
company name domicile Holding
thereof indirect interest
iFrS share of equity*
valua-tion*
reporting date
N.Ö. Kommunalgebäudeleasing Gesellschaft m.b.H. Vienna 33.30% –
238 -22 31 Dec. 2011
260 -36 31 Dec. 2010
NÖ-KL Kommunalgebäudeleasing Gesellschaft m.b.H. Vienna 33.30% –
402 -63 31 Dec. 2011
465 -48 31 Dec. 2010
Quirinal Grundstücksverwaltungs Gesellschaft m.b.H. Vienna 33.33% –
182 4 31 Dec. 2011
195 5 31 Dec. 2010
NÖ. HYPO Leasing und Raiffeisen- Immobilien-Leasing Traisenhaus GesmbH & Co OG St. Pölten 50.00% 50.00%
1,044 36 31 Dec. 2011
1,026 46 31 Dec. 2010
23 investments accounted for using the equity method in accordance with iAS 28
Hotel- und Sportstätten- Beteiligungs-, Errichtungs- und Betriebsgesellschaft m.b.H. Leasing KG St. Pölten 45.41% 45.41%
593 2 31 Dec. 2012
591 14 31 Dec. 2011
NÖ Beteiligungsfinanzierungen GmbH Vienna 21.00% 21.00%
1,367 29 31 Dec. 2011
1,359 23 31 Dec. 2010
Niederösterreichische Vorsorgekasse AG St. Pölten 49.00% –
1,580 209 31 Dec. 2011
1,371 185 31 Dec. 2010
Franz-Glaser-Gasse 28 Immobilienentwicklung GmbH St. Pölten 50.00% 50.00%
– – 31 Dec. 2012
– -48 31 Dec. 2011
Ernst Hora Elektroinstallationen Gesellschaft m.b.H. Vienna 100.00% 100.00%
– 14 31 Dec. 2012
– – 31 Dec. 2011
first facility Ingatlankezelö Korlátolt Felelösségü Társaság Budapest 100.00% 100.00%
887 -10 31 Dec. 2011
– – 31 Dec. 2010
first facility Imobilie SRL Bucharest 55.00% 55.00%
79 -22 31 Dec. 2012
– – 31 Dec. 2011
first facility Bulgaria EOOD Sofia 100.00% 100.00%
381 13 31 Dec. 2012
– – 31 Dec. 2011
first facility Macedonia dooel Skopje 100.00% 100.00%
34 -1 31 Dec. 2012
– – 31 Dec. 2011
first facility — Slovakia s.r.o. Bratislava 100.00% 100.00%
104 – 31 Dec. 2011
– – 31 Dec. 2010
first facility d.o.o Belgrade 51.00% 51.00%
114 11 31 Dec. 2012
– – 31 Dec. 2011
V2 FM GmbH Vienna 50.00% 50.00%
– 51 31 Dec. 2011
– – 31 Dec. 2010
Niederösterreichische Facility Management GmbHWiener
Neustadt 40.00% 40.00%
1,405 487 31 Dec. 2012
– – 31 Dec. 2011
BHN Sileo GmbH St. Pölten 44.00% 44.00%
1,199 -8 31 Dec. 2012
– – 31 Dec. 2011

HYPO NOE GROUP ANNUAL REPORT 2012 | 139
* Amounts in Eur ’000
company name domicile Holding
thereof indirect interest
iFrS share of equity*
valua-tion*
reporting date
Gemeinnützige Wohnungsgesellschaft „Austria“ Aktiengesellschaft Mödling 44.39% 44.39%
Included in EWU consolidated financial
statements
31 Dec. 2011
„Wohnungseigentümer“ Gemeinnützige Wohnbaugesellschaft m.b.H. Mödling 44.75% 44.75% 31 Dec. 2011
GEBAU-NIOBAU Gemeinnützige Baugesellschaft m.b.HMaria
Enzersdorf 42.60% 42.60% 31 Dec. 2011
EWU Wohnbau Unternehmensbeteiligungs- Aktiengesellschaft (consolidated financial statements) Vienna 44.79% –
30,521 1,612 31 Dec. 2012
29,030 3,212 31 Dec. 2011
HYPO Capital Management AG Vienna 25.00% –
2,382 211 31 Dec. 2011
2,382 1,493 31 Dec. 2010
Gemdat Niederösterreichische Gemeinde-Datenservice Gesellschaft m.b.H.
Korneu-burg 32.50% –
1,087 414 31 Dec. 2011
1,004 247 31 Dec. 2010
Bonitas Versicherungsservice Gesellschaft m.b.H. St. Pölten 50.00% 50.00%
18 101 31 Dec. 2011
18 200 31 Dec. 2010
KASERNEN Projektentwicklungs- und Beteiligungs GmbH Vienna 25.00% –
110 3 31 Dec. 2011
113 -6 31 Dec. 2010
NÖ. Landeshauptstadt — Planungsgesellschaft m.b.H. St. Pölten 39.00% 39.00%
402 16 31 Dec. 2011
386 -134 31 Dec. 2010
2 investments deconsolidated as of 31 dec. 2011
Augustus Funding Limited Dublin – –
– – 31 Dec. 2012
– – 31 Dec. 2011
HYPO Real Invest AG Vienna – –
– – 31 Dec. 2012
– 293 31 Dec. 2011
Total ** 53,514 3,686 ***
** Note 8.13 Investments accounted for using the equity method
*** Note 7.1 Interest and similar income

140 | NOTES
* Amounts in Eur ’000 company name domicile Holding
thereof indirect interest
registered capital*
Profit/loss re-ported in register
of companies*reporting
date
Non-consolidated AFS investments (interest more than 50%)
Castellum Schallaburg Grundstückver-mietungs Gesellschaft m.b.H. St. Pölten 100.00% 100.00%
-117 -23 31 Dec. 2011
-94 -42 31 Dec. 2010
VIA DOMINORUM Grundstückver-wertungs Gesellschaft m.b.H. St. Pölten 95.00% 95.00%
-7,041 -107 31 Dec. 2011
-6,934 -7,617 31 Dec. 2010
WPS-Wirtschaftspark Sieghart-skirchen Gesellschaft m.b.H. St. Pölten 100.00% 100.00%
-1,283 -128 31 Dec. 2011
-1,155 -164 31 Dec. 2010
Liegenschaftsverwertung Felixdorf GmbH
Felixdorf – – – – 31 Dec. 2011
St. Pölten 100.00% 100.00% -1,238 -56 31 Dec. 2010
Wilax Wien-Laxenburg NÖ Veran-staltungs Gesellschaft mbH St. Pölten 100.00% 100.00%
14 -3 31 Dec. 2011
17 3 31 Dec. 2010
Wohnpark Schrems Liegenschafts-verwertungs Gesellschaft m.b.H. St. Pölten 100.00% 100.00%
-105 -23 31 Dec. 2011
-82 -26 31 Dec. 2010
The following companies in which the Group holds interests of more than 50% were treated as AFS investments due to their being immaterial or not associated with risks and rewards of ownership.
* Amounts in Eur ’000company name domicile Holding
thereof indirect interest
registered capital*
Profit/loss re-ported in register
of companies*reporting
date
Non-consolidated AFS investments (interest 20–50%)
NÖ Kulturwirtschaft GesmbH. (consolidated financial statements)* St. Pölten
40.52% 40.52% 4,631 297 31 Dec. 2011
52.52% 52.52% 4,334 599 31 Dec. 2010
Psychosoziales Zentrum Schiltern Gesellschaft m.b.H.
Schiltern, Langenlois 26.67% –
1,012 91 31 Dec. 2011
922 58 31 Dec. 2010
EFH-Beteiligungsgesellschaft m.b.H. Vienna 50.00% –
30 -3 31 Dec. 2011
12 -2 31 Dec. 2010
NÖ. Landes-Sportschulanlagen-betriebsgesellschaft m.b.H. St. Pölten 49.00% 49.00%
60 – 31 Dec. 2011
61 1 31 Dec. 2010
Pöchlarner Kommunalimmobilien-verwaltungs Gesellschaft m.b.H. Pöchlarn 20.00% 20.00%
30 -14 31 Dec. 2011
44 14 31 Dec. 2010
Melker Kommunalimmobilienver-waltungs Gesellschaft m.b.H. St. Pölten 20.00% 20.00%
83 37 31 Dec. 2011
45 112 31 Dec. 2010
Loosdorfer Kommunalimmobilien Gesellschaft m.b.H. Loosdorf 20.00% 20.00%
449 -292 31 Dec. 2011
741 90 31 Dec. 2010
Schwarzauer Kommunalimmobilien-verwaltungs Gesellschaft m.b.H.
Schwarzau am Steinfelde 20.00% 20.00%
2,229 19 31 Dec. 2011
2,210 48 31 Dec. 2010
The following companies, in which the Group has interests of 20–50%, were treated as AFS investments due to immateri-ality or the absence of risks and rewards of ownership.

HYPO NOE GROUP ANNUAL REPORT 2012 | 141
3.3 FiNANciAL iNSTrumENTSA financial instrument is any contract that gives rise to a fi-nancial asset of one entity and a financial liability or equity instrument of another entity.
IAS 39 requires the recognition of all financial assets and li-abilities in the consolidated statement of financial position.
The regular way purchase or sale of derivatives and finan-cial instruments is recognised on the trade date.
Financial assets are derecognised when the contractual rights to the cash flows from the financial asset expire or the transfer criteria established by IAS 39 are fulfilled. Fi-nancial liabilities are derecognised when they are exting-uished or the obligations have expired.
Where financial instruments are accounted for at fair value, the latter is normally determined on the basis of quoted market prices. In the absence of a market price the future cash flows of a financial instrument are discounted to pres-ent value applying the relevant interest rate. Measurement is performed using standard financial valuation techniques. Options pricing models are used to value options and other financial instruments with similar characteristics, applying current market inputs. Amortised cost is used to measure equity instruments if the fair value is not reliably measur-able.
Financial instruments are initially recognised at fair value.
Fair value is the amount for which a financial instrument could be exchanged between knowledgeable, willing par-ties in an arm’s length transaction. Where market prices are available they are used to estimate fair value. In the ab-sence of market prices, accepted, industry-standard valua-tion models are employed. The present value of derivatives (e.g. interest rate swaps, cross currency swaps, FX forwards and forward rate agreements) is calculated by discounting the replicating cash flows. OTC currency and interest rate options are measured using option pricing models such as the Black Scholes, Hull White or LIBOR market model (Note 10.3 Fair value disclosures in accordance with IFRS 7).
3.4 FiNANciAL ASSETSIAS 39 classifies financial assets into the following four categories:
1. Loans and receivables (LAR)
Loans and receivables are non-derivative financial assets with fixed or determinable payments that are not quoted in an active market (Note 8.3 Loans and advances to banks, and Note 8.4 Loans and advances to customers).
Loans and receivables are measured at amortised cost (gross), and impairments to them as credit provisions, un-der “Risk provisions” (Note 8.6 Risk provisions and credit provisions).
2. Assets held for trading (HFT)
Financial instruments acquired for the purpose of reselling them in the near term, or forming part of a portfolio that the entity intends to resell in the near term with the objec-tive of generating a profit, must be classified as assets held for trading. This category also includes all derivatives other than those used as hedging instruments.
In the HYPO NOE Group most of the assets classified in this way represent the positive fair value attributable to derivatives used for interest rate or foreign exchange relat-ed transactions, and other derivative transactions such as share price and index-linked transactions and credit deriva-tives (Note 8.7 Assets held for trading).
Measurement is at fair value. Realised gains and losses, and measurement gains and losses are recognised in profit or loss (Note 7.6 Net trading income).
3. Available-for-sale financial assets (AFS)
This is a residual category to which all financial assets are assigned that are not classified under another category.
In the case of the HYPO NOE Group these are shares and other variable-income securities, bonds, public debt cer-tificates and other fixed-income securities, holdings in non-consolidated subsidiaries (over 50%), holdings in as-sociates (20–50%) and other investments (less than 20%) (see Note 8.9 Available-for-sale financial assets).

142 | NOTES
Subsequent measurement is at fair value. Measurement gains and losses are recognised directly in equity in the revaluation reserve (AFS reserve), taking deferred tax into account (statement of changes in equity and “Other com-prehensive income” in the statement of comprehensive in-come). Market prices are applied to the determination of fair value. If fair value is not reliably measurable the carrying amount is applied. In the event of disposal of the asset, the difference from the carrying amount recognised in equity, under the AFS reserve (revaluation reserve), is reversed in the statement of comprehensive income. Gains and losses are reversed over the remaining life of the asset using the effective interest method. In the event of credit-related im-pairment an impairment loss is recognised (Note 7.9 Net gains or losses on available-for-sale financial assets). In the event of reversal of impairment losses, equity instruments are revalued via the AFS reserve, and debt instruments via the comprehensive income statement.
4. Financial assets designated as at fair value through profit or loss (FVPL)
When the fair value option (FVO) is taken, financial assets that are not held for trading are irrevocably assigned to this category, and are subsequently measured at value fair through profit or loss (Note 8.10 Financial assets designat-ed as at fair value through profit or loss).
However, this classification may only be made if:
a.) The financial instrument contains one or more signifi-cant embedded derivatives;
b.) It eliminates or significantly reduces a measurement or recognition inconsistency;
c.) A group of financial liabilities or financial assets and fi-nancial liabilities is managed and its performance evaluat-ed on a fair value basis, in accordance with a documented risk management or investment strategy.
Measurement is at fair value. Realised and unrealised gains and losses, and measurement gains and losses are recog-nised in profit or loss. The HYPO NOE Group classifies the items reported as “Net gains or losses on financial assets (debt instruments)” in this way (Note 7.10 Net gains or loss-es on financial assets designated as at fair value through profit or loss).
5. Financial assets held to maturity (HTM)
Financial assets with fixed or determinable payments and fixed maturities normally meet the criteria for assignment to this category. In the case of the Bank it consists entirely of bonds, public debt certificates and other fixed-income securities (Note 8.11 Financial assets held to maturity).
Designation of investments as held to maturity requires an intention and ability to hold these financial instruments un-til maturity.
Measurement is at amortised cost, and gains and losses are amortised over the remaining lives of the assets using the effective interest method. Any impairment losses are re-cognised in profit or loss. This was not necessary in 2012.
3.5 FiNANciAL LiABiLiTiES IAS 39 classifies financial liabilities into the following four categories:
1. Other liabilities
This category comprises the financial liabilities, including debt evidenced by certificates, for which the option of measurement at fair value through profit or loss was not taken (liabilities at cost [LAC]) (Note 8.20 Deposits from banks, Note 8.21 Deposits from customers and 8.22 Debts evidenced by certificates).
Measurement is normally at amortised cost. Gains and loss-es are amortised over the remaining lives of the liabilities using the effective interest method, and are taken to inter-est expense.
2. Liabilities held for trading (HFT)
Financial instruments purchased for the purpose of resell-ing them in the near term, or forming part of a portfolio that the entity intends to resell in the near term with the objective of generating a profit, must be classified as liabil-ities held for trading. This category also includes all deriva-tives other than those used as hedging instruments.
In the HYPO NOE Group most of the liabilities classified in this way represent the negative fair value attributable to derivatives used for interest rate or foreign exchange relat-ed transactions and other derivative transactions such as share price and index-linked transactions and credit deriva-tives (Note 8.23 Liabilities held for trading).

HYPO NOE GROUP ANNUAL REPORT 2012 | 143
Measurement is at fair value. Realised gains and losses, and measurement gains and losses are recognised in profit or loss (Note 7.6 Net trading income).
3. Financial liabilities designated as at fair value through profit or loss (FVPL)
When the fair value option (FVO) is taken, financial liabili-ties that are not held for trading are irrevocably assigned to this category, and subsequently measured at value fair through profit or loss. However, this classification may only be made if:
a.) The financial instrument contains one or more signifi-cant embedded derivatives;
b.) It eliminates or significantly reduces a measurement or recognition inconsistency;
c.) A group of financial liabilities or financial assets and fi-nancial liabilities is managed and its performance evaluat-ed on a fair value basis, in accordance with a documented risk management or investment strategy.
Measurement is at fair value. Realised gains and losses, and measurement gains and losses are recognised in profit or loss.
The HYPO NOE Group has no liabilities assigned to this cat-egory.
3.6 EmBEddEd dErivATivESFinancial instruments are referred to as “structured prod-ucts” where they consist of a host contract and multiple embedded derivatives, and the latter are an integral com-ponent of the contract and cannot be separately traded.
IAS 39 states that embedded derivatives must be separated from the host contracts and accounted for as independent derivatives if:
�The structured financial instrument is not measured at fair value through profit or loss; �The economic characteristics and risks of the embedded derivative are not clearly and closely related to those of the host contract; �The terms of the embedded derivatives meet the defini-tion of a derivative.
Measurement gains and losses are recognised in the state-ment of comprehensive income. Derivatives that must not
be separately accounted for are measured together with the underlyings in accordance with the normal treatment of the category concerned.
3.7 HEdGE AccOuNTiNGDerivatives are measured at fair value. Measurement gains and losses are recognised in profit or loss unless the deriva-tive in question meets the criteria for IFRS cash flow hedge accounting.
The IFRS hedge accounting rules govern the measurement of derivatives that are purchased to hedge an underlying transaction. The latter is classified into one of the above categories. A hedging relationship exists where the un-derlying and hedging transaction, and the hedged risk are designated. The hedging relationship is regarded as highly effective if the fair value or cash flow changes in the under-lying and the hedge largely offset each other (hedge ratio of 80–125%). The effectiveness of the hedge must be reli-ably measurable, and is monitored throughout the annual reporting period.
�Fair value hedge:A hedge of the exposure of assets and liabilities to chang-es in fair value. Gains and losses on measurement of the derivative and underlying are reported in the statement of comprehensive income, under “Net gains or losses on hedges” (Note 7.12 Net gains or losses on hedges). �Cash flow hedge: A hedge of the exposure to variability in cash flows that is attributable to an identifiable and determinable risk associated with a recognised asset or liability or a highly probable forecast transaction. The effective portion of the change in fair value is recognised in the statement of comprehensive income, under “Change in cash flow hedge”. The gain or loss attributable to the ineffective portion is immediately recognised in profit or loss and re-ported in the statement of comprehensive income, under “Net gains or losses on hedges” (Note 7.12 Net gains or losses on hedges).
The HYPO NOE Group mainly uses fair value hedges. These are employed to hedge the fair value of both assets and liabilities (underlyings). The risks hedged are interest rate and currency risks. In addition, cash flow hedges are used to hedge the risk of fluctuations in cash flows (interest pay-ments) from assets and liabilities (underlyings).

144 | NOTES
Measurement of customer swaps in the HYPO NOE Group
Customer swaps for which there are no market prices from observable current market transactions in the same in-struments are measured using an internal model, taking account of credit spreads, as well as liquidity and equity costs. The credit spreads are determined according to standard risk cost at matching maturities, on the basis of the instruments’ internal ratings, and taking due account of multi-year cumulative default probabilities and the supervi-sory loss given default, which are normally taken into con-sideration when pricing loans. The liquidity costs arise from the anticipated need to refinance cash collaterals associ-ated with such transactions where these are not furnished by the customer. These costs are computed on the basis of maturity-specific rates, according to the current liquidi-ty cost matrix for unsecured refinancing. The finance costs are computed on the basis of projected regulatory capital consumption.
Analyses of hedges by the underlying transactions hedged are shown in Note 8.8 Positive fair value of hedges (hedge accounting) and Note 8.24 Negative fair value of hedges (hedge accounting).
3.8 LEASE AccOuNTiNG
The HYPO NOE Group as a lessor
The main determinant of the classification of, and hence the method of accounting for leases is not the legal own-ership of the leased property but the substance of the lease. If substantially all the risks and rewards incidental to legal ownership are transferred by the lessor, then under IAS 17 the lease is a finance lease; otherwise it is an op-erating lease. Most of the lease agreements concluded by the HYPO NOE Group as a lessor are classifiable as finance leases. Consequently, instead of recognising the assets,
the present value of the future lease payments is reported under “Loans and advances to customers”, taking account of any residual values (Note 8.5 Finance lease disclosures). Agreed lease payments are apportioned between the fi-nance charge, recognised in profit or loss, and the reduc-tion in the outstanding liability.
The HYPO NOE Group as a lessee
All the lease agreements concluded by the HYPO NOE Group as a lessee are operating leases. This means that leased vehicles are not stated as assets in the consolidated statement of financial position. The lease instalments are recognised as general administrative expenses (Note 7.7 General administrative expenses).
3.9 iNvESTmENT PrOPErTYLand and buildings held to earn rentals or for capital ap-preciation are classified as investment property. In cases of mixed occupation, significant parts of land and buildings used by third parties are reported as investment property provided that the conditions for separate letting or sale are met (Note 8.14 Investment property).
Investment property is measured at cost. Depreciation is on a straight-line basis, over the normal useful lives of the assets. The following useful lives, which correspond to the actual useful lives of the properties concerned, are applied:
�Buildings and building alterations: 25–50 years
Rental income, depreciation, gains and losses on disposal, and any impairment are recognised in profit or loss (Note 7.1 Interest and similar income and Note 7.14 Net gains or losses on other financial investments).
Fair value is mainly determined on the basis of independent valuations; the valuers use the cost and income approach-es, and weight the results (Note 10.3.1 Fair value of financial instruments).

HYPO NOE GROUP ANNUAL REPORT 2012 | 145
3.10 riSk PrOviSiONSIndividual or collective impairment allowances are recog-nised for identifiable lending risks. Attention is drawn to the risk report included in the operational and financial review.
Individual impairment allowances are recognised on the basis of assessment of the borrower’s financial position, paying special attention to the Group Credit Risk Analysis Department’s current view of the value of the collaterals, and the repayment terms and maturities.
Future cash flows (anticipated repayments) are discounted using the original effective interest rate. If there are col-laterals for receivables (e.g. charges on real property or guarantees), the future cash flows from their recoverable amounts less the selling costs must be deducted when measuring the impairment loss (paragraph AG84 IAS 39). Since the present value of all future cash flows and their expected due dates must be taken into account when calcu-lating impairments in accordance with paragraph 63 IAS 39, all expected interest payments must also be included.
Collective impairment allowances are recognised for re-ductions in the value of the Group lending portfolio (losses incurred but not reported) as at the end of the reporting period. It is assumed that there are incurred but unreport-ed losses in respect of a given percentage of customers without default ratings at the end of the reporting period.
To calculate these risk provisions, all loan items affecting credit risk that are measured at amortised cost (loans and receivables, and liabilities held to maturity), and all out-standing lending facilities and contingent liabilities are al-located either to HYPO NOE Gruppe Bank or to HYPO NOE Landesbank, in accordance with paragraph 64 IAS 39. The treatment of these provisions differentiates between the two banks due to their varying risk profiles. Financial in-struments that are not classified as held to maturity and derivatives do not form part of the calculations, as they are measured at fair value. Intra-group lending is not included because of its elimination due to IFRS consolidation.
Housing construction loans backed by the Lower Austrian state government are likewise excluded.
The calculation is based on the expected loss taking into account: (a) the unsecured balance net of the market val-ue of any collateral; (b) the historical probability of default (PD), i.e. the results of backtesting the rating system; (c) the loss ratios for the individual portfolios (loss given de-fault (LGD)); and (d) the period of time between occurrence of the loss and its identification (loss identification period (LIP)). For reasons of prudence no cure factor is recognised.
The collective impairment allowance is calculated for loans and advances to banks and customers with internal ratings of 2A to 4E, using the HYPO NOE Group master scale de-scribed in the risk report (part of the operational and fi-nancial review). For 2012, the loss identification period was assumed to be four months for all loans (i.e. the LIP factor is 4/12).
The collective impairment allowance is calculated using the following formula:
collective impairment allowance = (exposure + 50% range – fair value of collaterals) * Pd *
“Blanco” LGd * LiP
Total risk provision in respect of loans and advances carried as assets is disclosed on the assets side of the consolidated statement of financial position, as a deduction after “Loans and advances to banks” and “Loans and advances to cus-tomers” (Note 8.6 Risk provisions and credit provisions). The risk provisions for off-balance sheet transactions are included in the “Provisions” item (Note 8.25 Provisions). Allocations to and reversals of impairment allowances and risk provisions arising from the lending business are re-ported in the statement of comprehensive income, under “Credit provisions” (see Note 7.4 Credit provisions for a de-tailed analysis).
Note 8.6 Risk provisions and credit provisions provides quantified and narrative disclosures on the individual and collective customer impairment allowances. Impairment of AFS assets is discussed under Note 3.4 Financial assets.
A summary of all impairment losses recognised in accord-ance with IFRS 7 is set out in Note 7.3 Impairment losses (summary table). Further information on credit risk and gross exposure is given in the risk report contained in the operational and financial review.

146 | NOTES
3.11 rEPurcHASE AGrEEmENTSRepurchase agreements are agreements under which the transferor transfers the legal title to assets to the trans-feree for a specified period, for consideration. At the same time it is agreed that the assets will be retransferred to the transferor at a later date, in return for an agreed sum. IAS 39 requires the transferor to continue to recognise the assets if it retains substantially all the risks and rewards of ownership. The transferor recognises a liability, and the transferee a receivable, equal to the amount received/paid. In 2012 the HYPO NOE Group entered into repurchase agreements as a transferor. The amounts concerned are detailed in Note 8.20 Deposits from banks.
3.12 currENcY TrANSLATiON In compliance with IAS 21, monetary assets and liabilities denominated in foreign currencies, non-monetary items measured at fair value, and unsettled cash transactions
are translated at the mid spot rate, and unsettled forward transactions at the mid forward rate ruling at the end of the reporting period.
Non-monetary assets and liabilities carried at amortised cost are stated at the buying rate.
The annual financial statements of foreign subsidiaries are translated in accordance with the functional currency prin-ciple.
In the case of all of the companies accounted for using the equity method this is the local currency. All of the state-ment of financial position items apart from the equity items were translated into the reporting currency at the rates rul-ing on 31 December 2012. Exchange differences are report-ed under other comprehensive income.
As all of the consolidated subsidiaries draw up their finan-cial statements in euro it was not necessary to translate any statements into the reporting currency.

HYPO NOE GROUP ANNUAL REPORT 2012 | 147
4. NOTES ON INDIVIDUAL ITEMS OF THE CONSOLIDATED FINANCIAL STATEMENTS
4.1 cASH ANd BALANcES AT cENTrAL BANkS“Cash and balances at central banks” refers to cash on hand and balances at central banks that are repayable on demand. The balances are stated at nominal value (Note 8.1 Cash and balances at central banks).
Interest income is reported under “Interest and similar in-come” (see Note 7.1. Interest and similar income for a de-tailed breakdown).
4.2 LOANS ANd AdvANcESThe “Loans and advances to banks” and “Loans and ad-vances to customers” items largely relate to loans, lease receivables, overnight money and time deposits, and unlist-ed securities. They include accrued interest but are gross of impairment losses (Note 8.3 Loans and advances to bank and Note 8.4 Loans and advances to customers). Measure-ment is at amortised cost and the net present value of lease receivables. Interest income is reported under “Interest and similar income” (see Note 7.1. Interest and similar income for a detailed breakdown).
4.3 ASSETS HELd FOr TrAdiNGAssets held for trading relate exclusively to the positive fair value of derivatives which are not held as hedges.
This item comprises the positive fair value of derivative fi-nancial instruments measured at fair value (Note 8.7 As-sets held for trading).
Realised gains and losses, and measurement gains and losses are reported under the “Net trading income” item in the statement of comprehensive income (see Note 7.6 Net trading income for a detailed analysis).
4.4 POSiTivE ANd NEGATivE FAir vALuE OF HEdGES (HEdGE AccOuNTiNG)The positive and negative fair value of hedges is reported separately, on the assets, and equity and liabilities sides of the consolidated statement of financial position, provided that they qualify for hedge accounting under IAS 39 (Note 8.8 Positive fair value of hedges (hedge accounting) and 8.24 Negative fair value of hedges (hedge accounting)). Measurement gains and losses on fair value hedges are
recognised in profit or loss, under “Net gains or losses on hedges” (see detailed presentation under Note 7.12 Net gains or losses on hedges). Current income from hedges is reported under “Interest and similar income” (see Note 7.1 Interest and similar income for a detailed analysis).
4.5 AvAiLABLE-FOr-SALE (AFS) FiNANciAL ASSETS This item mainly relates to bonds and other fixed-income securities.
It also includes AFS equities and other variable-income securities, holdings in non-consolidated subsidiaries and equity interests not held for sale (Note 8.9 Available-for-sale financial assets).
Measurement gains and losses are reported under equi-ty, net of deferred tax, as an available-for-sale reserve (statement of changes in equity and “Other comprehen-sive income” in the statement of comprehensive income). Gains and losses on disposal, and measurement gains and losses are recorded under “Net gains and losses on avail-able-for-sale assets” (see Note 7.9 Net gains or losses on available-for-sale financial assets for a detailed analysis).
4.6 FiNANciAL ASSETS dESiGNATEd AS AT FAir vALuE THrOuGH PrOFiT Or LOSS Derivatives for which the fair value option is taken (FVO derivatives) are also reported under this item when they are used to hedge such underlying transactions. The item is confined to financial assets that were designated as at fair value through profit or loss on initial recognition (Note 8.10 Financial assets designated as at fair value through profit or loss).
In the HYPO NOE Group this item includes debt instruments managed by the former HYPO Absolute Return fund, which management designated as at fair value through profit or loss on initial recognition.
4.7 FiNANciAL ASSETS HELd TO mATuriTYBonds held to maturity are reported under this item. These are measured at amortised cost (Note 8.11 Financial assets held to maturity).

148 | NOTES
Impairments are recognised in profit or loss, under the “Net gains or losses on financial assets held to maturity” item. In 2012 the earnings contribution from gains on disposal of HTM assets (Note 7.11 Net gains or losses on financial assets held to maturity) was immaterial.
4.8 iNvESTmENTS AccOuNTEd FOr uSiNG THE EquiTY mETHOdInvestments in associates and joint ventures are recog-nised at cost, and are included in the consolidated state-ment of financial position at the date on which a significant influence is obtained. In subsequent periods the carrying amount of the holdings is adjusted for changes in equity (see Note 8.13 Investments accounted for using the equity method and Note 3.2 Investments). The Bank’s share of the annual profit or loss is recorded under “Income from invest-ments accounted for using the equity method”, which is a sub-item of “Interest and similar income” (Note 7.1 Interest and similar income).
4.9 iNTANGiBLE ASSETS, ANd PrOPErTY, PLANT ANd EquiPmENTIntangible assets acquired for consideration with determi-nable useful lives are stated at cost less straight-line amor-tisation. As at the end of the reporting period there were no internally generated intangible assets with reliably meas-urable development costs that were expected to generate future economic benefits.
Land and buildings, and equipment, fixtures and furnish-ings used by the HYPO NOE Group in the course of its own business activities are reported as property, plant and equipment. Property, plant and equipment is measured at cost less depreciation.
Note 8.16 Intangible assets, and property, plant and equip-ment gives a breakdown of intangible assets, and property, plant and equipment.
Depreciation and amortisation are on a straight-line basis, over the normal useful lives of the assets. The following useful lives are applied:
�Land and buildings 25–50 years �Equipment, fixtures and furnishings 4–10 years �Computer software and hardware 3–4 years
Impairment losses are recognised whenever there are indi-cations of impairment. Depreciation and amortisation, and impairments are reported in the statement of comprehen-sive income (see Note 7.7 General administrative expenses and the detailed disclosures in Note 7.7.3 Depreciation, am-ortisation and impairment). Gains and losses on disposal of property, plant and equipment are recognised under “Net other operating income” (Note 7.8 Net other operating in-come).
4.10 TAx ASSETS ANd LiABiLiTiESSince 2008 use has been made of the option of group tax-ation. HYPO NOE Gruppe Bank AG acts as the tax group parent company. To this end the parent concluded group taxation agreements governing tax contributions, report-ing duties and due dates with each group member.
Current and deferred tax assets and liabilities are reported under the respective items in the consolidated statement of financial position (Note 8.17 Assets held for trading and 8.26 Tax liabilities).
Current tax assets and liabilities are measured at the amount expected to be paid to/recovered from the taxation authorities, on the basis of the current tax rates.
Deferred tax assets and liabilities are measured according to the balance sheet liability method, whereby the tax base of an asset is compared with the IFRS carrying amount, and deferred tax recognised for the temporary difference. If a tax liability is probable when the temporary difference re-verses, a deferred tax liability is recognised. Deferred tax assets are recognised for temporary differences that result in tax reductions when they reverse. Offsetting of deferred tax assets and liabilities is performed on a company by company basis. Pursuant to IAS 12, deferred tax assets and liabilities are not discounted.
Deferred tax assets are recognised for tax loss carryfor-wards if it is probable that sufficient taxable profit will be available. The carrying amounts of deferred tax assets aris-ing from tax loss carryforwards and temporary differences are reviewed at the end of each reporting period. The rec-ognition and reversal of deferred tax assets and liabilities is either in profit or loss, under “Income tax”, or in equity (Note 7.15 Income tax) if the item itself is recognised outside profit or loss (e.g. the revaluation reserve for AFS financial instruments).

HYPO NOE GROUP ANNUAL REPORT 2012 | 149
4.11 OTHEr ASSETSThe “Other assets” item (Note 8.18 Other assets) largely relates to accruals and deferrals, other non-bank receiva-bles (e.g. trade receivables and amounts due from the tax authorities in respect of other taxes), and derivatives used in connection with banking book management. Accruals and deferrals, and other non-bank receivables are stated at nominal value.
The positive fair value of derivative financial instruments is reported under “Other assets” if they do not qualify for hedge accounting and instead represent economic hedges used in connection with banking book management.
Gains and losses on the measurement and disposal of hedges are reported under “Net gains or losses on hedges” (Note 7.12 Net gains or losses on hedges) in the statement of comprehensive income.
4.12 dEPOSiTS FrOm BANkS ANd cuSTOmErS; dEBTS EvidENcEd BY cErTiFicATESDeposits from banks and customers, including debts evi-denced by certificates, are carried at amortised cost (Note 8.20 Deposits from banks, Note 8.21 Deposits from custom-ers and Note 8.22 Debts evidenced by certificates). Gains and losses on debts evidenced by certificates are amortised over the maturities of the liabilities.
Where hedge accounting is applied, the movements in the fair value of the underlying are recognised in profit or loss, under “Net gains or losses on hedges” (Note 7.12 Net gains or losses on hedges).
4.13 LiABiLiTiES HELd FOr TrAdiNGThe negative fair value of derivatives held for trading that are measured at fair value is disclosed under this item (Note 8.23 Liabilities held for trading).
Realised gains and losses, and measurement gains and losses are reported under the “Net trading income” item in the statement of comprehensive income (see Note 7.6 Net trading income for a detailed analysis).
4.14 PrOviSiONSThe following items are reported under “Provisions” (Note 8.25 Provisions):
�Long-term provisions for pensions and similar obliga-tions; and �Other provisions.
Long-term provisions for pensions and similar obligations
There are both defined contribution and defined benefit plans in the HYPO NOE Group. Under the defined contribu-tion schemes defined contributions are paid to an external fund. As the employer has no legal or other obligation to make additional payments, there is no need to recognise a provision.
There are also defined benefit pension, and termination and jubilee benefit commitments. These plans are “unfund-ed”, in that the benefits are entirely internally funded. The long-term employee benefit provisions are measured using the projected unit credit method, in accordance with IAS 19. Future obligations are measured on the basis of an ac-tuarial report by an independent actuary. Recognition in the consolidated statement of financial position is accord-ing to the present value of the defined benefit obligation. Actuarial gains and losses on the termination benefit and pension provision are recognised in equity, under the “IAS 19 reserve” item in the statement of changes in equity, and in the statement of comprehensive income, under “Other comprehensive income”. However, actuarial gains and loss-es on the jubilee benefit provision are shown under “Gen-eral administrative expenses” in the statement of compre-hensive income (Note 7.7 General administrative expenses).
Measurement of the long-term employee benefit provisions is based on the statutory retirement ages of 60 for women and 65 for men.
The discount rate applied to measurement at the end of the reporting period was 3.25% p.a. (2011: 5.1% p.a.). Fu-ture salary increases of 4.5% p.a. (2011: 4.0% p.a.) and fu-ture pension increases of 2.5% p.a. (2011: 4.0% p.a.) are assumed. Downward adjustments of the provisions are not made for employee turnover.
Measurement is based on the biometric estimates con-tained in the latest Austrian actuarial table for pension insurance, the AVÖ 2008 – P – Rechnungsgrundlagen für

150 | NOTES
die Pensionsversicherung – Pagler & Pagler, Angestellten-bestand table.
Other provisions
“Other provisions” are recognised when there is a present obligation as a result of a past event, it is probable that it will be necessary to settle the obligation, and a reliable es-timate can be made of the amount of the obligation. Long-term provisions are discounted if the effect is material. The measurement of contingent liabilities and impending losses is based on best estimates in accordance with paragraphs 36 ff. IAS 37.
Contingent liabilities are recognised in respect of off bal-ance sheet liabilities such as those arising from sureties, guarantees and pledging of collaterals.
Restructuring provisions were not recognised.
Allocations to and reversals of “Other provisions” are mainly shown under “Net other operating income” (Note 7.8 Net other operating income). Movements in provisions for credit risks are reported in the statement of compre-hensive income under “Credit provisions” (Note 7.4 Credit provisions).
4.15 OTHEr LiABiLiTiES “Other liabilities” (Note 8.27 Other liabilities) are stated at amortised cost where they relate to accruals and deferrals or “Sundry other liabilities”. The negative fair value of fi-nancial instruments is reported under “Other liabilities” if they do not qualify for hedge accounting and instead rep-resent economic hedges used in connection with banking book management. Gains and losses on measurement are reported under “Net gains or losses on hedges” (Note 7.12 Net gains or losses on hedges) in the statement of compre-hensive income.
Long-term incentive plan (reported under the “Other liabilities” item from 2012 onwards)
Since 2012 the HYPO NOE Group has enabled members of top management (key management) to benefit from the long-term profitability of the Company and the growth of shareholder value. The long-term incentive plan (LTIP) is an important means of aligning the interests of key employees with those of the Company, and gives them a strong incen-tive to work for its long-term success.
The LTIP takes the form of a phantom share plan which rep-licates the value of the Company’s shares. Valuation is ac-cording to the adapted Viennese method, and value growth is capped at 11% p.a. The eligible plan members are entitled to convert the phantom shares allocated to them into cash after a five-year minimum holding period has expired. The scheme is reported under “Staff costs” in the statement of comprehensive income (see Note 7.7.1 Staff costs).
4.16 SuBOrdiNATEd cAPiTALSubordinated liabilities as defined by Austrian banking leg-islation are reported as subordinated capital (Note 8.28 Subordinated capital).
Subordinated liabilities are certificated or uncertificated liabilities which, in the event of liquidation or insolvency, are subordinated to the claims of other creditors. Interest expense is reported under “Interest and similar expense” (see Note 7.2. Interest and similar expense for a detailed breakdown).
4.17 EquiTY (iNcLudiNG NON-cONTrOLLiNG iNTErESTS)“Share capital” is the capital paid in by the shareholders in accordance with the articles of association.
The “Capital reserves” contain the share premiums paid in excess of nominal value when shares are issued.
As was the case a year earlier, at 31 December 2012 there were 7,150,000 registered shares of no par value in issue. Of these, 70.49% or 5,040,000 shares were held by NÖ Landes-Beteiligungsholding GmbH and 29.51% or 2,110,000 shares by NÖ BET GmbH. At year-end 2012 the share capi-tal (issued capital) of HYPO NOE Gruppe Bank AG was also unchanged, at EUR 51,980,500.
The Annual General Meeting held on 24 April 2009 auth-orised the Management Board to increase the Company’s share capital by EUR 6,906,500, from a nominal amount of EUR 47,618,500 to EUR 54,525,000, subject to the ap-proval of the Supervisory Board, no later than 31 December 2012, by issuing an additional 950,000 registered shares of no par value. The authorised capital of EUR 54,525,000 is divided into 7,500,000 registered shares of no par value. Each no par share represents an equal portion of the share capital. A capital increase, by 600,000 registered no par

HYPO NOE GROUP ANNUAL REPORT 2012 | 151
shares, was registered on 10 February 2010. No further cap-ital increase was effected up to 31 December 2012.
The retained earnings reserves required by statute and the articles of association, and the other retained earnings, as well as the liability reserve pursuant to section 23(6) Banking Act, the general banking risk fund, the differences between carrying amounts and present value (leasing com-panies) and the untaxed reserves (net of deferred tax) are reported under “Retained earnings”. The differences aris-ing on first-time adoption of IFRS, which were offset against equity, are also reported under “Retained earnings”.
The IAS 19 reserve comprises the actuarial gains and loss-es on the long-term employee benefit provisions (pensions and termination benefits), net of deferred tax.
The available-for-sale reserve contains the measurement gains and losses (net of deferred tax) on financial assets classified as available for sale.
The financial instruments attributable to the cash flow hedge category (net of deferred tax) are reported under the cash flow hedge reserve.
Consolidated profit/loss The accumulated profit or loss brought forward, and the annual profit or loss and divi-dends are shown under this item.
The non-controlling interests are minority interests in sub-sidiaries, and are reported as a separate equity item, in accordance with IAS 1.
For the disclosures relating to equity see Note 8.29 Equity. The movements in individual equity items are shown in the statement of changes in equity.

152 | NOTES
5. SEGMENT INFORMATION
The bank’s segment reporting is in accordance with IFRS 8. The segment information is derived from the quarterly reports drawn up by the Management Board, which is the “chief operating decision maker” as defined by paragraph 7 IFRS 8.
The information provided on individual segments is drawn from the IFRS financial statements of the companies attrib-uted to those segments. The same accounting policies as those described in Note 2 Accounting policies are applied to the preparation of these statements.
In 2012 the number of segments was increased from four to five, and the comparative figures for the previous year were adjusted to this presentation.
The five segments, which are based on the structure of the Group’s business activities, are as follows:
GruPPE BANkThis segment aggregates the income and expense items related to relationships with large customers – chiefly state and local government clients (public finance, real estate and treasury business).
LANdESBANkThese sub-group statements are for two subsidiaries, and contain the retail and business customer operations, with the emphasis on housing finance as well as the funding for large non-profit housing developers building projects provided by HYPO NOE Landesbank AG. The earnings con-tributions of HYPO NOE Versicherungsservice GmbH from its insurance brokerage business are now included in this segment.
LEASiNGThis segment groups together the subsidiaries that oper-ate in the leasing business (see Note 3.8 Lease accounting). These are IFRS subgroup financial statements for 37 (2011: 37) consolidated subsidiaries.
OTHErThis segment is used to provide information on a sub-group with 18 subsidiaries which are neither leasing companies nor banks.
The following companies were also included in the Other segment in 2012 due to their formation or acquisition dur-ing the year:
�Benkerwiese Mietergemeinschaft GmbH �HYPO NOE First Facility GmbH �Strategic Equity Beteiligungs-GmbH
The acquisition of HYPO NOE First Facility GmbH led to the decision in 2012 to present this segment separately.
cONSOLidATiONThis segment is used to provide information on consolida-tion adjustments.
See Note 9 Segment information for additional detailed information on segment profit or loss, and assets and lia-bilities, as well as descriptive information. Note 3.2 Invest-ments contains a table listing the consolidated subsidiaries and showing the segments they are assigned to.

HYPO NOE GROUP ANNUAL REPORT 2012 | 153
6. CONSOLIDATED STATEMENT OF CASH FLOWS
The consolidated statement of cash flows in accordance with IAS 7 shows the change in cash and cash equivalents held by the HYPO NOE Group due to the cash flows from operating, investing and financing activities. The cash flows from operating activities are presented according to the in-direct method.
The cash flows from operating activities in the main relate to cash inflows and outflows arising from loans and advanc-
es to banks and customers, and from available-for-sale fi-nancial assets, as well as deposits from banks and custom-ers, and debts evidenced by certificates.
The cash flows from investing activities largely concern cash inflows and outflows arising from property, plant and equipment, and financial assets held to maturity.
Cash and cash equivalents consist of cash on hand and bal-ances at central banks repayable on demand.

154 | NOTES
7. NOTES TO ThE STaTEmENT Of cOmprEhENSivE iNcOmE
7.1 Interest and sImIlar Incomeinterest income of EUr 6,623 thsd (2011: EUr 5,550thsd) from individually impaired loans was recognised for the reporting period.
The “investments in associates” item largely concerns the dividend paid by the afS investment divested in 2011.
7.1.a interest and similar income
eUr ’000 2012 2011
Interest income from:
cash and balances at central banks 98 284
Loans and advances to banks 7,211 8,470
Loans and advances to customers 253,102 230,961
Bonds, public debt certificates and other fixed-income securities 61,662 72,557
hedges (hedge accounting) 135,822 85,586
Other interest income 73,147 28,956
thereof: income from investments accounted for using the equity method 3,686 5,222
thereof: income from investment property: 1,732 215
rental income 3,177 971
depreciation -1,445 -756
current income from:
Leases 20,336 16,762
Shares and other variable-income securities 3 1
investments in associates 934 1,911
total 552,314 445,488

hYpO NOE GrOUp aNNUaL rEpOrT 2012 | 155
7.1.b interest and similar income by iaS 39 measurement categories
7.2 Interest and sImIlar expense
7.2.a interest and similar expense
eUr ’000 2012 2011
Interest and similar income from:
Loans and receivables (Lar) 264,858 245,496
available-for-sale (afS) assets 62,195 73,362
assets held to maturity (hTm) 172 843
assets measured using the fair value option (fvO) 233 265
assets held for trading (hfT) 60,850 14,725
impaired loans and advances (unwinding) 36 243
hedges (hedge accounting) 135,822 85,586
interest income attributable to other periods 189 259
income from investments accounted for using the equity method 3,686 5,222
income from investment property: 1,732 215
rental income 3,177 971
depreciation -1,445 -756
current lease income 20,336 16,762
current origination and commitment fees (iaS 18) 2,205 2,510
total 552,314 445,488
eUr ’000 2012 2011
Interest expense on:
Liabilities to central banks -4,097 -5,735
Deposits from banks -19,019 -24,510
Deposits from customers -47,734 -44,944
Debts evidenced by certificates -198,199 -171,751
Subordinated capital -3,850 -4,762
hedges (hedge accounting) -83,277 -40,348
Other interest expense -60,768 -14,643
total -416,944 -306,693

156 | NOTES
7.2.b interest and similar expense by iaS 39 measurement categories
2012 eUr ’000
(-) (+)
total recognised in reporting
period
Impairment losses on financial assets not measured at fair value through profit or loss: -36,904 14,495 -22,409
available-for-sale (afS) financial assets (7.9) -1,247 637 -610
Loans and receivables (Lar) (inc. finance leases) measured at amortised cost (7.4) -35,657 13,858 -21,799
Impairments according to Ias 36: -345 – -345
property, plant and equipment (7.7.3) -208 – -208
investment property -137 – -137
investments accounted for using the equity method (7.1) – – –
total -37,249 14,495 -22,754
2011 eUr ’000
(-) (+)
total recognised in reporting
period
Impairment losses on financial assets not measured at fair value through profit or loss: -58,322 12,299 -46,023
available-for-sale (afS) financial assets (7.9) -30,589 105 -30,484
Loans and receivables (Lar) (inc. finance leases) measured at amortised cost (7.4) -27,733 12,194 -15,539
Impairments according to Ias 36: -2,476 – -2,476
property, plant and equipment (7.7.3) -2,451 – -2,451
investments accounted for using the equity method -25 – -25
total -60,798 12,299 -48,499
7.3 ImpaIrment losses (sUmmary table)
eUr ’000 2012 2011
Interest expense on:
financial liabilities measured at amortised cost (Lac) -273,269 -252,042
financial liabilities held for trading (hfT) -60,398 -14,303
hedges (hedge accounting) -83,277 -40,348
total -416,944 -306,693

hYpO NOE GrOUp aNNUaL rEpOrT 2012 | 157
7.4 credIt provIsIonsThe risk provisions for on and off-balance sheet transactions are made up as follows:
eUr ’000 2012 2011
allocations to: -32,563 -26,502
individual impairment allowances (7.3) -30,288 -20,403
collective impairment allowances (7.3) -2,129 -1,350
Other credit provisions -146 -4,749
reversals of: 13,824 11,700
individual impairment allowances (7.3) 10,853 9,342
collective impairment allowances (7.3) 2,183 2,195
Other credit provisions 788 163
receipts from impaired assets (7.3) 822 657
direct write-offs (7.3) -1,404 -5,980
Impairments of loans and receivables (7.3) -1,836 –
total -21,157 -20,125

158 | NOTES
7.5 net fee and commIssIon Income
7.6 net tradIng Income
eUr ’000 2012 2011
fee and commission income from: 15,104 15,551
Loans and advances 1,765 2,453
Securities and custody account business 3,156 3,016
payment transactions 5,740 5,995
foreign exchange, foreign notes and coins, and precious metals 321 252
Other services 3,603 3,274
Diversification 473 557
Other fee and commission income 46 4
fee and commission expense from: -3,119 -3,112
Loans and advances -78 -112
Securities and custody account business -1,319 -1,382
payment transactions -1,322 -1,216
Other services -15 -22
Diversification -385 -380
total 11,985 12,439
eUr ’000 2012 2011
interest rate transactions -1,006 -2,237
foreign exchange transactions 170 268
Other transactions 32 1,069
total -804 -900

hYpO NOE GrOUp aNNUaL rEpOrT 2012 | 159
7.7 general admInIstratIve expensesGeneral administrative expenses comprise staff costs, other administrative expenses, and depreciation, amortisation and impairment. These items were as follows:
7.7.1 Staff costs
Due to the large number of sub-items there are rounding differences (see Note 3 accounting and measurement policies).
eUr ’000 2012 2011
Staff costs -61,892 -52,406
Other administrative expenses -39,832 -35,920
Depreciation, amortisation and impairment -5,238 -5,915
total -106,965 -94,240
eUr ’000 2012 2011
Wages and salaries -47,196 -39,555
thereof phantom share based cash incentives* -350 –
Social security costs -9,475 -8,317
cost of voluntary employee benefits -1,436 -1,287
retirement benefit costs -2,303 -2,003
Termination benefit costs -1,482 -1,244
thereof expenses for provident fund -474 -382
total -61,892 -52,406
* for information on phantom share based cash incentives see 4.15 Other liabilities
The acquisition of hYpO NOE first facility Gmbh was responsible for EUr 4,462thsd of the increase in staff costs.
2012 2011
average number of employees (inc. staff on parental leave) 894 658
The acquisition of hYpO NOE first facility Gmbh played a large part in the increase in the average number of employees (average of 189 employees).

160 | NOTES
The “Supervisory Board members' expenses” item forms part of “Other administrative expenses”, but is shown in the sup-plementary information on staff costs in the interests of clarity.
in 1997 hYpO NOE Gruppe Bank aG and hYpO NOE Landesbank aG negotiated a works agreement on the provision of re-tirement, invalidity and surviving dependants’ pensions by a pension fund. hYpO NOE Leasing Gmbh also concluded such an agreement in 2009.
in order to implement these agreements, pension fund contracts were made with viktoria volksbanken pensionskassen aG.
Under these the employer is obliged to contribute 2.7% (including administrative costs and insurance tax) of employees’ eligible salaries to the fund. The percentages applicable to senior management personnel are 4%, 6% and 10%. The em-ployer’s contributions vest five years after payments begin. Eligibility for employer’s contributions is conditional on five years’ service; eligible pre-service time is counted.
Key management in the hYpO NOE Group comprises “identified staff” and “identified staff with less material impact”.
eUr ’000 2012 2011
salaries of management board members -798 -844
supervisory board members' expenses (non-employees) -85 -83
supervisory board members’ salaries (Works council delegates) -318 -393
remuneration of key management personnel (other than the members of the management board and supervisory board of the parent): -9,783 -9,104
current remuneration -8,194 -7,282
other short-term employee benefits -1,031 -1,241
post-employment benefits -396 -477
other long-term benefits -62 -4
provision for termination benefits -100 -98
eUr ’000 2012 2011
termination benefit expenses inc. provident fund for: -1,482 -1,244
management Board -34 -41
Key management personnel -191 -239
Other employees -1,257 -964
pension expenses for: -2,303 -2,003
management Board -58 -46
Key management personnel -359 -370
Other employees (including former employees) -1,886 -1,587

hYpO NOE GrOUp aNNUaL rEpOrT 2012 | 161
7.7.2 Other administrative expenses
eUr ’000 2012 2011
premises -6,144 -5,901
Office and communication expenses -1,651 -1,626
iT expenses -7,084 -6,096
Legal and consultancy costs -5,337 -4,087
advertising and entertainment costs -5,880 -5,813
cost of transfers of liability -1,536 -1,714
Other administrative expenses -12,200 -10,683
total -39,832 -35,920
eUr ’000 2012 2011
the “legal and consultancy costs” include the following fees of the auditors of the consolidated financial statements:
annual audit -588 -593
Other auditing services -174 -425
Tax advice -103 -9
Other services -338 -220
eUr ’000 2012 2011
sundry other administrative expenses:
financial stability contribution -6,309 -5,047
cost of compliance with company law -987 -906
Training costs -964 -799
vehicle and fleet expenses -1,046 -874
insurance -285 -266
Travel expenses -483 -323
cost of information procurement and payment transactions -481 -505
Sundry other administrative expenses -1,645 -1,963
total -12,200 -10,683
rental and lease commitments amount to EUr 1,712thsd in 2013 (2012: EUr 1,968thsd) and EUr 7,720thsd during the 2013–2017 financial years.

162 | NOTES
7.8 net other operatIng Income
The change in gains and losses on the disposal of assets reflects the sale of a property in St. pölten used by the Bank.
The effect of the hYpO NOE first facility Gmbh acquisition from 2 July to 31 December 2012 comprises EUr 10,931thsd in “Sundry other operating income” and EUr 5,681thsd in “Sundry other operating expenses” (see Note 3.1 Basis of consoli-dation for the full contribution to results).
“Sundry other operating expenses/income” includes a net loss of EUr 278thsd (2011: EUr +10,652thsd) on currency trans-lation (see Note 7.13 Net gains and losses on financial assets and liabilities).
This item also includes EUr 6,585thsd (2011: EUr 7,537thsd) in administrative and brokerage fees.
eUr ’000 2012 2011
other rental income 295 340
gains/losses on 1,272 90
disposal of intangible assets, and property, plant and equipment 1,272 90
gains/losses on recognition and reversal of provisions 538 371
sundry other operating expenses/income 15,094 19,275
Sundry other operating income 22,102 20,801
Sundry other operating expenses -7,008 -1,525
total 17,199 20,076
eUr ’000 2012 2011
depreciation and amortisation: (8.16) -5,030 -3,464
intangible assets -644 -618
Buildings used by Group companies -961 -301
Equipment, fixtures and furnishings (including low value assets) -3,425 -2,545
Impairment (8.16) -208 -2,451
Land -208 -2,451
total -5,238 -5,915
7.7.3 Depreciation, amortisation and impairment

hYpO NOE GrOUp aNNUaL rEpOrT 2012 | 163
7.9 net gaIns or losses on avaIlable-for-sale fInancIal assets
The year-on-year increase in “Losses on disposal” is largely attributable to the disposal of cypriot, Greek and hungarian government bonds and Spanish bank bonds.
The high level of “Gains on disposal” in 2011 is largely a reflection of the sale of the 1.17% shareholding in raiffeisen Zen-tralbank aG (rZB). The comparative figure for the “impairment losses” item resulted from impairment losses on Greek and portuguese sovereign bonds.
7.11 net gaIns or losses on fInancIal assets held to matUrIty
7.10 net gaIns or losses on fInancIal assets desIgnated as at faIr valUe throUgh profIt or loss
eUr ’000 2012 2011
net gains or losses on financial assets 97 158
Equity -5 –
Debt instruments 102 158
total 97 158
eUr ’000 2012 2011
Income from financial assets – 44
Gains on disposal/redemption – 44
total – 44
eUr ’000 2012 2011
Income from financial assets 1,635 93,749
Gains on disposal (7.13) 998 93,644
Write-ups (7.3) 637 105
expenses arising from financial assets -8,852 -31,713
Losses on disposal (7.13) -7,605 -1,124
impairment losses (7.3) -1,247 -30,589
total -7,217 62,036

164 | NOTES
7.13 net gaIns or losses on fInancIal assets and lIabIlItIes
eUr ’000 2012 2011
realised gains and losses on financial assets and liabilities not measured at fair value through profit or loss, net -6,616 92,627
available-for-sale financial assets (7.9) -6,607 92,520
Loans and receivables (inc. finance leases) (7.14) -9 18
financial assets held to maturity (7.11) – 44
Other – 45
gains (losses) on financial assets and liabilities held for trading, net (7.6) -804 -900
interest rate instruments and related derivatives -1,006 -2,237
foreign exchange trading 170 268
Other (including hybrid derivatives) 32 1,069
gains (losses) on financial assets and liabilities designated as at fair value through profit or loss (7.10) 97 158
gains (losses) on hedge accounting, net (7.12) 1,973 382
gains on currency translation, net (7.8) -278 10,652
total -5,628 102,919
7.12 net gaIns or losses on hedgesGains or losses on the hedged items attributable to the hedged risk and to remeasurement of hedging instruments to fair value (hedge accounting) are recognised under this item. in addition, the result of the premature termination of a cash flow hedge was reported under this item for the first time in 2012. Derivative financial instruments used for economic hedges in connection with banking book management are shown under “Other derivative financial instruments”.
eUr ’000 2012 2011
hedge accounting 1,869 1,190
Gains or losses on hedged items 34,486 12,054
Gains or losses on hedging instruments -34,497 -10,864
Gains or losses on cash flow hedges 1,880 –
other derivative financial instruments (economic hedges) 104 -807
foreign exchange transactions 104 -807
total 1,973 382

hYpO NOE GrOUp aNNUaL rEpOrT 2012 | 165
7.14 net gaIns or losses on other fInancIal Investments
eUr ’000 2012 2011
net gains or losses on receivables and promissory notes -9 18
Investment property -399 -212
proceeds of disposals 1 1,857
carrying amounts of disposals – -1,812
Let investment property -391 -252
vacant investment property -9 -5
net gains or losses on other financial investments 152 148
Other income from other financial assets 152 148
total -256 -46
7.15 Income tax expenseThis item includes all taxes payable on profits for the reporting period.
a reconciliation of the expense that would result from applying the standard rate of corporation tax to the actual reported tax expense is shown below.
eUr ’000 2012 2011
current income tax -6,927 -10,575
Deferred income tax -491 -18,530
total -7,418 -29,105
eUr ’000 2012 2011
profit before tax 30,226 118,619
x income tax rate 25% 25%
= anticipated income tax expense -7,556 -29,655
tax deductions 1,281 1,684
Tax-free income from investments 719 1,374
Other tax-free income 125 -169
investments accounted for using the equity method 437 479
additions to tax liability -235 -1,486
Non-deductible expenses -235 -1,486
tax effects of other differences -908 351
adjustments to and non-recognition of deferred tax -920 87
previous years 57 326
prepayments -8 -6
Other adjustments -36 -56
total -7,418 -29,105

166 | NOTES
7.16 non-controllIng Interests
eUr ’000 2012 2011
vOLUNTaS Grundstückvermietungs Gesellschaft m.b.h. -64 -52
hOSpES-Grundstückverwaltungs Gesellschaft m.b.h. 27 6
total -37 -46
a total of EUr 18,499thsd in deferred tax (2011: deferred tax credits of EUr 15,220thsd) was written directly to equity.
Notes 8.17 Tax assets and 8.26 Tax liabilities provide a detailed analysis of the deferred tax assets and liabilities.
deferred tax recognised directly in equity, eUr ’000 2012 2011
actuarial gains/losses in accordance with iaS 19 686 604
available-for-sale (afS) financial instruments -19,425 13,980
cash flow hedge (effective portion) 239 -557
currency translation reserve 1 –
Untaxed retained earnings – 1,194
total -18,499 15,220

hYpO NOE GrOUp aNNUaL rEpOrT 2012 | 167
8. NOTES TO ThE STaTEmENT Of fiNaNciaL pOSiTiON
8.1 cash and balances at central banks“cash and balances at central banks” comprises cash on hand and balances at central banks that are repayable on demand. The balances are stated at nominal value.
8.2 loans and advancesThe “Loans and advances to banks” (Note 8.3 Loans and advances to banks) and “Loans and advances to customers” (Note 8.4 Loans and advances to customers) items largely relate to loans extended, lease receivables, overnight money and time deposits, and unlisted securities.
8.3 loans and advances to banks
8.4 loans and advances to cUstomers
8.4.1 customer group analysis
eUr ’000 31 dec. 2012 31 dec. 2011
cash on hand 13,569 12,853
Balances at central banks 58,075 65,886
total 71,644 78,739
eUr ’000 31 dec. 2012 31 dec. 2011
Domestic banks 219,558 111,209
foreign banks
central and Eastern Europe (cEE) 56,622 57,384
rest of the world (rOW) 618,137 415,404
total 894,317 583,997
eUr ’000 31 dec. 2012 31 dec. 2011
public sector customers 5,337,065 5,083,150
Business customers 1,761,748 1,647,368
housing developers 1,506,006 1,236,914
retail customers 2,039,003 1,624,799
professionals 91,255 110,247
total 10,735,077 9,702,478

168 | NOTES
8.4.2 Geographical analysis
8.5 fInance lease dIsclosUres
eUr ’000 31 dec. 2012 31 dec. 2011
Domestic customers 9,134,166 8,187,506
foreign customers
central and Eastern Europe (cEE) 659,805 598,937
rest of the world (rOW) 941,106 916,035
total 10,735,077 9,702,478
Net investment in finance leases is stated under “Loans and advances to customers”. See Note 3.8 above for a description of the accounting policies applied to this item.
The Lower austrian state government, and Lower austrian local authorities and off-budget agencies account for approx. 99% of the finance leases written.
The rest of the lessees concerned are business customers, other public agencies and associations.
about 95% of the lease assets in question are property, but a small amount of equipment is also involved – often directly related to the real estate financed by the leases.
most of the leased properties are hospitals, care homes, office buildings and schools, while the equipment largely relates to furnishings treated as separate assets, and to medical equipment.
No impairments were recognised for outstanding minimum lease payments.
eUr ’000 31 dec. 2012 31 dec. 2011
gross investment 1,397,225 1,446,381
minimum lease payments 1,302,989 1,353,451
up to 1 year 80,010 81,816
from 1–5 years 302,259 300,987
Over 5 years 920,720 970,648
Unguaranteed residual value 94,236 92,930
Unearned finance income -180,119 -254,424
up to 1 year -12,620 -20,000
from 1–5 years -56,662 -80,760
Over 5 years -110,837 -153,664
net investment 1,217,106 1,191,957

hYpO NOE GrOUp aNNUaL rEpOrT 2012 | 169
eUr ’000 31 dec. 2012 31 dec. 2011
minimum lease payments 1,302,989 1,353,451
Unearned finance income -180,119 -254,424
net present value of minimum lease payments 1,122,870 1,099,027
Unguaranteed residual value 94,236 92,930
net investment 1,217,106 1,191,957
8.6 rIsk provIsIons and credIt provIsIonsThe loans and advances to customers include EUr 73,387thsd in interest-free loans and advances of which EUr 45,991thsd were impaired (2011: EUr 118,115thsd; EUr 67,978thsd in impairments).
8.6.1 analysis of risk provisions and credit provisions by customer groups
"Unwinding" refers to interest income from impaired loans and advances.
The “Other changes” column reflects customer reclassifications, e.g. from retail to business where customers enter self-employment, or vice versa (e.g. when self-employment ceases due to retirement).
eUr ’000as at 1
Jan. 2012
change in
scope of cons.
ex-change
diffe-rences
allo-cations
Utilis-ation
rever-sals
Unwind-ing
other changes
as at 31 dec.
2012
risk provisions for customers: individual impairment allowances -99,008 – -10 -30,288 10,495 10,853 36 – -107,922
public sector customers -5,101 – – -3,336 – 1,070 10 – -7,357
Business customers -55,608 – -10 -19,372 5,672 4,542 18 -96 -64,854
housing developers -14 – – -7 – 4 – 4 -14
retail customers -34,079 – – -6,723 3,918 4,202 8 245 -32,429
professionals -4,206 – – -850 905 1,035 – -153 -3,269
risk provisions for customers: collective impairment allowances -4,998 -33 – -2,129 – 2,183 – – -4,977
subtotal: risk provisions for customers
-104,006 -33 -10 -32,417 10,495 13,036 36 – -112,899
credit provisions -10,165 – -11 -146 3,000 788 – – -6,535
total -114,171 -33 -21 -32,563 13,495 13,824 36 – -119,433

170 | NOTES
8.6.2 Geographical analysis of risk provisions
eUr ’000 31 dec. 2012 31 dec. 2011
Domestic -97,155 -99,483
foreign
central and Eastern Europe (cEE) -9,950 -1,005
rest of the world (rOW) -5,794 -3,518
total risk provisions -112,899 -104,006
eUr ’000as at 1
Jan. 2011
change in
scope of cons.
ex-change
diffe-rences
allo-cations
Utilis-ation
rever-sals
Unwind-ing
other changes
as at 31 dec. 2011
risk provisions for customers: individual impairment allowances -97,320 – -2 -20,403 9,132 9,342 243 – -99,008
public sector customers -5,635 – – – 102 338 94 – -5,101
Business customers -53,750 – -2 -13,701 7,019 4,660 144 22 -55,608
housing developers -156 – – -4 – 16 – 129 -14
retail customers -33,380 – – -5,683 1,734 3,739 5 -494 -34,079
professionals -4,399 – – -1,016 277 588 – 343 -4,206
risk provisions for customers: collective impairment allowances -5,844 – – -1,350 – 2,195 – – -4,998
subtotal: risk provisions for customers -103,164 – -2 -21,753 9,132 11,537 243 – -104,006
credit provisions -5,795 – 9 -4,749 206 163 – – -10,165
total -108,959 – 7 -26,502 9,338 11,700 243 – -114,171
8.6.3 analysis of risk provisions according to regulatory reporting segmentation
eUr ’000
as at 1 Jan. 2012
change in
scope of cons.
ex-change differ-ences
allo-cations
Utilis-ation
rever-sals
Unwind-ing
other changes
as at 31 dec.
2012
risk provisions for customers: individual impairment allowances -99,008 – -10 -30,288 10,495 10,853 36 – -107,922
Non credit institutions -4,909 – – -53 – 912 – – -4,051
corporates -50,298 – -10 -22,710 5,368 4,005 28 104 -63,512
retail -43,801 – – -7,525 5,127 5,936 8 -104 -40,359
risk provisions for customers and credit institutions: collective impairment allowances -4,998 -33 – -2,129 – 2,183 – – -4,977
total risk provisions -104,006 -33 -10 -32,417 10,495 13,036 36 – -112,899

hYpO NOE GrOUp aNNUaL rEpOrT 2012 | 171
8.6.4 analysis of risk provisions for customers by maturities of underlying transactions (regulatory reporting segmentation)
31 dec. 2012 EUr ’000 not past dueless than 90 days overdue
more than 90 days overdue total
risk provisions for customers: individual impairment allowances -27,453 -4,340 -76,130 -107,922
Non credit institutions -3,997 – -54 -4,051
corporates -16,804 -3,836 -43,005 -63,645
retail -6,652 -504 -33,071 -40,226
risk provisions for customers and credit insti-tutions: collective impairment allowances -4,827 -88 -61 -4,977
total risk provisions -32,280 -4,428 -76,191 -112,899
31 dec. 2011 EUr ’000 not past dueless than 90 days overdue
more than 90 days overdue total
risk provisions for customers: individual impairment allowances -31,921 -3,714 -63,374 -99,008
Non credit institutions -4,909 – – -4,909
corporates -15,582 -2,315 -32,402 -50,298
retail -11,430 -1,399 -30,972 -43,801
risk provisions for customers and credit insti-tutions: collective impairment allowances -4,814 -117 -67 -4,998
total risk provisions -36,735 -3,830 -63,441 -104,006
eUr ’000as at 1
Jan. 2011
change in
scope of cons.
ex-change differ-ences
allo-cations
Utilis-ation
rever-sals
Unwind-ing
other changes
as at 31 dec. 2011
risk provisions for customers: individual impairment allowances -97,320 – -2 -20,403 9,132 9,342 243 – -99,008
Non credit institutions -5,272 – – – 102 338 85 -162 -4,909
corporates -53,065 – -2 -13,359 7,000 4,384 153 4,592 -50,298
retail -38,983 – – -7,044 2,030 4,620 5 -4,429 -43,801
risk provisions for customers and credit institutions: collective impairment allowances -5,844 – – -1,350 – 2,195 – – -4,998
total risk provisions -103,164 – -2 -21,753 9,132 11,537 243 – -104,006

172 | NOTES
8.6.5 Disclosures of maturities and collaterals in accordance with ifrS 7
The table below shows the fair value of the collateral received as calculated for regulatory purposes.
further information on credit risk is given in the risk report contained in the operational and financial review.
31 dec. 2012 EUr ’000
gross carrying amount (not indi-vidually impaired)
gross carrying amount (individ-
ually impaired)
collective impairment allowances
Individual impairment allowances
net carrying amount
Not past due 11,392,442 76,596 -4,827 -27,453 11,436,758
Less than 90 days overdue 43,858 6,025 -88 -4,341 45,454
90 days or more overdue 3,446 133,953 -61 -76,129 61,209
total 11,439,746 216,574 -4,977 -107,922 11,543,421
31 dec. 2012 EUr ’000gross carrying
amount
fair value of collateral
received
Loans and advances to customers and banks and debt instruments not past due or individually impaired 11,392,442 5,096,065
Loans and advances to customers and banks and debt instruments overdue but not individually impaired 47,304 18,495
Loans and advances to customers and banks and debt instruments individually impaired (overdue and not past due) 216,574 46,369
total 11,656,320 5,160,929
31 dec. 2011 EUr ’000
gross carrying amount (not indi-vidually impaired)
gross carrying amount (individ-
ually impaired)
collective impairment allowances
Individual impairment allowances
net carrying amount
Not past due 10,073,287 73,143 -4,814 -31,921 10,109,696
Less than 90 days overdue 43,722 6,670 -117 -3,714 46,562
90 days or more overdue 10,235 100,823 -67 -63,374 47,617
total 10,127,244 180,636 -4,998 -99,008 10,203,874
31 dec. 2011 EUr ’000gross carrying
amount
fair value of collateral
received
Loans and advances to customers and banks and debt instruments not past due or individually impaired 10,073,287 4,261,774
Loans and advances to customers and banks and debt instruments overdue but not individually impaired 53,957 31,282
Loans and advances to customers and banks and debt instruments individually impaired (overdue and not past due) 180,636 41,538
total 10,307,880 4,334,594
The gross carrying amount of receivables of the leasing sub-group amounts to EUr 1,403,974thsd (2011: EUr 1,344,676thsd); is this case no collateral is shown.

hYpO NOE GrOUp aNNUaL rEpOrT 2012 | 173
8.7 assets held for tradIngThis item comprises the positive fair value of derivative financial instruments measured at fair value.
8.8 posItIve faIr valUe of hedges (hedge accoUntIng)The positive and negative fair value of hedges is reported separately, on the assets, and equity and liabilities sides of the consolidated statement of financial position, provided that they qualify for hedge accounting under iaS 39.
The positive fair value of hedges is classified according to the nature of the underlying transactions, as follows:
eUr ’000 31 dec. 2012 31 dec. 2011
positive fair value of derivatives held for trading (banking book)
interest rate derivatives 593,506 446,749
foreign exchange derivatives 8,557 10,581
Other assets held for trading 5,351 13,750
total 607,414 471,080
eUr ’000 31 dec. 2012 31 dec. 2011
assets 3,782 7,127
Loans and advances to banks – 145
Loans and advances to customers 315 1,052
financial assets 3,467 5,931
liabilities 614,153 464,682
Deposits from banks 1,805 739
Deposits from customers 98,381 98,220
Debts evidenced by certificates 513,967 365,723
total 617,935 471,809

174 | NOTES
8.9 avaIlable-for-sale fInancIal assetsThis item mainly relates to bonds and other fixed-income securities.
it also includes afS equities and other variable-income securities, holdings in non-consolidated subsidiaries, and equity interests not held for sale.
eUr ’000 31 dec. 2012 31 dec. 2011
Shares and other variable-income securities 201 125
Bonds, public debt certificates and other fixed-income securities 1,821,156 1,831,482
interests in non-consolidated subsidiaries (over 50%) 146 226
interests in associates (20–50%) 522 475
Other investments 3,575 4,872
total 1,825,600 1,837,180
8.10 fInancIal assets desIgnated as at faIr valUe throUgh profIt or loss
eUr ’000 31 dec. 2012 31 dec. 2011
Bonds, public debt certificates and other fixed-income securities 4,662 4,560
total 4,662 4,560
8.11 fInancIal assets held to matUrItyBonds held to maturity are reported under this item.
eUr ’000 31 dec. 2012 31 dec. 2011
Bonds, public debt certificates and other fixed-income securities 10,009 15,031
total 10,009 15,031
8.12 analysIs of fInancIal assets accordIng to the classIfIcatIon of the bWg (aUstrIan bankIng act)
Listed securities:
eUr ’000 31 dec. 2012 31 dec. 2011
Bonds, public debt certificates and other fixed-income securities 1,184,915 1,266,339
Shares and other variable-income securities 145 78
Debt securities and other fixed-income securities include securities totalling EUr 1,567,359thsd are due in the year after the end of the reporting period (2011: EUr 1,623,991thsd).

hYpO NOE GrOUp aNNUaL rEpOrT 2012 | 175
8.13 Investments accoUnted for UsIng the eqUIty methodinvestments in associates and joint ventures are recognised at cost, and are included in the consolidated statement of financial position at the date on which a significant influence is obtained. in subsequent periods the carrying amount of the holdings is adjusted for changes in equity (see Notes 3.1 Basis of consolidation and 3.2 investments).
pursuant to paragraph 30 iaS 28, unrealised losses in the form of start-up losses during the reporting period (and cumula-tive) of EUr 169thsd (2011: nil) are recognised.
as in the previous period, none of the investments accounted for using the equity method was listed as of the end of the reporting period.
analysis of the total loans and advances, deposits, and operating income and expense of joint ventures pursuant to para-graph 56 iaS 31 (see Note 3.2 investments for a listing of joint ventures and holdings in them):
8.14 Investment propertyLand and buildings held to earn rentals or for capital appreciation are reported under this item (see Note 3.9 investment property).
rental income during the reporting period was EUr 3,177thsd (2011: EUr 971thsd). The increase was due to the commence-ment of operations by the subsidiaries formed during the previous year.
eUr ’000 31 dec. 2012 31 dec. 2011
Banks 2,946 2,730
Non-banks 50,568 45,212
total 53,514 47,942
eUr ’000 31 dec. 2012 31 dec. 2011
Loans and advances 199,245 176,424
Deposits 178,670 157,026
Operating income 949 859
Operating expense -1,323 -1,043
movements in the properties held as financial investments are shown in the table below (Note 8.15 movements in financial assets).
eUr ’000 31 dec. 2012 31 dec. 2011
investment property 52,256 43,411
8.15 movements In fInancIal assetsThe “available-for-sale financial assets” item in the statement of movements in financial assets comprises holdings in non-consolidated subsidiaries (holdings of over 50%), holdings in associates (20–50%) and other investments.

176 | NOTES
eUr ‘000 (note)
amortised costdepreciation and valuations (+/-) of investments
accounted for by the equity method carrying amount
as at 1 Jan. 2012 additions
subsequent acquisition
costs disposalsother
changes
fair value measurement
recognised directly in equity
as at 31 dec. 2012
as at 1 Jan. 2012
depreciation and valu-ations (+/-) of invest-ments accounted for
by the equity method Impairments disposalsas at 31
dec. 2012as at 1
Jan. 2012as at 31
dec. 2012
financial assets held to maturity (8.11) 15,031 – – -5,010 -12 – 10,009 – – – – – 15,031 10,009
available-for-sale financial assets (8.9) 7,748 – – -40 – 39 7,748 -2,175 – -614 -717 -3,505 5,573 4,243
investments accounted for using the equity method (8.13) 12,743 3,847 – – – – 16,590 35,199 1,725 – – 36,924 47,942 53,514
investment property (8.14) 47,313 10,422 5 – – – 57,740 -3,901 -1,445 -137 – -5,484 43,412 52,256
total financial investments 82,835 14,269 5 -5,049 -12 39 92,087 29,123 279 -751 -717 27,934 111,958 120,021
eUr ‘000 (note)
amortised costdepreciation and valuations (+/-) of investments
accounted for by the equity method carrying amount
as at 1 Jan. 2011 additions
subsequent acquisition
costs disposalsother
changes
fair value measurement
recognised directly in equity
as at 31 dec. 2011
as at 1 Jan. 2011
depreciation and valu-ations (+/-) of invest-ments accounted for
by the equity method Impairments disposalsas at 31
dec. 2011as at 1
Jan. 2011as at 31
dec. 2011
financial assets held to maturity (8.11) 70,063 – – -55,033 – – 15,031 43 – – -43 – 70,106 15,031
available-for-sale financial assets (8.9) 28,319 257 – -20,827 – – 7,748 -5,403 – -961 4,189 -2,175 22,915 5,573
investments accounted for using the equity method (8.13) 12,846 48 – -150 – – 12,743 33,304 1,921 -25 – 35,199 46,150 47,942
investment property (8.14) 28,317 21,536 1 -2,541 – – 47,313 -3,874 -756 – 728 -3,901 24,443 43,411
total financial investments 139,545 21,840 1 -78,551 – – 82,835 24,070 1,165 -986 4,874 29,123 163,614 111,958

hYpO NOE GrOUp aNNUaL rEpOrT 2012 | 177
8.16 IntangIble assets, and property, plant and eqUIpmentLand and buildings, and equipment, fixtures and furnishings used by the hYpO NOE Group in the course of its own business activities are reported as property, plant and equipment.
eUr ’000 31 dec. 2012 31 dec. 2011
intangible assets
Software 1,349 765
Goodwill 845 –
total intangible assets 2,194 765
property, plant and equipment
Land and buildings 53,565 25,739
iT equipment 688 757
Equipment, fixtures and furnishings 13,217 8,741
Other property, plant and equipment 37 –
total property, plant and equipment 67,507 35,237
The increase in the “Land and buildings” and “Equipment, fixtures and furnishings” items is largely due to an addition to the hYpO NOE headquarters building in St. pölten – a self-managed project.
eUr ‘000 (note)
amortised costdepreciation and valuations (+/-) of investments
accounted for by the equity method carrying amount
as at 1 Jan. 2012 additions
subsequent acquisition
costs disposalsother
changes
fair value measurement
recognised directly in equity
as at 31 dec. 2012
as at 1 Jan. 2012
depreciation and valu-ations (+/-) of invest-ments accounted for
by the equity method Impairments disposalsas at 31
dec. 2012as at 1
Jan. 2012as at 31
dec. 2012
financial assets held to maturity (8.11) 15,031 – – -5,010 -12 – 10,009 – – – – – 15,031 10,009
available-for-sale financial assets (8.9) 7,748 – – -40 – 39 7,748 -2,175 – -614 -717 -3,505 5,573 4,243
investments accounted for using the equity method (8.13) 12,743 3,847 – – – – 16,590 35,199 1,725 – – 36,924 47,942 53,514
investment property (8.14) 47,313 10,422 5 – – – 57,740 -3,901 -1,445 -137 – -5,484 43,412 52,256
total financial investments 82,835 14,269 5 -5,049 -12 39 92,087 29,123 279 -751 -717 27,934 111,958 120,021
eUr ‘000 (note)
amortised costdepreciation and valuations (+/-) of investments
accounted for by the equity method carrying amount
as at 1 Jan. 2011 additions
subsequent acquisition
costs disposalsother
changes
fair value measurement
recognised directly in equity
as at 31 dec. 2011
as at 1 Jan. 2011
depreciation and valu-ations (+/-) of invest-ments accounted for
by the equity method Impairments disposalsas at 31
dec. 2011as at 1
Jan. 2011as at 31
dec. 2011
financial assets held to maturity (8.11) 70,063 – – -55,033 – – 15,031 43 – – -43 – 70,106 15,031
available-for-sale financial assets (8.9) 28,319 257 – -20,827 – – 7,748 -5,403 – -961 4,189 -2,175 22,915 5,573
investments accounted for using the equity method (8.13) 12,846 48 – -150 – – 12,743 33,304 1,921 -25 – 35,199 46,150 47,942
investment property (8.14) 28,317 21,536 1 -2,541 – – 47,313 -3,874 -756 – 728 -3,901 24,443 43,411
total financial investments 139,545 21,840 1 -78,551 – – 82,835 24,070 1,165 -986 4,874 29,123 163,614 111,958

178 | NOTES
eUr ’000
cost depreciation and amortisation carrying amount
as at 1 Jan. 2011
changes in scope of
consolidation additions disposalsas at 31
dec. 2011 as at 1 Jan. 2011
changes in scope of
consolidation
depreciation and amor-
tisation Impairments disposalsas at 31
dec. 20111 Jan.
201131 dec.
2011
intangible assets
Software 4,065 – 350 – 4,415 -3,032 – -618 – – -3,650 1,033 765
Goodwill 32 – – – 32 -32 – – – – -32 – –
total intangible assets 4,097 – 350 – 4,447 -3,064 – -618 – – -3,683 1,033 765
property, plant and equipment
Land and buildings 28,492 – 9,309 – 37,801 -9,310 – -301 -2,451 – -12,062 19,182 25,739
iT equipment 4,167 – 695 -543 4,319 -3,672 – -433 – 543 -3,562 495 757
Equipment, fixtures and furnishings 24,580 – 3,281 -870 26,990 -16,742 – -2,107 – 599 -18,250 7,838 8,741
Other property, plant and equipment 57 – – – 57 -57 – – – – -57 – –
total property, plant and equipment 57,295 – 13,285 -1,413 69,167 -29,781 – -2,840 -2,451 1,142 -33,930 27,514 35,237
eUr ’000
cost depreciation and amortisation carrying amount
as at 1 Jan. 2012
changes in scope of
consolidation additions disposalsas at 31
dec. 2012as at 1 Jan.
2012
changes in scope of
consolidation
depreciation and amor-
tisation Impairments disposalsas at 31
dec. 20121 Jan. 2012
31 dec. 2012
Intangible assets
Software 4,415 418 1,046 -130 5,749 -3,650 -222 -644 – 116 -4,400 765 1,349
Goodwill 32 845 – – 877 -32 – – – – -32 – 845
total intangible assets 4,447 1,263 1,046 -130 6,626 -3,683 -222 -644 – 116 -4,432 764 2,194
property, plant and equipment
Land and buildings 37,801 – 30,874 -6,417 62,259 -12,062 – -961 -208 4,537 -8,694 25,739 53,565
iT equipment 4,319 – 367 -472 4,214 -3,562 – -416 – 451 -3,526 757 688
Equipment, fixtures and furnishings 26,990 2,202 7,475 -2,059 34,608 -18,250 -1,719 -2,996 – 1,574 -21,391 8,740 13,217
Other property, plant and equipment 57 – 39 – 96 -57 – -2 – – -59 – 37
total property, plant and equipment 69,167 2,202 38,755 -8,948 101,177 -33,931 -1,719 -4,374 -208 6,562 -33,669 35,236 67,507
The carrying amount of the land was EUr 7,308thsd (2011: 7,535thsd) as at the end of the reporting period.
The impairments in 2012 and 2011 in relate to land and buildings in Lower austria owned by the Bank.

hYpO NOE GrOUp aNNUaL rEpOrT 2012 | 179
eUr ’000
cost depreciation and amortisation carrying amount
as at 1 Jan. 2011
changes in scope of
consolidation additions disposalsas at 31
dec. 2011 as at 1 Jan. 2011
changes in scope of
consolidation
depreciation and amor-
tisation Impairments disposalsas at 31
dec. 20111 Jan.
201131 dec.
2011
intangible assets
Software 4,065 – 350 – 4,415 -3,032 – -618 – – -3,650 1,033 765
Goodwill 32 – – – 32 -32 – – – – -32 – –
total intangible assets 4,097 – 350 – 4,447 -3,064 – -618 – – -3,683 1,033 765
property, plant and equipment
Land and buildings 28,492 – 9,309 – 37,801 -9,310 – -301 -2,451 – -12,062 19,182 25,739
iT equipment 4,167 – 695 -543 4,319 -3,672 – -433 – 543 -3,562 495 757
Equipment, fixtures and furnishings 24,580 – 3,281 -870 26,990 -16,742 – -2,107 – 599 -18,250 7,838 8,741
Other property, plant and equipment 57 – – – 57 -57 – – – – -57 – –
total property, plant and equipment 57,295 – 13,285 -1,413 69,167 -29,781 – -2,840 -2,451 1,142 -33,930 27,514 35,237
eUr ’000
cost depreciation and amortisation carrying amount
as at 1 Jan. 2012
changes in scope of
consolidation additions disposalsas at 31
dec. 2012as at 1 Jan.
2012
changes in scope of
consolidation
depreciation and amor-
tisation Impairments disposalsas at 31
dec. 20121 Jan. 2012
31 dec. 2012
Intangible assets
Software 4,415 418 1,046 -130 5,749 -3,650 -222 -644 – 116 -4,400 765 1,349
Goodwill 32 845 – – 877 -32 – – – – -32 – 845
total intangible assets 4,447 1,263 1,046 -130 6,626 -3,683 -222 -644 – 116 -4,432 764 2,194
property, plant and equipment
Land and buildings 37,801 – 30,874 -6,417 62,259 -12,062 – -961 -208 4,537 -8,694 25,739 53,565
iT equipment 4,319 – 367 -472 4,214 -3,562 – -416 – 451 -3,526 757 688
Equipment, fixtures and furnishings 26,990 2,202 7,475 -2,059 34,608 -18,250 -1,719 -2,996 – 1,574 -21,391 8,740 13,217
Other property, plant and equipment 57 – 39 – 96 -57 – -2 – – -59 – 37
total property, plant and equipment 69,167 2,202 38,755 -8,948 101,177 -33,931 -1,719 -4,374 -208 6,562 -33,669 35,236 67,507

180 | NOTES
8.18 other assetsThe “Other assets” item chiefly relates to accruals and deferrals, other non-bank receivables (e.g. trade receivables and amounts due from the tax authorities in respect of other taxes), and derivatives used in connection with banking book management.
The positive fair value of derivative financial instruments is reported under “Other assets” if they do not qualify for hedge accounting and instead represent economic hedges used in connection with banking book management.
Deferred tax assets were recognised in respect of the following items:
No deferred tax assets were recognised in respect of EUr 15,241thsd (2011: EUr 11,561thsd) in tax loss carryforwards.
eUr ’000 31 dec. 2012 31 dec. 2011
Loans and advances to banks 1 94
risk provisions 416 –
financial investments 122 11,688
property, plant and equipment 86 222
Other assets 41 –
Deposits from customers – 23,787
Debts evidenced by certificates 9,279 88,040
Liabilities held for trading 50 95,119
Negative fair value of hedges (hedge accounting) – 102,479
provisions 2,277 –
Other liabilities 677 1,009
Subordinated capital 417 309
Tax loss carryforwards 936 3,381
deferred tax assets before offsetting 14,302 326,127
less deferred tax liabilities -8,961 -306,914
reported net deferred tax assets 5,342 19,214
8.17 tax assetsSee Note 4.10 Tax assets and liabilities for a discussion of income tax.
eUr ’000 31 dec. 2012 31 dec. 2011
current tax assets – 4,068
Deferred tax assets 5,342 19,214
total 5,342 23,282

hYpO NOE GrOUp aNNUaL rEpOrT 2012 | 181
properties owned by new real estate subsidiaries (see Note 3.1 Basis of consolidation) are reported under the “property classified as inventory” item.
8.19 deposIts Deposits from banks and customers, including debts evidenced by certificates, are carried at amortised cost (Note 8.20 Deposits from banks, Note 8.21 Deposits from customers and Note 8.22 Debts evidenced by certificates).
eUr ’000 31 dec. 2012 31 dec. 2011
Deferred items 1,389 2,383
Other receivables and assets: 25,537 19,020
thereof: value added tax (VAT) and other tax credits (other than income tax) 5,951 8,514
property classified as inventory 4,935 4,624
trade receivables 10,108 1,249
emergency acquisitions held for sale – 36
positive fair value of derivatives 199 150
total 27,125 21,553
8.20 deposIts from banks
repurchase agreements entered into as a transferor
assets were loaned subject to contractual obligations to return them, as described by example aG51(a) iaS 39. The Bank, as the transferor, retained substantially all the risks and rewards of ownership.
These transactions were largely tri-party repos and collateralised loans from the EcB and the Oesterreichische National-bank (austrian National Bank).
The deposits from banks include repurchase agreements entered into by the Bank as a transferor.
eUr ’000 31 dec. 2012 31 dec. 2011
Domestic banks 1,123,774 1,656,345
foreign banks
central and Eastern Europe (cEE) 41,038 45,008
rest of the world (rOW) 1,552,475 683,108
total 2,717,286 2,384,461
eUr ’000 31 dec. 2012 31 dec. 2011
Liabilities to banks under repo agreements 800,000 950,000

182 | NOTES
8.21 deposIts from cUstomers
8.21.1 customer group analysis
eUr ’000 31 dec. 2012 31 dec. 2011
savings deposits 794,032 780,002
demand and time deposits 1,460,423 1,693,408
public sector customers 194,421 186,220
Business customers 978,570 1,214,770
housing developers 42,540 47,779
retail customers 214,214 210,775
professionals 30,678 33,864
total 2,254,455 2,473,410
8.21.2 Geographical analysis
eUr ’000 31 dec. 2012 31 dec. 2011
Domestic customers 1,457,469 1,421,985
foreign customers
central and Eastern Europe (cEE) 6,647 9,680
rest of the world (rOW) 790,339 1,041,745
total 2,254,455 2,473,410
trustee savings accounts
quaranteed by the state government
requiring coverage cover assets surplus coverage
31 Dec. 2012 EUr ’000 3,909 1,267 2,642 5,000 2,358
The deposits from customers include trustee savings accounts; an analysis is shown below.
8.22 debt evIdenced by certIfIcates
eUr ’000 31 dec. 2012 31 dec. 2011
covered and municipal bonds 3,603,113 2,633,854
Other bonds 4,307,872 4,197,395
profit-sharing certificates 364 503
total 7,911,349 6,831,752
8.23 lIabIlItIes held for tradIngThe negative fair value of derivatives held for trading that are measured at fair value is disclosed under this item. realised gains and losses, and measurement gains and losses are reported under the “Net trading income” item in the statement of comprehensive income (see Note 7.6 Net trading income for a detailed analysis).

hYpO NOE GrOUp aNNUaL rEpOrT 2012 | 183
eUr ’000 31 dec. 2012 31 dec. 2011
negative fair value of derivative financial instruments (banking book)
interest rate derivatives 511,208 358,159
foreign exchange derivatives 8,484 8,991
Other liabilities held for trading 5,351 13,324
total 525,043 380,474
8.24 negatIve faIr valUe of hedges (hedge accoUntIng)The negative fair value of hedges is reported separately, on the equity and liabilities side of the consolidated statement of financial position, provided that they qualify for hedge accounting under iaS 39.
The negative fair value of hedges is classified according to the nature of the underlying transactions, as follows:
eUr ’000 31 dec. 2012 31 dec. 2011
assets 590,079 403,116
Loans and advances to customers 487,478 331,295
available-for-sale financial assets 102,601 71,821
liabilities 3,550 6,800
Deposits from banks 233 1,046
Deposits from customers 617 –
Debts evidenced by certificates 2,700 5,754
total 593,630 409,916
8.25 provIsIonsThe following items are reported under “provisions”:
�Long-term provisions for pensions and similar obligations; and �Other provisions.
eUr ’000 31 dec. 2012 31 dec. 2011
employee benefit provisions 40,051 35,938
provisions for pensions 25,527 25,801
provisions for termination benefits 12,721 8,889
provisions for jubilee benefits 1,803 1,248
credit provisions 6,535 10,165
other provisions 1,162 756
total 47,748 46,859

184 | NOTES
eUr ’000
as at 1 Jan. 2012
changes in scope of
consolidation exchange
differencesallo-
cationsUtili-
sation re versals
discount unwinding
effect
as at 31 dec.
2012
employee benefit provisions 35,938 566 – 628 -2,115 – 5,033 40,051
provisions for pensions 25,801 – – 31 -1,652 – 1,346 25,527
provisions for termination benefits 8,889 566 – 494 -428 – 3,201 12,721
provisions for jubilee benefits 1,248 – – 103 -35 – 486 1,803
credit provisions 10,165 – 11 146 -3,000 -788 – 6,535
other provisions 756 337 – 274 -23 -182 – 1,163
total 46,859 903 11 1,048 -5,137 -970 5,034 47,748
eUr ’000as at 1
Jan. 2011
changes in scope of
consolidation exchange
differencesallo-
cationsUtili-
sation reversals
discount unwinding
effectas at 31
dec. 2011
employee benefit provisions 33,819 – – 587 -2,479 – 4,010 35,938
provisions for pensions 24,328 – – 31 -1,790 – 3,231 25,801
provisions for termination benefits 8,305 – – 445 -600 – 739 8,889
provisions for jubilee benefits 1,186 – – 112 -88 – 39 1,248
credit provisions 5,795 – – 4,749 -215 -163 – 10,165
other provisions 58,662 – – 323 -58,049 -181 – 756
total 98,276 – – 5,659 -60,742 -344 4,010 46,859
8.25.1 movements In provIsIonsThe “provisions” item relates to provisions for obligations which will probably need to be settled by an outflow of resources.
The interest penalty of EUr 57,866thsd imposed by notice of the austrian financial market authority was paid. This is reported under utilisation in the “Other provisions” item.

hYpO NOE GrOUp aNNUaL rEpOrT 2012 | 185
8.25.2 Disclosures on employee benefit obligation
Defined benefit obligation (DBO) is the present value of the benefit entitlements earned by employees up to the end of the reporting period.
eUr ’000provisions
for pensions
provisions for termination
benefits
provisions for jubilee
benefits total
present value of dbo at 31 dec. 2007 24,458 9,134 863 34,455
Service cost 51 547 65 663
interest cost 1,267 490 46 1,804
payments -1,936 -1,465 -63 -3,464
actuarial gains and losses recognised in profit or loss – – -112 -112
actuarial gains and losses not recognised in profit or loss 2,430 -1,563 – 867
present value of dbo at 31 dec. 2008 26,270 7,143 800 34,213
Service cost 31 420 67 517
interest cost 1,512 435 52 1,999
payments -1,887 -593 -92 -2,572
actuarial gains and losses recognised in profit or loss – – 100 100
actuarial gains and losses not recognised in profit or loss -1,475 18 – -1,457
present value of dbo at 31 dec. 2009 24,451 7,423 926 32,800
Service cost 24 426 63 514
interest cost 1,346 432 50 1,828
payments -1,826 -719 -15 -2,559
actuarial gains and losses recognised in profit or loss – – 162 162
actuarial gains and losses not recognised in profit or loss 333 742 – 1,075
present value of dbo at 31 dec. 2010 24,328 8,305 1,187 33,819
changes in scope of consolidation – – 16 16
Service cost 31 445 95 571
interest cost 1,145 411 60 1,616
payments -1,789 -600 -89 -2,478
actuarial gains and losses recognised in profit or loss – – -21 -21
actuarial gains and losses not recognised in profit or loss 2,087 328 – 2,415
present value of dbo at 31 dec. 2011 25,801 8,889 1,249 35,938
changes in scope of consolidation – 566 – 566
Service cost 31 494 103 628
interest cost 1,317 484 69 1,870
payments -1,652 -428 -35 -2,115
actuarial gains and losses recognised in profit or loss – – 417 417
actuarial gains and losses not recognised in profit or loss 29 2,717 – 2,746
present value of dbo at 31 dec. 2012 25,527 12,721 1,803 40,051
The average duration of the pension obligation is 15.6 years.

186 | NOTES
assumptions underlying employee benefit calculations
eUr ’000provisions
for pensions
provisions for termination
benefitsprovisions for
jubilee benefits total
carrying amounts as at 31 dec. 31 2012
discount rate 3.25%, salary increases 4.5%, pension increase 2.5%
DBO 25,527 12,721 1,803 40,051
Service cost (2013 forecast) 44 686 171 902
interest cost (2013 forecast) 831 436 64 1,331
thereof Supervisory and Management boards
DBO 552 998 37 1,587
Service cost 15 14 2 30
Interest cost 18 33 1 53
thereof key management staff
DBO 884 1,306 125 2,315
Service cost (2013 forecast) 25 90 15 130
Interest cost (2013 forecast) 30 45 5 79
carrying amounts as at 31 dec. 31 2012: + 1% discount rate
discount rate 4.25%, salary increases 4.5%, pension increase 2.5%
DBO 23,048 11,418 1,602 36,069
Service cost (2013 forecast) 37 608 143 788
interest cost (2013 forecast) 981 511 74 1,566
carrying amounts as at 31 dec. 31 2012: - 1% discount rate
discount rate 2.25%, salary increases 4.5%, pension increase 2.5%
The first table states the present value of the defined benefit obligation in respect of pensions, termination benefits and jubilee benefits recognised as at 31 December 2012, and the service cost and interest cost, as well as the parameters (dis-count rate, salary increases and pension increases) on which the calculations are based. The figures for the Supervisory and management boards, and key management staff are also given.
The other tables present four sensitivity analyses which show how changes in two parameters (the discount rate and sal-ary increases) would affect the DBO, and the service cost and interest cost recognised. The first two calculations show the sensitivity to a change of 1% upwards or downwards in the discount rate with the remaining parameters unchanged. The next two show the sensitivity to a change of plus or minus 1% in the rate of salary increases with the remaining parameters unchanged.
The final table estimates DBO, and service cost and interest cost if the parameters remain unchanged from last year’s.

hYpO NOE GrOUp aNNUaL rEpOrT 2012 | 187
8.26 tax lIabIlItIesSee Note 4.10 Tax assets and liabilities for a discussion of income tax.
eUr ’000 31 dec. 2012 31 dec. 2011
current tax liabilities 17,006 8,901
Deferred tax liabilities 16,962 11,961
total 33,967 20,862
The deferred tax liabilities are the potential burden due to temporary differences between the ifrS carryng ammounts of assets and liabilities, and the tax basis.
paragraph 120(a) is inapplicable as there are no plan assets.
DBO 27,790 14,272 2,049 44,110
Service cost (2013 forecast) 53 781 207 1,041
interest cost (2013 forecast) 626 339 51 1,016
carrying amounts as at 31 dec. 31 2012: + 1% salary increases
discount rate 3.25%, salary increases 5.5% as basis of termination and jubilee benefit provisions, pension increase 2.5%
DBO 25,527 14,436 2,043 42,005
Service cost (2013 forecast) 44 790 206 1,041
interest cost (2013 forecast) 831 495 73 1,399
carrying amounts as at 31 dec. 31 2012: - 1% salary increases
discount rate 3.25%, salary increases 3.5% as basis of termination and jubilee benefit provisions, pension increase 2.5%
DBO 25,527 11,264 1,602 38,394
Service cost (2013 forecast) 44 600 143 787
interest cost (2013 forecast) 831 386 57 1,273
carrying amounts as at 31 dec. 31 2012 - previous year’s discount rate
discount rate 5.1%, salary and pension increase 4%
DBO 24,279 9,897 1,384 35,559
Service cost (2013 forecast) 32 518 114 664
interest cost (2013 forecast) 1,240 531 76 1,847

188 | NOTES
Deferred tax assets are only set off against deferred tax liabilities of the same entities.
eUr ’000 31 dec. 2012 31 dec. 2011
Loans and advances to customers 136,915 16,281
risk provisions 715 –
assets held for trading 135,228 –
positive fair value of hedges (hedge accounting) 149,237 –
financial investments 14,657 –
property, plant and equipment 2 –
Other assets 2,563 –
provisions 6,195 –
deferred tax liabilities before offsetting 445,512 16,281
Less deferred tax assets -428,550 -4,320
reported net deferred tax liabilities 16,962 11,961
8.27 other lIabIlItIesThe negative fair value of derivative financial instruments is reported under “Other liabilities” if they do not qualify for hedge accounting and instead represent economic hedges used in connection with banking book management.
eUr ’000 31 dec. 2012 31 dec. 2011
Deferred items 8,781 10,966
Sundry other liabilities 69,089 40,554
thereof: trade payables 20,775 10,706
outstanding invoices 21,103 6,617
VAT and other tax liabilities (other than income tax) 6,235 5,190
legal and consultancy costs 1,161 1,203
phantom share based cash incentives* 350 –
Negative fair value of derivatives 371 425
total 78,241 51,945
* See Note 4.15 Other liabilities
Deferred tax liabilities were recognised in respect of the following statement of financial position items:

hYpO NOE GrOUp aNNUaL rEpOrT 2012 | 189
8.28 sUbordInated capItalSubordinated debt as defined by austrian banking legislation is reported as subordinated capital.
in 2012 expenses arising from subordinated debt totalled EUr 4,086thsd (2011: 5,077thsd).
eUr ’000 31 dec. 2012 31 dec. 2011
Subordinated capital 202,435 202,244
8.29 eqUItyNote 4.17 contains a discussion of equity (including non-controlling interests).
The table below provides a summarised view of the company’s equity. The statement of changes in equity gives additional details.
eUr ’000 31 dec. 2012 31 dec. 2011
Share capital 51,981 51,981
capital reserves 191,824 191,824
thereof: appropriated reserve 94,624 94,624
unappropriated reserve 97,200 97,200
revaluation surplus -33,587 -89,087
retained earnings 286,760 275,891
parent shareholders’ equity 496,977 430,608
Non-controlling interests 565 527
total 497,542 431,135
8.30 consolIdated capItal resoUrces and regUlatory capItal adeqUacy reqUIrements
The hYpO NOE Group is a banking group as defined by section 30 austrian Banking act. Under section 22(1) Banking act, banking groups must at all times, as a minimum, have capital resources equal to the amounts set out in sections 22(1)(1–5) of the act. The hYpO NOE Group is currently subject to regulatory capital requirements in respect of its credit and oper-ational risk. credit risk is measured in accordance with the standardised approach set out in section 22a Banking act, as well as the current exposure method under section 22(5)(2) of the act in the case of derivatives in the meaning of annex 2 to section 22 of the act.
The basic indicator approach is applied to the measurement of operational risk in accordance with section 22j Banking act.
The Group accounting Department calculates regulatory capital in the meaning of sections 23 and 24 Banking act.
The scope of consolidation in accordance with iaS/ifrS differs from that of the banking group under section 30 Banking act. The act requires the inclusion of credit institutions, financial institutions and companies providing banking-related

190 | NOTES
movements in the risk-weighted assessment base as defined by the Banking act and the resultant capital requirements were as follows:
eUr ’000 31 dec. 2012 31 dec. 2011
Share capital 51,981 51,981
reserves, differences and non-controlling interests 456,649 436,905
intangible assets -1,179 -757
core capital (tier 1 capital) 507,451 488,129
Deductions pursuant to sections 23(13) and 29 (1-2) Banking act -1,994 -1,864
eligible core capital 505,457 486,265
Undisclosed reserves in the meaning of section 57(1) Banking act 5,000 5,000
Eligible subordinated debt according to section 23(8) Banking act 160,000 200,000
supplementary capital (tier 2) 165,000 205,000
Deductions pursuant to sections 23(13) and 29 (1-2) Banking act -1,994 -1,864
eligible supplementary capital (after deductions) 163,006 203,136
total eligible core capital 668,463 689,401
capital requirement 351,082 315,497
surplus capital 317,381 373,904
coverage ratio 190.40% 218.51%
core capital ratio 12.33% 13.25%
Equity ratio 16.31% 18.79%
eUr ’000 31 dec. 2012 31 dec. 2011
risk-weighted assessment base according to section 22(2) Banking act 4,099,035 3,668,983
thereof 8% minimum capital requirement 327,923 293,518
capital requirement for operational risk 23,159 21,979
total capital requirement 351,082 315,497
services in consolidation where control exists. companies under common management are accounted for by proportionate consolidation, and those not under common management using the equity method.
in contrast to Banking act requirements, other, non-banking companies are also consolidated in accordance with iaS 27. Joint ventures are accounted for using the equity method in the ifrS consolidated financial reporting (see Note 3.2 invest-ments).
The capital resources of the hYpO NOE Group, calculated in accordance with the requirements of the austrian Banking act, had the following components:

HYPO NOE GROUP ANNUAL REPORT 2012 | 191
9. SEGmENT iNfORmATiON
The five segments, which are based on the structure of the Group’s business activities, are as follows:
Gruppe Bank
This segment aggregates the income and expense items related to relationships with large customers – chiefly state and local government clients (public finance, real estate and treasury business).
Landesbank
These sub-group statements are for two subsidiaries, and contain the retail and business customer operations, with the emphasis on housing finance as well as the funding for large non-profit housing developers building projects provided by HYPO NOE Landesbank AG, insurance brokerage and workout management.
Leasing
This segment groups together the subsidiaries that operate in the leasing business (see Note 3.8 Lease accounting). These are ifRS sub-group financial statements for 37 consolidated subsidiaries.
Other
This segment is used to provide information on a sub-group with 18 subsidiaries which are neither leasing companies nor banks.
Consolidation
This segment is used to provide information on consolidation adjustments.
The detailed assignment of companies to segments is shown in Note 3.2 investments, and the Bank’s segment reporting is also discussed in Note 5. Segment information
9.1 Business seGment infOrmatiOn
9.1.1 Segment profit or loss
The internal segmental reporting ends with “Profit before tax”. “income tax” and “Non-controlling interests”, in the Total column, reconcile the segmental analysis with the items in the consolidated financial statements. The presentation in the notes was adjusted to the internal reporting.
in 2012 the segment reporting was extended to five segments as the reporting to the management Board is based on these five segments. The previous year’s figures are also presented in accordance with the new structure.

192 | NOTES
Gruppe Bank
in 2012 the Gruppe Bank segment again recorded high net interest income, while making a net loss on financial assets due to the disposal of Cypriot, Greek, Hungarian government bonds, as well as Spanish bank bonds.
Landesbank
The Landesbank segment’s results for 2012 show slower income growth in its core business (net interest income, and net fee and commission income) which was more than made up for by a significant reduction in credit provision charges thanks to good workout management.
Leasing
Prevailing interest rates are the main influence on the operating profits of the Leasing segment, as the interest rate effect alters the capital and interest components of the annuities. The final settlement of two major real estate leasing contracts, making it possible to determine the total investment, also had a major impact on net interest income
Other
The year-on-year change in this segment’s earnings reflects the addition of three project companies and the related trans-action costs, the commencement of the operations of subsidiaries formed in the previous year, and special effects in 2011 including impairments and a waiver of receivables.
2012 eur ’000Gruppe
Bank Landesbank Leasing OtherConsolida-
tion total
interest and similar income 496,814 73,262 23,057 2,051 -42,869 552,314
thereof: income from investments ac-counted for using the equity method 2,671 130 352 533 – 3,686
interest and similar expense -399,963 -34,416 -17,236 -1,388 36,059 -416,944
Credit provisions -18,064 -3,066 – -27 – -21,157
net interest income after risk provisions 78,787 35,780 5,821 636 -6,810 114,214
Net fee and commission income/expense 3,414 8,602 -32 – 1 11,985
Net trading income/expense -1,257 453 – – – -804
General administrative expenses -56,511 -43,487 -3,905 -12,719 9,657 -106,965
Net other operating expenses/income 9,386 1,919 3,447 11,948 -9,501 17,199
Net gains or losses on financial assets -7,189 64 5 – – -7,120
Net gains or losses on hedges 2,441 -468 – – – 1,973
Net gains or losses on other financial investments -9 – 1 -91 -157 -256
Profit before tax 29,062 2,863 5,337 -226 -6,810 30,226
income tax expense -7,418
Profit for the year 22,808
Non-controlling interests -37
Profit attributable to owners of the parent 22,771

HYPO NOE GROUP ANNUAL REPORT 2012 | 193
Consolidation
The amounts in the column that reconciles the segment results with the consolidated profit arise from the elimination of intragroup expenses and revenue. The remaining portions, recognised in consolidated profit or loss, correspond to the consolidation of intra-group dividends.
2011 eur ’000Gruppe
Bank Landesbank Leasing OtherConsolida-
tion total
interest and similar income 393,681 80,974 18,846 327 -48,339 445,488
thereof: income from investments ac-counted for using the equity method 5,443 223 -397 -48 – 5,222
interest and similar expense -294,776 -37,219 -15,904 -160 41,366 -306,693
Credit provisions -10,182 -9,943 – – – -20,125
net interest income after risk provisions 88,723 33,812 2,942 167 -6,973 118,670
Net fee and commission income/expense 3,682 8,789 -31 – – 12,439
Net trading income/expense -1,449 549 – – – -900
General administrative expenses -54,911 -40,727 -3,574 -7,282 12,253 -94,240
Net other operating expenses/income 16,715 1,424 5,405 10,381 -13,849 20,076
Net gains or losses on financial assets 61,996 247 -7 – 2 62,238
Net gains or losses on hedges 490 -108 – – – 382
Net gains or losses on other financial investments 18 – 46 41 -150 -46
Profit before tax 115,264 3,986 4,780 3,307 -8,718 118,619
income tax expense -29,105
Profit for the year 89,514
Non-controlling interests -46
Profit attributable to owners of the parent 89,468

194 | NOTES
9.1.2 Segment assets and liabilities
Although HYPO NOE Landesbank has a profit and loss transfer agreement with HYPO NOE Gruppe Bank AG, the deferred tax arising from temporary differences is attributed to the Landesbank segment.
31 Dec. 2012 EUR ’000Gruppe
Bank Landesbank Leasing OtherConsolida-
tion total
assets
Cash and balances at central banks 35,118 36,521 – 4 – 71,644
Loans and advances to banks 1,365,168 129,446 53,034 9,602 -662,933 894,317
Loans and advances to customers 8,843,526 1,918,019 1,403,974 1,125 -1,431,567 10,735,077
Risk provisions -37,230 -74,819 -791 -59 – -112,899
Assets held for trading 607,414 205 – – -205 607,414
Positive fair value of hedges (hedge accounting) 602,800 39,135 – – -24,000 617,935
Available-for-sale financial assets 1,926,467 321,980 6,226 4,260 -433,333 1,825,600
financial assets designated as at fair value through profit or loss 4,662 – – – – 4,662
financial assets held to maturity 10,009 – – – – 10,009
investments accounted for us-ing the equity method 35,926 1,385 12,000 4,203 – 53,514
investment property – – 10,149 42,106 – 52,256
intangible assets 1,009 85 85 1,014 – 2,194
Property, plant and equipment 8,071 7,750 659 51,027 – 67,507
Tax assets – 4,384 580 378 – 5,342
Other assets 15,285 3,328 44,895 10,980 -47,364 27,125
total assets 13,418,226 2,387,420 1,530,811 124,640 -2,599,401 14,861,697
equity and liabilities
Deposits from banks 2,707,239 570,533 1,372,798 100,747 -2,034,030 2,717,286
Deposits from customers 1,102,732 1,213,511 273 22 -62,082 2,254,455
Debts evidenced by certificates 7,770,234 424,066 364 – -283,314 7,911,349
Liabilities held for trading 525,048 200 – – -205 525,043
Negative fair value of hedges (hedge accounting) 611,780 5,850 – – -24,000 593,630
Provisions 32,656 13,143 548 1,401 – 47,748
Tax liabilities 20,041 – 13,166 760 – 33,968
Other liabilities 27,597 16,400 27,173 12,839 -5,769 78,241
Subordinated capital 190,583 51,852 – – -40,000 202,435
Equity (inc. non-controlling interests) 430,316 91,866 116,489 8,871 -150,001 497,542
Equity attributable to owners of the parent 430,316 91,866 115,924 8,871 -150,001 496,977
Non-controlling interests – – 565 – – 565
total equity and liabilities 13,418,226 2,387,420 1,530,811 124,640 -2,599,401 14,861,697

HYPO NOE GROUP ANNUAL REPORT 2012 | 195
31 Dec. 2011 EUR ’000Gruppe
Bank Landesbank Leasing OtherConsolida-
tion total
assets
Cash and balances at central banks 53,411 25,328 – – – 78,739
Loans and advances to banks 1,148,086 70,523 53,175 10,106 -694,892 583,997
Loans and advances to customers 7,769,141 1,958,530 1,344,676 126 -1,369,995 9,702,478
Risk provisions -22,528 -80,688 -790 – – -104,006
Assets held for trading 471,079 237 – – -236 471,080
Positive fair value of hedges (hedge accounting) 464,152 23,273 – – -15,615 471,809
Available-for-sale financial assets 1,943,959 318,689 6,263 4,193 -435,925 1,837,180
financial assets designated as at fair value through profit or loss 4,560 – – – – 4,560
financial assets held to maturity 15,031 – – – – 15,031
investments accounted for us-ing the equity method 34,147 1,377 12,418 – – 47,942
investment property – – 244 43,167 – 43,411
intangible assets 541 74 142 8 – 765
Property, plant and equipment 6,899 5,945 568 21,826 – 35,237
Tax assets 17,926 3,873 1,295 187 – 23,282
Other assets 9,537 4,485 47,635 8,180 -48,284 21,553
total assets 11,912,940 2,331,645 1,465,626 87,793 -2,564,947 13,233,058
equity and liabilities
Deposits from banks 2,383,737 603,818 1,318,906 81,601 -2,003,601 2,384,461
Deposits from customers 1,390,362 1,146,116 357 – -63,425 2,473,410
Debts evidenced by certificates 6,719,575 403,558 503 – -291,885 6,831,752
Liabilities held for trading 380,484 226 – – -236 380,474
Negative fair value of hedges (hedge accounting) 417,067 8,464 – – -15,615 409,916
Provisions 34,539 11,483 474 364 – 46,859
Tax liabilities 8,850 – 11,961 51 – 20,862
Other liabilities 24,057 14,307 17,271 2,455 -6,145 51,945
Subordinated capital 190,707 51,537 – – -40,000 202,244
Equity (inc. non-controlling interests) 363,562 92,137 116,154 3,322 -144,040 431,135
Equity attributable to owners of the parent 363,562 92,137 115,626 3,322 -144,040 430,608
Non-controlling interests – – 527 – – 527
total equity and liabilities 11,912,940 2,331,645 1,465,626 87,793 -2,564,947 13,233,058

196 | NOTES
9.2 GeOGraPhiCaL infOrmatiOnThe table below breaks the main balance sheet items down into domestic and foreign business.
The geographical presentation analyses the debts evidenced by certificates that relate to listed securities by the countries of issue.
eur ’000
31 Dec. 2012 31 Dec. 2011
Domestic foreign Domestic foreign
Loans and advances to banks 219,558 674,759 111,209 472,788
Loans and advances to customers 9,134,166 1,600,911 8,187,506 1,514,972
Available-for-sale financial assets 809,808 1,015,793 839,498 997,682
financial assets designated as at fair value through profit or loss 4,140 521 4,056 504
financial assets held to maturity – 10,009 – 15,031
Deposits from banks 1,123,774 1,593,513 1,656,345 728,116
Deposits from customers 1,457,469 796,986 1,421,985 1,051,425
Debts evidenced by certificates 2,873,359 5,037,990 2,695,457 4,136,295

HYPO NOE GROUP ANNUAL REPORT 2012 | 197
10. SUPPLEmENTARY iNfORmATiON
10.1 anaLysis Of assets By maturities
eur ’000 31 Dec. 2012 31 Dec. 2011
Loans and advances to banks
Repayable on demand 74,882 177,210
Up to 3 months 641,273 224,395
from 3 months to 1 year 15,219 7,606
from 1 to 5 years 80,745 47,917
Over 5 years 82,198 126,869
total 894,317 583,997
Loans and advances to customers
Repayable on demand 228,502 227,421
Up to 3 months 278,124 301,588
from 3 months to 1 year 698,303 703,358
from 1 to 5 years 3,100,621 2,801,705
Over 5 years 6,429,528 5,668,406
total 10,735,077 9,702,478
assets held for trading
Repayable on demand – –
Up to 3 months – –
from 3 months to 1 year – 286
from 1 to 5 years 31,259 8,434
Over 5 years 576,155 462,359
total 607,414 471,080
financial assets (held to maturity, available for sale or designated as at fair value through profit or loss)
Repayable on demand or no fixed term 4,444 19,357
Up to 3 months 53,718 32,234
from 3 months to 1 year 148,909 168,933
from 1 to 5 years 1,043,032 702,493
Over 5 years 590,168 933,754
total 1,840,271 1,856,770
Positive fair value of derivatives (hedge accounting and economic hedges)
Repayable on demand – –
Up to 3 months 248 294
from 3 months to 1 year 6,333 16,086
from 1 to 5 years 392,616 96,931
Over 5 years 218,937 358,648
total 618,134 471,959

198 | NOTES
10.2 anaLysis Of LiaBiLities By maturities
eur ’000 31 Dec. 2012 31 Dec. 2011
Deposits from banks
Repayable on demand or no fixed term 55,641 52,004
Up to 3 months 937,005 976,143
from 3 months to 1 year 159,985 488,900
from 1 to 5 years 1,228,313 219,960
Over 5 years 336,341 647,453
total 2,717,286 2,384,461
Deposits from customers
Repayable on demand or no fixed term 669,272 592,434
Up to 3 months 229,624 242,599
from 3 months to 1 year 450,415 252,725
from 1 to 5 years 794,145 441,832
Over 5 years 111,000 943,820
total 2,254,455 2,473,410
Debts evidenced by certificates
Repayable on demand or no fixed term 603 682
Up to 3 months 398,414 46,763
from 3 months to 1 year 531,919 989,493
from 1 to 5 years 4,226,356 2,284,511
Over 5 years 2,754,056 3,510,303
total 7,911,349 6,831,752
Liabilities held for trading
Repayable on demand or no fixed term – –
Up to 3 months 9 –
from 3 months to 1 year – 262
from 1 to 5 years 24,292 6,708
Over 5 years 500,741 373,504
total 525,043 380,474
Other assets (inc. economic hedges)
Repayable on demand or no fixed term 9,184 9,842
Up to 3 months 14,455 9,137
from 3 months to 1 year 1,939 608
from 1 to 5 years 668 700
Over 5 years 879 1,267
total 27,125 21,555

HYPO NOE GROUP ANNUAL REPORT 2012 | 199
negative fair value of derivatives (hedge accounting and economic hedges)
Repayable on demand or no fixed term – –
Up to 3 months 480 446
from 3 months to 1 year 2,709 819
from 1 to 5 years 65,852 37,872
Over 5 years 524,959 371,204
total 594,001 410,341
Other liabilities (inc. economic hedges)
Repayable on demand or no fixed term 14,011 11,687
Up to 3 months 15,803 6,764
from 3 months to 1 year 16,173 12,371
from 1 to 5 years 26,886 14,649
Over 5 years 5,367 6,474
total 78,241 51,945
subordinated capital
Repayable on demand or no fixed term – –
Up to 3 months – –
from 3 months to 1 year – –
from 1 to 5 years 202,435 –
Over 5 years – 202,244
total 202,435 202,244

200 | NOTES
10.3 fair vaLue DisCLOsures in aCCOrDanCe with ifrs 7The disclosures regarding the nature and extent of the risks associated with financial instruments (paragraphs 31–42 ifRS 7), the sensitivity analysis and the other disclosures required by ifRS 7 form part of the risk report contained in the opera-tional an cd financial review.
All the obligations to pay principal and interest were met during the reporting period, and there were no indications of defaults as at the end of the reporting period.
10.3.1 fair value of financial instruments
fair value is the amount for which a financial instrument could be exchanged between knowledgeable, willing parties in an arm’s length transaction. Where market prices are available they are used to estimate fair value. in the absence of market prices, accepted, industry-standard valuation models are employed. The present value of derivatives (e.g. interest rate swaps, cross currency swaps, fX forwards and forward rate agreements) is calculated by discounting the replicating cash flows. OTC currency and interest rate options are measured using option pricing models such as the Black Scholes, Hull White or LiBOR market models.
eur ’000
31 Dec. 2012 31 Dec. 2011
fair value Carrying amount fair value Carrying amount
assets
Loans and advances to banks 1,010,325 894,317 583,546 583,997
Loans and advances to customers* 10,519,730 10,627,155 9,718,140 9,603,470
Assets held for trading 607,414 607,414 471,080 471,080
Positive fair value of hedges 617,935 617,935 471,809 471,809
Available-for-sale financial assets 1,825,600 1,825,600 1,837,180 1,837,180
financial assets designated as at fair value through profit or loss 4,662 4,662 4,560 4,560
financial assets held to maturity 10,022 10,009 15,041 15,031
investments accounted for using the equity method 53,514 53,514 47,942 47,942
investment property 53,149 52,256 44,431 43,411
Sundry other assets – positive fair value of derivatives 199 199 150 150
total assets 14,702,550 14,693,061 13,193,879 13,078,630
Liabilities
Deposits from banks 2,684,195 2,717,286 2,358,550 2,384,461
Deposits from customers 2,348,659 2,254,455 2,500,668 2,473,410
Debts evidenced by certificates 7,926,862 7,911,349 7,482,017 6,831,752
Liabilities held for trading 525,043 525,043 380,474 380,474
Negative fair value of hedges 593,630 593,630 409,916 409,916
Other liabilities – negative fair value of derivatives 371 371 425 425
Subordinated capital 204,150 202,435 203,187 202,244
total liabilities 14,282,910 14,204,569 13,335,237 12,682,682
* Carrying value of loans and advances to customers (individually impaired)

HYPO NOE GROUP ANNUAL REPORT 2012 | 201
Reference is made to explanatory Note 3.9 investment property for information on the fair value measurement of invest-ment property (iAS 40).
The year-on-year changes in fair value are principally due to volume effects, and to the changeover from the internal income method of calculating fair value to the use of external market values based on a weighting of cost and income ap-proaches.
10.3.2 fair value hierarchy disclosures
ifRS 7 applies to the categories of financial instruments established by iAS 39, as well as those recognised in accordance with other standards, and unrecognised instruments. Under ifRS 7 these financial instruments must be grouped into classes that are appropriate to the nature of the information disclosed and that take into account the characteristics of the instruments concerned.
fair value measurements must be classified using a fair value hierarchy with the following levels:
Level 1: Quoted prices in active markets
These are quoted prices in active markets for identical assets or liabilities, and mainly apply to exchange-traded underlying instruments and derivatives.
Level 2: valuation techniques based on observable inputs
Here, measurement is based on inputs other than the quoted prices included within Level 1 that are observable for the asset or liability, either directly (i.e. as prices) or indirectly (i.e. derived from prices). This chiefly applies to OTC derivatives (assets and liabilities held for trading, and hedges) and unlisted securities.
Level 3: valuation techniques not based on observable inputs
Here, use is made of inputs for the asset or liability that are not based on observable market data (unobservable inputs). in this model, measurement is based on management’s assumptions and assessments, which depend on the price transpar-ency and complexity of the financial instrument. This mainly applies to asset-backed securities and investments (see Note 3.2 investments for a list of AfS investments in which the Group holds interests of over 20%).

202 | NOTES
There were no material reclassifications from Level 1 to Level 2 in 2012. Reclassifications from Level 2 to Level 1 related to financial instruments for which it is now possible to directly derive the fair value from prices quoted on active liquid markets. The changes in the amounts at Level 1 and Level 2 largely relate to new and matured transactions, and disposals. Note 10.3.3 “fair value hierarchy: Level 3 disclosures” contains detailed information on Level 3 of the fair value hierarchy.
31 Dec. 2012 EUR ’000 total fair value
fair value measurement
Level 1 Level 2 Level 3
assets
Assets held for trading 607,414 – 17,926 589,488
Positive fair value of hedges 617,935 – 617,935 –
Available-for-sale financial assets 1,825,600 1,186,624 631,647 7,328
financial assets designated as at fair value through profit or loss 4,662 – 4,662 –
Sundry other assets – positive fair value of derivatives 199 – 199 –
total assets 3,055,810 1,186,624 1,272,369 596,816
Liabilities
Liabilities held for trading 525,043 – 519,610 5,433
Negative fair value of hedges 593,630 – 593,630 –
Other liabilities – negative fair value of derivatives 371 – 371 –
total liabilities 1,119,043 – 1,113,611 5,433
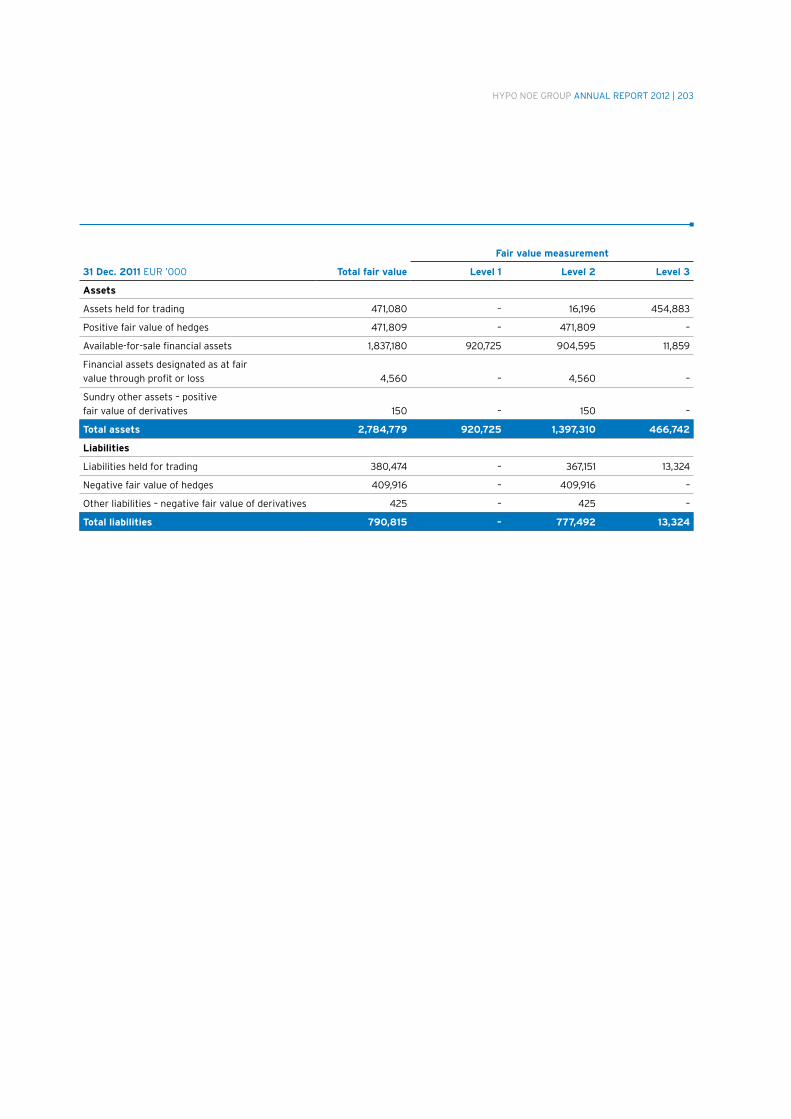
HYPO NOE GROUP ANNUAL REPORT 2012 | 203
31 Dec. 2011 EUR ’000 total fair value
fair value measurement
Level 1 Level 2 Level 3
assets
Assets held for trading 471,080 – 16,196 454,883
Positive fair value of hedges 471,809 – 471,809 –
Available-for-sale financial assets 1,837,180 920,725 904,595 11,859
financial assets designated as at fair value through profit or loss 4,560 – 4,560 –
Sundry other assets – positive fair value of derivatives 150 – 150 –
total assets 2,784,779 920,725 1,397,310 466,742
Liabilities
Liabilities held for trading 380,474 – 367,151 13,324
Negative fair value of hedges 409,916 – 409,916 –
Other liabilities – negative fair value of derivatives 425 – 425 –
total liabilities 790,815 – 777,492 13,324

204 | NOTES
10.3.3 fair value hierarchy: Level 3 disclosures
eur ’000as at 1
Jan. 2012
Gains or losses
Purchases settlementsas at 31
Dec. 2012
Gains/losses recognised in
profit and loss for assets
held as at 31 Dec. 2012
in profit or loss
in other compre-hensive income
assets
Assets held for trading 454,883 134,605 – – – 589,488 139,075
Available-for-sale financial assets 11,859 -633 34 – -3,932 7,328 -482
total assets 466,742 133,972 34 – -3,932 596,816 138,593
Liabilities
Liabilities held for trading 13,324 -7,891 – – – 5,433 4,550
total liabilities 13,324 -7,891 – – – 5,433 4,550
The loss on existing Level 3 assets, at EUR 482thsd (2011: EUR 542thsd), is shown under Note 7.9 “Net gains and losses on available-for-sale financial assets”. The gains of EUR 139,075thsd (2011: EUR 236,584thsd) on assets held for trading and of EUR 4,550thsd (2011: loss of EUR 3,292thsd) on liabilities held for trading are reported under Note 7.6 “Net trading income”.
eur ’000as at 1
Jan. 2011
Gains or losses
Purchases settlementsas at 31
Dec. 2011
Gains/losses recognised in
profit and loss for assets
held as at 31 Dec. 2011
in profit or loss
in other compre-hensive income
assets
Assets held for trading 222,173 232,710 – – – 454,883 236,584
Available-for-sale financial assets 34,310 -542 283 257 -22,449 11,859 -542
total assets 256,483 232,168 283 257 -22,449 466,742 236,042
Liabilities
Liabilities held for trading 13,406 -83 – – – 13,324 -3,292
total liabilities 13,406 -83 – – – 13,324 -3,292

HYPO NOE GROUP ANNUAL REPORT 2012 | 205
10.4 DerivativesVirtually all of the derivative financial instruments are hedges of the Bank’s own assets and liabilities, or customer deriva-tives.
most hedging activities related to interest rate and exchange risk in respect of the Bank’s own issues and securities, and promissory notes including certificates of deposit. interest rate and cross currency swaps were used to hedge these instru-ments from the time of designation through to the maturity of underlying transaction in question. Customer derivatives and related hedges are classified as held for trading.
Currency swaps and forwards are used as economic hedges for currency positions.
There are also bought and sold put options on own securities and issues in circulation, and a bought put option on an investment.
The cumulative dollar offset method is used for retrospective measurement of hedge effectiveness, and regression analy-sis for prospective measurement.
Where market prices are available they are used to estimate fair value. in the absence of market prices, accepted, industry-standard valuation models are employed. The present value of linear derivatives (e.g. interest rate swaps, cross currency swaps, fX forwards and forward rate agreements) is calculated by discounting the replicating cash flows. OTC currency and interest rate options are measured using option pricing models such as the Black Scholes, Hull White or LiBOR market models.
10.4.1 Derivatives: nominal and fair value
eur ’000
31 Dec. 2012 31 Dec. 2011
nominal value
fair value nominal value
fair value
Positive negative Positive negative
interest rate risk
interest rate swaps 15,339,806 1,138,030 1,090,640 13,637,281 827,658 759,528
Basis swaps 852,045 27,728 10,305 1,175,705 20,181 3,849
Options on interest rate instruments 550,089 6,072 6,067 675,781 15,293 14,855
Other similar contracts 20,000 12,976 – 20,000 9,556 –
total 16,761,940 1,184,805 1,107,011 15,508,767 872,688 778,232
Currency risk
Cross-currency (interest rate) swaps 235,194 40,321 11,662 375,798 69,295 11,911
forward exchange operations 137,238 199 371 111,028 351 584
total 372,432 40,521 12,033 486,825 69,646 12,495
share price and index-linked transactions
Equity and other index-linked options 2,001 223 – 7,501 705 88
total 2,001 223 – 7,501 705 88

206 | NOTES
10.4.2 Derivatives: nominal value by maturities
31 Dec. 2012 EUR ’000 total
remaining terms to maturity
up to 3 months
from 3 months to
1 yearfrom 1 to
5 years Over 5 years
interest rate risk
interest rate swaps 15,339,806 51,567 657,041 4,864,174 9,767,024
Basis swaps 852,045 40,000 – 621,090 190,955
Options on interest rate instruments 550,089 – – 395,768 154,321
Other similar contracts 20,000 – – 20,000 –
total 16,761,940 91,567 657,041 5,901,032 10,112,300
Currency risk
Cross-currency (interest rate) swaps 235,194 – 7,579 180,876 46,739
forward exchange operations 137,238 137,238 – – –
total 372,432 137,238 7,579 180,876 46,739
share price and index-linked transactions
Equity and other index-linked options 2,001 – – 2,001 –
total 2,001 – – 2,001 –
31 Dec. 2011 EUR ’000 total
remaining terms to maturity
up to 3 months
from 3 months to
1 yearfrom 1 to
5 years Over 5 years
interest rate risk
interest rate swaps 13,637,281 4,000 657,140 3,041,314 9,934,827
Basis swaps 1,175,705 50,000 292,500 237,590 595,615
Options on interest rate instruments 675,781 – – 34,741 641,040
Other similar contracts 20,000 – – – 20,000
total 15,508,767 54,000 949,640 3,313,645 11,191,482
Currency risk
Cross-currency (interest rate) swaps 375,798 – 123,396 82,662 169,739
forward exchange operations 111,028 92,704 18,323 – –
total 486,825 92,704 141,719 82,662 169,739
share price and index-linked transactions
Equity and other index-linked options 7,501 – 5,500 2,001 –
total 7,501 – 5,500 2,001 –

HYPO NOE GROUP ANNUAL REPORT 2012 | 207
10.5 anaLyses Of assets anD LiaBiLities By ias 39 measurement CateGOries anD CurrenCies
10.5.1 Analysis of assets and liabilities by iAS 39 measurement categories
in eur ’000, as at 31 Dec. 2012
Loans and receivables
(Lar)
Liabilities measured at
amortised cost (LaC)
held for trading
(hft)
Designated as at fair value
through profit or loss (fvO)
available for sale
(afs)
held to maturity
(htm)fair value
hedgeCash flow
hedge
financial assets/liabilities
at cost (at amortised cost) total
Cash and balances at central banks
– – – – – – – – 71,644 71,644
Loans and advances to banks 894,317 – – – – – – – – 894,317
Loans and advances to customers
10,735,077 – – – – – – – – 10,735,077
Risk provisions -112,899 – – – – – – – – -112,899
Assets held for trading – – 607,414 – – – – – – 607,414
Positive fair value of hedges – – – – – – 615,436 2,499 – 617,935
Available-for-sale financial assets – – – – 1,825,600 – – – – 1,825,600
financial assets designated as at fair value through profit or loss – – – 4,662 – – – – – 4,662
financial assets held to maturity – – – – – 10,009 – – – 10,009
investments accounted for using the equity method – – – – – – – – 53,514 53,514
investment property – – – – – – – – 52,256 52,256
Positive fair value of banking book derivatives1 – – 199 – – – – – – 199
Other financial assets1 25,537 – – – – – – – – 25,537
total financial assets 11,542,032 – 607,613 4,662 1,825,600 10,009 615,436 2,499 177,414 14,785,264
Deposits from banks – 2,717,286 – – – – – – – 2,717,286
Deposits from customers – 2,254,455 – – – – – – – 2,254,455
Debts evidenced by certificates – 7,911,349 – – – – – – – 7,911,349
Liabilities held for trading – – 525,043 – – – – – – 525,043
Negative fair value of hedges – – – – – – 593,630 – – 593,630
Subordinated capital – 202,435 – – – – – – – 202,435
Negative fair value of banking book derivatives1 – – 371 – – – – – – 371
Other financial liabilities1 – 69,089 – – – – – – – 69,089
total financial liabilities – 13,154,613 525,414 – – – 593,630 – – 14,273,657

208 | NOTES
in eur ’000, as at 31 Dec. 2011
Loans and receiva-
bles (Lar)
Liabilities measured at
amortised cost (LaC)
held for trading
(hft)
Designated as at fair
value through profit or
loss (fvO)
available for sale
(afs)
held to maturity
(htm)fair value
hedge
Cash flow
hedge
financial as-sets/liabilities
at cost (at amortised cost) total
Cash and balances at central banks – – – – – – – – 78,739 78,739
Loans and advances to banks 583,997 – – – – – – – – 583,997
Loans and advances to customers 9,702,478 – – – – – – – – 9,702,478
Risk provisions -104,006 – – – – – – – – -104,006
Assets held for trading – – 471,080 – – – – – – 471,080
Positive fair value of hedges – – – – – – 468,353 3,456 – 471,809
Available-for-sale financial assets – – – – 1,837,180 – – – – 1,837,180
financial assets designated as at fair value through profit or loss – – – 4,560 – – – – – 4,560
financial assets held to maturity – – – – – 15,031 – – – 15,031
investments accounted for using the equity method – – – – – – – – 47,942 47,942
investment property – – – – – – – – 43,411 43,411
Positive fair value of banking book derivatives1 – – 150 – – – – – – 150
Other financial assets1 19,022 – – – – – – – – 19,022
total financial assets 10,201,491 – 471,230 4,560 1,837,180 15,031 468,353 3,456 170,092 13,171,393
Deposits from banks – 2,384,461 – – – – – – – 2,384,461
Deposits from customers – 2,473,410 – – – – – – – 2,473,410
Debts evidenced by certificates – 6,831,752 – – – – – – – 6,831,752
Liabilities held for trading – – 380,474 – – – – – – 380,474
Negative fair value of hedges – – – – – – 409,916 – – 409,916
Subordinated capital – 202,244 – – – – – – – 202,244
Negative fair value of banking book derivatives1 – – 425 – – – – – – 425
Other financial liabilities1 – 40,554 – – – – – – – 40,554
total financial liabilities – 11,932,421 380,899 – – – 409,916 – – 12,723,236
1 Shown under "Other assets" or "Other liabilities" in the statement of financial position.

HYPO NOE GROUP ANNUAL REPORT 2012 | 209
10.5.2 Analysis of assets and liabilities by currencies
31 Dec. 2012 EUR ’000 Chf usD JPy CZK PLn seK huf GBP eur
Other curren-
cies total
Cash and balances at central banks 63 27 1 11 1 1 11 12 71,413 104 71,644
Loans and advances to banks 24,392 639 728 207 614 231 994 908 865,328 276 894,317
Loans and advances to customers 702,651 1,763 12,291 6,783 7,497 10,237 – 53,110 9,940,745 – 10,735,077
Risk provisions -7,999 -9 -36 -1 -9 -5 -3 -22 -104,815 – -112,899
Assets held for trading 8,754 – – – – – – – 598,660 – 607,414
Positive fair value of hedges (hedge accounting) 124,844 272 31,479 – 2,319 – – – 459,021 – 617,935
Available-for-sale financial assets – 25,493 – – – – 76 – 1,799,979 52 1,825,600
financial assets designated as at fair value through profit or loss – – – – – – – – 4,662 – 4,662
financial assets held to maturity – – – – – – – – 10,009 – 10,009
investments accounted for using the equity method – – – – – – – – 53,514 – 53,514
investment property 2,785 – – – – – – – 49,471 – 52,256
intangible assets – – – – – – – – 2,194 – 2,194
Property, plant and equipment – – – – – – – – 67,507 – 67,507
Tax assets – – – – – – – – 5,342 – 5,342
Other assets 6,398 117 – – – – 1 4 20,590 15 27,125
total assets 861,888 28,302 44,463 7,000 10,422 10,464 1,079 54,012 13,843,620 447 14,861,697
31 Dec. 2012 EUR ’000 Chf usD JPy CZK PLn seK huf GBP eur
Other curren-
cies total
Deposits from banks 69,373 398 12,326 – – – – 14 2,635,175 – 2,717,286
Deposits from customers 20 1,744 93,839 286 – 108 966 1 2,157,163 328 2,254,455
Debts evidenced by certificates 1,398,913 6,983 47,141 – 14,860 – – – 6,443,452 – 7,911,349
Liabilities held for trading 8,287 – – – – – – – 516,756 – 525,043
Negative fair value of hedges (hedge accounting) 15,008 4,101 – 183 – – – – 574,338 – 593,630
Provisions – – – – – – – – 47,748 – 47,748
Tax liabilities 18 – – – – – – – 33,950 – 33,968
Other liabilities 6,363 14 – – – 25 – 330 71,507 2 78,241
Subordinated capital – – – – – – – – 202,435 – 202,435
Equity (inc. non-controlling interests) – – – – – – – – 497,433 109 497,542
total equity and liabilities 1,497,982 13,240 153,306 469 14,860 133 966 345 13,179,957 439 14,861,697
The surplus of CHf-denominated liabilities was due to the refinancing of lease receivables for which host contracts were concluded in Swiss francs and which form part of the lease payment together with the costs associated with currency risk.
The surplus of JPY liabilities resulted from JPY deposits which were hedged using currency forwards.

210 | NOTES
31 Dec. 2011 EUR ’000 Chf usD JPy CZK PLn seK huf GBP eurOther
currencies total
Cash and balances at central banks 24 27 3 4 – 6 5 12 78,637 22 78,739
Loans and advances to banks 38,449 500 577 535 410 285 911 357 541,711 263 583,997
Loans and advances to customers 752,792 1,797 15,864 7,205 6,836 9,858 – 51,744 8,856,382 – 9,702,478
Risk provisions -10,518 – -1,116 – -7 -4 – -77 -92,284 – -104,006
Assets held for trading 8,918 – 1,147 – 314 – – – 460,701 – 471,080
Positive fair value of hedges (hedge accounting) 143,427 501 49,478 – – – – – 278,403 – 471,809
Available-for-sale financial assets – 25,642 – – – – – – 1,811,538 – 1,837,180
financial assets designated as at fair value through profit or loss – – – – – – – – 4,560 – 4,560
financial assets held to maturity – – – – – – – – 15,031 – 15,031
investments accounted for using the equity method – – – – – – – – 47,942 – 47,942
investment property 2,860 – – – – – – – 40,551 – 43,411
intangible assets – – – – – – – – 765 – 765
Property, plant and equipment – – – – – – – – 35,237 – 35,237
Tax assets – – – – – – – – 23,282 – 23,282
Other assets 142 69 – – – – – 2 21,340 – 21,554
total assets 936,094 28,536 65,953 7,743 7,554 10,146 915 52,038 12,123,794 284 13,233,058
31 Dec. 2011 EUR ’000Chf usD JPy CZK PLn seK huf GBP eur
Other currencies
total
Deposits from banks 30,169 18 -18 – – – – – 2,354,291 – 2,384,461
Deposits from customers 68,645 1,545 107,244 278 – 104 3,114 7 2,292,279 194 2,473,410
Debts evidenced by certificates 1,643,484 7,499 41,721 – 12,743 – – – 5,126,305 – 6,831,752
Liabilities held for trading 2,272 – – – – – 159 – 378,043 – 380,474
Negative fair value of hedges (hedge accounting) 13,822 657 – – – – – – 395,437 – 409,916
Provisions – – – – – – – – 46,859 – 46,859
Tax liabilities – – – – – – – – 20,862 – 20,862
Other liabilities – 56 230 2 – 70 – – 51,587 – 51,945
Subordinated capital – – – – – – – – 202,244 – 202,244
Equity (inc. non-controlling interests) – – – – – – – – 431,135 – 431,135
total equity and liabilities 1,758,392 9,775 149,177 279 12,743 174 3,274 7 11,299,042 194 13,233,058

HYPO NOE GROUP ANNUAL REPORT 2012 | 211
10.6 DisCLOsures On reLateD Party reLatiOnshiPs
During the period under review, EUR 12thsd was recognised as expenses in respect of bad or doubtful debts due from related parties.
The transfer prices charged to each other by HYPO NOE Gruppe AG and related parties are at normal market levels. The non-consolidated subsidiaries and investments accounted for using the equity method are set out in Note 3.2 “invest-ments”.
The Lower Austrian state government holds a direct interest of 70.49% in HYPO NOE Gruppe Bank AG via NÖ Landes-Beteiligungsholding GmbH, and an indirect interest of 29.51% via NÖ BET GmbH.
As at 31 December 2012, loans to the state government of Lower Austria amounted to EUR 1,893,229thsd (including the present value of lease receivables totalling EUR 1,079,920thsd). Receivables from the positive fair value of derivatives (with a nominal value of EUR 215m) were EUR 52,560thsd and credit lines worth EUR 446,874thsd remained unutilised.
Lower Austrian state government guarantees of loans and advances extended to third parties by HYPO NOE Gruppe Bank AG totalled EUR 3,259,407thsd as at 31 December 2012. All of these transactions were concluded on normal market terms and conditions. Use is made of the exemption from disclosure requirements under paragraph 25 iAS 24 in conjunction with paragraph 18 iAS 24.
31 Dec. 2012 EUR ’000non-consolidated
subsidiaries (>50%) associates
investments accounted
for using the equity method
Key management
personnel
Loans and advances to banks – – 750 –
Loans and advances to customers 102,049 12,754 152,336 2,165
Equity instruments (shareholdings, etc.) 146 539 53,514 –
Deposits from banks – – 295 –
Deposits from customers 1,225 1,504 5,251 5,356
Guarantees provided by the Group – – – 14
Other obligations (to related parties) 4,182 2,750 376,473 –
Provisions for doubtful debts – – -5 -7
31 Dec. 2011 EUR ’000
Loans and advances to banks – – 1 –
Loans and advances to customers 103,064 12,868 159,359 1,953
Equity instruments (shareholdings, etc.) 226 475 47,942 –
Deposits from banks – – 333 –
Deposits from customers 2,456 851 5,468 5,497
Guarantees provided by the Group – – – 7
Other obligations (to related parties) 6,857 2,017 384,688 –
Provisions for doubtful debts – – – –

212 | NOTES
relationships with non-consolidated subsidiaries and associates
The Chairman of the management Board, Dr. Peter Harold, is a member of the supervisory board of NÖ Kulturwirtschaft GesmbH, St. Pölten.
members of the Bank’s key management personnel are chief executives at the following companies: Castellum Schallaburg Grundstückvermietungs Gesellschaft m.b.H., ViA DOmiNORUm Grundstückverwertungs Gesellschaft m.b.H., WPS-Wirtschaftspark Sieghartskirchen Gesellschaft m.b.H, Wilax Wien-Laxenburg NÖ Veranstaltungs Gesellschaft mbH, NÖ Kul-turwirtschaft GesmbH, melker Kommunalimmobilienverwaltungs Gesellschaft m.b.H., Wohnpark Schrems Liegenschafts-verwertungs Gesellschaft m.b.H. – all domiciled in St. Pölten – as well as Pöchlarner Kommunalimmobilienverwaltungs Gesellschaft m.b.H., Pöchlarn, Loosdorfer Kommunalimmobilien Gesellschaft m.b.H., Loosdorf, and Schwarzauer Kommu-nalimmobilienverwaltungs Gesellschaft m.b.H., Schwarzau am Steinfelde.
A member of the Supervisory Board chairs the supervisory board of NÖ Kulturwirtschaft GesmbH, St. Pölten.
A member of the key management personnel serves on the supervisory board of ViA DOmiNORUm Grundstückverwer-tungs Gesellschaft m.b.H., St. Pölten.
relationships with entities accounted for using the equity method
The Chairman of the management Board, Dr. Peter Harold, chairs the supervisory board of EWU Wohnbau Unternehmens-beteiligungs-Aktiengesellschaft, Vienna, and the supervisory boards of its subsidiaries “Wohnungseigentümer” Gemein-nützige Wohnbaugesellschaft m.b.H., mödling, GEBAU-NiOBAU Gemeinnützige Baugesellschaft m.b.H., maria Enzersdorf am Gebirge, and Gemeinnützige Wohnungsgesellschaft “Austria” Aktiengesellschaft, mödling. Dr. Harold is also a member of the supervisory board of Niederösterreichische Vorsorgekasse AG, St. Pölten.
The other member of the management Board, Nikolai de Arnoldi, is chairman of the supervisory board of Niederösterrei-chische Vorsorgekasse AG, St. Pölten.
members of the Bank’s key management personnel hold office on the management boards of Niederösterreichische Vor-sorgekasse AG, St. Pölten and EWU Wohnbau Unternehmensbeteiligungs-Aktiengesellschaft, Vienna.
members of the Bank’s key management personnel are chief executives at the following companies:
CULiNA Grundstückvermietungs Gesellschaft m.b.H., fACiLiTAS Grundstückvermietungs Gesellschaft m.b.H., VALET-Grundstückverwaltungs Gesellschaft m.b.H., NÖ. HYPO LEASiNG - Sparkasse Region St. Pölten Grundstückvermietungs Gesellschaft m.b.H., LiTUS Grundstückvermietungs Gesellschaft m.b.H., CONATUS Grundstückvermietungs Gesellschaft m.b.H., UNDA Grundstückvermietungs Gesellschaft m.b.H., Palatin Grundstückverwaltungs Gesellschaft m.b.H., NÖ. Lande-shauptstadt - Planungsgesellschaft m.b.H., franz-Glaser-Gasse 28 immobilienentwicklung GmbH – all domiciled in St. Pölten – as well as TRABiTUS Grundstückvermietungs Gesellschaft m.b.H., Adoria Grundstückvermietungs Gesellschaft m.b.H., Esquilin Grundstücksverwaltungs Gesellschaft m.b.H., Purge Grundstücksverwaltungs-Gesellschaft m.b.H., Viminal Grund-stückverwaltungs Gesellschaft m.b.H., N.Ö. Gemeindegebäudeleasing Gesellschaft m.b.H., N.Ö. Kommunalgebäudeleasing Gesellschaft m.b.H., NÖ-KL Kommunalgebäudeleasing Gesellschaft m.b.H., Quirinal Grundstücksverwaltungs Gesellschaft m.b.H., fORiS Grundstückvermietungs Gesellschaft m.b.H. – all domiciled in Vienna – and Aventin Grundstückverwaltungs Gesellschaft m.b.H., Horn.
members of the Bank’s key management personnel are authorised signatories at the following companies:
CULiNA Grundstückvermietungs Gesellschaft m.b.H., VALET-Grundstückverwaltungs Gesellschaft m.b.H., Hotel- und Sport-stätten-Beteiligungs-, Errichtungs- und Betriebsgesellschaft m.b.H. Leasing KG, NÖ.HYPO LEASiNG - Sparkasse Region St. Pölten Grundstückvermietungs Gesellschaft m.b.H., LiTUS Grundstückvermietungs Gesellschaft m.b.H., CONATUS Grund-stückvermietungs Gesellschaft m.b.H., Palatin Grundstückverwaltungs Gesellschaft m.b.H. – all domiciled in St. Pölten – as well as Adoria Grundstückvermietungs Gesellschaft m.b.H., Esquilin Grundstücksverwaltungs Gesellschaft m.b.H., Viminal

HYPO NOE GROUP ANNUAL REPORT 2012 | 213
Grundstückverwaltungs Gesellschaft m.b.H., fORiS Grundstückvermietungs Gesellschaft m.b.H. – all domiciled in Vienna – and Aventin Grundstückverwaltungs Gesellschaft m.b.H., Horn.
members of key management hold office with NÖ Raiffeisen Kommunalprojekte Service Gesellschaft m.b.H. & NÖ.HYPO Leasinggesellschaft m.b.H. - Strahlentherapie OG and NÖ. HYPO Leasing und Raiffeisen-immobilien-Leasing Traisenhaus GesmbH & Co OG, both St. Pölten.
members of key management are members, chairmen or deputy chairmen of the supervisory boards of the following companies:
NÖ Beteiligungsfinanzierungen GmbH, HYPO Capital management AG, EWU Wohnbau Unternehmensbeteiligungs-Ak-tiengesellschaft – all domiciled in Vienna – as well as "Wohnungseigentümer" Gemeinnützige Wohnbauggesellschaft m.b.H., mödling and GEBAU-NiOBAU Gemeinnützige Baugesellschaft m.b.H., maria Enzersdorf am Gebirge.
One member of the Supervisory Board is deputy chairman of the supervisory board of Niederösterreichische Vorsorgekasse AG, St. Pölten.
relationships with parent companies
A member of the Supervisory Board chairs, and another member of the Supervisory Board is deputy chairman of the supervisory board of NÖ Landes-Beteiligungsholding GmbH, St. Pölten.
A supervisory commissioner of the Bank is the chief executive of NÖ BET GmbH and NÖ Landes-Beteiligungsholding GmbH, both domiciled in St. Pölten.
relationships with subsidiaries of the parent companies and companies owned by the Lower austrian state government
A member of the Bank’s key management personnel is the chief executive of Landesimmobiliengesellschaft m.b.H. and also holds office at tecnet Beteiligungs Holding GmbH & Co OG, both domiciled in St. Pölten.
The chairman of the Supervisory Board is the chairman of the supervisory board of EVN AG, maria Enzersdorf, and a mem-ber of the supervisory board of flughafen Wien AG (the operator of Vienna international Airport).
A member of the Supervisory Board is the chairman of the supervisory boards of EBG medAustron GmbH, Wiener Neustadt and ecoplus.Niederösterreichs Wirtschaftsagentur GmbH, St. Pölten, and deputy chairman of the supervisory board of N.vest Unternehmensfinanzierungen des Landes Niederösterreich GmbH, St. Pölten and of fachhochschule Wiener Neus-tadt für Wirtschaft und Technik Gesellschaft m.b.H. and RiZ Niederösterreichs Gründeragentur Ges.m.b.H., both domiciled in Wiener Neustadt.
A supervisory commissioner of the Bank is the chief executive of NÖ Holding GmbH and NÖ immobilien Holding GmbH – both domiciled in St. Pölten – and chairman of the supervisory board of Land Niederösterreich finanz- und Beteiligungs-management GmbH, St. Pölten, as well as deputy chairman of the supervisory boards of EBG medAustron GmbH, Wiener Neustadt and tecnet equity NÖ Technologiebeteiligungs-invest GmbH, St. Pölten, and a member of the supervisory board of EVN AG, maria Enzersdorf.
Key management in the HYPO NOE Group comprises “identified staff” and “identified staff with less material impact”.

214 | NOTES
10.8 trust transaCtiOnsin accordance with ifRS, trust transactions entered into by the HYPO NOE Group in its own name but for the account of third parties are not shown in the statement of financial position. Any commissions are reported under “Net fee and com-mission income” in the comprehensive income statement (Note 7.5, “Other fee and commission income” and “Other fee and commission expense”).
No trust transactions were reported in the statement of financial position as at 31 December 2012 or 31 December 2011.
10.9.2 Credit risk
eur ’000 31 Dec. 2012 31 Dec. 2011
Credit risk 1,364,204 1,284,930
10.9 COntinGent LiaBiLities, CreDit risK anD Latent LeGaL risK
10.9.1 Contingent liabilities
eur ’000 31 Dec. 2012 31 Dec. 2011
Acceptances and endorsements 327 327
Liabilities arising from guarantees and furnishing of collateral 149,564 132,741
10.7 assets PLeDGeD as COLLateraLAssets of EUR 3,408,336thsd (2011: EUR 4,313,619thsd) have been pledged to third parties as collateral for the Bank’s li-abilities in the amounts shown below. These assets are reported in the HYPO NOE Group’s statement of financial position.
eur ’000 31 Dec. 2012 31 Dec. 2011
Debts evidenced by certificates 3,408,336 4,313,619
total 3,408,336 4,313,619

HYPO NOE GROUP ANNUAL REPORT 2012 | 215
10.10 mOrtGaGe BanKinG in aCCOrDanCe with the PfanDBriefGesetZ (COvereD BOnD aCt)
31 Dec. 2012 EUR ’000Coverage required for debts
evidenced by certificates
Coverage of:
surplus coverageLoansfinancial
instruments
Covered bonds 56,207 1,464,490 10,000 1,418,283
Public sector covered bonds 3,420,296 3,951,353 211,035 742,092
total 3,476,503 5,415,843 221,035 2,160,375
31 Dec. 2011 EUR ’000Coverage required for debts
evidenced by certificates
Coverage of:
surplus coverageLoansfinancial
instruments
Covered bonds 46,993 1,128,879 10,000 1,091,886
Public sector covered bonds 2,548,959 3,221,733 124,010 796,784
total 2,595,952 4,350,612 134,010 1,888,670
10.11 suPPLementary DisCLOsure Pursuant tO seCtiOn 237(8a) austrian Business CODe in COnJunCtiOn with seCtiOn 64(1) BanKinG aCt
Joint and several liability for Pfandbriefstelle issuance
Under section 2(1) Pfandbriefstelle-Gesetz (Pfandbriefstelle Act), as member banks of Pfandbriefstelle der österreichischen Landes-Hypothekenbanken, HYPO NOE Gruppe Bank AG and HYPO NOE Landesbank AG are jointly and severally liable, together with the other members, for all the liabilities of Pfandbriefstelle. This liability is the same for all the member banks listed in section 1(2) of Pfandbriefstelle’s articles of association and their universal successors. Under section 2(2) Pfandbriefstelle Act, the members’ guarantors (the respective state governments) are likewise jointly and severally liable for all liabilities incurred up to 2 April 2003, and for all liabilities incurred after that date where the maturities do not extend beyond 30 September 2017. According to Pfandbriefstelle’s statutory audit report, the guarantors’ liabilities as at year-end 2012 were EUR 7,626,856thsd (31 Dec. 2011: EUR 9,043,020thsd). This is approximately equal to the entire liabilities of Pfandbriefstelle as at 31 December 2012. Taking into account the funds raised by Pfandbriefstelle and lent on to HYPO NOE Gruppe Bank AG, which totalled EUR 669,097thsd at the end of the reporting period (31 Dec. 2011: EUR 943,401thsd), this yields an amount of EUR 6,957,759thsd (31 Dec. 2011: EUR 8,110,619thsd) which must be disclosed pursuant to section 237(8a) Austrian Business Code.
Contingent liability of the state of Lower Austria
Under section 1356 ABGB (Civil Code), the state of Lower Austria is liable, as the deficiency guarantor, for all the liabili-ties incurred by HYPO NOE Gruppe Bank AG and HYPO NOE Landesbank AG up to and including 2 April 2003. Liabilities incurred between 3 April 2003 and 1 April 2007 are covered by the state government guarantee unless their maturities extend beyond 30 September 2017. The guarantee does not cover liabilities incurred after 1 April 2007 or falling due after 30 September 2017. As at 31 December 2012 state government guarantees of issues, deposits and other liabilities such as subordinated and supplementary capital totalled:
�EUR 5,119,434thsd (2011: EUR 5,481,593thsd) for HYPO NOE Gruppe Bank AG; �EUR 328,583thsd (2011: EUR 358,764thsd) for HYPO NOE Landesbank AG; and � a combined amount of EUR 5,448,017thsd (2011: EUR 5,840,357thsd) for both banks.

216 | NOTES
10.12 events after the rePOrtinG PeriODThe disclosures required by iAS 10 on events after the reporting period are part of the operational and financial review. There were no events after the end of the reporting period to 31 December 2012 that would have been material to the presentation of the Group’s assets, finances and earnings.
10.13 GOverninG BODies Of hyPO nOe GruPPe BanK aGThe following persons were members of the management and Supervisory boards during the reporting period:
management Board �Peter Harold, Chairman �Nikolai de Arnoldi, member
Supervisory Board �Burkhard Hofer, Chairman (since 1 January 2012) �michael Lentsch, Deputy Chairman (since 1 January 2012) �Klaus Schneeberger �Karl Schlögl �Karl Sonnweber �Engelbert J. Dockner (since 1 January 2012) �Hubert Schultes (since 1 January 2012)
Delegated by the Works Council �Hermann Haitzer �Peter Böhm �franz Gyöngyösi �franz Siegl (until 1 September 2012) �Claudia mikes (since 1 September 2012)
State commissioners �Hans Georg Kramer, CfP, federal ministry of finance (since 1 January 2012) �franz Ternyak, federal Accounting Agency
Supervisory commissioners �Reinhard meissl, office of the Lower Austrian state government �Helmut frank, office of the Lower Austrian state government
St. Pölten, 26 march 2013
The management Board
Dr. Peter harold nikolai de arnoldi Chairman of the management Board member of the management Board

HYPO NOE GROUP ANNUAL REPORT 2012 | 217
DECLARATiON BY THE COmPANY’S LEGAL REPRESENTATiVES
We hereby confirm that to the best of our knowledge the consolidated financial statements of HYPO NOE Gruppe Bank AG give a true and fair view of the Company’s assets, finances and earnings to the maximum extent possible, in conformity with the relevant accounting standards, that the operational and financial review presents the course of the Company’s business, and its results and financial condition in such a manner as to give a true and fair view of the Company's assets, fi-nances and earnings, and that that review describes the principal risks and uncertainties to which the Company is exposed.
St. Pölten, 26 march 2013
The management Board
Peter harold nikolai de arnoldi
Chairman of the management Board member of the management Board
Responsible for Responsible for Sales & Treasury, Participations & Public Services, Group Credit Risk Coordination, Group Organisation, iT & facility management, Group finance & Strategic Risk management, Group Real Estate Business, Unit Group ALm & Unit Group Tax Advisory, Group Credit Services, Strategic Planning, Unit Group Rating & investor Advisory, Ombudsman, Group Treasury Services, Group Human Resources, General Secretariat & Group Payment Administration & Group Compliance, Group Communications and Audit Custodian Bank Services and Group Legal

218 | AUDiTORS’ REPORT
AUDiTORS’ REPORT
rePOrt On the COnsOLiDateD finanCiaL statementsWe have audited the accompanying consolidated financial statements of HYPO NOE Gruppe Bank AG for the year ended 31 December 2012. These consolidated financial statements comprise the consolidated statement of comprehensive in-come for the year ended 31 December 2012, the consolidated statement of financial position as at 31 December 2011, the consolidated statement of changes in equity, the consolidated statement of cash flows for the fiscal year ended Decem-ber 31, 2012, and the Notes.
management’s Responsibility for the Consolidated financial Statements and for the Accounting Records
The Company’s management is responsible for the group accounting records and for the preparation and fair presenta-tion of these consolidated financial statements in accordance with international financial Reporting Standards (ifRSs) as adopted by the EU. This responsibility includes: designing, implementing and maintaining a system of internal controls relevant to the preparation and fair presentation of consolidated financial statements that are free from material mis-statement, whether due to fraud or error; selecting and applying appropriate accounting policies and making accounting estimates that are reasonable in the circumstances.
Auditor’s Responsibility and Description of Type and Scope of the Statutory Audit
Our responsibility is to express an opinion on these consolidated financial statements based on our audit. We conducted our audit in accordance with laws and regulations applicable in Austria and Austrian Standards on Auditing, as well as in accordance with international Standards on Auditing (iSAs) issued by the international Auditing and Assurance Standards Board (iAASB) of the international federation of Accountants (ifAC). These standards require that we comply with profes-sional guidelines and that we plan and perform the audit to obtain reasonable assurance whether the consolidated finan-cial statements are free from material misstatements.
An audit involves performing procedures to obtain audit evidence about the amounts and disclosures in the consolidated financial statements. The procedures selected depend on the auditor’s judgment, including the assessment of the risks of material misstatement of the consolidated financial statements, whether due to fraud or error. in making those risk assess-ments, the auditor considers the system of internal controls relevant to the Group’s preparation and fair presentation of the consolidated financial statements in order to design audit procedures that are appropriate in the circumstances, but not for the purpose of expressing an opinion on the effectiveness of the Group’s internal control. An audit also includes evaluating the appropriateness of accounting policies used and the reasonableness of accounting estimates made by management, as well as evaluating the overall presentation of the consolidated financial statements.
We believe that the audit evidence we have obtained is sufficient and appropriate to provide a reasonable basis for our audit opinion.
Opinion
Our audit did not give rise to any objections. in our opinion, which is based on the results of our audit, the consolidated financial statements comply with the legal requirements and give a true and fair view of the financial position of the Group as of December 31, 2012 and of its financial performance and its cash-flows for the fiscal year from January 1, 2012 to December 31, 2012, in accordance with international financial Reporting Standards (ifRSs) as adopted by the EU.
Comments on the Group management Report
Pursuant to statutory provisions, the management report for the Group is to be audited as to whether it is consistent with the consolidated financial statements and as to whether the other disclosures are not misleading with respect to the Company´s position. The auditor’s report also has to contain a statement as to whether the management report

HYPO NOE GROUP ANNUAL REPORT 2012 | 219
for the Group is consistent with the consolidated financial statements and whether the disclosures pursuant to section 243a para 2 UGB are appropriate.
in our opinion, the consolidated management report for the Group is consistent with the consolidated financial statements. The disclosures according to section 243a para 2 UGB are appropriate.
Vienna, march 27, 2013
Deloitte Audit Wirtschaftsprüfungs GmbH
Bruno moritz m.p. Tax consultant
ppa. wolfgang wurm m.p. Peter Bitzyk m.p. Certified public accountant Certified public accountant
The publication or transmission of the consolidated financial statements in a form different from the one we have audited is only permitted with our consent if in the course of doing so reference is made to our audit opinion or our audit. The audi-tor’s opinion only refers to the German version of the consolidated financial statements including the group management report. for any amended version the provisions of section 281 para 2 UGB need to be obeyed.

220 | REPORT Of THE SUPERViSORY BOARD

HYPO NOE GROUP ANNUAL REPORT 2012 | 221
REPORT Of THE SUPERViSORY BOARD
in 2012 the Supervisory Board discharged the duties incumbent upon it by virtue of the law and the articles of association, and was kept regularly informed by the management Board on the course of business and the state of the Bank’s affairs.
The accounts and records, and the annual financial statements, as well as the operational and financial review to the extent that it discusses the financial statements, have been audited by the independent auditors Deloitte Audit Wirtschaft-sprüfungs GmbH. As the audit gave rise to no objections and the statutory requirements were fully complied with, the audi-tors issued an unqualified audit certificate. The Supervisory Board concurred with the audit findings, is in agreement with the annual financial statements for the year ended 31 December 2012 and the operational and financial review, including the dividend recommendation, submitted to it by the management Board, and hereby approves the 2012 annual financial statements in accordance with section 96(4) Aktiengesetz (Austrian Companies Act).
The auditors Deloitte Audit Wirtschaftsprüfungs GmbH audited the 2012 consolidated financial statements for compli-ance with the international financial Reporting Standards (ifRSs) issued by the international Accounting Standards Board which are applicable in the EU, and the Group operational and financial review for compliance with the Austrian Business Code. The audit gave rise to no objections and the auditors found that the statutory requirements had been fully complied with. in the opinion of the auditors, the consolidated financial statements give a true and fair view of the financial posi-tion of the Group as at 31 December 2012 and of its financial performance and its cash flows for the year then ended, in accordance with international financial Reporting Standards (ifRSs) applicable in the EU. The auditors confirmed that the Group operational and financial review is consistent with the consolidated financial statements, such that the statutory requirements for exemption from the obligation to prepare consolidated financial statements according to Austrian law are fulfilled, and issued an unqualified audit certificate. The Supervisory Board concurred with the audit findings.
St. Pölten, 17 April 2013
The Supervisory Board
Burkhard hofer
Chairman

Proprietor and publisher: HYPO NOE Gruppe Bank AG
Editorial content: HYPO NOE Gruppe Bank AG
Design: Goldegg Verlag GmbH, Vienna, www.goldegg-verlag.com
Printed by: Druckerei Theiss
Printed on 100% chlorine-free paper with PEfC certification
(the raw materials used to manufacture the paper come from sustainably managed forests).


www.hyponoe.at