hypo noe investor presentation - startseite · hypo noe investor presentation. 2 ... syndications...
TRANSCRIPT

Regionality, customer proximity & sustainability
Solid consolidated net profit for Q1-Q3 2017 despite significant regulatory expenses and other one-off amounts
Efficient cost management consistently pursued
Strong capitalisation further expanded
Planned annual funding volume for 2017 raised almost entirely by the end of Q3 already
E | December 2017
HYPO NOE Investor Presentation

2
Section Slide
I. Group Business Strategy 3
II. Business Outlook for 2017 14
III. Financial Figures 15
IV. Funding 19
V. Contacts 26
Appendix Key Financial Statements and Further Details 27
Content
Names used in this presentation:
Bank: HYPO NOE Landesbank für Niederösterreich und Wien AG (abbreviation: HYPO NOE Landesbank)
Group: HYPO NOE Group
3
State of
Lower Austria
Vienna
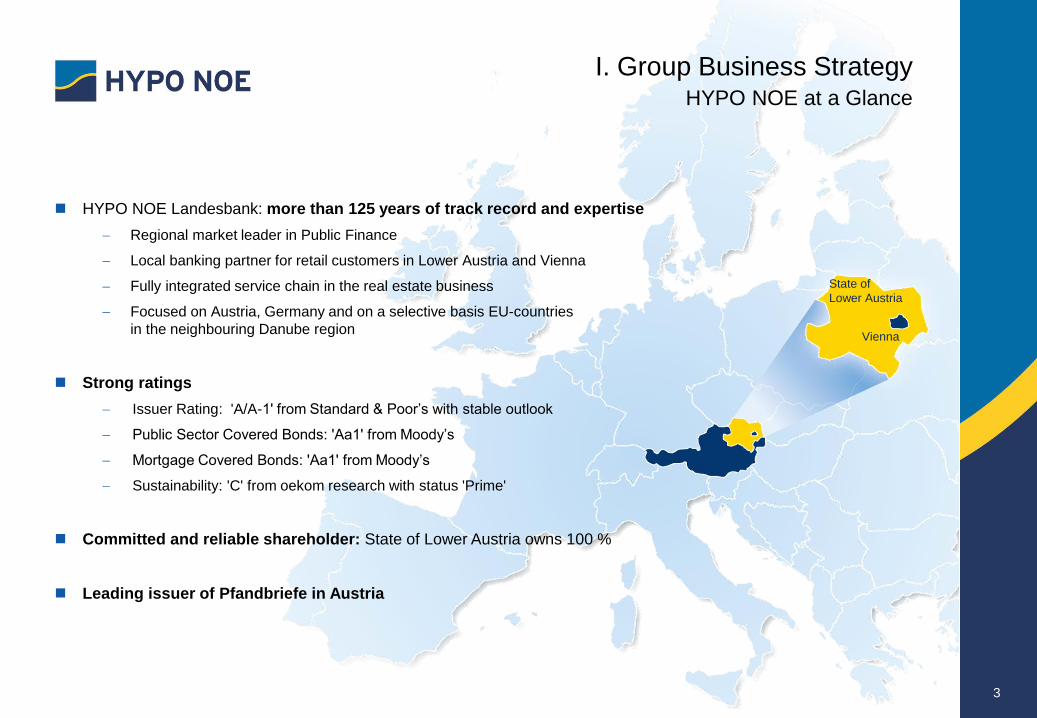
I. Group Business StrategyHYPO NOE at a Glance
HYPO NOE Landesbank: more than 125 years of track record and expertise
Regional market leader in Public Finance
Local banking partner for retail customers in Lower Austria and Vienna
Fully integrated service chain in the real estate business
Focused on Austria, Germany and on a selective basis EU-countries
in the neighbouring Danube region
Strong ratings
Issuer Rating: 'A/A-1' from Standard & Poor’s with stable outlook
Public Sector Covered Bonds: 'Aa1' from Moody’s
Mortgage Covered Bonds: 'Aa1' from Moody’s
Sustainability: 'C' from oekom research with status 'Prime'
Committed and reliable shareholder: State of Lower Austria owns 100 %
Leading issuer of Pfandbriefe in Austria

4
I. Group Business StrategyRecent Developments
Merger of HYPO NOE Landesbank AG and HYPO NOE Gruppe Bank AG successfully completed
The objective of the merger
Reintegration of the retail and housing finance businesses of former 100% subsidiary
HYPO NOE Landesbank AG
Efficiency increases due to the organization’s lower complexity and operational synergies - using the
operational and strategic strengths of both banks
The merger in retrospect
Successful merger of HYPO NOE Gruppe Bank AG and HYPO NOE Landesbank AG on the weekend of
23rd and 24th of September 2017
on the basis of the formal decision of the Supervisory Board of HYPO NOE Gruppe Bank AG, adopted on
May 17, 2017, and the following approval of the regulatory authorities
As of September 23rd, 2017, the merged bank will operate under the name:
HYPO NOE Landesbank für Niederösterreich und Wien AG
(abbr. HYPO NOE Landesbank)

5
I. Group Business StrategyCore Market: Competitive Economy
Austria
Positive GDP development
2016 + 1.6 % (EU19: 1.8 %)
2017f + 2.5 % (EU19: 2.2 %)
GDP per capita1 above average
2016 EUR 44,074 (EU19: EUR 36,650)
2017f EUR 45,849 (EU19: EUR 38,074)
One of the lowest unemployment rates within the EU
2016 6.0 % (EU19: 9.9 %)
2017f 5.4 % (EU19: 9.2 %)
Public debt below EU average
2016 84.6 % (EU19: 91.2 %)
2017f 82.0 % (EU19: 89.6 %)
Level of corporate and household indebtedness substantially
below Euro-zone average
Attractive yield spreads relative to Germany
Housing market: no oversized construction sector and low level of
household indebtedness
Lower Austria / Vienna
40 % of Austria‘s population live and work in
Lower Austria and Vienna
Region with highest population growth potential
2015-2075
41 % of Austrian GDP is generated in Lower Austria and Vienna
Highest gross income from employment
Lower Austria (# 1) EUR 33,118
Vienna (# 3) EUR 31,330
Highest purchase power per inhabitant
Lower Austria (# 1) EUR 21,048
Vienna (# 3) EUR 20,870
Fiscal equalisation scheme secures strong and prudent
framework for investors
Privileged access to international financial markets through
Federal Financing Agency (ÖBFA)
1 EIU, GDP per capita at purchase price parity; 11/2017

6
Issuer rating 'A/A-1' with “stable” outlook confirmed by Standard & Poor’s in October 2017
Strong capitalisation, very strong link to and important role for the 100% owner, the State of Lower Austria (GRE status)
Public Sector Covered Bonds and Mortgage Covered Bonds both rated 'Aa1' by Moody’s – confirmed in October 2016
Credit strength of the issuer, credit quality of the assets, strength of the Austrian legal framework, OC level
HYPO NOE Landesbank’s public sector covered bonds have an over-collateralisation (OC) of 35.4% with a minimum OC level of 20.5%,
of which 0% is on a "committed" basis.2
HYPO NOE Landesbank’s mortgage covered bonds have an over-collateralisation (OC) of 41.0% with a minimum OC level of 10.5%, of
which 0% is on a "committed" basis.2
Austrian banking sector
August 2017: Moody’s upgraded the outlook for the Austrian banking system from “stable” to “positive”.
October 2017: Standard & Poor’s regards the industry risk trend for the Austrian banking sector as “positive” (previously: “stable).
1 Unsolicited Rating
2 Last Moody’s performance overview based on data as of March 31, 2017
Issuer Type of Rating Standard & Poor’s Moody’s
Issuer Credit Rating 'A/A-1' (stable) -
Public Sector Covered Bond - 'Aa1'
Mortage Covered Bond - 'Aa1'
State of Lower Austria Issuer Credit Rating 'AA' (stable)1 'Aa1' (stable)
Republic of Austria Issuer Credit Rating 'AA+' (stable) 'Aa1' (stable)
I. Group Business StrategyStrong and Stable Credit Ratings

7
Sustainability ratings are an important evaluation with regards to corporate social responsibility performance and as such for a
holistic and future-orientated corporate governance. Therefore, sustainability ratings become an increasingly important aspect of
socially responsible investment decisions.
The corporate social responsibility performance of HYPO NOE Landesbank is currently assessed by the sustainability rating
agencies oekom research, imug and rfu.
As part of a successful sustainability programme HYPO NOE was in 2015 awarded for the first
time a 'C' rating with the status of 'Prime' .
'Prime' is awarded for an above-average commitment in the areas of environmental and social
responsibility.
HYPO NOE was rated in 2016 by the Austrian rating agency rfu and awarded with the status of
'rfu qualified' (rating result: 'ba'). rfu is an Austrian company specialising in sustainable
investment and in particular sustainability analysis .
The best performing companies are awarded with the status 'rfu qualified' and added to the rfu
sustainable investment universe.
I. Group Business StrategyTop Sustainability Ratings from oekom & rfu

8
HYPO NOE is in the upper quarter of all rated issuers of Public Pfandbriefe
(Public Sector Covered Bonds) .
HYPO NOE is the best of all rated issuers of Public Pfandbriefe in the savings bank sector.1
1 As an issuer HYPO NOE is assigned to the savings bank sector (incl. Landesbanks and mortgage banks).
HYPO NOE is in the upper quarter of all rated issuers of mortgage bonds
(Mortgage Covered Bonds).
HYPO NOE is the best of all rated issuers in the savings bank sector.1
HYPO NOE is in the upper quarter of all rated financial institutions (including development banks).
HYPO NOE is the best of all rated issuers in the savings bank sector.1
I. Group Business StrategyTop Sustainability Ratings from imug

9
Public Finance
Corporate & Structured Finance
Religious Communities,
Special Interest
Groups &Agriculture
Real Estate Finance
Real Estate Services
Retail Customers
I. Group Business StrategyCompetence and Experience Drive Business Focus
Strategic Business Units
Public Finance
Financing and leasing solutions for the public sector
Corporate & Structured Finance
Corporate and structured finance solutions
Project and infrastructure finance
Local SMEs
Religious Communities, Special Interest Groups &
Agriculture
Financing solutions
Ethical investments
Property & facility management
Real Estate Finance
Financing of commercial projects and housing developers
Real Estate Services
Project development and management
Property management
Facility management
Retail Customers
Experts on mortgages and housing for private customers
and special services for professionals

10
Business position
Partner of local and regional authorities, public agencies and
infrastructure companies
Public construction projects including leasing solutions and PPP
(Public-private-partnership)
Focus on Lower Austria and Vienna, active in selected countries
of Danube region
Long-standing cooperation with EIB, KfW, EBRD
Recent developments
Key revenue generator
Reference project Mistelbach-Gänserndorf State Hospital:
design-build general contractor solution that brought the project
in on budget and on schedule
Strategy
Remaining core business of HYPO NOE Gruppe
Reduction and diversification of Public Finance portfolio actively
promoted – resulting in a lower balance sheet total
Expanding market share in Austria
Syndications
1 Pro-forma analytical breakdown over all IFRS segments (12/2016)2 Fee income + interest income
0%
10%
20%
30%
40%
50%
60%
70%
80%
90%
100%
2016 2015 2014 2013
Retail customers
Real Estate Finance
Corporate &Structured Finance
Public Finance
HYPO NOE Group – Total Assets1
29%
16%29%
26% Public Finance
Corporate &Structured Finance
Real Estate Finance
Retail customers
HYPO NOE Group – Total Revenues2
I. Group Business StrategyPublic Finance

11
Business position
Corporate and structured corporate finance solutions for the mid-cap
and large corporate segments
Regional focus Austria, Germany and defined markets of the Danube
region
International business focus on infrastructure and corporates of
strategic relevance.
Specialized team for target group religious communities, interest
groups and agriculture
Recent developments
Intense competition and subdued credit demand
Focus on SME business in core markets
Financing of the renovation of sacral buildings
Selective financing of renewable energy projects
Strategy
Structured corporate lending will remain a high priority
Drive Danube strategy forward by partnering with Austrian and local
businesses in the region
Build up a range of ethical investment products
1 33% of corporate portfolio is accounted for by SMEs2 Pro-forma analytical breakdown over all IFRS segments (12/2016)3 Fee income + interest income
0%
10%
20%
30%
40%
50%
60%
70%
80%
90%
100%
2016 2015 2014 2013
Retail customers
Real Estate Finance
Corporate &Structured Finance
Public Finance
HYPO NOE Group – Total Assets1
29%
16%29%
26% Public Finance
Corporate &Structured Finance
Real Estate Finance
Retail customers
HYPO NOE Group – Total Revenues2
I. Group Business StrategyCorporate & Structured Finance1

12
Business position
Financing solutions for the asset classes:
office, logistics, warehouse and residential property, shopping
centers, retail parks, hotels, rental apartment properties/portfolios
Active in Austria, Germany and Danube region
Promoted housing developers (Wohnbaugenossenschaften) – low
risk business
Recent developments
Rising demand across all real estate categories due to low interest
rates
A number of early repayments, mainly as a result of early refinancing
or property disposals by customers
Strategy
Growth in Austria and Germany
Close watch on regional real estate trends
in Danube region
Maintaining strong relationships with
promoted housing developers in Austria
1 45% of real estate portfolio is accounted for by promoted housing2 Pro-forma analytical breakdown over all IFRS segments (12/2016)3 Fee income + interest income
0%
10%
20%
30%
40%
50%
60%
70%
80%
90%
100%
2016 2015 2014 2013
Retail customers
Real Estate Finance
Corporate &Structured Finance
Public Finance
HYPO NOE Group – Total Assets1
29%
16%
29%
26% Public Finance
Corporate &Structured Finance
Real Estate Finance
Retail customers
HYPO NOE Group – Total Revenues2
I. Group Business StrategyReal Estate Finance and Promoted Housing1

13
Business position
Universal banking services for 70,000 customers
Branches in Lower Austria and Vienna
Strategic focus on finance & housing, saving & investment and
accounts & cards
Specialized services for professionals like doctors, pharmacists or
lawyers
Recent developments
Increases of retail deposits
Customer-focused efforts led to significant cut in the number of foreign
currency loans
Improved accessibility via service centers
Roll out of user friendly homepage including new mobile services
Strategy
Focus on growth of the customer base and retail deposits
Efforts in the area of digitalisation will be further enhanced and
developed
1 Pro-forma analytical breakdown over all IFRS segments (12/2016)2 Fee income + interest income
0%
10%
20%
30%
40%
50%
60%
70%
80%
90%
100%
2016 2015 2014 2013
Retail customers
Real Estate Finance
Corporate &Structured Finance
Public Finance
HYPO NOE Group – Total Assets1
29%
16%29%
26%Public Finance
Corporate &Structured Finance
Real Estate Finance
Retail customers
HYPO NOE Group – Total Revenues2
I. Group Business StrategyRetail Customers and Professionals

14
Public Finance will remain core business
Reduction and diversification of the Public Finance portfolio actively promoted in coming years
✓ Continuous reduction of loans and advances to the public sector of EUR 370 mn or 7.2 % compared to end of 2016
Continued focus on real estate and infrastructure financing
in Lower Austria, Vienna and on a selective basis in the neighbouring Danube Region
✓ New lending of EUR 914 mn in Q1-Q3 2017 – HYPO NOE Group acts as an engine of economic growth in the region
Business in fee and commission based services is intended to be strengthened
in particular in the light of low interest rate environment
✓ Increase in fee and commission based income by EUR 1.5 mn or 14.9 % compared to the prior-year period
Diversification of available funding instruments
Customer deposits intended to remain a sustainable source of refinancing
✓ Continued growth in customer deposits by EUR 452 mn or 11.7 % in Q1-Q3 2017
Efforts in the area of digitalisation will be further enhanced and developed
✓ New HYPO NOE Online Banking with additional functions and features launched
II. Business Outlook for 2017Update for Q1-Q3 2017

15
Key Facts (in EUR '000s) Q3 2017 Q3 2016 FY 2016 FY 2015 FY 2014
Total assets 14,633,916 16,264,862 15,392,051 15,895,645 15,926,960
Loans and advances to customers 10,314,593 11,062,769 10,854,932 11,557,287 11,194,066
Deposits from customers1 4,299,532 4,181,659 3,847,855 3,260,856 2,305,056
Financial assets 1,692,750 2,217,319 1,987,488 2,108,456 2,249,653
Net interest income 85,270 93,145 124,439 130,840 129,9092
Net fee and commission income 11,812 10,282 13,458 13,850 13,979
Profit before tax 25,480 38,191 93,430 11,659 -39,810
Profit after tax 19,894 28,634 69,998 6,404 -30,988
Notes on major one-off effects:
2016: Significant non-recurring income from the sale of Carinthian Compensation
Payment Fund (KAF) zero-coupon bonds received under the swap for HETA
securities incl. unwinding: EUR 59.5 mn
2014-2015: Cumulated write-down (HETA): EUR 87.1 mn including impairment hedge
adjustment (35.85 % of face value EUR 225 mn)
Key Ratios (%) 30.09.2017 30.09.2016
Return on equity before tax 5.2 % 8.5 %
Return on equity before tax (operating)3 8.5 % 12.5 %
Cost income ratio 81.0 % 68.6 %
Cost income ratio (operating)4 66.7 % 55.9 %
Core Capital Ratio (CRR) 18.1 % 13.4 %
Equity Ratio (total, CRR) 18.1 % 14.4 %
Levies in respect of public authorities
Financial stability contribution (“bank tax”)Q1-Q3 2017: EUR 8.9 mn (thereof: EUR 6.8 mn one-off amount)
Q1-Q3 2017: EUR 11.2 mn
Deposit insurance contribution and resolution fundQ1-Q3 2017: EUR 8.4 mn
Q1-Q3 2016: EUR 8.1 mn
Provisions for potential interest rebates as a result
of Supreme Court judgments on negative interestEUR 2.4 mn (for the period 2015 to 2016)
EUR 2.4 mn (for the period 01.01. to 30.09.2017)
1 Including promissory notes placed with customers (30.09.2017: 54.9 EUR mn)
2 Adjusted net gains & losses on investments accounted for using the equity method disclosed in a separate line (Appendix:
Consolidated Statement of Comprehensive Income (I))
3 ROE before tax excl. financial stability contribution, contributions to resolution and deposit insurance funds, and regulatory costs/ave.
equity adjusted for financial stability contribution, contributions to resolution and deposit insurance funds, and regulatory costs
4 Cost/income ratio excl. financial stability contribution, contributions to resolution and deposit insurance funds, and regulatory costs
III. Financial FiguresKey Facts and Ratios

16
18.79%
16.31%17.89%
14.85% 15.16%
17.10%18.13 %
13.25%12.33%
14.71%
12.26%13.45%
16.34%
18.13 %
0%
5%
10%
15%
20%
25%
31.12.11 31.12.12 31.12.13 31.12.14 31.12.15 31.12.16 30.09.17
Equity ratio Tier 1 capital ratio Basel III Requirement
Capitalisation
LCR > 100 %
Leverage ratio 4.36 %1
NSFR (indicative) 106 %
Equity Ratios phased-in vs. fully-loaded(CRR/CRD IV)
13.45%14.05%
III. Financial FiguresSolid Capitalisation
Capital base (EUR '000s) 30.09.2017 30.09.2016
Total eligible core capital 613,402 576,113
Capital requirement (CRR/CRD IV) 270,694 320,258
Surplus capital 342,708 255,855
1 with consideration of the approval by FMA (without consideration of IC transactions)
Basel III (CRR/CRD IV) – as of 2014Basel II (BWG) – until 2013
18.13 %
18.37 %
18.13 %
18.37 %
16,5%
17,0%
17,5%
18,0%
18,5%
phased-in fully-loaded
Equity Ratio Tier 1 Capital Ratio
Difference between phased-in and fully loaded CET Ratios
predominantly due to 100% eligibility of AfS-reserve
Tier 1 capital ratio equals equity ratio – this is due to the
repayment of state-government-backed issues
Minimum regulatory requirements for core and total capital
ratio of 4.5 % and 8.0 % again considerably exceeded

17
95%
5% <1%
EUR CHF GBP
Volume (in EUR '000s) 30.09.2017
Public sector customers 4,780,455
Business customers 1,725,146
Housing associations 1,558,755
Retail customers 2,190,968
Professionals 59,269
Total 10,314,593
III. Financial FiguresLoan Portfolio and Risk Provisions
Details on CHF loan portfolio
Breakdown of loans and advances to customers
89%
7%4%
<1%
Austria EU & CH
Germany Others
Waterfall of risk provisions Q1-Q3 2017
Breakdown by country Breakdown by currency
97,462 0
9,176
-16,177
-10,866 -1,741
2,677 80,531
0
20000
40000
60000
80000
100000
120000
In E
UR
'000s
Industries
Leasing / Insurance companies 50 %
Retail 28 %
Corporates 21 %
States / Municipalities <1 %
Internal rating
1A-2E AAA bis BBB- 65 %
3A-4E BB+ bis C 32 %
5A-5E D 3 %
NPL 1.69 %

18
Breakdown by Sectors
Sovereigns 731,055,000
Banks 491,285,000
Sub-sovereigns and municipalities 83,000,000
International organisations 35,000,000
Supranational banks 19,000,000
Corporates 14,683,507
Public entities 10,000,000
Total 1,384,023,507
1 Based on nominal values (30.09.2017)
Regional Distribution
TOP 5 sovereign exposures in Austria, France, Poland,
Slovakia and Great Britain: on aggregate: > 60 %
100 % EUR denominated
Rest of portfolio well diversified within 19 countries
(share between 0,3 – 7 %)
Average portfolio rating 'A1'
Breakdown by Rating
III. Financial FiguresSecurities Portfolio1
53%
35%
6%3%
1% 1%1%
Sovereigns
Banks
Sub-sovereigns and municipalities
International organisations
Supranational banks
Corporates
Public entities
63%14%
22%
1% <1%
Aa1 - Aa3
A1 - A3
Baa1 - Baa3
Ba1
B1

19
IV. FundingDiversified Funding Base
1 including promissory notes placed with customers of EUR 54.9 mn2 including promissory notes placed with banks of EUR 57,7 mn3 i.a. liabilities held for trading and hedge accounting
Highlights 2016
CHF 100 mn, senior unsecured benchmark
EUR 100 mn public sector covered bond private placement
Significant increase in customer deposits (+ ~ EUR 590 mn year-on-year)
Increased repurchase of own issues with final maturity 2017
Highlights 2017
Planned funding volume of around EUR 1,150 mn (EUR 1 bn already issued as at November 2017)
Focus on public sector covered bond benchmark – EUR 500 mn public sector covered bond benchmark very successfully issued on
March 28, 2017 (first soft-bullet repayment structure in Austria)
Successful increase of the outstanding EUR 300 mn from the mortgage cover pool by EUR 200 mn to now a benchmark size of EUR 500 mn
Complementing senior unsecured funding
Continuous geographical expansion of investor base
Money Markets and Debt Capital Markets Fundingas of September 30, 2017, in EUR '000s
Covered bonds 4,877,156 33 %
Senior unsecured bonds 2,059,945 14 %
Subordinated debt 1,453 < 1 %
Deposits from customers1 4,299,532 29 %
Deposits from banks2 1,414,029 10 %
Equity 660,386 5 %
Other liabilities3 1,321,415 9 %
Total 14,633,916 100 %
Funding Strategy
Benchmark issues – secured and unsecured
Private placements with „tailor-made“ solutions
Retail – deposits through branch network
Customer deposits from institutional clients

20
Public Sector Pfandbrief
Volume of outstanding bonds EUR 3,452 mn
Cover pool EUR 4,342 mn
Rating (Moody’s) 'Aa1'
Minimum Overcollateralisation1 20.5 %
Effective Overcollateralisation (PV)2 35.4 %
Bloomberg HYNOE <Corp>
Outstanding HYPO NOE Pfandbrief benchmark issues
EUR 500 mn 1.625% Pfandbrief 2012-19 due September 2019 XS0829215838
EUR 500 mn 1.75% Pfandbrief 2013-20 due October 2020 XS0981808933
EUR 500 mn 3.00% Pfandbrief 2012-22 due May 2022 XS0780267406
EUR 500 mn 0.375% Pfandbrief 2017-23 due May 2023 XS1590565112
Tenor: 5-30 years
HYPO NOE Landesbank among leading Austrian issuers of Public Sector Pfandbriefe
1 Last Moody’s performance overview based on data as of March 31, 20172 Effective overcollateralisation: PV total cover pool / PV of total outstanding bonds (%)
IV. FundingHYPO NOE Public Sector Covered Bond (as of 30.09.2017)

21
Loans vs. Bonds (in EUR mn)
Loans 4,250 97.9 %
Bonds 92 2.1 %
Total 4,342 100.0 %
Cover Pool by Geography (in EUR mn)
Austria 4,274 98.4 %
Slovakia 35 0.8 %
Poland 20 0.5 %
Czech Republic 13 0.3 %
Total 4,342 100 %
Average Size Cover Asset
EUR 0.1mn per debtor
EUR 0.1mn per loan
Types of Debtors and Guarantors (in EUR mn)
Guaranteed by federal states 2,069 48 %
Federal states 1,588 36 %
Municipalities 330 8 %
Guaranteed by municipalities 210 5 %
States 92 2 %
Guaranteed by states 53 1 %
Total 4,342 100 %
by Rating (in EUR mn)
Aaa 3,652 84.1 %
Aa 602 13.9 %
A 48 1.1 %
< A 40 0.9 %
Gesamt 4,342 100.0 %
IV. FundingHYPO NOE Public Sector Covered Bond (as of 30.09.2017)
48%
36%
8%
5%2% 1%
Guaranteed by FederalStates
Federal States
Municipalities
Guaranteed byMunicipalities
States
Guaranteed by States

22
Research centre for cancer treatment
Client: EBG MedAustron
Facility: EIB-Loan
Amount: 100 mn Euro
Role: Arranger
Location: Wiener Neustadt, Lower Austria
Boat Terminal & World Heritage Centre
Client: Kremser Immobiliengesellschaft (KIG)
Facility: Loan
Amount: 2 mn Euro
Role: Lender & Project Manager
Location: Krems-Stein, Lower Austria
Copyright: Welterbezentrum
IV. FundingExamples: Classic and Social Infrastructure

Mortgage Covered Bonds
Volume of outstanding bonds EUR 1,109 mn
Cover pool EUR 1,536 mn
Rating (Moody’s) 'Aa1'
Minimum Overcollateralisation1 10.5 %
Effective Overcollateralisation2 41.0 %
Bloomberg HYNOE <Corp>
Outstanding HYPO NOE Pfandbrief benchmark issues
EUR 500 mn 0.75% Pfandbrief 2014-21 due September 2021 XS1112184715
EUR 500 mn 0.50% Pfandbrief 2015-20 due November 2020 XS1290200325
Cover Pool by Currencies (in EUR mn)
EUR 1,494 97.3 %
CHF 41 2.6 %
JPY and USD 1 > 1.0 %
Gesamt 1,536 100.0 %
Cover Pool by Countries (in EUR mn)
Austria 1,269 82.6 %
Germany 250 16.3 %
Netherlands 17 1.1 %
Gesamt 1,536 100.0 %
1 Last Moody’s performance overview based on data as of March 31, 20172 Effective overcollateralisation: nominal value total cover pool / volume of bonds outstanding (%)
IV. FundingHYPO NOE Mortgage Covered Bond (as of 30.09.2017)
23

24
Distribution by Asset TypeRegional Distribution
Cover Pool by Maturities (in years)
Seasoning 5.8
Remaining average life – total 8.1
Remaining average life – residential 9.4
Remaining average life – commercial 4.4
Cover Pool by Loan Size (in EUR mn) # of Loans
< 100,000 207 4,938
100,000 - 300,000 285 1,800
300,000 - 500,000 104 268
500,000 - 1,000,000 198 276
1,000,000 - 5,000,000 373 206
> 5,000,000 369 32
Total 1,536 7,520
LTV Distribution1
LTV 0-40 26.9 %
LTV 40-50 17.3 %
LTV 50-60 18.4 %
LTV 60-70 20.1 %
LTV 70-80 6.8 %
LTV >80 10.6 %
Average LTV (acc. Moody's)1 54.2 %
Average LTV (acc. to Austrian definition)2 48.3 %
IV. FundingHYPO NOE Mortgage Covered Bond (as of 30.09.2017)
1 LTV Austria Definition: (amount covered per receivable (including subtracted total of prior encumbrances))
÷ current property value2 LTV based on rating agency definition: (total receivables per borrower group + total prior encumbrances) ÷
total current property values
61%17%
2%2%
6%
3%8% 1%
Lower Austria
Vienna
Styria
Other Austrian Federal States
North Rhine-Westphalia
Bavaria
Other German Federal States
Utrecht (NL)
37%
34%
12%
16%1%
Austrian promotedhousing loans
Austrian residential loans
Austrian comercial loans
German comercial loans
Dutch comercial loans

25
Werderscher Markt
Client: Quartier am Auswärtigen Amt
Amount: 37 mn Euro
Size: 19,470 m²
Tenants: Arcotel (53%), Office + Retail (37%),
Residential (8%)
Location: Berlin, Germany
Promoted Housing in Lower Austria
Client: Siedlungsgenossenschaft Neunkirchen
Amount: 5.75 mn Euro
Size: 4,033 m²
Location: Neunkirchen, Lower Austria
Winner of the Lower Austrian Housing award 2011
IV. FundingExamples: Commercial and Promoted Housing

26
V. Contacts
Thomas Fendrich
Head of Group Treasury / Capital Markets / FI
+43 (0) 590 910 1233
Markus Payrits
Head of Liquidity Management
+43 (0) 590 910 1222
Peter Olsacher
Treasury Solutions Team
+43 (0) 590 910 1597
Martin Leppin
Head of Financial Institutions
+43 (0) 590 910 1054
Agnieszka Feiler
Financial Institutions
+43 (0) 590 910 1489
Harald Klimt
Treasury Solutions Team
+43 (0) 590 910 1581

27
Appendix

28
in EUR '000s 30.09.2017 31.12.2016 Δ absolut
Cash and balances at central banks 375,691 164,587 211,104
Loans and advances to banks 940,071 998,347 -58,276
Loans and advances to customers 10,314,593 10,854,932 -540,339
Risk provisions -80,535 -97,462 16,927
Assets held for trading 470,622 555,293 -84,671
Positive fair value of hedges (hedge accounting) 357,172 483,215 -126,043
Available-for-sale financial assets 1,673,113 1,967,148 -294,035
Financial assets designated as at fair value through profit or loss 19,637 20,340 -703
Investments accounted for using the equity method 31,193 28,4701 2,723
Investment property 52,841 54,117 -1,276
Intangible assets 766 918 -152
Property, plant and equipment 70,216 77,525 -7,309
Current tax assets 20,066 20,333 -267
Deferred tax assets 1,709 1,443 266
Other assets 385,349 261,393 123,956
Disposal groups held for sale (IFRS 5) 1,412 1,4521 -40
Total assets 14,633,916 15,392,051 -758,135
AppendixHYPO NOE Group Balance Sheet – Assets (consolidated)
1 The comparative figures of the previous year were adjusted by the IFRS5 reporting

29
in EUR '000s 30.09.2017 31.12.2016 Δ absolut
Deposits from banks 1,414,029 1,462,298 -48,269
Deposits from customers 4,299,532 3,847,855 451,677
Debts evidenced by certificates 6,937,361 7,698,831 -761,470
Liabilities held for trading 426,985 502,954 -75,969
Negative fair value of hedges (hedge accounting) 677,055 793,697 -116,642
Provisions 40,977 50,155 -9,178
Current tax liabilities 25,369 20,127 5,242
Deferred tax liabilities 33,332 36,955 -3,623
Other liabilities 117,437 129,429 -11,993
Subordinated capital 1,453 202,381 -200,928
Equity (including minority interests) 660,386 647,369 13,018
Owners‘ equity 651,575 638,950 12,626
Non-controlling interests 8,811 8,419 392
Total equity and liabilities 14,633,916 15,392,051 -758,135
AppendixHYPO NOE Group Balance Sheet – Liabilities (consolidated)

30
in EUR '000s 1.1.-30.9.2017 1.1.-30.9.2016 Δ absolut
Interest and similar income 388,269 425,969 -37,700
Interest and similar expense -302,999 -332,824 29,825
Net interest income 85,270 93,145 -7,875
Credit provisions 3,796 -7,537 11,333
Net interest income after risk provisions 89,066 85,608 3,458
Fee and commission income 14,295 12,370 1,925
Fee and commission expense -2,483 -2,088 -395
Net fee and commission income 11,812 10,282 1,530
Net trading income -826 -2,859 2,033
Administrative expenses -92,458 -100,016 7,558
Net other operating income 20,020 23,731 -3,711
Income from investments accounted for using the equity method 3,283 1,6991 1,584
Net gains or losses on available-for-sale financial assets -161 20,559 -20,720
Net gains or losses on financial assets designated as at fair value through profit or loss 72 -7 79
Net gains or losses on hedges -5,280 -1,350 -3,930
Net gains or losses on other financial investments -49 365 -414
Profit before tax 25,480 38,012 -12,532
Income tax expense -5,549 -9,557 4,008
Profit for the period from continuing operations 19,931 28,455 -8,524
Earnings from discontinued operations -37 1791 -216
Profit for the period 19,894 28,634 -8,740
Non-controlling interests -392 -8 -384
Profit attributable to owners of the parent 19,502 28,626 -9,124
AppendixConsolidated Statement of Comprehensive Income (I)
1 The comparative figures of the previous year were adjusted by the IFRS5 reporting

31
Other comprehensive income (in EUR '000s) 1.1.-30.9. 2017 1.1.-30.9.2016 Δ absolut
Profit attributable to owners of the parent 19,502 28,626 -9,124
Items not to be reclassified to profit or loss
Change in actuarial gains or losses (before tax) -468 0 -468
Change in deferred tax 117 0 117
Items that may be reclassified subsequently to profit or loss
Change in available-for-sale financial instruments (before tax) 637 17,547 -16,910
Change in non-current assets held for sale and discontinued operations (before tax) -4 171 -21
Change in deferred tax -158 -4,391 4,233
Total other comprehensive income 124 13,173 -13,049
Total comprehensive income attributable to owners of the parent 19,625 41,799 -22,174
Other comprehensive income is entirely attributable to owners of the parent
AppendixConsolidated Statement of Comprehensive Income (II)
1 The comparative figures of the previous year were adjusted by the IFRS5 reporting

32
PfandbriefeFundierte
Bankschuldverschreibungen
Hypothekenbankgesetz
(Mortgage Banking Act 1899)
Pfandbriefgesetz
(Pfandbrief Act 1927)
Gesetz betreffend Fundierte
Bankschuldverschreibungen
(Covered Bond Act 1905)
Erste Group BankBank Austria
ÖsterreichischeLandes-Hypothekenbanken
HYPO NOE Landesbank
BAWAG P.S.KKommunalkreditRaiffeisenbanken
VOLKSBANK WIEN
AppendixAustrian Legal Framework for Covered Bonds

33
Austria Germany
Pfandbrief law in place YES YES
Mortgage and public sector collateral assets in separate pools YES YES
Cover register YES YES
Collateral assets limited to EEA, CH YES NO
Legally required minimum overcollateralisation YES YES
Cover pool monitoring (Trustee) YES YES
Special proceedings in case of insolvency YES YES
Pfandbriefe remain outstanding in case of issuers‘s bankruptcy YES YES
NPV matching YES1 YES
Austrian Pfandbrief law was initially based on German legislation
Important changes to the German Pfandbrief law were followed by Austrian legislation
Main differences: Germany allows collateral from non-European countries; NPV matching is compulsory in Germany and voluntary
in Austria (self-commitment by issuing bank in Articles of Association)
1 if included in the Articles of Association of the respective credit institution
AppendixComparison of Austrian vs. German Pfandbrief Law

34
Deficiency guarantee by the State of Lower Austria
WITHOUT time limitation:
All liabilities originated before 03/04/2003
Deficiency guarantee by the State of Lower Austria
WITH time limitation:
All liabilities originated after 03/04/2003 and before 01/04/2007 and maturing before 30/09/2017
NO deficiency guarantee by the State of Lower Austria:
All liabilities originated between 03/04/2003 and 01/04/2007 and maturing after 30/09/2017
All liabilities originated after 01/04/2007
Guarantee WITHOUT Limitation Guarantee WITH Limitation NO Guarantee
Originated < 03/04/2003> 03/04/2003
< 01/04/2007 > 01/04/2007
Maturity > 30/09/2017 < 30/09/2017 n/a
AppendixDeficiency Guarantee by the State of Lower Austria

35
This document does not constitute an offer to sell, or the solicitation of an offer to subscribe for or buy, any securities, investments or any other financial instruments, in or of
HYPO NOE Landesbank für Niederösterreich und Wien AG, nor shall it or any part of it nor the fact of its distribution form the basis of, or be relied on in connection with, any contract
or investment decision. This document does not constitute an investment analysis or a recommendation to buy or to sell and is not intended to substitute any individual investment
advice. Any such offers will only be made when a prospectus in relation to the Offering is published in due course. This presentation will only be part of an offer, when it is explicitly
referenced in the respective offer.
No reliance may be placed for any purposes whatsoever on the information contained in this document or on its completeness. No representation or warranty, expressed or implied,
is given by or on behalf of HYPO NOE Landesbank für Niederösterreich und Wien AG or the banks represented in this presentation or any of such institutions’ affiliates, directors,
officers or employees, advisors or any other person as to the accuracy or completeness of the information or opinions contained in this document and no liability whatsoever is
accepted for any such information or opinions or any use which may be made of them.
This document is intended for distribution in the United Kingdom only to persons who have professional experience in matters relating to investments falling within Article 19(5) of the
Financial Services and Markets Act 2000 (Financial Promotion) Order 2005, as amended, or to those persons to whom it may otherwise lawfully be distributed. Neither this document
nor any copy of it may be taken or transmitted in or into the United States or to any US person (as defined by Regulation S of the US Securities Act of 1933 (the “Securities Act”)) or
transmitted in or into Australia, Canada or Japan or to Australian, Canadian or Japanese persons. Securities of HYPO NOE Landesbank für Niederösterreich und Wien AG have not
been and – as of the date of this presentation – will not be registered under the Securities Act and may not be offered or sold in the United States absent registration under the
Securities Act or exemption from the registration requirements thereof. There will be no public offer of securities of HYPO NOE Landesbank für Niederösterreich und Wien AG in the
United States. The distribution of this document in or into other jurisdictions may be restricted by law and persons into whose possession this document comes should inform
themselves about and observe, any such restrictions. Any failure to comply with this restriction may constitute a violation of applicable securities law and regulations.
Certain market data and financial and other figures (including percentages) in this document were rounded in accordance with commercial principles. Figures rounded in this manner
may not in any and all cases add up to the stated totals or the statements made in the underlying sources. For the calculation of percentages used in the text, the actual figures,
rather than the commercially rounded figures, were used. Accordingly, in some cases, the percentages provided in the text may deviate from percentages based on rounded figures.
Certain statements in this presentation are forward-looking statements. By their nature, forward-looking statements involve a number of risks, uncertainties and assumptions that
could cause actual results or events to differ materially from those expressed or implied by the forward-looking statements. These risks, uncertainties and assumptions could
adversely affect the outcome and financial effects of the plans and events described herein. HYPO NOE Landesbank für Niederösterreich und Wien AG does not undertake any
obligation to update or revise any forward-looking statements, whether as a result of new information, future events or otherwise. You should not place undue reliance on forward-
looking statements, which speak as only of the date of this presentation. Statements contained in this presentation regarding past trends or activities should not be taken as a
representation that such trends or activities will continue in the future.
Although due care has been taken in compiling this document it cannot be excluded that it is incomplete or contains errors.
HYPO NOE Landesbank für Niederösterreich und Wien AG, its shareholders, advisors and employees are not liable for the accuracy and completeness of the statements,
estimations and the conclusions contained in this document. Possible errors or incompleteness do not constitute any grounds for liability, neither with regard to indirect nor direct
damages. For the avoidance of doubt HYPO NOE Landesbank für Niederösterreich und Wien AG points out that it is not liable for any losses, damages or disadvantages including
direct, indirect, financial, immaterial, special or consequential loss or damage (whether for loss of profit or otherwise) due to this document or any of the statements contained therein.
By reading / downloading this presentation, you explicitly agree to be bound by the above.
NOT FOR DISTRIBUTION IN THE UNITED STATES OF AMERICA, AUSTRALIA, CANADA AND JAPAN.
DISCLAIMER