annual report 1998 - skf
TRANSCRIPT

Annual Report

KEY FIGURES 1998 1997 1996
Net sales, MSEK 37 688 36 922 33 589
Operating loss/profit, MSEK - 999 2 949 2 874
Loss/profit after financial income
and expense, MSEK - 2 063 2 106 2 412
Additions to tangible assets, MSEK 2 148 2 664 2 710
Loss/earnings per share after tax, SEK - 14.40 13.70 14.90
Dividend per share, SEK 2.00* 5.25 5.25
Return on capital employed, % - 2.8 13.0 14.7
Solvency, % 29.0 33.5 34.3
Number of employees registered 45 436 43 241 43 123
* Dividend according to the Board’s proposed distribution of surplus
PHOTO: Bertil Strandell, Håkan Ludwigsson, Lars Möller and many others
PRODUCTION: Malmer & Partners AB, 1999

’
Aftermarket Those customers, such asdistributors, who buy bearings for resaleas spare parts.
Angular contact ball bearing Bearing inwhich the raceways of the inner and outerring are displaced with respect to eachother in the direction of the bearing axis.This means that the bearing is particularlysuitable for the accommodation of simul-taneously acting radial and axial loads.
Axial load Load acting in the directionalong the shaft/axis.
Ball bearing Bearing with balls as rollingelements. May contain one or more rowsof balls.
Bearing Machine element for reducingthe friction between moving machineparts. Most bearings nowadays are rollingbearings, consisting of inner ring, outerring, a number of rolling elements (balls orrollers) and a cage. Most bearings aremade from steel.
Bearing housing Product in which arolling bearing is mounted for protectionand support. Made of cast metal or plasticand used in many different applications,such as fans, paper-making machines, etc.
Bearing unit Product in which the bear-ing has been integrated with other compo-nents in a single unit. The bearing isgreased for its entire lifetime.
Cage Bearing component which keepsthe balls or rollers separated from eachother when the bearing is rotating. Nor-mally made of steel, but sometimes ofbrass or plastic.
CARB™ Toroidal bearing – new bearingtype which can accomodate misalignmentand axial displacement of the shaft, andalso is compact. It has not been possibleto combine these properties in one bear-ing before.
Cylindrical roller bearing (CRB) Rollerbearing with cylindrical rollers.
Deep groove ball bearing (DGBB) Ballbearing where the balls run in grooves inthe inner and outer ring. The bearing is aradial bearing but can also take a certainaxial load. Used in such applications aselectric motors.
Elastomer Synthetic rubber.
Electromechanical fl ight control sys -tem System using electromechanicalactuators for moving the control surface ofthe aircraft.
Fly-by-wire System in which the surfacecontrols of the aircraft are powered byelectrically signaled actuators associatedto position transducers and flight controlcomputers.
Hub Unit /THBU Easy-to-mount, com-pact bearing unit for passenger car andtruck wheels.
Kits Kits where the bearing is suppliedtogether with the other components thatthe customer requires in order to performa given repair.
Lead time Time from the ordering of rawmaterial to delivery of the finished bear-ing.
Light trucks A designation used in theUS to cover everything from jeeps andvans to lightweight trucks.
Linear motor Electric motor which givesdirect linear movement and force withoutthe use of mechanical transformations.
Linear products Precision manufacturedcomponents, units and systems for linearmovement.
Needle roller bearing (NRB) Bearingwith long, thin cylindrical rollers. Used inapplications where space is limited, e gin gearboxes.
OEM customers Original EquipmentManufacturers – those customers whobuy bearings to use them in their ownproducts, e g manufacturers of cars,household appliances, machines, etc.
Positioning table Unit with linear guidescombined with linear drive element. Couldbe equipped with electric motor, measure-ment system and electronics for positioncontrol.
Precision bearing Bearing for machinetools with very high rotating speed. Usedin such applications as spindle units.
Radial bearing Ball or roller bearing forradial loads.
Radial load Load acting in a directionperpendicular to the shaft/axis, i e alongthe radius.
Radial seal A type of oil seal.
Roller bearing Bearing with rollers asrolling elements. May contain one or morerows of rollers.
Rolling bearing steel Very clean specialsteel for rolling bearing production.
Rolling bearings Common name for balland roller bearings.
Rolling elements Common name for theballs and rollers in a bearing.
Rolling/milling Method of processing steelto produce the desired products (bar, wire,sheet and tube).
Seal Steel or rubber component which ismounted between the outer and the innerring in a bearing, or around the shaft outsidethe bearing, to prevent dirt and moisturefrom entering the bearing and the lubricantfrom leaking out. Bearings which do nothave seals are often mounted in sealedbearing housings, for example. Seals arealso used in many other applications (egValve stem seal, Shock absorber seal).
Sensor Electric transmitter which registersrevolutions, speed, temperature, etc. Inte-grated in wheel bearing units and certaindeep groove ball bearings.
Shock absorber seal Sealing ring, spe-cially designed for short, shock-loaded axialmovements.
SKF Engineering & Research Centre B.V .(ERC) SKF’s research center in theNetherlands.
Spherical bearing Ball bearing (SABB) orroller bearing (SRB) where the inside sur-face of the outer ring is part of a sphere,which means that the bearing can adaptitself to misalignment of the shaft. SKF wasfounded on Sven Wingquist’s revolutionaryinvention of the double row spherical ballbearing.
Spindle unit Complete bearing unit withprecision bearings for machine tools.
Taper roller bearing (TRB) Roller bearingwith tapered rollers.
Thrust bearing Ball or roller bearing foraxial loads.
TQM Total Quality Management – qualityconcept within SKF comprising production,products, employees, service and attitudes.
Trouble-Free Operation (TFO) A concept,developed by SKF, which aims at giving thecustomer as trouble-free an operation aspossible. The concept is often tailor-madeand includes products and service, mainte-nance products, training, monitoring andother equipment.
Valve stem seal Seal for control and meter-ing of oil lubrication for inlet and outletvalves of combustion engines.
Accounting Principles Principles forhow specific transactions should beaccounted for.
Associated company A company inwhich the SKF Group has an interestrepresenting between 20 and 50% of thevoting rights, and where the SKF Grouphas a significant influence.
Break-even The sales volume whereincome and costs are equal, i e a zeroresult is achieved.
Capital employed The value of acompany's total assets, minus non-interest bearing liabilities.
Cash management Control strategiesover the company’s cash flows, in addi-tion to investment strategies on excessfunds.
Cash Flow A company's cashsurplus/deficit from the ongoing opera-tions.
Convertible Bonds An option to converta loan for a predetermined number ofcommon shares.
Cost effi ciency Within SKF there is anongoing effort to eliminate non-valueadded activities and to standardizeremaining activities to achieve highprofitability and efficiency.
Credit risk Risk that the borrower doesnot fulfil his obligations towards thelender.
Deferred tax Differences betweenaccounted and fiscal valuations ofassets and debts creates deferred taxliabilities and deferred tax assets, repre-senting future tax payment.
FIFO (First In First Out) The methodused by SKF to calculate which productsare still in stock, compared with LIFO(Last In First Out).
Financial derivatives An instrumentwhich is derived from, for example, anunderlying currency or interest rate.(See also Forward exchange contracts.)
Financial Year A financial year is theperiod in which the result of the opera-tions is measured. In SKF the financialyear is the same as the calendar year.
Forward exchange contracts A deriva-tive instrument where the companyagrees to buy or sell a certain currencyat a predetermined rate and date. Theagreement is obligatory for the company.
Hedge A financial contract made inorder to secure the value of an asset orliability or a future cash flow.
Interest-rate risk Risk for a loss in a fixinterest rate security due to changes inthe interest rate.
Issue A group of stocks or bonds thatare offered or sold at the same time.
Joint-venture company A company,formed by two or more companies, inwhich the risk is shared in relation to forexample capital input.
Operating Income Result generatedfrom a company's operations, i e incomeminus cost of goods sold minus salesand administrative expenses.
Price and mix Volume shifts betweenvarious customer segments withdifferent price levels.
Rating Official judgement of acompany's financial strength made by afinancial institute on behalf of potentiallenders.
Return Yield, in the form of dividends orinterest payments, on invested capital.
Risk-bearing capital The investedcapital in a company, usually stock andequity as opposed to bonds and loans.
Risk limits The maximum acceptablerisk of loss according to the pre-determined risk policy.
Sale/lease back A transaction where anasset is sold, and then leased back bythe original owner.
SFAS Accounting recommendationsissued by the U.S. Financial AccountingStandards Board.
Solvency The part of the company'stotal financing that is not financed withloans or other liabilities, i e share-holders’ equity's part of total assets.
Volatility A statistical function thatmeasures the speed of change of theprice of a commodity.
U.S. GAAP Generally AcceptedAccounting Principles in the U.S.

Financial information and reportingAB SKF will publish the following financial reports in 1999Report on 1998 operations . . . . . . . . . . . . . . . . .January 28Annual Report 1998 . . . . . . . . . . . . . . . . . . . . . . . .March 18Interim report January-March 1999 . . . . . . . . . . . . .April 22Interim report January-June 1999 . . . . . . . . . . . . . . .July 15Interim report January-September 1999 . . . . . . .October 21
The reports are available in Swedish and English. They aresent automatically to those shareholders who haveinformed the Company that they wish to receive them. Theycan also be ordered fromSKF Group CommunicationSE-415 50 GöteborgSwedentel +46-31-337 19 88, fax +46-31-337 17 22
The financial reports are also published on SKF’s home-page on the Internet www.skf.com
An annual report, Form 20-F, is produced for the Securitiesand Exchange Commission in the US.
Annual General MeetingThe Annual General Meeting will be held at SKFKristinedal, Byfogdegatan 4, Göteborg, Sweden, at 3.30p.m. on Thursday, April 22, 1999.
In order to participate in the meeting, shareholders must be recorded in the shareholders’ register maintained
by the Securities Register Centre (VPC AB) by Mon-day, April 12, 1999.
must notify the Company before noon on Monday, April 19,1999, of their intention to attend (AB SKF, Group Legal,SE-415 50 Göteborg, Sweden, tel +46-31-337 24 36,fax +46-31-337 16 91), giving details of name, address,telephone and shareholding.
Shareholders whose shares are registered in the name of atrustee through the Trust Department of a bank must havetheir shares temporarily re-registered in their own names.Sharesholders must notify their trustees of their wish to re-register their shares in plenty of time before April 12.
Payment of dividendsApril 27, 1999, is proposed as the record date for share-holders entitled to receive dividends for 1998. If this date isaccepted by the Annual General Meeting, it is expected thatthe Securities Register Centre will send out notices of pay-ment on May 4, 1999.
SKF Environmental Report 1998The Environmental Report, which is distributed togetherwith the Annual Report, is a comprehensive description ofthe SKF Group’s environmental activities during the year.
Aktiebolaget SKF, SE-415 50 Göteborg, Sweden
Telephone +46-31-337 10 00, fax +46-31-337 28 32, www.skf.com
S K F ’ s V I S I O N
is to be recognized as the world leader in
bearings, seals and related products.
We will achieve this by being the best
company in the industry in:
• providing customer value
• developing our employees
• creating shareholder value
T H I S I S S K F
SKF was founded in 1907 and since then
has always occupied a position in the front
line of technical innovation. Since its start,
SKF has been responsible for most of the
pioneering inventions within rolling bearing
technology. Thanks to having adopted an
aggressive focus from the start, SKF is
today the world’s leading producer of rolling
bearings and also holds a leading position
within special steels and elastomeric seals.
With some 80 production sites in 23 coun-
tries and sales through the Group’s own
sales companies and/or via authorized dis-
tributors in virtually all of the world’s coun-
tries, SKF is always close to the customer.
Zinc mine in Canada
page 6
Filter bed in Austria
page 10
SKF in Formula 1
page 14
Assembly of snowmobile in Finland
page 8
Industrial distributor in Singapore
page 17
Truck customer in the U.S.
page 20
Bearing simulation program
page 30
C O N T E N T S
SKF Group 2
The Chairman’s Review 4
Letter from the President 5
Board of Directors’ Report 7
The Board of Directors and its work procedures 9
Environment 10
Bearings 11
Seals 19
Steel 23
Financial objectives and dividend policy 26
Financial risk management 26
EMU 27
Year 2000 28
Technical development 30
F I N A N C I A L I N F O R M AT I O N
Consolidated income statements 32
Consolidated balance sheets 34
Consolidated statements of cash flow 36
Notes to the consolidated financial statements 38
U.S. GAAP 51
Parent Company income statements 58
Parent Company statements of cash flow 58
Parent Company balance sheets 59
Notes to the financial statements for the Parent Company 60
Proposed distribution of surplus 65
Auditors’ report 65
Shares and shareholders 66
Board of Directors 68
Management 70
Seven-year review of the SKF Group 72
Words in SKF’s world 73
Financial glossary 74
In January 1999 the SKF Group received a worldwide ISO
14001 certification, the international standard for environ-
mental management. Considering the global spread of SKF
manufacturing sites and customers, consistency is probably
the most important feature resulting from our endeavours to
achieve such a worldwide certification.
One of our ambitions is to select suppliers and raw mate-
rials that are least harmful to the environment. With respect to
the printing process, it is therefore important to us that our
suppliers use only processes and materials which are environ-
mentally approved. That is why we have chosen to print this
publication at the Falkenbergs Tryckeri AB, Sweden and on
Arctic stock from Håfreströms AB, Sweden, both environmen-
tally approved.

2
S T E E L
B E A R I N G S
This is SKF SKF's strength factors
S E A L S
The function of a rolling bearing is to min-imize the friction between a fixed and amoving surface, and to carry a load. SKFis the world’s leading rolling-bearing com-pany, with more than 50 bearing produc-tion facilities in 21 countries. A globalsales organization, consisting of whollyowned sales companies and 7 000 distribu-tors and dealers, annually supplies aroundone million customers in more than 130countries with bearings from a range ofmore than 20 000 varieties.
SKF’s determined focus on research anddevelopment has given the company aposition as the bearing-technology leader,with a large number of pioneering innova-tions that have established standards forthe entire industry. These range from SvenWingquist’s self-aligning ball bearing,through the Hub Unit to CARB™. Aworldwide sales and distribution networkassures that SKF remains close to its cus-tomers, wherever they are located, while ahighly qualified corps of application engi-neers is always available to resolve techni-cal problems.
The function of a seal is to separate amachine element from the outside world,either to prevent dirt and moisture comingin, or to avoid lubricants leaking out.Through its subsidiary Chicago Rawhide,SKF is the leading manufacturer of radialseals in the US. Chicago Rawhide is, with6 plants in the US, the largest company inthe Seals Division, which also includesRFT in Italy, Europe’s leading bearing-sealscompany, CR Elastomere in Germany,wholly owned production companies inIndia and Mexico, and three joint-venturecompanies: in Japan, China and Korea.
Chicago Rawhide has a very strong posi-tion in the US automotive aftermarketwhere the trademark CR is well estab-lished. Sales of SKF bearings to the USautomotive aftermarket are also made viaChicago Rawhide, which further enhancesthe service level to this important market.In Europe, the division’s position is beingstrengthened by CR Elastomere’s productrange. Here, the division takes advantageof SKF’s efficient distribution system forrolling bearings.
The steel from which rolling bearings areproduced is vital to the quality of the bear-ings. Ovako Steel is Europe’s leadingrolling bearing-steel company and sellsslightly less than half its production toSKF’s bearing manufacturing plants. Anincreasing share is sold to other bearingmanufacturers and certain highly demand-ing applications primarily within WesternEurope’s machinery and automotive sectors. The steel is manufactured inHofors (Sweden). Ovako Steel also hasmanufacturing facilities in France, theU.K. and the US.
Analysis precision and freedom frominclusions are factors that are critical to thebearing’s operational lifetime. Ovako Steelproduces the cleanest steel in the world.The long association with SKF and theintegration achieved between the two com-panies, has provided Ovako Steel with aunique competence and competitiveness.The extensive restructuring in recent years,the shift in focus to rolling bearing steeland the divestment of parts of the salesorganization have further strengthened thecompany.

3
S K F G R O U P
SKF’s customers Performance in 1998 What lies ahead?
Trucks 7%
Cars 16%
Industrialdistribution 27%
Specializedindustries 9%
Generalmachinery 14%
Aerospace 5%
Customizedengineering 9%
Vehiclereplacement 7%
Electricalindustry 6%
Cars 32%
Industrialdistribution
11%
Vehiclereplacement37%
Aerospace3%
Trucks 4%
Electricalindustry 1%
Generalmachinery
12%
Cars 10%
Industrialdistribution 15%
Customizedengineering 7%
Trucks 4%
General machinery
50%
Electricalindustry 2%
Specializedindustries 12%
Increased sales to car and truck customersin both Western Europe and the US com-pensated for the downturn within heavyindustry caused by the economic crisis inAsia. Deliveries increased but the changein customer mix and the severe competi-tion led to depressed prices and lowerearnings. Extensive measures were initi-ated to change the structure of the Group’sbearing operations. Loss-making and lessprofitable operations were discontinuedand resources redirected towards profitableparts of the business. A new division, withresponsibility for the industrial aftermar-ket, was established.
The focus on developing the Group’s prof-itable bearing operations will be strength-ened. The aftermarket will be assignedgreater prominence. Service centers will bebuilt up to cultivate the service market. Theefficiency enhancement programs will elimi-nate loss-making operations and improveearnings. Further reductions will be made tothe product range and inventories. Invest-ments will focus on plant rationalization andmodernization programs. Flexibility withinthe plants will increase by reducing resettingtimes and raising production frequency. Thedevelopment of new products with higheradded value is continuing and new productswill be launched in the market.
Chicago Rawhide continued to strengthenits international presence in order to meetits customers’ increasing globalization.Manufacturing units were established inKorea and Mexico. Production operationswill be started in India during the first quar-ter of 1999. Restructuring in the distributorsegment in the US led to the establishmentof new customer groups and inventoryreductions, which resulted in declined prof-itability. In Europe operations developedfavorably as a result of deliveries to theautomotive sector in Western Europe andmore widespread use of sealed bearings.
The division will develop and strengthen itspresence in the newer markets where ChicagoRawhide has its own production operations.Dependence on the North American marketwill therefore decrease to some extent. Inorder to restore profitability, the divisionwill also increase its focus on more prof-itable areas of operation. The focus onindustrial customers and the aftermarket inWestern Europe will continue, with the aimof increasing market share. Product devel-opment and the production of new productsis continuing, as is the division’s focus onthe aviation sector, which is expected togenerate good results during 1999.
After a good start to the year, demand grad-ually declined due to production decreasesin the Group’s bearing plants and lowerdemand from external customers. Steelproduction totalled approximately 423 000tons. An important milestone for OvakoSteel during the year was the start-up of thenew tube mill in Hofors, Sweden. Usingadvanced technology, the new tube millwill lead to improved productivity withinsteel operations and more cost-effectivebearing production. The decision was madeto sell or discontinue forging operations inArvika, which have operated at a loss forseveral years.
Efforts to increase the amount of steel soldoutside the SKF Group, which are alreadybeginning to show material results, willcontinue. Deliveries of seamless hot-rolledtubes from the new tube mill in Hofors,Sweden, will gradually increase when themill is fully run-in during the first quarterof 1999. Demand for tubes is alreadygood. The first six months of 1999 will becharacterized by the introduction of a com-pletely new and totally integrated adminis-trative system.
increased focus on operations in which theGroup holds strong, leading positions, willlead to a positive earnings trend for SKF.
In conclusion, I would like to take thisopportunity on behalf of the Board to thankthe Group’s employees for their good workin an extremely tough competitive climate.The ongoing restructuring of the companyhas also placed extra demands on theefforts of all employees.
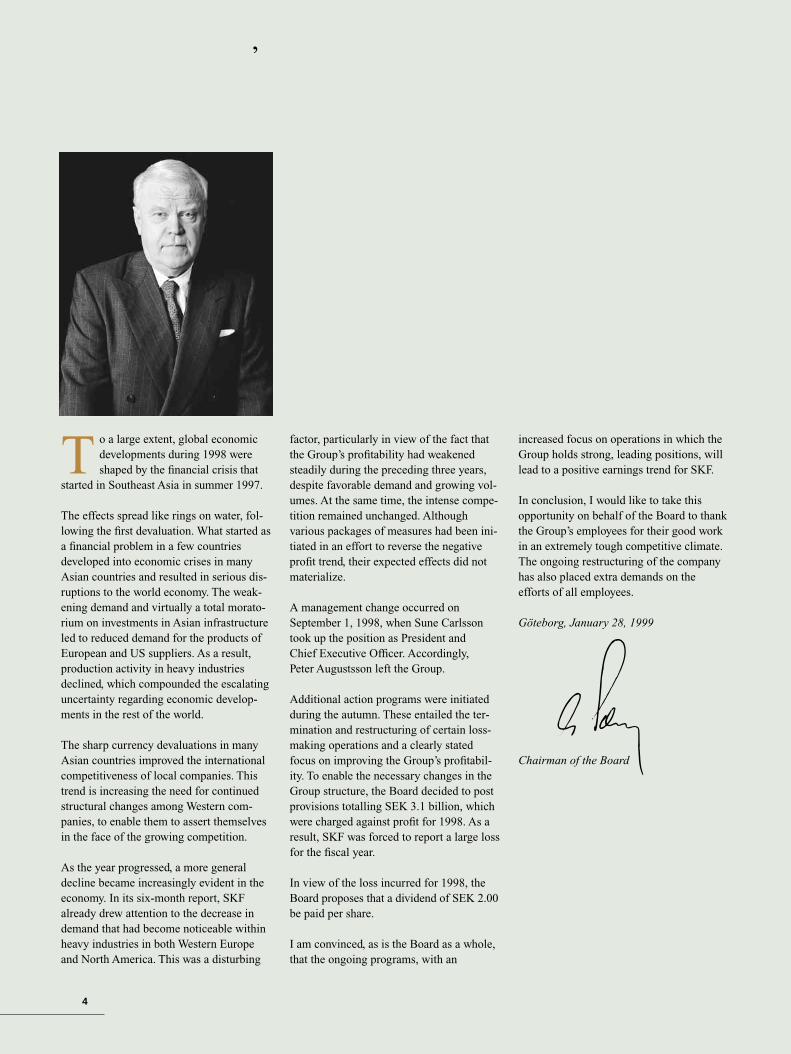
Göteborg, January 28, 1999
Chairman of the Board
4
’
To a large extent, global economicdevelopments during 1998 wereshaped by the financial crisis that
started in Southeast Asia in summer 1997.
The effects spread like rings on water, fol-lowing the first devaluation. What started asa financial problem in a few countriesdeveloped into economic crises in manyAsian countries and resulted in serious dis-ruptions to the world economy. The weak-ening demand and virtually a total morato-rium on investments in Asian infrastructureled to reduced demand for the products ofEuropean and US suppliers. As a result,production activity in heavy industriesdeclined, which compounded the escalatinguncertainty regarding economic develop-ments in the rest of the world.
The sharp currency devaluations in manyAsian countries improved the internationalcompetitiveness of local companies. Thistrend is increasing the need for continuedstructural changes among Western com-panies, to enable them to assert themselvesin the face of the growing competition.
As the year progressed, a more generaldecline became increasingly evident in theeconomy. In its six-month report, SKFalready drew attention to the decrease indemand that had become noticeable withinheavy industries in both Western Europeand North America. This was a disturbing
factor, particularly in view of the fact thatthe Group’s profitability had weakenedsteadily during the preceding three years,despite favorable demand and growing vol-umes. At the same time, the intense compe-tition remained unchanged. Although various packages of measures had been ini-tiated in an effort to reverse the negativeprofit trend, their expected effects did notmaterialize.
A management change occurred on September 1, 1998, when Sune Carlssontook up the position as President and Chief Executive Officer. Accordingly, Peter Augustsson left the Group.
Additional action programs were initiatedduring the autumn. These entailed the ter-mination and restructuring of certain loss-making operations and a clearly statedfocus on improving the Group’s profitabil-ity. To enable the necessary changes in theGroup structure, the Board decided to postprovisions totalling SEK 3.1 billion, whichwere charged against profit for 1998. As aresult, SKF was forced to report a large lossfor the fiscal year.
In view of the loss incurred for 1998, theBoard proposes that a dividend of SEK 2.00be paid per share.
I am convinced, as is the Board as a whole,that the ongoing programs, with an

I n 1998, the demand trend for SKFproducts turned downwards in mostmarkets and customer segments.
Competition increased and low inflationsharpened the price pressure in the market.The rate of capacity utilization within theGroup’s production units was unsatisfac-tory, particularly towards the end of theyear, when a necessary reduction of inven-tories was made. In total, the SKF Groupreported a substantial loss after provisionsof MSEK 3 135 for the 1998 fiscal year.
In order to build the foundation for afavorable profit trend at SKF, an extensiveprogram of efficiency enhancement andrestructuring measures was decided duringthe year. These measures are currently beingimplemented with high speed. More long-term work was initiated to strengthen SKF’smarketing activities and develop the Group’sstronger businesses. It should be noted thata considerable proportion of SKF’s approxi-mately 400 profit centers are showinghealthy profitability and that many of themalso posted improved profits in 1998.
The aim of the ongoing efficiency pro-gram is to cut costs by reducing the numberof employees by 4 000 prior to the end of1999. To alleviate the social consequencesof the personnel cutbacks, early retirementsolutions have been applied extensively.Approximately half of the planned programof measures had been implemented byDecember 31, 1998.
During the autumn, a review was madeof a number of operations that had givenrise to substantial losses, in many casesover a considerable period of time. Amongother consequences, this resulted in deci-sions to exit the textile machinery compo-nents area, to terminate the production oftaper roller bearings in the US and to closea seals plant in the US. In addition, a deci-sion was taken to exit the forging businessin Arvika. Production capacity in Brazil isbeing reduced sharply due to weak demand.These restructuring measures will result ina further reduction of the workforce involv-ing approximately 2 000 employees.
Due to the difficult market situation,SKF’s strategy for expansion in Asia wasfocused on improving the earnings ofrecently acquired companies. Towards theend of the year, there was a certain stabi-lization of demand in the region. The fun-damental assessment that Asia is an impor-tant market for SKF’s long-term expansionstands firm.
SKF’s organization was streamlinedduring 1998. Bearing operations are noworganized in four global divisions, eachwith a distinct market focus: Automotive,Electrical, Industrial and Service. TheComponents, Emerging & Specialty andAsia Pacific divisions were integratedwithin these divisions. The Seals and Steeldivisions remain essentially unchanged.
The Group will review its customerfocus with the aim of developing value
added business strategies to strengthen ourcompetetive advantages. In an effort toimprove profitability, considerable attentionwill be assigned to marketing, logistics,pricing and customer segmentation matters.The industrial aftermarket still has substan-tial potential and will thus continue to be atarget area for SKF.
Another area that will be assigned prior-ity is the SKF Group’s structure and level ofintegration. The aim is to reduce the highamount of tied-up capital and to improvecash flow.
The business during 1998 was marked byan increasingly difficult market climate andby extensive changes within SKF aimed atimproving profitability. Demand is expectedto continue to decline this year. Earningsfor the next few quarters are likely toremain weak until the efficiency improve-ment programs start to improve the profit.
Göteborg, January 28, 1999
President
5

6
SKF distributor Fred E. Shillington, Canadian Bearings Ltd., shown here withDenis J. Babin, Noranda Inc., Brunswick Mine, during a visit to the Bathurstzinc mine in eastern Canada. This is a good example of a successful tripartiterelationship between SKF, the distributor and the customer. The customer,Brunswick Mine, has access to all information from SKF with regard to techni-cal support, delivery capacity, prices and other key data. In return, SKFreceives all necessary information about the mining company’s requirementsvia the distributor.
7
’
2000 by which time all of the activities willhave been implemented.
These structural changes also mean thatthe number of employees in the Group willbe decreased by a further approximately2 000 persons, in addition to the 4 000announced earlier.
The total cost of the programs approvedduring 1998 was MSEK 3 135 and wascharged against Group earnings in anamount of MSEK 1 216 during the thirdquarter and MSEK 1 919 during the fourthquarter.
During the year, focus was increased onthe profitable industrial aftermarket forrolling bearings through the establishmentof the Service Division, with global respon-sibility for this segment. An important partof the new division’s operations is thedevelopment of new products and servicesto support its network of industrial distribu-tors and MRO (Maintenance & RepairOperations) customers. In this field SKFcan draw upon its unique competence andextensive and in-depth know-how of bear-ing technology, supplemented by a largeand experienced team of field engineers.
The Group’s financial net was MSEK -1 064 (-843). The deterioration was mainlyattributable to increased net borrowingsduring the year, currency losses in joint-venture companies in Asia and a MSEK110 write-down of SKF’s shareholding inthe Chinese bearing company WafangdianBearing Company Limited.
Group inventories expressed as a per-centage of annual sales amounted to 27%(27) at the end of the year. In terms ofvalue, inventories totalled MSEK 10 183 asof December 31, 1998 (9 924).
There was a build-up of inventories atthe beginning of 1998 to meet expected
There has been a growing overcapacityin the bearing industry in recent years. Thishas led to a battle for market share, whichhas had an adverse effect on sales price lev-els. Despite a favorable productivity trendin the SKF factories, the improvementswere insufficient to offset the negative con-sequences of the price trend.
To reverse the negative trend affectingSKF in recent years, the Group’s strategywas changed to prioritize profitability ratherthan volume expansion and discontinueunprofitable operations.
The cost-reduction measures announcedin autumn 1997 and June 1998 will result incost decreases amounting to approximatelyMSEK 1 500. The restructuring programdecided in autumn 1998 is intended toimprove earnings by about MSEK 600. Thefull impact will not be felt until fiscal year
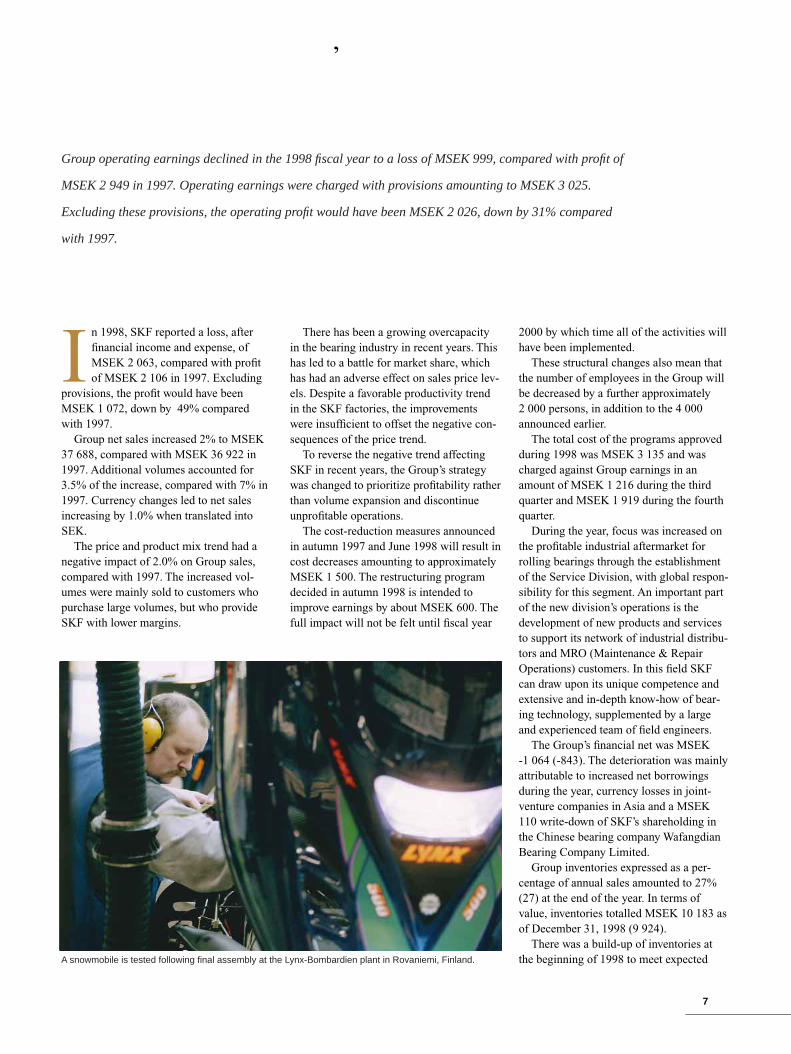
In 1998, SKF reported a loss, afterfinancial income and expense, ofMSEK 2 063, compared with profitof MSEK 2 106 in 1997. Excluding
provisions, the profit would have beenMSEK 1 072, down by 49% comparedwith 1997.
Group net sales increased 2% to MSEK37 688, compared with MSEK 36 922 in1997. Additional volumes accounted for3.5% of the increase, compared with 7% in1997. Currency changes led to net salesincreasing by 1.0% when translated intoSEK.
The price and product mix trend had anegative impact of 2.0% on Group sales,compared with 1997. The increased vol-umes were mainly sold to customers whopurchase large volumes, but who provideSKF with lower margins.
Group operating earnings declined in the 1998 fiscal year to a loss of MSEK 999,compared with profit of
MSEK 2 949 in 1997. Operating earnings were charged with provisions amounting to MSEK 3025.
Excluding these provisions,the operating profit would have been MSEK 2026,down by 31% compared
with 1997.
A snowmobile is tested following final assembly at the Lynx-Bombardien plant in Rovaniemi, Finland.

8
higher demand that never materialized. Theinventory levels were reduced during thesecond half of the year. This had an adverseeffect on manufacturing costs.
The loss per share amounted to SEK14.40, compared with earnings per share ofSEK 13.70 in 1997.
The Group’s solvency deteriorated from33.5% at year-end 1997 to 29.0% at the endof 1998 as a result of the provisions madefor the efficiency enhancement program.
Interest-bearing loans at year-end 1998totalled MSEK 8 179 (8 391), while pen-sion liabilities amounted to MSEK 7 139(6 171). As of the same date, the Group hadfinancial assets of MSEK 3 237 (4 761),including short-term financial assets ofMSEK 2 353 (3 931).
SKF’s capital expenditure in tangibleassets amounted to MSEK 2 148 (2 664).Depreciation according to plan was MSEK 1 722 (1 528).
Approximately MSEK 149 (120) of theGroup’s total capital expenditure is attribut-able to environmental investments, the aimof which is to improve SKF’s internal andexternal environment.
Capital expenditure during the next fewyears is expected to be slightly lower thanannual Group depreciations.
Investments in research and developmentamounted to MSEK 702 (757), correspond-ing to 1.9% (2.1) of annual sales. Thisamount includes only investments in prod-uct and process development.
SKF is aiming at a high rate of innova-tion. During 1998, SKF submitted 145 firsttime patent applications. This can be com-pared with the 146 submitted in 1997 and130 in 1996.
SKF increased its focus on training of itsemployees during 1998. The Learning Cen-tre (TLC) was established at SKF’s corpo-rate head office. During the year, trainingprograms were conducted in such areas asleadership, project management and finan-cial and international management. TLCand the SKF College, which focuses onproviding technical training, arrangedcourses for about 700 SKF employees dur-ing the year.
An international training program formanagers, the Global Leadership Pro-gramme, was introduced in 1998. Eachparticipant is assigned and carries out a personal development project during a 12-month period under the supervision of theimmediate superior and a selected mentor.
Group work in the quality area continuesat a high rate. The TQM (Total Quality
Management) process has resulted in agrowing number of production channelsreporting “Zero Defects,” meaning that nocustomer complaints have been receivedduring a 12-month period. In general, thenumber of customer complaints has beenhalved during the past four years.
Final stages on the snowmobile assembly line at the Lynx-Bombardien plant on the Arctic Circle in Rovaniemi, northern Finland. Lynx-Bombardien is Europe’s sole producer of snowmobiles, which are used extensively throughout the Arctic area. Since it is common forfamilies in the region to have one or more snowmobiles, a strong aftermarket is being opened up for various SKF products.
Steel tubes from Ovako Steel are sold to cus-tomers in Italy via the distributor Sandvik Italia.

9
B O A R D O F D I R E C T O R S ’ R E P O R T
Geographic distibution of net sales, average number of employees and
tangible assets (percent)
25
1419
5358
65
39
3
6 5 4
10 129North America
Western EuropeCentral and
Eastern Europe
3 20
Middle Eastand Africa
Asia
Latin America
Net sales
Average number of employees
Tangible assets
The Board of Directors and itswork procedures
The Annual General Meeting of AB SKF,held in the spring of 1998, elected tenBoard members. In addition hereto twomembers and two deputy members havebeen appointed by the employees. Peter
Augustsson left as President of the Com-pany and as member of the Board of Direc-tors as of August 31, 1998.
During 1998 the Board held nine meet-ings. The Board has adopted written rulesof procedure for its internal work. Theserules confirm already existing practice andcontain i a rules regarding
Trucks 6%
Cars 18%
Generalmachinery 15%
Specializedindustries 8%
Customizedengineering 8%
Industrialdistribution 27%
Aerospace 4%
Electricalindustry 5%
Vehicle replacement 9%
• number of Board meetings and timingfor Board meetings
• items normally included in the Boardagenda
• presentation to the Board of reports fromthe external auditors
The Board has also issued writteninstructions regarding
• when and how information required forthe Board’s assessment of the Company’sand the Group’s financial position shall becollected and reported to the Board;
• allocation of the tasks between the Boardand the President; and
• the order in which the deputy Presidentsshall act in the President’s absence.
Also these written instructions confirmalready existing practice within the Com-pany.
Net sales by customer segment 1998
10
The year 1998 was a special yearfor SKF and the environment, asthe Group received worldwidecertification to ISO 14001: the
international standard for environmentalmanagement. The global certificate coversSKF’s manufacturing units in 17 countriesspread over five continents, and reflects thecompany’s standing as the worldwide leaderin its business.
Coping with cultural differences
The project for global approval to ISO14001 included SKF’s factories in India,South Africa and Poland, where environ-mental awareness has traditionally beenmuch lower than in our factories in WesternEurope and the US. The Group’s employeesin these countries worked extremely hard toachieve the very high standards required forISO certification, concentrating especiallyon awareness training and culture change.The SKF factory at Poznan in Poland thusbecome one of the first organizations in thatcountry to be approved to ISO 14001.
Cost-effective strategy developed
SKF applied to a leading certification bodyfor a single ISO 14001 certificate coveringall manufacturing units in the Group, ratherthan individual certificates for each unit. Bydeveloping a single environmental manage-ment system (EMS) which could be usedby all its factories worldwide, SKF could beassessed by the auditors as one companyrather than as numerous individual units.This strategy substantially reduces the costsfor certification and subsequent surveil-lance audits.
Widespread benefi ts ofcertifi cation
SKF’s ISO 14001 approval will benefit cus-tomers, employees, shareholders and theenvironment. The certification providesassurance to customers, to shareholders andto other interested parties that SKF takes itsenvironmental responsibility seriously; thushelping customers meet their own obliga-tions.
The certification has also helpedemployee development. Extensive trainingwas necessary to ensure that the Group’semployees had sufficient environmentalawareness to operate the management sys-tem, and this training has allowed employ-ees to take on greater responsibility andauthority. More than 20 000 employeeshave passed different types of environmen-tal training.
ISO 14001 should also increase share-holder value, by helping to improve thelong-term stability of the company. Envi-ronmental accidents can be very expensiveto rectify, and may lead to damaging pub-licity and loss of reputation for any com-pany. An effective environmental manage-ment system should minimize the potentialfor accidents and emergencies. This notonly safeguards the environment, but alsoprotects the company and the share value.
Of course, the environment is the mostimportant beneficiary of the Group’sapproval to ISO 14001, as the standardfocuses on continual improvement of envi-ronmental care. Examples of such improve-ments around the Group can be found in theSKF Environmental Report 1998.
Accidents and injuries reducedagain
1998 provided further evidence of thedownward trend in the number of work-related accidents and injuries in the Group.SKF Pune in India showed a 23% reductionin the number of injuries in 1998, but thebest result was achieved by the plant atAltoona, PA, in the United States. They hadno lost time due to injuries during the entireyear.
SKF Environmental Report 1998
The Environmental Report, which is dis-tributed with the Annual Report, is a com-prehensive description of the SKF Group’senvironmental activities during the year.
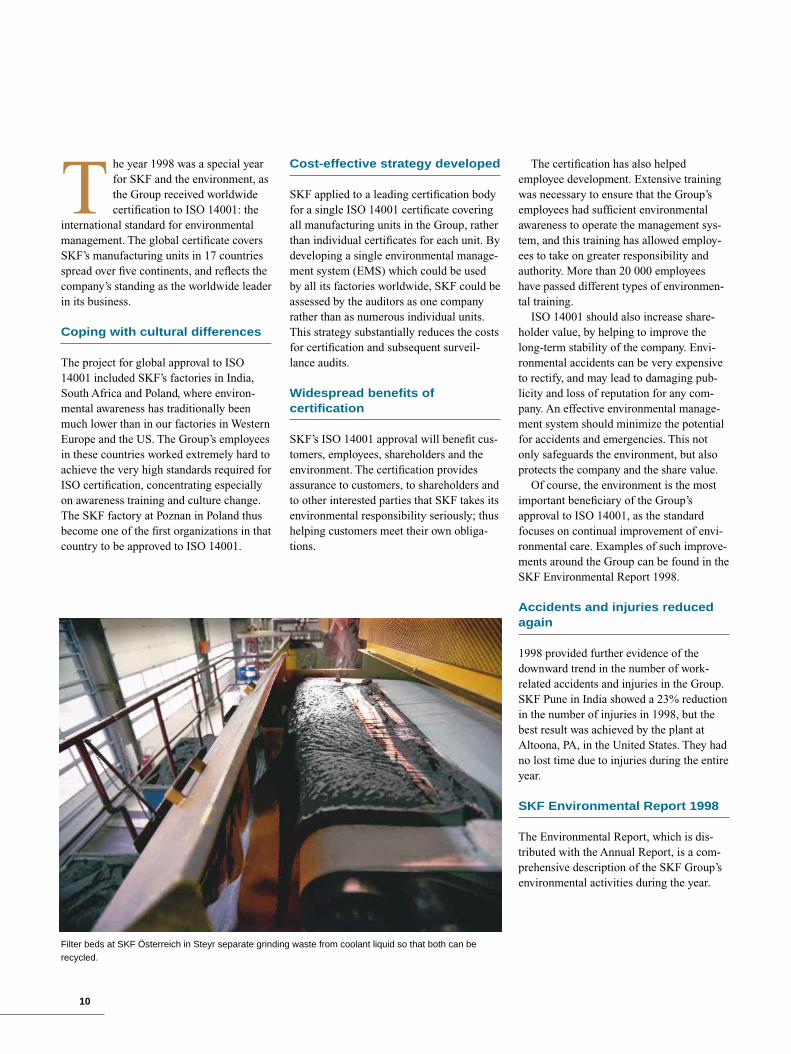
Filter beds at SKF Österreich in Steyr separate grinding waste from coolant liquid so that both can berecycled.

The bearing business reported a substan-
tial loss for 1998 due to comprehensive
provisions for restructuring. Operating
earnings amounted to a loss of MSEK
1 177 compared with a profit of MSEK
2 294 in 1997. Operating earnings were
charged with provisions of MSEK 2 882.
Excluding these restructuring provisions
operating earnings would have been
MSEK 1 705.
Sales of bearings increased during
1998 to MSEK 32 453 (31 991).
0
7 000
14 000
21 000
28 000
35 000
96 97 98
29 2
04
31 9
91
32 4
53
- 1 500
0
1 500
3 000
96 97 98
2 48
2
2 29
4
- 1
177
0
5 00
1 000
1 500
2 000
2 500
96 97 98
2 24
9
2 08
7
1 64
1
0
10 000
20 000
30 000
40 000
96 97 98
36 7
01
36 6
42
37 9
16
Asia 11%
NorthAmerica 21%
Latin America 7%
Middle Eastand Africa 3%
Central andEastern Europe 3%
Sweden 4%
Western Europa excl Sweden 51%
Operating
loss/profit,
MSEK
Additions to
tangible assets,
MSEK
Average
number of
employees
Net sales by geographic
area 1998
Net sales,
MSEK

12
This giant grinding mill at Noranda Inc., Brunswick Mine, in eastern Canada, isequipped with spherical roller bearings from SKF. The crushed zinc ore isdelivered directly from the mine and is ground into smaller particles in the millbefore going to the flotation process.

13
B E A R I N G S
The Industrial Division comprisesthree business areas – GeneralMachinery, Specialized Indus-tries and Customized Engineer-
ing – and focuses on industrial OEM cus-tomers. Manufacturing includes a largenumber of different types of industrial bear-ings, predominantly spherical, cylindricaland angular contact bearings.
Sales increased by 9.1% to MSEK 8 189(7 506). Before provisions, the division’s
operating margin declined slightly duringthe year as a result of unsatisfactory capac-ity utilization and lower prices.
During the year, the Industrial Divisiondeveloped new business activities with afocus on customers with more demandingapplications. New solutions were developedwith more functions integrated into thebearing application in order to improve theperformance and lifecycle.
During 1998, telephone sales generatedgood results in Europe and the US. Accord-ing to customers, this has improved thequality of their relations with SKF, sincecontacts have become more frequent andefficient for both parties.
Investments during the year amounted toMSEK 504 and focused mainly on increas-
ing the efficiency of existing plants. A pro-gram has been initiated to reduce resettingtimes in production and thus enhance ser-vice levels and reduce inventories. At thesame time, the product range is beingreduced in cooperation with customers.
The Industrial Division also comprisesthe manufacturing and sales of linearmotion products, which are found in therapidly expanding market for ergonomicand mobility aiding equipment. Positioning
systems is another product with significantgrowth in this area. These systems includespecialized sub-assemblies, designed and
built in close co-operation with the cus-tomers, as well as high speed, high preci-sion positioning tables incorporating linearmotors.
The sales development is positive in thisbusiness area, as is the profitability.
An area that the division is also focusingon is spindles for machine tools based onhigh-precision bearings. The acquisition of Russel T Gilman Inc., a leading US manu-facturer of such spindles, increased SKF’s
sales in this segment to MSEK 150 during1998. Machine tool spindles are also pro-duced in Germany and Sweden.
0
2 000
4 000
6 000
8 000
10 000
9897960
200
400
600
800
9897960
3 000
6 000
9 000
12 000
15 000
989796
6 83
0
7 50
6
8 18
9
483
662
504 10
633
11 5
78
11 6
29
External sales, Additions to RegisteredMSEK tangible number of
assets, MSEK employees
Giant loader at Brunswick Mine, Noranda Inc.,Canada.
Assembly line for snowmobile production at theLynx-Bombardien plant in Finland.
The baking ovens at the Göteborgs Kex biscuitplant in Sweden are equipped with SKF’s HighTemperature Bearings.

14
B E A R I N G S
Clevedon, UKRod endsSpherical plain bearingsSuspension and engine
Cassino, ItalyDeep groove ball bearingsEngine
Fontenay , FranceDeep groove ball bearingsEngine
Mühlheim, GermanySpecial needle cage
Differential
Thomery , FranceThin section bearingsEngine and gearbox
Jamestown, USPrecision angular
contact ball bearingsWheels
Schweinfurt, GermanySpecial cylindrical roller bearingsSpecial four-point contact ball bearingsGearbox and differential
Steyr , AustriaFour-point contact ball bearings
Gearbox
Villar Perosa, ItalyPrecision angular contact ball bearings
Wheels
Race cars live a punishing life. Designed, engineeredand maintained for one, single purpose: to win races.
The very popular NASCAR Winston Cup races arean excellent way to promote the SKF brand in the US.SKF has a sponsor agreement with Roush Racing andalso delivers seals, bearings and technical support tothis Ford Taurus and others in the Roush Racing stable.
SKF has been Ferrari’s technical partner and bear-ing supplier since 1947. The longest unbroken techni-cal partnership between a team and a supplier inGrand Prix history. The number of bearings in a mod-ern race car is staggering. This season’s F399 isequipped with nearly 150 SKF bearings, manufacturedat nine different locations.

15
B E A R I N G S
The Automotive Division is respon-sible for all sales to manufactur-ers of cars, trucks, buses andrelated aftermarkets. The divi-
sion is also responsible for the manufactureof taper roller bearings, wheel hub units,special products for vehicle manufacturers,and kits for the vehicle aftermarket.
Sales increased by 9.0% to MSEK 8 650(7 934). Although the division’s operatingmargin, before provisions, remained unsat-isfactory, it improved significantly duringthe year due to the restructuring programand efficiency improvements, which werestarted in the first half of the year, and tofavorable volumes.
Global production of cars and lighttrucks declined by 3% during 1998, primar-ily as a result of significantly lower volumesin Asia. The production of cars rose by over6% in Western Europe but decreased by 2%in the US.
The manufacture of heavy vehiclesincreased by 19% in Western Europe, by12% in the US and by 13% in South Amer-ica. Production in both India and Japanshowed a decline of more than one third.
In the vehicle aftermarket, SKF contin-ued to grow strongly in Europe andincreased its market share. This was mainlyattributable to sales of kits, which havebeen marketed heavily for the past fewyears and are now gaining increased marketacceptance. During the year, SKF receivedan award from CLEPA, the componentsparts association in Europe, for its EDI linkto vehicle component distributors.
In North America, SKF increased itsshares of the markets for cars and lighttrucks. Group sales rose by 20%, due tohighly favorable sales of the models towhich SKF provides bearings and due tonew business.
In Brazil, the sharp weakening of theautomotive market also affected SKF. Salesof locally produced kits for the automotiveaftermarket commenced during 1998. In the
truck segment, SKF decided to terminatedeliveries to Brazilian trailer manufacturersdue to unprofitable price levels.
Due to the structural changes in theKorean bearing market, SKF acquired theremaining shares in the joint venture com-pany for wheel hub units.
The SKF Group has had a joint venture
company in Italy with INA for water pumpspindles for cars. SKF has decided to leavethis business and has agreed to sell itsminority shareholding to INA.
0
2 000
4 000
6 000
8 000
10 000
9897960
200
400
600
800
1 000
9897960
3 000
6 000
9 000
12 000
989796
7 12
0
7 93
4
8 65
0
799
560 67
7
7 78
9
7 86
8
10 8
36
External sales, Additions to RegisteredMSEK tangible number of
assets, MSEK employees
Trailer axle equipped with discbrake and SKF truck hub unitmanufactured at the Group’splant in Lüchow, Germany.
B E A R I N G S
16
The Electrical Division is respon-sible for the sales to manufactur-ers of electric motors, householdappliances, electric components
for cars, and two-wheelers. The division isalso responsible for the production of alldeep groove ball bearings within SKF. Themajor part of these products is sold via theother bearing divisions.
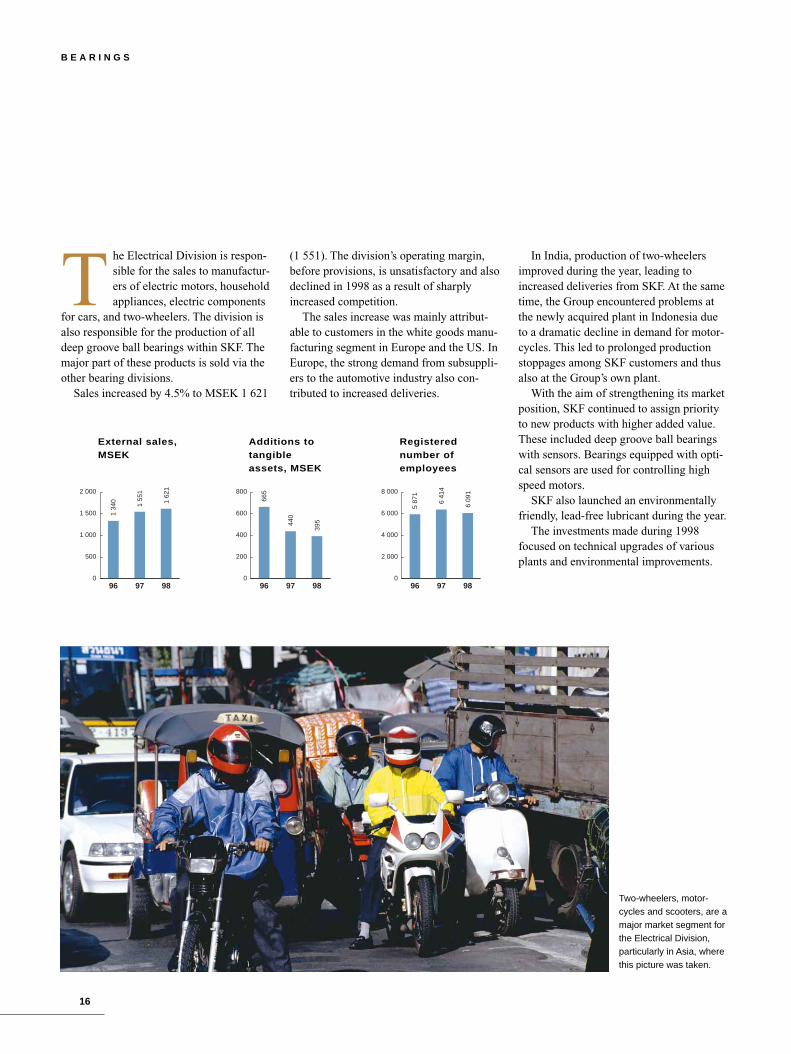
Sales increased by 4.5% to MSEK 1 621
In India, production of two-wheelersimproved during the year, leading toincreased deliveries from SKF. At the sametime, the Group encountered problems atthe newly acquired plant in Indonesia dueto a dramatic decline in demand for motor-cycles. This led to prolonged productionstoppages among SKF customers and thusalso at the Group’s own plant.
With the aim of strengthening its marketposition, SKF continued to assign priorityto new products with higher added value.These included deep groove ball bearingswith sensors. Bearings equipped with opti-cal sensors are used for controlling highspeed motors.
SKF also launched an environmentallyfriendly, lead-free lubricant during the year.
The investments made during 1998focused on technical upgrades of variousplants and environmental improvements.
(1 551). The division’s operating margin,before provisions, is unsatisfactory and alsodeclined in 1998 as a result of sharplyincreased competition.
The sales increase was mainly attribut-able to customers in the white goods manu-facturing segment in Europe and the US. InEurope, the strong demand from subsuppli-ers to the automotive industry also con-tributed to increased deliveries.
0
500
1 000
1 500
2 000
9897960
200
400
600
800
9897960
2 000
4 000
6 000
8 000
989796
1 34
0
1 55
1
1 62
1
665
440
395
5 87
1
6 41
4
6 09
1
External sales, Additions to RegisteredMSEK tangible number of
assets, MSEK employees
Two-wheelers, motor-cycles and scooters, are amajor market segment forthe Electrical Division, particularly in Asia, wherethis picture was taken.
17
The Service Division was estab-lished in mid-1998. The divisioncomprises sales in the industrialaftermarket of all SKF-produced
bearings and of externally purchased prod-ucts. The division has sales units in morethan 50 countries and a network of approxi-mately 7 000 distributors and dealers, sub-stantially more than any competitor.
Sales decreased by 5.3% to MSEK11 669 (12 324). The division’s operatingmargin before provisions declined slightly
due to negative volume development in theUS and Southeast Asia.
In Western Europe, the largest market forthe division, sales increased although therewas considerable price pressure.
In the United States, the second largestmarket, sales to distributors were seriouslyaffected by structural changes, which led tosubstantial re-balancing of inventories.
As expected, sales to the Asia Pacificregion were lower than in 1997. However,this negative trend has probably bottomedout and price levels are firming up.
Whilst growth in Eastern Europe contin-ued, severe slowdowns occurred in bothMiddle East, Africa and Latin Americasales regions.
Most of the division’s sales are madethrough the authorised distributor networkand these channels have entered a period ofconsolidation and rationalization which isexpected to continue.
SKF has developed a comprehensiveoffering of products and services. This isbeing enhanced by new, higher technologyofferings, such that IMS or Integrated
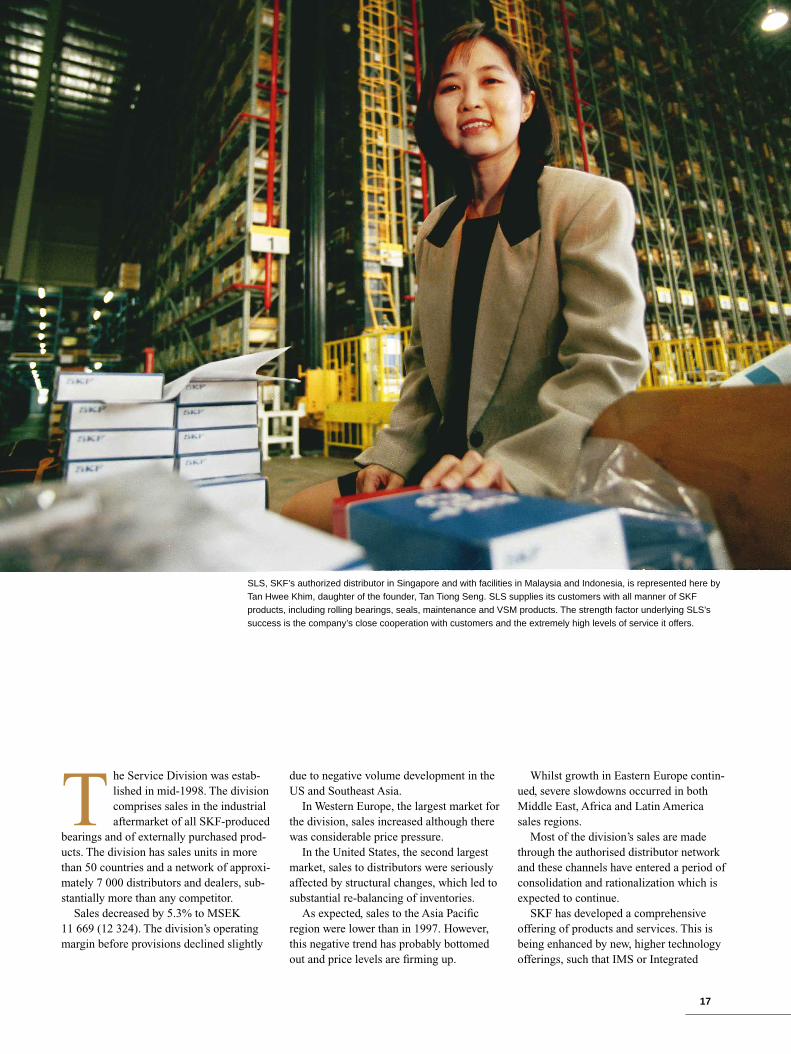
SLS, SKF’s authorized distributor in Singapore and with facilities in Malaysia and Indonesia, is represented here byTan Hwee Khim, daughter of the founder, Tan Tiong Seng. SLS supplies its customers with all manner of SKF products, including rolling bearings, seals, maintenance and VSM products. The strength factor underlying SLS’ssuccess is the company’s close cooperation with customers and the extremely high levels of service it offers.

18
B E A R I N G S
The bearing market worldwide
SKF is the world’s largest bearing supplier,followed by the two Japanese companiesNSK and NTN, then FAG of Germany,Timken of the US and Koyo of Japan.
SKF is the largest supplier to the WestEuropean market. SKF is also the largestsupplier to Latin America, Africa and theMiddle East. In the US, Timken is the lead-
ing supplier, followed by SKF and Torring-ton of America.
NSK is the largest supplier in Japan.SKF, which is the largest non-Japanesebearing company in this market, has a mar-ket share of around 2%.
Markets in Central and Eastern Europe,as well as China, are mainly supplied by
The SKF Group’s operations in the aviationsector comprises MRC and SKF AVIO,which manufacture aeroengine bearings,and SARMA and AMPEP, manufacturers ofairframe bearings, electromechanical flightcontrol systems and electromechanicalequipment for fly-by-wire systems. Boththese operations developed very favorablyduring 1998. The strong growth for largecommercial aircraft, regional jet planes andhelicopters in the US and Europe led toincreased sales and improved margins.
0
3 000
6 000
9 000
12 000
15 000
9897960
20
40
60
80
9897960
1 000
2 000
3 000
4 000
989796
11 0
71
12 3
24
11 6
69
1
46
67
3 05
3
3 24
0
3 06
5
External sales, Additions to RegisteredMSEK tangible number of
assets, MSEK employees
local companies, although Western, as SKF,and Japanese producers have started toestablish positions as manufacturers inthese countries.
The global bearing market is estimatedto be worth approximately SEK 160 billion,of which the US and Western Europejointly account for about 60%
Maintenance Solution packages can be sup-plied to enduser customers. This conceptaims to combine the excellent logistics ser-vice from our distributors with advanced
high impact mechanical and electronictechnology from SKF. The goal is that cus-tomers can increase productivity and theoperational lifetime of their mechanical
rotating machinery, and at the same timeimprove the efficiency and cost of theirmaintenance programs. This should resultin improved uptime for the customers.
ISC, or Industrial Service Centres, arebeing established in key markets, and theywill offer bearing repairs, assembly ser-vices, training, condition monitoring ser-vices and fault diagnosis.
The CFM56 jet aircraft engine isthe best selling jet engine in theworld today. SKF is the leadingbearing supplier on the engine,featuring parts provided by SKFAVIO in Italy and MRC Bearingsin the US.
0
1 500
3 000
4 500
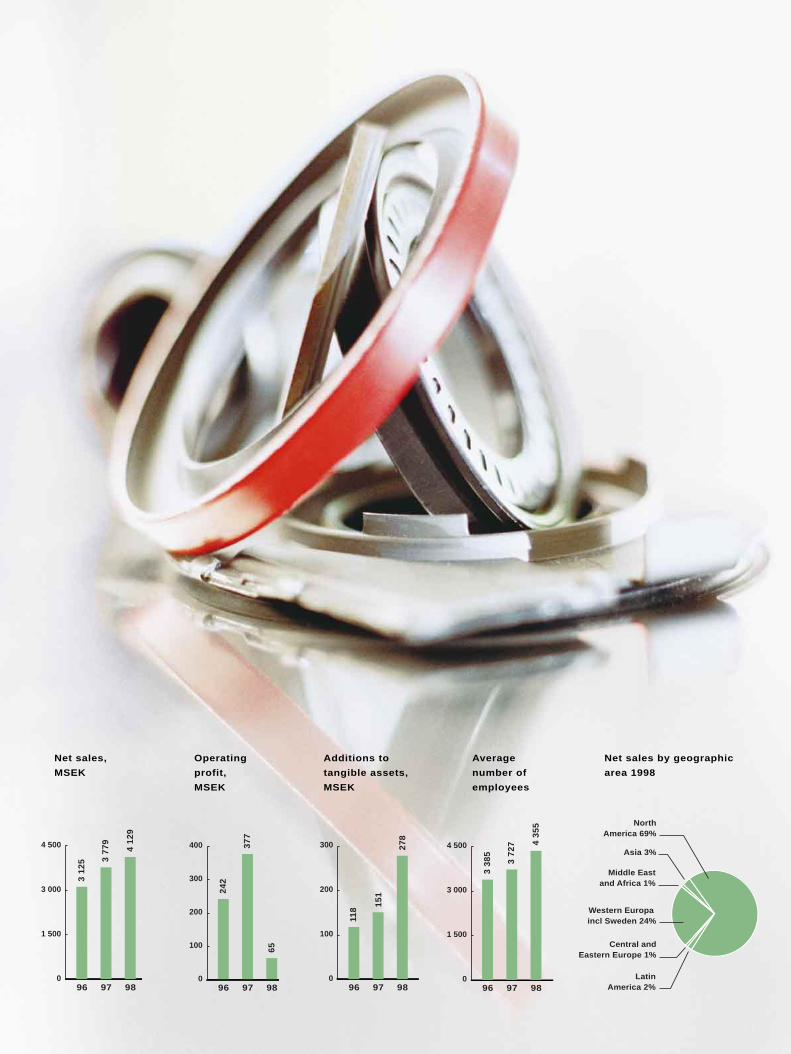
96 97 98
3 12
5 3 77
9
4 12
9
0
100
200
300
400
96 97 98
242
377
65
0
100
200
300
96 97 98
118
151
278
0
1 500
3 000
4 500
96 97 98
3 38
5
3 72
7 4 35
5
Asia 3%
NorthAmerica 69%
LatinAmerica 2%
Middle Eastand Africa 1%
Central andEastern Europe 1%
Western Europa incl Sweden 24%
Operating
profit,
MSEK
Additions to
tangible assets,
MSEK
Average
number of
employees
Net sales by geographic
area 1998
Net sales,
MSEK

20
With a large fleet of 230 trucks and more than 1 000 trailers, Jeff Kelly fromG&D Transportation, Loves Park, Illinois in the United States, is an importantcustomer for Chicago Rawhide. The company hauls various types of mixedfreight throughout the North American continent. G&D Transportation receivesits service and deliveries of CR seals and SKF bearings through TransAmTruck & Trailer Parts Inc. in Rockford, Illinois. TransAm is a well-equipped supplier of spare parts for heavy trucks and is a selected distributor of CRproducts. The company supplies not only individual truck owners but alsodelivers to the larger trucking companies, as shown here.

In order to restore profitability withinChicago Rawhide, the largest company inthe Seals Division, a comprehensiverestructuring program was initiated. At thesame time a number of new products, suchas a bonded piston seal for automatic gear-boxes and valve stem seals, was launched.
Seals operations in Western Europe con-sist of CR Elastomere in Germany, whichproduces seals for the European automotiveindustry and RFT in Italy, which produces a
range of seals for rolling bearings andshock absorbers.
Sales of seals to customers in WesternEurope developed positively during theyear. The Seals Division also benefitedfrom the favorable growth in the Europeanautomotive industry. Sales of new productssuch as valve stem seals with integratedsprings and new solutions for truck axlesalso contributed to the division’s growth inEurope.
North America accounts for 69%of the division’s sales. Theimprovement in earnings in thedivision’s European operations
could not offset the major decline in theUS. The important North American auto-motive aftermarket was exposed to exten-sive restructuring in the distributor area.This had an adverse effect on the division’searnings, since it resulted in increased costsfor business development at new customers.
The Seals Division’s sales rose by 9.3% in 1998 to MSEK 4129. The division’s operating profit declined
to MSEK 65 in 1998 from MSEK 377 in 1997,primarily as a result of the unsatisfactory market trend in
North America. Excluding provisions the division posted an operating profit of MSEK 164.
21
The new sign common to all distributors of Chicago Rawhide andSKF automotive aftermarket products.
A typical truck unit for the US heavy vehicles market, a key customer segment for Chicago Rawhide.

22
S E A L S
The building of a production base inAsia, which started a couple of years agothrough the majority acquisition of a Chi-nese seals company, continued during 1998.SKF acquired 50% of the Korean sealscompany, KFOS, which has now beenrenamed CR Korea.
In India, Chicago Rawhide established awholly owned subsidiary in Bangalore dur-ing autumn 1997. Following preparatorywork, production is expected to commenceduring the first quarter of 1999.
During the year, CR Mexicana alsobecame a wholly owned subsidiary throughChicago Rawhide’s acquisition of the Mexi-can partner’s 60% shareholding.
Global seals market
The total market for elastomeric products,which is how the Seals Division has chosento define its market, is approximately SEK80 billion.
The leading companies within the elas-tomeric products area are Freudenberg/NOK (a German/Japanese alliance),Chicago Rawhide, America’s FederalMogul and Dana, and the TI Group inEurope. During the year, a number of struc-tural changes occurred among the Ameri-can competitors, but not within the segmentin which Chicago Rawhide has its corebusiness.
Chicago Rawhide is the leading supplierof radial seals in the North American market.
Repair of machine parts in the engine bay of aheavy truck at Rockford Truck Sales and Service.
Miele, a German customer of the SKF Group is equipping its washingmachines with SKF deep groove ball bearings and CR seals. Thedynamic seal, see cut-out picture, has a special labyrinth feature towardsthe water side of the washing machine drum, in order to prevent washingpowder residuals from influencing the sealability of the unit.

Asia 3%
NorthAmerica 23%
Central andEastern Europe 1%
Middle Eastand Africa 1%
Western Europe excl Sweden 50%
Sweden 22%
0
1 000
2 000
3 000
4 000
96 97 98
3 27
1
3 39
1
3 22
9
0
50
100
150
200
250
96 97 98
153
242
1
0
150
300
450
96 97 98
334
419
221
0
1 000
2 000
3 000
96 97 98
2 96
2
2 79
2
2 68
6
Operating
profit,
MSEK
Additions to
tangible assets,
MSEK
Average
number of
employees
Net sales by geographic
area 1998
Net sales,
MSEK
24
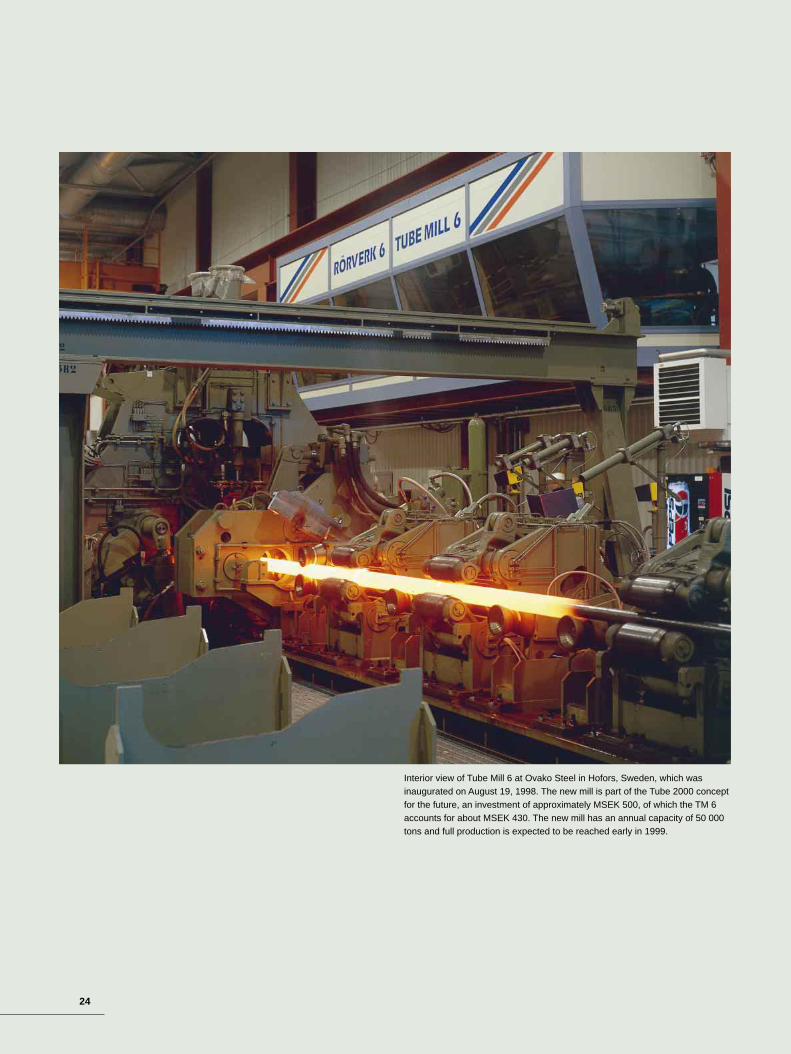
Interior view of Tube Mill 6 at Ovako Steel in Hofors, Sweden, which was inaugurated on August 19, 1998. The new mill is part of the Tube 2000 conceptfor the future, an investment of approximately MSEK 500, of which the TM 6accounts for about MSEK 430. The new mill has an annual capacity of 50 000tons and full production is expected to be reached early in 1999.

25
The Western European market forspecial steels was marked bystrong demand and increasingvolumes during the first half of
the year. The second half was characterizedby rapidly declining demand. Measures toadapt both production and manning to thenew conditions became necessary.
In North America, which accounts forone fourth of the sales, demand alsodeclined significantly during the secondhalf of the year, due, among other reasons,to a sharp decline in the oil industry.
The weaker market conditions during thesecond half led to a deterioration in bothsales and earnings. Profit was alsoadversely affected by the running-in costsrelated to the new tube mill in Hofors.
The new tube mill, an investment ofabout MSEK 500, was inaugurated inAugust and contributes capacity of 50 000
tons. The addition of this new mill strength-ened Ovako Steel’s position as a leadingsupplier of seamless hot-rolled tubes.
During 1998, preparatory work was initi-ated for a new and totally integrated systemthat will cover all of the administrative rou-tines in the company. In January 1999, thefirst step in the process was taken, when thesystem was introduced within the account-ing, purchasing and maintenance areas. Theremaining administrative departments willadopt the new system in April 1999.
On the marketing side, continued effortsare being made to increase sales to customersoutside the SKF Group. The proportion ofoutside sales increased during the year.
Global steel market
Ovako Steel is Europe’s leading supplier ofrolling-bearing steel. The company is alsothe world’s largest producer of through-hardening steel for rolling bearings. OvakoSteel holds a unique position by being theonly company to produce a combination ofbars, tubes and rolled rings.
Certain European competitors are cur-rently phasing out their production of barproducts in order to focus on flat steel prod-ucts. As a result, Germany’s Thyssen hasdisposed of Nedstaal and the French com-pany, Usinor, has announced that it intendsto withdraw from Asco, an Ovako Steelcompetitor.
America’s Timken, which like SKF hasits own steel production operations, hastaken over the UK’s Desford, which pro-duces tubes for bearing production.
Sales of steel,which declined gradually during the fiscal year, totalled MSEK 3229,down slightly
compared with sales of MSEK 3 391 in 1997. The operating profit amounted to MSEK 1 for 1998,
compared with a profit of MSEK 242 in 1997. Excluding provisions,the operating profit amounted
to MSEK45.
Special steel tube being cut to length for Italian customers at a distribution plant in Milan, where Sandvik Italia distributes Ovako Steel’s products.
Financial risks
SKF’s operations are exposed to currencyrisks, interest-rate risks and credit risks.
The Group’s financial policy clearlydefines currency, interest-rate and creditrisks and establishes responsibility andauthority for the management of financialrisks. This policy states that the objective isto eliminate or minimize risk and to con-tribute to a better return on Group assetsthrough an active management of risks.
The management of these risks, andresponsibility for all treasury operations, islargely centralized in SKF Treasury Centre,the Group’s internal bank.
Currency risks
The currency risks to which the Group isexposed consist of changes in exchangerates in future flows of payments, transac-tion exposure, as well as the revaluation ofresults, assets and liabilities in foreign cur-
26
Overall objective
SKF’s overall financial objective is to createvalue for its shareholders through providinga sustainable and market-comparable returnin the form of dividends and value appreci-ation. Over time, the return requirement onthe shareholders’ investment in SKF, themarket-value shareholders’ equity, shouldexceed the risk-free interest rate by about5-6 percentage points. This is the basis forSKF’s decisions on financial objectives inits operations.
Management model
SKF’s management model is a simplifiedeconomic value-added model. It is intendedto create value for shareholders and, conse-quently, promotes improved margins, capi-tal reductions and profitable growth. Themodel is linked to operating income, lesstaxes paid and costs for own and externalcapital in accordance with generally accept-ed principles. The result shows a good cor-relation with the trend of the share price.Group management’s bonus and option pro-grams are based on this model.
Capital costs, return requirement
Currently, a weighted capital cost is used inSKF’s management model in which costsafter tax for shareholders’ equity is about6% higher than interest on governmentbonds. Accordingly, the weighted capitalcost after tax in the present interest situa-tion is approximately 7.5%. This corre-sponds to the average return requirementover an economic cycle which the companymust exceed to create value for its share-holders. The weighted capital cost and thereturn requirement are calculated based onthe market value of shareholders’ equity.
Financial position
A strong financial position and good creditrating are prerequisites for solid long-termgrowth and profitability in a business that issensitive to changes in economic condi-tions. These factors also contribute to stabi-lizing the share price development.
SKF’s objective is to have a solvency ofapproximately 35%.
Dividend policy
SKF’s dividend policy is based on the prin-
ciple that the dividend should be adapted tothe trend of earnings and cash flow, takinginto account the Group’s developmentpotential and financial position. The Boardof Directors’ view is that the dividendshould amount to approximately one thirdof SKF’s average net result, calculated overan economic cycle.
Financing
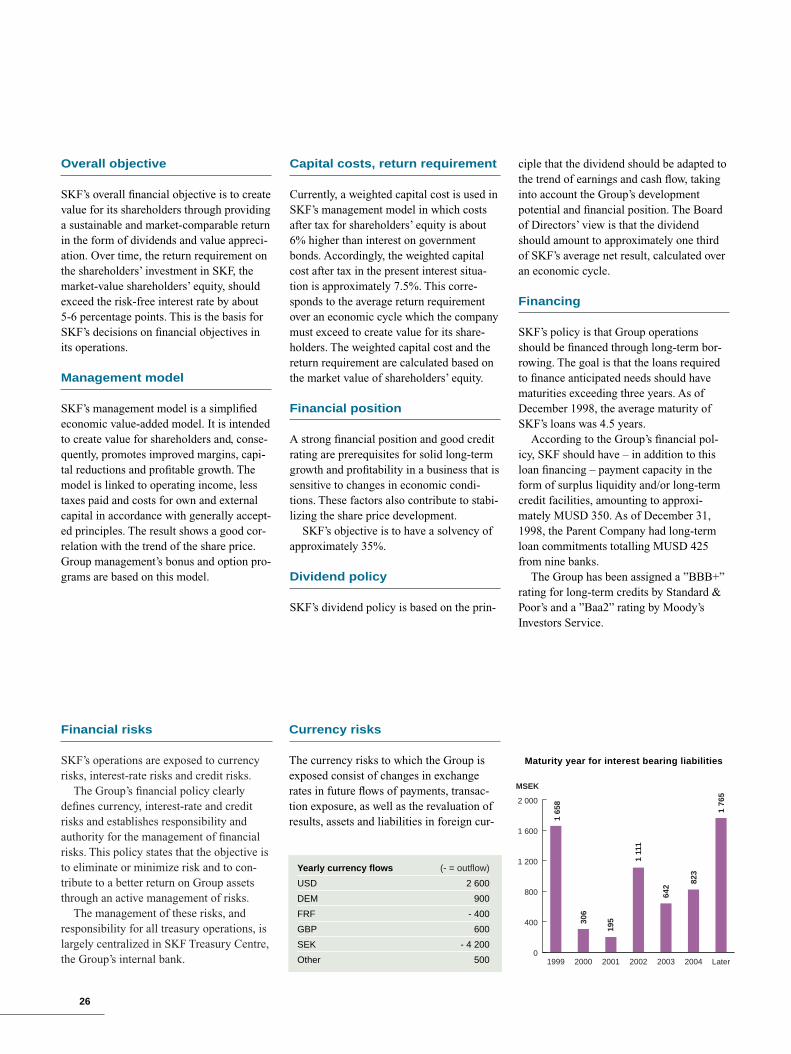
SKF’s policy is that Group operationsshould be financed through long-term bor-rowing. The goal is that the loans requiredto finance anticipated needs should havematurities exceeding three years. As ofDecember 1998, the average maturity ofSKF’s loans was 4.5 years.
According to the Group’s financial pol-icy, SKF should have – in addition to thisloan financing – payment capacity in theform of surplus liquidity and/or long-termcredit facilities, amounting to approxi-mately MUSD 350. As of December 31,1998, the Parent Company had long-termloan commitments totalling MUSD 425from nine banks.
The Group has been assigned a ”BBB+”rating for long-term credits by Standard &Poor’s and a ”Baa2” rating by Moody’sInvestors Service.
Yearly currency flows (- = outflow)
USD 2 600
DEM 900
FRF - 400
GBP 600
SEK - 4 200
Other 5000
400
800
1 200
1 600
2 000
Later200420032002200120001999
1 65
8
306
195
1 11
1
642
823
1 76
5
MSEK
Maturity year for interest bearing liabilities
27
E M U
rencies when these currencies are translatedto Swedish kronor, translation exposure.
Transaction exposureThe Group’s principal commercial flows offoreign currencies pertain to exports fromEurope to North America and Asia, and toflows of currencies within Europe. Theintroduction of the euro will reduce the cur-rency risks for SKF’s European operations.Over the long term, SKF is seeking toestablish a balance between production andsales within the European, American andAsian zones, respectively.
SKF has flows in some 20 currencies.The total flow of goods exceeds MSEK31 000. After offsetting flows in the samecurrency, the net flow amounts to approxi-mately MSEK 7 500. The flows that – dueto their size – could have a major impact onSKF’s income are inflows in USD, DEMand GBP that are converted into SEK, FRFand ITL. Fluctuations of approximately10% in foreign exchange rates in these cur-rencies can affect Group result by a coupleof hundred million kronor.
SKF’s policy is to hedge currency flowsfor three to six months on average. This isthe length of time deemed to be required toadjust to new conditions. Within the frame-work of established risk limits, it is possiblefor SKF Treasury Center to make deviationsfrom this average period. Risks are managed
based on a risk-evaluation system that takesinto account the volatility of currencies aswell as their mutual relationship. As of year-end, the lengths of the actual forward con-tracts conformed with the basic policy.
Translation exposureGroup result is also affected by the effect oftranslating the results of foreign subsidiariesto Swedish kronor. When there is a changeof approximately 10% in the value of thekrona, this effect can also amount to a couple of hundred million kronor, depend-ing on the country in which the result aroseand the respective currency movement inrelation to the Swedish krona.
The Group is also affected by the transla-tion to Swedish kronor of net assets heldoutside Sweden. At year-end 1998, SKF’snet foreign assets amounted to MSEK10 000. For the time being these currenciesare not hedged. Translation effects in for-eign net assets do not have any impact onGroup result but are transferred directly toshareholders equity.
Economic exposureSKF’s principal competitors have thegreater part of their production capacity inGermany, the US or Japan. Currencychanges affecting those countries’ cost situ-ation primarily in relation to Sweden, Italyand France, where SKF, in addition to Ger-
many and the US, has substantial manufac-turing operations, affect SKF’s competitive-ness in relation to these competitors.
Interest-rate risks
The risk associated with interest rates is thatchanges in interest rates will have a nega-tive impact on Group result. SKF’s basicpolicy for establishing fixed-interest-rateperiods is that the average duration shouldbe six months. This applies to borrowing aswell as investment of funds and alsoincludes the use of derivatives.
The composition of the Group’s interest-rate portfolio is diversified. Normal changesin interest rates are not considered to haveany significant impact on SKF’s result.
Credit risks
Credit risks pertain to the creditworthinessof counterparties. Credit risks that arise as aresult of trading in financial instruments andin connection with the investment of liquidfunds are carefully defined in the financialpolicy. Transactions are carried out onlywithin established limits, and with counter-parties who have good credit ratings.
On January 1, 1999, the common currencyknown as the euro was introduced in the 11member nations of the European MonetaryUnion (EMU).
SKF conducts extensive business opera-tions in EMU, with strong concentration inGermany, France and Italy. In 1998, EMUcountries accounted for approximately 45%of Group net sales and more than 50% ofGroup production.
The new euro currency, accordingly, willhave far-reaching effects on SKF’s opera-
tions, despite Sweden remaining outsideEMU for the time being.
SKF’s euro policy
SKF developed a euro policy during 1998to introduce the new currency in theGroup’s operational activities, whereby:• SKF companies in EU countries concludetheir sales and purchasing transactionsbased on the euro effective January 1, 1999.• SKF has been distributing price lists
quoted in euro to EU countries since January 1, 1999.• SKF has been equipped to send andreceive invoices and payments in both euroand the local currencies of EU countriessince January 1, 1999. • During the transitional period from 1999through 2001, SKF’s customers have theoption to select either the euro or their localcurrency as their invoicing currency.
28
The Year 2000 issue refers to the risk thatsystems, products and equipment havingdate-sensitive components will not recog-nize the year 2000. Throughout this dis-closure SKF uses the generic phrase ”year2000 compliant” to mean that a system,product or equipment will perform itsintended functions on or after January 1,2000 the same as it did before January 1,2000.
1. The SKF Year 2000 Project
SKF has been actively addressing Year 2000issues since 1996. In 1997 SKF decided tocoordinate all Year 2000 activities centrally.The progress and status of the Year 2000Project is reported to SKF Group Manage-ment every second month by the ProjectLeader.
Each Group Division, staff unit and ser-
vice unit has a Year 2000 Project Leader.Each Project Leader has his/her own ProjectTeam. In total approximately 350 people areinvolved in SKF’s Year 2000 Project on afull or part time basis.
SKF’s Year 2000 Project includes identi-fying the potential risk areas, increasingrisk awareness and introducing action plansfor managing Year 2000 issues.
2. State of Readiness
IT Applications and IT PlatformsMapping and risk assessment of IT Applica-tions (computer programs and databases) andIT Platforms (hardware, networks, operatingsystems, etc) including supplier complianceevaluations have been completed and most
Since 1985 SKF is quoted on the NASDAQ stock exchange. As a consequence, SKF
each year submits to the Securities and Exchange Commission (SEC) certain financial
and other information. For 1998 SEC has requested specific information related to the
handling of the year 2000 issue. The below is the information that SKF intends to sub-
mit to SEC regarding SKF's handling of the year 2000 issue.
SKF’s EMU project
In November 1996, SKF appointed a work-ing group to evaluate the effects of an even-tual introduction of a common currency inEurope.
The preparations have encompassedstrategic, financial, legal and infrastructuralaspects of information technology, financialaccounting and reporting.
Strategic aspectsSKF operates in an international industry,and the introduction of a common currencyin Europe is not expected to create any sig-nificant changes in the Group’s strategicdirection. SKF has treated Europe as a single market for the past several years.
A change in the Group’s overall directionof operations, or geographical localization,as a direct consequence of the new cur-rency’s introduction should not be expected,based on information available today.
Financial aspectsBecause of the broad geographical spreadof Group operations, SKF is exposed to a
complex situation regarding currency risks.Introduction of the euro will simplify theGroup’s risk situation, since the number ofcurrencies handled will be smaller. Further-more, the euro will provide increasedopportunities for more effective manage-ment of the Group’s liquid assets.
Infrastructural aspectsInformation technology will require thelargest work input to prepare for conversionto euro as the Group’s accounting andreporting currency.
Over the past two years, common andlocal systems for purchasing, sales and pro-duction have been reviewed and prepared tohandle the new currency for invoicing andpayments, effective January 1, 1999.
Beginning in 1999, euro is being used bySKF as the base currency in certain internalcost calculations used in the Group’s pro-duction process.
Companies in the SKF Group will switchover from their local currencies to the eurofor accounting and financial reporting pur-poses during the period 2000 to 2001. Vari-ous countries will probably switch to the
euro at different times. The intention is thatall companies within a given country shouldmake the conversion simultaneously.
During 1998, installation was started of aGroup-wide finance and accounting systemcalled SARA (SKF Accounting and Report-ing Applications), which is intended to beimplemented at all of SKF’s major Euro-pean companies in the run-up to the year2000. To minimize costs incurred to adaptexisting financial systems to the new cur-rency, the transition to euro as the financeand accounting currency will be completedafter implementation of SARA in the com-pany concerned.
Other IT-systems affected by conversionto euro as the finance and accounting cur-rency will be adapted for the currencyswitch in parallel with the transition by theSKF companies in EU countries to eurofrom their local currencies.
According to present Swedish legislation,it is not permissible for companies with head-quarters in Sweden to prepare their financialreports in any currency other than Swedishkronor. SKF’s financial accounts for 1999,consequently, will be prepared in SEK.
Y E A R 2 0 0 0
29
business critical systems have been remedi-ated and tested. The aim is to have the ITApplications and Platforms Year 2000 com-pliant by the end of June 1999. However,some lower risk systems are not expected tobe compliant before the third quarter of 1999.
Embedded SystemsMapping and risk assessment of EmbeddedSystems (electronic components and micro-chips) has been completed and remediationand verification testing are in progress. Theembedded systems are expected to be Year2000 compliant by the end of June 1999.
Products Very few of SKF’s products contain hard-ware, software or any devices that will beaffected by the Year 2000 issue. Most prod-ucts that will be affected by the year 2000issue are already Year 2000 compliant. Forthose products which to date are not Year2000 compliant, SKF aims to have compli-ance solutions in place during the secondquarter of 1999.
Third PartiesSKF’s Year 2000 activities include analysesand checks with third parties regarding theirYear 2000 plans and readiness. Major cus-tomers, suppliers, banks and public authori-ties with whom SKF has a material relation-ship have been asked about their Year 2000plans and readiness.
Suppliers have been segregated into twocategories i e key and non-key suppliers.Suppliers in both categories have beenasked for satisfactory commitments on theirYear 2000 readiness. Key suppliers havealso been requested to complete an assess-ment questionnaire and a document describ-ing their Year 2000 plans and status. SKF iscontinuously following up this process. Inaddition SKF is also performing audits witha number of its key suppliers. Most of theaudits are planned to be completed by theend of April 1999.
3. Costs
The costs directly related to Year 2000issues are in total expected to be in therange of MSEK 130-160 of which 60% has
been spent up to and including 1998, while40% remains for activities to be completedduring 1999.
Of the total costs of MSEK 130-160approximately 60% consists of internalmanpower and around 40% of externalexpenses for hardware, software and sub-contractors. Cost estimates may vary in thefuture and will be updated as SKF gets addi-tional information concerning the status ofits and third parties’Year 2000 compliance.
The internal manpower cost does notrepresent incremental cost to the Group butrather represents the re-deployment of exist-ing resources.
External expenses are included in normalbusiness budgets. SKF does not believe thatthe incremental costs of addressing Year2000 issues will have a material adverseeffect on its consolidated results of opera-tions, liquidity or capital resources.
Approximately 5% of the yearly IT bud-get during 1998 and 1999 is used for Year2000 remediations. No major IT projectshave been deferred due to the Year 2000efforts. When judging the share of the ITbudget used for Year 2000 remediation oneshould note the advantages of having glob-ally deployed standardized and common ITsolutions within the SKF Group.
These forecasted costs do not include thecost of potential business interruptions,additional remediation activities after Janu-ary 1, 2000 or third party potential claims.They merely cover all costs related to SKF’sefforts to be Year 2000 compliant byDecember 31, 1999.
4. Risks and Contingency Plans
The most reasonably likely worst case Year2000 scenarios are the following: (i) no rawmaterial supply, which would mean that oneor several factories stop production; (ii) lossof power/electricity supply, which wouldmean that one or several factories stop pro-duction; (iii) the systems supporting SKF’swarehouses fail to function, which wouldseverely affect SKF’s ability to deliver prod-ucts to its customers; and (iv) communica-tions (i e internal networks and/or externalnetworks) fail to function, which would
mean a stop in the integrated systems chainboth within and outside SKF.
Approximately 65% of the raw materialis supplied from within the SKF Group.Consequently the reliability of this sourceof supply can be more effectively controlledwith regard to Year 2000 readiness thanexternal sources.
The approximately 80 factories withinthe SKF Group are globally dispersed. Therisk exposure from e g loss of power supplyis thus local and not concentrated.
To minimize the potential impact of themost reasonably likely worst case scenario,SKF is developing contingency plans whichare expected to be finalized in due timebefore January 1, 2000. Finalized contin-gency plans could involve alternativesources of supply, inventory adjustments,manual handling of orders and goods inwarehouses, improvement of existing con-tingency plans for communications, cre-ation of an emergency task force and plan-ning of SKF’s business activities during themillennium shift in order to minimize therisk exposure.
SKF has made certain statements hereinwhich are not historical facts. These state-ments include SKF’s expectations aboutwhen it will be Year 2000 compliant, SKF’sexpectations about the impact of the Year2000 problem on its ability to continue tooperate on and after January 1, 2000, thecosts associated with the Year 2000 Pro-gram, and worst-case scenarios. SKF wishesto caution the reader that there are many fac-tors that could cause the actual results to dif-fer materially from these statements. This isespecially the case because many aspects ofSKF’s Year 2000 Program are outside SKF’scontrol such as the performance of third par-ties. Further, as a global company SKF oper-ates in many different countries, in whichthe Year 2000 issue may be addressed in dif-ferent ways and to a different extent. As aresult, there may be unforeseen problems indifferent parts of the world. All of these fac-tors make it impossible for SKF to ensurethat it will be able to resolve all year 2000related problems in a timely manner to avoidmaterial adverse affect on its operations orbusiness or exposure of SKF to third partyliability.
Y E A R 2 0 0 0
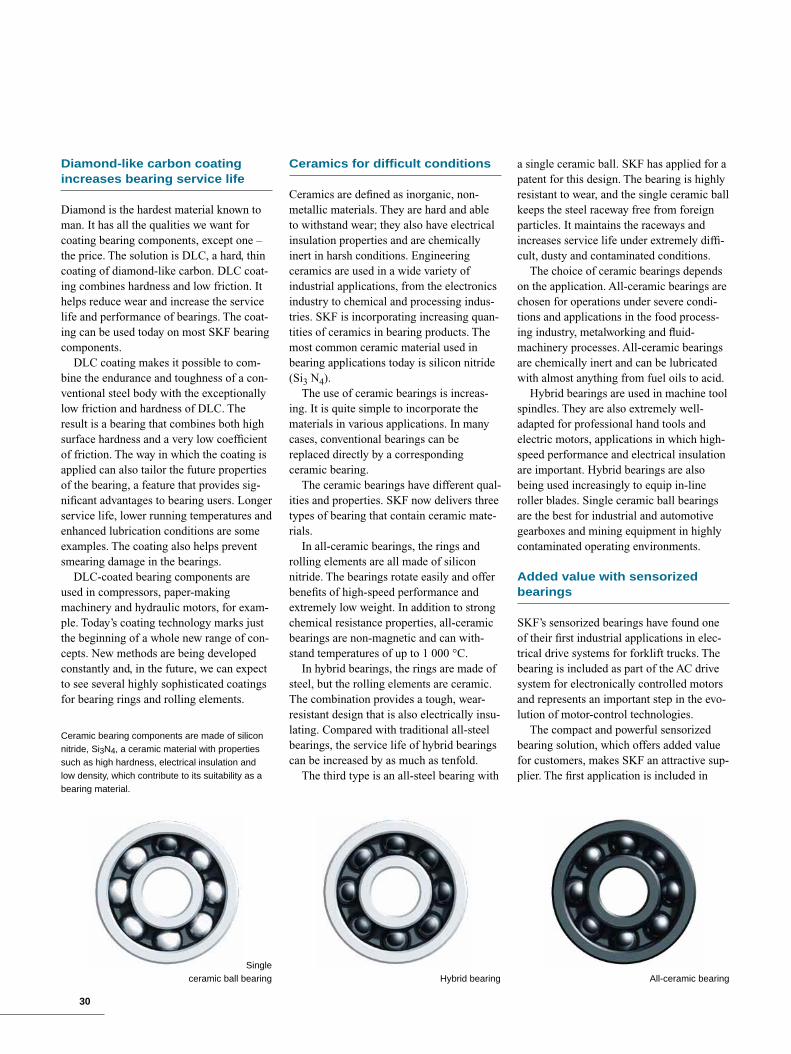
30
Diamond-like carbon coatingincreases bearing service life
Diamond is the hardest material known toman. It has all the qualities we want forcoating bearing components, except one –the price. The solution is DLC, a hard, thincoating of diamond-like carbon. DLC coat-ing combines hardness and low friction. Ithelps reduce wear and increase the servicelife and performance of bearings. The coat-ing can be used today on most SKF bearingcomponents.
DLC coating makes it possible to com-bine the endurance and toughness of a con-ventional steel body with the exceptionallylow friction and hardness of DLC. Theresult is a bearing that combines both highsurface hardness and a very low coefficientof friction. The way in which the coating isapplied can also tailor the future propertiesof the bearing, a feature that provides sig-nificant advantages to bearing users. Longerservice life, lower running temperatures andenhanced lubrication conditions are someexamples. The coating also helps preventsmearing damage in the bearings.
DLC-coated bearing components areused in compressors, paper-makingmachinery and hydraulic motors, for exam-ple. Today’s coating technology marks justthe beginning of a whole new range of con-cepts. New methods are being developedconstantly and, in the future, we can expectto see several highly sophisticated coatingsfor bearing rings and rolling elements.
Ceramics for diffi cult conditions
Ceramics are defined as inorganic, non-metallic materials. They are hard and ableto withstand wear; they also have electricalinsulation properties and are chemicallyinert in harsh conditions. Engineeringceramics are used in a wide variety ofindustrial applications, from the electronicsindustry to chemical and processing indus-tries. SKF is incorporating increasing quan-tities of ceramics in bearing products. Themost common ceramic material used inbearing applications today is silicon nitride(Si3 N4).
The use of ceramic bearings is increas-ing. It is quite simple to incorporate thematerials in various applications. In manycases, conventional bearings can bereplaced directly by a correspondingceramic bearing.
The ceramic bearings have different qual-ities and properties. SKF now delivers threetypes of bearing that contain ceramic mate-rials.
In all-ceramic bearings, the rings androlling elements are all made of siliconnitride. The bearings rotate easily and offerbenefits of high-speed performance andextremely low weight. In addition to strongchemical resistance properties, all-ceramicbearings are non-magnetic and can with-stand temperatures of up to 1 000 °C.
In hybrid bearings, the rings are made ofsteel, but the rolling elements are ceramic.The combination provides a tough, wear-resistant design that is also electrically insu-lating. Compared with traditional all-steelbearings, the service life of hybrid bearingscan be increased by as much as tenfold.
The third type is an all-steel bearing with
a single ceramic ball. SKF has applied for apatent for this design. The bearing is highlyresistant to wear, and the single ceramic ballkeeps the steel raceway free from foreignparticles. It maintains the raceways andincreases service life under extremely diffi-cult, dusty and contaminated conditions.
The choice of ceramic bearings dependson the application. All-ceramic bearings arechosen for operations under severe condi-tions and applications in the food process-ing industry, metalworking and fluid-machinery processes. All-ceramic bearingsare chemically inert and can be lubricatedwith almost anything from fuel oils to acid.
Hybrid bearings are used in machine toolspindles. They are also extremely well-adapted for professional hand tools andelectric motors, applications in which high-speed performance and electrical insulationare important. Hybrid bearings are alsobeing used increasingly to equip in-lineroller blades. Single ceramic ball bearingsare the best for industrial and automotivegearboxes and mining equipment in highlycontaminated operating environments.
Added value with sensorizedbearings
SKF’s sensorized bearings have found oneof their first industrial applications in elec-trical drive systems for forklift trucks. Thebearing is included as part of the AC drivesystem for electronically controlled motorsand represents an important step in the evo-lution of motor-control technologies.
The compact and powerful sensorizedbearing solution, which offers added valuefor customers, makes SKF an attractive sup-plier. The first application is included in
All-ceramic bearing
Ceramic bearing components are made of siliconnitride, Si3N4, a ceramic material with propertiessuch as high hardness, electrical insulation andlow density, which contribute to its suitability as abearing material.
Single ceramic ball bearing Hybrid bearing
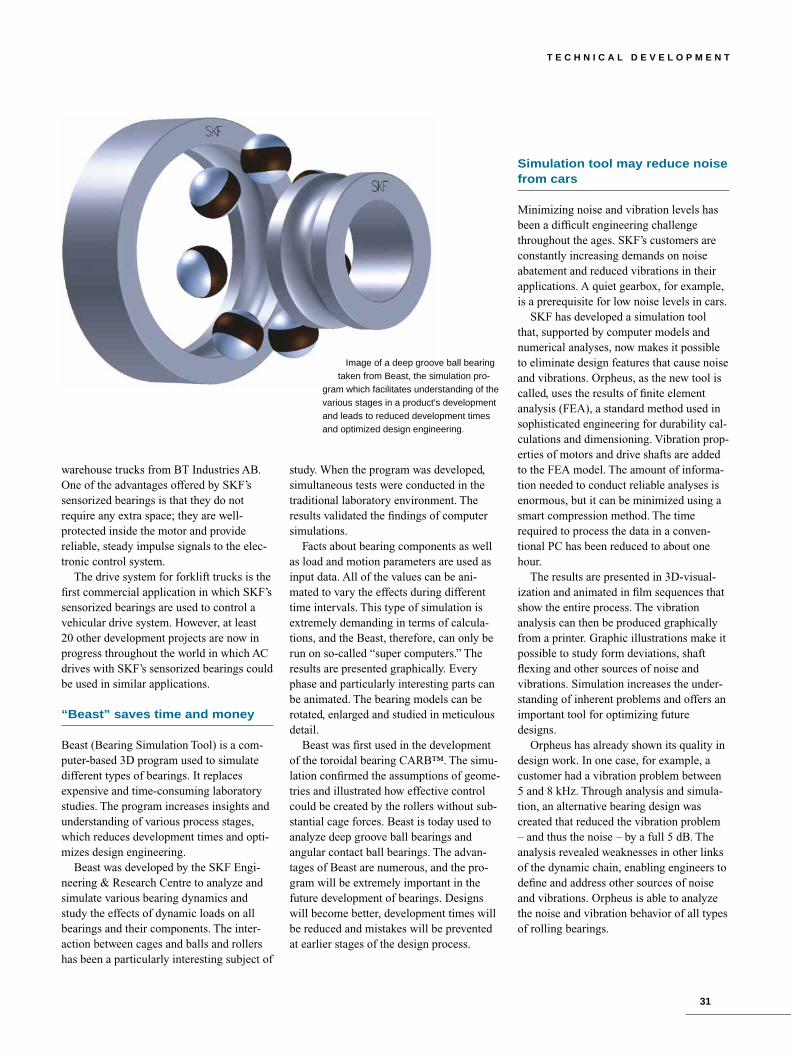
31
warehouse trucks from BT Industries AB.One of the advantages offered by SKF’ssensorized bearings is that they do notrequire any extra space; they are well-protected inside the motor and provide reliable, steady impulse signals to the elec-tronic control system.
The drive system for forklift trucks is thefirst commercial application in which SKF’ssensorized bearings are used to control avehicular drive system. However, at least20 other development projects are now inprogress throughout the world in which ACdrives with SKF’s sensorized bearings couldbe used in similar applications.
“Beast” saves time and money
Beast (Bearing Simulation Tool) is a com-puter-based 3D program used to simulatedifferent types of bearings. It replacesexpensive and time-consuming laboratorystudies. The program increases insights andunderstanding of various process stages,which reduces development times and opti-mizes design engineering.
Beast was developed by the SKF Engi-neering & Research Centre to analyze andsimulate various bearing dynamics andstudy the effects of dynamic loads on allbearings and their components. The inter-action between cages and balls and rollershas been a particularly interesting subject of
study. When the program was developed,simultaneous tests were conducted in thetraditional laboratory environment. Theresults validated the findings of computersimulations.
Facts about bearing components as wellas load and motion parameters are used asinput data. All of the values can be ani-mated to vary the effects during differenttime intervals. This type of simulation isextremely demanding in terms of calcula-tions, and the Beast, therefore, can only berun on so-called “super computers.” Theresults are presented graphically. Everyphase and particularly interesting parts canbe animated. The bearing models can berotated, enlarged and studied in meticulousdetail.
Beast was first used in the developmentof the toroidal bearing CARB™. The simu-lation confirmed the assumptions of geome-tries and illustrated how effective controlcould be created by the rollers without sub-stantial cage forces. Beast is today used toanalyze deep groove ball bearings andangular contact ball bearings. The advan-tages of Beast are numerous, and the pro-gram will be extremely important in thefuture development of bearings. Designswill become better, development times willbe reduced and mistakes will be preventedat earlier stages of the design process.
Simulation tool may reduce noisefrom cars
Minimizing noise and vibration levels hasbeen a difficult engineering challengethroughout the ages. SKF’s customers areconstantly increasing demands on noiseabatement and reduced vibrations in theirapplications. A quiet gearbox, for example,is a prerequisite for low noise levels in cars.
SKF has developed a simulation toolthat, supported by computer models andnumerical analyses, now makes it possibleto eliminate design features that cause noiseand vibrations. Orpheus, as the new tool iscalled, uses the results of finite elementanalysis (FEA), a standard method used insophisticated engineering for durability cal-culations and dimensioning. Vibration prop-erties of motors and drive shafts are addedto the FEA model. The amount of informa-tion needed to conduct reliable analyses isenormous, but it can be minimized using asmart compression method. The timerequired to process the data in a conven-tional PC has been reduced to about onehour.
The results are presented in 3D-visual-ization and animated in film sequences thatshow the entire process. The vibrationanalysis can then be produced graphicallyfrom a printer. Graphic illustrations make itpossible to study form deviations, shaftflexing and other sources of noise andvibrations. Simulation increases the under-standing of inherent problems and offers animportant tool for optimizing futuredesigns.
Orpheus has already shown its quality indesign work. In one case, for example, acustomer had a vibration problem between5 and 8 kHz. Through analysis and simula-tion, an alternative bearing design was created that reduced the vibration problem – and thus the noise – by a full 5 dB. Theanalysis revealed weaknesses in other linksof the dynamic chain, enabling engineers todefine and address other sources of noiseand vibrations. Orpheus is able to analyzethe noise and vibration behavior of all typesof rolling bearings.
Image of a deep groove ball bearingtaken from Beast, the simulation pro-
gram which facilitates understanding of thevarious stages in a product’s developmentand leads to reduced development timesand optimized design engineering.
T E C H N I C A L D E V E L O P M E N T
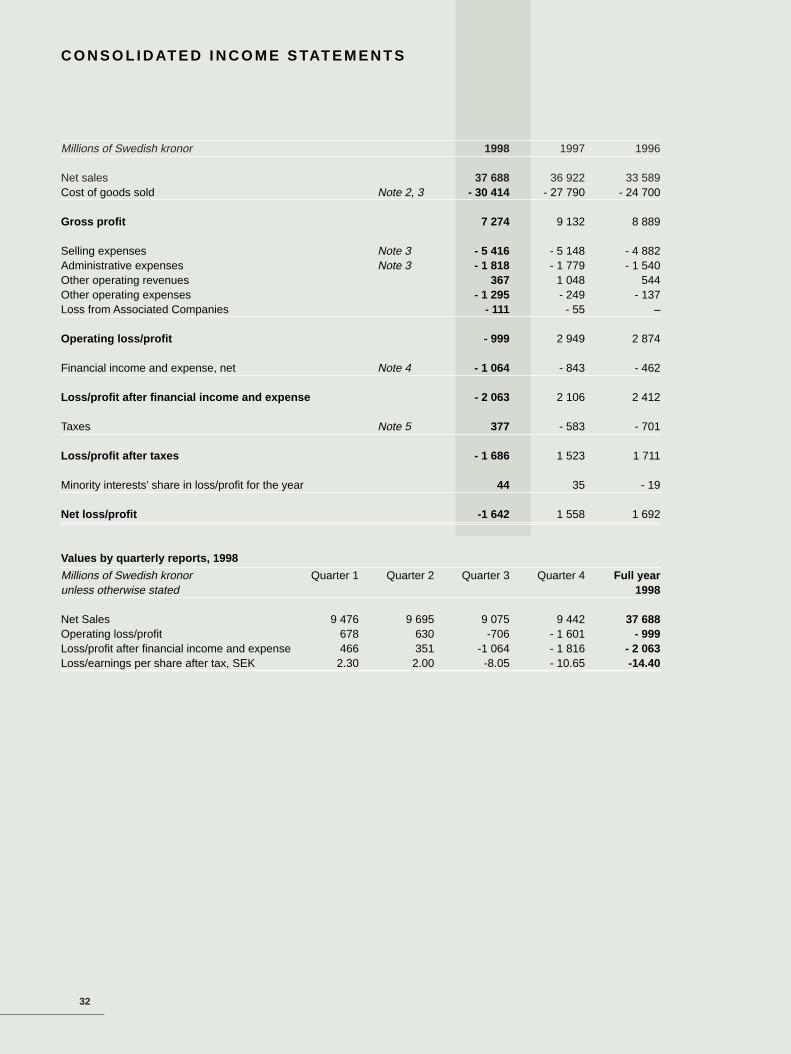
32
C O N S O L I D AT E D I N C O M E S TAT E M E N T S
Millions of Swedish kronor 1998 1997 1996
Net sales 37 688 36 922 33 589Cost of goods sold Note 2, 3 - 30 414 - 27 790 - 24 700
Gross profit 7 274 9 132 8 889
Selling expenses Note 3 - 5 416 - 5 148 - 4 882Administrative expenses Note 3 - 1 818 - 1 779 - 1 540Other operating revenues 367 1 048 544Other operating expenses - 1 295 - 249 - 137Loss from Associated Companies - 111 - 55 –
Operating loss/profit - 999 2 949 2 874
Financial income and expense, net Note 4 - 1 064 - 843 - 462
Loss/profit after financial income and expense - 2 063 2 106 2 412
Taxes Note 5 377 - 583 - 701
Loss/profit after taxes - 1 686 1 523 1 711
Minority interests’ share in loss/profit for the year 44 35 - 19
Net loss/profit -1 642 1 558 1 692
Values by quarterly reports, 1998
Millions of Swedish kronor Quarter 1 Quarter 2 Quarter 3 Quarter 4 Full yearunless otherwise stated 1998
Net Sales 9 476 9 695 9 075 9 442 37 688Operating loss/profit 678 630 -706 - 1 601 - 999Loss/profit after financial income and expense 466 351 -1 064 - 1 816 - 2 063Loss/earnings per share after tax, SEK 2.30 2.00 -8.05 - 10.65 -14.40
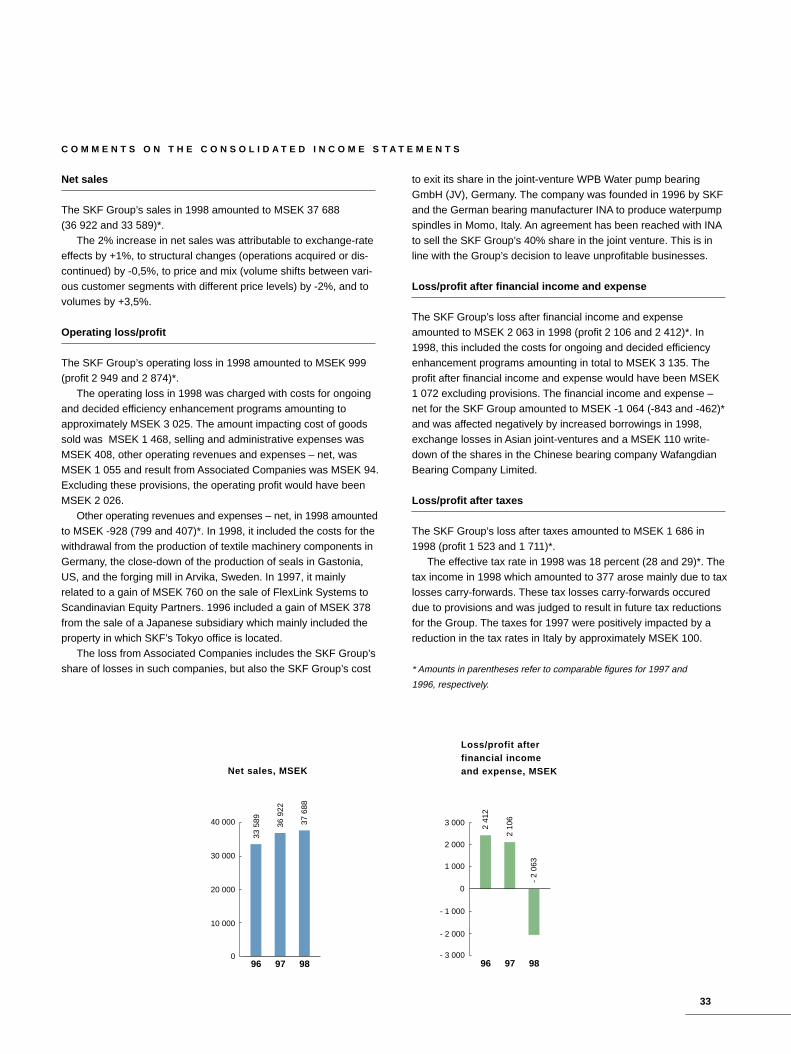
33
C O M M E N T S O N T H E C O N S O L I D A T E D I N C O M E S T A T E M E N T S
Net sales
The SKF Group’s sales in 1998 amounted to MSEK 37 688 (36 922 and 33 589)*.
The 2% increase in net sales was attributable to exchange-rateeffects by +1%, to structural changes (operations acquired or dis-continued) by -0,5%, to price and mix (volume shifts between vari-ous customer segments with different price levels) by -2%, and tovolumes by +3,5%.
Operating loss/profi t
The SKF Group’s operating loss in 1998 amounted to MSEK 999(profit 2 949 and 2 874)*.
The operating loss in 1998 was charged with costs for ongoingand decided efficiency enhancement programs amounting toapproximately MSEK 3 025. The amount impacting cost of goodssold was MSEK 1 468, selling and administrative expenses wasMSEK 408, other operating revenues and expenses – net, wasMSEK 1 055 and result from Associated Companies was MSEK 94.Excluding these provisions, the operating profit would have beenMSEK 2 026.
Other operating revenues and expenses – net, in 1998 amountedto MSEK -928 (799 and 407)*. In 1998, it included the costs for thewithdrawal from the production of textile machinery components inGermany, the close-down of the production of seals in Gastonia,US, and the forging mill in Arvika, Sweden. In 1997, it mainlyrelated to a gain of MSEK 760 on the sale of FlexLink Systems toScandinavian Equity Partners. 1996 included a gain of MSEK 378from the sale of a Japanese subsidiary which mainly included theproperty in which SKF’s Tokyo office is located.
The loss from Associated Companies includes the SKF Group’sshare of losses in such companies, but also the SKF Group’s cost
0
10 000
20 000
30 000
40 000
96 97 98
36 9
22
33 5
89 37 6
88
Net sales, MSEK
- 3 000
- 2 000
- 1 000
0
1 000
2 000
3 000
96 97 98
2 41
2
- 2
063
2 10
6
Loss/profit afterfinancial incomeand expense, MSEK
to exit its share in the joint-venture WPB Water pump bearingGmbH (JV), Germany. The company was founded in 1996 by SKFand the German bearing manufacturer INA to produce waterpumpspindles in Momo, Italy. An agreement has been reached with INAto sell the SKF Group’s 40% share in the joint venture. This is inline with the Group’s decision to leave unprofitable businesses.
Loss/profi t after fi nancial income and expense
The SKF Group’s loss after financial income and expenseamounted to MSEK 2 063 in 1998 (profit 2 106 and 2 412)*. In1998, this included the costs for ongoing and decided efficiencyenhancement programs amounting in total to MSEK 3 135. Theprofit after financial income and expense would have been MSEK1 072 excluding provisions. The financial income and expense –net for the SKF Group amounted to MSEK -1 064 (-843 and -462)*and was affected negatively by increased borrowings in 1998,exchange losses in Asian joint-ventures and a MSEK 110 write-down of the shares in the Chinese bearing company WafangdianBearing Company Limited.
Loss/profi t after taxes
The SKF Group’s loss after taxes amounted to MSEK 1 686 in1998 (profit 1 523 and 1 711)*.
The effective tax rate in 1998 was 18 percent (28 and 29)*. Thetax income in 1998 which amounted to 377 arose mainly due to taxlosses carry-forwards. These tax losses carry-forwards occureddue to provisions and was judged to result in future tax reductionsfor the Group. The taxes for 1997 were positively impacted by areduction in the tax rates in Italy by approximately MSEK 100.
* Amounts in parentheses refer to comparable figures for 1997 and
1996, respectively.

34
Millions of Swedish kronor 1998 1997 1996
ASSETSCapital assetsIntangible assets Note 6 1 042 576 568Long-term deferred tax assets Note 5 1 197 715 693Tangible assets Note 7 14 568 13 631 12 541Investments Note 29 200 355 77Long-term financial assets Note 8 884 830 986
17 891 16 107 14 865
Short-term assetsInventories Note 9 10 183 9 924 9 476Accounts receivable – trade Note 10 6 738 6 697 6 000Short-term tax assets Note 5 658 562 534Other short-term assets Note 11 1 192 1 219 818Short-term financial assets Note 12 2 353 3 931 2 091
21 124 22 333 18 919
Total assets 39 015 38 440 33 784
EQUITY, PROVISIONS AND LIABILITIESShareholders’ equity Note 13Restricted equityShare capital 1 423 1 423 1 412Restricted reserves 7 029 5 760 4 284Unrestricted equityUnrestricted reserves 4 122 3 847 3 922Loss/profit for the year - 1 642 1 558 1 692
10 932 12 588 11 310
Minority interest 367 290 288
ProvisionsProvisions for pensions and other postretirement benefits Note 14 7 139 6 171 6 030Provisions for deferred taxes Note 5 1 488 1 642 1 701Other provisions Note 15 4 095 2 981 2 130
12 722 10 794 9 861Long-term liabilitiesConvertible bond loans Note 16 – – 1 525Long-term loans Note 17 4 842 6 538 3 321Other long-term liabilities Note 18 88 69 74
4 930 6 607 4 920Short-term liabilitiesShort-term loans Note 20 3 337 1 853 1 693Accounts payable – trade Note 21 2 884 2 921 2 686Short-term tax liabilities Note 5 106 138 –Other short-term liabilities Note 22 3 737 3 249 3 026
10 064 8 161 7 405
Total equity , provisions and liabilities 39 015 38 440 33 784
Assets pledged Note 23 734 620 517Contingent liabilities Note 24 178 215 206
C O N S O L I D A T E D B A L A N C E S H E E T S
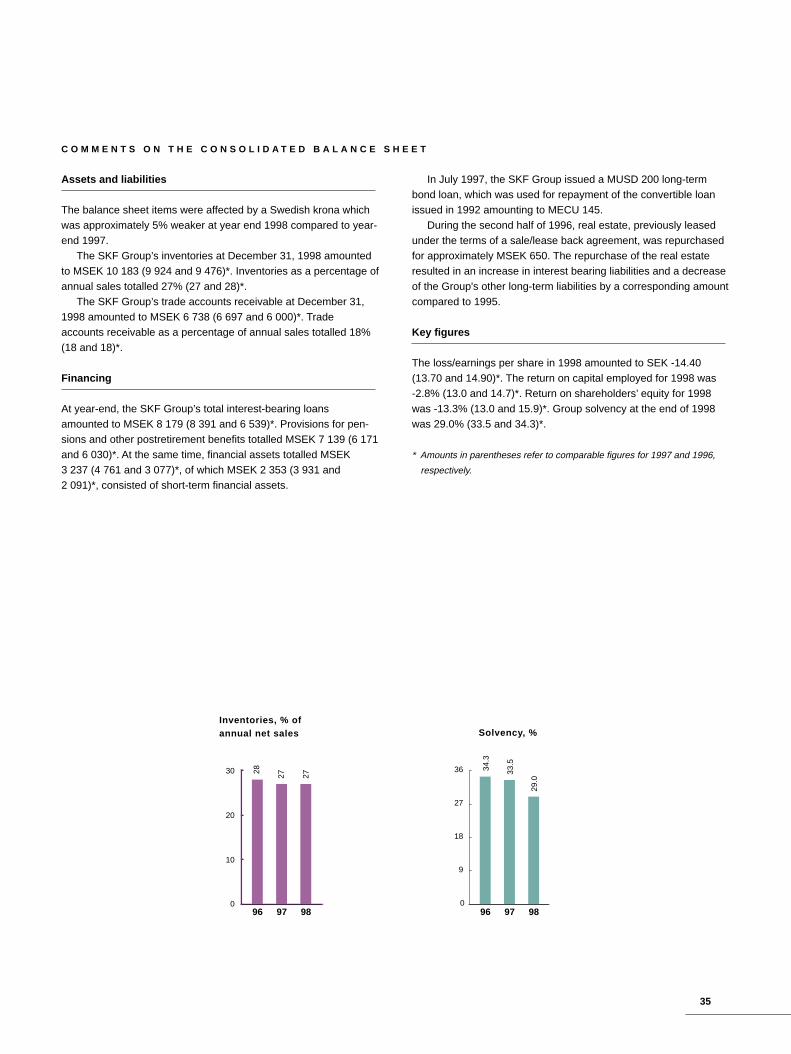
35
C O M M E N T S O N T H E C O N S O L I D A T E D B A L A N C E S H E E T
Assets and liabilities
The balance sheet items were affected by a Swedish krona whichwas approximately 5% weaker at year end 1998 compared to year-end 1997.
The SKF Group’s inventories at December 31, 1998 amountedto MSEK 10 183 (9 924 and 9 476)*. Inventories as a percentage ofannual sales totalled 27% (27 and 28)*.
The SKF Group’s trade accounts receivable at December 31,1998 amounted to MSEK 6 738 (6 697 and 6 000)*. Tradeaccounts receivable as a percentage of annual sales totalled 18%(18 and 18)*.
Financing
At year-end, the SKF Group’s total interest-bearing loansamounted to MSEK 8 179 (8 391 and 6 539)*. Provisions for pen-sions and other postretirement benefits totalled MSEK 7 139 (6 171and 6 030)*. At the same time, financial assets totalled MSEK3 237 (4 761 and 3 077)*, of which MSEK 2 353 (3 931 and2 091)*, consisted of short-term financial assets.
0
10
20
30
96 97 98
28
27 27
Inventories, % ofannual net sales
0
9
18
27
36
96 97 98
34.3
33.5
29.0
Solvency , %
In July 1997, the SKF Group issued a MUSD 200 long-termbond loan, which was used for repayment of the convertible loanissued in 1992 amounting to MECU 145.
During the second half of 1996, real estate, previously leasedunder the terms of a sale/lease back agreement, was repurchasedfor approximately MSEK 650. The repurchase of the real estateresulted in an increase in interest bearing liabilities and a decreaseof the Group's other long-term liabilities by a corresponding amountcompared to 1995.
Key fi gures
The loss/earnings per share in 1998 amounted to SEK -14.40(13.70 and 14.90)*. The return on capital employed for 1998 was-2.8% (13.0 and 14.7)*. Return on shareholders’ equity for 1998was -13.3% (13.0 and 15.9)*. Group solvency at the end of 1998was 29.0% (33.5 and 34.3)*.
* Amounts in parentheses refer to comparable figures for 1997 and 1996,
respectively.
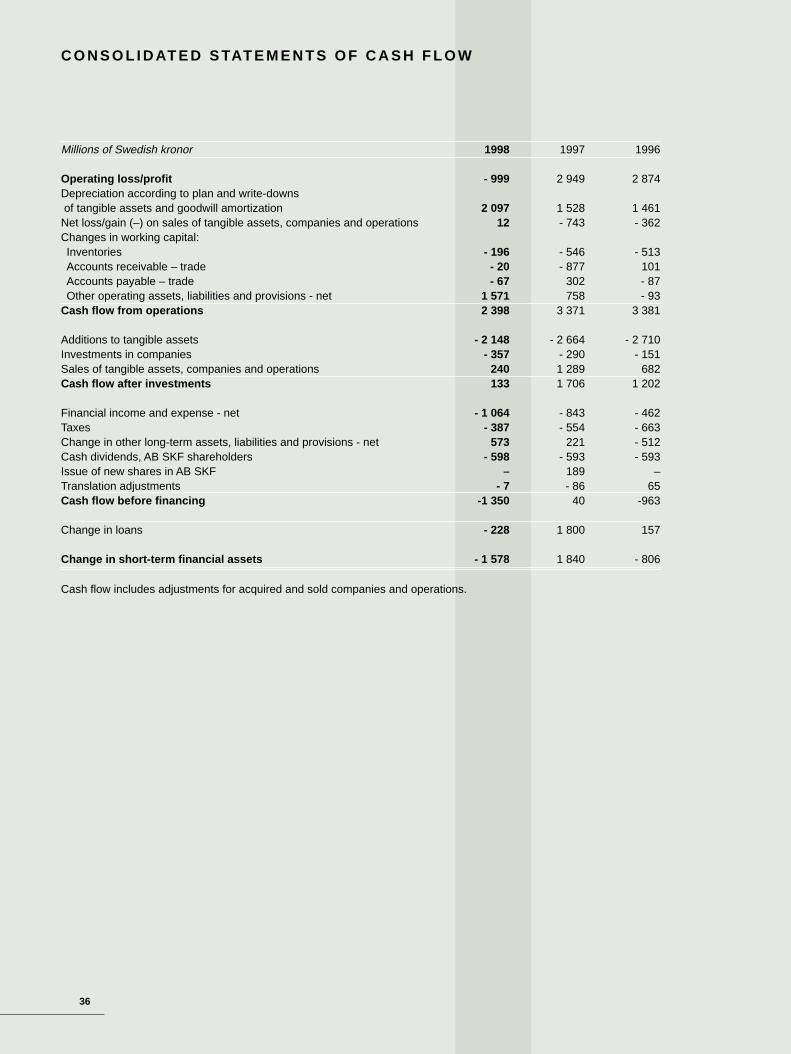
36
Millions of Swedish kronor 1998 1997 1996
Operating loss/profi t - 999 2 949 2 874Depreciation according to plan and write-downs of tangible assets and goodwill amortization 2 097 1 528 1 461
Net loss/gain (–) on sales of tangible assets, companies and operations 12 - 743 - 362Changes in working capital: Inventories - 196 - 546 - 513Accounts receivable – trade - 20 - 877 101Accounts payable – trade - 67 302 - 87Other operating assets, liabilities and provisions - net 1 571 758 - 93
Cash fl ow from operations 2 398 3 371 3 381
Additions to tangible assets - 2 148 - 2 664 - 2 710Investments in companies - 357 - 290 - 151Sales of tangible assets, companies and operations 240 1 289 682Cash fl ow after investments 133 1 706 1 202
Financial income and expense - net - 1 064 - 843 - 462Taxes - 387 - 554 - 663Change in other long-term assets, liabilities and provisions - net 573 221 - 512Cash dividends, AB SKF shareholders - 598 - 593 - 593Issue of new shares in AB SKF – 189 –Translation adjustments - 7 - 86 65Cash fl ow before fi nancing -1 350 40 -963
Change in loans - 228 1 800 157
Change in short-term fi nancial assets - 1 578 1 840 - 806
Cash flow includes adjustments for acquired and sold companies and operations.
C O N S O L I D A T E D S TAT E M E N T S O F C A S H F L O W

37
C O M M E N T S O N T H E C O N S O L I D A T E D S T A T E M E N T S O F C A S H F L O W
Cash fl ow from operations
The SKF Group’s gross cash flow, defined as operating loss/profitplus depreciation according to plan and one-time write-downs,amounted to MSEK 1 098 for 1998 (4 477 and 4 335)*, which is2.9% of annual sales (12.1 and 12.9)*.
Cash fl ow after investments
The SKF Group’s capital expenditures in tangible assets decreasedfrom MSEK 2 664 in 1997 to MSEK 2 148 in 1998.
During 1998, the SKF Group invested MSEK 357 in new com-panies and businesses. These acquisitions included Lutsk BearingPlant in the Ukraine, R.T. Gilman Inc. in the US, CR Mexicana S.A.de C.V. in Mexico, CR Seals India Pvt. Ltd. in India and the jointventures CR Korea Co. Ltd. in Korea and Dalian SKF WazhouBearings Co. in China.
Sale of companies and businesses related principally to ScanDust AB. Several real estates were also sold during 1998 and1997.
0
1000
2000
3000
4000
96 97 98
2 39
8
3 38
1
3 37
1
Cash flow fromoperations, MSEK
0
500
1 000
1 500
2 000
2 500
3 000
96 97 98
2 71
0
2 66
4
2 14
8
Additions to tangibleassets, MSEK
Cash fl ow before fi nancing
The net liabilities of the SKF Group, defined as interest bearingloans less short-term financial assets, amounted in 1998 to MSEK5 826 (4 460 and 4 448)*. The statement of cash flow was alsoaffected by the impact of the weaker Swedish krona on the balancesheet.
During the second half of 1996, real estate previously leasedunder the terms of a sale/lease back agreement, was repurchasedfor approximately MSEK 650. This transaction had a negative effectof the same amount on the cash flow before financing.
* Amounts in parentheses refer to comparable figures for 1997 and 1996,
respectively.
38
N O T E S TO T H E C O N S O L I D AT E D F I N A N C I A L S TAT E M E N T S Amounts in millions of Swedish kronor (MSEK) unless otherwise stated. Amounts in parentheses refer to comparable figures for 1997 and 1996, respectively.
1. ACCOUNTING PRINCIPLES
General
The consolidated financial statements include the Parent CompanyAB SKF and all companies in which AB SKF, directly or indirectly,owns shares representing more than 50% of the voting rights.AB SKF and its subsidiaries are referred to as ”the SKF Group” or”the Group”.
Companies, representing 20 to 50% of the voting rights, andwhere the SKF Group has a significant influence, are referred to as”Associated Companies” (see note 29).
All companies within the Group apply the accounting rules asstated in the ”SKF Accounting and Financial Reporting Manuals”.These rules are primarily based on generally accepted accountingprinciples in Sweden (Swedish GAAP). In general, the rules appliedby the SKF Group are also in accordance with generally acceptedaccounting principles in the United States (U.S. GAAP). Significantdifferences between Swedish GAAP and U.S. GAAP are describedin note 28.
The accounting rules below refer to the SFAS (Statements ofFinancial Accounting Standards) recommendations issued byFinancial Accounting Standards Board in the U.S.
Consolidation – subsidiaries
The consolidated financial statements are prepared using the pur-chase method. Consolidated shareholders’ equity includes the Par-ent Company’s equity and that part of the equity in subsidiarieswhich has arisen after the acquisition. The difference between thecost of acquiring the shares in a subsidiary and the shareholders’equity of that subsidiary at the time of acquisition, adjusted inaccordance with the Group’s accounting principles, is accountedfor:- as goodwill in the consolidated balance sheets, if the cost of
acquiring the subsidiary is higher than the shareholders’ equity, or- as a decrease in the value of acquired capital assets, if the cost
of acquiring the subsidiary is lower than the shareholders’ equity.Intercompany accounts, transactions and unrealized profits havebeen eliminated in the consolidated financial statements.
Investments in Associated Companies
Investments in Associated Companies are reported in accordancewith the equity method. The value of the investments is equal to theGroup’s share of shareholders’ equity in these companies, deter-mined in accordance with the accounting rules of the Group. TheGroup’s share in the results of these companies is based on theirprofit/loss after taxes.
Translation of foreign financial statements
The current rate method is used for translating the financial state-ments of the majority of the foreign subsidiaries into Swedish kro-nor. All balance-sheet items in foreign subsidiaries have beentranslated to Swedish kronor based on the year-end exchangerates. Income Statement items are translated at average exchangerates. The translation adjustments that arise as a result of the cur-rent rate method are transferred directly to shareholders’ equity.
For the translation of financial statements of subsidiaries operat-ing in highly inflationary economies, the Group applies the mone-tary/non-monetary method (MNM-method) according to the SFASNo. 52, ”Foreign Currency Translation.” Monetary balance sheetitems are translated at year-end exchange rates and non-monetarybalance sheet items, as well as related income and expense items,are translated at rates in effect at the time of acquisition (historicalrates). Other income and expense items are translated at averageexchange rates. Translation differences that arise are included inthe related lines in the income statement.
Foreign currency transactions
Receivables and payables denominated in foreign currencies aretranslated at year-end exchange rates. The resulting gains andlosses are classified as either operational or financial items in theincome statement. Operating gains and losses are included inOther operating revenue and Other operating expense. Financialgains and losses are included in Financial income and expense,net.
Forward exchange contracts
Forward exchange contracts hedge part of the budgeted flow ofgoods and services between countries. Realized gains and lossesare included in financial exchange differences related to Otherfinancial income.
Currency gains and losses on forward exchange contracts andloans, serving as hedges of net investments in foreign subsidiaries,are excluded from the income statement. These gains and losses,less current and deferred income taxes, are transferred directly toshareholders’ equity, thereby offsetting gains and losses arisingfrom the translation of the financial statements of the foreign sub-sidiaries. For these forward exchange contracts, the interest differ-ence between currencies is allocated over the life of the contract inthe income statement.
Forward exchange contracts which are not considered hedgeshave been valued at market value. Gains and losses are includedin Financial income and expense, net.

39
N O T E S , G R O U P
Exchange rates
The following exchange rates have been used when translating the financial statements of foreign subsidiaries operating in the countriesshown below into SEK:Country Unit Currency Average rate Year-end rate
1998 1997 1996 1998 1997 1996
Belgium 100 BEF 21.40 21.32 21.66 23.41 21.36 21.45Canada 1 CAD 5.37 5.47 4.91 5.21 5.49 5.02France 1 FRF 1.34 1.31 1.31 1.44 1.32 1.31Germany 1 DEM 4.50 4.40 4.45 4.83 4.41 4.42India 100 INR 19.26 20.12 18.99 18.99 20.13 19.13Italy 100 ITL 0.46 0.45 0.43 0.49 0.45 0.45Japan 100 JPY 6.03 6.08 6.14 7.01 6.09 5.92The Netherlands 1 NLG 4.00 3.90 3.92 4.29 3.91 3.94Spain 100 ESB 5.31 5.20 5.29 5.68 5.21 5.25Switzerland 1 CHF 5.35 5.43 5.44 5.91 5.43 5.09United Kingdom 1 GBP 13.20 13.07 10.43 13.52 13.15 11.61USA 1 USD 7.94 7.83 6.69 8.08 7.90 6.87
Debt and marketable equity securities
The Group applies SFAS 115 ”Accounting for Certain Investmentsin Debt and Equity Securities”. There are no marketable equitysecurities held. Debt securities are held only for trading purposesintended to be sold in the near future, and are recorded at marketvalue with changes in value recognized in the income statement.
Inventories
Inventories are stated at the lower of cost (first-in, first-out basis) ormarket (net realizable value). Net realizable value is defined as thelower of current replacement cost or market value less selling cost.Cost includes material, labor and manufacturing overheads.
Tangible and intangible assets
Depreciation is provided on a straight-line basis and is calculatedbased on the cost of the asset. In some countries, legal revalua-tions are made in addition to cost, and depreciation is then basedon the revalued amounts.
The rates of depreciation are based on the estimated economiclives of the assets, generally 33 years for buildings, 10-17 years formachines and 4-5 years for tools, office equipment and vehicles.
Goodwill is amortized on a straight-line basis, normally over 10years, but in some cases over 20 years. Amortization of goodwill isincluded in selling expenses.
Patents and similar rights are stated at cost and are amortizedon a straight-line basis over their legal lives.
Leases
The Group applies SFAS 13 ”Leases” which agrees with theSwedish accounting recommendation RR6 ”Accounting for leasingagreements.” Leases which transfer virtually all benefits and risksincident to the ownership of the property to the Group (capitalleases), are capitalized and accounted for as assets and incur-rence of obligations. Rentals for other leases (operating leases) arecharged against earnings over the lease term.
Other operating revenue and other operating expense
Other operating revenue and Other operating expense includeitems such as gains and losses on sales of non-production relatedcapital assets, gains and losses on sales or closures of companiesand operations, rental revenues, results from reinsurance opera-tions and exchange gains and losses arising on operating assetsand liabilities.
Research and development
Research and development expenditures are charged againstearnings as incurred and accounted for as cost of goods sold in theconsolidated income statement.
Income taxes
All companies within the SKF Group compute current income taxesin accordance with the tax rules and regulations of the countrieswhere the income is taxable.
Deferred taxes are accounted for according to SFAS 109”Accounting for Income Taxes”. SFAS 109 requires that deferredtaxes be calculated on differences between the book and tax bases
42
⅓
of assets and liabilities in accordance with the liability methodwhich, among other things, means that changes in tax rates affectthe year’s earnings. Additionally, it allows the recognition of losscarry-forwards if they, more likely than not, can be utilized. The dif-ference between the gross effect and the amounts expected to beutilized is provided for in a valuation allowance.
Provisions have been made in the consolidated financial state-ments for estimated taxes on earnings of subsidiaries expected tobe remitted in the following year, but not for tax liabilities which mayarise on distribution of the remaining unrestricted earnings of for-eign subsidiaries.
Postretirement benefi ts
The Group applies SFAS 106 (Employers’ Accounting for Post-retirement Benefits Other Than Pensions) which requires that thecost of health insurance and other similar benefits provided toemployees after their retirement be expensed during the active ser-vice life of the employee. Up until 1992, the cost of these benefitswas expensed on a cash basis.
Provisions
Provisions are defined as obligations related to the current or previ-ous financial years as a result of a business transaction or deci-sion. Such obligations are accounted for when the business trans-action is known, but as long as there is some uncertainty as to thefinal amount and the settlement date, the obligation should beaccounted for as a provision. Pensions and other postretirementbenefits, deferred taxes, restructuring reserves and similar itemssuch as warranty reserves and benefits to employees, other thanpensions, are classified as provisions in the balance sheet.
Changes in accounting principles
As from 1996, research and development expenditure is includedin the cost of goods sold instead of selling and administrativeexpenses in the consolidated income statements.
Beginning in 1996, the unrecognized and unfunded vested andunvested retirement benefits are accounted for as a provision in theconsolidated balance sheet and no longer as a contingent liability.The change in accounting principle, after taking taxes into account,amounted to 238 and was charged against opening shareholders’equity at January 1, 1990.
Beginning in 1997, the amortization of goodwill is accounted foras selling expenses and no longer as administrative expenses inthe consolidated income statements.
Previous years have been restated in accordance with the newprinciples.
As from 1997, the Annual Report is presented in accordancewith the Swedish Accounts Act (1995:1554). Previous years havebeen reclassified accordingly.
Definitions of key fi gures
The majority of the subsidiaries within the SKF Group report theirresults of their operations and financial position eleven times a year(ten for 1992 to 1996). The key figures presented in the AnnualReport have been calculated using average values based on theseinterim reports. Therefore, the calculation of these key figures usingthe year-end values presented, may give slightly different results.
1. Portion of risk-bearing capitalShareholders’ equity plus minority interest and deferred taxes, as a percentage of total assets at year-end.
2. Solvency (Equity/assets ratio)Shareholders’ equity plus minority interest, as a percentage oftotal assets at year-end.
3. Return on total assetsOperating profit/loss plus interest income, as a percentage ofaverage total assets.
4. Return on capital employedOperating profit/loss plus interest income, as a percentage ofaverage total assets less the average of non-interest bearingliabilities.
5. Return on shareholders’ equityProfit/loss after taxes, as a percentage of average share-holders’ equity.
6. Profit marginOperating profit/loss plus interest income, as a percentage of net sales.
7. Turnover of total assetsNet sales in relation to average total assets.
8. Earnings per share in Swedish kronorProfit/loss after taxes and minority interest divided by numberof shares.
9. YieldDividend as a percentage of share price at year-end.
10.P/E ratioShare price at year-end divided by earnings per share.
11.Average number of employeesTotal number of working hours of all employees, divided by thenormal total working time during the year.
N O T E S , G R O U P
40

43
⅓
2. RESEARCH AND DEVELOPMENT
Research and development expenditure charged against earningstotalled 702 (757 and 751). Additionally, the Group enters intoexternal research and development contracts where on behalf of athird party, the Group develops or produces prototypes of variousproducts. Expenses under such contracts were 7 (4 and 4), andhave been fully reimbursed.
3. DEPRECIATION
1998 1997 1996
Land improvements 7 7 7Buildings 168 145 170Machinery, supply systems, machinetools, tooling and factory fittings 1 839 1 315 1 199
Goodwill 70 46 69Leaseholds – 1 1Revaluations 13 14 15
2 097 1 528 1 461
Depreciations according to plan accounted for as:1998 1997 1996
Cost of goods sold 1 855 1 305 1 179Selling expenses 211 192 260Administrative expenses 31 31 22
2 097 1 528 1 461
A one-time write-down of 375 was included in depreciation accord-ing to plan in 1998.
4. FINANCIAL INCOME AND EXPENSE
1998 1997 1996
Income from equity securities andlong-term financial investments - 54 103 95
Other financial incomeand similar items 280 501 592
Interest expense and similar items - 1 290 - 1 447 - 1 149
- 1 064 - 843 - 462
Specifi cation of fi nancial income and expense, net1998 1997 1996
Dividends related to- income from equity securites and long-term financial investments 11 8 5
Total dividends 11 8 5
Interest income related to- income from equity securities and long-term financial investments 32 99 87
- other financial income and similar items 224 264 404
Total interest income 256 363 491
Interest expense for- financial liabilities related to interest expense and similar items - 729 - 813 - 758
- pensions and other post-retirement benefits (see note 14) related to interest expense and similar items - 398 - 370 - 383
Total interest expense - 1 127 - 1 183 - 1 141
Financial exchange gains and losses related to- income from equity securities and long-term financial investments 13 - 4 3
- other financial income and similar items 56 237 188
- interest expense and similar items - 163 - 264 - 8Total financial exchange gainsand losses - 94 - 31 183
Write-downs related to- income from equity securities and long-term financial investments - 110 – –
Total write-downs - 110 – –
Financial income and expense, net - 1 064 - 843 - 462
Adjustment to market value of trading securities affected financialincome and expense by -11 (-20 and -13).
Interest payments amounted to 715 (682 and 924).
N O T E S , G R O U P
41

42
N O T E S , G R O U P
5. TAXES
1998 1997 1996Taxes on loss/profit afterfinancial income and expense
- current taxes - 399 - 724 - 390- deferred taxes, net 793 163 - 291Other taxes - 17 - 22 - 20
377 - 583 - 701
Deferred taxes for 1998 include a charge of 358 related to the netchange in the valuation allowance. Of this charge, 9 represents anadjustment of the opening balance of the valuation allowance stillexisting at year-end. The adjustment was due to a change in cir-cumstances which affected the judgement on the realizability of therelated deferred tax asset in future years.
Deferred tax assets, provisions for deferred taxes and short-termtax receivables and payables at December 31, were:
1998 1997 1996Deferred tax assets:- long-term 1 197 715 693- short-term 658 562 506
1 855 1 277 1 199
Provisions for deferred taxes:- long-term 1 304 1 275 1 288- short-term 184 367 413
1 488 1 642 1 701
Deferred tax asset/provisions for deferred taxes - net 367 - 365 - 502
Short-term income taxes receivable – – 28Short-term income taxes payable 106 138 –
106 138 28
Gross deferred tax assets and provisions were related to the following items:
1998 1997 1996Provisions for pensions and other postretirement benefits 453 404 340
Tax loss carry-forwards 1 890 1 273 1 234Other 1 830 1 343 1 126
Gross deferred tax assets 4 173 3 020 2 700Valuation allowance - 1 216 - 858 - 688Gross deferred tax assets after valuation reserve 2 957 2 162 2 012
1998 1997 1996Provisions for pensions and other postretirement benefits 31 28 34
Inventory 444 483 434Tangible capital assets 1 926 1 754 1 595Other 189 262 451Gross provision for deferred taxes 2 590 2 527 2 514
Deferred tax asset/provision for deferred taxes - net 367 - 365 - 502
Corporate income taxThe corporate nominal income tax rate in Sweden was 28% in1998, 1997 and 1996.
The effective tax rate on profit/earnings after financial incomeand expense, but before minority interest, was 18% (28 and 29).A reconciliation of the statutory tax in Sweden to the effective tax isoutlined below:
1998 1997 1996Tax calculated on statutory tax rate in Sweden 578 - 590 - 675
Difference between statutory tax ratein Sweden and foreign subsidiaries’weighted statutory tax rate 34 - 109 - 120
Taxes other than income taxes - 17 - 22 - 20Permanent differences 41 114 113Tax loss carry-forwards, net of changes in valuation allowance - 289 - 11 27
Other, including translation adjustments 30 35 - 26
Effective tax 377 - 583 - 701
Tax loss carry-forwardsThe Parent Company and certain subsidiaries, principally inSweden and Germany had, at December 31, 1998, tax loss carry-forwards amounting to 5 526 (3 996 and 3 802). Such tax losscarry-forwards expire as follows:
1999 1032000 2252001 2482002 1022003 1612004 and thereafter 4 687
As of December 31, 1998, the total tax loss carry-forwards haveresulted in deferred tax assets of 819, net of valuation allowances,which are included in gross deferred tax assets above. Such lossescan be used to reduce future taxable income, but since their benefithas already been recorded, their future use will not reduce the totaltax charge for the Group.

43
N O T E S , G R O U P
6. INTANGIBLE ASSETS
Acquisition cost:Translation
1998 Additions Disposals Other effects 1997 1996Goodwill 970 138 - 1 - 4 20 817 698Patents and similar rights 16 – - 1 – 1 16 16Leaseholds 28 6 – - 2 1 23 29Deferred charges 478 415 – – - 27 90 111
1 492 559 - 2 - 6 -5 946 854
Accumulated depreciation according to plan:Translation
1998 Additions Disposals Other effects 1997 1996Goodwill 432 70 – – 9 353 269Patent and similar rights 13 – – – 1 12 12Leaseholds 5 – – – – 5 5
450 70 – – 10 370 286
Net book value 1 042 489 - 2 - 6 - 15 576 568
One-time write-downs of goodwill were 43 (6 and 44).
7. TANGIBLE ASSETS
Acquisition cost:Translation
1998 Additions Disposals Other effects 1997 1996Land, land improvements and buildings 5 972 138 - 176 568 175 5 267 5 141
- Revaluations 513 2 - 24 3 66 466 448Machinery and supply systems 21 826 1 317 - 602 1 047 955 19 109 17 491- Revaluations 46 – - 33 – 5 74 78Machine tools, tooling, factory fittings, etc 3 417 280 - 174 200 137 2 974 2 752
Construction in process including advances 1 448 413 - 4 - 658 53 1 644 1 542
33 222 2 150 - 1 013 1 160 1 391 29 534 27 452
Accumulated depreciation according to plan:Translation
1998 Additions Disposals Other effects 1997 1996Land improvements and buildings 2 995 175 - 85 208 116 2 581 2 593- Revaluations 238 12 - 10 – 18 218 203Machinery and supply systems 13 174 1 595 - 496 411 536 11 128 10 134- Revaluations 71 1 - 3 – 5 68 71Machine tools, tooling, factory fittings, etc 2 176 244 - 146 81 89 1 908 1 910
18 654 2 027 - 740 700 764 15 903 14 911
Net book value 14 568 123 - 273 460 627 13 631 12 541
44
N O T E S , G R O U P
A one-time write-down of tangible assets of 375 was included indepreciation according to plan.
Divested and acquired companies are included in other.
Capital leases included in tangible assets consisted of thefollowing:
Acquisition value:1998 1997 1996
Land, land improvements and buildings 70 66 61
Machinery and supply systems 93 92 101Machine tools, tooling, factory fittings, etc 41 36 40
204 194 202
Accumulated depreciation according to plan:1998 1997 1996
Land, land improvements and buildings 43 40 34
Machinery and supply systems 58 52 61Machine tools, tooling, factory fittings, etc 13 13 15
114 105 110
Tax value of Swedish tangible assets:1998 1997 1996
Land 131 242 245Buildings 706 701 702
837 943 947
8. LONG-TERM FINANCIAL ASSETS.
1998 1997 1996Long-term financial receivables 864 812 969Debt securities 20 18 17
884 830 986Substantially all the long-term financial receivables are recorded atmarket value.
9. INVENTORIES
Inventories, net of allowance for obsolescence, consist of thefollowing:
1998 1997 1996Raw materials and supplies 1 657 1 310 1 145Work in process 1 996 2 200 2 372Finished goods 6 530 6 414 5 959
10 183 9 924 9 476
10. ACCOUNTS RECEIVABLE – TRADE
1998 1997 1996Accounts receivable 6 342 6 263 5 672Acceptances receivable 697 732 603
7 039 6 995 6 275Allowance for doubtful accounts - 301 - 298 - 275
6 738 6 697 6 000
The change in allowance for doubtful accounts charged againstloss/profit amounted to 80 (74 and 76).
11. OTHER SHORT-TERM ASSETS
1998 1997 1996Other short-term receivables 746 716 506- Associated Companies 1 – 3Prepaid expenses 333 292 193Accrued income 66 167 89Advances to suppliers 46 44 27
1 192 1 219 818
12. SHORT-TERM FINANCIAL ASSETS
1998 1997 1996Short-term investments- in bonds and other securities 549 599 457- in treasury bills and
government bonds 451 1 688 236- with banks 251 213 196- other 292 506 504Cash and bank accounts 810 925 698
2 353 3 931 2 091
Unrealized holding loss on trading securities as per December 31,included in financial income and expense amounted to 11 (20 and10).

45
N O T E S , G R O U P
13. SHAREHOLDERS´ EQUITY
Share capital
The share capital at December 31, 1998, consisted of the followingshares (par value SEK 12.50 per share):
Number of sharesauthorized and Aggregate
outstanding par valueA shares 49 256 332 616B shares 64 581 435 807
113 837 767 1 423
An A share has one vote, a B share one-thousandth of one vote.
Restricted reserves
In accordance with statutory requirements in Sweden and certainother countries in which the SKF Group operates, the Parent Com-pany and its subsidiaries maintain restricted reserves which are notavailable for distribution as dividends.
The Swedish Companies Act requires that 10% of net profit betransferred to the legal reserve (part of restricted reserves) until thelegal reserve together with the premium reserve amounts to 20% ofthe share capital. As of 1997, premiums paid on new share issuesmust be transferred to the premium reserve. Premiums on newshare issues prior to 1997 have been transferred to the legalreserve.
In countries where legal revaluations of assets are made, anamount corresponding to the net revaluation must be transferred tolegal reserves.
Tax laws in Sweden and certain other countries permit alloca-tions to reserves that are deductible for tax purposes. To a certainextent, companies can thus allocate profit so that it remains in thebusiness without being taxed immediately. In the balance sheet thecumulative value of these allocations, less the related deferred taxliabilities, is shown under restricted reserves.
Differences between statutory reporting and reporting for Grouppurposes are also treated as restricted reserves.
Unrestricted equity
Unrestricted earnings include earnings distributable by the ParentCompany and those net earnings that may be remitted from sub-sidiaries to the Parent Company within one year. The unrestrictedequity has been reduced by accumulated losses in other sub-sidiaries. In determining the remittable amounts, consideration hasbeen given to legal and exchange restrictions, but not to thefinancial position of the remitting subsidiaries.
Changes in shareholders’ equityRe- Unre-
Share stricted stricted
capital reserves equity Total
Opening balance 1996-01-01 1 412 4 136 4 574 10 122
Cash dividend – – - 593 - 593Net profit – – 1 692 1 692Transfer between restricted and unrestricted reserves – 46 - 46 –
Translation adjustments – 87 - 13 74Revaluations – 15 – 15Closing balance 1996-12-31 1 412 4 284 5 614 11 310
Cash dividend – – -593 -593Issue of new shares 11 178 – 189Net profit – – 1 558 1 558Transfer between restricted and unrestricted reserves – 1 278 -1 278 –
Translation adjustments – 20 104 124Closing balance 1997-12-31 1 423 5 760 5 405 12 588
Cash dividend – – - 598 - 598Net loss – – - 1 642 - 1 642Transfer between restricted and unrestricted reserves – 604 - 604 –
Translation adjustments – 665 - 81 584Closing balance 1998-12-31 1 423 7 029 2 480 10 932
As described in note 1, translation adjustments arising from theapplication of the current rate method were transferred directly toshareholders’ equity. Changes in cumulative translation adjust-ments included in shareholders’ equity, were as follows:
1998 1997 1996Balance at beginning of year - 229 - 353 - 427Aggregate translation adjustments 560 452 68Gains/losses from hedges(net of taxes) of investments inforeign subsidiaries 24 - 328 6
Balance at end of year 355 - 229 - 353

46
14. PROVISIONS FOR PENSIONS AND OTHERPOSTRETIREMENT BENEFITS
1998 1997 1996Provisions for pensions 5 935 5 019 5 046Provisions for other postretirement benefits 1 204 1 152 984
7 139 6 171 6 030
Provisions for pensions
Charges against profit in 1998, 1997 and 1996 for pensions were848, 574 and 631, which include an interest cost calculated at 309,284 and 309, respectively. In 1996 the interest arose mainly onobligations for pensions in Sweden, Germany and the U.S.
Interest rates used vary by country, and were 4.9% (3.7 and6.0) for indexed Swedish pensions and 3.5% (3.5 and 3.5) for fixedSwedish pensions. An interest rate of 6.5% was used in 1998, 1997and 1996 for the German companies, which represented in aver-age 66% of the Group’s total pension obligation.
Provisions for other postretirement benefi ts
SKF sponsors several defined postretirement benefit plans cover-ing most salaried and hourly employees in the United States. Theplans, which are unfunded, provide certain health care and lifeinsurance benefits to eligible retired employees.
Net periodic postretirement benefit cost includes:1998 1997 1996
Service cost 16 14 11Interest cost 89 86 74Amortization - 6 - 10 - 8Other 7 – –Net periodic postretirement benefit cost 106 90 77
The following table shows the accrued postretirement benefit provi-sion recognized in the balance sheet of the Group:
1998 1997 1996Retirees 1 044 933 785Other fully eligible plan participants 165 160 147Other plan participants 171 138 119Total accumulated postretirement benefit obligation 1 380 1 231 1 051
Less: unrecognized loss - 176 - 79 - 671 204 1 152 984
A discount rate of 6.75% was applied in 1998.
The assumed annual rate of increase in the per capita cost ofcovered health care benefits:For retirees under the age of 65 8.00% (8.5 and 9)For retirees 65 and older 7.25% (7.5 and 8)The rate was assumed to decline by 0.5% per year for retireesunder the age of 65 and by 0.25% for retirees 65 and older, to anultimate rate of 6%.
An increase in the assumed health care cost trend rates by 1%would increase the accumulated postretirement benefit obligationas of December 31 by 104 (108 and 93) and the aggregate of theservice and interest cost components of the net periodic postretire-ment benefit by 9 (10 and 9).
15. OTHER PROVISIONS
1998 1997 1996Provisions for employee benefitsother than pensions 981 900 833
Other provisions 3 114 2 081 1 2974 095 2 981 2 130
Provisions for employee benefits other than pensions include anemployees’ right to certain benefits when leaving the companyeither before or at the retirement. The benefit is paid out in a lump-sum and not during the remaining lifetime of the employee. Italyaccounted for approximate 80% of the provision.
16. CONVERTIBLE BONDS
In May 1992, AB SKF issued zero coupon convertible bondsamounting to XEU 145 million after a discount of 8.75%. If fullyconverted on the due date, the nominal amount of XEU 286 millionwould have resulted in the issuance of 7 122 928 B shares.
In June 1997, SKF called for redemption of the convertiblebonds. A number of holders opted to convert their bonds intoshares and as a result of the conversion, 838 211 new B shareswere issued in July 1997. The total number of shares issued is now113 837 767. The conversion rate was slightly less than SEK 225per share, which means that shareholders’ equity increased byMSEK 189.
The bonds converted to shares amounted to XEU 22 millionincluding accrued interest. Following conversion and redemption ofthe remaining bonds, the loan has been repaid in full.
N O T E S , G R O U P
47
N O T E S , G R O U P
17. LONG-TERM LOANS
Long-term loans at the end of the year, excluding the short-termportion were:
1998 1997 1996Debentures (maturing from 2000to 2007) bearing interest from 6.6 to 14.5% * 3 100 3 703 1 393
Bank loans (maturing from 2000to 2008) bearing interest from 2.0 to 14.3% * 1 109 2 078 1 091
Other loans (maturing from 2000to 2013) bearing interest from 2.0 to 18.5% * 633 757 837
4 842 6 538 3 321* December 31, 1998
The short-term portion of long-term loans is included in short-termloans (see note 20).
Maturities of long-term loans outstanding at December 31, 1998are as follows:
2000 3062001 1952002 1 1112003 6422004 8232005 and thereafter 1 765
The terms of certain loan agreements contain various restrictions,relating principally to the further pledging of assets, additional bor-rowing and payment of intercompany dividends.
Of the long-term loans 511 (389 and 274) were secured atDecember 31.
The market value of long-term loans was approximately thesame as the book value after taking related interest rate swaps intoaccount. The market value has been calculated by discounting thefuture cash flows of the loans using the interest rates currentlyavailable.
18. OTHER LONG-TERM LIABILITIES
1998 1997 1996Long-term portion of capitalleases (see note 19) 32 43 54
Other 56 26 2088 69 74
19. LEASES
Future minimum rental commitments at December 31, 1998, forcapital leases and non-cancellable (within one year) operatingleases were as follows:
Capital Operatingleases leases
1999 26 2662000 12 1842001 11 1382002 6 1092003 4 802004 and thereafter 5 365
Less: Interest and executory costs - 8Present value of minimum leasepayments under capital leases 56
Less: Current portion - 24Long-term portion (see note18) 32
Net rental expense related to operating leases was 300 (291 and223). Contingent rentals and sub-lease revenues were not signifi-cant in any of the years presented.
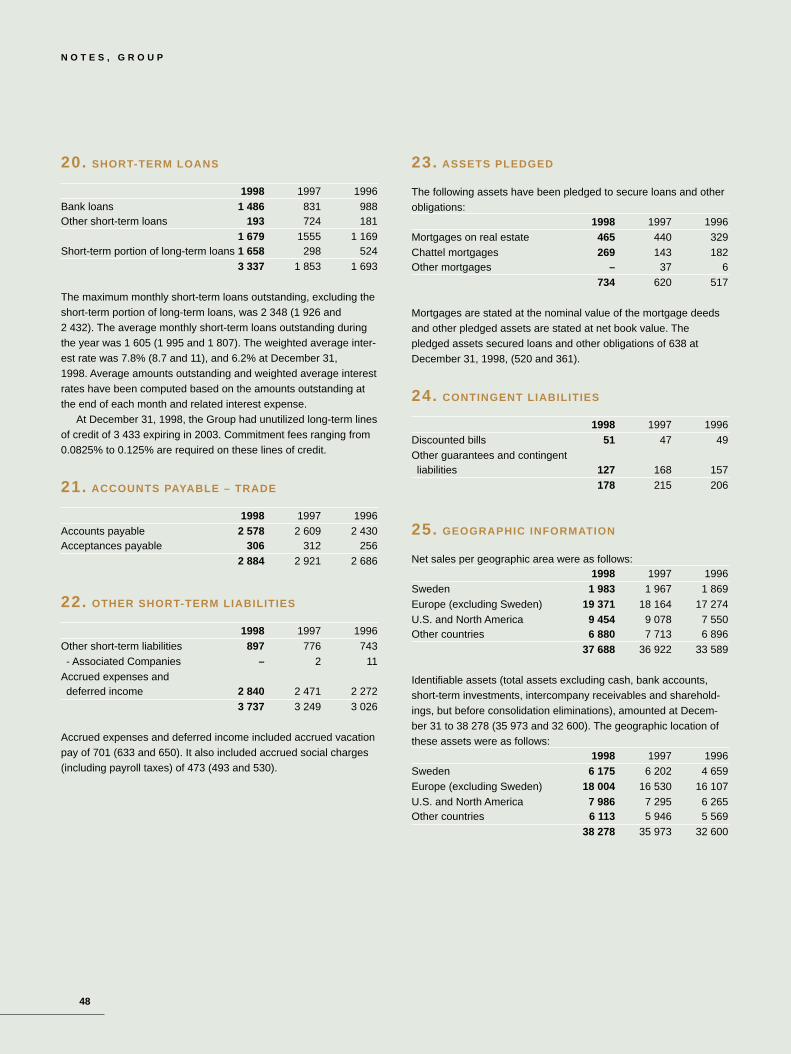
48
N O T E S , G R O U P
20. SHORT-TERM LOANS
1998 1997 1996Bank loans 1 486 831 988Other short-term loans 193 724 181
1 679 1555 1 169Short-term portion of long-term loans 1 658 298 524
3 337 1 853 1 693
The maximum monthly short-term loans outstanding, excluding theshort-term portion of long-term loans, was 2 348 (1 926 and2 432). The average monthly short-term loans outstanding duringthe year was 1 605 (1 995 and 1 807). The weighted average inter-est rate was 7.8% (8.7 and 11), and 6.2% at December 31,1998. Average amounts outstanding and weighted average interestrates have been computed based on the amounts outstanding atthe end of each month and related interest expense.
At December 31, 1998, the Group had unutilized long-term linesof credit of 3 433 expiring in 2003. Commitment fees ranging from0.0825% to 0.125% are required on these lines of credit.
21. ACCOUNTS PAYABLE – TRADE
1998 1997 1996Accounts payable 2 578 2 609 2 430Acceptances payable 306 312 256
2 884 2 921 2 686
22. OTHER SHORT-TERM LIABILITIES
1998 1997 1996Other short-term liabilities 897 776 743- Associated Companies – 2 11
Accrued expenses and deferred income 2 840 2 471 2 272
3 737 3 249 3 026
Accrued expenses and deferred income included accrued vacationpay of 701 (633 and 650). It also included accrued social charges(including payroll taxes) of 473 (493 and 530).
23. ASSETS PLEDGED
The following assets have been pledged to secure loans and otherobligations:
1998 1997 1996Mortgages on real estate 465 440 329Chattel mortgages 269 143 182Other mortgages – 37 6
734 620 517
Mortgages are stated at the nominal value of the mortgage deedsand other pledged assets are stated at net book value. Thepledged assets secured loans and other obligations of 638 atDecember 31, 1998, (520 and 361).
24. CONTINGENT LIABILITIES
1998 1997 1996Discounted bills 51 47 49Other guarantees and contingent liabilities 127 168 157
178 215 206
25. GEOGRAPHIC INFORMATION
Net sales per geographic area were as follows:1998 1997 1996
Sweden 1 983 1 967 1 869Europe (excluding Sweden) 19 371 18 164 17 274U.S. and North America 9 454 9 078 7 550Other countries 6 880 7 713 6 896
37 688 36 922 33 589
Identifiable assets (total assets excluding cash, bank accounts,short-term investments, intercompany receivables and sharehold-ings, but before consolidation eliminations), amounted at Decem-ber 31 to 38 278 (35 973 and 32 600). The geographic location ofthese assets were as follows:
1998 1997 1996Sweden 6 175 6 202 4 659Europe (excluding Sweden) 18 004 16 530 16 107U.S. and North America 7 986 7 295 6 265Other countries 6 113 5 946 5 569
38 278 35 973 32 600

49
N O T E S , G R O U P
26. SPECIFICATION OF SALARIES, WAGES AND REMUNERATIONS FOR EMPLOYEES
1998 1998 1997 1997 1996 1996Salaries, wages Social charges Salaries, wages Social charges Salaries, wages Social charges
and other (whereof and other (whereof and other (whereofremunerations pension cost) remunerations pension cost) remunerations pension cost)
Parent Company in Sweden 116 89 98 69 92 59(80) (53) (52)
Subsidiaries in Sweden 1 627 865 1 601 712 1 594 719(291) (148) (149)
Subsidiaries abroad 8 800 3 000 8 544 2 657 8 010 2 592(473) (373) (430)
10 543 3 954 10 243 3 438 9 696 3 370(844) (574) (631)
Specification of salaries, wages and remunerations:1998 1998 1997 1997 1996 1996
Board and Other Board and Other Board and OtherPresident employees President employees President employees(whereof (whereof (whereof
bonus etc) bonus etc) bonus etc)
Parent Company in Sweden 32 84 6 (1) 92 7 (1) 85Total Parent Company in Sweden 116 98 92
Subsidiaries in Sweden 12 (1) 1 615 10 (1) 1 591 22 (1) 1 572Total subsidiaries in Sweden 1 627 1 601 1 594
Subsidiaries abroad 97 (2) 8 703 91 (3) 8 453 83 (2) 7 927Total subsidiaries abroad 8 800 8 544 8 010
Group 141 (3) 10 402 107 (5) 10 136 112 (4) 9 584Total Group 10 543 10 243 9 696
Geographic specification of salaries, wages and renumerations in subsidiaries abroad:1998 1998 1997 1997 1996 1996
Board and Other Board and Other Board and OtherPresident employees President employees President employees(whereof (whereof (whereof
bonus etc) bonus etc) bonus etc)
France 10 996 7 956 6 942Germany 11 2 642 8 (1) 2 576 14 (1) 2 551Italy 4 1 341 4 1 279 4 1 220Western Europe excluding Sweden 20 (1) 985 25 (2) 941 19 (1) 911Central and Eastern Europe 7 105 3 64 2 58U.S. 6 (1) 1 897 5 1 823 7 1 528North America – 43 1 46 1 43Latin America 17 237 15 260 12 238Asia 19 364 20 413 15 342Africa 3 93 3 95 3 94
97 8 703 91 8 453 83 7 927Total subsidiaries abroad 8 800 8 544 8 010

50
N O T E S , G R O U P
27. AVERAGE NUMBER OF EMPLOYEES
1998 1998 1997 1997 1996 1996
Number of Whereof men Number of Whereof men Number of Whereof menemployees (percent) employees (percent) employees (percent)
Parent Company in Sweden 151 62% 160 66% 161 65%Subsidiaries in Sweden 5 993 83% 6 130 84% 6 187 84%Subsidiaries abroad 38 814 80% 35 573 82% 36 103 83%
44 958 80% 41 863 83% 42 451 83%
Geographic specification of subsidiaries abroad:1998 1998 1997 1997 1996 1996
Number of Whereof men Number of Whereof men Number of Whereof menemployees (percent) employees (percent) employees (percent)
France 3 930 83% 3 689 82% 3 892 83%Italy 5 864 85% 5 833 86% 5 834 87%Germany 6 741 88% 6 716 87% 7 006 87%Western Europe excluding Sweden 3 153 85% 3 297 84% 3 398 84%Central/Eastern Europe 4 253 63% 1 270 72% 1 392 71%U.S. 6 278 69% 6 086 71% 6 133 72%North America 151 81% 146 78% 148 80%Latin America 2 223 86% 2 086 88% 2 147 89%Asia 5 313 84% 5 452 87% 5 123 87%Africa 908 76% 998 75% 1 030 72%Total subsidiaries abroad 38 814 80% 35 573 82% 36 103 83%
In accordance with the resolution of the Annual General Meetingheld in 1998, the Board has received a fee of SEK 2 900 000. SEK700 000 should be distributed to the Chairman of the Board andSEK 275 000 to each elected board member who is not employedin active service in AB SKF (the Parent Company).
Giovanni Mario Rossignolo, Chairman of SKF’s Italian subsidiaryreceived a compensation of ITL 279 897 910 during 1998, in addi-tion to his annual fee as a board member of AB SKF. Of thisamount ITL 34 425 000 was a bonus.
Mauritz Sahlin, who previously held the position of Presidentand Chief Executive Officer through the Annual General Meeting1995, received – in addition to his annual fee as a board memberof AB SKF– an annual fee as board member of a subsidiary and aconsultancy fee, totally amounting to SEK 272 500. In addition,Mauritz Sahlin received his retirement pension in accordance witha so-called ”60-year agreement”.
Peter Augustsson, President and Chief Executive Officer of ABSKF up until August 31, 1998, received SEK 4 411 157 as salaryand other remunerations. This included a bonus of SEK 675 000and options of SEK 71 680 in accordance with the options programmentioned below. He received USD 14 000 as an additional fee asboard member of a subsidiary and free housing. Peter Augustssonwill receive a severance payment amounting to SEK 8 704 800.
Sune Carlsson, President and Chief Executive Officer of ABSKF from September 1, 1998, received SEK 17 288 629 as salaryand other renumerations, in addition to his annual fee as a boardmember of AB SKF until August 31, 1998. This included options ofSEK 15 372 093. In accordance with swedish legal practice optionbenefits will be taxed when given to the employee. Half of thisamount SEK 15 372 093 was taxes paid. AB SKF will make provi-sions corresponding to 35% of Sune Carlsson’s yearly salary,amounting to SEK 5 000 000, for the future pension benefit of SuneCarlsson. In the event of termination at the request of AB SKF,Sune Carlsson will receive a severance payment amounting tomaximum two years’ salary.
Certain members of Group management will receive an addi-tional pension over and above the ordinary plan and in one case, a contract exists for early old age pension. The total commitmentfor these benefits amounted in 1998 to approximately MSEK18 500 000 and was fully provided for in the Group accounts.
In 1996 SKF introduced an option program for the Group’s topemployees. The program, which is based on the Group’s results, isaimed at some 150 people and would allocate call options on SKFshares already issued.

51
U . S . G A A P
28. RECONCILIATION TO UNITED STATES GENER-ALL Y ACCCEPTED ACCOUNTING PRINCIPLES
An annual report, Form 20-F, is submitted to the Securities andExchange Commission (SEC), in the U.S. Accounting policies ofthe SKF Group that differ significantly from U.S. GAAP are asfollows:
1. Deferred income taxesAdjustments for deferred income taxes in the reconciliation to U.S.GAAP are attributable to the differences described below.
2. Revaluation of tangible assetsIn certain countries, tangible assets have been revalued at anamount in excess of cost. U.S. GAAP does not permit the revalua-tion of tangible assets in the financial statements.
3. Capitalization of interest expenseIn accordance with Swedish GAAP, the SKF Group has not capital-ized interest expense incurred in connection with the financing ofexpenditures for construction of tangible assets. Such interestexpense is required to be capitalized in accordance with U.S.GAAP and be depreciated according to plan.
4. Gain on sale of real estateThe real estate in Sweden, which was sold and leased back(through September 1996) in 1987, 1989, and 1990 is reported asa sale and financial transaction beginning in 1995 in the Swedishaccounts (see note 1 – Changes in accounting principles). Accord-ingly, there are no differences between Swedish and U.S. GAAP forthese transactions.
5. Provisions for restructuringProvisions for restructuring have been made based on Swedishgenerally accepted accounting principles. According to U.S. GAAP,restructuring plans should be made public and the terms communi-cated to the employees concerned before year-end, for SKFDecember 31, to qualify to be accounted for as provisions. Thoseprovisions which have been reversed for U.S. GAAP purposes aremainly reversed since the above mentioned criteria are not fulfilled.
6. Provisions for pensions and postretirement benefi tsPeriodic pension cost and liability and postretirement benefits arecalculated by the Group according to local laws and accountingprinciples. Under U.S. GAAP, the periodic pension cost and liabilityshould be calculated according to SFAS 87, ”Employers’ Account-ing for Pensions” and be disclosed according to SFAS 132,”Employers’ Disclosures about Pensions and Other PostretirementBenefits”. This statement supersedes the disclosure requirementsin FASB Statements No. 87, 88 and 106 and is effective for fiscalyears beginning after December 15, 1997. The disclosures for1997 and 1996 have been restated according to SFAS 132.
Provisions for pensionsThe Group sponsors benefit plans, defined according to SFAS 87,in several countries, principally Sweden, Germany, France, theUnited States and Spain. The Swedish plan supplements statutorypensions where benefits are established by national organizations.The subsidiaries in France sponsor a retirement indemnity plan inaccordance with French National Employer/Employee agreements.Plans in Germany, Spain and the United States are designed tosupplement these countries’ social security pensions.
The U.S. and French plans are funded. Benefits are based on acombination of age, salary and service and are available to allemployees meeting age, service and other requirements.
The following tables summarize approximate disclosures underSFAS 132.
1998 1997 1996Change in benefi t obligation (PBO)Benefit obligation at beginning of year 8 285 7 566 7 713Service cost 151 130 115Interest cost 550 546 519Settlements – - 71 –Plan amendments - 4 2 13Adjustments* 30 - 17 - 38Actuarial loss 520 259 310Benefits paid - 618 - 486 - 448Other - 1 - 1 1Translation adjustment 233 357 - 619Benefit obligation (PBO) at end of year 9 146 8 285 7 566
* Adjustments made for new/sold companies and businesses.
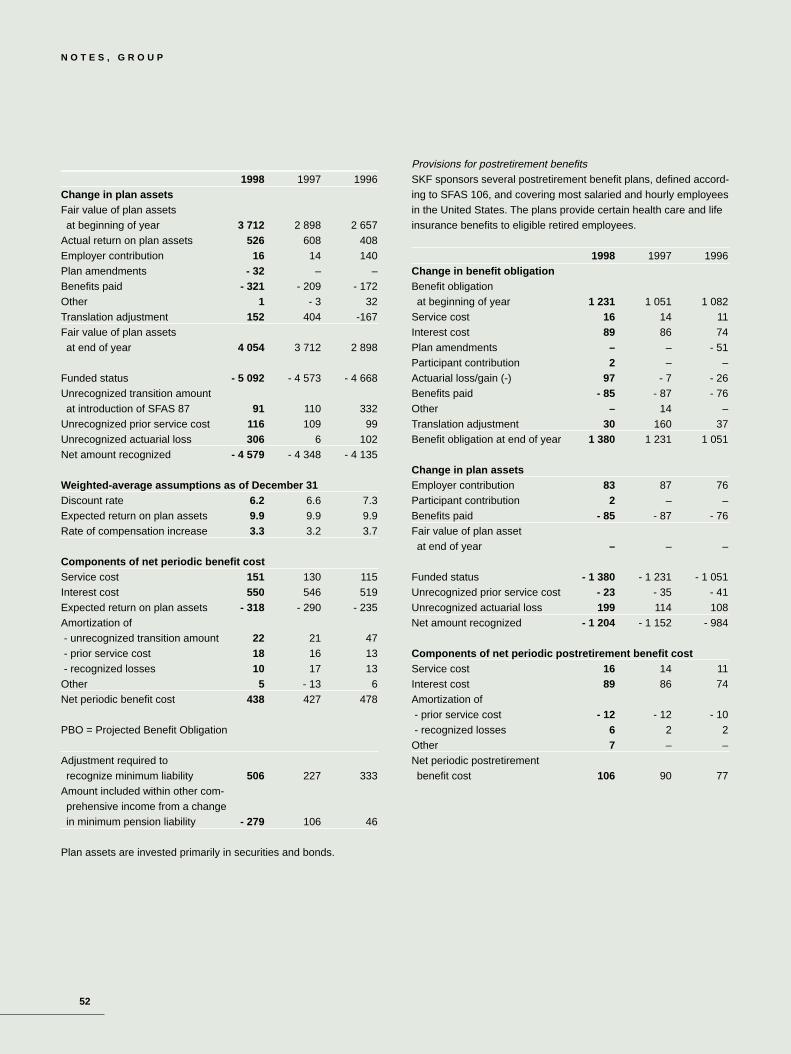
52
N O T E S , G R O U P
1998 1997 1996Change in plan assetsFair value of plan assetsat beginning of year 3 712 2 898 2 657
Actual return on plan assets 526 608 408Employer contribution 16 14 140Plan amendments - 32 – –Benefits paid - 321 - 209 - 172Other 1 - 3 32Translation adjustment 152 404 -167Fair value of plan assets at end of year 4 054 3 712 2 898
Funded status - 5 092 - 4 573 - 4 668Unrecognized transition amountat introduction of SFAS 87 91 110 332
Unrecognized prior service cost 116 109 99Unrecognized actuarial loss 306 6 102Net amount recognized - 4 579 - 4 348 - 4 135
Weighted-average assumptions as of December 31Discount rate 6.2 6.6 7.3Expected return on plan assets 9.9 9.9 9.9Rate of compensation increase 3.3 3.2 3.7
Components of net periodic benefi t costService cost 151 130 115Interest cost 550 546 519Expected return on plan assets - 318 - 290 - 235Amortization of- unrecognized transition amount 22 21 47- prior service cost 18 16 13- recognized losses 10 17 13
Other 5 - 13 6Net periodic benefit cost 438 427 478
PBO = Projected Benefit Obligation
Adjustment required torecognize minimum liability 506 227 333
Amount included within other com-prehensive income from a change in minimum pension liability - 279 106 46
Plan assets are invested primarily in securities and bonds.
Provisions for postretirement benefitsSKF sponsors several postretirement benefit plans, defined accord-ing to SFAS 106, and covering most salaried and hourly employeesin the United States. The plans provide certain health care and lifeinsurance benefits to eligible retired employees.
1998 1997 1996Change in benefi t obligationBenefit obligationat beginning of year 1 231 1 051 1 082
Service cost 16 14 11Interest cost 89 86 74Plan amendments – – - 51Participant contribution 2 – –Actuarial loss/gain (-) 97 - 7 - 26Benefits paid - 85 - 87 - 76Other – 14 –Translation adjustment 30 160 37Benefit obligation at end of year 1 380 1 231 1 051
Change in plan assetsEmployer contribution 83 87 76Participant contribution 2 – –Benefits paid - 85 - 87 - 76Fair value of plan assetat end of year – – –
Funded status - 1 380 - 1 231 - 1 051Unrecognized prior service cost - 23 - 35 - 41Unrecognized actuarial loss 199 114 108Net amount recognized - 1 204 - 1 152 - 984
Components of net periodic postretirement benefi t costService cost 16 14 11Interest cost 89 86 74Amortization of- prior service cost - 12 - 12 - 10- recognized losses 6 2 2
Other 7 – –Net periodic postretirement benefit cost 106 90 77
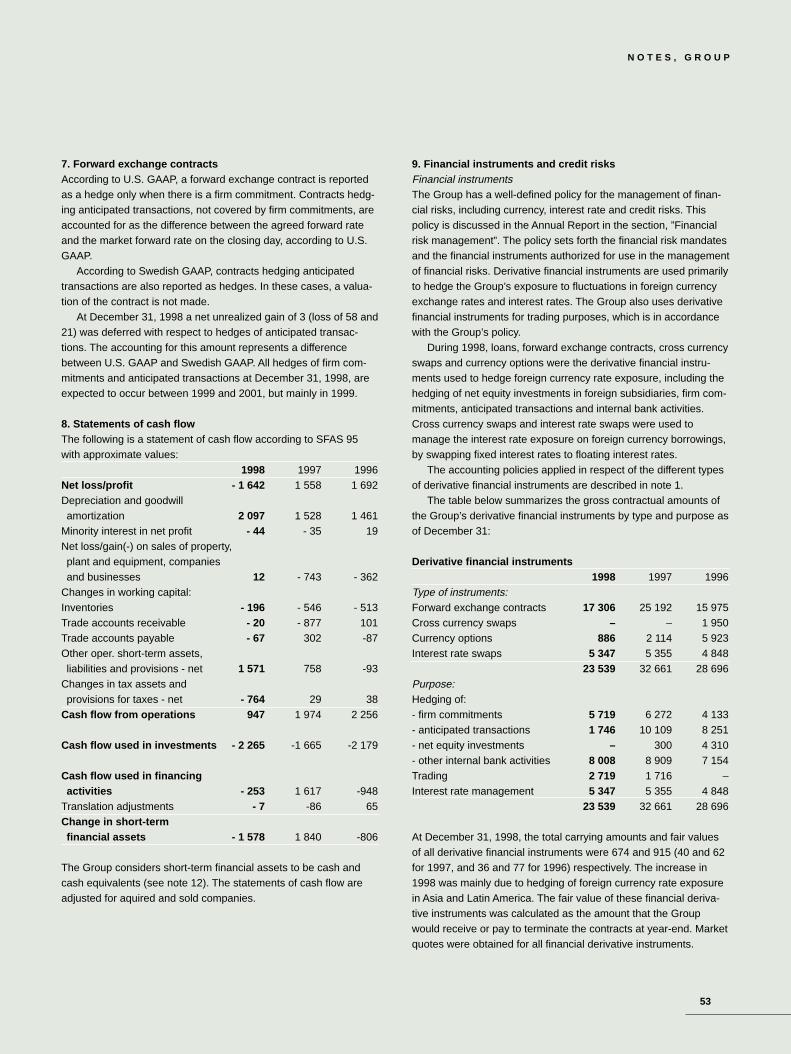
53
N O T E S , G R O U P
7. Forward exchange contractsAccording to U.S. GAAP, a forward exchange contract is reportedas a hedge only when there is a firm commitment. Contracts hedg-ing anticipated transactions, not covered by firm commitments, areaccounted for as the difference between the agreed forward rateand the market forward rate on the closing day, according to U.S.GAAP.
According to Swedish GAAP, contracts hedging anticipatedtransactions are also reported as hedges. In these cases, a valua-tion of the contract is not made.
At December 31, 1998 a net unrealized gain of 3 (loss of 58 and21) was deferred with respect to hedges of anticipated transac-tions. The accounting for this amount represents a differencebetween U.S. GAAP and Swedish GAAP. All hedges of firm com-mitments and anticipated transactions at December 31, 1998, areexpected to occur between 1999 and 2001, but mainly in 1999.
8. Statements of cash fl owThe following is a statement of cash flow according to SFAS 95with approximate values:
1998 1997 1996Net loss/profi t - 1 642 1 558 1 692Depreciation and goodwillamortization 2 097 1 528 1 461
Minority interest in net profit - 44 - 35 19Net loss/gain(-) on sales of property, plant and equipment, companies and businesses 12 - 743 - 362
Changes in working capital: Inventories - 196 - 546 - 513Trade accounts receivable - 20 - 877 101Trade accounts payable - 67 302 -87Other oper. short-term assets,liabilities and provisions - net 1 571 758 -93
Changes in tax assets and provisions for taxes - net - 764 29 38
Cash fl ow from operations 947 1 974 2 256
Cash fl ow used in investments - 2 265 -1 665 -2 179
Cash fl ow used in fi nancing activities - 253 1 617 -948
Translation adjustments - 7 -86 65Change in short-term financial assets - 1 578 1 840 -806
The Group considers short-term financial assets to be cash andcash equivalents (see note 12). The statements of cash flow areadjusted for aquired and sold companies.
9. Financial instruments and credit risksFinancial instrumentsThe Group has a well-defined policy for the management of finan-cial risks, including currency, interest rate and credit risks. Thispolicy is discussed in the Annual Report in the section, ”Financialrisk management”. The policy sets forth the financial risk mandatesand the financial instruments authorized for use in the managementof financial risks. Derivative financial instruments are used primarilyto hedge the Group’s exposure to fluctuations in foreign currencyexchange rates and interest rates. The Group also uses derivativefinancial instruments for trading purposes, which is in accordancewith the Group’s policy.
During 1998, loans, forward exchange contracts, cross currencyswaps and currency options were the derivative financial instru-ments used to hedge foreign currency rate exposure, including thehedging of net equity investments in foreign subsidiaries, firm com-mitments, anticipated transactions and internal bank activities.Cross currency swaps and interest rate swaps were used tomanage the interest rate exposure on foreign currency borrowings,by swapping fixed interest rates to floating interest rates.
The accounting policies applied in respect of the different typesof derivative financial instruments are described in note 1.
The table below summarizes the gross contractual amounts ofthe Group’s derivative financial instruments by type and purpose asof December 31:
Derivative fi nancial instruments1998 1997 1996
Type of instruments:Forward exchange contracts 17 306 25 192 15 975Cross currency swaps – – 1 950Currency options 886 2 114 5 923Interest rate swaps 5 347 5 355 4 848
23 539 32 661 28 696Purpose:Hedging of: - firm commitments 5 719 6 272 4 133- anticipated transactions 1 746 10 109 8 251- net equity investments – 300 4 310- other internal bank activities 8 008 8 909 7 154Trading 2 719 1 716 –Interest rate management 5 347 5 355 4 848
23 539 32 661 28 696
At December 31, 1998, the total carrying amounts and fair valuesof all derivative financial instruments were 674 and 915 (40 and 62for 1997, and 36 and 77 for 1996) respectively. The increase in1998 was mainly due to hedging of foreign currency rate exposurein Asia and Latin America. The fair value of these financial deriva-tive instruments was calculated as the amount that the Groupwould receive or pay to terminate the contracts at year-end. Marketquotes were obtained for all financial derivative instruments.

54
N O T E S , G R O U P
Credit risksThe Group’s concentration of operational credit risk is limited pri-marily because of its many geographically and industrially diversecustomers.
The Group is exposed to credit losses in the event of non-per-formance by the counterparties to its financial instruments but doesnot expect any counterparties to fail to meet their obligations. TheGroup deals only with well established international financial institu-tions. The Group does not obtain collateral or other security to sup-port financial derivative instruments subject to credit risk.
Recently Issued Accounting StandardsIn August 1998, the Financial Accounting Standards Board issuedSFAS 133, ”Accounting for Derivative Instruments and HedgingActivities”, which establishes accounting and reporting standardsfor derivative instruments and requests that all derivatives be rec-ognized as either assets or liabilities in the balance sheets. Thisnew standard is effective for the Group for the year ending Decem-ber 31, 2000. Based on information currently available, the Groupdoes not expect the new standard to have a material effect on thefinancial position or results of operations.
10. Comprehensive loss/income according to SF AS 130The comprehensive loss/income defined according to SFAS 130amounted to -1 897 (1 336 and 1 739). The difference between thenet loss/profit and comprehensive loss/income is the losses/gainsfrom hedges (net of taxes) of investments in foreign subsidiaries(see note 13) and the change in minimum pension liability definedaccording to SFAS 87.
The net loss/profit is reconciled to comprehensive loss/incomeas follows:
1998 1997 1996Loss/profit for the year - 1 642 1 558 1 692Losses/gains from hedges(net of taxes) 24 - 328 6
Change in minimum pension liability - 279 106 41
Comprehensive loss/income - 1 897 1 336 1 739
11. SummaryThe application of U.S. GAAP would have the following approxi-mate effect on consolidated net loss/profit, shareholders’ equity andearnings per share:
Net loss/profi t:1998 1997 1996
As reported in the consolidated income statements - 1 642 1 558 1 692
Items increasing/decreasingnet loss/profit:
28.1 Deferred income taxes - 238 18 - 3928.2 Depreciation on revaluation of assets including effect in connection with sale 21 6 14
28.3 Capitalization of interest expense 48 54 5728.5 Provisions for restructuring 700 – –28.6 Pensions - 14 - 79 - 1128.7 Forward exchange contracts 61 -37 - 53Net change in net loss/profit: 578 - 38 - 32Approximate net loss/profit in accordance with U.S. GAAP - 1 064 1 520 1 660
Shareholders’ equity:1998 1997 1996
As reported in the consolidatedbalance sheets 10 932 12 588 11 310
Items increasing/decreasing shareholders’ equity:
28.1 Deferred income taxes - 74 164 14628.2 Revaluation of assets - 251 - 254 -25328.3 Capitalization of interest expense 217 170 11628.5 Provisions for restructuring 700 – –28.6 Pensions - 193 - 179 -10028.7 Forward exchange contracts 3 - 58 -21Net change in shareholders’ equity 402 - 157 -112Approximate shareholders’ equity inaccordance with U.S. GAAP 11 334 12 431 11 198
Loss/earnings per share, in SEK (1):
1998 1997 1996Net loss/earnings per share in accordance with U.S. GAAP - 9.50 13.35 14.60
Weighted average number of shares outstanding 113 837 767 113 837 767 113 837 767
1) Loss/earnings per share have been recalculated to take into accountchanges in accounting principles (see note 1) and the conversion of838 211 shares in July 1997.

55
N O T E S , G R O U P
Summary comparing the reported consolidated balance sheets with the balance sheets after approximate adjustments to U.S. GAAP:As reported in the Approximate amounts after
consolidated balance sheets adjustments to U.S. GAAP1998 1997 1996 1998 1997 1996
Intangible assets 1 042 576 568 1 143 724 833Long-term deferred tax assets 1 197 715 693 1 097 809 759Tangible assets 14 568 13 631 12 541 14 534 13 547 12 404Long-term financial assets 1 084 1 185 1 063 1 084 1 185 1 063Inventories 10 183 9 924 9 476 10 183 9 924 9 476Short-term tax assets 658 562 534 658 578 534Other short-term assets 7 930 7 916 6 818 7 933 7 916 6 818Short-term financial assets 2 353 3 931 2 091 2 353 3 931 2 091Total assets 39 015 38 440 33 784 38 985 38 614 33 978
Shareholders’ equity 10 932 12 588 11 310 11 334 12 431 11 198Minority interest 367 290 288 367 290 288Provisions for pensions and other postretirement benefits 7 139 6 171 6 030 7 561 6 588 6 458
Provision for deferred taxes, long-term 1 304 1 275 1 288 1 277 1 222 1 214Provision for deferred taxes, short-term 184 367 413 185 366 407Other provisions 4 095 2 981 2 130 3 267 2 891 2 067Long-term loans 4 842 6 538 4 846 4 842 6 538 4 846Other long-term liabilities 88 69 74 88 69 74Short-term loans 3 337 1 853 1 693 3 337 1 853 1 693Other short-term liabilities 6 727 6 308 5 712 6 727 6 366 5 733Total equity, provisions and liabilities 39 015 38 440 33 784 38 985 38 614 33 978
29. INVESTMENTS
1998 1997 1996Investments in Associated Companies – 29 24Other investments 200 326 53
200 355 77Investments in Associated Companies
Nominal Book valueHolding Number value in in SEK
Name and location in percent of shares Currency thousands thousandsHeld by Parent Company:Revolve Magnetic Bearings Inc, Canada 40.0 444 000 CAD 3 813 –Held by subsidiaries:WPB Water Pump Bearing Beteiligungsgesellschaft mbH, Germany 40.0 1 DEM 20 –WPB Water Pump Bearing GmbH & Co. KG, Germany 40.0 1 DEM 22 000 –
–
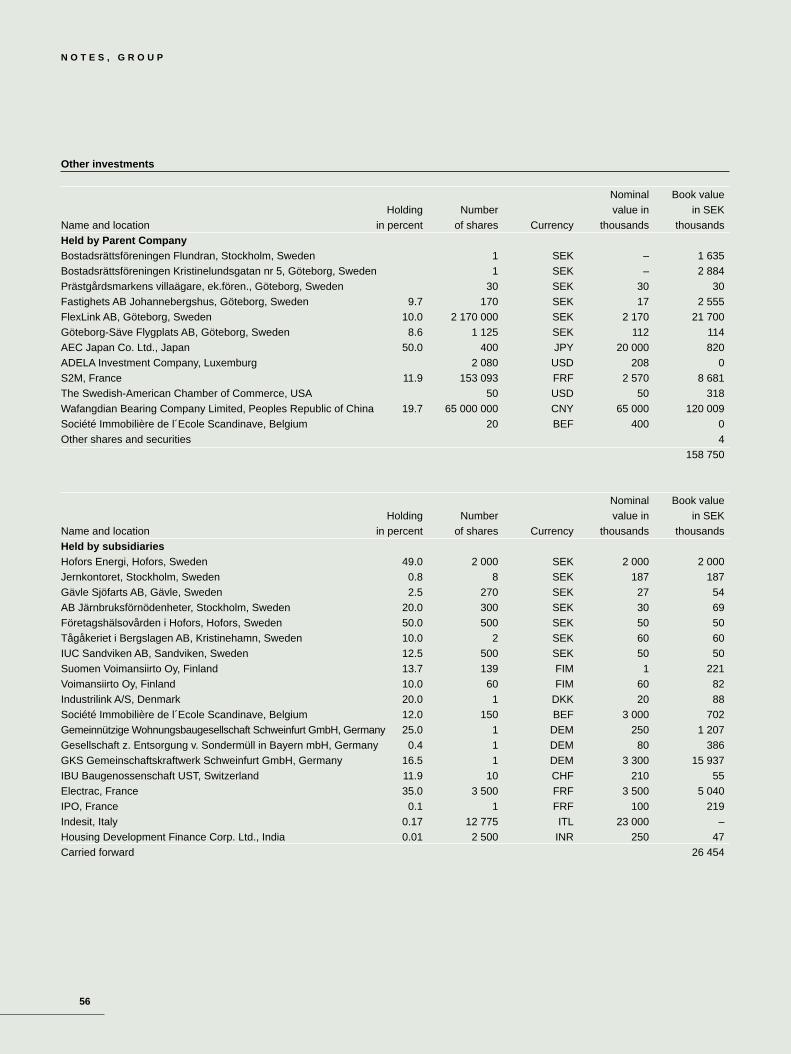
56
N O T E S , G R O U P
Other investments
Nominal Book valueHolding Number value in in SEK
Name and location in percent of shares Currency thousands thousandsHeld by Parent CompanyBostadsrättsföreningen Flundran, Stockholm, Sweden 1 SEK – 1 635Bostadsrättsföreningen Kristinelundsgatan nr 5, Göteborg, Sweden 1 SEK – 2 884Prästgårdsmarkens villaägare, ek.fören., Göteborg, Sweden 30 SEK 30 30Fastighets AB Johannebergshus, Göteborg, Sweden 9.7 170 SEK 17 2 555FlexLink AB, Göteborg, Sweden 10.0 2 170 000 SEK 2 170 21 700Göteborg-Säve Flygplats AB, Göteborg, Sweden 8.6 1 125 SEK 112 114AEC Japan Co. Ltd., Japan 50.0 400 JPY 20 000 820ADELA Investment Company, Luxemburg 2 080 USD 208 0S2M, France 11.9 153 093 FRF 2 570 8 681The Swedish-American Chamber of Commerce, USA 50 USD 50 318Wafangdian Bearing Company Limited, Peoples Republic of China 19.7 65 000 000 CNY 65 000 120 009Société Immobilière de l´Ecole Scandinave, Belgium 20 BEF 400 0Other shares and securities 4
158 750
Nominal Book valueHolding Number value in in SEK
Name and location in percent of shares Currency thousands thousandsHeld by subsidiariesHofors Energi, Hofors, Sweden 49.0 2 000 SEK 2 000 2 000Jernkontoret, Stockholm, Sweden 0.8 8 SEK 187 187Gävle Sjöfarts AB, Gävle, Sweden 2.5 270 SEK 27 54AB Järnbruksförnödenheter, Stockholm, Sweden 20.0 300 SEK 30 69Företagshälsovården i Hofors, Hofors, Sweden 50.0 500 SEK 50 50Tågåkeriet i Bergslagen AB, Kristinehamn, Sweden 10.0 2 SEK 60 60IUC Sandviken AB, Sandviken, Sweden 12.5 500 SEK 50 50Suomen Voimansiirto Oy, Finland 13.7 139 FIM 1 221Voimansiirto Oy, Finland 10.0 60 FIM 60 82Industrilink A/S, Denmark 20.0 1 DKK 20 88Société Immobilière de l´Ecole Scandinave, Belgium 12.0 150 BEF 3 000 702Gemeinnützige Wohnungsbaugesellschaft Schweinfurt GmbH, Germany 25.0 1 DEM 250 1 207Gesellschaft z. Entsorgung v. Sondermüll in Bayern mbH, Germany 0.4 1 DEM 80 386GKS Gemeinschaftskraftwerk Schweinfurt GmbH, Germany 16.5 1 DEM 3 300 15 937IBU Baugenossenschaft UST, Switzerland 11.9 10 CHF 210 55Electrac, France 35.0 3 500 FRF 3 500 5 040IPO, France 0.1 1 FRF 100 219Indesit, Italy 0.17 12 775 ITL 23 000 –Housing Development Finance Corp. Ltd., India 0.01 2 500 INR 250 47Carried forward 26 454
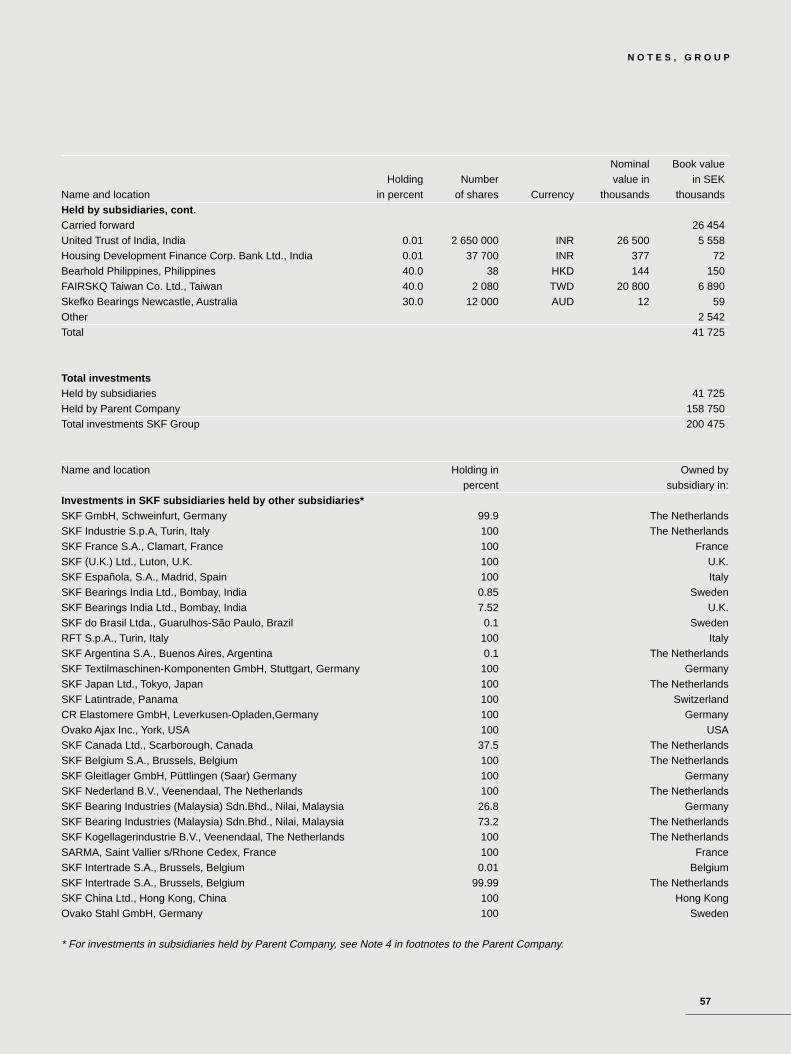
57
N O T E S , G R O U P
Nominal Book valueHolding Number value in in SEK
Name and location in percent of shares Currency thousands thousandsHeld by subsidiaries, cont.Carried forward 26 454United Trust of India, India 0.01 2 650 000 INR 26 500 5 558Housing Development Finance Corp. Bank Ltd., India 0.01 37 700 INR 377 72Bearhold Philippines, Philippines 40.0 38 HKD 144 150FAIRSKQ Taiwan Co. Ltd., Taiwan 40.0 2 080 TWD 20 800 6 890Skefko Bearings Newcastle, Australia 30.0 12 000 AUD 12 59Other 2 542Total 41 725
Total investments Held by subsidiaries 41 725Held by Parent Company 158 750Total investments SKF Group 200 475
Name and location Holding in Owned by percent subsidiary in:
Investments in SKF subsidiaries held by other subsidiaries*SKF GmbH, Schweinfurt, Germany 99.9 The NetherlandsSKF Industrie S.p.A, Turin, Italy 100 The NetherlandsSKF France S.A., Clamart, France 100 FranceSKF (U.K.) Ltd., Luton, U.K. 100 U.K.SKF Española, S.A., Madrid, Spain 100 ItalySKF Bearings India Ltd., Bombay, India 0.85 SwedenSKF Bearings India Ltd., Bombay, India 7.52 U.K.SKF do Brasil Ltda., Guarulhos-São Paulo, Brazil 0.1 SwedenRFT S.p.A., Turin, Italy 100 ItalySKF Argentina S.A., Buenos Aires, Argentina 0.1 The NetherlandsSKF Textilmaschinen-Komponenten GmbH, Stuttgart, Germany 100 GermanySKF Japan Ltd., Tokyo, Japan 100 The NetherlandsSKF Latintrade, Panama 100 SwitzerlandCR Elastomere GmbH, Leverkusen-Opladen,Germany 100 GermanyOvako Ajax Inc., York, USA 100 USASKF Canada Ltd., Scarborough, Canada 37.5 The NetherlandsSKF Belgium S.A., Brussels, Belgium 100 The NetherlandsSKF Gleitlager GmbH, Püttlingen (Saar) Germany 100 GermanySKF Nederland B.V., Veenendaal, The Netherlands 100 The NetherlandsSKF Bearing Industries (Malaysia) Sdn.Bhd., Nilai, Malaysia 26.8 GermanySKF Bearing Industries (Malaysia) Sdn.Bhd., Nilai, Malaysia 73.2 The NetherlandsSKF Kogellagerindustrie B.V., Veenendaal, The Netherlands 100 The NetherlandsSARMA, Saint Vallier s/Rhone Cedex, France 100 FranceSKF Intertrade S.A., Brussels, Belgium 0.01 BelgiumSKF Intertrade S.A., Brussels, Belgium 99.99 The NetherlandsSKF China Ltd., Hong Kong, China 100 Hong KongOvako Stahl GmbH, Germany 100 Sweden
* For investments in subsidiaries held by Parent Company, see Note 4 in footnotes to the Parent Company.
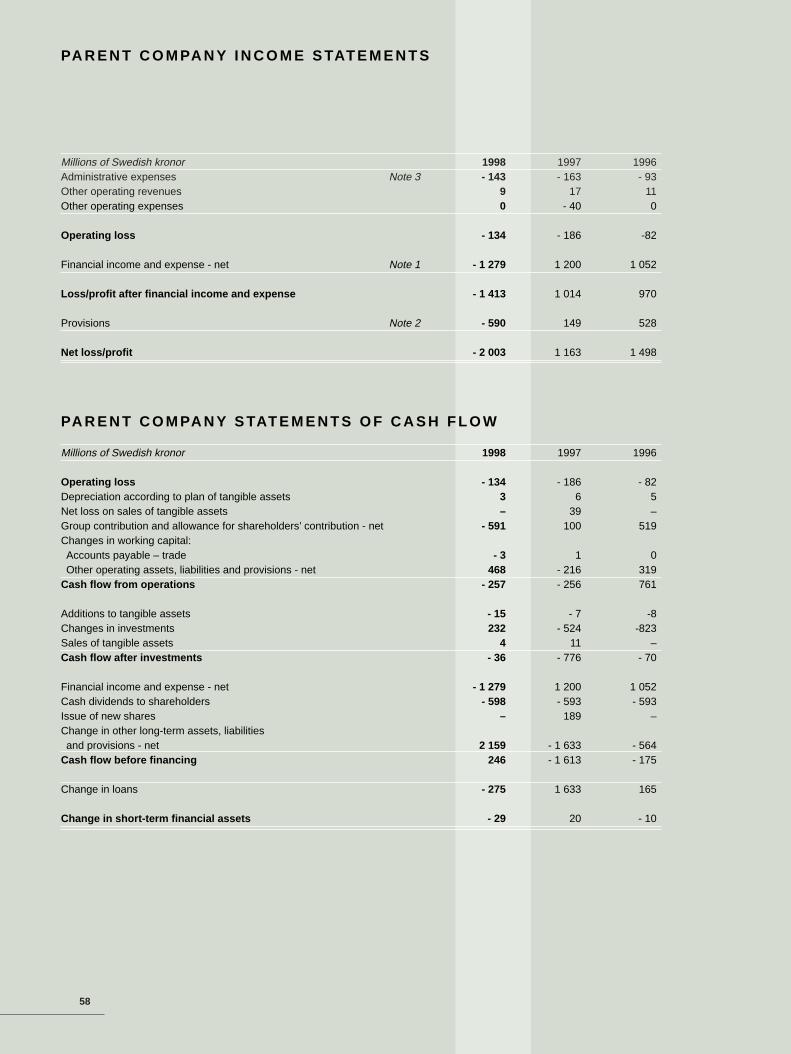
58
Millions of Swedish kronor 1998 1997 1996Administrative expenses Note 3 - 143 - 163 - 93Other operating revenues 9 17 11Other operating expenses 0 - 40 0
Operating loss - 134 - 186 -82
Financial income and expense - net Note 1 - 1 279 1 200 1 052
Loss/profit after financial income and expense - 1 413 1 014 970
Provisions Note 2 - 590 149 528
Net loss/profit - 2 003 1 163 1 498
PA R E N T C O M PA N Y S TAT E M E N T S O F C A S H F L O W
Millions of Swedish kronor 1998 1997 1996
Operating loss - 134 - 186 - 82Depreciation according to plan of tangible assets 3 6 5Net loss on sales of tangible assets – 39 –Group contribution and allowance for shareholders’ contribution - net - 591 100 519Changes in working capital: Accounts payable – trade - 3 1 0Other operating assets, liabilities and provisions - net 468 - 216 319
Cash flow from operations - 257 - 256 761
Additions to tangible assets - 15 - 7 -8Changes in investments 232 - 524 -823Sales of tangible assets 4 11 –Cash flow after investments - 36 - 776 - 70
Financial income and expense - net - 1 279 1 200 1 052Cash dividends to shareholders - 598 - 593 - 593Issue of new shares – 189 –Change in other long-term assets, liabilitiesand provisions - net 2 159 - 1 633 - 564
Cash flow before financing 246 - 1 613 - 175
Change in loans - 275 1 633 165
Change in short-term financial assets - 29 20 - 10
PA R E N T C O M PA N Y I N C O M E S TAT E M E N T S

59
Millions of Swedish kronor 1998 1997 1996
ASSETSCapital assetsTangible assets Note 3 42 34 83Investments in consolidated subsidiaries Note 4 8 296 8 371 8 146Long-term receivables from consolidated subsidiaries 4 005 5 240 3 611Investments in Associated Companies Note 4 0 24 –Other investments Note 4 159 292 17Other long-term receivables 0 0 3
12 502 13 961 11 860Short-term assetsShort-term receivables from consolidated subsidiaries 1 285 1 501 1 322
Other short-term assets Note 5 15 18 22Short-term financial assets Note 6 5 34 14
1 305 1 553 1 358
Total assets 13 807 15 514 13 218
EQUITY, PROVISIONS AND LIABILITIESShareholders’ equity Note 7Restricted equityShare capital (113 837 767 shares, nominal valueSEK 12.50 per share) 1 423 1 423 1 412
Legal reserve 633 633 455Unrestricted equityRetained earnings 5 461 4 896 3 991Net loss/profit - 2 003 1 163 1 498
5 514 8 115 7 356
Untaxed reserves Note 2 14 15 64
ProvisionsProvisions for pensions and similar commitments Note 8 394 383 374
Other provisions 24 1 1418 384 375
Long-term liabilitiesConvertible bonds Note 9 – – 1 525Long-term loans Note 10 3 993 5 153 1 995Long-term liabilities to consolidated subsidiaries 1 040 127 137Other long-term liabilities – 0 6
5 033 5 280 3 663Short-term liabilitiesShort-term loans Note 11 895 10 10Accounts payable - trade 7 10 9Short-term liabilities to consolidated subsidiaries 1 706 1 468 1 604Other short-term liabilities Note 12 220 232 137
2 828 1 720 1 760
Total equity , provisions and liabilities 13 807 15 514 13 218
Assets pledged Note 13 1 – 0Contingent liabilities Note 14 101 344 293
PA R E N T C O M PA N Y B A L A N C E S H E E T S

60
N O T E S TO T H E F I N A N C I A L S TAT E M E N T S F O R T H E PA R E N T C O M PA N YAmounts in millions of Swedish kronor (MSEK) unless otherwise stated.
For description of accounting principles, see note 1 to the Consoli-dated Financial Statements.
1. FINANCIAL INCOME AND EXPENSE
1998 1997 1996Income from investments in consoli-dated subsidiaries - 1 136 1 211 1 048
Income from investments inassociated companies - 26 – –
Income from other equity securities and long-term financial investments 346 698 350
Other financial income and similar items 14 16 59
Interest expense and similar items - 477 - 725 - 405- 1 279 1 200 1 052
Specifi cation of fi nancial income and expense, net1998 1997 1996
Dividends related to- investments in consolidated subsidiaries 351 650 1 081
- income from other equity securities and long-term financial investments 6 0 0
Total dividends 357 650 1 081
Interest income related to- income from other equity securities and long-term financial investments - consolidated subsidiaries 349 363 306- other – 0 0
- other financial income and similar items - consolidated subsidiaries 12 12 58- other 1 1 2
Total interest income 362 376 366
Interest expense for- financial liabilities related tointerest expense and similar items - consolidated subsidiaries - 8 - 21 - 61- other - 350 - 360 - 304
- pensions and other postretirement benefits related to interest expense and similar items - 19 - 14 - 22
Total interest expense - 377 - 395 - 387
1998 1997 1996Financial exchange gains and losses related to- income from other equity securities and long term financial investments - consolidated subsidiaries 100 333 44
- other financial income and similar items - consolidated subsidiaries 0 0 - 1- other 1 3 0
- interest expense and similar items - consolidated subsidiaries 1 - 16 22- other - 101 - 314 - 40
Total financial exchange gains and losses 1 6 25
Capital gains and losses from sales related to- investments in consolidated subsidiaries - 10 651 - 33
- other equity securities and long-term financial assets 1 2 –
Total capital gains and losses from sales - 9 653 -33
Write-downs related to- income from investments in - consolidated subsidiaries - 1 477 - 90 –- associated companies - 26 – –
- income from other equity securitiesand long-term financial investments - 110 – –
Total write-downs - 1 613 - 90 –
Financial income and expense, net - 1 279 1 200 1 052
2. PROVISIONS AND UNTAXED RESERVES
Provisions1998 1997 1996
Change in accelerated depreciation reserve 1 39 3
Change in other reserves 0 10 61 49 9
Group contribution received 93 536 545Group contribution paid - 672 -413 - 6Allowance for shareholders’contribution - 12 - 23 - 20
- 591 100 519- 590 149 528
Untaxed reserves1998 1997 1996
Accelerated depreciation reserve 14 15 54Other reserves – 0 10
14 15 64

61
N O T E S , P A R E N T C O M P A N Y
3. TANGIBLE ASSETS
Acquisition cost:Additions
1998 during the year Disposals 1997 1996Land, land improvements and buildings 27 12 - 4 19 122Machinery and supply systems 36 3 - 4 37 76
63 15 - 8 56 198
Accumulated depreciation according to plan:Depreciation
1998 during the year Disposals 1997 1996Land, land improvements and buildings 2 0 0 2 76Machinery and supply systems 19 3 - 4 20 39
21 3 - 4 22 115
Net book value 42 12 - 4 34 83
Depreciation according to plan is included in administrative expenses.
Tax value of tangible assets:1998 1997 1996
Land and land improvements 3 2 42Buildings 8 7 153
11 9 195
4. INVESTMENTS
Investments in subsidiaries are specified below. For specification of investments in Associated Companies and other investments held by theParent Company, see note 29 to the Consolidated Financial Statements.
Investments in subsidiaries held by the Parent Company on December 31, 1998Nominal Book value
Holding Number of value in in SEKName and location in percent shares Currency thousands thousandsManufacturing companiesSKF Sverige AB, Göteborg, Sweden 100 2 650 000 SEK 265 000 363 300SKF USA Inc., Pa., USA 99.8 1 444 447 USD 72 222 770 617SKF Österreich AG, Austria 100 200 ATS 200 000 175 958SKF GmbH, Germany 0.1 – DEM 218 1 813SKF Poznan S.A., Poland 99.6 1 746 548 PLN 34 931 68 038Lutsk Bearing Plant, Ukraine 89.7 111 997 788 UAH 27 999 132 366SKF Actuators AB, Göteborg, Sweden 100 1 000 SEK 1 000 0SKF AutoBalance Systems AB, Göteborg, Sweden 91.0 9 100 SEK 910 912SKF Arvika AB, Arvika, Sweden 100 2 900 SEK 290 0SKF de Mexico S.A. de C.V., Mexico 100 40 000 MXN 40 0SKF do Brasil Limitada, Brazil 99.9 14 688 564 BRL 14 689 75 291SKF Argentina S.A., Argentina 99.9 500 259 ARP 500 10 936SKF Bearings India Ltd., India 42.4 1 067 248 INR 106 725 0CR Seals India Private Limited, India 0.0 101 INR 1 0SKF Mekan AB, Katrineholm, Sweden 100 27 500 SEK 27 500 33 348Lidköping Machine Tools AB, Lidköping, Sweden 100 200 000 SEK 20 000 11 832Carried forward 1 644 411
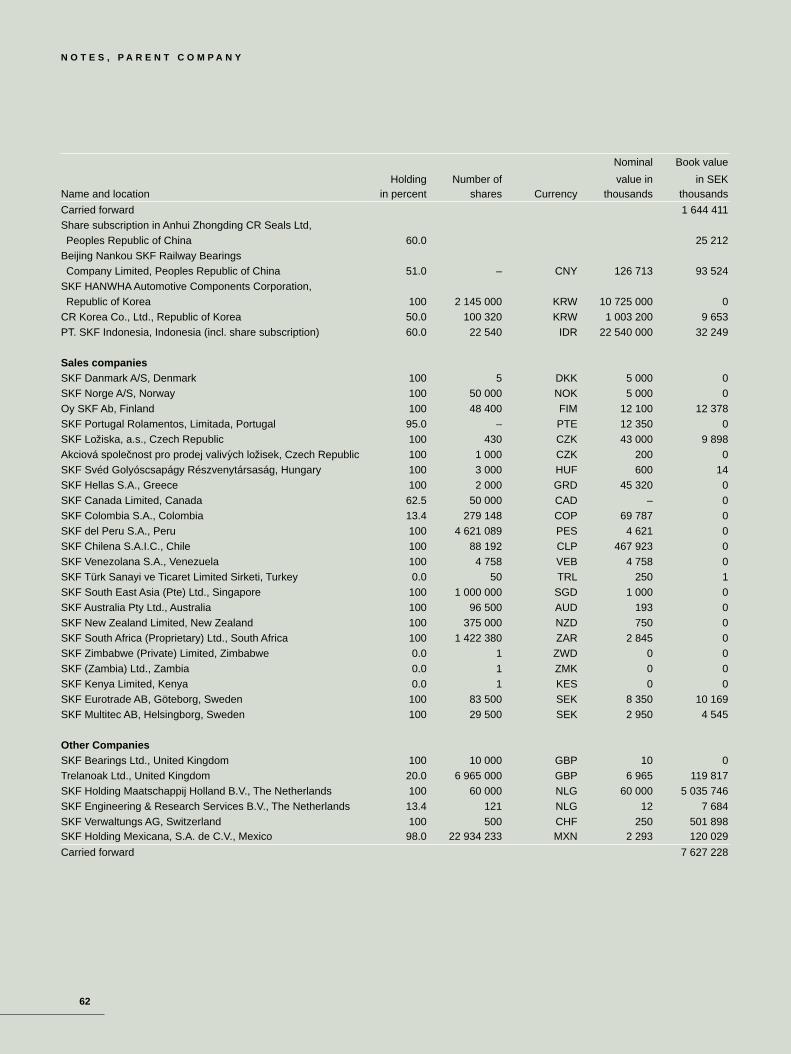
62
N O T E S , P A R E N T C O M P A N Y
Nominal Book value
Holding Number of value in in SEKName and location in percent shares Currency thousands thousands
Carried forward 1 644 411Share subscription in Anhui Zhongding CR Seals Ltd, Peoples Republic of China 60.0 25 212
Beijing Nankou SKF Railway BearingsCompany Limited, Peoples Republic of China 51.0 – CNY 126 713 93 524
SKF HANWHA Automotive Components Corporation,Republic of Korea 100 2 145 000 KRW 10 725 000 0
CR Korea Co., Ltd., Republic of Korea 50.0 100 320 KRW 1 003 200 9 653PT. SKF Indonesia, Indonesia (incl. share subscription) 60.0 22 540 IDR 22 540 000 32 249
Sales companiesSKF Danmark A/S, Denmark 100 5 DKK 5 000 0SKF Norge A/S, Norway 100 50 000 NOK 5 000 0Oy SKF Ab, Finland 100 48 400 FIM 12 100 12 378SKF Portugal Rolamentos, Limitada, Portugal 95.0 – PTE 12 350 0SKF Loziska, a.s., Czech Republic 100 430 CZK 43 000 9 898Akciová spolecnost pro prodej valivych lozisek, Czech Republic 100 1 000 CZK 200 0SKF Svéd Golyóscsapágy Részvenytársaság, Hungary 100 3 000 HUF 600 14SKF Hellas S.A., Greece 100 2 000 GRD 45 320 0SKF Canada Limited, Canada 62.5 50 000 CAD – 0SKF Colombia S.A., Colombia 13.4 279 148 COP 69 787 0SKF del Peru S.A., Peru 100 4 621 089 PES 4 621 0SKF Chilena S.A.I.C., Chile 100 88 192 CLP 467 923 0SKF Venezolana S.A., Venezuela 100 4 758 VEB 4 758 0SKF Türk Sanayi ve Ticaret Limited Sirketi, Turkey 0.0 50 TRL 250 1SKF South East Asia (Pte) Ltd., Singapore 100 1 000 000 SGD 1 000 0SKF Australia Pty Ltd., Australia 100 96 500 AUD 193 0SKF New Zealand Limited, New Zealand 100 375 000 NZD 750 0SKF South Africa (Proprietary) Ltd., South Africa 100 1 422 380 ZAR 2 845 0SKF Zimbabwe (Private) Limited, Zimbabwe 0.0 1 ZWD 0 0SKF (Zambia) Ltd., Zambia 0.0 1 ZMK 0 0SKF Kenya Limited, Kenya 0.0 1 KES 0 0SKF Eurotrade AB, Göteborg, Sweden 100 83 500 SEK 8 350 10 169SKF Multitec AB, Helsingborg, Sweden 100 29 500 SEK 2 950 4 545
Other CompaniesSKF Bearings Ltd., United Kingdom 100 10 000 GBP 10 0Trelanoak Ltd., United Kingdom 20.0 6 965 000 GBP 6 965 119 817SKF Holding Maatschappij Holland B.V., The Netherlands 100 60 000 NLG 60 000 5 035 746SKF Engineering & Research Services B.V., The Netherlands 13.4 121 NLG 12 7 684SKF Verwaltungs AG, Switzerland 100 500 CHF 250 501 898SKF Holding Mexicana, S.A. de C.V., Mexico 98.0 22 934 233 MXN 2 293 120 029
Carried forward 7 627 228

63
N O T E S , P A R E N T C O M P A N Y
Nominal Book value
Holding Number of value in in SEKName and location in percent shares Currency thousands thousands
Carried forward 7 627 228Share subscription in SKF (China) Investment co. Ltd., Peoples Republic of China 100 89 022
Barseco (Pty) Ltd, South Africa 100 100 ZAR 0 0SKF Australia (Manufacturing) Pty. Ltd., Australia 100 1 000 000 AUD 2 000 0Compania SKF Nicaragua S.A., Nicaragua 100 140 NIC 140 0Latinoamericana de Administracion S.A., Panama 100 50 USD 5 0SKF Lager AB, Göteborg, Sweden 100 150 000 SEK 3 000 0SKF Vehicle Parts AB, Göteborg, Sweden 100 115 000 SEK 11 500 13 872Nordiska Kullager Aktiebolaget, Göteborg, Sweden 100 1 000 SEK 100 101AB SKF-Agenturer, Göteborg, Sweden 100 100 SEK 100 0SKF Logistic Services AB, Göteborg, Sweden 100 80 000 SEK 6 400 9 760AB Compania Sudamericana SKF, Göteborg, Sweden 100 300 SEK 300 0AB S.A. des Roulements à Billes Suédois SKF, Göteborg, Sweden 100 100 SEK 100 0SKF International AB, Göteborg, Sweden 100 20 000 SEK 20 000 319 908SKF Reinsurance Co. Ltd., Göteborg, Sweden 100 30 000 SEK 30 000 80 200SKF Fondförvaltning AB, Göteborg, Sweden 100 10 000 SEK 1 000 998AB Svenska Kullagerfabriken, Göteborg, Sweden 100 1 000 SEK 100 101SKF Dataservice AB, Göteborg, Sweden 100 1 000 SEK 100 0SKF Nova AB, Göteborg, Sweden 100 1 000 SEK 100 0AB Transmatic, Göteborg, Sweden 100 1 000 SEK 100 101Bagaregården 16:7 KB, Göteborg, Sweden 99.9 – SEK 250 103* 15 617KB Nya Kulan, Göteborg, Sweden 99.0 – SEK 290 615* 31 075SKF Fastighetsförvaltning AB, Göteborg, Sweden 100 2 000 SEK 200 245SKF Support AB, Göteborg, Sweden 100 2 000 SEK 200 245Ovako Couplings Holding AB, Göteborg, Sweden 100 2 800 000 SEK 280 000 106 470 Ovako Ring AB, in liquidation, Göteborg, Sweden 100 1 000 SEK 100 99Ovako Metallurgy AB, in liquidation, Göteborg, Sweden 100 500 SEK 50 60Ovako Tube AB, Göteborg, Sweden 100 5 000 SEK 500 600
Ovako Steel Holding AB, Göteborg, Sweden 100 9 600 000 SEK 960 000 278 295 729
* As face value the original investment capital for each of the limited partnership companies is disclosed.
5. OTHER SHORT-TERM ASSETS
1998 1997 1996
Other short-term receivables 15 17 20Prepaid expenses 0 1 2
15 18 22
6. SHORT-TERM FINANCIAL ASSETS
1998 1997 1996
Short-term financial receivables 1 27 –Cash and bank accounts 4 7 14
5 34 14

64
N O T E S , P A R E N T C O M P A N Y
7. SHAREHOLDERS’ EQUITY
The distribution of share capital between share types is shown innote 13 to the Consolidated Financial Statements.
Changes in shareholders’ equityUn-
Share Legal restricted
capital reserve equity Total
Opening balance 1996-01-01 1 412 455 4 584 6 451Cash dividend – – - 593 - 593Net profit – – 1 498 1 498
Closing balance 1996-12-31 1 412 455 5 489 7 356Cash dividend – – - 593 - 593Issue of new shares 11 178 – 189Net profit – – 1 163 1 163
Closing balance 1997-12-31 1 423 633 6 059 8 115Cash dividend – – - 598 - 598Net loss – – - 2 003 - 2 003
Closing balance 1998-12-31 1 423 633 3 458 5 514
8. PROVISIONS FOR PENSIONS AND SIMILARCOMMITMENTS
Charges against profit/loss for pensions and similar plans were 80 (53 and 52) which include an interest cost calculated at 19 (14and 22).
Provisions for pensions include pensions in the FPG - PRI(Pension Registration Institute) system by 307 (298 and 294).
9. CONVERTIBLE BONDS
See note 16 to the Consolidated Financial Statements.
10. LONG-TERM LOANS
Long-term loans at the end of the year, excluding the short-termportion:
1998 1997 1996
Bonds 2 897 3 599 1 379Bank loans 606 1 027 378Other borrowings 490 527 238
3 993 5 153 1 995
The above loans were denominated in the following currencies:1998 1997 1996
Swedish kronor 1 292 1 226 437United States dollars 2 701 3 823 1 453Spanish pesetas – 104 105
3 993 5 153 1 995
Maturities of long-term loans as at December 31, 1998, were asfollows:
2000 142001 142002 9212003 5122004 8122005 and thereafter 1 720
3 993The terms of certain loan agreements contain various restrictions, relating principally to further pledging of assets.
11. SHORT-TERM LOANS
1998 1997 1996Current portion of long-term loans 895 10 10
895 10 10
12. OTHER SHORT-TERM LIABILITIES
1998 1997 1996Other short-term liabilities 4 6 6Accrued expenses and deferred income 216 226 131
220 232 137
Accrued expenses and deferred income include accrued interest of177 (185 and 83).
13. ASSETS PLEDGED
1998 1997 1996Mortgages in leasehold, land – – 0Receivables 1 – –
1 – 0
14. CONTINGENT LIABILITIES
1998 1997 1996Guarantees in respect of consolidatedsubsidiaries’ obligations 70 294 261
Other guarantees and contingentliabilities 31 50 32
101 344 293
15. AVERAGE NUMBER OF EMPLOYEES, W AGES,SALARIES AND REMUNERATIONS
For wages, salaries and other remunerations to employees - seenote 26 to the Consolidated Financial Statements.
For average number of employees - see note 27 to theConsolidated Financial Statements.

65
P R O P O S E D D I S T R I B U T I O N O F S U R P L U S
Retained earnings SEK 5 461 680 542Net loss for the year SEK - 2 003 541 739Total surplus SEK 3 458 138 803
The Board of Directors and the President recommend,that a dividend of 2.00 Swedish kronor per share be paid to the shareholders SEK 227 675 534that the balance be carried forward SEK 3 230 463 269
SEK 3 458 138 803
The results of operations and the financial position of the Parent Company and the Group in 1998are given in the income statements and in the balance sheets together with related notes.
Stockholm, January 28, 1999
Anders Scharp Sören Gyll Stig BlombergMauritz Sahlin Helmut Werner Lennart AlveråGiovanni Mario Rossignolo Vito H Baumgartner Anders OlssonPer-Olof Eriksson Ulla LitzénSune Carlsson Göran Johansson
A U D I T O R S ’ R E P O R T
We have audited the Parent Company and the consolidated finan-cial statements, the accounts and the administration of the Board ofDirectors and the President of Aktiebolaget SKF for 1998. Theseaccounts and the administration of the Company are the responsi-bility of the Board of Directors and the President. Our responsibilityis to express an opinion on the financial statements and the admin-istration based on our audit.
We conducted our audit in accordance with Generally AcceptedAuditing Standards in Sweden. Those Standards require that weplan and perform the audit to obtain reasonable assurance that thefinancial statements are free of material misstatement.
An audit includes examining, on a test basis, evidence support-ing the amounts and disclosures in the financial statements. Anaudit also includes assessing the accounting principles used andtheir application by the Board of Directors and the President, aswell as evaluating the overall presentation of information in thefinancial statements.
We examined significant decisions, actions taken and circum-stances of the Company in order to be able to determine the possi-ble liability to the Company of any Board member or the President,or whether they have in some other way acted in contravention ofthe Companies Act, the Annual Accounts Act or the Articles ofAssociation. We believe that our audit provides a reasonable basisfor our opinion.
In our opinion, the Parent Company and the consolidated financialstatements have been prepared in accordance with the AnnualAccounts Act, and, consequently we recommend
- that the income statements and the balance sheets of the ParentCompany and the Group be adopted, and
- that the total surplus of the Parent Company be dealt with inaccordance with the proposal in the Administration Report.
In our opinion, the Board members and the President have notcommitted any act or been guilty of any omission, which could giverise to any liability to the Company. We therefore recommend
- that the members of the Board of Directors and the President bedischarged from liability for the financial year.
Göteborg, February 26, 1999
Arthur Andersen AB
Mats FredricsonAuthorized public accountant

66
S H A R E S A N D S H A R E H O L D E R S
Distribution of shares as per 31 December, 1998
Stockholm London Paris Geneva Basel Zürich New York
(1914) (1928) (1929) (1935) (1985) (1985) (1985)
A shares, unrestricted 49 256 332 •B shares, unrestricted 64 581 435 • • • • • • •Total 113 837 767
Year of introduction on respective stock exchange is indicated within brackets.
An A share has one vote and a B share has one-thousandth of one vote.
The SKF share is traded in the USA through the NASDAQ system via American Depositary Receipts (ADR).
Changes in share capital 1982-1998
Amount paid Share capital Number of shares
MSEK MSEK in millions
1982 Bonus issue 1:4 1 350 27.0
1989 Split 4:1 1 350 108.0
1990 Conversion of debentures 62 1 412 113.0
1997 Conversion of bonds 11 1 423 113.8
Trading in SKF shares
Stockholm London
Year Number of shares MSEK Number of shares MSEK
1992 44 497 000 4 064 81 900 000 *
1993 69 120 000 6 940 92 532 000 *
1994 94 423 000 13 129 99 666 000 *
1995 89 040 000 12 414 72 060 000 *
1996 76 636 130 11 281 70 224 523 10 267
1997 80 880 606 15 335 79 329 702 15 746
1998 114 360 493 16 070 72 421 778 10 841
Source: Stockholm Stock Exchange, London Stock Exchange * No information available
Price development of the SKF B share
50
75
100
125
150
175
200
225
250
275
300
325
350
375
400
19981997199619951994
SEK SEK
50
75
100
125
150
175
200
225
250
275
300
325
350
375
400
Swedish share price index according to Affärsvärlden
Maximum and minimum purchase prices per month
- 15
- 10
- 5
0
5
10
15
96 97 98
14.9
0
13.7
0
- 14
.40
Loss/earnings pershare, SEK
0
30
60
90
120
96 97 9811
1
99 96
Shareholders’equity per share,SEK
0
1
2
3
4
96 97 98
3.13.
3
2.1
Yield in percent, B

67
S H A R E S A N D S H A R E H O L D E R S
Convertible bonds
In May, 1992, AB SKF issued zero coupon convertible bonds amounting to 145 million XEU after a 8.75% discount. At full
conversion, 7 122 928 B shares would have been issued.
In June 1997, SKF called for redemption of the convertible bonds. A number of holders opted to convert their bonds into
shares and as a result of the conversion, 838 211 new B shares were issued in July 1997. The total number of shares
issued is now 113 837 767. The conversion rate was slightly less than SEK 225 per share, which meant that Restricted
shareholders’ equity increased by MSEK 189.
Share savings fund for employees
SKF Allemansfond, a savings fund in which SKF employees in Sweden can save, was started in April 1984. Most of the
means of the fund have been invested in SKF shares. On December 31, 1998, the SKF Allemansfond had 720 members
and assets amounting to MSEK 45.
Distribution of shareholding
Shareholding Number of shareholders Percent Number of shares Percent
1– 1 000 32 063 92.4 6 795 890 6.0
1 001– 10 000 2 246 6.5 6 470 977 5.7
10 001– 100 000 283 0.8 8 758 976 7.7
100 001– 105 0.3 91 811 924 80.6
34 697 100.0 113 837 767 100.0
Source: VPC AB’s public share register as of 1998-12-30
The ten largest shareholders
Number of Number of In percent of In percent of
A-shares B-shares shares votes voting rights share capital
1) Investor AB 15 820 952 150 000 15 970 952 15 821 102 32.1 14.0
2) Skanska Invest AB 9 870 000 – 9 870 000 9 870 000 20.0 8.7
3) SPP (pension funds) 2 316 136 2 138 100 4 454 236 2 318 274 4.7 3.9
4) Nordbanken savings funds 2 106 900 3 991 000 6 097 900 2 110 891 4.3 5.4
5) The National Insurance Fund,
Fourth Fund Managing Board 2 026 800 1 729 000 3 755 800 2 028 529 4.1 3.3
6) Skandia (Insurance Group) 940 574 2 180 694 3 121 268 942 755 1.9 2.7
7) AMF Sjukförsäkring (Insurance Group) 874 200 346 000 1 220 200 874 546 1.8 1.1
8) Stiftelsen för Kunskaps- och
Kompetensutveckling (foundation) 612 600 – 612 600 612 600 1.2 0.5
9) Wallenberg foundations 539 100 106 624 645 724 539 207 1.1 0.6
10) Svenska Handelsbanken savings funds 302 423 973 900 1 276 323 303 397 0.6 1.1
71.8 41.3Source: VPC AB’s public share register as of 1998-12-31.
In total 36.6% of the shares representing 18% of voting rights were owned by foreigners 1998-12-30.
The proportion of institutional ownership was 60.6%.
Per-share data (Definitions see note 1)
Swedish kronor/share 1992 1993 1994 1995 1996 1997 1998
Loss/earnings per share (1) - 14.05 - 4.05 11.25 18.10 14.90 13.70 - 14.40
Cash flow before financing per share (1) - 9.70 1.10 17.00 10.50 - 8.50 0.40 - 11.90
Dividend per A and B share – – 4.25 5.25 5.25 5.25 2.00(2)
Total dividends paid in millions of Swedish kronor – – – 480 593 593 598
Purchase price of B shares at year-end on the
Stockholm Stock Exchange 74 132 122.50 127 160 169 94.50
Shareholders’ equity per share (1) 72 73 81 89 99 111 96
Yield in percent (B) (1) – – 3.5 4.1 3.3 3.1 2.1
P/E ratio, B (1) neg neg 10.9 7.0 10.8 12.3 neg
1) Data per share has been recalculated due to changed accounting principles of the Group (see Note 1) and to take into account the
conversion of 838 211 shares in July 1997.
2) Dividend according to the Board’s proposed distribution of surplus.
Analysts who follow SKF
ABG Securities, StockholmMichael Grundberg
Alfred Berg, StockholmStefan Lundewall
Aros Securities, StockholmMikael Sens
Cazenove & Co., LondonNeil Wilkinson
Cheuvreux de Virieu, StockholmPeter Karlsson
Commerzbank, LondonBrian O’Keefe
Credit Suisse First Boston, LondonDan Manor
D Carnegie, StockholmOla Asplund
Den Danske Bank, StockholmHans Westerberg
Den Norske Bank, StockholmNiklas Elmhammar
Deutsche Morgan Grenfell, StockholmHans-Olov Borneman
Dresdner Kleinwort Benson, LondonPeter Lawrence
Enskilda Securities, StockholmAnders Eriksson
Goldman Sachs International, LondonColin Gibson
Hagströmer & Qviberg Fondkommission, Stockholm
Johan Tisell
Handelsbanken Markets, StockholmAnders Bruzelius
HSBC James Capel, LondonRoddy Bridge
JP Morgan, LondonNiall O’Connor
Lehman Brothers, LondonMichael Hagmann
Matteus Fondkommission, StockholmDavid Hallbäck
Merrill Lynch, FrankfurtOlaf Toelke
Morgan Stanley, LondonGideon Franklin
Nordbanken Aktier, StockholmMathias Wallerström
Orkla Securities, StockholmAnders Roslund
Paribas Capital Markets, LondonChristian Diebitsch
Société Générale, ParisFrancine Lenoir
Swedbank Markets, StockholmMats Larsson
Warburg Dillon Read, StockholmPer AfrellAnders FagerlundPatrick Sjöblom
Williams de Broë, LondonAlex Migliorini
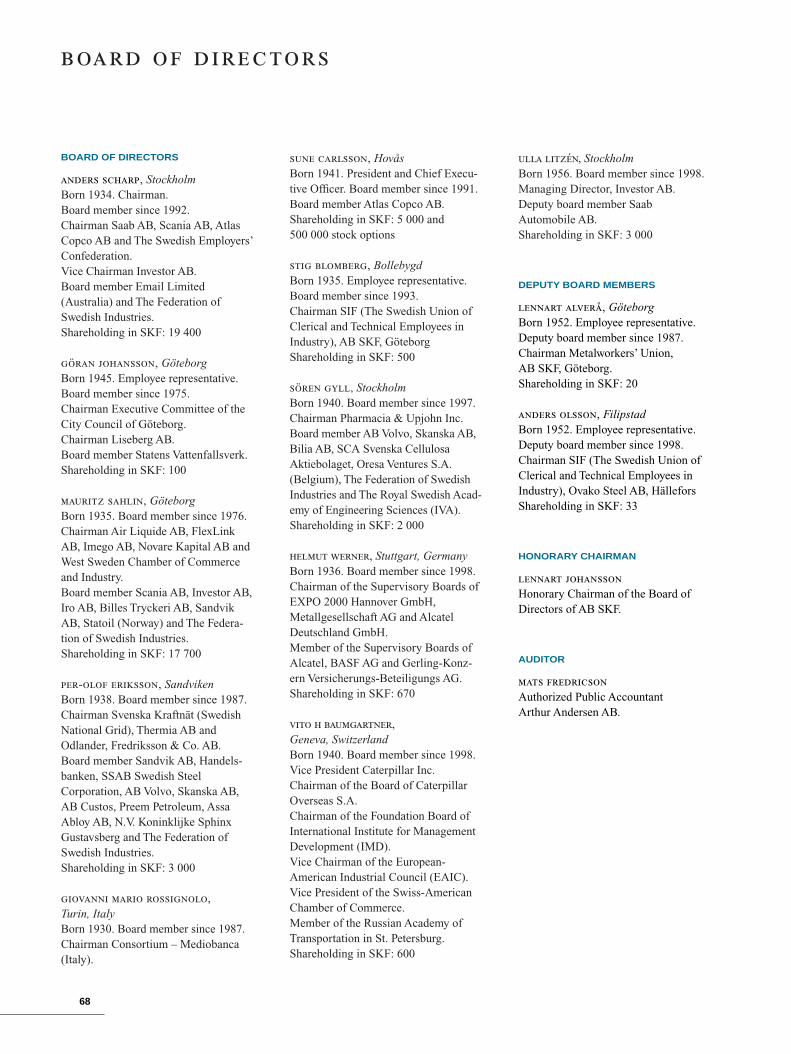
68
BOARD OF DIRECTORS
, StockholmBorn 1934. Chairman.Board member since 1992.Chairman Saab AB, Scania AB, AtlasCopco AB and The Swedish Employers’Confederation.Vice Chairman Investor AB.Board member Email Limited(Australia) and The Federation ofSwedish Industries.Shareholding in SKF: 19 400
, GöteborgBorn 1945. Employee representative.Board member since 1975.Chairman Executive Committee of theCity Council of Göteborg.Chairman Liseberg AB.Board member Statens Vattenfallsverk.Shareholding in SKF: 100
, GöteborgBorn 1935. Board member since 1976.Chairman Air Liquide AB, FlexLinkAB, Imego AB, Novare Kapital AB andWest Sweden Chamber of Commerceand Industry.Board member Scania AB, Investor AB,Iro AB, Billes Tryckeri AB, SandvikAB, Statoil (Norway) and The Federa-tion of Swedish Industries.Shareholding in SKF: 17 700
- , SandvikenBorn 1938. Board member since 1987.Chairman Svenska Kraftnät (SwedishNational Grid), Thermia AB and Odlander, Fredriksson & Co. AB.Board member Sandvik AB, Handels-banken, SSAB Swedish SteelCorporation, AB Volvo, Skanska AB,AB Custos, Preem Petroleum, AssaAbloy AB, N.V. Koninklijke SphinxGustavsberg and The Federation ofSwedish Industries.Shareholding in SKF: 3 000
,Turin, ItalyBorn 1930. Board member since 1987.Chairman Consortium – Mediobanca(Italy).
, HovåsBorn 1941. President and Chief Execu-tive Officer. Board member since 1991.Board member Atlas Copco AB.Shareholding in SKF: 5 000 and500 000 stock options
, BollebygdBorn 1935. Employee representative.Board member since 1993.Chairman SIF (The Swedish Union ofClerical and Technical Employees inIndustry), AB SKF, GöteborgShareholding in SKF: 500
, StockholmBorn 1940. Board member since 1997.Chairman Pharmacia & Upjohn Inc.Board member AB Volvo, Skanska AB,Bilia AB, SCA Svenska CellulosaAktiebolaget, Oresa Ventures S.A. (Belgium), The Federation of SwedishIndustries and The Royal Swedish Acad-emy of Engineering Sciences (IVA).Shareholding in SKF: 2 000
, Stuttgart, GermanyBorn 1936. Board member since 1998.Chairman of the Supervisory Boards ofEXPO 2000 Hannover GmbH, Metallgesellschaft AG and AlcatelDeutschland GmbH.Member of the Supervisory Boards ofAlcatel, BASF AG and Gerling-Konz-ern Versicherungs-Beteiligungs AG.Shareholding in SKF: 670
,
Geneva, SwitzerlandBorn 1940. Board member since 1998.Vice President Caterpillar Inc.Chairman of the Board of CaterpillarOverseas S.A.Chairman of the Foundation Board ofInternational Institute for ManagementDevelopment (IMD).Vice Chairman of the European-American Industrial Council (EAIC).Vice President of the Swiss-AmericanChamber of Commerce.Member of the Russian Academy ofTransportation in St. Petersburg.Shareholding in SKF: 600
, StockholmBorn 1956. Board member since 1998.Managing Director, Investor AB.Deputy board member Saab Automobile AB.Shareholding in SKF: 3 000
DEPUTY BOARD MEMBERS
, GöteborgBorn 1952. Employee representative.Deputy board member since 1987.Chairman Metalworkers’ Union,AB SKF, Göteborg.Shareholding in SKF: 20
, FilipstadBorn 1952. Employee representative.Deputy board member since 1998.Chairman SIF (The Swedish Union ofClerical and Technical Employees inIndustry), Ovako Steel AB, HälleforsShareholding in SKF: 33
HONORARY CHAIRMAN
Honorary Chairman of the Board ofDirectors of AB SKF.
AUDITOR
Authorized Public AccountantArthur Andersen AB.

69
Anders Olsson
Sune Carlsson Göran Johansson Anders Scharp
Per-Olof Eriksson Ulla Litzén Mauritz Sahlin
Sören Gyll
Lennart Alverå
Stig Blomberg
Mats Fredricson Lennart Johansson
Giovanni Mario Rossignolo Helmut Werner
Vito H Baumgartner

70
PRESIDENT AND CHIEF EXECUTIVE
OFFICER
*Hovås, born 1941Employed since 1998Shareholding in SKF: 5 000 and 500 000 stock optionsBoard member Atlas Copco AB
EXECUTIVE VICE PRESIDENT AB SKF
AND PRESIDENT SKF GMBH,
SCHWEINFURT, GERMANY
Schweinfurt, Germany, born 1945Employed since 1969Shareholding in SKF: 300 and 2 400 stock options
EXECUTIVE VICE PRESIDENT AB SKF
AND PRESIDENT SKF USA, INC.,
NORRISTOWN, PA, USA
Berwyn, PA, USA, born 1942Employed since 1970Shareholding in SKF: 1 679 and 1 600 stock options
GROUP FINANCE
*Göteborg, born 1951Employed since 1989Shareholding in SKF: 3 000 and 2 400 stock optionsBoard member Trygg Fonder AB andÅgrenska
INDUSTRIAL DIVISION
*Göteborg, born 1947Employed since 1972Shareholding in SKF: 500 and 2 270 stock options
AUTOMOTIVE DIVISION
*Göteborg, born 1955Employed since 1977Shareholding in SKF: 2 400 stockoptions
ELECTRICAL DIVISION
*Turin, Italy, born 1944Employed since 1979Shareholding in SKF: 2 270 stockoptions
SERVICE DIVISION
*Brussels, Belgium, born 1948Employed 1987-1993 and since 1996Shareholding in SKF: 800
SEALS DIVISION
Askim, born 1943Employed since 1973Shareholding in SKF: 1 000and 2 400 stock optionsChairman West Sweden China Forumand board member Gothenburg ResearchInstitute
STEEL DIVISION
Stockholm, born 1948Employed since 1974Shareholding in SKF: 150 and 2 400 stock options
GROUP QUALITY & HUMAN
RESOURCES
Pixbo, born 1947Employed since 1964
GROUP TECHNOLOGY DEVELOPMENT
Hilversum, the Netherlands, born 1942Employed since 1971Shareholding in SKF: 3 000 and 2 400 stock optionsBoard member Ytkemiska institutet
GROUP COMMUNICATION
Göteborg, born 1943Employed since 1974Shareholding in SKF: 1 200 and 2 400 stock optionsBoard member West Sweden Chamber ofCommerce and Industry, InternationalCouncil of Swedish Industries andChalmers Teknikpark
GROUP BUSINESS DEVELOPMENT
Göteborg, born 1944Employed since 1975Shareholding in SKF: 5 051 and 2 400 stock optionsBoard member FlexLink AB
GROUP LEGAL
Göteborg, born 1960Employed since 1990Shareholding in SKF: 1 335 stockoptionsBoard member Forskarpatent iVästsverige AB
GROUP SOURCING
- Lerum, born 1946Employed since 1996Shareholding in SKF: 1 870 stockoptions
* member of the Group Executive Committee
71
Gunnar GremlinKrister Peil
Kaj Thorén
Lars G Malmer
Carina Bergfelt
Tore Bertilsson
Phil Knights
Henning Wittmeyer Sten E Malmström
Tom Johnstone
Martin Ivert
Giuseppe Donato Christer Gyberg
Hans-Göran Persson
Sune Carlsson
Bengt Olof Hansson
M A N A G E M E N T

72
S E V E N - Y E A R R E V I E W O F T H E S K F G R O U P
Amounts in millions of Swedish kronor unless otherwise stated 1992 1993 1994 1995 1996 1997 1998Income statementsNet sales 26 649 29 200 33 273 36 700 33 589 36 922 37 688Sweden 1 463 1 415 1 837 2 202 1 869 1 967 1 983
Operating expenses - 27 759 - 28 922 - 30 833 - 32 775 - 31 122 - 34 717 - 37 648Other operating revenue/expense - net 213 427 151 75 407 799 - 928Loss in associated companies – – – – – - 55 - 111Operating loss/profit - 897 705 2 591 4 000 2 874 2 949 - 999Financial income and expense, net - 988 - 1 158 - 714 - 611 - 462 - 843 - 1 064Loss/profit after financial income and expense - 1 885 - 453 1 877 3 389 2 412 2 106 - 2 063Taxes 333 - 7 - 570 - 1 301 - 701 - 583 377Loss/profit after taxes - 1 552 - 460 1 307 2 088 1 711 1 523 - 1 686Extraordinary expense, net of taxes - 52 – – – – – –Minority interest 7 – - 28 - 30 - 19 35 44Net loss/profit for the year - 1 597 - 460 1 279 2 058 1 692 1 558 - 1 642
Balance sheetsIntangible assets 1 072 2 284 1 793 1 374 1 261 1 291 2 239Tangible assets 11 266 11 862 11 092 11 264 12 541 13 631 14 568Long-term financial assets 1 651 1 452 1 348 1 212 1 063 1 185 1 084Inventories 9 435 9 220 8 606 8 972 9 476 9 924 10 183Short-term assets 6 382 6 841 7 517 7 276 7 352 8 478 8 588Short-term financial assets 3 075 2 692 2 356 2 897 2 091 3 931 2 353Total assets 32 881 34 351 32 712 32 995 33 784 38 440 39 015
Shareholders’ equity 8 215 8 289 9 183 10 122 11 310 12 588 10 932Provisions for pensions and otherpostretirement benefits 4 781 6 326 6 260 6 089 6 030 6 171 7 139
Provisions for taxes 1 172 1 370 1 386 1 420 1 701 1 642 1 488Other provisions 3 415 3 258 2 159 2 377 2 130 2 981 4 095Long-term loans (including convertible loans) 6 517 7 044 4 954 4 584 4 846 6 538 4 842Other long-term liabilities, including minority interest 1 146 1 123 948 935 362 359 455Short-term loans 3 258 2 228 2 047 1 715 1 693 1 853 3 337Other short-term liabilities 4 377 4 713 5 775 5 753 5 712 6 308 6 727Total equity, provisions and liabilities 32 881 34 351 32 712 32 995 33 784 38 440 39 015
Key fi gures (in percentages unless otherwise stated)Return on total assets - 1.1 3.6 9.1 13.2 9.9 9.1 - 1.6Return on capital employed - 1.5 5.0 13.0 19.0 14.7 13.0 - 2.8Return on shareholders’ equity - 16.1 - 5.1 13.4 19.4 15.9 13.0 - 13.3Profit margin - 1.3 4.2 9.4 12.4 10.0 9.0 - 2.0Turnover of total assets, times 0.84 0.86 0.97 1.07 0.99 1.00 0.97Share of risk-bearing capital 28.6 23.9 28.1 31.9 35.8 37.8 32.8Solvency (equity/assets ratio) 25.3 24.5 28.5 31.2 34.3 33.5 29.0
Investments and employeesAdditions to tangible assets 1 121 933 1 356 2 296 2 710 2 664 2 148Sweden 140 238 293 427 655 918 434
Research and development expenses 473 552 542 598 751 757 702Patents - number of first filings 85 57 59 65 130 146 145Average number of employees 46 672 39 439 40 072 42 641 42 451 41 863 44 958Sweden 6 871 5 975 6 282 6 418 6 348 6 290 6 144
Number of employees registered at December 31 45 151 41 394 41 732 43 754 43 123 43 241 45 436Salaries, wages and social charges 11 845 12 277 12 869 13 744 13 066 13 681 14 497Sweden 2 377 1 979 2 117 2 361 2 464 2 480 2 697
Business areasNet salesBearings 22 690 24 767 28 168 31 003 29 204 31 991 32 453Seals – 2 752 3 099 3 456 3 125 3 779 4 129Tools 1 731 – – – – – –Steel 3 076 2 891 3 758 4 168 3 271 3 391 3 229Other and eliminations - 848 - 1 210 - 1 752 - 1 927 - 2 011 - 2 239 - 2 123
26 649 29 200 33 273 36 700 33 589 36 922 37 688
Operating loss/profitBearings - 668 690 1 904 3 198 2 482 2 294 - 1 177Seals – 189 261 307 242 377 65Tools 10 – – – – – –Steel - 345 - 166 289 439 153 242 1Other and eliminations 106 - 8 137 56 - 3 36 112
- 897 705 2 591 4 000 2 874 2 949 - 999
Invested capital*Bearings – 20 641 19 495 19 562 20 827 22 525 23 736Seals – 2 451 2 172 2 199 2 082 2 456 2 775Special Steels – 2 127 2 236 2 202 2 108 2 416 2 512Other and eliminations – 26 - 130 65 667 357 79
– 25 245 23 773 24 028 25 684 27 754 29 102
* Invested capital is defined as the sum of Goodwill, Inventories, Trade Accounts Receivable and Tangible Assets less Trade Accounts Payable and Customer Advances at the end of the period.