annual report 06-07 - delray beach, florida dbfr annual report.pdfannual report fiscal year 2006 -...
TRANSCRIPT

1
__________________________
City of Delray Beach Fire-Rescue Department
Annual Report Fiscal Year 2006 - 2007
Prepared by:
Delray Beach Fire-Rescue Department
November 2007

2
City of Delray Beach, Florida Fire - Rescue Annual Report
Fiscal Year 2006-2007
Table of Contents Page Fire Chief’s Message . . . . . . . . . 3 Introduction . . . . . . . . . . 4 Purpose . . . . . . . . . . 4 Scope . . . . . . . . . . . 4 Emergency Response . . . . . . . . . 4 Emergency Medical Service Transport . . . . . . 8 Regional Hazardous Materials Response . . . . . . 9 Disaster Response . . . . . . . . . 9 Performance Measures . . . . . . . . 10 Personnel . . . . . . . . . . 12 Recent Arrivals . . . . . . . . . 13 Training . . . . . . . . . . 15 Inspection, Plan Review, Public Education Services and Community Outreach Programs . . . . . . . . . . . . 17 Gulf Stream Annex . . . . . . . . . 18 Highland Beach Annex . . . . . . . . 23

3

4
Introduction The Delray Beach Fire-Rescue Department provides comprehensive fire, emergency medical and special operations response services to the City of Delray Beach and, through inter-local service agreements the Towns of Gulf Stream and Highland Beach. The Fire-Rescue Department also provides emergency medical transport service in Delray Beach, Gulf Stream and Highland Beach. Public education, inspection and plan review services are also provided to the three communities. Purpose The purpose of this report is to provide the commissioners, administrators, employees and residents of Delray Beach, Gulf Stream and Highland Beach a summary of the activities and projects that have been completed during the fiscal year. Scope This report contains information about the emergency responses, training, personnel and non-emergency activities that had an impact on the Delray Beach Fire-Rescue Department and the residents of our service area during the fiscal year beginning on October 1, 2006 and ending on September 30, 2007. The population of the City of Delray Beach during the fiscal year was 64,360 and the taxable value of property was $8,725,234,267. Emergency Response The Delray Beach Fire-Rescue Department responded to 11,747 calls for emergency service during the fiscal year, 11,064 of the calls were in Delray Beach, 588 in Highland Beach, and 95 in Gulf Stream. This represents a 2.2% decrease from the 12,005 calls in the previous fiscal year. Over the ten (10) year period from fiscal year 1997-98 to fiscal year 2006-07, the total emergency call volume increased an average 2.0% each year. FISCAL YEAR FIRE EMS TOTAL % +/- 1997-98 1,692 8,203 9,895 1998-99 1,717 8,336 10,053 + 1.6% 1999-00 1,963 8,472 10,435 + 3.8% 2000-01 1,984 8,687 10,671 + 2.3% 2001-02 1,975 8,918 10,893 + 2.1% 2002-03 1,894 8,649 10,543 - 3.3% 2003-04 2,228 9,620 11,848 +12.4% 2004-05 2,020 9,508 11,528 - 2.7% 2005-06 2,373 9,632 12,005 + 4.1% 2006-07 2,059 9,688 11,747 - 2.2% Average 1,991 8,971 10,875 + 2.0%
Table 1

5
Total Annual Responses Ten Year Comparison
0
2,000
4,000
6,000
8,000
10,000
12,000
14,000
1997-98
1998-99
1999-00
2000-01
2001-02
2002-03
2003-04
2004-05
2005-06
2006-07
FireEMSTotal
Chart 1
C-Shift units operate at a commercial structure fire at the former Paradise Club on West Atlantic Avenue February 3, 2007

6
Table 2, includes all the emergency calls for the fiscal year broken down by month and the type of emergency. It also shows the total of each type of call and the total number of emergency calls each month.
Month Minor
Medical Medical
Emergency Still
Alarm Brush Fire
Box Alarm
First Alarm
Special Operation
Mutual Aid Total
October 77 694 59 5 56 27 7 0 925 November 70 613 57 5 79 14 13 0 851 December 79 758 57 1 59 17 10 0 981 January 107 791 68 0 73 19 17 1 1,076 February 76 758 61 1 62 20 13 0 991 March 77 881 52 1 74 19 7 1 1,112 April 98 766 67 4 67 18 7 1 1,028 May 64 717 68 6 92 20 3 2 972 June 50 732 61 4 122 15 5 0 989 July 66 712 80 2 87 13 9 0 969 August 60 700 67 1 87 10 8 0 933 September 59 683 60 1 91 15 11 0 920 Total 883 8,805 757 31 949 207 110 5 11,747
Table 2
During the fiscal year, 9,688 (83%) of the responses were medical related, while the remainder were for a wide variety of situations ranging from fires to hazardous material incidents. Most of the medical responses, 75% of the total call volume, were classified as Medical Emergencies. This classification represents calls for cardiac related problems, respiratory difficulties, strokes, motor vehicle accidents and other emergencies where both the fire and rescue apparatus are needed to handle the incident. Minor Medical calls such as small cuts, short falls and other situations where the public needs assistance accounted for 8% of the call volume. Calls initiated by a fire alarm system are classified as a Box Alarm. Eight percent of the emergency calls (949) during the fiscal year were in response to the activation of these alarm systems. The Delray Beach Fire-Rescue Department sends two engines, one ladder truck and one rescue apparatus to these incidents. This classification represents the highest percentage of emergency calls that are not medically related. A significant number of these incidents turn out to be false alarms, many times due to alarm system malfunctions. Small fires outside of buildings, vehicle fires, elevator emergencies, small fuel spills and bomb threats are classified as Still Alarms. These accounted for 6% of the emergency incidents during the fiscal year. The actual number of fires reported inside any building or structure (First Alarms) were only 2% of the total workload of the department. Special Operations incidents such as hazardous material emergencies, confined space and water rescues made up 1%.

7
Chart 2, is a graphic representation showing the percentage of each type of call.
Box Alarm8%
First Alarm2%
Still Alarm6%
Brush Fire0%
Special Operation
1%Minor Medical
8%
Medical Emergency
75%
Chart 2
B-Shift units extinguish a vehicle fire and provide EMS to the driver on I-95 on March 22, 2007. This situation presents an extreme danger for personnel from both the fire itself as well as the high speed
traffic on an Interstate Highway.

8
During the fiscal year 2006-07, the monthly emergency call volume ranged from a high of 1,112 calls in March to a low of 851 calls in the month of November. There were three (3) months, January, March, and April where the number of emergency responses exceeded 1,000 calls per month. All of the remaining months had over 900 calls except November. Chart 3, represents the number of emergency calls per month.
0200400600800
10001200
Number of Calls
Oct
ober
Nov
embe
r
Dec
embe
r
Janu
ary
Febr
uary
Mar
ch
Apr
il
May
June
July
Aug
ust
Sep
tem
ber
Month
Emergency Response, FY 2006-07
Chart 3 Emergency Medical Service Transport On February 1, 1995 the Delray Beach Fire-Rescue Department assumed the responsibility for emergency medical service transport from Bethesda Ambulance Service for emergency incidents within the City of Delray Beach and the Town of Gulf Stream. On July 10, 2000 the department also assumed this responsibility in the Town of Highland Beach. During the fiscal year 06/07, 5,891 patients were transported to the hospital in Fire-Rescue vehicles. This number represents a 5.8% increase from the 5,568 patients that were transported in fiscal year 05/06.
FISCAL NUMBER OF REVENUE YEAR TRANSPORTS 1997-98 4,041 $986,051 1998-99 4,265 $998,148 1999-00 4,497 $1,037,121
2000-01 4,919 $1,156,776 2001-02 4,897 $1,194,622 2002-03 5,323 $1,170,764 2003-04 5,941 $1,423,303 2004-05 5,865 $1,496,177 2005-06 5,568 $1,470,339 2006-07 5,891 $1,273,023
Table 3

9
Regional Hazardous Materials Response During the fiscal year, the City of Delray Beach Fire-Rescue Department along with the Fire Departments from Boca Raton, West Palm Beach and Palm Beach County provided emergency response services to incidents involving hazardous materials throughout Palm Beach County through an agreement with the Board of County Commissioners and the Solid Waste Authority. The Cities of Delray Beach and Boca Raton joined forces to cover a primary response area that includes; Boca Raton, Boynton Beach, Briny Breezes, Delray Beach, Gulf Stream, Highland Beach, and the Village of Golf. This agreement provides revenue in the amount of $196,964 per year directly to the City in exchange for these services and other tangible benefits to the residents throughout Palm Beach County. The responders will also benefit from increased training opportunities and improvements in the co-ordination and support available when these incidents occur. Disaster Response The Delray Beach Fire-Rescue Department is responsible for the City’s Emergency Management program and serves as the coordinating agency for disaster preparation, response and recovery. City employees from various departments were provided career development, education and training to meet future challenges and issues that will impact the City. A tabletop disaster exercise simulating a potential pandemic avian flu event was conducted in July for all personnel assigned to work in the Emergency Operations Center during a disaster.
11
City of Delray Beach
Fire-Rescue Department
Tabletop Exercise for City Employees
July 2007
Pandemic Influenza

10
Performance Measures An important performance measurement factor for any emergency response service is the time it takes for trained emergency personnel to respond to an individual’s request for assistance. The Delray Beach Fire-Rescue Department is dispatched to emergencies by the Delray Beach Police Department, Communications Division. During fiscal year 06/07, the average time to process an emergency call by the Police Department Communications Division was one (1) minute and five (5) seconds. After receiving the emergency call, the average turnout and travel time for Fire-Rescue was four (4) minutes and twenty-five (25) seconds. The workload for the individual response units is another performance measure used to determine the level of service provided to the community. During the fiscal year, the busiest unit in the City was Quint 1 with 3,295 emergency responses. The busiest rescue unit was Rescue 1 with 3,111 responses. Table 4, shows the number of responses for each unit for the past ten (10) years. Table 5, indicates the total number of hospital transports this year for each rescue unit.
Unit FY 97-
98 FY 98-
99 FY 99-
00 FY 00-
01 FY 01-
02 FY 02-
03 FY 03-
04 FY 04-
05 FY 05-
06 FY 06-
07 Q1 3,039 3,058 3,204 3,220 3,212 3,119 3,370 3,248 3,349 3,295 R1 2,922 2,895 2,953 2,982 3,004 2,852 3,043 3,105 3,158 3,111 E2 1,388 1,384 1,574 1,494 1,560 1,487 1,654 1,630 1,637 1,522 R2 1,333 1,285 1,458 1,469 1,497 1,432 1,620 1,554 1,560 1,563 E3 2,412 2,431 2,632 2,734 2,852 2,808 3,069 3,071 2,976 3,018 R3 2,379 2,389 2,445 2,579 2,572 2,506 2,758 2,742 2,716 2,645 E4 1,781 1,807 1,910 1,979 2,085 2,108 2,276 2,178 2,266 2,051 R4 1,794 1,844 1,898 1,944 1,990 2,004 2,081 2,078 2,288 1,833 T5 1,771 2,001 2,126 2,331 2,317 2,195 2,471 2,518 2,629 2,474 R5 1,632 1,793 1,847 2,077 2,040 2,028 2,190 2,229 2,389 2,218 SO5 337 368 337 359 369 317 397 369 373 440 T6 970 988 1,066 1,084 1,134 1,112 1,118 1,087 1,157 1,067 R6 604 732 767 729 814 775 744 851 842 796 160 6,399 6,355 6,483 6,011 6,180 6,648 7,952 7,467 8,249 8,313 120 1,185 1,294 1,444 1,538 1,535 1,615 1,902 1,616 1,871 1,910
Table 4

11
Month/Unit Rescue
1 Rescue
2 Rescue
3 Rescue
4 Rescue
5 Rescue
6 Total October '06 106 48 103 85 94 13 449
November '06 92 28 80 82 73 18 373 December '06 118 51 108 87 126 25 515 January '07 131 59 100 97 103 32 522 February '07 123 58 105 80 109 28 503
March '07 150 70 131 90 113 35 589 April '07 142 46 107 103 102 28 528 May '07 135 59 104 84 107 20 509 June '07 111 49 118 69 100 25 472 July '07 115 40 102 89 94 21 461
August '07 122 52 119 86 101 23 503 September '07 98 44 106 103 88 28 467 Total FY 06-07 1,443 604 1,283 1,055 1,210 296 5,891
Transports per Day 3.9 1.6 3.5 3.0 3.3 0.8 16.1
Table 5
Crews from B-Shift operate at the Mano A Mano restaurant fire on East Atlantic Avenue November 14, 2006

12
Personnel
Retirements Two employees retired from the Delray Beach Fire-Rescue Department during the fiscal year.
Paramedic John Reeck 19 years Chief Kerry Koen 6 years Retirees with 20 or more years of service can remain with the department for an additional five (5) years by taking advantage of the Deferred Retirement Option Plan.
New Hires Paramedic Travis Franco Paramedic Dennis Simpson Paramedic Sean Close Paramedic Matthew Mahoney Paramedic William Roulette Paramedic John Kavanagh Paramedic Matthew Turnbach Paramedic James Bradford Paramedic John Woertz Paramedic Richard Tarantino Paramedic John Kavanagh Paramedic Joseph Cafone Paramedic Kenneth Hansley Paramedic Christopher Muller Paramedic Idania Miller Paramedic Gregory Tabeek Chief David James Paramedic James Bast Fire Protection Specialist Nicholas Scolaro
Promotions Danielle Connor, Promoted to Division Chief Christopher Zidar, Promoted to Lieutenant Joseph Mazzeo, Promoted to Driver Engineer
Service Awards
25 – Years 20 – Years 15 – Years Joseph Weitman William Briard Michael Twigger Paul Hensley David Brassard Jerome Weatherspoon Edward Meissner Craig Merrill David Wetzel John Tomaszewski Richard Murphy Timothy Garito Edward Crelin Howard Spain 10 – Years Michael Wise Mark Dorsett Cecelia Shade Dale Fagan Patricia Dunkelmann Odell Lewis 5 – Years Robert Baker Crista Mockenhaupt Harvey Greenburg Michael Camera Joseph Falcone Travis Klemann Gregory Giaccone Daniel Waldrep Omar Torres Steven Anderson Michael Boyd Michael Rodriguez Roxanne Tilghman

13
Recent Arrivals
Engine 3 arrived in December 2006 and is housed at Station 3 on Linton Boulevard
Rescue 3 arrived in September 2007 and is also housed at Station 3 on Linton Boulevard

14
Special Operations 5 arrived in February 2007 and is housed at Fire Station 5 on Germantown Road
Special Events Response Vehicle (SERV 3) arrived in July 2007 and is housed at Fire Headquarters on Atlantic Avenue, it was purchased with founding from a State EMS Grant

15
Training The Delray Beach Fire-Rescue Department has been providing Emergency Medical Service (EMS) at the Advanced Life Support (ALS) level since the early 1970’s. In order to provide this level of service, the continuous training, certification and re-certification of Paramedics and Emergency Medical Technicians (EMTs) must be a top priority of the department. There are currently 143 certified Fire Fighters in the department, 118 or 83% are Paramedics and the remainder are EMTs. All of the Paramedics and EMTs completed the requirements for re-certification this year as required by the State of Florida. Fire-Rescue personnel also participated in numerous hours of training in other topics including fire fighting operations, hazardous materials response and dive rescue. A rare opportunity, the ability to conduct live training scenarios, occurred as a result of donated buildings scheduled to be demolished. The department used two vacant structures on SW 10th Avenue to practice structural fire attack.
Recently hired Firefighter/Paramedics were also trained in structural firefighting techniques in this donated single-family residential structure. The concepts of fire behavior, attack line placement, fire control and extinguishment were covered in a realistic setting.
Recruit training on SW 10th Avenue
16
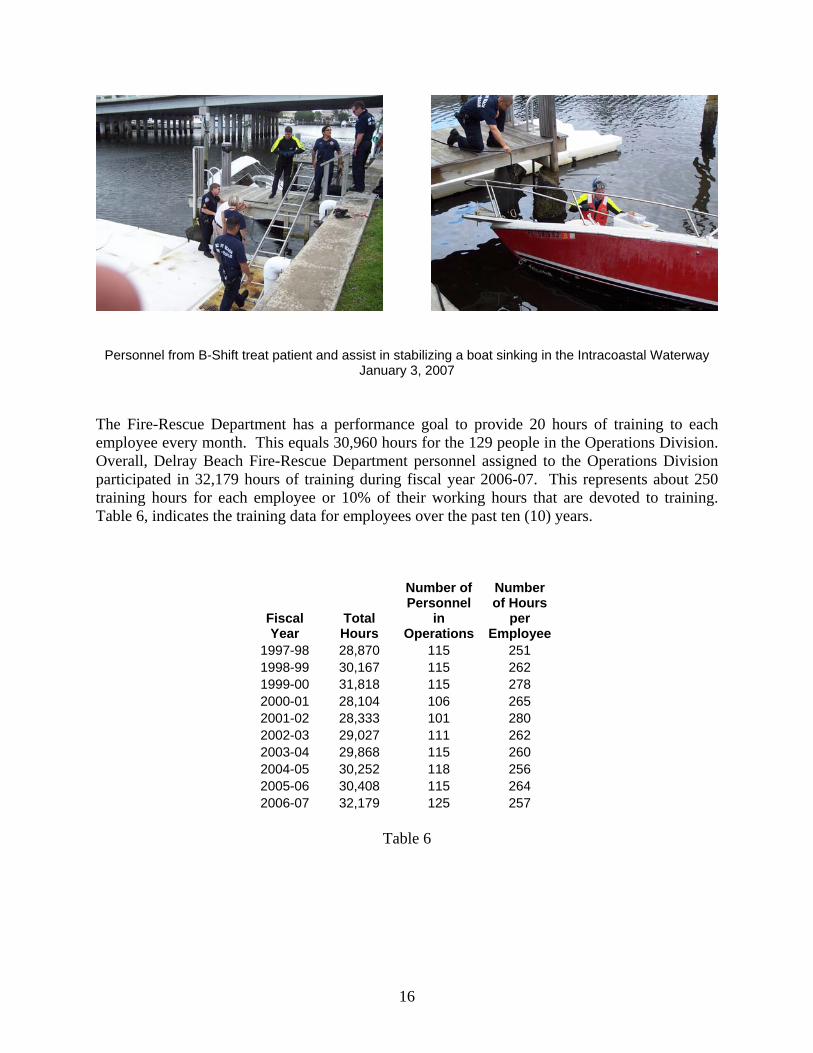
Personnel from B-Shift treat patient and assist in stabilizing a boat sinking in the Intracoastal Waterway January 3, 2007
The Fire-Rescue Department has a performance goal to provide 20 hours of training to each employee every month. This equals 30,960 hours for the 129 people in the Operations Division. Overall, Delray Beach Fire-Rescue Department personnel assigned to the Operations Division participated in 32,179 hours of training during fiscal year 2006-07. This represents about 250 training hours for each employee or 10% of their working hours that are devoted to training. Table 6, indicates the training data for employees over the past ten (10) years.
Fiscal Year
Total Hours
Number of Personnel
in Operations
Number of Hours
per Employee
1997-98 28,870 115 251 1998-99 30,167 115 262 1999-00 31,818 115 278 2000-01 28,104 106 265 2001-02 28,333 101 280 2002-03 29,027 111 262 2003-04 29,868 115 260 2004-05 30,252 118 256 2005-06 30,408 115 264 2006-07 32,179 125 257
Table 6

17
Inspection, Plan Review, Public Education Services and Community Outreach Programs During the fiscal year, the Delray Beach Fire-Rescue Department conducted a total of 4,668 fire and life safety inspections. There were 1,467 plans reviewed during the year. Members of Fire-Rescue participated in a number public education programs during the fiscal year. These programs brought the department into contact with 10,814 people. Fire Inspectors conducted 38 fire investigations. Table 7 represents the activities of the Fire Safety Division for the past ten (10) years. Our Community Emergency Response Team (CERT) completed three (2) new training courses this year bringing the total number of program participants since 1997 up to 663. This eight-week course is designed to provide trained volunteers to assist their community and the emergency responders in the event of a disaster such as a hurricane, flood or tornado. We currently have 202 people on our mailing list and 90 are active attending refresher training each year.
Fiscal Year
Fire Inspections
Plans Reviewed
Fire Investigations
Education Programs
Education Contacts
1997-98 2,125 1,166 30 178 9,009 1998-99 2,466 1,083 28 214 7,695 1999-00 2,248 1,162 43 209 8,725 2000-01 2,988 1,176 60 242 9,857 2001-02 3,345 1,389 53 252 8,777 2002-03 3,881 1,011 54 195 5,936 2003-04 4,035 1,172 52 200 5,146 2004-05 4,243 1,119 40 147 9,031 2005-06 3,474 968 60 182 9,363 2006-07 4,668 1,467 38 218 10,814 Average 3,347 1,171 46 204 8,435
Table 7

18
______________________________________________________________________________
Town of Gulf Stream
Annex ______________________________________________________________________________
Proudly Serving the Town of Gulf Stream since 1992

19
Introduction The City of Delray Beach has an inter-local agreement to provide comprehensive fire, emergency medical and special operations response services to the Town of Gulf Stream. This contractual service began on October 1, 1992, when the Delray Beach Fire-Rescue Department replaced the previous providers of emergency services. The department also provides public education, inspection and plan review services as a part of the agreement. Purpose The purpose of this annex is to provide the commissioners, administrators and residents of the Town of Gulf Stream a summary of the activities and projects that have been completed during the fiscal year. Scope This annex contains information about the emergency responses that had an impact on the Delray Beach Fire-Rescue Department and the residents of the Town of Gulf Stream during the fiscal year beginning on October 1, 2006 and ending on September 30, 2007. The population of the Town during the fiscal year was 693 and the taxable value of property was $730,416,229. Emergency Response The Delray Beach Fire-Rescue Department responded to 95 calls for emergency service during the fiscal year. This represents a 13% decrease from the 107 calls in the previous fiscal year. Table 1, includes all the emergency calls broken down by month and the type of emergency. It also shows the total of each type of call and the total number of emergency calls each month.
Month Minor
Medical Medical
Emergency Still
Alarm Brush Fire
Box Alarm
First Alarm
Special Operation Total
October 0 6 1 0 1 0 0 8 November 0 5 0 0 3 0 0 8 December 1 3 1 0 3 0 0 8 January 1 6 0 0 0 1 1 9 February 0 6 0 0 2 0 1 9 March 1 10 0 0 3 0 0 14 April 0 4 0 0 1 0 0 5 May 1 4 1 0 2 1 0 9 June 0 3 1 0 1 0 0 5 July 1 6 0 0 2 0 0 9 August 1 2 1 0 2 0 0 6 September 0 1 1 0 3 0 0 5 Total 6 56 6 0 23 2 2 95
Table 1

20
Most of the Fire-Rescue responses (56) in Gulf Stream during the fiscal year were for Medical Emergencies. This classification represents calls for cardiac related problems, respiratory difficulties, strokes, motor vehicle accidents and other emergencies where both the fire and rescue apparatus are needed to handle the incident. Box Alarms accounted for the second highest number of emergency calls with 23 incidents. A Box Alarm is an emergency call triggered by an automatic fire alarm system. The Delray Beach Fire-Rescue Department dispatches two engines, one ladder truck and one rescue apparatus to these incidents. A significant number of these incidents turn out to be false alarms, many times due to alarm system malfunctions. Chart 1, is a graphic representation of the emergency responses in Gulf Stream during the year.
020406080
100
Number of Calls
Min
orM
edic
al
Med
ical
Emer
genc
y
Still
Alar
m
Brus
h Fi
re
Box
Alar
m
Firs
t Ala
rm
Spec
ial
Ope
ratio
nType of Emergency
Emergency Response, FY 2006-07
Chart 1

21
Chart 2, shows the percentage of each type of emergency call.
First Alarm2%
Special Operation2%
Box Alarm23%
Still Alarm6%
Brush Fire0%
Minor Medical7%
Medical Emergency
60%
Chart 2 The busiest month in terms of the volume of emergency calls during the fiscal year was March with 14 calls. January, February, May and July were the second busiest months with 9 calls. There were only five calls during the months of April, June and September. Chart 3, represents the number of emergency calls per month.
02468
101214
Number of Calls
Oct
ober
Nov
embe
r
Dec
embe
r
Janu
ary
Febr
uary
Mar
ch
April
May
June July
Augu
st
Sept
embe
r
Month
Chart 3

22
Over the ten (10) year period from fiscal year 1997-98 to fiscal year 2006-07, the total emergency call volume ranged from a high of 128 to a low of 88. FISCAL YEAR FIRE EMS TOTAL % +/- 1997-98 75 53 128 1998-99 51 59 110 - 14.0% 1999-00 72 56 128 +16.4% 2000-01 55 54 109 - 17.4% 2001-02 56 56 112 + 2.8% 2002-03 44 44 88 - 27.3% 2003-04 65 60 125 +42.0% 2004-05 42 51 93 - 34.4% 2005-06 49 58 107 +15.0% 2006-07 33 62 95 - 12.6% Average 54 55 110
Table 2 Chart 4 is a graphic representation of the emergency call volume history in Gulf Stream over the past ten (10) years.
0
20
40
60
80
100
120
140
1997-98
1998-99
1999-00
2000-01
2001-02
2002-03
2003-04
2004-05
2005-06
2006-07
FireEMSTotal
Chart 4

23
_____________________________________
Town of Highland Beach
Annex _____________________________________
Proudly Serving the Town of Highland Beach since 1993

24
Introduction The City of Delray Beach has an inter-local service agreement to provide comprehensive fire, emergency medical and special operations response services to the Town of Highland Beach. This contractual service began on October 1, 1993, when the Delray Beach Fire-Rescue Department replaced Palm Beach County Fire Rescue as the agency providing emergency and non-emergency service. The department also provides public education, inspection and plan review services as a part of the agreement. Purpose The purpose of this annex is to provide the commissioners, administrators and residents of the Town of Highland Beach a summary of the activities and projects that have been completed during the fiscal year. Scope This annex contains information about the emergency responses that had an impact on the Delray Beach Fire-Rescue Department and the residents of the Town of Highland Beach during the fiscal year beginning on October 1, 2006 and ending on September 30, 2007. The population of the Town during the fiscal year was 4,155 and the taxable value of property was $2,244,564,938. Emergency Response The Delray Beach Fire-Rescue Department responded to 588 calls for emergency service during the fiscal year. This represents a 17.7% decrease from the 692 calls in the previous fiscal year. Table 1, includes all the emergency calls broken down by month and the type of emergency. It also shows the total of each type of call and the total number of emergency calls each month.
Month Minor
Medical Medical
Emergency Still
Alarm Brush Fire
Box Alarm
First Alarm
Special Operation Total
October 2 12 1 0 6 0 3 24 November 3 16 8 0 13 0 2 42 December 6 43 6 0 16 1 0 72 January 3 37 8 0 13 2 0 63 February 4 34 5 0 4 1 0 48 March 2 38 5 0 12 0 1 58 April 1 38 5 0 11 1 2 58 May 1 26 4 0 20 1 0 52 June 0 24 3 0 14 0 1 42 July 1 21 2 0 18 0 1 43 August 3 22 2 0 13 0 0 40 September 5 22 4 0 15 0 0 46 Total 31 333 53 0 155 6 10 588
Table 1

25
Most of the Fire-Rescue responses (333) in Highland Beach during the fiscal year were for Medical Emergencies. This classification represents calls for cardiac related problems, respiratory difficulties, strokes, motor vehicle accidents and other emergencies where both the fire and rescue apparatus are needed to handle the incident. Box Alarms accounted for the second highest number of emergency calls with 155 incidents. A Box Alarm is an emergency call triggered by an automatic fire alarm system. The Delray Beach Fire-Rescue Department dispatches two engines, one ladder truck and one rescue apparatus to these incidents. A significant number of these incidents turn out to be false alarms, many times due to alarm system malfunctions. Chart 1, is a graphic representation of the emergency responses in Highland Beach during the year.
0100200300400500600
Number of Calls
Min
orM
edic
al
Med
ical
Emer
genc
y
Still
Alar
m
Brus
h Fi
re
Box
Alar
m
Firs
t Ala
rm
Spec
ial
Ope
ratio
nType of Emergency
Emergency Response, FY 2006-07
Chart 1
Crews from Station 6 – Highland Beach conduct training exercise with Explorer from Post #320.

26
Chart 2, shows the percentage of each type of emergency call.
First Alarm1%
Special Operation1%
Box Alarm26%
Brush Fire0%
Still Alarm9%
Minor Medical5%
Medical Emergency
58%
Chart 2
During the fiscal year 2006-07, the monthly emergency call volume ranged from a high of 72 calls in December to a low of 24 calls in the month of October. Chart 3, represents the number of emergency calls per month.
01020304050607080
Number of Calls
Oct
ober
Nov
embe
r
Dec
embe
r
Janu
ary
Febr
uary
Mar
ch
April
May
June July
Augu
st
Sept
embe
r
Month
Chart 3

27
Over the ten (10) year period from fiscal year 1997-98 to fiscal year 2006-07, the total emergency call volume increased an average 1.1% each year. FISCAL YEAR FIRE EMS TOTAL % +/- 1997-98 208 330 538 1998-99 218 366 584 + 8.6% 1999-00 258 389 647 +10.8% 2000-01 213 367 580 - 11.5% 2001-02 234 389 623 + 7.4% 2002-03 255 425 680 + 9.1% 2003-04 255 347 602 - 11.5% 2004-05 256 369 625 + 3.8% 2005-06 271 421 692 +10.7% 2006-07 224 364 588 - 17.7% Average 239 377 619 + 1.1%
Table 2 Chart 4 is a graphic representation of the emergency call volume history in Highland Beach over the past ten (10) years.
0
100
200
300
400
500
600
700
1997-98
1998-99
1999-00
2000-01
2001-02
2002-03
2003-04
2004-05
2005-06
2006-07
FireEMSTotal
Chart 4