annual progress report 2018-2019
TRANSCRIPT
TANZANIA AGRICULTURAL RESEARCH INSTITUTE
KIBAHA SUB-CENTRE
ANNUAL PROGRESS REPORT 2018-2019

i
TIME TABLE FOR ANNUAL SUGARCANE RESEARCH TECHNICAL MEETING
DATES: 30th May 2019
TARI Kibaha
TIME EVENT RESPONSIBLE
S. I: Rapporteur (Baraka, Beatrice)
08.00-08.30 Registration Julieth
08.30-08.45 Welcome Note and Introduction Sub Centre Manager
08.45-09.00 Opening remarks Chairperson
09.00-09.15 TARI overview Director TARI HQ
09.15-09.30 Research highlights Coordinator
09.30-09.40 Discussion All
09.40-09.55 Breeding Andrew
09.55-10.00 Group Photo All
10.00-10.30 TEA BREAK All
S II: Rapporteur (January, Kinyau)
10.30-10.45 Breeding Nsajigwa
10.45-10.55 Discussion All
10.55-11.15 Agronomy Leyla
11.15-11.25 Discussion All
11.25-11.45 Entomology Amri
11.45-11.55 Discussion All
11.55-12.20 Pathology Minza/Margareth/Beatrice
12.20-12.30 Discussion All
12.30-12.50 Technology Transfer John
12.50-13.00 Discussion All
13.00-14.00 LUNCH All
S. III: Rapporteur: (Mziray, Amri)
14.00-14.10 Kilombero Estate Agronomist
14.10-14.20 Mtibwa Estate Agronomist
14.20-14.30 Kagera Estate Agronomist
14.30-14.40 TPC Estate Agronomist
14.40-14-50 Discussion All
14.50-15.10 Other stakeholders
15.10-16.00 Lab, screenhouse, field visits All
16.00-16.30 Refreshments All
S. IV: Rapporteur: (Minza, Nsajigwa,
Andrew)
16.30-17.30 Recommendations 2019/20 projects All
17.30-17.45 Closing Remarks Director TARI HQ
17.45…………… Departure All
ii
TABLE OF CONTENTS LIST OF TABLES ........................................................................................................... ix
LIST OF FIGURES ........................................................................................................ xii
LIST OF APPENDECIES ................................................................................................ xiv
ACRONYMS AND ABBREVIATIONS ................................................................................. xv
1.0 SUGARCANE RESEARCH HIGHLIGHTS 2018/19 ...................................................... 1
1.1 Introduction ............................................................................................... 1
1.1.1 Weather .................................................................................................. 2
1.1.2 Staffs .......................................................................................................... 2
1.2 Research Activities ......................................................................................... 1
1.2.1 Sugarcane Breeding .............................................................................. 2
1.2.2 Sugarcane Agronomy ......................................................................... 4
1.2.3 Sugarcane Entomology ...................................................................... 5
1.2.4. Sugarcane Pathology and Nematology .................................................. 7
1.2.5 Technology Transfer .......................................................................... 9
1.3 General Achievements .................................................................................. 10
Proposal development and submission ................................................................ 11
1.5 Challenges ................................................................................................... 11
2.0 SUGARCANE BREEDING SECTION ............................................................................ 12
2.1 Importation of New Varieties (Quarantine and Distribution of Newly Imported
Sugarcane Varieties) .......................................................................................... 12
2.1.1 Introduction ....................................................................................... 12
2.1.2 Materials and methods ........................................................................ 13
2.1.3 Results ............................................................................................... 13
2.1.4 Discussion .......................................................................................... 14
EVALUATION OF NEW VARIETIES ................................................................................. 14
2.2 Smut Screening Trials (Selection of Smut Resistant Sugarcane Varieties) ......... 14
2.2.1 Introduction ....................................................................................... 14

iii
2.2.2 Materials and methods ........................................................................ 15
2.2.3 Results ............................................................................................... 15
2.2.4 Discussion .......................................................................................... 20
2.3 Preliminary Yield Trials (Preliminary Evaluation of New Varieties/Clones in
Different Sugarcane Estates) .............................................................................. 21
2.3.1 Introduction ....................................................................................... 22
2.3.2 Materials and Methods ........................................................................ 22
2.3.3 Results ............................................................................................... 22
2.3.4 Discussion .......................................................................................... 43
2.4 National Performance Trials .......................................................................... 44
2.4.1 Introduction ....................................................................................... 44
2.4.2 Materials and Methods ........................................................................ 45
2.5 Advanced Sugarcane Fuzz Evaluation and Selection ........................................ 45
2.5.1 Introduction ....................................................................................... 46
2.5.2 Materials and Methods ........................................................................ 46
2.5.3 Results ............................................................................................... 47
2.6 Rapid Seedcane Multiplication (Evaluation of Sugarcane Seed Cane Production
Methods) ........................................................................................................... 47
2.6.1 Introduction ....................................................................................... 48
2.6.2 Materials and Methods ........................................................................ 48
2.6.3 Results ............................................................................................... 49
2.6.4 Discussion .......................................................................................... 49
2.7 Germplasm Conservation and Maintenance (Sugarcane Germplasm Conservation
for Sustainable Sugarcane Sector Development) .................................................. 50
2.7.1 Introduction ....................................................................................... 50
2.7.2 Materials and methods ........................................................................ 51
2.8 References ................................................................................................... 51
3.0 AGRONOMY AND PHYSIOLOGY ............................................................................... 53

iv
3.1 Evaluation of Existing Agronomic Package to Selected Sugarcane Varieties in
Outgrowers Fields of Kilombero Sugar Mill Area (Variety trial in OG fields) ............. 53
3.1.1 Introduction .................................................................................... 53
3.1.2 Materials and Methods ..................................................................... 54
3.1.3 Results ............................................................................................ 55
3.1.4 Discussion ....................................................................................... 61
3.2 Evaluation of Different Levels of Fertilizers for Improved Sugarcane
Productivity at Kagera Mill Area (Fertilizer trial) .................................................... 64
3.2.1 Introduction .................................................................................... 64
3.2.2 Materials and Methods ..................................................................... 65
3.2.3 Results ............................................................................................ 66
3.2.4 Discussion ....................................................................................... 70
3.3 Baseline Survey on the Status of Striga spp in Sugarcane Fields in Tanzania 71
3.3.1 Introduction .................................................................................... 71
3.3.2 Material and methods ............................................................................ 72
3.3.3 Results ............................................................................................ 72
3.3.4 Discussion ....................................................................................... 73
3.4 Evaluation of Different Herbicide for Use in Sugarcane Fields at Kagera ....... 73
3.4.1 Introduction .................................................................................... 74
3.4.2 Materials and methods ..................................................................... 75
3.4.3 Results ............................................................................................ 75
3.4.4 Discussion ....................................................................................... 77
3.5 References ............................................................................................... 78
4.0 SUGARCANE ENTOMOLOGY ................................................................................ 80
4.1 Project Tittle: Study of seasonal insect population fluctuations influenced by
weather changes and crop management practices in all estates and out growers
fields. 80
4.1.1 Introduction .................................................................................... 80

v
4.1.2 Materials and Methods ........................................................................ 81
4.1.3.1 Results and Discussion ........................................................................ 81
4.2 Project Title: Evaluation of white scale damage and sugar loss in selected
varieties ............................................................................................................ 86
4.2.1 Introduction .................................................................................... 86
4.2.3 Materials and Methods ..................................................................... 87
4.2.4 Results and Discussion ..................................................................... 87
4.3 Project Title: Production of White scale predator, R. lophanthae, in screen
house for field releases ...................................................................................... 88
4.3.1 Introduction .................................................................................... 88
4.3.2 Materials and Methods ..................................................................... 89
4.4 Project title: The Effectiveness of Prophylactic Soil Treatment and Foliar
Applications of locally available insecticides for Yellow Sugarcane Aphids control at
Kilombero Estate ................................................................................................ 90
4.4.1 Introduction .................................................................................... 90
4.4.2 Materials and Methods ..................................................................... 91
4.4.3 Results and Discussion .......................................................................... 92
4.5 Project Tittle: Impacts of predators on Population dynamics of Yellow
Sugarcane Aphid in Kilombero and Kagera Estates ............................................. 105
4.5.1 Introduction .................................................................................. 106
4.5.2 Materials and Methods ................................................................... 107
4.5.3 Results and Discussion ................................................................... 108
4.6 Project Tittle: Evaluation of resistance of sugarcane varieties to Yellow
Sugarcane Aphid infestation in cages ................................................................ 118
4.6.1 Introduction .................................................................................. 118
4.6.2 Materials and Methods ................................................................... 118
4.7 References ................................................................................................. 119
5.0 SUGARCANE PATHOLOGY ................................................................................. 120

vi
5.1 Project Title: Status of Ratoon Stunting Disease at Kilombero Sugar Company,
Tanzania ......................................................................................................... 120
5.1.1 Introduction .................................................................................. 120
5.1.2 Materials and Methods ................................................................... 121
Results ..................................................................................................... 123
Discussion ................................................................................................. 125
5.2 Project Title: Assessment on the incidence of sugarcane smut on estates and
Outgrowers fields in Tanzania ........................................................................... 126
5.2.1 Introduction .................................................................................. 127
5.2.3 Materials and methods ................................................................... 127
Results ..................................................................................................... 128
Percentage of smut infestation on both sugarcane estates and outgrowers ... 132
5.3 Project Title: Factors Influencing Disease Spread on Sugarcane Outgrowers
fields in Tanzania ............................................................................................. 134
5.3.1 Introduction .................................................................................. 135
5.3.2 Methodology ................................................................................. 135
5.3.4 Results .......................................................................................... 136
5.3.5 Discussion. .................................................................................... 141
5.4 Project Title: Monitoring of Plant Parasitic Nematode in sugarcane growing
area of Tanzania .............................................................................................. 143
5.4.1 Introduction ................................................................................. 144
5.4.2 Materials and Methods ................................................................... 144
Results ..................................................................................................... 145
Discussion ................................................................................................. 149
5.5 Project title: Screening for the best control of nematodes in sugarcane
production using integrated pest management .................................................. 150
5.5.1 Introduction .................................................................................. 150
5.5.2 Material and methods .................................................................... 151
5.5.3 Results .......................................................................................... 153

vii
5.6 Project title: Study on yield losses associated with key plant parasitic
nematodes affecting sugarcane in Tanzania ....................................................... 154
5.6.1 Introduction .................................................................................. 154
5.6.2 Materials and Methods ................................................................... 155
5.7 References ................................................................................................. 155
6.0 TECHNOLOGY TRANSFER ................................................................................. 163
6.1 Project Title: Strategies to Improve Extension Services to Sugarcane Growers
through Farmers Field School (FFS) in Kilombero and Mtibwa ............................. 163
6.1.1 Introduction .................................................................................. 163
6.1.2 Methodology ................................................................................. 164
6.1.3 Results and Discussion ................................................................... 165
6.2 Project title: Establishment of Demonstration plot in Mvomero, Kilosa and Kilombero
Districts ..................................................................................................................... 167
6.2.1 Introduction ........................................................................................ 167
6.2.3 Methodology ....................................................................................... 168
6.2.4 Results and Discussion ................................................................... 168
6.3 Project Title: The multiplication of clean seedcane at Kilombero, Kagera and
Mtibwa Mill Area .............................................................................................. 169
6.3.1 Introduction .................................................................................. 170
6.3.2 Methodology ................................................................................. 170
6.3.4 Results and Discussion ................................................................... 171
6.4 PROJECT TITLE: Scaling up sugarcane production technologies through
training and development of extension materials ............................................... 171
6.4.1 Introduction .................................................................................. 172
6.4.2 Methodology ................................................................................. 173
6.4.3 Results and discussion ................................................................... 173
6.5 Project Title: Promotion of Sugarcane Production Technologies to Sugarcane Growers
by Mass Media ........................................................................................................... 175
6.5.1. Introduction .................................................................................... 175

viii
6.5.2 Methodology .................................................................................... 176
6.5.3 Results and Discussion ...................................................................... 178
6.6 References ............................................................................................. 180

ix
LIST OF TABLES
Table 1. 1 Research staffs responsible for sugarcane researches at TARI Kibaha ................ 1 Table 2. 1 Varieties planted in closed quarantine at TARI – Kibaha ................................... 13 Table 2. 2 SCB Smut infection rate ................................................................................ 16 Table 2. 3 SCB Smut infection rate ................................................................................ 17 Table 2. 4 SCB: Smut infection rate ............................................................................... 18 Table 2. 5 SCB: Smut infection rate ............................................................................... 19 Table 2. 6 SCB: Smut infection rate ............................................................................... 20 Table 2. 7: Preliminary sugarcane variety trial (Field 410) ................................................ 23 Table 2. 8: Preliminary sugarcane variety trial (Field 411) ................................................ 24 Table 2. 9: Preliminary sugarcane variety trial (Field 417) ................................................ 25 Table 2. 10: Preliminary sugarcane variety trial (Field 511) .............................................. 26 Table 2. 11: Preliminary sugarcane variety trial (Field 219) .............................................. 27 Table 2. 12: Preliminary sugarcane variety trial (Field 332) .............................................. 28 Table 2. 13: Preliminary sugarcane variety trial (Field 257) .............................................. 29 Table 2. 14: Preliminary sugarcane variety trial (Field 103) .............................................. 30 Table 2. 15: Preliminary sugarcane variety trial (Field 124) .............................................. 30 Table 2. 16: Preliminary sugarcane variety trial (Field 622) .............................................. 31 Table 2. 17: Preliminary sugarcane variety trial (Field 670) .............................................. 32 Table 2. 18: Preliminary sugarcane variety trial (Field 692) .............................................. 33 Table 2. 19: Preliminary sugarcane variety trial (Field 664) .............................................. 34 Table 2. 20: Results for Variety Trial 31 (VT31R2) .......................................................... 35 Table 2. 21: Results for Plant Cane Variety Trial 35 (VT35PC) .......................................... 36 Table 2.22: Results for Plant Cane Variety Trial 37 (VT37PC) ........................................... 37 Table 2. 23: Preliminary sugarcane variety trial (Field GP6D) ........................................... 38 Table 2. 24: Preliminary sugarcane variety trial (Field TP8a) ............................................ 38 Table 2. 25: Preliminary sugarcane variety trial (Field AP12A) .......................................... 39 Table 2. 26: Preliminary sugarcane variety trial (Field TP13a) .......................................... 40 Table 2. 27: Preliminary sugarcane variety trial (IR4E) .................................................... 40 Table 2. 28: Preliminary sugarcane variety trial (LR6a) .................................................... 41 Table 2. 29: Preliminary sugarcane variety trial (3Ba)...................................................... 42 Table 2. 30: Preliminary sugarcane variety trial (D8) ....................................................... 42 Table 2. 31: Sugarcane clones distribution data 2019 ...................................................... 47 Table 2. 32: Seedcane establishment from single bud multiplication method at TARI Kibaha
................................................................................................................. 49 Table 3. 1 Results of TCH from different varieties grown under two management practices
in OG fields at Kilombero ............................................................................. 55 Table 3. 2 Results of TSH from different varieties grown under two management practices
in OG fields at Kilombero ............................................................................. 55 Table 3. 3 Results of TCH from different varieties grown under two management practices
in OG fields at Kilombero ............................................................................. 56 Table 3. 4 Results of TSH from different varieties grown under two management practices
in OG fields, Kilombero. ............................................................................... 56 Table 3. 5 Results of TCH from different varieties grown under two management practices
in OG fields, Kilombero. ............................................................................... 57 Table 3. 6 Results of TSH from different varieties grown under two management practices
in OG fields, Kilombero. ............................................................................... 57 Table 3. 7 Results of TCH from different varieties grown under two management practices
in OG fields, Kilombero. ............................................................................... 58

x
Table 3. 8 Results of TSH from different varieties grown under two management practices in OG fields, Kilombero ................................................................................ 58
Table 3. 9 Results of TCH from different varieties grown under two management practices in OG fields, Kilombero. ............................................................................... 59
Table 3. 10 Results of TSH from different varieties grown under two management practices in OG fields, Kilombero. ............................................................................... 59
Table 3. 11 Tillers count in large blocks in four sites at Kilombero ..................................... 62 Table 3. 12 Tillers count in large blocks in four sites at Mtibwa ......................................... 62 Table 3. 13 Results of TCH from selected varieties grown in large block fields at Kilombero.
................................................................................................................. 62 Table 3. 14 Results of TSH from selected varieties grown in large block fields at Kilombero 62 Table 3. 15 Treatments details ...................................................................................... 66 Table 3. 16 Results of TCH to applied fertilizer in OG fields at Kagera ............................... 67 Table 3. 17 Percent brix with reference to the applied fertilizers ....................................... 68 Table 3. 18 Results of stalks to applied fertilizers in OG fields at Kagera ............................ 69 Table 3. 19 Results of tillers to applied fertilizer in OG fields at Kagera .............................. 70 Table 3. 20 Status of Striga infestation at Kagera ........................................................... 73 Table 3. 21 Treatments details ...................................................................................... 75 Table 3. 22 Results of tested herbicide on grasses at Kagera mill area .............................. 76 Table 3. 23 Results of tested herbicide on Broadleaves at Kagera mill area ........................ 76 Table 3. 24 Results of tested herbicide on sedges at Kagera mill area ............................... 77 Table 3. 25 Weed classification scale .............................................................................. 78 Table 4. 1: Number of Fields Surveyed for Eldana Infestation in Miller Cum Planter (MCP)
and Outgrowers Sugarcane .......................................................................... 82 Table 4. 2: Number of Fields in Different Categories of Whitescale Infestation in Miller Cum
Planter (MCP) and out growers’ Sugarcane .................................................... 83 Table 4. 3: Number of Surveyed Fields for YSA Infestation in MCP and out growers’
Sugarcane .................................................................................................. 85 Table 4. 4: Infestation levels of YSA on selected varieties in Surveyed MCP fields at Kagera
................................................................................................................. 85 Table 4. 5: Percentage of inoculated stalks of test varieties in different categories of white
scale cover ................................................................................................. 88 Table 4. 6: Descriptions of the insecticides tested against the YSA ................................... 92 Table 4. 7: Mean number of YSA colonies per stalk in different treatments and sampling
periods (Log 10 (x + 1) Transf.)) .................................................................. 93 Table 4. 8: Mean percent infested leaves per stalk in different treatments and sampling
periods ....................................................................................................... 94 Table 4. 9: Mean percent damage leaves per stalk in different treatments and sampling
periods on leaves per stalk ........................................................................... 95 Table 4. 10: Effects of Treatments on mean stalk population, Cane yield and Brix% .......... 96 Table 4. 11: Ranking of seasonal performances of the insecticides treatments on YSA
populations and damage parameters ............................................................ 96 Table 4. 12: Mean number of predators per stool in different treatments and sampling dates
................................................................................................................. 99 Table 4. 13: Mean number of YSA colonies per stalk in different treatments and sampling
dates ....................................................................................................... 100 Table 4. 14: Mean percent infested leaves per stalk in different treatments and sampling
dates ....................................................................................................... 101 Table 4. 15: Mean percent damage on leaves per stalk in different treatments and sampling
dates ....................................................................................................... 102 Table 4. 16: Seasonal Mean numbers of YSA colonies per stalk in cage and open plots .... 111

xi
Table 4. 17: Predator population per five stools in open plots at Kilombero and Kagera on different sampling dates ............................................................................ 113
Table 4. 18: Monthly weather factors at Kagera in June 2018 to January, 2019 ............... 113 Table 4. 19: Monthly weather factors at Kilombero in June 2018 to January, 2019 .......... 113 Table 4. 20: Hydrogen dry bulb Temperature (oC) reading at Kagera .............................. 114 Table 4. 21: Hydrometer Relative .Humidity % Readings at Kagera ................................ 114 Table 5. 1: RSD diagnosis for KSC estate ..................................................................... 125 Table 5. 2: Status of smut infestation on sugarcane fields both estates and outgrowers ... 128 Table 5. 3. Number of respondent ............................................................................... 136 Table 5. 4: Mean population of plant parasitic nematodes isolated in the soil prior to
application of different integrated pest managements. ................................. 153 Table 6. 1 The area of seedcane planted 2018/19 ......................................................... 171 Table 6. 2 The number of participants attended at Sugarcane pavilion Morogoro ............. 174 Table 6. 3 Pairwise and ranking of radio preferred by farmers in Mtibwa mill area ........... 177 Table 6. 4 Pairwise ranking and scoring of radio at Kilombero mill area .......................... 177

xii
LIST OF FIGURES
Figure 1. 1 Sugarcane ................................................................................................... 1 Figure 1. 2 Percentage of project distribution funded in 2018/19 ....................................... 2 Figure 1. 3 Multiplication of clean sugarcane planting materials ......................................... 3 Figure 1. 4 Selection of planting materials ....................................................................... 4 Figure 1. 5 Sugarcane stokes infested by white scale ....................................................... 5 Figure 1. 6 Plant parasitic nematode which affect sugarcane plants ................................... 8 Figure 1. 7 Leaflets produced for sugarcane awareness on recommended practices 9 Figure 3. 1 Yield (TCH) of tested varieties vs crop cycles in two management levels .......... 60 Figure 3. 2 Yield (TSH) of tested varieties vs crop cycles in two management levels .......... 61 Figure 3. 3 Smut infestation levels for selected varieties in two management levels at
Kilombero and Mtibwa ................................................................................. 63 Figure 3. 4 Striga hermonthica at Kagera mill area.......................................................... 73 Figure 4. 1: Relationship between Varieties and Eldana Infestation 84 Figure 4. 2: Influence of Irrigation Regimes on Eldana Infestation on Sugarcane ............... 84 Figure 4. 3: The Mean Effects of Different Insecticides Treatments on YSA Population ....... 97 Figure 4. 4: Seasonal Mean Percent Infested Leaves in Different Insecticides Treatments .. 97 Figure 4. 5: Seasonal Mean Percent Damage on Leaves in Different Insecticides Treatments
................................................................................................................. 98 Figure 4. 6: The Effects of Different Insecticides Treatments on Predator Population ....... 103 Figure 4. 7: The Seasonal Effects of Different Insecticides Treatments on YSA Population 103 Figure 4. 8: The Mean Seasonal Effects of Insecticides Treatments on Percent Infested
Stalks ....................................................................................................... 104 Figure 4. 9: The Seasonal Mean % Damage on Leaves in Different Treatments ............... 104 Figure 4. 10: Seasonal mean number of predators per stool in different treatments ......... 105 Figure 4. 11: Seasonal Changes in YSA and Predator Populations in Untreated Plots at
Kagera - October, 2016 ............................................................................. 108 Figure 4. 12: Seasonal Changes in YSA and Predator Populations in Untreated Plots in
Kagera (D23B) - October, 2017 .................................................................. 109 Figure 4. 13: Mean Seasonal Changes in Populations of YSA and Predators in Untreated Plots
at Kilombero (Field 682) - August, 2018 ...................................................... 109 Figure 4.14: YSA Population Development inside Cages and Open Plots at Kilombero ...... 110 Figure 4. 15: YSA Population Development in Cage and Open Plots at Kagera ................. 110 Figure 4. 16: Percent Infested Leaves per Stalk in Cage and Open Plots at Kilombero ...... 111 Figure 4. 17: Percent Damage on Leaves in Cage and Open Plots at Kilombero ............... 111 Figure 4. 18: Percent Infested Leaves per Stalk in Cage and Open Plots at Kagera .......... 112 Figure 4. 19: Percent Damage on Leaves per Stalk in Cage and Open Plots at Kagera ...... 112 Figure 4. 20: YSA colonies in response to insecticides application in different sampling dates
at Kilombero ............................................................................................. 115 Figure 4. 21: Number of Predators in response to insecticides application in different
sampling dates Kilombero .......................................................................... 116 Figure 4. 22: YSA colonies in response to insecticides application in different sampling dates
at Kagera ................................................................................................. 116 Figure 4. 23: Predator in response to insecticides application in different sampling dates at
Kagera ..................................................................................................... 117 Figure 5. 1: Training on identification of ratoon stunting disease on sugarcane samples held
at TARI-Kibaha on 22nd to 25th January 2019 ............................................. 122 Figure 5. 2: Participants for RSD training conducted at TARI-Kibaha, January 2019 ......... 124 Figure 5. 3: Smut incidence on sugarcane varieties at TPC ............................................ 129 Figure 5. 4: Smut incidence on sugarcane varieties at KSL ............................................. 129 Figure 5. 5: Smut incidence on sugarcane varieties at MSE ............................................ 130

xiii
Figure 5. 6: Mean percentage smut incidence on sugarcane crop cycles at Kagera mill area ............................................................................................................... 131
Figure 5. 7: Mean smut incidence on sugarcane varieties at Kilombero in outgrower fields132 Figure 5. 8: Percentage of smut infestation on outgrower Vs esta .................................. 132 Figure 5. 9: Gender of respondents ............................................................................. 137 Figure 5. 11. Ages of the respondents ......................................................................... 137 Figure 5. 10: Education level of the respondents from the surveyed areas ...................... 138 Figure 5. 12: Farmers knowledge on different sugarcane diseases.................................. 138 Figure 5. 13: Different symptoms different sugarcane diseases ...................................... 139 Figure 5. 14. Methods used to control smut .................................................................. 139 Figure 5. 15: Sources of planting materials for OGs at KSL, KSC and MSE ....................... 140 Figure 5. 16: Factors influencing the spread of sugarcane diseases from OGs fields in the
surveyed areas ......................................................................................... 141 Figure 5. 17: Symptoms of root knot (Meloidogyne spp) Figure 2: Symptoms of root lesion
(Pratylenchus spp) .................................................................................... 145 Figure 5. 18: Nematodes population isolated in the root and soil samples in the Southern
part of TPC. .............................................................................................. 146 Figure 5. 19: Pratylenchus population in the roots and soil in sugarcane fields in the East of
TPC .......................................................................................................... 147 Figure 5. 20: Pratylenchus population in the roots and soil in fields sampled in the northern
part of TPC ............................................................................................... 147 Figure 5. 21: Population of plant parasitic nematodes found in the in sugarcane roots and
soil sample collected from Kilombero sugar. ................................................ 148 Figure 5. 22: Population of plant parasitic nematodes in the roots and soil found in the
sugarcane fields sample collected from Mtibwa sugar ................................... 148 Figure 5. 23: population of plant parasitic nematodes in roots and soil found in the sample
collected from Kagera sugar ....................................................................... 149 Figure 6. 1 FFS at Mzambarauni village Mvomero and Lumango village Mvomero ............ 165 Figure 6. 2 Figure Yield of FFS 2017/18 at Mtibwa mill area ........................................... 166 Figure 6. 3 Demonstration plot at Kungurumwoga village .............................................. 168 Figure 6. 4 The yield of the demonstration plot............................................................. 169 Figure 6. 5 SBT staff during training – practical session and graduation. ......................... 173 Figure 6. 6 Former president Dr. J, M. Kikwete was one of participants of nanenane
exhibition ................................................................................................. 174 Figure 6. 7 Distribution of questions asked by listeners on radio programs aired .............. 178 Figure 6. 8.Radio coverage area in Morogoro region ..................................................... 179

xiv
LIST OF APPENDECIES
APPENDIX 1: SMUT INCIDENCE AT KAGERA SUGAR LIMITED........................................ 158 APPENDIX 2: SMUT INCIDENCE AT TPC SUGAR LIMITED .............................................. 158 APPENDIX 3: SMUT INCIDENCE AT MTIBWA SUGAR ESTATE ........................................ 159 APPENDIX 4: SMUT INCIDENCE AT KAGERA OUTGROWERS FIELDS .............................. 159 APPENDIX 5: TPC field sampled .................................................................................. 160 APPENDIX 6: Kilombero sugarcane field sampled .......................................................... 161 APPENDIX 7: Mtibwa sugarcane field sampled .............................................................. 161 APPENDIX 8: Kagera sugarcane field sampled .............................................................. 161

xv
ACRONYMS AND ABBREVIATIONS
MN Malawi/Natal
N Natal
R Reunion
ANOVA Analysis of Variance
B Barbados
CG Contract growers
CG Guatemala
CP Canal Point
DUS Distinctiveness Uniformity Stability
FP Farmers Practice
GC Genetic Combinations
GENSTAT General Statistics
K1 Kilombero one factory
K2 Kilombero two factory
KSC Kilombero Sugar Company
KSL Kagera Sugar Limited
LSD Least Significant Difference
M Mauritius
MSE Mtibwa Sugar Estate
NPT National Performance Trials
OGs Out Growers
PC Plant Cane
POCS Per cent Obtainable Cane Sugar
Q/KQ Queensland
R1 Ratoon cane
RCBD Randomized Complete Block Design
RT Recommended Technology
SBT Sugarbord of Tanzania
SPF Sugar Processing Factories
TCH Tonnes Cane per Hectare
TOSCI Tanzania Official Seed Certification Institute
TPC Tanganyika Planting Company
TPRI Tropical Pesticides Research Institute
TSH Tonnes of Sugar per Hectare
WICSCBS West Indies Central Sugar Cane Breeding Station

1
1.0 SUGARCANE RESEARCH HIGHLIGHTS 2018/19
Figure 1. 1 Sugarcane
1.1 Introduction The Tanzania Agricultura Research Institute (TARI, Kibaha) is working on demand driven
research to solve problems hindering sugarcane production. Due to limited area good for
sugarcane production and limitations of being closer to sugar factory, hence production
has to be with improved practices and varieties. However, sugar production is still low to
meet country requirements. They are several factors that are limiting including Biotic and
abiotic such as lack of enough improved varieties which are tolerant to drought and
resistance to pest and diseases, Poor management of pests and diseases and lack of
knowledge on good agronomic practices. Being the only Research institute with national
mandate for sugarcane research, TARI-Kibaha has been implementing a five years
strategic plan which aims to improve researches related to sugarcane.
In order share research outputs archived, TARI Kibaha organizes Technical Committee
Meetings for the researchers and other sugarcane stakeholders to present their results.
Hence in 2017/18 the meeting was held on 8th June 2018 at TARI Kibaha conference room
and researchers presented progress reports related to sugarcane breeding, agronomy,
entomology, pathology and technology transfer. The main purpose of this meeting was to
review the results and progress of research activities implemented in year 2017/18 and
propose research activities for 2018/19. In this meeting, we invited different stakeholders
including; representatives from sugarcane out growers, agronomist from estates

2
(Kilombero, Mtibwa, Kagera sugar and TPC), DAICOs (Kilombero, Kilosa, Misenyi, LAOs,
Mkulazi project, SBT, SIDTF, AWF-SUSTAIN, YARA Fertilizer Company, Bagamoyo Sugar
Estate, Essoco, DEDs, Abood Radio and Representatives from Researches (Ilonga and
Mlingano).
During the meeting participants came up with recommendations for the purpose of
improving sugarcane researches. The recommendations discussed and agreed to be part
of action plan include; establish collaboration between TARI Kibaha (formerly SRI) and
TOSCI in establishment of quality control standards for seed cane, form task force to
sensitize LGA’s to give financial support in order to support sugarcane productivity based
on ASDP II Program, establish a study on factor that will improve efficiency along
sugarcane value chain for out growers (Farm to Weigh bridge), review the MoU between
LGA,s and SBT for extension services, Government to support ARI-Mlingano to upgrade
their soil laboratories to ISO standards (Accreditation of laboratories is important) and last
is to initiate the study on the control of Striga i.e. by using catch crops.
1.1.1 Weather
1.1.2 Staffs Researches under the commodity of sugarcane has been divided by discipline which are
breeding, agronomy, entomology, pathology, nematology and technology transfer.
However, starting from new financial year researchers will be working based on where
they have been allocated following new TARI structure which divides researchers into their
specialization. The system of working under discipline of specialization will allow
researchers from root and tuber crops to work on sugarcane when we have shortage of
research staffs. Aim is to fully utilize available skills and identify gaps within institution.
The TARI structure wants to make sure all researches are conducted by specialized
people. In addition, in the new structure, there is emphasis on transfer of developed
technologies to end user. Hence this section is separated from research section and will
concentrate on reaching farmers with improved technologies through trainings,
awarenesses, shows etc.
Sugarcane research comprised of 25 staffs (Table 1.1) where six are technicians or field
officers and nineteen are scientists. Among 19 scientists, 17 are fulltime scientists and two
are working under contracts. One field officer is on study leave taking her BSc agronomy
at SUA. Due to restructuring of TARI, sugarcane has received new staffs where three from
internal transfer from root and tuber crops and other two from TARI HQ. However, some
staffs have been transferred to other institutions or given new appointments. Among them
are Drs Mtunda and Ngailo who were appointed as Director for TARI center and Director
General for TFRA respectively.
In the last meeting we presented problem of Entomologist. But recently we have been
given permit from TARI to continue with recruitment of Entomologist who will be working
in contract bases and paid from SIDTF funds.

1
Table 1. 1 Research staffs responsible for sugarcane researches at TARI Kibaha
No Name Education Specialization Duty
1 Dr H. Msita PhD Bioscience
engineering
Centre Manager
2 Dr Nessie Luambano PhD Plant Nematology Coordinator
3 Ambilikile
Mwenisongole
MSc Agricultural
Economics
Technology
transfer
4 Herman Kalimba MSc Agronomy Agronomy
5 Leyla Lwiza MSc Soil Science Agronomy
6 Minza Masunga MSc Molecular Pathology Pathology
7 Beatrice Kashando MSc Nematology Nematology
Magreth Mziray MSc Water Management Pathology and
nematology
8 Andrew Kachiwile MSc Molecular Breeding Breeding
9 George Mwasinga MSc Breeding Breeding
10 Amri Yusuph MSc Environmental and
Natural resource
Economics
Entomology
11 Margareth Kinyau MSc Agricultural
Economics
Technology
transfer
12 John Msemo MSc Rural Development
and Marketing
Technology
transfer
13 Diana Nyanda MSc Agric. Education and
Extension
Technology
transfer
14 Baraka Ernest MSc Climate Change
15 Nsajigwa Mwakyusa BSc Agriculture General Breeding
16 Fadhila Urasa BSc Agriculture General Entomology
17 Rose Pachi BSc General Science Agronomy
18 Mohammed Mwinjumah Diploma Fields Officer Field Officer
19 Stanley Kajiru Diploma Field Officer Field Officer
20 Robert Mlimi Diploma Field Officer Field Officer
21 Renifrida Polini Diploma Laboratory
Technician
Technician
22 Yeremiah Mbaga Diploma Laboratory
Technician
Technician
23 Dr Juma Katundu PhD Entomology Contract
24 Bonaventura Minja MSc Entomology New-Entomologist
25 Judith Setebe Diploma Study leave
1.2 Research Activities In the financial year 2018/19 a total of 49 project activities (appendix 1) were approved by
37th sugarcane research steering committee meeting held on 13th July 2018. The projects
are from breeding, agronomy, entomology, pathology and technology transfer and
percentage projects distribution are shown in Figure 1.2.

2
Figure 1. 2 Percentage of project distribution funded in 2018/19
Total budget approved for these activities was 426, 062, 870/=. In addition to this, the
committee approved funds for research coordination and station upkeep which are Tsh
68,971,700 and 197,424,000/= respectively. Below in Figure 1.3 are projects and outputs
achieved by each discipline for 2018/19.
1.2.1 Sugarcane Breeding
20%
27%
15%
23%
15%
Breeding
Agronomy
Entomology
Pathology
Technology Transfer

3
Figure 1. 3 Multiplication of clean sugarcane planting materials
Importation of New Varieties (Quarantine and distribution of newly imported sugarcane
varieties)
Five varieties (CPCL05-1102, R 01/0277, GT18, GT 5 and GT 3) were imported from
CIRAD and planted in the closed quarantine
Eight varieties (R98/4146, GT 15, R 58, CP 062042, R00/2460, R00/8180, FR 89-746,
& R 6221) are under open quarantine at Kilombero
Thirteen varieties (N35, N40, N42, N48, N57, R97/0478, R96/0020, R00/2129,
R96/6396, NA8-1090, FR 92394, FR 90881 & BO 3572) were released from open
quarantine and planted in four estates (KSC, MSE, KSL & TPC) for seedcane bulking.
Smut Screening Trials (Selection of smut resistant sugarcane varieties)
12 varieties (N35, N40, N42, N48, N57, R97/0478, R96/0020, R00/2129, R96/6396,
NA891090, FR 92394 & FR 90881) were planted at TARI Ifakara for smut
screening.
Evaluation of 107 varieties is at TARI Ifakara in five sub-experiments
Among 107 varieties, 10 are promising candidate for smut resistance
Preliminary Yield Trials (Preliminary evaluation of new varieties/clones in different
sugarcane estates)
A total of 5 trials have been established at KSC, KSL and MSE in 2018/19 season.
25 on-going preliminary variety trials at KSC, KSL, MSE and TPC have been
harvested at different crop stage
Among these, 15 promising sugarcane varieties have been identified
National Performance Trials (NPT)
Four varieties which include rainfed (R 570 & N47) and irrigated (N36 and R
85/1334) varieties were planted in KSC, KSL, MSE and TPC.
5 NPTs established at TPC and 2 KSC, KSL and MSE
Data on performance of plant cane planted at TPC, KSC and KSL will be presented in
detail by breeding team
Advanced Sugarcane Fuzz Evaluation and Selection
A total of 31 promising clones of sugarcane were selected from imported fuzz.
Selected clones were planted at KATRIN, KSC, TPC and KSL for further evaluation
and selection
Rapid seedcane multiplication (Evaluation of sugarcane seed cane production methods)
Eleven sugarcane varieties (NCo376, R579, N41, R570, R575, N25, N30, N19, N36,
N47 and R85/1334) have been mass multiplied in screenhouses at TARI Kibaha using
single node multiplication technique
Total of 34,111 seedlings have been multiplied and ready for commercial production
Germplasm Conservation and Maintenance (sugarcane germplasm conservation for
sustainable sugarcane sector development)

4
A total of 279 sugarcane varieties have been collected, planted and are maintained
at TARI Kibaha
Also, 41 local sugarcane cultivars have been collected from different regions of
Tanzania, planted and maintained at TARI-Kibaha
1.2.2 Sugarcane Agronomy
Figure 1. 4 Selection of planting materials
Under sugarcane agronomy, the following have been conducted;
Evaluation of existing agronomic package to selected sugarcane varieties in outgrowers
fields of Kilombero sugar mill area.
Trials established at Kilombero Mill area with aim of assessing three promising varieties
(N47,N12, and R570) against NCo376 on recommended sugarcane agronomic
practices.
The key output for the trial is two varieties (N47, R 570) were selected for evaluation
in large blocks.
Evaluation of different levels of fertilizers for improved sugarcane productivity at Kagera Mill
Area
Fertilizer trials comprised of different rates of NPK were established in OG fields of
Kagera mill area
Among 12 fertilizer combinations tested, three (N100P75K100 tested at Kyaka,
N150P25K150 tested at Nsunga and N100P25K100 at tested at Kasambya were promising
Baseline survey on the status of Striga spp in sugarcane fields in Tanzania

5
Survey was done in 100 sugarcane fields in Kagera Mill area.
No field was infested in estate while one field was infested at out growers.
In this study, Striga spp is not a serious weed of sugarcane at Kagera mill area.
Evaluation of different herbicide for use in sugarcane fields at Kagera Mill area
Trials were conducted to evaluate efficacy of different combination rates of herbicides
namely Acetochlor, Metribuzine, Chlorimuron and Paraquat
Assessment of herbicides action was based on direct comparison between treated and
untreated plots
Results shows that all herbicides combinations were effective in controlling weeds for
more than nine weeks
1.2.3 Sugarcane Entomology
Figure 1. 5 Sugarcane stalks infested by white scale
Study of seasonal insect population fluctuations influenced by weather changes and crop
management practices in all estates and out growers fields.
Surveys were conducted in selected fields of Kagera, Mtibwa and TPC, Kilombero and
Manyara to assess the status of infestation of sugarcane Stem borer, Yellow Sugarcane
Aphids and White scale.
The sugarcane fields assess were 121 from estates and 56 from out growers.
Sugarcane stem borer, the white grub and the sugarcane white scale were found in
all estates and out growers fields

6
Except for white grab which was only at TPC and MSE estates.
Sugarcane stem borer attack has been a common problem at TPC and KSL estates.
Generally, white scale infestation in surveyed fields were low which could be due to
the use of less susceptible varieties like R579.
Evaluation of white scale damage and sugar loss in selected varieties
The objective was to develop protocol for an artificial inoculation technique and later
adopt for screening of new sugarcane varieties.
This was conducted in Kilombero Sugar company on the following varieties TZ 93KA -
120, TZ 93KA - 122, R 85/1334, B80689, KQ228 and EA70-97 as tolerant standard and
MN1 or N25 as susceptible controls
Production of White scale predator, Rhyzobius lophanthae, in screen house for field releases
The objective is to produce R. lophanthae for release in sugarcane fields infested
with white scales.
The surveys conducted at TPC showed both White scale and predators were not
available because they use varieties which are less susceptible to white scale
Other results not yet
The Effectiveness of Prophylactic Soil Treatment and Foliar Applications of locally available
insecticides for Yellow Sugarcane Aphids control at Kilombero Estate
Study was conducted at Kilombero Sugar Estate fields to evaluate efficacy of
Attackan, Actara, Drone, Pirimicarb and Abamectin in the control of YSA.
These insecticides are in Neonicotinoids (Attackan, Drone and Actara) and carbamide
(Pirimicarb) and microbial (Abamectin) groups.
Neonicotinoids insecticides (Attackan, Drone and Actara) were highly effective in
reduction of YSA population and damage on sugarcane by 55.2% to 75.5%.
Impacts of predators on Population dynamics of Yellow Sugarcane Aphid in Kilombero and
Kagera Estates
The study aimed at studying the impacts of the resident adults and larvae of
Coccinellid and Syriphid predators in reducing populations of the YSA in sugarcane by
field surveys and partial exclusion cages and open plots
Also, to assess the impact of insecticides on of reduction of predator and YSA
populations.
Results of the exclusion method have shown that the YSA population have increase
three to five times in the absence of predator.
The regular surveys data have supported evidence for predation as a major regulating
factor of YSA population development in sugarcane fields.
Chemical exclusion shown that the both YSA and predators were susceptible to all
insecticides
The impact of insecticides on reduced abundance of predators caused the YSA
resurgence in treated plots.
However, insecticides must be thoroughly tested to determine their impact on
predators.
Evaluation of resistance of sugarcane varieties to Yellow Sugarcane Aphid infestation in
cages

7
The study aimed to asses level of YSA infestation on different sugarcane varieties
Different varieties of sugarcane plantlets have been planted on pots in screenhouse
at TARI Kibaha.
Results not yet
1.2.4. Sugarcane Pathology and Nematology
Figure 1. 6 Symptoms of sugarcane affected by smut disease
Status of Ratoon Stunting Disease at Kilombero Sugar Company, Tanzania A capacity was built to 13 staffs trained in relation to identification of Ratoon Stunting Diseases (RSD) 20 fields were surveyed at KSC which had 6 sugarcane varieties (N19, N25, N41, N30, R570 & R579) Results showed no RSD infestation in all field surveyed Assessment on the incidence of sugarcane smut on estate and outgrowers fields in Tanzania

8
113 fields consisting of 20 sugarcane varieties were assessed for smut infestation both on estates and out-growers fields Results showed higher smut infestation on out-growers fields (86 %) as compared to estates (51 %). Factors influencing disease spread on sugarcane outgrowers fields in Tanzania The survey was conducted to assess knowledge and factors contributing to disease spread in outgrowers fields in Kagera, Kilombero and Mtibwa. A total of 276 farmers interviewed Four major factors; source of planting materials, high price of seedcane, inadequate knowledge related to sugarcane diseases and long distance from seedcane source were identified Monitoring of Plant Parasitic Nematode in sugarcane growing area of Tanzania
Figure 1. 7 Plant parasitic nematode which affect sugarcane plants
Nematodes monitoring was done in Kagera sugar, Kilombero sugar, Tanganyika
Planting Company limited and Mtibwa Sugar Estate. The aim was to know the status
and key nematodes of sugarcane
Total of 129 samples were collected from 43 fields
At least 12 key plant parasitic nematode were identified to genus level
Lesion nematodes (Pratylenchus spp) are widely spread in all estates surveyed while
Reniform (Rotylenchulus spp), was only at TPC limited
Screening for the best control of nematodes in sugarcane production using integrated pest
management

9
This study aimed to develop integrated pest management using organic amendments
(Filter cake, Mucuna beans and Lablab and sunn hemp).
The experiment was done at Kagera sugar limited.
Before setting 24 soil samples were collected to know the status of nematode
The trial consist of 5 treatments and a control
Study on yield losses associated with key plant parasitic nematodes affecting sugarcane in
Tanzania
The study intend to assess yield losses associated with key plant parasitic
nematodes (Pratylenchus spp and Meloidogyne spp) of sugarcane on varieties
R570, R579 and Co 617.
The experiments will be conducted in screenhouse at TARI Kibaha
We have started with mass multiplication of inoculum in the laboratory
1.2.5 Technology Transfer
Figure 1. 8 Leaflets produced for sugarcane awareness on recommended
practices
Strategies to Improve Extension Services to Sugarcane Farmers Through FFS in Kilombero
Sugarcane Mill Area
The FFS established at Kilombero and Mtibwa whereby and 55 farmers were trained
on the use of clean seedcane from nursery B, fertilizer recommendation (N100, P25,
K100) and herbicides application.
Gender distribution was 33 males and 22 females
Establishment of Demonstration plots in Mvomero, Kilosa and Kilombero District
Nine demonstration plots established at Kilombero mill area and Mtibwa mill area.
Three packages were demonstrated which are the use of clean seedcane from B
nursery, recommended fertilizer packages (N100 P 25 K100), herbicides volmuron 4
liters/hectare and good agronomic practices.
The yields of 9 demonstration plots were higher (87-111 TCH) as compared to the
yield from farmers practice (63-75 TCH)
A total of 782 sugarcane farmers learned through demonstration plots.

10
The multiplication of clean seedcane at Kilombero, Kagera and Mtibwa Mill Area
Multiplication of nursery B was established at sugarcane mill areas with a total area of
38.5 acres planted with Co617, NCo376, N47 and R570 varieties.
The seedcane multiplication fields are managed and owned by farmers.
TARI-Kibaha provided clean seed cane from A nursery and inputs, also and local
extension officers support in field observation and monitoring.
Scaling up sugarcane production technologies through training and development of
extension material
A total of 13 were trained on sugarcane production
Designed and developed 1 poster (350 copies), 7 flyers (7000 copies), 7 Brochure
(7000 copies) and 1 book (200 copies) Swahili version.
Total of 2820 fliers, 2300 brochures and 328 posters have been distributed to cane
growers and other stakeholders during nanenane exhibition, farmers’ day in Kilombero
and Kilosa district, at TARI office to parliament committees for agriculture livestock
and fisheries.
In nanenenane exhibition total of 4676 peoples visited sugarcane pavilion
Promotion of Sugarcane Production Technologies to Sugarcane Growers Through Mass
Medial
The promotion of sugarcane technologies was done through Abood FM.
Total of 26 episodes which covered production to harvesting were aired.
As a result we received about 96 calls and 3175 messages from listerners.
Percentage farmers interest were on new seedcane variety (39%), pests and diseases
(19%), planting pattern (14%), fertilizers type and application (13%), herbicides
(8%).
This shows that radio is one of the important tools in dissemination technologies to
sugarcane growers.
1.3 General Achievements Papers, reports and thesis
Juma Katundu, Amri Yusuph, Nassoro Abubakari, Yona Kalinga (2019). Impacts of
predators on yellow sugarcane Aphids population in Kilombero and Kagera. Paper
submitted to the 8th Annual national Workshop of Tanzania Society of Sugar and Cane
Technologist (TSSCT), held on 26th -27th April 2019 at Kilombero Sugar Company.
Lwiza L, Kalimba H, Kajiru S, Merumba S, , Nyanda D, Msita H (2019). Improved
sugarcane vertical productivity through optimum fertilization; case study of Kagera mill area,
Misenyi district, Kagera, Tanzania.
Beatrice Kashando (2018). Morphological and Molecular characterization of plant
parasitic nematodes from sugarcane plantations in the Kilimanjaro region of Tanzania. MSc
Thesis.
George Mwasinga (2018). Effects of Nitrogen Fertilizer on yield and quality of
introduced sugarcane (Sacchurum Officinurum L.) varieties in commercial field at
Kilombero, Morogoro Region.
Annual progress report 2018-2019 compiled for sugarcane research technical
committee meeting

11
Awareness materials and training Manuals
7 banners, 350 posters, 7000 flyers, 7000 Brochures and 200 training manuals were printed
and distributed to;
Sugarcane farmers in sugarcane mill areas (Kilombero, Kagera and Mtibwa),
August 2018 Agriculture show (Nanenane exhibition) in Morogoro,
Different visitors including members of parliament committees for agriculture
livestock and fisheries.
Training
Two researchers who were on study leave have been gradated as follows;
Beatrice Kashando graduated September 2018 in International Master of Science in
Agro and Environmental Nematology. Ghent University, Belgium.
George Mwasinga graduated December 2018 in MSc of Crop Science, Sokoine
University of Agriculture, Morogoro, Tanzania.
Proposal development and submission As researchers with national mandate for sugarcane researches we are responsible
mobilizing resources to support sugarcane research and development.
1.4 Proposal in plans for submission
Sustain-Africa phase ii submitted to Dutch government with title crop variety
research and multiplication of clean seed-cane in Kilombero and Kilosa.
The nutritional, sensory quality and the microbial contamination of chewing
sugarcane juice consumed in Tanzania, to be submitted end of May 2019 to Innovate
UK/DFID call
The following proposal drafts have been prepared and we are looking for the call to submit;
Breeding: Sustainable Sugarcane Seed System in Tanzania
Entomology: Evaluation of Yellow Sugarcane Aphid resistance among commonly grown
sugarcane varieties in Sugarcane growing areas in Tanzania
Agronomy +Agric. natural resources management: Assessment of environmental
and social impacts of sugarcane industry in Tanzania.
Pathology: Development of diagnostic tools for detection of sugarcane diseases in
Tanzania
1.5 Challenges
Need of more funds for building capacity through teller made courses from
different countries
Old irrigation pump
Getting funds from other donors out of SIDTF
Few vehicles and drivers for field work
Leakage of building
Few field officers for succession those expected to retire within 2 years

12
2.0 SUGARCANE BREEDING SECTION
2.1 Importation of New Varieties (Quarantine and Distribution of Newly Imported Sugarcane Varieties) Project code: SCB 2017/01
Investigators: A. Kachiwile, N. Mwakyusa G. Mwasinga and R. Mlimi
Collaborators: TPRI
Duration: 2017/18
Completion: Ongoing
Project summary
Sugarcane varieties are fundamentals for sugarcane sector development. Varieties with
improved traits to resist pests, diseases and tolerate drought in harsh environment providing
more protection against crop failure. The purpose of the project was to introduce new
sugarcane germplasm, monitoring and selection of superior varieties. The selection is based
on their performance in closed and open quarantine before they are released to sugar
estates in Tanzania. Five (5) new varieties (CPCL05-1102, R 01/0277, GT18, GT 5 and GT 3)
were imported from France and planted in the closed quarantine in February 2019. Eight (8)
varieties (R 98/4146, GT 15, R 58, CP062042, R 00/2460, R 00/8180, FR89-746, & R 6221)
planted in November 2018 originally from France are under open quarantine at Kilombero.
Thirteen (13) newly varieties (N35, N40, N42, N48, N57, R 97/0478, R 96/0020, R 00/2129,
R 96/6396, NA8-1090, FR92394, FR90881 & BO3572) were released from open quarantine
distributed to four estates: KSC, MSE, KSL & TPC for seedcane bulking.
2.1.1 Introduction
Plant breeding is defined as the art and science of changing plants genetically (Allard,
1960). Therefore, it is crop evolution directed by man through conscious decision to keep
the progeny of certain parents in preference to others in diverse genetic population
(Simmonds, 1978). The introduction of new sugarcane varieties is among of the activities in
the breeding section. The introduced varieties were from South Africa, Mauritius, United
States, Australia, Reunion and Brazil. Evaluation of the varieties in major sugarcane growing
areas is done in collaboration with sugarcane estates so as to identify superior genotypes
with improved agronomical performance and tolerance to biotic and abiotic stresses.
Objective
To introduce new germplasm of sugarcane, monitor and select superior varieties based on
their performance in closed and open quarantine before they are released to the sugarcane
estates.
Specific Objectives
i. To introduce new sugarcane varieties in sugarcane estates of Tanzania
ii. To evaluate the performance of the new sugarcane varieties
iii. To select the superior sugarcane varieties for commercialization
Outputs
i. 5 new varieties imported and planted in closed quarantine
ii. 8 new varieties graduated to open quarantine

13
iii. 18 new varieties released from open quarantine for seedcane bulking in the four
sugarcane estates
2.1.2 Materials and methods
Importation of 5 new varieties from France was done in February 2019. These materials
were planted in closed quarantine screen house at TARI-Kibaha. The plant materials were
inspected by National Plant Quarantine Services from Tropical Pesticides Research Institute
(TPRI) before planting and released to Cane growers in Tanzania. Each variety consisted 6
setts with one eye bud each. Prior to planting, the cutting knife was sterilized by washing
with sodium hypochloride solution 3.5/v; before using it for cutting another variety. Setts
were dipped into mixed solution of Baleyton 250 WP (Triadimefon 250g) fungicide with
Diazinon (Neucidol 50 EC) insecticide for 10 minutes for a ratio of 1ml of Baleyton and 1g of
Diazinon to 1 litre of water. The setts were planted into 20 dm3 baskets containing sterilized
soil, one variety per basket. Irrigation of setts planted was done by using tape water. After
planting, 20mls of insecticide per 20 litres of water (Karate 500 EC lambda-cyhalothrin) was
sprayed to control insect pests inside the screen house.
Sugarcane varieties imported before the five varieties planted in 2018/2019 are in nurseries
for seedcane multiplication. They are in the stages to attain preliminary variety trials for
2019/2020 planting season. The varieties are N35, N40, N42, N48, N57, R 97/0478, R
96/0020, R 00/2129, R 96/6396, NA89-1090, FR 92394, FR 90881 and B 03572.
2.1.3 Results
Imported varieties in closed quarantine: Five (5) new varieties, CPCL05-1102, R 01/0277, GT18, GT 5 and GT 3 were imported from
France in February 2019 and planted in closed quarantine at TARI - Kibaha (Table 2.1). All
varieties germinated and are in good condition.
Table 2. 1 Varieties planted in closed quarantine at TARI – Kibaha
Varieties under open quarantine
Eight (8) new varieties (R98/4146, GT 15, R 58, CP 062042, R00/2460, R00/8180,
FR 89-746, & R 6221) are under open quarantine at Kilombero.
S/N Variety No of setts & eye buds Germination (%) Remarks
1 GT 3 6 setts 1 eye bud each 100 Very Good
2 CPCL05-1102 6 setts 1 eye bud each 50 Good
3 R 01/0277 6 setts 1 eye bud each 17 Poor
4 GT 18 6 setts 1 eye bud each 17 Poor
5 GT 5 6 setts 1 eye bud each 17 Poor

14
Varieties released from open quarantine
Thirteen (13) newly varieties (N35, N40, N42, N48, N57, R97/0478, R96/0020,
R00/2129, R96/6396, NA8-1090, FR 92394, FR 90881 & BO 3572) were released
from open quarantine distributed to four estates: KSC, MSE, KSL & TPC for seedcane
bulking.
2.1.4 Discussion
Introducing new varieties and clones to the sugarcane industry in the country have high
impact towards commercialization by sugarcane estates. The performance of the planted
varieties in the closed quarantine depends on genetically adaptability to new environment
that are subjected. The better performing varieties are typically adapted to the
environmental condition resulting to promising commercial elite varieties for sugar industry
development in Tanzania
EVALUATION OF NEW VARIETIES
2.2 Smut Screening Trials (Selection of Smut Resistant Sugarcane Varieties) Project Code: SCB 2017/02
Investigators: A. Kachiwile, N. Mwakyusa, Mwasinga, G and R. Mlimi
Collaborators: Sugarcane Estates and TARI-Ifakara
Duration: 2 years (2017/18 – 2019/20)
Project summary
Sugarcane smut resistance is influenced by three major factors: sugarcane genotype, the
pathogen, and the environment. Assessment on the reaction of varieties to smut was done
by exposing candidate varieties to high smut pressure by artificially inoculating seedcane
with fresh smut spores and planting in a nursery. All test varieties were planted between
infester rows of an artificially infected susceptible variety (NCo376). The experiment design
was a Randomized Complete Block Design (RCBD) replicated three times. Plot sizes were
two rows 1.2 m apart and 8 m long. Total numbers of stalks were counted and number of
infected stalks were calculated as percentages and subjected to analysis of variance. The
reaction of test varieties in the form of numbers of infected stalks was compared with the
most susceptible (NCo376) and resistant (EA70-97) varieties. A total of 10 sugarcane
varieties showed to be promising in resisting smut disease.
2.2.1 Introduction
Sugarcane smut disease, caused by Sporisorium scitamineum, can cause significant yield
loss when susceptible cultivars are planted. There is 0.6 to 0.7% yield loss for every 1%
increase in diseased plants. (Magarey at al., 2014). Sugarcane smut can cause any amount
of loss to susceptible varieties from 30% to total crop failure .Sugarcane smut managed
effectively when resistant cultivars are planted, which is the most economical and effective
measure for disease prevention and control (Xing, 2013). Infected plants show a profound
metabolic modification resulting in the development of a whip-shaped structure (sorus)
composed of a mixture of plant tissues and fungal hyphae. Within this structure,
ustilospores develop and disseminate the disease. Resistant varieties grown in all areas

15
regularly and show some smut infection but not suffering with cane yield loss (Magarey et
al., 2014).
In Tanzania, sugarcane smut disease has been causing problem in all estates and to
outgrowers (OGs) where growers use clean seedcane as means of managing the disease.
However, the management techniques used are not effective and hence this project aimed
to evaluate new imported sugarcane varieties for their resistance to this disease.
Objective
To determine the reaction of newly imported varieties to smut infections so as to identify
resistant varieties
Specific objective
To evaluate new imported sugarcane varieties for their resistance to smut disease.
Achieved Output
A total of 10 sugarcane varieties showed to be promising in resisting smut disease
2.2.2 Materials and methods
A total five experimental trials comprised of fifteen (7N and 8R), nineteen (4CP and 15R),
twenty four (7B and 17R), twenty five (B) twenty four (23B and 1M) varieties and 3 check
varieties were evaluated in ratoon crop (R1). Susceptible check variety was NCo376, while R
579 and EA 70-79 included as resistant varieties. The treatments were planted in
Randomized Complete Block Design and replicated 3 times, having a spacing of 1.2 m and
length of 8 m, each plot was planted with 40 setts containing two eye buds inoculated with
2 grams of smut spores in 1litre of water per plot stayed overnight. Data on diseases
incidences were collected by counting number of infested stools per plot and later
percentage infection calculated from the total plants.
Statistical analysis
Data on percent disease incidence were square root transformed before subjecting into
ANOVA using GENSTAT statistical package version 14. Means were compared using LSD at
P=5%
2.2.3 Results
Experiment No. 1
A total of fifteen (7N and 8R) varieties were evaluated for smut resistant and compared to
NCo376 and EA70-97 in smut screening trial. Results for R1 are shown in (Table 2.2).The
level of mean percent smut infection varied among test varieties, however there were not
significantly different (p≤0.05). Test varieties N29, N38 and R96/2454 had smut infection
lower than resistant check EA70-97, while varieties N50, R95/2100, R97/2168 and R99/4065
had smut infection higher than susceptible check NCo376.

16
Table 2. 2 SCB Smut infection rate
Variety Smut (%) Arc sine
N29 0.0 5.7
N38 1.6 8.5
N43 7.3 15.0
N50 27.6 31.4
N51 11.1 15.8
N52 7.2 16.4
N53 7.1 16.0
R95/2100 24.6 25.2
R95/2204 9.2 17.0
R96/2454 0.0 5.7
R96/8149 16.2 20.2
R97/2168 30.1 30.4
R98/2431 21.4 27.6
R98/6092 20.0 26.0
R99/4065 26.8 31.3
EA 70-97 6.5 14.6
NCo 376 23.3 26.5
MEAN 14.1 19.6
LSD (0.05)
21.9
CV (%)
67.0
P-Value
0.389
Experiment No. 2
Nineteen (4CP and 15R) varieties were assessed for smut reactions in comparison with
NCo376 and EA70-97 susceptible and resistant varieties, respectively. Results for R1 are
presented in Table 2.3. Varieties CPCL02-6848, CPCL051791, R004055, R94/2129-1 and
R95/2202 had significant (P<0.05) lower smut infection than resistant check EA70-97, while
varieties R95/2202, R95/4065 (R586), R97/2225 and R97/6177 scored significant (P<0.05)
higher smut infection than susceptible check NCo376.

17
Table 2. 3 SCB Smut infection rate
Variety Smut % Arc sine
CPCL02-6848 2.7 9.6
CPCL05-1102 8.5 15.6
CPCL05-1791 3.6 10.4
CP04-1566 9.7 18.1
R004055 3.8 12.4
R93/4541 12.1 18.6
R94/2129 14.1 14.4
R94/2129-1 3.1 10.0
R95/2087 7.0 11.4
R95/2202 23.3 24.5
R95/4065 (R586) 24.9 28.4
R95/4216 1.9 9.5
R96/2281 10.1 18.4
R97/0391 17.0 23.7
R97/2225 20.9 26.8
R97/6177 24.2 27.8
R98/2310 7.6 15.9
R98/4001 12.2 20.4
R98/8115 12.9 21.1
R99/4064 10.7 17.7
R99/4065 14.6 19.7
EA 7079 6.2 12.3
NCo 376 14.4 21.5
MEAN 11.6 17.7
LSD (0.05)
15.7
CV (%)
53.6
P-Value
0.314
Experiment No. 3
Twenty four (7B and 17R) varieties were evaluated in smut screening trial against R579 and
NCo376. Results are presented in Table 2.4, indicated that mean percent smut infection
varied among test varieties, however there were not significantly different (p≤0.05) in
reaction to smut among test varieties. However, susceptible check had lower smut infection
compared to test varieties except varieties R94/0142 and R96/8299 which had the lowest
infection rate.

18
Table 2. 4 SCB: Smut infection rate
Variety Smut % Arc sine
B001250 4.0 11.9
B00167 24.0 26.9
B03110 11.5 18.6
B77602 32.2 3 5.1
B80689 4.5 12.5
B89447 3.6 11.6
B98235 4.9 12.7
R580 16.7 19.0
R581 6.6 14.3
R585 18.5 23.5
R91/2200 7.0 15.1
R92/4246 2.0 9.0
R93/6480 6.9 15.2
R94/0142 0.0 5.7
R94/2129 2.1 9.0
R94/6113 3.3 10.3
R94/6447 3.7 11.7
R95/0017 12.4 20.5
R96/2116 1.5 8.4
R96/2569 10.1 17.7
R96/6538 6.7 12.9
R96/8299 0.0 5.7
R97/4029 7.4 13.4
R98/4162 26.1 30.2
R579 1.5 8.5
NCo376 13.9 17.4
MEAN 8.8 15.3
LSD (0.05) 17.6
CV (%)
70.3
P-Value
0.164
Experiment No. 4
A total of twenty five (B) varieties were assessed for smut reaction against NCo376, N41
and R579. Results for R1 are presented in Table 2.5, indicated that were not statistically
significant difference (p≤0.05). However, varieties B99186, BBZ951049 and BR93017 scored
significant higher (p<0.05) smut infection than susceptible check NCo376.

19
Table 2. 5 SCB: Smut infection rate
Variety Smut % Arc sine
B991037 1.1 7.8
B991114 18.9 26.0
B99186 37.4 38.2
BBZ92653 7.6 15.1
BBZ951034 0.0 5.7
BBZ951049 25.3 30.5
BJ78100 5.6 13.2
BJ8231 1.1 7.8
BJ8534 14.2 22.5
BJ8897 9.5 18.8
BR030003 0.0 5.7
BR041001 0.0 5.7
BR08004 14.6 22.2
BR08012 4.1 12.9
BR93017 20.4 27.5
BR96013 11.7 20.0
BR971007 2.6 10.4
BR971011 8.2 16.1
BR971014 1.7 8.6
DB8203 15.1 19.7
DB94177 5.5 14.6
DB9436 10.1 17.7
DB9526 6.8 15.8
M700/86 8.2 17.2
N41 6.8 16.0
NCo376 18.5 23.5
R579 0.0 5.7
MEAN 9.4 16.5
LSD (0.05) 12.1
CV (%)
44.9
P-Value
0.001
Experiment No. 5
Twenty four (23B and 1M) varieties were assessed for smut reaction against NCo376 and
R579. Results are presented in Table 2.6, indicated that there were highly significant
differences (p≤0.05) among tested varieties. Test varieties had varying levels of reaction to
smut infection; however, varieties B41291 and KNb9180 scored significant (p<0.05) higher
smut infection than the susceptible check NCo376, while other varieties had smut infection
statistically (P>0.05) similar to resistant check R579.

20
Table 2. 6 SCB: Smut infection rate
Variety Smut % Arc sine
B00111 0.0 5.7
B00279 12.6 17.7
B00713 1.0 7.7
B0072 9.0 16.4
B01218 19.5 23.1
B041291 28.9 27.8
B991110 4.9 12.5
B99907 2.6 9.5
BBZ8257 8.3 14.8
BJ82156 7.3 16.2
BJ8820 3.0 9.9
BR00010 2.2 9.1
BR021002 1.7 8.5
BR96013 9.8 18.2
BR971004 3.2 11.1
BR972001 1.7 8.5
BT7782 0.0 5.7
BT88404 4.5 11.1
DB7869 9.5 14.3
DB8113 3.5 11.4
DB9633 8.3 13.6
KNB9180 28.9 31.4
KNB9211 5.1 11.6
KNB9218 10.0 17.0
KNB9252 18.4 22.4
NCo376 15.8 23.4
R579 4.8 12.7
MEAN 8.3 14.5
LSD (0.05)
15.3
CV (%)
64.4
P-Value 0.117
2.2.4 Discussion
From these results it is obvious that NCo376 have high infestation rate than the tested
varieties, however, some tested varieties shows high infestation rate than NCo376 (Table
2.2). Variety N29, N38 and R96/2454 proved more resistant to smut infestation rate than
other varieties, this might be attributed by genetic makeup of these varieties (Xing, 2013).
Variety R95/2202, R95/4065 (R586), R97/2225 and R97/6177579 showed that they are not
stable resistant to smut infestation than other varieties. The tillering rate has been reported
to progressively decrease in the field infected sugarcane cultivars (Caleb, 2008).
Varieties CPCL02-6848, CPCL051791, R004055, R94/2129-1 and R95/2202579 (Table 2.3)
shows stable resistant to smut infestation than other varieties. Varieties R95/2202,
R95/4065 (R586), R97/2225 and R97/6177 proved that they are not resistant to smut
infection rate. Magarey et al (2014) reported that, the infection rate of smut in a variety is

21
mainly dependent on the races of the pathogen present and the environmental conditions.
For highly susceptible variety, indicating that if the planting material is fully infected, it may
result in a total failure of the crop because incidence of smut increases in the ratoon crop
due to the infection of subterranean buds, which germinates to from the ratoon tillers (Xing,
2013).
Variety R94/0142 and R96/8299 (Table 2.4) shows stable resistant to smut infestation than
other varieties, however, other varieties were intermediate resistant to smut, this might be
attributed by timing of inoculation between smut spores growth and susceptibility of a
variety to smut spores or genetic makeup of the variety to resist against smut spores (Xing,
2013).This implies that smut resistant cane cultivars should be planted in areas where smut
is known to be common.
Variety BBZ951034, BR030003, BR041001 and BT7782 (Table 2.5) proved to be highly
resistant to smut, while variety B991037, BJ8231, and BR971014 shows high ability to resist
to smut infection. The variation in the reactions of smut among varieties might be
associated with resisting to inoculation pressure (Singh et al., 2014). Cultivars with a high
level of field phenotypic resistance to smut disease had relatively little pathogen proliferation
after smut infection (Caleb, 2008)
Variety B00111, B00713, BR972001, BT7782 proved that they are highly resistant to smut
infestation rate. The variation in reactions to smut might be associated with variety
environments occurrence of difference strains of smut (Xing, 2013). The susceptible
reactions of some varieties in respective of whether they are inoculated or not during the
varietal screening and the series of field infection contributed to variation of varieties
infection rates. Magarey et al (2014) reported that the extent of the yield and economic
losses exerted on sugar cane by smut are dependent primarily on the percentage of seed
cane infected and by the yield loss of each infected plants. The contrast between the
disease resistance percentage for test varieties it might be the differences were due to the
presence of different races of sugarcane smut (Caleb, 2008),
2.3 Preliminary Yield Trials (Preliminary Evaluation of New Varieties/Clones in Different Sugarcane Estates)
Project Codes: SCB 2013/04, SCB 2015/03, SCB 2016/04, SCB
2016/05 2017/4, SCB 2017/03, SCB 2017/06
Principle investigator A. Kachiwile, N. Mwakyusa, G. Mwasinga and R. Mlimi
Collaborators Sugarcane Estates
Duration 2013/14/15/16/17
Date of Completion Ongoing
Project summary
Commercial sugarcane production in Tanzania is done in rainfed and irrigated conditions.
The attainable yield of 70 – 80 TCH and 45 - 50 TCH are being experienced in the country
under irrigation and rainfed conditions respectively (Chambi & Issa, 2010). This is generally
very low productivity that actually translate to actual sugar production of less than 7 tonnes
per hectare.
The key factors leading to low productivity include the use of old varieties which have lost
vigour and have succumbed to insect pests and diseases and further unfavorable weather

22
and soil conditions. The aim of this project is to evaluate performance of newly introduced
varieties in sugarcane estates of Tanzanian sugarcane. A total of 5 trials have been
established: 3 at KSC, 1 at KSL and 1 at MSE in 2018/19 season. 25 on-going preliminary
variety trials at KSC, KSL, MSE and TPC have been harvested at different crop stage and out
of those 15 promising sugarcane varieties have been identified.
2.3.1 Introduction
Development of sugarcane varieties involve a series of stages. It starts by generating the
population with genetic variability (either by crossing contrasting individuals or introduction
of new varieties of known qualities) followed by evaluations across locations and selection of
genotypes with superior qualities (Gazaffi, Oliveira, Souza, Augusto, & Garcia, 2014). In
Tanzania, preliminary variety trial is the second stage in sugarcane variety release pipeline
after germplasm introduction and/or improvement. The stage involves three crop cycles:
one plant cane (PC) and two ratoons (2R). At this stage candidate varieties are compared
with commercial varieties for important traits such as per cent pure obtainable cane sugar
(POCS), cane-yield (tons of cane per hectare - TCH), sugar yield (tons of sugar per hectare -
TSH) and tolerance/resistance to biotic and abiotic stresses. Identified superior genotypes
are then passed to advanced stages until official variety release.
Objective
To evaluate performance of newly introduced varieties in sugarcane estates of Tanzanian
sugarcane.
Output achieved
5 new preliminary variety trials established at different sugarcane estates
15 promising sugarcane varieties have been identified
2.3.2 Materials and Methods
The experiments were conducted in sugarcane estates fields of Kagera, Kilombero, Mtibwa
and TPC. Varieties planted in Randomized Complete Block Design (RCBD) with three to five
replications. Plot size and spacing differed from one sites to another. Parameters collected
during evaluation are number of millable stalks, plant height, plant weight, sugar yield and
quality parameters (brix, pol and purity cane). Sucrose content was calculated (TCH X
%Sucrose).
Statistical analysis
Data collected at different crop growth stage was subjected to analysis of variance using
GenStat statistical package version 15.
2.3.3 Results
Kilombero Sugar Company (KSC) - Irrigated variety trials
Variety trials were established at KSC estate to test performance of candidate varieties
under irrigated conditions. Results are reported below in different parameters: Sucrose
content, Polarization (POL), Purity, Tons Cane per Hectare (TCH), Tons Sugar per Hectare
(TSH), percentage brix, number of millable stalks and stalks population per hectare.

23
Field 410
Fourteen B varieties were evaluated against N25 and R 579 in field 410 at KSC during the
reported period. Results indicated highly significant differences in TSH (P< 0.001) and high
significant difference on TCH (P<.001) among tested varieties (Table 2.7). Varieties
B001250 followed by BR971004 and DB9526 had the highest TSH. Contrarily, varieties
BJ8256, BR0812 and BR96013 had the lowest TSH. In terms of TCH, candidate varieties
BR971004, DB9526 and B001250 had highest TCH whereas BJ8256, BR0812 and BR96013
had lowest TCH.
Table 2. 7: Preliminary sugarcane variety trial (Field 410)
VARIETY POL PURITY SUCROSE TCH TSH
BJ8256 13.3 85.6 10.6 33.0 3.5
BR0812 13.4 89.9 11.0 34.8 3.8
BR96013 13.1 83.2 10.1 38.4 3.9
BJ78100 13.1 89.3 10.8 45.0 4.8
BJ8820 12.6 85.9 10.1 48.6 4.9
B98235 13.3 85.4 10.5 48.6 5.1
DB8113 13.2 85.6 10.5 51.0 5.3
BR041001 13.6 84.7 10.7 52.2 5.6
BR971014 12.5 81.8 9.5 63.6 6.1
BJ8534 12.9 85.7 10.2 60.0 6.1
B80689 13.1 88.2 10.6 67.2 7.2
DB9526 12.3 84.9 9.8 74.4 7.3
BR971004 13.2 90.7 11.0 70.8 7.8
B001250 13.5 87.5 10.9 76.8 8.4
N25 13.3 89.4 10.9 55.2 6.0
R579 12.6 85.7 10.0 69.6 6.9
MEAN 13.1 86.5 10.4 55.6 5.8
LSD (0.05) 1.0 5.4 1.3 20.3 2.2
CV (%) 4.8 3.7 7.3 21.9 23.0
P-Value 0.392 0.092 0.400 <.001 0.001
Planting date: 12/08/2015 previous harvest date: 28/08/2017
Harvest date: 20/7/2018 Crop cycle: R2
Field 411
Twenty six varieties (15 CP and 11 Q) were tested against N25 and NCo376. Results of
selected parameters are presented in Table 2.8. There was no significance differences
among tested varieties in all parameter. However, in absolute terms, variety Q219 followed
by Q96 and CPO4-1367 had higher TSH. Contrariwise, varieties CPO4-1844, CPO4-1258 and
CPO4-1252 had the lower TSH. For TCH, the highest performer was candidate Q96 followed
by Q219 and CPO4-1367. Perversely the lowest performer was CPO4-1844 followed by
CPO4-1258 and CPO4-1252.

24
Table 2. 8: Preliminary sugarcane variety trial (Field 411)
VARIETY POL PURITY SUCROSE TCH TSH
CPO4-1844 14.8 86.6 11.8 14.4 0.5
CPO4-1258 14.4 92.1 12.1 16.2 0.6
CPO4-1252 14.8 93.1 12.6 16.2 0.6
Q199 14.9 91.5 12.5 18.0 0.6
CPCLO2-0843 15.0 89.7 12.4 19.8 0.7
CPO4-1619 15.0 97.9 13.3 18.0 0.7
Q190 14.3 88.4 11.6 21.6 0.7
CPO4-1321 14.6 87.8 11.8 21.6 0.7
Q183 15.0 96.5 13.1 19.8 0.7
CPCLO2-2273 14.8 90.4 12.4 21.6 0.7
Q200 14.4 88.3 11.7 23.4 0.8
CPCLO2-0926 14.5 88.7 11.9 25.2 0.8
CPO4-1566 14.6 90.6 12.1 23.4 0.8
CPO4-1426 14.8 97.4 13.2 21.6 0.8
Q177 14.9 89.3 12.2 23.4 0.8
CPCLO2-1295 14.5 93.4 12.4 23.4 0.8
CPO4-1935 14.9 94.8 12.9 23.4 0.8
Q151 15.3 89.8 12.7 25.2 0.9
Q155 15.2 93.7 13.1 23.4 0.9
Q99 14.3 90.2 11.9 28.8 1.0
CPCL95-2287 14.8 83.5 11.4 30.6 1.0
CPO4-1374 15.4 89.2 12.6 28.8 1.0
Q171 15.4 93.9 13.2 27.0 1.0
CPO4-1367 14.3 89.9 11.8 30.6 1.0
Q96 14.0 85.2 11.0 34.2 1.0
Q219 15.0 95.6 13.0 32.4 1.2
N25 14.4 95.6 12.5 23.4 0.8
NCo376 14.6 94.0 12.5 19.8 0.7
MEAN 14.7 91.3 12.3 23.4 0.8
LSD (0.05) 1.1 12.6 2.2 14.8 0.5
CV (%) 3.6 6.7 8.5 30.8 28.7
P-VALUE 0.655 0.809 0.867 0.539 0.502
Planting date: 12/09/2015 previous harvest date: 06/09/2017
Harvest date: 25/7/2018 Crop cycle: R3
Field 417
Fifteen varieties (4 B, 6 CG and 5 R) were tested against N25. Results are presented in
Table 2.9. There was highly significant differences (P<0.001) in TSH and TCH among
varieties tested.
The test candidate R96/2569 was the highest in terms of TSH and TCH followed by
BR9701011 and N25. To the contrary, varieties DB8203, CGSP98-12 and CG99-125 had the
lowest TSH. Whereas varieties DB8203, CGSP98-12 and B99114 had the lowest TCH.

25
Table 2. 9: Preliminary sugarcane variety trial (Field 417)
VARIETY POL PURITY SUCROSE TCH TSH
B03110 14.8 77.3 10.5 60.0 6.3
B041291 14.6 78.1 10.5 51.9 5.5
B99114 15.7 77.8 11.2 44.6 5.1
BR9701011 15.1 77.3 10.7 69.1 7.4
CG00-092 13.2 77.3 10.4 61.9 6.4
CG96-52 14.8 74.7 10.2 50.4 5.2
CG99-087 14.8 76.0 10.3 52.4 5.4
CG99-125 15.1 77.5 10.8 45.7 4.9
CGSP98-12 14.0 76.8 9.9 33.3 3.3
DB8203 14.1 77.8 10.1 29.3 3.0
R94/6447 14.5 77.3 10.3 49.4 5.1
R96/2569 14.7 77.5 10.7 80.6 8.6
R96/6538 14.4 80.9 10.8 62.0 6.7
R97/4029 14.3 81.0 10.7 58.9 6.3
R580 14.9 76.6 10.5 55.6 5.8
N25 14.0 80.8 10.4 65.9 6.9
MEAN 14.6 77.8 10.5 54.4 5.7
LSD (0.05) 1.3 3.6 0.8 14.4 1.6
CV (%) 5.4 2.8 4.5 15.9 17.0
P-VALUE 0.150 0.060 0.220 <.001 <.001
Planting date: 25/09/2015 previous harvest date: 06/12/2017
Harvest date: 16/11/2018 Crop cycle: R2
Field 511
Fourteen varieties (12B and 2R) were evaluated against N25 and R579. The means for
parameters studied are presented in Table 2.10. Results indicated non-significant differences
in all the selected parameters: polarization, purity, sucrose, TCH and TSH. Nevertheless,
candidates BT88404, BR93017 and B00167 were the best in terms of TSH whereas checks
N25 and R579 were the least for the parameter.
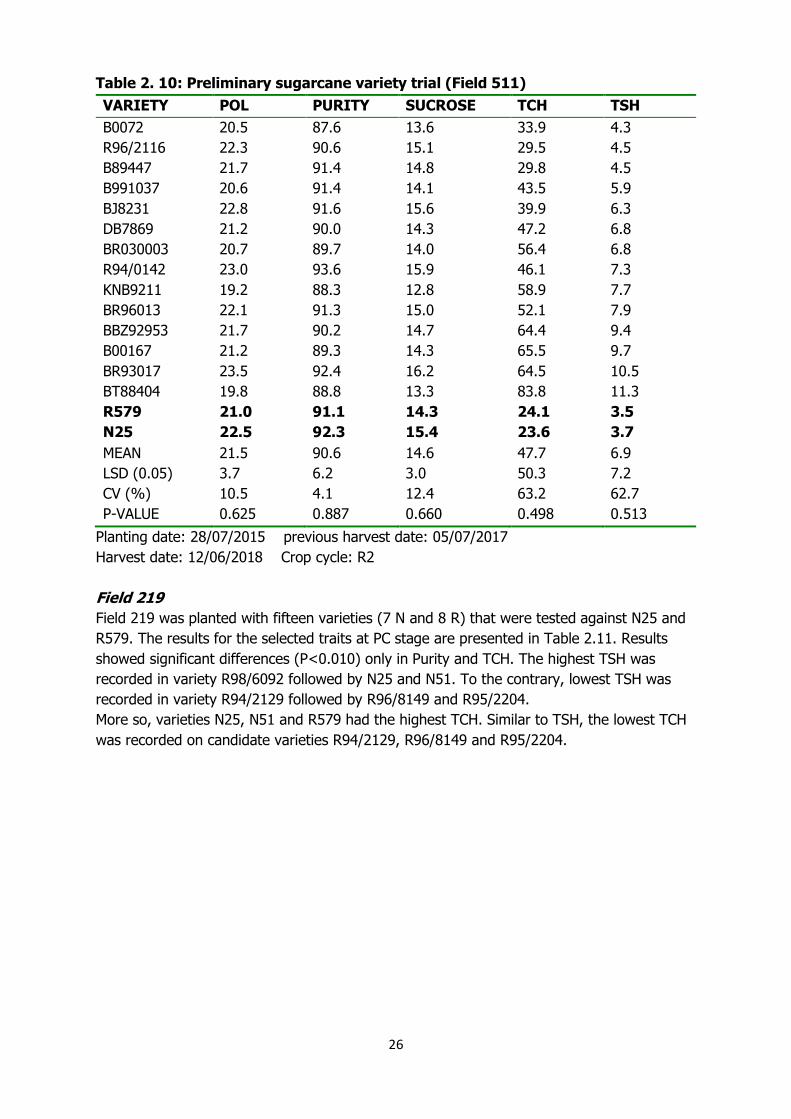
26
Table 2. 10: Preliminary sugarcane variety trial (Field 511)
VARIETY POL PURITY SUCROSE TCH TSH
B0072 20.5 87.6 13.6 33.9 4.3
R96/2116 22.3 90.6 15.1 29.5 4.5
B89447 21.7 91.4 14.8 29.8 4.5
B991037 20.6 91.4 14.1 43.5 5.9
BJ8231 22.8 91.6 15.6 39.9 6.3
DB7869 21.2 90.0 14.3 47.2 6.8
BR030003 20.7 89.7 14.0 56.4 6.8
R94/0142 23.0 93.6 15.9 46.1 7.3
KNB9211 19.2 88.3 12.8 58.9 7.7
BR96013 22.1 91.3 15.0 52.1 7.9
BBZ92953 21.7 90.2 14.7 64.4 9.4
B00167 21.2 89.3 14.3 65.5 9.7
BR93017 23.5 92.4 16.2 64.5 10.5
BT88404 19.8 88.8 13.3 83.8 11.3
R579 21.0 91.1 14.3 24.1 3.5
N25 22.5 92.3 15.4 23.6 3.7
MEAN 21.5 90.6 14.6 47.7 6.9
LSD (0.05) 3.7 6.2 3.0 50.3 7.2
CV (%) 10.5 4.1 12.4 63.2 62.7
P-VALUE 0.625 0.887 0.660 0.498 0.513
Planting date: 28/07/2015 previous harvest date: 05/07/2017
Harvest date: 12/06/2018 Crop cycle: R2
Field 219
Field 219 was planted with fifteen varieties (7 N and 8 R) that were tested against N25 and
R579. The results for the selected traits at PC stage are presented in Table 2.11. Results
showed significant differences (P<0.010) only in Purity and TCH. The highest TSH was
recorded in variety R98/6092 followed by N25 and N51. To the contrary, lowest TSH was
recorded in variety R94/2129 followed by R96/8149 and R95/2204.
More so, varieties N25, N51 and R579 had the highest TCH. Similar to TSH, the lowest TCH
was recorded on candidate varieties R94/2129, R96/8149 and R95/2204.

27
Table 2. 11: Preliminary sugarcane variety trial (Field 219)
VARIETY POL PURITY SUCROSE TCH TSH
R94/2129 13.9 77.9 10.0 68.3 6.8
R96/8149 14.1 76.7 10.0 71.7 7.1
R95/2204 14.1 77.6 10.1 80.2 8.1
N52 13.6 75.9 9.5 97.4 9.2
N50 14.5 76.2 10.1 92.8 9.4
R99/4065 13.4 78.3 9.7 98.0 9.5
R98/2431 14.5 76.5 9.8 99.4 9.8
N53 12.8 72.6 8.5 116.1 9.8
N29 13.9 75.5 9.7 103.1 9.9
N38 13.8 75.5 9.8 102.6 10.1
R96/2454 13.5 77.7 9.7 108.9 10.6
R97/2168 14.2 75.3 9.8 110.0 10.8
N43 14.5 76.3 10.1 108.0 10.9
N51 13.3 77.7 9.6 121.1 11.3
R98/6092 13.8 77.8 9.9 118.5 11.7
N25 13.4 76.2 9.3 122.0 11.4
R579 13.3 73.7 8.9 120.6 10.7
MEAN 13.8 76.3 9.7 102.3 9.8
LSD (0.05) 1.1 2.7 1.1 29.8 2.9
CV (%) 4.9 2.1 6.8 17.5 17.9
P-VALUE 0.150 0.010 0.240 0.010 0.060
Planting date: 27/11/2017 previous harvest date: NONE
Harvest date: 16/10/2018 Crop cycle: PC
Field 332
Table 2.12 summarizes performance of 10 R varieties and tested against N25 and R579 in
field 332 at PC stage. Results for the selected parameters showed significant differences (P
< 0.001) only in TCH. The highest TCH was recorded in variety R97/6177 followed by
R99/4064 and N25. However, on comparative terms, varieties R99/4064, R97/6177 and N25
had the highest TSH and varieties R99/4065, R95/2202 and R98/8115 had the lowest TSH.
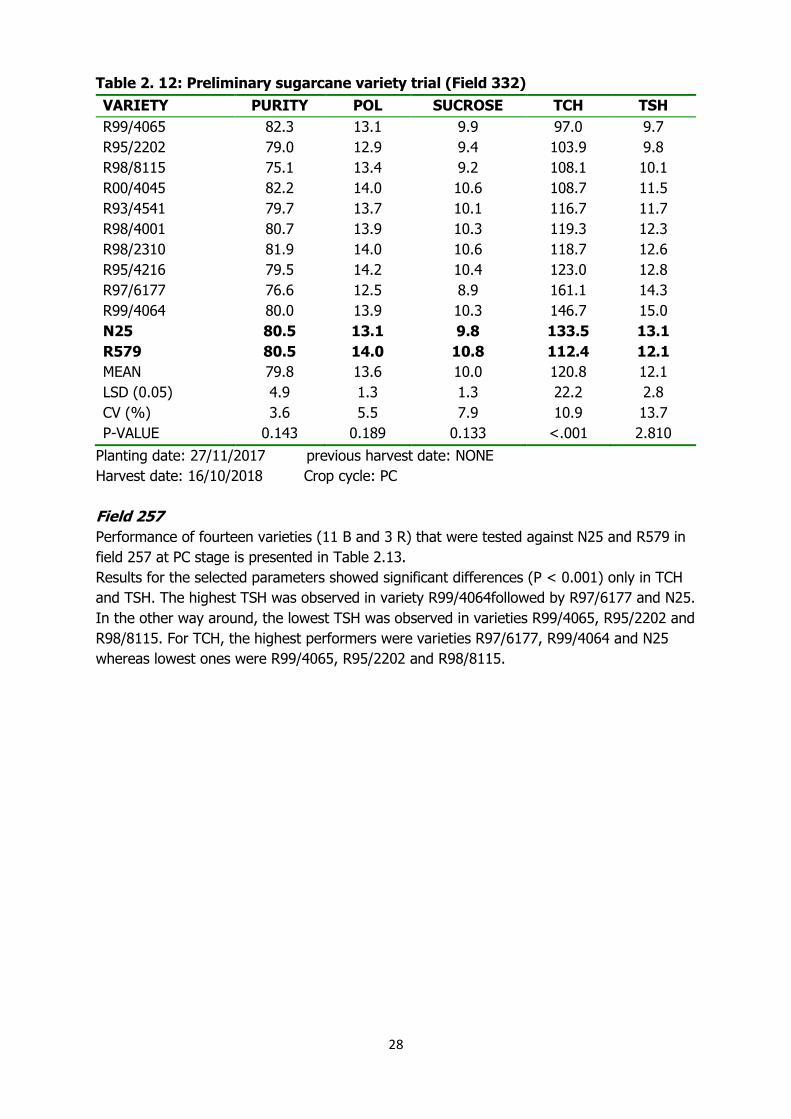
28
Table 2. 12: Preliminary sugarcane variety trial (Field 332)
VARIETY PURITY POL SUCROSE TCH TSH
R99/4065 82.3 13.1 9.9 97.0 9.7
R95/2202 79.0 12.9 9.4 103.9 9.8
R98/8115 75.1 13.4 9.2 108.1 10.1
R00/4045 82.2 14.0 10.6 108.7 11.5
R93/4541 79.7 13.7 10.1 116.7 11.7
R98/4001 80.7 13.9 10.3 119.3 12.3
R98/2310 81.9 14.0 10.6 118.7 12.6
R95/4216 79.5 14.2 10.4 123.0 12.8
R97/6177 76.6 12.5 8.9 161.1 14.3
R99/4064 80.0 13.9 10.3 146.7 15.0
N25 80.5 13.1 9.8 133.5 13.1
R579 80.5 14.0 10.8 112.4 12.1
MEAN 79.8 13.6 10.0 120.8 12.1
LSD (0.05) 4.9 1.3 1.3 22.2 2.8
CV (%) 3.6 5.5 7.9 10.9 13.7
P-VALUE 0.143 0.189 0.133 <.001 2.810
Planting date: 27/11/2017 previous harvest date: NONE
Harvest date: 16/10/2018 Crop cycle: PC
Field 257
Performance of fourteen varieties (11 B and 3 R) that were tested against N25 and R579 in
field 257 at PC stage is presented in Table 2.13.
Results for the selected parameters showed significant differences (P < 0.001) only in TCH
and TSH. The highest TSH was observed in variety R99/4064followed by R97/6177 and N25.
In the other way around, the lowest TSH was observed in varieties R99/4065, R95/2202 and
R98/8115. For TCH, the highest performers were varieties R97/6177, R99/4064 and N25
whereas lowest ones were R99/4065, R95/2202 and R98/8115.

29
Table 2. 13: Preliminary sugarcane variety trial (Field 257)
VARIETY POL PURITY SUCROSE TCH TSH
BR021002 23.1 93.6 15.8 7.3 1.1
BR00010 22.6 90.6 15.4 19.1 2.9
BBZ951034 20.8 89.5 14.0 28.2 3.8
R98/4162 21.3 90.2 14.4 28.1 4.0
DB94177 21.5 88.9 14.5 29.1 4.3
B00713 21.0 90.8 14.3 30.8 4.5
KNB9252 22.4 91.3 15.3 31.5 4.8
BR08004 21.1 90.7 14.3 37.9 5.6
R94/2129 22.2 91.6 15.2 35.9 5.7
B991110 18.1 85.6 11.9 59.4 7.2
BBZ8257 22.0 92.7 15.4 50.9 7.8
R96/8299 22.6 90.6 15.4 69.6 10.6
B99907 22.5 92.5 15.5 77.1 11.9
BJ8897 21.2 89.1 14.3 87.5 12.1
R579 20.8 91.3 14.2 64.2 9.0
N25 20.2 90.2 13.7 106.6 14.6
MEAN 21.5 90.6 14.6 47.7 6.9
LSD (0.05) 3.7 6.0 3.0 25.9 4.0
CV (%) 10.3 4.0 12.2 32.5 35.1
P-VALUE 0.568 0.699 0.591 <.001 <.001
Planting date: 06/08/2018 previous harvest date: 16/08/2017
Harvest date: 31/08/2018 Crop cycle: R2
Kilombero Sugar Company (KSC) - Rainfed variety trials
Variety trials were established at KSC estate to test performance of candidate varieties
under rainfed conditions. The varieties tested included R 570, R 581, R 583, R 92/4246,
N12, N47, TZ93-KA-120 and TZ93-KA-122. They were evaluated against NCo376.
Field 103
The means for parameters studied are presented in Table 2.14. Results for R2 indicated no
significant differences for all parameters except purity at (P<0.05). In general, varieties
R570, R583 and TZ93-KA-122 had the highest TCH and TSH while varieties with lowest TCH
and TSH were R92/4246, R581and NCo376.

30
Table 2. 14: Preliminary sugarcane variety trial (Field 103)
VARIETY POL PURITY SUCROSE TCH TSH
R92/4246 14.72 80.1 10.9 51.8 5.6
R581 14.29 74.9 10.0 63.6 6.3
N47 15.49 79.4 11.2 82.9 9.2
TZ93KA-122 15.05 81.6 11.3 89.9 10.1
N12 15.07 79.1 11.0 95.0 10.3
TZ93KA-120 15.14 80.6 11.1 95.3 10.6
R583 15.15 76.4 10.4 108.9 11.3
R570 14.78 79.4 10.8 109.3 11.8
NCo376 15.03 78.8 10.9 66.9 7.3
MEAN 14.97 78.9 10.8 84.8 9.2
LSD (0.05) 0.9 3.0 0.9 41.9 4.4
CV (%) 4 2.6 5.6 33.9 33.0
P-VALUE 0.316 0.003 0.101 0.092 0.066
Planting date: 30/12/2015 previous harvest date: 12/10/2017
Harvest date: 08/11/2018 Crop cycle: R2
Field 124
Eight varieties (2 TZ, 4 R and 2 N) were planted in field 124 and evaluated against NCo376.
The means for parameters studied are shown in Table 2.15. Results showed no significant
differences (P<0.05) among tested varieties for all parameters. Nonetheless, varieties
R94/6113, TZ93-KA-120 and N12 had the highest TCH and TSH. Contrarily, the lowest TCH
and TSH were recorded in varieties R570, N47and R 581.
Table 2. 15: Preliminary sugarcane variety trial (Field 124)
VARIETY POL PURITY SUCROSE TCH TSH
R570 7.5 38.9 5.4 29.5 3.2
N47 7.8 38.5 5.5 30.0 3.3
R581 10.9 58.0 7.6 37.8 3.7
TZ93-KA122 7.4 40.4 5.5 40.4 4.4
R583 7.7 39.3 5.6 48.2 5.4
N12 7.6 39.5 5.6 50.4 5.6
TZ93-KA120 11.3 59.8 8.3 51.3 5.7
R94/6113 11.0 58.1 7.8 72.0 7.5
NCo376 11.3 59.1 8.2 49.2 5.4
MEAN 8.9 46.5 6.4 44.9 4.9
LSD (0.05) 11.8 61.0 8.5 72.9 8.0
CV (%) 87.9 87.2 88.0 110.0 110.8
P-VALUE 0.986 0.978 0.987 0.969 0.973
Planting date: 16/12/2014 previous harvest date: 9/10/2017
Harvest date: 27/11/2018 Crop cycle: R3

31
Field 622
The means for traits studied in this field 622 are presented in Table 2.16. Results in R2 did
not show significant differences (P>0.05) in selected parameters among tested varieties.
Nevertheless, the highest TSH was recorded in control variety NCo376 followed by TZ93KA-
120 and R581. Conversely the lowest TSH was observed in TZ93-KA-122, R 92/4246 and
R570.
In terms of TCH, the highest TCH was also recorded in control variety NCo376 followed by
R583 and R581. The lowest TCH was observed in TZ93-KA-122 followed by R 92/4246 and
N47.
Table 2. 16: Preliminary sugarcane variety trial (Field 622)
VARIETY POL PURITY SUCROSE TCH TSH
TZ93KA-122 14.9 90.0 12.4 26.7 3.3
R92/4246 14.4 88.3 11.8 31.1 3.7
R570 14.7 86.7 11.8 33.9 4.0
N47 15.0 88.7 12.3 32.9 4.1
N12 15.1 88.0 12.3 33.9 4.1
R583 14.6 87.0 11.7 39.4 4.6
R581 14.8 88.9 12.2 38.1 4.6
TZ93KA-120 15.2 88.6 12.5 37.2 4.7
NCo376 14.9 90.4 12.4 39.6 4.9
MEAN 14.8 88.5 12.1 34.8 4.2
LSD (0.05) 0.6 4.5 0.9 8.6 1.1
CV (%) 2.7 3.5 4.9 16.9 18.4
P-VALUE 0.166 0.750 0.451 0.073 0.114
Planting date: 06/12/2015 previous harvest date: 17/01/2018
Harvest date: 19/12/2018 Crop cycle: R2
Field 670
Field 670 was planted with nine varieties (2 N, 5 R and 2 TZ) that were tested against
NCo376. The results for the traits measured are presented in Table 2.17. Results showed
significant differences only in POL (P = 0.008), TCH (P<0.001) and TSH (P = 0.001) for
varieties tested. The highest TSH was recorded in variety R 94/6113 followed by TZ93KA-
120 and NCo376. To the contrary, the lowest TSH was recorded in TZ93-KA-122, N47 and
R92/4246.
On the other hand, highest TCH was observed in variety R 94/6113 followed by TZ93KA-120
and R581 and the lowest was observed in TZ93-KA-122, N47 and N12.

32
Table 2. 17: Preliminary sugarcane variety trial (Field 670)
VARIETY POL PURITY SUCROSE TCH TSH
TZ93KA-122 15.2 79.8 11.2 32.5 3.6
N47 15.5 81.1 11.6 34.4 4.0
R92/4246 14.7 80.6 10.9 37.8 4.1
N12 15.4 79.0 11.2 37.5 4.2
R570 15.5 79.0 11.0 39.4 4.4
R583 15.2 78.3 11.1 41.2 4.6
R581 15.3 78.3 11.0 42.8 4.7
TZ93KA-120 15.5 79.3 11.3 49.0 5.6
R94/6113 15.0 78.2 10.7 67.2 7.2
NCo376 15.2 78.1 11.1 42.6 4.8
MEAN 15.3 79.2 11.1 42.5 4.7
LSD (0.05) 0.4 2.4 0.6 12.9 1.4
CV (%) 1.8 2.1 3.8 21.0 20.8
P-VALUE 0.008 0.151 0.302 <.001 0.001
Planting date: 27/09/2016 previous harvest date: 11/11/2017
Harvest date: 21/11/2018 Crop cycle: R1
Field 692
Field 692 was planted with thirteen varieties (1 N, 1 Q, 2 TZ and 9 R) that were tested
against NCo376. The results for the selected traits at PC stage are presented in Table 2.18.
Results showed significant differences only in purity (P = 0.031), TCH (P = 0.008) and TSH
(P = 0.023). The highest TSH was recorded on variety N47 followed by R94/6113 and the
check variety NCo376. To the contrary, lowest TSH was recorded in variety R94/2129
followed by R96/8149 and R95/2204.
Further, varieties N47, R97/4004 and TZ93-KA120 had the highest TCH. Oppositely lowest
TCH was observed in variety R92/4246 followed by R97/4029 and R98/4162.

33
Table 2. 18: Preliminary sugarcane variety trial (Field 692)
VARIETY POL PURITY SUCROSE TCH TSH
R98/4162 14.5 80.0 10.7 75.2 8.1
R97/4029 14.2 77.0 10.1 85.6 8.6
R92/4246 14.4 77.8 10.3 90.9 9.3
Q99 15.0 77.0 10.6 94.6 10.0
R583 14.6 79.1 10.7 98.3 10.5
R95/4065(R586) 15.2 77.9 10.9 97.0 10.6
R570 14.7 75.2 10.2 110.6 11.3
R581 15.0 77.2 10.6 106.9 11.3
TZ93-KA120 14.6 76.0 10.1 112.0 11.4
TZ93-KA122 14.7 76.5 10.8 107.8 11.6
R97/4004 14.1 74.6 9.9 118.1 11.7
R94/6113 14.9 80.4 11.1 111.3 12.4
N47 15.0 77.5 10.5 120.6 12.7
NCo376 15.2 78.8 11.0 110.9 12.2
MEAN 14.7 77.5 10.5 102.8 10.9
LSD (0.05) 0.7 3.2 0.9 21.6 2.6
CV (%) 2.9 2.5 5.2 12.5 14.1
P-VALUE 0.058 0.031 0.228 0.008 0.023
Planting date: 06/09/2017 previous harvest date: NONE
Harvest date: 12/10/2018 Crop cycle: PC
Field 664
Field 664 was planted with eight varieties (2 N, 2 TZ and 4 R) that were tested against
NCo376. The results for the selected traits at PC stage are shown in Table 2.19. Among the
quality parameters with significant differences exhibited in pol (P = 0.009). The highest TSH
was recorded on varieties R92/4246, TZ93-KA122 and R583 whereas lowest value on R570,
N41 and N47. Correspondingly, varieties R92/4246, R583 and TZ93-KA120 had highest TCH
while the lowest TCH was on varieties R570, N41 and N47.

34
Table 2. 19: Preliminary sugarcane variety trial (Field 664)
VARIETY POL PURITY SUCROSE TCH TSH
R570 16.0 86.5 12.2 31.0 3.7
N41 15.2 89.2 13.2 31.9 4.3
N47 20.1 90.3 13.6 39.0 5.3
R581 16.4 86.3 12.3 51.4 6.4
TZ93-KA120 18.4 87.5 12.5 51.7 6.4
R583 17.8 87.9 12.3 52.1 6.6
TZ93-KA122 17.0 90.0 13.2 50.2 6.7
R92/4246 16.8 87.0 12.7 60.7 7.9
NCo376 15.8 88.1 12.1 46.2 5.7
MEAN 17.1 88.1 12.7 46.0 5.9
LSD (0.05) 2.4 3.8 1.8 20.1 2.7
CV (%) 9.7 2.9 9.5 30.0 31.6
P-VALUE 0.009 0.303 0.626 0.075 0.105
Planting date: 29/12/2017 previous harvest date: NONE
Harvest date: 14/01/2019 Crop cycle: PC
Tanganyika Planting Company (TPC) - Irrigated variety trials
Field VT31
Twelve varieties (7R and 5CG) were tested against N25 and R 579 in field trial 31 at TPC in
the second ratoon (R2). The information on statistical analysis are presented in Table 2.20.
The results indicates that, statistically, there was a significant differences when you compare
control and test varieties at (P<0.05) The results indicates that, the highest TCH was
recorded in control varieties N25 and R579 followed by test variety R 94/6113 while the
lowest TCH was recorded in test varieties CG98/32, R 92/4246, 189.9. With respect to TSH,
results indicates that, control variety N25 had the highest TSH followed by test varieties
R580 and R 94/6113 while test varieties CG98/32, R 92/4246, and CG98/46 were found to
have lowest TSH.

35
Table 2. 20: Results for Variety Trial 31 (VT31R2)
Variety Weight Stalks Stalks
Pop Ha
Pol (%) Purity (%) TCH TSH
R579 2292.0 21.5 223454.0 15.2 87.7 318.3 48.3
R580 2019.0 25.1 168697.0 17.7 90.8 280.4 49.5
R581 1752.0 26.8 136316.0 16.7 89.9 243.4 40.6
CG-SP98/12 1736.0 29.0 126231.0 15.8 87.9 241.1 38.1
CG98/10 1658.0 23.1 155141.0 15.3 88.8 230.3 35.2
CG98/32 1173.0 26.7 91656.0 15.3 87.3 162.9 25.0
CG98/46 1368.0 22.6 128591.0 17.7 90.9 189.9 33.5
CG98/47 1535.0 25.9 123603.0 16.4 89.6 213.2 35.1
N25 2367.0 25.6 194123.0 15.7 89.3 328.8 51.2
R 92/4246 1292.0 27.0 99446.0 17.1 90.5 179.4 30.6
R 93/6480 1831.0 25.0 152819.0 17.3 91.3 254.4 43.9
R 94/6113 2290.0 31.5 154710.0 15.2 87.3 318.1 48.5
R 94/6447 1755.0 28.7 127838.0 17.4 91.0 243.8 42.4
R 95/0017 1849.0 29.7 130303.0 14.5 86.5 256.8 36.9
MEAN 1780.0 26.3 143781.0 16.2 89.2 247.2 39.9
LSD (0.05) 283.7 3.6 33615.0 1.4 2.2 39.4 5.9
CV (%) 11.1 9.6 16.3 6.1 1.7 11.1 10.3
P-Value <.001 <.001 <.001 <.001 <.001 <.001 <.001
Date planted: January 16, 2016 Previous harvested: February 9,
2017 Date harvested: July 10, 2018 Age at harvest: 17 Months
Crop cycle: R2
Field VT35
Ten varieties (1B, 1BJ, 1BR, 1CGPS, 2CPCL, 3DB and 1R) were tested against N25 and R579
in field trial 35 of plant cane at TPC. The information on statistical analysis are presented in
(Table 2.21). Statistically, there was significant differences in TCH when you compare
control and test varieties at (P<0.05), except for TSH parameter which indicated no
significant differences (P>0.05) among the control and test varieties. The highest TCH was
recorded in control variety R579 followed by test variety CGPS98-09 and control variety N25
while the lowest TCH was recorded in test varieties DB7869, BJ78100 and CPCL97-0393.
Although, there were no significant differences in TSH parameter among the control and test
varieties, significantly, control varieties R579 and N25 were found to have highest TSH while
test varieties DB7869, BJ78100 and R98/4162 had lowest TSH.

36
Table 2. 21: Results for Plant Cane Variety Trial 35 (VT35PC)
Variety Weight Stalks Stalks
Pop Ha
Pol
(%)
Purity
(%)
TCH TSH
R579 1530.0 26.6 121437.0 15.4 86.8 212.5 32.7
B991037 1139.0 27.5 86421.0 16.1 83.8 158.2 25.7
BJ78100 998.0 20.7 101228.0 15.7 86.4 138.6 21.7
BR93017 1304.0 26.4 103308.0 13.8 86.4 181.1 24.9
CGPS98-09 1418.0 19.7 153379.0 15.8 85.7 197.0 31.2
CPCL00-6131 1169.0 21.5 114891.0 17.7 90.8 162.4 29.1
CPCL97-0393 1015.0 17.2 126591.0 17.9 91.5 140.9 25.3
DB7869 937.0 24.9 78158.0 15.8 87.2 130.2 20.7
DB9436 1134.0 24.9 95490.0 15.9 87.4 157.4 24.9
DB9526 1317.0 30.8 89441.0 14.9 89.4 182.9 27.1
N25 1384.0 21.8 133770.0 16.6 90.8 192.3 32.1
R98/4162 1089.0 20.4 111276.0 15.8 87.5 151.3 23.9
MEAN 1203.0 23.5 109616.0 15.9 87.8 167.1 26.6
LSD (0.05) 318.5 4.2 34320.3 2.2 7.0 44.2 8.2
CV (%) 18.4 12.5 21.8 9.6 5.6 18.4 21.3
P-Value 0.01 <.001 0.004 0.044 0.532 0.010 0.073
Date planted: July 21, 2017 Date harvested: August 10, 2018
Age at harvest: 12.7 Months Crop cycle: in PC
Field VT37
Ten varieties (1B, 1BJ, 1BR, 1CGPS, 2CPCL, 3DB, 1R) were tested against N25 and R579 in
field trial 37 of plant cane at TPC. The information on statistical data analysis are presented
in (Table 2.22). The results indicates that, statistically, there was significant differences in
TCH among of the control and test varieties at (P<0.05) while TSH indicated no significant
differences among the control and test varieties. The highest TCH was recorded in control
variety R579 followed by test variety CGPS98-09 and control variety N25 while the lowest
TCH was found in test variety DB7869, BJ78100 and CPCL97-0393. Although there was no
significant differences in TSH parameter among the control and test varieties, significantly,
the highest TSH was recorded in control varieties N25 and R579 and test variety CGPS98-09,
while the lowest was recorded in DB7869, BJ78100, and R 98/4162.

37
Table 2.22: Results for Plant Cane Variety Trial 37 (VT37PC)
Variety Weight Stalks Stalks
Pop Ha
Pol
(%)
Purity
(%)
TCH TSH
R579 1530.0 26.6 121437.0 15.4 86.8 212.5 32.7
B991037 1139.0 27.5 86421.0 16.1 83.8 158.2 25.7
BJ78100 998.0 20.7 101228.0 15.7 86.4 138.6 21.7
BR 93017 1304.0 26.4 103308.0 13.8 86.4 181.1 24.9
CGPS98-09 1418.0 19.7 153379.0 15.8 85.7 197.0 31.2
CPCL00-6131 1169.0 21.5 114891.0 17.7 90.8 162.4 29.1
CPCL97-0393 1015.0 17.2 126591.0 17.9 91.5 140.9 25.3
DB7869 937.0 24.9 78158.0 15.8 87.2 130.2 20.7
DB9436 1134.0 24.9 95490.0 15.9 87.4 157.4 24.9
DB9526 1317.0 30.8 89441.0 14.9 89.4 182.9 27.1
N25 1384.0 21.8 133770.0 16.6 90.8 192.3 32.1
R 98/4162 1089.0 20.4 111276.0 15.8 87.5 151.3 23.9
MEAN 1203.0 23.5 109616.0 15.9 87.8 167.1 26.6
LSD (0.05) 318.5 4.2 34320.3 2.2 7.0 44.2 8.2
CV (%) 18.4 12.5 21.8 9.6 5.6 18.4 21.3
P-Value 0.01 <.001 0.004 0.044 0.532 0.01 0.073
Date planted: February 21, 2018 Harvest date: February 16, 2019
Kagera Sugar Ltd (KSL) - Irrigated variety trials
Four irrigated variety trials testing varieties MN1, R 579, R 92/6545, N41, N47, N49, R 570,
N19, N25 and Co617 were harvested at KSL. While one variety trial was in plant cane, two
trials were in first ratoon and one trial was in second ratoon. The data from harvested trials
showed varieties MN1, R92/6565, N47 and N49 to be promising similar to N25.
Field GP6D Ten varieties (6N and R) were evaluated against N19, N25 and Co617. The trial was in second ratoon at KSL. There were highly significant differences (P<0.05) among the candidate varieties for all traits measured. However, with regards to TCH the highest performance was observed in MN1, followed by N47 and N12 (Table 2.23). On the other hand, varieties R 570 and N39 performed lower similar to control variety N25 and Co617.

38
Table 2. 23: Preliminary sugarcane variety trial (Field GP6D)
Varieties Stalk/Ha Stalk height (Cm) Brix % TCH
Co617 181342.0 227.6 21.5 114.3
MN1 166008.0 213.9 21.6 165.3
N12 153341.0 222.8 22.5 141.8
N19 146007.0 209.1 23.0 134.4
N25 139340.0 208.4 22.5 136.3
N39 162008.0 176.7 22.5 101.4
N41 140674.0 216.4 23.5 123.5
N47 140007.0 237.2 23.0 151.7
N49 143340.0 226.8 22.8 123.6
R570 147341.0 203.9 22.3 105.1
MEAN 151941.0 214.3 22.5 129.8
LSD (0.05) 35250.0 21.1 0.7 33.3
CV (%) 18.1 7.7 2.5 20.0
P-Value 0.287 0.001 0.001 0.008
Growth start date: 26/10/2017 Harvest date: 15/01/2019
Age at harvest: 14.7 Months Crop cycle: R2 With regard to stalk population, Test varieties did not differed significantly.
Field TP8a
Seven varieties (4N and 3R) were evaluated against N19, N25 and Co617 in field TP8a in
first ratoon for the reported period. There was significant difference (P<0.05) in TCH among
tested varieties. Variety R579 performed better followed by N41 and N49 (Table 2.24).
Conversely, varieties N25 and R570 had lowest yield.
Table 2. 24: Preliminary sugarcane variety trial (Field TP8a)
Varieties Stalks/Ha Stalk height(cm) Brix % TCH
Co617 154674.4 257.7 21.7 125.8
MN1 154674.4 221.5 22.6 138.6
N19 185342.6 239.7 22.4 142.0
N25 130673.2 274.3 21.7 112.0
N41 166675.0 250.0 21.8 163.3
N47 149340.8 245.7 22.7 147.7
N49 160008.0 246.0 22.4 156.9
R570 134673.4 231.7 22.9 116.9
R579 173342.0 257.0 22.0 167.0
R92/6545 164008.2 242.6 22.0 144.5
Mean 157341.0 246.6 22.3 141.5
LSD 57028.0 36.7 1.3 35.2
CV % 28.3 11.6 4.4 19.4
P-Value 0.379 0.267 0.385 0.036
Growth start date: 14/06/2017 Harvest date: 30/08/2018
Age at harvest: 14.5 Months Crop cycle: R1

39
With regards to stalk population, the difference among varieties tested was not statistically
significant (P≤0.05).
Field AP12A Ten varieties (6N and R) were evaluated against N19, N25 and Co617. The trial was in first ratoon for the reported period. There were highly significant differences (P<0.001) among the candidate varieties for all traits measured except TCH. However, with regards to TCH the highest performance was observed in R92/6565, followed by N25 and N47 (Table 2.25). On the other hand, control variety N19 and Co617 performed lower.
Table 2. 25: Preliminary sugarcane variety trial (Field AP12A)
Varieties Stalk/Ha Stalk height (cm) Brix% TCH
Co617 134066.0 114.3 20.1 108.1
MN1 136955.0 73.4 20.5 117.9
N19 143918.0 59.6 21.6 100.4
N25 142881.0 66.0 21.4 131.6
N41 144022.0 72018.5 21.6 119.0
N47 143844.0 126.9 21.6 126.9
N49 144259.0 63801.3 21.6 114.5
R570 144126.0 126.5 21.6 126.5
R579 143311.0 124.6 21.5 124.6
R92/6545 127488.0 135.0 19.1 135.0
MEAN 140487.0 217.7 21.1 120.5
LSD (0.05) 4461.9 24.0 0.7 28.9
CV (%) 2.5 8.6 2.5 18.7
P-Value 0.001 0.001 0.001 0.372
Growth start date: 15/02/2017 Harvest date: 12/03/2018
Age at harvest: 12.8 Months Crop cycle: R1 With regards to stalk population, the difference among varieties tested was highly statistically significant (P<0.001). N49, R570 and N41 had the highest stalk population as opposed to R92/6565 which had the lowest. Field TP13a Nine varieties (6N and R) were evaluated against N19 and N25. The trial was in plant cane for the reported period. There were significant differences (P<0.05) among the candidate varieties for TCH. However, Highest TCH was observed in N25, followed by MN1 and N36 (Table 2.26). On the other hand, varieties N46 and N41 record lowest TCH.

40
Table 2. 26: Preliminary sugarcane variety trial (Field TP13a)
Varieties Stalks/Ha Stalk height Brix % TCH
MN1 140007.0 200.6 19.4 172.5
N19 121673.0 212.8 21.0 156.3
N25 131673.0 207.2 19.8 180.8
N36 123340.0 211.8 21.0 167.9
N41 128340.0 213.6 21.3 136.5
N46 143340.0 199.6 20.5 131.4
N47 131673.0 211.3 20.9 162.9
N49 126673.0 240.1 21.3 152.7
R579 118339.0 216.5 20.2 143.0
MEAN 141744.0 212.6 20.6 156.0
LSD (0.05) 161681.0 24.3 1.0 31.0
CV (%) 7.8 7.8 3.4 13.6
P-Value 0.088 0.088 0.007 0.040
Growth start date: 24/01/2017 Harvest date: 4/01/2018
Age at harvest: 11.3 Months Crop cycle: PC With regards to stalk population, the difference among varieties tested was not statistically significant (P ≤ 0.05).
Kagera Sugar Ltd (KSL) - Rainfed variety trials
Results of two rainfed trials (PC and first ratoon) established at KSL in 2019 are reported.
The varieties evaluated include N12, MN1, N41, N47, R 570 and the check Co617. Varieties
were tested in different field (IR4E & LR6a).
Field IR4E
Five varieties (4N and R) were evaluated against Co617 in field IR4E in first ratoon in the
reported period. Results indicated no significant differences (P<0.05) among the tested
varieties in TCH. However, Variety N47, followed by MN1 had the highest TCH (Table 2.27).
Alternatively, R 570 and Co617 performed least. With regard to Stalk population test
varieties also did not differed significantly (P=0.11).
Table 2. 27: Preliminary sugarcane variety trial (IR4E)
Varieties Stalk/Ha Stalk height(cm) Brix % TCH
Co617 177342.0 215.7 21.8 95.8
MN1 217344.0 184.0 21.9 110.5
N12 184009.0 186.6 21.7 103.5
N41 188009.0 207.2 21.9 105.6
N47 161341.0 212.0 21.8 117.7
R570 182676.0 193.3 22.0 88.3
MEAN 145588.0 199.8 21.8 103.6
LSD (0.05) 1354.9 28.5 0.2 23.0
CV (%) 0.7 10.8 0.7 16.9
P-Value 0.110 0.124 0.110 0.160
Growth start date: 22/02/2017 Harvest date: 28/06/2018
Age at harvest: 16.2 Months Crop cycle: R1

41
Field LR6a
Five varieties (4N and R) were evaluated against Co617 in field LR6a in plant cane. Results
indicated significant differences (P<0.05) among the tested varieties. However, Variety MN1
performed better (TCH) compared to other varieties followed by Co617 and N41 (Table
2.28). Alternatively, N12, R 570 and N47 performed least.
Table 2. 28: Preliminary sugarcane variety trial (LR6a)
Variety Stalks/Ha Stalk height (cm) Brix % TCH
Co617 145341.0 232.5 19.7 108.6
MN1 122673.0 227.7 21.0 117.3
N12 124006.0 211.0 20.8 56.2
N41 133340.0 195.9 21.5 89.6
N47 144007.0 191.8 21.3 81.0
R570 130673.0 172.7 20.9 72.5
MEAN 139029.0 205.3 20.9 87.5
LSD (0.05) 5273.8 50.2 0.8 33.8
CV (%) 2.9 18.5 2.9 29.2
P-Value 0.002 0.158 0.002 0.012
Growth start date: 8/10/2016 Harvest date: 16/12/2018
Age at harvest: 14.3 Months Crop cycle: PC
Regarding stalk population, the highest was recorded in Co617 followed by N47. On the
other hand the lowest stalk population was observed in N12 and MN1. Alternative, varieties
did not differ significantly in stalk population test.
Mtibwa Sugar Estate (MSE) – Rainfed variety trials
Two variety trials at MSE (Field 3Ba and D8) were harvested in 2018/19 season in plant
cane stage under rainfed condition. Thirteen varieties (8R, 2 CPCL, 2 TZ and 1N) and
NCo376 as check were evaluated.
Field 3Ba
Twelve varieties were tested in field 3Ba, Results on plant cane indicated there were
significant differences (P < 0.05) in TSH among tested varieties. The varieties R98/8115 and
R 97/6177 scored the highest TSH statistically to control variety, R 00/4055 had the lowest
TSH (Table 2.29).

42
Table 2. 29: Preliminary sugarcane variety trial (3Ba)
Variety POL Purity Sucrose TCH TSH
CPCL02-6848 18.44 84.25 16.82 69.6 11.61
CPCL05-1102 18.89 83.62 17.13 50.2 8.57
N 12 17.51 84.76 16.39 60.2 9.79
NCo376 18.03 85.78 16.83 65.4 11
R570 19.37 84.48 17.55 68.5 12.05
R93/4541 18.48 86.12 17.18 81.2 13.95
R95/4065 17.42 86.4 16.49 65.6 10.98
R96/2281 17.42 83.6 15.93 74.7 11.95
R97/6177 18.06 85.39 16.87 87.5 14.76
R98/4001 16.86 84.19 15.5 61.4 9.75
R98/8115 17.4 85.35 16.27 92.2 15.02
ROO/4055 17.7 84.74 16.34 50.9 8.31
MEAN 17.97 84.89 16.61 68.9 11.48
LSD (0.05) 1.45 3.843 1.429 2120 3.626
CV (%) 5.6 3.1 6 21.4 22
P-Value 0.054 0.902 0.255 0.005 0.005
Growth start date: 06/10/2017 Harvest date: 30/11/2018
Age at harvest: 13.8 Months Crop cycle: PC
Field D8
Five varieties were tested in field D8, Results on plant cane indicated there were highly
significant differences (P< 0.001) among the candidate varieties for all traits measured.
However, with regards to TSH the highest score was observed in N12 which had the highest
TSH statistically to control variety, TZ93-KA-120 had the lowest TSH (Table 2.30).
Table 2. 30: Preliminary sugarcane variety trial (D8)
Variety POL Purity Sucrose TCH TSH
N 12 14.03 66.46 12.72 68 11.45
NCo 376 15.39 62.43 12.7 66.3 8.334
R 570 12.3 54.69 10.1 65.7 6.574
TZ93-KA-120 14.01 66.01 11.85 26.8 3.204
TZ93-KA-122 14.35 69.28 12.88 61.5 7.861
MEAN 14.02 12.03 12.03 57.6
LSD (0.05) 1.299 1.263 1.263 17.52 1.079
CV (%) 6 6.8 6.8 19.7 15.58
P-Value 0.004 0.002 0.002 0.001 <0.001
Growth start date: 24/11/2017 Harvest date: 1/09/2018
Age at harvest: 10 Months Crop cycle: PC

43
2.3.4 Discussion
Kilombero Sugar Company (KSC)
Various sugarcane varieties were evaluated based on respective parameter. Tone cane per
hectare (TCH) and tone sugar per hectare (TSH) are important sugarcane parameters as
they provide an insight toward selecting elite sugarcane variety for commercial purposes.
From the current experimental data at the preliminary stage of evaluation at KSC, there is
an insight that better varieties for both rainfed and irrigated conditions are going to be
identified.
Under irrigation conditions the TCH and TSH ranged from 62.0 - 161.1 and 6.7 - 14.4
respectively. Whereas varieties R98/6092, R99/4064, B001250, Q231, N25 and R96/2569
were the best performers across the trials. In the other way, TCH and TSH under rainfed
condition ranged from 27.0 – 118.1 and 1.0 – 12.7 respectively. The best performers under
rainfed condition were N47, R92/4246, R94/6113, NCo376, R570, BT88404, R94/6113 and
Q219. However, the candidate variety TZ93-KA122 consistently appeared in most
frequencies among the top four in terms of TSH and TCH across the trials. Therefore these
varieties are recommended for further evaluations to check their stability in performance as
most of the trials were at the PC level.
Tanganyika Planting Company (TPC)
Trial 31 was in second ratoon whereby twelve varieties were tested against N25 and R579.
The variety R 94/6113 is promising, had high TCH and TSH. Variety R580 had higher TSH as
compared to control. The promising ratooned varieties are essential commercially for the
development of sugar industry in Tanzania. These findings are in line with Aamer et al.
(2017) who found that, the promising ratoon varieties are considered economical for the
farming communities because production cost is 25 to 30% less than plant crop along with
saving of seed material. TCH and TSH were assessed in other field trials for selecting elite
sugarcane variety. Field trial 35, 36 and 37 some varieties are promising for future benefits.
Varieties N25 and R579 of field trial 35; varieties R 85/1334, N25, and KQ228 of field trial
36; and varieties R579, CGPS98-09, and N25 of field trial 37 are mostly promising in terms
of TCH. The capability of the amount of sugar to be produced by the sugarcane for
commercial purposes and home consumption is determined by TSH. Each trial 35, 36, and
37 was evaluated on TSH. Varieties R579, and N25 of field trial 35; varieties KQ228, CG00-
028, and Q190 of field trial 36; and varieties N25, R579, and CGPS98-09 of field trial 37 are
also promising varieties as they indicates to have valuable amount of sugar in terms of
quantity and quality.
Kagera Sugar Ltd (KSL)
Varieties MN1 and N47 showed superior performance in producing more tonnes caner per
hectare compared to all varieties tested under irrigated regime at KSL in plant cane, first
and second ratoon stages. If trends continue to third ratoon can be recommended for
advance evaluation before commercially released under irrigated regime while R570
struggles in the same condition. Varieties MN1 showed superior performance in producing
more tonnes cane per hectare compared to all varieties tested under rainfed conditions at
KSL in plant cane and first ratoon stages. This suggested it can adapt to moisture stress and

44
hence if trends continue to third ratoon can be recommended for advance evaluation before
commercially released while R570 struggles in the same condition.
Mtibwa Sugar Estate (MSE)
Varieties R98/8115, R97/6177 and N12 proved statistically to produce more tonnes sugar
per hectare compared to other varieties tested in rainfed scheme for this reported period at
MSE in plant cane stage. This suggested they can easily adapt to drought environment and
hence if trends continue can be recommended for advance evaluation before commercially
released. Varieties R00/4055 and TZ 93-KA-120 struggles in the same conditions. Generally,
the yields were encouraging. This could have been attributed by good management such as
weed management and fertilization.
2.4 National Performance Trials Project Codes SCB 2016/05, 2017/4
Principle investigator TOSCI
Collaborators
A. Kachiwile, N. Mwakyusa, G. Mwasinga and R. Mlimi
Sugarcane Estates
Duration 2016/17 - 2021
Project summary
National performance Trials (NPT) are designed to test new plant varieties for performance
compared to varieties currently in the market. Aim is to allow regulatory authority TOSCI to
evaluate before they release as improved varieties. In this work, four varieties which include
rainfed (R 570 & N47) and irrigated (N36 and R 85/1334) varieties were planted in different
sugarcane estates. The trials are in progress for data collection and evaluation.
Key results
Results are in pipeline for data collection
2.4.1 Introduction
National performance Trials (NPT) are designed to test new plant varieties for performance
compared to varieties currently in the market. The trials are done across the country at
specific agro-ecological zones where the full potential of the sugarcane varieties can be
expressed.
NPTs are designed to determine the agronomic potential of a new variety before it is
released for commercialization. Candidate varieties are planted alongside existing varieties
(checks) and performance gauged to ensure only superior varieties are released.
Tanzania Official Seed Certification Institute (TOSCI) is mandated to monitor and evaluate
these trials in collaboration with TARI Kibaha. Candidate varieties are tested for
Distinctiveness, Uniformity and stability (DUS) for a minimum of two seasons. DUS tests are
conducted by TOSCI in selected areas depending on the recommended areas for the variety.
Once the tests are complete, the Variety Release and Seed Certification Committee evaluate
the data in order to make recommendations for release
It is important that a reasonable number of commercial varieties with different genetic
background are deployed to avoid monoculture system which has for many years been the

45
case in the Tanzanian sugar industry. Hence, we found it is important to evaluate varieties
in both irrigated and rainfed condition in various agro-ecologies where sugarcane is grown.
Objective
To verify performances of the new varieties under NPT compared to those currently in the
market, in order to determine their potentiality before commercially released.
Specific Objectives
i. Performance evaluation of new varieties tested under national performing trials with
commercially available varieties in the market
ii. To identify potential new varieties for release at national level
Output achieved
5 National Performance Trials (NPT) established at different sugarcane estates
2.4.2 Materials and Methods
The experiments were laid out under irrigation system in all fields both at TPC and KSC
estates. The experiment details were as hereunder:
Plot size: 10 m x 4 row with a net plot size of 8 m x 2 rows
Treatments: Test varieties N36 and R 85/1334
: Control varieties N19, N25, N30, N41, R 570 and R 579 Design: RCBD at TPC with three replications
A 4 x 4 Triple lattice design at KSC, KSL and MSE
Cultural practices: irrigation, fertilization and weeding as per commercial field
recommendation
Data collected:
cane yield (TCH)
sugar yield (TSH)
sucrose %
reaction to insect and diseases
2.5 Advanced Sugarcane Fuzz Evaluation and Selection Project Code SCB 2017/06
Principle investigator Kachiwile, N. Mwakyusa, R. Mlimi, G. Mwasinga
Location TARI-Ifakara and Sugarcane Estates
Duration 2017/18 - 2021
Project summary
The sugarcane varieties genetic makeup varying in traits expressing desirable characteristics
in different environmental conditions. The trait influences selection of variety which can be
used as a superior variety for commercialization. The project intend to contribute on
sugarcane productivity through improved sugarcane varieties with genetic variability for
commercialization in Tanzania. The project imported a total of 31 new/promising clones of
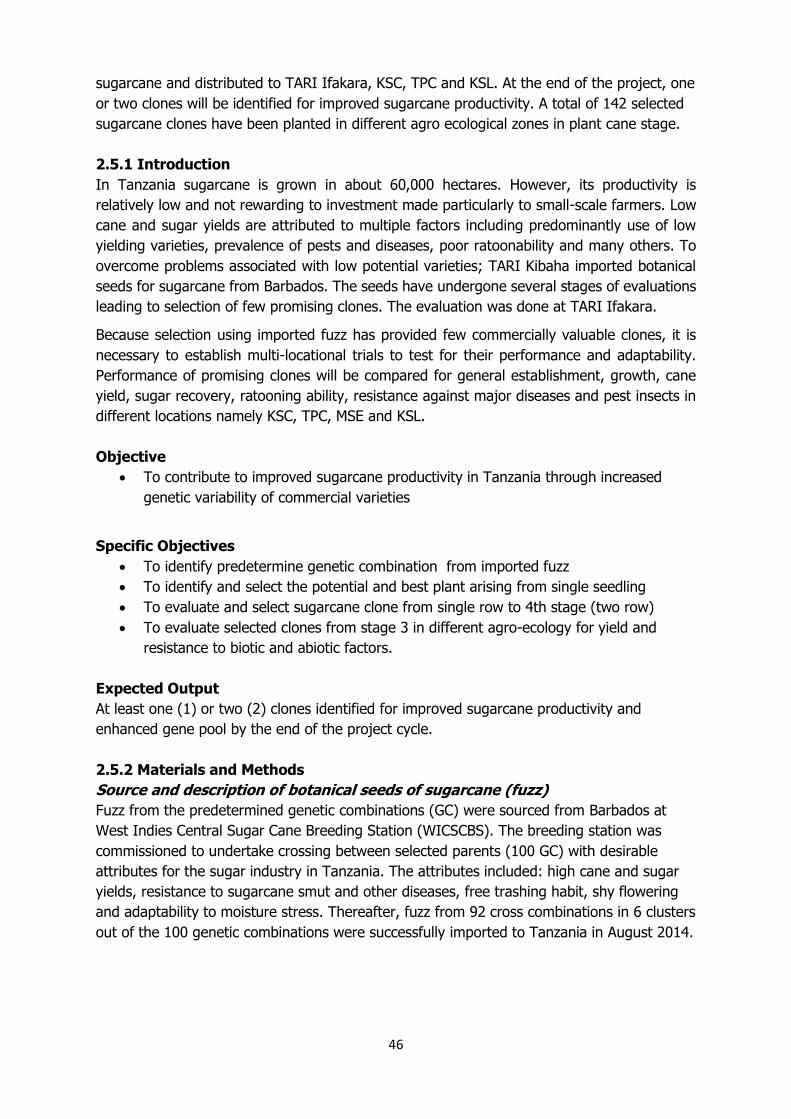
46
sugarcane and distributed to TARI Ifakara, KSC, TPC and KSL. At the end of the project, one
or two clones will be identified for improved sugarcane productivity. A total of 142 selected
sugarcane clones have been planted in different agro ecological zones in plant cane stage.
2.5.1 Introduction
In Tanzania sugarcane is grown in about 60,000 hectares. However, its productivity is
relatively low and not rewarding to investment made particularly to small-scale farmers. Low
cane and sugar yields are attributed to multiple factors including predominantly use of low
yielding varieties, prevalence of pests and diseases, poor ratoonability and many others. To
overcome problems associated with low potential varieties; TARI Kibaha imported botanical
seeds for sugarcane from Barbados. The seeds have undergone several stages of evaluations
leading to selection of few promising clones. The evaluation was done at TARI Ifakara.
Because selection using imported fuzz has provided few commercially valuable clones, it is
necessary to establish multi-locational trials to test for their performance and adaptability.
Performance of promising clones will be compared for general establishment, growth, cane
yield, sugar recovery, ratooning ability, resistance against major diseases and pest insects in
different locations namely KSC, TPC, MSE and KSL.
Objective
To contribute to improved sugarcane productivity in Tanzania through increased
genetic variability of commercial varieties
Specific Objectives
To identify predetermine genetic combination from imported fuzz
To identify and select the potential and best plant arising from single seedling
To evaluate and select sugarcane clone from single row to 4th stage (two row)
To evaluate selected clones from stage 3 in different agro-ecology for yield and
resistance to biotic and abiotic factors.
Expected Output
At least one (1) or two (2) clones identified for improved sugarcane productivity and
enhanced gene pool by the end of the project cycle.
2.5.2 Materials and Methods
Source and description of botanical seeds of sugarcane (fuzz)
Fuzz from the predetermined genetic combinations (GC) were sourced from Barbados at
West Indies Central Sugar Cane Breeding Station (WICSCBS). The breeding station was
commissioned to undertake crossing between selected parents (100 GC) with desirable
attributes for the sugar industry in Tanzania. The attributes included: high cane and sugar
yields, resistance to sugarcane smut and other diseases, free trashing habit, shy flowering
and adaptability to moisture stress. Thereafter, fuzz from 92 cross combinations in 6 clusters
out of the 100 genetic combinations were successfully imported to Tanzania in August 2014.

47
Experimental locations and set ups
Selection criteria of clones
Generally selection of promising clones was based on general appearance (stool
architecture), stalk number/mass as an indicator of potential yield, growth habit (erect
growth), and ability to withstand attack/not to be infested by insect pests and diseases
(absence of smut, white scale and Eldana) and brix content. For brix content, quality
analysis was done by using a brix refractometer on selected clones from stage 3 by brix
reading from at the bottom, middle and top for two stalks per clone.
2.5.3 Results
At stage three of selection, a total of 142 selected sugarcane clones have been planted in
different agro ecological zones in plant cane stage. Distribution is as shown in the table 2.31
below. Evaluation using selection criteria will be done at right growth stage.
Table 2. 31: Sugarcane clones distribution data 2019
Estate/site Clones (#) DOP Rep Status
IFAKARA 31 4 /04/ 2018 3 Very good
TPC 44 17/01/2019 3 20 are promising
KSL 67 15/03/2019 3 NA
2.6 Rapid Seedcane Multiplication (Evaluation of Sugarcane Seed Cane Production Methods)
Project Codes. SCB 2017/07
Principle investigator A. Kachiwile, N. Mwakyusa, R. Mlimi, G.
Mwasinga
Location TARI - Kibaha
Duration 2017/18
Project summary
Sugarcane production in Tanzania is done by large-scale and small-scale farmers. Small-
scale farmers contribute forty percent of total cane crushed per annum. However, their
contribution is likely to decrease due to low productivity caused by several factors including
prevalent of pests and diseases resulting from use of poor quality planting materials. Thus, a
large proportion of the farmers use traditional, poor quality seedcane resulting in poor
yields. A total of 11 sugarcane varieties (NCo376, R579, N41, R570, R575, N25, N30, N19,
N36, N47 and R85/1334) that were sourced from TARI Kibaha were used for rapid seedcane
multiplication. The aim of the project is to increase sugarcane productivity in Tanzania
through improved access and deployment of healthy seed canes. 34,111 seedlings
produced from eleven sugarcane varieties.

48
2.6.1 Introduction
Sugarcane is a perennial crop, as once a new crop is planted it is harvested repeatedly for
up to five seasons or more. Being vegetatively propagated and practice of ratooning which
is necessary for economic optimization, permits systemic pathogens to survive, multiply and
spread from one crop to the next. Also, the perennial nature of the crop and the fact that it
is usually grown as a monoculture favours the build-up of diseases.
A properly designed seed production system is must i.e. a system through which seed borne
diseases are eliminated or its spread is minimized and at the same time quality, vigour and
production potential of a variety could be maintained over a longer period. The benefit of
improved sugarcane varieties cannot be realized until enough healthy seed is produced and
supplied to farmers for growing on large scale (Karuppaiyan & Ram, 2012).
Sugarcane production in Tanzania is done by large-scale and small-scale farmers. Small-
scale farmers contribute forty percent of total cane crushed per annum. However, their
contribution is likely to decrease due to low productivity caused by several factors including
prevalent of pests and diseases resulting from use of poor quality planting materials. Thus, a
large proportion of the farmers use traditional, poor quality seedcane resulting in poor
yields. Moreover, they rely on very old, degenerated and low genetic potential varieties;
namely, NCo376 for KSC and MSE, and Co617 for KSL mill areas (Chambi & Isa, 2010).
These varieties have are susceptible to several diseases including smut. Use of seedcane
from the commercial crop has been responsible for rapid multiplication of a large number of
diseases and pests such as smut, ratoon stunting, stalk borers and white scale which
adversely affect cane yield and quality.
Inadequate availability of quality seedcane, poor seedcane replacement rate and poor
quality canes has adversely contributed to low sugarcane productivity and sugar recovery.
The importance of enhancing smallholder farmers’ access to quality seedcane can play a role
in raising sugarcane productivity. To maximize yield potential for all sugarcane varieties, it is
essential that plantings be made with seedcane that is free of pests and diseases. To
accomplish this, healthy seed-cane nurseries should be established with seedcane of
recommended varieties from a heat treatment program or from seedcane that has been
produced by tissue culture.
Objective
To increased sugarcane productivity in Tanzania through improved access and deployment
of healthy seed canes.
Achieved Output
34,111 seedlings produced from eleven sugarcane varieties.
2.6.2 Materials and Methods
Plant materials
A total of 11 sugarcane varieties (NCo376, R579, N41, R570, R575, N25, N30, N19, N36,
N47 and R85/1334) that were sourced from TARI Kibaha were used for rapid seedcane
multiplication activity that took place at the station from March 12, 2019 to April 11, 2019.

49
Preparation of growth media
A mixture of forest soil, sand and farm yard manure was sterilized 3hours; after cooling the
soil was potted in polythene. For each variety, a single eye bud was planted per polythene
bag of 4 inches polythene bags. Routine irrigation was done. Pesticide (Gladiator) was
applied i.e. 25cc/15L of water to control termites. Sprouting of each variety was recorded
seven days after planting. At four weeks, a compound fertilizer (N17:P17:K17) was applied
at a rate 5g per seedling.
2.6.3 Results
Establishment of the seedlings after planting at TARI Kibaha is as presented in Table 2.32.
The establishment rate ranged from 31.0 to 97.5%. The highest establishment was
observed in variety R570 (97.5%) followed by N19 (93.9%) and NCo376 (89.6%). To the
contrary, the lowest establishment was on varieties N30 (31.0%), N36 (32.2%) and R575
(45.8%).
Table 2. 32: Seedcane establishment from single bud multiplication method at
TARI Kibaha
Variety Stalks
(#)
Buds
planted (#)
Dispositio
n (%)
Established
settlings (#)
Establishment
rate (%)
NCo376 4218.0 29580.0 69.0 26490.0 89.6
R579 172.0 1610.0 3.8 1203.0 74.7
N41 227.0 1280.0 3.0 1020.0 79.7
R570 36.0 200.0 0.5 195.0 97.5
R575 334.0 1836.0 4.3 840.0 45.8
N25 100.0 615.0 1.4 400.0 65.0
N30 247.0 3749.0 8.7 1164.0 31.0
N19 128.0 756.0 1.8 710.0 93.9
N36 71.0 1000.0 2.3 322.0 32.2
N47 140.0 1572.0 3.7 1227.0 78.1
R85/1334 68.0 680.0 1.6 540.0 79.4
Total 5,741 42,878 100 34,111 766.9
2.6.4 Discussion
The differences in establishment among the varieties are thought to be due to their genetic
variations, high genetic variation may promote long-term population persistence by allowing
adaptations to changing environmental conditions (Lavergne and Molofsky, 2007; Bock et
al., 2015) however, further investigations especially for poor performers is paramount.
Recommendations
Other rapid seedcane multiplication techniques such as bud chips and tissue culture need to
be investigated.

50
2.7 Germplasm Conservation and Maintenance (Sugarcane Germplasm Conservation for Sustainable Sugarcane Sector Development)
Project Code. SCB 2017/08
Principle investigator A. Kachiwile, N. Mwakyusa, R. Mlimi and G. Mwasinga
Collaborators Agronomy Section
Location TARI - Kibaha
Duration 2017/18
Project summary
Germplasm conservation conserve the genetic traits of endangered and commercially
valuable species. Such conservation serves as the link between the acquisition and utilization
of plant genetic resources and includes all the means by which plant genetic resource is
stored and preserved. Sugarcane germplasm are concerned for the project. The aim of the
project is establishment and conservation of sugarcane germplasm of both improved and
locally sugarcane varieties. 279 sugarcane imported varieties have been collected from all
sugar estates, while 41 local sugarcane clones have been collected from different sugarcane
growing regions of Tanzania planted and are growing well. A total of 320 sugarcane
varieties have been collected and conserved at TARI Kibaha for future application of
conserved traits.
2.7.1 Introduction
Traditional plant breeding has contributed to crop improvement. Because of the biological
complexities of sugarcane, sexual hybridization strategies have not been very effective in
developing improved cultivars. Nevertheless, successful crop improvement through breeding
relies on diversity of the gene pool; the wide diverse the germplasm collections the more
effective the crop improvement (Withers et al., 1990; Rao, 2004). Hence collection and
conservation of germplasm are prerequisite for assured availability to different users
including plant breeders.
The genetic resources of most crops can be conserved as seeds in seed gene banks;
however, some highly heterozygous and vegetatively crops, and those that produce
recalcitrant seeds cannot (Withers et al., 1990). Conservation serves as the link between the
acquisition and utilization of plant genetic resources and includes all the means by which
plant genetic resource is stored and preserved. There are basically two approaches for plant
genetic resources conservation; namely in field gene bank (in situ) and in vitro (ex situ)
(Engelmann and Engels, 2002; Rao, 2004). While in situ involves maintaining genetic
resources in natural habitats where they occur, ex situ refers to conservation of genetic
resources outside the native habitat (Engelmann and Engels, 2002; Rao, 2004). Therefore,
the objective of this project is to ensure readily availability of genetic resources for future
crop improvement.
Objective
To establish and conserve germplasm collection of improved and locally collected sugarcane
varieties available in Tanzania

51
2.7.2 Materials and methods
A total of 279 sugarcane imported varieties were collected from different estates in Tanzania
41 local sugarcane clones were collected from different sugarcane locality and planted at TARI
Kibaha. Varieties were planted in two-row plot, having a spacing of 1.5m and length of 10m,
each plot was planted with 50 setts.
Output achieved to date
A total of 320 sugarcane varieties collection conserved at TARI Kibaha.
Challenges
The most challenge is availability of irrigation water during the dry seasons. Apart from
stressing the plants also exacerbated the problem of termites.
2.8 References
Aamer, M., Ahmad, R., Anjum, S. A., Hassan, M. U., Rasul, F., Zhiqiang, W., … Guoqin, H.
(2017). Production Potential of Ratoon Crop of Sugarcane Planted under Varying
Planting Dimensions. Academia Journal of Agricultural Research, 5(3), 39–44.
https://doi.org/10.15413/ajar.2017.0110
Allard, R.W. 1960. Principles of plant breeding. John Wiley and sons, Inc. New York (ISBN 0-
471-02315-9)
Bock DG, Caseys C, Cousens RD, et al. 2015. What we still don’t know about invasion
genetics. Molecular Ecology 24: 2277–2297
Caleb. O. O. (2008), evaluation of inoculation techniques and screening markers for smut
resistance in sugarcane
Chambi, J., Issa, D. (2010). Performance Evaluation of Sasri Varieties N19 and N25 in
Tanzania. Proc S Afr Sug Technol Ass, 83: 67–79.
Engelmann, F. and Engels, J.M.M. (2002) Technologies and Strategies for ex Situ
Conservation. In: Brown, A. and Jackson, M., Eds., Managing Plant Genetic
Diversity, CAB International /IPGRI, Wallingford, 89-104.
Engelmann, F., & Engels, J. M. . (2002). Technologies conservation and strategies for ex
situ, 89–104. Retrieved from https://www.researchgate.net/publication/236681594
Gazaffi, R., Oliveira, K. M., Souza, A. P. De, Augusto, A., & Garcia, F. (2014). Sugarcane:
breeding methods and genetic mapping. https://doi.org/10.5151/BlucherOA-
Sugarcane-sugarcanebioethanol.
Karuppaiyan, R., Ram, B. (2012). Sugarcane Seed Production. Sugarcane Breeding
Institute, Regional Centre, Karnal-132 001 (Haryana). Training Manual. SBI
Centenary Publication 5.
Lavergne S, Molofsky J. 2007. Increased genetic variation and evolutionary potential drive
the success of an invasive grass. Proceedings of the National Academy of Sciences
of the United States of America 104: 3883–3888.
Magarey, R. C., Bhuiyan, S., Croft, B. J., Cox, M. B., 2014. Development of smut resistant
varieties and their economic impact on sugarcane production in Australia. Souvenir

52
de Presentation. International Conference IS2014, Green Technologies for
Sustainable Growth of Sugar & Integrated Industries in Developing Countries,
November 25-28, 2014, Nanning P. R. China, IS-2014, 92-93. Msechu, Z.
Rao, N. K. (2004). Plant genetic resources: Advancing conservation and use through
biotechnology. African Journal of Biotechnology, 3(2), 136–145.
Simmonds, N.W. 1978. Principles of Crop Improvement, Longman group, Essex, UK (ISBN
0-582-44630-9)
Singh P., Kumar B., Rani R., Jindal M. M. (2014). Standardization of inoculation technique of
sugarcane smut (Ustilago scitaminea) for evaluation of resistance. Afr. J. Microbiol.
Res. 8 3108–3111. 10.5897/AJMR2014.6996
Withers, L. ., & Engels, J. M. . (1990). The test tube genebank - A safe alternative to field
conservation. International Board for Plant Genetic Resources.
Xing H. Q. (2013). Physiological Index Determination of Sorghum Head Smut Group and
Molecular Markers Analysis of Disease Resistance Genes Master’s Degree thesis,
Shenyang Normal University; Shenyang.

53
3.0 AGRONOMY AND PHYSIOLOGY
3.1 Evaluation of Existing Agronomic Package to Selected Sugarcane Varieties in Outgrowers Fields of Kilombero Sugar Mill Area (Variety trial in OG fields)
Project Code: AP 2013/03/02
Investigators: Kalimba. H. F, L. Lwiza, S. Kajiru and Msita, H. B.
Collaborators: LAO’s, VAEO’s
Date of commencement: 2013/14
Planned end date: On going
Reporting period: 2018/2019
Summary
Sugarcane (Saccharum officinarum L) is an important commercial crop in Tanzania. It is the
main source of sugar produced for domestic consumption and export. The average
sugarcane yield in outgrowers fields has remained low (30-40 tons/ha) below the attainable
yield potential of more than 100 tons/ha. Farmers at Kilombero rely on a single variety
(NCo376) which is highly susceptible to a number of diseases including smut. In order to
recommend new sugarcane varieties for outgrowers under rainfed environment, trials were
established to assess three promising varieties (N47, N12, and R 570) against NCo376.
Preliminary results revealed to have two promising varieties (N47, R 570) which were
selected for further evaluation in large blocks (1 acre for each variety).
3.1.1 Introduction
Sugarcane (Saccharum officinarum L) is an important commercial crop in Tanzania. It is the
main source of sugar produced for domestic consumption and export. In Tanzania its
production is concentrated mainly in three regions of Morogoro, Kagera and Kilimanjaro.
Currently, most sugarcane is grown in estates, owned by the sugar processing factories and
also small scale growers known as outgrowers (OG).
Kilombero mill area have about 8500 active registered OG who supply about 43% of
sugarcane crushed at Kilombero 1 (K1) and Kilombero 2 (K2) factories (SBT, 2017). Average
sugarcane yield in OG fields is about 40 tons/ha (Chongela, 2015). This is low compared to
the attainable yield potential of more than 100 tons/ha (SBT, 2017). According to survey
conducted to small scale sugarcane producers it was observed that lack of improved
varieties was among the major factors contributing to low sugarcane production (Mtunda et
al., 1998). Other factors included low level of field management particularly poor
management of weeds, low level of fertilization and sometimes moisture stress due to
unreliable rainfall. At Kilombero only one variety (NCo376) is grown by outgrowers, this
variety is very susceptible to smut disease. The long existence of NCo376 to outgrowers is
due to fact that most of the new varieties being evaluated do not exhibit wide adaptability
like NCo376. It was therefore important to screen new varieties which are adaptive to
drought and also resistant to smut.
Objective
1. To test new promising varieties with the existing management package under rainfed
condition in OG fields

54
Specific Objectives
1. To test performance of tested varieties on existing management packages
Output achieved to date Two promising varieties for rainfed condition identified
3.1.2 Materials and Methods
Location Kilombero mill area.
During 2013/14 seasons experiment was designed to evaluate sugarcane varieties under
rainfed conditions. Experiments comprised of two phases. During the first phase
experiments were conducted consecutively for four seasons in small replicated trials.
Second phase started in 2017/18 season in which selected varieties were planted in large
blocks trials of one acre for each variety and were compared to NCo376 as a standard check
so as to have viable variety recommendation.
Design 1st Phase experimentation
Experiment comprised of four treatments namely R 570, N12, N47 and NCo376 as a
standard check, designed in Split plots in RCBD with three replications. Main factors were
two management levels (1) The recommended technologies (RT) which was 100 kg N ha-1 +
100 kg K ha-1 +25 kg P ha-1 and 4 lit Volmuron ha-1 (2) Farmers’ practices (FP) which varied
from farmer to farmer but usually averaged to 30 kg of nitrogenous fertilizer without
phosphate and potash. Each variety was tested against the selected management packages
in different sites at K1 and K2. Phosphate and potash fertilizers were applied at planting and
nitrogen was applied two months later.
Plot size Six rows of 10 m long spaced at 1.2 m, comprising two centre rows of test varieties and two
guard rows of NCo376 variety on each side.
2nd Phase experimentation (Large block trials) Large blocks comprising of three acres each, three varieties R 570, N47 and NCo376 were
planted each variety occupying one acre at every location.
Data collected
Data on yields (stalks number, stalks weight, purity % and sucrose %,) were
collected during harvest at the age of 10-12 months
Data analysis Data were subjected to ANOVA using GenStat statistical package version 12, Means were
compared using LSD at P=0.05.

55
3.1.3 Results
2017/18 trials (PC)
Four trials were established in November 2017, at Sonjo, Nyange, Kitete and Mfilisi. Results
are presented in Table 3.1.
Tons of cane per hectare (TCH)
Results presented in Table 3.1 indicated that higher TCH (169.6) was recorded in RT with
variety R 570 at Mfilisi and lowest (54.0) in FP with variety N12 at nyange. Generally in RT
all tested varieties performed above the standard check NCo376. Performance of each
variety differed from one location to another; however R 570 had higher TCH followed by
N12. Standard variety NCo376 was the least compared to all new tested varieties for both
FP and RT.
Table 3. 1 Results of TCH from different varieties grown under two
management practices in OG fields at Kilombero
Nyange Mfilisi Kitete
Varieties FP RT VM FP RT VM FP RT VM
R 570 89.4 101.2 95.3 145.4 169.6 157.5 117.0 166.9 142.0
N12 54.0 93.5 73.7 163.2 173.2 168.2 110.0 140.9 125.4
N47 94.5 88.1 91.3 132.5 166.2 149.3 115.7 107.5 111.6
NCo376 76.2 83.1 79.7 133.6 134.3 133.9 113.0 125.3 119.1
MM 78.5 91.5
143.7 160.8
113.9 135.2
CV % 22.4 22.4 16.6
LSD (0.05) 23.91 42.94 26.06
P(0.05) 0.27 0.39 0.12
Note: FP= Farmers Practice, RT= Recommended Technology, VM= Variety Mean,
MM=Management Mean
Tons of Sugar per Hectare (TSH)
Results presented in Table 3.2 indicate that R 570 had higher TSH compared to other tested
varieties including the standard variety NCo376. N12 was the second followed by N47.
Table 3. 2 Results of TSH from different varieties grown under two management
practices in OG fields at Kilombero
Nyange Mfilisi Kitete
Variety FP RT VM FP RT VM FP RT VM
R 570 11.3 12.8 12.0 21.7 25.1 23.4 14.7 20.0 17.4
N12 6.3 10.0 8.1 23.2 24.8 24.0 13.3 16.0 14.6
N47 11.4 10.2 10.8 18.8 23.4 21.1 13.7 13.3 13.5
NCo376 8.5 9.8 9.2 19.9 18.7 19.3 12.4 13.3 12.9
MM 9.4 10.7
20.9 23.0
13.5 15.7
CV % 31.1 23.0 19.6
LSD (0.05) 3.93 6.36 3.60
P(0.05) 0.19 0.39 0.08

56
2016/17 trials (R1)
Eight trials were established in January and March 2016 at Mang’ula (Ulanga cotton), Kitete
mradini, Kitete mgudeni, Kungurumwoga, Msolwa station, Msolwa ujamaa, Nyange and
Nyamamba. Results presented are for R1 crop cycle.
Tons of cane per hectare (TCH)
Results are presented in Table 3.3. Performance of each variety were not significant
(P>0.05) from one variety to another. The highest TCH of 131.3 was recorded in variety
N12 under RT at Nyamamba and lowest 66.6 in variety N47 under FP at Nyange.
Table 3. 3 Results of TCH from different varieties grown under two
management practices in OG fields at Kilombero
Nyamamba Nyange Kitete
Variety FP RT VM FP RT VM FP RT VM
R 570 77.4 113.0 95.2 71.8 76.1 73.9 113.3 129.7 121.5
N12 100.5 131.3 115.9 67.9 84.0 75.9 99.1 99.7 99.4
N47 79.1 99.5 89.3 66.6 76.6 71.6 88.9 113.2 101.0
NCo376 110.8 114.9 112.9 88.9 88.9 88.9 93.0 93.4 93.6
MM 91.95 114.68
73.8 81.4
98.8 109.0
CV % 26.30 21.90 24.90
LSD (0.05) 34.20 21.35 32.52
P(0.05) 0.29 0.34 0.30
Tons of Sugar per Hectare (TSH)
Results presented in Table 3.4 indicated that average TSH for R570 was significant (P<0.05)
higher compared to other tested varieties. Kitete field recorded the highest TSH than other
locations.
Table 3. 4 Results of TSH from different varieties grown under two
management practices in OG fields, Kilombero. Nyamamba Nyange Kitete
Variety FP RT VM FP RT VM FP RT VM
R 570 10.7 8.0 9.3 6.4 7.8 7.1 14.54 17.0 15.7
N12 10.2 13.2 11.7 6.6 8.7 7.7 11.9 12.7 12.3
N47 6.9 9.8 8.3 6.3 7.6 7.0 11.8 15.2 13.5
NCo376 11.0 11.8 11.4 8.6 9.0 8.8 11.9 12.7 12.3
MM 9.7 10.7
7.0 8.3
12.6 14.4
CV % 27.50 20.60 25.00
LSD (0.05) 3.56 2.00 4.23
P(0.05) 0.02 0.21 0.03
2015/16 trials (R2)

57
Eight trials were established in December 2015 at Kielezo, Kitete, Mbwade, Mtakanini,
Kungurumwoga, Msolwa, Miwangani and Mkula. Results are presented in table 3.5.
Tons of cane per hectare (TCH)
During this season high yield in TCH was observed both for FP and RT in all the
experimental sites. In management practices where RT was used variety R 570 recorded the
highest TCH of 173.2. The lowest TCH of 57.1 was recorded in FP.
Table 3. 5 Results of TCH from different varieties grown under two
management practices in OG fields, Kilombero. Kitete Mtakanini Deco (Mbwade)
Variety FP RT VM FP RT VM FP RT VM
R 570 145.4 169.6 157.5 57.1 63.8 60.4 96.5 111.0 103.8
N12 163.2 173.2 168.2 58.9 68.9 63.9 83.3 103.6 93.5
N47 132.5 166.2 149.3 60.3 63.3 61.8 76.2 111.6 93.9
NCo376 133.6 134.3 133.9 69.4 108.3 88.9 120.3 121.6 121.0
MM 143.7 160.8
61.5 74.4
94.1 112
CV % 22.4 24.5 27.1
LSD (0.05) 42.94 21.21 35.2
P(0.05) 0.39 0.03 0.32
Tons of Sugar per Hectare (TSH)
Results are presented in Table 3.6. Generally RT recorded higher TSH compared to FP in
almost all sites. Variety R 570 performed better compared to other tested varieties including
NCo376
Table 3. 6 Results of TSH from different varieties grown under two
management practices in OG fields, Kilombero.
Kitete Mtakanini Deco
Variety FP RT VM FP RT VM FP RT VM
R 570 21.7 25.1 23.4 10.0 9.0 9.5 13.1 15.9 14.5
N12 23.2 24.8 24.0 9.1 10.6 9.9 11.3 13.7 12.5
N47 18.8 23.4 21.1 9.4 8.9 9.1 10.5 16.0 13.3
NCo376 19.9 18.7 19.3 10.5 15.4 13.0 12.8 16.1 14.5
MM 20.9 23.0
9.7 11.0
12.0 15.5
CV % 23.0 27.3 28.6
LSD (0.05) 6.36 3.56 4.92
P(0.05) 0.39 0.31 0.78
2014/15 trials (R3)

58
Eight trials were established in December 2014 at Kungurumwoga, Mbwade, Mang’ula,
Sonjo, Msolwa Ujamaa and Kidatu. The results for this experiment are presented in Table
3.7.
Tons of Cane per Hectare (TCH)
Based on the results high yield in TCH was recorded in almost all sites for both FP and RT.
However, R 570 recorded the highest TCH (124.9) under RT while NCo376 recorded the
lowest TCH (45.1) under FP. These results did not differ significantly (P>0.05) in most of the
sites. In general R 570 had higher TCH compared to other tested varieties including
NCo376.
Table 3. 7 Results of TCH from different varieties grown under two
management practices in OG fields, Kilombero.
Kungurumwoga Mbwade Sonjo
Variety FP RT VM FP RT VM FP RT VM
R 570 54.2 77.2 65.7 102.5 124.9 113.7 76.2 93.2 84.7
N12 49.4 73.9 61.7 92.8 112.2 102.5 76.0 82.9 79.5
N47 46.6 74.0 60.3 87.4 119.2 103.3 63.9 62.3 63.1
NCo376 45.1 55.4 50.3 83.4 115.3 99.4 69.5 82.7 76.1
MM 48.8 70.1
91.5 117.9
71.4 80.8
CV % 28.4 24.0 10.7
LSD (0.05) 21.43 31.62 10.19
P(0.05) 0.47 0.78 0.004
Tons of Sugar per Hectare
Results for TSH are presented in Table 3.8. Based on the results TSH ranged from 3.5 to
13.1 under FP and 5.5 to 18.2 under RT. On average R 570 had higher TSH compared to
other varieties.
Table 3. 8 Results of TSH from different varieties grown under two
management practices in OG fields, Kilombero Kungurumwoga Mbwade Sonjo
Variety FP RT VM FP RT VM FP RT VM
R 570 7.9 11.2 9.6 13.1 18.2 15.6 9.1 7.1 8.1
N12 7.0 10.7 8.9 13.0 15.8 14.4 7.6 7.1 7.3
N47 6.9 10.3 8.6 12.6 16.3 14.5 6.3 5.5 5.9
NCo376 6.2 7.8 7.0 11.9 16.9 14.4 6.1 7.7 6.9
MM 7.0 10.0
12.7 16.8
7.3 6.8
CV % 28.4 29.1 10.9
LSD (0.05) 3.07 5.40 0.97
P(0.05) 0.35 0.95 0.003
2013/14 trials (R4)

59
Ten trials were established in December 2013, in the following locations. Kitete, Msowero,
Mang’ula, Mkula, Msolwa Ujamaa, Miwangani, Mbwade and Matambiko. Results for these
trials are presented in Table 3.9.
Tons of Cane per Hectare
Results presented in Table 3.9 revealed that TCH was higher for RT in all the sites compared
to FP except at Mang’ula where R 570 recorded higher TCH in FP, however, the difference
was not significant (P >0.05).
Table 3. 9 Results of TCH from different varieties grown under two
management practices in OG fields, Kilombero. Msowero Mang'ula
Variety FP RT VM FP RT VM
R 570 61.1 117.6 89.3 105.3 94.3 76.0
N12 96.9 113.7 105.3 64.6 94.9 79.3
N47 82.6 106.1 94.4 65.2 62.8 64.0
NCo376 82.2 69.9 76.1 76.0 113.1 94.5
MM 80.7 101.8
69.6 90.4
CV % 27.5 23.5
LSD (0.05) 31.61 23.66
P(0.05) 0.086 0.09
Tons of Sugar per Hectare
Results for TSH are presented in Table 3.10. The levels ranged from 6.7 to 16.6. Variety R
570 recorded high TSH compared to other varieties.
Table 3. 10 Results of TSH from different varieties grown under two
management practices in OG fields, Kilombero.
Msowero Mang'ula
Variety FP RT VM FP RT VM
R 570 9.6 16.6 13.1 8.0 10.8 9.4
N12 14.4 15.8 15.1 7.6 10.9 9.2
N47 12.2 15.9 14.1 7.1 6.7 6.9
NCo376 10.9 10.4 10.6 8.2 12.2 10.2
MM 11.8 14.7
7.7 10.2
CV % 28.7 26.2
LSD (0.05) 4.77 2.94
P(0.05) 0.24
0.14
Yield response of tested varieties across seasons
Tons of cane per hectare (TCH)

60
Results for four cropping cycles for two management levels are presented in Figure 1(a) and
1(b). Based on the results there was a decrease in yield (TCH) under FP for R 570, N47 and
NCo376 from PC to R1, but N12 remained almost constant. From R1 to R2 yields of N12, R
570 and NCo376 remained constant but that of N47 increased. From R2 to R3 yields of R
570 and N47 increased but N12 and NCo376 decreased, from R3 to R4 TCH for all varieties
increased.
For RT yields of N47 and NCo376 decreased from PC to R1, but there was a slight increase
in TCH for R 570 and N12. From R1 to R2 TCH for all varieties decreased significantly, while
from R2 to R3 TCH for N47, R 570 and NCo376 increased but N12 continued to decrease.
From R3 to R4 TCH for all varieties increased subsequently.
Figure 3. 1 Yield (TCH) of tested varieties vs crop cycles in two management
levels
Where a=FP, b=RT
Tons of sugar per hectare
Trends in TSH for four cropping cycles presented in figure 2(a) and 2(b) revealed that, there
was a decrease in TSH for all varieties from PC to R3. N47 increased from R2 to R3 while
from R3 to R4 TSH in all varieties increased. Generally all the tested varieties performed
higher than the standard variety NCo376.
0
10
20
30
40
50
60
70
80
90
PC R1 R2 R3 R4
TC
H
Crop cycles
(a)
R570N12N47NCo376
0
20
40
60
80
100
120
PC R1 R2 R3 R4
TC
H
Crop cycles
(b)
R570N12N47NCo376

61
Figure 3. 2 Yield (TSH) of tested varieties vs crop cycles in two management levels 3.1.4 Discussion
Preliminary results revealed that all tested varieties performed better in term of yields (TCH,
TSH) when compared to standard variety NCo376. Variety N12 is referred to as very
susceptible to smut disease next to NCo376 hence terminated from further evaluation. The
decrease in cane yield from ratoon 1 to ratoon 2 might have been attributed to long dry
spell which was experienced during that season (2015/16). The dry weather might have
affected the growth of sugarcane and subsequent cane yields (TCH). TSH is the product of
TCH and sucrose percent therefore the decrease or increase of one or both of these
parameters automatically affect TSH accordingly (Gilbert et al., 2005).
Way forward
Varieties N47 and R 570 undergone the second phase of evaluation where they were
planted in large blocks (one acre each) for further evaluation in order to come up with a
viable recommendation.
Second phase experimentation (Large blocks trials)
2018/19 blocks (PC)
Three blocks each comprising of three acres were established at Kiberege, Msolwa and
Kungurumwoga at Kilombero and two blocks were established at Kisala and Kwadori at
Mtibwa. Results for these trials are presented in Tables 3.11 and Table 3.12. In terms of
tillering, NCO 376 in both locations (Kilombero and Mtibwa) had higher number of tillers
followed by N47 while R 570 had the least tillers.
0
2
4
6
8
10
12
14
PC R1 R2 R3 R4
TS
H
Crop cycles
(a)
R570
N12
N47
NCo376
0
2
4
6
8
10
12
14
16
PC R1 R2 R3 R4
TS
H
Crop cycles
(b)
R570
N12
N47
NCo376

62
Table 3. 11 Tillers count in large blocks in four sites at Kilombero
Variety Kiberege Msolwa K’mwoga
R 570 162,500 110,000 59,583
N47 156,667 104,167 85,000
NCo 376 187,500 106,250 163,333
Table 3. 12 Tillers count in large blocks in four sites at Mtibwa
Variety Kisala Kwadori
R 570 107,917 130,833
N47 80,000 150,833
NCo 376 173,750 213,750
2017/18 blocks (PC) Four blocks each comprising of three acres were established at Mang’ula, Mbwade,
Ruhembe and Mfilisi in Kilombero.
Tons of cane per hectare (TCH)
Results are presented in Table 3.13. Generally the two tested varieties performed higher
than the standard variety NCo376. Variation in variety yield was observed from one site to
another. For example at Mang’ula N 47 performed higher than the standard check while at
Mbwade N47 was the lowest among others.
Table 3. 13 Results of TCH from selected varieties grown in large block fields at
Kilombero.
Variety Mang'ula Mbwade Ruhembe
R 570 104.0 95.7 127.3
N47 118.8 67.9 78.3
NCo376 93.5 85.4 72.9
Tons of sugar per hectare Results are presented in Table 3.14.TSH ranged from 7.1 to 12.2. All tested varieties
recorded TSH above NCo376, with R570 having higher TSH compared to other varieties.
Table 3. 14 Results of TSH from selected varieties grown in large block fields at
Kilombero
Variety Mang'ula Mbwade Ruhembe
R 570 11.2 9.4 12.2 N47 10.3 7.1 7.6 NCo376 9.1 8.2 7.1
Smut incidence Results presented in fig 3 (a) and 3(b) indicated that smut incidences for two varieties R 570
and N47 were below 4 % threshold at Mtibwa and Kilombero. This was low compared to
NCo376 which had 6 percent incidences

63
Figure 3. 3 Smut infestation levels for selected varieties in two management
levels at Kilombero and Mtibwa
Discussion
Crop varieties may show wide variations in their yielding ability when grown over varied
environments or agro-climatic zones. The results for 2017/18 large block trials revealed that
there were variations in varieties yield for some sites which is attributed by the existing
micro climates (soil, temperature, rainfall, vegetation). This can cause difficulty in
demonstrating the superiority of a particular variety over sites. Same scenario has been
reported by other researchers. Gilbert et al. (2005) reported on the adoption of the variety,
productivity and total production of the crop as a result of changes in environments.
Smut incidences as per 2017/18 large block trials revealed that NCO376 is still the highly
susceptible variety in smut followed by N 47. Smut susceptibility or resistance are said to be
heritable character of a variety. Two types of resistance behavior were reported by Ramesh,
et al (2012); external resistance mediated by a chemical or physical barrier in the sugarcane
bud and an internal resistance which is speculated to be governed during host-pathogen
interaction.
0
1
2
3
4
5
6
7
8
N47 NCo376 R570
Sm
ut
(%)
Varieties
Kilombero
0
1
2
3
4
5
6
7
8
N47 NCo376 R570
Sm
ut
(%)
Varieties
Mtibwa

64
Significantly high tillering as reported in 2018/19 is a good indication towards yield because
it is a primodial characteristics through which the final harvestable stalks in sugarcane is
determined. Kapur et al. (2011 reported, a product of photosynthesis are stalks formed from
the growth of tillers and thus the profitability of the crop is highly dependent on the tillers
produced.
Wayforward These trials are in the last stages of evaluation soon to be released for commercial
production in outgrowers.
3.2 Evaluation of Different Levels of Fertilizers for Improved Sugarcane Productivity at Kagera Mill Area (Fertilizer trial)
Project code: AP 2016/03/03
Investigators: Dr. Msita H. B., Kalimba H., S. Kajiru and Lwiza L.M
Collaborators: Outgrowers, LAO, DAICO, YARA Fertilizer Company
Start date: 2016-17
Reporting time: 2018-19
Summary
Fertilizers are crucial input in sugarcane production. There is a clear correlation between
increased production and use of fertilizers. Most farmers rely on estimation and past
experience when deciding on fertilizer rates. Outgrowers in Kagera mill area are faced by
the problem of low yield due to inappropriate fertilization. In order to establish fertilizer
recommendations, a trial with twelve treatments (different fertilizer rates) was conducted.
Phosphate and potash fertilizers were applied at planting while nitrogen was applied three
months after planting. Results showed that each treatment responded differently in each
site. There was a significant difference in yield for some of the treatments observed. These
experiments are in preliminary results and collection of data is still continuing
3.2.1 Introduction
Sugarcane is a tropical plant that requires warm, humid climate for good growth (Saleem et
al., 2012). It is grown throughout the sub tropical land surface of earth between latitude
30˚ N and 35˚ S in a wide variety of soil types ranging from sandy loam to heavy clay
(Nazir, 1994). It is an important commercial crop and is the main raw material of sugar
produced in Tanzania for both export and domestic consumption (Tarimo, 1998). Currently,
most sugarcane is grown in estates, owned by the sugar processing factories (SPF) as well
as contract growers (CG). The productivity in outgrowers’ fields in Tanzania has remained
low below the attained yield potential of more than 70-100 tons per Hectare (SBT, 2016).
Among other factors, imbalanced and inadequate use of fertilizers has led to the decline in
productivity in most of the outgrowers’ field within the country.
Moreover, continuous planting of sugarcane in the same field depletes soil nutrients. For
instances a crop having yield of 100 t ha-1 removes 207 kg N, 30 kg P2O5 and 233 kg K2O
from the soil (Jagtap et al., 2006). Therefore these nutrients must be added in adequate
quantities in the root zone of the crop to obtain higher yield. Among these, Nitrogen (N) is

65
the primary nutrient limiting sugarcane production (Wiedenfeld and Enciso, 2008). Others
include Phosphorus (P) and Potassium (K).
Outgrowers in Kagera mill area are faced with the same problem of low sugarcane
productivity within their fields; they contribute less than 8% of the total factory production.
Poor soil fertility and inadequate fertilization are the main challenges. This called for
establishment of fertilizer trials in outgrower’s fields of Kagera mill area in order to establish
specific recommendation packages for sugarcane farming.
Specific objectives
1. Determination of soil properties in sugarcane fields in Kagera Mill area
2. Establishment of specific fertilizer recommendation rates for sugarcane
Achieved output todate
1. Data on physical and chemical properties of the soil known in Kagera is known
2. One promised fertilizer recommendation based on yield data available
3.2.2 Materials and Methods
Location
The experiments were conducted in OG fields of Kagera mill area in Misenyi District,
between latitude S 1˚13.06’ and Longitude E 31°16.327 and about 1300 m asl. Rainfall in the
area is bimodal (October-November and March-May) whereby the mean annual rainfall is
about 1500 mm and the mean temperature is 200C.
Experimental design and sites
Before trial establishment, four zones (Kasambya, Nsunga, Bubale and Kyaka) were selected
as study area where 12 soil samples from each zone were collected to make total of 48
samples. The collected soil samples were sent to Lancop Lab in United Kingdom for analysis
to get data on physical and chemical properties of the soil.
Experimental design
Randomized Complete Block Design with three replications, Plot size of 48 m2 comprising of
four rows of 10 m long spaced at 1.2 m.

66
Table 3. 15 Treatments details
No. Treatments Nutrient levels (Kg/ha)
N P K
1 T1 100 25 100
2 T2 100 50 100
3 T3 100 75 100
4 T4 100 100 100
5 T5 125 25 125
6 T6 125 50 125
7 T7 125 75 125
8 T8 125 100 125
9 T9 150 25 150
10 T10 150 50 150
11 T11 150 75 150
12 T12 150 100 150
Fertilizer application
Phosphate and Potash fertilizers were applied at planting and Nitrogen was applied in two
splits at three and six months after planting. Other nutrients including Ca7.5, Mg1.25, S17.5 and
B0.03 were added in all the treatments
Data collected and to be collected
Number of stalks at 16 months of age
Stalks weight at 18 months of age
Quality parameter (brix) determined in the laboratory (KSL)
TCH was calculated using formulas
Data analysis
Data collected were statistically analyzed by Analysis of Variance (ANOVA) using GenStat
statistical package version 14.00 and mean differences among treatments were compared
using Least Significant difference (P=5%).
3.2.3 Results
Following the analysis of soil samples it was observed that most of the soils are sandy loam
to loam with acidic to slightly acidic reaction. The soils are medium in N and K but deficient
in P.
2016/17 fertilizer trial (PC)
Eight sites were selected for experimentation; seven sites were planted in November 2016.
Results are presented in Table 3.16 and Table 3.17.
Tons cane per Hectare (TCH)
Yield of sugarcane to applied treatments in experimental sites are presented in Table 3.16.
The results revealed that there is a significant difference in yield (p≤ 0.05) for some
treatments in some of the sites. Based on the presented results each treatment performed
differently in different locations. For example at Kyaka treatment 3 had a significant higher

67
TCH of 284 while the same treatment was the least at Nsunga (127) and Kasambya (141).
For Kasambya, higher TCH was 166 for treatment 1 while treatment 10 recorded higher TCH
Nsunga had the highest TCH of 284.
Table 3. 16 Results of TCH to applied fertilizer in OG fields at Kagera
Treatments Kyaka Kasambya Nsunga(M) Nsunga (J)
1 182 166 128 180
2 118 141 152 184
3 284 127 141 136
4 185 106 132 163
5 132 141 113 134
6 130 152 148 211
7 103 145 141 175
8 126 127 142 124
9 145 124 171 135
10 120 146 114 284
11 123 158 156 175
12 120 143 143 143
CV % 43.6 30.0 26.0 32.7
LSD (0.05) 108.8 70.94 61.55 94.30
P (0.05) 0.118 0.905 0.785 0.098
Brix percentage Table 3.17 indicates the relationship of the applied treatments to quality of juice (brix).
Based on the results brix % significantly and positively responded well under lower
treatments. For instances in all the harvested sites where treatment dose was low
(N100P25K100) brix percentage was higher compared to higher treatment dose (N150P100K150).

68
Table 3. 17 Percent brix with reference to the applied fertilizers
Treatments Kyaka Kasambya Nsunga(1) Nsunga (2)
1 15.07 16.07 15.33 15.76
2 15.01 14.85 15.16 14.49
3 13.38 14.75 14.82 14.15
4 14.91 14.91 14.55 14.45
5 14.50 15.05 15.30 14.93
6 14.79 15.86 15.24 14.62
7 14.62 13.17 14.37 15.18
8 14.75 14.31 15.25 15.13
9 14.95 15.23 14.05 14.97
10 15.60 15.57 15.17 13.83
11 14.95 13.97 14.83 15.55
12 15.48 15.09 14.80 13.04
CV % 7.3 3.5 4.1 7.2
LSD (0.05) 1.9 13.9 1.02 1.78
P (0.05) 0.180 0.913 0.247 0.180
2017/18 fertilizer trials (PC)
Eight sites were selected for experimentation but only 7 trials were established in
October/November 2017 at Nsunga (1), Kasambya (3) Bubale (1) and Kyaka (2).
Stalk count
Results on the number of millable stalks are presented in Table 3.18. From the results, the
performance of the applied treatments was different from each site. Significant difference
(p≤0.05) in number of stalks per applied treatments was only observed at Kasambya. In
General treatment 11 (N150P75K150) performed better as compared to other treatments across all
the sites.

69
Table 3. 18 Results of stalks to applied fertilizers in OG fields at Kagera
Treatment
s
Kyaka
(M)
Kyaka
(H)
Kasambya
(E)
Kasambya
(J)
Nsunga
(B)
1 158333 125001 134723 107222 119215
2 183333 131946 140696 94722 112823
3 138611 130557 144584 91666 133665
4 134166 140696 132362 94722 124495
5 161110 113890 136112 88611 113101
6 173055 136112 139029 86389 120048
7 169999 98612 143057 90000 130053
8 138611 108347 148612 89444 120048
9 184721 127779 125695 90833 130886
10 173055 111112 127084 86944 126718
11 188888 125001 134307 121388 112823
12 162499 111112 140557 91666 128385
CV (%) 24.6 20.4 8.0 18.8 12.0
LSD (0.05)
P (0.05)
68311.8
0.773
42242.0
0.642
18544.7
0.035
30086.4
0.045
24947.3
0.672
2018/19 trials (PC)
Eight sites were planted September/October 2018 at Nsunga (2), Kasambya (2) Bubale (2)
and Kyaka (2). Results on number of tillers are presented in Table 3.19.

70
Table 3. 19 Results of tillers to applied fertilizer in OG fields at Kagera
Treat
ment
Kyaka
(K)
Kyaka
(M)
Bubale
(K)
Bubale
(N)
Nsunga
(J)
Nsunga
(B)
Kasam
bya
(M)
Kasamb
ya (S)
1 141332 285719 238793 408448 203530 96906 151884 237405
2 137167 200475 314874 389289 193534 59698 161602 335421
3 210194 289051 277389 444544 241848 53590 233518 299602
4 129948 315707 272669 417333 206862 79968 192145 356524
5 210471 328313 344307 370685 159936 84411 168821 275168
6 241570 306266 339864 394287 212137 78857 212970 271558
7 206029 356524 301268 353470 199087 73026 173542 314874
8 197699 347639 268226 315429 242958 75248 171320 356246
9 113566 348749 296826 390955 232129 83300 203530 300436
10 152994 317095 334033 367908 204085 66085 194367 281554
11 168544 297659 357079 343474 277667 83855 184093 282942
12 246846 304323 333755 345417 269892 86910 162990 302657
C.V 38.8 22.9 21.5 19.2 22.4 19.6 21.5 17.8
LSD(0
.05)
117984 119060 111735 123111 83603 25450 67031 90870
P
(0.05)
0.316 0.186 0.666 0.327 0.894 0.631 0.105 0.889
Based on the results in Table 3.19 each treatment had performed differently in each site.
Productivity (tiller count) in relation to the applied treatments was significantly higher in all the
sites. Generally treatment 6 (N125P50K125) among others performed well while treatment 1
(N100P25K100) was the least.
3.2.4 Discussion
The presented results are still preliminary since the trial is on-going, so many factors might
have been contributed to the observed results. The study revealed that in year 2016/17 a
combination of N100P75K100 at Kyaka, N150P25K150 at Nsunga and N100P25K100 at Kasambya had a
substantial yield of Sugarcane in each zone. The observed difference in yield in some of the
treatments might be due to differences in soil pH, soil erosion and flooding. These results are
in contrast with results reported by Gana (2008) that application of N more than 120 kg N ha-
1 indicates no significant difference between tillers number, stalk length and cane yield.
The difference between our results and his results can be due to differences in
environment and soil status of the area where two studies were conducted. Furthermore
percent brix was higher for lower dose treatment the observation which was observed by
other researchers. El-Geddawy et al. (2005) that application of 72 kg k2O favored cane
growth, produced the highest yield of millable cane and increased juice quality traits in terms of
Brix, sucrose and sugar recovery percentages. They further clarified that as levels of K
increased the reduction in sugar quality is expected. High fertilizer doses enhance a longer
vegetative growth rather than accumulation of sugar hence lowers percent brix levels.

71
For 2017/18 the study revealed that higher number of millable cane for 2017/18 season
was observed in treatment 11 where higher doses of N, and K were applied. The large
number of millable cane due to high N might have been due to importance of N in
establishment of strong and vigorous stems and leaves which are important in
photosynthesis and nutrient synthesis for most of the plants including sugarcane. The
same scenario of having high millable cane with high N levels has been reported by
different researchers (Ahmad et al., (1995), Kolage et al., (2001), Afzal et al., (2003) and
Sinha et al., (2005).
Way forward
For three cropping cycles established since 2016 we have managed to gather results on one
crop cycle only given the long cane growth period at Kagera (18months). We still need results
from three cropping cycles before arriving to the conclusion. However, the preliminary results
however revealed that each treatment applied behaved different in different sites
3.3 Baseline Survey on the Status of Striga spp in Sugarcane Fields in Tanzania
Project Code : AP 2017/03/04
Investigators: Kalimba, H. F, L. Lwiza, S, Kajiru.
Collaborators: Yonna Kalinga, Mohamed Salumu, Nasser Mlawa, Nassoro
Abubakari
Date of commencement: 2017/18
Reporting period: 2018/19
Summary Striga spp, commonly known as witch weed, are root parasitic flowering plants that occurs
naturally in sub Saharan Africa and Asia. Three species: S. hermonthica, S. asiatica and S.
gesnerioides have been reported to cause serious damage to crops. In recent years Striga
has been observed in some sugarcane fields. Infestation area and levels are likely to
increase in future because of continued monoculture. A survey was conducted for the
purpose of identifying species and levels of infestation in sugarcane fields at Kagera.
Observations were done at an interval of 100 m and field in vicinity was observed. A total of
100 fields were observed, 50 in estate and 50 in OG. In estate none of the fields were
infested and for out growers only one farm was infested. Results indicated that Striga is not
a serious weed of sugarcane at Kagera mill area.
3.3.1 Introduction
Striga spp, commonly known as witch weed or witchers weed, are root parasitic flowering
plants that occurs naturally in sub Saharan Africa and Asia, attacking a wide range of
crops. Striga spp are amongst the world’s worst weeds (Nail et al., 2014), reducing the
value of grain crops particularly in Africa. Striga spp are prolific seed producers, the fine
dust-like seed which can last more than 15 years, and consequently, eradication and control
attempts are extremely difficult and prolonged (Nail et al., 2014). Striga spp reduces crop
yields by extracting water, nutrients (particularly nitrogen), and affect photosynthetic
process from the root system of its host plant, resulting in stunting and yield reduction
(Parker and Riches., 1993). The attack of this weed causes a lot of economic losses. In

72
Tanzania, the weed has been reported mainly in cereal crops such as sorghum, maize and
finger millet including sugarcane (Ramaiah, et al., 1983).
Three species: S. hermonthica, S. asiatica and S. gesnerioides have been reported to cause
the serious damage to crops (Ramaiah, et al., 1983). The symptoms of attack by Striga may
be apparent, sometime before the weed emerges. At early stages, symptoms are
indistinguishable from those caused by drought for example wilting and curling of the leaves
but they are strong indicators if they occur when the soil is still moist (Nail et al., 2014).
The infected plant may also show stunting from quite an early stage and pronounced
scorching of the leaf borders and finally of the whole leaf area may occur at a later stage.
Crop yield loss due to Striga spp attacks can vary depending on density, soil fertility, rainfall
distribution, host species and variety grown. It has been reported that Striga spp can cause
yield loss between 20 and 80% on sorghum crop and thus farmers are obliged to abandon
highly infested field (Altera and Itoh, 2011).
In recent years Striga spp has been observed in some sugarcane fields. This called urgent
need to assess the levels and distribution of striga spp infestation in sugarcane field in
Kagera and Kilombero
Objective
1. To determine level and identify species of Striga spp infestation in sugarcane fields
in Tanzania.
Output achieved to date Two species of striga identified
3.3.2 Material and methods Location
In 2018/19 the survey was conducted at Kagera mill area (Kagera estate and outgrowers
fields).
Survey method
Survey was conducted where by transects along the road were used. Observations were
done in all sugarcane fields at an interval of 100m and fields in vicinity after each stop was
observed for presence or absence of Striga. Species identification was done by
characterizing Striga morphologies as described by Ramaiah, et al., (1983).
3.3.3 Results
A total of 100 fields were surveyed in Kagera mill area, that is, 50 fields at the estate and 50
fields in outgrowers. Out of 50 fields surveyed at the estate none was infested by Striga
while in outgrowers only one field was infested. Results are summarized in Table 3.20

73
Table 3. 20 Status of Striga infestation at Kagera
SN Location No of field
surveyed
Field found with
striga
Percent of field
with infestation
1 Estate 50 0 0
2 Outgrowers 50 1 2
Total 100 1 2
Figure 3. 4 Striga hermonthica at Kagera mill area
3.3.4 Discussion
The study found that only small percent of the outgrowers field were infested with striga.
This indicates that Striga is not a serious weed in Kagera mill area. This can be due to host
specificity of striga to cereal crops which might not be for sugarcane.
Wayforward
Further study on Striga will be carried out at Mtibwa and TPC estates in order to have
proper overview on the status of Striga infestation in Tanzania so as to come up with
appropriate control strategies.
3.4 Evaluation of Different Herbicide for Use in Sugarcane Fields at Kagera Project Code: AP 2017/03/06
Investigators: Kalimba, H. F, G. Mwasinga, S. Kajiru, L. Lwiza and
Dr. H. B. Msita
Collaborators: Nassoro Abubakari, Nelson Mshana,
Date of commencement: 2017/18
Reporting period: 2018/19
Duration: 3 years
Summary
Herbicides are chemicals that inhibit or interrupt normal plant growth and development.
They are widely used in agriculture. Sugarcane is grown in well drained fertile soils, with
good supply of moisture and nutrients. Such condition favors an intense and rapid growth of

74
wide range of weed species. Hand hoe is a common method in controlling weeds but not
100% effective. Herbicides are considered to be effective and quick method of weed control.
Trials were conducted to evaluate efficacy of different herbicides at Kagera mill area.
Experiments were laid out in randomized complete block design. Herbicides were applied as
early post emergence. Assessment of herbicides action was based on direct comparison
between treated and untreated plots. Current results revealed that all herbicides were
effective in controlling weeds for more than nine weeks.
3.4.1 Introduction
Herbicides are chemicals that inhibit or interrupt normal plant growth and development and
widely used in agriculture (Peng, 1984). Sugarcane is grown in well drained fertile soils, with
good supply of moisture and nutrients In addition, sugarcane receives dressing of nitrogen,
phosphorus and potassium. Such condition favors an intense and rapid growth of wide
range of weed species (Cardoso, 1997). Weed competition in the initial stages of crop
growth can be so severe and that plants remain stunted and final yields are a mere
fractional of the true potential (Fute, 1990). Losses up to 45% have been reported in
sugarcane fields when weeds were not controlled within the first six weeks (Isa and
Kalimba, 2000). This is due to the fact that emergence and early growth of sugarcane is
inherently slow and considerable time elapse between planting and development of foliage
cover, hence the crop competes very poorly with weeds (Isa and Kalimba, 2000; Fute,
1990). For these reasons weed infestations is considered a major constraint in the
achievement of yield potentials in sugarcane production.
Hand hoe weeding, mechanical weeding and use of herbicides are common methods used in
controlling weeds in sugarcane fields (Isa and Kalimba, 2000). Disking and interrow
cultivation methods are also practiced, however the methods do not solve the problem fully
as they do not remove weeds within the crop rows (Isa, 2000). Proper use of herbicides is
considered as an effective and quick method of controlling many weed species (Fute, 1990).
In all estates during the rainy season weed growth becomes vigorous and intense which
require constant application of control measures. Manual weeding during this period has
also many limitations including labour availability due to high labour demand for planting
and weeding of annual crops (Mtunda et al, 1998). Moreover, some weed species such as
Cyperus spp, Commelina spp are not easily killed by tillage alone due to high soil moisture.
On the other hand tillage operations, manual or mechanical, are rendered ineffective and
costly. Due to this TARI Kibaha conducted this project to come up with effective herbicides
for managing weeds in sugarcane.
Objective 1 To evaluate effectiveness of different herbicides in sugarcane fields at Kagera mill
area
Output achieved to date Four effective herbicides combinations rates developed

75
3.4.2 Materials and methods
Location
Kagera mill area Estate and OG
Design
Experiment had five herbicides, which were combined to make nine combinations and two
controls hence total of eleven treatments which were designed in Randomized Complete
Block Design (RCBD) and replicated three times. Plots were in four rows spaced at 1.2 m,
Herbicide application
Herbicides were applied as early post emergence two weeks after planting. Treatments are
as shown in Table 3.21. Weed count was made at three weeks intervals and assessment of
herbicides action was based on direct comparison between treated and untreated plots, to
get percentage control which was then converted to a 1 to 9 logarithmic scale as in
accordance to (Werner, 1981) Where 1 = complete control, 4.5 = Just an acceptable control
and 9 no control at all (Table 3.25).
Statistical analysis
Percentage weed control was transformed (Arc sine Transformation) and subjected into
statistical analysis (ANOVA) using Genstat statistical package version 12.where the
coefficient of variation was determined and used as a measure of consistence of treatments
effect.
Table 3. 21 Treatments details
Treatment Acetochlor Metribuzine Chlorimuron Paraquat Surfactant Litres/ha Litres/ha Kilograms/ha Litres/ha Litres/ha
T1 4.0 1.6 0.250 1 0.2
T2 0.0 1.6 0.250 1 0.2
T3 0.0 1.6 0.250 1 0.0
T4 4.0 1.6 0.375 1 0.2
T5 0.0 1.6 0.375 1 0.2
T6 0.0 1.6 0.375 1 0.0
T7 4.0 2.4 0.250 1 0.2
T8 0.0 2.4 0.250 1 0.2
T9 0.0 2.4 0.250 1 0.0
T10 weed free check
T11 Weed check
3.4.3 Results
Results presented in Tables 3.22, 3.23 and 3.24 indicate that all herbicide treatments were
statistically different from each other (P≤0.05) hence able to control all types of weeds for
more than nine weeks after herbicide application similar to weed free check.

76
Table 3. 22 Results of tested herbicide on grasses at Kagera mill area
Treat
ments
3 WAT 6 WAT 9 WAT
Score %
control
T.D Score %
control
T.D Score %
control
T.D
1 2 98.50 82.98 2 99.30 85.29 2 98.90 83.88
2 4 91.80 73.39 3 97.20 80.44 4 92.40 73.99
3 2 99.30 85.10 2 99.80 87.21 2 98.80 83.76
4 2 98.70 83.52 2 99.40 85.58 2 99.30 84.96
5 1 100.00 90.00 2 99.30 85.08 2 98.50 83.04
6 5 88.40 70.09 3 97.50 80.88 2 99.10 84.71
7 4 92.50 74.13 3 97.50 80.85 2 98. 70 83.43
8 6 78.30 62.25 2 98.50 83.12 2 99.40 85.42
9 2 98.10 82.06 2 99.70 87.00 2 99.10 84.58
10 1 100.00 90.00 1 100.00 90.00 1 100.00 90.00
11 9 0.00 5.74 9 0.00 5.74 9 0.00 5.74
CV
(%)
11.90
3.90
6.60
LSD
(0.05)
14.67
5.43
9.16
P
(0.05)
0.001
0.001
0.001
WAT= Weeks after Treatments
T.D = Arcsine transformed data
Table 3. 23 Results of tested herbicide on Broadleaves at Kagera mill area
Treatment
3 WAT 6 WAT 9 WAT
Score %
control
T.D Score %
control
T.D Score %
control
T.D
1 4 93.80 75.60 2 99.00 84.30 2 99.40 85.65
2 4 94.00 75.85 2 99.30 85.08 4 91.10 72.68
3 1 100.00 90.00 2 99.90 88.94 2 98.80 83.88
4 2 98.90 81.76 2 99.30 85.28 2 98.40 82.73
5 2 98.20 82.24 2 99.60 86.55 3 97.50 80.93
6 2 98.50 83.10 2 99.80 87.84 2 99.40 85.42
7 2 98.50 83.10 2 99.30 84.95 3 98.00 81.79
8 4 94.60 76.55 3 97.50 80.90 3 98.60 83.16
9 3 97.90 81.64 2 99.90 89.01 2 99.40 85.51
10 1 100.00 90.00 1 100.00 90.00 1 100.00 90.00
11 9 0.00 5.74 9 0.00 5.74 9 0.00 5.74
CV (%)
12.60
3.00
6.90
LSD
(0.05)
16.04
4.23
9.39
P
(0.05)
0.001
0.001
0.00
1
WAT= Weeks after Treatments
T.D=Arcsine transformed data

77
Table 3. 24 Results of tested herbicide on sedges at Kagera mill area
Treat
ments
3 WAT 6 WAT 9 WAT
Score % control
T.D Score % control
T.D Score % control
T.D
1 1 100.00 90.00 1 100.00 90.00 1 100.00 90.00
2 2 99.30 85.34 2 99.90 89.01 2 99.90 88.14
3 1 100.00 90.00 1 100.00 90.00 1 100.00 90.00
4 2 99.40 85.75 1 100.00 90.00 1 100.00 90.00
5 1 100.00 90.00 1 100.00 90.00 1 100.00 90.00
6 2 99.90 88.91 2 99.90 88.94 2 99.90 87.80
7 2 99.90 88.91 2 99.90 87.99 2 99.50 85.95
8 1 100.00 90.00 2 99.90 88.60 2 99.80 87.30
9 2 99.90 88.91 1 100.00 90.00 1 100.00 90.00
10 1 100.00 90.00 1 100.00 90.00 1 100.00 90.00
11 9 0.00 5.74 9 0.00 5.74 9 0.00 5.74
CV
(%)
3.50
1.60
3.30
LSD
(0.05)
5.15
2.41
4.81
P (0.05)
0.001
0.001
0.001
T.D=Arcsine transformed data
WAT= Weeks after Treatments
3.4.4 Discussion
Several weed species were observed in the experimental site, all herbicides treatments
reduced grasses, broadleaves and sedges to an acceptable level for the period exceeding
nine weeks.
According to Isa (1996) and Rugaimukamu (2000), herbicide products which can control
weeds for the period of more than 8 eight weeks can be recommended for use in sugarcane
fields, because after that period the crop develop canopy cover sufficient to suppress
emerging weeds. Treatments with surfactants seems to perform better compared to those
which did not have, because surfactant is used as binding material and therefore herbicide
was not easily washed by rainfall water and thus increased the effectiveness of herbicides
applied.

78
Table 3. 25 Weed classification scale
Score % Activity
1 100
2 99.9 – 98
3 97.9 – 95
Limit of 4
.......................................................................
............
Acceptability 5
6
7
8
9
94.9 – 90
.........................................................
.........
89.9 – 82
81.9 – 70
69.9 – 55
54.9 – 30
29.9 – 0
Wayforward
Presented results are still preliminary since we have managed to gather information from
one cycle only.
3.5 References Afzal, M., Chattha, A. A. and Zafar M. (2003). Role of different NPK doses and seed
rates on cane yield and quality of HSF-240. Pak. Sugar J. 18: 72-75.
Ahmad, Z., Khan, S., Rahman, S. and Ahmad, G. (1995). Effect of N levels and setts
density on various agronomic characteristics of sugarcane. Pak. Sugar J. 9: 7-
11.
Ahmed, M.A., Ferweez, H. and Saher, M.A. (2009). The optimum yield and quality
properties of sugarcane under different organic, nitrogen and potassium
fertilizers levels. J. Agric. Res. Kafer El-Sheikh Univ. 35(3): 879-896.
Altera E. and Itoh K. (2011). Evaluation of ecologies and severity of Striga weed on rice
in sub
Cardoso, V. J. M (1997). Germination and initial growth of some weeds in different soil
types. Naturalia-Rio-Claro 22:61-74.
Choice Pest Geography, 2, 1–6.
Chongela J. (2015). Economic analysis of sugarcane outgrowers and paddy production
scheme at Ruembe sugarcane basin in Kilosa Dstrict, Morogoro Tanzania: A
comparative approach. Asian Journal of Agriculture Extension, Economics and
Sociology 5(2) 108-116.
El-Geddawy, L.H., Rady, M.S., Dawwam, H.A., Hendawy, A. and El-Ghait, R.A.M.A.
(2005). Response of some sugar cane varieties to nitrogen and potassium
application. Egypt. J. Agric. Res., 83(2): 693 707.
Fute, J. L (1990). Effect of herbicides on weeds, sugar content and yield of sugarcane
at low and high application volume. MSc. Thesis. Sokoine University of
Agriculture: Morogoro, Tanzania.

79
Gilbert, R. A., Shine J.R., MILLER, J. M., RICE, J. D. and RAINBOLT, C. R. (2005). The
effect of genotype, environment and time of harvest on sugarcane yields in
Florida, USA. Field Crops Research 95: 156-170.
Isa D. W. and H. F kalimba., (2000). Evaluation of Diuron 800 SC, Velpar 75 DF and
Sencor (70 WP) for controlling weeds in sugarcane at Kilombero and Mtibwa
Sugar Estates. Tropical Pest Management Bulletin, Volume. 1. No: 2, Sept - Dec
2000. pp19-26.
Jagtap, S.M., JadhavI M.B. and Kulkarm R.V. (2006). Effect of levels of NPK on yield
and quality of sugarcane (cv. Co. 7527). Ind. Sugar. 56: 35-40.
Kapur, R.D., Krishna, R.K. and Duttamajumdar S.K. (2011). A breeder’s perspective on
the tillers dynamics in sugarcane. Current science 100(2): 183-189
Kolage, A.K., Pilani, M.S., M.S. Munde M.S. and. Bhoi, P.G. (2001). Effect of fertilizer
levels on yield and quality of new sugarcane genotype. Ind. Sugar. 51: 375-382.
Mishra, P.J., Mishra, P.K. Biswal, S., Panda, S.K. and Mishra, M.K. (2004). Studies on
nutritional management in sugarcane seed crop of coastal Orissa. Ind. Sugar.
54:443-446.
Mtunda, K. J., Buza, T. J., A. B. Kiriwaguru, A.B. and Chilagane, A. (1998). Baseline
Survey on Sugarcane out growers in Mtibwa and Kilombero areas. Sugarcane
Research Institute
Nazir, M.S. (1994). Sugarcane. In: Crop production. Bashir E. and Bantel R. (Eds.).
National Book Foundation, Islamabad, Pakistan, pp 421-422.
Parker C and Riches, C R (1993). Parasitic weeds of the world: Biology and Control. CAB
Peng, S. Y (1984). Biology and control of weeds in sugarcane. Elsevier. Amsterdam-
366pp.
Ramaiah, K.V., Parker, C, Vasudeva Rao, M.J., and Musselman, L.J. (1983). Striga
identification and control handbook. Information Bulletin No. 15. Patancheru,
A.P., India: International Crops Research Institute for the Semi-Arid Tropics.
Ramesh S.A., Leonard B.E., Malathi, P. and Viswanathan, R.A. (2012). Min-Review on smut disease of sugarcane caused by Sporisorium scitamineum 5: Botany, 978-953-510355-4
Rugaimukamu, J. (2000). Herbicide evaluation, Kilombero Sugar Company Limited.
Agronomy department: A paper presented to annual Sugar Research Technical
Committee June at Kibaha Sugarcane Research Institute.
Saleem, M.F, Ghaffar, A., Anjum, S.A., Cheema, M.A. and Bilal, M.F. (2012). Effect of
Nitrogen on Growth and Yield of Sugarcane. A.J. 32
Singha, D.D. (2002). Nutrient requirement and time of application for sugarcane seed
crop. Ind. Sugar 51:875-880.
Sinha, V.P, Singh H. and Singh, B.K. (2005). Effect of genotype and fertility levels on
growth, yield and quality of sugarcane under rainfed conditions. Ind. Sugar
55:23-26.
Wiedenfeld, B. and J. Enciso. 2008. Sugarcane responses to irrigation and N in semiarid
South Texas. Agron. J. 100: 665-671.

80
4.0 SUGARCANE ENTOMOLOGY
4.1 Project Tittle: Study of seasonal insect population fluctuations influenced by weather changes and crop management practices in all estates and out growers fields. Project Number: CPE2018/01
Principal Investigators: J. M. Katundu, F. A. Urassa A. Yusuph and M. Mwinjummah.
Collaborators: A. Nassoro, N. Mlawa, Y. Kalinga and M. Salum, SBT
Reporting Period: 2018/2019.
Project summary
This study aimed at monitoring the seasonal insect pests that feed on sugarcane to
understand the current insect pest status, spread and seasonal trends in population build up
influenced by weather changes and crop management practices. Surveys were conducted in
selected fields to assess Stem borer (Eldana Saccharina), Yellow Sugarcane Aphids (Sipha
flava Forbes) and White scale (Aulacaspis tegalensis Zehnt) populations and extent and
intensity of damage caused by these insects on sugarcane in the estates and out growers
(OG) fields. Three key insect pests, the sugarcane stem borer, the white grub Cochliotis
melolonthoides Gerst and the sugarcane white scale were found in all estates and out
growers fields except for C. melolonthoides which is still confined to TPC and MSE estates.
White scale incidences are still widespread, the intensity of infestation has been very low
due to the use of varieties, such as R579, which are less susceptible to the insect damage.
TPC and KSL remain the most vulnerable areas for sugarcane stem borer attack.
4.1.1 Introduction
A wide range of insects pests such as stem borers, termites, white-grubs, scale insect,
mealy bug, army-worm and grasshoppers feed on sugarcane at various stages of its growth
and cause significant yield losses (Sathe et al., 2009). Many are only occasional feeders, but
in most regions where this crop is grown insect pests are a significant factor in the
economics of sugarcane production (James, 2004). In Tanzania, sugarcane stem borer,
whitescale, sugarcane white grubs and Yellow Sugarcane Aphid are the key insect pests
which feed on sugarcane (Anonymous, 2016). Other insects are usually classified as
occasional or sporadic pests.
Factors which determine insect population and level of damage they cause on the crop
include weather, varieties, natural enemies, agronomic practices and new invasions by
exotic insect pests (Sathe et al., 2009). Therefore, this study aimed to understand the
current insect pest status, spread and seasonal trends in population build up. The
information are useful in establishing immediate and future effective strategic management
measures. Also, the results will be used to advise growers on what time to make necessary
decision on management actions.
Specific Objectives
a) Monitoring of sugarcane stem borer Eldana saccharina, White scale Aulacaspis tegalensis,
and other insects.
b) Assessment of damage and crop losses caused by sugarcane stem borer and white scale.
c) Scouting of Yellow Sugarcane Aphid (YSA) (Sipha flava Forbes)

81
Outputs achieved
121 fields surveyed for sugarcane stem bore and white scale in all estates and 56 fields in
out growers fields.
Data on level of damage caused by stem borer and White scale in estates and OG
available.
48 fields surveyed for YSA in all estates fields and 140 in out growers fields.
4.1.2 Materials and Methods
Surveys were conducted in selected fields to assess Sugarcane stem borer (Eldana
Saccharina), YSA and white scale populations and extent and intensity of damage caused by
these insects on sugarcane in the estates and out growers (OG) fields. For white scale and
assessment, a total of fifty stalks were sampled in each field except in some OG fields or
multiplication blocks and variety trials in which twenty five or less stalks were taken for
assessment of sugarcane stem borer and white scale. In scouting of YSA the sampled fields
were divided into five sections where by two sampled stools from each section were
randomly selected for assessment of YSA damage and presence of predators.
4.1.3.1 Results and Discussion Sugar production in Tanzania is affected by four key insect pests, the sugarcane stem borer,
Eldana saccharina Walker the white grub Cochliotis melolonthoides Gerst, sugarcane white
scale Aulacaspis tegalensis Zehnt and Yellow Sugarcane Aphids Sipha flava Forbes. The two
pests (sugarcane stem borer and white scale) are present in all major estates in the country
except for C. melolonthoides which is still confined to TPC and MSE estates.
Sugarcane stem borer Infestation in Estate and Growers Fields
A total of 21 fields were assessed for sugarcane stem borer infestation at Kilombero estate
(Table 4.1) and only two fields had infestation above economic threshold of 4% internode
bored. At Kagera Sugar Limited, 49 fields were surveyed and 11 fields had infestation above
economic thresholds of 4% internodes bored. These fields were in rainfed area in which
were planted varieties N49, N47, N25, and N41. Variety N49 showed an extreme damage of
27.4% to 52.6% internodes bored. At TPC, a total of 33 fields were surveyed for stem borer
infestation where by only 5 fields had stem borer infestation above economic threshold of
4%. Generally this implies that sugarcane stem borer infestation in many surveyed fields in
all estates was below economic threshold. In out growers fields, in all estates, out of 56
fields surveyed only one field at Mtibwa was infested with sugarcane stem borer above
economic threshold. The advice given based on this results was that all fields whose
infestation was above economic threshold to be harvested immediately so as to minimize
the economic loss.

82
Table 4. 1: Number of Fields Surveyed for Eldana Infestation in Miller Cum
Planter (MCP) and Outgrowers Sugarcane
SURVEYED DATE
TPC KSL MSE KSC MANYARA TOTAL
Aug-18
12 (1) 12 (1)
Sept -18 14(0) 14(0)
Oct-18
28 (1) 10 (0)
28 (1)
Nov-18 9(1) 13 (1)
Dec-19
10 (0)
10 (0)
Feb-19 7 (2) 8 (7)
15 (9)
Mar-19 26 (3) 3(3) 29 (6)
TOTAL 33 (5) 49 (11) 10(0) 21(2) 14(0) 121 (18)
OUTGROWERS FIELDS
Dec -18 16 (0) 16 (0)
April-19 20(1) 20(0) 40 (1)
TOTAL 16 (0) 20 (0) 20(0) 56 (1)
White scale Infestation in MCP and Growers Fields
From August, 2018 to April, 2019 a total of 105 fields were surveyed for white scale
infestation in all estates. The summary of results in Table 4.2 shows that out of 105 MCP
fields, 68 fields were not infested, while the remaining 37 fields had low infestation of less
than 50 %. In Out growers fields only 3 fields out of 56 fields surveyed were infested with
white scale at low levels of less than 25 percent.

83
Table 4. 2: Number of Fields in Different Categories of Whitescale Infestation in
Miller Cum Planter (MCP) and out growers’ Sugarcane
MCP FIELDS
Date
Estate
Number of Fields in each Category of Infestation
Total None (0%) Low (< 50 %)
High (51%- 100%)
Aug-18 KSC 10 2 0 12
Oct-18 KSL 18 10 0 28
Oct-18 MSE 7 3 0 10
Nov-18 KSC 0 9 0 9
Nov-18 BAGAMOYO 3 2 0 5
Feb-19 TPC 7 0 0 7
Feb-19 KSL 0 8 0 8
Mar-19 TPC 23 3 0 26
TOTAL 68 37 0 105
OUTGROWERS FIELDS
Dec-18 KSL 16 0 0 16
April-19 KSC 17 3 0 20
MSE 20 0 0 20
TOTAL 53 3 0 56
On the other hand, Agronomy department at KSL have conducted about 646 sugarcane
stem borer surveys which included old and new commercial varieties of Co617 (77 samples),
N19 (50), N25 (205), N41 (82), N47 (54), N49 (64), R 570(30) and R579 (84). Those data
have been summarized to understand better the influences of main crop and environmental
factors on sugarcane stem borer population and damage on sugarcane. The graph in Fig 4.1
shows the relationship between varieties and percent internodes bored. Variety N49 had the
higher infestation of 7.7% internodes bored as compared to other varieties like N25 with 1.2
% internode bored although at almost similar cane age.
Moisture stress is an environmental factor which is known to increase the susceptibility of
sugarcane to sugarcane stem borer a damage (Anonymous, 2005). The summary of results
in Figure 4.2 shows the relationship between sugarcane stem borer infestation levels and
irrigation regimes at KSL. The results have shown higher levels of infestation (% internodes
bored) of sugarcane under rainfed (RF) as compared to center pivot (CP) irrigation regimes.
These results further emphasize the fact that areas prone with drought have higher
sugarcane stem borer infestation compared to irrigated areas.

84
Figure 4. 1: Relationship between Varieties and Eldana Infestation
Figure 4. 2: Influence of Irrigation Regimes on Eldana Infestation on Sugarcane
YSA Scouting in MCP and Growers Fields 2017/2018
During September, 2018 and October, 2018 a total of 188 fields were surveyed for Yellow
Sugarcane Aphids in MCP fields at Mtibwa, Manyara and Kilombero Cane Growers fields. The
results in Table 4.3 show that 16.7 % of the fields surveyed in Manyara had YSA infestation
above the economic threshold of 20% infested stools. Also, surveys conducted at MSE have
shown that 60% of the fields had YSA infestation above the economic threshold.
In response to reports of YSA outbreak in Kilombero Cane Growers’ sugarcane in September
2018, 140 fields were assessed and 71.4 % of them were found to have YSA infestation
above economic threshold and required immediate control action.
0
2
4
6
8
10
12
14
Ag
e(m
) a
nd
% in
tern
od
es b
ore
d
Varieties
Average of Age(m)
Average of % internodesbored
0
2
4
6
8
10
12
CP RF
Ag
e(m
) a
nd
%In
tern
od
e b
ore
d
Irrigation regime
Average of Age(m)
Average of %internodes bored

85
Table 4. 3: Number of Surveyed Fields for YSA Infestation in MCP and out
growers’ Sugarcane
SURVEYED DATE MSE KSC MANYARA TOTAL
Sept-18 - - 18 (3) 18 (3)
Oct-18 30 (18) - - 30 (18)
TOTAL 30 (18) - 18 (3) 48(21)
KILOMBERO CANE GROWERS FIELDS
Sept-18 - 140 (100) - 140 (100)
TOTAL - 140 (100) - 140(100)
() Number of fields with YSA infestation > 20 %.
At KSL, data of YSA infestation were collected and accumulated for several months in the
data base of Agronomy department and summarized in Table4.4 for this presentation. About
912 fields or 2297 ha, planted with nine commercial varieties, were surveyed between June,
2018 and March, 2019. The scouted fields had sugarcane of 4 – 4.6 (mean 4.3) months old
and YSA infestation of 13.9% – 20.3% (mean 17.5%) infested stools. High level of YSA
infestation may have been attributed by type of variety and crop age at the time of
sampling. The mean crop age at sampling of 4.3 months might have just missed the peak
YSA population which usually occurs when the plants are 3 to 4 months old ( Katundu,
Personal observations) Otherwise the threat of YSA is real as indicated by the increasing
trends of its incidence and intensity on sugarcane grown at the KSL. The data has confirmed
that none of the commercial varieties cultivated at Kagera are resistant to YSA though the
level of susceptibility vary between varieties.
Table 4. 4: Infestation levels of YSA on selected varieties in Surveyed MCP fields
at Kagera
Variety Number of
surveyed
fields
Total surveyed
Area
Average
Age(m)
Percent Infested
stools
CO617 358 1022 4.12 18.01
MN1 60 129 4.02 20.28
N19 38 83 4.58 15.36
N25 158 329 4.00 20.08
N41 52 131 4.36 18.76
N47 72 236 4.39 16.57
N49 16 39 4.29 13.93
R570 31 74 4.33 16.13
R579 127 254 4.64 17.96
Grand Total 912 2297
Average 4.30 17.45
Other Observations
A high incidence of an Entomopathogenic fungus (EP) of YSA was observed in field DR3B at
Kagera after heavy rains and humid conditions. By microscopic examination, the
characteristics white mycelial growth on the cadaver and in comparison with other common
insect pathogens of Aphids the EP was likely to be Verticillium lecanii. Thus it’s specific and

86
strain identification is necessary in future. Also the presence of a Coccinellidae predators
belonging to Scymnus sp was noted for further specific identification and evaluation of its
role in YSA control.
Conclusion
While the white scale incidences are still widespread, the intensity of infestation has
been very low due to the use of varieties, such as R579, which are less susceptible to
the insect damage. Therefore, introduction of relatively susceptible varieties such as
N47 should be done cautiously.
We would say that TPC and KSL remain the most vulnerable areas for Sugarcane stem
borer attack. Kagera, however, has the disadvantage of a long crop season so that the
sugarcane crop cannot be harvested below the age of 14 months as compared to TPC
where maturity tests can allow for harvesting at the age of 12 months or less. Also a
large area at KSL is rain fed and unfortunately, at the moment, we do not have suitable
varieties which are tolerant to Eldana damage and moisture stress to be deployed there.
Advice were given to all growers whose fields had Eldana infestation above economic
thresholds of 4% to be harvested in order to reduce the economic loss.
4.2 Project Title: Evaluation of white scale damage and sugar loss in selected varieties Project code: CPE 2018 /02
Principal investigators: J. M. Katundu, F. Urassa, A. Yusuph and M. Mwinjumah
Collaborators: Y. Kalinga
Reporting date: 2018/19
Project Summary
The sugarcane whitescale. Aulacaspis tegalensis (Zehntner) (Homoptera: Diaspididae) is one
of the most important pests in sugarcane in Tanzania. The white scale is a stem pest which
usually reduces juice quality of infested sugarcane. White scale damage in sugarcane
estates has been reported to cause about 30% sugar loss in heavily infested fields.
Information on yield losses and determination of appropriate control measures are important
for proper management recommendations. The objective of the present study was to
develop protocol for an artificial inoculation technique and later adopted for establishment of
high white scale insect pressure necessary for screening of new sugarcane varieties.
Adoption of the inoculation technique has enabled successful screening of varieties against
white scale damage in the field.
4.2.1 Introduction
The sugarcane white scale. Aulacaspis tegalensis (Zehntner) (Homoptera: Diaspididae) is
one of the most important pests in sugarcane in Tanzania which, if not managed, can cause
up to 30 % crop losses (Fewkes,1971).

87
Together with biological and cultural methods, use of resistant varieties is an important
component of white scale management. Therefore, resistance to whitescale is one of the
factors which must be considered in the selection of new varieties.
The previous results of research conducted at TPC and KSC based on natural insect
infestation have shown that assessment of white scale infestation in small plots of replicated
trials has not been able to provide substantial information on how test varieties would
respond to potential insect damage in large scale production.
In the proposed experiment a new inoculation technique has been used to ensure
establishment and sustained pest pressure during the selection process of new sugarcane
varieties.
Main Objectives
To provide quantitative information on risk potential of white scale in each of the new
varieties before and post release.
Specific objectives
a) To assess the establishment of white scale on test sugarcane varieties after artificial
inoculation.
b) To determine the effect of white scale on sucrose and TCH of different sugarcane
varieties.
Output
One variety potentially showing antixenosis to white scale identified.
4.2.3 Materials and Methods
Location: The experiment was conducted at KSC
Treatments: Sugarcane varieties namely TZ 93KA - 120, TZ 93KA - 122, R 85/1334,
B80689, KQ228 and EA70-97 as tolerant standard and MN1 or N25 as susceptible controls.
White scale inoculum source:
White scale eggs were collected from sugarcane stalks of infested fields and sieved. A
weighed spatula full amount of eggs were inoculated and covered with a screen or netting
material on four or two stalks of each variety per plot.
The design of the experiment:
Randomized Complete Block Design with 8 treatments and 5 replications.
Plot size: 4 rows X 10m.
Data collected and to be collected
White scale infestation (% stalk infested; white scale cover (WSCI).
Juice quality analysis (Brix; Purity; Pol; Sucrose).
Yield parameters (TCH; TSH)
4.2.4 Results and Discussion White scale establishment
The preliminary results in Table 4.5 indicate that the establishment of white scale in the
inoculated stalks was so poor that only 13.1 % of the inoculated stalks had low level of
white scale infestation and none in the high category. However, in this trial variety B80689
appeared to have been potentially most susceptible with the white scale establishment of

88
20% of the inoculated stalks, similar to MN1. The standard resistant check variety EA70-97
had zero white scale establishment and variety TZ 93KA – 120, with white scale
establishment on only 5% of the inoculated stalks, and could tentatively be considered
resistant to the insect pest.
Table 4. 5: Percentage of inoculated stalks of test varieties in different categories
of white scale cover
Categories
Variety None (0%) Low (<50%) High (51%- 100%)
TZ 93KA - 120 95 5 0
TZ 93KA - 122 85 15 0
R 85/ 1334 85 15 0
B80689 80 20 0
KQ228 85 15 0
EA 70-97 100 0 0
N25 85 15 0
MN1 80 20 0
MEAN 86.9 13.1 0
Way Forward
Collection of yield data for juice analysis
4.3 Project Title: Production of White scale predator, R. lophanthae, in screen house for field releases Project code: CPE 2017 /03
Principal investigator: J. M. Katundu, F. A. Urassa, A. Yusuph and M. Mwinjumah
Collaborators: Y. Kalinga, N. Mlawa, M. Salum and National Biological Control
Start date: 2017/2018
Reporting date: 2018/19
Project Summary
A study on the production of Rhyzobius lophanthae is being implemented in the screen
house at TARI-Kibaha. The objective is to produce Rhyzobius lophanthae for release in
sugarcane fields infested with white scales. The surveys conducted at TPC showed that both
and White scale and predators were not available as sources for screen house rearing.
4.3.1 Introduction
Whitescale has been a problem at TPC since 1968 which has caused losses up to 30% sugar
loss per annum (TPC Agronomy report, 1970). The control of whitescale has mainly
achieved by use of host plant resistance (self-trashing varieties) and natural enemies.
The predators (Rhyzobius lophanthae) has been effective in reducing whitescale infestation
at TPC and therefore there is a need to introduce it to other newly whitescale infested area.
This project aimed at producing the predator(R Lophanthae) in mass for release in
whitescale infested areas such as Mtibwa, Kilombero, Kagera and other Sugarcane growing
areas.

89
Main Objectives
The main objective of the project is to produce Rhyzobiuslophanthae in screen house for
release in sugarcane fields infested with whitescale.
Specific objectives
a) To study suitable conditions for population buildup of the predator, Rhyzobius
lophanthae (Coleoptera: Coccinalidae) in screen house and release sites.
b) To study the influence of pugnacious ant, Anoplolepiscustodiens (Hymenoptera:
Formicidae) on establishment of white scale predator, R. lophanthae for control of the
white scale in release sites.
Expected Output
Rhyzobiuslophanthae will be mass produced sufficient for release in infested by white
scale.
Data on effect of pugnacious ant, Anoplolepiscustodiens (Hymenoptera: Formicidae)
on biological control activity of Rhyzobius lophanthae (Coleoptera: Coccinalidae) will
be available.
4.3.2 Materials and Methods
Sugarcane varieties (N25, MN1) susceptible to whitescale infestation were planted in
February 2019 in the 20ltr capacity pots containing 20 Kg of sterilized soil which were placed
in the screen house at TARI-Kibaha. Cuttings used were of two nodes collected from TARI-
Kibaha sugarcane germplasm. For each variety, seven pots were arranged in single row.
Three cuttings were planted in each pot. Sugarcane plants were fertilized and watered
regularly to maintain the health of plants throughout the study.
Project status
The project is in progress

90
4.4 Project title: The Effectiveness of Prophylactic Soil Treatment and Foliar Applications of locally available insecticides for Yellow Sugarcane Aphids control at Kilombero Estate Principal Investigator: J.M. Katundu, F. A. Urassa, A. Yusuph and M. Mwinjumah
Project code: CPE 2018/04
Collaborators: Y. Kalinga
Start Date: 2018
Reporting date: 2018/19
Project Summary
This study was carried out at Kilombero Sugar Estate fields in two sites (field 314 and field
325) to evaluate the effectiveness of Attackan, Actara, Drone, Pirimicarb and Abamectin in
the control of YSA. Treatments were arranged in RCBD replicated four times. Mode of
insecticide application were soil and foliar, applied at most two times on entire season.
Results have indicated that on the average at field 314, Actara (8 WAP) + Drone (12 WAP),
Piricab (8 WAP) + (12 WAP), Drone (8 WAP), and Attakan (8 WAP) were more effective
than untreated plots. For field 325, Attackan (8 WAP), Actara (8WAP), Drone (8 WAP)
Attackan (8 WAP + 12 WAP), Actara (8 WAP + 12 WAP) and Drone (8 WAP + 12 WAP) have
all indicated percentage reduction 55.2% to 75.5% of YSA control. Neonicotinoids
insecticides (Attackan, Drone and Actara) are highly effective in reduction of YSA population
and damage on sugarcane.
4.4.1 Introduction
The Yellow Sugarcane Aphid (YSA), Sipha flava (Forbes) (Homoptera: Aphididae) invaded
Tanzania in May, 2016 when the country had no registered insecticides for its control.
Sugarcane growers in Kilombero have desperately used different insecticides which have
been locally available but have no sugarcane label in controlling YSA. Among the products
used by cane growers were Attakan 350 SC, Actara 250 WG which belongs to
Neonicotinoids, and Piricab 50 WDG and Abanil 18 EC which belongs to carbamate and
microbial families respectively.
Neonicotinoids insecticides act on the post-synaptic nicotinic acetylcholine receptors in the
central and peripheral nervous systems, resulting in excitation and paralysis, followed by
death of insect (Tomizawa and Casida, 2003). Many of these compounds are sufficiently
xylem mobile to be suitable for soil application.
Carbamate insecticides are both acetylcholinesterase inhibitors, interfering with the
transmission of nerve impulses across the synaptic gap between two nerve cells by
preventing the breakdown of the predominant neurotransmitter, acetylcholine (Tomizawa
and Casida, 2003). This results in tetanic paralysis that destroys the ability of insects and
other organisms to respond to external stimuli.
Thus it was important for researchers to test these insecticides to determine their efficacies
in the control of YSA so that they can also be included in the registration of chemicals
recommended for management of YSA in Tanzania.

91
Main Objective
To find suitable prophylactic and augmentative insecticides to be used in soil and foliar
applications for sustainable YSA management that have a reduced impacts on natural
enemies.
Specific Objectives
a) To test the efficacy of insecticides available in local Agricultural Inputs Stores for YSA
control
b) To study the effect of the tested insecticides on YSA natural enemies.
Outputs
Four insecticides effective in managing YSA known
Means of insecticide application identified
Insecticides affecting natural enemies known
4.4.2 Materials and Methods
Two fields which had relatively high incidences of YSA infestation were selected for
establishment of the trials at KSC. Randomized Complete Block Design was employed with
four replications.
Insecticides tested in these trials are described in Table 4.6 below.
As a prophylactic treatment, Attakan 350 SC (imidacloprid) was soil applied at the rate of
2.0 L per ha at planting. Also Attakan 350 SC (2.0 L/ha), Actara 250 WG (thiamethoxam) at
800 g/ ha) and Drone 222 SL (acetamiprid) at 1.35 L/ha were tested as augmentative
treatments by foliar application. Since the above three insecticides belong to the group of
neonicotinoids, alternatively, Pirimicarb (Piricab 50 WDG) at 396 g/ha and Abamectin (Abanil
18 EC) at 300ml/ha, insecticides which belong to the carbamate and microbial families,
respectively were also included in the trials.
Foliar applications were either fixed at approximately 8 Weeks After Planting (WAP) and 12
WAP or when the YSA infestation reached 20 – 30 % infested stools.
For field 314, the total number of treatments were nine which were: Attackan (8 WAP),
Abamectin (8 WAP), Actara (8 WAP), Drone (8 WAP), Pirimicarb (8 WAP), Abamectin (8
WAP) + (12 WAP), Actara (8 WAP) + Drone (12 WAP), Pirimicarb (8 WAP) + (12 WAP), and
Control (no foliar spraying).
Twelve treatments for field 325 were: Attackan (soil), Attackan (8 WAP), Abamectin (8
WAP), Actara (8 WAP), Drone (8 WAP), Pirimicarb (8 WAP), Attackan (8 WAP + 12 WAP),
Abamectin (8 WAP + 12 WAP), Actara (8 WAP + 12 WAP), Drone (8 WAP + 12 WAP),
Pirimicarb (8 WAP + 12 WAP), Control. The plot size was four rows by ten meter and space
between plots was two meter.

92
Table 4. 6: Descriptions of the insecticides tested against the YSA
Trade name
and
formulation
Active
ingredient
Active
ingredient(a
i) %
Application rate
of formulation
(L/Kg/Ha)
Application methods
and Timing
Drone 222 SL Acetamiprid 22.2% 1.35L per ha Foliar
Attakan 350
SC®
Imidacloprid 35% 2.0 L per ha Soil at planting and
Foliar
Actara 250 WG Thiamethoxam 25% 800g per ha Foliar at 8 and 12 WAP
Piricab 50%
WDG
Pirimicarb 50% 396 g per ha Foliar at 8 and 12 WAP
Abanil 18EC Abamectin 1.8% 300 ml per ha Foliar at 8 and 12 WAP
SL: Soluble Liquid; SC: Suspension Concentrate; WDG: Water Dispersible Granules. WG:
Wettable Granules; EC: Emulsifiable Concentrate; WAP Weeks after Planting
Statistical analysis
Data were analyzed using Genstat statistical package by one-way ANOVA. Means were
separated by Duncan’s Multiple Range Test (DMRT).
4.4.3 Results and Discussion
Experiment in Field 314
Table 4.7 shows that YSA control was achieved in most insecticides two weeks after
application, except Abamectin treatments (both one and two applications) which were least
effective. Foliar applications of Attakan at 8 WAP, Actara (8 WAP) + Drone (12 WAP), Actara
(8 WAP) and Drone (8 WAP) were in descending order the most effective in reducing the
YSA population in the trial (Table 4.7, Fig4.5 to Fig 4.7).
The different insecticides treatments have not been consistent in reducing YSA damage on
sugarcane leaves although on the average, Actara (8 WAP) + Drone (12 WAP), Piricab (8
WAP) + (12 WAP), Drone (8 WAP), and Attakan (8 WAP) were significantly (P≤0.05) more
effective than untreated plots. A similar trend was shown with all treatments yielding more
than control. Attakan (8 WAP) had significantly (P≤0.05) highest TCH (143.6) and Tons Brix
per ha (33.2) as compared to control (TCH 127.0 and 28.2 Tons Brix per ha).

93
Table 4. 7: Mean number of YSA colonies per stalk in different treatments and sampling periods (Log 10 (x + 1) Transf.))
Treatments
Sampling Periods
10.7
WAP
13.3
WAP
15.6
WAP
17.7WA
P
19.9
WAP
21.9
WAP
23.9
WAP
25.9
WAP
27.9
WAP
29.9
WAP
Attackan (8) 0.498 a 0.088 ab 0.084 a 0.037 ab 0.00 a 0.207 a 0.020 a 0 0 0
Abamectin (8) 0.502 a 0.442 b 0.238 a 0.037 ab 0.0365 a 0.363 a 0.056 a 0 0 0
Actara (8) 0.467 a 0.112 ab 0.169 a 0.051 ab 0.0365 a 0.385 a 0.088 a 0 0 0
Drone (8) 0.502 a 0.238 ab 0.137 a 0.037 ab 0.0198 a 0.210 a 0.0 a 0 0 0
Pirimicarb (8) 0.473 a 0.371 b 0.245 a 0.0 ab 0.0198 a 0.323 a 0.071 a 0 0 0
Abamectin (8) +(12) 0.411 a 0.388 b 0.297 a 0.158 b 0.0198 a 0.397 a 0.0 a 0 0 0
Actara (8) + Drone (12) 0.298 a 0.107 ab 0.056 a 0.0 ab 0.0365 a 0.137 a 0.020 a 0 0 0
Pirimicarb (8) + (12) 0.557 a 0.299 ab 0.212 0.051 ab 0.051 a 0.343 a 0.020 a 0 0 0
Control (no foliar
spraying)
0.461 a 0.409 b 0.259 a 0.076 ab 0.00 a 0.292 a 0.071 a 0 0 0
Mean 0.463 0.273 0.188 0.05 0.0244 0.295 0.038 0 0 0
SE 0.1811 0.1546 0.1743 0.067 0.05939 0.197 0.0664 0 0 0
LSD 0.2643 0.2256 0.2543 0.0977 0.08667 0.2875 0.0969 0 0 0
CV % 39.1 56.7 92.4 135.1 242.9 66.7 173.2 0 0 0
Note: WAP=Weeks After Planting

94
Table 4. 8: Mean percent infested leaves per stalk in different treatments and sampling periods
Treatments
Sampling Periods
10.7 WAP 13.3
WAP
15.6
WAP
17.7
WAP
19.9
WAP
21.9
WAP
23.9
WAP
25.9
WAP
27.9
WAP
29.9
WAP
Attackan (8) 24.78 a 18.01 a 17.19 ab 18.02 a 9.9 a 26.39 a 18.18 a 15.0 a 12.7 a 11.1 abc
Abamectin (8) 23.95 a 18.63 a 19.5 ab 18.96 a 8.8 a 29.76 a 18.38 a 12.11 a 10.3 a 2.7 ab
Actara (8) 20.41 a 20.33 a 15.27 ab 17.8 a 11.2 a 29.64 a 19.73 a 14.56 a 12.2 a 15.4 bc
Drone (8) 25.09 a 15.59 a 11.91 ab 14.82 a 15.1 a 27.53 a 13.52 a 12.01 a 20.1 a 19.9 bc
Pirimicarb (8) 25.49 a 20.8 a 14.61 ab 18.69 a 14.2 a 29.54 a 17.98 a 14.91 a 14.2 a 11.5 abc
Abamectin (8) +(12) 21.76 a 19.42 a 20.07 b 26.38 a 11.3 a 28.56 a 16.44 a 14.71 a 14.3 a 12.0 abc
Actara (8) + Drone (12) 17.4 a 16.96 a 10.12 ab 18.28 a 12.2 a 24.72 a 16.95 a 15.29 a 19.6 a 9.1 abc
Pirimicarb (8) + (12) 26.05 a 16.54 a 12.22 ab 15.14 a 9.2 a 28.44 a 18.53 a 11.52 a 10.1 a 13.0 abc
Control (no foliar
spraying)
26.01 a 20.12 a 19.4 ab 20.72 a 5.1 a 25.42 a 17.05 a 14.33 a 18.1 a 21.9 c
Mean 23.44 18.49 15.59 18.81 10.8 27.78 17.42 13.83 14.6 13
SE 5.03 4.02 5.837 4.966 6.2 5.081 4.978 3.319 7.37 7.61
LSD 7.341 5.867 8.519 7.264 9.04 7.415 7.265 4.844 10.76 11.11
CV % 21.5 21.7 37.4 26.4 57.5 18.3 28.6 24 50.4 58.7
Note: WAP=Weeks After Planting

95
Table 4. 9: Mean percent damage leaves per stalk in different treatments and sampling periods on leaves per stalk
Treatment
Sampling Periods
10.7 WAP 13.3 WAP 15.6 WAP 17.7WAP 19.9 WAP 21.9 WAP 23.9 WAP 25.9 WAP 27.9 WAP 29.9 WAP
Attackan (8) 11.89 ab 28.2 a 22.3 abc 16.7 ab 14.2 a 42.69 a 28.5 a 22.0 a 11.0 a 13.4
Abamectin (8) 9.54 ab 34.6 a 24.0 abc 22.9 ab 13.5 a 46.12 a 26.9 a 20.1 a 14.4 a 4.6
Actara (8) 12 18 ab 25.9 a 21.8 abc 21.5 ab 11.0 a 46.0 a 27.4 a 24.1 a 19.0 a 22.1
Drone (8) 12.81 ab 24.9 a 12.4 abc 14.4 ab 16.4 a 43.87 a 18.9 a 16.1 a 20.4 a 17.8
Pirimicarb (8) 18.13 b 31.0 a 25.7 abc 18.4 ab 17.2 a 45.89 a 24.0 a 22.8 a 19.4 a 13.1
Abamectin (8) +(12)
10.17 ab 30.1 a 29.8 c 30.0 b 14.3 a 44.89 a 21.0 a 24.9 a 15.1 a 23.2
Actara (8) + Drone (12)
4.76 ab 21.8 a 11.3 a 17.6 ab 13.7 a 40.99 a 27.4 a 22.3 a 20.3 a 9.9
Pirimicarb (8)
+ (12)
13.55 ab 30.0 a 15.5 abc 17.6 ab 7.9 a 44.8 a 26.6 a 19.9 a 12.3 a 13.9
Control 11.95 ab 28.6 a 26.7 bc 25.3 ab 9.0 a 41.74 a 26.5 a 23.4 a 20.2 a 18.5
Mean 11.7 28.41 21 20.5 13 44.1 25.2 21.8 16.9 15.2
SE 6.84 8.72 9.05 6.55 7.36 5.149 7.06 6.59 8.37 9.43
LSD 9.99 12.73 13.2 9.57 10.74 7.515 10.31 9.62 12.22 13.75
CV % 58.7 30.8 43 32 56.5 11.7 28 30.2 49.6 62.2
Note: WAP=Weeks After Planting

96
Table 4. 10: Effects of Treatments on mean stalk population, Cane yield and
Brix%
Treatment Stalk Pop. per Ha TCH Ton Brix/ha
Attackan (8) 95841 a 143.6 a 33.2 a
Abamectin (8) 89799 a 134.7 a 26.6 a
Actara (8) 91605 a 131.0 a 26.4 a
Drone (8) 90285 a 129.6 a 26.4 a
Pirimicarb (8) 85007 a 133.2 a 23.9 a
Abamectin (8) +(12) 94938 a 132.4 a 25.2 a
Actara (8) + Drone (12) 97925 a 131.4 a 26.1 a
Pirimicarb (8) + (12) 88062 a 130.3 a 28.1 a
Control 82716 a 127.0 a 28.2 a
Mean 90686 132.58 27.10
SE 15237.3 29.1 5.78
LSD 22237.3 42.47 8.4
CV% 16.8 22.0 21.3
Table 4. 11: Ranking of seasonal performances of the insecticides treatments on
YSA populations and damage parameters
Treatments YSA
colonies
% Infested
leaves
%
Damage
Ranking
Total Final
Attackan (8) 2 4 4 10 2
Abanil (8) 8 3 5 16 6
Actara (8) 4 6 8 18 4
Drone (8) 3 5 2 10 3
Piricab (8) 5 7 6 18 7
Abanil (8) +(12) 9 8 9 26 8
Actara (8) + Drone (12)
1 1 3 1
Piricab (8) + (12) 6 2 3 11 5
Control (no foliar
spraying)
7 9 7 23 9

97
Figure 4. 3: The Mean Effects of Different Insecticides Treatments on YSA
Population
Figure 4. 4: Seasonal Mean Percent Infested Leaves in Different Insecticides
Treatments
0
0.05
0.1
0.15
0.2
0.25N
um
ber
of
YS
A C
olo
nie
s p
er S
talk
Treatments and Application Periods (Weeks After Planting)
0
5
10
15
20
25
Mean
Perc
en
t In
feste
d L
eav
es p
er
Sta
lk
Treatments and Application Time (Weeks after Planting)

98
Figure 4. 5: Seasonal Mean Percent Damage on Leaves in Different Insecticides
Treatments
Experiment in field 325
Considerable reduction in predator numbers was recorded in plots treated with Attackan (8
WAP), Drone (8 WAP + 12 WAP), Actara (8 WAP + 12 WAP) and Attackan (8 WAP + 12
WAP). Abamectin (8 WAP), Abamectin (8 WAP + 12 WAP). Attackan (soil), Pirimicarb (8
WAP), Pirimicarb (8 WAP + 12 WAP) and Drone (8 WAP) had comparable predator
populations with control.
Attackan (8 WAP), Actara (8WAP), Drone (8 WAP) Attackan (8 WAP + 12 WAP), Actara (8
WAP + 12 WAP) and Drone (8 WAP + 12 WAP) have all indicated reduction ranging from
55.2% to 75.5% reduction of YSA control and as illustrated in Fig.4.9 only one application of
these treatments may be sufficient in order to avoid their detrimental effects on predators.
The same trends of effectiveness of the neonictinoids (Attackan, Drone and Actara) have
been demonstrated in reduction of YSA damage on sugarcane leaves (Figures 4.14 and
4.15).
0
5
10
15
20
25
30
Attackan(8)
Abamectin(8)
Actara (8) Drone (8) Pirimicarb(8)
Abamectin(8) +(12)
Actara (8)+ Drone
(12)
Pirimicarb(8) + (12)
Control(no foliarspraying)
% D
am
ag
e o
n L
eav
es
Treatments and Application Time (Weeks after Planting)
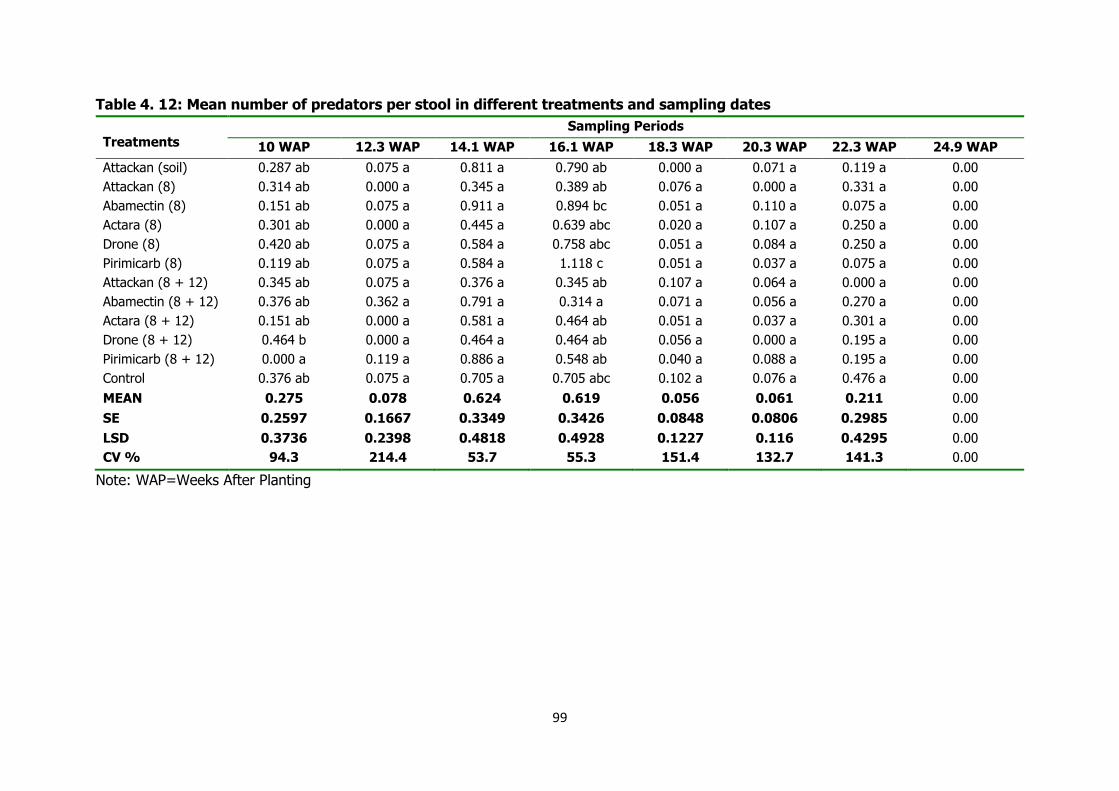
99
Table 4. 12: Mean number of predators per stool in different treatments and sampling dates
Treatments
Sampling Periods
10 WAP 12.3 WAP 14.1 WAP 16.1 WAP 18.3 WAP 20.3 WAP 22.3 WAP 24.9 WAP
Attackan (soil) 0.287 ab 0.075 a 0.811 a 0.790 ab 0.000 a 0.071 a 0.119 a 0.00
Attackan (8) 0.314 ab 0.000 a 0.345 a 0.389 ab 0.076 a 0.000 a 0.331 a 0.00
Abamectin (8) 0.151 ab 0.075 a 0.911 a 0.894 bc 0.051 a 0.110 a 0.075 a 0.00
Actara (8) 0.301 ab 0.000 a 0.445 a 0.639 abc 0.020 a 0.107 a 0.250 a 0.00
Drone (8) 0.420 ab 0.075 a 0.584 a 0.758 abc 0.051 a 0.084 a 0.250 a 0.00
Pirimicarb (8) 0.119 ab 0.075 a 0.584 a 1.118 c 0.051 a 0.037 a 0.075 a 0.00
Attackan (8 + 12) 0.345 ab 0.075 a 0.376 a 0.345 ab 0.107 a 0.064 a 0.000 a 0.00
Abamectin (8 + 12) 0.376 ab 0.362 a 0.791 a 0.314 a 0.071 a 0.056 a 0.270 a 0.00
Actara (8 + 12) 0.151 ab 0.000 a 0.581 a 0.464 ab 0.051 a 0.037 a 0.301 a 0.00
Drone (8 + 12) 0.464 b 0.000 a 0.464 a 0.464 ab 0.056 a 0.000 a 0.195 a 0.00
Pirimicarb (8 + 12) 0.000 a 0.119 a 0.886 a 0.548 ab 0.040 a 0.088 a 0.195 a 0.00
Control 0.376 ab 0.075 a 0.705 a 0.705 abc 0.102 a 0.076 a 0.476 a 0.00
MEAN 0.275 0.078 0.624 0.619 0.056 0.061 0.211 0.00
SE 0.2597 0.1667 0.3349 0.3426 0.0848 0.0806 0.2985 0.00
LSD 0.3736 0.2398 0.4818 0.4928 0.1227 0.116 0.4295 0.00
CV % 94.3 214.4 53.7 55.3 151.4 132.7 141.3 0.00
Note: WAP=Weeks After Planting

100
Table 4. 13: Mean number of YSA colonies per stalk in different treatments and sampling dates
Treatment
Sampling Periods
10 WAP 12.3 WAP 14.1 WAP 16.1 WAP 18.3 WAP 20.3 WAP 22.3 WAP 24.9 WAP
Attackan (soil) 0.389 a 0.719 d 0.887 b 0.258 a 0.125 ab 0.051 a 0.0198 a 0
Attackan (8) 0.412 a 0.112 a 0.277 a 0.105 a 0.064 ab 0.051 a 0.08 0
Abamectin (8) 0.535 a 0.673 cd 0.841 b 0.343 a 0.135 ab 0.119 a 0.00 0
Actara (8) 0.332 a 0.312 abc 0.779 b 0.19 a 0.177 ab 0.064 a 0.000 a 0
Drone (8) 0.392 a 0.037 a 0.444 ab 0.278 a 0.312 b 0.040 a 0.0198 a 0
Pirimicarb (8) 0.285 a 0.662 cd 0.861 b 0.349 a 0.120 ab 0.000 a 0.000 a 0
Attackan (8 + 12) 0.404 a 0.088 a 0.455 ab 0.251 a 0.000 ab 0.000 a 0.0365 a 0
Abamectin (8 + 12) 0.339 a 0.695 cd 0.731 ab 0.12 a 0.086 ab 0.000 a 0.0198 a 0
Actara (8 + 12) 0.237 a 0.306 abc 0.445 ab 0.086 a 0.198 ab 0.000 a 0.000 a 0
Drone (8 + 12) 0.378 a 0.243 ab 0.550 ab 0.075 a 0.020 ab 0.000 a 0.000 a 0
Pirimicarb (8 + 12) 0.433 a 0.624 bcd 0.680 ab 0.322 a 0.132 ab 0.061 a 0.0198 a 0
Control 0.376 a 0.682 cd 0.592 ab 0.151 a 0.207 ab 0.020 a 0.000 a 0
MEAN 0.38 0.429 0.6285 0.211 0.13 0.03 0.0159 0
SE 0.1983 0.2445 0.2877 0.1853 0.1484 0.0893 0.05212 0
LSD 0.2853 0.3518 0.4139 0.2666 0.2135 0.1284 0.07498 0
CV % 52.7 57 45.8 87.9 113 270.8 327.5 0
Note: WAP=Weeks After Planting

101
Table 4. 14: Mean percent infested leaves per stalk in different treatments and sampling dates
Treatment Sampling Periods
10 WAP 12.3 WAP 14.1 WAP 16.1 WAP 18.3 WAP 20.3 WAP 22.3 WAP 24.9 WAP
Attackan (soil) 18.09 a 16.97 ab 23.46 b 22.09 cd 20.95 ab 14.01 ab 9.67 a 0
Attackan (8) 18.26 a 13.73 ab 19.87 ab 14.99 abc 17.16 ab 13.21 ab 4.22 a 0
Abamectin (8) 23.10 a 17.85 b 16.16 ab 28.11 d 24.20 b 12.56 ab 5.30 a 0
Actara (8) 17.91 a 13.64 ab 15.25 ab 18.07 abcd 18.70 ab 9.19 a 10.08 a 0
Drone (8) 18.48 a 15.64 ab 18.56 ab 9.87 a 20.98 ab 16.95 ab 7.33 a 0
Pirimicarb (8) 18.67 a 15.47 ab 22.61 ab 21.58 bcd 23.57 ab 12.43 ab 8.71 a 0
Attackan (8 + 12) 17.95 a 8.26 a 13.85 a 18.11 abcd 17.22 ab 8.96 a 8.22 a 0
Abamectin (8 + 12) 22.43 a 15.78 ab 23.07 b 19.51 abcd 22.60 ab 14.58 ab 4.88 a 0
Actara (8 + 12) 15.82 a 11.56 ab 24.21 b 19.10 abcd 19.53 ab 17.17 ab 5.21 a 0
Drone (8 + 12) 19.21 a 13.84 ab 24.37 b 10.65 ab 18.57 ab 18.40 b 7.61 a 0
Pirimicarb (8 + 12) 20.34 a 13.52 ab 23.18 b 21.77 bcd 20.83 ab 15.61 ab 4.03 0
Control 19.02 a 15.30 ab 24.51 b 19.50 abcd 16.74 a 14.30 ab 2.91 a 0
MEAN 19.11 14.3 20.76 18.61 20.09 13 95 6.51 0
SE 5.117 5.226 5.498 6.698 4.278 5.354 6.572 0
LSD 7.361 7.518 7.909 9.636 6.154 7.702 9.454 0
CV % 26.8 36.6 26.5 36 21.3 38.4 100.9 0
Note: WAP=Weeks after Planting

102
Table 4. 15: Mean percent damage on leaves per stalk in different treatments and sampling dates
Treatment Sampling Periods
10 WAP 12.3 W AP 14.1 WAP 16.1 WAP 18.3 WAP 20.3 WAP 22.3 WAP 24.9 WAP
Attackan (soil) 29.5 a 26.0 b 27.99 cd 39.7 cd 38.5 ab 16.6 a 18.1 b 0 Attackan (8) 24.5 a 19.1 ab 16.76 ab 21.8 ab 30.9 ab 24.4 a 4.1 ab 0 Abamectin (8) 29.4 a 22.4 b 31.54 cd 42.2 d 40.6 b 20.5 a 7.9 ab 0 Actara (8) 25.5 a 12.8 ab 8.72 a 32.3 abcd 28.3 ab 13.4 a 13.2 ab 0 Drone (8) 29.1 a 13.6 ab 14.17 ab 15.9 a 39.3 ab 21.2 a 2.0 a 0 Pirimicarb (8) 26.4 a 18.9 ab 30.48 cd 37.1 bcd 38.8 ab 18.1 a 11.5 ab 0 Attackan (8 + 12) 24.1 a 6.4 a 9.95 a 24.1 abc 29.7 ab 13.3 a 8.9 ab 0 Abamectin (8 + 12) 39.7 a 23.0 b 33.21 d 32.0 abcd 41.9 b 24.9 a 2.9 a 0 Actara (8 + 12) 28.5 a 15.5 ab 22.74 bc 24.0 abc 33.3 ab 26.5 a 11.6 ab 0 Drone (8 + 12) 26.6 a 13.8 ab 16.12 ab 18.6 a 24.2 a 25.6 a 10.7 ab 0 Pirimicarb (8 + 12) 26.6 a 15.2 ab 27.26 cd 37.3 bcd 36.3 ab 24.2 a 7.3 ab 0 Control 28.3 a 23.1 b 34.52 d 27.3 abcd 33.1 ab 22.4 a 3.5 ab 0 MEAN 28.20 17.500 22.79 29.400 34.60 20.90 8.5 0 SE 10.04 8.57 5.999 10.48 9.52 8.9 8.72 0 LSD 14.44 12.33 8.631 15.07 13.69 12.81 12.54 0 CV % 35.6 49 26.3 35.7 27.5 42.5 102 9 0
Note: WAP=Weeks After Planting

103
Figure 4. 6: The Effects of Different Insecticides Treatments on Predator Population
Figure 4. 7: The Seasonal Effects of Different Insecticides Treatments on YSA
Population
0.000.100.200.300.400.500.600.700.800.901.00
Nu
mb
er
of
Pre
da
tors
pe
r S
too
l
Treatments and Application Time (Weeks after Planting)
0
1
2
3
4
5
6
Nu
mb
er
of
YS
A C
olo
nie
s p
er
Sta
lk
Treatments and Application Time (Weeks after Planting)

104
Figure 4. 8: The Mean Seasonal Effects of Insecticides Treatments on Percent Infested
Stalks
Figure 4. 9: The Seasonal Mean % Damage on Leaves in Different Treatments
0.00
5.00
10.00
15.00
20.00
25.00
30.00
35.00
40.00
45.00
% D
am
ag
e o
n L
eav
es
Treatments and Application Time Weeks After planting
02468
101214161820
% I
nfe
ste
d L
eav
es p
er
Sta
lk
Treatments and Application Time weeks After Planting Time

105
Impact of insecticides applications on predator populations
All chemicals except abamectin has shown negative impacts on predators compared to untreated
(Fig 4.12). Also soil applied attackan appears to preserve more predators compared to other
treatments. Attackan soil applied had shown less reduction in number of predators than foliar
applied Attackan.
Figure 4. 10: Seasonal mean number of predators per stool in different treatments
Conclusion
The two insecticides trials conducted at Kilombero have therefore demonstrated that the
neonicotinoids insecticides (Attackan, Drone and Actara) are highly effective in reduction of YSA
population.
4.5 Project Tittle: Impacts of predators on Population dynamics of Yellow Sugarcane Aphid in Kilombero and Kagera Estates Project Number: CPE2018/05
Principal Investigators: J. M. Katundu, F. A. Urassa A. Yusuph and M. Mwinjummah.
Collaborators: Y. Kalinga, A. Nassoro
Reporting Period: 2018/2019.
Project Summary
Field surveys of seasonal changes in the abundance of Yellow Sugarcane Aphid (YSA) and
predators, and exclusion cages were used to investigate the impacts of the resident generalist
predators in reducing populations of the YSA in sugarcane. The mosquito netting with aperture
size of 4.0 mm was used to allow entry of YSA and small predators and to exclude in the cage the
large Coccinellidae and Syriphidae species.
0.00
0.10
0.20
0.30
0.40
0.50
0.60
0.70
0.80
0.90
1.00
Nu
mb
er
of
pre
da
tors
Treatments and Application Time Weeks After planting

106
The regular field surveys have shown strong associations and correlations between numbers of
the YSA colonies and predators, and together with observations of actual feeding provided
evidence of the role of these natural enemies on YSA population regulation. Also, results of the
exclusion method have shown that YSA population could increase three to five times in the
absence of the generalist Coccinellid predators. Predators suppress YSA populations in early part
of the season and followed by the general decline in aphid infestation when the sugarcane plants
get older.
4.5.1 Introduction
Aphidophagous predators are the most abundant generalist predators of aphid populations
(Hodek, van Emden, and Honek, 2012). Since the occurrence of Yellow Sugarcane Aphid (YSA) in
Tanzania several species of ladybirds, lacewings and hoverflies have been recorded to feed on
YSA (Anonymous, 2016)
Several species of predatory insects in the families of Coccinellidae (ladybirds), Syriphidae
(hoverflies), Chrysopidae (lacewings) and Forficulidae (earwigs) have been observed on
sugarcane infested with YSA in Tanzania(Anonymous, 2016). Coccinellidae species including
Hippodamiavariegata (Goeze), Cheilomeneslunata (F), C. sulphurea(Olivier), C. propinqua
(Mulsant), and Exochomus nigromaculatus(Goeze) and Syriphidae species such as Xanthogramma
scutellareaegyptium (Wied) have been found to be among the most dominant predators which are
usually present earlier in the season when YSA densities are low.
These predators are usually found to be abundant in the fields but their effectiveness in
controlling YSA has not been established. The present investigations studied the impacts of the
resident adults and larvae of Coccinellid and Syriphid predators in reducing populations of the YSA
in sugarcane by field surveys of seasonal changes in the abundance of prey and predator, and
secondly by using a method of partial exclusion cages and open plots as per Dent (1991); and
Hodek et al. (2012). Also to assess the impact of reduction of predator numbers by using
insecticides on the YSA population on infested sugarcane.
Specific Objectives
a) To determine the effectiveness of predators on YSA control on sugarcane.
b) To study population fluctuations of the predators and YSA in sugarcane.
c) To study the effect of foliar application of the insecticides on predators, YSA and YSA
resurgence.
Outputs
Two (Physical and chemical) predator exclusion trials have been set up at Kilombero and
Kagera.
Data on the level of predators in control of YSA available.

107
4.5.2 Materials and Methods
This study involved two trials conducted in Kilombero and Kagera estates with cage and chemical
treatments respectively.
Treatments:
First trial
Cage (Physical exclusion of predators): Treatments - (A) Cage and (B)Open plots
Second Trial
Chemical exclusion: Five treatments - 4 insecticides Pirirmicarb (carbamate), Profenofos
(organophosphate), Deltamethrin (pyrethroid), Acetamiprid (neonicotinoid) and untreated control.
First Trials: Physical exclusion of predators by using Cages
Investigations by using Partial Exclusion Cages were conducted in sugarcane fields at Kilombero
(Field 682) and Kagera (Field DR3B) from August 2018 to March, 2019.Treatments were
replicated four times in Randomized Complete block design. The plot and cage sizes were
approximately 10 m2 which varied according to plant spacing used in each field.
Kilombero (Field 682) Kagera (Field DR3B)
Plot size 3.6 m (2 rows) X 3.0 m 5 m (4 rows) X2 m
Space between plots 0 m (adjacent) 0 m (adjacent)
Spacing between rows 1.8 m 1.7 m * 0.7 m
Number of plots 8 8
Cage size (four cages,
and four open plots )
3.6 m(2 rows) X 3.0 m X 2 m
height 5 m (4 rows) X2 m X 2 m height
The cages were made by wooden frames with mosquito polyester netting of mesh size of ten
holes per 1.0 sq. inch or aperture size of approximately 4.0 mm. The lower portion of the net
sewn with a polythene tube material so that 15 cm was sunk in soil and covered. The mesh size
of mosquito netting was selected to allow entry of YSA and small predators and to exclude in the
cage the large Coccinellid and syriphid predators which are dominant, and assumed to be
important in the regulation of YSA population in the field.
Second Trials: Investigations using chemical exclusion
This experiment was assessing the impact of reduction of predator numbers by using insecticides
on the YSA population on infested sugarcane.
Four insecticides Pirimicarb (carbamate), Profenofos (organophosphate), Deltamethrin
(pyrethroid) and Acetamiprid (neonicotinoid) were used in treated plots at field rates. These
insecticides were reported by Ahmad et al. (2011) to be highly toxic to predators and could have
either direct lethal effect or sub- lethal effects on the insect development and reproduction.

108
The data which included number of leaves per stalk, number of damaged leaves per stalk,
numbers of predator per stool, number of YSA colonies per stalk and level of damage on leaves
were taken, at two -weeks intervals, starting at one month after planting (MAP) or when the
plants have about six leaves per stalk. The sampling continued up to 24 weeks after planting or
when the sugarcane was just two meters high.
4.5.3 Results and Discussion
Seasonal YSA and predator population changes
The associations and correlations between numbers of the YSA colonies and predators are
graphically represented in figures 4.13 to 4.15, together with observations of actual feeding by
the adults and larvae of Coccinellids, are evidence of the impact of these natural enemies on YSA
population regulation. There was no time-lag in the observed prey – predator population
oscillations, apparently because as generalists, the predators could readily move from refuges
(grass weeds) into sugarcane earlier when the YSA population was still low. The collapse of large
populations of aphids is attributed to the action of large numbers of coccinellids associated with
them (Hodek, van Emden, and Honek, 2012; Helmut F. Van Emden and Harrington, 2017).
Figure 4. 11: Seasonal Changes in YSA and Predator Populations in Untreated Plots at
Kagera - October, 2016
1
10
Nu
mb
er
of
insects
(L
og
10(x
+ 1
) tr
an
sfo
rm.)
Months After Planting
YSA colonies per stalk
number of predators per stool

109
Figure 4. 12: Seasonal Changes in YSA and Predator Populations in Untreated Plots in
Kagera (D23B) - October, 2017
Figure 4. 13: Mean Seasonal Changes in Populations of YSA and Predators in
Untreated Plots at Kilombero (Field 682) - August, 2018
Yellow Sugarcane Aphid population dynamics and damage on sugarcane plants inside
and outside the cage
As illustrated in Figures 4.16 to 4.19, the YSA population has consistently reached its peak when
the crop was between 3 to 4 months old (divergence phase), then followed by a decline phase
1
10
1.5 2 2.6 3 3.6 4 4.6 5 5.5 6 6.5 7 7.5 8 8.5 9
Nu
mb
ers
of
inse
cts
(L
og
10
(x +
1)t
ran
sform
.)
Months After Planting
YSA Colonies
PREDATORS
4 WAP 10WAP
12WAP
14WAP
18WAP
20WAP
22WAP
Num
ber
of
Insects
(Log10(x
+1)
transfo
rmed
Sampling dates
YSA
PREDATOR

110
after 4 or 5 months of plant growth. In the cage the peak numbers of YSA colonies per stalk were
12.1 and 22.1, and outside the cage (OPEN ) were 2.5 and 4.9 at Kagera and Kilombero,
respectively (Figures 4.14 and 4.15). Seasonal mean numbers of YSA colonies per stalk inside and
outside the cage were in the ratios of 2.9:1 in Kagera and 5.3:1 in Kilombero (Table 4.16). The
highest number of Aphids in the cage is due to the fact that predators were excluded from
entering the cages.
Figure 4.14: YSA Population Development inside Cages and Open Plots at Kilombero
Figure 4. 15: YSA Population Development in Cage and Open Plots at Kagera
1.11
10
100
4 WAP 10 WAP 12 WAP 14 WAP 18 WAP 20 WAP 22 WAP
Nu
mb
er o
f Y
SA
Co
lon
ies
(Lo
g1
0 (
x +
1)
tra
nsf
orm
.)
Sampling Dates
CAGE
OPEN
1
10
100
12 WAP 14 wAP 16 WAP18 WAP20 WAP22 WAP24 WAP
Nu
mb
er
of
Co
lon
ies p
er
Sta
lk (
Lo
g 1
0(x
+ 1
) tr
an
sfo
rm.)
Sampling Dates
CAGE
OPEN

111
Table 4. 16: Seasonal Mean numbers of YSA colonies per stalk in cage and open plots
TREATMENT KAGERA KILOMBERO
CAGE 4.98571 5.99286
OPEN 1.71429 1.13571
RATIO (CAGE : OPEN) 2.9083 5.2768
Considering YSA damage on the leaves in Kilombero and Kagera investigations, the presence of
predators could reduce percent infested leaves by 64.5 % and percent damage on leaves by 90.6
% (Figures 4.18 to 4.21).
Figure 4. 16: Percent Infested Leaves per Stalk in Cage and Open Plots at Kilombero
Figure 4. 17: Percent Damage on Leaves in Cage and Open Plots at Kilombero
MAP=Months After Planting
0
2
4
6
8
10
12
14
16
18
20
1 MAP 2.5 MAP 3 MAP 3.5 MAP 4.5 MAP 5 MAP 5.5 MAP
% I
nfe
ste
d L
eav
es p
er
Sta
lk
Sampling Dates
Cage (Enclosed)
(Open)
0
10
20
30
40
50
60
1 MAP 2.5MAP
3 MAP 3.5MAP
4.5MAP
5 MAP 5.5MAP
% D
am
age
on
Lea
ves
Sampling Dates
T1 Cage(Enclosed)(Open)

112
Figure 4. 18: Percent Infested Leaves per Stalk in Cage and Open Plots at Kagera
Figure 4. 19: Percent Damage on Leaves per Stalk in Cage and Open Plots at Kagera
Predator population
Although the plant growth and weather factors could be important in the general population
changes, the differences in YSA abundance inside and outside cages could to some extent be
attributed to predator actions. Table 4.17 is a summary of predator counts in OPEN plots which
has demonstrated variable numbers in different sampling dates, from 0 to 1.75 (mean = 0.86)
predators per 5 stools at Kilombero and 0 to 1.0 (mean = 0.43) predators per 5 stools at Kagera.
The low predator counts was observed because the visual sampling of predators is a quick
method and it is highly influenced by the interactions of prey abundance, microclimate and host
plant density and growth structure (Hodek, van Emden, and Honek, 2012). It is the highly active
and visible individuals only which can be counted when temperature, sunshine and time of day
are suitable for predator activity (Hodek et al., 2012). Therefore, in these experiments, the
0
5
10
15
20
25
30
35
40
3 MAP 3.5 MAP 4 MAP 4.5 MAP
%
Infe
ste
d L
eav
es p
er
Sta
lk
Sampling Dates
CAGE
OPEN
0
10
20
30
40
50
60
3 MAP 3.5 MAP 4 MAP 4.5 MAP
% D
am
ag
e o
n L
eav
es p
er
S
talk
Sampling Dates
CAGE
OPEN

113
recorded estimates of numbers of Coccinellid adults and larvae must have been much lower than
the true predator abundance.
Table 4. 17: Predator population per five stools in open plots at Kilombero and Kagera
on different sampling dates
KILOMBERO
21.09.18
16.10.18
02.11.18
13.11.18
13.12.18
24.12.18
21.01.19
MEAN
0 0.25 1.75 0.5 1.75 0 1.75 0.86
KAGERA 18.12.1
8
03.01.1
9
18.01.1
9
02.02.1
9
16.02.1
9
02.03.1
9
MEAN
0 1 0.05 0.5 0.5 0.5 0.43
Weather factors
During the present studies there have been no extreme changes of weather factors (mean
maximum temp. of 29.0 -32.0 oC; mean minimum temp. 15.0 -21.0 oC and mean R.H. % of 71.7 –
72.1 %) in all sites (Tables 4.18 and 4.19).
Table 4. 18: Monthly weather factors at Kagera in June 2018 to January, 2019
Parameter June,18
Aug,18
Sep, 18
Oct, 18
Nov, 18
Dec, 18
Jan, 19
Mean
Max. Temp oC 28.5 29 29.6 28.8 29.1 27.9 28.7 28.85
Min. Temp. o C 14.7 14.7 14.6 15.5 15.7 16.1 15 15.03
Mean R.H % 67.4 69.5 71.4 72.3 75.7 78.2 75.3 71.66
Rainfall (mm) 0.7 0.1 2 1 1.7 3.1 3.3 1.49 Rain days 1 3 11 8 15 13 12 8
Wind speed (km / hr)
NA NA NA NA NA NA NA NA
Table 4. 19: Monthly weather factors at Kilombero in June 2018 to January, 2019
Parameter June,18 Aug,1
8
Sep,18 Oct,
18
Nov, 18 Dec, 18 Jan,
19
Mean
Max. Temp oC 28.80 30.00 31.60 32.40 35.40 35.10 34.00 31.99
Min. Temp. oC 18.30 18.40 20.10 22.30 23.40 23.60 23.20 21.00
Mean R.H % 75.40 70.60 71.50 68.20 65.70 74.40 76.20 72.14
Rainfall (mm) 0.80 0.20 0.70 0.04 0.40 4.40 4,4 0.98
Rain days 5.00 1.00 3.00 1.00 2.00 9.00 12.00 4.50
Wind speed
(km / hr)
2.80 2.30 3.10 3.10 3.40 2.80 2.90 2.90
The recorded temperatures at Kilombero and Kagera were below 40 o C and could not be the
cause of experienced sudden decreases of the populations of aphids and predators during the
season. The cages which presumably allowed free air movement had minimal effects on

114
sugarcane growth, but there was a reduction of hygrometer dry bulb temperature reading of 1.0 o
C and increase in R.H. % of 12 units as compared with the records of the nearest weather station
(Kagera B); thus the microclimate inside the cages appears to be cooler and more humid than
outside them (Tables 4.19 and 4.20). Certainly, the prevailed mean maximum temperatures were
above 24 oC which is optimal for development and survival of the YSA, an insect essentially of
temperate and subtropical origin (Blackman and Eastop, 2000; Hentz and Nuessly, 2004).
Table 4. 20: Hydrogen dry bulb Temperature (oC) reading at Kagera
13.03.2019 14.03.2019 15.03.2019 MEAN
Station AM PM Avg AM PM Avg AM
Kagera B 19.0 29.0 24.0 18.0 25.0 21.5 23.0 22.8
Cage 18.0 28.0 23.0 17.0 24.0 20.5 22.0 21.8
Difference 1.0 1.0 1.0 1.0 1.0 1.0 1.0 1.0
Table 4. 21: Hydrometer Relative .Humidity % Readings at Kagera
Station
13.03.2019 14.03.2019 15.03.2019 MEAN
AM PM Avg AM PM Avg AM
Kagera B 95.0 58.0 76.5 95.0 68.0 81.5 79.0 79.0
Cage 100.0 77.0 88.5 95.0 91.0 93.0 91.0 90.8
Difference 5.0 19.0 12.0 0.0 23.0 11.5 12.0 11.8
The causes of the very rapid decline of YSA population inside as well as outside the cage when
the crop is four to five months old was probably due many biotic and abiotic factors such as
diminishing host plant quality, induced plant defense responses, development and emigration of
winged forms of Aphids, fungal epizootics, high temperatures, wind and rain (Van Emden and
Harrington, 2017).
Furthermore, in this study it has been observed that predators suppress YSA populations in early
part of the season and followed by the general decline in aphid infestation when the sugarcane
leaves mature. A combination of these facts has important implications on the strategic
management of YSA in the country. Under these circumstances, it would be advisable that
insecticides applications should be made only after scouting data show intolerable infestation
levels and when the sugarcane have not reached five month old, and only one application may be
necessary, otherwise the YSA population would decline as the crop matures later in the season.
The impacts of the insecticides sprays on YSA and predators
The impacts of the insecticides sprays on YSA and predators have been graphically illustrated in
figures 4.18 and 4.19 for data from Kilombero experiment and figures 4.20 and 4.21 from Kagera.

115
At Kilombero where the insecticides were applied two times, the abundance of YSA was reduced
in all plots so that the population could not recover to pre-treatment levels up to the end of
observations, 26.6 weeks after planting (WAP). The insecticides have also caused a reduction in
the abundance of predators in treated plots; compared with other insecticides treatments and
control, profenofos appeared to have had the greatest impact (figures 4.22 and 4.23).and figures
4.24 and 4.25.
In Kagera where spraying was done at one time. All insecticides were very effective at about two
weeks after treatment and acetamiprid had shown the highest efficacy. We observed differences
in the abundance of natural enemies among the insecticides and control, but most reduction has
occurred in profenofos treatment. The lowest population of natural enemies was observed for all
treatments on the last sampling on 26.1 WAP.
However, the YSA population started to rebound at 24.3 WAP or 4 weeks after treatment so that
at 6 weeks after treatment the untreated control had less YSA than insecticides treated plots.
The present results show that both YSA and predators were susceptible to all the insecticides
through residual and/or contact exposure. However, the increase in YSA population in
insecticides-treated as compared to untreated plots could be regarded as a case of insect pest
resurgence due to reduced predator control. Similar results on insect resurgence have been
reported by Chelliah S and E,A Henrichs (1984).
Figure 4. 20: YSA colonies in response to insecticides application in different sampling
dates at Kilombero
1
10
10 12 16.2 17.9 21.1 22.6 25.4 26.6
Nu
mb
er
of
. Y
SA
co
lon
ies
Weeks After Planting
Primicarb
Profenofos
Deltamethrin
Acetamiprid
Untreated
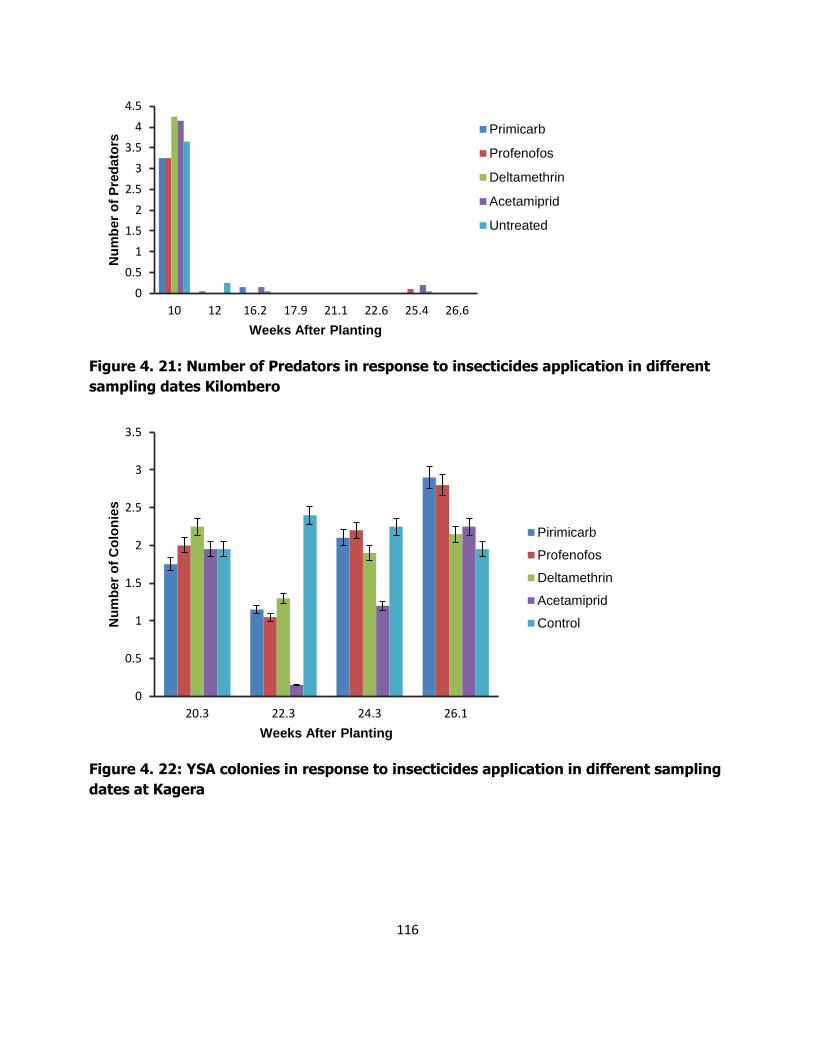
116
Figure 4. 21: Number of Predators in response to insecticides application in different
sampling dates Kilombero
Figure 4. 22: YSA colonies in response to insecticides application in different sampling
dates at Kagera
0
0.5
1
1.5
2
2.5
3
3.5
4
4.5
10 12 16.2 17.9 21.1 22.6 25.4 26.6
Nu
mb
er
of
Pre
dato
rs
Weeks After Planting
Primicarb
Profenofos
Deltamethrin
Acetamiprid
Untreated
0
0.5
1
1.5
2
2.5
3
3.5
20.3 22.3 24.3 26.1
Nu
mb
er
of
Co
lon
ies
Weeks After Planting
Pirimicarb
Profenofos
Deltamethrin
Acetamiprid
Control

117
Figure 4. 23: Predator in response to insecticides application in different sampling
dates at Kagera
Conclusion and recommendations
Cage Experiment
Results of the exclusion method have shown that the YSA population could increase three
to five times in the absence of the generalist Coccinellid predators.
While predators would suppress YSA populations in the early part of the season there is a
general decline in aphid infestation when the sugarcane leaves mature.
In Tanzania weather factors (mean maximum temperature of 28 – 32 oC) could play an
important role in reducing the development rate and survival of YSA on sugarcane.
The regular surveys data have supported evidence for predation as a major regulating
factor of YSA population development in sugarcane fields.
Further investigations are required to understand the factors which determine the seasonal
abundance of YSA which has typically shown rapid rise to peak abundance (3 – 4 months
after planting) and then a rapid decline in mature plant leaves.
Chemical exclusion experiments
Tested insecticides were not selective
Both YSA and predators were susceptible to all insecticides
The impact of insecticides on reduced abundance of predators may have caused the YSA
resurgence (increased abundance) in treated plots.
That before making a recommendation, insecticides must be thoroughly tested to
determine their impact on predators and tendency for YSA resurgence.
0
0.2
0.4
0.6
0.8
1
1.2
1.4
1.6
1.8
2
20.3 22.3 24.3 26.1
Nu
mb
er
of
Pre
dato
rs
Weeks After Planting
Pirimicarb
Profenofos
Deltamethrin
Acetamiprid
Control

118
4.6 Project Tittle: Evaluation of resistance of sugarcane varieties to Yellow Sugarcane Aphid infestation in cages
Project Number: CPE2018/06
Principal Investigators: J. M. Katundu, F. A. Urassa A. Yusuph and M. Mwinjummah.
Collaborators: Estates Agronomists
Reporting Period: 2018/2019.
Project Summary
This study aimed at investigating the reaction of sugarcane varieties against YSA infestation. The
cage has been constructed at TARI-Kibaha, and sugarcane has been planted in containers.
4.6.1 Introduction
The Yellow Sugarcane Aphid (Sipha flava) has become one of the most damaging pest of
sugarcane in all the major sugarcane growing areas of Tanzania. This insect causes damage to
sugarcane by direct feeding on the sap and injection of a toxin which causes leaf discoloration,
necrosis and death, thereby reducing the photosynthetic area of the plant. Early YSA infestation
on the sugarcane crop may cause reduction in tillering.
Increased populations of YSA may eventually damage all mature leaves on plants < 6 months old
which can reduce sugarcane yield at harvest time by 20% (Nuessly and Hentz, 2002). Experience
from TPC and other infested areas have shown that different varieties react differentially to YSA
damage. Therefore instead of relying on chemical control alone host plant resistance may be
important in IPM programme in YSA management.
Main objective
To screen commercial sugarcane varieties for the resistance to YSA.
Specific objectives
a) To determine the effects of YSA on plant growth.
b) To study the population build-up of YSA in the test varieties.
4.6.2 Materials and Methods
Location: The experiment is being implemented in a screen house at TARI Kibaha.
Research design: RCBD with 4 replications. Each replicate have 20 varieties/clones arranged
randomly.
Project Status
The project is in progress

119
4.7 References Ahmad, M., Rafiq, M., Arif, M. I., & Sayyed, A. H. (2011). Toxicity of Some Commonly Used
Insecticides Against Coccinella undecipimpunctata (Coleoptera:Coccinellidae). Pakistan J.
Zool, 1161-1165.
Anonymous (2005). Guidelines and Recommendations for Eldana control in the South African
Sugar Industries. South African Sugarcane Industries. February 2005.
Blackman, R.I and V.F.Eastop, (2000). Aphids on the world’s crops: identification and information
guide. 2nd ed. Wiley, Chichester, UK.
Chelliah S., and Heinrichs E, A. (1984). Factors Contributing to brown planthopper resurgence.
PROCEEDINGS OF THE FAO/lRRl WORKSHOP ON Judicious and Efficient Use of
Insecticides on Rice, (p. 6).
Fewkes, D.W. (1971). Notes on the outbreak of Aulacapsis tegalensis Zehnt (Homoptera,
Diaspididae) on Sugarcane in Tanzania.
Hentz, M., and Nuessly, G., (2004). Development, Longevity, and Fecundity of Sipha flava
(Homoptera: Aphididae) Feeding on Sorghum bicolor. Environ. Entomol. Vol 33 (3): 546 –
553 (2004).
Hodek, I., van Emden, H. F., and Honěk, A. (Eds.). (2012). Ecology and Behaviour of the Ladybird
Beetles (Coccinellidae):
James, G. (2004). Sugarcane. London: Blackwell Science Ltd.
Matthew Hentz and Gregg Nuessly (2004). Development, Longevity, and Fecundity of Sipha flava
(Homoptera: Aphididae) Feeding on Sorghum bicolor. Environ. Entomol. Vol 33 (3): 546 –
553 (2004).
Sathe, T. V., Shinde, K. P., Shaikh, A. L., & Raut, D. K. (2009). Sugarcane Pests and Diseases.
Delhi: Manglam Publications.
Tomizawa, M. and Casida, J.E. (2003) Selective toxicity of neonicotinoids attributable to specificity
of insect and mammalian nicotinic receptors. Annual Review of Entomology 48, 339–364
Van Emden, Helmut F., and Harrington, R. (Eds.). (2017). Aphids as crop pests (Second edition).
Wallingford, Oxfordshire, UK Boston, MA: CABI.

120
5.0`SUGARCANE PATHOLOGY
5.1 Project Title: Status of Ratoon Stunting Disease at Kilombero Sugar Company, Tanzania Project Number: CCP 2017/01/01
Principal Investigators: M. Masunga, B. Kashando, R. Polin and Y. Mbaga
Collaborators: Y. Kalinga
Reporting Period: 2018/2019
Remarks: On going
Summary Ratoon stunting disease (RSD) is one of the key sugarcane disease in Tanzania. The objective of this work was to monitor the status and diagnose RSD at Kilombero Sugar Company (KSC) sugarcane fields. Disease diagnosis is one of the key component for disease management thus a training of staffs on identification of RSD was conducted at TARI-Kibaha. Moreover, a survey was done at KSC where 20 fields comprised of 6 sugarcane varieties; N19, N25, N41, N30, R570 & R579 from plant cane to 4th ratoon crop with sugarcane plant aged 9 -11 months were sampled. The xylem sap was extracted by a compressor and the bacteria identified using both Phase contrast microscope at 1000x magnification and Immunoflorescence Microscope at 100x magnification. The results indicated the absence of RSD for twenty sampled fields which implies that KSC has strengthern management against RSD. Regular monitoring to check the status of RSD on sugarcane fields is recommended. 5.1.1 Introduction
Ratoon stunting disease (RSD) , caused by a gram positive-bacteria Leisfonia xyli subsp. xyli is the
most widespread disease and it is considered to cause high yield losses than any other disease in
sugarcane fields worldwide (Grisham., et al 2007) .The pathogen is xylem-limited produces
gelatenious materials which plug the vascular vessels of sugarcane plant thus imparing
translocation of water resulting into stunting growth of the plant (Gao et al., 2008). The disease
does not produce distinct external symptoms rather than stunting and lowers yield from 5% up
to 50% depending on the susceptibility of the variety and weather conditions (Philip, 2016). RSD
is a systemic and primarily transmitted by planting infected seedcane and transmissison from
infected to healthy plant is through wounds caused by farm implements especially those used
during planting or harvesting for example cane knives (Pan et al., 2007). According to
Mcfarlane, (2003) sugarcane is the only known host of Leisfonia xyli subsp xyli in nature.
In Tanzania , sugarcane estate normally control RSD through the use of resistant varieties,
disease-free planting materials (hot-water treatment of seedcane at 50°C for 2 hours) and
adherence to phytosanitary practices such as disinfencting farm implement (cane knives) used
during planting or harvesting. Despite all these efforts, ratoon stunting disease is still a major
challenge in all sugarcane producing areas in the country. This is contributed by inadequate
farmers knowledge about the disease, difficult to distinguish the disease since RSD has no distinct

121
external symptom and prolonged drought period. Therefore, to prevent spread of ratoon stunting
disease effective and effiecient diagnosis is very important for the control of the disease which can
only be achieved by having competent staff to perform the analysis. Moreover, the identification
of RSD is normally done by Phase contrast microscope (PCM) at KSC and confirmation of the
results is done by immunofluorescence microscope which is believed to be 10 times sensitive than
PCM (Mcfarlane, 2003). Therefore, this work was undertaken to check the presence or absence of
the bacteria causing RSD on sugarcane fields at Kilombero Sugar Company for the purpose of
preventing spread of RSD within and nearby fields.
General objective Monitoring the status of ratoon stunting disease in sugarcane fields at KSC Specific objectives
To build capacity of staffs on RSD identification. To determine the presence or absence of a bacteria (Leisfonia xyli subsp xyli) in
sugarcane fields at KSC. Output
13 staffs trained on RSD diagnosis One immunoflurescent microscope purchased and installed 20 sugarcane fields at Kilombero Sugar Company (KSC) were monitored for RSD
infestation
Report on the status of RSD at KSC is available
5.1.2 Materials and Methods
A training on RSD identification using Immunoflorescence Microscope (IFM) was done at TARI Kibaha from 22nd-24th January 2019 and a total of 13 staffs were trained. The trainees were 10 TARI staffs (Scientist (7), laboratory technicians (2) and 1 field officer, 2 Kilombero Sugar Company (KSC) staffs and 1 staff from TPC. A trainer was RSD speciality Mr. Solen Subramoney from SASRI, South Africa (Figure 5.1).

122
Figure 5. 1: Training on identification of ratoon stunting disease on sugarcane samples
held at TARI-Kibaha on 22nd to 25th January 2019
Monitoring and detection of RSD in sugarcane fields Location and sampling The activity was done at KSC on December, 2018 and a total of 20 fields were assessed for the presence or absence of the bacteria. The fields were selected randomly whereas 6 sugarcane varieties; N19, N25, N41, N30, R570 & R579 with the age range from 9 to 11 months (age suitable for RSD sampling) and crop cycle from plant cane to 4th ratoon were also included in the sampling. For each field, 20 mature stalks were collected from different points per field neatly bundled and tied together. Thereafter the samples were taken to KSC lab for further processing.
Selection and cutting of internodes for diagnosis Immediate after collection from the field, each bundle of stalks which comprised of 20 stalks per
field, was divided into 5 sub-bundles each with 4 stalks of which the lowest undamaged internode
about 1 cm was cut from each stalk and placed into one clean container. The knives and chopping
board washed with disinfectant after each stalk cut to avoid cross contamination.
Extraction of xylem sap and preparation of microscope slides The sap was extracted from xylem vessels of stalk pieces by a positive air pressure method using
compressor. The blowing air from compressor forced out the xylem sap which was collected using
disposable pipette and a small drop was placed on the microscope slide (76mm x 26mm) and the
cover slip (18mm x 18mm) placed over the sap for view under PCM microscope at 1000x
magnification. Also a duplicate samples were placed on 10 multiwel slides and air dried,

123
thereafter, were packed properly and transported to TARI-Kibaha for detection of the bacteria
using IFM.
Detection using Phase contrast microscope (PCM) A drop of immersion oil was placed on the cover slip before viewing on Phase contrast microscope
at 1000x magnification and results were recorded per field. This was done at Kilombero Sugar
Company laboratory.
Detection using immuno -fluorescence microscope (IFM) A protocol of Davis (2008) was used for detection of RSD. The slides containing xylem sap were
processed at TARI-Kibaha using different reagents correctly and a specific antiserum to Leisfonia
xyli subsp xyli was used to detect the bacteria under using immunofluorescence microscope
(OPTIKA-Italy, B-383LD2) under 100x magnification and the results recorded accordingly.
Data analysis
No statistical analysis was done since all fields were negative on IFM and PCM method.
Results
Capacity building A large number (72 % ) of the trainees were from TARI-Kibaha, 21 % from Kilombero Sugar
Company and 7 % from TPC. During the training hands-on-skills related to field sampling,
Sample preparations for both IFM & PCM, preparation of buffers for IFM, preparation of IFM slides
using different reagents correctly, recording of results, healthy and safety issues were covered
(Figure 5.2).

124
Figure 5. 2: Participants for RSD training conducted at TARI-Kibaha, January 2019
RSD diagnosis The results in table 5.1 indicate that all 20 fields that were sampled for detection of the bacteria
Leisfonia xyli subsp xyli was not detected in any field regardless of the variety, age and crop cycle
on both phase contrast and immunofluorescence microscope.
Kibaha72%
KSC21%
TPC7%
Kibaha
KSC
TPC

125
Table 5. 1: RSD diagnosis for KSC estate
Location Field Variety Crop Age Detection method
Phase Contrast Immunofluorescence
Ruaha 358 N41 1 11 0 0
Ruaha 349 N25 4 10 0 0
Ruaha 359 N25 4 10 0 0
Ruaha 302 R570 1 11 0 0
Ruaha 303 R570 2 10 0 0
Simba 419 N25 5 11 0 0
Simba 429 N25 7 11 0 0
Simba 428 N25 6 10 0 0
Simba 481 N41 1 10 0 0
Simba 480 N19 2 10 0 0
Magombera 629 N41 4 11 0 0
Simba 416 R579 1 6 0 0
Magombera 643 N41 3 10 0 0
Magombera 639 N41 4 11 0 0
Msolwa 504 R579 4 11 0 0
Msolwa 504 R579 4 11 0 0
Msolwa 507 R579 3 11 0 0
Ruembe 104 R570 1 11 0 0
Ruembe 101 R570 2 11 0 0
Nyamvisi 244 N30 1 11 0 0
Nyamvisi 210 R579 PC 9 0 0
Discussion
Disease diagnosis is a key component on disease management which requires competent personel
to perform accurate disease diagnosis. During RSD training, a large number (72 % ) of the
trainees were from TARI-Kibaha purposely to strenghern institutional capacity on RSD diagnosis
using Immunoflorescence microscope of which previously were perform at SASRI, South Africa.
After the training the partcipants were able to person the analysis on IFM from the samples that
were collected from KSC.
Therefore, on this season 2018/2019 all sampled fields had no RSD infestation for both methods
i.e PCM and IFM. The absence of ratoon stunting disease in the sugarcane fields is associated with
the use of disease-free planting materials obtained through hot-water treatment, use of resistant
varieties, and adherence to sanitation measures. Likewise, Mutonyi & Nyongesa, (2016) reported
that maintenance of good agricultural practice in the sugarcane fields lead to reduction of
different diseases in the fields including RSD. Also, the use of resistance varieties against Leifsonia

126
xyli Subsp. Xyli prevent the penetration and multiplication of the pathogen into sugarcane plant
(McFarlane, 2013)
Also, RSD was absent on the fields planted N 25 & N30 which are known to be susceptible to RSD
infestation. A report by Mcfarlane (2003) indicated that N25 & N30 are highly susceptible to
Leifsonia xyli Subsp. Xyli but this results did not indicate the presence of RSD on all fields planted
with these varieties. This could be due to sugarcane plant adaption to different climatic condition
and its reaction against certain diseases which can lead to increase its resistance or become
tolerance (Tiwari et al., 2012).
Conclusion and recommendations RSD incidence at KSC has decreased as compared to previous seasons which implies that the
estate strengthened RSD management programme. However, regular monitoring to check the
status of RSD on sugarcane fields is recommended. Since TARI- Kibaha has established molecular
lab, DNA-based method will also be used for RSD diagnosis starting from next season. Also,
studies on genetic diversity of the bacteria causing RSD to identify physiological races of the
pathogen is necessary. Lastly, extending RSD monitoring to other estates and outgrowers fields is
important to prevent disease spread.
5.2 Project Title: Assessment on the incidence of sugarcane smut on estates and Outgrowers fields in Tanzania Project code: CCP 2017/01/02
Principal Investigators: M. Masunga, Y. Mbaga, R. Polin and M. Mziray
Collaborators: Nassoro Abubakari, Nasser Mlawa, Mohamed Salum, Joseph Kitali, and
Issa Mdemu
Reporting Period: 2018/2019
Remarks: On going
Summary Sugarcane smut is a fungal (Sporisorium scitamineum) disease that cause negative effect on
sucrose accumulation, fiber content and juicy quality. The aim of this work was to assess the
incidence of smut on estates and out-growers fields. A total number of 113 fields consisting of 20
sugarcane varieties from plant cane to 8th ratoon were assessed for smut infestation both on
estates and out-growers fields. The higher smut infestation was observed on out-growers fields
(86 %) as compared to estates (51 %). For estates, Mtibwa Sugar Estate had higher smut
infestation, followed by Kagera Sugar Limited and the least smut incidence encountered at
Tanganyika Plantation Company Limited. Also, NCO 360 and Co 617 had higher smut incidence
than other varieties. Similarly, ratoon crops had higher smut incidence compared to plant cane.
Therefore, MSE need to look over their disease management programme but also replacing NCO
376 & Co 617 with smut resistant varieties is recommended.

127
5.2.1 Introduction
Sugarcane smut is caused by a basidiomycete fungus, Sporisorium scitamineum Sydow
(Benevenuto et al., 2016). It is an important disease of sugarcane that has spread to all over the
cane growing areas of the world causing insiginificant to significant quality and yield losses
(Schaker et al., 2017). The disease cause negative effect on sucrose accumulation, fiber content
and juicy quality (Marques et al., 2017). The fungus infects plant through buds on the standing
stalks or germinating buds on the soil and then growths with the plant in close association with
the growing region (Magarey, 2013). Infected plants produce whip-like structure that forms at the
growing point of the plant. The whip has a thin membrane that breaks and release a mass of
black spore (Marques et al., 2017). The disease spread through wind blown spore, planting
infected seed cane or contaminated cane cutting implements (Su et al., 2016). The disease is
systemic and its control is through the use of resistant varieties, hot water treatment of seed
cane, regular monitoring, roughing of smut affected stools and avoidance of ratooning of smut
affected fields. In Tanzania, smut is a major problem affecting sugarcane production in both out
growers and estate fields. Therefore, this work was undertaken to monitor the incidence of smut
on sugarcane fields at estates (KSL, KSC & MSE) and outgrowers (Kagera and Kilombero Mill
Areas).
Specific objectives To determine the status of smut disease on sugarcane varieties and crop cycles
Output A total of 113 sugarcane fields assessed for smut infestation
20 sugarcane varieties assessed for smut infestation
5 sugarcane crop cycles (plant cane to 4th ratoon) evaluated for the level of smut
infestation
3 estates and 2 outgrowers Mill Cane Areas assessed for their status on smut incidence
5.2.3 Materials and methods
Description of the survey area A survey in sugarcane fields to asses smut was carried out from October 2018 to January 2019
both on estate and out grower’s fields. A total number of 113 fields were assessed for smut where
by at Kagera estate 33 fields and 22 fields outgrowers, Kilombero out grower’s fields -20, Mtibwa
estate-18 and TPC were 20 fields.
Survey procedure A field was divided into five points and each point had ten rows of 50 metres. One meter
represented one stool and for that reason one row had 50 stools and one point had a total
number of 2500 stools. The parameters assessed were variety, crop cycle, age and irrigation
regime in relation to smut incidence.

128
Therefore, percentages of smut incidence were calculated based on the formula below;
Percentage of smut infection = Total number of smutted stools in a field ×100
Total number of stools per field
On commercial fields smut infestation level greater than 4% meaning the disease is above
economic threshold and uprooting and replanting is the only management option. Below 4 %
roughing is recommended.
Data collected Data on percentage of smut incidence
Data on smut incidence on sugarcane varieties
Data on smut incidence over crop cycle across site
Results
Status of smut incidences on estates and out-growers fields A total number of 113 fields were assessed for smut infestation this season 2018/2019 where by 71 fields on estate and 42 outgrowers. For outgrowers, Kilombero mill area all (100%) fields assessed had smut infestation while Kagera 72.7 % of assessed fields had smut infestations. For estates, 77.8% of fields surveyed at MSE had smut, 48.5% for Kagera Sugar Limted and 30% for TPC (Table 5.2).
Table 5. 2: Status of smut infestation on sugarcane fields both estates and outgrowers
Location Number of fields Percentage smut
KSL 33 48.5
TPC 20 30.0
MSE 18 77.8
OG-Kagera 22 72.7
OG-Kilombero 20 100.0
Assessment of smut Incidence on sugarcane varieties TPC A total of 20 fields planted with 8 sugarcane varieties were assessed for smut infestation at TPC.
Four varities N25, R575, M700/86, R579 and N41 were found with smut infestation below the
economic threshold of 4%. The higher smut incidence was on variety N25 (3.8%) and least
incidence of smut was on variety N41 (0.2%). The other 4 varieties N30, R585, R579 and
R85/1334 smut was not observed (Figure 5.3)

129
Figure 5. 3: Smut incidence on sugarcane varieties at TPC
At Kagera Sugar Limited (KSL) Smut infestation was observed on fields planted with varieties; Co 617, R579, N49, MN1, N47 and
variety Co617 had higher smut symptoms as compared to other varieties. Only two varieties N19
and N25 smut was not encountered (Figure 5.4)
Figure 5. 4: Smut incidence on sugarcane varieties at KSL
0
0.5
1
1.5
2
2.5
3
3.5
4
sm
ut in
cid
ence (
%)
Sugarcane Varieties
0
0.5
1
1.5
2
2.5
3
N19 N25 N47 MN1 N49 R 579 Co 617
% m
ean s
mut in
cid
ence
Sugarcane varieties
130
At Mtibwa Sugar Estate (MSE) Six varieties (N12, N32, N41, NCo 376, R570, R575) out of 7 had smut infestation where as three
N32, Nco 376 and R 575 the smut infestation was > 4% which is above the economic threshold.
Only one variety R579 smut symptoms was not observed (Figure 5.5)
Figure 5. 5: Smut incidence on sugarcane varieties at MSE
Assessment of Smut incidence on sugarcane crop cycle at out growers fields Kagera Mill Area Only one variety CO 617 is cultivated by sugarcane out growers at Kagera, unfortunately smut
incidence were observed on 21 fields out of 22 fields equals to 95 % of all surveyed fields had
smut. The results also indicates that plant cane had no smut infestation as compared to ratoon
crops. Higher smut infestation were encountered on second and third ratoon crop which had
mean smut incidence of 1.6% while first ratoon crop had mean percentage of smut infestation of
1.4 %. Also out o f 22 fields that were surveyed only one field had no smut infestation which was
plant cane (Figure 5.6)
0
0.5
1
1.5
2
2.5
3
3.5
4
4.5
5
R579 R570 N12 N41 N32 NCO376 R575
% m
ean s
mut in
cid
ence
Sugarcane varieties

131
Figure 5. 6: Mean percentage smut incidence on sugarcane crop cycles at Kagera mill
area
Outgrowers at Kilombero
A total of 20 fields were surveyed at Kilombero outgrowers, varieties NCO 376 (16 fields) and
N41(6 fields) assessed for the level of smut incidence. Results shows that for NCO 376 smut
infestation is higher on ratoon crop especially on ratoon R2, R3 and R4 with the smut incidence of
1.6, 1.4 and 1.6 respectivelly. For N 41, smut was observed even on both plant cane and ratoon
(R4) with the mean smut infestation of 1.39 % and 1.13 % (Figure 5.7).

132
Figure 5. 7: Mean smut incidence on sugarcane varieties at Kilombero in outgrower
fields
Percentage of smut infestation on both sugarcane estates and outgrowers fields
In total, 86% of the out growers fields assesse at Kilombero and Kagera Mill area have smut
infestation and only 14% of the fields smut was not found while on estates 51% of the fields
assessed had smut infestation and 49% smut was not observed (Figure 5.8)
Figure 5. 8: Percentage of smut infestation on outgrower Vs esta
0
0.2
0.4
0.6
0.8
1
1.2
1.4
1.6
1.8
2
PC R1 R2 R3 R4
Me
an %
sm
ut in
cid
en
ce
Crop cycle
N41
NCO 376
Smut51%
Clean49%
Estate
Smut
Clean

133
Discussion
The survey on smut assessment conducted this season (2018/2019) revealed that smut disease is
still prevalent both on estate and out growers fields (TPC, KSL, MSE, Kagera and Kilombero Mill
are as). In Tanzania different smut-resistant varieties such as R579, R570, N 41 N 25 has been
adopted and selected for cultivation on estates since most of them are irrigated varieties. The use
of smut-resistant sugarcane varieties is the most economical and effective measure for disease
prevention and control (Sundar et al., 2012).
Moreover, studies have shown that the evolution of new races of Sporisorium scitaminea may
have broken the resistance of sugarcane varieties to smut making it possible for the resistant
varieties getting infected (Sundar et al., 2012; Schaker et al., 2017 & Marques et al., 2017).
Additionally, Su et al., (2016) reported that sugarcane smut resistance is influenced by three
major factors; sugarcane genotype, the pathogen, and the environment. Therefore, these could
be the explanation for the observed smut on resistance varieties on three surveyed estate (KSL,
TPC & MSE). Also, a study done by Nzioki et al., ( 2010) identified the presence of physiological
races of sugarcane smut and the results suggested possible existence of ten smut races in Kenya.
Results showed smut infection on resistant varieties such as R579 & R570. Since no study has
been done on the genetic diversity of sugarcane smut in Tanzania, there is possibility of having
smut races which are more virulent in sugarcane fields surveyed.
Also, there was an increase on smut incidence from plant cane to ratoon crop which could be attributed by the increased inoculum on the successive ratoon. The highest smut incidence were recorded on 4th ratoon as compared to plant cane (figure 8) this was observed both on estates and out growers field. Similarly, studies conducted on different countries confirmed that ratoons are the most susceptible crop cycle to sugarcane smut than plant cane because sugarcane smut is a systemic, and thus its incidence might be increased in successive ratoons because of the increased amount of inoculum (Mcfarlane, 2003; Hadush Hagos, 2015 & Schaker et al., 2017). Generally, the prevalence of smut was higher on outgrowers fields as compared to estates whereby 86% of outgrowers and 51 % of estates fields had smut infestation (Figure 7). The higher smut incidence encountered on outgrowers fields is contributed by the use of susceptible varieties; NCO 376 and Co 617 which are planted at Kilombero and Kagera mill areas respectively. Other countries has eradicated the use of NCO 376 due to its susceptility to smut infestation as one of the control strategy (Nzioki et al., 2010).Therefore, to prevent more spread of the disease the use of smut resistant variety is the key on controlling smut and earlier management of the disease such as earlier roughing of smut infected stools before higher spread occurred is most important to increase sugarcane yield. Also, uprooting of the fields with smut infestation > 4% to avoid build up and carry over the disease into the next season. However, replanting of sugarcane fields with fresh clean seedcane each year has been an effective management tool for smut in Louisiana as compared to repeated ratooning, which encourages smut build up (Zekarias et al., 2011) . Therefore, estate need to strengthen smut management with the emphasis on using hot-water treatment and earlier roughing of smutted stools. Also, replacing susceptible varieties (NCO 376 & Co 617) with smut resistant varieties is necessary to avoid disease spread and minimising the level of smut incidence in sugarcane fields that will contribute to increasing sugarcane yields.

134
Conclusion and Recommendations In general, smut disease is still prevalent on both estate and out-growers field. For estate, the highest smut incidence observed at MSE followed by KSL and TPC had lowest percentage of smut infestation. It is advised for estates to strengthen the management of sugarcane smut such as the use of hot-water treated seedcane, early roughing and replanting of severely infested fields. Also, it is suggested to replace Co 617 and NCO 376 at KSL and MSE respectively with smut resistant varieties. Also smut incidences observed on fields planted with smut-resistant varieties (N41, R575, R579, MN1, N49, R570, N12 & N12) at TPC, MSE and KSL estates which suggests the possibility for the presence of Sporisorium scitamineum physiological races in Tanzania. Therefore a study on genetic diversity of smut pathogen is recommended to identify the number of physilological races of smut fungal that might be available. Also there was higher percentage of smut infected fields (86%) in out-growers fields as compared to estate (51%). TARI-Kibaha is in process of releasing drought tolerant with smut resistant trait which could help to minimise the level of smut infestation on out-growers fields. On other hand, farmers should continue with early roughing of the infested stool to minimize the number of inoculum on their fields. In addition, TARI-kibaha to continue with systematic and regular monitoring of smut on sugarcane fields to monitor the incidence of smut in all major sugarcane growing areas in Tanzania and the information obtained will allow the industries to strengthern management strategies to reduce the risk of smut epidemics. Lastly, establishment of Pest and disease (P&D) committes in local area to monitor the spread of diseases in a respective areas is recommended. 5.3 Project Title: Factors Influencing Disease Spread on Sugarcane Outgrowers fields in Tanzania Project Code: CCP 2018/01/05
Investigators: M. Mziray, M.Kinyau, B. Kashando, R. Polin and M. Masunga and A.
Mwenisongole
Collaborators: J. Kitali, W.Bajwala, E.Mutakyawa and A. Kazimuheza
Reporting Period: 2018/2019
Project Summary Diseases infestation contributes in yield losses from outgrowers fields on sugarcane crop in
Tanzania. Assessment of outgrowers knowledge on diseases in the sugarcane growing areas was
very important in order (i) to evaluate farmers’ awareness and current practices on managing
diseases on sugarcane and (ii) to identify management challenges for development of an efficient
integrated disease management approach on sugarcane. A total of 276 respondents from Kagera,
Kilombero and Mtibwa were randomly selected for interview using a structured questionnaire.
Results show gender imbalance where male representative was higher by 79.3% compared to
20.7% female. About 80.8% of the respondents were aware on smut disease in sugarcane
compared to other diseases between the locations ranging from 90.7% Kilombero, 86.1% Kagera
to 61.6% Mtibwa. Factors that influencing the spread of sugarcane diseases includes source of

135
planting materials, high price of clean planting materials and inadequate knowledge on the use of
clean seedcane were identified.
5.3.1 Introduction
The contribution of sugarcane production from outgrowers (OG) fields to the factory has been
decreasing year after year. Report by Chongela (2015) indicated the low contribution of
sugarcane from OG about 40 tons/ha which is low compared to those attained by large estate
(70-90 tons/ha) and also below the attainable yield potential of more than 100tons/ha. One of the
reason that contributes in yield losses from OG fields is the infestation of sugarcane diseases such
as Ratoon Stunting Disease (RSD) and Smut that causes yield loss from 5-60% (Gao et al., 2008)
and 12% – 75% (Lemma et al., 2015). However, the spread of diseases in OG sugarcane fields is
generally caused by various factors including; availability of clean planting materials and
inadequate knowledge on the use of clean planting materials. Moreover, high price of the clean
seed cane, low income, biotic, abiotic, lack of improved varieties with drought tolerance, limited
access to credits to acquire inputs and shortage of extension services are reported to be
important constraints to sugarcane production. On –other hand socio economic factors such as
gender, age, education level, farm size and income also accelerate disease spread (Livingston et
al., 2011). The aim of this study was to identify determinants for spread of sugarcane diseases at
Kagera, Kilombero and Mtibwa mill cane areas.
Specific objectives 1. To assess farmers’ knowledge and practices on managing of diseases on sugarcane
2. To identify factors influencing diseases spread on out grower’s fields.
Achieved outputs A total of 276 farmers interviewed
At least 3 factors that influences the spread of sugarcane diseases were identified.
Information on farmers’ knowledge on sugarcane diseases from 3 sugarcane growing
areas (Kagera, Kilombero and Mtibwa) are documented.
5.3.2 Methodology
Location The survey was conducted in three out growers’ fields at Kagera Sugar Limited (KSL), Kilombero
Sugar Company (KSC) and Mtibwa Sugar Estate (MSE). The areas were selected because majority
of the people involves in sugarcane cultivation and most of their incomes are generated from
sugarcane.
Sample selection This research was focused to sugarcane outgrowers farmers from Kagera, Kilombero and Mtibwa
areas. The selection was based on the wards with high population of outgrowers involving in

136
sugarcane cultivation and most of their income are largely generated from sugarcane crop.
Another criterias for sample selection were; OG responsibilities for decision making regarding the
cultivation of the crop, control of sugarcane diseases and their availability during the survey.
Number of respondents surveyed during the interview is summarized in Table 5.3.
Table 5. 3. Number of respondent
Data collection Data were collected by using a structured questionnaire administered face to face to 276
respondents selected randomly from two regions (Kagera 101 and Morogoro 175, where 97 were
from Kilombero and 78 from Mtibwa) as indicated in table 1.
Socio-economic characteristics such as gender, age, education, farm size and income were
collected. Also data on the knowledge and awareness of sugarcane as well as factors influencing
diseases spread were also captured.
Statistical analysis Data variables were coded and analysed by Statistical Package for Social Science (SPSS v16.0)
program where mean and percentages were calculated.
5.3.4 Results
Socio economic characteristics of the respondents Gender The results indicate that majority of households were male and the distribution was: 85.1% male
and 14.9% female for Kagera, 71.1% male and 28.9% female for Kilombero and for Mtibwa
respondents, 82.1% were male and 17.9% were female (figure 5.9)
Region Ward Number of interviews
Kagera Nsunga 15
Kakunyu 18
Kassambya 45
Kyaka 23 Subtotal Kagera 101 Kilombero Ruhembe 63
Kidodi 34
Subtotal Kilombero 97 Mtibwa Diongoya 39
Sungaji 20
Mtibwa 19
Subtotal Mtibwa 78 Total interviewed farmers 276

137
Figure 5. 9: Gender of respondents
Age Figure 5.10 represents the age of the respondent and most of them had an age between 36-53
with 59.4% from Kagera, 66% from Kilombero and 47.4 from Mtibwa.
Figure 5. 10. Ages of the respondents
Education level The results also observed that 72.1% of the respondents had primary education while 14.1% has
secondary education as indicated in figure 11.
0
10
20
30
40
50
60
70
18-35 36-53 54-71 72-89
Per
cen
tage
s(%
)
Ages of the respondents
Kagera
Kilombero
Mtibwa
0
10
20
30
40
50
60
70
80
90
Kagera Kilombero Mtibwa
Per
cen
tage
s(%
)
Location of the survey
Male
Female

138
Figure 5. 11: Education level of the respondents from the surveyed areas
Farmers’ knowledge on sugarcane diseases. Knowledge on sugarcane diseases Majority of the respondents are aware about smut sugarcane disease compared to other diseases
suchas ratoon stunting diseases as indicated in figure 4 where 86.1% were from Kagera,90.7%
from Kilombero and 61.5% from Mtibwa.(figure 5.12)
Figure 5. 12: Farmers knowledge on different sugarcane diseases
Results on figure 13 represent farmers’ knowledge based on the symptoms of different sugarcane
disease with the following distribution: (a) smut:86.1% Kagera,90.7 Kilombero and 61.5 Mtibwa)
(b) RSD:1% Kagera,0% Kilombero and Mtibwa etc. However, the following respondents 15.8%
0
10
20
30
40
50
60
70
80
90
Primary Secondary University Vocational Illiterate
Per
cen
tage
s(%
)
Education level
Kagera
Kilombero
Mtibwa
0
10
20
30
40
50
60
70
80
90
100
Smut RSD Others I don’t know
Per
cen
tage
s(%
)
Sugarcane diseases
Kagera
Kilombero
Mtibwa

139
Kagera, 6.2% Kilombero and 4.1% Mtibwa were not aware about any symptom of sugarcane
diseases.
Figure 5. 13: Different symptoms different sugarcane diseases
Farmers practices for controlling sugarcane diseases Farmer’s awareness was also evaluated based on the methods used to control sugarcane
diseases. Majority of the farmers were aware on controlling smut as shown in figure 6. The
response was as follows; by roughing (84.2%) from Kagera, (77.3%) from Kilombero and
(29.5%) from Mtibwa (Figure 5.14)
Figure 5. 14. Methods used to control smut
0
10
20
30
40
50
60
Perc
enta
ges(%
)
Symptoms for sugarcane diseases
Kagera
Kilombero
Mtibwa
0
10
20
30
40
50
60
70
80
90
Kagera Kilombero Mtibwa
Per
cen
tage
s(%
)
Methods for controlling smut at KSL,KSC and MSE
Roughing
Uprooting and replanting
I don't know

140
Factors that influence the spread of sugarcane diseases Sources of planting materials The research observed the main source of planting materials acquired from neighbours with
83.5% from Kilombero, 51.3% from Mtibwa and 46.5% from Kagera (Figure 5.15). Another
observed source is from outgrowers own sources 48.7% from Mtibwa and 15.8% from Kagera.
On the other hand, few 30.7% OGs from Kagera use clean planting materials from Kagera Sugar
Limited.
Figure 5. 15: Sources of planting materials for OGs at KSL, KSC and MSE
Price of clean seedcane Results in figure 5.16 shows factrors that contributes in the spread of sugarcane disease at KSL,
KSC and MSE. The factors are: high price of clean seedcane with high percentages (61.9%) from
Kilombero, Inadequate knowledge with (46.6%) from Kagera and low income with 68.7% from
Mtibwa.
30.7
15.8
46.5
6.9
0
10
20
30
40
50
60
70
80
90
Estate Own Neighbours Estate+Neighbours/own
Per
cen
tage
s(%
)
Source of planting materials
Kagera
Kilombero
Mtibwa

141
Figure 5. 16: Factors influencing the spread of sugarcane diseases from OGs fields in
the surveyed areas
5.3.5 Discussion.
Socio economic characteristics of the respondents The over representation of men was influenced by the selection criteria used in the survey that
targeted the head of the household. This is because sugarcane is considered as a male crop. This
show that sugarcane farming is more of men role and also males play a big role in making
decisions on agricultural investment at house hold level.Dominance of men on sugarcane crop/
commercial crops has also been reported by (Dancer & Sulle, 2015) who found ownership of
sugarcane crop dominated by men.
Also, majority of the respondents were aged between 36-53 years. This is because this group of
age is energetic, well matured and have family responsibilities and therefore can face and resolve
any challenge they will encounter in sugarcane activities.
The study revealed that majority of sugarcane farmers are literate with primary school education
which implies that if trained there is possibities for them to adopt and practice technologies
depending on the suitability of the technology. Similarly, education level reported to determine
one’s ability to comprehend and analyse issues before taking any action (Ong et al., 2016). In
Tanzania, any person with primary school education and above is considered as literate and on
the other hand, any one with non-formal education is considered as illiterate
(www.tradingeconomics.com,2019). Literacy is the group of people with ages from 15 years and
above who can, with understanding, read and write a short, simple statement on their everyday
(https://www.indexmundi.com/tanzania/literacy.html visited on May 2019).
0
10
20
30
40
50
60
70
80
Long distanceand transportcost from the
source
Not available Inadequateknowledge
Low income High price ofclean seed
cane
Perc
enta
ges(
%)
Factors accelerates disease spread to OGs
Kagera Kilombero Mtibwa

142
Farmers’ knowledge on sugarcane diseases. The survey observed that, majority of the respondents interviewed are aware about smut
sugarcane disease compared to other diseases as shown in Figures 2,4 and 4. The disease was
witnessed by most of the respondents in their own farms and few had seen it on neighbouring
farms. This indicate that smut disease is a major challenge to sugarcane outgrowers fields in the
sugarcane mill areas. Similar results on response and knowledge of farmers in relation to smut
disease were reported in Western Kenya (Khan et al., 2014). At Mtibwa mill cane area 38.5% of
the farmers had no knowledge on sugarcane diseases which suggest that, there is a need of
training on sugarcane diseases to OG farmers to minimize number of those who have scant
knowledge of disease.
It was also evidenced that majority of the respondents were aware on smut symptoms compared
to other diseases symptoms because the disease is very common in sugarcane growing areas. On
the other hand, few OGs were observed with inadequate knowledge on symptoms of sugarcane
diseases with high percent from Kagera. It is therefore suggested to capacitate farmers on
different symptoms for different sugarcane diseases
It is also noted that most of the respondents were aware on the methods used to control smut
which are roughing followed by uprooting and replanting. However, few respondents didn’t have
any idea on how to control sugarcane diseases. Therefore, there is a need for training on proper
methods for disease control such as use of clean seedcane and adherence to sanitation measures.
Factors that accelerates the spread of sugarcane diseases The study revealed that farmers use planting materials from their neighbours and own sources.
Normally, these materials are not free from diseases, which accelerate the diseases spread from
and within sugarcane fields. Similarly, the study by (Ong et al., 2016) showed that the prevalence
for farmers whose seedcane wer sourced from factory was lower than the seedcane that were
sourced from neighbours and self-grown,. Furthermore, the use of clean planting materials to
minimize disease infection especially for vegetativelly propagated crops have also been
recommended on cassava (McQuaid et al., 2016). Also farmers were not able to afford to use
clean planting materials due to long distance and high transport cost from estate to their vicinity
which could explain the reason for not using clean seedcane.
This implies that, there is a need of establishing seedcane nursieries nearby farmers with
affordable price nearby farmers’ fields to minimize the spread of sugarcane diseases. CGIAR,
(2012) report indicated similar approach of making clean seed cane available nearby farmers’
fields with low cost to reduce the risk of disease spread on roots, tuber and banana crop.
Inadequate knowledge on the advantages of using clean planting materials and criteria used to
select clean seed cane is also witnessed as another factor contributing in spread of sugarcane
diseases. This indicate that, farmers require knowledge on the importance of using clean planting

143
materials. Research on the use of clean cane production technology and environmental
sustainability has largely reduced the incidence of disease infestation in sugarcane production
( Doorasamy, 2017).
Conclusion and Recommendations
The study has revealed that smut is the only sugarcane disease which is familiar to majority of the
sugarcane outgrowers at Kagera, Kilombero and Mtibwa. Other determinant factors for disease
spread in sugarcane fields were poor availability of clean seedcane, long distance and high
transport cost from estate and inadequate farmer’s knowledge on sugarcane disease.
Its therefore recommended to establish nursery B nearby outgrowers fields to minimize
the spread of sugarcane diseases to OGs, train farmers on sugarcane diseases, to have a
regular field visit for monitoring and backstopping and develop an efficient integrated
disease management technique for sugarcane out growers.
5.4 Project Title: Monitoring of Plant Parasitic Nematode in sugarcane growing area of Tanzania Project code: CCP 2017/02/01
Principal Investigators: B. Kashando, R. Polin, Y. Mbaga, M. Mziray, M. Masunga, and
N. Luambano,
Collaborators: N. Abubakari, N. Mlawa and M. Salum, Y.Kalinga
Reporting Period: 2018/2019
Remarks: On going
Project summary Plant parasitic nematodes involves complex of species with different feeding habits and various
degree of pathogenicity which cause losses in different crops including sugarcane. Nematodes
monitoring was done in Kagera sugar, Kilombero sugar, Tanganyika Planting Company limited and
Mtibwa Sugar. A total of 129 samples of root and soil were collected from 43 fields, in every field
three samples were collected and mixed to make a composite sample. Nematodes were extracted
from roots and soils amples based on available protocols.
The aim was (1) to assess availability of plant parasitic nematodes in all sugarcane growing areas
(2) to identify key plant parasitic nematodes of sugarcane and classify type and number based on
their difference from based on their location.
Pratylenchus spp found in all sugarcane fields while Rotylenchulus spp, was only at TPC estate.
The low population of Pratylenchus (less than 250) found at TPC medium (250-2000) found at
Mtibwa and Kilombero sugar while Kagera sugar was high (above 2000). However, Meloidogyne is
the most pathogenic species on sugarcane, but restricted to sandy soils appear to have low
population (less than 200) in all fields.

144
5.4.1 Introduction
Sugarcane production is affected by number of factors including paste and diseases, one of the
known pest is plant parasitic nematodes (Yoshida et al.,2014). The monoculture of sugarcane can
foster the accumulation of diverse nematode communities which accelerated by presence of more
than one crop cycle in sugarcane production (Bond et al., 2000).
According to Bhuiyan et al. (2016) sugarcane yield can be reduced up to 5-20% in field affected
with nematodes in Australia. The above symptoms for field affected with nematodes appear to
have patches and below symptoms the tip of the roots form galling for the presence of
Meloidogyne spp and root necrosis for the presence of Pratylenchus spp. .
This study was undertaken to gather information on the abundance and distribution of plant
parasitic nematodes in all sugarcane growing area which is important for management of spread
of plant parasitic nematode (PPN) from one field to another. Also this data can be used to indicate
type and number of nematodes which are of significant importance and used to assess yield
losses associated with nematodes and designate suitable management’s strategies.
General Objectives Monitoring population density of plant parasitic nematodes in the sugarcane fields on estates.
Specific Objectives a) To assess occurrance of plant parasitic nematodes in all sugarcane estates
b) To identify key plant parasitic nematodes associated with sugarcane and their population
density.
Output At least 2 information on the level of estates affected by nematodes known
At least 12 key plant parasitic nematode identified to genus level
43 fields monitored for plant parasitic nematodes.
5.4.2 Materials and Methods
Nematodes sampling The study was conducted from November 2018 to April 2019 at Tanganyika Planting Company
Limited, Kagera sugar limited, Kilombero sugar and Mtibwa Sugar Company. Random sampling
was done by collecting soil and root samples from all sugarcane fields in all estates mentioned
above. During sampling attention were given in the fields with symptoms caused by presence of
plant parasitic nematodes.
A total of 129 samples of root and soil were collected from 43 fields, in every field three samples
were collected and mixed to make a composite sample. The information on plant age (months),
number of ratoons and varieties were also collected (see attachment in appendix1). Samples were
kept in a plastic bag well labelled and sent to nematology laboratory at TARI- Kibaha.

145
Extraction of nematodes was accomplished by using a modified Baerman method as described by
(Coyne et al., 2007). By using dissecting and compound microscope, nematodes were identified
up to genus level and images were captured using camera connected to a microscope. The key
plant parasitic which cause yield losses to sugarcane were described and identified, data obtained
were summarized in excel 2013.
Results
Nematode occurance During sampling sugarcane fields appear to have above symptoms caused by plant parasitic
nematodes such as patches. Nevertheless the below symptoms which associated with nematodes
problems includes visible root galling at the tip of the roots and feeder roots were present, this is
caused by presence of Meloidogyne spp. Also, root necrosis which indicates the problems caused
by presence of Pratylenchus spp (Figure 5. 17).
Figure 5. 17: Symptoms of root knot (Meloidogyne spp) Figure 2: Symptoms of root
lesion (Pratylenchus spp)
TPC The results were given in three part as per sampling schedule, in Northern, Eastern and South
parts as follows;
Southern In fields 6D with variety N19 ratoon 1, and aged 8 months the main isolated nematodes were
Pratylenchus. In the soil Rotylenchulus spp found to be the most abundant (Figure 5.18). In field
10K planted variety N25 ratoon 1 and aged 4.9 months. Field B1 harbour survival of different

146
plant parasitic nematodes such as Pratylenchus spp, Rotylenchulus spp, Scutellonema spp and
Helicotylenchus spp. The sugarcane variety planted in B1 was R579, ratoon 2 and aged 4.7
months.
Figure 5. 18: Nematodes population isolated in the root and soil samples in the
Southern part of TPC.
East Low (less than 250) population of plant parasitic nematodes were isolated in both roots and soil
However population of Pratylenchus spp dominate other type of nematodes which were present in
the roots, KH19 and D34 fields (Figure 5.19).
Field KH19 during sampling it was planted variety N25 with ratoon 4 and aged 3 months but field
D34 it was variety R579 aged 2 months with ratoon 3. FieldKH7 has Pratylenchus spp and it was
planted variety N25, with ratoon 4, and aged 11 months (Figure 5.19). Other plant parasitic
nematodes isolated in different fields include Rotylenchulus spp, Hemicycliophora spp,
Tylenchorynchus spp and Xiphinema spp.
0
5
10
15
20
25
30
35
5c 6F 6D 10K B1
Pla
nt
para
sitic
nem
ato
des
/5g o
f
roots
Field name
Pratylenchus Scutelonema
Rotylenchulus Helicotylenchus
0
50
100
150
200
5c 6F 6D 10K B1
Pla
nt
para
sitic
nem
ato
des
/100m
l
soil
Field name
PratylenchusScutelonemaRotylenchulusHelicotylenchusZiphinema
0
20
40
60
80
100
KH 19 KH 7 KH 22 D34 B01 C4
Pla
nt
para
sitic
nem
ato
des
/5g
roots
Field name
Pratylenchus Scutelonema
Rotylenchulus Tylenchorynchus
0
50
100
150
KH 19 KH 7 KH 22 D34 B01 C4
Pla
nt
para
sitic
nem
ato
des
/100m
l of
soil
Field name
Pratylenchus Rotylenchulus
Tylenchorynchus Hemicycliophora
Ziphinema

147
Figure 5. 19: Pratylenchus population in the roots and soil in sugarcane fields in the
East of TPC
Northern In the roots population of Pratylenchus spp was abundance in the field M3 than any other
nematodes, and field M3 the variety planted was R579, ratoon 1 and aged 3months (Figure 5.20).
In the soil similar result was observed for the case of Pratylenchus spp in field M3 as seen in the
roots. However low population density of plant parasitic nematodes were observed because they
were less than 250 based on hazard index key.
Figure 5. 20: Pratylenchus population in the roots and soil in fields sampled in the
northern part of TPC
Kilombero sugar Medium population of Pratylenchus spp (250-2000) and low population of Meloidogyne spp (low
less than 200) were isolated in both roots and soil samples collected in the sugarcane fields. In
the roots the most abundant plant parasitic nematodes of sugarcane was Pratylenchus spp
followed by Meloidogyne spp (Figure 5. 21) in field F251 has planted R579 variety aged 9months
and ratoon 1.
The population of Pratylenchus spp was more widespread in the soil dominate population of
Meloidoyne spp in the roots. Field F226 had medium population density (250-2000) compared to
other fields (Figure 5.21)
0
20
40
60
80
100
120
140
M3 L2 N33 N80 N44
Pla
nt
para
sitic
nem
ato
des
/5g r
oots
Field names
PratylenchusScutelonemaRotylenchulus
0
50
100
150
200
250
M3 L2 N33 N80 N44
Pla
nt
para
sitic
nem
ato
des
/100m
l of
soil
Field name
Pratylenchus Rotylenchulus
Hemicycliophora Longidorus

148
Figure 5. 21: Population of plant parasitic nematodes found in the in sugarcane roots
and soil sample collected from Kilombero sugar.
Mtibwa sugar Medium population of Pratylenchus spp (250-2000) and low population of Meloidogyne spp (less
than 200) were isolated in both roots and soil samples collected in the sugarcane fields. In the
root, Pratylenchus spp found in field M4 variety NCO 376, ratoon 2 and aged 8 months (Figure
5.22). The soil sample higher abundance of Pratylenchus spp in field 131(a) planted variety N41,
aged 5 months and it was plant cane. Meloidogyne spp were present in more than one fields
sampled in the roots than in the soil.
Figure 5. 22: Population of plant parasitic nematodes in the roots and soil found in the
sugarcane fields sample collected from Mtibwa sugar
Kagera sugar
0
100
200
300
400
500
600
F.226 F.227 F.250 F.251 F.364Mean p
lant
para
sitic
nem
ato
des/
5g o
f ro
ots
Field name
Pratylenchus Meloidogyne Aphelenchus
0
100
200
300
400
500
600
700
800
F. 226 F. 227 F. 250 F. 251 F. 364
pla
nt
para
sitic
nem
ato
des/
100m
l of
soil.
Field number
Pratylenchus Meloidogyne
Aphelenchus Xiphinema
Helicotylenchus
050
100150200250300350400450500
2B(a
)
3B(a
)
M4(b
)
5B(b
)
6F(b
)
7K(b
)
11H
(a)
14J(
a)
14I(
a)
13I(
a)
14E(a
)
Pla
nt
para
sitic
nem
ato
des
/5g o
f ro
ots
Field name
Pratylenchus Meloidogyne
0200400600800
1000120014001600
Pla
nt
par
asit
ic n
emat
od
es p
er 1
00
ml o
f so
il
Field name
Pratylenchus Meloidogyne
Trichodorus Scutellonema

149
In the roots medium population of Pratylenchus spp were present other nematodes includes
Hemicycliophora spp and Trichodorus spp. (Figure 5.23) in field AP11C planted variety N25 with
ratoon 4 and aged 5 months.
In the soil high populati of Pratylenchus spp (more than 2000) dominate population of other
nematodes in the field CP2B planted variety MN, ratoon 3 and aged 7months.
Figure 5. 23: population of plant parasitic nematodes in roots and soil found in the
sample collected from Kagera sugar
Discussion
Twelve nematode genus Pratylenchus spp, Meloidogyne spp, Xiphinema spp, Scutellonema spp,
Helicotylenchus spp Tylenchorynchus spp, Rotylenchulus spp (only TPC) Aphelenchus spp,
Hemicycliophora spp, Aphelenchoides spp, Longidorus spp and Trichodorus spp was identified
and the most dominant was Pratylenchus spp followed by Meloidogyne spp which which are
among the key nematode species in sugarcane. According to Stirling & Blair, (2000) the most
pathogenic and widespread nematodes in sugarcane are Pratylenchus spp and Meloidogyne spp
particularly in sandy soil. The low population (< 250) of Pratylenchus spp was observed at TPC
which could be attributed by soil salinity.
The high population (above 2000) of Pratylenchus spp was observe in Kagera sugar Limited of
which could be contributed by sandy soil that influence movement, survival and multiplication.
This observation was similar to the study of (Rott et al., 2000) on the estimates of likely hazard to
sugarcane of various nematodes population density. Plant parasitic nematodes can cause high
reduction above 20% but the extent of losses depend on the soil type and standard of crop
management (Rott et al., 2000).
The abundance of Pratylenchus spp in the roots and soil fluctuation was associated with the mode
of life because they are migratory nematodes (Fontana et al., 2015).
0
100
200
300
400
500
600
Pla
nt
par
asit
ic n
emat
od
es /
5g
roo
ts
Field name
Pratylenchus Trichodorus Hemicycliophora
0
500
1000
1500
2000
2500
Pla
nt
par
asit
ic n
emat
od
es /
10
0m
l so
il.
Field name
Pratylenchus Trichodorus Hemicycliophora

150
Medium population of Meloidogyne spp 200-500 were isolated in the roots than in the soil. In
sugarcane production the presence of Meloidogyne spp can cause yield losses up to 30% of the
losses equivalent to 15 t cane/ha per year.(Cadet & Spaull, 2003). The existence of Meloidogyne
spp and Pratylenchus spp in the same field decrease the population of Meloidogyne spp and
increase population of Pratylenchus spp this is caused by the mode of feeding, because
Pratylenchus spp has a tendency of destructing the feeding sites established by Meloidogyne spp
in the roots (Fontana et al., 2015).
Conclusion and Recommendations
Generally, Pratylenchus spp and Meloidogyne spp which are key nematode was most wide spread
but the population of Pratylenchus spp out peak other nematodes. Moreover, Rotylenchulus spp
was found only at TPC sugarcane fields especially at southern part. Thus it is recommended to do
regular monitoring and establish proper nematode management plan.
5.5 Project title: Screening for the best control of nematodes in sugarcane production using integrated pest management
Project code: CCP 2018/02/02
Principal Investigators: B. Kashando, R. Polin, Y. Mbaga, M. Mziray, M. Masunga, and
N. Luambano,
Reporting Period: 2018/2019
Remarks: On going
Project summary
Plant parasitic nematodes affect roots of sugarcane, these nematodes can be managed by
different organic amendments. On the other hand nematicides have being widely used to control
nematodes in order to improve the growth of sugarcane on the sandy soils. Therefore the
objective of this study was to use integrated pest management by screening organic amendments
includes; Filter cake, Mucuna beans and Lablab and sunn hemp.
The objective of this study In this study we will screen the best method to manage nematodes
and increase yield in sugarcane production. The experiment was done at Kagera sugar limited in a
Filed IR14F started January 2019. Randomized Complete Block Design (RCBD) with 4 replications,
each replication consist of 6 plots. The trial consist of 5 treatment and a control and a total of 24
soil samples were collected prior to treatment application.
5.5.1 Introduction
Plant-parasitic nematodes (ppn) affect crop in the field by feeding using spear -like mouth parts to
puncture plant roots and obtain nutrients. The effect may occur either directly from root
deformation caused by nematode feeding or indirectly from predisposition to infection by other
pathogens that results from nematode penetration into the roots (Wanga et al., 2007). The study
conducted by Fontana et al. (2015) revealed the widespread of, M. javanica and P. zeae that

151
suppress yield by 20 to 30% in the first harvest in susceptible varieties. Likewise, the research
carried out by TARI Kibaha observed the high population of Pratylenchus spp and Meloidogyne
spp in the sugarcane growing areas of Tanzania.
Different methods have been used to manage nematodes to the lowest threshold (at what level)
which does not affect production. The management practices include nematicides, rotation with
plants that are non- hosts of plant-parasitic nematodes, using resistant plants, soil solarization,
organic amendments, trap crops, microbial bio-control agents (Stirling et al., 2011; Spaull &
Cadet, 2003; Mashela et al., 2017). On the other hand nematicides have being widely used to
control nematodes in order to improve the growth of sugarcane on the sandy soils. Nematicide
should be used where the clay content of the soil is less than 6% and when symptoms of
nematode damage observed on the previous cane crop harvested (Spaull, 1997). However, the
most used commercial nematicides are expensive and can be harmful by producing residual
toxicity. Therefore the objective of this study was to use integrative pest management by
screening between oxamly granule nematicides and other soil amendments like Filter cake,
Mucuna beans (Mucuna pruriens), and Lablab (Lablab purpureus) and sunn hemp (Clotararia
Juncea). In this study we will screen the best method to manage nematodes and increase yield in
sugarcane production.
General objective
To evaluate the efficient of different organic amendment in management of plant parasitic
nematodes in sugarcane.
Specific objective
1. To identify an efficient integrated pest management (IPM) against nematodes on
sugarcane production
Expected output
At least 2 organic amendment will be identified
5.5.2 Material and methods
Location
Two trials established at Kagera Sugar Limited and Kilombero Sugar Company.
Intergrated pest management was done to screen the best organic amendment used such as
Sunn hemp (Clotararia Juncea), Mucuna Bean (Mucuna pruriens) Lablab purpureus, and Filter
pressmud (filter cake) in a comparison with Foxamyl granule 110G.
Experimental design
The experiment was done at Kagera sugar limited in a Filed IR14F with dual layout design on 03
Janury 2019. Complete Randomized Block Design (CRBD) with 4 replications, each replication
consist of 6 plots. The trial consisted of 5 treatment and a control. Treatment one was Sunn hemp

152
(Clotararia Juncea), treatment two Mucuna Bean (Mucuna pruriens) treatment 3 Lablab
purpureus, treatment 4 Foxamyl granule, treatment 5 Filter pressmud (filter cake) and treatment
6 was a control. The space between one replication and another was 1.7m and between plot was
2m. Average spacing between cane row was 1.2m, therefore total number of plot was 24. Total
area of the plot was 31 square metre (10mx3.1), and a total experimental area consisted of
1546.6 sqm (20.9mx74m). Clean sugarcane variety N41was planted and the treatment selected
for nematodes management were applied in the field depend on the design per plot.
Treatments
i. Sunn hemp
38.75g of sunn hemp was applied per plot which consisted of four cane rows. In each row of 10
metre 9.69 g was spread along single cane row.
ii. Mucuna pruriens
Plots with treatment number 2, at interval of 20 cm Mucuna pruriens was planted, and space
between Mucuna pruriens lines is 60cm.
iii. Lablab purpureus
Plots with treament number 3, at interval of 20 cm Lablab purpureus was planted, and space
between line Lablab purpureus is 60cm.
iv. Foxamly Granule nematicides
93g of Foxamly Granule nematicides was applied per plot which consist four cane rows. In each
row of 10 metre 23.25 g was spread along single cane row.
v. Filter cake
93kg of Filter cake was applied per plot which consist four cane rows. In each row of 10 metre
23.25 kg was spread along single cane row.
Data collection
A total of 24 soil samples were collected prior treatment application. Sample were collected at 20
cm depth and kept in plastic bag, well labelled, kept in cool box and sent to TARI Kibaha for
nematode analysis. Extraction was done by using modified Baerman technique (Coyne et al.,
2007). Nematode identification was accomplished using Leica 2500 under 100x magnification.
Data analysis
The data obtained will be subjected to analysis of variance (ANOVA) using GenStat program

153
5.5.3 Results
Based on the preliminary results, seven population of Plant parasitic nematode were identified in
the soil of experimental area prior to application of treatments. The identified nematodes were
Helicotylenchus spp,Meloidogyne spp, Paralongidorus spp, Pratylenchus spp, Scutellonema spp,
Trichodorus spp and Xiphinema spp.Mean population of Pratylenchus spp indicates medium
population 250-200 and the remaining nematodes found to have low population less than 250 in
the soil. These finding will be used to compare the effect of each treatment based on the number
of nematodes Table 5.4.
Table 5. 4: Mean population of plant parasitic nematodes isolated in the soil prior to
application of different integrated pest managements.
Mean population of plant parasitic nematodes in soil before application of treatments
Treatm
ent
Helicotylenc
hus
Meloidog
yne
Paralongido
rus
Pratylenc
hus
Scutellone
ma
Trichodo
rus
Xiphine
ma
2 3 5 5 372 0 0 0
3 0 50 10 508 0 15 0
4 5 35 0 400 0 5 3
5 5 38 8 320 3 3 3
6 3 25 3 208 5 8 0
Lsd 8.75 81.8 12.75 287.7 6781,0 15.6 4.3
CV (%) 202 191.5 187.2 60.2 365.1 204.2 364.4
P 0.837 0.893 0.606 0.12 0.539 0.349 0.564
Note: Similar trial was set at Kilombero Sugar Company but it was terminated due to some
treatment fail to germinate.
Way forward
Second data collection on the experimental area after the incorporation of organic
amendment will be done next season. The results obtained after the analysis will be used
to compare the population of nematodes before and after incoperation of organic
amendments in term of type of nematodes and quantity.
To repeat the same experiment at Kilombero Sugar company

154
5.6 Project title: Study on yield losses associated with key plant parasitic nematodes affecting sugarcane in Tanzania Project code: CCP 2017/02/03 Principal Investigators: B. Kashando, R. Polin, Y. Mbaga, M. Mziray, M. Masunga, and N. Luambano, Collaborators: N. Abubakari, N. Mlawa and M. Salum, Y.Kalinga Reporting Period: 2018/2019 Remarks: On going Project summary Based on the study which was accomplished by TARI Kibaha from different sugarcane estate revealed the presence of different plant parasitic nematodes the key nematodes was Pratylenchus spp followed by Meloidogyne spp. These nematodes can cause different loses in sugarcane production as describe in different literatures. However in Tanzania no information on the losses caused by plant parasitic nematodes in sugarcane production. Therefore the aim of this study is to assess yield losses associated with plant parasitic nematodes on varieties R570, R579 and Co 617 by using pots experiment in screen house. The experiments will be conducted at TARI Kibaha arranged in a completely randomized design. To date only multiplication of inoculum has being initiated in the laboratory. 5.6.1 Introduction
Yield losses caused by plant parasitic nematodes which affect sugarcane production differ from
one place to another. The study of Fontana et al.,( 2015) indicated that yield losses associated
with plant parasitic nematodes especially for very susceptible varieties and high nematode
population densities, may reach 50% on sugarcane crop.
Following the study conducted by TARI Kibaha in collaboration with Tanganyika Planting
Company, Kagera sugar Mtibwa sugar and Kilombero Sugar Company on monitoring of plant
parasitic nematodes on sugarcane fields, the widespread of Pratylenchus spp and Meloidogyne
spp were observed. These plant parasitic nematodes affect different sugarcane cultivars and
cause yield losses which differ from one place to another. However the effect caused by single
genus of plant parasitic nematodes either Meloidogyne spp or Pratylenchus spp and the presence
of co-existence of both genus in the sugarcane fields in Tanzania is unknown. Therefore the aim
of this study is to assess yield losses associated with plant parasitic nematodes on varieties R570,
R579 and Co 617 using pots experiment in screen house.
Specific objective
To determine the effect of single genera of nematodes and competition among Meloidogyne spp
and Pratylenchus spp on sugarcane growth.
Expected output
At least economic threshold level for 2 Plant Parasitic Nematode will be established

155
5.6.2 Materials and Methods
Three experiments will be conducted in the greenhouse at TARI Kibaha arranged in a completely
randomized design. Pratylenchus spp which were extracted from sugarcane roots will be
multiplied in the carrot disc under sterilised laboratory condition. Adult and juveniles will be
collected in a distilled water and used as inoculant. Multiplication of Meloidogyne will be done in
tomato seedling using Cal J variety which is suceptible to nematodes. To get combined treatment
of Pratylenchus and Meloidogyne equal number of population will be introduced in one tube
before inoculated in the pot.
The first experiment will use autoclaved soil with inoculum of Pratylenchus in a rate of 0, 500,
1000 and 1500 per 5kg pot of soil. Pratylenchus will be induced around the roots via a straw after
the sett was planted.
The second experiment will consist of autoclaved soil plus Meloidogyne in a rate of 0,500, 1000
and1500 per 5kg of soil in a pot. Meloidogyne will be induced around the roots via a straw after
the sett was planted.
Third experiment will comprise autoclaved soil plus known amount of Pratylenchus and
Meloidogyne in a rate of 0,500, 1000 and1500 per 5kg of soil in a pot. Half population
Pratylenchus and half of Meloidogyne will be induced around the roots via a straw after the sett
was planted.
Mature stalks of sugarcane cultivar R570, R579 and Co 617, will be selected and each with three
replications, with a cut of two buds nodes (sett). The sett will be immersed in water at 50oc for 3
hours as a treatment for RSD and any other diseases. Sterilised soil about 4kg will be placed in
5kg pots with 3 drainage holes. During planting and after 30 days pot will be fertilized by applying
fertilizer DAP and urea to the surface and the pot will be arranged in CRD in the screen house.
After nine months from inoculation, the cane stalks will be harvested by separating the roots from
the tops.
Data collection
Soil and root samples will be collected for analysis of nematodes Nematode extraction will be
done using modified Baerman technique. The dry weight of root and shoots, the length of primary
shoots to the top leaf collar and number of shoot will be measure. Multiplication rate of
nematodes =Pi/Pf, and at harvest tch and brix will be measured.
Statistical analysis
The data obtained will be subjected to analysis of variance (ANOVA) using Gen Stat program
Progress
At this stage we have started mass multiplication of nematodes in the laboratory.
5.7 References

156
Benevenuto, J., Longatto, D. P., Reis, G. V., Mielnichuk, N., Palhares, A. C., Carvalho, G., … Monteiro-Vitorello, C. B. (2016). Molecular variability and genetic relationship among Brazilian strains of the sugarcane smut fungus. FEMS Microbiology Letters, 363(24), 1–8. https://doi.org/10.1093/femsle/fnw277
Bond, J. P., McGawley, E. C., & Hoy, J. W. (2000). Distribution of plant-parasitic nematodes on sugarcane in louisiana and efficacy of nematicides. Journal of Nematology, 32(4S), 493–501. Retrieved from http://www.pubmedcentral.nih.gov/articlerender.fcgi?artid=2620482&tool=pmcentrez&rendertype=abstract
Cadet, P., & Spaull, V. W. (2003). Effect of nematodes on the sustained production of sugarcane in South Africa. Field Crops Research, 83(1), 91–100. https://doi.org/10.1016/S0378-4290(03)00066-2
CGIAR. (2012). CGIAR Research Program : Roots , Tubers and Bananas for Food Security and Income Program Participant Agreement Annex 2A : Product Portfolio 2012 Theme 5 : Developing tools for more productive , ecologically robust cropping systems Approved version. 1–25.
Coyne, D. L., Nicol, J. M., & Claudius-Cole, B. (2007). Practical plant nematology: A field and laboratory guide.
Dancer, H., & Sulle, E. (2015). Gender implications of agricultural commercialisation : The case of sugarcane production in Kilombero District , Tanzania. (May).
Davis, M. J. (2008). Comparison of Diagnostic Techniques for Determining Incidence of Ratoon Stunting Disease of Sugarcane in Florida. Plant Disease, 68(10), 896. https://doi.org/10.1094/pd-69-896
Doorasamy, M. (2017). Clean Cane Production Techniques and Environmental Sustainablility: A Review. Journal of Sustainable Development, 10(5), 44. https://doi.org/10.5539/jsd.v10n5p44
Fontana, L. F., Dias-arieira, C. R., Mattei, D., Biela, F., Arieira, J. D. O., & Campus, R. (2015). Competition between Pratylenchus zeae and Meloidogyne incognita on sugarcane. Nematropica, 45, 1–8.
Gao, S. J., Pan, Y. B., Chen, R. K., Chen, P. H., Zhang, H., & Xu, L. P. (2008). Quick detection of Leifsonia xyli subsp. xyli by PCR and nucleotide sequence analysis of PCR amplicons from Chinese Leifsonia xyli subsp. xyli isolates. Sugar Tech, 10(4), 334–340. https://doi.org/10.1007/s12355-008-0059-0
Grisham, M. P., Pan, Y.-B., & Richard, E. P. (2007). Early Detection of Leifsonia xyli subsp. xyli in Sugarcane Leaves by Real-Time Polymerase Chain Reaction . Plant Disease, 91(4), 430–434. https://doi.org/10.1094/pdis-91-4-0430
Hadush Hagos, A. L. (2015). Study on the Reaction of Sugarcane Genotypes (CIRAD-2011) to Sugarcane Smut (Sporisorium scitamineum) in the Ethiopian Sugarcane Plantations. Advances in Crop Science and Technology, 03(04), 3–5. https://doi.org/10.4172/2329-8863.1000181
Khan, Z. R., Midega, C. A. O., Nyang’au, I. M., Murage, A., Pittchar, J., Agutu, L. O., … Pickett, J. A. (2014). Farmers’ knowledge and perceptions of the stunting disease of Napier grass in Western Kenya. Plant Pathology, 63(6), 1426–1435. https://doi.org/10.1111/ppa.12215
Magarey, R. (2013). Diseases of Australian Sugarcane: Field Guide. Marques, J. P. R., Appezzato-da-Glória, B., Piepenbring, M., Massola, N. S., Monteiro-Vitorello, C.
B., & Vieira, M. L. C. (2017). Sugarcane smut: Shedding light on the development of the

157
whip-shaped sorus. Annals of Botany, 119(5), 815–827. https://doi.org/10.1093/aob/mcw169
Mcfarlane, S. A. (2003). EVALUATION OF SUGARCANE VARIETIES FOR RESISTANCE TO RATOON STUNTING DISEASE by. (September).
Mutonyi, J., & Nyongesa, H. (2016). Incidence And Prevalence of Ratoon Stunting Disease (Leifsonia Xyli Subsp. Xyli, Evtushenko) In The Mumias Sugar Cane Growing Zone Kenya. 9(11), 28–31. https://doi.org/10.9790/2380-0911022831
Nzioki, H., Jamoza, J., Olweny, C., & Rono, J. (2010). Characterization of physiologic races of sugarcane smut (Ustilago scitaminea) in Kenya. African Journal of Microbiology Research, 4(16), 1694–1697. Retrieved from http://www.academicjournals.org/ajmr
Pan, Y.-B., Grisham, M. P., Burner, D. M., Damann, K. E., & Wei, Q. (2007). A Polymerase Chain Reaction Protocol for the Detection of Clavibacter xyli subsp. xyli , the Causal Bacterium of Sugarcane Ratoon Stunting Disease . Plant Disease, 82(3), 285–290. https://doi.org/10.1094/pdis.1998.82.3.285
Philip, E. S. (2016). Occurrence of Sugarcane Ratoon Stunting Disease in Nyando Sugar Belt and Its Management By Hot Water Treatment. 61. Retrieved from http://erepository.uonbi.ac.ke/bitstream/handle/11295/97508/Philip_Occurrence Of Sugarcane Ratoon Stunting Disease In Nyando Sugar Belt And Its Management By Hot Water Treatment.pdf?sequence=1&isAllowed=y
Philippe Rott, Roger A. Bailey, Jack C. Comstock, Barry J. Croft, A. S. S. (2000). A guide to sugarcane diseases. Cirad Publications Service.
Schaker, P. D. C., Peters, L. P., Cataldi, T. R., Labate, C. A., Caldana, C., & Monteiro-Vitorello, C. B. (2017). Metabolome Dynamics of Smutted Sugarcane Reveals Mechanisms Involved in Disease Progression and Whip Emission. Frontiers in Plant Science, 8(May), 1–17. https://doi.org/10.3389/fpls.2017.00882
Spaull, V. W., & Cadet, P. (2003). Impact of Nematodes on Sugarcane and, 230–238. Su, Y., Wang, Z., Xu, L., Peng, Q., Liu, F., Li, Z., & Que, Y. (2016). Early Selection for Smut
Resistance in Sugarcane Using Pathogen Proliferation and Changes in Physiological and Biochemical Indices. Frontiers in Plant Science, 7(July), 1–10. https://doi.org/10.3389/fpls.2016.01133
Sundar, A. R., Barnabas, E. L., Malathi, P., & Viswanathan, R. (2012). A mini-review on smut disease of sugarcane caused by Sporisorium scitamineum. Botany, (May 2014), 107–128. Retrieved from http://cdn.intechopen.com/pdfs/32715/InTech-A_mini_review_on_smut_disease_of_sugarcane_caused_by_sporisorium_scitamineum.pdf
Tiwari, A. K., Vishwakarma, S. K., Kumar, P., & Pandey, N. (2012). Mini Review Article Ratoon stunting disease ( Leifsonia xyli ) of sugarcane. 1(1), 20–24.
Yoshida, K., Toyota, K., Miyamaru, N., Kawanaka, T., & Kawanobe, M. (2014). Plant-parasitic nematodes in sugarcane fields in Kitadaito Island (Okinawa), Japan, as a potential sugarcane growth inhibitor. Nematology, 16(7), 807–820. https://doi.org/10.1163/15685411-00002810
Zekarias, Y., Mashilla Dejene, G., & Tegegn, F. Y. (2011). Importance and status of sugarcane smut (Ustilago scitaminea) in the Ethiopian sugar estates. Ethiop. J. Agric. Sci., 21(1–2), 35–46.

158
APPENDIX 1: SMUT INCIDENCE AT KAGERA SUGAR LIMITED
SN Field Variety Age cc Area % smut incidences
1 IRID CO617 6 3 25 4.2 2 OR2D CO617 4 4 28 3.3 3 ER10D CO617 8 3 4 0.1 4 DR3 CO617 5 3 3.9 0 5 JR11D CO617 3 3 24 2.3 6 JR12A CO617 2 4 25 2.7 7 JR12C CO617 8 2 25 0.7 8 H24 CO617 3 3 10 1.3 9 H19A CO617 3 10 3.2 10 H14 CO617 2 25 1.8 11 BR3C CO617 2 2 8 4.1 12 KR3A MN1 2 4 10.7 0.2 13 GP5D MN1 2 3 25 0 14 BP2B MN1 4 2 2.5 0 15 BR4A N19 4 2 4.6 0 16 DP10C N25 0 3 24.7 0 17 BP7C N25 1 2 25 0 18 TR8A N47 1 5 0 19 IR8A N47 1 4 24 0.3 20 H20 N47 3 2 2 0 21 GP5C N47 2 2 25 0 22 KR3E N49 0 3 3.7 0 23 ER4D N49 0 3 14.2 0 24 IR11C N49 1 2 22.5 0.2 25 FP3D R579 2 2 9.3 0 26 TP3B R579 2 3 19 0.1 27 TP8A R579 2 2 17.7 0 28 FP9A R579 1 3 6.5 0 29 H16 R579 2 25 0.2 30 AR12D R579 2 3 14.7 0.4 31 AP2A R579 3 2 6.3 0 32 AP2B R579 3 2 6.3 0 33 BP7D R579 1 4 25 0
APPENDIX 2: SMUT INCIDENCE AT TPC SUGAR LIMITED
SN Variety Crop cycle Age (Months) Area (Ha) Location %Infestation
1 M700 1 3.2 9.9 East 0
2 M700/86 1 2.6 5.29 South 0
3 M700/86 1 2.7 7.82 South 0.7
4 N25 1 3.8 9.83 East 0
5 N30 6 2.7 30.76 North 0

159
6 N30 6 1.7 25.35 North 0
7 N41 0 4 18.8 East 0
8 N41 2 1.5 21.67 East 0.4
9 R 575 0 2.5 24.9 North 0
10 R 575 5 2.6 25.52 North 0.9
11 R 575 1 3.1 21.36 South 0.6
12 R 575 1 3.2 15.54 South 8.9
13 R 579 1 3.8 24.9 East 0
14 R 579 4 3.3 18.74 East 0
15 R 579 4 3.2 19.15 East 0.1
16 R 579 1 3.2 21.78 South 0
17 R 579 1 2.6 11.48 South 0
18 R 585 1 2.7 6.68 South 0
19 R 85/1334 1 2.6 2.7 South 0
20 R 85/1334 1 2.7 7.04 South 0
APPENDIX 3: SMUT INCIDENCE AT MTIBWA SUGAR ESTATE
S/N Field Variety Crop cycle Age (Months) Area (Ha) Location % Infestation
1 E11(b) R 570 1 3 15 Dakawa 1 0.3
2 9A(a) N41 6 2.7 13.2 Central 0.9
3 A4(b) R570 2 3.5 14.05 Dakawa 1 0.5
4 DO9(b) R579 1 2 17.7 Dakawa 2 0
5 11A(a) NCO376 3 3.1 13 South 4.02
6 A3(a) NCO376 3 4 15.8 Dakawa 1 4
7 C8A R 575 4 4 15.85 Dakawa 1 4.5
8 D8(a) R579 4 3 15.8 Dakawa 1 0
9 C12 © R579 PC 3.5 24.5 Dakawa 2 0
10 1A(b) R570 2 2.5 13.4 Central 0.4
11 11A(b) N41 3 3 13 South 1.5
12 2D R 579 1 2 2 Central 0
13 M8(a) N12 PC 1.7 12.9 North 0.4
14 M9(a) N41 4 2.2 13 North 2.3
15 A4(a) NCO376 2 3 15.85 Dakawa 1 4.1
16 14A N12 1 3.8 10 South 1.4
17 J6B N32 3 3.4 5.1 North 4
18 16B N32 4 3.4 10 North 4
APPENDIX 4: SMUT INCIDENCE AT KAGERA OUTGROWERS FIELDS
FIELDS VILLAGE VARIETY CROP CYCLE AGE/MONTH %SMUT
INFESTATION
1 Kyaka C0617 R3 2 2
2 Kyaka C0617 R1 3 2

160
3 Kyaka C0617 R1 2.5 0
4 Kyaka C0617 R2 4 3.3
5 Kyaka C0617 R3 3 1.5
6 Bubale C0617 R2 2 0.3
7 Kasambya C0617 R3 3 0
8 Mabuye C0617 R2 3 2.4
9 Mabuye C0617 R2 3 0
10 Mabuye C0617 PC 2 0
11 Mabuye C0617 R2 3 3.4
12 Mabuye C0617 R3 3 3.8
13 Mabuye C0617 R1 3 2
14 Mabuye C0617 R3 3 3
15 Mabuye C0617 R3 3 4.2
16 Kakindo C0617 R2 3 1.5
17 Kakindo C0617 R2 3 0
18 Kakindo C0617 R3 3 0.7
19 Kakindo C0617 R3 3 0.3
20 Kakindo C0617 R3 3 0.6
21 Kakindo C0617 R3 3 1
22 Kakindo C0617 R3 3 0
APPENDIX 5: TPC field sampled
Southern
No Field Variety Ratoon Age/months
1 5C mixed 1 3.8
2 6F R585 2 9.3
3 6D N19 1 8.3
4 10K N25 1 4.9
5 B1 R579 2 4.7
East
6 KH 19 N25 4 3
7 KH 7 N25 4 11.3
8 KH 22 R579 4 3.9
9 D34 R579 3 2.4
10 B01 R579 3 2.4
11 C4 N41 3 2.7
Northern

161
12 M3 R579 1 3
13 L2 N30 7 3.9
14 N33 R575 6 3.8
15 N80 NCO 0 10.9
16 N44 N30 6 9.5
APPENDIX 6: Kilombero sugarcane field sampled
Field no Variety Crop cycle Age/month
226 R579 R1 9
227 R570 R1 4
250 R579 R1 8
251 R579 R1 9
364 MN1 R1 7
APPENDIX 7: Mtibwa sugarcane field sampled
Farm Field Name Variety AGE/MONTHS Crop cycle
CEN 2B(a) R570 2 R1
CEN 3B(a) R570 4.967105 R1
NOA M4(b) NCO 376 7.993421 R2
CEN 5B(b) R570 4 PC
CEN 6F(b) N12 4.342105 PC
CEN 7K(b) N12 9.144737 R1
SOA 11H(a) R570 6 PC
SOA 14J(a) R579 3 PC
SOA 14I(a) N25 2.203947 R1
SOA 13I(a) N41 5 PC
SOA 14E(a) N41 4 R2
APPENDIX 8: Kagera sugarcane field sampled
Field Name Variety Age/months Crop cycle
CP3B N19 5 R2
CP3A N47/N41 6 R3
CP2D N47/N41 9 PC
CP2A N47/N41 8 PC
CP2B MN1 7 R3
BP6B N41 5 PC
BP2A N25 8 PC
AP11C N25 5 R4
AP11B R579 5 R4

162
AP5C N25 12 R4
AP5A N25 7 R5

163
6.0 TECHNOLOGY TRANSFER
6.1 Project Title: Strategies to Improve Extension Services to Sugarcane Growers through Farmers Field School (FFS) in Kilombero and Mtibwa Investigators: John Msemo, Diana S. Nyanda, Magreth Kinyau
Collaborators: Farmers, VAEO’s, DAICO, Local Area Officer, KSE and Farmers’
Organizations
Reporting time: 2018/2019
Summary
Farmer Field School (FFS) is a forum where farmers and trainers debate on observations and
apply their previous experiences and present new knowledge gained. The objective was to
enhance sugarcane production technologies for improved productivity through farmer field school,
specifically aim to empower farmers with knowledge and skills of sugarcane production practices
and also empower farmer’s ability in making informed decisions which results to sustainable
sugarcane farming production and productivity. In year 2017/2018 and 2018/2019, three FFS was
established at Kilombero and Mtibwa whereby a total of 55 farmers which comprises 33 males and
22 females were participated and trained on the uses of clean seedcane from nursery B, fertilizer
recommendation (N100, P25, K100) and herbicides combination and rates of 4litre per hectare and
empowered with decision making skills.
6.1.1 Introduction
Several agriculture extension approaches from top down to more participatory have been tried in
Tanzania among of that is farming system approach (FSA), conventional extension system and
training and visiting. Some fails of these approaches fails to meet the goals, however the most
recently used is farmer field school.
Farmer field schools (FFS) is a group-based adult learning approach that teaches farmers how to
experiment and solve problems independently, sometimes called “schools without walls”. It’s a
learning approach that emphasizes problem solving and discovery based learning. FFS aims to
build farmers’ capacity to analyze their production systems, identify problems, test possible
solutions, and eventually encourage the participants to adopt the practices most suitable to their
farming systems (FAO, 2013). Improving decision making capacity of farming communities and
stimulating local innovation for sustainable agriculture (R. Braga et al 2011). Also provide an
opportunity for farmers to practice and test technologies. In FFS groups of farmers meet regularly
with a facilitator, observe, talk, ask questions and learn together. It is a participatory approach to
extension, whereby farmers are given opportunity to make a choice in the methods of production
through discovery based approach. FFS aims to increase the capacity of groups of farmers to test
new technologies in their own fields, assess results and their relevance to their particular
circumstances and interact on a more demand driven basis with the researchers and extension
officers looking to these for help where they are unable to solve a specific problem amongst
themselves.

164
Objective
To enhance sugarcane production and productivity through farmer field school (FFS)
Specific Objectives
i) To empower farmers with knowledge and skills of sugarcane production practices
ii) To empower farmer’s ability in making informed decisions results to sustainable
sugarcane farming.
Outputs achieved
Two (2) FFS established at Mtibwa for the year of 2017/2018 and one (1) FFS for 2018/2019 in
the villages of Kisala and Mzambarauni and Lumango at Kilombero mill area respectively. 55
farmers trained on sugarcane practices where by male were 33 and female were 22.
6.1.2 Methodology
Farmers that participated in FFS were selected through village meeting by listing of those village
households that express interest in participating and fulfil the selection criteria. According to the
farmer trainers and villagers, this process often leads to listing of exactly 25 households for the
FFS. A total of 55 farmers (33 males and 22 females) identified. Criteria for selection based on the
fact that the farmers must be sugarcane growers and be in groups and able to attend the class
session each week in the field selected.
The land for FFS was acquired through voluntary basis from the member of the groups and will be
used as field for training and farmers meet once per week. In any case if there is something
special or activities which needs farmer to meet more than weekly, then timetable will be
changed.
Farmers generate their own learning materials, from drawings of what they observe to the field
trials themselves. These materials are always consistent with local conditions are less expensive
to develop, are controlled by the learners and can thus be discussed by the learners with others.
The input for training like seedcane, fertilizers, and herbicides were provided by TARI-Kibaha but
implementation was done by farmer groups themselves like planting, weeding, fertilizer
application. Before starting season farmers were trained on three packages namely; fertilizers N100
P25 K100, clean seed cane from nursery B and recommended herbicide (volmuron at rate of 4 liters
per ha) developed by TARI Kibaha.

165
Figure 6. 1 FFS at Mzambarauni village Mvomero and Lumango village Mvomero
6.1.3 Results and Discussion
Two (2) FFS established at Mtibwa mill area for the year of 2017/2018 in villages of Kisala and
Mzambarauni and one FFS established in the year of 2018/2019 at Kilombero in the village of
Lumango. A total of 55 farmers trained on sugarcane agronomical practices including the use of
clean seedcane from nursery B and variety used was NCo376, fertilizer recommendation was
(N100, P25, K100) and herbicides combination and rates (Volmuron 4lts/ha) and empowered with
decision making skills. Awareness materials was printed and distributed to farmer’s groups and
this was essential as supporting materials for their classes of FFS.
The results also show that the yield from farmer field school (FFS) were higher as compared to
farmers practice and the yield of farmers practice were from 20.8 to 67 TCH as compared to yield
of 80 to 89 TCH on farmer’s field school as shown in the figure below (figure 6.2).

166
Figure 6. 2 Figure Yield of FFS 2017/18 at Mtibwa mill area
The farmers were able to participate in all activities which are essential in agricultural activities
like planting, weeding, fertilizer application and herbicides, farmers were able to meet once per
week and recorded all the important things like insect pest, weeds and diseases.
The majority of the technologies presented and discussed during FFS appeared to be very
relevant to farmers. From the interviews carried out with farmer trainers it appeared that they
have a clear understanding of the objectives of FFS and recognize the importance of it in the
training of the farmers to become capable decision makers. When visiting the sugarcane field with
FFS participants, it was evident that the FFS sessions practiced and participants understood the
concept taught.
Conclusion
FFS participants appreciated the hands-on, practical approach of FFS with demonstrations in fields
and the use of live samples of diseases and pests with participation of activities including planting,
weeding, herbicides application which makes it easy to understand and memories. Fertilizer
application and herbicides was considered the most useful session and was very popular.
0
20
40
60
80
100
120
MZAMBARAUNI KISALA
Yie
ld in T
CH
VILLAGE
IP
FP

167
6.2 Project title: Establishment of Demonstration plot in Mvomero, Kilosa and
Kilombero Districts
Project code: TT 2018/19/02
Investigators: John Msemo, Diana S. Nyanda, Magreth Kinyau
Collaborators: VAEO’s, DAICO, Local Area Officer, and Farmers’ Organizations
Reporting Period: 2018/2019
Summary
Demonstration plots are one of the tools for effecting desirable changes in the behavior of farmers
and explores the technologies available and developed. In view of these in the year 2018/19, nine
(9) demonstration plots were established at Mang’ula, Lumango, Kunguru mwoga, Msolwa
ujamaa, Mfilisi and Sonjo at kilombero mill area. Furthermore, Kisala, Mzambarauni and Lungo
villages at Mtibwa mill area. Three packages were demonstrated which are the use of clean
seedcane from B nursery, recommended fertilizer packages N100 P 25 K100, herbicides volmuron 4
liters/hectare (combination and rates) and good agronomic practices such as land preparation,
planting, weeding, planting, gap filling, fertilizer and herbicide application. Farmers were able to
see, learn and to apply technologies to their fields. The demonstration plot was also compared to
other plot which uses farmers practice and the yield data were captured after harvest. The yield
ranges from 87 TCH to 111 TCH as compared to farmers practice which ranges from 63 to 75 TCH
in both sites of Kilombero and Mtibwa mill area. About 522 farmers were learned demonstration
plots at kilombero and 260 at Mtibwa mill areas through visiting.
6.2.1 Introduction Demonstration plot is one of the methods to disseminate improved technologies. This method is
used to sugarcane growers as a tool for effecting desirable changes in the behavior of farmers,
arranging the best learning situations, and providing opportunities in which useful communication
and interaction take place between extension workers and farmers.
The use of demonstration plots for technology transfer is perceived as means of improving
effectiveness in knowledge transfer (Mirani and Memon 2011). Depending on the context,
demonstrations can be referred to as on-farm or field demonstrations and they constitute an
important tool for enabling farmers to learn first-hand about improved agricultural production
practices. (Khan et al., 2009).

168
Figure 6. 3 Demonstration plot at Kungurumwoga village
Objectives
To disseminate improved technologies of sugarcane production
To demonstrate the use of clean and high quality seedcane for increased sugarcane
productivity
Outputs achieved
Nine (9) demonstration plots established
522 farmers/visitors accessed demo plots in Kilombero and 260 for Mtibwa mill area
6.2.3 Methodology Sugarcane growers were selected purposively with an ability and track record in best cane
growing practices and who follow the improved technologies developed by researchers.
Criteria for selection of demonstration plots includes the following conditions: The area should be
passable throughout the year, the land should be selected in places where people can see and
learn easily, and the land should reflect typical ecological situations of sugarcane crops.
6.2.4 Results and Discussion
Nine (9) demonstration plots established in 2018/19. Where by 522 farmers/visitors accessed
demonstration plots at Kilombero and 260 for Mtibwa mill areas. The yields of 9 demonstration
plots for (2017/18) increased compared to farmer practice. The yield ranges from 87 TCH to 111
TCH as compared to farmers practice which ranges from 63 to 75 TCH in both sites of Kilombero
and Mtibwa mill area.

169
Figure 6. 4 The yield of the demonstration plot
Conclusion Demonstration plots are one of the methods to improve yields. These methods are used as tools
by the extension workers to effect desirable changes in the behavior of rural population, arrange
the best learning situations, and provide opportunities for useful communication and interaction
that take place between researchers who developed technologies and extension workers who
implement and farmers who adopt improved technologies.
6.3 Project Title: The multiplication of clean seedcane at Kilombero, Kagera and Mtibwa Mill Area Code: TT 2018/03
Investigators: Diana S. Nyanda, John Msemo, Magreth Kinyau
Collaborators: Farmers, VAEO’s, DAICO, Local Area Officer, KSC, KSL, MSE
Estates and Farmers’ Organizations
Reporting Period: 2018/2019
Summary
Economical sugarcane yield potential depends on factors that contribute to increase yields to
farmers; the use of clean seed cane, use of recommended fertilizer, and use of recommended
herbicides as well as the use of good agronomic practices such as proper land preparation,
recommended spacing and timely weeding. The accessibility of the clean seedcane is the biggest
challenge that most of farmers face in Kilombero, Kagera and Mtibwa mill area which resulting to
low productivity. To solve the problem, the multiplication of nursery B was established at
0
20
40
60
80
100
120
140Y
ie
ld
in
TC
H
VILLAGE
IP
FP
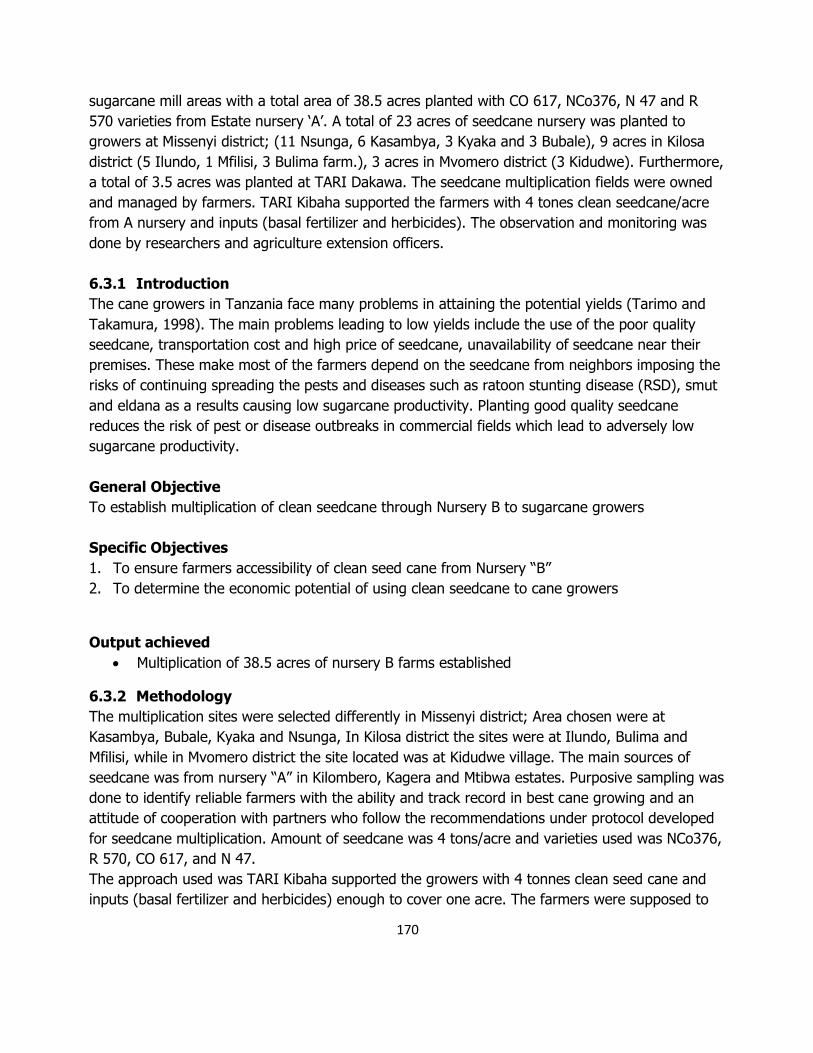
170
sugarcane mill areas with a total area of 38.5 acres planted with CO 617, NCo376, N 47 and R
570 varieties from Estate nursery ‘A’. A total of 23 acres of seedcane nursery was planted to
growers at Missenyi district; (11 Nsunga, 6 Kasambya, 3 Kyaka and 3 Bubale), 9 acres in Kilosa
district (5 Ilundo, 1 Mfilisi, 3 Bulima farm.), 3 acres in Mvomero district (3 Kidudwe). Furthermore,
a total of 3.5 acres was planted at TARI Dakawa. The seedcane multiplication fields were owned
and managed by farmers. TARI Kibaha supported the farmers with 4 tones clean seedcane/acre
from A nursery and inputs (basal fertilizer and herbicides). The observation and monitoring was
done by researchers and agriculture extension officers.
6.3.1 Introduction
The cane growers in Tanzania face many problems in attaining the potential yields (Tarimo and
Takamura, 1998). The main problems leading to low yields include the use of the poor quality
seedcane, transportation cost and high price of seedcane, unavailability of seedcane near their
premises. These make most of the farmers depend on the seedcane from neighbors imposing the
risks of continuing spreading the pests and diseases such as ratoon stunting disease (RSD), smut
and eldana as a results causing low sugarcane productivity. Planting good quality seedcane
reduces the risk of pest or disease outbreaks in commercial fields which lead to adversely low
sugarcane productivity.
General Objective
To establish multiplication of clean seedcane through Nursery B to sugarcane growers
Specific Objectives
1. To ensure farmers accessibility of clean seed cane from Nursery “B”
2. To determine the economic potential of using clean seedcane to cane growers
Output achieved
Multiplication of 38.5 acres of nursery B farms established
6.3.2 Methodology
The multiplication sites were selected differently in Missenyi district; Area chosen were at
Kasambya, Bubale, Kyaka and Nsunga, In Kilosa district the sites were at Ilundo, Bulima and
Mfilisi, while in Mvomero district the site located was at Kidudwe village. The main sources of
seedcane was from nursery “A” in Kilombero, Kagera and Mtibwa estates. Purposive sampling was
done to identify reliable farmers with the ability and track record in best cane growing and an
attitude of cooperation with partners who follow the recommendations under protocol developed
for seedcane multiplication. Amount of seedcane was 4 tons/acre and varieties used was NCo376,
R 570, CO 617, and N 47.
The approach used was TARI Kibaha supported the growers with 4 tonnes clean seed cane and
inputs (basal fertilizer and herbicides) enough to cover one acre. The farmers were supposed to

171
repay loan to TARI Kibaha in monetary form equivalent to the market price of 4 tons of seedcane.
Then extension officers and Local Area Officer (LAO) of the particular area were helping in
managing the multiplication plot.
6.3.4 Results and Discussion
A total of 38.5 acres of seedcane nursery B were established at Missenyi, Kilosa and Mvomero
district as shown in table below.
Table 6. 1 The area of seedcane planted 2018/19
S/n District location Area planted (acres)
1 Misenyi Nsunga 11
Kasambya 6
Kyaka 3
Bubale 3
2 Kilosa Ilundo 5
Mfilisi 1
Bulima farm 3
3 Mvomero Kidudwe 3
TARI- Dakawa 3.5
Total 38.5
Way forward
Sensitization to farmers on the use of clean seedcane established from nursery B
6.4 PROJECT TITLE: Scaling up sugarcane production technologies through training and development of extension materials Project code: TT 2018/04
Investigators: John Msemo, Diana S. Nyanda, Magreth Kinyau
Collaborators: Farmers, VAEO’s, DAICO, Local Area Officerand Farmers’
Organizations
Reporting Period: 2018/2019
Summary
The sugarcane growers face many problems in production of sugarcane, one of them is
inadequate knowledge and access to information on the available technologies for improvement of
sugarcane production. Therefore, the intended project tried to use methods of developing
research materials like banners, posters, flyers, brochure and training manuals. A total of 6 new
recruited staff of Sugar Board of Tanzania (SBT) and 7 prison officers of Mbigiri was trained on
sugarcane production. The training was covered both theory and practical sessions. Apart from
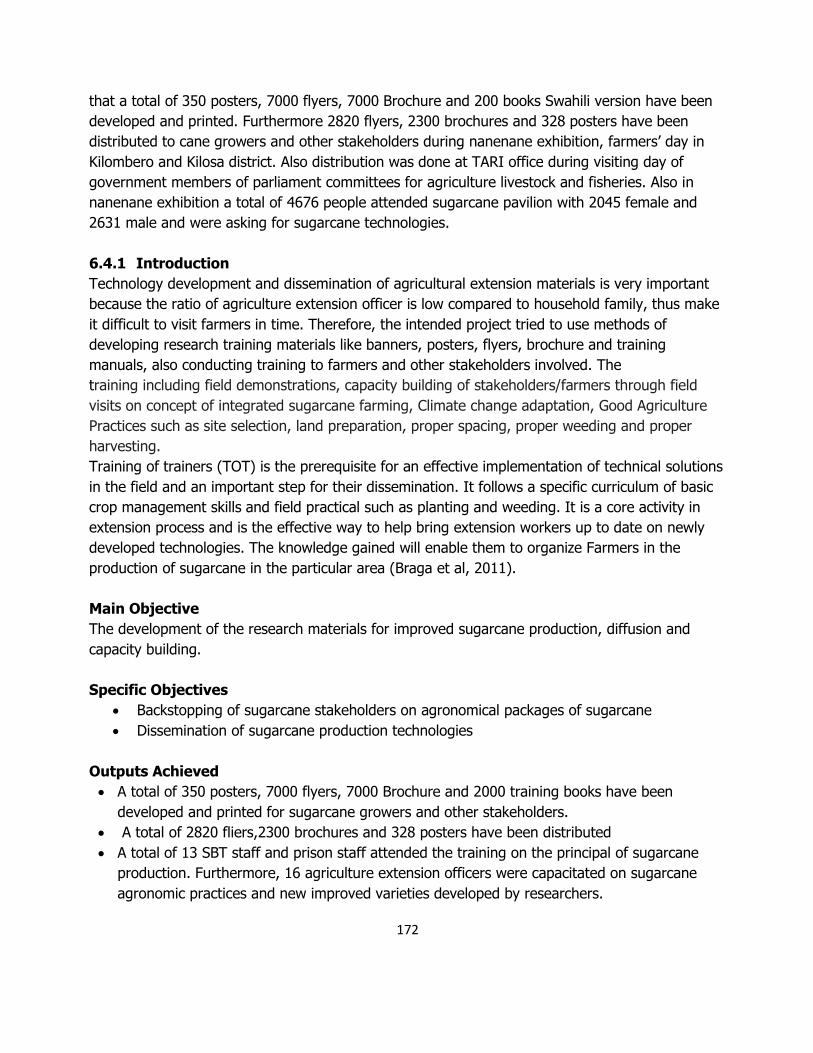
172
that a total of 350 posters, 7000 flyers, 7000 Brochure and 200 books Swahili version have been
developed and printed. Furthermore 2820 flyers, 2300 brochures and 328 posters have been
distributed to cane growers and other stakeholders during nanenane exhibition, farmers’ day in
Kilombero and Kilosa district. Also distribution was done at TARI office during visiting day of
government members of parliament committees for agriculture livestock and fisheries. Also in
nanenane exhibition a total of 4676 people attended sugarcane pavilion with 2045 female and
2631 male and were asking for sugarcane technologies.
6.4.1 Introduction
Technology development and dissemination of agricultural extension materials is very important
because the ratio of agriculture extension officer is low compared to household family, thus make
it difficult to visit farmers in time. Therefore, the intended project tried to use methods of
developing research training materials like banners, posters, flyers, brochure and training
manuals, also conducting training to farmers and other stakeholders involved. The
training including field demonstrations, capacity building of stakeholders/farmers through field
visits on concept of integrated sugarcane farming, Climate change adaptation, Good Agriculture
Practices such as site selection, land preparation, proper spacing, proper weeding and proper
harvesting.
Training of trainers (TOT) is the prerequisite for an effective implementation of technical solutions
in the field and an important step for their dissemination. It follows a specific curriculum of basic
crop management skills and field practical such as planting and weeding. It is a core activity in
extension process and is the effective way to help bring extension workers up to date on newly
developed technologies. The knowledge gained will enable them to organize Farmers in the
production of sugarcane in the particular area (Braga et al, 2011).
Main Objective
The development of the research materials for improved sugarcane production, diffusion and
capacity building.
Specific Objectives
Backstopping of sugarcane stakeholders on agronomical packages of sugarcane
Dissemination of sugarcane production technologies
Outputs Achieved
A total of 350 posters, 7000 flyers, 7000 Brochure and 2000 training books have been
developed and printed for sugarcane growers and other stakeholders.
A total of 2820 fliers,2300 brochures and 328 posters have been distributed
A total of 13 SBT staff and prison staff attended the training on the principal of sugarcane
production. Furthermore, 16 agriculture extension officers were capacitated on sugarcane
agronomic practices and new improved varieties developed by researchers.

173
A total of 4676 attended sugarcane pavilion with 2045 female and 2631 female during
nanenane.
6.4.2 Methodology
The development of training materials was done to all unit which are breeding, pathology,
entomology, nematodes, agronomy and technology transfer. The aim was each section to develop
the user friendly output for leaflets and brochures. The process of production was based on the
available technologies which developed in each unit. Training of trainers and farmers were done
by using manual prepared by researchers.
6.4.3 Results and discussion
The training was done with TARI team with a total participation of 6 SBT new recruited staff and
7 prison officers of Mbiligiri. The training was covered in all aspect related to sugarcane
production technologies and it covered both theory and practical session.
Figure 6. 5 SBT staff during training – practical session and graduation.
Printing of Training Materials
During 2018/19 season, 7 banners, 350 posters, 7000 flyers, 7000 Brochures and 200 training
manuals were printed and distributed to farmers at sugarcane mill areas (Kilombero, Kagera and
Mtibwa), nanenane exhibition, and during the visit of members of parliament committees for
agriculture livestock and fisheries.
Nanenane Exhibitions
Nanenane is also sometimes called “Farmers’ Day”. It’s a time when the contribution of farmers
and all involved in agriculture of all kinds throughout Tanzania are appreciated.
A week-long national Nanenane day fair takes place each year, but the location varies and
rotates. There are seven regional level fairs for Nane nane that are put on simultaneous to the
National fair. The fairs start on 1 August and run till 8 August. The agriculture shows conducted
every year. During eight days of exhibition we had people who were looking for a technology
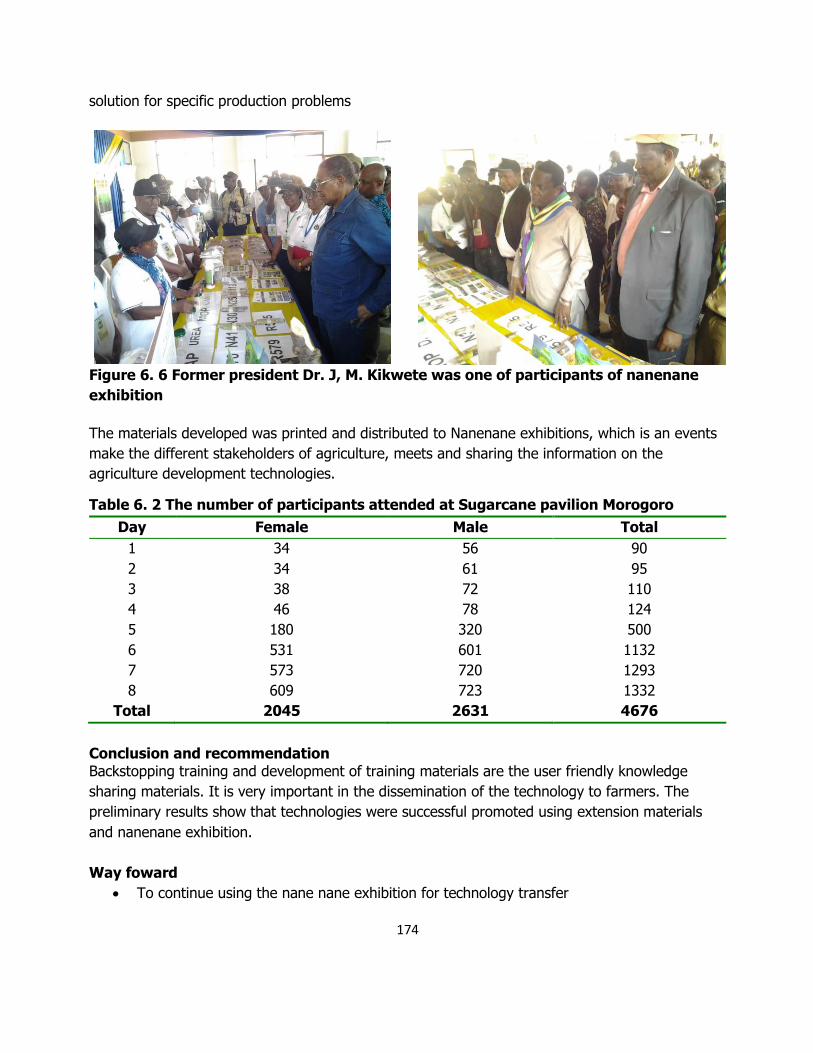
174
solution for specific production problems
Figure 6. 6 Former president Dr. J, M. Kikwete was one of participants of nanenane
exhibition
The materials developed was printed and distributed to Nanenane exhibitions, which is an events
make the different stakeholders of agriculture, meets and sharing the information on the
agriculture development technologies.
Table 6. 2 The number of participants attended at Sugarcane pavilion Morogoro
Day Female Male Total
1 34 56 90
2 34 61 95
3 38 72 110
4 46 78 124
5 180 320 500
6 531 601 1132
7 573 720 1293
8 609 723 1332
Total 2045 2631 4676
Conclusion and recommendation Backstopping training and development of training materials are the user friendly knowledge
sharing materials. It is very important in the dissemination of the technology to farmers. The
preliminary results show that technologies were successful promoted using extension materials
and nanenane exhibition.
Way foward
To continue using the nane nane exhibition for technology transfer

175
To make evaluation of the developed training materials
6.5 Project Title: Promotion of Sugarcane Production Technologies to Sugarcane
Growers by Mass Media
Code: TT 2018/05
Investigators: John Msemo, Diana S. Nyanda, Magreth Kinyau
Collaborators: Farmers, VAEO’s, DAICO, Local Area Officer, KSC, MSE Estates and
Farmers’ Organizations
Reporting Period: 2018/2019
Summary
It is well known that radio play a significant role in transferring information to many communities.
Statistics show that if radio is used effectively can help to narrow the gap between the extension
officer and family households in obtaining information of agriculture technologies, In view of this
the implemented project aimed at transferring knowledge of sugarcane technologies to growers at
Morogoro mill areas by using radio. Prior to implementing the radio program, a preliminary study
of indigenous farmers knowledge was conducted at Madizini village in Mvomero , Kitete village in
Kilosa and Nyange village in Kilombero. Using Participatory rapid appraisal (PRA) and Focus
Group Discussion (FGD) techniques. Tools used were transect drive, crop calendar, pairwise
ranking and score. Pairwise and ranking showed that most preferred radio in all location was
Abood FM was also supported by transect drive. Thereafter the two workshop was conducted at
Kibaha and Morogoro and came up with 26 episodes which covered production to harvesting. At
end of seasons a total of 96 calls was received so far from listeners and about 3175 messages
received, this indicate that the radio has potential impact in transferring technologies and narrow
the gap between of extension officers and household’s community on knowledge and information
6.5.1. Introduction
It is well known that the ratio of agriculture extension officers and farming families is low as
compared to number of farmers which increases every year. The gap will continue to exist as the
ratio of recruitment of new staff is low compared to the growth of population.
Radio plays the most significant role of any communication technology in the transfer of
information in African countries because spoken word on broadcast radio is the principal means of
information transfer where literacy rates are low (Yahaya, M. K et al., 2012)
In Tanzania Radio has been considered as the most important and most preferred tool in
communication as compared to other means of transferring technologies (FRI 2008). Statistics
have shown that radio receivers are at least ten times more common than Television (TV) set in
developing countries (Okelo J. 2007)).

176
In Tanzania farmer’s extension groups(FRG) which are groups of farmers that are working with
extension on the verification of recommended messages and option has been used for past year
to evaluated the research message through recorded message on radio, however in order this to
be effective needs specific crops and groups.
In sugarcane growing areas of Kilombero, Mvomero, Kilosa and Misenyi there more than 9,000
cane growers who supply sugarcane to millers. Effort to make them improve production and
productivity of their fields has been done using different approach like an extension method of
training and visiting (T&V) backstopping of VAEO, and use them to train farmers, establishment of
FFS to farmers growing areas and establishment of demonstration plot. All these effort aims at
increase production and productivity of sugarcane growers. Because of the situation above
emphasis on district councils and research is on the growing of this crops especially to the place
accessible to mill area, The TARI Kibaha in collaboration with other stakeholders has put emphasis
in establishments of Nursery Demonstration B plots and FFS for easy access of clean materials
It is not a secret that most farmers obtain seed from their own field or neighbor which are not
clean, therefore diseases especially smut have been passed over generation to another fields and
leading to low yields to sugarcane growers.
It is therefore awareness creation through radio farmers will increase knowledge on the
importance of agronomical practices of sugarcane as well as importance of using the seedcane
from nursery B
Main objective
Promotion of sugarcane production technologies to sugarcane growers through radio program
Specific objective
Dissemination of sugarcane production technologies in Kilombero, Kilosa and Mvomero mill
area
Outputs achieved
A total of 26 episodes developed was aired to farmers in Morogoro regions sugarcane mill
areas
A total of 3171 messages was received through radio
A total of 96 telephone calls was received from the starting of radio episodes
6.5.2 Methodology
The Execution of the Project Involved Three Stages
Stage 1 Information gap
In identifying information Participatory Rapid Appraisal (PRA) and Focus groups discussion (FGD)
were conducted at Madizini village in Mvomero district, Kitete village in Kilosa district and Nyange
village in Kilombero district. Tools used were crop calendar, matrix ranking, and Venn diagram
and transect driving around community of sugarcane growing areas. The selection of farmers was

177
done purposively with assistance of extension officer’s and Local Area Officer (LAO) of respective
areas and criteria used was good record on production of sugarcane and participation on farmer’s
field school. The results from pair wise ranking show that most preferred radio along Mtibwa
milling area were, Abood FM followed by Planet and uhuru. (Table 6.3)
Table 6. 3 Pairwise and ranking of radio preferred by farmers in Mtibwa mill area
TBC Abood Planet Uhuru Cloud Total Rank
TBC Abood Planet Uhuru Cloud 0 4
Abood Abood Abood Abood 4 1
Planet Planet Planet 3 2
Uhuru Uhuru 2 3
Cloud
The focus group discussion from kitete and Nyange which represented kilombero mill area were
conducted and results is as shown below
Table 6. 4 Pairwise ranking and scoring of radio at Kilombero mill area
Ulanga Aboud TBC 1 Pambazuko Planet Score Rank
Ulanga ulanga Ulanga Ulanga Ulanga 4 1
Abood Abood Abood Abood 3 2
TBC 1 Pambazuko TBC 1 1 4
Pambazuko Pambazuko 2 3
Planet 0 5
The results showed that the most frequency and popular radio were ULANGA FM followed by
Abood FM radio and others were TBC, Pambazuko and Radio planet FM.It was north to note that
Abood radio covered in both sites, therefore were selected to air radio program (table 6:4).
Stage 2 workshops
Two workshops conducted at Kibaha and Morogoro involving participation of sugarcane
stakeholders and media specialist. The aim of workshops was to develop the radio program that
will be aired by consideration of important topic and also development of the script which valuing
a farmers and listeners, giving them an opportunity to express themselves, and also providing a
relevance information, convenience and entertaining messages. The workshops ended by
selection of 26 episodes which aired twice per by consideration of crop calendar.
Stage 3 Radio broadcasting
Time selected was 6:30 pm every Friday and repeated at Wednesday day at 6:30. Three methods
were used in broadcasting the first was interview of a successful sugarcane farmer from
sugarcane growing areas who tell the success stories and challenges and ask some listeners to
call and text questions and comments. Second method was interview sugarcane expert from

178
extension services or researchers or any organization then after airing invite the listeners to call or
text with questions and comments. Third method was host an expert for live airing at Abood radio
studio. After transmissions to radio was concluded by experts giving a
6.5.3 Results and Discussion
Results show all total of 26 episodes was aired from 2017 to 2018/2019 covering the following
topics from varieties of sugarcane, agronomic practices, plant protection, harvesting and
environment and safety precaution.
A total of 96 calls was received from the respondents over directed calling from respondents and
almost questions and comments was covered in all aspects.
A total of 3171 messages have been received from listeners on the questions and issues related to
sugarcane.
in summary from the evaluation radio discussions with episodes in Morogoro sugarcane growing
areas, show that the most common interactions during radio program were demanding from new
seedcane variety (39%), pests and diseases (19%), planting pattern (14%), fertilizers type and
application (13%), herbicides (8%) and other question (9%), some was not coverage to directly
topics concerned (fig 6;10)
Figure 6. 7 Distribution of questions asked by listeners on radio programs aired
Results also indicate that, radio was covered to larger areas apart from area intended these was
Dodoma, Simiyu, Kongwa, Kilosa, Ruvuma,Tanga,Pemba and most of people were demanding to
have sugar factory. It was worth to note that the most area covered was Morogoro region
especially Kilosa (27%), Mvomero (28%) and Kilombero (33%).
38%
20%
8%
14%
11%
9%
New varietyseedcanePest and diseases
Herbicides
Planting pattern
Fertilizer
others

179
Figure 6. 8.Radio coverage area in Morogoro region
From the listeners of radio and telephone calls the preliminary results show that. The main
challenge farmer’s face was low yielding of sugarcane and this was due to the use low yielding
varieties from neighbors, diseases and pest such as smut, poor weed management and/no little
use of fertilizers. The listeners were found to pay attention to the use of clean seed from Nursery
B and demanding of new highly yielding seed cane, and the proper use of fertilizer in the
productions of sugarcane. The number of farmers reported in different episodes was found to
concentrate in the use clean seed and new variety to replace NCO 376 to grower’s fields.
Conclusion The studies show that radio can be used to improve the sharing of agricultural information to
remote rural farming areas through participatory communication techniques therefore support
extension effort in disseminations of technologies. Also the radio can be effective in narrowing the
gap between agriculture extension officers if used properly. It can be concluded that radio
programme was well received by target audience, and format in which they were presented was
easily understood, that is using the experience from farmers to explain how they know certain
topic and summarized by knowledgeable people by showing how it is was supposed to be,
however, sustainability and continuity of these programed must be taken into consideration.
Recommendations
To conduct impact assessment of radio to area which was intended to be aired
To review the topic intended to be aired based on questions we received
Kilombero33%
Kilosa27%
Mvomero28%
Ifakara7%
Morogoro5%
Kilombero Kilosa Mvomero Ifakara Morogoro

180
6.6 References A.Ngendelo,S.S.B Mgenzi and Ted Schrader Dissemination of Agricultural technology: Narrowing
the gap between reserchers,Proceedin Workshop of the National on Client oliented
research 2013 Moshi
Farm Radio International (2016) final report for Tanzania, Malawi, and Ethiopia.
Khan, A., Pervaiz, U., Khan, N. M., Ahmad, S., & Nigar, S. (2009). Effectiveness of demonstration
plots as extension method adopted by AKRSP for agricultural technology dissemination in
District Chitral. Sarhad J. Agric, 25(2), 313–319
Mirani, Z. and Memon, A. (2011). Farmers‟ assessment of the farm advisory service of
Okello, J. (2007). Radio - The Lead Information Communication Technology for Rural Information
Dissemination: Case study for ALIN - Information Communication Technology Experiences
Manual. Apac Town, Uganda, Arid Lands Information Network (ALIN).
Public and private agricultural extension in Hyderabab District
R. Braga R. Labrada L. Fornasari and N. Fratini (2011). Manual for Training of Extension Workers
and Farmers on Alternatives to Methyl Bromide for Soil Fumigation. Rome Italy.
Sindh.PakstanJournal of Agricultural Research 24(1-4):56-64.
Tarimo, J.P. and Takamura, Y.T. (1998). Sugarcane Production and Marketing in Tanzania: Joint
paper prepared for the department of Crop Science and Production, Sokoine University of
Agriculture and Center for African Area Studies.
Yahaya, M. K. and O. I. Badiru (2002). "Measuring the Impact on Farmers of Agricultural Radio
and Television Programs in Southwest Nigeria
Website: www.sugar.org.za/sasri seedcane production visited on 5/13/2019

181
APPENDIX 9:Projects for 2018/19
1 SCB 2018/01 Closed and open quarantine
2 SCB 2018/03, SCB 2017/02 Smut screening trials
3 SCB 2017/03, SCB 2016/, SCB
2015, SCB 2015/03, SCB 2013/04
Preliminary screening trials
4 SCB 2018/05 Advanced variety trials
5 SCB 2016/05, SCB 2017/05 National Performance trials
6 SCB 2018/06 COSTECH Clonal selection
7 SCB 2018/07 Rapid seedcane multiplication
8 SCB 2018/08 Germplasm conservation
9 AP/2018/03/ 12 large bloc experiment at KSC (PC)
10 AP/2017/03/02 12 large block experiment at KSC (R1)
11 AP/2016/03/02 OG variety trial (R11)
12 AP/2015/03/03 OG variety trials (R 111)
13 AP/2014/03/04 OG variety trials (R IV)
14 AP/2016/03/02 Fertilizer trial at Kagera (R1)
15 AP/2017/03/03 Fertilizer trial at Kagera (Pc)
16 AP/2018/03/ Fertilizer trial Kagera (New)
17 AP/2017/03/04 Baseline survey on the status of Striga spp in
Tanzania
18 AP/2018/03/0 Herbicide trial at Kagera
19 AP/2018/03/0 9 Large block trials at Mtibwa
20 CPE 2018/01 Study on seasonal insect population fluctuation
in all estates and OF fields
21 CPE 2018/02 Establishment of WS evaluation trial at KSC
22 CPE 2018/03 Production of white scale predators
23 CPE 2018/04 Insecticides trial for control of YSA at TPC, KSC
and KSL
24 CPE 2018/05 Evaluation of sugarcane varieties to YSA
damage in cages (New project)
25 CPE 2018/06 Impact of predators in controlling YSA (New
project)
26 CPP 2017/01/01 Monitoring and management of plant diseases
(RSD)
27 CPP 2018/01/02 Disease assessment (SCWL, Smut, SYLV)

182
28 CPP 2018/01/03 Diagnosis of sugarcane white leaf scale
29 CPP 2018/01/04 Investigation on potential insect vectors of
sugarcane white leaf disease in Tanzania
40 CPP 2018/01/05 Assessment of disease management practices
by sugarcane small-scale farmers in Tanzania:
Case study of KSL, KSC and MSE Mill areas
41 CPP 2018/02/01 Monitoring and management of plant parasitic
nematodes (PPN)
42 CPP 2018/02/02 A study on crop loss on plant parasitic
nematodes associated with sugarcane in
Tanzania
43 CPP 2018/02/03 An investigation of IPM practices for nematode
control in sugarcane
44 TT.2018/01 Establishment of demonstration plots
45 TT.2018/02 Establishment of B-nursery
46 TT.2018/03 Backstopping mission (training of trainers)
47 TT.2018/04 Monitoring and evaluation
48 TT.2018/05 Radio broadcasting
49 TT.2018/06 Factors affecting efficiency of sugarcane
productivity along sugarcane value chain