annual global survey 2016 - world federation … · the report on the annual global survey 2016...
TRANSCRIPT

ANNUAL GLOBAL SURVEY2016
October 2017
WORLD FEDERATION OF HEMOPHILIA REPORT ON THE

Report on the Annual Global Survey 2016 is published by the World Federation of Hemophilia.
All data are provisional.
© World Federation of Hemophilia, 2017
To obtain permission to reprint, redistribute, or translate this publication, please contact the Research and Public Policy Department at the address below.
Please credit the WFH when Annual Global Survey data are used in presentations, publications, or other research material. We encourage researchers to contact us at [email protected] when they use WFH Annual Global Survey data.
Please note: This material is intended for general information only. The World Federation of Hemophilia does not endorse particular treatment products or manufacturers; any reference to a product name is not an endorsement by the World Federation of Hemophilia. The World Federation of Hemophilia is not a regulatory agency and cannot make recommendations relating to safety of manufacturing of specific blood products. For recommendations of a particular product, the regulatory authority in a particular country must make these judgments based on domestic legislation, national health policies and clinical best-practices.
World Federation of Hemophilia1425, boul. René-Lévesque Ouest, bureau 1010 Montréal, Québec H3G 1T7 CanadaTel. (514) 875-7944Fax: (514) 875-8916E-mail: [email protected]: www.wfh.org

1REPORT ON THE ANNUAL GLOBAL SURVEY 2016
TABLE OF CONTENTS
Introduction .................................................................................................................................... 3
Summary of survey data ................................................................................................................. 7
Graphs – number of identified patients ....................................................................................... 10
Graphs – factor usage .................................................................................................................. 11
Data Source .................................................................................................................................. 24
Severity ......................................................................................................................................... 25
Countries included in the survey .................................................................................................. 27
Population statistics ...................................................................................................................... 28
Distribution of reported bleeding disorders ................................................................................ 32
Gender distribution ...................................................................................................................... 36
Patients with inhibitors ................................................................................................................. 37
Age distribution of hemophilia and VWD .................................................................................... 40
HIV and HCV infection .................................................................................................................. 50
Reported use of prophylaxis......................................................................................................... 53
Reported use of factor concentrates ............................................................................................ 56
Annual Global Survey 2016 questionnaire ................................................................................... 64
Glossary ........................................................................................................................................ 74

2 REPORT ON THE ANNUAL GLOBAL SURVEY 2016
SINGAPORE
COUNTRIES INCLUDED IN THE REPORT ON THE ANNUAL GLOBAL SURVEY 2016
Countries included
Countries not included
The WFH has a total of 134 National Member Organizations (NMOs). The Report on the Annual Global Survey 2016 includes data from 113 NMOs.

3REPORT ON THE ANNUAL GLOBAL SURVEY 2016
INTRODUCTION TO THE REPORT ON THE ANNUAL GLOBAL SURVEY 2016The Report on the Annual Global Survey 2016 includes selected demographic and other data on people with hemophilia (PWH), von Willebrand disease (VWD), other rare factor deficiencies, and inherited platelet disorders throughout the world. The purpose of this report is to provide hemophilia organizations, hemophilia treatment centres (HTCs), and health officials with useful information to support efforts to improve or sustain the care of people with bleeding disorders and to assist with program planning. Supplementary charts and graphs using 2016 data can be found on the website at: www.wfh.org/en/data-collection.
MethodologyIn 1998, the World Federation of Hemophilia (WFH) began collecting information on hemophilia care throughout the world. This survey, called the WFH Annual Global Survey, collects basic demographic information, data on access to care and treatment products, and information on the prevalence (the percentage of the population affected) of infectious complications such as HIV and hepatitis C (HCV). The WFH compiled the first survey report in 1999.
Each year questionnaires are sent to national hemophilia associations linked with the WFH with the request that they in turn work with physicians or health officials, as necessary, to complete the survey. The WFH reviews completed questionnaires for inconsistencies, which are clarified where possible by communicating directly with the participating organization. The 2016 survey is the eighteenth WFH survey. This report also uses data from the year 2015. Not all of our members are able to report every year. Previous Annual Global Survey reports have used historical data going back more than 1 year. A list of participating countries and the last year they provided data can be found on page 27 . This report includes data on more than 295,000 people with hemophilia, von Willebrand disease and other bleeding disorders in 113 countries. Data from the WFH questionnaire are supplemented with data from other sources in order to provide a general socio-economic picture of each country surveyed. The survey questionnaire is included at the end of this report.
Total population numbers are used in Table 6 Population statistics and in the calculation for factor VIII and IX per capita (Table 16 and 17). The source from 1999 to 2014 was The World Factbook, Central Intelligence Agency. As of 2015, this was changed to The World Bank Group. General population numbers are estimates based on national government data.

4 REPORT ON THE ANNUAL GLOBAL SURVEY 2016
Comments on the graphsThe graph showing the increase over time in patients identified contains historical data from the Annual Global Survey. This graph was created using aggregated numbers to demonstrate the increases in patients identified over time. If a country reported data one year and not the next, the older data were used on the assumption that the number of patients did not change substantially from one year to the next. For all the graphs, answers were not always available for all questions. In such cases, the analysis was done using only data from countries that responded, with the number of respondents as the denominator.
Comments on data collectionParticipation in the Annual Global Survey is voluntary. Although these data are self-reported, fairly consistent information on hemophilia care has been obtained from countries with similar economic capacities, validating its use for program planning. Some countries are only able to provide detailed data on gender, age, inhibitors and HIV/HCV infection for a limited subset of patients. For example, they may know the total number of people with hemophilia in the country but only have age and gender data from a single treatment centre. This report provides information on the annual usage of treatment products for 2016 only. It includes only those countries where the national hemophilia organization provided information. Quantities reported were not independently verified except when the WFH has data on humanitarian donations it provided in 2016. In some cases the numbers reported may be based on an estimate or from one region or hospital only. The amounts reported may only be factor bought through government and not through other sources. Not all national hemophilia organizations are able to report on all products used in their country. Although factor use per capita is a useful way to compare the availability of treatment products between countries, it is not a reflection of how individual patients are treated. For example, in a country with a lower than expected number of identified patients, the amount of treatment product available per patient is higher than the per capita number would suggest.
Please consider the following caveats about the data in this report:a) Founder effects can create pockets of patients concentrated geographically. The founder
effect occurs when a small population grows in isolation and there is little genetic dilution. This can increase the local frequency of genetic disease compared to the general population. This may occur with hemophilia and all the rare bleeding disorders. In the extremely rare bleeding disorders, consanguinity may lead to an increased incidence in some countries.
b) Countries with small populations can appear to have too many identified patients. Countries submitting data to the WFH range in population from 300,000 to over a billion. With a small denominator (total population), just a few extra identified patients (the numerator) can create the appearance of huge percentage differences between expected and identified patients when really there are only a few more patients than expected.

5REPORT ON THE ANNUAL GLOBAL SURVEY 2016
c) The type of health care system in a country can influence data quality. A country with universal health care may be more likely to identify patients with hemophilia even if they do not require treatment. In countries with different health care systems, it is likely that patients who do not require treatment will not be identified.
d) Definitions may vary from country to country. Countries may use different definitions to diagnose mild hemophilia and other disorders. In the case of the rare bleeding disorders, some countries may report heterozygous patients while other countries report only patients with bleeding symptoms.
e) Some countries are reporting every patient who seeks treatment while other countries are using methods to identify patients who do not require treatment, such as laboratory screening or follow up with families of identified patients.
f) Data gathering and the state of registries varies. Maintaining accurate registries can be time consuming and expensive. It is possible that some registries contain patients who have been double-entered or have died. Even wealthy countries with excellent registries have to carefully review their records to avoid over-counting. Countries with large populations are more susceptible to over-counting. It is harder to keep track of births and deaths. Some patients may be registered in more than one treatment centre and validation of registry data is more difficult.
g) There is also the possibility that the death rate due to HIV and hepatitis C infection is not the same around the world. In some countries there may have been lower infection rates, while other countries may have had better treatment for infected people with hemophilia.
h) The numbers in this report are as reported by our members. They are not independently verified by the WFH. Some countries are not reporting for the whole country; they only have data from certain treatment centres or large cities.
The Report on the Annual Global Survey is collected under the supervision of the WFH Data & Demographics Committee, including:
Chair: Alfonso Iorio Members: Vanessa Byams Magdy El Ekiaby Mike Makris Jamie O’Hara Alok Srivastava Jeff Stonebraker Marijke van den BergAnnual Global Survey Reviewers: Paula Bolton-Maggs Randall Curtis Suely Rezende Mike Soucie
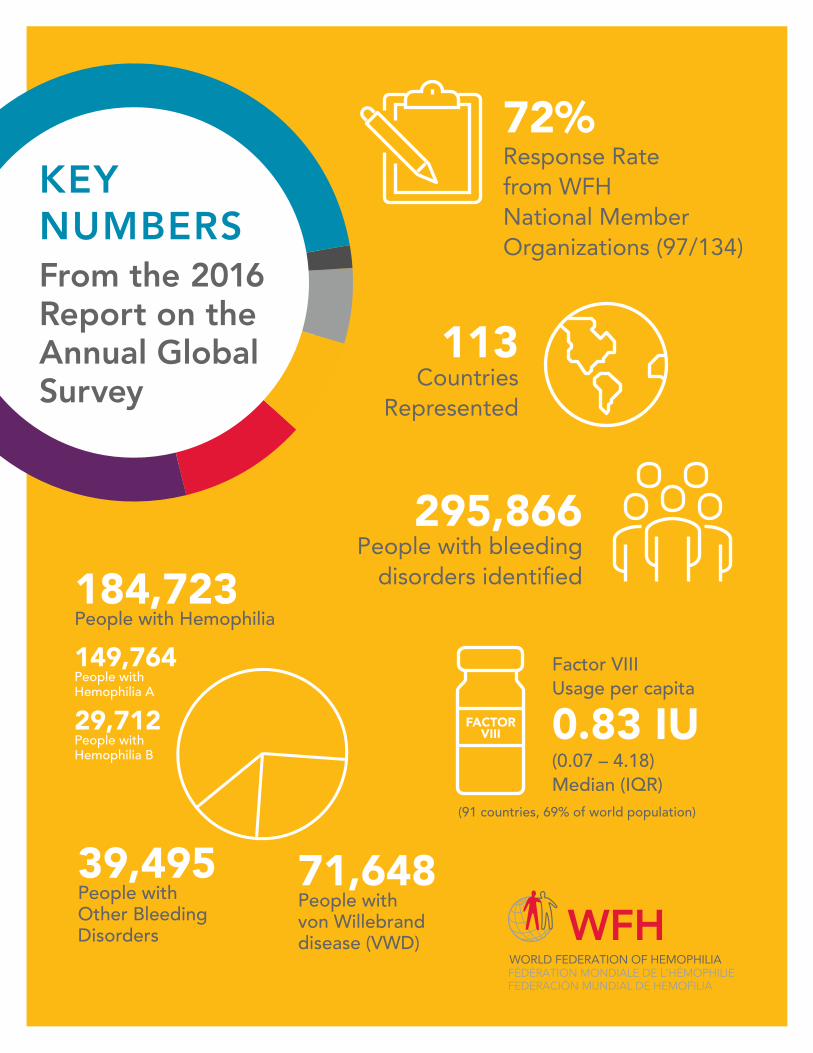
Factor VIII Usage per capita
0.83 IU(0.07 – 4.18) Median (IQR)
(91 countries, 69% of world population)
KEYNUMBERS
295,866People with bleeding
disorders identified
113Countries
Represented
72% Response Rate from WFH National Member Organizations (97/134)
From the 2016 Report on the Annual Global Survey
184,723 People with Hemophilia
149,764 People with Hemophilia A
29,712 People with Hemophilia B
39,495 People with Other Bleeding Disorders
71,648 People with von Willebrand disease (VWD)
7REPORT ON THE ANNUAL GLOBAL SURVEY 2016
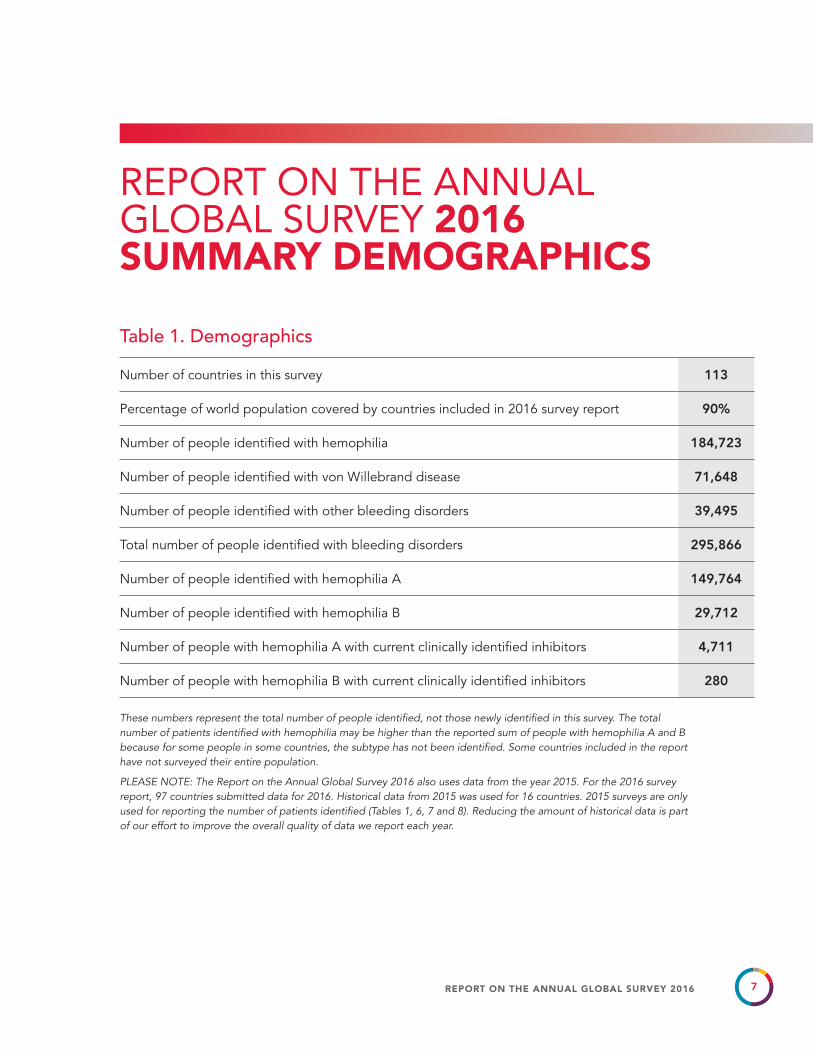
Table 1. Demographics
Number of countries in this survey 113
Percentage of world population covered by countries included in 2016 survey report 90%
Number of people identified with hemophilia 184,723
Number of people identified with von Willebrand disease 71,648
Number of people identified with other bleeding disorders 39,495
Total number of people identified with bleeding disorders 295,866
Number of people identified with hemophilia A 149,764
Number of people identified with hemophilia B 29,712
Number of people with hemophilia A with current clinically identified inhibitors 4,711
Number of people with hemophilia B with current clinically identified inhibitors 280
These numbers represent the total number of people identified, not those newly identified in this survey. The total number of patients identified with hemophilia may be higher than the reported sum of people with hemophilia A and B because for some people in some countries, the subtype has not been identified. Some countries included in the report have not surveyed their entire population.
PLEASE NOTE: The Report on the Annual Global Survey 2016 also uses data from the year 2015. For the 2016 survey report, 97 countries submitted data for 2016. Historical data from 2015 was used for 16 countries. 2015 surveys are only used for reporting the number of patients identified (Tables 1, 6, 7 and 8). Reducing the amount of historical data is part of our effort to improve the overall quality of data we report each year.
REPORT ON THE ANNUAL GLOBAL SURVEY 2016 SUMMARY DEMOGRAPHICS

8 REPORT ON THE ANNUAL GLOBAL SURVEY 2016
Table 2. Factor VIII usage 2016
FACTOR USAGENUMBER OF COUNTRIES
Mean global per capita factor VIII usage 2.29 IU 91
Median global per capita factor VIII usage 0.83 IU 91
Interquartile range (IQR) global per capita factor VIII usage 4.12 IU (0.07 to 4.18) 91
Total reported annual global consumption of factor VIII concentrates
9,986,083,762 IU 91
Table 3. Factor IX usage 2016
FACTOR USAGENUMBER OF COUNTRIES
Mean global per capita factor IX usage 0.38 IU 87
Median global per capita factor IX usage 0.17 IU 87
Interquartile range (IQR) global per capita factor IX usage 0.62 IU (0.01 to 0.63) 87
Total reported annual global consumption of factor IX concentrates
1,599,691,148 IU 87
The average per capita and total consumption figures reported this year cannot be directly compared to the figures from other survey years as the group of countries reporting factor usage changes from year to year. To illustrate, if a large country using large amounts of factor or a large country using very little factor, reports one year and not the next, then this will have a significant effect on the mean and median from year to year. The interquartile range (IQR) describes the middle 50% of reported numbers and is less likely to be distorted by outliers (extreme values).

9REPORT ON THE ANNUAL GLOBAL SURVEY 2016
The chart below shows average per capita factor use for the countries that reported in both the 2015 and 2016 surveys.
Table 4. Factor use in 2015 and 2016
2015 2016COUNTRIES REPORTING
Mean global per capita factor VIII usage 2.30 IU 2.35 IU 67
Median global per capita factor VIII usage 0.53 IU 1.05 IU 67
Interquartile range (IQR) global per capita factor VIII usage
3.89 IU (0.02 to 3.91)
4.28 IU (0.11 to 4.39)
67
Mean global per capita factor IX usage 0.41 IU 0.43 IU 59
Median global per capita factor IX usage 0.16 IU 0.29 IU 59
Interquartile range (IQR) global per capita factor IX usage
0.66 IU (0.005 to 0.66)
0.72 IU (0.01 to 0.74)
59

10 REPORT ON THE ANNUAL GLOBAL SURVEY 2016
Figure A. Identified patients over time – all bleeding disorders
This graph showing the increase over time in patients identified contains historical data from the Global Survey. This graph was created using aggregated numbers to demonstrate the increases in patients identified over time. If a country reported data one year and not the next, the older data were used on the assumption that the number of patients did not change substantially from one year to the next. The Report on the Annual Global Survey 2016 uses 1 year of historical data for the number of patients identified; however, for each year in Figure A, historical data for up to 3 years is used. This reflects an estimate of the total number of identified patients with inherited bleeding disorders. Figure A provides a historical snapshot of the growth in patient identification.
0
50,000
100,000
150,000
200,000
250,000
300,000
350,000
1999 2000 2001 2002 2003 2004 2005 2006 2007 2008 2009 2010 2011 2012 2013 2014 2015 2016
Hemophilia A, B and Type Unknown von Willebrand disease Other bleeding disorders
Num
ber
of p
atie
nts

11REPORT ON THE ANNUAL GLOBAL SURVEY 2016
Figure B1. Mean global factor VIII use per capita (Data from 79 countries.)
Economic category based on The World Bank Group 2016 rankings for “Gross national income (GNI) per capita, Atlas method (current US$)”. (GNI in US dollars: D lower income, $0-$1,005; C lower middle income, $1,006 - $3,955; B upper middle income, $3,956 - $12,235 and A high income, $12,235 or more.)
Figure B2. Mean global factor VIII use per patient (Data from 79 countries.)
Economic category based on The World Bank Group 2016 rankings for “Gross national income (GNI) per capita, Atlas method (current US$)”. (GNI in US dollars: D lower income, $0-$1,005; C lower middle income, $1,006 - $3,955; B upper middle income, $3,956 - $12,235 and A high income, $12,235 or more.)
Numbers in Figure B2 are calculated based on reported factor VIII use and the number of identified hemophilia A patients. We do not have data on individual treatment. WFH humanitarian aid donations are included.
0
1
2
3
4
5
6
7
8
LowerLower MiddleUpper MiddleHigh
6.16 6.33
1.80
1.43
0.04 0.030.31
0.11
WORLD BANK ECONOMIC RANKING
IU P
ER
CA
PIT
A
Mean per capita
Median per capita
0
20000
40000
60000
80000
100000
120000
LowerLower MiddleUpper MiddleHigh
109,581
85,324
40,935
34,077
10,5787,945 7,543 7,085
WORLD BANK ECONOMIC RANKING
IU P
ER
PA
TIE
NT
Mean per patient
Median per patient
12 REPORT ON THE ANNUAL GLOBAL SURVEY 2016
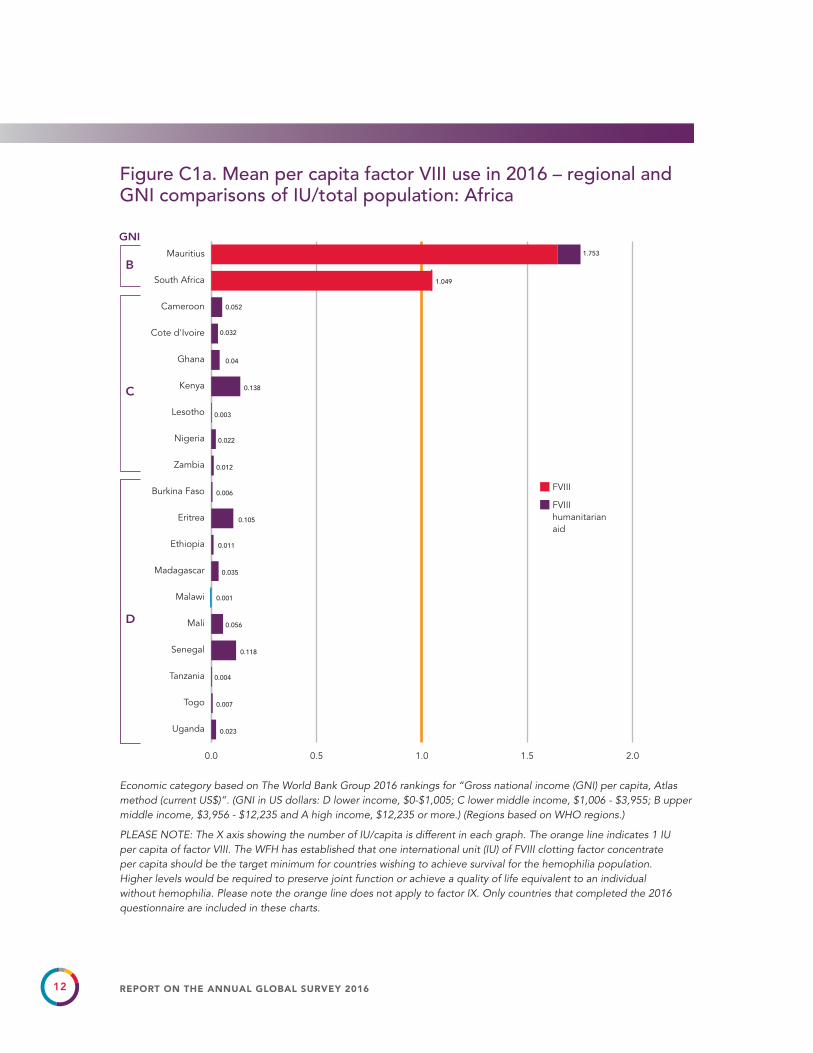
Figure C1a. Mean per capita factor VIII use in 2016 – regional and GNI comparisons of IU/total population: Africa
Economic category based on The World Bank Group 2016 rankings for “Gross national income (GNI) per capita, Atlas method (current US$)”. (GNI in US dollars: D lower income, $0-$1,005; C lower middle income, $1,006 - $3,955; B upper middle income, $3,956 - $12,235 and A high income, $12,235 or more.) (Regions based on WHO regions.)
PLEASE NOTE: The X axis showing the number of IU/capita is different in each graph. The orange line indicates 1 IU per capita of factor VIII. The WFH has established that one international unit (IU) of FVIII clotting factor concentrate per capita should be the target minimum for countries wishing to achieve survival for the hemophilia population. Higher levels would be required to preserve joint function or achieve a quality of life equivalent to an individual without hemophilia. Please note the orange line does not apply to factor IX. Only countries that completed the 2016 questionnaire are included in these charts.
0.0 0.5 1.0 1.5 2.0
Uganda
Togo
Tanzania
Senegal
Mali
Malawi
Madagascar
Ethiopia
Eritrea
Burkina Faso
Zambia
Nigeria
Lesotho
Kenya
Ghana
Cote d'Ivoire
Cameroon
South Africa
Mauritius
GNI
B
D
C
FVIII
FVIII humanitarianaid
1.753
1.049
0.052
0.032
0.04
0.138
0.003
0.022
0.012
0.006
0.105
0.011
0.035
0.001
0.056
0.118
0.004
0.007
0.023
13REPORT ON THE ANNUAL GLOBAL SURVEY 2016
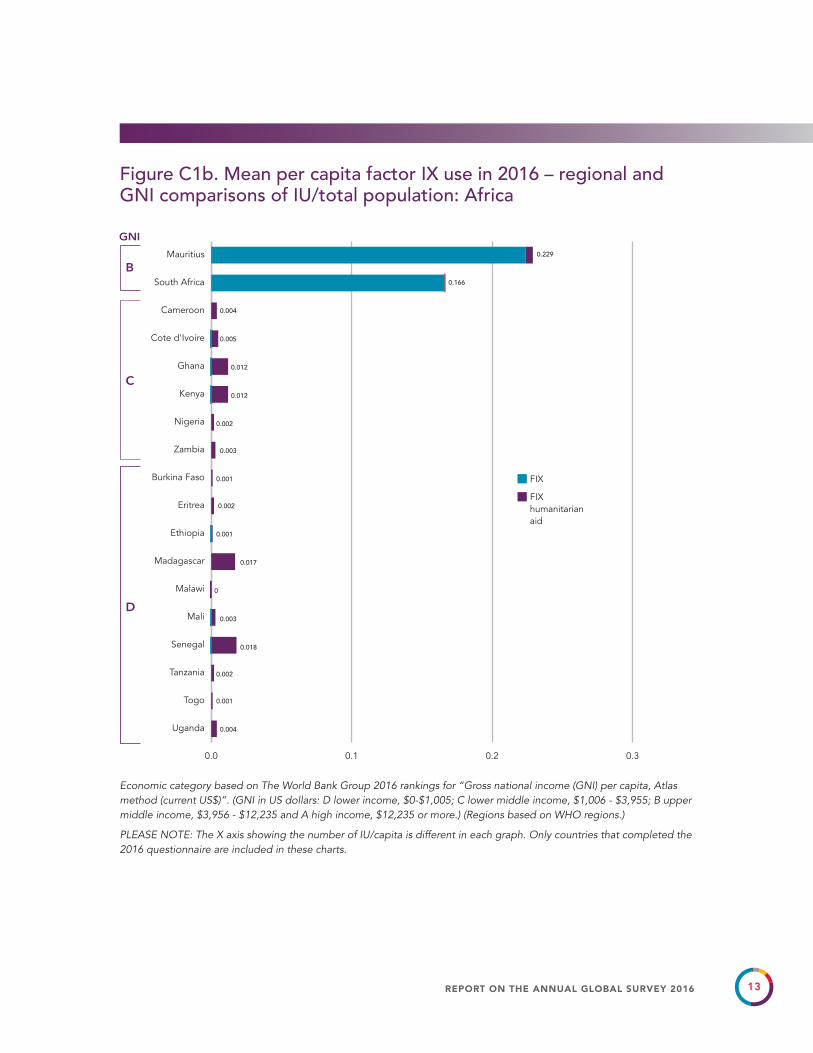
Figure C1b. Mean per capita factor IX use in 2016 – regional and GNI comparisons of IU/total population: Africa
Economic category based on The World Bank Group 2016 rankings for “Gross national income (GNI) per capita, Atlas method (current US$)”. (GNI in US dollars: D lower income, $0-$1,005; C lower middle income, $1,006 - $3,955; B upper middle income, $3,956 - $12,235 and A high income, $12,235 or more.) (Regions based on WHO regions.)
PLEASE NOTE: The X axis showing the number of IU/capita is different in each graph. Only countries that completed the 2016 questionnaire are included in these charts.
0.0 0.1 0.2 0.3
Uganda
Togo
Tanzania
Senegal
Mali
Malawi
Madagascar
Ethiopia
Eritrea
Burkina Faso
Zambia
Nigeria
Kenya
Ghana
Cote d'Ivoire
Cameroon
South Africa
Mauritius
GNI
B
D
C
FIX
FIX humanitarian aid
0.229
0.166
0.004
0.005
0.012
0.012
0.002
0.003
0.001
0.002
0.001
0.017
0
0.003
0.018
0.002
0.001
0.004

14 REPORT ON THE ANNUAL GLOBAL SURVEY 2016
Figure C2a. Mean per capita factor VIII use in 2016 – regional and GNI comparisons of IU/total population: Americas
Economic category based on The World Bank Group 2016 rankings for “Gross national income (GNI) per capita, Atlas method (current US$)”. (GNI in US dollars: D lower income, $0-$1,005; C lower middle income, $1,006 - $3,955; B upper middle income, $3,956 - $12,235 and A high income, $12,235 or more.) (Regions based on WHO regions.)
PLEASE NOTE: The X axis showing the number of IU/capita is different in each graph. The orange line indicates 1 IU per capita of factor VIII. The WFH has established that one international unit (IU) of FVIII clotting factor concentrate per capita should be the target minimum for countries wishing to achieve survival for the hemophilia population. Higher levels would be required to preserve joint function or achieve a quality of life equivalent to an individual without hemophilia. Please note the orange line does not apply to factor IX. Only countries that completed the 2016 questionnaire are included in these charts.
0 1 2 3 4 5 6 7 8 9 10
Nicaragua
Honduras
Guatemala
Bolivia
Venezuela
Paraguay
Panama
Mexico
Ecuador
Dom. Republic
Cuba
Costa Rica
Colombia
Brazil
Belize
Argentina
United States
Canada
GNI
A
C
B
FVIII
FVIII humanitarian aid
8.036
9.532
4.385
` 1.066
3.556
5.083
3.238
0.567
0.528
0.194
1.425
0.829
0.031
2.491
0.021
0.014
1.047
0.244

15REPORT ON THE ANNUAL GLOBAL SURVEY 2016
Figure C2b. Mean per capita factor IX use in 2016 – regional and GNI comparisons of IU/total population: Americas
Economic category based on The World Bank Group 2016 rankings for “Gross national income (GNI) per capita, Atlas method (current US$)”. (GNI in US dollars: D lower income, $0-$1,005; C lower middle income, $1,006 - $3,955; B upper middle income, $3,956 - $12,235 and A high income, $12,235 or more.) (Regions based on WHO regions.)
PLEASE NOTE: The X axis showing the number of IU/capita is different in each graph. Only countries that completed the 2016 questionnaire are included in these charts.
0.0 0.2 0.4 0.6 0.8 1.0 1.2 1.4 1.6 1.8 2.0
Nicaragua
Honduras
Bolivia
Venezuela
Panama
Mexico
Ecuador
Dom. Republic
Cuba
Costa Rica
Colombia
Brazil
Belize
Argentina
United States
Canada
GNI
A
C
BFIX
FIXhumanitarian aid
1.507
1.656
0.520
0.869
0.578
0.740
0.737
0.046
0.026
0.017
0.273
0.230
0.452
0.005
0.009
0.016
16 REPORT ON THE ANNUAL GLOBAL SURVEY 2016
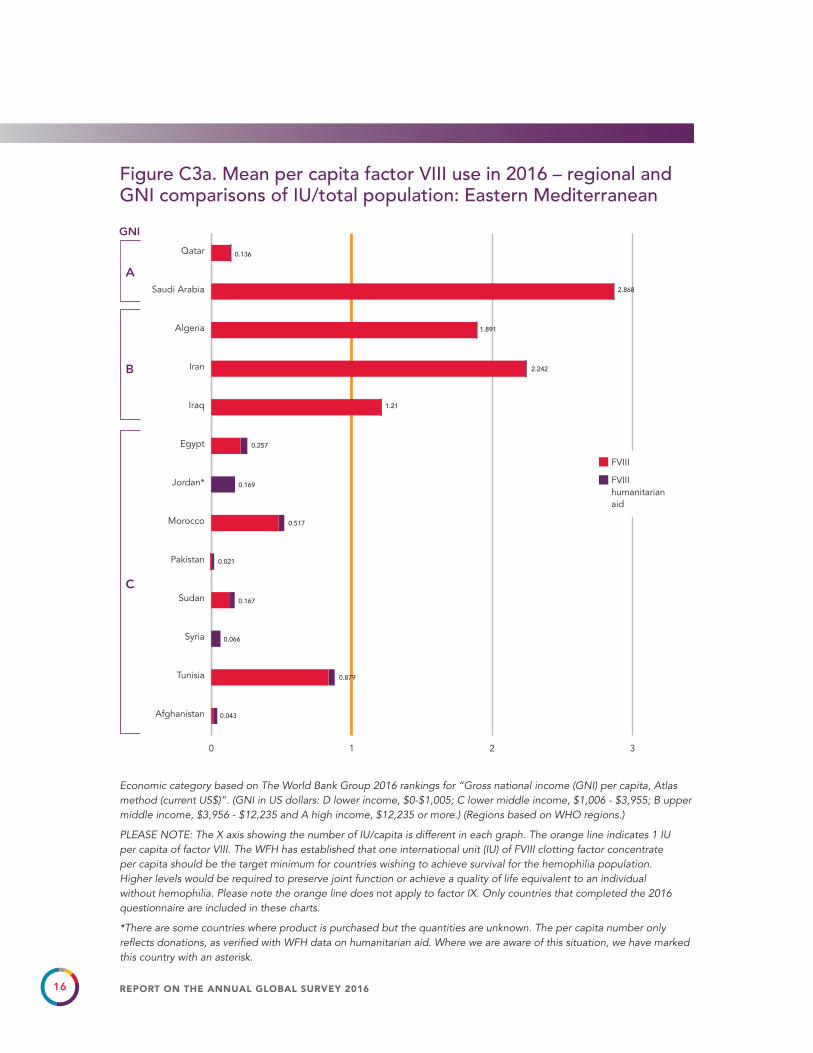
Figure C3a. Mean per capita factor VIII use in 2016 – regional and GNI comparisons of IU/total population: Eastern Mediterranean
Economic category based on The World Bank Group 2016 rankings for “Gross national income (GNI) per capita, Atlas method (current US$)”. (GNI in US dollars: D lower income, $0-$1,005; C lower middle income, $1,006 - $3,955; B upper middle income, $3,956 - $12,235 and A high income, $12,235 or more.) (Regions based on WHO regions.)
PLEASE NOTE: The X axis showing the number of IU/capita is different in each graph. The orange line indicates 1 IU per capita of factor VIII. The WFH has established that one international unit (IU) of FVIII clotting factor concentrate per capita should be the target minimum for countries wishing to achieve survival for the hemophilia population. Higher levels would be required to preserve joint function or achieve a quality of life equivalent to an individual without hemophilia. Please note the orange line does not apply to factor IX. Only countries that completed the 2016 questionnaire are included in these charts.
*There are some countries where product is purchased but the quantities are unknown. The per capita number only reflects donations, as verified with WFH data on humanitarian aid. Where we are aware of this situation, we have marked this country with an asterisk.
0 1 2 3
Afghanistan
Tunisia
Syria
Sudan
Pakistan
Morocco
Jordan*
Egypt
Iraq
Iran
Algeria
Saudi Arabia
Qatar
GNI
A
C
B
FVIII
FVIII humanitarian aid
0.136
2.868
1.891
2.242
1.21
0.257
0.169
0.517
0.021
0.167
0.066
0.879
0.043

17REPORT ON THE ANNUAL GLOBAL SURVEY 2016
Figure C3b. Mean per capita factor IX use in 2016 – regional and GNI comparisons of IU/total population: Eastern Mediterranean
Economic category based on The World Bank Group 2016 rankings for “Gross national income (GNI) per capita, Atlas method (current US$)”. (GNI in US dollars: D lower income, $0-$1,005; C lower middle income, $1,006 - $3,955; B upper middle income, $3,956 - $12,235 and A high income, $12,235 or more.) (Regions based on WHO regions.)
PLEASE NOTE: The X axis showing the number of IU/capita is different in each graph. Only countries that completed the 2016 questionnaire are included in these charts.
*There are some countries where product is purchased but the quantities are unknown. The per capita number only reflects donations, as verified with WFH data on humanitarian aid. Where we are aware of this situation, we have marked this country with an asterisk.
0.0 0.5 1.0
Afghanistan
Tunisia
Sudan
Pakistan
Morocco
Jordan*
Egypt
Iraq
Iran
Algeria
Saudi Arabia
Qatar
GNI
A
C
B
FIX
FIXhumanitarian aid
0.012
0.372
0.543
0.311
0.269
0.013
0.002
0.054
0.005
0.027
0.085
0
18 REPORT ON THE ANNUAL GLOBAL SURVEY 2016
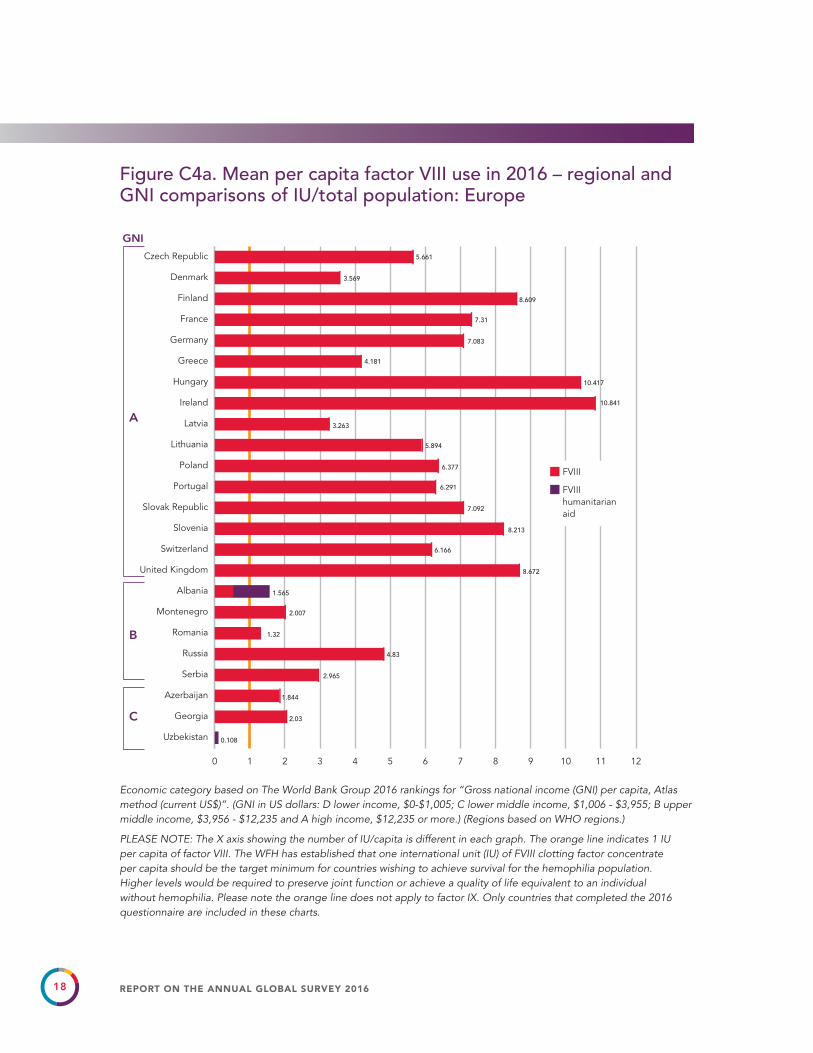
Figure C4a. Mean per capita factor VIII use in 2016 – regional and GNI comparisons of IU/total population: Europe
Economic category based on The World Bank Group 2016 rankings for “Gross national income (GNI) per capita, Atlas method (current US$)”. (GNI in US dollars: D lower income, $0-$1,005; C lower middle income, $1,006 - $3,955; B upper middle income, $3,956 - $12,235 and A high income, $12,235 or more.) (Regions based on WHO regions.)
PLEASE NOTE: The X axis showing the number of IU/capita is different in each graph. The orange line indicates 1 IU per capita of factor VIII. The WFH has established that one international unit (IU) of FVIII clotting factor concentrate per capita should be the target minimum for countries wishing to achieve survival for the hemophilia population. Higher levels would be required to preserve joint function or achieve a quality of life equivalent to an individual without hemophilia. Please note the orange line does not apply to factor IX. Only countries that completed the 2016 questionnaire are included in these charts.
0 1 2 3 4 5 6 7 8 9 10 11 12
Uzbekistan
Georgia
Azerbaijan
Serbia
Russia
Romania
Montenegro
Albania
United Kingdom
Switzerland
Slovenia
Slovak Republic
Portugal
Poland
Lithuania
Latvia
Ireland
Hungary
Greece
Germany
France
Finland
Denmark
Czech Republic
GNI
A
B
C
FVIII
FVIII humanitarian aid
5.661
3.569
8.609
7.31
7.083
4.181
10.417
10.841
3.263
5.894
6.377
6.291
7.092
8.213
6.166
8.672
1.565
2.007
1.32
4.83
2.965
1.844
2.03
0.108
19REPORT ON THE ANNUAL GLOBAL SURVEY 2016
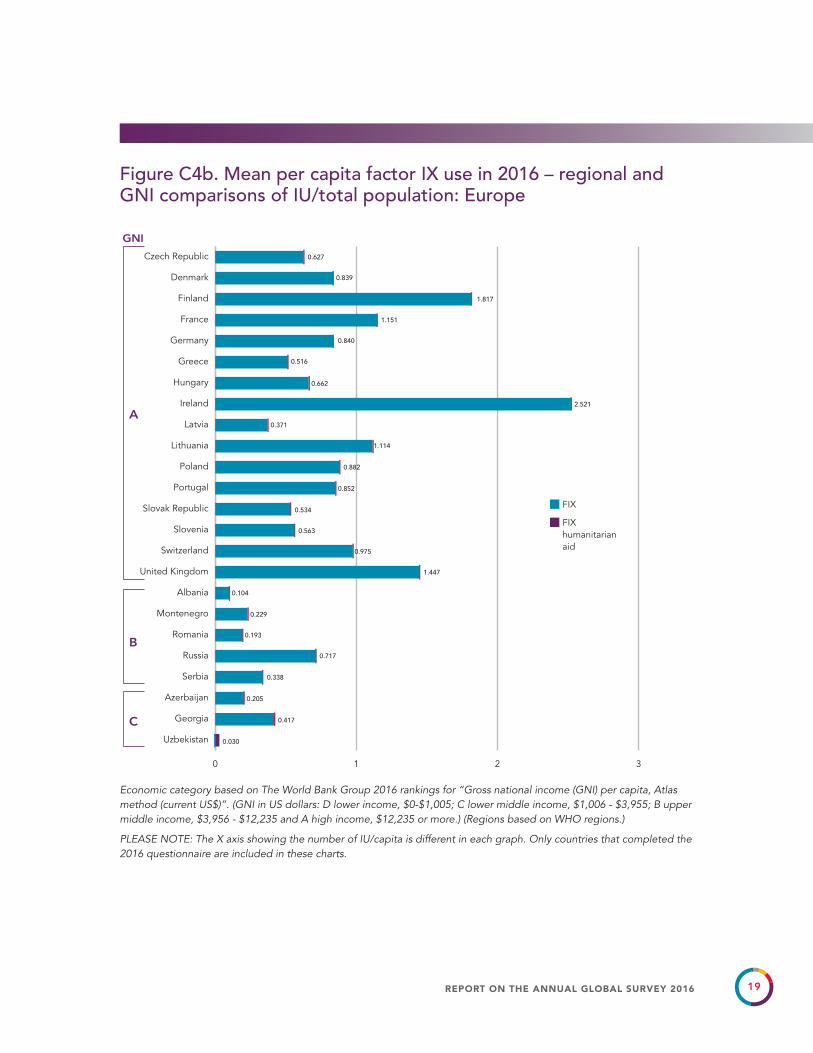
Figure C4b. Mean per capita factor IX use in 2016 – regional and GNI comparisons of IU/total population: Europe
Economic category based on The World Bank Group 2016 rankings for “Gross national income (GNI) per capita, Atlas method (current US$)”. (GNI in US dollars: D lower income, $0-$1,005; C lower middle income, $1,006 - $3,955; B upper middle income, $3,956 - $12,235 and A high income, $12,235 or more.) (Regions based on WHO regions.)
PLEASE NOTE: The X axis showing the number of IU/capita is different in each graph. Only countries that completed the 2016 questionnaire are included in these charts.
0 1 2 3
Uzbekistan
Georgia
Azerbaijan
Serbia
Russia
Romania
Montenegro
Albania
United Kingdom
Switzerland
Slovenia
Slovak Republic
Portugal
Poland
Lithuania
Latvia
Ireland
Hungary
Greece
Germany
France
Finland
Denmark
Czech Republic
GNI
A
B
C
FIX
FIXhumanitarian aid
0.627
0.839
1.817
1.151
0.840
0.516
0.662
2.521
0.371
1.114
0.882
0.852
0.534
0.563
0.975
1.447
0.104
0.229
0.193
0.717
0.338
0.205
0.417
0.030

20 REPORT ON THE ANNUAL GLOBAL SURVEY 2016
Figure C5a. Mean per capita factor VIII use in 2016 – regional and GNI comparisons of IU/total population: South-East Asia
Economic category based on The World Bank Group 2016 rankings for “Gross national income (GNI) per capita, Atlas method (current US$)”. (GNI in US dollars: D lower income, $0-$1,005; C lower middle income, $1,006 - $3,955; B upper middle income, $3,956 - $12,235 and A high income, $12,235 or more.) (Regions based on WHO regions.)
PLEASE NOTE: The X axis showing the number of IU/capita is different in each graph. The orange line indicates 1 IU per capita of factor VIII. The WFH has established that one international unit (IU) of FVIII clotting factor concentrate per capita should be the target minimum for countries wishing to achieve survival for the hemophilia population. Higher levels would be required to preserve joint function or achieve a quality of life equivalent to an individual without hemophilia. Please note the orange line does not apply to factor IX. Only countries that completed the 2016 questionnaire are included in these charts.
*There are some countries where product is purchased but the quantities are unknown. The per capita number only reflects donations, as verified with WFH data on humanitarian aid. Where we are aware of this situation, we have marked this country with an asterisk.
0.0 0.2 0.4 0.6 0.8 1.0
Nepal
Sri Lanka*
Indonesia
India
Bangladesh
Thailand
Maldives
FVIII
FVIII humanitarian aid
B
C
D
0.145
0.282
0.005
0.105
0.118
0.149
0.107

21REPORT ON THE ANNUAL GLOBAL SURVEY 2016
Figure C5b. Mean per capita factor IX use in 2016 – regional and GNI comparisons of IU/total population: South-East Asia
Economic category based on The World Bank Group 2016 rankings for “Gross national income (GNI) per capita, Atlas method (current US$)”. (GNI in US dollars: D lower income, $0-$1,005; C lower middle income, $1,006 - $3,955; B upper middle income, $3,956 - $12,235 and A high income, $12,235 or more.) (Regions based on WHO regions.)
PLEASE NOTE: The X axis showing the number of IU/capita is different in each graph. Only countries that completed the 2016 questionnaire are included in these charts.
*There are some countries where product is purchased but the quantities are unknown. The per capita number only reflects donations, as verified with WFH data on humanitarian aid. Where we are aware of this situation, we have marked this country with an asterisk.
0.0 0.1 0.2 0.3 0.4
Nepal
Sri Lanka*
Indonesia
India
Bangladesh
Thailand
Maldives
B
C
D
FIX
FIXhumanitarian aid
0.299
0.033
0.001
0.002
0.008
0.042
0.012
22 REPORT ON THE ANNUAL GLOBAL SURVEY 2016
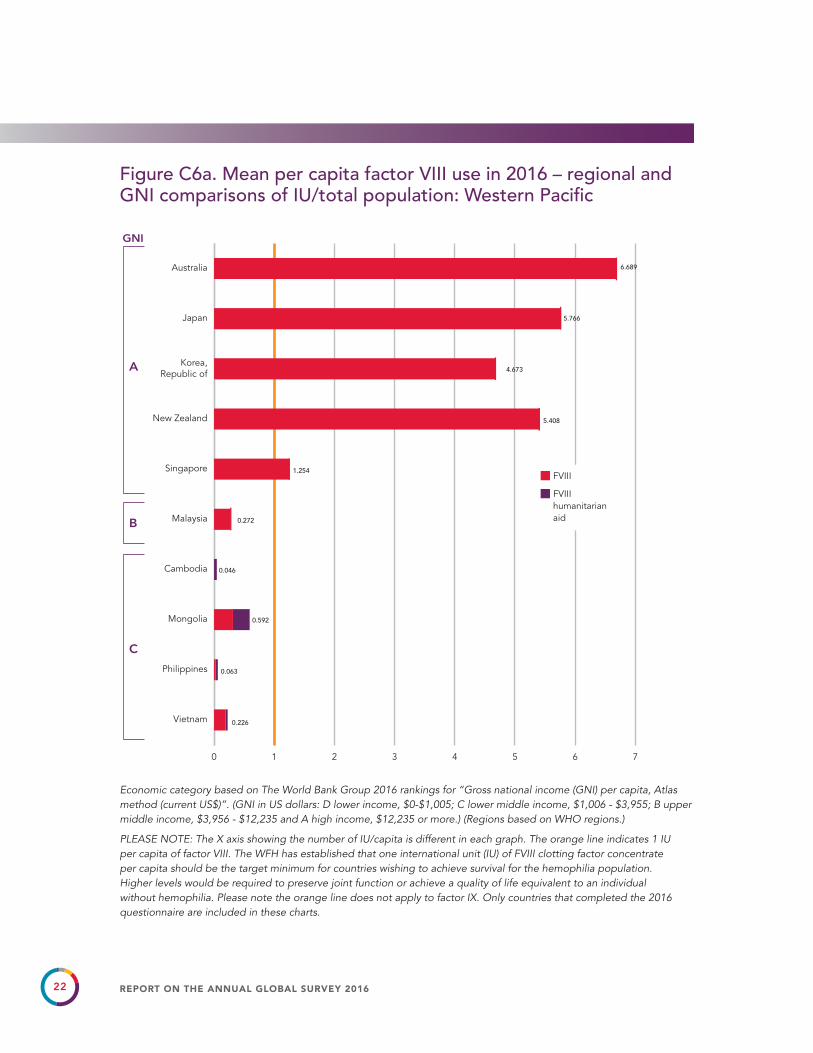
Figure C6a. Mean per capita factor VIII use in 2016 – regional and GNI comparisons of IU/total population: Western Pacific
Economic category based on The World Bank Group 2016 rankings for “Gross national income (GNI) per capita, Atlas method (current US$)”. (GNI in US dollars: D lower income, $0-$1,005; C lower middle income, $1,006 - $3,955; B upper middle income, $3,956 - $12,235 and A high income, $12,235 or more.) (Regions based on WHO regions.)
PLEASE NOTE: The X axis showing the number of IU/capita is different in each graph. The orange line indicates 1 IU per capita of factor VIII. The WFH has established that one international unit (IU) of FVIII clotting factor concentrate per capita should be the target minimum for countries wishing to achieve survival for the hemophilia population. Higher levels would be required to preserve joint function or achieve a quality of life equivalent to an individual without hemophilia. Please note the orange line does not apply to factor IX. Only countries that completed the 2016 questionnaire are included in these charts.
0 1 2 3 4 5 6 7
Vietnam
Philippines
Mongolia
Cambodia
Malaysia
Singapore
New Zealand
Korea,Republic of
Japan
Australia
GNI
B
A
C
FVIII
FVIII humanitarian aid
6.689
5.766
4.673
5.408
1.254
0.272
0.046
0.592
0.063
0.226

23REPORT ON THE ANNUAL GLOBAL SURVEY 2016
Figure C6b. Mean per capita factor IX use in 2016 – regional and GNI comparisons of IU/total population: Western Pacific
Economic category based on The World Bank Group 2016 rankings for “Gross national income (GNI) per capita, Atlas method (current US$)”. (GNI in US dollars: D lower income, $0-$1,005; C lower middle income, $1,006 - $3,955; B upper middle income, $3,956 - $12,235 and A high income, $12,235 or more.) (Regions based on WHO regions.)
PLEASE NOTE: The X axis showing the number of IU/capita is different in each graph. Only countries that completed the 2016 questionnaire are included in these charts.
0.0 0.2 0.4 0.6 0.8 1.0 1.2 1.4 1.6 1.8 2.0
Vietnam
Philippines
Mongolia
Cambodia
Malaysia
Singapore
New Zealand
Korea,Republic of
Japan
Australia
GNI
B
A
D
C
FIX
FIXhumanitarian aid
1.088
1.013
1.074
0.796
0.288
0.041
0.006
0.140
0.008
0.009

24 REPORT ON THE ANNUAL GLOBAL SURVEY 2016
Figure D. Data source
Members were asked the source of the numbers provided for the survey. Possible answers were: Hemophilia Society and/or national member organization (NMO) registry or database, Hospital(s)/HTC(s) registry or database, Health Ministry registry or database or Other. Many members used multiple sources to obtain data.
0%
5%
10%
15%
20%
25%
30%
35%
40%
45%
50%
NMO + Hospital/HTCs + Health Ministry
Hospital/HTCs +Health Ministry
Health Ministry
NMO +Health Ministry
NMO +Hospital/
HTCs
Hospitals/HTCs
NMO
National member organization (NMO)
Hospitals/HTCs
Health Ministry
42.7%
29.2%
12.5%
7.3%
4.2%
2%1%
DATA SOURCE
25REPORT ON THE ANNUAL GLOBAL SURVEY 2016
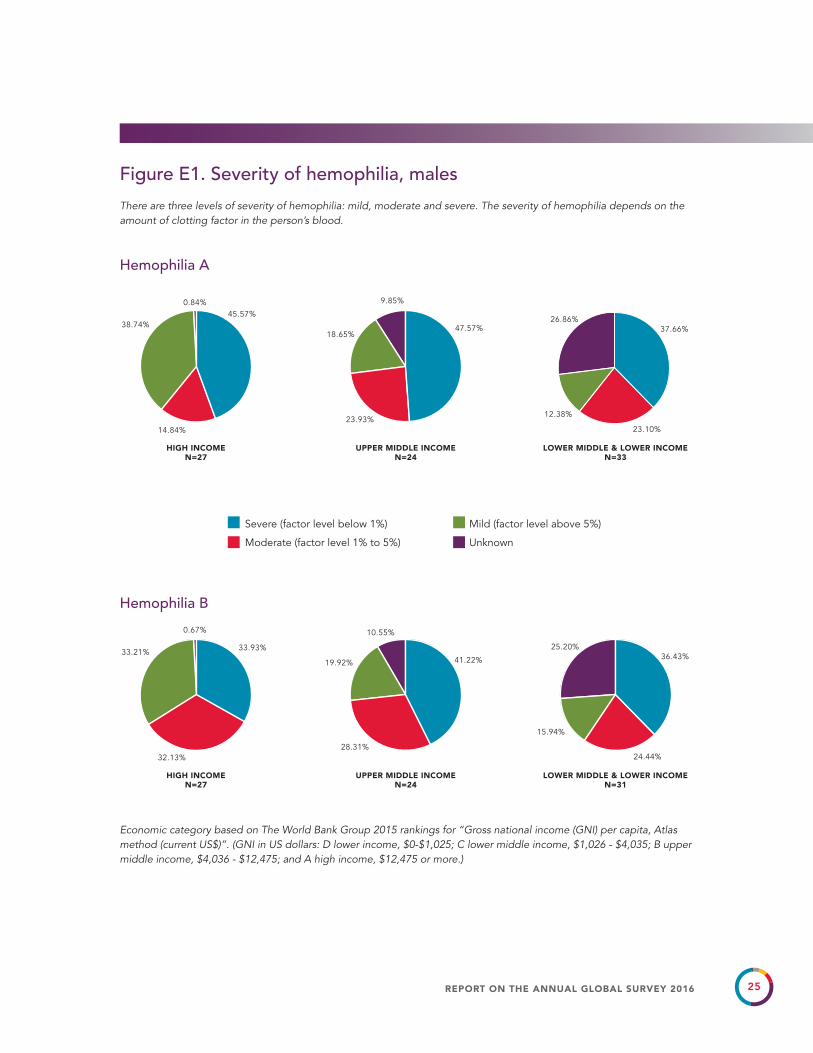
Figure E1. Severity of hemophilia, males
There are three levels of severity of hemophilia: mild, moderate and severe. The severity of hemophilia depends on the amount of clotting factor in the person’s blood.
Economic category based on The World Bank Group 2015 rankings for “Gross national income (GNI) per capita, Atlas method (current US$)”. (GNI in US dollars: D lower income, $0-$1,025; C lower middle income, $1,026 - $4,035; B upper middle income, $4,036 - $12,475; and A high income, $12,475 or more.)
LOWER MIDDLE & LOWER INCOMEN=33
UPPER MIDDLE INCOMEN=24
HIGH INCOMEN=27
Hemophilia A
Hemophilia B
45.57%0.84%
38.74%
14.84%
9.85%
47.57%
23.93%
18.65%
26.86%37.66%
23.10%
12.38%
LOWER MIDDLE & LOWER INCOMEN=31
UPPER MIDDLE INCOMEN=24
HIGH INCOMEN=27
33.93%
0.67%
33.21%
32.13%
10.55%
41.22%
28.31%
19.92%
25.20%36.43%
24.44%
15.94%
Severe (factor level below 1%)
Moderate (factor level 1% to 5%)
Mild (factor level above 5%)
Unknown
26 REPORT ON THE ANNUAL GLOBAL SURVEY 2016
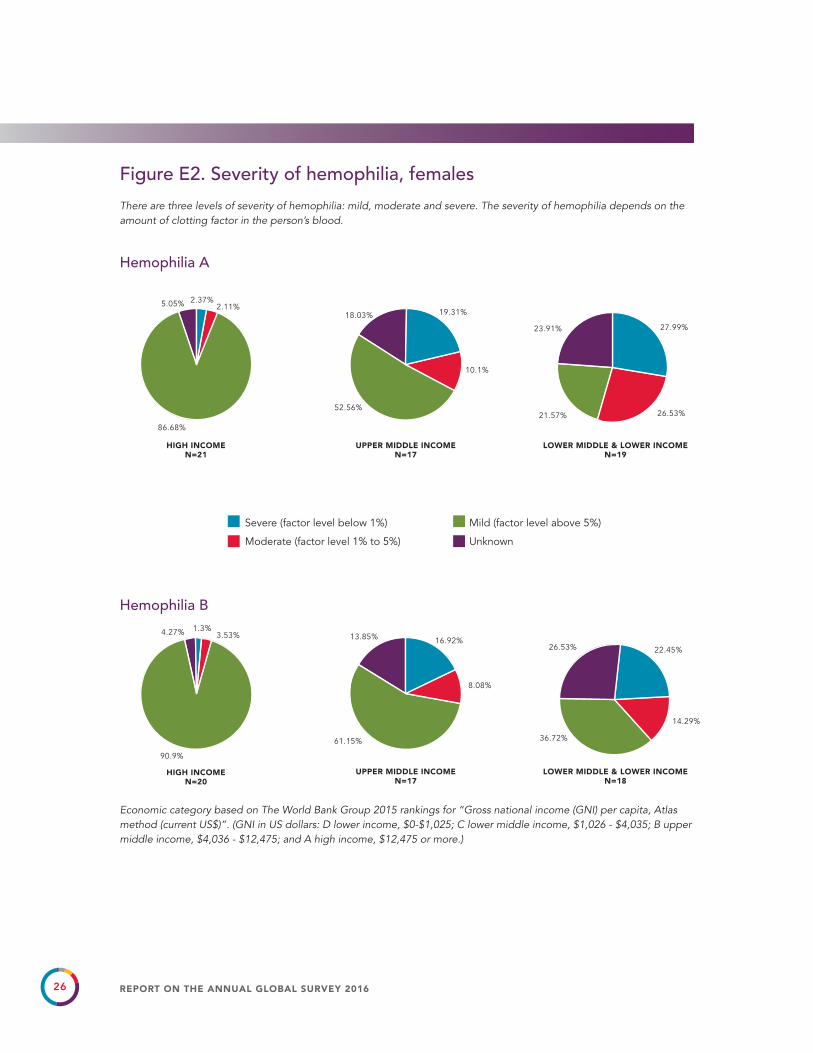
Figure E2. Severity of hemophilia, females
There are three levels of severity of hemophilia: mild, moderate and severe. The severity of hemophilia depends on the amount of clotting factor in the person’s blood.
Economic category based on The World Bank Group 2015 rankings for “Gross national income (GNI) per capita, Atlas method (current US$)”. (GNI in US dollars: D lower income, $0-$1,025; C lower middle income, $1,026 - $4,035; B upper middle income, $4,036 - $12,475; and A high income, $12,475 or more.)
Severe (factor level below 1%)
Moderate (factor level 1% to 5%)
Mild (factor level above 5%)
Unknown
LOWER MIDDLE & LOWER INCOMEN=19
UPPER MIDDLE INCOMEN=17
LOWER MIDDLE & LOWER INCOMEN=18
UPPER MIDDLE INCOMEN=17
HIGH INCOMEN=21
Hemophilia A
Hemophilia B
2.11%2.37%5.05%
86.68%
19.31%
10.1%
52.56%
18.03%
26.53%
23.91% 27.99%
3.53%1.3%4.27%
90.9%
16.92%
8.08%
13.85%
61.15%
26.53% 22.45%
36.72%
14.29%
21.57%
HIGH INCOMEN=20

27REPORT ON THE ANNUAL GLOBAL SURVEY 2016
Table 5. Countries included in the Report on the Annual Global Survey 2016 Please note: the year indicates the year the submitted data applies to. Not all of our members are able to submit data every year. For the 2016 survey report, 97 countries submitted data for 2016. Countries in BOLD reported data for 2016.
Data from 2015 was used for 16 countries. 2015 surveys are only used for reporting the number of patients identified – all other numbers in this report are from 2016 only.
Afghanistan 2016
Albania 2016
Algeria 2016
Argentina 2016
Australia 2016
Austria 2016
Azerbaijan 2016
Bangladesh 2016
Belarus 2015
Belgium 2016
Belize 2016
Bolivia 2016
Brazil 2016
Burkina Faso 2016
Cambodia 2016
Cameroon 2016
Canada 2016
Chile 2015
China 2016
Colombia 2016
Costa Rica 2016
Cote d'Ivoire 2016
Cuba 2016
Czech Republic 2016
Denmark 2016
Dominican Republic 2016
Ecuador 2016
Egypt 2016
Eritrea 2016
Estonia 2016
Ethiopia 2016
Finland 2016
France 2016
Georgia 2016
Germany 2016
Ghana 2016
Greece 2016
Guatemala 2016
Honduras 2016
Hong Kong (China) 2015
Hungary 2016
India 2016
Indonesia 2016
Iran 2016
Iraq 2016
Ireland 2016
Jamaica 2015
Japan 2016
Jordan 2016
Kenya 2016
Korea, Republic of 2016
Kyrgyzstan 2015
Latvia 2016
Lebanon 2015
Lesotho 2016
Lithuania 2016
Macedonia 2015
Madagascar 2016
Malawi 2016
Malaysia 2016
Maldives 2016
Mali 2016
Mauritania 2015
Mauritius 2016
Mexico 2016
Moldova 2015
Mongolia 2016
Montenegro 2016
Morocco 2016
Nepal 2016
New Zealand 2016
Nicaragua 2016
Nigeria 2016
Norway 2016
Oman 2016
Pakistan 2016
Palestine 2015
Panama 2016
Paraguay 2016
Peru 2015
Philippines 2016
Poland 2016
Portugal 2016
Qatar 2016
Romania 2016
Russia 2016
Saudi Arabia 2016
Senegal 2016
Serbia 2016
Singapore 2016
Slovak Republic 2016
Slovenia 2016
South Africa 2016
Sri Lanka 2016
Sudan 2016
Suriname 2015
Sweden 2015
Switzerland 2016
Syria 2016
Tanzania 2016
Thailand 2016
Togo 2016
Tunisia 2016
Uganda 2016
Ukraine 2015
United Arab Emirates 2015
United Kingdom 2016
United States 2016
Uzbekistan 2016
Venezuela 2016
Vietnam 2016
Zambia 2016
Zimbabwe 2015

28 REPORT ON THE ANNUAL GLOBAL SURVEY 2016
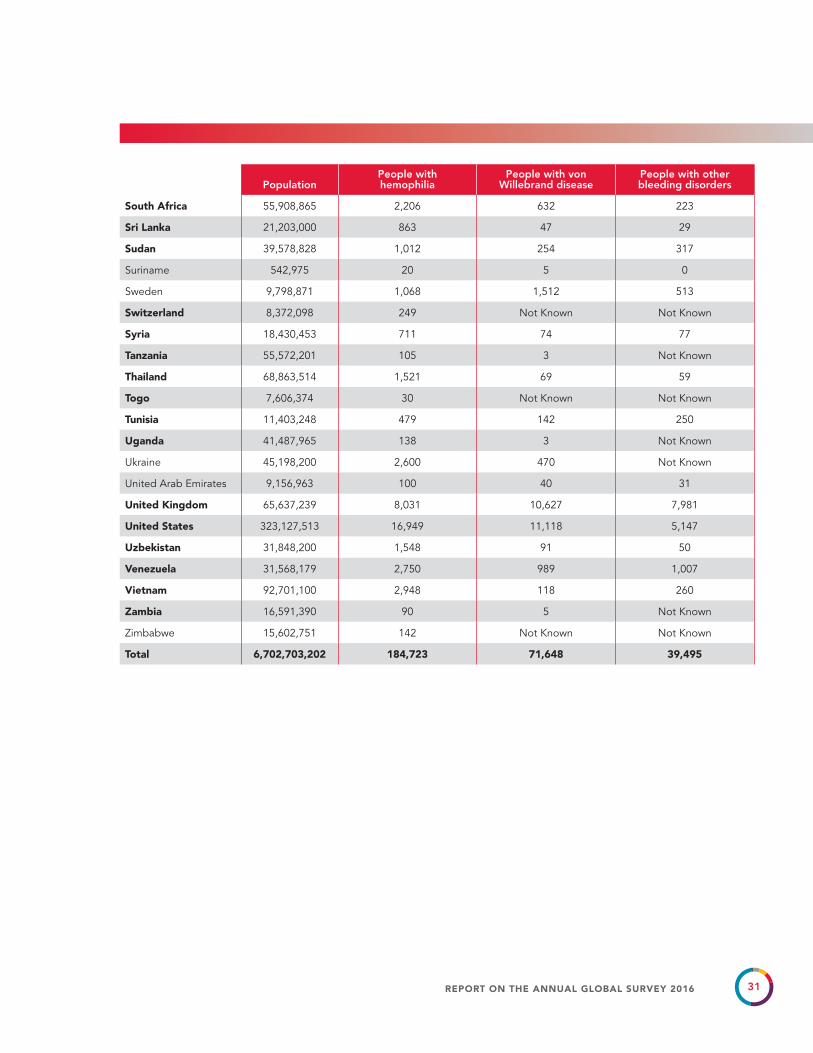
Table 6. Population statisticsPlease note: in all of the population charts a 0 indicates that the member organization reported the number zero and “Not known” means that the member organization reported that they do not know the answer. Countries in BOLD reported data for 2016. For countries that did not report population statistics for 2016 but did report during the year 2015, we used the most recent number of patients reported. 2015 surveys are only used for reporting the number of patients identified – all other numbers in this report are from 2016 only.
The source of population data from 1999 to 2014 was The World Factbook, Central Intelligence Agency. As of 2015, population data is sourced from The World Bank Group.
PopulationPeople with hemophilia
People with von Willebrand disease
People with other bleeding disorders
Afghanistan 34,656,032 306 Not Known Not Known
Albania 2,876,101 189 4 6
Algeria 40,606,052 2,160 298 536
Argentina 43,847,430 2,630 401 10
Australia 24,127,159 2,576 2,092 722
Austria 8,747,358 772 Not Known Not Known
Azerbaijan 9,762,274 1,334 207 113
Bangladesh 162,951,560 900 2 3
Belarus 9,513,000 564 192 48
Belgium 11,348,159 1,212 1,906 455
Belize 366,954 16 Not Known Not Known
Bolivia 10,887,882 200 1 Not Known
Brazil 207,652,865 12,119 7,811 2,872
Burkina Faso 18,646,433 46 Not Known Not Known
Cambodia 15,762,370 153 4 6
Cameroon 23,439,189 176 2 0
Canada 36,286,425 3,893 4,437 1,932
Chile 17,948,141 1,547 483 473
China 1,378,665,000 14,390 72 90
Colombia 48,653,419 2,059 1,471 282
Costa Rica 4,857,274 210 71 36
Cote d'Ivoire 23,695,919 81 3 3
Cuba 11,475,982 470 351 3,220
Czech Republic 10,561,633 1,076 818 109

29REPORT ON THE ANNUAL GLOBAL SURVEY 2016
PopulationPeople with hemophilia
People with von Willebrand disease
People with other bleeding disorders
Denmark 5,731,118 523 309 145
Dominican Republic 10,648,791 370 17 16
Ecuador 16,385,068 132 48 3
Egypt 95,688,681 5,549 543 1,205
Eritrea 5,869,869 54 Not Known Not Known
Estonia 1,316,481 107 96 68
Ethiopia 102,403,196 258 21 2
Finland 5,495,096 239 533 Not Known
France 66,896,109 7,205 2,055 864
Georgia 3,719,300 320 33 21
Germany 82,667,685 4,358 3,930 Not Known
Ghana 28,206,728 250 2 Not Known
Greece 10,746,740 1,055 1,075 420
Guatemala 16,582,469 222 22 27
Honduras 9,112,867 307 9 6
Hong Kong (China) 7,305,700 131 2 7
Hungary 9,817,958 1,120 1,442 625
India 1,324,171,354 18,353 532 357
Indonesia 261,115,456 1,954 7 2
Iran 80,277,428 6,087 1,516 3,420
Iraq 37,202,572 1,346 324 373
Ireland 4,773,095 853 1,420 998
Jamaica 2,725,941 45 Not Known Not Known
Japan 126,994,511 6,200 1,222 367
Jordan 9,455,802 367 252 246
Kenya 48,461,567 654 50 13
Korea, Republic of 51,245,707 2,103 126 125
Kyrgyzstan 5,957,000 300 9 3
Latvia 1,960,424 156 120 7
Lebanon 5,850,743 189 107 69
Lesotho 2,203,821 24 Not Known Not Known
Lithuania 2,872,298 172 303 18
Macedonia 2,078,453 315 167 20
Madagascar 24,894,551 100 2 10

30 REPORT ON THE ANNUAL GLOBAL SURVEY 2016
PopulationPeople with hemophilia
People with von Willebrand disease
People with other bleeding disorders
Malawi 18,091,575 39 0 0
Malaysia 31,187,265 1,595 657 306
Maldives 417,492 17 Not Known Not Known
Mali 17,994,837 81 4 1
Mauritania 4,067,564 38 2 Not Known
Mauritius 1,263,473 78 0 7
Mexico 127,540,423 5,693 297 45
Moldova 3,554,150 230 6 Not Known
Mongolia 3,027,398 96 13 Not Known
Montenegro 622,781 45 3 5
Morocco 35,276,786 844 17 20
Nepal 28,982,771 573 4 15
New Zealand 4,692,700 447 230 68
Nicaragua 6,149,928 251 77 7
Nigeria 185,989,640 308 4 0
Norway 5,232,929 413 580 77
Oman 4,424,762 133 354 392
Pakistan 193,203,476 1,343 209 94
Palestine 4,422,143 293 35 7
Panama 4,034,119 290 497 65
Paraguay 6,725,308 480 1 1
Peru 31,376,670 887 171 19
Philippines 103,320,222 1,395 38 Not Known
Poland 37,948,016 2,835 1,827 517
Portugal 10,324,611 703 51 15
Qatar 2,569,804 48 32 13
Romania 19,705,301 1,825 87 11
Russia 144,342,396 7,451 1,950 Not Known
Saudi Arabia 32,275,687 418 182 237
Senegal 15,411,614 193 8 5
Serbia 7,057,412 539 286 48
Singapore 5,607,283 252 85 76
Slovak Republic 5,428,704 596 640 1,070
Slovenia 2,064,845 237 182 77
31REPORT ON THE ANNUAL GLOBAL SURVEY 2016
PopulationPeople with hemophilia
People with von Willebrand disease
People with other bleeding disorders
South Africa 55,908,865 2,206 632 223
Sri Lanka 21,203,000 863 47 29
Sudan 39,578,828 1,012 254 317
Suriname 542,975 20 5 0
Sweden 9,798,871 1,068 1,512 513
Switzerland 8,372,098 249 Not Known Not Known
Syria 18,430,453 711 74 77
Tanzania 55,572,201 105 3 Not Known
Thailand 68,863,514 1,521 69 59
Togo 7,606,374 30 Not Known Not Known
Tunisia 11,403,248 479 142 250
Uganda 41,487,965 138 3 Not Known
Ukraine 45,198,200 2,600 470 Not Known
United Arab Emirates 9,156,963 100 40 31
United Kingdom 65,637,239 8,031 10,627 7,981
United States 323,127,513 16,949 11,118 5,147
Uzbekistan 31,848,200 1,548 91 50
Venezuela 31,568,179 2,750 989 1,007
Vietnam 92,701,100 2,948 118 260
Zambia 16,591,390 90 5 Not Known
Zimbabwe 15,602,751 142 Not Known Not Known
Total 6,702,703,202 184,723 71,648 39,495

32 REPORT ON THE ANNUAL GLOBAL SURVEY 2016
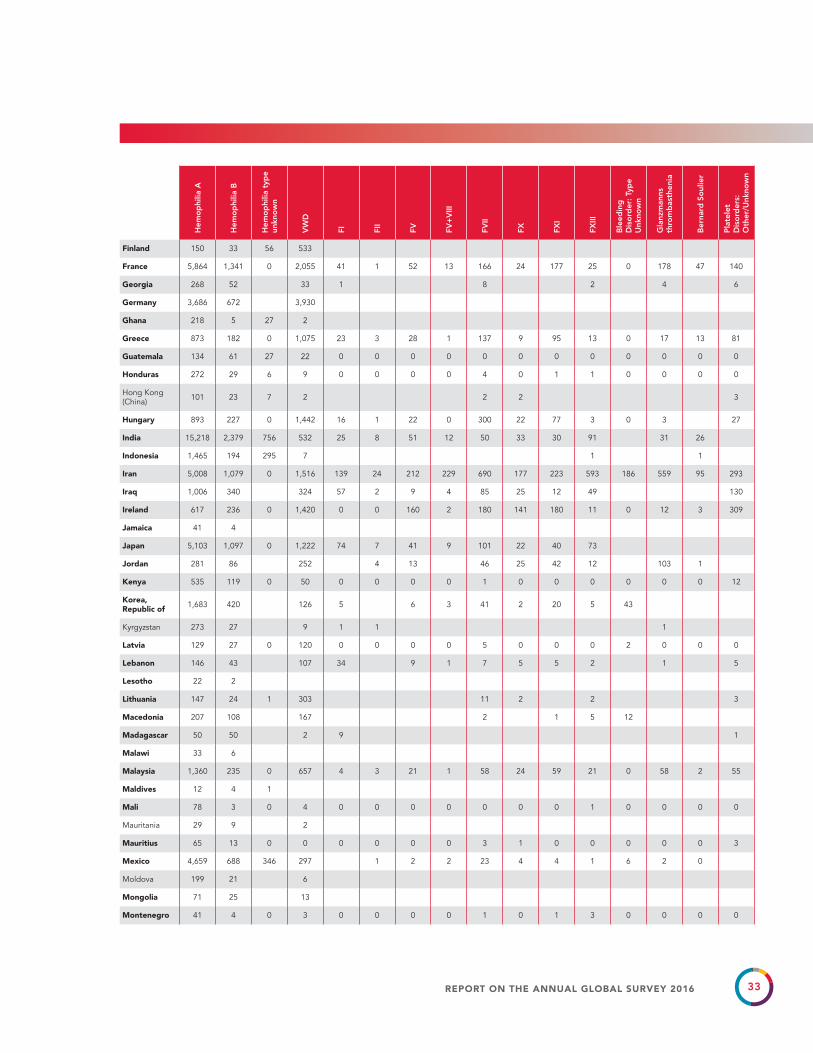
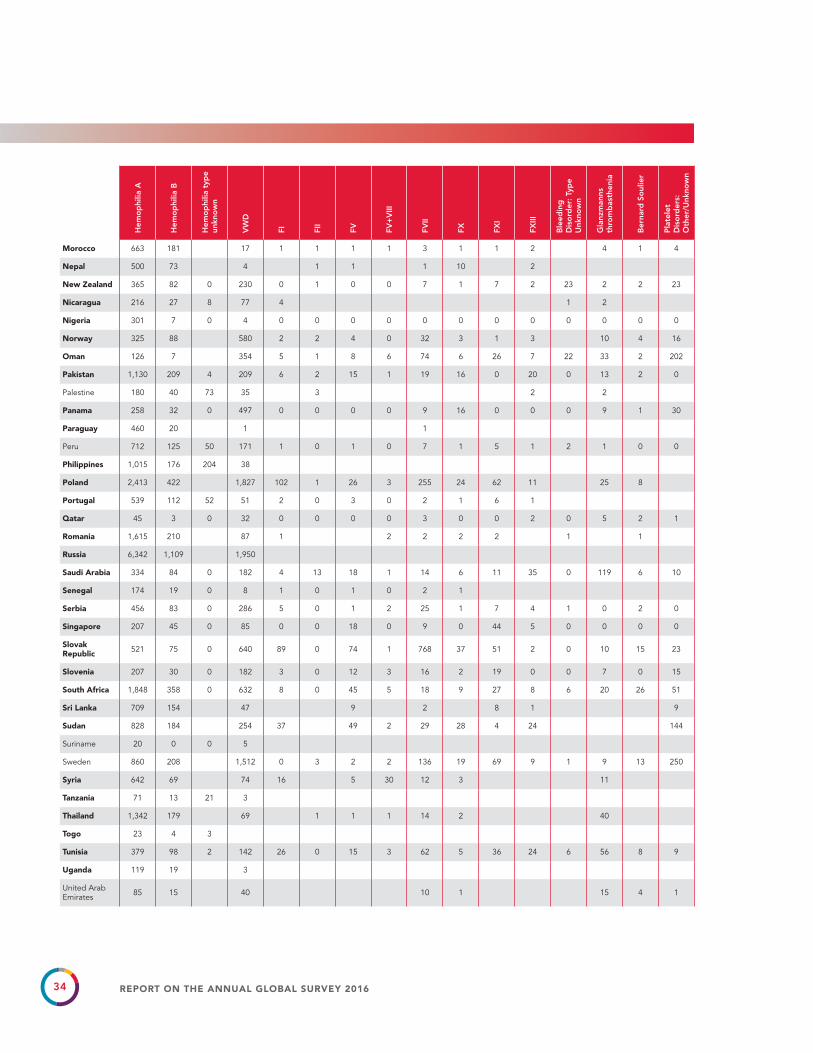
Table 7. Distribution of reported bleeding disorders by countryPlease note: in all of the population charts a 0 indicates that the member organization reported the number zero, a blank space indicates that no number was reported. Countries in BOLD reported data for 2016.
Hem
op
hilia
A
Hem
op
hilia
B
Hem
op
hilia
typ
e un
kno
wn
VW
D
FI FII
FV FV+
VIII
FVII
FX FXI
FXIII
Ble
edin
g
Dis
ord
er: T
ype
Unk
now
n
Gla
nzm
anns
th
rom
bas
then
ia
Ber
nard
So
ulie
r
Pla
tele
t D
iso
rder
s:
Oth
er/U
nkno
wn
Afghanistan 289 17
Albania 161 27 1 4 3 2 1
Algeria 1,798 362 298 42 8 50 22 333 15 8 19 26 13
Argentina 2,270 360 0 401 1 2 1 1 2 3
Australia 2,075 501 2,092 62 16 67 18 248 38 21 5 247
Austria 658 114 0
Azerbaijan 1,098 134 207 11 7 31 18 17 7 2 9 5 6
Bangladesh 770 124 6 2 2 1
Belarus 455 109 192 0 0 19 3 26
Belgium 970 233 9 1,906 2 2 20 118 8 128 4 26 19 3 125
Belize 11 5
Bolivia 160 40 1
Brazil 10,123 1,996 0 7,811 107 18 191 38 1,054 117 215 67 0 576 75 414
Burkina Faso 36 10
Cambodia 135 18 4 1 5
Cameroon 153 23 2
Canada 3,183 710 4,437 92 13 76 4 371 37 425 53 64 28 769
Chile 1,295 138 114 483 26 5 215 26 35 5 4 157
China 12,533 1,857 72 33 5 6 15 6 17 3 5
Colombia 1,705 354 0 1,471 17 6 31 12 73 3 44 17 36 15 2 26
Costa Rica 178 32 0 71 1 1 17 8 6 3
Cote d'Ivoire 74 7 0 3 0 0 0 0 1 2 0 0 0 0 0 0
Cuba 400 70 0 351 2 1 2 0 2 2 15 7 17 3 0 3,169
Czech Republic 937 139 0 818 1 8 0 52 2 19 2 25
Denmark 410 108 0 309 3 0 3 0 52 14 13 6 0 13 7 34
Dominican Republic 264 34 72 17 14 1 1
Ecuador 125 7 0 48 1 1 1
Egypt 4,504 1,045 0 543 149 8 174 8 135 113 93 41 0 466 18
Eritrea 50 4
Estonia 97 10 96 5 2 1 30 5 15 2 8
Ethiopia 122 18 118 21 2
33REPORT ON THE ANNUAL GLOBAL SURVEY 2016
Hem
op
hilia
A
Hem
op
hilia
B
Hem
op
hilia
typ
e un
kno
wn
VW
D
FI FII
FV FV+
VIII
FVII
FX FXI
FXIII
Ble
edin
g
Dis
ord
er: T
ype
Unk
now
n
Gla
nzm
anns
th
rom
bas
then
ia
Ber
nard
So
ulie
r
Pla
tele
t D
iso
rder
s:
Oth
er/U
nkno
wn
Finland 150 33 56 533
France 5,864 1,341 0 2,055 41 1 52 13 166 24 177 25 0 178 47 140
Georgia 268 52 33 1 8 2 4 6
Germany 3,686 672 3,930
Ghana 218 5 27 2
Greece 873 182 0 1,075 23 3 28 1 137 9 95 13 0 17 13 81
Guatemala 134 61 27 22 0 0 0 0 0 0 0 0 0 0 0 0
Honduras 272 29 6 9 0 0 0 0 4 0 1 1 0 0 0 0
Hong Kong (China) 101 23 7 2 2 2 3
Hungary 893 227 0 1,442 16 1 22 0 300 22 77 3 0 3 27
India 15,218 2,379 756 532 25 8 51 12 50 33 30 91 31 26
Indonesia 1,465 194 295 7 1 1
Iran 5,008 1,079 0 1,516 139 24 212 229 690 177 223 593 186 559 95 293
Iraq 1,006 340 324 57 2 9 4 85 25 12 49 130
Ireland 617 236 0 1,420 0 0 160 2 180 141 180 11 0 12 3 309
Jamaica 41 4
Japan 5,103 1,097 0 1,222 74 7 41 9 101 22 40 73
Jordan 281 86 252 4 13 46 25 42 12 103 1
Kenya 535 119 0 50 0 0 0 0 1 0 0 0 0 0 0 12
Korea, Republic of 1,683 420 126 5 6 3 41 2 20 5 43
Kyrgyzstan 273 27 9 1 1 1
Latvia 129 27 0 120 0 0 0 0 5 0 0 0 2 0 0 0
Lebanon 146 43 107 34 9 1 7 5 5 2 1 5
Lesotho 22 2
Lithuania 147 24 1 303 11 2 2 3
Macedonia 207 108 167 2 1 5 12
Madagascar 50 50 2 9 1
Malawi 33 6
Malaysia 1,360 235 0 657 4 3 21 1 58 24 59 21 0 58 2 55
Maldives 12 4 1
Mali 78 3 0 4 0 0 0 0 0 0 0 1 0 0 0 0
Mauritania 29 9 2
Mauritius 65 13 0 0 0 0 0 0 3 1 0 0 0 0 0 3
Mexico 4,659 688 346 297 1 2 2 23 4 4 1 6 2 0
Moldova 199 21 6
Mongolia 71 25 13
Montenegro 41 4 0 3 0 0 0 0 1 0 1 3 0 0 0 0
34 REPORT ON THE ANNUAL GLOBAL SURVEY 2016
Hem
op
hilia
A
Hem
op
hilia
B
Hem
op
hilia
typ
e un
kno
wn
VW
D
FI FII
FV FV+
VIII
FVII
FX FXI
FXIII
Ble
edin
g
Dis
ord
er: T
ype
Unk
now
n
Gla
nzm
anns
th
rom
bas
then
ia
Ber
nard
So
ulie
r
Pla
tele
t D
iso
rder
s:
Oth
er/U
nkno
wn
Morocco 663 181 17 1 1 1 1 3 1 1 2 4 1 4
Nepal 500 73 4 1 1 1 10 2
New Zealand 365 82 0 230 0 1 0 0 7 1 7 2 23 2 2 23
Nicaragua 216 27 8 77 4 1 2
Nigeria 301 7 0 4 0 0 0 0 0 0 0 0 0 0 0 0
Norway 325 88 580 2 2 4 0 32 3 1 3 10 4 16
Oman 126 7 354 5 1 8 6 74 6 26 7 22 33 2 202
Pakistan 1,130 209 4 209 6 2 15 1 19 16 0 20 0 13 2 0
Palestine 180 40 73 35 3 2 2
Panama 258 32 0 497 0 0 0 0 9 16 0 0 0 9 1 30
Paraguay 460 20 1 1
Peru 712 125 50 171 1 0 1 0 7 1 5 1 2 1 0 0
Philippines 1,015 176 204 38
Poland 2,413 422 1,827 102 1 26 3 255 24 62 11 25 8
Portugal 539 112 52 51 2 0 3 0 2 1 6 1
Qatar 45 3 0 32 0 0 0 0 3 0 0 2 0 5 2 1
Romania 1,615 210 87 1 2 2 2 2 1 1
Russia 6,342 1,109 1,950
Saudi Arabia 334 84 0 182 4 13 18 1 14 6 11 35 0 119 6 10
Senegal 174 19 0 8 1 0 1 0 2 1
Serbia 456 83 0 286 5 0 1 2 25 1 7 4 1 0 2 0
Singapore 207 45 0 85 0 0 18 0 9 0 44 5 0 0 0 0
Slovak Republic 521 75 0 640 89 0 74 1 768 37 51 2 0 10 15 23
Slovenia 207 30 0 182 3 0 12 3 16 2 19 0 0 7 0 15
South Africa 1,848 358 0 632 8 0 45 5 18 9 27 8 6 20 26 51
Sri Lanka 709 154 47 9 2 8 1 9
Sudan 828 184 254 37 49 2 29 28 4 24 144
Suriname 20 0 0 5
Sweden 860 208 1,512 0 3 2 2 136 19 69 9 1 9 13 250
Syria 642 69 74 16 5 30 12 3 11
Tanzania 71 13 21 3
Thailand 1,342 179 69 1 1 1 14 2 40
Togo 23 4 3
Tunisia 379 98 2 142 26 0 15 3 62 5 36 24 6 56 8 9
Uganda 119 19 3
United Arab Emirates 85 15 40 10 1 15 4 1

35REPORT ON THE ANNUAL GLOBAL SURVEY 2016
Hem
op
hilia
A
Hem
op
hilia
B
Hem
op
hilia
typ
e un
kno
wn
VW
D
FI FII
FV FV+
VIII
FVII
FX FXI
FXIII
Ble
edin
g
Dis
ord
er: T
ype
Unk
now
n
Gla
nzm
anns
th
rom
bas
then
ia
Ber
nard
So
ulie
r
Pla
tele
t D
iso
rder
s:
Oth
er/U
nkno
wn
United Kingdom 6,559 1,472 0 10,627 648 14 206 25 1,231 253 2,960 67 0 132 86 2,359
United States 12,996 3,953 11,118 146 30 104 15 808 93 473 103 1,772 151 40 1,412
Uzbekistan 1,409 139 91 5 5 10 6 8 15 1
Venezuela 2,184 566 989 20 66 33 28 166 111 384 16 4 15 4 160
Vietnam 2,418 530 0 118 9 3 4 12 37 15 6 12 3 87 5 67
Zambia 63 5 22 5
Zimbabwe 129 13 0
Total 149,764 29,712 2,281 71,178 2,098 259 1,895 548 8,282 1,592 6,487 1,553 2,219 2,986 584 10,811
36 REPORT ON THE ANNUAL GLOBAL SURVEY 2016
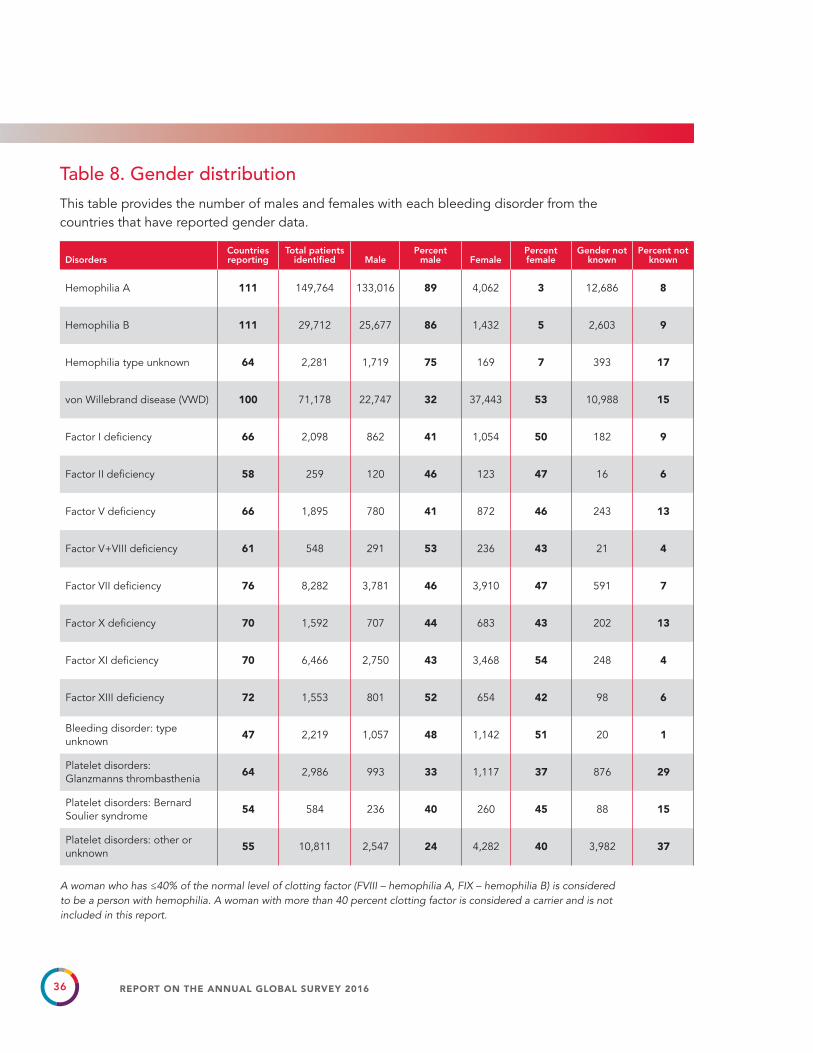
Table 8. Gender distribution This table provides the number of males and females with each bleeding disorder from the countries that have reported gender data.
DisordersCountries reporting
Total patients identified Male
Percent male Female
Percent female
Gender not known
Percent not known
Hemophilia A 111 149,764 133,016 89 4,062 3 12,686 8
Hemophilia B 111 29,712 25,677 86 1,432 5 2,603 9
Hemophilia type unknown 64 2,281 1,719 75 169 7 393 17
von Willebrand disease (VWD) 100 71,178 22,747 32 37,443 53 10,988 15
Factor I deficiency 66 2,098 862 41 1,054 50 182 9
Factor II deficiency 58 259 120 46 123 47 16 6
Factor V deficiency 66 1,895 780 41 872 46 243 13
Factor V+VIII deficiency 61 548 291 53 236 43 21 4
Factor VII deficiency 76 8,282 3,781 46 3,910 47 591 7
Factor X deficiency 70 1,592 707 44 683 43 202 13
Factor XI deficiency 70 6,466 2,750 43 3,468 54 248 4
Factor XIII deficiency 72 1,553 801 52 654 42 98 6
Bleeding disorder: type unknown
47 2,219 1,057 48 1,142 51 20 1
Platelet disorders: Glanzmanns thrombasthenia
64 2,986 993 33 1,117 37 876 29
Platelet disorders: Bernard Soulier syndrome
54 584 236 40 260 45 88 15
Platelet disorders: other or unknown
55 10,811 2,547 24 4,282 40 3,982 37
A woman who has ≤40% of the normal level of clotting factor (FVIII – hemophilia A, FIX – hemophilia B) is considered to be a person with hemophilia. A woman with more than 40 percent clotting factor is considered a carrier and is not included in this report.

37REPORT ON THE ANNUAL GLOBAL SURVEY 2016
Table 9. Number of prevalent and incident cases of inhibitors in Hemophilia A and BPatients with current clinically significant inhibitors, meaning patients who do not respond to standard treatment.
Please note: a 0 indicates that the member organization reported the number zero, a blank space indicates that no number was reported.
Hemophilia A
inhibitors (total)
Hemophilia A inhibitors
(new cases in 2016)
Hemophilia B inhibitors
(total)
Hemophilia B inhibitors
(new cases in 2016)
Albania 6 2 2 1
Algeria 64 14 0
Argentina 85 1 5 0
Australia 61 8 3 0
Austria 22 2
Azerbaijan 23 2
Brazil 395 56 13 0
Burkina Faso 0 0 0 0
Cambodia 4 2
Cameroon 12 0 0 0
Canada 3 11 1 0
Colombia 160 8 16 0
Costa Rica 20 0 0 0
Cote d'Ivoire 11 0 0 0
Cuba 35 0 0 0
Czech Republic 21 5 2 0
Denmark 15 1 1 0
Dominican Republic 11 0 0 0
Ecuador 1 1 0 0
Egypt 88 32 2 0
Estonia 4 0 0
Finland 14 3 0
France 100 12 5 0
Georgia 8
Germany 102 30
Ghana 0 0 0 0

38 REPORT ON THE ANNUAL GLOBAL SURVEY 2016
Hemophilia A inhibitors
(total)
Hemophilia A inhibitors
(new cases in 2016)
Hemophilia B inhibitors
(total)
Hemophilia B inhibitors
(new cases in 2016)
Greece 24 1 4 0
Guatemala 0 0 0 0
Hungary 38 1
Indonesia 86 1
Iran 250 27 16 4
Iraq 85 5 3 1
Ireland 12 1 2 0
Japan 109 20
Kenya 4 1 0 0
Korea, Republic of 43 3 8 0
Latvia 3 1 2 0
Lithuania 9 1 0 0
Madagascar 1 1 0 0
Malawi 0 0
Malaysia 133 3 3 0
Mali 1 1 0 0
Mauritius 1 0 0 0
Mexico 266 14
Montenegro 1 0 0 0
Morocco 61 52 18 12
Nepal 12 2
Nicaragua 2
Nigeria 1 0 0 0
Norway 13 1 1 0
Oman 19 0
Pakistan 14 0 0 0
Panama 5 1 0 0
Philippines 12 3 1 0
Poland 149 4
Qatar 5 1 0 0
Russia 320 3
Saudi Arabia 48 4 2
Senegal 7 0 0 0
Serbia 18 0 0 0

39REPORT ON THE ANNUAL GLOBAL SURVEY 2016
Hemophilia A inhibitors
(total)
Hemophilia A inhibitors
(new cases in 2016)
Hemophilia B inhibitors
(total)
Hemophilia B inhibitors
(new cases in 2016)
Singapore 9 0 0 0
Slovak Republic 6 0 1 1
Slovenia 3 0 0 0
South Africa 167 11 12 1
Sri Lanka 47 31 0 0
Sudan 4 2
Syria 35 1
Tanzania 5
Thailand 52 3 1 0
Tunisia 24 4 1 0
Uganda 0 0
United Kingdom 232 32 12 0
United States 811 64
Uzbekistan 38
Venezuela 106 4 4 0
Vietnam 155 72 0 0
Total 4,711 427 280 20

40 REPORT ON THE ANNUAL GLOBAL SURVEY 2016
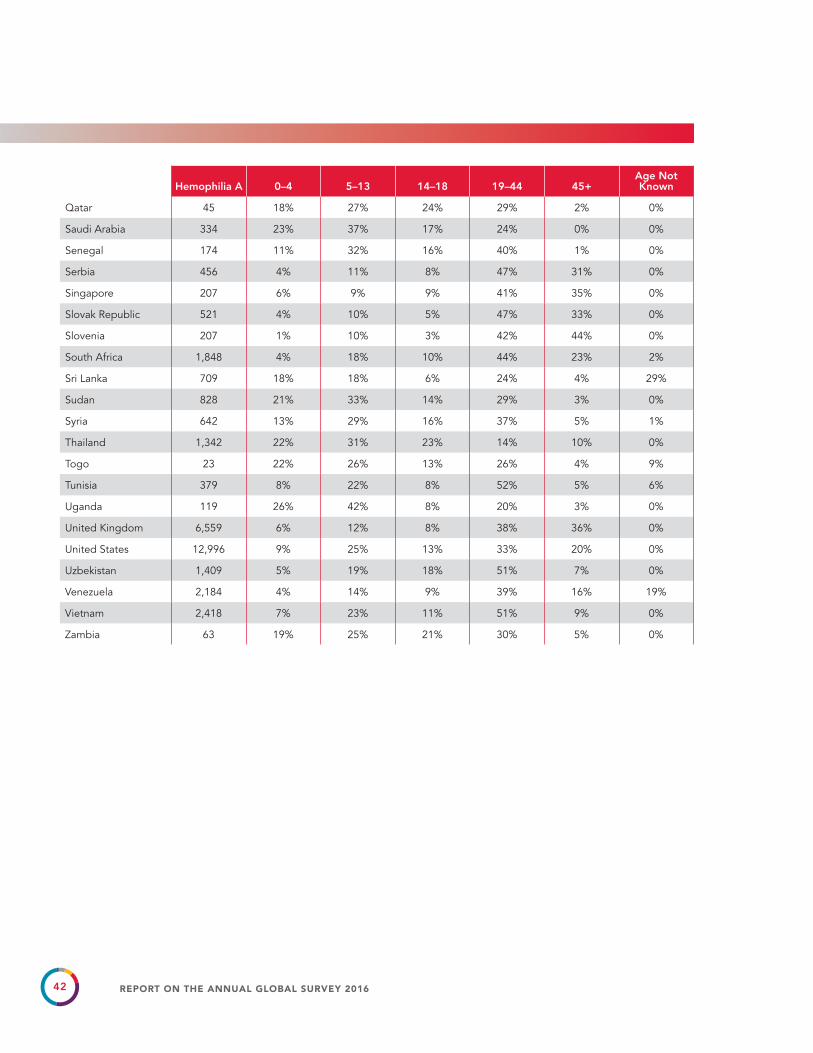
Table 10. Age distribution: Hemophilia A(85 countries reported age data.)
Hemophilia A 0–4 5–13 14–18 19–44 45+Age Not Known
Afghanistan 289 20% 42% 16% 22% 1% 0%
Albania 161 2% 16% 11% 47% 25% 0%
Argentina 2,270 4% 17% 9% 46% 21% 4%
Australia 2,075 6% 15% 7% 39% 33% 0%
Austria 658 3% 10% 9% 42% 37% 0%
Azerbaijan 1,098 5% 11% 6% 51% 27% 0%
Bangladesh 770 8% 32% 23% 33% 4% 0%
Belgium 970 2% 11% 8% 36% 42% 0%
Belize 11 9% 18% 36% 36% 0% 0%
Bolivia 160 0% 31% 25% 19% 1% 24%
Brazil 10,123 5% 16% 11% 49% 18% 0%
Burkina Faso 36 19% 47% 11% 14% 0% 8%
Cambodia 135 15% 46% 19% 20% 0% 0%
Cameroon 153 14% 22% 25% 17% 1% 20%
Canada 3,183 3% 13% 8% 42% 34% 0%
China 12,533 3% 20% 13% 49% 15% 1%
Colombia 1,705 8% 25% 14% 38% 15% 0%
Costa Rica 178 4% 19% 15% 51% 11% 1%
Cote d'Ivoire 74 12% 26% 31% 26% 5% 0%
Cuba 400 5% 12% 14% 54% 15% 0%
Czech Republic 937 5% 11% 7% 45% 32% 0%
Denmark 410 5% 13% 7% 35% 40% 0%
Dominican Republic 264 11% 19% 17% 44% 10% 0%
Ecuador 125 0% 2% 11% 68% 19% 0%
Egypt 4,504 8% 42% 4% 10% 2% 33%
Eritrea 50 0% 22% 22% 50% 2% 4%
Estonia 97 5% 9% 4% 61% 21% 0%
Ethiopia 122 7% 38% 17% 37% 2% 0%
France 5,864 8% 17% 10% 40% 26% 0%
Georgia 268 9% 17% 7% 47% 20% 0%

41REPORT ON THE ANNUAL GLOBAL SURVEY 2016
Hemophilia A 0–4 5–13 14–18 19–44 45+Age Not Known
Ghana 218 7% 45% 21% 11% 2% 14%
Greece 873 3% 8% 7% 38% 44% 0%
Guatemala 134 8% 25% 19% 40% 7% 0%
Honduras 272 8% 29% 15% 36% 3% 9%
Hungary 893 3% 7% 5% 44% 41% 0%
India 15,218 2% 15% 11% 36% 7% 28%
Indonesia 1,465 6% 29% 18% 29% 2% 16%
Iran 5,008 4% 13% 8% 57% 18% 0%
Iraq 1,006 23% 38% 19% 17% 2% 0%
Ireland 617 9% 17% 8% 38% 29% 0%
Japan 5,103 5% 13% 7% 43% 32% 0%
Kenya 535 30% 29% 16% 8% 12% 4%
Korea, Republic of 1,683 4% 13% 10% 52% 20% 0%
Latvia 129 5% 15% 5% 47% 28% 0%
Lesotho 22 0% 27% 41% 9% 0% 23%
Madagascar 50 4% 44% 18% 32% 2% 0%
Malaysia 1,360 26% 22% 6% 13% 3% 30%
Maldives 12 8% 42% 8% 25% 17% 0%
Mali 78 31% 40% 10% 15% 0% 4%
Mauritius 65 0% 14% 5% 46% 29% 6%
Mexico 4,659 1% 16% 12% 44% 12% 14%
Mongolia 71 15% 41% 4% 35% 4% 0%
Montenegro 41 5% 17% 7% 37% 34% 0%
Morocco 663 3% 16% 26% 34% 21% 0%
Nepal 500 6% 22% 18% 37% 5% 12%
New Zealand 365 3% 16% 8% 39% 23% 11%
Nicaragua 216 15% 35% 19% 30% 2% 0%
Nigeria 301 10% 33% 14% 25% 2% 16%
Oman 126 12% 27% 14% 42% 5% 0%
Pakistan 1,130 4% 16% 12% 63% 4% 0%
Panama 258 5% 15% 9% 55% 17% 0%
Philippines 1,015 2% 14% 15% 47% 7% 14%
Poland 2,413 2% 8% 5% 48% 37% 0%
Portugal 539 1% 9% 8% 41% 33% 8%
42 REPORT ON THE ANNUAL GLOBAL SURVEY 2016
Hemophilia A 0–4 5–13 14–18 19–44 45+Age Not Known
Qatar 45 18% 27% 24% 29% 2% 0%
Saudi Arabia 334 23% 37% 17% 24% 0% 0%
Senegal 174 11% 32% 16% 40% 1% 0%
Serbia 456 4% 11% 8% 47% 31% 0%
Singapore 207 6% 9% 9% 41% 35% 0%
Slovak Republic 521 4% 10% 5% 47% 33% 0%
Slovenia 207 1% 10% 3% 42% 44% 0%
South Africa 1,848 4% 18% 10% 44% 23% 2%
Sri Lanka 709 18% 18% 6% 24% 4% 29%
Sudan 828 21% 33% 14% 29% 3% 0%
Syria 642 13% 29% 16% 37% 5% 1%
Thailand 1,342 22% 31% 23% 14% 10% 0%
Togo 23 22% 26% 13% 26% 4% 9%
Tunisia 379 8% 22% 8% 52% 5% 6%
Uganda 119 26% 42% 8% 20% 3% 0%
United Kingdom 6,559 6% 12% 8% 38% 36% 0%
United States 12,996 9% 25% 13% 33% 20% 0%
Uzbekistan 1,409 5% 19% 18% 51% 7% 0%
Venezuela 2,184 4% 14% 9% 39% 16% 19%
Vietnam 2,418 7% 23% 11% 51% 9% 0%
Zambia 63 19% 25% 21% 30% 5% 0%
43REPORT ON THE ANNUAL GLOBAL SURVEY 2016
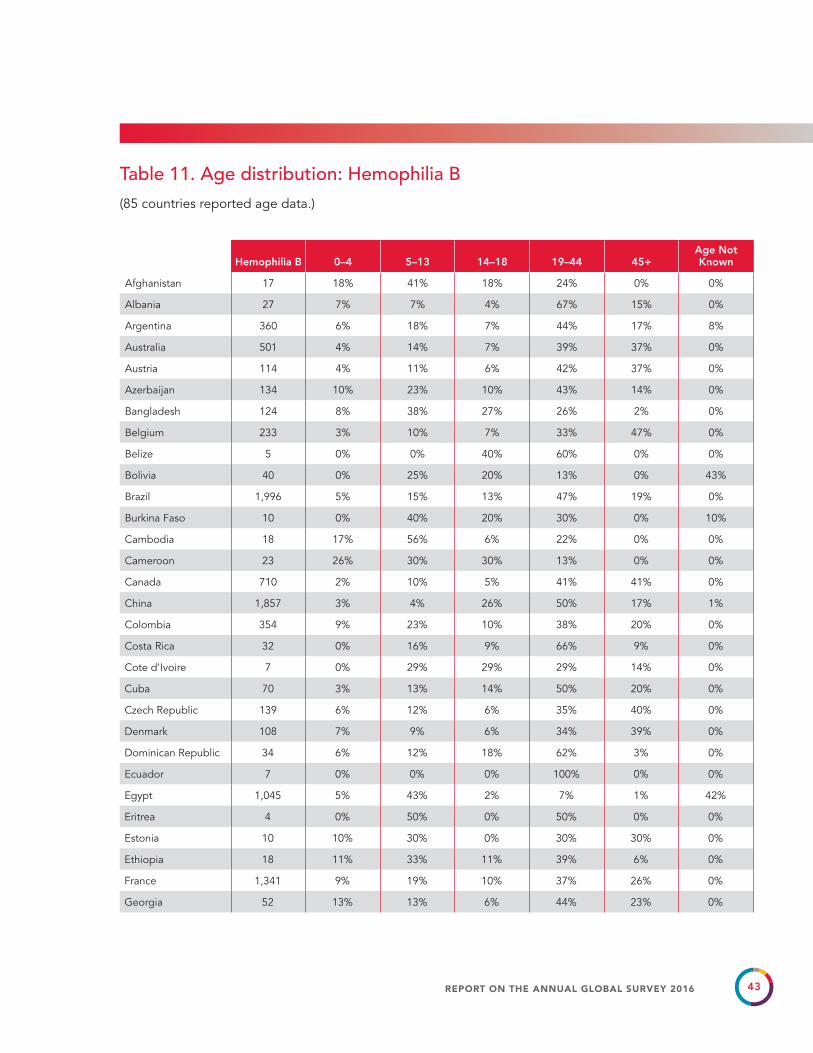
Table 11. Age distribution: Hemophilia B(85 countries reported age data.)
Hemophilia B 0–4 5–13 14–18 19–44 45+Age Not Known
Afghanistan 17 18% 41% 18% 24% 0% 0%
Albania 27 7% 7% 4% 67% 15% 0%
Argentina 360 6% 18% 7% 44% 17% 8%
Australia 501 4% 14% 7% 39% 37% 0%
Austria 114 4% 11% 6% 42% 37% 0%
Azerbaijan 134 10% 23% 10% 43% 14% 0%
Bangladesh 124 8% 38% 27% 26% 2% 0%
Belgium 233 3% 10% 7% 33% 47% 0%
Belize 5 0% 0% 40% 60% 0% 0%
Bolivia 40 0% 25% 20% 13% 0% 43%
Brazil 1,996 5% 15% 13% 47% 19% 0%
Burkina Faso 10 0% 40% 20% 30% 0% 10%
Cambodia 18 17% 56% 6% 22% 0% 0%
Cameroon 23 26% 30% 30% 13% 0% 0%
Canada 710 2% 10% 5% 41% 41% 0%
China 1,857 3% 4% 26% 50% 17% 1%
Colombia 354 9% 23% 10% 38% 20% 0%
Costa Rica 32 0% 16% 9% 66% 9% 0%
Cote d'Ivoire 7 0% 29% 29% 29% 14% 0%
Cuba 70 3% 13% 14% 50% 20% 0%
Czech Republic 139 6% 12% 6% 35% 40% 0%
Denmark 108 7% 9% 6% 34% 39% 0%
Dominican Republic 34 6% 12% 18% 62% 3% 0%
Ecuador 7 0% 0% 0% 100% 0% 0%
Egypt 1,045 5% 43% 2% 7% 1% 42%
Eritrea 4 0% 50% 0% 50% 0% 0%
Estonia 10 10% 30% 0% 30% 30% 0%
Ethiopia 18 11% 33% 11% 39% 6% 0%
France 1,341 9% 19% 10% 37% 26% 0%
Georgia 52 13% 13% 6% 44% 23% 0%

44 REPORT ON THE ANNUAL GLOBAL SURVEY 2016
Hemophilia B 0–4 5–13 14–18 19–44 45+Age Not Known
Ghana 5 0% 0% 100% 0% 0% 0%
Greece 182 4% 7% 4% 38% 48% 0%
Guatemala 61 7% 20% 25% 44% 5% 0%
Honduras 29 7% 24% 14% 38% 3% 14%
Hungary 227 1% 4% 7% 45% 43% 0%
India 2,379 2% 13% 13% 41% 9% 22%
Indonesia 194 11% 36% 23% 22% 3% 7%
Iran 1,079 4% 11% 8% 59% 18% 0%
Iraq 340 18% 36% 23% 16% 7% 0%
Ireland 236 5% 17% 9% 39% 30% 0%
Japan 1,097 4% 12% 7% 42% 34% 0%
Kenya 119 18% 24% 29% 24% 3% 2%
Korea, Republic of 420 5% 17% 12% 45% 21% 0%
Latvia 27 0% 19% 0% 59% 19% 4%
Lesotho 2 50% 50% 0% 0% 0% 0%
Madagascar 50 12% 52% 6% 30% 0% 0%
Malaysia 235 34% 25% 4% 22% 3% 13%
Maldives 4 75% 0% 25% 0% 0% 0%
Mali 3 100% 0% 0% 0% 0% 0%
Mauritius 13 8% 15% 31% 23% 23% 0%
Mexico 688 2% 16% 11% 48% 11% 12%
Mongolia 25 12% 32% 28% 20% 8% 0%
Montenegro 4 0% 0% 50% 25% 25% 0%
Morocco 181 5% 14% 39% 20% 23% 0%
Nepal 73 12% 33% 15% 29% 8% 3%
New Zealand 82 2% 12% 2% 37% 35% 11%
Nicaragua 27 11% 22% 33% 30% 4% 0%
Nigeria 7 43% 29% 14% 14% 0% 0%
Oman 7 14% 29% 0% 57% 0% 0%
Pakistan 209 8% 16% 7% 66% 3% 0%
Panama 32 9% 9% 22% 53% 6% 0%
Philippines 176 4% 18% 13% 48% 7% 10%
Poland 422 2% 8% 5% 50% 34% 1%
Portugal 112 1% 9% 6% 39% 37% 8%

45REPORT ON THE ANNUAL GLOBAL SURVEY 2016
Hemophilia B 0–4 5–13 14–18 19–44 45+Age Not Known
Qatar 3 0% 0% 100% 0% 0% 0%
Saudi Arabia 84 15% 38% 7% 39% 0% 0%
Senegal 19 26% 53% 11% 5% 5% 0%
Serbia 83 5% 19% 11% 42% 23% 0%
Singapore 45 0% 20% 7% 53% 20% 0%
Slovak Republic 75 5% 17% 7% 49% 21% 0%
Slovenia 30 3% 10% 3% 40% 43% 0%
South Africa 358 5% 20% 9% 41% 23% 1%
Sri Lanka 154 17% 23% 11% 9% 3% 36%
Sudan 184 21% 43% 12% 23% 1% 0%
Syria 69 3% 33% 25% 35% 1% 3%
Thailand 179 26% 30% 20% 12% 13% 0%
Togo 4 0% 25% 0% 0% 0% 75%
Tunisia 98 13% 24% 2% 39% 8% 13%
Uganda 19 5% 42% 21% 32% 0% 0%
United Kingdom 1,472 6% 12% 7% 40% 35% 0%
United States 3,953 9% 24% 11% 29% 26% 0%
Uzbekistan 139 4% 18% 17% 55% 6% 0%
Venezuela 566 3% 13% 7% 39% 20% 19%
Vietnam 530 10% 21% 14% 44% 11% 0%
Zambia 5 0% 20% 0% 80% 0% 0%

46 REPORT ON THE ANNUAL GLOBAL SURVEY 2016
Table 12. Age distribution: Hemophilia Type Unknown (17 countries reported age data.)
Hemophilia Type
Unknown 0–4 5–13 14–18 19–44 45+Age Not Known
Bangladesh 6 0% 0% 100% 0% 0% 0%
Belgium 9 0% 0% 0% 22% 67% 11%
Dominican Republic 72 3% 22% 19% 35% 8% 13%
Ethiopia 118 25% 27% 23% 25% 0% 0%
Ghana 27 19% 11% 52% 19% 0% 0%
Guatemala 27 11% 26% 26% 22% 15% 0%
Honduras 6 0% 33% 17% 50% 0% 0%
India 756 1% 5% 6% 21% 5% 62%
Indonesia 295 4% 6% 7% 17% 1% 65%
Maldives 1 0% 0% 0% 0% 100% 0%
Mexico 346 1% 7% 5% 21% 5% 61%
Nicaragua 8 25% 63% 13% 0% 0% 0%
Pakistan 4 0% 0% 0% 100% 0% 0%
Philippines 204 4% 11% 12% 41% 4% 27%
Portugal 52 0% 0% 8% 21% 29% 42%
Togo 3 67% 0% 0% 0% 0% 33%
Zambia 22 0% 0% 27% 14% 18% 41%

47REPORT ON THE ANNUAL GLOBAL SURVEY 2016
Table 13. Age distribution: VWD(71 countries reported age data.)
VWD 0–4 5–13 14–18 19–44 45+Age Not Known
Albania 4 0% 0% 0% 100% 0% 0%
Argentina 401 0% 2% 3% 47% 34% 14%
Australia 2,092 2% 10% 7% 44% 36% 0%
Azerbaijan 207 3% 9% 10% 57% 20% 0%
Bangladesh 2 50% 0% 0% 50% 0% 0%
Belgium 1,906 1% 15% 10% 40% 34% 1%
Bolivia 1 0% 0% 0% 100% 0% 0%
Brazil 7,811 1% 11% 10% 52% 25% 0%
Cambodia 4 25% 75% 0% 0% 0% 0%
Canada 4,437 1% 7% 8% 49% 36% 0%
China 72 4% 22% 11% 53% 10% 0%
Colombia 1,471 0% 16% 11% 15% 58% 0%
Cote d'Ivoire 3 0% 0% 0% 100% 0% 0%
Cuba 351 1% 10% 19% 50% 21% 0%
Czech Republic 818 1% 8% 6% 46% 40% 0%
Denmark 309 1% 7% 3% 40% 40% 0%
Dominican Republic 17 12% 18% 12% 53% 6% 0%
Ecuador 48 0% 0% 8% 69% 23% 0%
Egypt 543 6% 45% 3% 1% 1% 44%
Estonia 96 2% 23% 11% 42% 13% 9%
France 2,055 5% 15% 11% 40% 29% 0%
Georgia 33 3% 24% 9% 36% 27% 0%
Ghana 2 0% 100% 0% 0% 0% 0%
Greece 1,075 2% 13% 9% 42% 35% 0%
Guatemala 22 5% 50% 14% 27% 5% 0%
Honduras 9 0% 0% 33% 22% 0% 44%
Hungary 1,442 1% 6% 6% 44% 42% 1%
India 532 2% 15% 12% 43% 7% 21%
Indonesia 7 14% 14% 14% 57% 0% 0%
Iran 1,516 4% 18% 10% 55% 14% 0%

48 REPORT ON THE ANNUAL GLOBAL SURVEY 2016
VWD 0–4 5–13 14–18 19–44 45+Age Not Known
Iraq 324 17% 31% 40% 10% 3% 0%
Ireland 1,420 6% 18% 7% 46% 24% 0%
Japan 1,222 2% 6% 7% 47% 32% 5%
Kenya 50 20% 26% 28% 14% 4% 8%
Korea, Republic of 126 1% 13% 11% 56% 19% 0%
Latvia 120 3% 0% 1% 57% 39% 0%
Madagascar 2 0% 0% 0% 100% 0% 0%
Malaysia 657 11% 25% 9% 38% 4% 12%
Mali 4 0% 0% 50% 25% 25% 0%
Mexico 297 1% 12% 10% 41% 10% 26%
Mongolia 13 0% 38% 8% 38% 15% 0%
Montenegro 3 0% 0% 33% 67% 0% 0%
Morocco 17 0% 24% 41% 35% 0% 0%
Nepal 4 0% 50% 0% 25% 25% 0%
New Zealand 230 1% 6% 8% 38% 25% 22%
Nicaragua 77 4% 44% 18% 26% 8% 0%
Nigeria 4 25% 50% 0% 25% 0% 0%
Pakistan 209 3% 25% 15% 54% 3% 0%
Panama 497 2% 22% 32% 37% 8% 0%
Paraguay 1 0% 0% 0% 100% 0% 0%
Philippines 38 0% 11% 5% 26% 0% 58%
Poland 1,827 1% 18% 9% 47% 24% 1%
Portugal 51 2% 4% 4% 37% 49% 4%
Qatar 32 13% 16% 53% 19% 0% 0%
Saudi Arabia 182 16% 33% 25% 26% 0% 0%
Senegal 8 0% 50% 25% 25% 0% 0%
Serbia 286 1% 9% 5% 52% 32% 0%
Singapore 85 1% 13% 0% 46% 40% 0%
Slovak Republic 640 1% 6% 4% 56% 32% 0%
Slovenia 182 1% 7% 10% 52% 30% 0%
South Africa 632 0% 6% 7% 43% 39% 4%
Sri Lanka 47 13% 17% 4% 9% 2% 55%
Sudan 254 24% 40% 14% 19% 4% 0%
Syria 74 7% 32% 11% 43% 7% 0%

49REPORT ON THE ANNUAL GLOBAL SURVEY 2016
VWD 0–4 5–13 14–18 19–44 45+Age Not Known
Uganda 3 0% 100% 0% 0% 0% 0%
United Kingdom 10,627 3% 11% 6% 41% 39% 0%
United States 11,118 6% 32% 22% 23% 17% 0%
Uzbekistan 91 3% 8% 19% 62% 9% 0%
Venezuela 989 1% 15% 10% 40% 16% 19%
Vietnam 118 7% 23% 16% 40% 14% 0%
Zambia 5 0% 40% 20% 0% 40% 0%

50 REPORT ON THE ANNUAL GLOBAL SURVEY 2016
Table 14. HIV and HCV infection(People currently living with HIV or HCV. 68 countries reported HIV and HCV data.)
Please note: the number of people infected with HCV does not refer to the number of people with active HCV.
Data on HIV and HCV are based on a small number of countries and do not reflect the true global burden of these infections in the bleeding disorders community.
Total number of people living with HIV
Total number of people infected with hepatitis C*
Total number of people with currently active hepatitis C**
Hem
op
hilia
VW
D
Oth
er
ble
edin
g
dis
ord
ers
Hem
op
hilia
VW
D*
Oth
er
ble
edin
g
dis
ord
ers
Hem
op
hilia
VW
D
Oth
er
ble
edin
g
dis
ord
ers
Afghanistan 0 0 0 8 0 0 1 0 0
Albania 1 0 0 15 0 0 1 0 0
Algeria 0 0 0 26 15 2 12 5 1
Argentina 57 0 611 21
Austria 49 206
Burkina Faso 0 0 0 0 0 0 0 0 0
Cameroon 0 0 0 0 0 0 0 0 0
Colombia 12 1 0 192 50 6 92 12 2
Costa Rica 11 0 0 50 0 0 15 0 0
Cote d'Ivoire 1 0 0 1 0 0 0 0 0
Czech Republic 3 0 0 210 2 0 60 1 0
Dominican Republic 0 0 0 12 0 0 0 0
Ecuador 0 0 0 0 0 0 0 0 0
Estonia 0 0 0 28 1
Finland 0
France 523 16 3 2,000 173 46
Georgia 144 136
Germany 370 2,000
Ghana 0 0 0 0 0 0 0 0 0
Greece 51 2 0 272 26 9 126 10 3
Hungary 10 389 108
India 149
Indonesia 1 39

51REPORT ON THE ANNUAL GLOBAL SURVEY 2016
Total number of people living with HIV
Total number of people infected with hepatitis C*
Total number of people with currently active hepatitis C**
Hem
op
hilia
VW
D
Oth
er
ble
edin
g
dis
ord
ers
Hem
op
hilia
VW
D*
Oth
er
ble
edin
g
dis
ord
ers
Hem
op
hilia
VW
D
Oth
er
ble
edin
g
dis
ord
ers
Iraq 300 62 5
Ireland 31 0 0 138 7 7 4 0 0
Japan 714 7 3 2,496 146 86 1,789 115 67
Kenya 23 2 0
Korea, Republic of 18 557 108
Latvia 36
Lithuania 0 0 0 0 0 0 0
Madagascar 0 0 0 1 0 0 1 0 0
Malaysia 2 0 0 0 0 0 0 0 0
Maldives 0 0 0 0 0 0 0 0 0
Mali 0 0 0 0 0 0 0 0 0
Mauritius 0 0 0 8 0 0 8 0 0
Mexico 49 3 0 269 7 2
Montenegro 0 0 0 3 0 0 1 0 0
Morocco 0 0 0 30 0 0 0 0 0
Nepal 1 8
New Zealand 6 0 0 137 1 0 14 0 0
Nicaragua 1 0 0 18 0 0 0 0 0
Norway 5 0 0
Oman 2 16
Pakistan 13 1 0 182 49 0 182 49 0
Panama 0 0 0 23 5 0 20 5 0
Philippines 0
Qatar 0 0 0 0 0 0 0 0 0
Saudi Arabia 31 0 0 88 0 0 0
Senegal 0 0 0 0 0 0 0 0 0
Serbia 7 2 0 122 7 1
Singapore 0 0 64 2
Slovak Republic 0 0 0 131 22 16 24 2 0
Slovenia 7 0 0 78 6 3 8 0 0

52 REPORT ON THE ANNUAL GLOBAL SURVEY 2016
* Hepatitis C antibody positive at any time
** Still PCR positive: patients who have not cleared the virus spontaneously or after treatment
Total number of people living with HIV
Total number of people infected with hepatitis C*
Total number of people with currently active hepatitis C**
Hem
op
hilia
VW
D
Oth
er
ble
edin
g
dis
ord
ers
Hem
op
hilia
VW
D*
Oth
er
ble
edin
g
dis
ord
ers
Hem
op
hilia
VW
D
Oth
er
ble
edin
g
dis
ord
ers
South Africa 71 3 0 217 4 2 17 4 2
Sri Lanka 0 0 0 1
Sudan 2 40
Switzerland 12 68
Syria 71 6
Thailand 3 60
Togo 0
Tunisia 10 0 0 71 2
Uganda 1 1
United Kingdom 278 4 0 1,246 132 19
United States 939 15 5 2,227 106 29
Uzbekistan 9 177 11
Venezuela 84 9 1 320 24 60 8
Vietnam 3 0 0 199 3 22 0 0 0
Zambia 1 0 0 0 0 0 0 0 0
Total 3,561 65 12 13,379 890 226 4,908 317 104
53REPORT ON THE ANNUAL GLOBAL SURVEY 2016
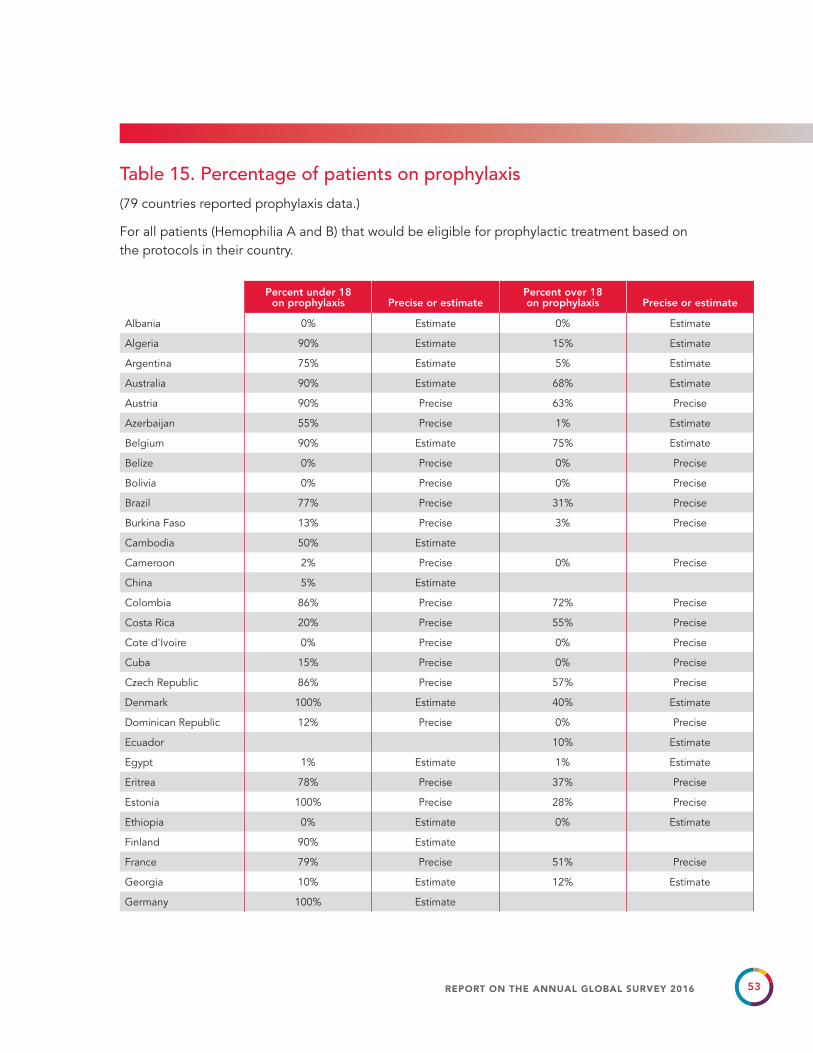
Table 15. Percentage of patients on prophylaxis (79 countries reported prophylaxis data.)
For all patients (Hemophilia A and B) that would be eligible for prophylactic treatment based on the protocols in their country.
Percent under 18 on prophylaxis Precise or estimate
Percent over 18 on prophylaxis Precise or estimate
Albania 0% Estimate 0% Estimate
Algeria 90% Estimate 15% Estimate
Argentina 75% Estimate 5% Estimate
Australia 90% Estimate 68% Estimate
Austria 90% Precise 63% Precise
Azerbaijan 55% Precise 1% Estimate
Belgium 90% Estimate 75% Estimate
Belize 0% Precise 0% Precise
Bolivia 0% Precise 0% Precise
Brazil 77% Precise 31% Precise
Burkina Faso 13% Precise 3% Precise
Cambodia 50% Estimate
Cameroon 2% Precise 0% Precise
China 5% Estimate
Colombia 86% Precise 72% Precise
Costa Rica 20% Precise 55% Precise
Cote d'Ivoire 0% Precise 0% Precise
Cuba 15% Precise 0% Precise
Czech Republic 86% Precise 57% Precise
Denmark 100% Estimate 40% Estimate
Dominican Republic 12% Precise 0% Precise
Ecuador 10% Estimate
Egypt 1% Estimate 1% Estimate
Eritrea 78% Precise 37% Precise
Estonia 100% Precise 28% Precise
Ethiopia 0% Estimate 0% Estimate
Finland 90% Estimate
France 79% Precise 51% Precise
Georgia 10% Estimate 12% Estimate
Germany 100% Estimate

54 REPORT ON THE ANNUAL GLOBAL SURVEY 2016
Percent under 18 on prophylaxis Precise or estimate
Percent over 18 on prophylaxis Precise or estimate
Ghana 80% Estimate 80% Estimate
Greece 87% Precise 29% Estimate
Honduras 0% Estimate 0% Estimate
Hungary 100% Precise 70% Estimate
Indonesia 0% Precise 0% Precise
Iran 20% Precise 0% Precise
Iraq 80% Estimate 10% Estimate
Ireland 96% Precise 73% Precise
Japan 90% Estimate 72% Estimate
Kenya 14% Precise 1% Precise
Latvia 100% Estimate 100% Estimate
Lesotho 0% Estimate 0% Estimate
Lithuania 100% Precise 25% Estimate
Madagascar 10% Estimate 10% Estimate
Malaysia 60% Estimate 51% Estimate
Mali 6% Precise 0% Precise
Mauritius 100% Precise 58% Precise
Mongolia 0% Estimate 0% Estimate
Montenegro 78% Precise 67% Precise
Morocco 20% Estimate 30% Estimate
New Zealand 100% Precise 50% Estimate
Nicaragua 0% Precise 0% Precise
Nigeria 15% Precise 0% Precise
Norway 100% Estimate 80% Estimate
Pakistan 1% Precise 0% Precise
Panama 100% Precise 100% Precise
Philippines 1% Estimate 1% Estimate
Poland 100% Precise
Qatar 50% Precise 70% Precise
Romania 90% Estimate 0% Estimate
Russia 55% Estimate 40% Estimate
Senegal 18% Estimate 0% Estimate
Serbia 90% Estimate 34% Estimate
Singapore 95% Estimate 30% Estimate
Slovak Republic 95% Precise 40% Estimate
Slovenia 77% Precise 64% Precise

55REPORT ON THE ANNUAL GLOBAL SURVEY 2016
Percent under 18 on prophylaxis Precise or estimate
Percent over 18 on prophylaxis Precise or estimate
South Africa 35% Estimate 25% Estimate
Sri Lanka 24% Precise 6% Estimate
Switzerland 95% Estimate 50% Estimate
Syria 0% Precise
Tanzania 0% Estimate 0% Estimate
Thailand 20% Estimate 10% Estimate
Togo 0% Estimate 0% Estimate
Tunisia 50% Estimate
Uganda 1% Precise 1% Precise
United Kingdom 95% Estimate 70% Estimate
Uzbekistan 0% Estimate 0% Estimate
Venezuela 20% Estimate 15% Estimate
Vietnam 30% Estimate 2% Estimate
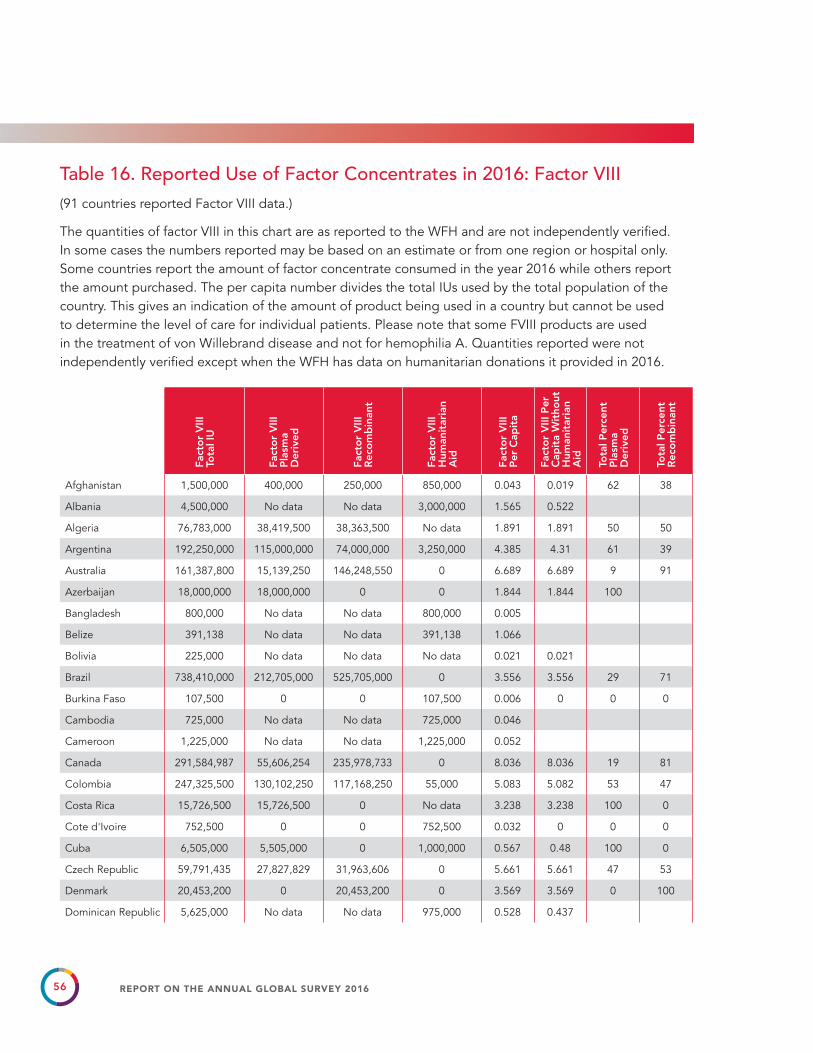
56 REPORT ON THE ANNUAL GLOBAL SURVEY 2016
Table 16. Reported Use of Factor Concentrates in 2016: Factor VIII(91 countries reported Factor VIII data.)
The quantities of factor VIII in this chart are as reported to the WFH and are not independently verified. In some cases the numbers reported may be based on an estimate or from one region or hospital only. Some countries report the amount of factor concentrate consumed in the year 2016 while others report the amount purchased. The per capita number divides the total IUs used by the total population of the country. This gives an indication of the amount of product being used in a country but cannot be used to determine the level of care for individual patients. Please note that some FVIII products are used in the treatment of von Willebrand disease and not for hemophilia A. Quantities reported were not independently verified except when the WFH has data on humanitarian donations it provided in 2016.
Fact
or
VIII
To
tal I
U
Fact
or
VIII
P
lasm
a D
eriv
ed
Fact
or
VIII
R
eco
mb
inan
t
Fact
or
VIII
H
uman
itar
ian
Aid
Fact
or
VIII
P
er C
apit
a
Fact
or
VIII
Per
C
apit
a W
itho
ut
Hum
anit
aria
n A
id
Tota
l Per
cent
P
lasm
a D
eriv
ed
Tota
l Per
cent
R
eco
mb
inan
t
Afghanistan 1,500,000 400,000 250,000 850,000 0.043 0.019 62 38
Albania 4,500,000 No data No data 3,000,000 1.565 0.522
Algeria 76,783,000 38,419,500 38,363,500 No data 1.891 1.891 50 50
Argentina 192,250,000 115,000,000 74,000,000 3,250,000 4.385 4.31 61 39
Australia 161,387,800 15,139,250 146,248,550 0 6.689 6.689 9 91
Azerbaijan 18,000,000 18,000,000 0 0 1.844 1.844 100
Bangladesh 800,000 No data No data 800,000 0.005
Belize 391,138 No data No data 391,138 1.066
Bolivia 225,000 No data No data No data 0.021 0.021
Brazil 738,410,000 212,705,000 525,705,000 0 3.556 3.556 29 71
Burkina Faso 107,500 0 0 107,500 0.006 0 0 0
Cambodia 725,000 No data No data 725,000 0.046
Cameroon 1,225,000 No data No data 1,225,000 0.052
Canada 291,584,987 55,606,254 235,978,733 0 8.036 8.036 19 81
Colombia 247,325,500 130,102,250 117,168,250 55,000 5.083 5.082 53 47
Costa Rica 15,726,500 15,726,500 0 No data 3.238 3.238 100 0
Cote d'Ivoire 752,500 0 0 752,500 0.032 0 0 0
Cuba 6,505,000 5,505,000 0 1,000,000 0.567 0.48 100 0
Czech Republic 59,791,435 27,827,829 31,963,606 0 5.661 5.661 47 53
Denmark 20,453,200 0 20,453,200 0 3.569 3.569 0 100
Dominican Republic 5,625,000 No data No data 975,000 0.528 0.437
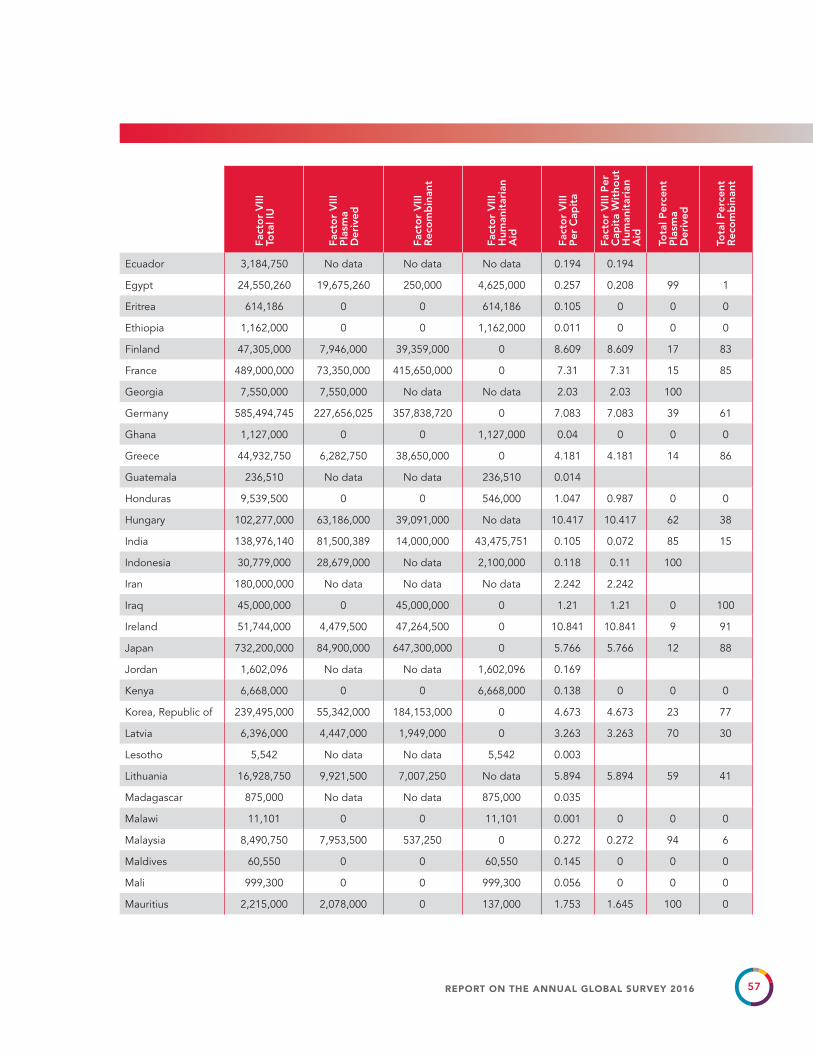
57REPORT ON THE ANNUAL GLOBAL SURVEY 2016
Fact
or
VIII
To
tal I
U
Fact
or
VIII
P
lasm
a D
eriv
ed
Fact
or
VIII
R
eco
mb
inan
t
Fact
or
VIII
H
uman
itar
ian
Aid
Fact
or
VIII
P
er C
apit
a
Fact
or
VIII
Per
C
apit
a W
itho
ut
Hum
anit
aria
n A
id
Tota
l Per
cent
P
lasm
a D
eriv
ed
Tota
l Per
cent
R
eco
mb
inan
t
Ecuador 3,184,750 No data No data No data 0.194 0.194
Egypt 24,550,260 19,675,260 250,000 4,625,000 0.257 0.208 99 1
Eritrea 614,186 0 0 614,186 0.105 0 0 0
Ethiopia 1,162,000 0 0 1,162,000 0.011 0 0 0
Finland 47,305,000 7,946,000 39,359,000 0 8.609 8.609 17 83
France 489,000,000 73,350,000 415,650,000 0 7.31 7.31 15 85
Georgia 7,550,000 7,550,000 No data No data 2.03 2.03 100
Germany 585,494,745 227,656,025 357,838,720 0 7.083 7.083 39 61
Ghana 1,127,000 0 0 1,127,000 0.04 0 0 0
Greece 44,932,750 6,282,750 38,650,000 0 4.181 4.181 14 86
Guatemala 236,510 No data No data 236,510 0.014
Honduras 9,539,500 0 0 546,000 1.047 0.987 0 0
Hungary 102,277,000 63,186,000 39,091,000 No data 10.417 10.417 62 38
India 138,976,140 81,500,389 14,000,000 43,475,751 0.105 0.072 85 15
Indonesia 30,779,000 28,679,000 No data 2,100,000 0.118 0.11 100
Iran 180,000,000 No data No data No data 2.242 2.242
Iraq 45,000,000 0 45,000,000 0 1.21 1.21 0 100
Ireland 51,744,000 4,479,500 47,264,500 0 10.841 10.841 9 91
Japan 732,200,000 84,900,000 647,300,000 0 5.766 5.766 12 88
Jordan 1,602,096 No data No data 1,602,096 0.169
Kenya 6,668,000 0 0 6,668,000 0.138 0 0 0
Korea, Republic of 239,495,000 55,342,000 184,153,000 0 4.673 4.673 23 77
Latvia 6,396,000 4,447,000 1,949,000 0 3.263 3.263 70 30
Lesotho 5,542 No data No data 5,542 0.003
Lithuania 16,928,750 9,921,500 7,007,250 No data 5.894 5.894 59 41
Madagascar 875,000 No data No data 875,000 0.035
Malawi 11,101 0 0 11,101 0.001 0 0 0
Malaysia 8,490,750 7,953,500 537,250 0 0.272 0.272 94 6
Maldives 60,550 0 0 60,550 0.145 0 0 0
Mali 999,300 0 0 999,300 0.056 0 0 0
Mauritius 2,215,000 2,078,000 0 137,000 1.753 1.645 100 0

58 REPORT ON THE ANNUAL GLOBAL SURVEY 2016
Fact
or
VIII
To
tal I
U
Fact
or
VIII
P
lasm
a D
eriv
ed
Fact
or
VIII
R
eco
mb
inan
t
Fact
or
VIII
H
uman
itar
ian
Aid
Fact
or
VIII
P
er C
apit
a
Fact
or
VIII
Per
C
apit
a W
itho
ut
Hum
anit
aria
n A
id
Tota
l Per
cent
P
lasm
a D
eriv
ed
Tota
l Per
cent
R
eco
mb
inan
t
Mexico 181,694,344 163,647,250 18,011,750 35,344 1.425 1.424 90 10
Mongolia 1,791,500 No data 950,000 841,500 0.592 0.314 100
Montenegro 1,250,000 1,250,000 0 0 2.007 2.007 100 0
Morocco 18,230,000 9,876,500 7,014,250 1,339,250 0.517 0.479 58 42
Nepal 3,099,690 No data No data 3,099,690 0.107
New Zealand 25,377,600 3,977,500 21,400,100 0 5.408 5.408 16 84
Nicaragua 1,500,000 0 0 1,500,000 0.244 0 0 0
Nigeria 4,024,420 No data No data 4,024,420 0.022
Pakistan 3,975,000 No data No data 3,975,000 0.021
Panama 3,343,723 3,342,600 1,123 0 0.829 0.829 100 0
Paraguay 208,000 No data No data 208,000 0.031
Philippines 6,496,676 2,460,500 0 4,036,176 0.063 0.024 100 0
Poland 242,003,000 234,151,000 7,852,000 0 6.377 6.377 97 3
Portugal 64,954,250 27,050,000 37,904,250 No data 6.291 6.291 42 58
Qatar 350,000 0 350,000 0 0.136 0.136 0 100
Romania 26,012,250 17,418,300 8,550,750 43,200 1.32 1.318 67 33
Russia 697,223,678 605,782,978 91,440,700 0 4.83 4.83 87 13
Saudi Arabia 92,575,000 36,225,000 56,350,000 No data 2.868 2.868 39 61
Senegal 1,822,500 0 0 1,822,500 0.118 0 0 0
Serbia 20,922,600 12,107,350 8,815,250 0 2.965 2.965 58 42
Singapore 7,033,250 4,396,250 2,637,000 No data 1.254 1.254 63 37
Slovak Republic 38,500,000 34,000,000 4,500,000 0 7.092 7.092 88 12
Slovenia 16,959,250 4,663,750 12,295,500 0 8.213 8.213 27 73
South Africa 58,630,250 57,069,500 1,560,750 0 1.049 1.049 97 3
Sri Lanka 3,162,500 No data No data 3,162,500 0.149
Sudan 6,611,900 5,311,900 No data 1,300,000 0.167 0.134 100
Switzerland 51,618,357 10,553,250 41,065,107 No data 6.166 6.166 20 80
Syria 1,224,000 0 0 1,224,000 0.066 0 0 0
Tanzania 200,000 No data No data 200,000 0.004
Thailand 19,428,750 No data No data 1,380,750 0.282 0.262
Togo 55,700 No data No data 55,700 0.007
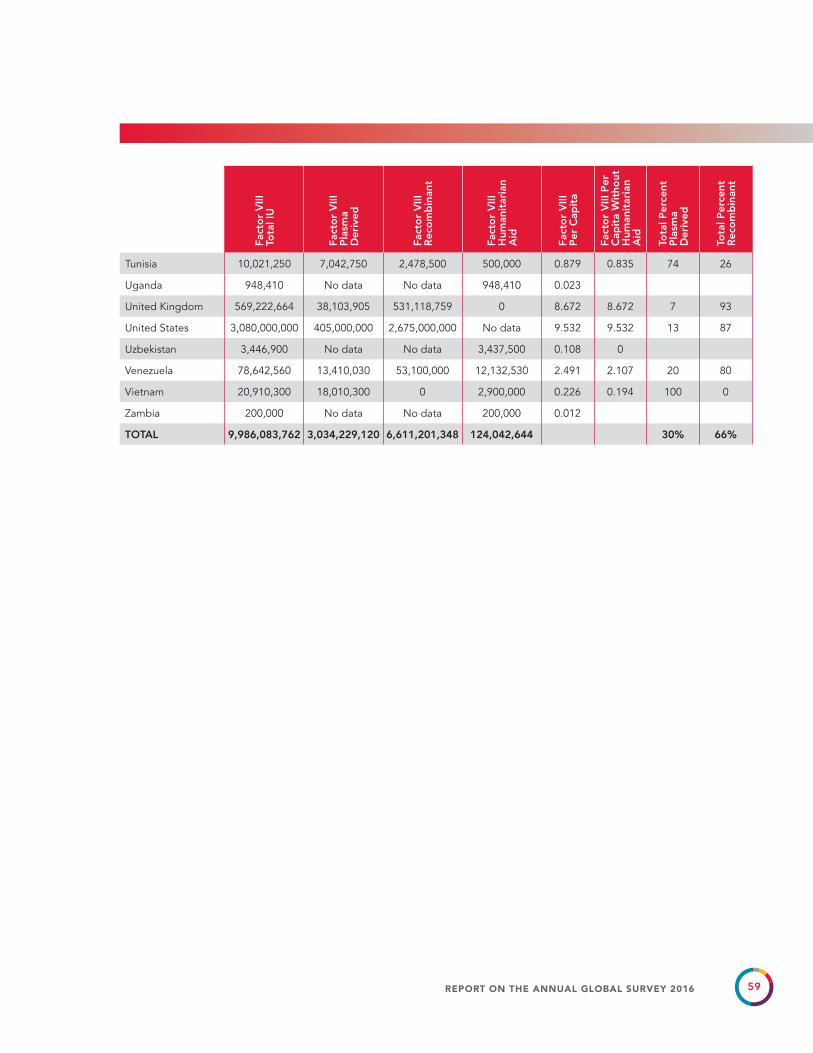
59REPORT ON THE ANNUAL GLOBAL SURVEY 2016
Fact
or
VIII
To
tal I
U
Fact
or
VIII
P
lasm
a D
eriv
ed
Fact
or
VIII
R
eco
mb
inan
t
Fact
or
VIII
H
uman
itar
ian
Aid
Fact
or
VIII
P
er C
apit
a
Fact
or
VIII
Per
C
apit
a W
itho
ut
Hum
anit
aria
n A
id
Tota
l Per
cent
P
lasm
a D
eriv
ed
Tota
l Per
cent
R
eco
mb
inan
t
Tunisia 10,021,250 7,042,750 2,478,500 500,000 0.879 0.835 74 26
Uganda 948,410 No data No data 948,410 0.023
United Kingdom 569,222,664 38,103,905 531,118,759 0 8.672 8.672 7 93
United States 3,080,000,000 405,000,000 2,675,000,000 No data 9.532 9.532 13 87
Uzbekistan 3,446,900 No data No data 3,437,500 0.108 0
Venezuela 78,642,560 13,410,030 53,100,000 12,132,530 2.491 2.107 20 80
Vietnam 20,910,300 18,010,300 0 2,900,000 0.226 0.194 100 0
Zambia 200,000 No data No data 200,000 0.012
TOTAL 9,986,083,762 3,034,229,120 6,611,201,348 124,042,644 30% 66%
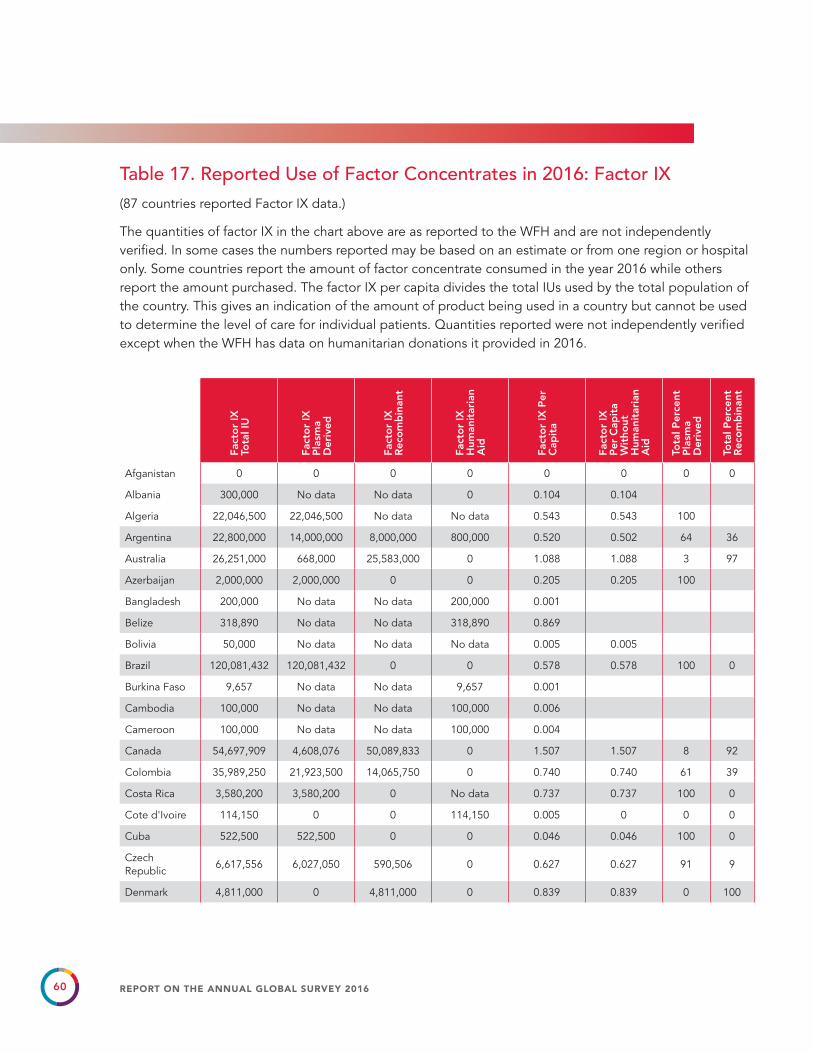
60 REPORT ON THE ANNUAL GLOBAL SURVEY 2016
Fact
or
IX
Tota
l IU
Fact
or
IX
Pla
sma
Der
ived
Fact
or
IX
Rec
om
bin
ant
Fact
or
IX
Hum
anit
aria
n A
id
Fact
or
IX P
er
Cap
ita
Fact
or
IX
Per
Cap
ita
Wit
hout
H
uman
itar
ian
Aid
Tota
l Per
cent
P
lasm
a D
eriv
ed
Tota
l Per
cent
R
eco
mb
inan
t
Afganistan 0 0 0 0 0 0 0 0
Albania 300,000 No data No data 0 0.104 0.104
Algeria 22,046,500 22,046,500 No data No data 0.543 0.543 100
Argentina 22,800,000 14,000,000 8,000,000 800,000 0.520 0.502 64 36
Australia 26,251,000 668,000 25,583,000 0 1.088 1.088 3 97
Azerbaijan 2,000,000 2,000,000 0 0 0.205 0.205 100
Bangladesh 200,000 No data No data 200,000 0.001
Belize 318,890 No data No data 318,890 0.869
Bolivia 50,000 No data No data No data 0.005 0.005
Brazil 120,081,432 120,081,432 0 0 0.578 0.578 100 0
Burkina Faso 9,657 No data No data 9,657 0.001
Cambodia 100,000 No data No data 100,000 0.006
Cameroon 100,000 No data No data 100,000 0.004
Canada 54,697,909 4,608,076 50,089,833 0 1.507 1.507 8 92
Colombia 35,989,250 21,923,500 14,065,750 0 0.740 0.740 61 39
Costa Rica 3,580,200 3,580,200 0 No data 0.737 0.737 100 0
Cote d'Ivoire 114,150 0 0 114,150 0.005 0 0 0
Cuba 522,500 522,500 0 0 0.046 0.046 100 0
Czech Republic
6,617,556 6,027,050 590,506 0 0.627 0.627 91 9
Denmark 4,811,000 0 4,811,000 0 0.839 0.839 0 100
Table 17. Reported Use of Factor Concentrates in 2016: Factor IX(87 countries reported Factor IX data.)
The quantities of factor IX in the chart above are as reported to the WFH and are not independently verified. In some cases the numbers reported may be based on an estimate or from one region or hospital only. Some countries report the amount of factor concentrate consumed in the year 2016 while others report the amount purchased. The factor IX per capita divides the total IUs used by the total population of the country. This gives an indication of the amount of product being used in a country but cannot be used to determine the level of care for individual patients. Quantities reported were not independently verified except when the WFH has data on humanitarian donations it provided in 2016.

61REPORT ON THE ANNUAL GLOBAL SURVEY 2016
Fact
or
IX
Tota
l IU
Fact
or
IX
Pla
sma
Der
ived
Fact
or
IX
Rec
om
bin
ant
Fact
or
IX
Hum
anit
aria
n A
id
Fact
or
IX P
er
Cap
ita
Fact
or
IX
Per
Cap
ita
Wit
hout
H
uman
itar
ian
Aid
Tota
l Per
cent
P
lasm
a D
eriv
ed
Tota
l Per
cent
R
eco
mb
inan
t
Dominican Republic
275,000 No data No data 275,000 0.026
Ecuador 285,600 No data No data No data 0.017 0.017
Egypt 1,250,000 200,000 250,000 800,000 0.013 0.005 44 56
Eritrea 10,000 No data No data 10,000 0.002
Ethiopia 100,000 0 0 100,000 0.001 0 0 0
Finland 9,986,000 9,686,000 300,000 0 1.817 1.817 97 3
France 77,000,000 27,720,000 49,280,000 0 1.151 1.151 36 64
Georgia 1,550,000 1,550,000 No data No data 0.417 0.417 100
Germany 69,457,050 38,074,500 31,382,550 0 0.840 0.840 55 45
Ghana 350,000 0 0 350,000 0.012 0 0 0
Greece 5,548,500 404,500 5,144,000 0 0.516 0.516 7 93
Honduras 82,940 0 0 65,440 0.009 0.002 0 0
Hungary 6,500,000 6,500,000 0 No data 0.662 0.662 100 0
India 3,225,000 2,100,000 No data 1,125,000 0.002 0.002 100
Indonesia 2,178,500 1,678,500 No data 500,000 0.008 0.006 100
Iran 25,000,000 No data No data No data 0.311 0.311
Iraq 10,000,000 0 10,000,000 0 0.269 0.269 0 100
Ireland 12,034,600 328,000 11,706,600 0 2.521 2.521 3 97
Japan 128,700,000 57,200,000 71,500,000 0 1.013 1.013 44 56
Jordan 22,460 No data No data 22,460 0.002
Kenya 600,000 0 0 600,000 0.012 0 0 0
Korea, Republic of
55,017,000 3,505,000 51,512,000 0 1.074 1.074 6 94
Latvia 726,500 726,500 0 0 0.371 0.371 100 0
Lithuania 3,200,400 3,200,400 0 No data 1.114 1.114 100 0
Madagascar 425,000 No data No data 425,000 0.017
Malawi 0 0 0 0 0.000 0 0 0
Malaysia 1,276,050 1,276,050 0 0 0.041 0.041 100 0
Maldives 125,000 0 0 125,000 0.299 0 0 0
Mali 50,000 0 0 50,000 0.003 0 0 0
Mauritius 289,312 283,000 0 6,312 0.229 0.224 100 0
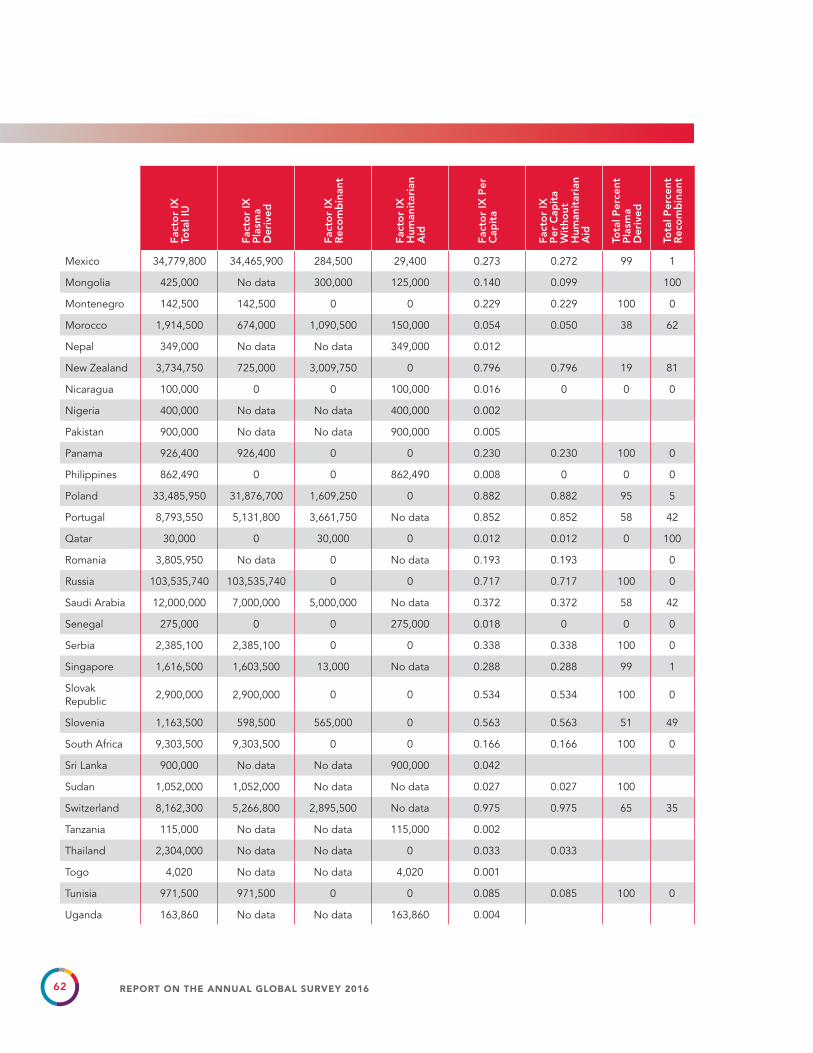
62 REPORT ON THE ANNUAL GLOBAL SURVEY 2016
Fact
or
IX
Tota
l IU
Fact
or
IX
Pla
sma
Der
ived
Fact
or
IX
Rec
om
bin
ant
Fact
or
IX
Hum
anit
aria
n A
id
Fact
or
IX P
er
Cap
ita
Fact
or
IX
Per
Cap
ita
Wit
hout
H
uman
itar
ian
Aid
Tota
l Per
cent
P
lasm
a D
eriv
ed
Tota
l Per
cent
R
eco
mb
inan
t
Mexico 34,779,800 34,465,900 284,500 29,400 0.273 0.272 99 1
Mongolia 425,000 No data 300,000 125,000 0.140 0.099 100
Montenegro 142,500 142,500 0 0 0.229 0.229 100 0
Morocco 1,914,500 674,000 1,090,500 150,000 0.054 0.050 38 62
Nepal 349,000 No data No data 349,000 0.012
New Zealand 3,734,750 725,000 3,009,750 0 0.796 0.796 19 81
Nicaragua 100,000 0 0 100,000 0.016 0 0 0
Nigeria 400,000 No data No data 400,000 0.002
Pakistan 900,000 No data No data 900,000 0.005
Panama 926,400 926,400 0 0 0.230 0.230 100 0
Philippines 862,490 0 0 862,490 0.008 0 0 0
Poland 33,485,950 31,876,700 1,609,250 0 0.882 0.882 95 5
Portugal 8,793,550 5,131,800 3,661,750 No data 0.852 0.852 58 42
Qatar 30,000 0 30,000 0 0.012 0.012 0 100
Romania 3,805,950 No data 0 No data 0.193 0.193 0
Russia 103,535,740 103,535,740 0 0 0.717 0.717 100 0
Saudi Arabia 12,000,000 7,000,000 5,000,000 No data 0.372 0.372 58 42
Senegal 275,000 0 0 275,000 0.018 0 0 0
Serbia 2,385,100 2,385,100 0 0 0.338 0.338 100 0
Singapore 1,616,500 1,603,500 13,000 No data 0.288 0.288 99 1
Slovak Republic
2,900,000 2,900,000 0 0 0.534 0.534 100 0
Slovenia 1,163,500 598,500 565,000 0 0.563 0.563 51 49
South Africa 9,303,500 9,303,500 0 0 0.166 0.166 100 0
Sri Lanka 900,000 No data No data 900,000 0.042
Sudan 1,052,000 1,052,000 No data No data 0.027 0.027 100
Switzerland 8,162,300 5,266,800 2,895,500 No data 0.975 0.975 65 35
Tanzania 115,000 No data No data 115,000 0.002
Thailand 2,304,000 No data No data 0 0.033 0.033
Togo 4,020 No data No data 4,020 0.001
Tunisia 971,500 971,500 0 0 0.085 0.085 100 0
Uganda 163,860 No data No data 163,860 0.004
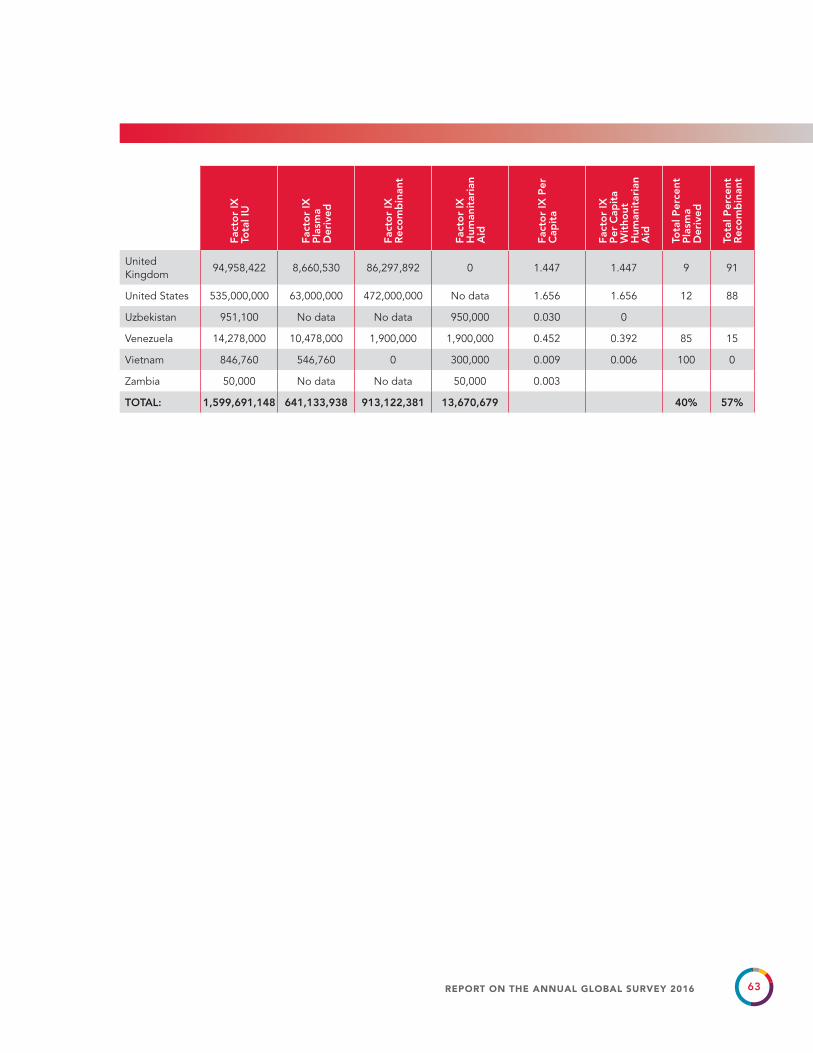
63REPORT ON THE ANNUAL GLOBAL SURVEY 2016
Fact
or
IX
Tota
l IU
Fact
or
IX
Pla
sma
Der
ived
Fact
or
IX
Rec
om
bin
ant
Fact
or
IX
Hum
anit
aria
n A
id
Fact
or
IX P
er
Cap
ita
Fact
or
IX
Per
Cap
ita
Wit
hout
H
uman
itar
ian
Aid
Tota
l Per
cent
P
lasm
a D
eriv
ed
Tota
l Per
cent
R
eco
mb
inan
t
United Kingdom
94,958,422 8,660,530 86,297,892 0 1.447 1.447 9 91
United States 535,000,000 63,000,000 472,000,000 No data 1.656 1.656 12 88
Uzbekistan 951,100 No data No data 950,000 0.030 0
Venezuela 14,278,000 10,478,000 1,900,000 1,900,000 0.452 0.392 85 15
Vietnam 846,760 546,760 0 300,000 0.009 0.006 100 0
Zambia 50,000 No data No data 50,000 0.003
TOTAL: 1,599,691,148 641,133,938 913,122,381 13,670,679 40% 57%

Annual Global Survey 2016
64
1
A. National Hemophilia Organization Organization name
City
Country
Phone
This form completed by: First name
Last name
Please Click Here
to validate Organization contact information
The WFH would like to know how you collect the data you are providing for this survey. If you have a registry, we would like to know more about the registry. A registry is a regularly updated centralized list of identified people with hemophilia (PWH) or inherited bleeding disorders. A registry includes information on personal details, diagnosis, treatment, and complications.
What is the source of the numbers provided for this survey?
Check one Hemophilia Society and/or NMO registry or database Hospital(s)/HTC(s) registry or database Health Ministry registry or database Other (please describe):
How often is your database updated? Ongoing update (can be updated anytime)
Yearly update (the registry is updated once each year) Other (please describe):
Who updates the database? Doctors update the database
Patient organization updates the database Hospitals or clinics update the database Other (please describe):
Have all the identified patients in your country been included in this report? If not, please explain.
Yes No Please explain:
Please Click Here
to validate Data source
B. Identified Patients (Please DO NOT estimate or guess) Number Not known
1. Total number of identified people with hemophilia A or B, or type unknown (PWH)
2. Number of identified people with von Willebrand disease (VWD)
3. Number of identified people with other hereditary bleeding disorders (including rare factor deficiencies and inherited platelet disorders. See question 6 for the list of specific disorders.)
Do you consider these numbers to be accurate? Yes Not sure
Please Click Here
to validate number of patients

Annual Global Survey 2016 Annual Global Survey 2016
65
2
4. Number of people with Hemophilia and von Willebrand disease by age group
Age group Number with hemophilia A
Number with hemophilia B
Number with hemophilia type unknown
Number with VWD
0 - 4 years old
5 - 13 years old
14 - 18 years old
19 - 44 years old
45 years or older
Patients with age Unknown
No age data The age distribution of Hemophilia A, B and unknown should be equal to the number of PWH in question B1 The age distribution of vWD should be equal to the number of vWD in question B2
Do you consider these numbers to be accurate? Yes Not sure
5. Do you collect age data in a format that does not match question 4? (If you do collect age data in another format, please send it to the WFH in a separate attachment.) Yes
Please Click Here
to validate Age section
6. Type of hereditary bleeding disorder The sum of Male, Female, and Gender Unknown should be equal to Total.
Diagnosis Total Male Female Gender unknown
No data
Hemophilia A
Hemophilia B
Hemophilia, type unknown
von Willebrand disease
Factor I deficiency
Factor II deficiency
Factor V deficiency
Factor V+VIII deficiency
Factor VII deficiency
Factor X deficiency
Factor XI deficiency
Factor XIII deficiency
Rare factor deficiency: type unknown
Platelet disorders: Glanzmann's thrombasthenia
Platelet disorders: Bernard Soulier Syndrome
Platelet disorders: other or unknown
The sum of Totals Hemophilia A, B, and type unknown should be equal to the number of PWH in question B1. The Total of vWD should be equal to the number of vWD in question B2. The sum of Total of the all other bleeding and platelets disorders should be equal to the number of OBD in question B3 A woman who has less than 40 percent of the normal level of clotting factor would be considered a person with hemophilia. A woman with more than 40% FVIII is considered a carrier and should not be included in this report.
Do you consider these numbers to be accurate? Yes Not sure
Please Click Here
to validate Gender section
1
A. National Hemophilia Organization Organization name
City
Country
Phone
This form completed by: First name
Last name
Please Click Here
to validate Organization contact information
The WFH would like to know how you collect the data you are providing for this survey. If you have a registry, we would like to know more about the registry. A registry is a regularly updated centralized list of identified people with hemophilia (PWH) or inherited bleeding disorders. A registry includes information on personal details, diagnosis, treatment, and complications.
What is the source of the numbers provided for this survey?
Check one Hemophilia Society and/or NMO registry or database Hospital(s)/HTC(s) registry or database Health Ministry registry or database Other (please describe):
How often is your database updated? Ongoing update (can be updated anytime)
Yearly update (the registry is updated once each year) Other (please describe):
Who updates the database? Doctors update the database
Patient organization updates the database Hospitals or clinics update the database Other (please describe):
Have all the identified patients in your country been included in this report? If not, please explain.
Yes No Please explain:
Please Click Here
to validate Data source
B. Identified Patients (Please DO NOT estimate or guess) Number Not known
1. Total number of identified people with hemophilia A or B, or type unknown (PWH)
2. Number of identified people with von Willebrand disease (VWD)
3. Number of identified people with other hereditary bleeding disorders (including rare factor deficiencies and inherited platelet disorders. See question 6 for the list of specific disorders.)
Do you consider these numbers to be accurate? Yes Not sure
Please Click Here
to validate number of patients
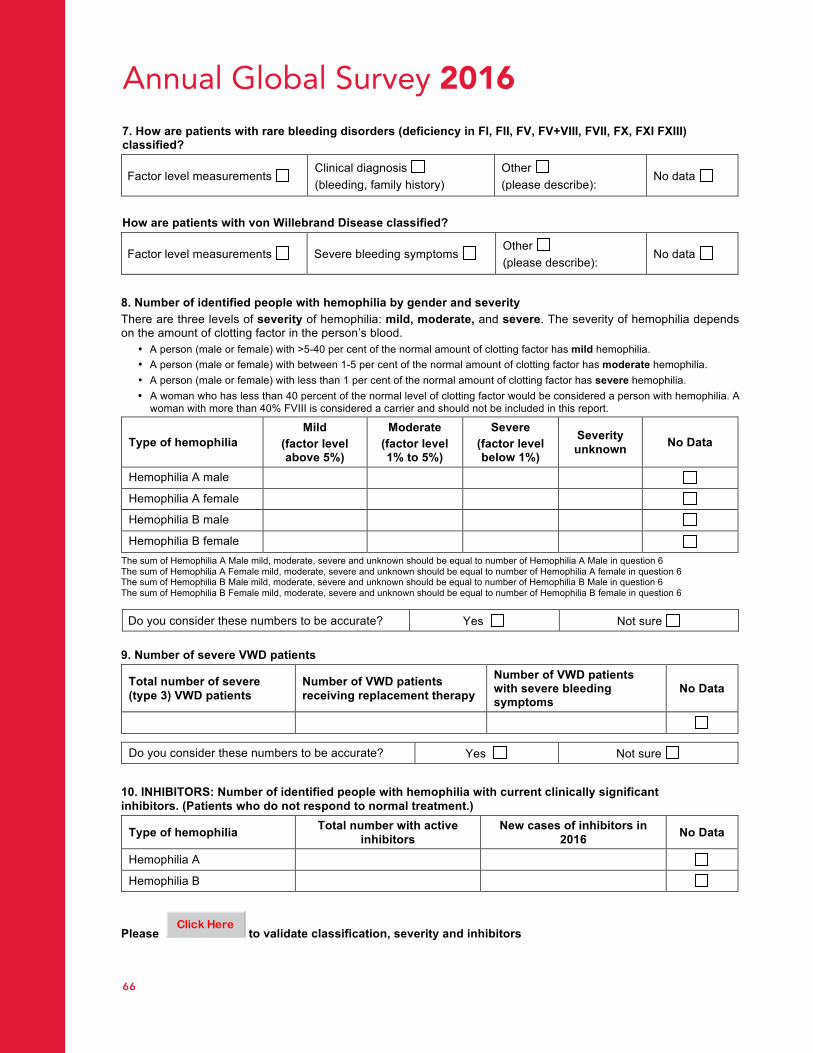
Annual Global Survey 2016
66
3
7. How are patients with rare bleeding disorders (deficiency in FI, FII, FV, FV+VIII, FVII, FX, FXI FXIII) classified?
Factor level measurements Clinical diagnosis (bleeding, family history)
Other (please describe):
No data
How are patients with von Willebrand Disease classified?
Factor level measurements Severe bleeding symptoms Other (please describe):
No data
8. Number of identified people with hemophilia by gender and severity There are three levels of severity of hemophilia: mild, moderate, and severe. The severity of hemophilia depends on the amount of clotting factor in the person’s blood.
• A person (male or female) with >5-40 per cent of the normal amount of clotting factor has mild hemophilia. • A person (male or female) with between 1-5 per cent of the normal amount of clotting factor has moderate hemophilia. • A person (male or female) with less than 1 per cent of the normal amount of clotting factor has severe hemophilia. • A woman who has less than 40 percent of the normal level of clotting factor would be considered a person with hemophilia. A
woman with more than 40% FVIII is considered a carrier and should not be included in this report.
Type of hemophilia Mild
(factor level above 5%)
Moderate (factor level 1% to 5%)
Severe (factor level below 1%)
Severity unknown No Data
Hemophilia A male
Hemophilia A female
Hemophilia B male
Hemophilia B female
The sum of Hemophilia A Male mild, moderate, severe and unknown should be equal to number of Hemophilia A Male in question 6 The sum of Hemophilia A Female mild, moderate, severe and unknown should be equal to number of Hemophilia A female in question 6 The sum of Hemophilia B Male mild, moderate, severe and unknown should be equal to number of Hemophilia B Male in question 6 The sum of Hemophilia B Female mild, moderate, severe and unknown should be equal to number of Hemophilia B female in question 6
Do you consider these numbers to be accurate? Yes Not sure
9. Number of severe VWD patients
Total number of severe (type 3) VWD patients
Number of VWD patients receiving replacement therapy
Number of VWD patients with severe bleeding symptoms
No Data
Do you consider these numbers to be accurate? Yes Not sure
10. INHIBITORS: Number of identified people with hemophilia with current clinically significant inhibitors. (Patients who do not respond to normal treatment.)
Type of hemophilia Total number with active inhibitors
New cases of inhibitors in 2016 No Data
Hemophilia A
Hemophilia B
Please Click Here
to validate classification, severity and inhibitors

Annual Global Survey 2016 Annual Global Survey 2016
67
4
11. Availability and usage of products to treat hemophilia
Treatment product Product is available
Product is used
Number of patients treated with product indicated No data
Plasma
Cryoprecipitate
Plasma-derived concentrate
Recombinant concentrate (excluding prolonged half-life)
Recombinant concentrate (prolonged half-life)
DDAVP (Desmopressin)
PLEASE NOTE: We are asking for the number of patients treated, not a percentage. Please provide your best estimate.
12. Availability and usage of products to treat VWD
Treatment product Product is available
Product is used
Number of patients treated with product indicated No data
Plasma
Cryoprecipitate
Plasma-derived concentrate
DDAVP (Desmopressin)
PLEASE NOTE: We are asking for the number of patients treated, not a percentage. Please provide your best estimate.
13. HIV infection
Hemophilia A or B, or type unknown
von Willebrand disease
Other hereditary bleeding disorders
Total number of people living with HIV
New HIV infections in 2016
14. Hepatitis C infection
Hemophilia A or B, or type unknown von Willebrand disease Other hereditary
bleeding disorders Total number of people infected with hepatitis C1
Total number of people with currently active hepatitis C2
New hepatitis C infections in 2016
1Hepatitis C antibody positive at any time 2Still PCR positive: patients who have not cleared the virus spontaneously or after treatment
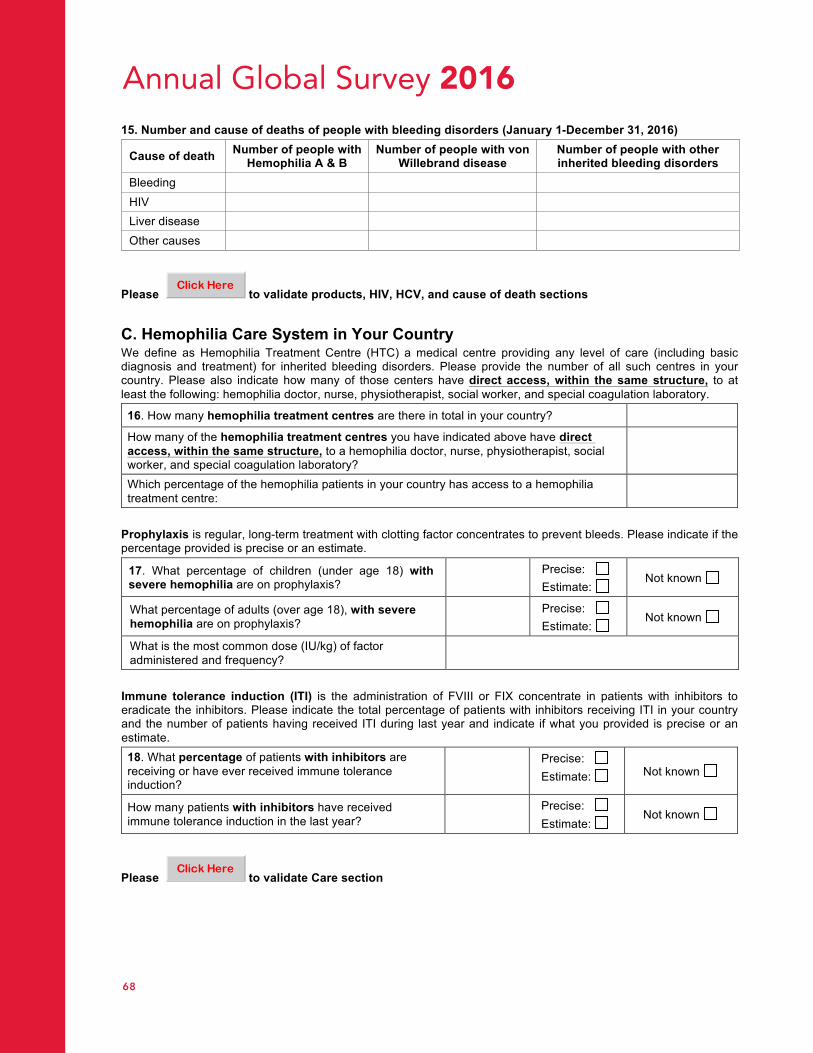
Annual Global Survey 2016
68
5
15. Number and cause of deaths of people with bleeding disorders (January 1-December 31, 2016)
Cause of death Number of people with Hemophilia A & B
Number of people with von Willebrand disease
Number of people with other inherited bleeding disorders
Bleeding
HIV
Liver disease
Other causes
Please Click Here
to validate products, HIV, HCV, and cause of death sections
C. Hemophilia Care System in Your Country We define as Hemophilia Treatment Centre (HTC) a medical centre providing any level of care (including basic diagnosis and treatment) for inherited bleeding disorders. Please provide the number of all such centres in your country. Please also indicate how many of those centers have direct access, within the same structure, to at least the following: hemophilia doctor, nurse, physiotherapist, social worker, and special coagulation laboratory.
16. How many hemophilia treatment centres are there in total in your country?
How many of the hemophilia treatment centres you have indicated above have direct access, within the same structure, to a hemophilia doctor, nurse, physiotherapist, social worker, and special coagulation laboratory?
Which percentage of the hemophilia patients in your country has access to a hemophilia treatment centre:
Prophylaxis is regular, long-term treatment with clotting factor concentrates to prevent bleeds. Please indicate if the percentage provided is precise or an estimate.
17. What percentage of children (under age 18) with severe hemophilia are on prophylaxis?
Precise: Estimate:
Not known
What percentage of adults (over age 18), with severe hemophilia are on prophylaxis?
Precise: Estimate:
Not known
What is the most common dose (IU/kg) of factor administered and frequency?
Immune tolerance induction (ITI) is the administration of FVIII or FIX concentrate in patients with inhibitors to eradicate the inhibitors. Please indicate the total percentage of patients with inhibitors receiving ITI in your country and the number of patients having received ITI during last year and indicate if what you provided is precise or an estimate. 18. What percentage of patients with inhibitors are receiving or have ever received immune tolerance induction?
Precise: Estimate: Not known
How many patients with inhibitors have received immune tolerance induction in the last year?
Precise: Estimate:
Not known
Please Click Here
to validate Care section
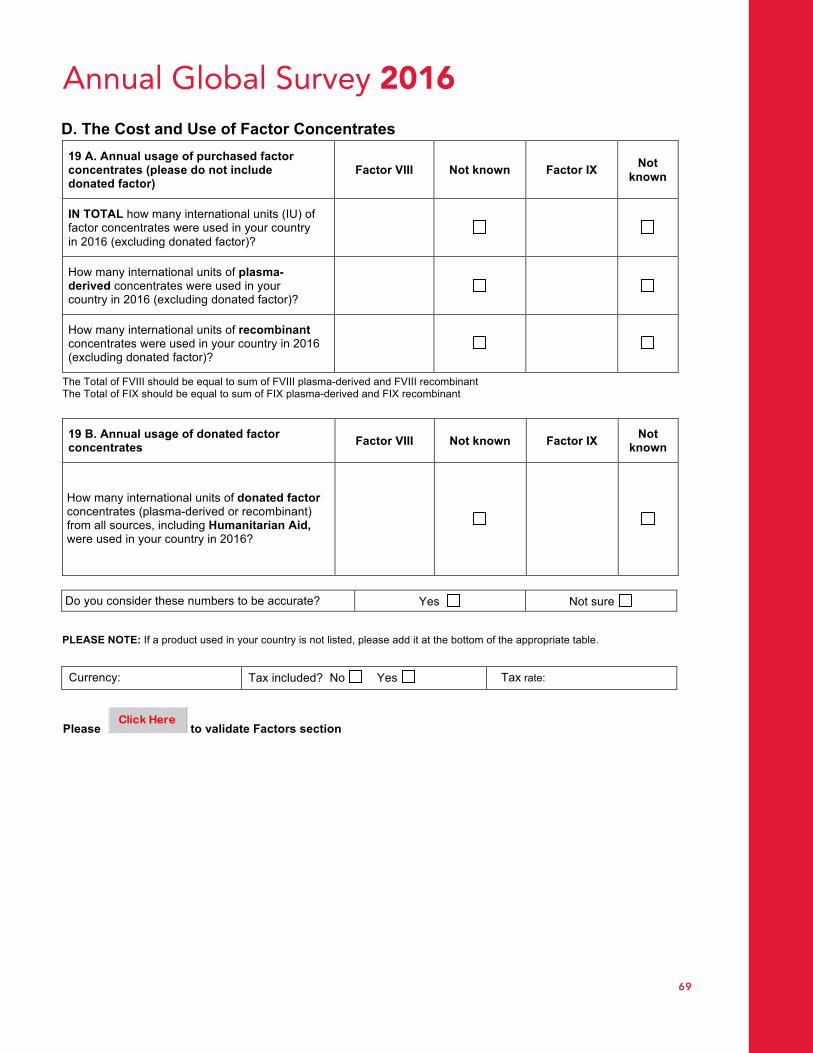
Annual Global Survey 2016 Annual Global Survey 2016
69
6
D. The Cost and Use of Factor Concentrates 19 A. Annual usage of purchased factor concentrates (please do not include donated factor)
Factor VIII Not known Factor IX Not known
IN TOTAL how many international units (IU) of factor concentrates were used in your country in 2016 (excluding donated factor)?
How many international units of plasma-derived concentrates were used in your country in 2016 (excluding donated factor)?
How many international units of recombinant concentrates were used in your country in 2016 (excluding donated factor)?
The Total of FVIII should be equal to sum of FVIII plasma-derived and FVIII recombinant The Total of FIX should be equal to sum of FIX plasma-derived and FIX recombinant
19 B. Annual usage of donated factor concentrates Factor VIII Not known Factor IX Not
known
How many international units of donated factor concentrates (plasma-derived or recombinant) from all sources, including Humanitarian Aid, were used in your country in 2016?
Do you consider these numbers to be accurate? Yes Not sure
PLEASE NOTE: If a product used in your country is not listed, please add it at the bottom of the appropriate table.
Currency:
Tax included? No Yes Tax rate:
Please Click Here
to validate Factors section
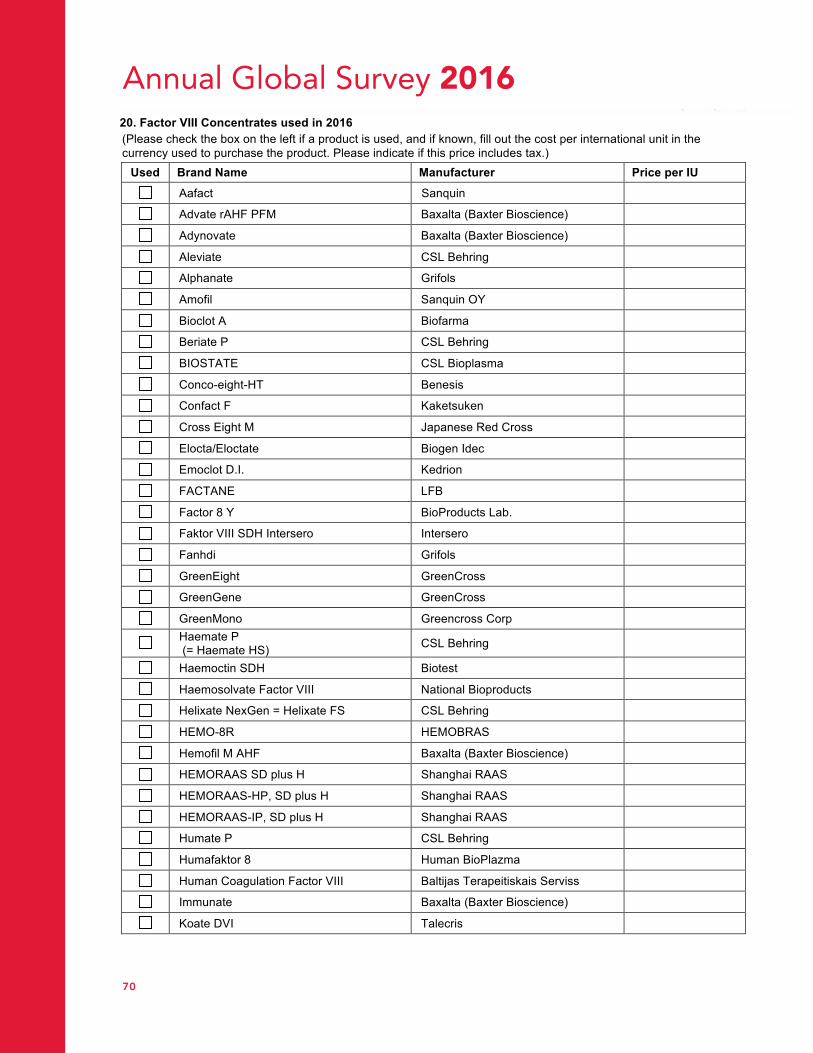
Annual Global Survey 2016
70
7
20. Factor VIII Concentrates used in 2016
(Please check the box on the left if a product is used, and if known, fill out the cost per international unit in the currency used to purchase the product. Please indicate if this price includes tax.)
Used Brand Name Manufacturer Price per IU
Aafact Sanquin
Advate rAHF PFM Baxalta (Baxter Bioscience)
Adynovate Baxalta (Baxter Bioscience)
Aleviate CSL Behring
Alphanate Grifols
Amofil Sanquin OY
Bioclot A Biofarma
Beriate P CSL Behring
BIOSTATE CSL Bioplasma
Conco-eight-HT Benesis
Confact F Kaketsuken
Cross Eight M Japanese Red Cross
Elocta/Eloctate Biogen Idec
Emoclot D.I. Kedrion
FACTANE LFB
Factor 8 Y BioProducts Lab.
Faktor VIII SDH Intersero Intersero
Fanhdi Grifols
GreenEight GreenCross
GreenGene GreenCross
GreenMono Greencross Corp
Haemate P
(= Haemate HS) CSL Behring
Haemoctin SDH Biotest
Haemosolvate Factor VIII National Bioproducts
Helixate NexGen = Helixate FS CSL Behring
HEMO-8R HEMOBRAS
Hemofil M AHF Baxalta (Baxter Bioscience)
HEMORAAS SD plus H Shanghai RAAS
HEMORAAS-HP, SD plus H Shanghai RAAS
HEMORAAS-IP, SD plus H Shanghai RAAS
Humate P CSL Behring
Humafaktor 8 Human BioPlazma
Human Coagulation Factor VIII Baltijas Terapeitiskais Serviss
Immunate Baxalta (Baxter Bioscience)
Koate DVI Talecris

Annual Global Survey 2016 Annual Global Survey 2016
71
8
Kogenate FS = KOGENATE Bayer (in EU) Bayer
Monoclate P CSL Behring
Novoeight NovoNordisk
Nuwiq Octapharma
Octanate Octapharma
Octanativ-M Octapharma
Octavi SD Octapharma
Octofactor Generium/Pharmstandart
Optivate Bio Products Laboratory
FVIII by Quimbiotec Quimbiotec
Recombinate rAHF Baxalta (Baxter Bioscience)
ReFacto AF Pfizer (Wyeth)
Replenate Bio Products Laboratory
TBSF purity factor, Koate DVI Grifols
UNC Hemoderivados Laboratorio de Hemoderivados de Universidad Nacional de Córdoba
Voncento CSL Behring
Western Province factor8 VIAHF Western Province Blood transfusion Service
Wilate Octapharma
Xyntha Pfizer (Wyeth)
Other:
PLEASE NOTE: For “Other”, please provide the Brand Name and Manufacturer.
21. Factor IX Concentrates used in 2016 (Please check the box on the left if a product is used, and if known, fill out the cost per international unit in your currency.)
Used Brand Name Manufacturer Price per IU
Aimafix Kedrion
AlphaNine SD Grifols
Alprolix Biogen Idec
BeneFIX Wyeth
Berinin-P = Berinin HS CSL Behring
BETAFACT LFB
Christmassin-M Benesis
Clotnine Hemarus
Factor IX Grifols Grifols
Faktor IX SDN Biotest
Fixnove Baxalta (Baxter Bioscience)
Hemo-B-RAAS Shanghai RAAS
Haemonine Biotest
Humafactor IX Kedrion
Immunine Baxalta (Baxter Bioscience)

Annual Global Survey 2016
72
9
MonoFIX-VF CSL Bioplasma
Mononine CSL Behring
Nanofix Octapharma
Nanotiv Octapharma
Nonafact Sanquin
Novact M Kaketsuken
Octafix Octapharma
Octanine F Octapharma
Replenine – VF BioProducts Lab.
Rixubis Baxalta (Baxter Bioscience)
Other:
PLEASE NOTE: For “Other”, please provide the Brand Name and Manufacturer.
22. Prothrombin Complex Concentrates used in 2016 (Please check the box on the left if a product is used, and if known, fill out the cost per international unit in your currency.)
Used Brand Name Manufacturer Price per IU
Bebulin VH Baxalta (Baxter Bioscience)
Beriplex P/N CSL Behring
Cofact Sanquin
Facnyne Greencross Corp
Haemosolvex Factor IX National Bioproducts
HT DEFIX SNBTS
Kanokad Confidex LFB
KASKADIL LFB
Octaplex Octapharma
PPSB-HT Nihon Pharmaceutical
PPSB-human SD/Nano 300/600 German Red Cross NSTOB
Profilnine SD Grifols
Proplex – T Baxalta (Baxter Bioscience)
Prothrombinex PXT CSL Bioplasma
Prothrombinex- VF CSL Bioplasma
Prothromplex-T Baxalta (Baxter Bioscience)
Prothroraas Shanghai RAAS
UMAN Complex D.I. Kedrion
Other:
PLEASE NOTE: For “Other”, please provide the Brand Name and Manufacturer. 23. Other Products used in 2016 (Please check the box on the left if a product is used, and if known, fill out the cost per international unit in your currency.)
Used Brand Name Manufacturer Price per IU
Aryoseven Aryogen

Annual Global Survey 2016 Annual Global Survey 2016
73
10
Byclot (1.5mg) Kaketusken
Ceprotin Baxalta (Baxter Bioscience)
Clottafact Wilstart LFB
Clottagen (fibrinogen) LFB
Coagil 7 (activated factor VII) Pharmstandard Price per vial:
Vial size:
FACTEUR VII LFB
Factor VII Baxalta (Baxter Bioscience)
Factor VII Bio Products
Factor X P Behring CSL Behring
Factor XI Bio Products
FEIBA Baxalta (Baxter Bioscience)
Fibrinogen HT Benesis
Fibrogammin P (=Fibrogammin
HS) (Factor XIII) CSL Behring
FIBRORAAS (fibrinogen) Shanghai RAAS
Haemocomplettan P =
Haemocomplettan HS (fibrinogen) CSL Behring
HEMOLEVEN (Factor XI) LFB
Kovaltry Bayer
NovoSeven (=Niastase) (activated factor VII) NovoNordisk
Price per vial:
Vial size:
Riastap CSL Behring
Tretten rXIII NovoNordisk
WILFACTIN (Von Willebrand Factor) LFB
Other:
PLEASE NOTE: For “Other”, please provide the Brand Name and Manufacturer.
Please return to: Email: [email protected] Fax: 514-875-8916 Address: World Federation of Hemophilia
1425 René Lévesque Boulevard West, suite 1010 Montréal, Québec, H3G 1T7 Canada
Please provide your feedback on the WFH Annual Global Survey data collection system.
Comments:
9
MonoFIX-VF CSL Bioplasma
Mononine CSL Behring
Nanofix Octapharma
Nanotiv Octapharma
Nonafact Sanquin
Novact M Kaketsuken
Octafix Octapharma
Octanine F Octapharma
Replenine – VF BioProducts Lab.
Rixubis Baxalta (Baxter Bioscience)
Other:
PLEASE NOTE: For “Other”, please provide the Brand Name and Manufacturer.
22. Prothrombin Complex Concentrates used in 2016 (Please check the box on the left if a product is used, and if known, fill out the cost per international unit in your currency.)
Used Brand Name Manufacturer Price per IU
Bebulin VH Baxalta (Baxter Bioscience)
Beriplex P/N CSL Behring
Cofact Sanquin
Facnyne Greencross Corp
Haemosolvex Factor IX National Bioproducts
HT DEFIX SNBTS
Kanokad Confidex LFB
KASKADIL LFB
Octaplex Octapharma
PPSB-HT Nihon Pharmaceutical
PPSB-human SD/Nano 300/600 German Red Cross NSTOB
Profilnine SD Grifols
Proplex – T Baxalta (Baxter Bioscience)
Prothrombinex PXT CSL Bioplasma
Prothrombinex- VF CSL Bioplasma
Prothromplex-T Baxalta (Baxter Bioscience)
Prothroraas Shanghai RAAS
UMAN Complex D.I. Kedrion
Other:
PLEASE NOTE: For “Other”, please provide the Brand Name and Manufacturer. 23. Other Products used in 2016 (Please check the box on the left if a product is used, and if known, fill out the cost per international unit in your currency.)
Used Brand Name Manufacturer Price per IU
Aryoseven Aryogen
Annual Global Survey 2016
74
Glossary of termsBernard-Soulier syndrome: A severe congenital bleeding disorder characterized by thrombocytopenia and large platelets, due to a defect in the platelet glycoprotein 1b/V/IX receptor.
Cryoprecipitate: A fraction of human blood prepared from fresh plasma. Cryoprecipitate is rich in factor VIII, von Willebrand factor, and fibrinogen (factor I). It does not contain factor IX.
Desmopressin (DDAVP): A synthetic hormone used to treat most mild cases of von Willebrand disease and mild hemophilia A. It is administered intravenously or by subcutaneous injection or by intranasal spray.
Factor concentrates: These are fractionated, freeze-dried preparations of individual clotting factors or groups of factors derived from donated blood.
Glanzmann’s thrombasthenia: A severe congenital bleeding disorder in which the platelets lack glycoprotein IIb/IIIa, the blood platelet count is normal, but their function is very abnormal.
Hemophilia A: A condition resulting from factor VIII deficiency, also known as classical hemophilia.
Hemophilia B: A condition resulting from factor IX deficiency, also known as Christmas disease.
Hemophilia treatment centre: A specialized medical centre that provides diagnosis, treatment, and care for people with hemophilia and other inherited bleeding disorders.
HIV: Human immunodeficiency virus. The virus that causes AIDS.
Identified person: A living person known to have hemophilia, von Willebrand disease, or another bleeding disorder.
Inhibitors: A PWH has inhibitors when their body’s immune system attacks the molecules in factor concentrate, rendering it ineffective.
International Unit (IU): A standardized measurement of the amount of factor VIII or IX contained in a vial. Usually marked on vials as 250 IU, 500 IU, 1000 IU or 2000 IU.
Mild hemophilia: Condition resulting from a level of factor VIII or factor IX clotting activity below normal but above 5% of normal activity in the bloodstream. (National definitions differ on the upper limit for mild hemophilia, ranging from 24% to 50%. The normal range of factor VIII or IX is 50 to 200%)
Moderate hemophilia: Condition resulting from a level of factor VIII or factor IX clotting activity between 1 to 5 % of normal activity in the bloodstream.
Plasma-derived products: Factor concentrates that contain factor VIII or IX that have been fractionated from human blood.
PWH: Person with hemophilia
Recombinant products: Factor concentrates that contain factor VIII or IX that have been artificially produced and are, therefore, not derived from human blood.
Registry: A database or record of identified people with hemophilia or inherited bleeding disorders. A registry includes information on personal details, diagnosis, treatment and complications.
Severe hemophilia: Condition resulting from a level of factor VIII or factor IX clotting activity of less than 1 % in the bloodstream.
von Willebrand disease (VWD): An inherited bleeding disorder resulting from a defect or deficiency of von Willebrand factor.
Annual Global Survey 2016 Notes

Notes