annual budget fy 2018-2019
TRANSCRIPT

ANNUAL BUDGETFY 2018-2019
Zika
Dengue Fever
Chikungunya
FINAL
West Nile virus

MISSION STATEMENT & VALUES
OF THE
GREATER LOS ANGELES COUNTY VECTOR CONTROL DISTRICT
The Greater Los Angeles County Vector Control District is a California government and public health service agency. Our mission is to reduce populations of vectors
(mosquitoes, black flies, and midges) below nuisance levels; to prevent human infection associated with mosquito-transmitted diseases; to guard against human infection and
discomfort associated with other vector-transmitted diseases; and to prevent the loss of property value and commercial enterprise as the result of vector occurrence and activity.
Santa Fe Springs Sylmar
1

GREATER LOS ANGELES COUNTY VECTOR CONTROL DISTRICT
FISCAL YEAR 2018-2019 BUDGET
Table of Contents Page
Mission Statement 1
Table of Contents 2
Letter of Transmittal 3
Accomplishments ` 5
Goals & Objectives 9
FY 17/18 vs. FY 18/19 Budget 11
District Organizational Chart 17
Personnel Summary 18
Budget Summaries 19
District Overview 23
Executive & Administrative Services 30
Scientific-Technical Services 35
Operations 39
Community Affairs 44
Facilities & Maintenance 49
Board of Trustees 54
Other Funds 56
Employee Development & Training Plan 57
FY 2017-2018 Budget Recap 66
Five Year Projections 72
FY 18/19 Salary Schedule 85
2

May 10, 2018
To: Mark Bollman, President, Board of Trustees Steven Appleton, Chair, Budget & Finance Committee Members of the GLACVCD Board of Trustees
Re: Fiscal Year 18/19 Budget
I am pleased to submit the Greater Los Angeles County Vector Control District’s Proposed FY 18/19 Budget to the Board of Trustees for review and adoption. As in previous years, this budget was developed in collaboration with each department head using a “bottoms up” approach that ensures management accountability. Strategic planning sessions were held with management staff beginning in late 2017 to discuss the needs and challenges of maintaining current service levels to our communities, particularly with the permanent integration of an invasive Aedes mosquito control program and the development of an urban stormwater monitoring and control program. Staff capacity and resources have not kept pace with the surge in workload, resulting in thousands of hours of overtime in 2017; and trends indicate those hours will continue to climb this year. While the future of the Zika virus threat is unclear, public health officials across the state and country agree that new, exotic threats, such as dengue and chikungunya, are only a plane ride away. Agencies must work to build vector control, surveillance and public education capacity.
In order to stay ahead of these demands, staff propose a 34% increase in the District budget. Revenue and expenditures are estimated at $16,447,354, up from $12,237,200 in FY 17/18. The estimated benefit assessment would be $12.79 per single family home, or an increase of $3.82.
Highlights of the FY 18/19 Budget include the following:
1. The addition of 15 regular, full-time staff across departments and 10 seasonalmosquito control technicians.
2. 15 new field vehicles for additional staff and to continue the replacement ofaging vehicles in the fleet.
3. A 3% cost of living adjustment for all full-time, non-contract employees isproposed. The CPI-W over the past year (March to March) was approximately3.89%. Incremental increases will keep staff wages competitive and increaseretention and recruitment.
GREATER LOS ANGELES COUNTY VECTOR CONTROL DISTRICT
12545 Florence Avenue, Santa Fe Springs, CA 90670 Office (562) 944-9656 Fax (562) 944-7976
Email: [email protected] Website: www.glacvcd.org PRESIDENT GENERAL MANAGER Mark W. Bollman, Cerritos Truc Dever
VICE PRESIDENT Baru Sanchez, Cudahy SECRETARY-TREASURER Steven Appleton, Los Angeles
ARTESIA Sally Flowers BELL Ali SalehBELL GARDENS Pedro Aceituno BELLFLOWER Sonny R. Santa InesBURBANK Dr. Jeff D. Wassem CARSON Elito M. Santarina COMMERCE Leonard Mendoza DIAMOND BAR Steve Tye DOWNEY Robert Kiefer GARDENA Dan Medina GLENDALE Jerry Walton HAWAIIAN GARDENS Barry Bruce HUNTINGTON PARK Marilyn Sanabria LA CAÑADA FLINTRIDGE Leonard Pieroni LA HABRA HEIGHTS Catherine Houwen LAKEWOOD Steve Croft LA MIRADA Larry P. Mowles LONG BEACH Emily Holman LOS ANGELES COUNTY Steven A. Goldsworthy LYNWOOD Salvador Alatorre MAYWOOD Eddie De La Riva MONTEBELLO Avik Cordeiro NORWALK Leonard Shryock PARAMOUNT Dr. Tom Hansen PICO RIVERA Bob J. Archuleta SAN FERNANDO Raymin Herrera SAN MARINO Scott T. Kwong SANTA CLARITA Heidi Heinrich SANTA FE SPRINGS Luis Gonzalez SIGNAL HILL Robert D. Copeland SOUTH EL MONTE Hector Delgado SOUTH GATE Denise Diaz WHITTIER Josué Alvarado
A CALIFORNIA GOVERNMENTAL AGENCY PROMOTING COMMUNITY HEALTH, COMFORT AND WELFARE THROUGH EFFECTIVE AND RESPONSIVE VECTOR CONTROL SINCE 1952
3

May 10, 2018 Page 2 of 2
4. Capital Improvements estimated at $58,500 for the Santa Fe Springs facility including the repair of the parking lot, rekeying the facility and repair of perimeter fencing. An additional $9,000 is requested in Sylmar for a split system air conditioning unit for the laboratory cold room.
5. The District seeks to transition to a Cloud-based server system to increase security and back-up capabilities for the information technology infrastructure and District databases. Simultaneously, a Cloud voice-over IP phone system will be implemented that will allow for better customer service center capabilities for front-line staff. Conversion to these systems would require the assistance of consultants to work at the direction of the District’s Information Technology Administrator. The conversion to cloud technologies and associated consultant fees are estimated to be $35,400.
6. The development and roll-out of the Operational field data collection system using hand-held tablets is near completion. Updated field tablets and activation of cellular service will be rolled out across all operational teams.
7. $600,000 would be allocated to fund the OPEB CERBT Trust annual required contribution (ARC).
8. $300,000 will be allocated to Capital Designated Reserves to plan for future capital improvements and facility expansion projects.
9. This budget would continue employer paid short term disability benefits to all full-time, regular staff.
We believe the additional staffing and equipment will allow us to serve our residents and protect the health of the public more effectively for years to come. Aedes mosquitoes are making LA County their permanent residence and we must be prepared for the additional bite pressure and health risks associated with this invasive species. At the same time, we must keep West Nile virus from reaching epidemic levels. This year’s budget will give staff the support and resources they need to continue as leaders in the national fight against mosquito-borne illnesses. I respectfully submit this budget proposal to you for your review and consideration. Sincerely,
Truc Dever General Manager
4

GREATER LOS ANGELES COUNTY VECTOR CONTROL DISTRICT
2017-2018 Accomplished District Goals and Objectives
Executive/Administration
1. Continue updating articles in District Employee Handbook to be compliant with new laws and regulations. (In-progress)
The District is working with labor attorneys at Liebert Cassidy Whitmore to finalize revisions which are to be completed early in the new fiscal year.
2. Administer “out-of-agency” service agreement with City of Vernon and evaluate vector control needs within the city. (Completed and On-going)
The service agreement is a two-year contract which the District is billing for on a quarterly basis.
3. Complete the replacement of PC hard drives in old computers to be proactive to hardware failures. (Completed and On-going)
4. Complete roll-out of new asset tracking software system. (Postponed) Assessing software needs and transitioning project to new Facilities and Fleet
Maintenance Supervisor. 5. Continue to research new methods to protect the District’s information systems from
hacking and ransomware. (Completed and On-going) The District will transition to cloud-based server which provides better security,
support and back-up capabilities. Scientific-Technical Services
1. Evaluate efficacy of traditional applications of the IGR pyriproxyfen to residential backyard sources (Completed)
Efficacy of pyriproxyfen applications to typical backyard source containers made of glass, plastic and terracotta was evaluated
Control of Cx. quinquefasciatus mosquitoes was achieved for greater than 30 days.
2. Evaluate efficacy and residual time Natular 2EC applications in USDS (On-going) 3. Evaluate VectoMax FG applications in swimming pools (Completed)
Granular applications to swimming pools turned out to be extremely susceptible to surface water wind movement, resulting in inadequate treatment efficacy and shortened residual times
4. Evaluate efficacy and residual time of commercially available “Mosquito Dunks” (B.t.i.) before recommendation to residents (Completed)
Product quality inconsistencies resulted in a decision not to recommend “Mosquito Dunks” to residents and facility maintenance crews
5. Conduct truck-mounted applications of Duet (adulticide) and VectoBac WDG (larvicide) to determine their potential use to control a possible outbreak of Zika, chikungunya or dengue in Los Angeles County. (In progress)
5

Weather conditions, WNV activity and Aedes workload demands on staff did not allow these trials to move forward.
6. Continue to maintain high standards for surveillance of adult mosquitoes, wild bird serology and sentinel chicken surveillance. (Completed and On-going)
2,032 mosquito samples were submitted for testing 772 sentinel chicken blood samples were collected and submitted for testing 176,810 adult mosquitoes were collected in 14,412 trap-nights and were identified
to species 1904 field collected larval samples were processed and surveyed for invasive
Aedes species presence All data collected was continuously entered into in-house and statewide databases
Operations
1. Implement field data collection program using tablets for our USD routes and zones. (Completed)
The tablets are deployed and collecting data 2. Develop and integrate electronic mapping for all USD tablet applications. (Completed)
The mapping applications are greatly appreciated by the staff and facilitates navigation to treatment sites
3. Develop strategy and program for mapping, identifying and inspecting stormwater best management practices (BMPs). (Completed)
Stormwater capture device data and locations are being entered into the data base
4. Finalize and integrate the swimming pool protocol with our abatement procedures. (Completed)
Notices and documentation are in line with our abatement process 5. Establish an Aedes team based in our Sylmar facility. (Completed)
Significant Aedes work is done in the San Fernando Valley with the team 6. Evaluate the efficiency and effectiveness of a four month rotation by each USD team in
an assigned zone. (Completed) Based on our findings, a three month rotation is more efficient and effective
7. Develop a documentation system for all cross training, special equipment and specialty assignments involving Operational VCS. (Completed)
Cross training, special equipment and specialty assignment activities are being captured in the tablet
Community Affairs
1. Utilizing survey/assessment tools, evaluate revised educational outreach programs for their efficacy at a) conveying key information to students and parents, b) adequately addressing STEAM and California Science Standards, and c) energizing young ‘public health heroes’ and science enthusiasts. (Completed and on-going)
Staff will continue to collect surveys from schools and teachers regarding the
6

revised curriculum until the close of the 2017-2018 school year. To date, teachers have provided overwhelmingly high praise for the new program and curriculum. Evaluation of student impact will continue into the 2018-2019 school year.
2. Expand partnerships with LA County Emergency volunteers, faith-based entities, homeless advocates, Promotores, LA Zoo, LA Cube, and others to promote WNV and Zika prevention. (Completed and on-going)
LA County Emergency Volunteers Participated in numerous joint outreach exercises with emergency volunteers
and public health nurses throughout the LA area. Additional events and exercises planned through the summer to strengthen emergency response readiness.
Faith-Based Outreach Trained and provided attendees at regional Los Angeles Interfaith meeting
with toolkit and outreach materials to reach parishioners. Homeless Participated in Supervisorial District 5 public health update targeting highest
risk populations for Hepatitis A, WNV, Zika, and targeted outreach activities. Repellent will be distributed
Promotores Continuing work with Promotores network. In 2017, staff participated in
additional training meetings and hosted a workshop at the Annual Promotores Conference. Worked with LA County DPH on deployment of additional teams in June 2018.
LA Zoo / LA Cube LA Zoo Camp partnership is ongoing. Provided educational content for
2017 “Griffith Park Gone Wild” summer camp program and partnering for 2018.
Scheduling “Mobile Madness” event at LA Cube for fall 2018 3. Expand use of highly successful social and digital media to provide targeted
information to communities and those at highest risk. (Completed and on-going) 11.4% increase in the number of visits to the District’s website 11.3% growth in followers on District social media sites 50% reduction in paid digital media reach. Heavy workload prevented
dedication of time to this program 4. Develop assessment tool to quantify success of behavior change outreach
activities targeting source reduction and mosquito prevention activities. (In-progress) Due to workload, in-house assessments were not completed. Surveys conducted by LA County DPH as part of their targeted outreach
pilot program showed an increase in awareness and knowledge, but little behavior change.
5. Increase outreach and public understanding about safety and efficacy of various repellents and pesticides used in or recommended for use by vector control to reduce risks of vector-borne disease transmission. (Completed and on-going) Added Public Health Pesticides page to districts website discussing and
7

providing links to product information. A list of FAQs was included to address common concerns.
Working with MVCAC Integrated Vector Management and Public Relations committees on speaking points.
Worked on year-long UC Integrated Pest Management, and Department of Pesticide Regulation-funded “Pests, Pesticides, and IPM” project, and presented at the culminating Statewide IPM Summit.
Facilities & Maintenance
1. Hire new Facilities and Fleet Maintenance Supervisor to oversee and coordinate maintenance projects at both Santa Fe Springs and Sylmar facilities. (Completed)
Fernando Martinez was hired as the new Facilities and Fleet Maintenance Supervisor.
2. Review standard operating procedures for vehicle maintenance and determine whether repairs are to be performed in-house or by an outside vendor. (On-going)
3. Integrate Collective Data System software into all aspects of fleet maintenance and data entry work flow. (Completed)
4. Research and implement new option for fuel purchase and management system given phasing out of Mobil speed passes. (Completed)
Staff have transitioned to Mobil fuel cards and implemented procedures for storing and securing them.
Additional Accomplishments
1. Updated audio-visual equipment and voting system in Boardroom. 2. Auctioned retired fleet vehicles for a profit of $16,558. 3. Installation and implementation of Verizon Fleet GPS system to both Santa Fe Springs
and Sylmar fleets. 4. Installation and upgrade to fiber for faster internet speeds at both Santa Fe Springs and
Sylmar facilities without incurring installation costs, for a savings of more than $15,000.
8

GREATER LOS ANGELES COUNTY VECTOR CONTROL DISTRICT
2018-2019 District Goals and Objectives
Executive/Administration
1. Complete and adopt revised District Employee Handbook. 2. Complete LAFCO applications to annex gaps in LA County currently without vector
control services. 3. Transition to cloud-based servers and IP phone systems at both facilities. 4. Complete roll-out of new asset tracking software system 5. Hire and integrate new GIS/IT Coordinator into the information technology work flow. 6. Implement a new applicant tracking system and hire additional positions across the
District. 7. Develop a Records Retention Policy and implement a Document Management System for
archiving and compliance. 8. Develop and implement a District Workers’ Compensation guide.
Scientific-Technical Services
1. Evaluate the effectiveness of truck mounted Wide Area Liquid Larvicide Sprays (WALLS) of VectoBac WDG to reduce Culex quinquefasciatus abundance and WNV risk within treatment areas.
2. Evaluate field applications of DeltaGard with handheld ULVs to reduce adult Aedes abundance and assess potential resistance concerns through bioassays
3. Evaluate the efficacy of Altosid P35 applications to sumps, drains, clarifiers and stormwater BMPs.
4. Evaluate a plant watering drip system for timed applications of surface oils in stormwater BMPs with high water exchange rates.
5. Conduct methoprene resistance testing of Culex quinquefasciatus populations. 6. Evaluate the effectiveness of mosquito exclusion measures implemented at Boulevard
Park infiltration gallery in Lakewood. 7. Continue to maintain high standards for surveillance of adult mosquitoes, wild bird
serology and sentinel chicken surveillance. Operations
1. Improve existing tablet applications and incorporate new features. 2. Deliver Service Requests directly to field tablets to improve response time. 3. Export Operations data to the CalSurv Gateway to take advantage of Tableau reporting
tools. 4. Establish a program to identify the location and condition of stormwater BMP’s in the
District and establish a treatment strategy.
9

5. Standardize work vehicle layouts for maximum efficiency in the field. 6. Evaluate the gutter treatment protocols and routes to improve efficiency. 7. Develop a written holistic SOP (standard operating procedure) for swimming pools. 8. Evaluate the effectiveness of mosquito exclusion in high flow trash capture devices.
Community Affairs
1. Significantly increase attendance at community fairs, council meetings, and other public venues with continued increased emphasis on Los Angeles and San Fernando Valley communities.
2. Increase presence and use of NextDoor to better target and respond to residents’ questions/concerns.
3. Increase outreach to local legislative offices and LA City and County representatives, and partner to share information with their constituents.
4. Increase use of novel outreach modalities (video, music, digital polls) to target unique user groups, motivate change, and evaluate knowledge and actions taken to reduce risks.
5. Evaluate options for elementary outreach programs to expand reach and incorporate additional grade levels.
Facilities & Maintenance
1. Hire a one additional Maintenance Mechanic to assist with the growing fleet and maintenance needs.
2. Addition of new parking stalls at the Santa Fe Springs facility during the process of repairing and sealing of parking lot.
3. Install dedicated air conditioning unit to cold storage room at the Sylmar facility. 4. Install insulation and a dividing curtain in Maintenance Mechanic area at the Sylmar
facility, in order to control extreme climate conditions. 5. Strategize on accommodating new staff work areas at both the Santa Fe Springs and
Sylmar facilities.
10

BUDGET 17/18 VS. BUDGET 18/19FY 18/19 BUDGET
Column A Column B (Col. B-Col. A)
REVENUE 2017-18 2018-19Budget Budget Variance
PropertySecured, Current 1,672,000 1,690,000 18,000 Unsecured, Current 1,600 1,600 - Secured, Prior (7,800) (7,800) - Unsecured, Prior 600 600 -
Supplemental Property - Current 25,000 25,000 - Prior 4,000 4,000 - Other Fines, Forfeitures & Penalties 73,000 73,000 - Interest (LA County Account) 15,000 15,000 - Other State-In-Lieu Taxes 6,100 6,100 - Homeowners Prop Tax Relief 1,500 1,500 - Intergovernmental Revenue-State - - - Intergovernmental Revenue-Other 4,000 4,000 - Miscellaneous Receipts 136,600 120,000 (16,600) Black Fly Assessment 92,000 92,000 - General Assessment 10,213,600 14,422,354 4,208,754
Total Revenue 12,237,200 16,447,354 4,210,154
Column A Column B (Col. B-Col. A)
Budget Summary 2017-18 2018-19Budget Budget Variance
Salaries & Benefits 9,197,655 11,080,098 1,882,443 Operational Expenditures 1,959,096 2,525,484 566,388 Facilities Maintenance 239,240 281,200 41,960 Board of Trustees 53,580 53,125 (455) Other Expenditures 739,939 886,603 146,664 Reserves - 900,000 900,000 Capital Outlay 47,689 720,845 673,156
Total Expenditures 12,237,200 16,447,354 4,210,155
NET INCOME - (0) (1)
11

BUDGET 17/18 VS. BUDGET 18/19FY 18/19 BUDGET
Personnel Summary
Full-time Positions Column A Column B (Col. B-Col. A)
Account Expenditure 2017-18 2018-19Number Classification Budget Budget Variance
Salaries5005 General Manager/CEO 164,029 170,568 6,539 5010 Director of Human Resources 106,288 109,473 3,185 5015 Director of Fiscal Operations 106,288 109,473 3,185 5017 Information Technology Administrator 98,632 101,587 2,955 5055 GIS/IT Coordinator - 67,940 67,940 5020 Human Resources Assistant 60,159 61,961 1,802 5025 District Secretary 55,494 57,165 1,671 5018 Accounting Clerk 59,398 63,357 3,959 5019 Benefits Specialist - 66,410 66,410 5030 Operations Assistant (2) 102,002 105,060 3,058 5035 Director of Operations 112,906 116,295 3,389 5040 Operations Supervisor (3) 282,210 292,598 10,388 5050 Vector Control Specialist (49) 3,136,084 3,640,370 504,286 5052 Database Analyst 75,573 79,598 4,025 5054 Urban Water Program Manager 94,689 97,533 2,844 5060 Director of Scientific Technical Services 112,906 116,295 3,389 5065 Vector Ecologist (4) 352,771 363,335 10,564 5070 Assistant Vector Ecologist (2) 77,204 159,048 81,844 5071 Field Assistant (2) 76,734 75,025 (1,709) 5073 Director of Community Affairs 109,475 112,760 3,285 5075 Public Information Officer 84,306 86,038 1,732 5085 Community Liaisons (3) - 166,749 166,749 5086 Outreach Assistant 43,712 48,921 5,209 5085 Education Program Coordinators (2) 134,073 141,866 7,793 5090 Maintenance Supervisor 84,469 81,048 (3,421) 5095 Maintenance Mechanic (5) 300,146 379,341 79,195 5100 Seasonal Help (36) 417,792 673,200 255,408 5110 Overtime 22,064 45,500 23,436
Total Salaries 6,269,404 7,588,514 1,319,110
Benefits5115 Sick Payout 65,424 77,326 11,902 5120 Vacation Payout 47,330 67,446 20,116 5130 Medicare & FICA 119,495 154,074 34,579 5133 Short Term Disability - 33,703 33,703 5135 SUI 60,694 73,125 12,431 5140 PERS 1,096,442 1,266,159 169,717 5145 ICMA 401(a) 225,122 235,100 9,978 5150 Health Insurance 1,224,854 1,493,743 268,889 5155 Dental Insurance 77,494 79,512 2,018 5160 Vision Insurance 11,396 11,396 0
- Total Benefits 2,928,251 3,491,584 563,333
Total Salaries & Benefits Expenditures 9,197,655 11,080,098 1,882,443
12

BUDGET 17/18 VS. BUDGET 18/19FY 18/19 BUDGET
Column A Column B (Col. B-Col. A)
Account Expenditure 2017-18 2018-19Number Classification Budget Budget Variance
Operational Expenditures
5210 Chemicals & Compounds 304,600 423,850 119,250 5215 Herbicides - - - 5230 Portable Spray Equipment 18,325 10,650 (7,675) 5260 Support Equipment 14,750 27,960 13,210 5455 Hazardous Waste 7,520 7,520 - 5507 Reference Materials 500 500 - 5510 Lab Supplies & Equipment 6,000 6,000 - 5520 Field Supplies & Equipment 12,000 14,000 2,000 5540 Shipping & Testing 74,500 77,050 2,550 5605 Bank/Finance Charges 1,201 20,000 18,799 5610 Copier Expense 18,000 18,000 - 5615 Computer Consultant 5,400 35,400 30,000 5617 Computer Supplies & Access. 17,870 17,400 (470) 5619 Equipment Repair 1,000 1,000 - 5620 Computer Software 30,250 26,240 (4,010) 5625 Postage 9,150 7,950 (1,200) 5630 Wireless Telephone 38,373 70,870 32,497 5635 GPS Tracking 18,760 21,568 2,808 5640 Website & Email Service 18,600 71,067 52,467 5655 Office Supplies 19,400 23,250 3,850 5660 Printing/Stationary 2,100 3,100 1,000 5665 Payroll Processing Expense 50,000 46,240 (3,760) 5667 Professional/ Temp Services 10,000 50,000 40,000 5670 Legal Services 90,000 110,000 20,000 5680 Auditing Contract 30,000 30,000 - 5683 VCJPA Insurance - Pooled Worker's Compensation 368,032 414,604 46,572 5685 VCJPA Insurance - Pooled Liability Premium 118,339 134,253 15,914 5686 VCJPA Insurance - Pooled Automobile Liability - - - 5687 VCJPA Insurance - Group Property 8,882 18,111 9,229 5690 VCJPA Insurance - Group Fidelity Program 7,504 1,370 (6,134) 5695 VCJPA Insurance - Travel Premium - - - 5700 VCJPA Insurance - General Fund 19,756 22,135 2,379 5703 Earthquake Insurance - 26,600 26,600 5705 Recruitment & Pre-Post Employment Screens 12,000 19,600 7,600 5707 Meeting/Supplies 9,175 11,300 2,125 5730 Tuition Reimbursement 10,000 10,000 - 5735 Continuing Education & Seminars 100,108 105,479 5,371 5745 Manager's Auto Allowance 6,000 6,000 - 5760 Miscellaneous Expense - 150 150 5765 Safety/Management Training 4,360 4,000 (360)
13

BUDGET 17/18 VS. BUDGET 18/19FY 18/19 BUDGET
Column A Column B (Col. B-Col. A)
Account Expenditure 2017-18 2018-19Number Classification Budget Budget Variance
5220 Aerial Support 15,000 22,500 7,500 5270 Miscellaneous Part & Repair 500 600 100 5310 Foot Wear 13,200 17,400 4,200 5315 Gloves 490 715 225 5320 Coveralls 250 800 550 5325 Uniform Cleaning 34,055 38,100 4,045 5330 Towels Supply & Cleaning 7,826 10,720 2,894 5335 Uniform Caps 3,626 5,980 2,354 5340 Uniform Accessories 200 970 770 5345 Work Apparel 4,145 9,120 4,975 5350 Logo Patches 2,800 900 (1,900) 5355 Shields 560 1,625 1,065 5357 Staff Year Pins 250 1,200 950 5360 Protective Safety Equipment 12,400 17,600 5,200 5375 Mosquito Fish Supplies & Eq 2,000 2,500 500 5400 Maint. Parts Electric 9,000 9,000 - 5410 Vehicle Registration & Fees - - - 5415 Brake and Suspension 10,000 10,000 - 5420 Tires, Wheels & Alignment 17,000 17,000 - 5430 Cooling Sys. Parts & Supplies 6,000 6,000 - 5435 Body Repair 10,000 10,000 - 5445 Fabrication Supplies 3,500 3,500 - 5456 Engine and Transmission Overhaul 25,000 20,000 (5,000) 5475 Trans Chassis & Drive 10,000 10,000 - 5480 Engine 15,000 15,000 - 5485 Fuel 189,225 251,915 62,690 5457 Smog Checks 2,500 2,500 - 5460 First Aid 1,100 18,500 17,400 5499 Misc. Maint Parts & Supplies 15,000 23,900 8,900 5637 Two Way Radios 1,025 1,025 - 5675 Advertising 30,000 30,000 - 5720 Permits & Fees 8,080 12,020 3,940 5727 Certification Renewals 9,409 12,877 3,468 5765 Public Info Video - - - 5770 Public Information Materials & Equipment - - - 5775 Photography Expenses 2,500 1,300 (1,200) 5785 Ed Materials & Supplies - - - 5787 Promotional & Ed. Materials 20,500 32,500 12,000 5769 Supplies and Equipment 4,500 4,500 - 5790 Public Exhibit - - - 5793 Media Monitoring Services - - - 5795 Mobile Education Unit 10,000 10,000 - 5815 Janitorial Supplies - - - 6035 Furniture & Fixtures - - -
Total Operational Expenditures 1,959,096 2,525,484 566,388
14

BUDGET 17/18 VS. BUDGET 18/19FY 18/19 BUDGET
Column A Column B (Col. B-Col. A)
Account Expenditure 2017-18 2018-19Number Classification Budget Budget Variance
Facilities Maintenance
5333 Floor Mats 1,300 1,300 - 5755 Kitchen Supplies 1,300 1,450 150 5800 Irrigation - - - 5810 Landscape Maint. 25,000 25,000 - 5815 Janitorial Maint. 23,500 27,500 4,000 5820 Pond & Fountain 500 500 - 5825 Interior & Exterior Supplies 20,000 40,750 20,750 5850 HVAC 18,000 18,000 - 5855 Fixtures & Hardware 6,000 19,500 13,500 5870 Security Alarm 2,600 2,600 - 5875 Telephone 6,800 12,600 5,800 5877 Internet 29,240 18,000 (11,240) 5880 Utilities 80,000 80,000 - 5885 Water 21,000 23,000 2,000 5890 Waste Disposal 4,000 11,000 7,000
Total Facilities Maintenance Expenditures 239,240 281,200 41,960
Column A Column B (Col. B-Col. A)
Account Expenditure 2017-18 2018-19Number Classification Budget Budget Variance
Capital Outlay6010 Vehicle Purchases - 472,000 472,000 6035 Furniture & Fixtures 2,950 18,800 15,850 6015 Machinery & Equipment 12,950 37,745 24,795 6011 Vehicle Setup 2,950 76,000 73,050 6020 Spray Equipment 1,000 7,900 6,900 6025 Lab Equipment - - - 6031 Computer Equipment 22,840 40,900 18,060 6036 Capital Improvements 5,000 67,500 62,500
Total Capital Outlay 47,690 720,845 673,155
15

BUDGET 17/18 VS. BUDGET 18/19FY 18/19 BUDGET
Column A Column B (Col. B-Col. A)
Account Expenditure 2017-18 2018-19Number Classification Budget Budget Variance
Board of Trustees Operational Expenditures
5710 Trustee-in-Lieu 38,200 38,200 - 5715 Board Meeting Expenses 6,200 6,200 - 5735 Continuing Education & Seminars 9,180 8,725 (455)
Total Operational Expenditures 53,580 53,125 (455)
Column A Column B (Col. B-Col. A)
Account Expenditure 2017-18 2018-19Number Classification Budget Budget Variance
5170 Retirees Insurance 317,652 428,714 111,062 5645 Memberships 29,055 31,889 2,834 5671 NPDES Monitoring Costs - - - 5672 CEQA Fees - - - 5701 Property Tax Administration Cost 48,232 380,000 331,768 5702 L A County Property Tax Administrative Charges 345,000 46,000 (299,000)
Total Operational Expenditures 739,939 886,603 146,664
Column A Column B (Col. B-Col. A)
2017-18 2018-19RESERVES Budget Budget Variance
MEU Vehicle Replacement - - - Capital Reserve Fund - 300,000 300,000 Annuitant Health Care Unfunded Liability - 600,000 600,000 Emergency Vector Control - - -
Total Reserves - 900,000 900,000
16

Effective July 2018
General Manager
Director of
Scientific-
Technical Services
Director of
Fiscal
Operations
Director of
Operations
Operations
Supervisor
(SFS)
Operations Supervisor
(Sylmar)
Operations Supervisor
(USD)
District Secretary
Human Resources
Assistant
Director of
Community
Affairs
Public
Information
Officer
Education
Program
Coordinators
Assistant Vector
Ecologists
Vector
Control
Specialists
Vector
Control
Specialists
Board of Trustees
Information
Technology
Administrator
Accounting
Clerk
Database
Analyst
Field
Assistants
Operations
Assistants
Urban Water Program
Manager
Maintenance
Mechanics
Facilities and
Fleet
Maintenance
Supervisor
Director of
Human
Resources
Vector
Ecologists
Outreach
Assistant
Lead, Vector
Control
Specialists
Lead, Vector
Control
Specialists
Vector
Control
Specialists
Lead, Vector
Control
Specialists
Benefit
Specialist
GIS/IT
Coordinator
Community
Liaisons
GREATER LOS ANGELES COUNTY VECTOR CONTROL DISTRICT
Organizational Chart
17

2016-2017 Actual
2017-2018 Actual
2018-2019 Proposed
General Manager 1 1 1 1
District Secretary 1 1 1 1
Information Technology Administrator1 1 1 1
GIS/IT Coordinator - - - 1
Director of Community Affairs 1 1 1 1
Community Outreach Liaison - - - 3
Education Program Coordinator 2 2 2 2
Outreach Assistant - 1 1 1
Public Information Officer 1 1 1 1
Facilities and Fleet Maintenance Supervisor
1 1 1 1
Maintenance Mechanic 4 4 4 5
Director of Fiscal Operations 1 1 1 1
Accounting Clerk 1 1 1 1
Director of Human Resources 1 1 1 1
Benefit Specialist - - - 1
Human Resources Assistant 1 1 1 1
Director of Operations 1 1 1 1
Database Analyst 1 1 1 1
Operations Assistant 2 2 2 2
Operations Supervisor 2 2 2 2
Operations Supervisor (USD) 1 1 1 1
Vector Control Specialist 25 26 26 32
Vector Control Specialist USD 15 15 15 17
Urban Water Program Manager 1 1 1 1
Director of Scientific-Technical Services
1 1 1 1
Field Assistant 2 2 2 2
Vector Ecologist 4 4 4 4
Assistant Vector Ecologist 1 1 1 2
Total: 72 74 74 89
Personnel Summary2015-2016
ActualFull-Time Staff
18

Executive & Scientific Operations Community Maintenance Board of Other Funding Reserves SummaryFY 2018-19 Administrative Tech Services Affairs Trustees
Salaries & Benefits 1,141,960 1,095,358 7,371,019 805,195 666,565 - - 11,080,098 Maintenance & Operations 570,854 192,295 1,325,194 175,401 542,940 53,125 886,603 900,000 4,646,412 Capital Outlay 17,500 110,500 433,795 71,300 87,750 - - 720,845
Totals 1,730,314 1,398,153 9,130,009 1,051,895 1,297,254 53,125 886,603 900,000 16,447,354
BUDGET SUMMARIES
11% 9%
56%
6%
8% 0% 5% 5%
2018-19 Budget
Executive & Administrative
Scientific Tech Services
Operations
Community Affairs
Maintenance
Board of Trustees
Other Funding
Reserves
19

DISTRICT REVENUE AND EXPENDITURE SUMMARY FY 18/19BUDGET
REVENUE 2014-15 2015-16 2016-17 2017-18 2018-19Actual Actual Actual Estimated Budget
PropertySecured, Current 1,423,709 1,596,760 1,689,097 1,700,719 1,690,000 Unsecured, Current - - - - 1,600 Secured, Prior (7,755) (748) (18,402) (8,630) (7,800) Unsecured, Prior (598) (1,166) 572 5,400 600
Supplemental PropertyCurrent 26,863 37,178 39,829 31,444 25,000 Prior 3,570 4,094 4,603 4,800 4,000 Other Fines, Forfeitures & Penalties 86,556 76,641 51,694 56,680 73,000 Interest (LA County Account) 2,208 3,450 18,275 10,226 15,000 Other State-In-Lieu Taxes 10,098 7,420 10,042 4,492 6,100 Homeowner Prop Tax Relief - 3,010 - 1,500 1,500 Intergovernmental Revenue-State - - - 1,500 - Intergovernmental Revenue-Other 18,659 1,925 8,692 - 4,000 Miscellaneous Receipts 116,357 209,902 153,348 274,829 120,000 Black Fly Assessment 90,000 90,000 92,000 92,000 92,000 General Assessment 8,651,469 8,588,153 10,129,135 10,149,239 14,422,354
Total Revenue 10,421,136 10,616,619 12,178,884 12,324,198 16,447,354
EXPENDITURES 2014-15 2015-16 2016-17 2017-18 2018-19Actual Actual Actual Estimated Budget
Salaries & Benefits 7,660,947 7,977,279 8,401,800 8,690,012 11,080,098 Maintenance & Operations 2,251,681 2,347,294 2,461,063 2,928,291 3,746,412 Capital Outlay 134,113 740,469 - 223,680 720,845 Restricted and Designated Reserves 730,000 910,000 - - 900,000
Total Expenditures 10,776,740 11,975,042 10,862,863 11,841,983 16,447,354
NET INCOME (355,604) (1,358,423) 1,316,021 482,215 (0)
20

DISTRICT REVENUE AND EXPENDITURE SUMMARY FY 18/19BUDGET
2014-15 2015-16 2016-17 2017-18 2018-19CASH FLOW ACCOUNTS (UNRESTRICTED) Actual Actual Actual Estimated Budget
L.A.I.F. Cash Flow 6,226,884 5,904,201 6,379,046 6,634,735 - Banc of California (Payroll and Accounts Payable) 152,959 250,379 315,352 270,720 -
Total Fund Balances 6,379,843 6,154,580 6,694,398 6,905,455 -
2014-15 2015-16 2016-17 2017-18 2018-19RESTRICTED RESERVE ACCOUNTS Actual Actual Actual Estimated Budget
County Treasurer Fund 119,972 136,816 133,986 154,183 - VCJPA Member Contingency Fund 521,757 672,311 812,241 887,171 - VCJPA Property Contingency Fund 50,682 50,703 51,602 51,400 -
Total Fund Balances 692,411 859,830 997,829 1,092,754 -
2014-15 2015-16 2016-17 2017-18 2018-19DESIGNATED RESERVE ACCOUNTS (L.A.I.F.) Actual Actual Actual Estimated Budget
MEU Vehicle Replacement 125,000 125,000 255,000 - - Emergency Disease Reserve 1,150,000 1,150,000 1,150,000 1,200,000 - Vehicle Replacement 200,000 200,000 200,000 200,000 Capital Designated Reserves 500,000 500,000 500,000 485,850 - *OPEB Designated Reserves 1,250,696 1,000,696 900,696 250,696 - Operations Designated Reserves 400,000 400,000 400,000 400,000 -
Total Fund Balances 3,625,696 3,375,696 3,405,696 2,536,546 -
2014-15 2015-16 2016-17 2017-18 2018-19GRAND TOTALS OF FUND BALANCES Actual Actual Actual Estimated Budget
Grand Total of Fund Balances 10,697,950 10,390,106 11,097,922 10,534,755 -
21

DISTRICT REVENUE AND EXPENDITURE SUMMARY FY 18/19BUDGET
2014-15 2015-16 2016-17 2017-18 2018-19*DESIGNATED RESERVE ACCOUNTS (L.A.I.F.) Actual Actual Actual Estimated Budget
Retirement Benefits Reserves Beginning Balance 1,445,696 1,250,696 1,000,696 900,696 - Increases in Retirement Benefits 430,000 350,000 500,000 - - Decrease in Reserves to Fund OPEB 625,000 600,000 600,000 600,000 -
Retirement Benefits Reserves Ending Balance 1,250,696 1,000,696 900,696 300,696 -
2014-15 2015-16 2016-17 2017-18 2018-19RESERVES FUNDING Actual Actual Actual Estimated Budget
Capital Designated Reserves 50,000 360,000 - - 300,000 Operations Designated Reserves - - - - - Retirement Benefits Designated Reserves 430,000 500,000 - - 600,000 MEU Replacement Restricted Reserves - - - - - Vehicle Replacement 200,000 - - Emergency Vector Control Restricted Reserves 50,000 50,000 - - -
Total Annual Reserves Funding 730,000 910,000 - - 900,000
22

REVENUE AND EXPENDITURE HISTORY
2014-15 2015-16 2016-17 2017-18 2018-19Actual Actual Actual Estimated Budget
Total Revenue 10,421,136 10,616,619 12,178,884 12,324,198 16,447,354
Total Expenditures 10,776,740 11,975,042 10,862,863 11,841,983 16,447,354
- 2,000,000 4,000,000 6,000,000 8,000,000
10,000,000 12,000,000 14,000,000 16,000,000 18,000,000
2014-15
2015-16
2016-17
2017-18
2018-19
Mon
etar
y A
mou
nts
Fiscal Years
Revenue vs. Expenditures
Total Revenue
Total Expenditures
23

DISTRICT EXPENDITURES SUMMARY FY 18/19 BUDGET
Budget Summary 2014-15 2015-16 2016-17 2017-18 2018-19Actual Actual Actual Estimated Budget
Salaries & Benefits 7,660,947 7,977,279 8,308,485 8,690,012 11,080,098 Operational Expenditures 1,403,911 1,488,700 1,569,089 1,900,382 2,525,484 Facilities Maintenance 213,544 203,972 211,880 250,909 281,200 Board of Trustees 44,232 39,707 41,595 49,963 53,125 Other Expenditures 591,435 614,871 638,034 727,037 886,603 Restricted and Designated Reserves 730,000 910,000 - - 900,000 Capital Outlay 134,114 740,469 - 223,680 720,845
Total Expenditures 10,778,182 11,974,998 10,769,083 11,841,983 16,447,354
24

DISTRICT EXPENDITURES SUMMARY FY 18/19 BUDGET
Personnel Summary
Full-time PositionsAccount Expenditure 2014-15 2015-16 2016-17 2017-18 2018-19Number Classification Actual Actual Actual Estimated Budget
Salaries5005 General Manager/CEO 155,065 156,049 161,571.10 164,104 170,568 5010 Director of Human Resources 91,831 99,500 104,721.80 106,261 109,473 5015 Director of Fiscal Operations 100,423 103,078 104,721.80 106,262 109,473 5017 Information Technology Administrator 93,209 95,662 97,189.79 98,607 101,587 5020 Human Resources Assistant 56,826 58,339 58,197.74 58,349 61,961 5025 District Secretary 52,152 53,634 54,881.31 55,084 57,165 5018 Accounting Clerk 47,692 51,032 54,788 57,959 63,357 5019 Benefit Specialist - - - - 66,410 5030 Operations Assistant (2) 95,662 99,282 100,508 104,301 105,060 5035 Director of Operations 106,689 109,503 111,266 112,860 116,295 5040 Operations Supervisor (3) 267,674 275,499 256,377 270,924 292,598 5050 Vector Control Specialist (49) 2,632,785 2,745,392 2,871,816 2,896,230 3,640,370 5052 Database Analyst 60,590 65,672 70,383 75,461 79,598 5054 Urban Water Program Manager - - - 94,650 97,533 5055 GIS/IT Coordinator - - - - 67,940 5060 Director of Scientific Technical Services 106,689 109,503 111,266 112,860 116,295 5065 Vector Ecologist (4) 332,525 342,112 345,622 352,683 363,335 5070 Assistant Vector Ecologist (2) 72,958 74,874 76,063 77,183 159,048 5071 Field Assistant (2) 35,207 59,379 62,126 68,295 75,025 5073 Director of Community Affairs 99,966 106,170 107,874 109,429 112,760 5075 Public Information Officer 71,311 77,470 82,953 67,684 86,038 5084 Community Liaisons (3) - - - - 166,749 5086 Outreach Assistant 12,477 14,366 25,755 42,582 48,921 5085 Education Program Coordinators (2) 129,015 124,741 119,498 114,311 141,866 5090 Facilities and Fleet Maintenance Supervisor 79,801 81,917 44,206 41,269 81,048 5095 Maintenance Mechanic (5) 269,479 273,839 290,594 292,015 379,341 5100 Seasonal Help (36) 271,249 244,425 286,079 375,458 673,200 5110 Overtime 7,024 15,215 25,779 37,051 45,500
Total Salaries 5,248,297 5,436,654 5,624,236 5,891,873 7,588,514
Benefits5115 Sick Payout 102,839 125,324 104,845 63,306 77,326 5120 Vacation Payout 68,960 95,762 68,607 67,203 67,446 5130 Medicare & FICA 94,978 88,272 99,200 116,534 154,074 5133 Short Term Disability - - - 14,528 33,703 5135 SUI 42,426 43,956 43,811 49,334 73,125 5140 PERS 897,526 905,930 978,785 1,085,653 1,266,159 5145 ICMA 401(a) 236,797 232,444 230,250 216,395 235,100 5150 Health Insurance 882,627 960,604 1,073,309 1,093,918 1,493,743 5155 Dental Insurance 74,750 76,407 73,676 79,599 79,512 5160 Vision Insurance 11,747 11,927 11,767 11,670 11,396
Total Benefits 2,412,651 2,540,625 2,684,249 2,798,139 3,491,584
Total Salaries & Benefits Expenditures 7,660,947 7,977,278 8,308,485 8,690,012 11,080,098 25

DISTRICT EXPENDITURES SUMMARY FY 18/19 BUDGET
Account Expenditure 2014-15 2015-16 2016-17 2017-18 2018-19Number Classification Actual Actual Actual Estimated Budget
Operational Expenditures
5210 Chemicals & Compounds 218,927 219,931 241,314 293,278 423,850 5215 Herbicides - - - - - 5230 Portable Spray Equipment 2,151 4,004 2,116 16,564 10,650 5260 Support Equipment 12,038 12,672 8,833 10,834 27,960 5455 Hazardous Waste 5,272 13,936 5,072 6,052 7,520 5507 Reference Materials 267 412 37 100 500 5510 Lab Supplies & Equipment 5,823 6,431 4,482 4,505 6,000 5520 Field Supplies & Equipment 13,396 10,000 8,869 14,166 14,000 5540 Shipping & Testing 33,790 67,861 45,751 76,607 77,050 5605 Bank/Finance Charges 1,071 1,586 1,247 2,162 20,000 5610 Copier Expense 16,628 17,605 15,147 16,241 18,000 5615 Computer Consultant 1,908 - 1,550 - 35,400 5617 Computer Supplies & Access. 10,412 6,637 8,437 17,033 17,400 5619 Equipment Repair - - 32 500 1,000 5620 Computer Software 37,991 14,343 7,943 27,563 26,240 5625 Postage 4,239 3,466 2,619 7,822 7,950 5630 Wireless Telephone 30,679 17,907 27,180 36,857 70,870 5635 GPS Tracking 13,811 15,689 15,673 17,761 21,568 5640 Website & Email Service 22,447 12,121 14,561 17,267 71,067 5655 Office Supplies 15,963 16,551 18,862 16,523 23,250 5660 Printing/Stationary 1,029 872 1,533 4,172 3,100 5665 Payroll Processing Expense 32,865 40,464 41,177 45,228 46,240 5667 Professional/ Temp Services 3,908 18,086 10,000 - 50,000 5668 Lawsuit Settlement - - - 50,683 - 5670 Legal Services 59,025 51,418 86,834 93,034 110,000 5680 Auditing Contract 18,495 22,951 23,745 23,233 30,000 5683 VCJPA Insurance - Pooled Worker's Compensation 235,876 345,028 361,348 367,687 414,604 5685 VCJPA Insurance - Pooled Liability Premium 102,714 104,644 113,314 119,367 134,253 5686 VCJPA Insurance - Pooled Automobile Liability - - - - - 5687 VCJPA Insurance - Group Property 6,648 6,366 22,387 16,069 18,111 5690 VCJPA Insurance - Group Fidelity Program 1,119 1,131 1,200 1,212 1,370 5695 VCJPA Insurance - Travel Premium 388 - - - - 5700 VCJPA Insurance - General Fund 19,240 20,339 18,756 19,572 22,135 5704 Earthquake Insurance - - - - 26,600 5705 Recruitment & Pre-Post Employment Screens 10,337 7,791 12,638 12,623 19,600 5707 Meeting/Supplies 6,155 7,456 7,763 8,544 11,300 5730 Tuition Reimbursement 2,275 2,005 7,255 6,000 10,000 5735 Continuing Education & Seminars 52,479 72,089 84,450 100,442 105,479 5745 Manager's Auto Allowance 6,000 6,000 6,000 6,000 6,000 5760 Miscellaneous Expense - 44 94 - 150 5765 Safety/Management Training 1,600 4,492 1,568 2,300 4,000
26

DISTRICT EXPENDITURES SUMMARY FY 18/19 BUDGET
Account Expenditure 2014-15 2015-16 2016-17 2017-18 2018-19Number Classification Actual Actual Actual Estimated Budget
5220 Aerial Support - - - 15,000 22,500 5270 Miscellaneous Part & Repair 370 368 275 275 600 5310 Foot Wear 6,566 5,482 8,881 11,026 17,400 5315 Gloves 19 35 16 445 715 5320 Coveralls 150 103 - 250 800 5325 Uniform Cleaning 26,525 29,238 33,165 29,864 38,100 5330 Towels Supply & Cleaning 6,589 6,474 7,511 8,084 10,720 5335 Uniform Caps - 422 784 3,625 5,980 5340 Uniform Accessories - 97 46 200 970 5345 Work Apparel 1,391 1,960 1,726 4,224 9,120 5350 Logo Patches 780 - 145 900 900 5355 Shields - 161 - 280 1,625 5357 Staff Year Pins - 1,024 893 - 1,200 5360 Protective Safety Equipment 5,642 10,362 9,881 12,258 17,600 5375 Mosquito Fish Supplies & Eq 1,148 1,654 1,965 2,001 2,500 5400 Maint. Parts Electric 9,455 15,290 10,257 10,763 9,000 5410 Vehicle Registration & Fees - - - - - 5415 Brake and Suspension 9,998 8,412 6,451 8,076 10,000 5420 Tires, Wheels & Alignment 17,560 11,806 13,247 19,350 17,000 5430 Cooling Sys. Parts & Supplies 5,438 4,224 5,439 7,180 6,000 5435 Body Repair 9,817 6,395 5,836 5,708 10,000 5445 Fabrication Supplies 9,363 12,312 14,381 3,961 3,500 5456 Engine & Transmission Overhaul 9,862 1,229 258 17,791 20,000 5475 Trans Chassis & Drive 6,557 2,949 8,877 7,177 10,000 5480 Engine 14,918 14,611 14,716 16,061 15,000 5485 Fuel 172,575 110,089 111,220 160,248 251,915 5457 Smog Checks 3,643 736 2,258 2,201 2,500 5460 First Aid 714 310 377 500 18,500 5499 Misc. Maint Parts & Supplies 12,487 16,954 14,685 14,981 23,900 5637 Two Way Radios 195 304 364 525 1,025 5675 Advertising 25,800 19,528 27,952 29,121 30,000 5720 Permits & Fees 4,526 8,242 11,420 7,697 12,020 5727 Certification Renewals 6,600 7,080 - 9,516 12,877 5765 Public Info Video - - - - - 5770 Public Information Materials & Equipment - - - - - 5775 Photography Expenses - 229 948 723 1,300 5785 Ed Materials & Supplies - 10 121 - - 5787 Promotional & Ed. Materials 19,933 19,934 15,656 18,283 32,500 5769 Supplies & Equipment 2,041 3,922 2,754 2,698 4,500 5790 Public Exhibit 403 544 5,427 25 - 5793 Media Monitoring Services 773 65 - - - 5795 Mobile Education Unit 5,111 13,818 994 10,100 10,000 5815 Janitorial Supplies - - 376 1,264 -
Total Operational Expenditures 1,403,913 1,488,700 1,569,089 1,900,382 2,525,484
27

DISTRICT EXPENDITURES SUMMARY FY 18/19 BUDGET
Account Expenditure 2014-15 2015-16 2016-17 2017-18 2018-19Number Classification Actual Actual Actual Estimated Budget
Facilities Maintenance
5333 Floor Mats 1,572 1,328 1,527 1,585 1,300 5755 Kitchen Supplies 901 1,213 1,053 1,629 1,450 5800 Irrigation - - - - - 5810 Landscape Maint. 17,223 17,013 20,120 25,356 25,000 5815 Janitorial Maint. 21,082 21,215 21,350 28,870 27,500 5820 Pond & Fountain 786 578 1,121 289 500 5825 Interior & Exterior Supplies 20,278 19,283 20,982 20,497 40,750 5850 HVAC 16,846 20,629 13,377 13,180 18,000 5855 Fixtures & Hardware 1,927 1,408 6,711 6,897 19,500 5870 Security Alarm 2,682 4,199 2,878 3,055 2,600 5875 Telephone 5,599 6,160 7,440 8,951 12,600 5877 Internet 14,391 19,727 23,866 29,944 18,000 5880 Utilities 82,612 61,033 63,403 75,819 80,000 5885 Water 19,891 19,972 19,158 22,908 23,000 5890 Waste Disposal 7,753 10,215 8,894 11,932 11,000
Total Facilities Maintenance Expenditures 213,544 203,972 211,880 250,909 281,200
Account Expenditure 2014-15 2015-16 2016-17 2017-18 2018-19Number Classification Actual Actual Actual Estimated Budget
Capital Outlay6010 Vehicle Purchases 122,354 496,279 - - 472,000 6035 Furniture & Fixtures 4,180 1,878 - 3,700 18,800 6015 Machinery & Equipment 3,996 678 - 13,387 37,745 6011 Vehicle Setup - 25,181 - 2,993 76,000 6020 Spray Equipment - - - 1,001 7,900 6025 Lab Equipment - - - - - 6030 Public Information Equipment - 6031 Computer Equipment 3,584 18,249 - 17,598 40,900 6036 Capital Improvements - 198,203 - 185,000 67,500
Total Capital Outlay 134,114 740,469 - 223,680 720,845
28

DISTRICT EXPENDITURES SUMMARY FY 18/19 BUDGET
Account Expenditure 2014-15 2015-16 2016-17 2017-18 2018-19Number Classification Actual Actual Actual Estimated Budget
Board of Trustees Operational Expenditures
5710 Trustee-in-Lieu 33,700 30,300 33,450 35,136 38,200 5715 Board Meeting Expenses 5,877 4,529 5,288 5,102 6,200 5735 Continuing Education & Seminars 4,655 4,877 2,858 9,725 8,725
Total Operational Expenditures 44,232 39,707 41,595 49,963 53,125
Account Expenditure 2014-15 2015-16 2016-17 2017-18 2018-19Number Classification Actual Actual Actual Estimated Budget
5170 Retirees Insurance 216,070 232,185 260,911 308,489 428,714 5645 Memberships 23,365 18,642 23,614 33,114 31,889 5671 NPDES Monitoring Costs - 241 - - - 5672 CEQA Fees - - - - - 5701 Property Tax Administration Cost 22,411 40,301 34,833 42,851 46,000 5702 L A County Property Tax Administrative Charges 329,589 323,503 318,676 342,583 380,000
Total Operational Expenditures 591,435 614,871 638,034 727,037 886,603
2014-15 2015-16 2016-17 2017-18 2018-19RESERVES Actual Actual Actual Estimated Budget
Capital Designated Reserves 50,000 360,000 - - 300,000 Operations Designated Reserves - - - - - Retirement Benefits Designated Reserves 430,000 500,000 - - 600,000 MEU Replacement Restricted Reserves - - - - - Vehicle Replacement 200,000 - - Emergency Vector Control Restricted Reserves 50,000 50,000 - - -
Total Reserves 730,000 910,000 - - 900,000
29

EXECUTIVE & ADMINISTRATIVE SERVICES DEPARTMENT
Department Overview The District’s Executive & Administrative Services Department is comprised of the Board of Trustees, General Manager, Legal Counsel, Director of Fiscal Operations, Director of Human Resources, Information Technology Administrator, Accounting Clerk, Human Resources Assistant, and District Secretary. The addition of a Benefit Specialist and GIS/IT Coordinator is proposed for FY 18/19. The thirty-six member Board of Trustees represents thirty-five cities and areas of unincorporated Los Angeles County. The Board is responsible for setting policy, approving the annual budget, and approving expenditures of the District. The General Manager is hired by the Board of Trustees and is responsible for overseeing the daily operations of the District. Administrative services include fiscal operations, payroll, human resources, risk management, information technology, and general office support.
Budget Highlights Cloud-based Server: The District seeks to transition to a Cloud-based server system to increase security and back-up capabilities for the information technology infrastructure and District databases. Simultaneously, a Cloud voice-over IP phone system will be implemented that will allow for better customer service center capabilities for front-line staff. OPEB Funding: $600,000 would be allocated to fund the OPEB CERBT Trust annual required contribution (ARC). Applicant Tracking System (ATS) With the influx of staff demands, an applicant tracking system will increase and attract top-notch applicants to the District and onboard new hires with up-to-date technology specific to the public sector. This system will allow us to navigate through our recruitment process for hiring purposes through the Internet and retain hiring documents electronically. This digital retention of records will relieve storage space across the District and supports “green” initiatives by going completely paperless. Keenan Benefit Bridge The Benefit Bridge offers a secure portal that acts as a single gateway which integrates benefit enrollment, eligibility, employee communication, billing and reconciliation and self-service tools to maximize the effectiveness of plans and resources. Benefit Bridge enables employees to get answers to many typical benefits inquiries and transactions through self-service access and helps maintain accurate plan documentation. It further streamlines insurance carrier eligibility and premium remittance processing.
30

DEPARTMENT SUMMARYEXECUTIVE AND ADMINISTRATIVE SERVICES
Budget Summary
2014-15 2015-16 2016-17 2017-18 2018-19Actual Actual Actual Estimated Budget
Salaries & Benefits 876,626 921,782 949,443 965,150 1,141,960 Operational Expenditures 302,911 304,245 344,705 418,540 570,854 Capital Outlay 2,479 14,773 - 10,139 17,500
Total Expenditures 1,182,017 1,240,800 1,294,148 1,393,830 1,730,314
-
200,000
400,000
600,000
800,000
1,000,000
1,200,000
Actual Actual Actual Estimated Budget
2014-15 2015-16 2016-17 2017-18 2018-19
Exp
end
itu
res
Fiscal Years
Executive & Administrative Services
Salaries & Benefits
Operational Expenditures
Capital Outlay
31

DEPARTMENT SUMMARYEXECUTIVE AND ADMINISTRATIVE SERVICES
FY 18/19 BUDGET
Budget Summary 2014-15 2015-16 2016-17 2017-18 2018-19Actual Actual Actual Estimated Budget
Salaries & Benefits 876,626 921,782 949,443 965,150 1,141,960 Operational Expenditures 302,911 304,245 344,705 418,540 570,854 Capital Outlay 2,479 14,773 - 10,139 17,500
Total Expenditures 1,182,017 1,240,800 1,294,148 1,393,830 1,730,314
Personnel Summary
Full-time PositionsAccount Expenditure 2014-15 2015-16 2016-17 2017-18 2018-19Number Classification Actual Actual Actual Estimated Budget
Salaries5005 General Manager/CEO 155,065 156,049 161,571 164,104 170,568 5010 Director of Human Resources 91,831 99,500 104,722 106,261 109,473 5015 Director of Fiscal Operations 100,423 103,078 104,722 106,262 109,473 5017 Information Technology Administrator 93,209 95,662 97,190 98,607 101,587 5055 GIS/IT Coordinator - - - - 67,940 5020 Human Resources Assistant 56,826 58,339 58,198 58,349 61,961 5025 District Secretary 52,152 53,634 54,881 55,084 57,165 5018 Accounting Clerk 47,692 51,032 54,788 57,959 63,357 5019 Benefit Specialist - - - - 66,410 5110 Overtime - - - - -
Total Salaries 597,198 617,294 636,071 646,627 807,933
Benefits5115 Sick Payout 11,634 17,486 13,017 8,691 6,500 5120 Vacation Payout 9,063 9,310 6,765 9,050 3,600 5130 Medicare & FICA 8,862 9,102 9,418 10,089 11,715 5133 Short Term Disability - - - 1,396 3,423 5135 SUI 3,038 3,038 3,038 2,621 4,473 5140 PERS 93,701 109,577 118,121 128,235 151,934 5145 ICMA 401(a) 25,443 25,155 26,314 27,034 26,944 5150 Health Insurance 119,416 121,584 127,240 121,754 116,324 5155 Dental Insurance 7,102 8,041 8,265 8,350 7,860 5160 Vision Insurance 1,168 1,194 1,194 1,304 1,254
Total Benefits 279,429 304,488 313,372 318,523 334,027
Total Salaries & Benefits Expenditures 876,626 921,782 949,443 965,150 1,141,960
32

DEPARTMENT SUMMARYEXECUTIVE AND ADMINISTRATIVE SERVICES
FY 18/19 BUDGET
Account Expenditure 2014-15 2015-16 2016-17 2017-18 2018-19Number Classification Actual Actual Actual Estimated Budget
Operational Expenditures
5507 Reference Materials 267 412 - - 300 5605 Bank/Finance Charges 1,071 1,586 1,247 2,162 20,000 5610 Copier Expense 16,628 17,605 15,147 16,241 18,000 5615 Computer Consultant - - - - 30,000 5617 Computer Supplies & Access. 6,934 3,693 5,405 5,113 5,200 5619 Equipment Repair - - - 500 - 5620 Computer Software 32,904 8,270 1,550 6,196 7,500 5625 Postage 3,896 3,096 2,577 3,917 4,000 5630 Wireless Telephone 17,048 3,804 3,950 1,767 2,880 5640 Website & Email Service 8,665 11,374 11,599 16,214 68,367 5655 Office Supplies 9,314 10,004 9,633 7,404 11,000 5660 Printing/Stationary 1,029 872 1,393 3,022 2,500 5665 Payroll Processing Expense 32,865 40,464 41,177 45,228 46,240 5345 Work Apparel 160 110 224 194 250 5357 Staff Year Pins - 1,024 893 - 1,200 5667 Professional/ Temp Services 2,359 16,537 10,000 - 50,000 5668 Lawsuit Settlement - - - 50,683 - 5670 Legal Services 59,025 51,418 86,834 93,034 110,000 5680 Auditing Contract 18,495 22,951 23,745 23,233 30,000 5683 VCJPA Insurance - Pooled Worker's Compensation 26,206 38,333 44,084 44,858 44,993 5685 VCJPA Insurance - Pooled Liability Premium 11,412 11,626 13,824 14,825 14,569 5686 VCJPA Insurance - Pooled Automobile Liability - - - - - 5687 VCJPA Insurance - Group Property 739 707 2,731 1,960 1,965 5690 VCJPA Insurance - Group Fidelity Program 124 126 146 148 149 5695 VCJPA Insurance - Travel Premium 388 - - - - 5700 VCJPA Insurance - General Fund 2,138 2,260 2,288 2,388 2,402 5705 Recruitment & Pre-Post Employment Screens 10,337 7,791 12,638 12,623 19,600 5707 Meeting/Supplies 5,980 6,941 7,100 8,269 10,200 5720 Permits & Fees 2,713 - 1,041 55 2,900 5725 Certification Renewals 120 120 - 134 150 5730 Tuition Reimbursement 2,275 2,005 7,255 6,000 10,000 5735 Continuing Education & Seminars 22,223 30,581 30,560 44,074 46,489 5745 Manager's Auto Allowance 6,000 6,000 6,000 6,000 6,000 5760 Miscellaneous Expense - 44 94 - - 5765 Safety/Management Training 1,600 4,492 1,568 2,300 4,000
Total Operational Expenditures 302,911 304,245 344,705 418,540 570,854
33

DEPARTMENT SUMMARYEXECUTIVE AND ADMINISTRATIVE SERVICES
FY 18/19 BUDGET
Account Expenditure 2014-15 2015-16 2016-17 2017-18 2018-19Number Classification Actual Actual Actual Estimated Budget
Capital Outlay
6035 Furniture & Fixtures - - - - - 6015 Machinery & Equipment - 678 - 2,656 - 6031 Computer Equipment 2,479 14,095 - 7,484 17,500
Total Capital Outlay 2,479 14,773 - 10,139 17,500
34

SCIENTIFIC-TECHNICAL SERVICES DEPARTMENT
Department Overview The Scientific-Technical Services Department is responsible for the surveillance program, monitoring vector abundance and vector-borne disease occurrence, as well as all technical aspects of the overall control program. The department is comprised of a Scientific-Technical Services Director, four Vector Ecologists, two Assistant Vector Ecologists, as well as two Laboratory Field Assistants. The disease surveillance program serves as an early warning system in the detection of mosquito-borne viruses that can infect people and animals. Testing for the presence of viruses and pathogens in mosquitoes, sentinel chickens, and dead birds helps identify disease transmission before human cases occur. The Vector Ecologists are also involved in the development and assessment of control strategies. They are responsible for conducting studies to evaluate new treatment methods, improve control efficacy and monitor for pesticide resistance. The Department continues to collaborate with the University of California, Davis and the California Department of Public Health on studies surrounding emerging vector and disease issues.
Budget Highlights Staffing – The Department is currently staffed with a Department Director, four Vector Ecologists, one Assistant Vector Ecologist and two Laboratory Field Assistants. Due to the continued spread of three invasive Aedes species and the potential disease risk their presence poses for Los Angeles County residents, the workload for scientific-technical staff has increases dramatically. At the same time, the department head has been pulled further away from performing field related activities as more time is needed for collaboration with State and County health officials to prepare our response to the emerging disease risk. The Santa Fe Springs office is thus in need for an Assistant Vector Ecologist to fill in the resulting gap and to ensure equal coverage in both offices. Shipping and Testing – Besides staff salaries and benefits, this account is generally the largest part of the scientific-technical budget. In recent years increased early season mosquito activity combined with the potential for early onset of WNV amplification and transmission have been the norm. This line item accommodates for some early season mosquito testing for WNV, as well as to allow for the potential testing for chikungunya, dengue, Zika and Yellow fever in the invasive Aedes populations, in case of the occurrence of local transmission of these diseases.
35

DEPARTMENT SUMMARYSCIENTIFIC TECHNICAL SERVICES
2018-2019 BUDGET
Budget Summary
2014-15 2015-16 2016-17 2017-18 2018-19Actual Actual Actual Estimated Budget
Salaries & Benefits 807,705 874,539 898,231 921,648 1,095,358 Operations 121,126 160,802 158,450 186,910 192,295 Capital Outlay - 1,115 - 1,000 110,500
Total Expenditures 928,830 1,036,456 1,056,681 1,109,558 1,398,153
-
200,000
400,000
600,000
800,000
1,000,000
1,200,000
Actual Actual Actual Estimated Budget
2014-15 2015-16 2016-17 2017-18 2018-19
Exp
endi
ture
s
Fiscal Years
Scientific-Technical Services
Salaries & Benefits
Operations
Capital Outlay
36

DEPARTMENT SUMMARYSCIENTIFIC-TECHNICAL SERVICES
FY 18/19 BUDGET
Budget Summary
2014-15 2015-16 2016-17 2017-18 2018-19Actual Actual Actual Estimated Budget
Personnel 807,705 874,539 898,231 921,648 1,095,358 Operations 121,126 160,802 158,450 186,910 192,295 Capital Outlay - 1,115 - 1,000 110,500
Total Expenditures 928,830 1,036,456 1,056,681 1,109,558 1,398,153
Personnel Summary
Full-time PositionsAccount Expenditure 2014-15 2015-16 2016-17 2017-18 2018-19Number Classification Actual Actual Actual Estimated Budget
Salaries5060 Director of Scientific Technical Services (1) 106,689 109,503 111,266 112,860 116,295 5065 Vector Ecologist (4) 332,525 342,112 345,622 352,683 363,335 5070 Assistant Vector Ecologist (1) 72,958 74,874 76,063 77,183 159,048 5071 Field Assistant (2) 35,207 59,379 62,126 68,295 75,025 5110 Overtime 217 422 722 - 3,400
Total Salaries 547,595 586,291 595,800 611,020 717,103
Benefits5115 Sick Payout 16,614 21,797 16,071 6,106 11,200 5120 Vacation Payout 5,232 9,405 5,346 4,962 7,300 5130 Medicare & FICA 10,305 9,452 8,765 9,379 10,666 5133 Short Term Disability - - - 1,419 3,242 5135 SUI 4,116 5,317 3,997 3,995 4,473 5140 PERS 103,090 107,479 116,014 124,098 147,766 5145 401(a) 35,438 36,157 36,846 38,620 44,360 5150 Health Insurance 74,912 87,879 104,378 109,890 134,683 5155 Dental Insurance 8,827 9,152 9,404 10,412 12,562 5160 Vision Insurance 1,575 1,610 1,610 1,747 2,004
Total Benefits 260,110 288,248 302,432 310,628 378,255
Total Salaries & Benefits Expenditures 807,705 874,539 898,231 921,648 1,095,358
37

DEPARTMENT SUMMARYSCIENTIFIC-TECHNICAL SERVICES
FY 18/19 BUDGET
Account Expenditure 2014-15 2015-16 2016-17 2017-18 2018-19Number Classification Actual Actual Actual Estimated Budget
Operational
5310 Foot Wear 150 - - 66 400 5345 Work Apparel 282 593 39 815 1,000 5350 Logo Patches - - 145 - - 5355 Shields - - - 80 300 5455 Hazardous Waste 704 492 1,017 1,552 1,520 5485 Fuel 14,493 9,124 7,925 10,736 16,370 5507 Reference Materials - - 21 100 200 5510 Lab Supplies & Equipment 5,823 6,431 4,482 4,505 6,000 5520 Field Supplies & Equipment 13,396 10,000 8,869 14,166 14,000 5540 Shipping & Testing 33,790 67,861 45,751 76,607 77,050 5610 Copier Expenses - - - - - 5615 Computer Consultant - - - - - 5617 Computer Supplies & Access - - 71 2,251 1,410 5620 Computer software - - - - - 5625 Postage - 10 - - - 5630 Wireless Phone Service 1,180 1,406 1,341 648 750 5635 GPS Tracking 1,669 1,919 1,939 1,959 1,840 5655 Office Supplies 110 290 136 84 200 5660 Printing/Stationary - - 178 500 - 5667 Professional/Temp Service (USCD Staff) - - - - - 5683 VCJPA Insurance - Pooled Worker's Compensation 23,281 34,054 39,459 40,152 37,074 5685 VCJPA Insurance - Pooled Liability Premium 10,138 10,328 12,374 13,002 12,005 5686 VCJPA Insurance - Pooled Automobile Liability - - - - - 5687 VCJPA Insurance - Group Property 656 628 2,445 1,755 1,619 5690 VCJPA Insurance - Group Fidelity Program 110 112 131 132 123 5700 VCJPA Insurance - General Fund 1,899 2,007 2,048 2,137 1,979 5707 Meeting/Supplies - - - - - 5720 Permits and Fees - 100 180 - - 5727 Certification Renewals 720 840 - 972 1,300 5735 Continuing Education & Seminars 12,724 14,605 29,899 14,691 17,155 5760 Miscellaneous Expense - - - - -
Total Operational Expenditures 121,126 160,802 158,450 186,910 192,295
Capital Outlay
6031 Computer Equipment - 1,115 - - 4,500 6010 Vehicle Purchase - - - - 105,000 6035 Furniture & Fixtures - - - 1,000 1,000 6025 Lab Equipment - - - - -
Total Capital Outlay - 1,115 - 1,000 110,500
38

OPERATIONS DEPARTMENT
Department Overview The Operations Department is responsible for implementing mosquito and vector control and prevention strategies in the field. Long-term mosquito prevention is accomplished by incorporating Integrated Vector Management methodologies, which uses a combination of applied field techniques involving physical, chemical, and biological control methods. Mosquito prevention and management is performed by dedicated Vector Control Specialists who are managed by three supervisors working under the Director of Operations. Two Operations Assistants handle daily administrative tasks for the Operations Department. Field staff are assigned individual zone routes or are part of two-person crews, the Underground Storm Drain team, or Aedes control team. An Urban Water Program Manager oversees stormwater structures, best management practices, and low impact development projects. All full-time operations staff are licensed and certified by the State of California Department of Public Health in pesticide laws and regulations and mosquito biology.
Budget Highlights GIS/IT Coordinator– Mapping has become an important tool in planning and executing operational work and special projects. We have relied on our internal resources, VCS with some mapping knowledge, to create the maps we need on an ad hoc basis. The GIS/IT Coordinator will provide a frame work for evaluating our mapping needs and the tools required, as we go forward. The position will be shared with other departments to produce District wide maps to address each departments mapping needs. The position will also assist the IT department in software and hardware evaluations and implementation. Aedes Program Support – We have enhanced our pesticide budget to address the expansion of the Aedes mosquitoes into other areas in the District. We will also hire 5 full time Vector Control Specialists to replace the full time limited term VCS currently funded through CDC grant money. Staff for Stormwater BMP Survey and Treatment – 2 additional VCS will be added to our USD program to survey and treat various stormwater capture and treatment devices throughout our District. The Supervisor of the USD program will work with the Urban Water Program Manager to establish goals and objectives. A great deal of work will be necessary to determine the scope of work needed to address these structures. Vehicle Purchases - Additional vehicles will be necessary to facilitate our efforts in the field, not only for additional staff, but also for the replacement of aging vehicles based on our vehicle replacement policy. Increase in Mosquito Control Technicians – We will increase our seasonal staff by adding 10 additional Mosquito Control Technicians. Our mosquito control efforts in the gutters were hampered last year because of the sheer volume of Aedes work. Gutters represent a significant source of Culex breeding and have a negative impact on our ability to control WNV.
39

DEPARTMENT SUMMARYOPERATIONS
2018-2019 BUDGET
Budget Summary
2014-15 2015-16 2016-17 2017-18 2018-19Actual Actual Actual Estimated Budget
Personnel 5,055,407 5,212,449 5,588,097 5,830,690 7,371,019 Operations 707,240 746,344 803,869 984,523 1,325,194 Capital Outlay 126,532 521,460 - 6,339 433,795
Total Expenditures 5,889,179 6,480,253 6,391,967 6,821,552 9,130,009
- 1,000,000 2,000,000 3,000,000 4,000,000 5,000,000 6,000,000 7,000,000 8,000,000
Actual Actual Actual Estimated Budget
2014-15 2015-16 2016-17 2017-18 2018-19
Exp
end
itu
res
Fiscal Years
Operations
Personnel
Operations
Capital Outlay
40

DEPARTMENT SUMMARYOPERATIONS
FY 18/19 BUDGET
Budget Summary 2014-15 2015-16 2016-17 2017-18 2018-19Actual Actual Actual Estimated Budget
Salaries & Benefits 5,055,407 5,212,449 5,588,097 5,830,690 7,371,019 Operations 707,240 746,344 803,869 984,523 1,325,194 Capital Outlay 126,532 521,460 - 6,339 433,795
Total Expenditures 5,889,179 6,480,253 6,391,967 6,821,552 9,130,009
Personnel Summary
Full-time PositionsAccount Expenditure 2014-15 2015-16 2016-17 2017-18 2018-19Number Classification Actual Actual Actual Estimated Budget
Salaries5030 Operations Assistant (2) 95,662 99,282 100,508 104,301 105,060 5035 Director of Operations 106,689 109,503 111,266 112,860 116,295 5040 Operations Supervisor (3) 267,674 275,499 256,377 270,924 292,598 5050 Vector Control Specialist (49) 2,632,785 2,745,392 2,871,816 2,896,230 3,640,370 5052 Database Analyst 60,590 65,672 70,383 75,461 79,598 5054 Urban Water Program Manager - - 93,315 94,650 97,533 5100 Seasonal Help (36) 271,249 244,425 286,079 375,458 673,200 5110 Overtime 5,955 12,853 20,191 27,631 36,100
Total Salaries 3,440,604 3,552,626 3,809,934 3,957,516 5,040,755
Benefits5115 Sick Payout 61,550 72,223 66,515 40,385 53,000 5120 Vacation Payout 48,093 69,100 53,246 50,299 52,000 5130 Medicare & FICA 65,302 58,950 71,245 86,712 116,730 5133 Short Term Disability - - - 9,414 22,515 5135 SUI 30,758 30,688 32,436 37,687 57,221 5140 PERS 607,291 589,788 635,158 720,723 814,844 5145 ICMA 401(a) 160,954 155,904 154,756 141,665 153,362 5150 Health Insurance 578,517 620,617 703,235 721,843 997,921 5155 Dental Insurance 54,204 54,326 53,481 56,622 55,160 5160 Vision Insurance 8,133 8,227 8,092 7,824 7,512
Total Benefits 1,614,804 1,659,823 1,778,163 1,873,174 2,330,264
Total Salaries & Benefits 5,055,407 5,212,449 5,588,097 5,830,690 7,371,019
41

DEPARTMENT SUMMARYOPERATIONS
FY 18/19 BUDGET
Account Expenditure 2014-15 2015-16 2016-17 2017-18 2018-19Number Classification Actual Actual Actual Estimated Budget
Operational Expenditures
5210 Chemicals & Compounds 218,927 219,931 241,314 293,278 423,850 5215 Herbicides - - - - - 5220 Aerial Support - - - 15,000 22,500 5230 Portable Spray Equipment 1,822 3,548 1,731 15,811 9,850 5260 Support Equipment 7,354 8,223 8,258 8,550 16,460 5270 Miscellaneous Part & Repair 370 368 275 275 600 5310 Foot Wear 5,850 5,054 8,355 10,057 16,000 5315 Gloves - - - 400 625 5320 Coveralls 150 103 - 250 800 5325 Uniform Cleaning 23,466 25,880 28,359 26,198 35,000 5330 Towels Supply & Cleaning 3,341 2,683 3,506 4,185 7,370 5335 Uniform Caps - 422 784 3,625 5,980 5340 Uniform Accessories - 97 46 200 970 5345 Work Apparel 563 816 1,192 2,184 6,420 5350 Logo Patches 780 - - 900 900 5355 Shields - 161 - 200 1,325 5357 Staff Year Pins - - - - - 5360 Protective Safety Equipment 5,505 10,106 9,484 11,932 17,300 5375 Mosquito Fish Supplies & Eq 1,148 1,654 1,965 2,001 2,500 5485 Fuel 146,735 93,369 98,955 133,740 210,375 5610 Copier Expense - - - - - 5615 Computer Consultant - - 1,550 - 5,400 5617 Computer Supplies & Accessories 2,807 2,894 2,679 7,085 8,450 5619 Equipment Repair - - - - 1,000 5620 Computer Software 2,890 3,466 5,743 16,779 11,940 5630 Wireless Telephone Service 7,948 8,304 17,779 30,430 60,950 5635 GPS Tracking 11,921 13,530 13,494 15,277 18,360 5637 Two Way Radios 195 304 364 525 1,025 5625 Postage - - 38 15 5655 Office Supplies 4,898 5,163 5,532 6,369 8,550 5660 Printing & Stationary - - 140 500 500 5683 VCJPA Insurance - Pooled Worker's Com 157,777 230,789 237,189 241,350 278,711 5685 VCJPA Insurance - Pooled Liability Prem 68,705 69,996 74,379 78,157 90,249 5686 VCJPA Insurance - Pooled Automobile Li - - - - - 5687 VCJPA Insurance - Group Property 4,447 4,258 14,695 10,548 12,175 5690 VCJPA Insurance - Group Fidelity Progra 749 757 788 796 921 5700 VCJPA Insurance - General Fund 12,870 13,605 12,311 12,847 14,880 5707 Meeting/Supplies 144 200 248 275 500 5720 Permits and Fees 440 510 717 1,650 620 5725 Certification Renewals 4,920 5,400 - 7,366 9,735 5735 Continuing Education & Seminars 10,520 14,752 11,999 25,769 22,254 5760 Miscellaneous Expenses - - - - 150 5775 Photography Expenses - - - - -
Total Operational Expenditures 707,240 746,344 803,869 984,523 1,325,194
42

DEPARTMENT SUMMARYOPERATIONS
FY 18/19 BUDGET
Account Expenditure 2014-15 2015-16 2016-17 2017-18 2018-19Number Classification Actual Actual Actual Estimated Budget
Capital Outlay6010 Vehicle Purchases 122,354 496,279 - - 307,000 6015 Machinery & Equipment - - - - 18,795 6011 Vehicle Setup - 25,181 - - 76,000 6020 Spray Equipment - - - 1,001 7,900 6035 Furniture & Fixtures 4,180 - - 2,700 14,800 6031 Computer Equipment - - - 2,637 9,300
Total Capital Outlay 126,532 521,460 - 6,339 433,795
43

COMMUNITY AFFAIRS DEPARTMENT
Department Overview The Community Affairs Department prioritizes youth and adult education utilizing school outreach and public information programs to promote District services and raise awareness about current and newly emerging vector-related public health issues. The Department designs and implements annual outreach strategies and public education campaigns to reach residents, property owners, businesses, and community leaders within District boundaries. The Department is comprised of the Director of Community Affairs, the Public Information Officer, two Education Program Coordinators, and one Outreach Assistant. Department members collaborate as a team to produce quality, cost-effective education and information materials. Because of the District’s diverse and dense population, effective outreach must reach residents of all demographics. Our strategy includes localized, targeted efforts as well as outreach on a larger scale. Partnering with community partners, city leaders and local, state, and federal legislators will ensure new and emerging public health considerations are not ignored.
Budget Highlights Community Liaisons- Ever increasing demands for outreach that targets and motivates our diverse population continue to rely on face-to-face interactions to cement the knowledge necessary for behavior change to occur. This new outreach tool will expand our ‘grassroots’ approach, putting more skilled staff into the community where they can have the greatest impact, and reduce overtime burdens on our existing staff. Promotional and Educational Materials- The Department continues to redesign educational materials (flyers & brochures) to reduce printing costs as current stock is depleted. Low cost, high impact promotional items are purchased and distributed to increase awareness and provide ready access to our contact information. Advertising- In addition to working directly with city staff to provide important information to residents, staff utilizes many traditional advertising/information dissemination strategies to reach our diverse population including news articles, print ads, radio, billboards, and direct mail. We will continue to increase our use of highly successful targeted online advertising, social media, electronic newsletters and eAlerts, eBillboards, and video content, and partner with other Los Angeles County agencies to implement regional education campaigns of mutual benefit. Continuing Education & Seminars- Training will continue in compliance with the CA Department of Public Health required continuing education program for pesticide applicators. Staff will attend workshops, association conferences, and planning meetings of benefit to our residents.
44

DEPARTMENT SUMMARYCOMMUNITY AFFAIRS
2018-2019 BUDGET
Budget Summary
2014-15 2015-16 2016-17 2017-18 2018-19Actual Actual Actual Estimated Budget
Salaries & Benefits 402,323 428,080 458,835 470,515 805,195 Operational Expenditures 105,840 107,412 103,688 122,963 175,401 Capital Outlay - 1,202 - 7,477 71,300
Total Expenditures 508,163 536,694 562,523 600,955 1,051,895
- 100,000 200,000 300,000 400,000 500,000 600,000 700,000 800,000 900,000
Act
ual
Act
ual
Act
ual
Est
imat
ed
Bud
get
2014-15 2015-16 2016-17 2017-18 2018-19
Exp
end
itu
res
Fiscal Years
Community Affairs
Salaries & Benefits
OperationalExpenditures
Capital Outlay
45

DEPARTMENT SUMMARYCOMMUNITY AFFAIRS
FY 18/19 BUDGET
Budget Summary2014-15 2015-16 2016-17 2017-18 2018-19Actual Actual Actual Estimated Budget
Salaries & Benefits 402,323 428,080 458,835 470,515 805,195 Operational 105,840 107,412 103,688 122,963 175,401 Capital Outlay - 1,202 - 7,477 71,300
Total Expenditures 508,163 536,694 562,523 600,955 1,051,895
Personnel Summary
Full-time PositionsAccount Expenditure 2014-15 2015-16 2016-17 2017-18 2018-19Number Classification Actual Actual Actual Estimated Budget
Salaries5073 Director of Community Affairs 99,966 106,170 107,874 109,429 112,760 5075 Public Information Officer 71,311 77,470 82,953 67,684 86,038 5084 Community Liaisons (3) - - - - 166,749 5086 Outreach Assistant 12,477 14,366 25,755 42,582 48,921 5110 Overtime 200 27 2,959 1,548 4,000 5085 Education Program Coordinators (2) 129,015 124,741 119,498 114,311 141,866
Total Salaries 312,969 322,774 339,039 335,553 560,334
Benefits5115 Sick Payout 3,685 2,646 2,068 2,918 2,826 5120 Vacation Payout 2,464 1,750 474 - 3,021 5130 Medicare & FICA 5,352 5,530 4,883 5,325 8,181 5133 Short Term Disability - - - 1,419 2,394 5135 SUI 2,344 2,744 2,604 2,665 3,976 5140 PERS 40,015 40,053 42,442 47,875 72,585 5145 ICMA 401 (a) 4,415 4,502 4,256 3,808 4,745 5150 Health Insurance 29,615 46,457 61,409 67,921 144,349 5155 Dental Insurance 1,179 1,325 1,361 2,708 2,470 5160 Vision Insurance 285 299 299 323 313
Total Benefits 89,354 105,306 119,796 134,961 244,861
Total Salaries & Benefits Expenditures 402,323 428,080 458,835 470,515 805,195
46

DEPARTMENT SUMMARYCOMMUNITY AFFAIRS
FY 18/19 BUDGET
Account Expenditure 2014-15 2015-16 2016-17 2017-18 2018-19Number Classification Actual Actual Actual Estimated Budget
Operational
5325 Uniforms - - - - - 5340 Uniform Accessories - - - - - 5345 Work Apparel 386 440 193 784 1,050 5350 Logo Patches - - - - - 5485 Fuel 3,048 2,610 1,421 5,893 15,800 5507 Reference Materials - - 16 - - 5610 Copier Expenses - - - - - 5615 Computer Consultant - - - - - 5617 Computer Supplies & Access. 643 - 264 1,302 1,760 5620 Computer Software 698 973 650 800 2,500 5625 Postage 343 360 42 3,890 3,950 5630 Wireless Telephone 3,241 3,179 3,199 3,355 4,980 5635 GPS Tracking 220 240 240 525 1,368 5640 Website & Email Service 13,782 748 2,962 1,053 2,700 5645 Memberships 108 - 108 - - 5655 Office Supplies 1,335 208 2,215 2,054 2,300 5660 Printing/Stationary - - 140 - - 5667 Professional/Temp Services - 1,549 - - - 5675 Advertising 25,800 19,528 27,952 29,121 30,000 5683 VCJPA Insurance - Pooled Worker's Compensation 13,256 19,391 17,851 18,164 28,395 5685 VCJPA Insurance - Pooled Liability Premium 5,773 5,881 5,598 5,882 9,195 5686 VCJPA Insurance - Pooled Automobile Liability - - - - - 5687 VCJPA Insurance - Group Property 374 358 1,106 794 1,240 5690 VCJPA Insurance - Group Fidelity Program 63 64 59 60 94 5700 VCJPA Insurance - General Fund 1,081 1,143 927 967 1,516 5707 Meeting/Supplies 31 315 415 - 600 5720 Permits & Fees - 50 75 - - 5727 Certification Renewals 480 360 - 564 1,072 5735 Continuing Education & Seminars 6,917 11,451 11,981 14,663 18,581 5760 Miscellaneous Expense - 44 - - - 5765 Public Info Video - - - - - 5770 Public Information Materials & Equipment - - - - - 5775 Photography Expenses - 229 948 723 1,300 5769 Supplies & Equipment 2,041 3,922 2,754 2,698 4,500 5785 Ed Materials & Supplies - 10 121 - - 5787 Promotional & Ed. Materials 19,933 19,934 15,656 18,283 32,500 5790 Public Exhibit 403 544 5,427 25 - 5793 Media Monitoring Services 773 65 - - - 5795 Mobile Education Unit Supplies 5,111 13,818 994 10,100 10,000 5815 Janitorial Supplies - - 376 1,264 -
Total Operational Expenditures 105,840 107,412 103,688 122,963 175,401
47

DEPARTMENT SUMMARYCOMMUNITY AFFAIRS
FY 18/19 BUDGET
Account Expenditure 2014-15 2015-16 2016-17 2017-18 2018-19Number Classification Actual Actual Actual Estimated Budget
Capital Outlay
6010 Vehicle Setup (MEU Bus) - - - - - 6010 Vehicle Purchase - - - - 60,000 6035 Furniture & Fixtures - - - - 3,000 6015 Public Information Equipment - - - - - 6036 Capital Improvement - - - - - 6031 Computer - 1,202 - 7,477 8,300
Total Capital Outlay - 1,202 - 7,477 71,300
48

FACILITIES & MAINTENANCE DEPARTMENT
Department Overview The Facilities & Maintenance Department is responsible for maintaining the Santa Fe Springs and Sylmar facilities, district vehicles and district equipment. Staff members also perform vehicle modifications and special District projects. The Department is comprised of a Maintenance Supervisor and five maintenance personnel specializing in automotive repair, welding, machining, carpentry, painting, plumbing and electrical work.
Budget Highlights Capital Improvement – Repair, seal, and add additional parking stalls in order to accommodate growing work force at the Santa Fe Springs facility. In addition, we will be re-keying and re-organizing the entire facility key system at the Santa Fe Springs facility. Staff Accommodations – Due to the growing workforce, maintenance will strategize on accommodating new staff work areas at both the Santa Fe Springs and Sylmar facilities. For example, we will plan for the addition of new cubicles in Operations, dividing the library and adding cubicles, and installing additional lockers in the changing areas. Vehicle Set-Up- The District will be purchasing 15 new field vehicles to accommodate new staff and continue replacement of the aging fleet. These vehicles will need to be outfitted with District logos, pesticide equipment and fixtures, safety lighting and tools as necessary.
49

DEPARTMENT SUMMARYMAINTENANCE
2018-2019 BUDGETBudget Summary
2014-15 2015-16 2016-17 2017-18 2018-19Actual Actual Actual Estimated Budget
Salaries & Benefits 518,886 540,430 507,194 502,009 666,565 Operational 165,353 169,940 158,842 187,445 261,740 Facilities Maintenance 213,544 203,972 211,880 250,909 281,200 Capital Outlay 5,101 201,918 - 198,725 87,750
Total Expenditures 902,884 1,116,261 877,916 1,139,088 1,297,254
- 100,000 200,000 300,000 400,000 500,000 600,000 700,000
Act
ual
Act
ual
Act
ual
Est
imat
ed
Bud
get
2014-152015-162016-172017-182018-19
Exp
endi
ture
s
Fiscal Years
Maintenance
Salaries & Benefits
Operational
Facilities Maintenance
Capital Outlay
50

DEPARTMENT SUMMARYFACILITIES AND MAINTENANCE
FY 18/19 BUDGET
Budget Summary 2014-15 2015-16 2016-17 2017-18 2018-19Actual Actual Actual Estimated Budget
Salaries & Benefits 518,886 540,430 507,194 502,009 666,565 Operational 165,353 169,940 158,842 187,445 261,740 Facilities Maintenance 213,544 203,972 211,880 250,909 281,200 Capital Outlay 5,101 201,918 - 198,725 87,750
Total Expenditures 902,884 1,116,261 877,916 1,139,088 1,297,254
Personnel Summary
Full-time PositionsAccount Expenditure 2014-15 2015-16 2016-17 2017-18 2018-19Number Classification Actual Actual Actual Estimated Budget
Salaries5090 Facilities and Fleet Maintenance Supervisor 79,801 81,917 44,206 41,269 81,048 5095 Maintenance Mechanic (4) 269,479 273,839 290,594 292,015 379,341 5110 Overtime 652 1,914 1,907 7,872 2,000
Total Salaries 349,933 357,670 336,707 341,156 462,388
Benefits5115 Sick Payout 9,357 11,171 7,173 5,206 3,800 5120 Vacation Payout 4,108 6,198 2,777 2,892 1,525 5130 Medicare & FICA 5,157 5,237 4,888 5,028 6,782 5133 Short Term Disability - - - 881 2,129 5135 SUI 2,170 2,170 1,736 2,367 2,982 5140 PERS 53,428 59,032 67,049 64,722 79,030 5145 ICMA 401 (a) 10,546 10,726 8,078 5,267 5,689 5150 Health Insurance 80,166 84,067 77,047 72,511 100,466 5155 Dental Insurance 3,437 3,563 1,165 1,507 1,461 5160 Vision Insurance 584 597 572 473 313
Total Benefits 168,954 182,761 170,486 160,853 204,176
Total Salaries & Benefits Expenditures 518,886 540,430 507,194 502,009 666,565
51

DEPARTMENT SUMMARYFACILITIES AND MAINTENANCE
FY 18/19 BUDGET
Account Expenditure 2014-15 2015-16 2016-17 2017-18 2018-19Number Classification Actual Actual Actual Estimated Budget
Operational Expenditures
5230 Portable Spray Equipment 329 456 385 753 800 5260 Support Equipment 4,685 4,449 575 2,284 11,500 5310 Foot Wear 567 428 526 903 1,000 5315 Gloves 19 35 16 45 90 5320 Coveralls - - - - - 5325 Uniform Cleaning 3,059 3,358 4,806 3,666 3,100 5330 Towel Supply 3,248 3,791 4,005 3,899 3,350 5340 Uniform Accessories - - - - - 5345 Work Apparel - - 79 247 400 5350 Logo Patches - - - - - 5360 Protective Safety Equipment 137 256 397 327 300 5400 Maint. Parts Electric 9,455 15,290 10,257 10,763 9,000 5410 Vehicle Registration & Fees - - - - - 5415 Brake and Suspension 9,998 8,412 6,451 8,076 10,000 5420 Tires, Wheels & Alignment 17,560 11,806 13,247 19,350 17,000 5430 Cooling Sys. Parts & Supplies 5,438 4,224 5,439 7,180 6,000 5435 Body Repair 9,817 6,395 5,836 5,708 10,000 5445 Fabrication Supplies 9,363 12,312 14,381 3,961 3,500 5455 Hazardous Waste, Oil Disp. & Clarifier 4,567 13,445 4,056 4,500 6,000 5456 Engine & Transmission Overhaul 9,862 1,229 258 17,791 20,000 5475 Trans Chassis & Drive 6,557 2,949 8,877 7,177 10,000 5480 Engine 14,918 14,611 14,716 16,061 15,000 5485 Fuel 8,298 4,986 2,919 9,878 9,370 5457 Smog Checks 3,643 736 2,258 2,201 2,500 5460 First Aid 714 310 377 500 18,500 5499 Misc. Maint Parts & Supplies 12,487 16,954 14,685 14,981 23,900 5610 Copier Supplies - - - - - 5615 Computer Consultant 1,908 - - - - 5617 Computer Supplies 28 49 18 1,282 580 5619 Equipment Repair - - 32 - - 5620 Computer Software 1,500 1,635 - 3,788 4,300 5625 Postage - - - - - 5630 Wireless Telephone 1,262 1,214 911 656 1,310 5640 Internet/Website Services - - - - - 5655 Office Supplies 307 886 1,346 613 1,200 5660 Printing & Stationary - - - 150 100 5683 VCJPA Insurance - Pooled Worker's Compensation 15,356 22,461 22,765 23,164 25,432 5685 VCJPA Insurance - Pooled Liability Premium 6,687 6,812 7,139 7,501 8,235 5686 VCJPA Insurance - Pooled Automobile Liability - - - - - 5687 VCJPA Insurance - Group Property 433 414 1,410 1,012 1,111 5690 VCJPA Insurance - Group Fidelity Program 73 74 76 76 84 5700 VCJPA Insurance - General Fund 1,253 1,324 1,182 1,233 1,358 5704 Earthquake Insurance - - - - 26,600 5707 Meeting/Supplies - - - - - 5720 Permits & Fees 1,373 7,583 9,408 5,992 8,500 5725 Certification Renewal 360 360 - 480 620 5735 Continuing Education & Seminars 95 699 12 1,244 1,000 5760 Miscellaneous Expenses - - - - - 5775 Photography Expenses - - - - -
Total Operational Expenditures 165,353 169,940 158,842 187,445 261,740
52

DEPARTMENT SUMMARYFACILITIES AND MAINTENANCE
FY 18/19 BUDGET
Account Expenditure 2014-15 2015-16 2016-17 2017-18 2018-19Number Classification Actual Actual Actual Estimated Budget
Facilities Maintenance
5333 Floor Mats 1,572 1,328 1,527 1,585 1,300 5755 Kitchen Supplies 901 1,213 1,053 1,629 1,450 5800 Irrigation - - - - - 5810 Landscape Maint. 17,223 17,013 20,120 25,356 25,000 5815 Janitorial Maint. 21,082 21,215 21,350 28,870 27,500 5820 Pond & Fountain 786 578 1,121 289 500 5825 Interior & Exterior Supplies 20,278 19,283 20,982 20,497 40,750 5850 HVAC 16,846 20,629 13,377 13,180 18,000 5855 Fixtures & Hardware 1,927 1,408 6,711 6,897 19,500 5870 Security Alarm 2,682 4,199 2,878 3,055 2,600 5875 Telephone 5,599 6,160 7,440 8,951 12,600 5877 Internet 14,391 19,727 23,866 29,944 18,000 5880 Utilities 82,612 61,033 63,403 75,819 80,000 5885 Water 19,891 19,972 19,158 22,908 23,000 5890 Waste Disposal 7,753 10,215 8,894 11,932 11,000
Total Facilities Maintenance Expenditures 213,544 203,972 211,880 250,909 281,200
Capital Outlay
6011 Vehicle Setup - - - 2,993 - 6035 Furniture & Fixtures - 1,878 - - - 6015 Machinery & Equipment 3,996 - - 10,731 18,950 6031 Computer & Software 1,105 1,837 - - 1,300 6036 Capital Improvements (HVAC) - 198,203 - 185,000 67,500
Total Capital Outlay 5,101 201,918 - 198,725 87,750
53

BOARD OF TRUSTEES
Board of Trustees Overview The Greater Los Angeles County Vector Control District’s governing power is vested in the Board of Trustees, which is now comprised of thirty-six members. One trustee is appointed by each member city and a county trustee representative is appointed by the County Board of Supervisors. To be appointed, the member must be a resident voter of the representative city or county within the District. Board member duties and responsibilities include setting policy, establishing the budget, approving expenditures, and retaining legal counsel. The trustee serves a two-year or four-year term without compensation but does receive an in-lieu travel stipend of $100 per month for attending the regularly scheduled Board meeting.
Budget Highlights Continuing Education & Seminars- Trustees are encouraged to send representatives to attend the annual association conferences, including those for the American Mosquito Control Association (AMCA) and Mosquito and Vector Control Association of California (MVCAC). These conferences consist of presentations and exhibits that illustrate and highlight the latest science, technology, and products used to conduct research and control vectors. These conferences also offer special sessions for Trustees to provide updates on legal, state, and operational issues. Budgeted expenses include registration, travel, food, and lodging.
54

BOARD OF TRUSTEESFY 18/19
Budget Summary
2014-15 2015-16 2016-17 2017-18 2018-19Actual Actual Actual Estimated Budget
Salaries & Benefits - Operational Expenditures 44,232 39,707 41,595 49,963 53,125 Capital Outlay - - - - -
Total Expenditures 44,232 39,707 41,595 49,963 53,125
Account Expenditure 2014-15 2015-16 2016-17 2017-18 2018-19Number Classification Actual Actual Actual Estimated Budget
Board of Trustees' Operational Expenditures5710 Trustee-in-Lieu 33,700 30,300 33,450 35,136 38,200 5715 Board Meeting Expenses 5,877 4,529 5,288 5,102 6,200 5735 Continuing Education & Seminars 4,655 4,877 2,858 9,725 8,725
Total Board of Trustees' Operational Expenditures 44,232 39,707 41,595 49,963 53,125
55

OTHER FUNDS SUMMARY FY 18/19 BUDGET
Budget Summary
2014-15 2015-16 2016-17 2017-18 2018-19Actual Actual Actual Estimated Budget
Salaries & Benefits - Operational Expenditures 591,435 614,871 638,034 727,037 886,603 Capital Outlay -
Total Expenditures 591,435 614,871 638,034 727,037 886,603
Account Expenditure 2014-15 2016-16 2016-17 2017-18 2018-19Number Classification Actual Actual Actual Estimated Budget
5170 Retirees Insurance 216,070 232,185 260,911 308,489 428,714 5645 Memberships 23,365 18,642 23,614 33,114 31,889 5671 NPDES Monitoring Costs - 241 - - - 5672 CEQA Fees - - - - - 5701 Property Tax Administration Cost 22,411 40,301 34,833 42,851 380,000 5702 L A County Property Tax Administrative Charges 329,589 323,503 318,676 342,583 46,000
Total Other Operational Expenditures 591,435 614,871 638,034 727,037 886,603
56

Registration Travel Hotel rate# of
NightsPer
Diem/day# of
Days# Pub.
Affairs Staff# Sci-Tech
Staff
# Operations
Staff# Maintenance
Staff
# Admin Staff (incl.
Mngr.)
# of Trustees attending Total
MVCAC
Summer Planning Mtg '18-Teleconference None 0 0 0 0 0 1 1 1 0
Fall Quarterly'18-Palm Springs (Nov. 1-Nov. 2) None 0 164 2 60 2 2 1 3 1 3136
Winter Planning Mtg.'19-Coastal Region (TBD) None 250 185 2 60 2 1 1 1480
Annual Conference '19-Burlingame (Feb. 2-5)
310; +50 for Trustee
luncheon 250 185 3 60 4 3 4 4 1 2 19070Spring Quarterly '19-So CA (TBD) None 0 185 2 60 2 2 1 3 1 3430
Legislative Day-TBD None 250 185 1 60 1 1 1 1 3 2970AMCA
85th Annual-Orlando, FL (Feb.25-Mar.1)
400, 440 Trustees 500 195 5 60 5 3 2 5 1 2 28355
Washington Day-TBD None 500 195 3 60 3 1 1 2530VCJPA
Annual workshop None 250 0 2 60 2 1 370ERMA
Annual workshop None 250 0 2 60 2 1 370CSDA
Annual conference-Indian Wells(Sept. 23-28) 800 100 240 5 60 5 2 4800
Human ResourcesSHRM National Convention 1650 500 300 5 60 5 1 3950
PIHRA Annual Legal Update 250 0 0 0 0 1 1 250California HR Conference 850 0 0 0 0 3 1 850
CalPERS Conference 500 500 250 3 60 3 1 1930AALRR Conference 199 0 0 0 0 1 2 398
LCW Conference 525 250 250 3 60 3 1 1705CALPERLRA 1005 500 250 5 60 5 1 3055
ADP Conference 300 0 0 0 0 1 2 600CA Public Information Officials
Annual Conference 500 300 175 3 60 3 1 1505Mobile Lab Coalition
Annual Conference 235 500 150 3 60 4 2 2850CDPH-Pub. Health Continuing Ed.
Make-up seminars 100 1 5 500American Society for Tropical Medicine & Hygiene
Annual Conference- Orlando, FL (Nov.) 870 500 249 4 60 4 2 5212Finance Department
CalCPA Conference 1500 150 200 6 60 6 1 3210ADP Conference 300 2 600
CSTC Annual Conference 520 1 520Thomas Reuters 1550 150 200 6 60 1 1 2960
CSDA 600 150 200 6 60 6 1 2310Lance, Soll Lunghard Conference 99 2 198
Government Fraud 1995 150 230 7 60 1 1 3815Fred Pryor Seminar 300 50 0 4 0 1 1 350
Accounting Conference 750 200 200 3 60 3 1 1730Other Employee Development
IT: Interop Training Conference 3100 150 3 1 3550Facilities & Maintenance Training 1000 1 1000
Misc. Community Seminars/meetings 500 1 500CSDA webinars and training 500 1 500
CASQA Conference 600 250 185 3 60 4 1 1645Seminars for Database Analyst 1000 1 1000
Misc. MVCAC/NACCHO/Business Meetings & Seminars 1000 1 1000
Total 114204
GLACVCD Training Plan 2018-2019
57

GREATER LOS ANGELES COUNTY VECTOR CONTROL DISTRICT
EMPLOYEE DEVELOPMENT & TRAINING PLAN FY 2018-19
INTRODUCTION The vector control industry is rapidly changing. With the arrival of invasive Aedes species mosquitoes which have the capacity to transmit debilitating viruses such as dengue, chikungunya and Zika, it is more important than ever for districts to innovate, conduct research, and share tools and strategies with each other. That is why the Greater Los Angeles County Vector Control District continues to place high priority on training and development for its managers and staff. Meetings and conferences are not only meant to ensure employee growth and knowledge of new vector-related trends and issues, it allows for important information exchange between agencies. Furthermore, it gives administrative staff the training and knowledge necessary to stay ahead of new regulatory, labor and finance laws and allows for maintenance of professional certifications. The training plan presented here incorporates all departments and was developed to ensure District employees remain at the forefront of any innovation in the field of vector control, surveillance, public education, technology, finance, and human resources. State and national programs allow staff to remain informed of best practices and continue Greater Los Angeles County Vector Control District’s reputation as a leader in the mosquito and vector control industry. With greater legislative and regulatory restrictions to public health pesticide applications, it is important for management staff to stay on top of the political, regulatory, and economic climate. Information shared at these meetings allow District staff to meet their charges to protect public health while adhering to legal mandates. The training seminars and conferences detailed in this plan provide staff with knowledge to combat emerging vector-borne disease threats; improve methodologies for surveillance, control, and public education; deal with pesticide resistance; adjust to new pesticide regulations; create partnerships with state and national public health agencies; and stay apprised of new employee, management, and organizational rules and regulations. Many of the training sessions and conferences include educational presentations and workshops as well as working committee meetings to tackle current issues in information technology, finance, legislation, public relations, continuing education, integrated pest management, and vector-borne disease. These conferences often offer educational tracks for operational staff, scientific-technical staff, administrative staff, outreach staff, and Trustees. In addition, district management staff members participate on or chair a number of committees within the host associations, making them key players in the coordination of training events and industry activities. Training and development is made available to all staff, not just upper level management. In addition, Trustees are encouraged to attend the annual state and national conferences and share information learned with the rest of the Board. Similarly, staff members who attend these training sessions and conferences will report back to District staff highlighting new information and issues.
58

The following training plan narrative corresponds with the employee training and development matrix. The narrative will provide descriptions of each training opportunity, including the objective and focus of the program and its potential impact on District operations. The plan will also indicate whether staff will be involved in presentations, conference activities, or participate as volunteers or committee members. SUMMARY A total of $114,204 has been budgeted to fund the Employee Training and Development Plan for FY 2018-2019. Personnel participating in training include management staff as well as administrative and field personnel. The scope of training includes professional and scientific conferences and seminars for professional certification requirements. CONFERENCES MVCAC
The Mosquito & Vector Control Association of California (MVCAC) is a statewide organization of more than 65 vector control agencies designed to facilitate information flow between individual agencies to gain better knowledge of mosquito surveillance and control issues and to better represent these issues as a group to local and state legislators. The association is dedicated to “quality public information, comprehensive mosquito and vector-borne disease surveillance, training to high professional standards, and effective legislative advocacy.” MVCAC is comprised of vector control managers and staff, university researchers, representatives from the California Department of Public Health, and other public health entities statewide. GLACVCD’s membership in this organization has greatly benefited the District’s overall program through legislative achievements and scientific exchange and support. The District has been a corporate member of the association for many years and pays annual corporate membership dues totaling $9,000 in FY 18/19. Membership in recent years has become even more important as agencies face the challenge of pesticide regulations and pressure from environmentalists and other advocacy groups. It is through MVCAC and its resources and membership that the District has been able to achieve compliance with NPDES permitting and monitoring requirements and defeated proposed legislation that would negatively impact districts’ abilities to combat public health threats.
Quarterly Meetings The quarterly meetings are held at varying locations within California. The fall and spring meetings are working meetings for committees to discuss statewide developments and issues in mosquito and vector control and develop statewide action plans and campaigns for the year. MVCAC Planning Sessions are held in the winter and summer and attended by managers and committee chairs. The following staff members are either managerial staff and/or members of various association committees and are recommended to attend:
1. General Manager 2. Director of Community Affairs – Member of the Integrated Vector Management
Committee 3. Public Information Officer – Member of the Public Relations Committee
59

4. Director of Operations - Member of the Integrated Vector Management and Information Technology Committees
5. Director of Scientific-Technical Services – Member of the Vector & Vector-borne Disease Committee
Annual Meeting The Annual MVCAC Conference offers educational symposia, workshops, poster presentations, and opportunities to network and share ideas with state public health professionals and vector control colleagues. This year’s Annual Conference is scheduled for February 2 to 5, 2019 in Burlingame, CA. Topics cover all aspects of the industry including chemical use, proposed legislation, new public health threats, new research on existing health threats such as West Nile and Zika virus, and strategies for dealing with invasive Aedes mosquitoes. In addition, information such as new treatment methods, control agents and formulations, improved surveillance methods, and improved understanding of disease ecology and biology often results in changes and improvements to the District’s overall program. The following staff members are recommended to attend:
1. Two (2) Trustees 2. General Manager 3. Three (3) Community Affairs Staff Members 4. Four (4) Scientific-Technical Services Staff Members 5. Four (4) Operations Staff Members
Legislative Day MVCAC’s Legislative Day in Sacramento is held in March or April and consists of meetings with state legislators and their staff to discuss proposed legislation and other issues that might impact the mosquito and vector control industry. In the past, the district has sent 8 staff members and Trustees to meet with the large number of state representatives with legislative districts within GLACVCD boundaries. The following staff members are recommended to attend:
1. General Manager 2. Two (2) Department Directors 3. Three (3) Trustees
AMCA The 85th Annual Meeting of the American Mosquito Control Association (AMCA) will be held in Orlando, Florida on February 25 to March 1, 2019. This meeting will consist of presentations and exhibits that illustrate and highlight the latest science, technology, and products used to conduct research and control vectors. This meeting also provides ample opportunities to network with vector control professionals, researchers, and educators from around the world. With 800 to 1,000 participants from throughout the nation and worldwide, this annual conference is one of the most important meetings of mosquito professionals in the world sharing knowledge and seeking guidance for their individual programs. Since the rise of invasive Aedes species mosquitoes in the U.S. and mosquito-borne disease threats such as dengue, chikungunya, and Zika viruses, the exchange of surveillance and control information and techniques between member districts, researchers, and pesticide industry professionals has become even more critical in the development of control and disease prevention strategies.
60

The following staff members are recommended to attend this conference:
1. Two (2) Trustees 2. General Manager 3. Three (3) Community Affairs Staff 4. Two (2) Scientific-Technical Services Staff 5. Five (5) Operational Staff
Annual Washington Conference AMCA’s Annual Washington Conference is usually held in May in Washington, D.C. and consists of meetings with U.S. legislators and their staff to discuss existing and proposed legislation and other issues that might impact the mosquito and vector control industry nationwide. The following staff members are recommended to attend:
1. General Manager 2. (1) Department Director
VECTOR CONTROL JOINT POWERS AGENCY (VCJPA) & EMPLOYMENT RISK MANAGEMENT AUTHORITY (ERMA) The mission of the Vector Control Joint Powers Agency is to actively promote the efficient, economical, and responsive delivery of self-insurance programs and professional risk management services deemed appropriate by the member entities. The VCJPA is a joint powers authority consisting of 35 mosquito and vector control districts throughout California. Annual workshops are held to discuss insurance and risk management topics impacting vector control agencies and Board meetings are held quarterly. The General Manager currently serves as the VCJPA representative to ERMA, the District’s employee risk management authority. The position requires attendance at the quarterly Board meetings as well as the annual conference. The following staff member is recommended to attend the conferences:
1. General Manager CALIFORNIA SPECIAL DISTRICT ASSOCIATION (CSDA) CSDA is an association that assists in providing services for all independent special districts throughout California. The Annual Conference and Exhibitor Showcase is the most densely-packed educational and networking experience available to special districts with presentations on issues such as governance and human resources. The CSDA’s annual conference is generally held in October. The following staff member is recommended to attend the conference:
61

1. Director of Fiscal Operations
SOCIETY FOR HUMAN RESOURCES MANAGEMENT (SHRM) NATIONAL CONVENTION The 70th Annual SHRM conference will be held in Chicago from June 17th – 20th. This annual SHRM convention provides up-to-date exchange of information and exposure to human resources best practices on employee relations, organizational compliance in risk management, safety, leave management, litigation exposure, benefit administration, healthcare and emerging issues that affect organizational excellence and fiscal responsibilities. This conference is held every June on an annual basis. The following staff member is recommended to attend this conference:
1. Director of Human Resources LIEBERT, CASSIDY & WHITMORE (LCW) CONFERENCE The 21st Annual Public Sector Employment Law conference will be held from January 23rd – 25th at the JW Marriot Desert Springs Resort & Spa. This annual employment law conference provides the latest employment law updates, changes, recent law cases, new employment law language, maintaining compliance, networking and professional development. This conference is in partnership with consortiums of both Southern and Northern California Regions of LCW. The following staff member is recommended to attend this conference:
1. Director of Human Resources CALIFORNIA PUBLIC EMPLOYERS LABOR RELATIONS ASSOCIATION (CALPELRA) CALPELRA's 43rd Annual Training Conference will be held the week of December 3rd – 7th, 2018, in Monterey. CALPELRA helps California public sector employers better serve their communities by providing comprehensive, quality training in employee relations and personnel management and by fostering professional development with a dynamic network of support. CALPELRA's members work in city, county or state government, school districts, state university systems, and special districts, representing management in employee relations, bargaining, and other activities involving public employees. The following staff member is recommended to attend this conference:
1. Director of Human Resources PROFESSIONALS IN HUMAN RESOURCES ASSOCIATION (PIHRA) CONVENTION
The Professionals in Human Resources Association (PIHRA) is dedicated to the continuous enhancement of human resources through networking, learning, and advocacy. PIHRA serves the human resources industry with 17 locations in the counties of Los Angeles, Orange, Riverside, San Bernardino, and Ventura. As the largest affiliate chapter of the Society for Human Resources
62

Management, PIHRA represents more than 4,000 individual members. The Director of Human Resources serves as a Board Member for the Gateway Cities Local District.
The California HR Conference, produced by the Professionals in Human Resources Association (PIHRA), and held from August 27th – 29th in Long Beach, CA, is the 2nd largest regional conference for human resources professionals in California with more than 2,000 practitioners, presenters, and providers. The objective of the Conference is to provide six tracks of professional development to (California) HR professionals, including Business Acumen & HR Strategy, Employment Law & Legislation, Global HR, Personal & Leadership Development, Talent Acquisition, and Total Rewards.
The following staff members are recommended to attend this conference:
1. Director of Human Resources 2. Benefit Specialist 3. Human Resources Assistant
CALIFORNIA PENSION EMPLOYEE RETIREMENT SYSTEM (CalPERS) CONFERENCE The 19th annual forum, which is the premier CalPERS educational event, will take place in Indian Wells from October 22nd – 24th. The CalPERS forum highlights include informative sessions, dynamic keynote speakers, exhibits, leadership training, and networking opportunities. These sessions will provide health benefits changes, memberships, understanding retirement, service credit and training opportunities.
The following staff members are recommended to attend this conference:
1. Director of Human Resources 2. Benefit Specialist ADP USER CONFERENCE ADP Pro User Conferences include sessions specifically designed to help the District maximize their investment in the ADP solutions and ensuring that we get the most out of your relationship with ADP. This conference will allow an opportunity to connect with peers, experience hands-on training, and discover how to get the most from your ADP solutions. The conference will demonstrate practical, tactical approach to creating a Talent Management program, review ADP Reporting tips and offer roundtables and discussions promoting networking and share best practices. The following staff members are recommended to attend this conference: 1. Benefit Specialist 2. Human Resources Assistant
MOBILE LABORATORY COALITION CONFERENCE
63

The importance of science and technology to the prosperity of American society demands an educated populace able to meet pressing science career needs, ensure national economic development, and improve human health. The Mobile Laboratory Coalition is a partnership of traveling laboratory programs, institutions of higher education, and K-12 schools and school systems, built upon scientist and educator collaborations that will address the nation's science education challenge by providing equity of access to authentic hands-on, inquiry-based, contemporary science education for K-12 students, educators, and the community. The Education Foundation’s mobile SWAT Lab Program Staff have attended and led MLC Conference sessions in prior years as part of an effort to further develop and expand the District’s educational curriculum. The Coalition hosts an annual conference each year around June. The following staff members are recommended to attend this conference:
1. Two (2) Education Program Coordinators CAPIO ANNUAL CONFERENCE The California Association of Public Information Officials holds an annual conference in April of each year. The conference offers workshops and presentations on a variety of communications and public relations issues affecting public sector public information officials. Past topics have included crisis communications, managing the media, social marketing, and public speaking. The conference also provides an opportunity to network with other public sector information officers and share ideas and experiences in the communications field. The following staff members are recommended to attend this conference:
1. Public Information Officer CERTIFIED PUBLIC ACCOUNTANT CONTINUING EDUCATION SEMINARS AND CONFERENCES As a certified public accountant (CPA) and Enrolled Agent, the Director of Fiscal Operations is required to complete 40 hours of continuing education per year relating to accounting, auditing, and tax laws. Various 8-hour seminars are conducted locally that meet the continuing education requirements needed to maintain the CPA status. However, many of these seminars are no longer free. The Director of Fiscal Operations has identified and selected to attend relevant courses and conferences throughout the year to satisfy this continuing education requirement. In addition, the Accounting Clerk, who assists in the Finance Department, must also keep current on accounting practices. The following staff members are recommended to attend these various seminars and conferences:
64

1. Director of Fiscal Operations 2. Accounting Clerk
CASQA ANNUAL CONFERENCE The California Stormwater Quality Association (CASQA) is a professional member association dedicated to the advancement of stormwater quality management through collaboration, education, implementation guidance, regulatory review, and scientific assessment. CASQA has an annual conference held, this year, at the Riverside Convention Center, October 15-17, 2018. The Urban Water Program Manager is responsible for the minimization of vectors in stormwater conveyance systems and structures throughout the District. The CASQA conference represents an opportunity to educate the stormwater community about stormwater designs that facilitate the harborage and production of disease vectors and possible solutions. The following staff members are recommended to attend this conference: 1. Urban Water Program Manager
INTEROP ITX CONFERENCE
Interop ITX combines a trusted Conference program with a vendor-neutral Business Hall and lots of networking events. It is an event for the IT community to learn about technologies and solutions outside the District’s current ecosystems. It features more than 130 sessions via a mix of hands-on, panel, and speaker-led sessions. It’s also an opportunity to network with other IT professionals to discuss what solutions best fit our environment. The following staff member is recommended to attend this conference:
1. IT Administrator AMERICAN SOCIETY OF TROPICAL MEDICINE & HYGIENE (ASTMH) The introduction and spread of several invasive Aedes to Los Angeles County, has brought the potential for new challenging tropical diseases into our residents backyard. In order to ensure that District scientific staff is adequately educated and prepared to work on the prevention of said disease into the future, we propose sending two scientific-Technical staff members to attend the Annual Meeting for American Society of Tropical Medicine & Hygiene in Orlando, Florida, in early November 2018. ASTMH Annual Meeting traditionally has a robust program portion on vector-borne disease, their epidemiology and control, during which experts from around the world report on the latest findings and offer great learning opportunities and networking opportunities. The following staff members are recommended to attend this conference:
1. Two (2) Scientific-Technical Services staff members
65

FY 17/18 Budget vs FY 17/18 Estimated Actuals2018 -2019 Budget
Column A Column B (Col. B-Col. A)
REVENUE 2017-18 2017-18 2017-18Budget Estimated Variance
PropertySecured, Current 1,672,000 1,700,719 28,719 Unsecured, Current 1,600 - (1,600) Secured, Prior (7,800) (8,630) (830) Unsecured, Prior 600 5,400 4,800
Supplemental Property - Current 25,000 26,000 1,000 Prior 4,000 5,000 1,000 Other Fines, Forfeitures & Penalties 73,000 56,680 (16,320) Interest (LA County Account) 15,000 17,500 2,500 Other State-In-Lieu Taxes 6,100 4,492 (1,608) Homeowner Prop Tax Relief 1,500 1,500 - Intergovernmental Revenue-State - 1,500 1,500 Intergovernmental Revenue-Other 4,000 - (4,000) Miscellaneous Receipts 136,600 274,829 138,229 Black Fly Assessment 92,000 91,000 (1,000) General Assessment 10,213,600 10,393,100 179,500
Total Revenue 12,237,200 12,569,089 331,889
Column A Column B (Col. B-Col. A)
Budget Summary 2017-18 2017-18 2017-18Budget Estimated Variance
Salaries & Benefits 9,197,655 8,675,484 (522,171) Operational Expenditures 1,959,096 1,849,697 (109,399) Facilities Maintenance 239,240 250,909 11,669 Board of Trustees 53,580 49,963 (3,617) Other Expenditures 739,939 727,037 (12,902) Reserves - - - Capital Outlay 47,689 223,680 175,991
Total Expenditures 12,237,200 11,776,770 (460,429)
NET INCOME - 792,318 792,317
66

FY 17/18 Budget vs FY 17/18 Estimated Actuals2018 -2019 Budget
Personnel Summary
Full-time Positions Column A Column B (Col. B-Col. A)
Account Expenditure 2017-18 2017-18 2017-18Number Classification Budget Estimated Variance
Salaries5005 General Manager/CEO 164,029 164,104 75 5010 Director of Human Resources 106,288 106,261 (27) 5015 Director of Fiscal Operations 106,288 106,262 (26) 5017 Information Technology Administrator 98,632 98,607 (25)
GIS/IT Coordinator - - - 5020 Human Resources Assistant 60,159 58,349 (1,810) 5025 District Secretary 55,494 55,084 (410) 5018 Accounting Clerk 59,398 57,959 (1,439) 5019 Benefits Specialist - - - 5030 Operations Assistant (2) 102,002 104,301 2,299 5035 Director of Operations 112,906 112,860 (46) 5040 Operations Supervisor (3) 282,210 270,924 (11,286) 5050 Vector Control Specialist (49) 3,136,084 2,896,230 (239,854) 5052 Database Analyst 75,573 75,461 (112)
Urban Water Program Manager 94,689 94,650 (39) 5060 Director of Scientific Technical Services 112,906 112,860 (46) 5065 Vector Ecologist (4) 352,771 352,683 (88) 5070 Assistant Vector Ecologist (2) 77,204 77,183 (21) 5071 Field Assistant (2) 76,734 68,295 (8,439) 5073 Director of Community Affairs 109,475 109,429 (46) 5075 Public Information Officer 84,306 67,684 (16,622)
Outreach Assistant 43,712 42,582 (1,130) 5083 Community Liaisons (3) - - - 5085 Education Program Coordinators (2) 134,073 114,311 (19,762) 5090 Maintenance Supervisor 84,469 41,269 (43,201) 5095 Maintenance Mechanic (5) 300,146 292,015 (8,131) 5100 Seasonal Help (36) 417,792 375,458 (42,334) 5110 Overtime 22,064 37,051 14,987
Total Salaries 6,269,404 5,891,873 (377,531)
Benefits5115 Sick Payout 65,424 63,306 (2,118) 5120 Vacation Payout 47,330 67,203 19,873 5130 Medicare & FICA 119,495 116,534 (2,961) 5133 Short Term Disability Insurane - - - 5135 SUI 60,694 49,334 (11,360) 5140 PERS 1,096,442 1,085,653 (10,789) 5145 ICMA 401(a) 225,122 216,395 (8,727) 5150 Health Insurance 1,224,854 1,093,918 (130,936) 5155 Dental Insurance 77,494 79,599 2,105 5160 Vision Insurance 11,396 11,670 274
Total Benefits 2,928,251 2,783,611 (144,640)
Total Salaries & Benefits Expenditures 9,197,655 8,675,484 (522,171)
67

FY 17/18 Budget vs FY 17/18 Estimated Actuals2018 -2019 Budget
Column A Column B (Col. B-Col. A)
Account Expenditure 2017-18 2017-18 2017-18Number Classification Budget Estimated Variance
Operational Expenditures
5210 Chemicals & Compounds 304,600 293,278 (11,322) 5215 Herbicides - - - 5230 Portable Spray Equipment 18,325 16,564 (1,761) 5260 Support Equipment 14,750 10,834 (3,916) 5455 Hazardous Waste 7,520 6,052 (1,468) 5507 Reference Materials 500 100 (400) 5510 Lab Supplies & Equipment 6,000 4,505 (1,495) 5520 Field Supplies & Equipment 12,000 14,166 2,166 5540 Shipping & Testing 74,500 76,607 2,107 5605 Bank/Finance Charges 1,201 2,162 961 5610 Copier Expense 18,000 16,241 (1,759) 5615 Computer Consultant 5,400 - (5,400) 5617 Computer Supplies & Access. 17,870 17,033 (837) 5619 Equipment Repair 1,000 500 (500) 5620 Computer Software 30,250 27,563 (2,687) 5625 Postage 9,150 7,822 (1,328) 5630 Wireless Telephone 38,373 36,857 (1,516) 5635 GPS Tracking 18,760 17,761 (999) 5640 Website & Email Service 18,600 17,267 (1,333) 5655 Office Supplies 19,400 16,523 (2,877) 5660 Printing/Stationary 2,100 4,172 2,072 5665 Payroll Processing Expense 50,000 45,228 (4,772) 5667 Professional/ Temp Services 10,000 - (10,000) 5670 Legal Services 90,000 93,034 3,034 5680 Auditing Contract 30,000 23,233 (6,767) 5683 VCJPA Insurance - Pooled Worker's Compensation 368,032 367,687 (345) 5685 VCJPA Insurance - Pooled Liability Premium 118,339 119,367 1,028 5686 VCJPA Insurance - Pooled Automobile Liability - - - 5687 VCJPA Insurance - Group Property 8,882 16,069 7,187 5690 VCJPA Insurance - Group Fidelity Program 7,504 1,212 (6,292) 5695 VCJPA Insurance - Travel Premium - - - 5700 VCJPA Insurance - General Fund 19,756 19,572 (184) 5703 Earthquake Insurance - - - 5705 Recruitment & Pre-Post Employment Screens 12,000 12,623 623 5707 Meeting/Supplies 9,175 8,544 (631) 5730 Tuition Reimbursement 10,000 6,000 (4,000) 5735 Continuing Education & Seminars 100,108 100,440 332 5745 Manager's Auto Allowance 6,000 6,000 - 5760 Miscellaneous Expense - - - 5765 Safety/Management Training 4,360 2,300 (2,060)
68

FY 17/18 Budget vs FY 17/18 Estimated Actuals2018 -2019 Budget
Column A Column B (Col. B-Col. A)
Account Expenditure 2017-18 2017-18 2017-18Number Classification Budget Estimated Variance
5220 Aerial Support 15,000 15,000 - 5270 Miscellaneous Part & Repair 500 275 (225) 5310 Foot Wear 13,200 11,026 (2,174) 5315 Gloves 490 445 (45) 5320 Coveralls 250 250 - 5325 Uniform Cleaning 34,055 29,864 (4,191) 5330 Towels Supply & Cleaning 7,826 8,084 258 5335 Uniform Caps 3,626 3,625 (1) 5340 Uniform Accessories 200 200 - 5345 Work Apparel 4,145 4,224 79 5350 Logo Patches 2,800 900 (1,900) 5355 Shields 560 280 (280) 5357 Staff Year Pins 250 - (250) 5360 Protective Safety Equipment 12,400 12,258 (142) 5375 Mosquito Fish Supplies & Eq 2,000 2,001 1 5400 Maint. Parts Electric 9,000 10,763 1,763 5410 Vehicle Registration & Fees - - - 5415 Brake and Suspension 10,000 8,076 (1,924) 5420 Tires, Wheels & Alignment 17,000 19,350 2,350 5430 Cooling Sys. Parts & Supplies 6,000 7,180 1,180 5435 Body Repair 10,000 5,708 (4,292) 5445 Fabrication Supplies 3,500 3,961 461 5456 Engine & Transmission Overhaul 25,000 17,791 (7,209) 5475 Trans Chassis & Drive 10,000 7,177 (2,823) 5480 Engine 15,000 16,061 1,061 5485 Fuel 189,225 160,248 (28,977) 5457 Smog Checks 2,500 2,201 (299) 5460 First Aid 1,100 500 (600) 5499 Misc. Maint Parts & Supplies 15,000 14,981 (19) 5637 Two Way Radios 1,025 525 (500) 5675 Advertising 30,000 29,121 (879) 5720 Permits & Fees 8,080 7,697 (383) 5727 Certification Renewals 9,409 9,516 107 5765 Public Info Video - - - 5770 Public Information Materials & Equipment - - - 5775 Photography Expenses 2,500 723 (1,777) 5785 Ed Materials & Supplies - - - 5787 Promotional & Ed. Materials 20,500 18,283 (2,217) 5769 Supplies & Equipment 4,500 2,698 (1,802) 5790 Public Exhibit - 25 25 5793 Media Monitoring Services - - - 5795 Mobile Education Unit 10,000 10,100 100 5815 Janitorial Supplies - 1,264 1,264 6035 Furniture & Fixtures - - -
Total Operational Expenditures 1,959,096 1,849,697 (109,399)
69

FY 17/18 Budget vs FY 17/18 Estimated Actuals2018 -2019 Budget
Column A Column B (Col. B-Col. A)
Account Expenditure 2017-18 2017-18 2017-18Number Classification Budget Estimated Variance
Facilities Maintenance
5333 Floor Mats 1,300 1,585 285 5755 Kitchen Supplies 1,300 1,629 329 5800 Irrigation - - - 5810 Landscape Maint. 25,000 25,356 356 5815 Janitorial Maint. 23,500 28,870 5,370 5820 Pond & Fountain 500 289 (211) 5825 Interior & Exterior Supplies 20,000 20,497 497 5850 HVAC 18,000 13,180 (4,820) 5855 Fixtures & Hardware 6,000 6,897 897 5870 Security Alarm 2,600 3,055 455 5875 Telephone 6,800 8,951 2,151 5877 Internet 29,240 29,944 704 5880 Utilities 80,000 75,819 (4,181) 5885 Water 21,000 22,908 1,908 5890 Waste Disposal 4,000 11,932 7,932
Total Facilities Maintenance Expenditures 239,240 250,909 11,669
Column A Column B (Col. B-Col. A)
Account Expenditure 2017-18 2017-18 2017-18Number Classification Budget Estimated Variance
Capital Outlay6010 Vehicle Purchases - - - 6035 Furniture & Fixtures 2,950 3,700 750 6015 Machinery & Equipment 12,950 13,387 437 6011 Vehicle Setup 2,950 2,993 43 6020 Spray Equipment 1,000 1,001 1 6025 Lab Equipment - - - 6031 Computer Equipment 22,840 17,598 (5,242) 6036 Capital Improvements 5,000 185,000 180,000
Total Capital Outlay 47,690 223,680 175,990
70

FY 17/18 Budget vs FY 17/18 Estimated Actuals2018 -2019 Budget
Column A Column B (Col. B-Col. A)
Account Expenditure 2017-18 2017-18 2017-18Number Classification Budget Estimated Variance
Board of Trustees Operational Expenditures
5710 Trustee-in-Lieu 38,200 35,136 (3,064) 5715 Board Meeting Expenses 6,200 5,102 (1,098) 5735 Continuing Education & Seminars 9,180 9,725 545
Total Operational Expenditures 53,580 49,963 (3,617)
Column A Column B (Col. B-Col. A)
Account Expenditure 2017-18 2017-18 2017-18Number Classification Budget Estimated Variance
5170 Retirees Insurance 317,652 308,489 (9,164) 5645 Memberships 29,055 33,114 4,059 5671 NPDES Monitoring Costs - - - 5672 CEQA Fees - - - 5701 Property Tax Administration Cost 48,232 42,851 (5,381) 5702 L A County Property Tax Administrative Charges 345,000 342,583 (2,417)
Total Operational Expenditures 739,939 727,037 (12,902)
Column A Column B (Col. B-Col. A)
2017-18 2017-18 2017-18RESERVES Budget Estimated Variance
MEU Vehicle Replacement - - - Capital Reserve Fund - - - Retirement Benefit Reserve - - - Emergency Vector Control - - -
Total Reserves - - -
71

Greater Los Angeles County Vector Control DistrictFive Year Projection
FY 17/18 FY 18/19 FY 19/20 FY20/21 FY 21/22Proposed Projected* Projected* Projected* Projected*
Revenues
Property 1,684,400$ 1,701,289$ 1,718,302$ 1,735,513$ 1,752,897$ Supplemental Property 128,600 129,237 116,926 117,174 117,422 General Assessment 14,514,354 14,326,433 14,708,713 14,946,936 15,301,240 Miscellaneous Receipts 120,000 112,000 112,000 112,000 112,000
Total Revenues 16,447,354$ 16,268,959$ 16,655,940$ 16,911,623$ 17,283,559$
Operating Expenditures
Salaries and Benefits 11,080,098$ 11,459,114 12,149,785 12,406,246 12,689,440 Maintenance and Operations 3,746,412 4,159,845 3,851,155 3,875,376 3,964,119 Capital Outlay 720,845 50,000 55,000 30,000 30,000 Restricted and Designated Reserves 900,000 600,000 600,000 600,000 600,000
Total Operating Expenditures 16,447,354$ 16,268,959$ 16,655,940$ 16,911,622$ 17,283,558$
Proposed/Projected Adjustment -$ (0)$ 0$ 0$ 0$
Net Operating Surplus/(Deficit) (0) (0) 0 0 0
* Projected figures are based on historical revenue and expenditure data. Future year projections are estimates only and have not been approved by the Board of Trustees. These figures are for forecasting purposes only.
72

GREATER LOS ANGELES COUNTY VECTOR CONTROL DISTRICTFIVE YEAR PROJECTION
REVENUE 2018-19 2019-20 2020-21 2021-22 2022-23Budget Projection Projection Projection Projection
PropertySecured, Current 1,690,000 1,706,900 1,723,969 1,741,209 1,758,621 Unsecured, Current 1,600 1,603 1,619 1,627 1,635 Secured, Prior (7,800) (7,816) (7,894) (7,933) (7,973) Unsecured, Prior 600 601 607 610 613
Supplemental Property - - Current 25,000 25,050 25,301 25,427 25,554 Prior 4,000 4,008 4,048 4,068 4,089 Other Fines, Forfeitures & Penalties 73,000 73,146 73,219 73,292 73,366 Interest (LA County Account) 15,000 15,030 2,300 2,300 2,300 Other State-In-Lieu Taxes 6,100 6,500 6,500 6,500 6,500 Homeowner Prop Tax Relief 1,500 1,503 1,518 1,526 1,533 Intergovernmental Revenue-State - - - - - Intergovernmental Revenue-Other 4,000 4,000 4,040 4,060 4,081 Miscellaneous Receipts 120,000 112,000 112,000 112,000 112,000 Black Fly Assessment 92,000 92,000 92,000 92,000 92,000 General Assessment 14,422,354 14,234,433 14,616,713 14,854,936 15,209,240
Total Revenue 16,447,354 16,268,959 16,655,940 16,911,623 17,283,559
EXPENDITURES 2018-19 2019-20 2020-21 2021-22 2022-23Budget Projection Projection Projection Projection
Salaries & Benefits 11,080,098 11,459,114 12,149,785 12,406,246 12,689,440 Maintenance & Operations 3,746,412 4,159,845 3,851,155 3,875,376 3,964,119 Capital Outlay 720,845 50,000 55,000 30,000 30,000 Restricted and Designated Reserves 900,000 600,000 600,000 600,000 600,000
Total Expenditures 16,447,354 16,268,959 16,655,940 16,911,622 17,283,558
NET INCOME (0) (0) 0 0 0
73

GREATER LOS ANGELES COUNTY VECTOR CONTROL DISTRICTFIVE YEAR PROJECTION
2018-19 2019-20 2020-21 2021-22 2022-23RESERVES Budget Projection Projection Projection Projection
Capital Designated Reserves - - - - - Operations Designated Reserves - - - - - Retirement Benefits Designated Reserves - - - - MEU Replacement Restricted Reserves - - - - - Emergency Vector Control Restricted Reserves - - - - -
Total Reserves - - - - -
2018-19 2019-20 2020-21 2021-22 2022-23CASH FLOW ACCOUNTS (UNRESTRICTED) Budget Projection Projection Projection Projection
L.A.I.F. Cash Flow - - - - -
Banc of California (Payroll and Accounts Payable) - - - - -
Total Fund Balances - - - - -
2018-19 2019-20 2020-21 2021-22 2022-23DESIGNATED RESERVE ACCOUNTS (L.A.I.F.) Budget Projection Projection Projection Projection
Capital Designated Reserves - - - - - Operations Designated Reserves - - - - - Retirement Benefits Reserves - - - - -
Total Fund Balances - - - - -
2018-19 2019-20 2020-21 2021-22 2022-23RESTRICTED RESERVE ACCOUNTS Budget Projection Projection Projection Projection
County Treasurer Fund - - - - - MEU Vehicle Replacement (L.A.I.F.) - - - - - Emergency Disease Reserve (L.A.I.F.) - - - - - VCJPA Member Contingency Fund - - - - - VCJPA Property Contingency Fund - - - - -
Total Fund Balances - - - - -
2018-19 2019-20 2020-21 2021-22 2022-23GRAND TOTALS OF FUND BALANCES Budget Projection Projection Projection Projection
Grand Total of Fund Balances - - - - -
74

GREATER LOS ANGELES COUNTY VECTOR CONTROL DISTRICTFIVE YEAR PROJECTION
Budget Summary 2018-19 2019-20 2020-21 2021-22 2022-23Budget Projection Projection Projection Projection
Salaries & Benefits 11,080,098 11,459,114 12,149,785 12,406,246 12,689,440 Operational Expenditures 2,525,484 2,938,215 2,596,917 2,589,092 2,644,578 Facilities Maintenance 281,200 257,672 262,789 268,101 273,415 Board of Trustees 53,125 53,912 54,000 54,089 54,179 Other Expenditures 886,603 910,046 937,448 964,094 991,947 Restricted and Designated Reserves 900,000 600,000 600,000 600,000 600,000 Capital Outlay 720,845 50,000 55,000 30,000 30,000
Total Expenditures 16,447,354 16,268,959 16,655,940 16,911,622 17,283,558
Personnel Summary
Full-time Positions
Account Expenditure 2018-19 2019-20 2020-21 2021-22 2022-23Number Classification Budget Projection Projection Projection Projection
Salaries5005 General Manager/CEO 170,568 173,979 187,898 191,656 195,489 5010 Director of Human Resources 109,473 111,662 120,595 123,007 125,467 5015 Director of Fiscal Operations 109,473 111,662 120,595 123,007 125,467 5017 Information Technology Administrator 101,587 103,619 109,836 112,032 114,273 5020 Human Resources Assistant 61,961 63,200 68,256 69,621 71,013 5025 District Secretary 57,165 58,308 62,973 64,232 65,517 5018 Accounting Clerk 63,357 57,332 64,009 65,290 66,595 5019 Benefits Specialist 66,410 67,738 73,157 70,475 71,885 5030 Operations Assistant (2) 105,060 107,161 115,734 118,049 120,410 5035 Director of Operations 116,295 118,621 128,111 130,673 133,287 5040 Operations Supervisor (3) 292,598 298,450 322,326 328,773 335,348 5050 Vector Control Specialist (49) 3,640,370 3,713,178 4,010,232 4,090,436 4,172,245 5054 Urban Water Program Manager 97,533 96,583 104,310 100,485 102,495 5052 Database analyst 79,598 81,190 87,686 89,439 91,228 5055 GIS/IT Coordinator 67,940 69,299 74,843 72,099 73,541 5060 Director of Scientific Technical Services 116,295 118,621 128,111 130,673 133,287 5065 Vector Ecologist (4) 363,335 370,601 400,249 408,254 416,419 5070 Assistant Vector Ecologist (2) 159,048 324,459 350,416 357,424 364,572 5071 Field Assistant (2) 75,025 78,269 84,531 81,431 83,060 5073 Director of Community Affairs 112,760 115,015 124,217 126,701 129,235 5075 Public Information Officer 86,038 87,759 94,779 96,675 98,609 5084 Community Liaisons (3) 166,749 170,084 183,690 187,364 191,112 5085 Education Program Coordinators (2) 141,866 144,703 156,280 159,405 162,593 5086 Outreach Assistant 48,921 49,899 53,891 54,969 56,068 5090 Maintenance Supervisor 81,048 82,669 89,282 91,068 92,889 5095 Maintenance Mechanic (5) 379,341 386,928 417,882 426,239 434,764 5100 Seasonal Help (36) 673,200 673,200 673,200 673,200 673,200 5110 Overtime 45,500 45,500 45,500 45,500 45,500
Total Salaries 7,588,514 7,879,689 8,452,587 8,588,178 8,745,568
Benefits5115 Sick Payout 77,326 66,000 66,000 66,000 66,000 5120 Vacation Payout 67,446 48,000 48,000 48,000 48,000 5130 Medicare & FICA 154,074 163,532 166,803 170,139 173,542 5133 Short Term Disability 33,703 34,097 34,779 35,475 36,185 5135 SUI 73,125 72,628 72,628 72,628 72,628 5140 PERS 1,266,159 1,291,482 1,317,312 1,343,658 1,370,531 5145 ICMA 401(a) 235,100 239,802 244,598 249,490 254,480 5150 Health Insurance 1,493,743 1,568,430 1,646,851 1,729,194 1,815,654 5155 Dental Insurance 79,512 83,488 87,662 90,292 93,001 5160 Vision Insurance 11,396 11,966 12,565 13,193 13,852
Total Benefits 3,491,584 3,579,425 3,697,198 3,818,068 3,943,872
Total Salaries & Benefits Expenditures 11,080,097 11,459,114 12,149,785 12,406,246 12,689,440
75

GREATER LOS ANGELES COUNTY VECTOR CONTROL DISTRICTFIVE YEAR PROJECTION
Account Expenditure 2018-19 2019-20 2020-21 2021-22 2022-23Number Classification Budget Projection Projection Projection Projection
Operational Expenditures
5210 Chemicals & Compounds 423,850 428,089 432,369 434,531 436,704 5215 Herbicides - - - - - 5230 Portable Spray Equipment 10,650 10,757 10,864 10,973 11,082 5260 Support Equipment 27,960 28,240 28,522 28,807 29,095 5455 Hazardous Waste 7,520 7,595 7,671 7,748 7,825 5507 Reference Materials 500 505 510 515 520 5510 Lab Supplies & Equipment 6,000 6,060 6,121 6,182 6,244 5520 Field Supplies & Equipment 14,000 14,140 14,281 14,424 14,568 5540 Shipping & Testing 77,050 82,050 83,691 82,712 84,366 5605 Bank/Finance Charges 20,000 20,000 20,000 20,000 20,000 5610 Copier Expense 18,000 18,180 18,362 18,545 18,731 5615 Computer Consultant 35,400 - - - - 5617 Computer Supplies & Access. 17,400 17,544 17,895 18,253 18,618 5619 Equipment Repair 1,000 1,000 1,000 1,000 1,000 5620 Computer Software 26,240 26,765 27,290 27,835 28,381 5625 Postage 7,950 8,030 8,110 8,191 8,273 5630 Wireless Telephone 70,870 74,414 78,134 82,041 83,682 5635 GPS Tracking 21,568 22,646 23,779 24,968 25,467 5640 Internet/Website Service 71,067 72,488 81,338 19,731 20,125 5655 Office Supplies 23,250 23,483 23,717 23,954 24,194 5660 Printing/Stationary 3,100 3,131 3,162 3,194 3,226 5665 Payroll Processing Expense 46,240 46,702 47,169 47,641 48,118
Salary Study and Potential Salary Increase - 425,281 - - - 5667 Professional/ Temp Services 50,000 30,000 30,000 30,000 30,000 5670 Legal Services 110,000 90,000 90,000 90,000 90,000 5680 Auditing Contract 30,000 31,000 32,000 32,000 32,000 5683 VCJPA Insurance - Pooled Worker's Compensation 414,604 447,773 483,594 507,774 533,163 5685 VCJPA Insurance - Pooled Liability Premium 134,253 144,993 156,593 164,422 172,643 5686 VCJPA Insurance - Pooled Automobile Liability - - - - - 5687 VCJPA Insurance - Group Property 18,111 19,559 21,124 22,814 24,639 5690 VCJPA Insurance - Group Fidelity Program 1,370 1,480 1,598 1,726 1,864 5695 VCJPA Insurance - Travel Premium - - - - - 5700 VCJPA Insurance - General Fund 22,135 23,905 25,818 27,883 30,114
Earthquake Insurance 26,600 27,000 27,500 28,000 28,500 5705 Pre-Post Employment Screens 19,600 19,796 19,994 20,194 20,396 5707 Meeting/Supplies 11,300 11,300 11,300 11,300 11,300 5730 Tuition Reimbursement 10,000 10,000 10,000 10,000 10,000 5735 Continuing Education & Seminars 105,479 117,454 118,628 119,815 121,013 5745 Manager's Auto Allowance 6,000 6,000 6,000 6,000 6,000 5760 Miscellaneous Expense 150 150 150 150 150 5765 Safety/Management Training 4,000 4,000 4,000 4,000 4,000
76

GREATER LOS ANGELES COUNTY VECTOR CONTROL DISTRICTFIVE YEAR PROJECTION
Account Expenditure 2018-19 2019-20 2020-21 2021-22 2022-23Number Classification Budget Projection Projection Projection Projection
5220 Aerial Support 22,500 22,500 22,500 22,500 22,500 5270 Miscellaneous Part & Repair 600 600 600 600 600 5310 Foot Wear 17,400 17,400 17,400 17,400 17,400 5315 Gloves 715 722 729 737 744 5320 Coveralls 800 808 816 824 832 5325 Uniform Cleaning 38,100 38,481 38,866 39,254 39,647 5330 Towels Supply & Cleaning 10,720 10,827 10,935 11,045 11,155 5335 Uniform Caps 5,980 1,000 1,000 1,000 1,000 5340 Uniform Accessories 970 970 970 970 970 5345 Work Apparel 9,120 9,211 9,303 9,396 9,490 5350 Logo Patches 900 - - - - 5355 Shields 1,625 1,625 1,625 1,625 1,625 5357 Staff Year Pins 1,200 1,200 1,200 1,200 1,200 5360 Protective Safety Equipment 17,600 17,776 17,954 18,133 18,315 5375 Mosquito Fish Supplies & Eq 2,500 2,525 2,550 2,576 2,602 5400 Maint. Parts Electric 9,000 9,000 9,200 9,500 9,500 5410 Vehicle Registration & Fees - - - - - 5415 Brake and Suspension 10,000 10,200 10,404 10,612 10,824 5420 Tires, Wheels & Alignment 17,000 17,340 17,687 18,041 18,402 5430 Cooling Sys. Parts & Supplies 6,000 6,120 6,242 6,367 6,494 5435 Body Repair 10,000 10,200 10,404 10,612 10,824 5445 Fabrication Supplies 3,500 3,500 3,500 3,500 3,500 5456 Engine & Transmission Overhaul 20,000 20,000 20,000 20,000 20,000 5475 Trans Chassis & Drive 10,000 10,000 10,000 10,000 10,000 5480 Engine 15,000 15,500 16,000 16,500 17,000 5485 Fuel 251,915 255,694 259,529 262,124 264,746 5457 Smog Checks 2,500 2,500 2,500 2,700 3,000 5460 First Aid 18,500 1,200 1,200 1,300 1,300 5499 Misc. Maint Parts & Supplies 23,900 24,378 24,866 25,363 25,870 5637 Two Way Radios 1,025 1,025 1,025 1,025 1,025 5675 Advertising 30,000 30,375 30,755 31,139 31,528 5720 Permits & Fees 12,020 12,140 12,262 12,384 12,508 5727 Certification Renewals 12,877 13,006 13,136 13,267 13,400 5765 Public Info Video - - - - - 5770 Public Information Materials & Equipment - - - - - 5775 Photography Expenses 1,300 1,313 1,326 1,339 1,353 5785 Ed Materials & Supplies - - - - - 5787 Promotional & Ed. Materials 32,500 32,825 33,153 33,485 33,820 5769 Supplies & Equipment 4,500 4,545 4,590 4,636 4,683 5790 Public Exhibit - - - - - 5793 Media Monitoring Services - - - - - 5795 Mobile Education Unit 10,000 10,200 10,404 10,612 10,718 5815 Janitorial Supplies - - - - -
Total Operational Expenditures 2,525,484 2,938,215 2,596,917 2,589,092 2,644,578
77

GREATER LOS ANGELES COUNTY VECTOR CONTROL DISTRICTFIVE YEAR PROJECTION
Account Expenditure 2018-19 2019-20 2020-21 2021-22 2022-23Number Classification Budget Projection Projection Projection Projection
Facilities Maintenance
5333 Floor Mats 1,300 1,500 1,600 1,700 1,800 5755 Kitchen Supplies 1,450 1,800 1,900 2,000 2,100 5800 Irrigation - - - - - 5810 Landscape Maint. 25,000 25,500 26,010 26,530 27,061 5815 Janitorial Maint. 27,500 23,970 24,449 24,938 25,437 5820 Pond & Fountain 500 525 550 575 600 5825 Interior & Exterior Supplies 40,750 31,365 31,992 32,632 33,285 5850 HVAC 18,000 18,360 18,727 19,102 19,484 5855 Fixtures & Hardware 19,500 8,670 8,843 9,020 9,200 5870 Security Alarm 2,600 2,650 2,700 2,750 2,800 5875 Telephone 12,600 12,852 13,109 13,371 13,639 5877 Internet 18,000 18,360 18,727 19,102 19,484 5880 Utilities 80,000 81,600 83,232 84,897 86,595 5885 Water 23,000 21,420 21,848 22,285 22,731 5890 Waste Disposal 11,000 9,100 9,100 9,200 9,200
Total Facilities Maintenance Expenditures 281,200 257,672 262,789 268,101 273,415
Account Expenditure 2018-19 2019-20 2020-21 2021-22 2022-23Number Classification Budget Projection Projection Projection Projection
Capital Outlay6010 Vehicle Purchases 472,000 - - - - 6035 Furniture & Fixtures 18,800 10,000 15,000 15,000 15,000 6015 Machinery & Equipment 37,745 - - - - 6011 Vehicle Setup 76,000 - - - - 6020 Spray Equipment 7,900 - - - - 6025 Lab Equipment - - - - - 6031 Computer Equipment 40,900 25,000 25,000 - - 6036 Capital Improvements 67,500 15,000 15,000 15,000 15,000
Total Capital Outlay 720,845 50,000 55,000 30,000 30,000
Account Expenditure 2018-19 2019-20 2020-21 2021-22 2022-23Number Classification Budget Projection Projection Projection Projection
Board of Trustees Operational Expenditures
5710 Trustee-in-Lieu 38,200 38,600 38,600 38,600 38,600 5715 Board Meeting Expenses 6,200 6,500 6,500 6,500 6,500 5735 Continuing Education & Seminars 8,725 8,812 8,900 8,989 9,079
Total Operational Expenditures 53,125 53,912 54,000 54,089 54,179
78
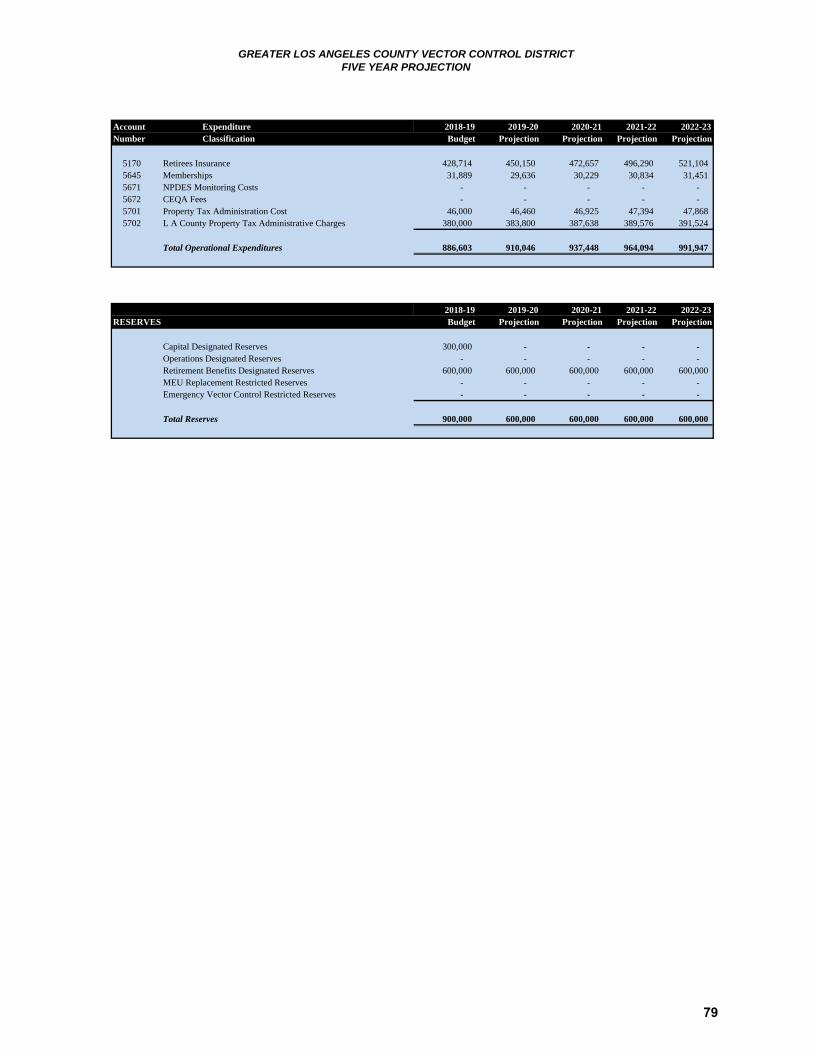
GREATER LOS ANGELES COUNTY VECTOR CONTROL DISTRICTFIVE YEAR PROJECTION
Account Expenditure 2018-19 2019-20 2020-21 2021-22 2022-23Number Classification Budget Projection Projection Projection Projection
5170 Retirees Insurance 428,714 450,150 472,657 496,290 521,104 5645 Memberships 31,889 29,636 30,229 30,834 31,451 5671 NPDES Monitoring Costs - - - - - 5672 CEQA Fees - - - - - 5701 Property Tax Administration Cost 46,000 46,460 46,925 47,394 47,868 5702 L A County Property Tax Administrative Charges 380,000 383,800 387,638 389,576 391,524
Total Operational Expenditures 886,603 910,046 937,448 964,094 991,947
2018-19 2019-20 2020-21 2021-22 2022-23RESERVES Budget Projection Projection Projection Projection
Capital Designated Reserves 300,000 - - - - Operations Designated Reserves - - - - - Retirement Benefits Designated Reserves 600,000 600,000 600,000 600,000 600,000 MEU Replacement Restricted Reserves - - - - - Emergency Vector Control Restricted Reserves - - - - -
Total Reserves 900,000 600,000 600,000 600,000 600,000
79

GREATER LOS ANGELES COUNTY VECTOR CONTROL DISTRICT
5-Year Strategic Plan
Introduction
The mission of the Greater Los Angeles County Vector Control District is to protect public health against vectors and vector-borne diseases through a comprehensive control, surveillance, and public education programs. Our continuing battle against invasive vectors and disease threats like the ones posed by Aedes aegypti, Aedes albopictus, and Aedes notoscriptus, as well as increasing environmental regulations, new legislation, and changes in technology, drive the District to be proactive in addressing future budgetary challenges. Summary
Beginning in November 2017, two strategic planning sessions were held with senior-level staff to discuss current and future threats and prioritize District needs. In the next five years, top budget priorities can be organized under five areas:
1. Staffing and Pay 2. Space 3. Equipment/Vehicles 4. Information Technology Infrastructure 5. OPEB/Pension Liabilities
It is the District’s goal to maintain a level of responsiveness that reduces risk of disease transmission and provide residents with the service and education they are accustomed to. In order to maintain a 48-hour turnaround on service requests and reduce the burden of overtime on staff, the District must focus on adding field staff and resources. However, with the addition of field staff comes the need for more administrative and maintenance support. Therefore, staffing must be reviewed across all departments. At the same time, the District must have the ability to retain and recruit top-notch employees. Conducting salary surveys across the industry and between other government agencies will help the District remain competitive. The growth of our employee population is putting a strain on the current office and parking availability at both facilities. It will, therefore, be necessary to begin exploring options for building expansion. Not only will additional office space be needed, the parking lots must be redesigned to accommodate more vehicles and the lockers must be expanded to allow room to change in and out of uniforms. The District is already looking at reconfiguring cubicles and turning library space into offices for FY 18/19. Equipment and vehicles are critical to the District’s work and mission. With a fleet of more than 100 vehicles, maintaining and replacing field trucks will be an on-going job for maintenance staff. At the same time, they will continue to fabricate and innovate new tools to be used against above- and below-ground menaces. Management staff strongly believe that the District should provide field staff with the tools they need to do their jobs and do their jobs well. Keeping up with new computers and information technology hardware and software while maintaining data security will also be a priority for IT staff. A major goal for management staff
80

is to strengthen communications between the Santa Fe Springs and Sylmar offices. This includes improving telephone and teleconferencing capabilities and inter-office connectivity. Part of that will be addressed with the transition to fiber to increase internet speeds at both offices. Finally, the District’s post-employment liabilities including OPEB and CalPERS pensions must be addressed through prudent funding of future liabilities. Currently, the use of a CERBT Trust allows the District to re-allocate any surplus funds towards OPEB liabilities as the District is able. However, existing OPEB reserves will soon be insufficient to fund the growing annual required contributions.
Department Projections
Each District department conducted its own SWOT analysis to identify its strengths, weaknesses, opportunities and threats. With this information, strategic plans and corresponding needs were identified for the next five years.
Operations Field Data Entry Tablets A field data entry system has been rolled-out to streamline data collection, allow the Vector Control Specialist (VCS) access to the treatment history for any given source, provide extensive and real time mapping of sources and allow service requests to be forwarded to enhance response time and improve service. As technology changes, tablets will need to be upgraded every few years. GIS/Mapping The hiring of a GIS Coordinator will greatly improve the District’s mapping and trend analysis capabilities. Over the next five years, the District anticipates improving GIS technologies and mapping software. Urban Storm Water Program Currently, the District is working with municipalities, public works departments, and the State Water Resources Control Board to review storm water structure devices and their designs. Management staff project the need to expand the program with additional personnel to map, monitor, and treat hundreds of thousands of underground stormwater capture devices which are prime mosquito breeding sites. At this point, vector control agencies throughout California have only scratched the surface of the problem. Vehicles Over the past few years, the District has been working to steadily replace its fleet of aging field vehicles. Given the large size of our fleet, this task will continue as we implement a schedule compliant with the District’s vehicle replacement policy. We have prioritized those trucks that have more than 100,000 miles on them. It is at this turning point where the cost of repairs starts escalating rapidly to keep them cosmetically appealing, safe, and road worthy. The five major areas to consider when making a decision to retire a vehicle are: 1. Days out of Service 2. Hours / Time to repair
81

3. Cost of repairs4. Availability of parts5. Lifespan of the vehicle, which is determined by age and mileage.
Every other year, our vehicles are required to pass a smog test. If they do fail, the cost of parts alone can easily exceed the value of an aging vehicle. Therefore, the District aims to continue replacing these high mileage vehicles with a new, reliable fleet.
Scientific-Technical Services
Staff The Scientific-Technical Services (S-TS) Department currently has 4 staff members in each office. Two Vector Ecologists, one Assistant Vector Ecologist and a Field Assistant in Sylmar and the S-TS Director, two Vector Ecologists and a Field Assistant in Santa Fe Springs. Since the creation of the S-TS Director position, this staff member has been regarded as a working supervisor. Due to the increasing administrative and leadership demands posed by emerging disease threats, environmental compliance issues and local as well as statewide collaborations, the S-TS Director’s ability to participate in routine field work had been drastically diminished. In order to keep up with current workload demands, an Assistant Vector Ecologist has been added in FY 18/19 in Santa Fe Springs. As Aedes surveillance expands and new mosquito-borne threats emerge, additional staff will be needed to assist with surveillance as well as bioassays and other research projects related to pesticide resistance and treatment susceptibility.
Vehicles Vehicles assigned to Scientific-Technical Services are not as heavily used on a daily basis as those of the vector control specialists, but surveillance sites and chicken flocks are widely distributed throughout the service area and long distances must be traveled to set and retrieve mosquito traps and tend to sentinel chicken cages. Vehicle reliability is paramount to complete all of the Department’s business. Pursuant to evaluations of maintenance costs, down-time due to vehicle failure, and repair costs, it is expected that the District will need to replace additional lab vehicles over the next five years.
Community Affairs
The Community Affairs Department strives to increase the number of residents and constituents reached through community events, presentations, and youth education programs. This is important to increase awareness and understanding of the District’s services and the role our agency plays in protecting public health in the community. With the continued spread of invasive Aedes mosquitoes, it has become most critical to convert this knowledge into long-standing behavior change. Increases in department expenditures will occur in three main areas: administration, public information, and youth education.
Administration Projected increases in the Department’s long-term administrative costs include the addition of outreach personnel to facilitate greater contact with schools and communities, particularly in Aedes infestation zones and the northern portion of the District where WNV poses a more
82

consistent annual threat. The addition of much-needed community outreach staff will increase visibility and reduce reliance on operations staff and overtime accruals. Within the next five years, the Department would like to add an additional Mobile SWAT Lab and two Education Program Coordinators based out of the Sylmar office to increase outreach and availability to Valley schools.
Public Education and Partnerships Over the next five years, the need to expand awareness will be driven by changing environmental conditions (drought, heat), increasing regulatory burdens, and new vectors and disease threats in Los Angeles County. Dissemination of public information to residents, the media, and the general public through traditional and novel strategies and partnerships will increase visibility and ensure residents better understand the role of vectors and vector-borne disease in their environment.
The District continues to explore opportunities to partner with existing educational facilities including the Los Angeles Discovery Cube, Los Angeles Zoo, and the Natural History Museum, and local nature centers, and hopes to develop teacher-training opportunities for area educators. The Department will request additional funds to continue this process and expand these opportunities as resources permit. We will continue to focus on programs which provide the greatest return on investment.
Vehicles With the addition of the new Mobile SWAT Lab and Ford Flex to our Department, vehicle expenses should be minimal. In approximately 4 years, it is recommended we replace the tires on the SWAT Lab and the vehicle wrap may need refreshing. Additionally, electronic equipment on the SWAT Lab will require upgrades as technology advances.
Administration
Document Management System (DMS) The District will be archiving operational and administrative documents electronically in FY 18/19. The District has retained personnel and financial documents according to document retention policies, but storage space for paper files is limited. DMS document scanning services are available to organize and digitally archive files with searchable options.
Information Technology
IT hardware and software must continually be updated. The IT Administrator will roll out and install new Windows 10 desktop computers in Sylmar and Santa Fe Springs. At the same time, he will look to update the District’s firewall and router systems to ensure a secure infrastructure. The purchase of additional accounting, help desk and employee training software is also projected in the next couple of years.
Disaster Response and Recovery Natural disasters such as fires, floods, and earthquakes can occur without warning and the District must have contingency plans in place to remain operational. The District is currently
83

researching options for earthquake and flood insurance and implementing strategies for database and file back-ups and recovery through offsite Cloud-based services.
Facilities and Maintenance
Santa Fe Springs Maintenance Building Roof The District’s Santa Fe Springs maintenance building roof has multiple leaks that require yearly patching and repair. The roof is the same style and age as the main building, which recently underwent a complete resurfacing. Contractors would perform the same resurfacing on the garage roof using a heat reflective foam product with a 20-year warranty.
Operations Department Building Expansion The operations staff has grown significantly since the main office in Santa Fe Springs was built. With a conservative 400 square foot addition that would stay within the building’s footprint, an additional office as well as 6 additional staff areas can be built.
84

GREATER LOS ANGELES COUNTY VECTOR CONTROL DISTRICTSALARY SCALE
18/19
EMPLOYEE POSITIONSNo. of
EXEMPT (E) Full-Time Employees Step 1 Step 2 Step 3 Step 4 Step 5
Director of Scientific-Technical Services 1 7,801 8,237 8,579 9,177 9,691 Monthly3,901 4,118 4,289 4,589 4,846 Semi-Monthly45.01 47.52 49.49 52.95 55.91 Hourly
Director of Operations 1 7,801 8,237 8,579 9,177 9,691 Monthly3,901 4,118 4,289 4,589 4,846 Semi-Monthly45.01 47.52 49.49 52.95 55.91 Hourly
Director of Human Resources 1 7,345 7,752 8,185 8,642 9,123 Monthly3,672 3,876 4,093 4,321 4,561 Semi-Monthly42.37 44.72 47.22 49.86 52.63 Hourly
Director of Fiscal Operations 1 7,345 7,752 8,185 8,642 9,123 Monthly3,672 3,876 4,093 4,321 4,561 Semi-Monthly42.37 44.72 47.22 49.86 52.63 Hourly
Director of Community Affairs 1 7,565 7,985 8,432 8,900 9,397 Monthly3,783 3,992 4,216 4,450 4,698 Semi-Monthly43.65 46.06 48.64 51.35 54.21 Hourly
Information Technology Administrator 1 6,817 7,195 7,595 8,019 8,466 Monthly3,408 3,597 3,798 4,009 4,233 Semi-Monthly39.33 41.51 43.82 46.26 48.84 Hourly
GIS/IT Coordinator 1 5,111 5,386 5,662 5,937 6,213 Monthly2,555 2,693 2,831 2,968 3,106 Semi-Monthly29.49 31.07 32.66 34.25 35.84 Hourly
Database Analyst 1 5,333 5,631 5,947 6,282 6,633 Monthly2,667 2,816 2,974 3,141 3,317 Semi-Monthly30.77 32.49 34.31 36.24 38.27 Hourly
Urban Water Program Manager 1 6,539 6,907 7,292 7,698 8,128 Monthly3,270 3,454 3,646 3,849 4,064 Semi-Monthly37.73 39.85 42.07 44.41 46.89 Hourly
1
85
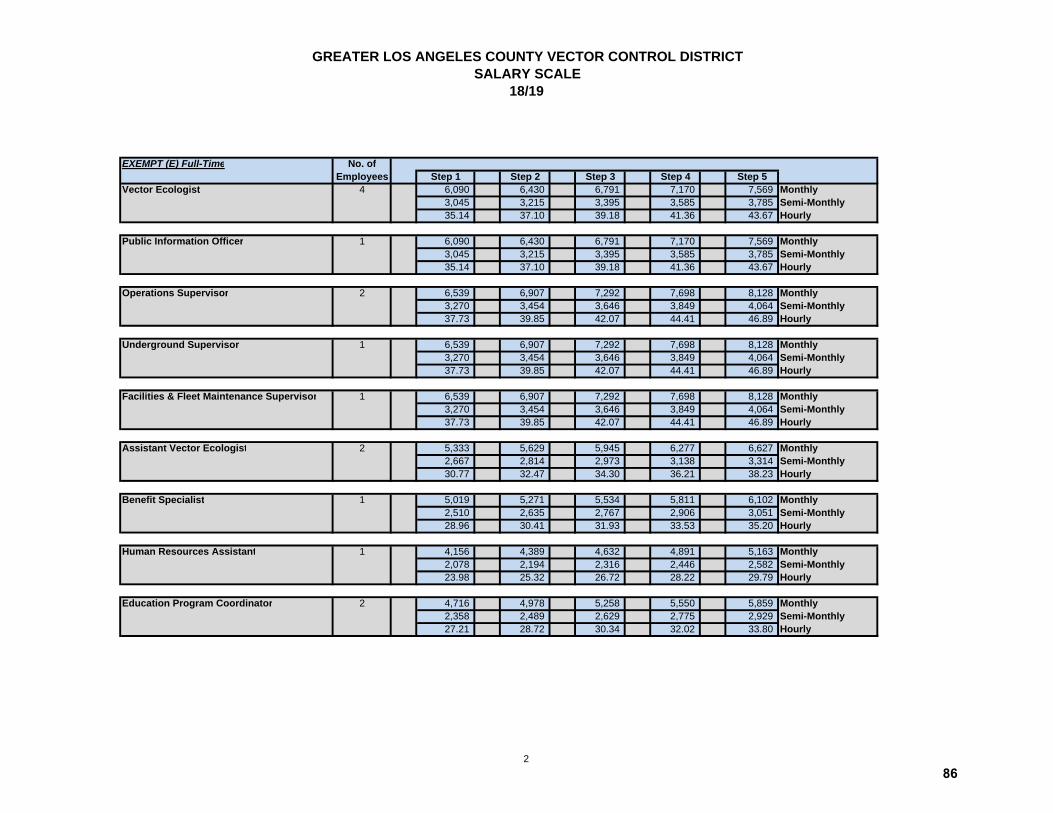
GREATER LOS ANGELES COUNTY VECTOR CONTROL DISTRICTSALARY SCALE
18/19
EXEMPT (E) Full-Time No. ofEmployees Step 1 Step 2 Step 3 Step 4 Step 5
Vector Ecologist 4 6,090 6,430 6,791 7,170 7,569 Monthly3,045 3,215 3,395 3,585 3,785 Semi-Monthly35.14 37.10 39.18 41.36 43.67 Hourly
Public Information Officer 1 6,090 6,430 6,791 7,170 7,569 Monthly3,045 3,215 3,395 3,585 3,785 Semi-Monthly35.14 37.10 39.18 41.36 43.67 Hourly
Operations Supervisor 2 6,539 6,907 7,292 7,698 8,128 Monthly3,270 3,454 3,646 3,849 4,064 Semi-Monthly37.73 39.85 42.07 44.41 46.89 Hourly
Underground Supervisor 1 6,539 6,907 7,292 7,698 8,128 Monthly3,270 3,454 3,646 3,849 4,064 Semi-Monthly37.73 39.85 42.07 44.41 46.89 Hourly
Facilities & Fleet Maintenance Supervisor 1 6,539 6,907 7,292 7,698 8,128 Monthly3,270 3,454 3,646 3,849 4,064 Semi-Monthly37.73 39.85 42.07 44.41 46.89 Hourly
Assistant Vector Ecologist 2 5,333 5,629 5,945 6,277 6,627 Monthly2,667 2,814 2,973 3,138 3,314 Semi-Monthly30.77 32.47 34.30 36.21 38.23 Hourly
Benefit Specialist 1 5,019 5,271 5,534 5,811 6,102 Monthly2,510 2,635 2,767 2,906 3,051 Semi-Monthly28.96 30.41 31.93 33.53 35.20 Hourly
Human Resources Assistant 1 4,156 4,389 4,632 4,891 5,163 Monthly2,078 2,194 2,316 2,446 2,582 Semi-Monthly23.98 25.32 26.72 28.22 29.79 Hourly
Education Program Coordinator 2 4,716 4,978 5,258 5,550 5,859 Monthly2,358 2,489 2,629 2,775 2,929 Semi-Monthly27.21 28.72 30.34 32.02 33.80 Hourly
2
86

GREATER LOS ANGELES COUNTY VECTOR CONTROL DISTRICTSALARY SCALE
18/19
Non-Exempt (N) Full-Time No. ofEmployees Step 1 Step 2 Step 3 Step 4 Step 5
Vector Control Specialist (IV) 4 5,404 5,705 6,026 6,357 6,714 Monthly(MCC+ TIVCC + VVCC) 2,702 2,853 3,013 3,179 3,357 Semi-Monthly
31.18 32.91 34.76 36.68 38.73 Hourly
Vector Control Specialist (III) 29 5,273 5,566 5,878 6,203 6,550 Monthly(MCC+ TIVCC + VVCC) 2,636 2,783 2,939 3,101 3,275 Semi-Monthly
30.42 32.11 33.91 35.78 37.79 Hourly
Vector Control Specialist (II) 8 5,195 5,487 5,792 6,115 6,455 Monthly(MCC + TIVCC or VVCC) 2,598 2,743 2,896 3,058 3,228 Semi-Monthly
29.97 31.65 33.41 35.28 37.24 Hourly
Vector Control Specialist (I) 8 5,117 5,401 5,707 6,038 6,357 Monthly(MCC) 2,559 2,701 2,854 3,019 3,179 Semi-Monthly
29.52 31.16 32.93 34.83 36.68 Hourly
Maintenance Mechanic 5 5,195 5,487 5,792 6,115 6,455 Monthly2,598 2,743 2,896 3,058 3,228 Semi-Monthly29.97 31.65 33.41 35.28 37.24 Hourly
Laboratory Field Assistant 2 2,779 2,934 3,099 3,273 3,457 Monthly1,389 1,467 1,550 1,637 1,728 Semi-Monthly16.03 16.93 17.88 18.88 19.94 Hourly
Accounting Clerk 1 4,272 4,505 4,749 5,008 5,280 Monthly2,136 2,253 2,375 2,504 2,640 Semi-Monthly24.65 25.99 27.40 28.89 30.46 Hourly
Community Liaison 3 4,156 4,389 4,632 4,891 5,163 Monthly2,078 2,194 2,316 2,446 2,582 Semi-Monthly23.98 25.32 26.72 28.22 29.79 Hourly
Outreach Assistant 1 2,779 3,103 3,428 3,752 4,077 Monthly1,389 1,552 1,714 1,876 2,038 Semi-Monthly16.03 17.90 19.78 21.65 23.52 Hourly
District Secretary 1 3,835 4,048 4,272 4,511 4,764 Monthly1,917 2,024 2,136 2,256 2,382 Semi-Monthly22.12 23.35 24.65 26.03 27.48 Hourly
Operations Assistant 2 3,525 3,720 3,929 4,147 4,378 Monthly1,762 1,860 1,965 2,073 2,189 Semi-Monthly20.33 21.46 22.67 23.92 25.25 Hourly
3
87

GREATER LOS ANGELES COUNTY VECTOR CONTROL DISTRICTSALARY SCALE
18/19
Extra Help No. ofEmployees Step 1 Step 2 Step 3 Step 4 Step 5
Mosquito Control Technician 36 14.50 15.90 17.30 18.70 20.00 Hourly
General Manager and Board of Trustees No. ofEmployees
General Manager 1 $14,214/month (Contract)
Board of Trustees 36 No Compensation. Up to $100/mo reimbursement for expenses (per CA Health & Safety Code 2030
4
88

12545 Florence Ave., Santa Fe Springs, CA 90670 | (562) 944-9656 | www.glacvcd.org