annual and size dependent variation of growth rates and ... · annual and size dependent variation...
TRANSCRIPT

BOREAL ENVIRONMENT RESEARCH 10: 357–369 ISSN 1239-6095Helsinki 24 October 2005 © 2005
Annual and size dependent variation of growth rates and ion concentrations in boreal forest
Anne Hirsikko1), Lauri Laakso1), Urmas Hõrrak1)2), Pasi P. Aalto1), Veli-Matti Kerminen3) and Markku Kulmala1)
1) Department of Physical Sciences, P.O. Box 64, FI-00014 University of Helsinki, Finland2) Institute of Environmental Physics, University of Tartu, Ülikooli 18, 50090 Tartu, Estonia3) Finnish Meteorological Institute, Research and Development, Erik Palmenin Aukio 1, P.O. Box
503, FI-00101 Helsinki, Finland
Hirsikko, A., Laakso, L, Hõrrak, U., Aalto, P. P., Kerminen, V.-M. & Kulmala, M. 2005: Annual and size dependent variation of growth rates and ion concentrations in boreal forest. Boreal Env. Res. 10: 357–369.
Number size distributions of particles and ions were measured with a differential mobility particle sizer and two different ion spectrometers at the SMEAR II station in southern Finland during April 2003–April 2004. Cluster ion (diameter < 1.6 nm) concentrations varied between 200 and 1500 cm–3, while the concentrations of inter-mediated ions (1.6–6.3 nm) remained usually below 200 cm–3. During the 70 observed nucleation event days, particle growth rates were strongly dependent on their size. The median diameter growth rates of particles in size classes 7–20 nm, 3–7 nm and 1.3–3 nm were 4–5 nm h–1, 2–4 nm h–1 and < 2 nm h–1, respectively. The growth rates of the smallest ions/particles were almost independent of the season having a minimum during the summer, whereas the growth rates of larger particles had a clear annual cycle with the highest values during the summer and lowest values during the winter. The results indicate that in addition to sulphuric acid, compounds related to photosyn-thesis participate in the particle growth, especially in the size class 7–20 nm.
Introduction
Atmospheric aerosol particles influence the Earth’s climate system by absorbing and scat-tering solar radiation and by acting as cloud con-densation nuclei (Kaufman et al. 2002, Lohman and Feichter 2005). In polluted areas aerosol particles frequently impair visibility, in addi-tion to which they may have adverse effects on human health (see for example Dockery et al. 1993, Lighty et al. 2000). Understanding the climatic and other effects of atmospheric aerosol particles requires detailed information on aerosol sources and atmospheric processes modifying
the concentration and properties of these aero-sols. Important processes in this context are the formation and growth of new aerosol particles from gaseous precursors in the atmosphere (Kul-mala 2003, Kulmala et al. 2004b and references therein).
In an earlier study a size dependence of the particle growth rate was found for a short spring period (Kulmala et al. 2004c). Although there are some data on ion/particle concentrations and growth rates for restricted time periods, no com-prehensive study covering all the seasons has been made so far for the smallest particle sizes below 3 nm. This size range is important, since
358 Hirsikko et al. • BOREAL ENV. RES. Vol. 10
new particles formed by nucleation are around 1 nm in diameter. The investigation of the behav-iour of these particles needs measured size dis-tributions to support theoretical estimations of formation and growth rates. While typical instru-ments used for environmental monitoring (Dif-ferential Mobility Particle Sizer) cannot measure particles smaller than 3 nm in diameter, measur-ing small charged particles or ions (< 3 nm) has become possible due to the recent instrumental developments (Hõrrak et al. 1998).
This study utilizes long-term simultaneous aerosol particle and air ion measurements for the diameter range 0.5–20 nm in Hyytiälä, southern Finland, during the period from the beginning of April 2003 to the end of April 2004. Measured cluster ion (< 1.6 nm in diameter) and intermedi-ate ion (1.6–6.3 nm in diameter) concentrations, as well as examples of ion and particle size distributions, will be presented. Particle growth rates were in addition calculated separately for three size classes (1.3–3 nm, 3–7 nm, 7–20 nm). This procedure was repeated for 70 particle formation events taking place during the meas-urement period, with a special focus put on the annual variability. The time series of the growth rates were used to estimate the contribution of different condensing vapours to the growth of these particles during different times of the year.
Measurements and methods
Since January 1996, we have measured continu-ously the mobility distributions of aerosol parti-cles at the SMEAR II station (Station for Measur-ing Forest Ecosystem–Atmosphere Relations) in Hyytiälä, southern Finland (61°51´N, 24°17´E, 181 m above sea level). In addition to particle observations, we started continuous measure-ments of the mobility distributions of atmos-pheric ions in the spring of 2003. The measuring station is surrounded mainly by a Scots pine forest. The surroundings and operation of the sta-tion have been described in more detail by Vesala et al. (1998) and Kulmala et al. (2001).
Two ion spectrometers, the Air Ion Spec-trometer (AIS) and Balanced Scanning Mobility Analyser (BSMA), both manufactured by Airel Ltd. in Estonia, and the Differential Mobility
Particle Sizer (DMPS) system measured ion and charged particle mobility distributions as well as particle size distributions (Laakso et al. 2004a, 2004b). The ion spectrometers took their air sample from about 1.6 m above the ground and DMPS from a 2-m height. The measurements were performed inside the forest. The ambient temperature was measured with a PT-100 resist-ance thermometer at a 4.2-m height, while Pho-tosynthetically Active Radiation (PAR) in the wavelength range 400–700 nm was measured with a LI-190SZ quantum sensor (LiCor, USA) at an 18-m height.
AIS
The Air Ion Spectrometer (AIS) has been meas-uring continuously in Hyytiälä since 11 August 2003. The AIS uses two identical cylindrical aspiration-type differential mobility analyzers (DMA), one for positive and the other for nega-tive ions, to classify and measure all air ions simultaneously in the mobility range 0.0013–2.4 cm2 V–1 s–1. Naturally charged particles (cluster ions and aerosols) carried by air flow drift in the radial electric field of the DMA and are depos-ited on different electrodes of the DMA accord-ing to their electrical mobilities. Both mobility analysers have 21 insulated collector electrodes. Electrometrical amplifiers connected with these collectors measure the electric current carried by ions.
The sample and sheath air flow rates through each analyser are 500 and 1000 cm3 s–1, respec-tively. Particles in the sample air are neutralized with a corona charger and charged particles are removed from the airflow by electronically controlled electric filter when instrument meas-ures the offset level and noise of electrometrical amplifiers. The corona charger and electric filter are not used when the ion concentration is meas-ured. Two analysers have their own closed-loop sheath flow arrangements. Additional corona chargers and electric filters clean continuously the sheath air by using the method described above.
Based on 200-second sample air and 100-second offset-level measurements during five minutes, the average mobility distributions for

BOREAL ENV. RES. Vol. 10 • Ion size distribution measurements 359
positive and negative ions as well as their uncer-tainties are calculated. These mobility distribu-tions are presented as 27 knot points distrib-uted uniformly (in logarithmic scale) over the measuring mobility range of the device. The corresponding diameter distributions of single charged particles are obtained by utilizing the algorithm developed by Tammet (1995). Under normal conditions (temperature 0 °C, pressure 1013 mb), the measuring size range of the AIS is 0.46–40 nm.
Originally, both diffusion broadening and losses inside the AIS and sampling line were esti-mated based on theoretical calculations (Fuchs 1964, Tammet 1970). However, the experimental testing of the AIS and the comparison of the AIS and BSMA showed that the theoretical calcula-tions had underestimated the losses of the small-est (cluster) ions. For this reason, the inlet of the AIS was improved recently.
BSMA
The Balanced Scanning Mobility Analyser (BSMA) (Tammet 2004) has been measuring ion mobility distributions in Hyytiälä since 20 March 2003. The ion spectrometer consists of two plain aspiration-type differential mobility analysers (DMA), one for measuring positive ions and the other for measuring negative ions. Each DMA has a measuring condenser with only one collector electrode and electric filter in the inlet to provide the DMA with sheath air. The electronically controlled section of the electric filter (inlet gate) is also used to remove ions from the sample air during the offset-level measure-ments of the spectrometer. During the mobility distribution measurements, the inlet gate of the first (active) DMA is opened for ions while the inlet gate of the second (passive) DMA is kept closed. For measuring ions of opposite polarity, the first DMA is passive and the second one is active.
The condensers of the DMA and the common electrometric amplifiers are electrically con-nected via a balance bridge circuit, one arm of which consists of two condensers and the other arm consists of two resistors for bridge balanc-ing. The electrometric amplifier is connected
with one diagonal of the bridge (between the wiring points of the condensers and resistors), whereas the driving high voltage is applied in the other diagonal to provide the DMAs with neces-sary voltages. The mobility classification of ions is performed by changing the applied voltage during discharging of the larger capacitor after disconnecting the power from the high voltage source. The balancing of the bridge is not per-fect and, therefore, the spectrometer offset-level measurements (with the closed inlet gates) fol-lowed the ion concentration measurements in a similar way by scanning the entire mobility interval to improve the quality of the data.
The measuring cycle of the BSMA for the positive and negative ion mobility distributions is six minutes. The mobility distributions of one polarity are scanned and averaged during the first three minutes and during the next three minutes the ions of the opposite polarity are classified. The measuring cycle of each polarity consists of nine 20-second scans, so that the ion mobil-ity distributions are measured for five times and the spectrometer offset levels for four times. Similarly, as in the case of the AIS, the losses of ions and diffusion broadening were estimated theoretically.
The airflow rate through one condenser of the BSMA is 22 l s–1. The instrument scans the ion mobility distributions in the range 0.032–3.2 cm2 V–1 s–1. Ion concentrations in this range are obtained as 16 uniformly distributed fractions, the corresponding diameter range being 0.34–7.43 nm. The data processing program devel-oped by H. Tammet from the University of Tartu averages the three-minute data over 15 minutes and reduces the size range to 0.4–6.3 nm. The 15-minute average data has been used hereinaf-ter, except in the growth rate analysis where the three-minute data has been utilised.
DMPS
The Differential Mobility Particle Sizer (DMPS) system (Aalto et al. 2001) classified particles in the diameter range 3–520 nm. The system consists of two parallel DMPS devices. The devices have a common sample inlet and they both use their own closed loop sheath flow arrangements (Jokinen and

360 Hirsikko et al. • BOREAL ENV. RES. Vol. 10
Mäkelä 1997). The first device uses a 10.9-cm-long Hauke-type Differential Mobility Analyser (DMA) (Winklmayer et al. 1991) and TSI model 3025 Condensation Particle Counter (CPC). This device classified particles in the size range 3–10 nm. The other device, consisting of a 28-cm-long Hauke-type DMA and TSI model 3010 CPC, clas-sified particles in the diameter range 10–520 nm. The aerosol was neutralized with a 2 mCi Kryp-ton-85 beta source before sizing.
Losses of particles inside the DMA and CPC were determined experimentally, whereas losses inside the sampling line were calculated theoreti-cally by assuming that the tube flow is laminar and that the losses are generated by diffusion. The diffusion broadening inside the DMA was theoretically calculated as described by Stolzen-burg (1988). The estimated particle losses and the effect of diffusion broadening were considered when the final data inversion was performed.
Data processing
The growth rate (GR) of particles and air ions can be estimated from size distribution measure-ments (Lehtinen and Kulmala 2003, Kulmala et al. 2004c). After the onset of nucleation, the number concentration of the smallest particles increases, creating a local maximum (concentra-
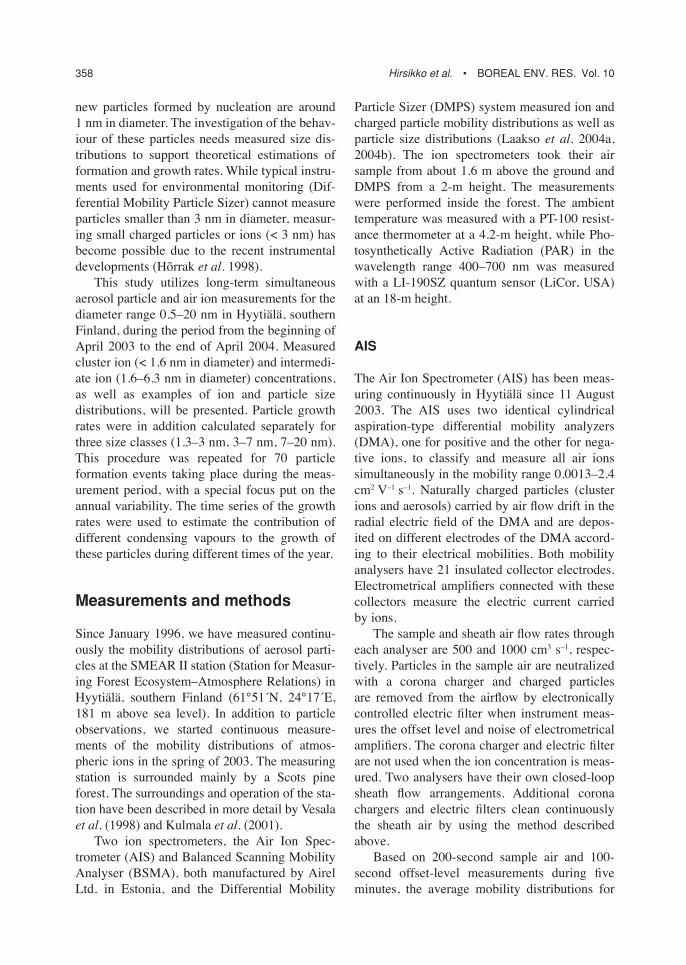
tion peak) in the particle size distribution. When the nucleated particles grow in size, this peak shifts to larger sizes. In order to follow the con-centration peaks, we fitted a normal (Gaussian) distribution function into the time series of the particle concentrations in a certain size fraction (spectrometric channel) after the onset of the nucleation burst (Fig. 1). The dashed curve with stars represents the measured concentration of particles in the size fraction with a geometric mean diameter of 6.04 nm, while the circles lying above the x-axis indicate the assumed par-ticle growth period for which the Gaussian distri-bution (solid curve in Fig. 1) was fitted. The first concentration peak taking place before midday was not taken into account in the fitting process, since these particles grew only up to 10 nm and then suddenly disappeared. Our purpose was to follow the growth of nucleated particles toward larger sizes (Fig. 2), as was the case for particles in the second concentration peak in Fig. 1.
The timing of the concentration peak in a given size fraction was obtained from the fitted normal distribution, and this procedure was repeated for all the size fractions. The growth rates were then obtained by looking at the rela-tion between the timing of these concentration peaks and corresponding geometric mean diame-ters of the size fractions. The estimated timings of the maxima of each peak as a function of particle
Fig. 1. The first phase of the growth rate analysis. A Gaussian distribution (solid curve) is fitted on DMPS data measured on 2 April 2004 in Hyytiälä. The particle number dis-tribution function (dNi /d logDp) is given for the size fraction with a geo-metric mean diameter of 6.04 nm.
BOREAL ENV. RES. Vol. 10 • Ion size distribution measurements 361
sizes are indicated as stars in Fig. 2. The growth rates of particles in different size classes (1.3–3 nm, 3–7 nm, 7–20 nm) were obtained by a least-square fitting of straight lines on the data points.
It should finally be noted that the effect of coagulation was not included in our analysis. Self-coagulation between nucleation mode par-ticles may speed up the growth of this mode if its number concentration is high enough. In Hyytiälä such high nucleation mode concen-trations are practically never encountered, so self-coagulation can be neglected in the growth analysis. Coagulation of the smallest nucleation mode particles and ions with pre-existing larger particles might affect the temporal behaviour of the concentration peaks of these particles. As a result, the real growth rates of the smallest par-ticles/ions might be somewhat lower than those obtained from our analysis.
Results and discussion
Ion concentrations
The BSMA data representing the period 1 April 2003–30 April 2004 was averaged over 15 min-utes, in addition to which the data with a high
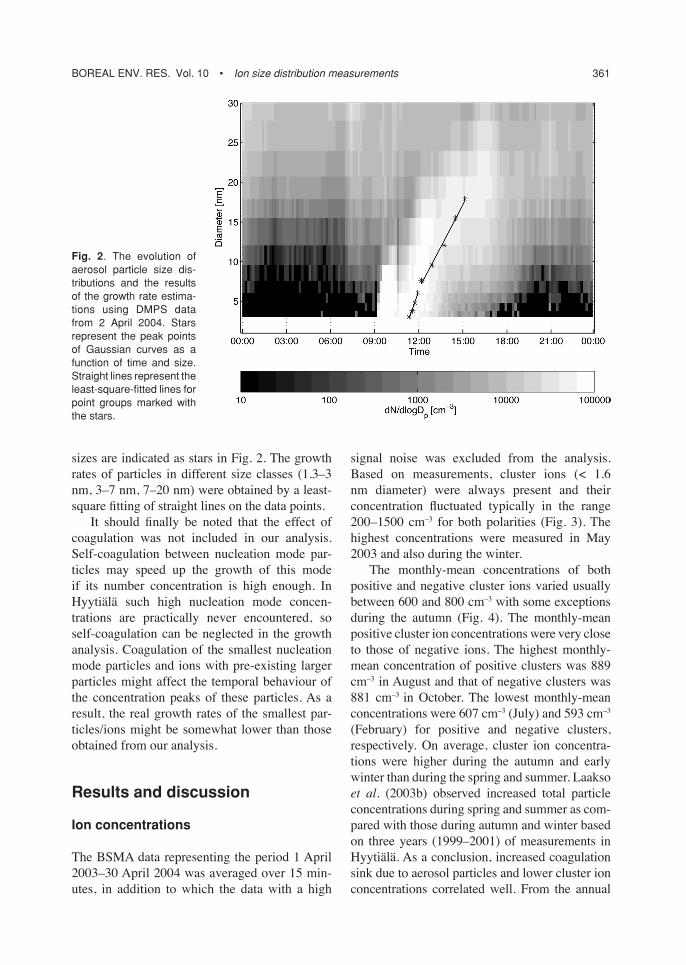
signal noise was excluded from the analysis. Based on measurements, cluster ions (< 1.6 nm diameter) were always present and their concentration fluctuated typically in the range 200–1500 cm–3 for both polarities (Fig. 3). The highest concentrations were measured in May 2003 and also during the winter.
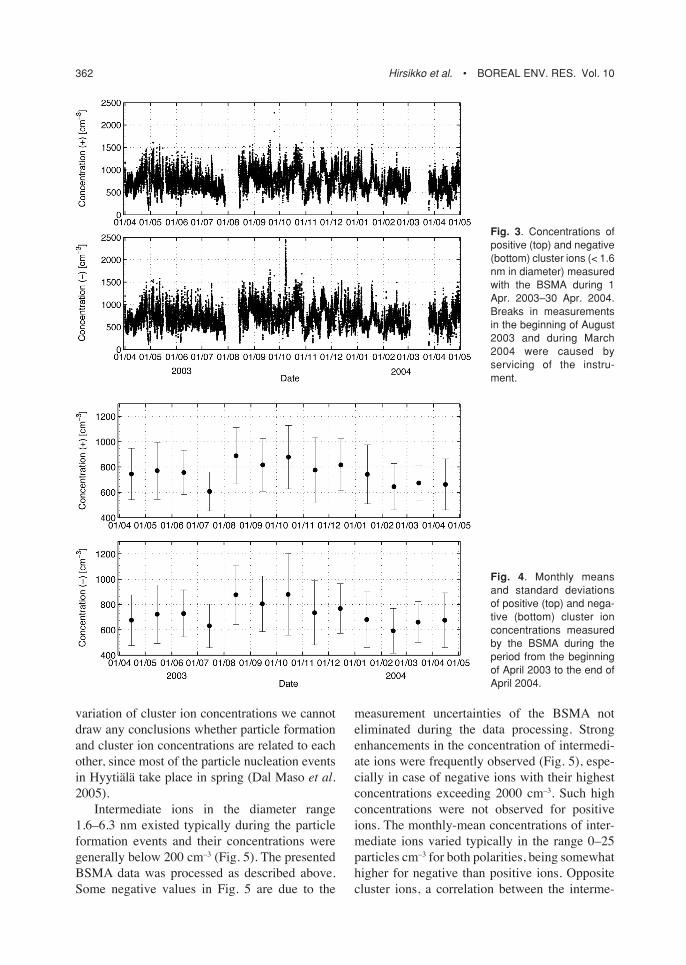
The monthly-mean concentrations of both positive and negative cluster ions varied usually between 600 and 800 cm–3 with some exceptions during the autumn (Fig. 4). The monthly-mean positive cluster ion concentrations were very close to those of negative ions. The highest monthly-mean concentration of positive clusters was 889 cm–3 in August and that of negative clusters was 881 cm–3 in October. The lowest monthly-mean concentrations were 607 cm–3 (July) and 593 cm–3 (February) for positive and negative clusters, respectively. On average, cluster ion concentra-tions were higher during the autumn and early winter than during the spring and summer. Laakso et al. (2003b) observed increased total particle concentrations during spring and summer as com-pared with those during autumn and winter based on three years (1999–2001) of measurements in Hyytiälä. As a conclusion, increased coagulation sink due to aerosol particles and lower cluster ion concentrations correlated well. From the annual
Fig. 2. The evolution of aerosol particle size dis-tributions and the results of the growth rate estima-tions using DMPS data from 2 April 2004. Stars represent the peak points of Gaussian curves as a function of time and size. Straight lines represent the least-square-fitted lines for point groups marked with the stars.
362 Hirsikko et al. • BOREAL ENV. RES. Vol. 10
variation of cluster ion concentrations we cannot draw any conclusions whether particle formation and cluster ion concentrations are related to each other, since most of the particle nucleation events in Hyytiälä take place in spring (Dal Maso et al. 2005).
Intermediate ions in the diameter range 1.6–6.3 nm existed typically during the particle formation events and their concentrations were generally below 200 cm–3 (Fig. 5). The presented BSMA data was processed as described above. Some negative values in Fig. 5 are due to the
measurement uncertainties of the BSMA not eliminated during the data processing. Strong enhancements in the concentration of intermedi-ate ions were frequently observed (Fig. 5), espe-cially in case of negative ions with their highest concentrations exceeding 2000 cm–3. Such high concentrations were not observed for positive ions. The monthly-mean concentrations of inter-mediate ions varied typically in the range 0–25 particles cm–3 for both polarities, being somewhat higher for negative than positive ions. Opposite cluster ions, a correlation between the interme-
Fig. 4. Monthly means and standard deviations of positive (top) and nega-tive (bottom) cluster ion concentrations measured by the BSMA during the period from the beginning of April 2003 to the end of April 2004.
Fig. 3. Concentrations of positive (top) and negative (bottom) cluster ions (< 1.6 nm in diameter) measured with the BSMA during 1 Apr. 2003–30 Apr. 2004. Breaks in measurements in the beginning of August 2003 and during March 2004 were caused by servicing of the instru-ment.

BOREAL ENV. RES. Vol. 10 • Ion size distribution measurements 363
diate ion concentration and particle formation events was found. The monthly-mean concen-tration of intermediate ions was close to zero in November and January when we did not observe any particle nucleation events. In the springs of 2003 and 2004 the average concentrations of the intermediate ions increased as compared with those in the other seasons. An exception to this was October when we measured extremely high negative ion concentrations.
Our observations of cluster ion and charged particle concentrations agree well with the results obtained by Hõrrak et al. (2005) at the SMEAR II station in the spring of 1999. For example, according to their measurements, the concentra-tions of small positive ions varied between 110 and 1183 cm–3. Based on another study by Hõrrak et al. (2003), the concentrations of small ions were somewhat smaller in the Tahkuse station in Estonia than in the Hyytiälä station. It is clear that cluster ion concentrations are site dependent because of differences in the average ionisation rate and the degree of particulate pollution.
Size distributions during the nucleation events
Based on DMPS measurements, 141 particle for-mation events were observed in Hyytiälä during
the period considered here. The particle formation events were classified into three classes (Ia, Ib and II) according to the number of particles formed and the strength or rate of their subsequent growth (Kulmala et al. 2004d, Dal Maso et al. 2005). Based on our classification, 70 of these 141 events were such that we were able to use them in analys-ing different properties of aerosol particles such as their growth and formation rate. An example of the most evident events, termed class Ia events, is shown in Fig. 6a. In this example the formation of 3-nm particles started before midday and lasted for several hours, in addition to which a clear growth of nucleated particles toward the Aitken mode could be seen. Most of the 70 events were, however, so-called class Ib events which have not as clear formation and growth behaviour as the class Ia events (see Dal Maso et al. (2005) for more detailed description of event classification).
The evolution of both negative and positive ion size distributions measured with the AIS was similar to that of particle size distributions meas-ured by the DMPS (Fig. 6). The upper detection limit of the AIS and the lower detection limit of the DMPS are indicated as horizontal lines in Fig. 6a and b, respectively. The presence of ion clusters and their growth to sizes detectable with the DMPS can clearly be seen. The size distri-butions of ions measured with the BSMA were similar to those measured with the AIS.
Fig. 5. Concentrations of positive (top) and negative (bottom) intermediate ions in the diameter range 1.6–6.3 nm measured using the BSMA during 1 Apr. 2003–30 Apr. 2004.

364 Hirsikko et al. • BOREAL ENV. RES. Vol. 10
Growth rate
Annual variation
The growth rates of aerosol particles and ions were estimated from the AIS, BSMA and DMPS measurements using the method described ear-lier. Neutral or charged particles and ions were not separated in this analysis. The BSMA was
utilized only for the two smallest size intervals because the size interval 7–20 nm is out of its measurement range. Only the events of the classes Ia and Ib were taken into account in this analysis. The rest of the particle formation events were excluded from the analysis because they were weak so that fitting of the Gaussian distribution with a good reliability was not pos-sible.
Fig. 6. The evolution of the size distributions of (a) particles measured by the DMPS and (b) negative cluster ion and charged particles measured by AIS during a nucleation event day on 3 Apr. 2004. The black horizontal line at 3 nm indicates the lower limit of the DMPS, and the white horizontal line at 40 nm indicates the upper limit of the AIS. Shades of grey represent the con-centration of particles.

BOREAL ENV. RES. Vol. 10 • Ion size distribution measurements 365
The calculated growth rates were size dependent (Fig. 7). Especially in the summer, particles (and ions) in diameter range 7–20 nm grew more rapidly than ions < 3 nm in diameter. The monthly-median growth rate of ions in the diameter range 1.3–3 nm was usually below 2 nm h–1. The growth of particles in the diameter range 7–20 nm was quickest during the warm and sunny months between June and September,
while the growth of the smallest charged parti-cles (< 3 nm) was slowest in June. During this season, the monthly-median growth rate of ions in the diameter range 1.3–3 nm was only 15%–35% and 3%–24% of the growth rates of 3–7 nm and 7–20 nm particles, respectively (Table 1). During the winter the differences in the growth rates of different-size particles and ions were much smaller than in the summer.
Fig. 7. Monthly median growth rates of particles and ions in three size classes (1.3–3, 3–7 and 7–20 nm). The number of classes Ia and Ib aerosol particle formation events in each month is given in the upper part of the figure.
Table 1. Monthly median and the whole measuring period median growth rates (last row) of different sized air ions and particles in Hyytiälä during the period 1 April 2003–30 April 2004. The ratios of the growth rates (GR) of parti-cles in the size classes 1.3–3 nm, 3–7 nm and 7–20 nm are shown.
Month GR(1.3–3 nm)/ GR(3–7 nm)/ GR(1.3–3 nm)/ GR(7–20 nm) GR(7–20 nm) GR(3–7 nm) (%) (%) (%)
4 54 90 60 5 28 79 35 6 3 21 15 7 7 36 18 8 13 50 27 9 24 70 3510 89 56 16011 No events No events No events12 62 55 113 1 No events No events No events 2 134 68 197 3 26 39 65 4 42 74 56Whole period 35 65 53

366 Hirsikko et al. • BOREAL ENV. RES. Vol. 10
During the late spring and summer (May–July) the growth rates of 1.3–3-nm ions were, on average, somewhat slower than during the rest of the year. This feature has two possible explana-tions: (1) the concentration of sulphuric acid is, for some reason, at its lowest during this time of the year or (2) the saturation vapour pressures of condensing organic compounds are at their highest due to higher temperatures. At present it is impossible to conclude which one of these explanations is more plausible, or whether they both are contributing to the observed growth behaviour.
The fast growth of 7–20 nm particles during the summer cannot be explained by the same condensing vapours that are responsible for the growth of 1.3–3 nm particles. According to the theoretical analysis by Anttila et al. (2004) and Kulmala et al. (2004a), and to measurements by O’Dowd et al. (2002), nucleation mode particles are likely to contain organic compounds. We might expect that organic vapours are responsi-ble for the main growth of 7–20-nm particles in summer and early autumn because the concen-trations of organic vapours are at their highest during the warm period. Based on measure-ments in Hyytiälä during April 2000–April 2002, Hakola et al. (2003) observed that monoterpene concentrations had a maximum during July–August, and that during September–November
their concentrations were almost as high as in summer. They also measured increased iso-prene concentrations in summer and noticed that organic vapour concentrations are temperature dependent.
Trees emitting volatile organic compounds are active when they are exposed to a sufficient amount of Photosynthetically Active Radia-tion (PAR). Figure 8 shows monthly means and standard deviations of temperature and PAR measured during the period considered in this study. Measurement uncertainties of the PAR sensor during the period of low radiation causes slightly negative values of radiation. The negative values were taken into account when averaging the data to avoid the shift of aver-ages to higher values. Both temperature and PAR showed a seasonal variation similar to the growth rates of particles > 3 nm in diameter, which supports the important role of organics to the growth of these particles.
Comparison of GR obtained by different instruments
The BSMA, AIS and DMPS do not measure exactly the same quantity: the AIS and BSMA measure naturally charged ions and particles, whereas the DMPS measures the sum of neutral
Fig. 8. The monthly mean values and standard devi-ations of temperature and PAR, measured at the heights of 4.2 m and 18 m above the ground, respec-tively.

BOREAL ENV. RES. Vol. 10 • Ion size distribution measurements 367
and charged particles assuming charge equi-librium. Laakso et al. (2003a) showed that the charge of particles enhances the flux of polar vapour molecules onto particles in the nuclea-tion process and increases the condensation growth. Charged particles are observed before neutral ones if ions are strongly involved in the nucleation process. Neutral particles appear after discharging charged particles (by cluster ions) with a small time delay. In the case of particle formation by neutral mechanisms, a charged particle population follows the neu-tral particle population, again with a small time delay. It is possible that the time delay caused by different nucleation mechanisms changes calculated growth rates systematically in one direction or another when comparing the growth rates obtained from ion spectrometers and DMPS.
Our recent investigations showed that the probabilities of 5–20 nm particles to be positively or negatively charged were equal during nuclea-tion events in the atmosphere. In the same study, negatively charged particles between 2.6 and 3.3 nm were found to be overcharged, whereas positive ions in the same range were close to charge equilibrium. Because positive particles are close to charge equilibrium, we can assume
that they represent also the particle population (mainly neutral particles) that is measured with the DMPS. Thus, if positive ions mostly follow the main population of growing particles gener-ated by neutral mechanisms also below 3 nm, we can compare growth rates obtained below 3 nm from the ion spectrometers with GRs above 3 nm obtained from the DMPS.
Median growth rates for each instrument and both polarities showed an increasing trend as a function of particle size (Fig. 9 and Table 1). These results are in accordance with those presented by Kulmala et al. (2004c). They inves-tigated ion and particle data from Hyytiälä meas-ured during March–April 2003 and obtained average growth rates of about 1, 3 and 5 nm h–1 for the size classes 1.3–3 nm, 3–7 nm and 7–20 nm, respectively.
We also compared growth rates of ions of dif-ferent polarities in different size-ranges and those measured with different instruments by calculat-ing the ratio between positive and negative ion growth rates during each event. If the growth rates of ions of different polarity differ from each other, this ratio should differ from unity. Statisti-cally significant deviations from unity were not found. The idea of this analysis was to study the possible effect of charge on growth rates as pro-
Fig. 9. Comparison between the growth rates estimated from the size distributions measured with different instruments (the AIS, BSMA and DMPS) in Hyytiälä during 1 Apr. 2003–30 Apr. 2004. The particle diameter in the x-axis represents the arithmetic mean diameter of each size class used in our analysis (see Fig. 7).

368 Hirsikko et al. • BOREAL ENV. RES. Vol. 10
posed by Yu and Turco (2000) and Laakso et al. (2003a). Based on our results, we cannot draw any conclusions about the effect of charge on the growth of the particles by condensation.
Conclusions
The concentrations and size distributions of atmospheric ions and particles were measured at the SMEAR II station in Hyytiälä during 13 months starting at the beginning of April 2003. By using two different kinds of ion spectrom-eters (AIS and BSMA) we were able to measure charged particles (ions) < 3 nm in diameter. Based on our observations, cluster ions (< 1.6 nm diameter) were always present and the con-centrations of both cluster ions and intermediate ions (1.6–6.3 nm) ions displayed a seasonal vari-ability.
The estimated growth rates of particles and ions were strongly size dependent. This size dependence had an annual cycle: the growth rates of particles > 3 nm diameter demonstrated a clear annual cycle with highest values during the summer and lowest ones during the winter, whereas the growth rates of the 1.3–3 nm ions were usually smaller than 2 nm h–1 with a mini-mum in summer. The results can be explained by a seasonal variation in the concentration of condensing vapours. Besides sulphuric acid, organic compounds were concluded to partici-pate in the particle growth process during the summertime. In obtaining the results discussed above, the possibility of measuring the smallest naturally charged particles (ions smaller < 3nm) was essential. To draw more detailed conclusions about the particle growth processes, long-term measurement periods together with sulphuric acid and organic vapour concentration measure-ments are needed.
References
Aalto P., Hämeri K., Becker E., Weber R., Salm J., Mäkelä J.M., Hoell C., O’Dowd C.D., Karlsson H., Hansson H-C., Väkevä M., Koponen I.K, Buzorius G. & Kulmala M. 2001. Physical characterization of aerosol particles during nucleation events. Tellus 53B: 344–358.
Anttila T., Kerminen V.-M., Kulmala M., Laaksonen A. &
O’Dowd C. 2004. Modelling the formation of organic particles in the atmosphere. Atmos. Chem. Phys. 4: 1071–1083.
Dal Maso M., Kulmala M., Riipinen I., Wagner R., Hussein T., Aalto P.P. & Lehtinen K.E.J. 2005. Formation and growth of fresh atmospheric aerosols: eight years of aerosol size distribution data from SMEAR II, Hyytiälä, Finland. Boreal Env. Res. 10: 323–336.
Dockery D.W., Pope C.A., Xu X., Spengler J.D., Ware J.H., Fay M.E., Ferris B.G. & Speizer F.E. 1993. An association between air pollution and mortality in six U.S. cities. The New England Journal of Medicine 329: 1753–1759.
Fuchs N.A. 1964. The mechanics of aerosol, Pergamon, New York.
Hakola H., Tarvainen V., Laurila T., Hiltunen V., Hellén H. & Keronen P. 2003. Seasonal variation of VOC concentra-tions above a boreal coniferous forest. Atmos. Environ. 37: 1623–1634.
Hõrrak U., Salm J. & Tammet H. 1998. Bursts of interme-diate ions in atmospheric air. J. Geophys. Res. 103: 13909–13915.
Hõrrak U., Salm J. & Tammet H. 2003. Diurnal variation in the concentration of air ions of different mobility classes in a rural area. J. Geophys. Res. 108(D20), 4653, doi: 10.1029/2002JD003240.
Hõrrak U., Aalto P.P., Salm J., Mäkelä J.M., Laakso L. & Kulmala M. 2005. Characterization of air ions in boreal forest air during BIOFOR III campaign. Atmos. Chem. Phys. Discuss. 5: 2749–2790.
Jokinen V. & Mäkelä J. 1997. Closed loop arrangement with critical orifice for DMA sheath/excess flow system. J. Aerosol Sci. 28: 643–648.
Kaufman Y.J., Tanre D. & Boucher O. 2002. A satellite view of aerosols in the climate system. Nature 419: 215–223.
Kulmala M. 2003. How particles nucleate and grow. Science 302: 1000–1001.
Kulmala M., Kerminen V.-M., Anttila T., Laaksonen A. & O’Dowd C.D. 2004a. Organic aerosol formation via sul-phate cluster activation. J. Geophys. Res. 109, D04205, doi:10.1029/2003JD003961.
Kulmala M., Vehkamäki H., Petäjä T., Dal Maso M., Lauri A., Kerminen V.-M., Birmili W. & McMurry P.H. 2004b. Formation and growth rates of ultrafine atmospheric particles: A review of observations. J. Aerosol Sci. 35: 143–176.
Kulmala M., Laakso L., Lehtinen K.E.J., Riipinen I., Dal Maso M., Anttila T., Kerminen V.-M., Hõrrak U., Vana M. & Tammet H. 2004c. Initial steps of aerosol growth. Atmos. Chem. Phys. 4: 2553–2560.
Kulmala M., Hämeri K., Aalto P.P., Mäkelä J.M., Pirjola L., Nilsson E.D., Buzorius G., Rannik Ü., Dal Maso M., Seidl W., Hoffman T., Janson R., Hansson H.-C., Viisanen Y., Laaksonen A. & O’Dowd C.D. 2001. Over-view of the international project on biogenic aerosol formation in the boreal forest (BIOFOR). Tellus 53B: 324–343.
Kulmala M., Boy M., Suni T., Gaman A., Raivonen M., Aal-tonen V., Adler H., Anttila T., Fiedler V., Grönholm T., Hellén H., Herrmann E., Jalonen R., Jussila M., Komp-

BOREAL ENV. RES. Vol. 10 • Ion size distribution measurements 369
pula M., Kosmale M., Plauskaite K., Reis R., Savola N., Soini P., Virtanen S., Aalto P., Dal Maso M., Hakola H., Keronen P., Vehkamäki H., Rannik Ü., Lehtinen K. & Hari P. 2004d. Aerosols in boreal forest: wintertime rela-tions between formation events and bio-geo-chemical activity. Boreal Env. Res. 9: 63–74.
Laakso L., Kulmala M. & Lehtinen K.E.J. 2003a. Effect of condensation rate enhancement factor on 3-nm (diam-eter) particle formation in binary ion-induced and homo-geneous nucleation. J. Geophys. Res. 108(D18), 4574, doi:10.1029/2003JD003432.
Laakso L., Hussein T., Aarnio P., Komppula M., Hiltunen V., Viisanen Y. & Kulmala M. 2003b. Diurnal and annual characteristics of particle mass and number concentra-tions in urban, rural and Arctic environments in Finland. Atmos. Environ. 37: 2629–2641.
Laakso L., Petäjä T., Lehtinen K.E.J., Paatero J., Kulmala M., Hõrrak U., Tammet H. & Joutsensaari J. 2004a. Ion production rate in a boreal forest based on ion, particle and radiation measurements. Atmos. Chem. Phys. 4: 1933–1943.
Laakso L., Anttila T., Lehtinen K.E.J., Aalto P.P., Kulmala M., Hõrrak U., Paatero J., Hanke M. & Arnold F. 2004b. Kinetic nucleation and ions in boreal particle formation events. Atmos. Chem. Phys. 4: 2353–2366.
Lehtinen K.E.J. & Kulmala M. 2003. A model for particle formation and growth in the atmosphere with molecular resolution in size. Atmos. Chem. Phys. 3: 251–258.
Lighty J.S., Veranth J.M. & Sarofirn A.F. 2000. Combustion aerosols: factors governing their size and and composi-tion and implications to human health. J. Air & Waste Manage. Assoc. 50: 1565–1618.
Lohman U. & Feichter J. 2005. Global indirect aerosol
effects: A review. Atmos. Chem. Phys. 5: 715–737.O’Dowd C.D., Aalto P., Hämeri K., Kulmala M. & Hoffmann
T. 2002. Atmospheric particles from organic vapours. Nature 416: 497–498.
Stolzenburg M.R. 1988. An ultrafine aerosol size distribution system, Ph.D. thesis. University of Minnesota, Minne-apolis, MN.
Tammet H. 1970. The aspiration method for the determina-tion of atmospheric ion-spectra. IPST for NSF, Jerusa-lem, Jerusalem.
Tammet H. 1995. Size and mobility of nanometer particles, clusters and ions. J. Aerosol Sci 26: 459–475.
Tammet H. 2004. Balanced scanning mobility analyzer, BSMA. In: Kasahara M. & Kulmala M. (eds.), Nuclea-tion and Atmospheric Aerosols 2004, 16th International Conference, Kyoto University Press, Japan, pp. 294–297.
Vesala T., Haataja J., Aalto P., Altimir N., Buzorius G., Garam E., Hämeri K., Ilvesniemi H., Jokinen V., Kero-nen P., Lahti T., Markkanen T., Mäkelä J.M., Nikinmaa E., Palmroth S., Palva L., Pohja T., Pumpanen J., Rannik Ü., Siivola E., Ylitalo H., Hari P. & Kulmala M. 1998. Long-term field measurements of atmosphere–surface interactions in boreal forest combining forest ecology, micrometeorology, aerosol physics and atmospheric chemistry. Trends in Heat, Mass and Momentum Trans-fer 4: 17–35.
Winklmayer W., Reischl G.P., Lindner A. & Berner A. 1991. A new electromobility spectrometer for the measurement of aerosol size distributions in the size range from 1 to 1000 nm. J. Aerosol Sci. 22: 289–296.
Yu F. & Turco R.P. 2000. Ultrafine aerosol formation via ion-mediated nucleation, Geophys. Res. Lett. 27: 883–886.
Received 14 April 2005, accepted 1 August 2005