annona muricata approach in partial fulfillment of the
TRANSCRIPT

i
CHARACTERIZATION OF ANXIOLYTIC COMPOUNDS FROM ANNONA
MURICATA LEAF EXTRACT: A COMPUTATIONAL AND EXPERIMENTAL
APPROACH
by
BRIAN LALLIER
A thesis submitted to the
Graduate School-Camden
Rutgers, The State University of New Jersey
in partial fulfillment of the requirements
for the degree of
Master of Science
Graduate Program in Biology
written under the direction of
Simeon O. Kotchoni
and approved by
_______________________________
Simeon O. Kotchoni
______________________________
Joseph Martin
_____________________________
Hao Zhu
Camden, New Jersey
February, 2014

ii
ABSTRACT OF THE THESIS
CHARACTERIZATION OF ANXIOLYTIC COMPOUNDS FROM ANNONA
MURICATA LEAF EXTRACT: A COMPUTATIONAL AND EXPERIMENTAL
APPROACH
By BRIAN LALLIER
Thesis Director:
Simeon O. Kotchoni
Annona muricata is a perennial tree found in most tropical areas of the world, including
Western Africa, Central and South America and Southeast Asia. It has been used around
the world medicinally by several cultures. Some of these cultures use A. muricata as an
anxiolytic tea given to unruly patients. Traditional anxiolytic uses of Annona muricata in
medicine have long existed, without knowledge of the active compound or compounds.
We aim to scientifically support and extend these traditional uses by characterizing the
bioactive compound(s) within the leaf extract. The active structures can then be modified
to provide potentially new classes of active drugs. The anti-anxiety effects of A. muricata
seen in traditional medicine were characterized by using a set of widely-accepted
behavioral models of anxiolytic effects in mice. Partial phytochemical profiling done
through ultra-high performance liquid chromatography (UHPLC) and gas
chromatography-mass spectrometry (GC-MS) has identified a list of compounds that
comprise the different fractions of the leaf extract. Through the mouse behavioral
investigations, an active fraction has been determined to have a sedative effect, and
through a dose-response study, an anxiolytic-like activity has been determined for the
same fraction. Further fractionation of the extract and subsequent mouse behavioral
studies have resulted in the discovery of smaller groups of potentially active compounds

iii
that can be fully profiled and modeled using Computer-Aided Drug Discovery (CADD).
The use of mouse behavioral models of anxiolytic effects and the chromatographic
analysis of the leaf extract allowed the identification of active fractions in aqueous
extract. Both sedative and anxiolytic-like concentrations of the extract’s polar
components were demonstrated, and further profiled. The profiled chemical compounds
can be modeled to better suggest which compounds may provide the bioactive effects in
vivo.

iv
ACKNOWLEDGEMENT
This dissertation would not have been possible without the guidance from Dr. Simeon O.
Kotchoni. His ability to help me break down and solve any problem has been a positive
influence on my research abilities. I would like to give a special thanks to my other
committee members, Drs. Joseph Martin and Hao Zhu, for the guidance they have shown
me in their specialized fields, which has allowed me to become a well-rounded scientist
who has experience in a variety of fields, both independently and in an interdisciplinary
context. A special thanks goes to Dr. Sylvain Y. G. Atohoun (University of Abomey-
Calavi, Cotonou, Benin) who initially started this project and established the preliminary
anxiolytic effects of A. muricata leaf crude extract on mice in Kotchoni lab. A special
thanks to Julia Keklak, Marlene Kim, and Pradhan Sharma for all of their help with the
behavioral models, video data analysis, and computational comparison of identified
chemical compounds to preexisting mental health drugs. Another special thanks to Dr.
Jeff Raber and Sytze Elzinga from the Werc Shop, Inc. (Pasadena, CA), for their work in
phytochemical profiling of our plant extract.
I would also like to thank other members of the Kotchoni lab, such as Dr. Emma
Gachomo, Timnit Kefela, Lyla Jno Baptiste, and Omotola Saka, as well as the rest of my
family and friends, for their constant support and uplifting spirit.

v
TABLE OF CONTENTS
TITLE……………………………………………………………………………………...i
ABSTRACT…....................................................................................................................ii
ACKNOWLEDGEMENT………………………………………………………………..iv
LIST OF
FIGURES……………………………………………………………………...…………vii
LIST OF
TABLES…………………………………………………………………...……………viii
SECTION
1.INTRODUCTION………………………………………………………………………1
2. MATERIALS AND METHODS……………………………………………………….5
Plant Material Collection and Initial PhytochemicalProfiling………………………….…5
Phytochemical Screening by Gas Chromatography-Mass Spectrometry (GCMS)…….…6
Identification of Bioactive Fraction from Leaf Extract of A.muricata…………………....6
Identification of Bioactive Fraction within Polar Components of Leaf Extract Through
Preparative HPLC…………………..……………………………………………………..7
Oral Dose Response Curve of Crude Polar Extract Determination……………………….7
Animal Housing, Identification of Bioactive Fraction, Dose Response Curve of Polar
Fraction and Diazepam, Oral Administration of Potentially Bioactive Fractions, Oral
Dose Response Curve of Crude Polar Extract………………………………..…………..7
Light/Dark Conflict Box Test………………………..…………………………………...9
Identification of Bioactive Fraction from Leaf Extract of A. muricata…………9
Dose Response Curve of Polar Fraction and Diazepam, Oral Dose Response
Curve of Crude Polar Extract…………………………………………………….10
Elevated Plus-Maze Test…………………………………………………………………10

vi
Open Field Exploration Test…………...…………………………………………...........10
Statistical Analyses………………………………………………………………………11
Chemical Similarity Analysis………………………………………………….……..….11
3. RESULTS………………….…………………………………………………….…....12
4.
DISCUSSION…………….……………………………………………………….……..15
5. FUTURE DIRECTIONS…………….……………………………………….……….18
6. TABLES AND FIGURES…………….……………………………………….……...19
7.
REFERENCES………………………………………………………………………….52

vii
LIST OF FIGURES
Fig 1. Photograph of the Light/Dark Conflict Box Test
Fig 2. Photograph of the Elevated Plus-Maze Test
Fig 3. Photograph of the Open Field Exploration Test
Fig 4. GC-MS chromatogram of hexane extraction of A. muricata leaves
Fig 5. GC-MS chromatogram of methanol extraction of A. muricata leaves
Fig 6. 3D chromatogram of A. muricata leaf extract
Fig 7. Extracted chromatogram of hexane extract
Fig 8. Extracted chromatogram of methanol extract
Fig 9. Effects of extraction fractions on behavior of mice in the Light/Dark Conflict Box
Test
Fig 10. Effects of extraction fractions on behavior of mice in the Elevated Plus-Maze
Test
Fig 11. Effects of extraction fractions on behavior of mice in the Open Field Exploration
Test
Fig 12. Dose response curves for effect of water fraction and diazepam on behavior of
mice in the Open Field Exploration Test
Fig 13. A. muricata extraction flow chart and chromatogram of bioactive water fraction 4.
Fig 14. Effect of fractions from the water extract on behavior of mice in the Open Field
Exploration Test
Fig 15. Chemical space of identified compounds and NIH mental health drugs

viii
LIST OF TABLES
Table 1. Collection times of fractionated polar fraction through preparative HPLC
Table 2. Treatment list for second behavioral mouse bioassay
Table 3. Treatment schedule for Light/Dark Conflict Box Test in first behavioral mouse
bioassay
Table 4. Treatment schedule for Elevated Plus-Maze Test and Open Field Exploration
Test in first behavioral mouse bioassay
Table 5. Testing schedule for first behavioral mouse bioassay
Table 6. Treatment schedule for second behavioral mouse bioassay
Table 7. Testing schedule for second behavioral mouse bioassay
Table 8. Treatment list for third behavioral mouse bioassay
Table 9. Treatment schedule for third behavioral mouse bioassay
Table 10. Treatment schedule for fourth behavioral mouse bioassay
Table 11. Testing schedule for fifth behavioral mouse bioassay
Table 12. Treatment schedule for fifth behavioral mouse bioassay
Table 13. Identification of compounds in A. muricata leaf extract
1
1. Introduction
Ethnobotany is the study of the symbiotic relationship between humans and
plants, more specifically on the ways that humans use plants in everyday life.
Ethnobotanical species are used as sources of food and medicinal remedies. Across the
world, it is still common for plants to be used as a major component in natural medicines.
Medicinal plants have also been found to be the number one source of biologically active
compounds, and many documented medicinal plants have been scientifically proven to
have therapeutic applications (Borris, 1996; Carlini, 2003; Faustino et al, 2010).
Ethnobotany is an important branch of science because many cultures, including
many Western cultures, are looking for better alternatives to the already existing
synthetic medicines. In addition to the drawback of having adverse side effects and
frequent addiction with therapeutic usage, synthetic medicines also lose effectiveness
over time as the biological system builds a tolerance to it, requiring different doses or
even different drugs for the same effect. This opens up the possibility of using natural
resources, such as plants, to see if a better alternative may exist in the natural world. Out
of the 250,000-500,000 plants that exist on this planet, only 1-10% have been studied to
determine if any potential medicinal value exists (Borris, 1996). This statistic supports
the idea that plant species need to be studied and their medicinal values determined.
Another benefit of ethnobotany is that many of the compounds that have already
been discovered are secondary metabolites, meaning that they are not directly involved
with the plant’s metabolic processes (de Souza et al, 2009). Therefore, harvesting these
compounds for mass production will not destroy or alter the plant’s normal processes, but
will allow for a steady renewable resource to support man’s needs for treatment.

2
Although widely used in Benin, West Africa as an anti-anxiety treatment, Annona
muricata can be found all over the world as a treatment for a wide variety of ailments. A.
muricata is a deciduous tree that belongs to the Annonaceae family, and it produces a
heart-shaped, highly aromatic fruit. The fruit’s nectar is commonly used in smoothies and
yoghurts, giving this plant yet another cultural use (Lutchmedial et al, 2004). A. muricata
is known in the United States as “soursop,” in Benin as “chap-chap,” and in South
America as “graviola,” “guanabana,” and “pawpaw” (Adewole et al, 2008). Soursop is
believed to have originated in Central or South America and spread across the world into
all major tropical climates, including Western Africa and Southeast Asia. This spread is
most likely because all parts of this tree are used in natural medicine spanning the tropics.
Natural medicine exploits the bark, leaves, roots, fruit, and fruit seeds of the plant
(Onimawo, 2002; de Souza et al, 2009). Parts of A. muricata have been used to treat
ailments such as cancer (including prostate and liver cancers), diabetes mellitus, and have
elicited an anti-viral effect against Herpes simplex virus-1 (Atawodi, 2011; Adewole et
al, 2008; Padma et al, 1998). Extracts of soursop, specifically the leaf extract, have
exhibited strong antioxidant properties, with a high success rate in capturing free radicals,
and have also exhibited anti-inflammatory and antinociceptive properties (Lim, 2012; de
Sousa et al, 2010). Various parts of the plant have been used for hypertension, or as a
vasodilator, and as an antispasmodic (Lim, 2012).
Potentially one of the most important uses of soursop that has not yet, at least
until now, been scientifically investigated is its use as an anti-anxiety treatment. Although
often overlooked by society, anxiety disorders are among the most common neurological
disorders in the world. In the United States, 15-26 million Americans suffer from one or

3
more of these disorders annually (Greenberg et al, 1999). Generalized anxiety disorder
(GAD), is a prime example of an anxiety disorder that plagues humanity. GAD is
characterized by obsessive, chronic worrying, and typically requires long-term treatment.
Anxiety disorders are not only a problem because of the chronic worrying, but also
because there is a high correlation between anxiety disorders and increased rates of
alcohol abuse, marital problems, and suicide attempts (Iosifescu, 2010). The four main
anxiety disorders are GAD, panic disorder, obsessive compulsive disorder, and post-
traumatic stress disorder (PTSD), and they can be caused by a number of things, such as
dietary deficiencies, hormonal changes, traumatic experiences, life stressors, aging, and
genetics (Alramadhan et al, 2012; Bandelow et al, 2013).
Current synthetic, short-term anxiety treatments are costly, and may come with
many undesired, adverse effects (Lakhan et al, 2010). Benzodiazepines are typically
prescribed to patients of anxiety disorders, either instead of other treatments that include
selective serotonin reuptake inhibitors (SSRIs) and serotonin-norepinephrine reuptake
inhibitors (SNRIs), or in combination with these medications for quick relief that the
other treatments do not provide (Bandelow et al, 2013). However, their usage is often
accompanied with development of a strong dependence, as well as anterograde amnesia,
impaired spatial and motor awareness and coordination (Maremmani et al, 2013).
Therefore, many Americans have begun looking into nutraceutical supplements as a
remedy for anxiety, with approximately 40% turning to herbal supplements or other
alternative medicine (Barnes et al, 2008). This statistic, along with the statistic that less
than 10% of the world’s plant population has been examined for medicinal value, show,
4
more than ever, the importance of moving forward into this new frontier of natural
medicine (George et al, 2012).
In studying anxiety and developing treatments for it, behavioral mouse models are
often used to examine the effects of the anxiolytic agent in vivo. One such model, the
Light/Dark Conflict Box test, is based on the innate aversion of mice to sources of bright
light. It allows more anxious mice to spend a larger percentage of time in a dark area, and
allows less anxious mice to explore a bright space (Crawley et al, 1980; Bourin et al,
2003). The most widely used model, the Elevated Plus-Maze test, is considered the most
well-established behavioral mouse model in terms of assessing anxiety and motor
behavior (Pellow et al, 1986; Foyet et al, 2012). Another model, the Open Field
Exploration test, looks at the environment exploration and general locomotive activity of
the mice (Prut et al, 2003). All of these approaches use the natural anxiety of mice to
gauge if the treatments have any effect in lowering the anxiety of the animal.
This study was conducted to investigate the use of A. muricata as an anti-anxiety
treatment, and to identify the bioactive compounds within the leaf extract. Three different
behavioral mouse model assays were used in this study to determine which fractions of
the extract exhibited an anxiolytic or sedative effect, as well as to determine the dose
responsive effect of different concentrations of the active fractions. In addition, the
extract fractions were administered intraperitoneally (IP) and orally to the mice to
determine the effect of metabolism on the efficacy of the active fractions.
In developing new pharmaceuticals, the clinical trials can, and most likely will,
get costly. Therefore, it is a benefit to be able to simulate a compound’s biological
activity before synthesizing and spending all of the money on model assays.
5
Cheminformatics, an emerging and progressing new computational science, provides the
researcher an opportunity to sift through large amounts of data to determine if a specific
compound will likely act in a way that would be beneficial for pharmaceutical utilization.
This subject is currently a main aspect in today’s pharmaceutical industry in terms of
drug discovery (Jorgensen, 2004). Once biologically active fractions have been found
from the leaf extract of A. muricata, they can each be modeled to see how likely they are
to be causing the bioactive effect. These compounds can be checked to see if they
optimally obey certain necessary parameters for drug development, such as Lipinski’s
Rule of 5. This allows the researcher to see if the molecule has certain characteristics that
are indicative of drug-like behavior. Some of these rules include a limit on molecular
weight, as well as relative solubility and lipophilicity (Akella et al, 2010). Even if the
bioactive compounds are not optimally drug-like, they can still be chemically modified,
as long as the structure important for its bioactive effect is not covered or altered.
2. Materials and Methods
2. 1 Plant Material Collection and Initial Phytochemical Profiling
The plant material (leaves) was collected at Abomey-calavi in Benin (West-
Africa) with the following geographical location characterization: latitude (06°27’0”N),
longitude (02°21’0”E); and an altitude of 12 m. The collection site was characterized by
an average of 80% year round high hygrometry with a subequatorial climate
characterized by two rainy and two dry seasons. The total annual pluviometry reaches
1200-1300 mm of water. The ambient temperature is relatively high (26.6°C) with a
thermal amplitude of 7°C. The soil is ferrallitic, deep, well-drained and without
concretions on rock sedimentary.

6
Plant material was dried and ground into a powder and was stored at 4°C until
extraction. Phytochemical profiling was performed through a multi-solvent based
fractionation of the leaf extract and followed using UHPLC and GC-MS. The powdered
leaf material (7.011 g) was extracted three times with hexane and subsequently three
times with methanol containing 1% glacial acetic acid. Both fractions were dried under
vacuum using a rotary evaporator. The hexane-extract yielded 196 mg of residue (2.79%)
and the methanol extract yielded 907 mg of residue (12.9%).
The methanol extract was fractionated by liquid/liquid partitioning between water
and ethyl acetate. Both fractions were dried under vacuum using a rotary evaporator. The
water fraction yielded 514 mg of material (56.7% of the methanol extract) and the ethyl
acetate fraction yielded 343 mg (37.8% of the methanol extract).
2.2 Phytochemical screening by Gas Chromatography-Mass Spectrometry (GC-MS)
20 mL of d solvent (hexane or methanol) was added to 800 mg of plant material
in a 50 mL Falcon test tube. Samples were extracted by vortexing for 60 min at 500 rpm.
The mixture was allowed to settle for another 60 minutes, and 1 mL of sample was
transferred into a vial for GC-MS analysis. The sample was analyzed with a Shimadzu
GC2010 gas chromatograph coupled to a Shimadzu QP2010-Plus mass spectrometer. A
Shimadzu SHRXI-5MS column (length = 30.0 m, film thickness = 0.25 µm, diameter =
0.25 mm) using a linear gradient from 70 °C to 315 °C with an increase of 10 °C per
minute to separate the compounds. Data was recorded using GC-MS solution ver. 2.61
software. Major peaks were tentatively identified by comparison to the NIST 2008
library.
2.3 Identification of Bioactive Fraction from Leaf Extract of A. muricata

7
Five samples resulting from the fractionation of the extract were tested in the first
behavioral mouse model: (i) plant material still containing all of the extract (positive
control), (ii) plant material in which all fractions had previously been extracted (negative
control), (iii) a hexane fraction, containing most nonpolar components of the extract, (iv)
an ethyl acetate fraction, containing most of the amphipathic components of the extract,
and (v) a water fraction, containing most of the polar components of the extract. All
fractions were dissolved in phosphate buffer saline (PBS). Solutions from fractions were
all made at 5 mg/kg (stock concentration). The stock solutions were diluted further with
PBS to obtain solutions for administration at 2.5 mg/kg. Diazepam (positive control)
solution was administered at a 2 mg/kg dose only (dissolved in PBS with 1% Tween 80).
2.4 Identification of Bioactive Fraction within Polar Components of Leaf Extract
Through Preparative HPLC
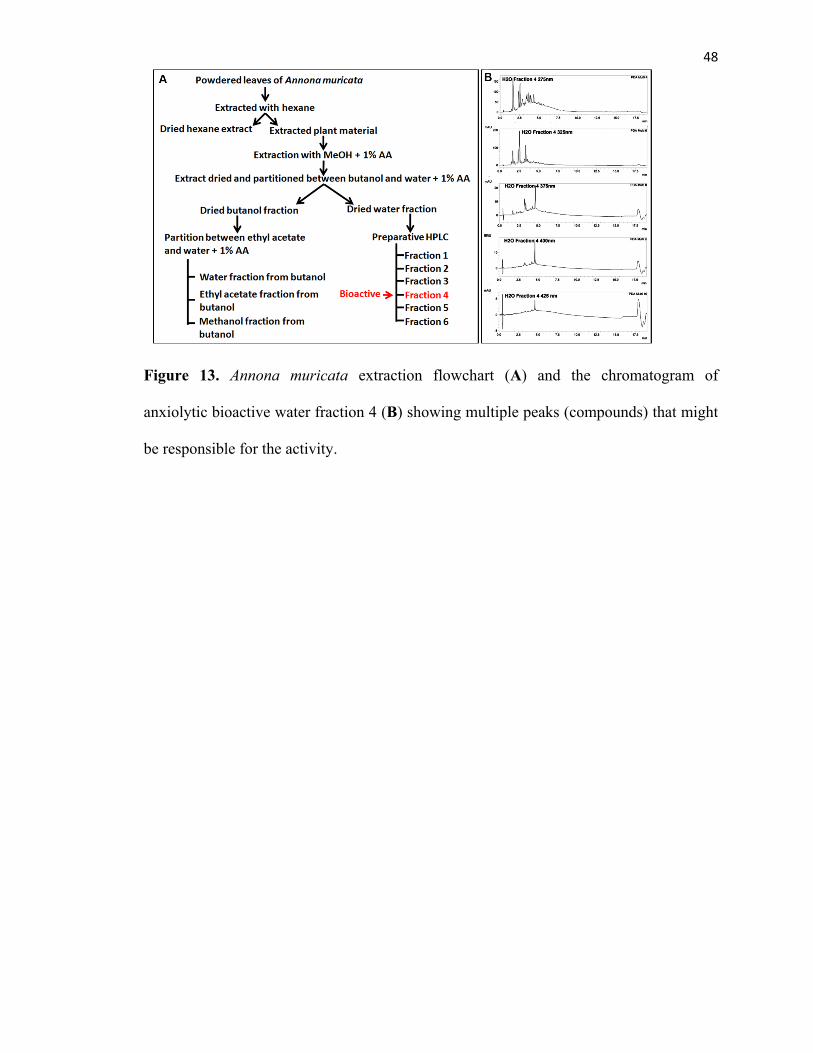
Powdered leaves of A. muricata were extracted with hexane. All plant material
that remained was extracted with methanol + 1% glacial acetic acid. The extract was then
partitioned between butanol and water + 1% glacial acetic acid. The butanolic extract was
then partitioned between ethyl acetate, methanol, and water + 1% glacial acetic acid, to
give three fractions. The water extract was then separated into six fractions using
preparative HPLC. Preparative HPLC was performed on a C18 column using a stepped
gradient with a flow rate of 15 mL/min. Fractions were collected manually at timed
intervals as shown in Table 1. The fractionation was done on a Shimadzu CBM-20A
controller and a CTO-20AC oven at 40° C with the solvents water with formic acid and
methanol with formic acid. The resin of each fraction was dissolved in PBS for
administration to the mice.
8
2.5 Oral Dose Response Curve of Crude Polar Extract Determination
To determine the optimal concentration for oral administration of the polar
extract, 15.27 g of plant material was crushed and extracted twice in methanol and twice
in 2-propanol. The extracted material was combined and dissolved in PBS + 1% Tween
80 to ensure most polar compounds would be present in the treatment and the solution
would be solubilized for absorption in the animals.
2.6 Animal Housing, Identification of Bioactive Fraction, and Dose Reponse Curve
of Polar Fraction and Diazepam, Oral Administration of Potentially Bioactive
Fractions, Oral Dose Response Curve of Crude Polar Extract
For all behavioral models, C57 BL/6 mice were purchased from Hilltop Lab
Animals, Inc. (Scottsdale, PA). All mice were housed in a reverse light-dark cycle (12
hours/12 hours), with lights on at 19:00. They were given food and water ad libitum and
the temperature of the facility was maintained at 22.2- 23.3 ºC. Testing was only
performed during the dark half of the cycle, starting at about 10:00.
In the first two behavioral bioassays, 24 mice were individually housed and all ID
numbers were determined randomly to separate mice into groups. The list of treatments
for the second behavioral bioassay can be seen in Table 2. Treatment schedules were also
randomly assigned using a die. Treatment and testing schedules can be seen in Tables 3-7
for the first and second assays, respectively. All three behavioral models were utilized in
the first and second behavioral assay. After the light/dark box conflict test trials were
completed, five mice were sacrificed due to prolapsed intestines. The remaining mice
were re-organized into three groups with the same ID numbers, and the positive control
solution was no longer used as a treatment. This is justified by the use of diazepam,

9
which already acts as a positive control. All mice were weighed prior to testing and all
injection volumes were 30 mL/kg. All procedures were approved by the Rutgers
Institutional Animal Care and Use Committee (IACUC) in a facility accredited by the
Association for Assessment and Accreditation of Laboratory Animal Care International
(AAALAC).
For the third behavioral bioassay, 20 mice were housed four in each cage. ID
numbers were determined randomly as described above. No groups were made for this
assay. The list of treatments and treatment schedule of the third behavioral assay can be
seen in Tables 8 and 9. Only the Open Field Exploration test was utilized. The fourth
mouse assay was also run using 20 mice, separated into four groups of five. Each group
received four different concentrations of the same treatment to identify any dose
responsive effects. The four treatments were the positive control from the prior bioassay
(RUTWS-1001), diazepam, and the two most potentially bioactive fractions of the polar
components, as suggested from the prior bioassay (RUTWS-1004 and RUTWS-1005).
For water fraction treatments, the four concentrations in descending order are as follows:
2.5 mg/kg, 1 mg/kg, 0.313 mg/kg, and 0 mg/kg (PBS as a negative control). For the
generation of a diazepam dose response curve, the concentrations chosen were as
follows: 0.9 mg/kg, 0.3 mg/kg, 0.1 mg/kg, and 0 mg/kg (PBS as a negative control).
Treatment schedules can be seen in Table 10. The Open Field Exploration test was the
only model utilized. To determine the differences in routes of administration, the animals
in the fourth behavioral assay were treated orally.
The fifth behavioral bioassay was run with 8 mice to determine an oral dose
response curve for the entire polar extract of A. muricata leaves. Each mouse was orally

10
given each of the following concentrations for dose responsive effect determination: 180
mg/kg, 90 mg/kg, 45 mg/kg, and 0 mg/kg (PBS; negative control). The Open Field
Exploration and Light/Dark Conflict Box tests were utilized in this assay. Treatment and
testing schedules can be seen in Tables 11 and 12.
2.7 Light/Dark Conflict Box Test
2.7.1 Identification of Bioactive Fraction from Leaf Extract of A. muricata
Two boxes are separated by a wall in the middle. One box is painted white and
left uncovered, while the other box is painted black with a removable cover on top
(Figure 1). Each mouse received four treatments: (i) PBS as negative control, (ii)
diazepam (positive control; 2 mg/kg solution), (iii) low concentration of fraction (2
mg/kg), and (iv) high concentration of fraction (5 mg/kg). Mice were given an IP
injection and set in the testing room to acclimatize, then placed into the testing box and
recorded for three minutes with a Kodak 100 Sport camera. All videos were watched and
the following parameters were measured: (i) amount of time spent in the open, light box
(converted into a percentage of time), (ii) latency into the dark box, or how long until the
mouse moved into the dark box after the test began, (iii) time spent in the middle of the
light box, (iv) number of rears, and (v) number of transitions between boxes.
2.7.2 Dose Reponse Curve of Polar Fraction and Diazepam, Oral Dose Response
Curve of Crude Polar Extract
The testing apparatus remained the same for the second and fifth behavioral
bioassays. Different concentrations of the polar fraction and diazepam were administered
to the mice as treatments. Mice were placed into the testing apparatus 30 minutes post-

11
injection and recorded for five minutes. The same parameters were measured during the
video analysis.
2.8 Elevated Plus-Maze Test
An elevated platform in the shape of a plus sign was suspended 45 cm off the
ground. Each arm was 5 cm wide and 30 cm long. The walls of the two arms that were
considered to be closed were approximately 20 cm high, while the walls of the two arms
that were considered to be open were 2.5 cm high (Figure 2). This model was utilized in
the first two assays. The treatments were the same as above. All mice were placed into
the testing area 30 minutes post-injection, and were recorded with the same camera for
five minutes. All videos were watched and the following parameters were measured: (i)
crosses into a new arm, or how many times all four paws crossed from the center of the
platform into a new arm, whether open or closed, (ii) amount of time spent in the open
arms, and (iii) number of rears.
2.9 Open Field Exploration Test
A large, open square (76 cm x 76cm) was constructed with 30 cm walls all
around. A grid of 16 smaller squares was drawn onto the testing area (each square was 19
cm x 19 cm) (Figure 3). This model was utilized in all behavioral assays. The treatments
for the first two bioassays were the same as above. For the identification of the bioactive
fraction within the polar components of the extract, each mouse was randomly assigned
two treatments: one sedative concentration and one anxiolytic concentration. All mice
were placed into the testing area 30 minutes post-injection, and were recorded with the
same camera for five minutes. All videos were watched and the following parameters
were measured: (i) locomotion, or how many times all four paws crossed over one of the

12
gridlines, (ii) time spent in the center four squares as opposed to the outside of the grid,
(iii) number of rears, and (iv) time spent in the four corner squares out of the entire
amount of time spent around the edges of the grid.
2.10 Statistical Analyses
The following statistical tests were applied to all of the data from each test: analysis of
variance (ANOVA), the Tukey test, and Dunnett’s multiple comparison test. Statistical
difference was concluded if p ≤ 0.05.
2.11 Chemical Similarity Analysis
We performed chemical similarity analysis between the 51 compounds from plant extract
and the 67 NIH Mental Health Drugs. First, 186 two dimensional chemical descriptors
were calculated from the molecular structures of all the compounds by using Molecular
Operating Environment (MOE) software. Then the chemical similarity between each of
two compounds could be presented as the MOE chemical descriptor distance. Since it is
not feasible to directly visualize the compounds in a 186 dimensional space, we
performed a Principal Component Analysis (PCA) by using all the descriptor values of
the NIH Mental Health Drugs and the plant extract compounds. The top three principal
components (57% explained variance of all 186 MOE descriptors) could be used to
generate a 3-D plot that gives us a direct visualization of the current MOE chemical space
of all the compounds.
3. Results
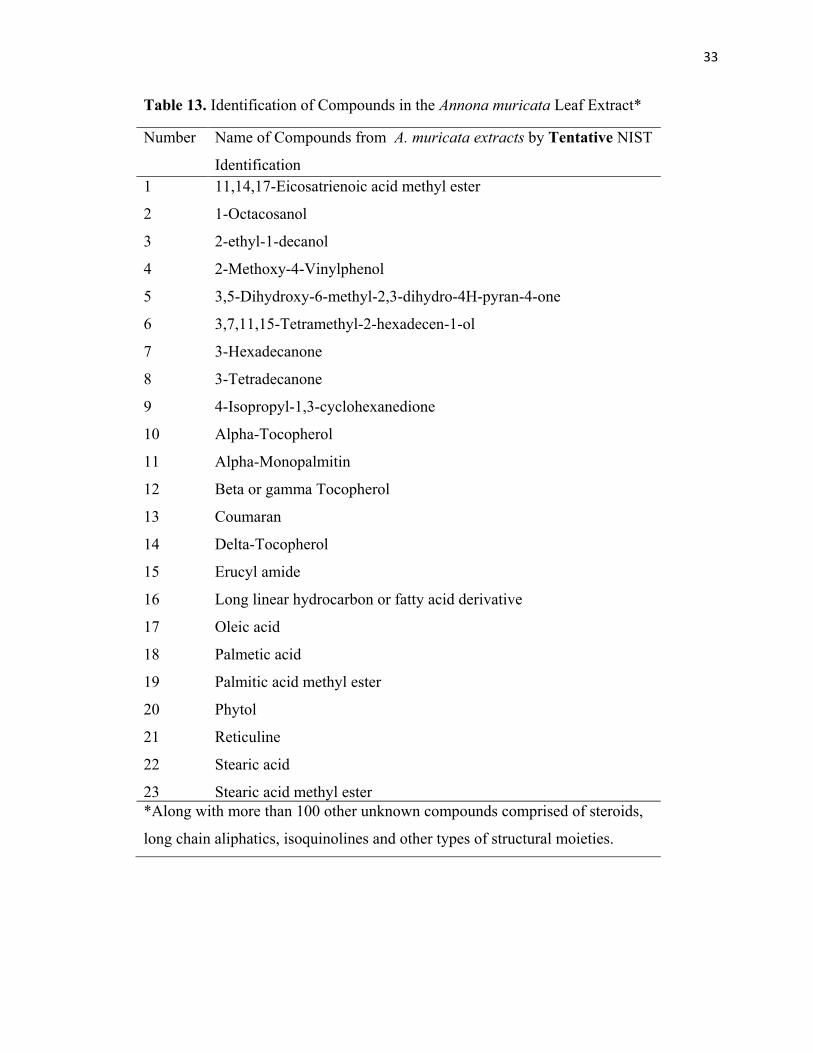
3.1 Phytochemical Profiling of A. muricata leaf extract
Through GC-MS and UHPLC, we identified a list of compounds in the extracts of
A. muricata leaves. Compounds that have already been identified and approved as NIST
13
compounds have been listed in Table 13. Many compounds in the extract have not yet
been identified. Phytochemical studies on A. muricata revealed a broad range of
biological activities such as: the production of approximately 82 acetogenins from 10
different groups, including muricin I, muricin H, cis-annomontacin, cis-corossolone, and
annocatalin; a number of alkaloids, including reticulin, coreximine, coclarine, and
anomurine; the essential oils β-caryophyllene, δ-cadinene, epi-α-cadinol, and α-cadinol
(Lim, 2012; Adewole et al, 2008; de Sousa et al, 2010; Liaw et al, 2002). Other
substances, such as flavonols, polyphenols, and flavones have also been isolated from the
A. muricata extract (George et al, 2012). Chromatograms representing the phytochemical
profiling of A. muricata leaf extract can be seen in Figures 4-8.
3.2 Determination of Active Fraction from Crude Extract through Behavioral
Mouse Model
The results of the IP administration of the different fractions of A. muricata crude
leaf extract on parameters tallied in the Light/Dark Conflict Box test, the Elevated Plus-
Maze test, and the Open Field Exploration test are presented here. All statistical
differences were found using Dunnett’s Multiple Comparison Test.
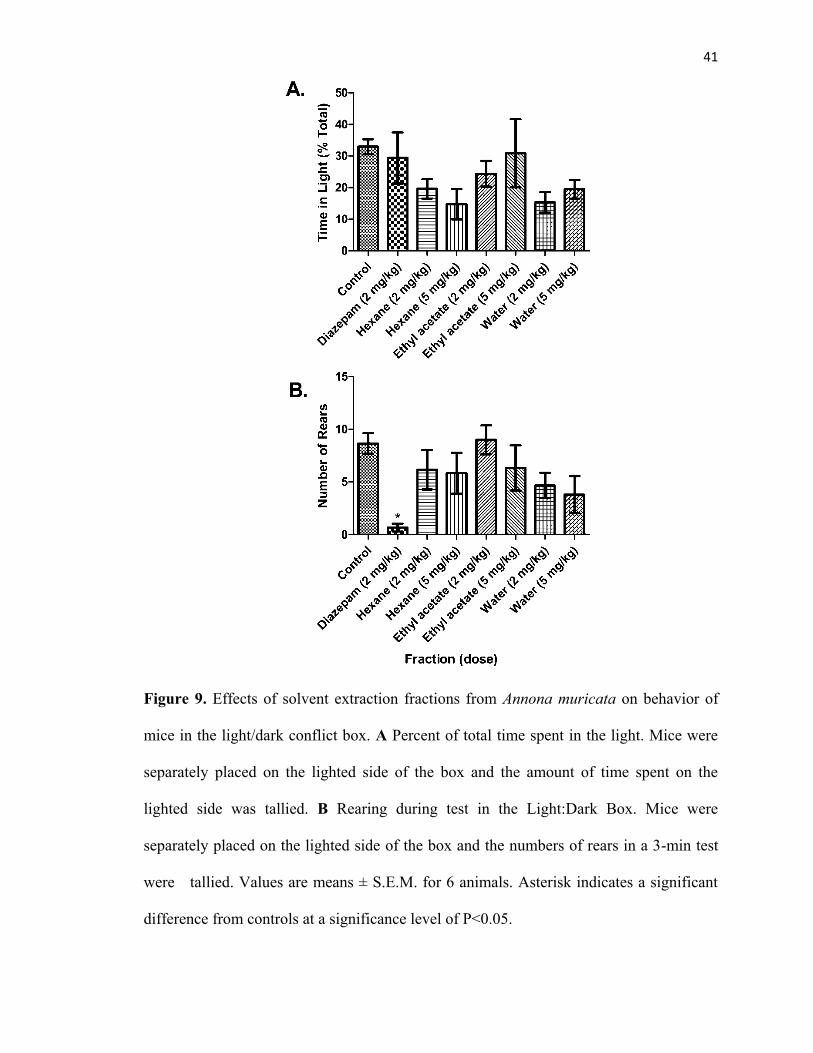
3.2.1 Light/Dark Conflict Box Test
The parameters presented are the effects of the fractions on percent of time spent
in the light box as well as number of rears (F74 = 8.612, p<0.0001) (Fig 9). No statistical
difference was observed between treatments through this approach.
3.2.2 Elevated Plus-Maze Test

14
The parameters presented are the effects of the fractions on time spent in the open
arms (F66 = 3.379, p=0.0038), the number of crosses into a new arm, and the number of
rears (F67 = 14.39, p<0.0001) (Fig. 10). Statistical differences were found between the
effect of the water (polar) fraction on the number of crosses into new arms and the
number of rears (F67 = 6.287, p<0.0001).
3.2.3 Open Field Exploration Test
The parameters presented are the effects of the fractions on the time spent in the
center of the grid (F67 = 5.661, p<0.0001), the time spent in the corners of the grid,
locomotion of the mouse around the grid, and the number of rears (Fig. 11). Statistical
difference was found using Dunnett’s Multiple Comparison test between the effects of
the lower concentration (2 mg/kg) of the water (polar) fraction on the amount of time
spent in the corners of the grid (F69 = 13.75, p<0.0001).
3.3 Dose Response Curve Determination for the Active Water (Polar) Fraction
The results of the administration of the water (polar) fraction and diazepam for
dose response determination in the Light/Dark Conflict Box test, the Elevated Plus-Maze
test, and the Open Field Exploration test are presented here. All statistical differences
were found using Dunnett’s Multiple Comparison test. All figures are presented together
in Figure 12.
3.3.1 Light/Dark Conflict Box Test
The parameter presented is the percent of time spent in the light box. Both dose
response curves appear to be biphasic in shape. No statistical difference in behavior has
been found between the varying concentrations.
15
3.3.2 Elevated Plus-Maze Test
The parameter presented is the percent of time spent in the open arms of the
testing apparatus. Both dose response curves appear to be biphasic in shape. No statistical
difference in behavior has been found between the varying concentrations of the water
fraction.
3.3.3 Open Field Exploration Test
The parameter presented is the percent of time spent in the center four squares of
the grid. Both dose response curves appear to be biphasic in shape. Statistical difference
was found between the treatment of the lowest concentration of the water fraction (0.313
mg/kg) and the other treatments.
3.4 Extraction and Preparative HPLC
The fractionation procedure of the water fraction using preparative HPLC can be
seen in Figure 13. A list of fractions used to determine biological efficacy of these sub
fractions and other isolated fractions from other non-water solvents can be found in Table
8.
3.5 Determination of Active Fraction within Water (Polar) Fraction of Crude
Extract
The results of the administration of the various extracted and fractionated
fractions of the water fraction in the Open Field Exploration test are presented here. Both
sedative and anxiolytic concentrations were used as determined by the dose response
curves for the same testing approach. Statistical differences between the lower (or
anxiolytic) concentrations are indicated in Figure 14.
3.6 Chemical Similarity Analysis
16
Since lipophilicity (logP), water solubility (logS), and molecular weight are three
important factors that affect the oral bioavailability of drug molecules, we generated the
3D plot for the 51 compounds from A. muricata extract samples and 67 NIH mental
health drugs (Fig. 15A). Furthermore, we performed PCA of the chemical descriptors as
described above. After PCA with the 186 MOE descriptors for all the compounds, we
selected the first three most important principal components to generate a three-
dimensional plot (Fig. 15B) for these 118 (51 A. muricata extract and 67 metal health
drug) compounds. These two plots could be viewed as two chemical spaces covered by
the existing metal health drug molecules and the compounds analyzed in this study. There
is only one outlier (escitalopram, CAS 128196-01-0) of NIH mental health drugs within
these two chemical spaces. As a selective serotonin reuptake inhibitor, escitalopram has a
chemical structure unrelated to that of other SSRIs or of tricyclic, tetracyclic, or other
available antidepressant agents. On the other hand, several of our identified compounds
from A. muricata extract samples are chemically similar to the available NIH mental
health drug molecules on these two different chemical spaces, indicating the potentials of
these compounds to be successful future drug candidates.
4. Discussion
The main goal of this study has been to isolate and identify the active
compound(s) that provide the anxiolytic effects of the Annona muricata leaf extract, and
compare these compounds to preexisting NIH mental health drugs to determine their
potential of becoming new anti-anxiety drugs. Through the first behavioral mouse
bioassay, it was determined that the active fraction of the crude extract was the water
(polar) fraction, as shown by the statistical difference in the data of the water fraction as a

17
treatment compared to the other fractions (Figures 10B, 10C, 11D). Although the
treatment did not exhibit an expected anxiolytic effect, it exhibited a similar effect to
diazepam. Diazepam has a well-known biphasic dose response curve, which means that it
exhibits anxiolytic effects at certain concentrations, but may exhibit sedative effects at a
higher concentration. The concentration chosen for the first behavioral assay was high
enough to be in the realm of sedative effects. Our results seem to accomplish our
secondary goal of supporting traditional administration of this extract with scientific data;
in some cultures, such as that of Benin, West Africa, the leaf material is boiled in water
and consumed as a tea (Atawodi, 2011). This is supported by the first behavioral bioassay
because when boiled with water as the solvent (to make tea), the polar compounds will be
released from the leaves into solution.
Once the water fraction was determined to be the active one, it became important
to determine if the active fraction was able to exhibit anxiolytic effects at a lower
concentration. A dose response curve utilizing all three models from the first bioassay
was created for the water fraction and diazepam for comparison. All of the parameters
presented by this study do exhibit a curve that appears biphasic in shape. The shape of the
dose response curves for diazepam validate the model, and the shape of the curves for the
water fraction show that anxiolytic effects can be reached at a lower concentration. A
statistically significant anxiolytic effect for the water fraction is seen in Figure 12E,
giving a concentration that could be used in the subsequent assays as an established
anxiolytic concentration.
After validating the ability of the water fraction to exhibit anxiolytic effects,
further fractionation and profiling was done to increase the chance of finding the active

18
compound(s) within the fraction. Another behavioral mouse bioassay was performed,
using a positive control water fraction (RUTWS-1001), the six fractions listed in Table 1,
and the three other fractions from extraction of the leaf material, as seen in Table 8. The
Open Field Exploration test was the only model utilized for this assay, and no statistical
difference was seen between treatments. However, fraction 4 (RUTWS-1005) seems to
have exhibited the desired anxiolytic and sedative effects, as seen in Figure 16. This
fraction, as well as the fraction before it and the positive control (RUTWS-1004 and -
1001, respectively) were compared to diazepam in a dose response curve of oral
administration.
Oral administration of the fractionated extract is able to reveal whether the
metabolism plays an important role in the efficacy of the active compound(s). The first
bioassay using oral administration did not show any statistical difference between
concentrations of the treatments. When drugs are administered to an organism orally, it
must first undergo first pass metabolism before it takes its effect (Pond et al, 1984). We
believe that the concentrations utilized were high enough for i.p. administration, where
the compounds do not undergo first pass metabolism through the liver, but not high
enough for oral administration. We have extracted all potential polar components of the
extract and are performing another model with higher concentrations of the treatments for
oral administration.
After performing the chemical similarity analysis between the compounds
identified from the exact samples and the current available mental health drug molecules,
we believe these compounds have a high possibility to be successful drug candidates in
the future. Based on the original active A. muricata plant components identified in this

19
study, we will use optimized rational drug design procedure to create novel drug
candidates with similar or higher activity but more suitable pharmaceutical properties.
5. Future Directions
Future directions for this project include:
Complete phytochemical profiling and identification of all compounds within the
subfraction of the aqueous extract.
Modeling of identified compounds against preexisting NIH mental health drugs.
Pharmacophore modeling of potentially bioactive compounds against preexisting
NIH mental health drugs.
Structure-based modeling of potentially bioactive compounds against 5-HT1A
receptor
Synthesis of potentially bioactive compounds for bioassay experimentation
Behavioral mouse bioassays to determine which compound(s) elicit anxiolytic
effect (done alone and in conjunction with other potentially active compounds).

20
6. Tables and Figures
Table 1. Collection times of fractionated polar fraction through preparative HPLC.
Fraction Collection time (mins) Solvent
1 0-3 MeOH in Water + 0.1% Formic
acid
2 3-8 MeOH in Water + 0.1% Formic
acid
3 8-16 MeOH in Water + 0.1% Formic
acid
4 16-24 MeOH in Water + 0.1% Formic
acid
5 24-32 MeOH in Water + 0.1% Formic
acid
6 32-40 MeOH in Water + 0.1% Formic
acid
Table 2. Treatment list for second behavioral mouse bioassay for dose response
determination. Code to the left of the numerical concentration represents randomly
selected running code for treatments.
H2O Fraction Concentrations (mg/kg) Diazepam Concentrations (mg/kg)
W1: 2.5 D1: 2.0
W2: 0 (PBS; negative control) D2: 1.0
W3: 0.313 D3: 0.25
W4: 5.0 D4: 0 (PBS; negative control)
W5: 0.625 D5: 0.5
W6: 1.25 D6: 0.125
21
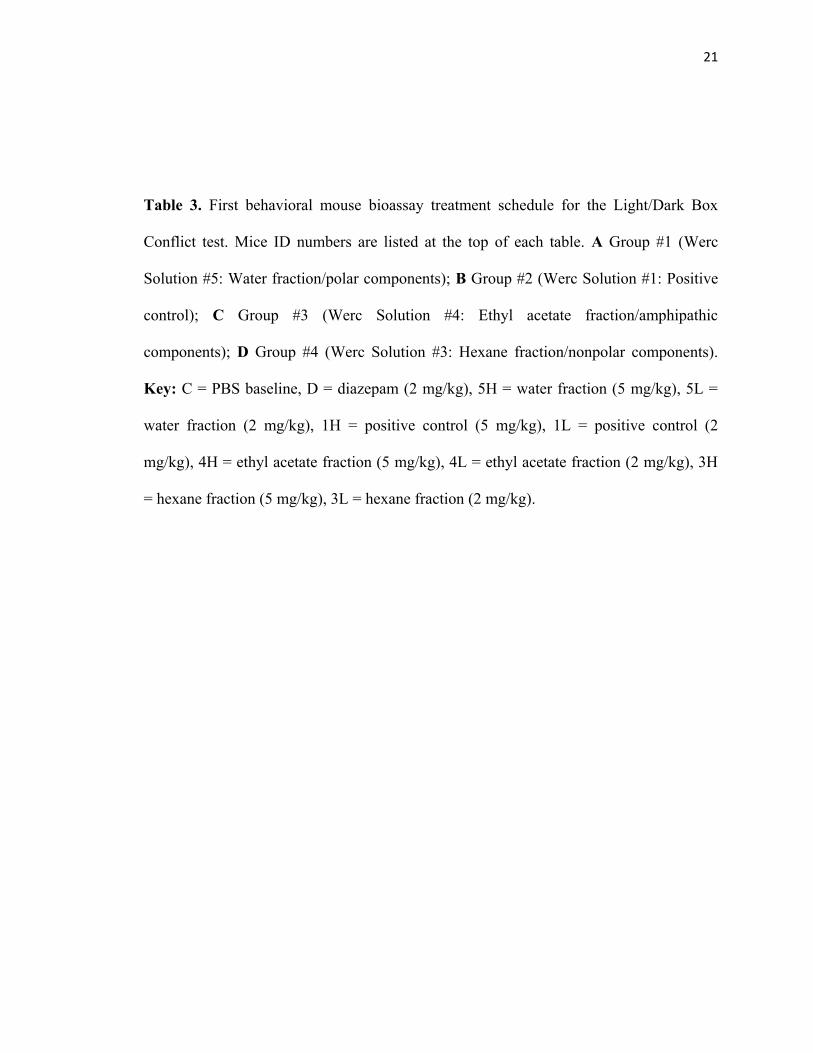
Table 3. First behavioral mouse bioassay treatment schedule for the Light/Dark Box
Conflict test. Mice ID numbers are listed at the top of each table. A Group #1 (Werc
Solution #5: Water fraction/polar components); B Group #2 (Werc Solution #1: Positive
control); C Group #3 (Werc Solution #4: Ethyl acetate fraction/amphipathic
components); D Group #4 (Werc Solution #3: Hexane fraction/nonpolar components).
Key: C = PBS baseline, D = diazepam (2 mg/kg), 5H = water fraction (5 mg/kg), 5L =
water fraction (2 mg/kg), 1H = positive control (5 mg/kg), 1L = positive control (2
mg/kg), 4H = ethyl acetate fraction (5 mg/kg), 4L = ethyl acetate fraction (2 mg/kg), 3H
= hexane fraction (5 mg/kg), 3L = hexane fraction (2 mg/kg).

22
Trial # 1.1 1.2 1.3 1.4 1.5 1.6
1 C C C C C C
2 D 5L 5H 5H 5H 5L
3 5H 5H D 5L D D
4 5L D 5L D 5L 5H
Trial # 2.1 2.2 2.3 2.4 2.5 2.6
1 C C C C C C
2 1L D D 1H 1L D
3 1H 1H 1L D D 1H
4 D 1L 1H 1L 1H 1L
Trial # 3.1 3.2 3.3 3.4 3.5 3.6
1 C C C C C C
2 4L 4L 4H D D D
3 D 4H 4L 4L 4H 4L
4 4H D D 4H 4L 4H
Trial # 4.1 4.2 4.3 4.4 4.5 4.6
1 C C C C C C
2 3H 3L 3L 3L 3H 3L
3 D 3H 3H D 3L 3H
4 3L D D 3H D D

23
Table 4. First behavioral mouse bioassay treatment schedule for the Elevated Plus-Maze
test and Open Field Exploration test. Mice ID numbers are listed at the top of each table.
A Group #1 (Werc Solution #5: Water fraction/polar components); B Group #2 (Werc
Solution #4: Ethyl acetate fraction/amphipathic components); C Group #3 (Werc
Solution #3: Hexane fraction/nonpolar components). Key: See Table 3.
Trial # 1.1 1.2 1.3 1.4 1.5 2.3
1 C C C C C C
2 D 5L 5H 5H 5H D
3 5H 5H D 5L D 5L
4 5L D 5L D 5L 5H
Trial # 3.1 3.2 3.3 3.4 3.5 3.6
1 C C C C C C
2 4L 4L 4H D D D
3 D 4H 4L 4L 4H 4L
4 4H D D 4H 4L 4H
Trial # 2.5 4.1 4.2 4.3 4.4 4.5 4.6
1 C C C C C C C
2 3L 3H 3L 3L 3L 3H 3L
3 D D 3H 3H D 3L 3H
4 3H 3L D D 3H D D
24
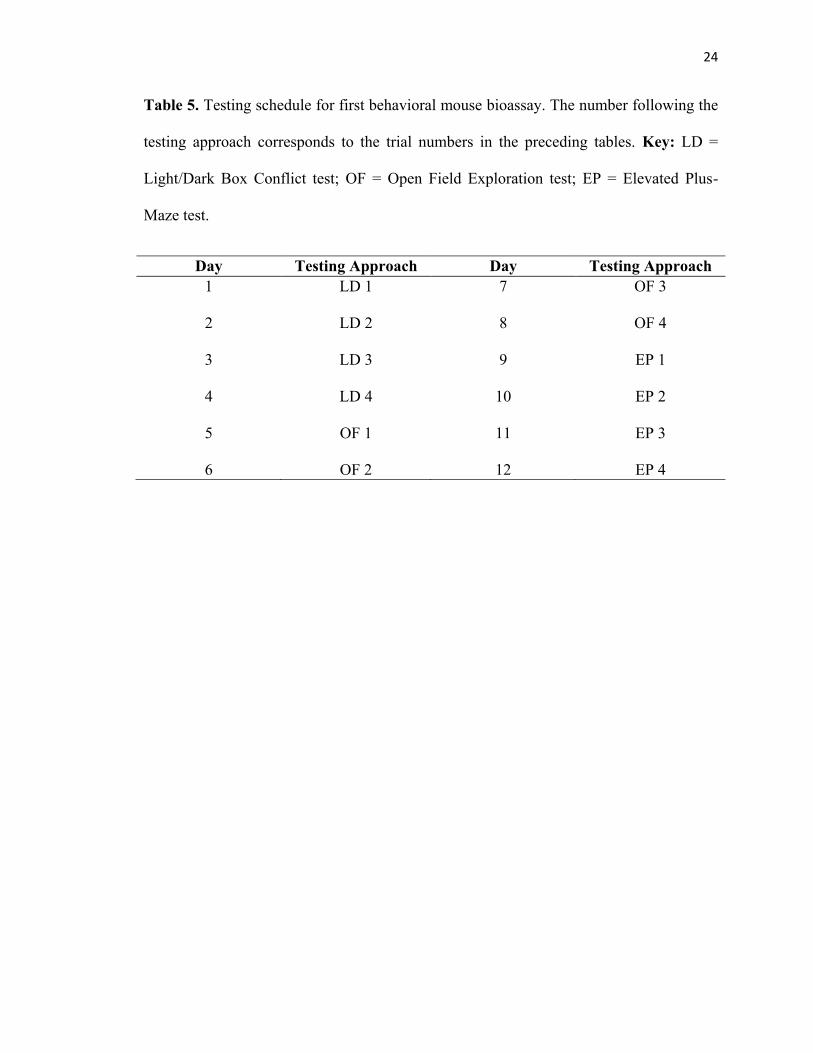
Table 5. Testing schedule for first behavioral mouse bioassay. The number following the
testing approach corresponds to the trial numbers in the preceding tables. Key: LD =
Light/Dark Box Conflict test; OF = Open Field Exploration test; EP = Elevated Plus-
Maze test.
Day Testing Approach Day Testing Approach
1 LD 1 7 OF 3
2 LD 2 8 OF 4
3 LD 3 9 EP 1
4 LD 4 10 EP 2
5 OF 1 11 EP 3
6 OF 2 12 EP 4

25
Table 6. Treatment schedule for second behavioral mouse bioassay for dose response
determination. Mice ID numbers are listed at the top of each table. Each group received
two randomized treatments from the polar fraction of the extract and two randomized
treatments of diazepam solutions. For treatment identification, refer to Table 2. A Group
#1; B Group #2; C Group #3.
Trial # 1.1 1.2 1.3 1.4 1.5 1.6 1.7 1.8
1 C C C C C C C C
2 W1 D1 D2 D1 W2 W2 W1 D2
3 D2 D2 W2 W1 W1 D1 W2 D1
4 D1 W2 D1 W2 D1 W1 D1 W1
5 W2 W1 W1 D2 D2 D2 D2 W2
Trial # 2.1 2.2 2.3 2.4 2.5 2.6 2.7 2.8
1 C C C C C C C C
2 W4 W4 D3 D4 D3 W3 W4 W3
3 D3 D4 W4 W3 W3 D4 D3 D3
4 D4 W3 D4 W4 D4 W4 W3 D4
5 W3 D3 W3 D3 W4 D3 D4 W4
Trial # 3.1 3.2 3.3 3.4 3.5 3.6 3.7 3.8
1 C C C C C C C C
2 W5 W5 W6 W6 D5 W5 D5 D6
3 D6 D6 D5 W5 W5 W6 D6 D5
4 D5 W6 D6 D5 W6 D5 W5 W5
5 W6 D5 W5 D6 D6 D6 W6 W6

26
Table 7. Testing schedule for second behavioral mouse bioassay for dose response
determination. The number following the testing approach corresponds to the trial
numbers in the preceding tables. Key: See Table 5.
Day Testing
Approach
Day Testing
Approach
Day Testing
Approach
1 EP 1 6 OF 2 11 LD 4
2 LD 1 7 LD 3 12 OF 5
3 EP 2 8 OF 3 13 EP 4
4 OF 1 9 EP 3 14 LD 5
5 LD 2 10 OF 4 15 EP 5
Table 8. Treatment list for third behavioral mouse bioassay. Fractions were obtained
through preparative HPLC.
Treatment Running Code
H2O fraction (positive control) RUTWS-1001
Fraction 1 from H2O fraction RUTWS-1002
Fraction 2 from H2O fraction RUTWS-1003
Fraction 3 from H2O fraction RUTWS-1004
Fraction 4 from H2O fraction RUTWS-1005
Fraction 5 from H2O fraction RUTWS-1006
Fraction 6 from H2O fraction RUTWS-1007
Butanolic extract from H2O fraction RUTWS-1008
EtOAc fraction from Butanol RUTWS-1009
MeOH fraction from Butanol RUTWS-1010

27
Table 9. Treatment schedule for third behavioral mouse bioassay. Mouse ID numbers are
listed to the left. Key: C = PBS (negative control); for treatment identification, please
refer to Table 8 (H refers to the higher concentration of the solution, 2.5 mg/kg, and L
refers to the lower concentration, 0.313 mg/kg).
Mouse ID Day 1 Day 2 Day 3 Day 4
1 C RUTWS-1006H C RUTWS-1007L
2 C C RUTWS-1002L RUTWS-1004H
3 C RUTWS-1007H C RUTWS-1001L
4 C C RUTWS-1003H RUTWS-1005L
5 C RUTWS-1004L RUTWS-1009H C
6 C RUTWS-1007H RUTWS-1004L C
7 C C RUTWS-1008H RUTWS-1005L
8 C RUTWS-1003H C RUTWS-1003L
9 C RUTWS-1009L C RUTWS-1001H
10 C C RUTWS-1010L RUTWS-1008H
11 C C RUTWS-1010H RUTWS-1003L
12 C C RUTWS-1002L RUTWS-1001H
13 C RUTWS-1008L C RUTWS-1005H
14 C RUTWS-1009H RUTWS-1007L C
15 C RUTWS-1006H RUTWS-1009L C
16 C C RUTWS-1010L RUTWS-1002H
17 C RUTWS-1006L RUTWS-1005H C
18 C C RUTWS-1006L RUTWS-1002H
19 C RUTWS-1001L C RUTWS-1010H
20 C RUTWS-1004H RUTWS-1008L C

28
Table 10. Treatment schedule for fourth behavioral mouse bioassay. Mice ID numbers
are listed at the top of each table. A Group #1: RUTWS-1004 (Fraction #3 from H2O
fraction); B Group #2: Diazepam; C Group #3: RUTWS-1001 (H2O fraction; positive
control); D Group #4: RUTWS-1005 (Fraction #4 from H2O fraction). Key: C = PBS
(negative control); H = high concentration of treatment; M = middle concentration of
treatment; L = low concentration of treatment.

29
Trial # 1 2 3 4 5
1 C C C C C
2 3H C C 3H 3M
3 C 3M 3H 3M 3L
4 3L 3H 3M C 3H
5 3M 3L 3L 3L C
Trial # 6 7 8 9 10
1 C C C C C
2 C DM C DL DH
3 DM DH DL DH C
4 DL DL DH C DM
5 DH C DM DM DL
Trial # 11 12 13 14 15
1 C C C C C
2 C 1H 1L C 1M
3 1L 1L C 1M 1H
4 1M C 1M 1H 1L
5 1H 1M 1H 1L C
Trial # 16 17 18 19 20
1 C C C C C
2 4L C 4L 4H 4M
3 C 4H 4M 4M 4L
4 4M 4L C C 4H
5 4H 4M 4H 4L C
30
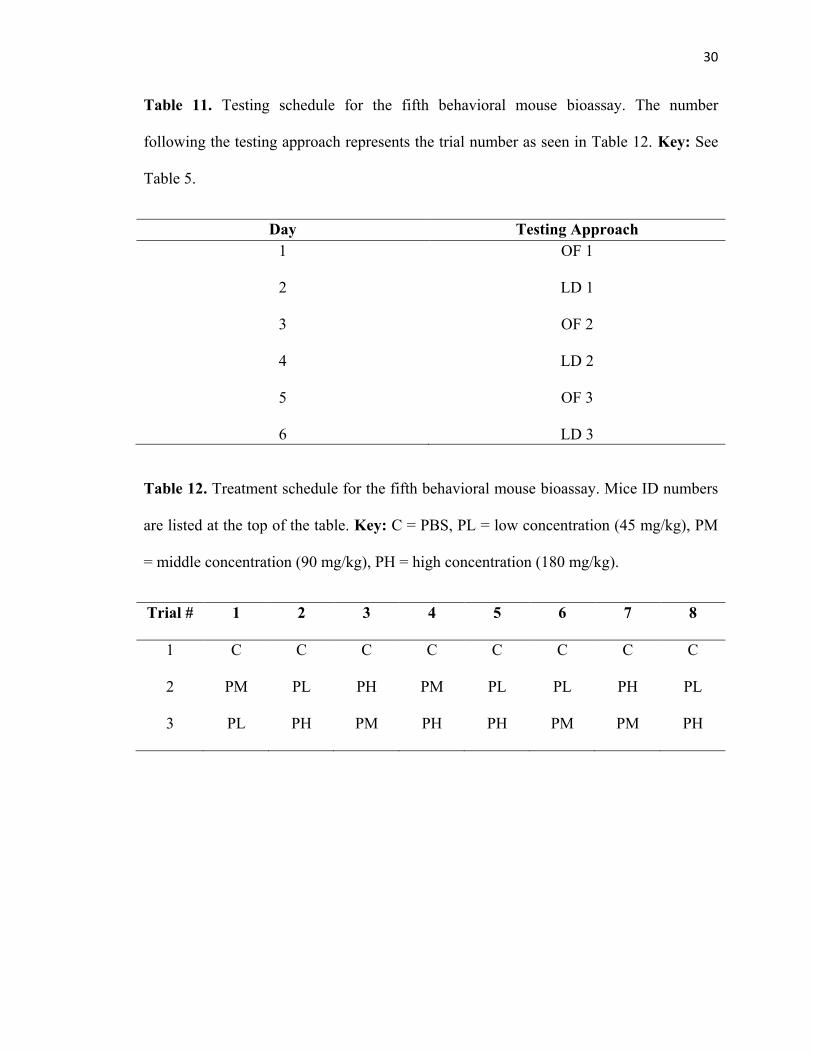
Table 11. Testing schedule for the fifth behavioral mouse bioassay. The number
following the testing approach represents the trial number as seen in Table 12. Key: See
Table 5.
Day Testing Approach
1 OF 1
2 LD 1
3 OF 2
4 LD 2
5 OF 3
6 LD 3
Table 12. Treatment schedule for the fifth behavioral mouse bioassay. Mice ID numbers
are listed at the top of the table. Key: C = PBS, PL = low concentration (45 mg/kg), PM
= middle concentration (90 mg/kg), PH = high concentration (180 mg/kg).
Trial # 1 2 3 4 5 6 7 8
1 C C C C C C C C
2 PM PL PH PM PL PL PH PL
3 PL PH PM PH PH PM PM PH

31
Figure 2. Photograph of the Elevated-Plus Maze test apparatus.
A B
Figure 1. Photograph of the Light/Dark Conflict Box test apparatus. A The entire
apparatus, B Close-up of the light box.

32
A B
Figure 3. Photograph of the Open Field Exploration test apparatus.
33
Table 13. Identification of Compounds in the Annona muricata Leaf Extract*
Number Name of Compounds from A. muricata extracts by Tentative NIST
Identification
1 11,14,17-Eicosatrienoic acid methyl ester
2 1-Octacosanol
3 2-ethyl-1-decanol
4 2-Methoxy-4-Vinylphenol
5 3,5-Dihydroxy-6-methyl-2,3-dihydro-4H-pyran-4-one
6 3,7,11,15-Tetramethyl-2-hexadecen-1-ol
7 3-Hexadecanone
8 3-Tetradecanone
9 4-Isopropyl-1,3-cyclohexanedione
10 Alpha-Tocopherol
11 Alpha-Monopalmitin
12 Beta or gamma Tocopherol
13 Coumaran
14 Delta-Tocopherol
15 Erucyl amide
16 Long linear hydrocarbon or fatty acid derivative
17 Oleic acid
18 Palmetic acid
19 Palmitic acid methyl ester
20 Phytol
21 Reticuline
22 Stearic acid
23 Stearic acid methyl ester
*Along with more than 100 other unknown compounds comprised of steroids,
long chain aliphatics, isoquinolines and other types of structural moieties.

34
A
B
C
Figure 4. GC-MS Chromatogram of Hexane extraction of A. muricata leaves. A 3-13
minutes section. B 13-23 minutes section. C 23-32 minutes section.

35
C
A
B
Figure 5. GC-MS Chromatogram of Methanol extraction of A. muricata leaves. A 3-13
minutes section. B 13-23 minutes section. C 23-32 minutes section.

36
A
B
Figure 6. 3D UV-VIS Chromatogram of A. muricata leaf extract. A Hexane extract. B
Methanol + 1% glacial acetic acid extract.

37
A
B
C
D
E

38
F
Figure 7. Extracted Chromatogram of hexane extract (minutes 0-16) at the following
wavelengths: A 250 nm B 300 nm C 325 nm D 400 nm E 450 nm F 500 nm.

39
A
B
C
D
E

40
F
Figure 8. Extracted Chromatogram of methanol extract (minutes 0-16) at the following
wavelengths: A 250 nm B 300 nm C 325 nm D 400 nm E 450 nm F 500 nm.
41
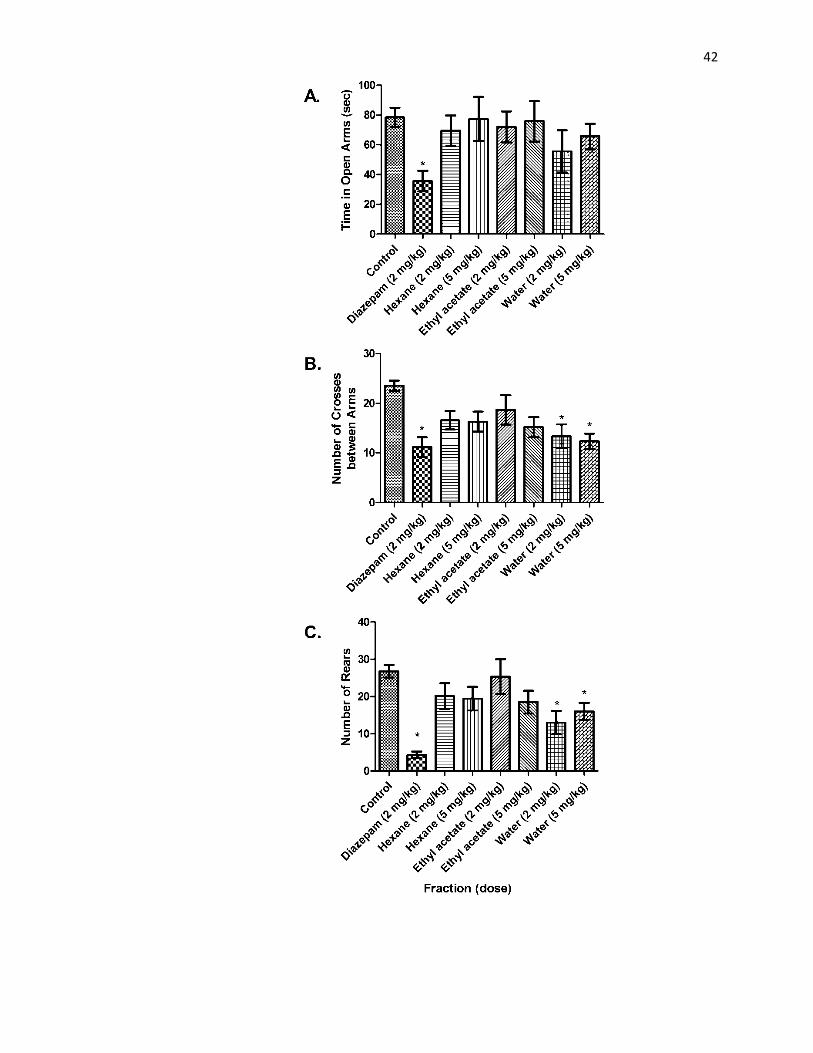
Figure 9. Effects of solvent extraction fractions from Annona muricata on behavior of
mice in the light/dark conflict box. A Percent of total time spent in the light. Mice were
separately placed on the lighted side of the box and the amount of time spent on the
lighted side was tallied. B Rearing during test in the Light:Dark Box. Mice were
separately placed on the lighted side of the box and the numbers of rears in a 3-min test
were tallied. Values are means ± S.E.M. for 6 animals. Asterisk indicates a significant
difference from controls at a significance level of P<0.05.
42

43
Figure 10. Effects of solvent extraction fractions from Annona muricata on behavior of
mice in the elevated plus-maze. A Time spent in the open arms of the elevated plus-
maze. Mice were separately placed in the center of the apparatus and the amount of time
spent on in the open arms was tallied. Values are means ± S.E.M. for 6 animals. B
Crossings between the open and closed arms of the elevated plus-maze. Mice were
separately placed in the center of the apparatus and the crossings were tallied. Values are
means ± S.E.M. for 6 animals. C Number of rears. Number of rears were tallied over the
5-min test. Values are means ± S.E.M. for 6 animals. Asterisks indicate significant
differences from controls at a significance level of P<0.05.

44

45
Figure 11. Effects of solvent extraction fractions from Annona muricata on behavior of
mice in the open field exploration test. A Time spent in the center of the open field. Mice
were separately placed in the center of the box and the amount of time spent on in the
central 4 squares was tallied. Values are means ± S.E.M. for 6 animals. B Locomotion.
Mice were placed separately in the center of the box and the number of times all four
paws crossed a gridline was tallied. Values are means ± S.E.M. for 6 animals. C Number
of rears in open field exploration test. Mice were placed separately in the center of the
box and the number of rears was tallied. Values are means ± S.E.M. for 6 animals. D
Time spent in the corners of the open field. Mice were separately placed in the center of
the box and the amount of time spent on in the corner squares was tallied. Values are
means ± S.E.M. for 6 animals. Asterisks indicate significant differences from controls at
a significance level of P<0.05.
46

47
B
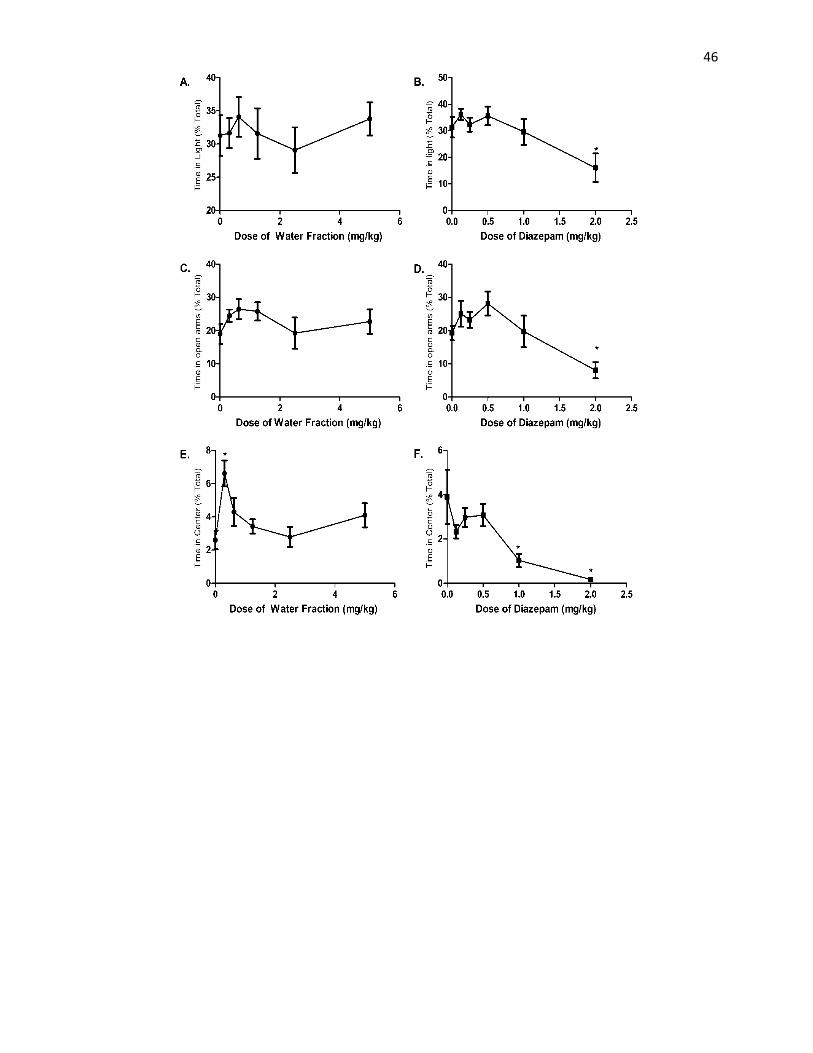
Figure 12. Dose response curves for effect of the water fraction (left column) and
diazepam (right column) on three measures of anxiolytic like and sedative behavior (by
row). A Effect of water fraction on percent of time spent in the light box of the
Light/Dark Conflict Box test. Mice were separately placed into the light box and the
amount of time spent in the light box was tallied. B Effect of diazepam on percent of time
spent in the light box of the Light/Dark Conflict Box test. C Effect of the water fraction
and D diazepam on percent of time spent in the open arms of the Elevated Plus-Maze
test. Mice were separately placed into the center of the testing apparatus and the amount
of time spent in the open arms was tallied. E Effect of the water fraction and F diazepam
on percent of time spent in the center of the grid in the Open Field Exploration test. Mice
were separately placed into the center of the testing apparatus and the amount of time
spent in the center of the grid was tallied. All values are means ± S.E.M. for 8 animals.
Asterisks indicate significant differences from controls at a significance level of P<0.05.
48
Figure 13. Annona muricata extraction flowchart (A) and the chromatogram of
anxiolytic bioactive water fraction 4 (B) showing multiple peaks (compounds) that might
be responsible for the activity.

49

50
Figure 14. Effect of fractions from the water extract of A. muricata leaf on percent of
time spent in the center four squares in the open field exploration test. An aqueous
extract of the leaves was subjected to HPLC chromatography and further extracted
against butanol, ethyl acetate (EtOAc) and methanol (MeOH). Values are means ±
S.E.M. for 6 animals. Asterisks indicate significant differences from controls at a
significance level of P<0.05.

51

52
Figure 15. The chemical space of the identified compounds from A. muricata leaf extract
(red) and the NIH mental health drugs (purple) shown as A the 3-D Plots of LogP (o/w),
water solubility (LogS), & molecular weight and B the first three principle components of
(57% explained variance) 186 two dimensional MOE descriptors using MOE® 2011.
53
7. References
1. Borris, R.P. (1996) Natural product research. Perspective from a major Pharmaceutical
company. J. Ethnopharmacol, 51, 29-38.
2. Carlini, E.A. (2003) Plants and the central nervous system. Pharmacology,
Biochemistry, and Behavior, 75, 501-512.
3. Faustino, T.T., Almeida, R.B., Andreatini, R. (2010) Medicinal plants for the treatment
of generalized anxiety disorder: a review of controlled clinical studies. Revista Brasileira
de Psiquiatria, 32, 429-436.
4. Alramadhan, E., Hanna, M.S., Hanna, M.S., Goldstein, T.A., Avila, S.M., Weeks, B.S.
(2012) Dietary and botanical anxiolytics. Med. Sci. Monit., 18: 40-48.
5. de Souza, E.R., da Silva, R., Afonso, S., Scarminio, I. (2009) Enhanced extraction
yields and mobile phase separations by solvent mixtures for the analysis of metabolites in
Annona muricata L. leaves. J. Sep. Sci., 32, 4176-4185.
6. Lutchmedial, M., Ramlal, R., Badrie, N., Chang-Yen, I. (2004) Nutritional and sensory
quality of stirred soursop (Annona muricata L) yoghurt. International Journal of Food
Sciences and Nutrition, 55, 407-414.
7. Adewole, S. and Ojewole, J. (2008) Protective effects of Annona muricata Linn.
(Annonaceae) leaf aqueous extract on serum lipid profiles and oxidative stress in
hepatocytes of steptozotocin-treated diabetic rats. Afr. J. Traditional, Complementary and
Alternative Medicines, 6, 30-41.
8. Onimawo, I. (2002) Proximate composition and selected physicochemical properties of
the seed, pulp and oil of soursop (Annona muricata). Plant Foods for Human Nutrition,
57, 165-171.
9. Atawodi, E. (2011) Nigerian foodstuffs with prostate cancer chemopreventive
polyphenols. Infectious Agents and Cancer, 6, S2-S9.
10. Padma, P., Pramod, N., Thyagarajan, S., Khosa, R. (1998) Effect of the extract of
Annona muricata and Petunia nyctaginiflora on herpes simplex virus. Journal of
Ethnopharmacology, 61, 81-83.
11. Lim, T.K. (2012) Edible Medicinal and Non-Medicinal Plants. Vol. 1: Fruits.
12. de Sousa, O., Vieira, G., de Pinho, J., Yamamoto, C., Alves, M. (2010)
Antinociceptive and anti-inflammatory activities of the ethanol extract of Annona
muricata L. leaves in animal models. International Journal of Molecular Sciences, 11,
2067-2078.

54
13. Greenberg, P.E., Sisitsky, T., Kessler, R.C., Finkelstein, S.N., Berndt, E.R.,
Davidson, J.R., Ballenger, J.C., Fyer, A.J. (1999) The economic burden of anxiety
disorders in the 1990s. J. Clin. Psychiatry, 60, 427-435.
14. Iosifescu, D. (2010) GABAA receptor modulators: can they offer any improvement
over benzodiazepines in the treatment of anxiety disorders? CNS Neuroscience &
Therapeutics, 16, 61-62.
15. Bandelow, B., Gutermann, J., Peter, H., Wedekind, D. (2013) Early traumatic life
events, parental attitudes, family history, and birth risk factors in patients with depressive
disorder and healthy controls. Int. J. Psychiatry Clin. Pract., 17: 56-63.
16. Lakhan, S., Vieira, K. (2010) Nutritional and herbal supplements for anxiety and
anxiety-related disorders: systematic review. Nutrition Journal, 9, 42-56.
17. Maremmani, A.G.I., Rovai, L., Rugani, F., Bacciardi, S., Pacini, M., Dell’Osso, L.,
Maremmani, I. (2013) Clonazepam as agonist substitution treatment for benzodiazepine
dependence: A case report. Case Reports in Psychiatry, 2013: 1-4.
18. Barnes, P.M., Bloom, B., Nahin, R. (2008) Complementary and alternative medicine
use among adults and children. United States 2007 CDC Natl. Stat. Rep., 12, 1-4.
19. George, V., Kumar, D., Rajkumar, V., Suresh, P., Kumar, R. (2012) Quantitative
assessment of the relative antineoplastic potential of the n-butanolic leaf extract of
Annona muricata Linn. in normal and immortalized human cell lines. Asian Pacific
Journal of Cancer Prevention, 13, 699-704.
20. Crawley, J.N., Goodwin, F.K. (1980) Preliminary report of a simple animal behavior
for the anxiolytic effects of benzodiazepines. Pharmacol. Biochem. Behav., 13: 167-170.
21. Bourin, M., Hascoët, M. (2003) The mouse light/dark box test. European Journal of
Pharmacology, 463: 55-65.
22. Pellow, S., Chopin, P., File, S.E., Briley, M. (1986) Validation of open-closed arm
entries in an elevated plus-maze as a measure of anxiety in the rat. J. Neurosci. Meth., 14:
149-167.
23. Foyet, H.S., Hritcu, L., Ciobica, A., Stefan, M., Kamtchouing, P., Cojocaru, D.
(2012) Methanolic extract of Hibiscus asper leaves improves spatial memory deficits in
the 6-hydroxydopamine-lesion rodent model of Parkinson’s disease. Journal of
Ethnopharmacology, 133: 773-779.
24. Prut, L., Belzung, C. (2003) The open field as a paradigm to measure the effects of
drugs on anxiety-like behaviors: A review. European Journal of Pharmacology, 463: 3-
33.
25. Jorgensen, W.L. (2004) The many roles of computation in drug discovery. Science,
303: 1813-1818.

55
26. Akella, A.J., Wloga, D., Kim, J., Starostina, N.G., Lyons-Abbott, S., Morrissette,
N.S., Dougan, S.T., Kipreos, E.T., Gaertig, J. (2010) MEC-17 is an alpha-tubulin
acetyltransferase. Nature, 467: 218-222.