anixter 4q 2016 highlights and operating results
TRANSCRIPT

4Q 2016 Highlights and Operating ResultsJanuary 31, 2017
1

2© 2017 Anixter Inc.
4Q 2016 Highlights and Operating Results
Table of Contents
Page(s)1 Sales Overview 4-52 NSS Overview 6-73 EES Overview 8-94 UPS Overview 10-115 Financial Performance Trends 12-166 Leverage Metrics 177 Financial Details 18-198 Outlook 20-219 Appendix 22-3010 Supplemental Information 31-32

3© 2017 Anixter Inc.
Safe Harbor Statement and Non-GAAP Financial MeasuresSafe Harbor StatementThe statements in this release other than historical facts are forward-looking statements made in reliance upon the safe harbor of the Private Securities Litigation Reform Act of 1995. Theseforward-looking statements are subject to a number of factors that could cause our actual results to differ materially from what is indicated here. These factors include but are not limited togeneral economic conditions, the level of customer demand particularly for capital projects in the markets we serve, changes in supplier relationships or in supplier sales strategies or financialviability, risks associated with the sale of nonconforming products and services, political, economic or currency risks related to foreign operations, inventory obsolescence, copper pricefluctuations, customer viability, risks associated with accounts receivable, the impact of regulation and regulatory, investigative and legal proceedings and legal compliance risks, informationsecurity risks, risks associated with substantial debt and restrictions contained in financial and operating covenants in our debt agreements, the impact and the uncertainty concerning thetiming and terms of the withdrawal by the United Kingdom from the European Union, and risks associated with integration of acquired companies, including, but not limited to, the risk thatthe acquisitions may not provide us with the synergies or other benefits that were anticipated. These uncertainties may cause our actual results to be materially different than those expressedin any forward looking statements. We do not undertake to update any forward looking statements. Please see our Securities and Exchange Commission (“SEC”) filings for more information.
Non-GAAP Financial MeasuresIn addition to the results provided in accordance with U.S. Generally Accepted Accounting Principles (“GAAP”) above, this release includes certain financial measures computed using non-GAAP components as defined by the SEC. Specifically, net sales comparisons to the prior corresponding period, both worldwide and in relevant segments, are discussed in this releaseboth on a GAAP and non-GAAP basis. We believe that by providing non-GAAP organic growth, which adjusts for the impact of acquisitions (when applicable), foreign exchange fluctuations,copper prices and the number of billing days, both management and investors are provided with meaningful supplemental sales information to understand and analyze our underlying trendsand other aspects of our financial performance. We calculate the year-over-year organic sales growth and operating expenses impact relating to the Power Solutions acquisition by includingits 2015 comparable period results prior to the acquisition with our results (on a "pro forma" basis) as we believe this represents the most accurate representation of organic growth, consideringthe nature of the company we acquired and the synergistic revenues that have been or will be achieved. Historically and from time to time, we may also exclude other items from reportedfinancial results (e.g., impairment charges, inventory adjustments, restructuring charges, tax items, currency devaluations, pension settlements, etc.) in presenting adjusted operating expense,adjusted operating income, adjusted income taxes and adjusted net income so that both management and financial statement users can use these non-GAAP financial measures to betterunderstand and evaluate our performance period over period and to analyze the underlying trends of our business. As a result of the recent acquisitions we have also excluded amortizationof intangible assets associated with purchase accounting from acquisitions from the adjusted amounts for comparison of the non-GAAP financial measures period over period.
EBITDA is defined as net income from continuing operations before interest, income taxes, depreciation and amortization. Adjusted EBITDA is defined as EBITDA before foreign exchangeand other non-operating expense and non-cash stock-based compensation, excluding the other items from reported financial results, as defined above. We believe that adjusted operatingincome, EBITDA and Adjusted EBITDA provide relevant and useful information, which is widely used by analysts, investors and competitors in our industry as well as by our managementin assessing both consolidated and business segment performance. Adjusted operating income provides an understanding of the results from the primary operations of our business byexcluding the effects of certain items that do not reflect the ordinary earnings of our operations. We use adjusted operating income to evaluate our period-over-period operating performancebecause we believe this provides a more comparable measure of our continuing business excluding certain items that are not reflective of expected ongoing operations. This measure maybe useful to an investor in evaluating the underlying performance of our business. EBITDA provides us with an understanding of earnings before the impact of investing and financing chargesand income taxes. Adjusted EBITDA further excludes the effects of foreign exchange and other non-cash stock-based compensation, and certain items that do not reflect the ordinary earningsof our operations and that are also excluded for purposes of calculating adjusted net income, adjusted earnings per share and adjusted operating income. EBITDA and Adjusted EBITDAare used by our management for various purposes including as measures of performance of our operating entities and as a basis for strategic planning and forecasting. Adjusted EBITDAmay be useful to an investor because this measure is widely used to evaluate a company’s operating performance without regard to items excluded from the calculation of such measure,which can vary substantially from company to company depending on the accounting methods, book value of assets, capital structure and the method by which the assets were acquired,among other factors. They are not, however, intended as an alternative measure of operating results or cash flow from operations as determined in accordance with generally acceptedaccounting principles.
Non-GAAP financial measures provide insight into selected financial information and should be evaluated in the context in which they are presented. These non-GAAP financial measureshave limitations as analytical tools, and should not be considered in isolation from, or as a substitute for, financial information presented in compliance with GAAP, and non-GAAP financialmeasures as reported by us may not be comparable to similarly titled amounts reported by other companies. The non-GAAP financial measures should be considered in conjunction withthe Condensed Consolidated Financial Statements, including the related notes, and Management’s Discussion and Analysis of Financial Condition and Results of Operations included inthis release. Management does not use these non-GAAP financial measures for any purpose other than the reasons stated above.

4© 2017 Anixter Inc.
4Q16 GAAP Sales Up 3.2%
$M
illio
ns
4Q15 Currency Copper OrganicGrowth
4Q16
$1,836
$(20)
$6
$73 $1,895
• Record fourth quarter sales of $1.9B, with growth driven by NSS segment, reflecting strength in our NorthAmerica and Europe geographies and our security business
• Sequential sales performance was stronger than typical Q3 to Q4 progression, reflecting good execution andslowly improving industrial end markets
1. Sales Overview
4Q16 GAAP Sales Up 3.2%
Organic Sales up 4.0%Up 2.3% on a Per Day Basis
YO
YG
row
th
4Q15 1Q16 2Q16
(0.6)%
3Q16
(2.3)%
4Q16
4.0%
(0.5)%
0.0%
(2.2)%
(0.7)%
2.3%
YOY Growth
GAAP Organic Organic Growth per day
North America 4.5% 4.2% 2.5%EMEA (1.5)% 7.1% 5.4%
Emerging Markets (3.4)% (0.4)% (2.0)%Anixter International 3.2% 4.0% 2.3%
Reported organic sales:

5© 2017 Anixter Inc.
1. Sales Overview
Segment and Geographic Sales Mix
4Q16 Sales of $1.9 Billion
NSS - NA43%
NSS - EMEA5%
NSS - EM7%
EES - NA21%
EES - EMEA3%
EES - EM3%
UPS - NA18%
% of Sales Organic GrowthNA 83% 4.2%EMEA 8% 7.1%EM 9% (0.4)%
Total 100% 4.0%
6© 2017 Anixter Inc.
2. NSS Overview
Network & Security Solutions Sales Overview
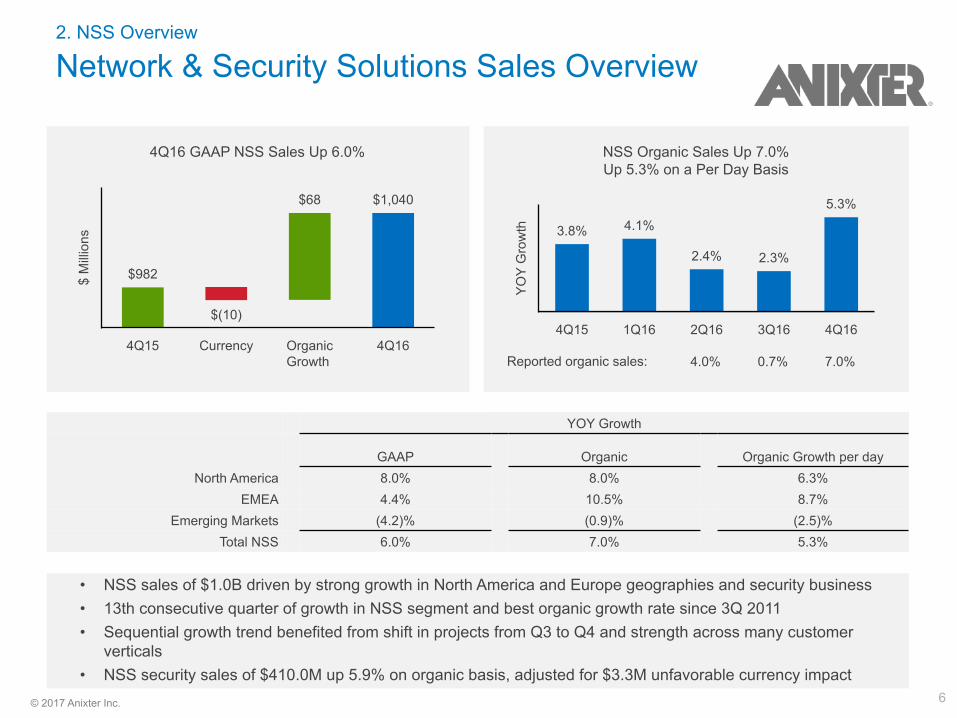
• NSS sales of $1.0B driven by strong growth in North America and Europe geographies and security business• 13th consecutive quarter of growth in NSS segment and best organic growth rate since 3Q 2011• Sequential growth trend benefited from shift in projects from Q3 to Q4 and strength across many customer
verticals• NSS security sales of $410.0M up 5.9% on organic basis, adjusted for $3.3M unfavorable currency impact
NSS Organic Sales Up 7.0%Up 5.3% on a Per Day Basis
YO
YG
row
th
4Q15 1Q16 2Q16
4.0%
3Q16
0.7%
4Q16
7.0%
3.8% 4.1%
2.4% 2.3%
5.3%
4Q16 GAAP NSS Sales Up 6.0%
$M
illio
ns
4Q15 Currency OrganicGrowth
4Q16
$982
$(10)
$68 $1,040
YOY Growth
GAAP Organic Organic Growth per dayNorth America 8.0% 8.0% 6.3%
EMEA 4.4% 10.5% 8.7%Emerging Markets (4.2)% (0.9)% (2.5)%
Total NSS 6.0% 7.0% 5.3%
Reported organic sales:

7© 2017 Anixter Inc.
2. NSS Overview
Operating Income and Adjusted EBITDA Trends
NSS Operating Income Trend (GAAP)
$M
illio
ns
Mar
gin
%
4Q15 1Q16 2Q16 3Q16 4Q16
$62 $59$65
$75 $77
6.3% 6.2% 6.2%7.1% 7.4%
• The improvement in NSS operating income and adjusted EBITDA YOY and sequentially was driven by strongsales performance combined with ongoing expense management
• NSS operating income increased 24.8% and adjusted EBITDA increased 8.3%, respectively, on 6.0% increase inGAAP sales, resulting in 1.4 times adjusted EBITDA leverage in the business
NSS Adjusted EBITDA Trend
$M
illio
ns
Mar
gin
%
4Q15 1Q16 2Q16 3Q16 4Q16
$76$64
$76 $79 $82
7.7%
6.7%7.2% 7.5%
7.9%

8© 2017 Anixter Inc.
3. EES Overview
Electrical & Electronic Solutions Sales Overview
EES Organic Sales Up 1.7%Flat on a Per Day Basis
YO
YG
row
th
4Q15 1Q16 2Q16
(1.9)%
3Q16
(3.1)%
4Q16
1.7%
(8.1)%(7.1)%
(3.4)%(1.6)%
0.0%
4Q16 GAAP EES Sales Up 0.9%
$M
illio
ns
4Q15 Currency Copper OrganicGrowth
4Q16
$503
$(10)
$6$8 $507
YOY Growth by Geography
GAAP Organic Growth Organic Growth per dayNorth America 2.8% 1.7% 0.0%
EMEA (10.2)% 2.1% 0.5%Emerging Markets (1.0)% 1.2% (0.5)%
Total EES segment 0.9% 1.7% 0.0%
• Fourth consecutive quarter of improving organic sales trend on a per day basis, as industrial end markets begin to recoverand the first quarter of YOY organic growth since 2Q15
• Sales performance reflects strength in OEM business and increasing sales from the low voltage product set from the PowerSolutions product portfolio, offset by challenging industrial markets
• Backlog is up versus year ago, supporting our view that ongoing improvement in EES sales trend will continue
Reported organic sales:
9© 2017 Anixter Inc.
3. EES Overview
Operating Income and Adjusted EBITDA Trends
EES Adjusted EBITDA Trend
$M
illio
ns
Mar
gin
%
4Q15 1Q16 2Q16 3Q16 4Q16
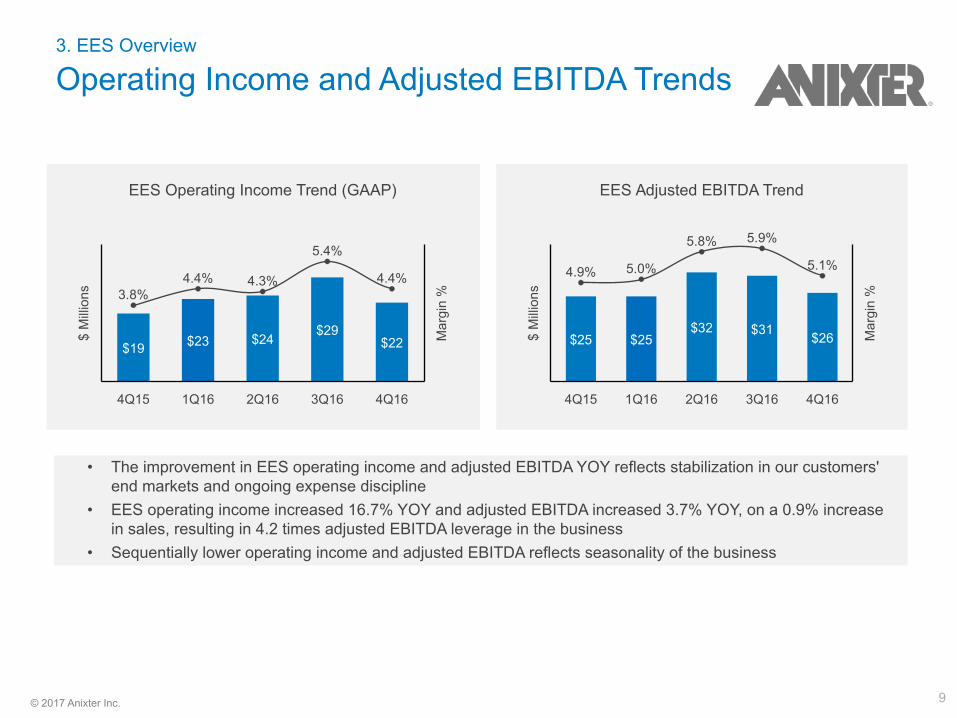
$25 $25$32 $31 $26
4.9% 5.0%
5.8% 5.9%
5.1%
• The improvement in EES operating income and adjusted EBITDA YOY reflects stabilization in our customers'end markets and ongoing expense discipline
• EES operating income increased 16.7% YOY and adjusted EBITDA increased 3.7% YOY, on a 0.9% increasein sales, resulting in 4.2 times adjusted EBITDA leverage in the business
• Sequentially lower operating income and adjusted EBITDA reflects seasonality of the business
EES Operating Income Trend (GAAP)
$M
illio
ns
Mar
gin
%
4Q15 1Q16 2Q16 3Q16 4Q16
$19 $23 $24$29
$22
3.8%4.4% 4.3%
5.4%
4.4%

10© 2017 Anixter Inc.
• Sales in UPS segment continue to be negatively impacted by weakness in oil and gas regions in Canada andthe timing of utility customers' major project spend
• Exited 2016 achieving run rate sales levels with 2 new customers that replaced sales from previously disclosedcustomer contract that was not renewed
• Sales related to the previously disclosed $750M, 5-year contract serving a large investor-owned electric utilitybegan in 4Q16 and are expected to reach annual run rate levels in mid-2Q17
4. UPS Overview
Utility Power Solutions Sales Overview
4Q16 GAAP UPS Sales (1.2)%
$M
illio
ns
4Q15 Currency Copper OrganicGrowth
4Q16
$352 $0 $0
$(5)
$347
UPS Organic Sales (1.2)%(2.8)% on a Per Day Basis*
YO
YG
row
th
4Q15 1Q16 2Q16
(10.7)%
3Q16
(8.8)%
4Q16
(1.2)%
0.9% 1.1%
(12.0)%
(7.3)%
(2.8)%
Reported organic sales:
*2Q16 and 3Q16 organic sales are pro forma for Power Solutions acquisition, previously disclosed and available on our Investor Relationswebsite

11© 2017 Anixter Inc.
• YOY decline in adjusted EBITDA caused by weakness in oil and gas regions in Canada and the timing of utilitycustomers' major project spend
• YOY decline in adjusted EBITDA margin caused by lower sales and customer mix• Continue to accelerate integration process through restructuring and change in leadership announced in 2Q16• On track with EBITDA synergy targets
4. UPS Overview
Operating Income and Adjusted EBITDA Trends
UPS Adjusted EBITDA Trend
$M
illio
ns
Mar
gin
%
4Q15 1Q16 2Q16 3Q16 4Q16
$21 $20 $19 $21 $19
5.9%5.6% 5.4%
5.7% 5.5%
UPS Operating Income Trend (GAAP)
$M
illio
ns
Mar
gin
%
4Q15 1Q16 2Q16 3Q16 4Q16
$15 $14 $12$16 $15
4.4%3.9%
3.4%
4.3% 4.2%

12© 2017 Anixter Inc.
5. Financial Performance Trends
Gross Margin Trend
• Gross profit dollar increase YOY driven by volume and year end rebates • The YOY and sequential increase in gross margin is driven by segment and product mix
Gross profit ($)
Gross margin (%)
Gross Margin Trend
$M
illio
ns
Mar
gin
%
4Q15 1Q16 2Q16 3Q16 4Q16
$371 $371$393 $397 $387
20.2%20.4%
20.1%20.3% 20.4%

13© 2017 Anixter Inc.
5. Financial Performance Trends
Operating Expense Trends
Adjusted Operating Expense Trend
$M
illio
ns
%of
Sal
es
4Q15 1Q16 2Q16 3Q16 4Q16
$280$299 $303 $300 $296
15.2%16.4%
15.5% 15.3% 15.6%
Operating Expense Trend (GAAP)
$M
illio
ns
%of
Sal
es
4Q15 1Q16 2Q16 3Q16 4Q16
$306 $311$337
$309 $306
16.6% 17.1% 17.2%15.8% 16.2%
• Operating expense ratio trend improved YOY reflecting ongoing expense management• The increase in adjusted operating expense and adjusted operating expense ratio was driven primarily by
segment mix combined with higher incentive compensation

14© 2017 Anixter Inc.
5. Financial Performance Trends
Adjusted EBITDA and Net Income Trends
• The 10 basis point decline in adjusted EBITDA margin YOY was caused by ongoing weakness in industrialmarkets
• The increase in YOY net margin was driven by sales growth and ongoing expense discipline combined with theimpact of $29.5 million of adjustments to 4Q15 operating expense
• Sequentially, the decrease in net income and adjusted EBITDA reflects typical seasonality of the business
Adjusted EBITDA Trend
$M
illio
ns
Mar
gin
%
4Q15 1Q16 2Q16 3Q16 4Q16
$102$83
$102 $108 $102
5.5%4.6%
5.2% 5.5% 5.4%
Net Income Trend (GAAP)
$M
illio
ns
Mar
gin
%
4Q15 1Q16 2Q16 3Q16 4Q16
$6
$23 $21
$40 $37
0.3%
1.3% 1.1%
2.1% 1.9%

15© 2017 Anixter Inc.
5. Financial Performance Trends
Working Capital Trends
Adjusted ROTC
Adj
RO
TC
4Q15 1Q16 2Q16 3Q16 4Q16
25.1%
19.8%
25.3%
27.9%26.4%
Working Capital as % of Sales
%of
Sal
es
4Q15 1Q16 2Q16 3Q16 4Q16
21.4%
21.0%
19.2%18.6% 18.8%
• Working capital ratio of 18.8% represents a 260 bps improvement from 2015, driven by improvements in workingcapital efficiency
• Adjusted ROTC of 26.4% improved 130 bps from 2015, driven by improvements in working capital efficiency
Note:Working Capital as a % of Sales: Defined as the net of current assets less current liabilities divided by annualized salesROTC and Adjusted ROTC: Return on tangible capital defined as operating profits, excluding intangible amortization and one-time itemsidentified in our earnings releases, divided by average tangible capital

16© 2017 Anixter Inc.
5. Financial Performance Trends
Counter-Cyclical Free Cash Flow ProvidesFinancial Flexibility
Free Cash Flow GAAP Sales Growth
$M
illio
ns
30%
15%
0%
-15%
-30%
YO
YS
ales
Gro
wth
2001 2002 2003 2004 2005 2006 2007 2008 2009 2010 2011 2012 2013 2014 2015 2016
$267
$149
$98
$43
-$15
-$65
$102 $93
$419
$176
$119 $109
$302
$64 $63
$246
23.1%
Generate Strong Free Cash Flow Throughout the Economic Cycle
Note: Free cash flow is not restated for acquisitions and divestitures
17© 2017 Anixter Inc.
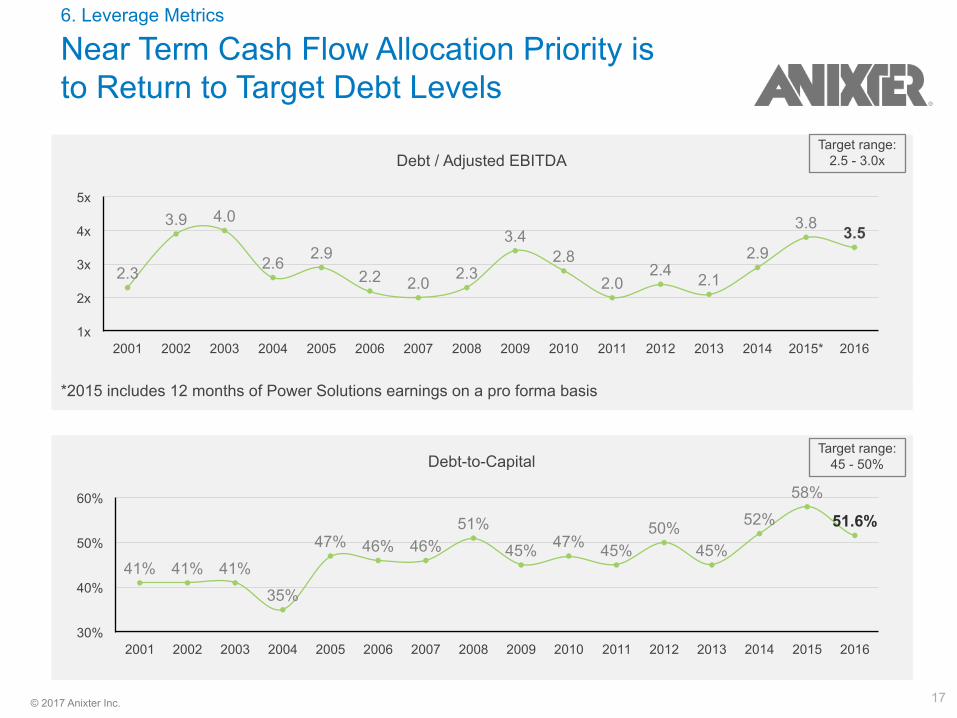
Debt / Adjusted EBITDA
5x
4x
3x
2x
1x2001 2002 2003 2004 2005 2006 2007 2008 2009 2010 2011 2012 2013 2014 2015* 2016
2.3
3.9 4.0
2.6 2.92.2 2.0 2.3
3.42.8
2.02.4 2.1
2.9
3.8 3.5
6. Leverage Metrics
Near Term Cash Flow Allocation Priority isto Return to Target Debt Levels
Debt-to-Capital
60%
50%
40%
30%2001 2002 2003 2004 2005 2006 2007 2008 2009 2010 2011 2012 2013 2014 2015 2016
41% 41% 41%
35%
47% 46% 46%51%
45% 47% 45%50%
45%
52%
58%
51.6%
*2015 includes 12 months of Power Solutions earnings on a pro forma basis
Target range:2.5 - 3.0x
Target range:45 - 50%
18© 2017 Anixter Inc.
7. Financial Details
Diluted EPS Bridge
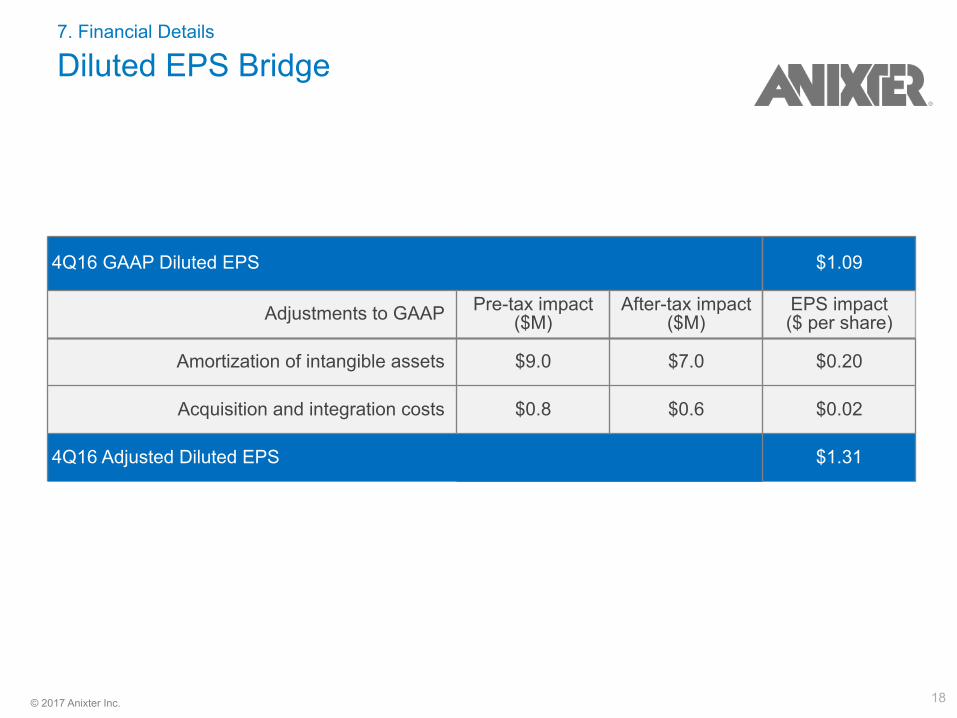
4Q16 GAAP Diluted EPS $1.09
Adjustments to GAAP Pre-tax impact($M)
After-tax impact($M)
EPS impact($ per share)
Amortization of intangible assets $9.0 $7.0 $0.20
Acquisition and integration costs $0.8 $0.6 $0.02
4Q16 Adjusted Diluted EPS $1.31

19© 2017 Anixter Inc.
7. Financial Details
Impact of Currency, Copper and M&A on 4Q16 Sales
$ millions 4Q16
Prior Outlook Actual Per day basis
Organic sales growth Flat - 1.5% 4.0% 2.3%
Currency* $(11 - 14) $(20.3)
Copper** $(2 - 4) $6.1
Combined Currency and Copper $(13 - 15) $(14.2)
*4Q16 currency outlook based on rates as of October 24, 2016**4Q16 prior outlook based on average copper price of approximately $2.13 and actual based on 4Q16 average copperprice of $2.39

20© 2017 Anixter Inc.
8. Outlook
Sales Trends by Business and Geography
North America EMEA Emerging Markets
NSS é è è
EES é è è
UPS é
Business Trend 1Q17 versus 4Q16
é Trend is likely to improve
è Trend is stable
ê Trend is likely to decline
EMEA outlook excludes theunknown impact of Brexit
21© 2017 Anixter Inc.
8. Outlook
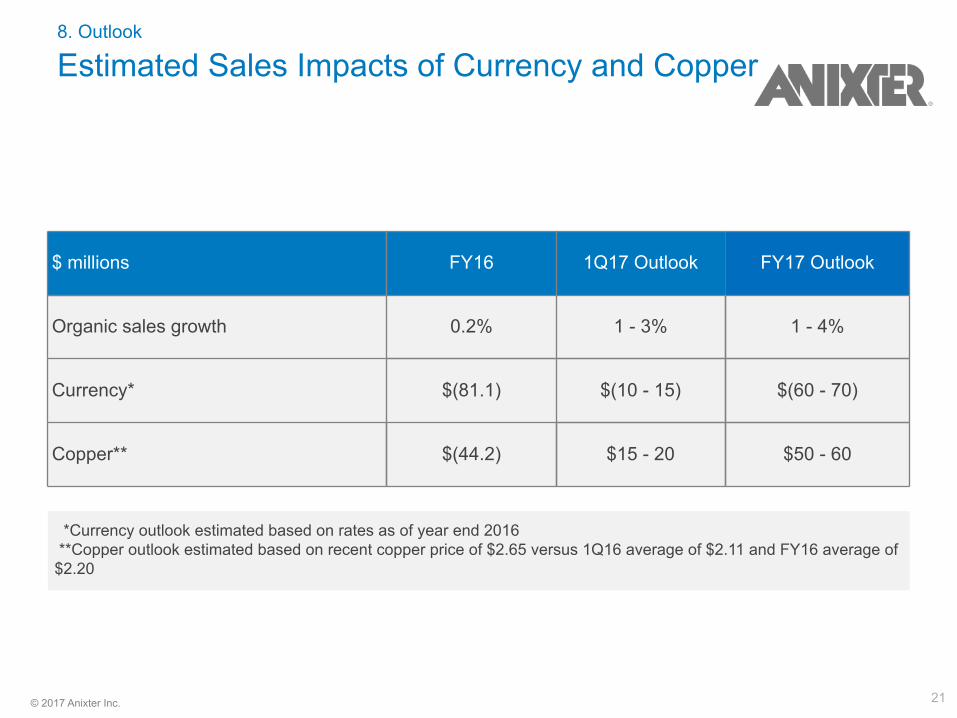
Estimated Sales Impacts of Currency and Copper
*Currency outlook estimated based on rates as of year end 2016 **Copper outlook estimated based on recent copper price of $2.65 versus 1Q16 average of $2.11 and FY16 average of$2.20
$ millions FY16 1Q17 Outlook FY17 Outlook
Organic sales growth 0.2% 1 - 3% 1 - 4%
Currency* $(81.1) $(10 - 15) $(60 - 70)
Copper** $(44.2) $15 - 20 $50 - 60

22© 2017 Anixter Inc.
Appendix

23© 2017 Anixter Inc.
Glossary
1H first half of fiscal year 2H second half of fiscal yearB billionsM millionsFx foreign exchangeBps basis pointsGAAP U.S. GAAPNSS Network & Security SolutionsEES Electrical & Electronic SolutionsUPS Utility Power SolutionsETR effective tax rateOpex total operating expenseEMEA Europe, middle east and AfricaCALA Central and Latin AmericaAPAC Asia Pacific, Australia and ChinaOEM original equipment manufacturerIOU investor owned utilityMRO maintenance, repair and operationsYOY year-over-yearNA North AmericaEM emerging marketsUSD US dollarWC working capitalROTC return on tangible capital
24© 2017 Anixter Inc.
Anixter International Inc
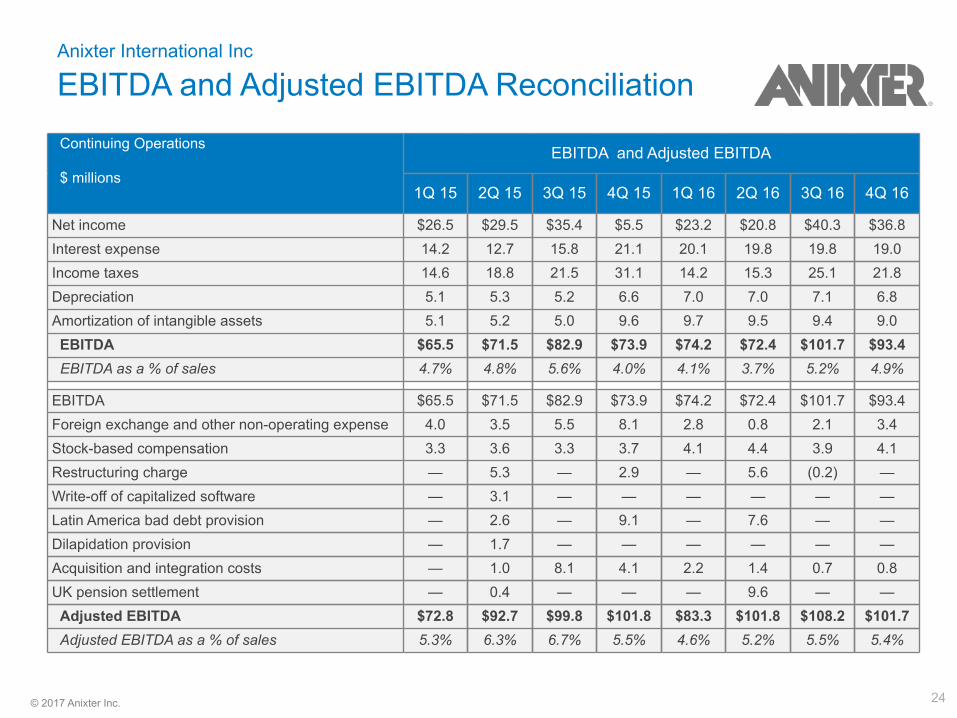
EBITDA and Adjusted EBITDA ReconciliationContinuing Operations
$ millionsEBITDA and Adjusted EBITDA
1Q 15 2Q 15 3Q 15 4Q 15 1Q 16 2Q 16 3Q 16 4Q 16
Net income $26.5 $29.5 $35.4 $5.5 $23.2 $20.8 $40.3 $36.8Interest expense 14.2 12.7 15.8 21.1 20.1 19.8 19.8 19.0Income taxes 14.6 18.8 21.5 31.1 14.2 15.3 25.1 21.8Depreciation 5.1 5.3 5.2 6.6 7.0 7.0 7.1 6.8Amortization of intangible assets 5.1 5.2 5.0 9.6 9.7 9.5 9.4 9.0EBITDA $65.5 $71.5 $82.9 $73.9 $74.2 $72.4 $101.7 $93.4
EBITDA as a % of sales 4.7% 4.8% 5.6% 4.0% 4.1% 3.7% 5.2% 4.9%
EBITDA $65.5 $71.5 $82.9 $73.9 $74.2 $72.4 $101.7 $93.4Foreign exchange and other non-operating expense 4.0 3.5 5.5 8.1 2.8 0.8 2.1 3.4Stock-based compensation 3.3 3.6 3.3 3.7 4.1 4.4 3.9 4.1Restructuring charge — 5.3 — 2.9 — 5.6 (0.2) —Write-off of capitalized software — 3.1 — — — — — —Latin America bad debt provision — 2.6 — 9.1 — 7.6 — —Dilapidation provision — 1.7 — — — — — —Acquisition and integration costs — 1.0 8.1 4.1 2.2 1.4 0.7 0.8UK pension settlement — 0.4 — — — 9.6 — —Adjusted EBITDA $72.8 $92.7 $99.8 $101.8 $83.3 $101.8 $108.2 $101.7Adjusted EBITDA as a % of sales 5.3% 6.3% 6.7% 5.5% 4.6% 5.2% 5.5% 5.4%

25© 2017 Anixter Inc.
Network & Security Solutions
EBITDA and Adjusted EBITDA Reconciliation
Continuing Operations
$ millions
EBITDA and Adjusted EBITDA
1Q 15 2Q 15 3Q 15 4Q 15 1Q 16 2Q 16 3Q 16 4Q 16
Net income $55.7 $66.6 $74.1 $61.8 $58.8 $64.9 $74.9 $77.2Interest expense — — — — — — — —Income taxes — — — — — — — —Depreciation 0.9 0.9 0.9 0.9 0.9 0.8 0.8 0.7Amortization of intangible assets 3.7 3.7 3.7 3.6 3.6 3.6 3.3 3.6EBITDA $60.3 $71.2 $78.7 $66.3 $63.3 $69.3 $79.0 $81.5
EBITDA as a % of sales 6.5% 7.0% 7.5% 6.8% 6.7% 6.6% 7.5% 7.8%
EBITDA $60.3 $71.2 $78.7 $66.3 $63.3 $69.3 $79.0 $81.5Stock-based compensation 0.4 0.6 0.4 0.5 0.5 0.6 0.2 0.5Restructuring charge — 1.8 — 0.6 — 1.9 (0.1) (0.1)Latin America bad debt provision — 2.6 — 8.1 — 3.9 — —Adjusted EBITDA $60.7 $76.2 $79.1 $75.5 $63.8 $75.7 $79.1 $81.9Adjusted EBITDA as a % of sales 6.5% 7.5% 7.6% 7.7% 6.7% 7.2% 7.5% 7.9%

26© 2017 Anixter Inc.
Electronic and Electrical Solutions
EBITDA and Adjusted EBITDA Reconciliation
Continuing Operations
$ millions
EBITDA and Adjusted EBITDA
1Q 15 2Q 15 3Q 15 4Q 15 1Q 16 2Q 16 3Q 16 4Q 16
Net income $35.8 $33.6 $32.5 $19.2 $22.5 $23.9 $28.7 $22.4Interest expense — — — — — — — —Income taxes — — — — — — — —Depreciation 0.2 0.3 0.2 0.7 0.5 1.0 0.5 0.7Amortization of intangible assets 1.4 1.5 1.3 2.1 2.2 2.0 2.1 2.2EBITDA $37.4 $35.4 $34.0 $22.0 $25.2 $26.9 $31.3 $25.3
EBITDA as a % of sales 8.5% 7.9% 8.0% 4.4% 5.0% 4.8% 5.8% 5.0%
EBITDA $37.4 $35.4 $34.0 $22.0 $25.2 $26.9 $31.3 $25.3Stock-based compensation 0.3 0.4 0.3 0.3 0.2 0.3 0.2 0.3Restructuring charge — 1.8 — 1.4 — 1.4 (0.1) —Latin America bad debt provision — — — 1.0 — 3.7 — —Adjusted EBITDA $37.7 $37.6 $34.3 $24.7 $25.4 $32.3 $31.4 $25.6Adjusted EBITDA as a % of sales 8.6% 8.3% 8.1% 4.9% 5.0% 5.8% 5.9% 5.1%

27© 2017 Anixter Inc.
Utility Power Solutions
EBITDA and Adjusted EBITDA Reconciliation
Continuing Operations
$ millions
EBITDA and Adjusted EBITDA
1Q 15 2Q 15 3Q 15 4Q 15 1Q 16 2Q 16 3Q 16 4Q 16
Net income $2.0 $2.4 $2.7 $15.3 $14.3 $12.0 $15.8 $14.6Interest expense — — — — — — — —Income taxes — — — — — — — —Depreciation — — — 1.2 1.4 0.7 1.0 1.1Amortization of intangible assets — — — 3.9 3.9 3.9 4.0 3.2EBITDA $2.0 $2.4 $2.7 $20.4 $19.6 $16.6 $20.8 $18.9
EBITDA as a % of sales 12.1% 12.8% 14.5% 5.8% 5.4% 4.7% 5.6% 5.5%
EBITDA $2.0 $2.4 $2.7 $20.4 $19.6 $16.6 $20.8 $18.9Stock-based compensation — — — 0.1 0.2 0.5 0.3 0.4Restructuring charge — — — 0.1 — 2.2 — (0.1)Acquisition and integration costs — — — 0.2 0.3 — — —Adjusted EBITDA $2.0 $2.4 $2.7 $20.8 $20.1 $19.3 $21.1 $19.2Adjusted EBITDA as a % of sales 12.1% 12.8% 14.5% 5.9% 5.6% 5.4% 5.7% 5.5%

28© 2017 Anixter Inc.
Positive (Negative) ImpactThree Months Ended Twelve Months Ended
December 30,2016
January 1, 2016
December 30,2016
January 1, 2016
Continuing operations (As revised*) (As revised*)Items impacting comparability of results:Items impacting operating expense and operating income:Amortization of intangible assets $ (9.0) $ (9.6) $ (37.6) $ (24.9)UK pension settlement — — (9.6) (0.4)Restructuring charge — (2.9) (5.4) (8.2)Acquisition and integration costs (0.8) (4.1) (5.1) (13.2)Write-off of capitalized software — — — (3.1)Latin America bad debt provision — (9.1) (7.6) (11.7)Dilapidation provision — — — (1.7)Total of items impacting operating expense and operating income $ (9.8) $ (25.7) $ (65.3) $ (63.2)Items impacting interest expense:Write-off of deferrred financing costs $ — $ (0.3) $ — $ (0.3)Total of items impacting interest expense $ — $ (0.3) $ — $ (0.3)Items impacting other expenses:Foreign exchange loss from the devaluation of foreign currencies $ — $ (2.9) $ — $ (3.6)Extinguishment of debt — (0.9) — (0.9)Total of items impacting other expenses $ — $ (3.8) $ — $ (4.5)Total of items impacting pre-tax income $ (9.8) $ (29.8) $ (65.3) $ (68.0)Items impacting income taxes:Tax impact of items impacting pre-tax income above $ 2.2 $ 12.1 $ 18.8 $ 27.4Establishment of deferred income tax valuation allowances — (11.3) (1.1) (11.3)Tax benefits related to prior year tax positions — — 3.2 —Other tax items — (0.5) — (0.5)Total of items impacting income taxes $ 2.2 $ 0.3 $ 20.9 $ 15.6Net income impact of these items $ (7.6) $ (29.5) $ (44.4) $ (52.4)Diluted EPS impact of these items $ (0.22) $ (0.88) $ (1.32) $ (1.56)
Anixter International IncItems Impacting Comparability

29© 2017 Anixter Inc.
Positive (Negative) ImpactThree Months Ended Twelve Months Ended
December 30,2016
January 1, 2016
December 30,2016
January 1, 2016
Continuing operations (As revised*) (As revised*)
GAAP to Non-GAAP Net Income and EPS Reconciliation for continuing operations:Net income from continuing operations – GAAP $ 36.8 $ 5.5 $ 121.1 $ 96.9Items impacting net income from continuing operations 7.6 29.5 44.4 52.4Net income from continuing operations – Non-GAAP $ 44.4 $ 35.0 $ 165.5 $ 149.3
Diluted EPS – GAAP $ 1.09 $ 0.17 $ 3.61 $ 2.90Diluted EPS impact of these items 0.22 0.88 1.32 1.56Diluted EPS – Non-GAAP $ 1.31 $ 1.05 $ 4.93 $ 4.46
* Revised due to change in composition of items impacting comparability of results to include amortization of intangibleassets.
Anixter International IncItems Impacting Comparability

30© 2017 Anixter Inc.
Anixter International Inc
Adjusted Operating Expense Reconciliation
$ millionsAdjusted Operating Expense Margin
1Q 15 2Q 15 3Q 15 4Q 15 1Q 16 2Q 16 3Q 16 4Q 16
Operating expense (as reported) $250.0 $264.4 $252.7 $305.6 $310.5 $336.7 $309.4 $306.1
Items impacting comparability (5.1) (19.3) (13.1) (25.7) (11.9) (33.7) (9.9) (9.8)
Adjusted operating expense $244.9 $245.1 $239.6 $279.9 $298.6 $303.0 $299.5 $296.3
Adjusted operating expense as a % of sales 17.7% 16.6% 16.1% 15.2% 16.4% 15.5% 15.3% 15.6%
Power Solutions $60.6 $61.4 $68.5 $— $— $— $— $—
Power Solutions items impacting comparability(amortization of intangible assets and acquisition andintegration costs)
(4.4) (4.4) (10.4) — — — — —
Pro forma adjusted operating expense $301.1 $302.1 $297.7 $279.9 $298.6 $303.0 $299.5 $296.3
Pro forma adjusted operating expense as a % of sales 16.1% 15.1% 14.7% 15.2% 16.4% 15.5% 15.3% 15.6%
31© 2017 Anixter Inc.
Supplemental Information
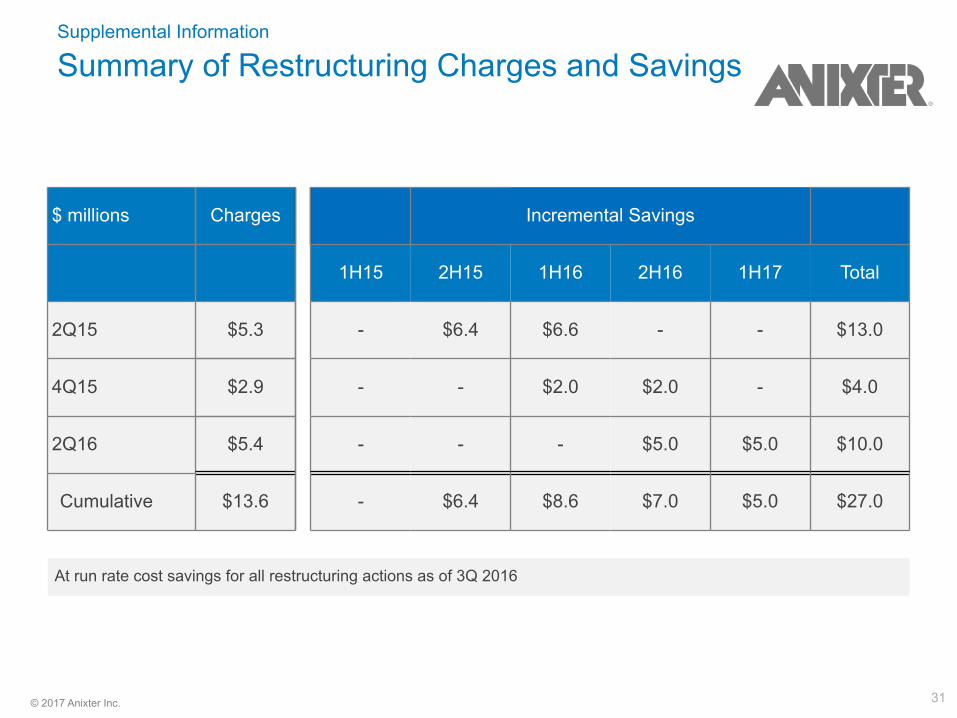
Summary of Restructuring Charges and Savings
$ millions Charges Incremental Savings
1H15 2H15 1H16 2H16 1H17 Total
2Q15 $5.3 - $6.4 $6.6 - - $13.0
4Q15 $2.9 - - $2.0 $2.0 - $4.0
2Q16 $5.4 - - - $5.0 $5.0 $10.0
Cumulative $13.6 - $6.4 $8.6 $7.0 $5.0 $27.0
At run rate cost savings for all restructuring actions as of 3Q 2016

32© 2017 Anixter Inc.
Supplemental Information
Billing Days and Average Copper Prices
Billing Days
Q1 Q2 Q3 Q4 FY
2015 65 63 64 61 253
2016 65 64 63 62 254
2017 64 64 63 62 253
Average Copper Prices
Q1 Q2 Q3 Q4 FY
2015 $2.67 $2.77 $2.39 $2.20 $2.50
2016 $2.11 $2.13 $2.16 $2.39 $2.20
Increase (Decrease) $(0.56) $(0.64) $(0.23) 0.19 (0.30)
% Increase (Decrease) (21.0)% (23.0)% (9.6)% 8.6% (12.0)%