animal biology and pathology / biologie et pathologie
TRANSCRIPT
Animal biology and pathology / Biologie et pathologie animales
Periosteal bone growth rates in extant ratites(ostriche and emu). Implications for assessinggrowth in dinosaurs
Jacques Castaneta*, Kristina Curry Rogersb, Jorge Cuboa, Jean-Jacques Boisardc
a ER Formations squelettiques, université Paris-VI-VII et CNRS UMR 85 70, 2, place Jussieu, case 7077,75251 Paris cedex 05, Franceb Paleontology Department, Science Museum of Minnesota, 120 W. Kellogg Blvd., St. Paul, MN 55102, USAc Réserve africaine de Sigean, 11130 Sigean, FranceReceived 27 March 2000; accepted 2 May 2000
Communicated by Yvon Le Maho
Abstract – The first quantitative experimental data on growth dynamics of the primarycortical bone of young ratites demonstrate the following. 1) From hatching to 2 monthsof age, cortical thickness remains constant, thereby expressing equilibrium betweenperiosteal bone deposition and an endosteal bone resorption. 2) Radial growth rates ofthe diaphyseal bone cortex are high (10–40 µm·day–1 on average – maximum80 µm·day–1) in the hindlimb (femur, tibiotarsus and tarsometatarsus). Wing bones aresmaller and later developed. They have lower rates of radial osteogenesis(2–14 µm·day–1). 3) High growth rates are linked to densely vascularized primary bonebelonging to the reticular or laminar tissue types. Growth rates fall when bone vasculardensity decreases. These results emphasize the importance of examining a large numberof skeletal elements in order to build a precise knowledge of the general relationshipbetween bone growth rate and bone tissue type. They also stress the potential of bonegrowth rate quantification among extinct tetrapods, including non-avian dinosaurs.© 2000 Académie des sciences/Éditions scientifiques et médicales Elsevier SAS
histology and bone growth dynamics / birds / dinosaurs
Résumé – Croissance de l’os périostique chez les ratites (autruche et émeu).Implications pour l’évaluation de la croissance des dinosaures. De premièresdonnées quantitatives obtenues expérimentalement sur la dynamique de croissance descorticales diaphysaires primaires des os longs de jeunes ratites (autruches et emeus),montrent que 1o, pendant la période étudiée (de l’éclosion à 2 mois), l’épaisseur de cescorticales reste constante, ce qui témoigne d’un équilibre entre apposition osseusesous-périostique et résorption endostéale ; 2o les vitesses de croissance radiaire de cescorticales diaphysaires sont très élevées (10 à 40 µm·j–1 en moyenne ; maximum à80 µm·j–1) pour les principaux os (fémur, tibiotarse et tarsométatarse) de la patte. Les osdes ailes, nettement plus petits et à développement plus tardif, ont des vitessesd’ostéogenèse beaucoup plus faibles (2 à 14 µm·j–1) ; 3o les vitesses d’ostéogenèseélevées sont associées à de l’os primaire très vascularisé de type réticulaire ou laminaire.Ces vitesses chutent lorsque la densité vasculaire diminue. Ces résultats montrent lanécessité d’examiner différents os avant d’avoir une idée précise des vitesses decroissance et des typologies osseuses qui leur sont associées. Ils soulignent égalementles potentialités des types tissulaires osseux pour calculer les vitesses de croissance chez
* Correspondence and reprints: [email protected]
543
C.R. Acad. Sci. Paris, Sciences de la vie / Life Sciences 323 (2000) 543–550© 2000 Académie des sciences/Éditions scientifiques et médicales Elsevier SAS. Tous droits réservésS0764446900001815/FLA
les formes fossiles, en particulier celles des dinosaures non aviens. © 2000 Académiedes sciences/Éditions scientifiques et médicales Elsevier SAS
histologie et dynamique de croissance osseuse / oiseaux / dinosaures
Version abrégée
Depuis le travail d’Amprino présentant les micros-tructures osseuses comme une expression de leurvitesse d’accroissement, il est globalement confirméque l’organisation des os à l’échelle histologique estdavantage le résultat de contraintes ontogénétiques,fonctionnelles (physiologiques, biomécaniques) ouenvironnementales, que d’une origine phylogénétiqueou d’un niveau taxinomique donné. Une telle relationcausale offre en principe la possibilité d’inférer lesvitesses de croissance à partir de la structure histologi-que, d’où un intérêt évident en paléontologie parexemple. Chez les fossiles, en effet, la structure destissus osseux, souvent parfaitement conservée, consti-tue un outil unique pour tenter de restituer certainstraits de leur histoire de vie (stratégie de croissance,place de la maturité sexuelle, longévité). Cependant lestravaux dans ce domaine sont encore rares. L’une desraisons est que peu de données comparatives et surtoutquantitatives sont disponibles chez les vertébrés actuelspour permettre d’évaluer la précision et la valeuropérationnelle de la « règle d’Amprino ». Chez lesoiseaux par exemple, seule une étude préliminaireréalisée sur le canard a permis de calculer les vitessesde croissance associées aux différents types de micros-tructures osseuses. Nous apportons ici les premièresdonnées quantitatives obtenues sur les vitesses d’appo-sition et la dynamique de croissance des corticalespériostiques primaires des os longs de jeunes ratites,autruches et émeus, représentants actuels des plusgrandes formes aviennes.
Six autruches et sept émeus en début de croissance(entre 7 et 68 j après éclosion) et élevés en semi-captivité ont reçu des injections de fluoromarqueurspermettant de calculer avec précision les vitesses decroissance radiaires des corticales diaphysaires. Unsuivi simultané de la variation d’épaisseur de cescorticales a été réalisé par mesure de l’indice cortico-diaphysaire (ICD).
Pour les deux espèces, aux stades de croissanceconsidérés, les corticales diaphysaires des os longs desmembres sont principalement formées d’os primairevascularisé, organisé en complexe « fibro-lamellaire ».La structure de type « os réticulaire » prédomine dansl’humérus, le radius, l’ulna et le tarsométatarse, tandisque le type « laminaire» est plus fréquent dans le fémuret le tibiotarse. Dans les phalanges proximales desdoigts de la patte, les canaux vasculaires sont majori-tairement longitudinaux et peu anastomosés. Danstous les cas, l’os récemment déposé est très lacunaire.
Il devient plus compact en vieillissant par suite ducomblement des canaux vasculaires primaires. Auxstades étudiés, le remaniement secondaire est encorerare. Seuls quelques ostéones secondaires sont obser-vés dans les parties profondes des corticales, principa-lement celles des phalanges. Pendant la période decroissance considérée, l’épaisseur des corticales osseu-ses ne varie pratiquement pas alors que le diamètrediaphysaire augmente : la quantité d’os périostiquedéposé équilibre celle détruite en bordure de la cavitémédullaire (résorption endostéale). Les vitesses d’ostéo-genèse mesurées sont élevées et toujours beaucoupplus fortes dans les os de la patte que dans ceux del’aile. Des valeurs atteignant près de 90 µm·j–1 ont étémesurées pour de l’os réticulaire dans le fémur d’unémeu entre 7 et 14 j post-éclosion (moyenne de36,3 µm·j–1 pour les sept émeus). Un maximum de65 µm·j–1 est atteint dans le tibiotarse d’une autrucheentre 23 et 39 j post-éclosion. Les plus faibles vitessessont rencontrées dans le radius des émeus (2,9 µm·j–1)et la phalange des autruches (4 µm·j–1). Selon les os etles régions osseuses étudiées, l’os laminaire et l’osréticulaire se forment à partir de vitesses de croissanceégales à 10 µm·j–1 en moyenne et jusqu’aux valeurs lesplus élevées. En dessous de 10 µm·j–1 ces types histo-logiques sont remplacés par de l’os nettement moinsvascularisé. Les canaux vasculaires deviennent longitu-dinaux et leurs anastomoses se raréfient. L’aspect enréseau s’estompe. Ces aspects sont rencontrés chez lesplus vieux émeus de l’échantillon étudié. Ils n’appa-raissent pas encore chez les autruches qui, aux mêmesâges, sont encore loin d’avoir atteint leur taille maxi-male.
Les présents résultats sont congruents avec ceux déjàobtenus chez le canard et quelques autres tétrapodes.L’os réticulaire et l’os laminaire sont effectivementassociés aux fortes vitesses d’ostéogenèse périostique.Il reste cependant difficile de savoir lequel de ces deuxtypes histologiques correspond aux vitesses de crois-sance les plus élevées, dans la mesure ou leurs valeursse superposent largement. Une diminution de la den-sité vasculaire est toujours associée à un net ralentisse-ment de la vitesse d’apposition.
À partir de ces données comparatives et quantitati-ves, si l’on admet que la relation causale entre vitessesde croissance et microstructures osseuses des formesactuelles était la même chez les formes fossiles (prin-cipe d’uniformisation), une quantification précise de lacroissance et des traits d’histoire de vie qui en décou-lent, devient possible chez ces dernières. Cette étudemontre aussi que chaque type histologique correspond
544
J. Castanet et al. / C.R. Acad. Sci. Paris, Sciences de la vie / Life Sciences 323 (2000) 543–550
à une gamme étendue de vitesses de croissance, varia-ble d’un os à l’autre et entre différentes régions d’unmême os. Dans ces conditions, pour être crédibles, lesanalyses réalisées chez les fossiles devront utiliser le
maximum d’éléments squelettiques disponibles, et com-parer des niveaux anatomiques homologues. De plusles résultats seront présentés comme une estimationmoyenne entre des valeurs minimales et maximales.
1. Introduction
Although bone histological structures have long beenutilized by both neontologists and paleontologists for inter-preting growth strategies, physiology and even phylogenyin extinct and extant tetrapods [1–11], few works haveexplicitly addressed the relationships between bone tissuetypologies, osteogenic rates and overall body growth rates.Bone structures are largely the result of ontogenetic, func-tional and environmental constraints [9, 12–15]. As such,histological data have a high heuristical value for clarify-ing many biological attributes in extant and extinct taxa,including post-hatching development, life history strate-gies, physiology and even environmental conditions.
Amprino [16] was the first to recognize the functionalrelationship between primary (appositional) bone micro-structural organization and the speed of its deposition.With the advent of the notion that primary bone histologyreflects the rate of bone growth, Amprino set the stage forthe comparative analysis of bone tissue from a functionalperspective. Although this relationship was supported bycomparative and qualitative evidence [1–3, 17, 18],Amprino’s Rule has only been rigorously quantified in afew taxa [13, 19–23]. Intra-specific and intra-individualevaluations are almost completely lacking. In fact, onlyone preliminary study of mallard has provided quantifica-tion of osteogenic growth rates and their relationship tothe primary bone tissue organization of different bones atvariable ontogenetic stages [13]. To supplement this earlydata base, we present here the initial results of an experi-mental analysis of bone growth dynamics in young emus(Dromaius novaehollandiae) and ostriches (Struthio cam-elus).
Because bone microstructure is commonly preserved,even in fossils, the experiments and quantificationsdescribed herein shed new light on the importance ofbone histology for determining growth rates in extincttaxa. This first look at bone growth in living ratites therebyopens the door to better comprehension of growth dynam-ics in both extant birds and extinct tetrapods.
2. Materials and methods
Experiments were conducted in the Sigean AfricanReserve, near Narbonne, in the south of France. Adultbirds reproduce in semi-natural conditions. After hatchingjuveniles are kept in internal and external enclosures andallowed to roam freely. Chicks were intra-abdominallyinjected with fluoromarkers four times at various ages(eclosion + 7 d to eclosion + 68 d). Labels were injected
weekly in the following sequence and dosage: fluoresce-ine (DCAF) at 30 mg·kg–1, alizarine at 80 mg·kg–1, tetra-cycline at 60 mg·kg–1, and xylenol orange at 80 mg·kg–1.The seven ostriches and six emus included in this studydied due to natural causes. Thus, the time between the lastinjection and death are variable. In addition, some birdsdid not receive all of the four fluoromarkers (i.e. they diedprior to the injection schedule). According to comparisonswith growth curves of surviving birds, we have no reasonsto believe that the individuals in this study display abnor-mal bone growth patterns.
The humerus, radius, ulna, femur, tibiotarsus, tarsometa-tarsus, proximal phalanx from digits II and III of the hind-limb, and several coracoids were studied. After inclusionin polyester resin, cross sections of 40–80 µm thick weremade at standardized locations in the diaphysis of eachelement. Microscopic observations were made under ordi-nary, polarized and fluorescent light. Thicknesses betweenconsecutive fluorescent labels and between the last oneand the bone periphery were measured at several points(at least four) with a micrometric ocular. Growth rateswere calculated by dividing the bone thickness by thenumber of days between the labels. The Cortico diaphy-seal index (CDI) was calculated for each bone as a body-size-independent measure of cortical thickness.CDI = external diameter – internal diameter/external diam-eter. Bone tissue typology and bone depositional rateswere defined for each element by authors K. Curry Rogersand J. Castanet. The small sample size permitted onlysimple descriptive statistics (Statview IV package forMacintosh).
3. Results
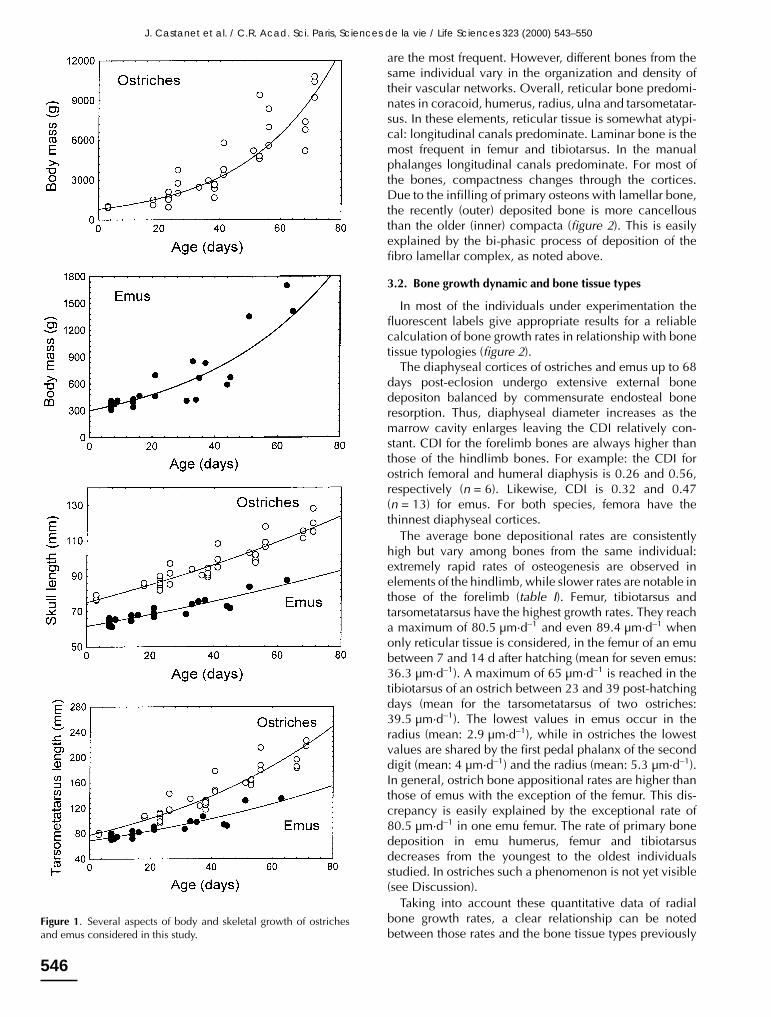
Emus and ostriches grew rapidly for the growth stagesunder consideration (eclosion up to 2 months). On aver-age, their body mass increases by at least 50 % per month(figure 1).
3.1. General bone organization
The ostrich and emu diaphyseal cortices are depositedas primary periosteal bone, although slight endosteal depo-sition of secondary structures also locally occur, adjacentto the medullary cavity in the oldest individuals. Corticalbone tissue belongs to the fibrolamellar complex [18].Cortices consist of a woven fibered matrix, containinglongitudinal, circular, radial and oblique vascular chan-nels which are partially filled up later by primary osteons.Spatial organization of blood vessels in these juvenileratites is quite similar overall: laminar and reticular types
545
J. Castanet et al. / C.R. Acad. Sci. Paris, Sciences de la vie / Life Sciences 323 (2000) 543–550
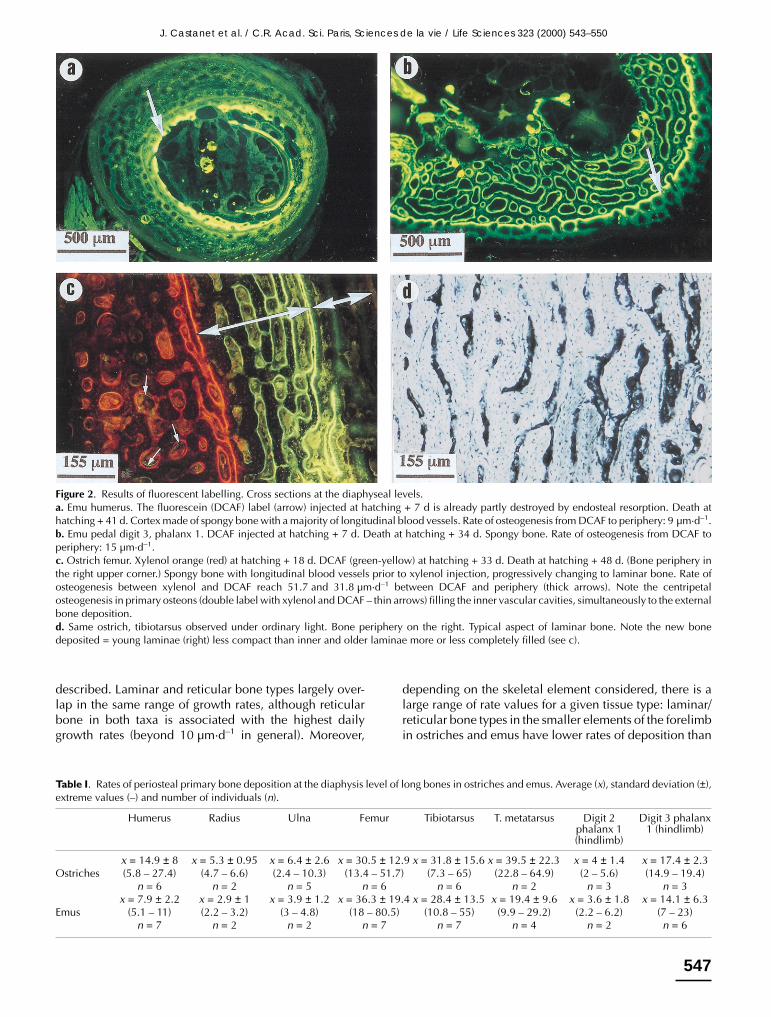
are the most frequent. However, different bones from thesame individual vary in the organization and density oftheir vascular networks. Overall, reticular bone predomi-nates in coracoid, humerus, radius, ulna and tarsometatar-sus. In these elements, reticular tissue is somewhat atypi-cal: longitudinal canals predominate. Laminar bone is themost frequent in femur and tibiotarsus. In the manualphalanges longitudinal canals predominate. For most ofthe bones, compactness changes through the cortices.Due to the infilling of primary osteons with lamellar bone,the recently (outer) deposited bone is more cancellousthan the older (inner) compacta (figure 2). This is easilyexplained by the bi-phasic process of deposition of thefibro lamellar complex, as noted above.
3.2. Bone growth dynamic and bone tissue types
In most of the individuals under experimentation thefluorescent labels give appropriate results for a reliablecalculation of bone growth rates in relationship with bonetissue typologies (figure 2).
The diaphyseal cortices of ostriches and emus up to 68days post-eclosion undergo extensive external bonedepositon balanced by commensurate endosteal boneresorption. Thus, diaphyseal diameter increases as themarrow cavity enlarges leaving the CDI relatively con-stant. CDI for the forelimb bones are always higher thanthose of the hindlimb bones. For example: the CDI forostrich femoral and humeral diaphysis is 0.26 and 0.56,respectively (n = 6). Likewise, CDI is 0.32 and 0.47(n = 13) for emus. For both species, femora have thethinnest diaphyseal cortices.
The average bone depositional rates are consistentlyhigh but vary among bones from the same individual:extremely rapid rates of osteogenesis are observed inelements of the hindlimb, while slower rates are notable inthose of the forelimb (table I). Femur, tibiotarsus andtarsometatarsus have the highest growth rates. They reacha maximum of 80.5 µm·d–1 and even 89.4 µm·d–1 whenonly reticular tissue is considered, in the femur of an emubetween 7 and 14 d after hatching (mean for seven emus:36.3 µm·d–1). A maximum of 65 µm·d–1 is reached in thetibiotarsus of an ostrich between 23 and 39 post-hatchingdays (mean for the tarsometatarsus of two ostriches:39.5 µm·d–1). The lowest values in emus occur in theradius (mean: 2.9 µm·d–1), while in ostriches the lowestvalues are shared by the first pedal phalanx of the seconddigit (mean: 4 µm·d–1) and the radius (mean: 5.3 µm·d–1).In general, ostrich bone appositional rates are higher thanthose of emus with the exception of the femur. This dis-crepancy is easily explained by the exceptional rate of80.5 µm·d–1 in one emu femur. The rate of primary bonedeposition in emu humerus, femur and tibiotarsusdecreases from the youngest to the oldest individualsstudied. In ostriches such a phenomenon is not yet visible(see Discussion).
Taking into account these quantitative data of radialbone growth rates, a clear relationship can be notedbetween those rates and the bone tissue types previously
Figure 1. Several aspects of body and skeletal growth of ostrichesand emus considered in this study.
546
J. Castanet et al. / C.R. Acad. Sci. Paris, Sciences de la vie / Life Sciences 323 (2000) 543–550
described. Laminar and reticular bone types largely over-lap in the same range of growth rates, although reticularbone in both taxa is associated with the highest dailygrowth rates (beyond 10 µm·d–1 in general). Moreover,
depending on the skeletal element considered, there is alarge range of rate values for a given tissue type: laminar/reticular bone types in the smaller elements of the forelimbin ostriches and emus have lower rates of deposition than
Figure 2. Results of fluorescent labelling. Cross sections at the diaphyseal levels.a. Emu humerus. The fluorescein (DCAF) label (arrow) injected at hatching + 7 d is already partly destroyed by endosteal resorption. Death athatching + 41 d. Cortex made of spongy bone with a majority of longitudinal blood vessels. Rate of osteogenesis from DCAF to periphery: 9 µm·d–1.b. Emu pedal digit 3, phalanx 1. DCAF injected at hatching + 7 d. Death at hatching + 34 d. Spongy bone. Rate of osteogenesis from DCAF toperiphery: 15 µm·d–1.c. Ostrich femur. Xylenol orange (red) at hatching + 18 d. DCAF (green-yellow) at hatching + 33 d. Death at hatching + 48 d. (Bone periphery inthe right upper corner.) Spongy bone with longitudinal blood vessels prior to xylenol injection, progressively changing to laminar bone. Rate ofosteogenesis between xylenol and DCAF reach 51.7 and 31.8 µm·d–1 between DCAF and periphery (thick arrows). Note the centripetalosteogenesis in primary osteons (double label with xylenol and DCAF – thin arrows) filling the inner vascular cavities, simultaneously to the externalbone deposition.d. Same ostrich, tibiotarsus observed under ordinary light. Bone periphery on the right. Typical aspect of laminar bone. Note the new bonedeposited = young laminae (right) less compact than inner and older laminae more or less completely filled (see c).
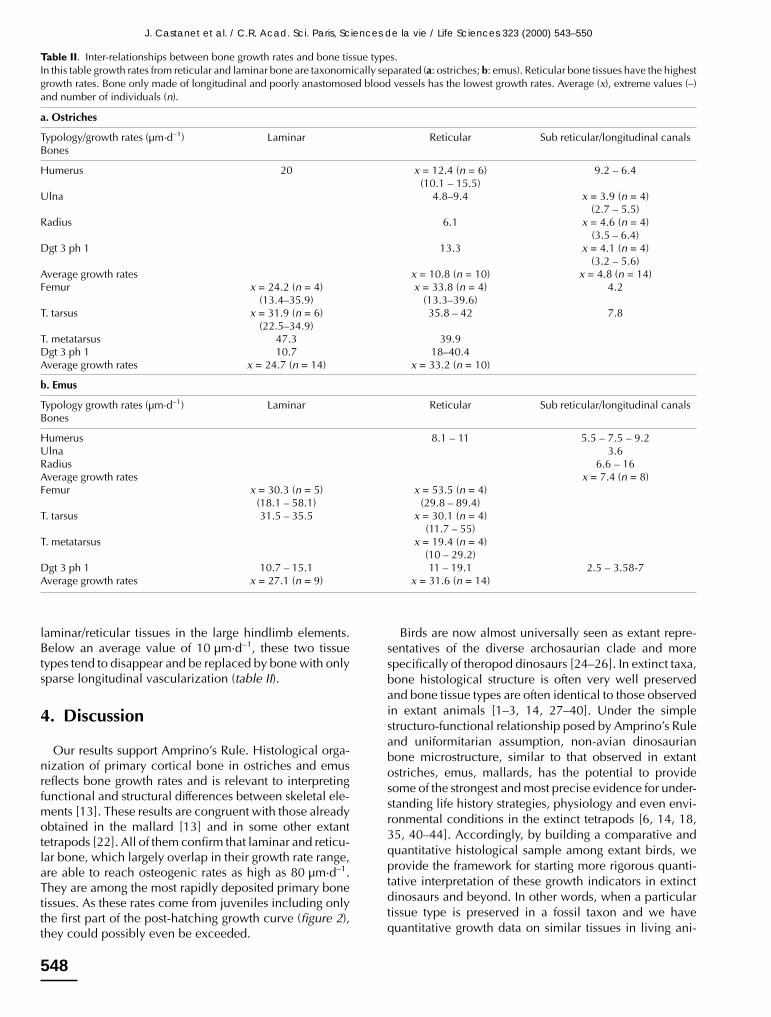
Table I. Rates of periosteal primary bone deposition at the diaphysis level of long bones in ostriches and emus. Average (x), standard deviation (±),extreme values (–) and number of individuals (n).
Humerus Radius Ulna Femur Tibiotarsus T. metatarsus Digit 2phalanx 1(hindlimb)
Digit 3 phalanx1 (hindlimb)
Ostrichesx = 14.9 ± 8 x = 5.3 ± 0.95 x = 6.4 ± 2.6 x = 30.5 ± 12.9 x = 31.8 ± 15.6 x = 39.5 ± 22.3 x = 4 ± 1.4 x = 17.4 ± 2.3(5.8 – 27.4) (4.7 – 6.6) (2.4 – 10.3) (13.4 – 51.7) (7.3 – 65) (22.8 – 64.9) (2 – 5.6) (14.9 – 19.4)
n = 6 n = 2 n = 5 n = 6 n = 6 n = 2 n = 3 n = 3
Emusx = 7.9 ± 2.2 x = 2.9 ± 1 x = 3.9 ± 1.2 x = 36.3 ± 19.4 x = 28.4 ± 13.5 x = 19.4 ± 9.6 x = 3.6 ± 1.8 x = 14.1 ± 6.3
(5.1 – 11) (2.2 – 3.2) (3 – 4.8) (18 – 80.5) (10.8 – 55) (9.9 – 29.2) (2.2 – 6.2) (7 – 23)n = 7 n = 2 n = 2 n = 7 n = 7 n = 4 n = 2 n = 6
547
J. Castanet et al. / C.R. Acad. Sci. Paris, Sciences de la vie / Life Sciences 323 (2000) 543–550
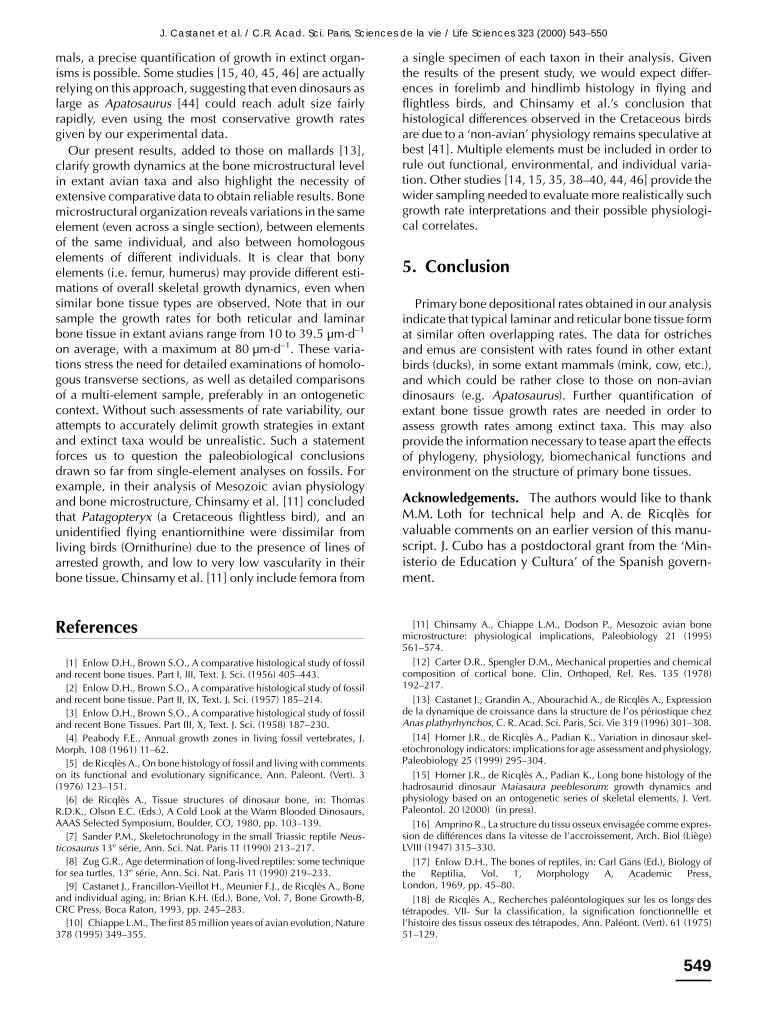
laminar/reticular tissues in the large hindlimb elements.Below an average value of 10 µm·d–1, these two tissuetypes tend to disappear and be replaced by bone with onlysparse longitudinal vascularization (table II).
4. Discussion
Our results support Amprino’s Rule. Histological orga-nization of primary cortical bone in ostriches and emusreflects bone growth rates and is relevant to interpretingfunctional and structural differences between skeletal ele-ments [13]. These results are congruent with those alreadyobtained in the mallard [13] and in some other extanttetrapods [22]. All of them confirm that laminar and reticu-lar bone, which largely overlap in their growth rate range,are able to reach osteogenic rates as high as 80 µm·d–1.They are among the most rapidly deposited primary bonetissues. As these rates come from juveniles including onlythe first part of the post-hatching growth curve (figure 2),they could possibly even be exceeded.
Birds are now almost universally seen as extant repre-sentatives of the diverse archosaurian clade and morespecifically of theropod dinosaurs [24–26]. In extinct taxa,bone histological structure is often very well preservedand bone tissue types are often identical to those observedin extant animals [1–3, 14, 27–40]. Under the simplestructuro-functional relationship posed by Amprino’s Ruleand uniformitarian assumption, non-avian dinosaurianbone microstructure, similar to that observed in extantostriches, emus, mallards, has the potential to providesome of the strongest and most precise evidence for under-standing life history strategies, physiology and even envi-ronmental conditions in the extinct tetrapods [6, 14, 18,35, 40–44]. Accordingly, by building a comparative andquantitative histological sample among extant birds, weprovide the framework for starting more rigorous quanti-tative interpretation of these growth indicators in extinctdinosaurs and beyond. In other words, when a particulartissue type is preserved in a fossil taxon and we havequantitative growth data on similar tissues in living ani-
Table II. Inter-relationships between bone growth rates and bone tissue types.In this table growth rates from reticular and laminar bone are taxonomically separated (a: ostriches; b: emus). Reticular bone tissues have the highestgrowth rates. Bone only made of longitudinal and poorly anastomosed blood vessels has the lowest growth rates. Average (x), extreme values (–)and number of individuals (n).
a. Ostriches
Typology/growth rates (µm·d–1) Laminar Reticular Sub reticular/longitudinal canalsBones
Humerus 20 x = 12.4 (n = 6) 9.2 – 6.4(10.1 – 15.5)
Ulna 4.8–9.4 x = 3.9 (n = 4)(2.7 – 5.5)
Radius 6.1 x = 4.6 (n = 4)(3.5 – 6.4)
Dgt 3 ph 1 13.3 x = 4.1 (n = 4)(3.2 – 5.6)
Average growth rates x = 10.8 (n = 10) x = 4.8 (n = 14)Femur x = 24.2 (n = 4) x = 33.8 (n = 4) 4.2
(13.4–35.9) (13.3–39.6)T. tarsus x = 31.9 (n = 6) 35.8 – 42 7.8
(22.5–34.9)T. metatarsus 47.3 39.9Dgt 3 ph 1 10.7 18–40.4Average growth rates x = 24.7 (n = 14) x = 33.2 (n = 10)
b. Emus
Typology growth rates (µm·d–1) Laminar Reticular Sub reticular/longitudinal canalsBones
Humerus 8.1 – 11 5.5 – 7.5 – 9.2Ulna 3.6Radius 6.6 – 16Average growth rates x = 7.4 (n = 8)Femur x = 30.3 (n = 5) x = 53.5 (n = 4)
(18.1 – 58.1) (29.8 – 89.4)T. tarsus 31.5 – 35.5 x = 30.1 (n = 4)
(11.7 – 55)T. metatarsus x = 19.4 (n = 4)
(10 – 29.2)Dgt 3 ph 1 10.7 – 15.1 11 – 19.1 2.5 – 3.58-7Average growth rates x = 27.1 (n = 9) x = 31.6 (n = 14)
548
J. Castanet et al. / C.R. Acad. Sci. Paris, Sciences de la vie / Life Sciences 323 (2000) 543–550
mals, a precise quantification of growth in extinct organ-isms is possible. Some studies [15, 40, 45, 46] are actuallyrelying on this approach, suggesting that even dinosaurs aslarge as Apatosaurus [44] could reach adult size fairlyrapidly, even using the most conservative growth ratesgiven by our experimental data.
Our present results, added to those on mallards [13],clarify growth dynamics at the bone microstructural levelin extant avian taxa and also highlight the necessity ofextensive comparative data to obtain reliable results. Bonemicrostructural organization reveals variations in the sameelement (even across a single section), between elementsof the same individual, and also between homologouselements of different individuals. It is clear that bonyelements (i.e. femur, humerus) may provide different esti-mations of overall skeletal growth dynamics, even whensimilar bone tissue types are observed. Note that in oursample the growth rates for both reticular and laminarbone tissue in extant avians range from 10 to 39.5 µm·d–1
on average, with a maximum at 80 µm·d–1. These varia-tions stress the need for detailed examinations of homolo-gous transverse sections, as well as detailed comparisonsof a multi-element sample, preferably in an ontogeneticcontext. Without such assessments of rate variability, ourattempts to accurately delimit growth strategies in extantand extinct taxa would be unrealistic. Such a statementforces us to question the paleobiological conclusionsdrawn so far from single-element analyses on fossils. Forexample, in their analysis of Mesozoic avian physiologyand bone microstructure, Chinsamy et al. [11] concludedthat Patagopteryx (a Cretaceous flightless bird), and anunidentified flying enantiornithine were dissimilar fromliving birds (Ornithurine) due to the presence of lines ofarrested growth, and low to very low vascularity in theirbone tissue. Chinsamy et al. [11] only include femora from
a single specimen of each taxon in their analysis. Giventhe results of the present study, we would expect differ-ences in forelimb and hindlimb histology in flying andflightless birds, and Chinsamy et al.’s conclusion thathistological differences observed in the Cretaceous birdsare due to a ‘non-avian’ physiology remains speculative atbest [41]. Multiple elements must be included in order torule out functional, environmental, and individual varia-tion. Other studies [14, 15, 35, 38–40, 44, 46] provide thewider sampling needed to evaluate more realistically suchgrowth rate interpretations and their possible physiologi-cal correlates.
5. Conclusion
Primary bone depositional rates obtained in our analysisindicate that typical laminar and reticular bone tissue format similar often overlapping rates. The data for ostrichesand emus are consistent with rates found in other extantbirds (ducks), in some extant mammals (mink, cow, etc.),and which could be rather close to those on non-aviandinosaurs (e.g. Apatosaurus). Further quantification ofextant bone tissue growth rates are needed in order toassess growth rates among extinct taxa. This may alsoprovide the information necessary to tease apart the effectsof phylogeny, physiology, biomechanical functions andenvironment on the structure of primary bone tissues.
Acknowledgements. The authors would like to thankM.M. Loth for technical help and A. de Ricqlès forvaluable comments on an earlier version of this manu-script. J. Cubo has a postdoctoral grant from the ‘Min-isterio de Education y Cultura’ of the Spanish govern-ment.
References
[1] Enlow D.H., Brown S.O., A comparative histological study of fossiland recent bone tisues. Part I, III, Text. J. Sci. (1956) 405–443.
[2] Enlow D.H., Brown S.O., A comparative histological study of fossiland recent bone tissue. Part II, IX, Text. J. Sci. (1957) 185–214.
[3] Enlow D.H., Brown S.O., A comparative histological study of fossiland recent Bone Tissues. Part III, X, Text. J. Sci. (1958) 187–230.
[4] Peabody F.E., Annual growth zones in living fossil vertebrates, J.Morph. 108 (1961) 11–62.
[5] de Ricqlès A., On bone histology of fossil and living with commentson its functional and evolutionary significance, Ann. Paleont. (Vert). 3(1976) 123–151.
[6] de Ricqlès A., Tissue structures of dinosaur bone, in: ThomasR.D.K., Olson E.C. (Eds.), A Cold Look at the Warm Blooded Dinosaurs,AAAS Selected Symposium, Boulder, CO, 1980, pp. 103–139.
[7] Sander P.M., Skeletochronology in the small Triassic reptile Neus-ticosaurus 13e série, Ann. Sci. Nat. Paris 11 (1990) 213–217.
[8] Zug G.R., Age determination of long-lived reptiles: some techniquefor sea turtles, 13e série, Ann. Sci. Nat. Paris 11 (1990) 219–233.
[9] Castanet J., Francillon-Vieillot H., Meunier F.J., de Ricqlès A., Boneand individual aging, in: Brian K.H. (Ed.), Bone, Vol. 7, Bone Growth-B,CRC Press, Boca Raton, 1993, pp. 245–283.
[10] Chiappe L.M., The first 85 million years of avian evolution, Nature378 (1995) 349–355.
[11] Chinsamy A., Chiappe L.M., Dodson P., Mesozoic avian bonemicrostructure: physiological implications, Paleobiology 21 (1995)561–574.
[12] Carter D.R., Spengler D.M., Mechanical properties and chemicalcomposition of cortical bone. Clin. Orthoped, Rel. Res. 135 (1978)192–217.
[13] Castanet J., Grandin A., Abourachid A., de Ricqlès A., Expressionde la dynamique de croissance dans la structure de l’os périostique chezAnas plathyrhynchos, C. R. Acad. Sci. Paris, Sci. Vie 319 (1996) 301–308.
[14] Horner J.R., de Ricqlès A., Padian K., Variation in dinosaur skel-etochronology indicators: implications for age assessment and physiology,Paleobiology 25 (1999) 295–304.
[15] Horner J.R., de Ricqlès A., Padian K., Long bone histology of thehadrosaurid dinosaur Maiasaura peeblesorum: growth dynamics andphysiology based on an ontogenetic series of skeletal elements, J. Vert.Paleontol. 20 (2000) (in press).
[16] Amprino R., La structure du tissu osseux envisagée comme expres-sion de différences dans la vitesse de l’accroissement, Arch. Biol (Liège)LVIII (1947) 315–330.
[17] Enlow D.H., The bones of reptiles, in: Carl Gans (Ed.), Biology ofthe Reptilia, Vol. 1, Morphology A, Academic Press,London, 1969, pp. 45–80.
[18] de Ricqlès A., Recherches paléontologiques sur les os longs destétrapodes. VII- Sur la classification, la signification fonctionnellle etl’histoire des tissus osseux des tétrapodes, Ann. Paléont. (Vert). 61 (1975)51–129.
549
J. Castanet et al. / C.R. Acad. Sci. Paris, Sciences de la vie / Life Sciences 323 (2000) 543–550
[19] Castanet J., La squelettochronologie chez les Reptiles. I. Résultatsexpérimentaux sur la signification des marques de croissance squelet-tiques utilisées comme critère d’âge chez les lézards et les tortues, Ann.Sc. Nat. Zool. Paris 7 (1985) 23–40.
[20] Castanet J., Naulleau G., La squelettochronologie chez les Rep-tiles. II. Résultats expérimentaux sur la signification des marques decroissance squelettiques utilisées comme critère d’âge chez les Serpents.Remarques sur la croissance et la longévité de la vipère Aspic, Ann. Sci.Nat. Zool. Paris 7 (1985) 41–62.
[21] Carrier D., Leon R.L., Skeletal growth and function in the Califor-nia gull (Larus cifornicus), J. Zool. Lond. 222 (1990) 375–389.
[22] de Ricqlès A., Meunier F.J., Castanet J., Francillon-Vieillot H.,Comparative microstructure of bone, in: Brian K.H. (Ed.), Bone Matrix andBone Specific Products, Vol. 3, CRC Press, Boca Raton, FL, 1991, pp. 1–78.
[23] Wyers M., Cherel Y., Plassiart G., Chabeauti E., Mariau V.,Fernandez B., Guéreaud C., Guigand L., Étude comparée de la croissanceosseuse diaphysaire du tibia entre 3 et 12 semaines dans deux souches dedindes : aspects histologiques et histomorphométriques, Reprod. Nutr.Dev. 33 (1993) 511–530.
[24] Gauthier J., Saurischian monophyly and the origin of birds, in:Padian K. (Ed.), The Origins of Birds and the Evolution of Flight, Mem.Calif. Acad. Sci. 8 (1986) 1–55.
[25] Padian K., Chiappe L.M., The origin and early evolution of birds,Biol. Rev. 73 (1998) 1–42.
[26] Sereno P.C., The evolution of dinosaurs, Science. 284 (1999)2137–2147.
[27] Currey J.D., The histology of the bone of a prosauropod dinosaur,Paleontology 5 (1962) 238–246.
[28] de Ricqlès A., Recherches paléohistologiques sur les os longs destétrapodes. VI. Stégocéphales, Ann. Paléont. (Vert). 67 (1981) 141–157.
[29] de Buffrénil V., Mazin J.M., Bone histology of the ichthyosaurs:comparative data and functional interpretation, Paleobiology 16 (1990)435–437.
[30] Chinsamy A., Dinosaur bone histology: implications and infer-ences No.7, in: Rosenberg. G.D., Wolberg. D.L. (Eds.), The Dino Fest,Paleotological Society Special Publication, University of Tennessee Press,Knoxville, TN, 1994, pp. 213–227.
[31] Chinsamy A., Histological perspectives on growth in the birdsStruthio camelius and Sagittarius serpentarius, Courier ForschungsinstitutSenckenberg 181 (1995) 317–323.
[32] Chinsamy A., Bone microstructure of early birds, in: Chiappe L.,Witmer L. (Eds.), Mesozoic Birds: Above the Head of Dinosaurs, Univer-sity of California Press, Berkeley, 2000.
[33] Chinsamy A., Martin L.D., Dodson P., Bone microstructure of thediving Hesperornis and the volant Ichthyornis from the Niobrara chalk ofwestern Kansas, Cretac. Res. 19 (1998) 225–235.
[34] Houde P., Histological Evidence for the Systematic Position ofHesperornis (Odontornithes: Hesperornithiformes), Auk 104 (1987)125–129.
[35] Reid R.E.H., Zonal ‘Growth rings’ in dinosaurs, Mod. Geol. 15(1990) 19–48.
[36] Reid R.E.H., How dinosaur grew, in: Farlow J.O., Brett-SurmanM.K. (Eds.), The Complete Dinosaur, Indiana Univ. Press, Blomington,IN, 1997, pp. 403–413.
[37] Reid R.E.H., Dinosaurian physiology: the case for ‘intermediate’dinosaur, in: Farlow J.O., Brett-Surman M.K. (Eds.), The Complete Dino-saur, Indiana Univ. Press, Blomington, IN, 1997, pp. 449–473.
[38] Varricchio D.J., Bone microstructure of the upper cretaceoustheropod Dinosaur Troodon formosus, J. Vert. Paleontol. 13 (1993)99–104.
[39] Curry K.A., Diplodocid osteogenesis, J. Vert. Paleont. 16 (1996)29A.
[40] Sander P.M., Life history of Tendagurus sauropods as infered fromlong bone histology, 2 Mitt. Mus. Nat. kd. Berl., Geowiss. Reihe 2 (1999)103–112.
[41] de Ricqlès A., L’origine dinosaurienne des Oiseaux et del’endothermie avienne: les arguments histologiques, Année Biol. 29 (2000)in press.
[42] de Ricqlès A., Padian K., Horner J.R., The bone histology of basalbirds in phylogenetic and ontogenetic perspectives, in: Gauthier J. (Ed.), J.Oström Feischrift Tale University Press, NH, 2000.
[43] Reid R.E.H., Bone istology of the Cleveland-Lloyd Dinosaurs andof Dinosaurs in General, Part I. Introduction to Bone Tissues, BrighamYoung University Geology Studies 41 (1996) 25–71.
[44] Curry K.A., Ontogenetic histology of Apatosaurus (Dinosauria:sauropoda): new insights on growth rates and longevity, J. Vertebr. Pale-ontol. 19 (1999) 654–665.
[45] Rimblot-Baly F., de Ricqlès A., Zylberberg L., Analyse paléohis-tologique d’une série de croissance partielle chez Lapparentosaurusmadagascariensis (Jurassique moyen): Essai sur la dynamique de crois-sance d’un dinosuare sauropode, Ann. Paléontol. 81 (1995) 49–86.
[46] Curry K.A., Histological quantification of growth rates inApatosaurus, J. Vertebr. Paleontol. 15 (1998) 36–37A.
550
J. Castanet et al. / C.R. Acad. Sci. Paris, Sciences de la vie / Life Sciences 323 (2000) 543–550