angola: perspectives on the financial crisis ricardo gazel second afr economists retreat...
TRANSCRIPT
Angola: Perspectives on the Financial Crisis
Ricardo Gazel
Second AFR Economists RetreatJohannesburg, South Africa
December 5, 2008

Impact on Financial Sector
• Likely small as:– No stock market– No strong connection of domestic bank
system with international financial markets (except via Portuguese banks)
– Small interbaking credit market– Low loans to deposit ratios– Solid macroeconomic indicators: budget
surplus, high international reserves, low external debt.

Net International Reserves US$ Millions
5002500450065008500
1050012500145001650018500
2003
2004
2005
2006
2007
08-J
an
08-F
eb
08-M
ar
08-A
pr
08-M
ay
08-J
un
08-J
ul
08-A
ug
08-S
ep
10-O
ct-0
8
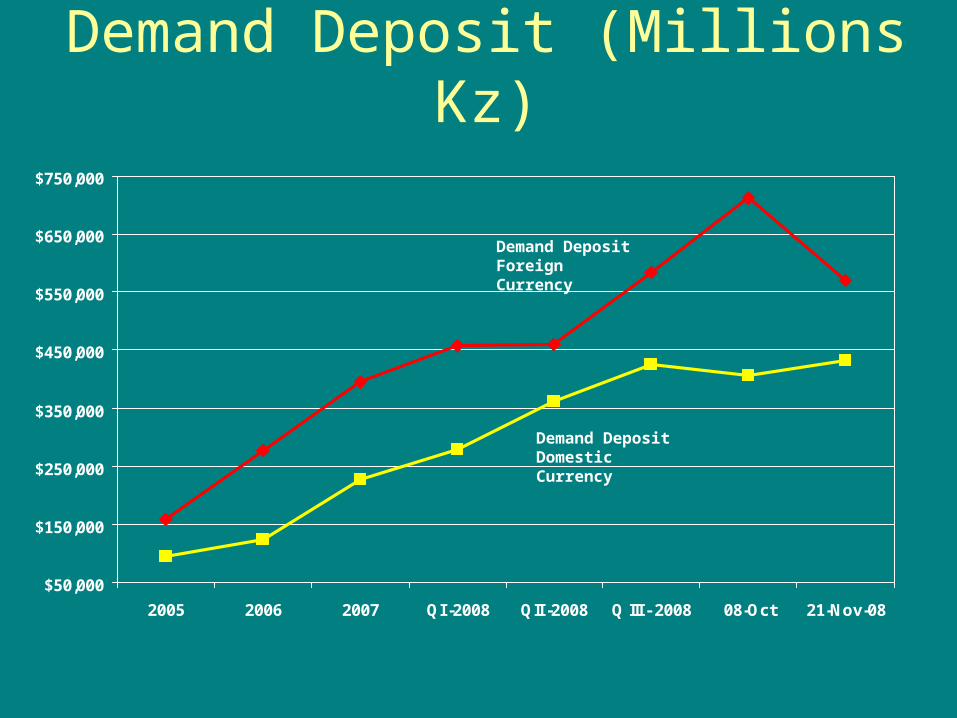
Demand Deposit (Millions Kz)
$50,000
$150,000
$250,000
$350,000
$450,000
$550,000
$650,000
$750,000
2005 2006 2007 QI -2008 QII -2008 Q III - 2008 08-Oct 21-Nov-08
Demand Deposit Foreign Currency
Demand Deposit Domestic Currency
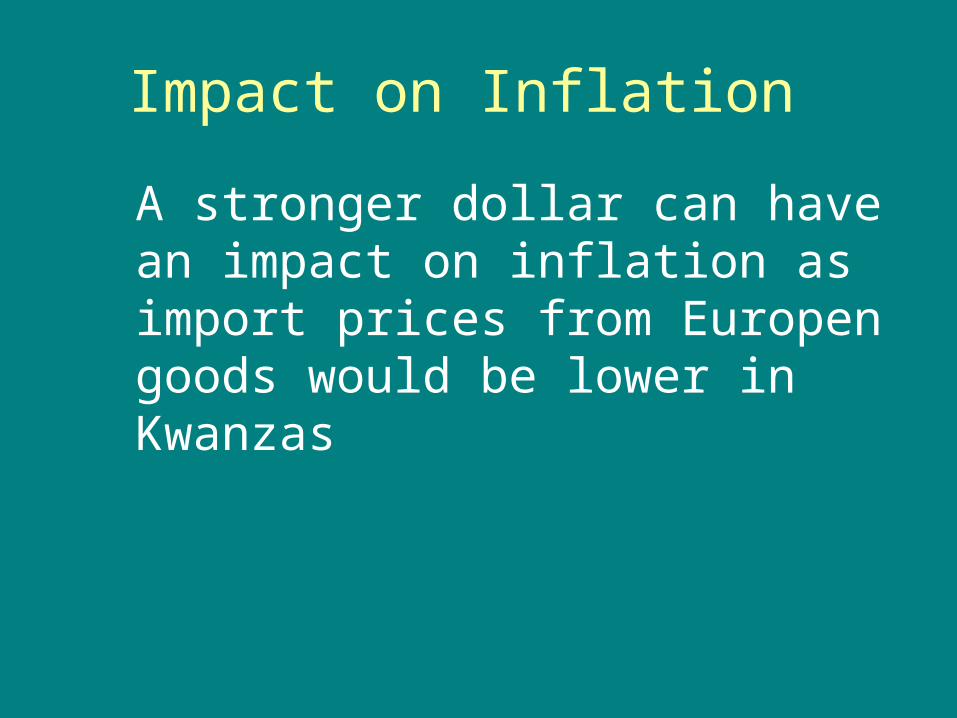
Impact on Inflation
A stronger dollar can have an impact on inflation as import prices from Europen goods would be lower in Kwanzas

Yearly Inflation
0
50
100
150
200
250
300
2000 2001 2002 2003 2004 2005 2006 2007
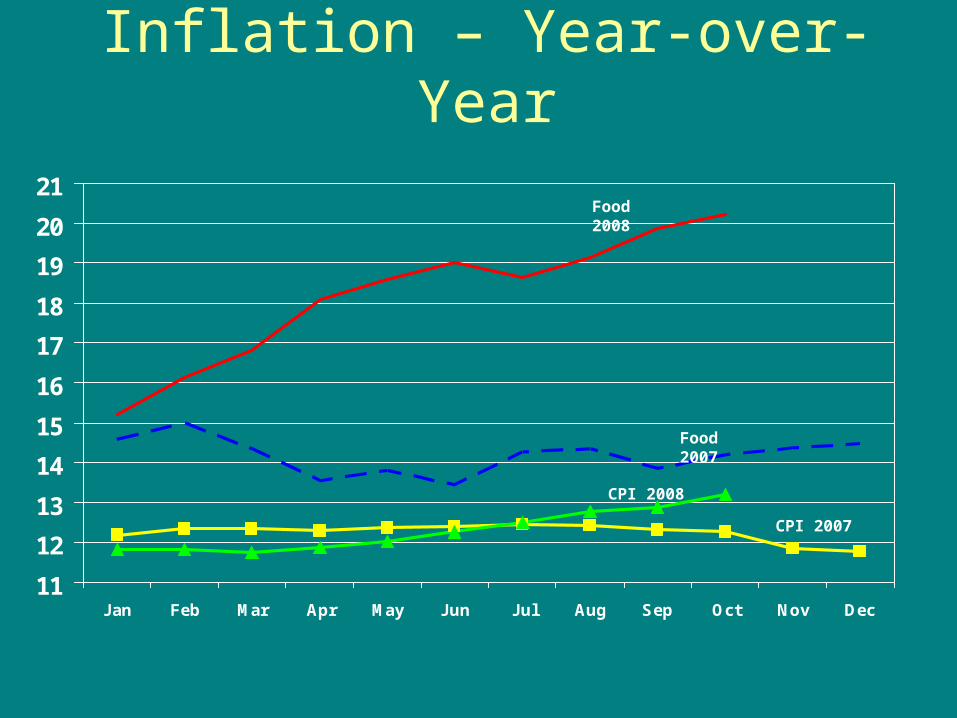
Inflation – Year-over-Year
11
12
13
14
15
16
17
18
19
20
21
Jan Feb Mar Apr May Jun Jul Aug Sep Oct Nov Dec
Food 2008
CPI 2008
Food 2007
CPI 2007
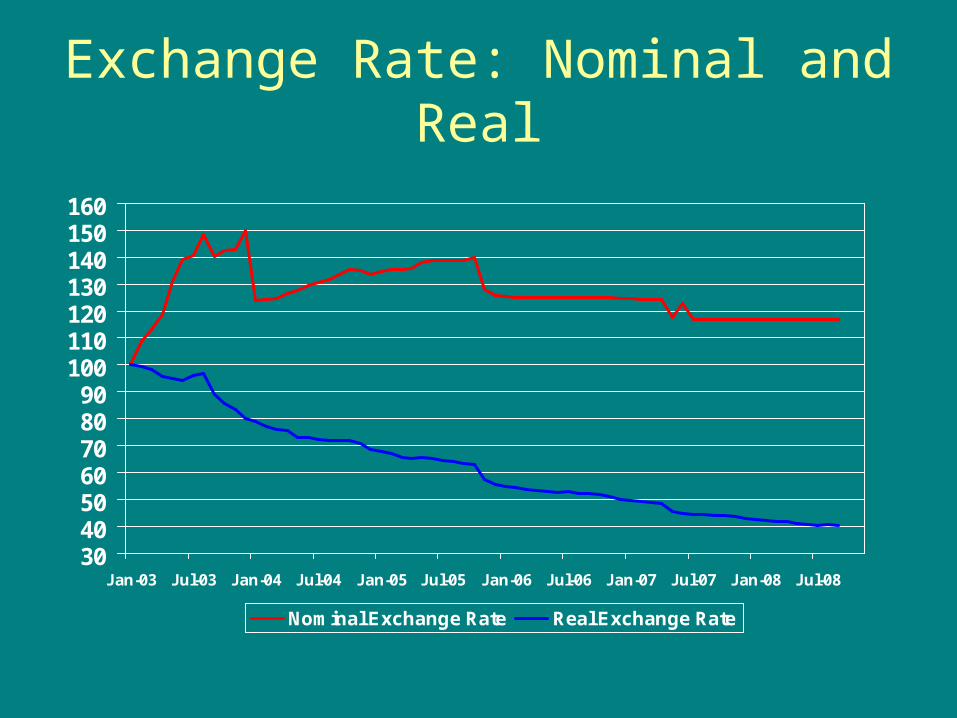
Exchange Rate: Nominal and Real
30405060708090
100110120130140150160
Jan-03 Jul-03 Jan-04 Jul-04 Jan-05 Jul-05 Jan-06 Jul-06 Jan-07 Jul-07 Jan-08 Jul-08
Nominal Exchange Rate Real Exchange Rate

Nominal Exchange Rates
60
70
80
90
100
110
120
130
Jan-07 Mar-07 May-07 Jul-07 Sep-07 Nov-07 Jan-08 Mar-08 May-08 Jul-08 Sep-08
Do
llar,
Eu
ro
8
9
10
11
12
Ra
nd
dollar Euro Rand (Right axis)

Impact on Real Economy • Real Economy:
– Lower price of oil – lower government revenues and lower national income
– Lower government demand – lower growth of non-oil sector
• Investment and Capital Flows– Less liquidity in international credit markets
can reduce investment flows as price of capital increases
– Higher Costs of Government Financing

Exports:US$ Millions
0
5,000
10,000
15,000
20,000
25,000
30,000
35,000
40,000
45,000
2003 2004 2005 2006 2007
Oil Non-oil
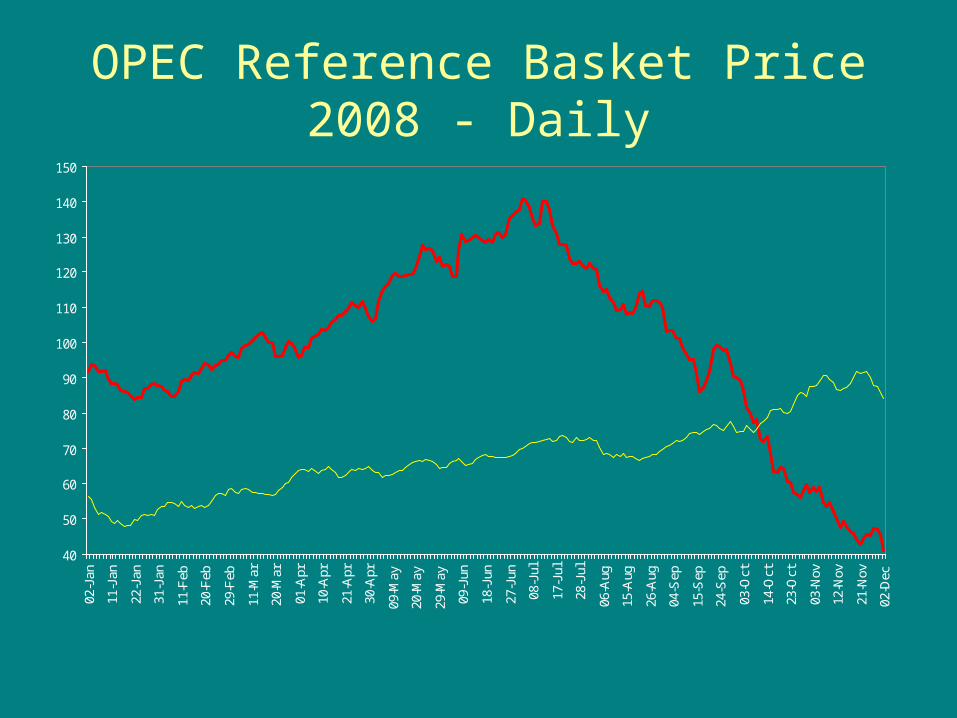
OPEC Reference Basket Price2008 - Daily
40
50
60
70
80
90
100
110
120
130
140
150
02-J
an
11-J
an
22-J
an
31-J
an
11-F
eb
20-F
eb
29-F
eb
11-M
ar
20-M
ar
01-A
pr
10-A
pr
21-A
pr
30-A
pr
09-M
ay
20-M
ay
29-M
ay
09-J
un
18-J
un
27-J
un
08-J
ul
17-J
ul
28-J
ul
06-A
ug
15-A
ug
26-A
ug
04-S
ep
15-S
ep
24-S
ep
03-O
ct
14-O
ct
23-O
ct
03-N
ov
12-N
ov
21-N
ov
02-D
ec

Oil Exports:Volume and Price
311.1 302.6
344.5
452
487.8
522
584
623
24.228.2
36.1
50
61.4
72.4
97.08
55
200
250
300
350
400
450
500
550
600
650
2002 2003 2004 2005 2006 2007 2008 2009
20
30
40
50
60
70
80
90
100
110
Volume (millions of barrels) Price (US$/barrel)

Oil Exports (US$ millions)
5,000
10,000
15,000
20,000
25,000
30,000
35,000
40,000
45,000
50,000
55,000
60,000
2002 2003 2004 2005 2006 2007 2008 2009
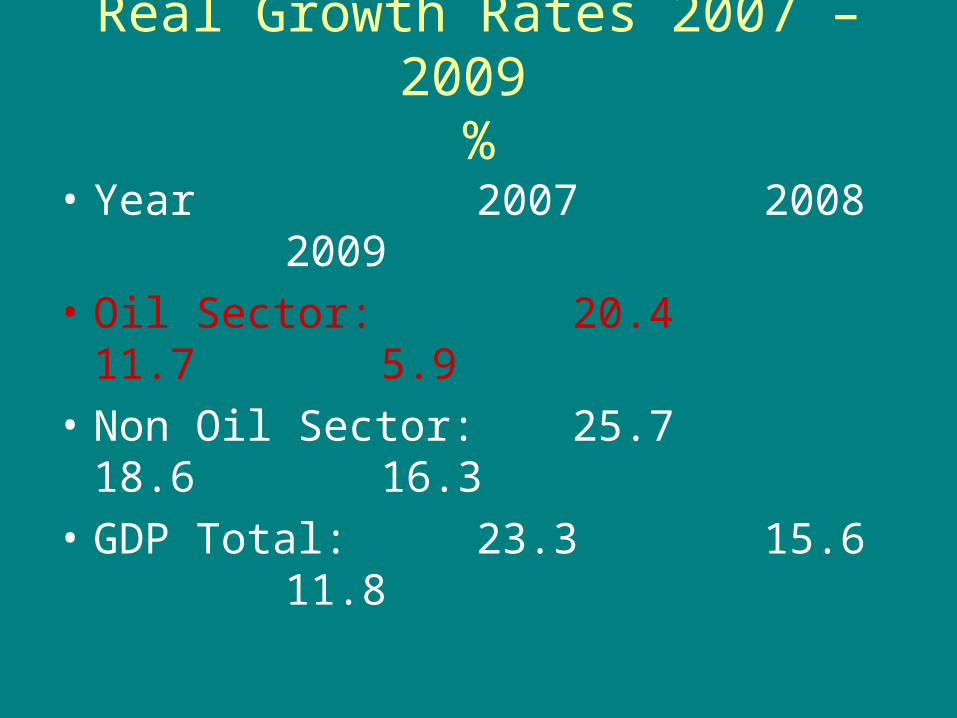
Real Growth Rates 2007 – 2009 %
• Year 2007 2008 2009
• Oil Sector: 20.4 11.7 5.9
• Non Oil Sector: 25.7 18.616.3
• GDP Total: 23.3 15.611.8
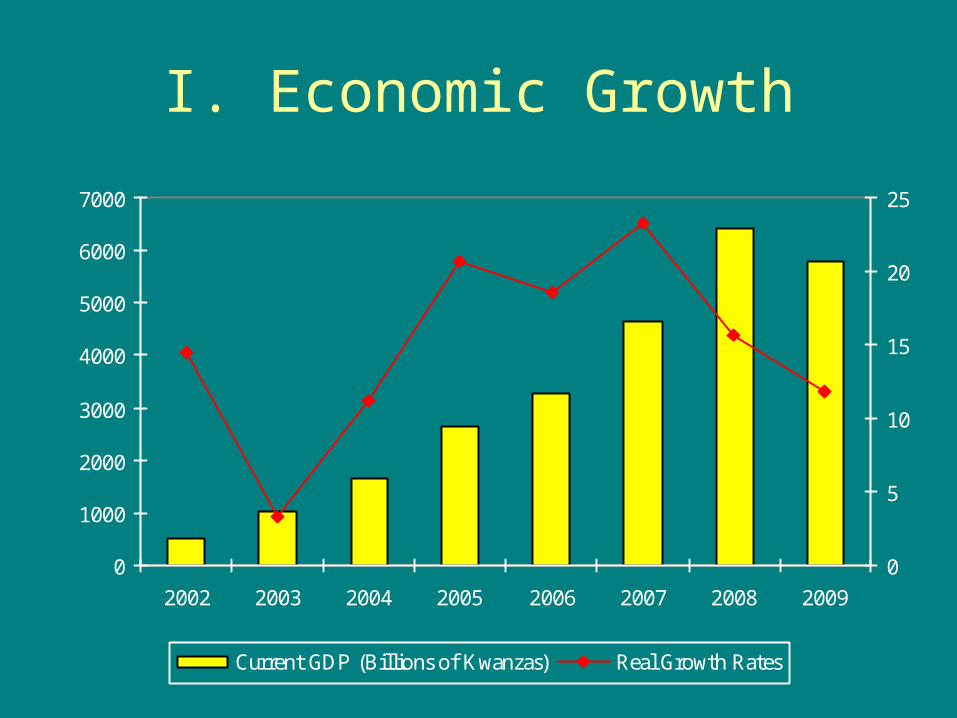
I. Economic Growth
0
1000
2000
3000
4000
5000
6000
7000
2002 2003 2004 2005 2006 2007 2008 2009
0
5
10
15
20
25
Current GDP (Billions of Kwanzas) Real Growth Rates

OIL ProductionMillion Barrels per Day
OPEC Monthly Oil Market Report
1.4
1.6
1.8
2.0
2.2
2007 2008 OPEC Quota OPEC Quotawith
ProductionCut
GovernmentForecast 2009

Real Growth Rates 2007 – 2009 %
• Year 2007 2008 2009
• Oil Sector: 20.4 11.7 5.9
• Non Oil Sector: 25.7 18.616.3
• GDP Total: 23.3 15.611.8
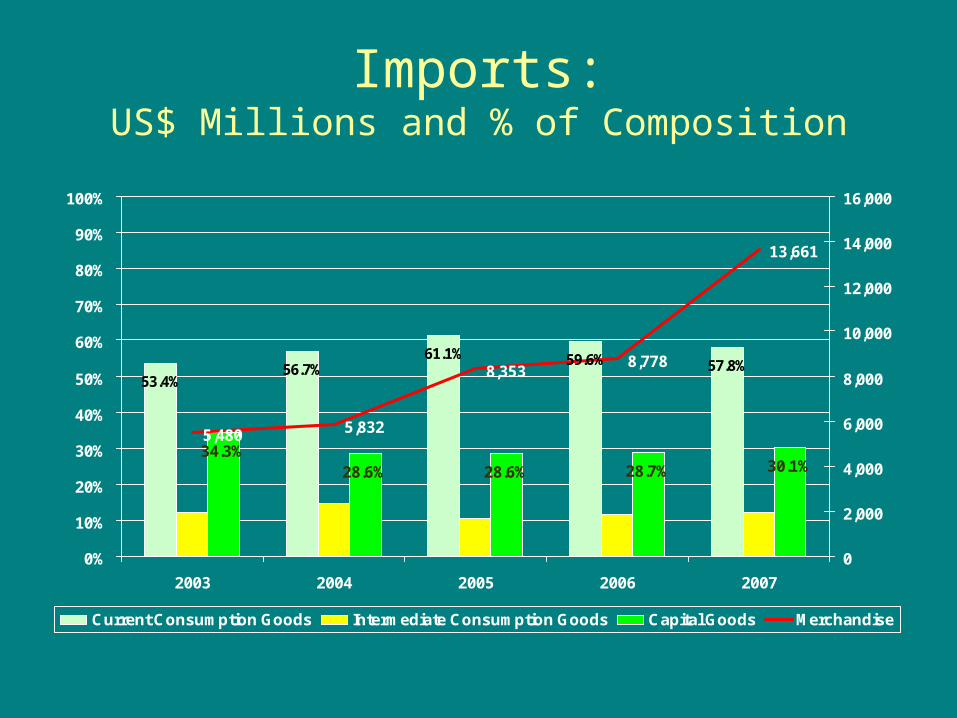
Imports:US$ Millions and % of Composition
53.4%56.7%
61.1% 59.6% 57.8%
34.3%28.6% 28.6% 28.7% 30.1%
5,480 5,832
8,3538,778
13,661
0%
10%
20%
30%
40%
50%
60%
70%
80%
90%
100%
2003 2004 2005 2006 2007
0
2,000
4,000
6,000
8,000
10,000
12,000
14,000
16,000
Current Consumption Goods Intermediate Consumption Goods Capital Goods Merchandise

Fiscal Accounts: Revenues Billions of Kwanzas)
0
500
1000
1500
2000
2500
3000
3500
2003 2004 2005 2006 2007 2008 2009
Oil Non-oil

Fiscal Accounts: Growth Rates % over previous year
-30%
0%
30%
60%
90%
2004 2005 2006 2007 2008 2009
Total Revenues Oil Non-oil

Fiscal Accounts: Revenues and Expenditures(% do GDP)
-80%
-60%
-40%
-20%
0%
20%
40%
60%
2003 2004 2005 2006 2007 2008 2009
Non-oil GDP as % of GDP Non-Oil primary fiscal balance (as % of Non-oil GDP)

External Debt including Arrears
0%
10%
20%
30%
40%
50%
60%
70%
80%
2003 2004 2005 2006 2007 2008 2009
$0
$2,000
$4,000
$6,000
$8,000
$10,000
$12,000
$14,000
$16,000
As % GDP External Debt (US$millions)