angola desk review october 2012 - famine early warning...
TRANSCRIPT
FEWS NET Angola [email protected] www.fews.net
FEWS NET is a USAID-funded activity. The content of this report does not necessarily reflect the view of the United States Agency for International Development or the United States Government.
ANGOLA Desk Review October 2012 NATIONAL OVERVIEW Geographically, Angola is located on the west coast of southern Africa, south of the equator, with most of the territory situated between the parallel 4° 22' and 18o 02' parallels latitude south and meridians 11o 41’ and 24o 05' longitude east of Greenwich. The country has a total area of 1,246,700 Km2, with 1,650 km of coastline and 4,837 of land borders. In a North-South sense, the territory has a maximum length of 1,277 km and maximum width, from West-East, of 1,236 km. The country has eighteen (18) provinces and 163 municipalities. Angola, a former Portuguese colony, obtained independence in 1975, and almost immediately plunged into a civil war that lasted 27 years. Soon after independence, the country installed the central planning economic system based on models from the Soviet Union. After the Bicesse Accords in 1991, the central planning system was changed to a “market-oriented” system. In this system, the government still maintained control of crucial sectors of the economy and selectively liberalized the rest. During most of the 1990s, Angola’s economy underperformed, at par with most African countries. However, after 1998, Angola was successful in attracting foreign direct investments beyond 1 billion USD, which was mostly destined for offshore oil. Excluding a fall in 2000, inflows have increased steadily, maintaining a rate of more than 5 billion USD since 2003. Angola attracted over 11 billion USD in foreign direct investments (FDI) in 2009.1 Most of Angola’s FDI comes from the United States, followed by France, the Netherlands and Brazil.2 Despite a fast-growing economy, Angola ranks in the bottom 10 percent of most socio-economic indicators.3 The government has begun tackling the country’s massive developmental challenges and tentatively diversifying the economy away from its dependency on oil, while rebuilding infrastructure and improving institutional capacity. However, much of these investments have not yet begun to trickle down to the majority of the population, as evidenced by the high level of societal inequality (Gini Index of 58.6 percent), and income distribution (the top 20 percent of the population acquires 62 percent of the income while the bottom 20 percent only acquires only 2 percent of the income).4 Agriculture, one of the fastest growing sectors of the economy, is largely characterized by subsistence production, and currently accounts for about 10 percent of national GDP. Angola was once a major African agricultural exporter. The long civil war and its negative consequences, such as massive displacement of rural population, infrastructure destruction, and the widespread placement of landmines throughout the country resulted in a massive decline of agricultural activities and food production.5 The lasting peace achieved in 2002 has allowed the government to design an aggressive investment strategy in agriculture in order to tackle food insecurity, reduce costly food imports and boost employment.6 Population The size of the country's population is not really known, given that Angola has not had a census since 1970. The National Institute of Statistics (INE) estimated the population to be 16 million inhabitants in 2010 with a growth rate of 2.8 percent per year. For 2012m it is estimated that the population will reach 20.6 million with a growth rate of 3 percent.7However, the UNDPs Human Development Index (HDI) is more conservative, showing estimates closer to 19.6 million for 2012.8 It is projected that about a third of that population is concentrated in Luanda (see table B1 in the appendix for a disaggregated population distribution). The Angolan population is very young (two-thirds is under 25), due to high fertility rates (6 children per woman) and high death rates of adults.9 The mortality rate of children under five has shown a decreasing trend. In
1 UNCTAD Stat http://unctadstat.unctad.org/UnctadStatMetadata/Documentation/UNCTADstatContent.html 2 US Dept. of State, 2010 Investment Climate Statement, Angola: http://angola.usembassy.gov/pol-econ-section/investment-climate-statement-2010.html 3 US Dept. of State, Background Note Angola: http://www.state.gov/r/pa/ei/bgn/6619.htm 4 FAOSTAT: http://faostat.fao.org/ 5 US Dept. of State, Background Note Angola: http://www.state.gov/r/pa/ei/bgn/6619.htm 6 African Economic Outlook – Angola: http://www.africaneconomicoutlook.org/en/countries/southern-africa/angola/ 7 National Institute of Statistics [Instituto Nacional de Estatística], INE (2012): http://ine.gov.ao 8 2012 Human Development Index [HDI], found at: http://hdrstats.undp.org/en/indicators/306.html 9 INE, 2012: Found at: http://ine.gov.ao

ANGOLA Desk Review October 2012
Famine Early Warning Systems Network 2
2009, it was estimated that the mortality rate for children under five was 194 deaths per 1,000 live births, down from a peak of 300 deaths per 1,000 in 1994. The infant mortality rate is currently estimated at 116 per 1,000 live births. According to the Household Expenditure Survey (IBEP, in Portuguese), children living in rural areas have a greater than 150 percent chance of dying before their fifth birthday.10 The World Health Organization (WHO) estimated life expectancy at birth to be 51 years for men and 55 for women in 2012.11 There are plans to conduct a new census in 2013. According to the National Food Security strategy report by the Ministry of Agriculture, the percentage of the population living in rural areas is uncertain, particularly in areas that have been affected by armed conflict.12 Despite the uncertainty, the UN Fund for Population (UNFP) estimates that more than half of Angola's population lives in rural areas – there are other studies that point to a rural population of around 60 to 70 percent.13 Basic macroeconomic environment The macroeconomic environment has seen drastic changes in recent years. Even though there is no reliable employment or unemployment data available, it is estimated that 85 percent of the population is employed in the agricultural sector. For those residing in large cities such as Luanda, the chief source of income is salaried work in state-owned institutions. The government substantially increased public sector wages in 2010. Since then it has increased wages gradually; the last adjustment was made in late 2011.15 The high GDP growth rates the country has been posting has allowed the government to stabilize the macroeconomic environment, finance massive infrastructure overhauls, and invest in sectors that had been neglected during the civil war period. However, high transaction costs, such as high national debt levels, onerous access to private capital, corruption, and extreme bureaucracy, are still hindering the economic transition process. For instance, even though the country has been posting GDP surpluses in the last 3 years, the government still owes 7 billion USD to companies carrying out this massive infrastructure overhaul (Table 1).16 The government has adopted a policy of devaluing the Cuanza (AOA) against major currencies. In September 2009, the Cuanza was trading at 1 USD = 78 AOA. A sharp devaluation occurred at the end of 2009, resulting in an exchange rate of 1 USD = 90 AOA. Currently, the Cuanza is trading at 1 USD = 98.8 AOA. In 2011, the per capita GDP was estimated to be 6,000 USD (purchasing power parity method [PPP]).18 The 1991-1996 period was marked by hyperinflation that peaked at over 4,000 percent/year due to civil war and the transition to a market-based economy. Inflation has been 10-12 percent/year since 2006 (Table 2). Poverty
10 IBEP, 2011 11 World Health Organization [WHO], found at: http://apps.who.int/ghodata/?vid=3300&theme=country# 12 National Food Security Strategy report, 2009 13 Report of the Joint Mission FAO/WFP Evaluation of Crop and Food Needs in Angola, Rome: FAO/ WFP, 2007 14 Ibid. 15 IBEP, ibid. 16 World Bank country brief: http://go.worldbank.org/6LIK1A3SS0 17 Banco Nacional de Angola: www.bna.ao/conteudos/artigos/detalhe_artigo.aspx?idc=951&idsc=948&idl=1 18 ibid.
Table 1. Current and historic GDP TYPE
2007 2008 2009 2010 2011 General (billion AOA)
Agriculture 351,80 405,60 596,50 729 909,60 Fisheries 12,60 13,90 14,50 16,90 19,60
Other 4.191,30 5.742,6 5.230,5 6.645,9 8.306,8 TOTAL 4.545,90 6.162,10 5.841,50 7.391,80 9.236
percent of GDP Agriculture 7,74 6,58 10,21 9,86 9,85
Fisheries 0,28 0,23 0,25 0,23 0,21 Other 91,98 93,19 89,54 89,91 89,94
percent Growth rate Agriculture 27,39 1,86 29 6 11,40
Fisheries 9,70 -2,43 -8,72 1,30 3,45 Overall 23,19 13,82 2,39 3,39 3,40
Source: BNA and MINPLAN14; a more complete table is in the appendix
Table 2. Monthly consumer price index (Base: December 2010 = 100)
2012 CPI Accumulated inflation
Inflation last 12 months
January 112,19 0,73% 11,48% February 112,96 1,42% 11,32% March 113,64 2,03% 11,12% April 114,44 2,74% 10,88% May 115,18 3,41% 10,51% June 115,96 4,11% 10,11%
Source: BNA and MINPLAN17

ANGOLA Desk Review October 2012
Famine Early Warning Systems Network 3
Poverty has been improving, albeit not fast enough. According to the Human Development Index report (2011/2012), Angola is ranked 148 out of 187 countries. There has been no change compared to last year’s rankings. However, this is an improvement over 2007-08, when Angola ranked at 162 on the HDI. A third of the population still lives below poverty thresholds of 1.25 USD (29.93 percent) at PPP while 42.4 percent lives with 2 USD a day (PPP).19 According to a causal analysis conducted by the Ministry of Planning in their Strategy to Fight Poverty (ECP), the following factors have been identified as being the main causes of poverty:20
A. The armed conflict; B. The strong demographic pressure in major cities; C. The destruction and degradation of economic and social infrastructure; D. The weak functioning of the education, health and protection sectors; E. The very sharp fall in domestic supply of key products; F. The weakness of the institutional framework; G. A disqualification and depreciation of human capital; H. The ineffectiveness of macroeconomic policies.
These factors are not mutually exclusive. For instance, it is extremely hard to extricate the cause of one from many of the rest. The intensification of the civil war in 1992–2002 meant the government committed many resources to the war effort, neglecting much of the public sector. Extensive minefields hindered agricultural production; destruction of the road network and low security made the supply of food and related goods impracticable. Nutritional status Sources of data on malnutrition include:
• FAOSTAT 2012 • Estratégia Nacional de Segurança Alimentar e Nutricional (2009) • UN Standing Committee on Nutrition • WHO
Chronic malnutrition rates range between 30-40 percent between 2009 and 2011. Reliable sources of data on acute malnutrition since the mid-2000s are not available. However, available data suggests that background rates of global acute malnutrition may range between 5-15 percent and vary by geographic area and season. Health status There are two main health factors influencing food security in the country: malaria and HIV/AIDS. According to Malaria Survey Indicators, malaria is still the leading cause of death, sickness and absenteeism in both work and school.21 This disease accounts for about 35 percent of demand for curative care, 20 percent of hospital admissions, 40 percent of perinatal deaths and 25 percent of maternal mortality.22 Malaria is endemic in all provinces of the country with the highest rate of transmission recorded in the northern provinces (Cabinda, Uige, Malanje, Cuanza Norte, Lunda Norte and Lunda Sul). It is worth mentioning that there usually is an increase of transmission during the rainy season, with a peak between January and May. Similar to the population census, the actual numbers of individuals living with HIV/AIDS is not known. However, estimates by most institutions put the number of adult individuals living with HIV/AIDS at around 2 percent of the total adult population (between the ages of 15 – 49) although it is believed that the rate might be a little higher.23 It is believed that 41 percent of the population lives without access to safe drinking water and 59 percent lives without access to basic sanitation.24 This situation creates a high risk of infections, especially those related to food or waterborne
19 FAO STAT 2012: http://faostat.fao.org/ 20 Estratégia de Combate a Pobreza, Ministério do Planeamento [EN] (2009) 21 Inquérito de Indicadores de Malaria [Malaria Indicators Survey], 2011 22 Programa Nacional de Controlo da Malaria [National Program of Malaria Control], 2010 23 CIA world fact book: www.cia.gov; WHO: FAOSTAT: http://faostat.fao.org/ 24 HDI, ibid.

ANGOLA Desk Review October 2012
Famine Early Warning Systems Network 4
diseases, such as bacterial and protozoal diarrhea, hepatitis A, typhoid fever; and water-contact disease such as schistosomiasis.25 LIVELIHOOD ZONES Livelihoods are defined by common production systems and market access. Livelihood strategies, or sources of food and income, are particular to wealth groups within each livelihood zone. To the best of our knowledge, there are not many studies assessing how these strategies work in Angola. The few studies assessing livelihood strategies are very contextual, thus care should be taken when generalizing characteristics. Agro-ecological regions Angola has three main agro-ecological regions that are closely related to altitude. The relative climatic diversity allows for the growth of crops from tropical to those from relatively more temperate zones.26 A description of each of these areas follows. Selected climacteric maps are presented in the appendix.
North: This region is characterized by a humid tropical climate, with rainfall normally exceeding 1,500 mm/year. Cassava is the main product and covers about 75 percent of the planted area; the rest of the area is used for a mixture of corn, beans, groundnuts and sweet potatoes. Central Plateau: This region is characterized by a mild tropical climate with altitudes between 1,000 and 2,500 m. Rainfall in the Central Plateau is between 1,250-1,500 mm/year, and the average temperature ranges between 18-20 °C. Corn is the predominant crop produced, which is normally intercropped with beans, sorghum or millet, peanuts and sweet potatoes. South: This region is characterized by a dry climate, ranging from tropical desert (Namibe) to a tropical dry area (Cunene) with low rainfall (200 mm/year on average), and has average temperatures between 20-22 °C. The predominant crops in this region are millet, sorghum, cowpeas, and livestock. There is a high proportion of nomadic pastoralists.
In virtually all rural areas, agriculture is the main source of food, except in the south where transhumance livestock predominates. Intercropping is the usual agricultural practice with maize, beans, groundnuts and cassava interspersed in the same field. Due to the climatic characteristics, the main crops in the southern region are millet and sorghum, which cover about 80 percent of the planted area, as well as maize in association with beans, peanuts and sweet potatoes. The persistence of adverse weather conditions over the past three years has tended to worsen food availability. In most regions cropping is carried out three times a year (Table 3). Harvest periods generally follow each other. However, in Central region, the 1st and2nd harvests overlap for 8 – 10 weeks (May, June, and first half of July). The periods during which there is no harvest are:
o North: 2 months (1 month in May; 1 month August/September) o Center: 3 ½ months (August; ½ month in first half of January; and 2 months in March and April) o South: ½ month (first half of January)
Table 3. Sub-national crop harvest calendar
June July Aug Sept Oct Nov Dec Jan Feb March Apr May North
Central South Legend 1st Harvest 2nd Harvest 3rd Harvest
North: Zaire, Uige, Malanje, Cuanza Norte, Lunda Norte, Lunda Sul, and Cabinda Central: Benguela, Bie, Huambo, Moxico, and Cuanza Sul South: Huila, Cunene, Cuando Cubango, and Namibe
Source: 2006 FAO/WFP crop and food supply assessment mission
25 CIA world fact book, found at: https://www.cia.gov/library/publications/the-world-factbook/geos/ao.html 26 World Bank, Angola Investment Climate Assessment (2007): http://siteresources.worldbank.org/INTAFRSUMAFTPS/Resources/ANGOLA_ICA_FINAL1.pdf
ANGOLA Desk Review October 2012
Famine Early Warning Systems Network 5
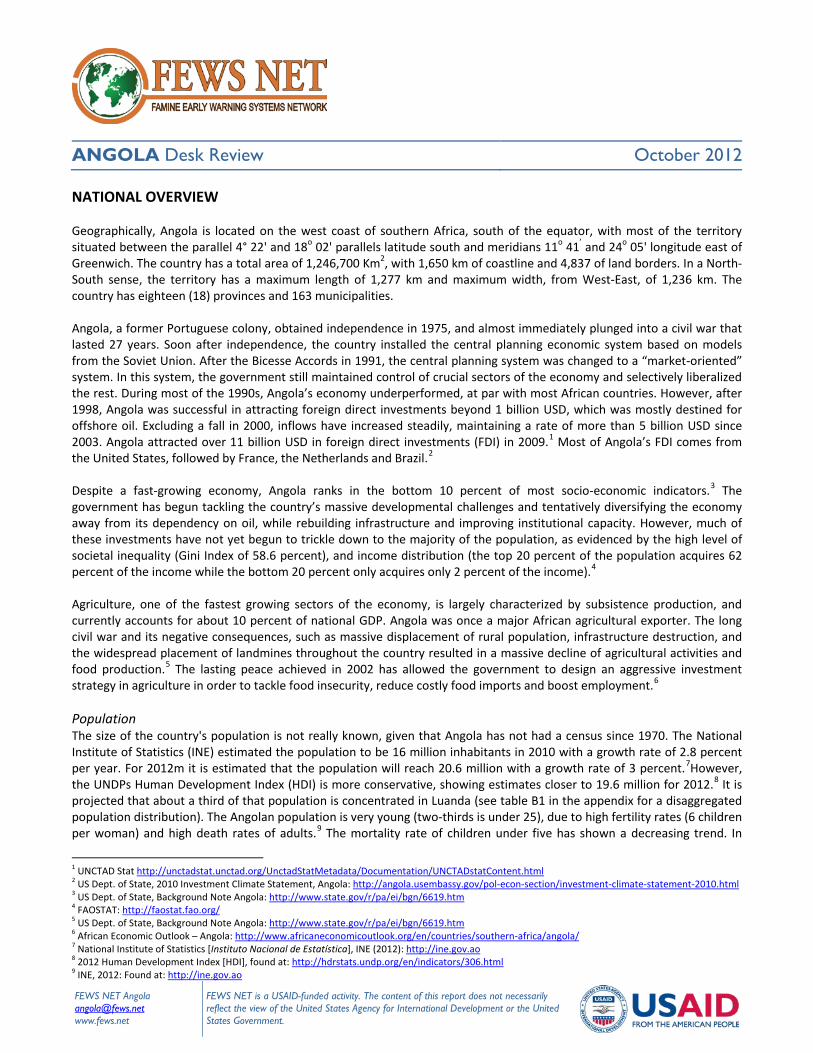
Rural livelihood zones Cunene: The province relies mostly on livestock trade, agricultural production, and informal trade. People in KU1 area rely mostly on livestock and agricultural activity for income, while those in the KU2 area rely mostly on a strong, diversified informal economy supplied by cross border trade with Namibia. Area KU3 and KU4 rely on extensive pastoral livelihoods; employment opportunities are limited (Figure 4).
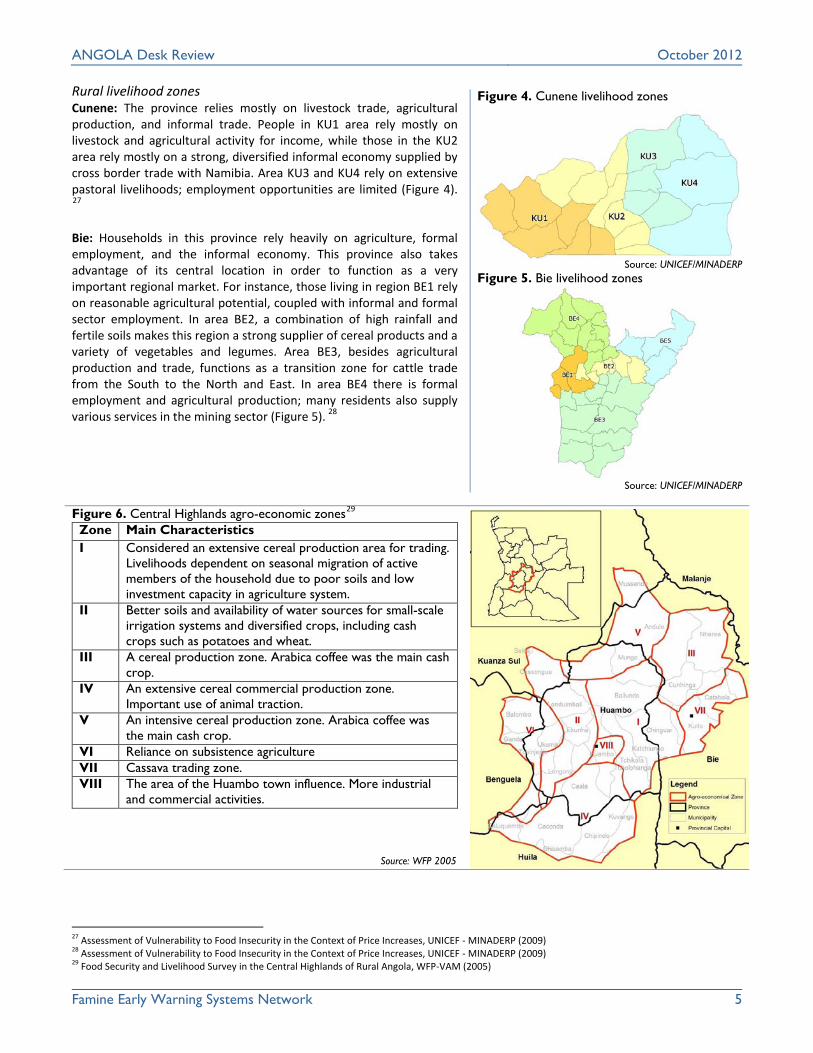
27 Bie: Households in this province rely heavily on agriculture, formal employment, and the informal economy. This province also takes advantage of its central location in order to function as a very important regional market. For instance, those living in region BE1 rely on reasonable agricultural potential, coupled with informal and formal sector employment. In area BE2, a combination of high rainfall and fertile soils makes this region a strong supplier of cereal products and a variety of vegetables and legumes. Area BE3, besides agricultural production and trade, functions as a transition zone for cattle trade from the South to the North and East. In area BE4 there is formal employment and agricultural production; many residents also supply various services in the mining sector (Figure 5). 28 Figure 6. Central Highlands agro-economic zones29
Source: WFP 2005
Zone Main Characteristics I Considered an extensive cereal production area for trading.
Livelihoods dependent on seasonal migration of active members of the household due to poor soils and low investment capacity in agriculture system.
II Better soils and availability of water sources for small-scale irrigation systems and diversified crops, including cash crops such as potatoes and wheat.
III A cereal production zone. Arabica coffee was the main cash crop.
IV An extensive cereal commercial production zone. Important use of animal traction.
V An intensive cereal production zone. Arabica coffee was the main cash crop.
VI Reliance on subsistence agriculture VII Cassava trading zone. VIII The area of the Huambo town influence. More industrial
and commercial activities.
27 Assessment of Vulnerability to Food Insecurity in the Context of Price Increases, UNICEF - MINADERP (2009) 28 Assessment of Vulnerability to Food Insecurity in the Context of Price Increases, UNICEF - MINADERP (2009) 29 Food Security and Livelihood Survey in the Central Highlands of Rural Angola, WFP-VAM (2005)
Figure 4. Cunene livelihood zones
Source: UNICEF/MINADERP
Figure 5. Bie livelihood zones
Source: UNICEF/MINADERP

ANGOLA Desk Review October 2012
Famine Early Warning Systems Network 6
Urban and peri-urban livelihood zones Moxico: Many living in the urban area (highlighted in blue) are engaged in formal employment as the main source of livelihood support. Even among households employed in the public sector, agriculture is a significant source of food and income due to irregularities in wage payments (Figure 7). 30 Luanda: This is the economic center of the country, therefore the population living here has more livelihood options. Households living in LD1 (and LD4) area rely on a strong informal economy sector and formal and informal employment. The LD2 area is a rapidly growing employment center with high volumes of informal trade in food, agricultural, and industrial goods. The LD3 area functions as a transition zone from rural to urban; informal markets are weaker than in LD1 and LD4 due to lower population density; many households still practice some agriculture (Figure 8). 31 Poor household income There is also a marked lack of adequate income safety nets, such as savings, which compounds food price increases. According to IBEP 2011, the common Angolan citizen spends on average AKZ 6,449 per month on food consumption, non-food, and comfort. Of this amount, AKZ 3,675.93 (57 percent) is directed to the needs of food consumption and non-alcoholic beverage, which is below the national poverty line estimated total of AKZ 4,793. The IBEP may have some income data aggregated by province. Main foods consumed by the poor The National Food Security Strategy (2009) has found that poor households’ food consumption patterns may be variously classified as very poor, poor, moderately good, and good (Table 9). AGRICULTURE Angola has a land area of 124 million hectares (ha). It is estimated that 35 million ha are potentially arable, of which 30 million ha is yet to be put into production. The remaining 5 million ha have been previously cleared and cultivated in rotation cultivation. Out of this vast potential area for cultivation, only 2.5 million ha are estimated to be currently in use.32 Access to land is governed by relatively ‘new’ property rights legislation established by the Land Law No. 9/04. Its article 12 states that all land is a property of the state. The state alone is responsible for establishing the conditions under which land can be alienated, while protecting the country’s national interests and development.33 For large scale enterprises, the most common procedure is to lease the land for limited (45 years) or long-term (99 or more) periods.34 A future investor has to
30 Joint Program on Children, Food and Nutritional Security in Angola, UNICEF (2012) 31 Assessment of Vulnerability to Food Insecurity in the Context of Price Increases, UNICEF - MINADERP (2009) 32 National Investment Brief Angola, High-Level Conference on Water for Agriculture and Energy in Africa (2008): http://www.sirtewaterandenergy.org/docs/reports/Angola-Draft2.pdf 33 USAID Land Tenure and Property Rights Portal, Angola Country Profile: http://usaidlandtenure.net/usaidltprproducts/country-profiles/angola/angola-country-profile/view?searchterm=angola 34 FAOLEX: http://faolex.fao.org/docs/pdf/ang49570.pdf
Figure 7. Moxico livelihood zones
Source: UNICEF
Figure 8. Luanda livelihood zones
Source: UNICEF/MINADERP
Table 9. Food consumption groups and their dietary characteristics for poor households in Angola
Food consumption
Description of the basic diet
Very poor Cereals used as the only basic food Vegetables
Poor Cereals, other food items, sugar/salt e vegetables or Tubers, sugar/salt, oil, vegetables and fish or Cereals, sugar/salt, vegetables and oil
Moderately good
Cereals, dairy products, sugar/salt, and oil or Cereals, fish, oil, sugar/salt, meat
Good Cereals, sugar/salt, oil, beans and vegetable or Cereals, sugar/salt, oil, tuber, meat and vegetables or Cereals, sugar/salt, oil, vegetable, fish and others
Source: adapted from National Food Security Strategy, 2009

ANGOLA Desk Review October 2012
Famine Early Warning Systems Network 7
provide proof of his/her ability to develop land efficiently and must offer guarantees to the people who originally lived on and cultivated it. This law is really important for those who want to invest in large scale farming business and are either foreigners or foreigners in partnership with locals. For local smallholder farmers, the law provides rural residents with a space to live and produce, but for subsistence purposes. Access to land for cultivation is still governed by the law mentioned above, but in rural areas, customary laws have a very important role: lands are ceded for cultivation by either the traditional leader or passed down as inheritance, which are then approved by formal institutions.35 Commercial farming came to a halt during civil war, and even own-production was dramatically reduced. The cessation of hostilities has permitted the resumption of activities and investments in the agricultural sector by both family-owned (99.75 percent of production units) and investor-owned firms (0.25 percent of production units).36 Currently, there is limited use of mechanization, with most farmers practicing subsistence agriculture and relying mostly on family labor, hand tools for land preparation and weeding, and planting local seeds held over from the previous harvest. There is very low use of fertilizers or pesticides in this type of production. In the provinces of Huambo and Bie, Benguela area and Huila, many subsistence farmers use animal traction as well. The national average cultivated area per family-owned farm is 1.5 ha. There are two major agricultural seasons; even though some regions might have a smaller third season (see chart below). The main planting season accounts for about 95 percent of the total production of cereals, legumes and tubers, which are also the major food crops: cereals (maize, sorghum, millet and rice), legumes (beans and peanuts), roots and tubers (cassava, sweet potato, yam and potato). The second season, also called the Nacas season, occurs in low-lying depressions. This season accounts for about 5 percent of the national production of cereals and legumes. The production of vegetables and sweet potatoes is also very important in the Nacas season. The government has embarked on an ambitious agricultural development program, using international credit lines to finance large investments. These credit lines are being secured chiefly from China, Brazil, Israel, South Korea, Spain and Germany.37 As of 2012, total credit financing was valued at 197,072,649 USD.38 However, given that most of these investments are in their inception stages, it is still too early to assess their impact on food supply (and thus food security) in the country. A table summarizing the estimated total production of the 2010/2011 season from the Ministry of Agriculture’s statistical service is presented in the Annex. Agriculture value added in 2009 was 7,702 million USD, an increase from the 2006 value of 4,018 million USD.39 Livestock The livestock sector is characterized by the existence of two large sectors: a) a young mid- to large-scale commercial sector and b) the artisanal sector, catering mostly for income and consumption smoothing among agropastoral families. The latter is predominant in the South (Cunene, Huila, Cuando Cubango and Namibe), part of Benguela, and in central Cuanza Sul. There are no current records on existing animal population, but estimates based on the number of herds vaccinated suggest that there are approximately 4 million cattle, 2.5 million pigs, 300,000 sheep and 4 million goats.40 The majority of cattle in Angola are of the indigenous breed, with low dairy productivity but resistant to local conditions. The introduction of exotic breeds hasn’t been successful so far. Currently, commercial milk production is concentrated in the region of Huila, Cunene, Cuanza Sul and Namibe, while traditional producers of milk are mostly found in south of Huila, Namibe and Cunene, and the Southwest of Angola. Current production levels do not meet the country’s needs and are far below their potential levels.41 Traditional poultry farming is of great importance for the country as it constitutes an important source of income and animal protein of high value. These birds are hardy, smaller, of slow growth rate, and of lower egg production, as compared to commercial breeds. Currently, there are no actual records of how many birds there are in the country. 35 FAO Land tenure support: http://www.fao.org/docrep/007/y5639t/y5639t0a.htm 36 Relatório da Campanha Agrícola [2010/2011 National Agricultural Report] 2010/2011 37 Ministry of Agriculture, Rural Development, and Fisheries [MINADERP], Plano Director 2010 – 2015; CIA, World fact book, ibid. 38 Ministry of Finance; found here 39 FAOSTAT, ibid. 40 National Food Security Strategy [NFSS] report 41 NFSS, ibid.

ANGOLA Desk Review October 2012
Famine Early Warning Systems Network 8
MARKETS AND TRADE The basic market environment The large investments flowing to the country have facilitated the resurgence of the large supermarket chains and small, neighborhood grocers in most major cities. However, it is important to note that these markets are supplied almost exclusively with processed, imported foods. Again, more than a third of Angola’s population is based in Luanda alone, with more in other major cities. The discussion here will focus mostly on what is commonly known as ‘informal’ or ‘agricultural’ markets due to their preponderance in urban and rural areas and importance in carrying consumer goods found in diets of most Angolans, particularly the poor. Important food commodities There are regional differences on important food commodities. The staple food of the northern region is cassava and its derivatives. This region produces, in addition to cassava, coffee, rice, yam, sweet potato and legumes. The southern region of the country bases its diet on corn and its derivatives. This region produces, in addition to corn, sorghum, millet, beans, potatoes, and peanuts. Market supply Food stocks There are no reliable sources of data regarding food stocks. Crop stocking is more developed and effective in commercial farming, such as those producing potatoes in the central plateau. Commercial farmers may build or rent adequate storage facilities and reduce post-harvest losses compared to subsistence farmers. Farmers producing cassava tend to store the crop on the ‘ground’, i.e., they only harvest the quantities needed at the moment, leaving the rest on the ground. Some subsistence farmers tend to rent places for storage for a daily fee. However, the majority of these storage facilities are of low quality. Alternatively, some smallholders prefer keeping their savings in cash in order to help meet their needs all the way through the next harvest, even if they must buy back food at higher prices during the lean season. Farmers living near alluvial soils or along river banks have a relatively stronger food stocking strategy, which enables them to smooth consumption better for longer periods. Their strategy is highly dependent on the mid-cropping season, which reduces the length of the lean season. Their stocks are usually able to smooth consumption through the lean season to the Nacas season. Those not able to stock food for longer periods tend to rely on informal loans or gifts from family and friends to meet essential food and non-food needs. Cross-border trade Angola is a net food-importing country and cross-border trade is a very important part of this equation, even though the import bill has been decreasing.42 The most developed cross-border trade is in the southern part of the country. Angola is a member of the Southern Africa Development Community (SADC) and signed bilateral investment treaties with South Africa in 2005.43 Under the auspices of these treaties, there has been increasing cross-border trade. However, the trade coming from the southern countries (Namibia and South Africa) is mostly in the processed foods category, and it is mostly one directional: towards Angola. Angolan exports to these countries are over 90 percent petroleum products. Most of the imported processed food products are destined for supermarkets. However, there are some products, such as maize meal and rice, which are sold wholesale to vendors who then distribute into markets all over the country. Trade in the northern region (between Angola and DRC) has been interrupted since 2009 due to diplomatic disagreements and an increasing military presence. In the western part of the country, trade is set to increase due to the recommencement of railway services between Benguela (in the east) and border with Zambia in the west. Other major trading partners for agricultural and food commodities are the European Union, Brazil, and the USA. Angola is an eligible member of the EU’s Everything But Arms Initiative and the United States' market access initiative for Africa (the African Growth and Opportunity Act – AGOA). Angola has signed customs cooperation agreements with Portugal and Sao
42 FAO STAT, ibid. 43 http://www.info.gov.za/speeches/2009/09081709451003.htm

ANGOLA Desk Review October 2012
Famine Early Warning Systems Network 9
Tome and Principe and is in discussions with South Africa, the Community of Portuguese Speaking States (CPLP), Namibia and Zambia for similar agreements. Once in place, these agreements may alter the balance of cross-border trade. The total value of all agricultural imports between 2008-2010 has ranged from 2.1 billion to 2.6 billion USD. The largest shares of agricultural import value are chicken meat, wheat flour, barley for beer, soybean oil and wine. Wheat flour and rice imports comprise nearly the entirety of cereal imports in Angola. Wheat flour imports were relatively stable between 2008-2010 (500,000-550,000 MT). Rice imports typically range between 200,000-280,000 MT since 2004. However, rice imports spiked to more than 400,000 in 2008. Total cereal imports also peaked in 2008 (Table 4). Agricultural export value ranged between 9.3 -11.9 million USD between 2008-2010. The main agricultural exports in terms of value are palm oil, green coffee, millet, unmanufactured tobacco and tea.44 Market centers The recent policy of restricting traffic of large trucks through Luanda has naturally created two main informal markets within Luanda for agricultural produce: the ‘Panguila’ market in the northeastern part of the city and the ‘Morro Bento’ market in the southwest part of the city.45 In the provinces, major informal markets are being gradually moved away from the city centers; however, each capital city has at least one large ‘informal’ – redistributor – market. In the provinces, large informal markets function as retail, wholesale, and assembly markets. 46 In the northern region, Malanje is a very important market center. Individual bulking agents collect produce (e.g., cassava, sweet potatoes, and vegetables) from producers around the province and bring it to the main informal market in town, which is sold wholesale to other vendors. In the center-north region, the Sumbe and Gabela towns are very important market centers for potatoes, horticultural produce, and beans. Besides their own production, these towns provide an informal trading post for smallholder farmers/vendors. In the center-south, Huambo, Cutato and Camacupa (in Bie province), are very important centers for corn, beans, millet, sorghum, and potatoes. Cutato functions as an assembly market for those smallholder farmers living in the region and it works only on weekends. Market channels Luanda is the undisputed market center of the whole country. However, roughly 99 percent of the products supplied to the markets do not originate from Luanda. As should be expected, most middlemen and other bulking agents going around the country acquiring commodities for sale have Luanda as their final destination.47 The Panguila market is served by those bringing products from the northern region, and the Morro Bento market is served by those bringing products from the southern region. The Malanje city center market is a very good supply center for the Lunda Norte, Lunda Sul, and northern Moxico markets. In the center-north region, Sumbe and Gabela supply Malanje and Luanda markets.48 Smallholders either transport their produce to Sumbe (or Gabela) or sell it to bulking agents who, in turn, take these commodities to either Luanda or Malanje via Gabela. In the center-south, most of the agricultural produce comes from the rural areas Huambo and Bié, which supplies (Huambo city, Kuito [Bié], Menongue [Cuando Cubango], Benguela, and Luena [Moxico]). There are middlemen coming from as far as Luanda to acquire products for sale from these main regional markets.49 Livestock comes mostly from Cunene, Huila and parts of Benguela and Namibe. The trade of cattle goes across borders as well – to Namibia, where animals usually sell for higher prices. Some middlemen, with the exception of those intending to supply Luanda, walk their animals from the southern part of the country to regional markets. 44 FAO STAT, Ibid. 45 UNICEF (2009) Vulnerabilidade à Insegurança Alimentar no Contexto da Alta de Preços: Analise dos meios d e sustento e economia alimentar dos agregados familiares, Luanda: Angola 46 MOSAP, ibid. 47 MOSAP, ibid. 48 Ministry of Agriculture 2010-11 production season report. 49 MOSAP, ibid.
Table 4. Key food exports, imports in MT
2008 2009 2010
Cassava equivalent export
18 18 18
Cassava equivalent import
170 345 30
Cereal export
503 503 503
Cereal import
940,101 818,091 784,769
Source: FAOSTAT

ANGOLA Desk Review October 2012
Famine Early Warning Systems Network 10
Physical market infrastructure The government has been making a push to reduce the proliferation of informal markets with poor conditions in all major city centers of the country. For instance the main informal market in Luanda – Roque Santeiro – has been totally dismantled and moved more than 20 miles out of the city, where an improved infrastructure was built for the vendors. The same approach is being followed in most major city centers throughout the country. Rural areas are not benefiting from these upgrades. Whichever the market type, some crucial infrastructure is missing. For instance, no market offers specialized storage options, e.g., cold storage or bulk storage, thus leaving vendors with very limited options to reduce post-harvest losses. With the exception of the Luanda market, most do not have running water. Transportation infrastructure The main access roads are being rehabilitated, thus tentatively improving the circulation of goods from the supply areas to the consumption centers. However, the connecting roads from rural areas, where most production is carried out, are still in poor condition. The main national road network consists of about 16,300 km of road, of which about 9,000 are paved. The government has a very active program of rehabilitating and building other main connecting roads. According to the government program of national infrastructure overhaul, secondary roads are slotted for improvement at a later stage. There are 60,000 km of secondary, unpaved roads of which approximately 60 percent are in disrepair.50 Credit The evolving formal rural credit market started in 2010, when the government identified the need to implement a micro-credit program aimed at fomenting rural commerce.51 Under this program, selected ‘potential’ traders, living in rural areas, are provided with credit in order to acquire goods produced by local smallholder farmers and trade it in the region. However, inefficiencies in credit provision led to a temporary halt of the program. For instance, the criteria for selecting ‘potential’ traders were not clearly defined; the financial terms of the credit were not clearly understood; often there was no contextual investment, i.e., traders acquired goods not usually consumed by local residents. Additionally, traders did not have the necessary know-how to understand the issues involved in managing credit. A relatively newer variant of micro-credit disburses goods to traders instead of cash. Any national citizen can apply for this credit. Under this program, a potential trader brings a pro-forma bill to a lending institution specifically set up for this purpose (called BUE – Balcão Único do Emprendedor). After approval, a deposit is made on the commercial institution’s account allowing the trader to purchase the goods.52 As of August 2012, the program had a lending ceiling of a million Cuanzas (10,000 USD).53 The program is currently in moratorium. Informal credit use is fairly common. Anecdotal evidence points to social networks as the most common source. Income obtained in this type of credit is mostly used to smooth consumption and only rarely used for production or commerce. Interest rates upwards of 50 percent are common. Market associations Soon after independence, the government introduced a Soviet Unionstyle agriculture cooperative production system. These institutions had “farmer unions” that functioned as market and marketing associations in one. Inefficiency issues and regime change obviated the existence of these institutions. Very few, if any, are currently left. With regard to the quality and quantity of products supplied (mostly in formal institutions such as supermarkets, convenience stores, and large warehouses) the Ministry of Commerce is in charge of regulating this activity. Informal markets have spontaneous origins and almost all vendors function as individual units. There are no current, active informal market associations. Market performance Informal discussions with government and non-government market analysts suggest that markets are underperforming in the provision of agricultural products due to occasional bottlenecks in the in the movement of goods throughout the country. Additionally, markets are not regulated, a situation that encourages rampant speculation in the commercialization of products. There is also an added element of price negotiation: prices are never certain for consumers and producers, a
50 Instituto Nacional de Estradas de Angola (INEA) [Angolan National Institute of Roads],2010 51 MOSAP, ibid. 52 ANGOP: http://www.portalangop.co.ao/motix/pt_pt/noticias/economia/2012/4/20/Governador-Luanda-inaugura-balcao-unico-empreendedor-Cazenga,20e753dc-bae8-473f-bb4b-6755d032202d.html 53 ANGOP – AngolaPress: www.portalangop.co.ao
ANGOLA Desk Review October 2012
Famine Early Warning Systems Network 11
fact that affects product prices and consequently profits. These limitations have the final effect of constraining product supply in the market, affecting consumers, who have to live with high prices and oligopolistic supply sources. Supply lines The war caused enormous damage to the infrastructure in the country. The main national road network consists of about 16,300 km of road, of which about 9,000 are paved. There are 60,000 km of secondary, unpaved roads of which approximately 60 percent are still broken or in disrepair.54 The majority of small-scale producers live in rural areas served by these secondary roads; very few traders have the means to acquire specialized trucks adapted for these conditions, leading to oligopolistic market conditions. Weak demand The policy of moving informal trade, especially municipal and provincial agricultural markets, away from city centers puts unnecessary difficulties on customers’ access to markets, increasing the cost of goods. Customers also may carry fewer goods due to the distance they must travel. All of this might result in lower demand. As a result, some vendors are selling only at times when there is high probability of having clients, such as on the weekends. Post-harvest losses Even though some stocking of produce occurs, the storage facilities used for this activity are in poor or inadequate condition, which leads to a high volume of losses. Thus, smallholder producers/vendors tend to sell their produce very quickly at harvest time before it loses quality. The implication is that they then receive low prices for their produce. High transaction costs particularly for producers Most smallholder farmers do not have transport to carry all their production to the markets. Therefore, they either have to store large quantities and transport small quantities, or rely on middlemen who charge exorbitant prices for the transport of merchandise. Secondly, there is no efficient price discovery process. Those farmers who cannot take their produce to the market usually undersell their produce to bulking agents given that they do know the prevailing market prices. Opportunistic behavior Vendors are being charged a daily fee for the right to sell. Most do not make nearly enough to afford paying these fees daily. Thus, most adopt myriad strategies that are either disruptive or less efficient to the marketing activity. For instance, some prefer to sell only a few days per week to save on costs; others prefer selling in places that are not very well organized in order to avoid paying these fees. City inspectors do not enforce the law of removing these vendors from the makeshift markets. Household purchasing power Households’ purchasing power has been closely related to food prices practiced in many markets. High food prices pose a major threat to food security.55 By having limited sources of income, recent food price increases have reduced the quantity and quality of food consumed. The impact of high prices has fallen heavily on the poor, especially single-parent households. Poor dietary diversity limits the effectiveness of substitution to cope with price increases, i.e., price increases in one staple cannot easily be compensated by a switch to other foods. FOOD INSECURITY Until 2006, there was a multi-sector task force in charge of the assessment of relative food insecurity risks (called “vulnerability levels”) in the country. This group was led by the WFP and the Ministry of Agriculture with the participation of other governmental sectors and various NGOs then operating in the country. Their latest analysis, published in 2007, used a specially designed scale in order to characterize the population groups at greatest risk of food insecurity. They had four general groupings: 1.High; 2. Moderated; 3. Low; and 4. Minimum. The characteristics of each population group and the provinces with higher proportions of that particular type of population are presented below:
• High - a) generally low agricultural productivity due to excessive rainfall, poor soils, poor agricultural practices without agricultural inputs; b) poverty, few non-labor productive assets at the domestic or household level; c)
54 Instituto Nacional de Estradas de Angola (INEA) [Angolan National Institute of Roads],2010 55 FAO STAT, ibid.

ANGOLA Desk Review October 2012
Famine Early Warning Systems Network 12
greater risk sensitivity;56 d) few options for income diversification; and f) localized high population density, resulting in limited access to agricultural land. Examples were the Central Highlands (Huambo, Huila northern and parts of Bie);
• Moderate – a) lack of access to services and basic infrastructure; and b) few options for diversification of income due to limited opportunities for casual labor. Examples were the provinces of Moxico, Cuando-Cubango, and parts of Bie;
• Low – a) large influx of recent returnees; and b) little access to basic services. • Minimum – a) localized pockets of isolated population groups at risk of food insecurity; b) fairly good access to
markets and services; and c) relatively good income diversification. Examples were the provinces of Bengo, Cuanza-South, Uige, Benguela, and Huila.
The main population groups identified as at risk of food insecurity in all of these areas were the following:
• Internally Displaced Persons (IDPs), including families who have left their areas of origin; • Returnees, including former IDPs or former refugees who returned to their areas of origin; • Resettled, including former IDPs or former refugees who were settled in their areas of origin; and • Vulnerable social groups, including elderly, women, orphans and widows of war, ethnic minorities, poor farmers,
children, and disabled persons. The Survey of Vulnerability to Food Insecurity conducted in 2005/2006 by the Unit of Analysis and Assessment of Vulnerability of the WFP (VAM/WFP) reveals that the end of 2004, 2005, and parts of 2006 were periods of high risk of food insecurity due massive IDP flows. Their results show that 19 percent of the population was food insecure, 30 percent “highly vulnerable", 19 percent “moderately vulnerable” and 32 percent in “low vulnerability”.57 Another survey conducted in the southeast, in October 2005 by the same group, shows a high concentration of “vulnerability” between 25-60 percent of households in the provinces of Bie, 15-40 percent in Huila and Cuando Cubango, and low vulnerability (0-15 percent) in Namibe and Cunene.58 Data indicated the existence of food insecurity in the Central Highlands, which can be explained by the poor soil quality and great pressure on natural resources in the period in which the work was performed. A possible reason for high pressure on natural resources, mostly deforestation, might have been the high concentration of IDPs in a small, localized place due to the redistribution of the population. In 2011/12 a technical team of the Ministry of Agriculture made food security recommendations by assessing the effects of prolonged drought that affected some regions the country. This team evaluated the agricultural production of eleven of the eighteen provinces of the country, namely Uige, Bengo, Benguela, Cuanza Sul, Malanje, Cuanza Norte, Bie, Huambo, Huila, Namibe and Cunene, in the first trimester of 2012. Livelihoods and market assessments were not a part of this study. The team concluded that there was extensive damage to first-season crops in the 2011/12 agricultural year as a result of prolonged drought, which might lead to shortages of local food production. The provinces in the study are the highest producing areas of the country, and low production might negatively affect national food availability. This technical team has recommended measures to reduce the effects of drought on both a) the cropping season; and b) population food security. In summary, these measures are:
- Develop a phased, multi-year water reservoir construction project across the country, starting with the critical areas and semi-arid areas and extend to other regions; and
- Establish official food reserves through mobilization of the formal commercial network. In order to reduce the impact of this prolonged drought on the population, they have recommended the following plan of action:
- Food assistance intended for families in extreme need, totaling 366,780 people distributed in the following provinces: Bengo (8,670); Benguela (87,280) Cunene (38,000); Huila (101,290); Cuanza Sul (107,900); Namibe (11,700); Zaire (11,940);
- Provide agricultural inputs to the most-affected families. This action includes distribution of seeds and fertilizers to a total of 73,356 families affected in seven provinces, namely Bengo (1,734), Zaire (2,388), Cuanza Sul (21,580), Benguela (17,456), Huila (20,258), Namibe (2,340) and Cunene (7,600);
56 This is roughly defined as the capacity for higher risk due to susceptibility (innate biological factors) and differences in exposure. http://www.hesiglobal.org/i4a/pages/index.cfm?pageID=3511 57 FAO/WFP joint mission, ibid 58 VAM in WFP/Luanda, 2007

ANGOLA Desk Review October 2012
Famine Early Warning Systems Network 13
- Provide small-sized power inputs: acquire and distribute 700 water pumps to affected smallholders. Food aid The protracted civil strife increased the size of the population at risk of livelihood protection or survival deficits and requiring assistance to obtain basic goods. From 1994 onwards, the government started supporting the victims of the conflict and natural disasters, as well as specific social groups, with the help of the international community, particularly the World Food Program (WFP). With the onset of peace in 2002, many internally-displaced people returned to their areas of origin. Of the 4 million displaced, approximately 1.9 million received direct food assistance by the end of 2002.59 The number of people assisted increased dramatically in 2003 due to the inclusion of those people previously living in UNITA-controlled. The involvement of government partners in food assistance has been decreasing since the end of 2003 due to the government decision, in 2004, to stop all emergency assistance and start ‘development’ assistance programs. According to MINARS, after the transition, humanitarian assistance consisted of securing and distributing food and non-food items, with emphasis on food items to the groups at greatest risk of food insecurity. WFP provided most of this assistance through food-for-work and food-for-assets. These programs were phased out in mid-2006. As of 2009, food aid had been limited to situations such as providing school lunches, helping the health sector and the victims of natural disasters (Table 3).60
59 Ministry of Assistance and Social Reintegration (MINARS)’ report on humanitarian assistance. 60 IBEP, ibid.
Table 3. Estimated number of assistance beneficiaries
Year Beneficiaries 2002 1,860,000 2003 5,165,518 2004 1,079,002 2005 559,143 2006 742,929 2007 1,412,498 2008 1,571,132 Source: National Food Security
Strategy, 2009

ANGOLA Desk Review October 2012
Famine Early Warning Systems Network 14
ANNEX A. POLITICAL MAP

ANGOLA Desk Review October 2012
Famine Early Warning Systems Network 15
ANNEX B. CLIMATOLOGY MAPS Angola: Contour map of average rainfall in mm per year
Angola: Contour map of average air temperature in degrees Centigrade
Source: National Irrigation Plan (PLANIRRIGA), progress report # 2. (2010)
Angola: Contour map of reference evapotranspiration levels in mm per year
Angola: Average cultivated area per household per municipality
Source: National Irrigation Plan (PLANIRRIGA), progress report # 2. (2010)

ANGOLA Desk Review October 2012
Famine Early Warning Systems Network 16
APPENDIX C. POPULATION
Province Population Malaria (%) Water (%) Power (%) Sanitation (%) Luanda 5,851,161 19 52 84 90 Lunda Norte 770,252 15 16 24 31 Lunda Sul 387,060 6 7 18 38 Benguela 1,985,415 12 46 29 35 Moxico 565,020 21 17 12 56 Cuando Cubango 394,400 5 25 10 24 Bie 1,143,709 7 40 9 67 Malanje 745,641 16 52 23 45 Cunene 648,374 16 25 21 18 Huila 2,097,961 24 56 32 46 Namibe 367,966 23 44 32 27 Huambo 1,624,000 11 39 15 79 Cuanza Sul 1,353,828 18 31 13 32 Cuanza Norte 376,883 21 46 23 39 Bengo 351,544 13 14 29 52 Uige 1,101,199 25 31 15 57 Zaire 394,822 42 39 33 47 Cabinda 441,059 42 59 60 84
Notes: Malaria percent indicates percent of households with at least one person with malaria; Water percent indicates percent of households who use appropriate sources of potable water; Power percent indicates percent of households who use power from the national grid; Sanitation percent indicates percent of households who use appropriate sanitation.
Source: INE, 2012

ANGOLA Desk Review October 2012
Famine Early Warning Systems Network 17
ANNEX D. ESTIMATED AGRICULTURAL PRODUCTION IN ANGOLA IN METRIC TONS FOR 2010/11
EAF EAE TOTAL EAF EAE TOTAL EAF EAE TOTAL EAF EAE TOTALCEREAIS 980.369 197.579 1.177.948 1.169.267 239.559 1.408.826 19,3 21,2 19,6 188.898 41.980 230.878Milho 885.849 186.891 1.072.740 1.037.684 224.538 1.262.222 17,1 20,1 17,7 151.835 37.647 189.482Massamgo 39.000 1.722 40.722 58.260 2.966 61.226 49,4 72,2 50,4 19.260 1.244 20.504Massambala 45.649 1.139 46.788 60.701 1.468 62.169 33,0 28,9 32,9 15.052 329 15.381Arroz 9.871 7.827 17.698 12.622 10.587 23.209 27,9 35,3 31,1 2.751 2.760 5.511Trigo 0 0 0 0 0 0 0,0 0,0 0,0 0 0 0RAIZES E TUBÉRCULOS 14.447.398 1.239.125 15.686.523 14.901.817 1.318.048 16.219.865 3,1 6,4 3,4 454.419 78.923 533.342Mandioca 12.997.368 861.313 13.858.681 13.416.356 917.153 14.333.509 3,2 6,5 3,4 418.988 55.840 474.828Batata rena 539.874 301.405 841.279 529.660 311.592 841.252 -1,9 3,4 0,0 -10.214 10.187 -27Batata doce 910.156 76.407 986.563 955.801 89.303 1.045.104 5,0 16,9 5,9 45.645 12.896 58.541LEGUMINOSAS E OLEAGINOSAS 338.869 32.399 371.268 430.269 42.111 472.380 27,0 30,0 27,2 91.400 9.712 101.112Feijões 223.072 26.945 250.017 270.672 32.849 303.521 21,3 21,9 21,4 47.600 5.904 53.504Amendoim 112.107 3.057 115.164 155.158 5.958 161.116 38,4 94,9 39,9 43.051 2.901 45.952Soja 3.690 2.397 6.087 4.439 3.304 7.743 20,3 37,8 27,2 749 907 1.656FRUTAS 1.878.797 878.724 2.757.521 2.351.636 1.037.357 3.388.993 25,2 18,1 22,9 472.839 158.633 631.472Bananeira 1.332.175 715.780 2.047.955 1.767.740 878.333 2.646.073 32,7 22,7 29,2 435.565 162.553 598.118Citrinos 199.806 47.793 247.599 221.686 51.252 272.938 11,0 7,2 10,2 21.880 3.459 25.339Mangueira 54.176 48.119 102.295 61.548 33.549 95.097 13,6 -30,3 -7,0 7.372 -14.570 -7.198Ananás 249.997 63.368 313.365 255.869 70.483 326.352 2,3 11,2 4,1 5.872 7.115 12.987Abacateiro 42.643 3.664 46.307 44.793 3.740 48.533 5,0 2,1 4,8 2.150 76 2.226HORTÍCOLAS 3.831.236 898.031 4.729.267 4.215.558 972.448 5.188.006 10,0 8,3 9,7 384.322 74.417 458.739Alho 1.047 5.652 6.699 1.711 5.157 6.868 63,4 -8,8 2,5 664 -495 169Cebola 817.390 164.188 981.578 866.896 189.272 1.056.168 6,1 15,3 7,6 49.506 25.084 74.590Tomate 1.267.453 295.987 1.563.440 1.442.281 316.797 1.759.078 13,8 7,0 12,5 174.828 20.810 195.638Repolho 860.492 218.464 1.078.956 943.201 228.142 1.171.343 9,6 4,4 8,6 82.709 9.678 92.387Cenoura 273.254 29.151 302.405 334.622 32.426 367.048 22,5 11,2 21,4 61.368 3.275 64.643Pimento 183.483 26.236 209.719 195.351 28.847 224.198 6,5 10,0 6,9 11.868 2.611 14.479Outras hortícolas 428.117 158.353 586.470 431.496 171.807 603.303 0,8 8,5 2,9 3.379 13.454 16.833CAFÉ E PALMAR 8.110 1.841 9.951 8.768 1.990 10.758 8,1 8,1 8,1 658 149 807Café 8.110 1.841 9.951 8.768 1.990 10.758 8,1 8,1 8,1 658 149 807Palmar .. .. .. .. .. .. .. .. .. .. .. ..
Fonte: GEPE do MINADERP-RCA/2010/2011
PRODUÇÃO (Em Toneladas)CULTURA 2009/2010 2010/2011 VARIAÇÃO PERCENTUAL
(%)VARIAÇÃO ABSOLUTA
Notes: EAF – Exploração Agrícola Familiar (Family-owned Farm) EAE – Exploração Agrícola Empresarial (Investor-owned Farm) GEPE – Gabinete de Estudos, Planeamento, e Estatística (Office of Studies, Planning, and Statistics) MINADERP – Ministério da Agricultura, Desenvolvimento Rural e Pescas (Ministry of Agriculture) RCA – Relatório da Campanha Agrícola (Agricultural Season’s Report)

ANGOLA Desk Review October 2012
Famine Early Warning Systems Network 18
ANNEX E. ANGOLAN GROSS DOMESTIC PRODUCT, 2007-2011
GDP TYPE 2007 2008 2009 2010 2011
General (in billions of AOA) Agriculture 351,80 405,60 596,50 729 909,60 Fisheries 12,60 13,90 14,50 16,90 19,60 Diamonds and other 80,40 66,10 53,70 71,10 71,80 Oil 2.537,20 3.569,40 2.661,60 3.395,90 4.346,90 Transforming industry 241,20 303,10 363,80 464,20 539,70 Construction 224,10 318,60 449,60 601,60 714,80 Energy 3,80 5,40 7,40 9,50 12,30 Services 768,80 1.104,10 1.240,40 1.555,10 1.956,70 Others 326 375,90 454 548,20 664,70 TOTAL 4.545,90 6.162,10 5.841,50 7.391,80 9.236,00 Percent contribution to GDP Agriculture 7,74 6,58 10,21 9,86 9,85 Fisheries 0,28 0,23 0,25 0,23 0,21 Diamonds and other 1,77 1,07 0,92 0,96 0,78 Oil 55,81 57,92 45,56 45,94 47,06 Transforming industry 5,31 4,92 6,23 6,28 5,84 Construction 4,93 5,17 7,70 8,14 7,74 Energy 0,08 0,09 0,13 0,13 0,13 Services 16,91 17,92 21,23 21,04 21,19 Others 7,17 6,10 7,77 7,42 7,20 Percent growth rate Agriculture 27,39 1,86 29 6 11,40 Fisheries 9,70 -2,43 -8,72 1,30 3,45 Diamonds and other 2,69 -8,19 4,63 -10,28 -3,26 Oil 20,38 12,29 -5,09 -2,98 -5,56 Transforming industry 32,57 11,30 5,27 10,66 3,81 Construction 37,10 25,60 23,78 16,05 6,80 Energy 8,60 26,10 21,32 10,90 14,98 Services 21,80 26,90 -1,45 8,73 12,34 Others 4,50 1,90 5,94 4,73 8,24
Source: BNA