andreas schleicher 9 february 2010 the high cost of low educational performance london, 9 february...
Post on 22-Dec-2015
213 views
TRANSCRIPT

11A
ndre
as S
chle
iche
r9
Fe
brua
ry 2
010
Th
e h
igh
co
st o
f lo
w
edu
cati
on
al p
erfo
rma
nce
The high cost of low educational performance
London, 9 February 2010
Andreas SchleicherEducation Policy Advisor of the OECD Secretary-General

33A
ndre
as S
chle
iche
r9
Fe
brua
ry 2
010
Th
e h
igh
co
st o
f lo
w
edu
cati
on
al p
erfo
rma
nce 1. Know why you are looking
The yardstick for success is no longer just improvement by national standards…
… but the best performing education systems globally
2. Know what you are looking for The kind of ‘human capital’ that makes a
difference for individuals and nations
3. How do we know that we found it? Gauging impact
4. Implications Understanding what contributes to the
success of education systems and improving performance .

AustraliaAustriaCzech RepublicDenmarkFinlandGermanyGreeceHungaryIcelandIrelandItalyJapanNetherlandsNew ZealandNorwayPolandPortugalSlovak RepublicSpainSwedenUnited KingdomUnited States
0 10 20 30 40 50 60 700
5000
10000
15000
20000
25000
30000
1995Ex
pend
iture
per
stu
dent
at t
ertia
ry le
vel (
USD
)
Tertiary-type A graduation rate
A world of change – higher education
Graduate supply
Cost
per
stu
den
t

AustraliaAustriaCzech RepublicDenmarkFinlandGermanyGreeceHungaryIcelandIrelandItalyJapanNetherlandsNew ZealandNorwayPolandPortugalSlovak RepublicSpainSwedenUnited KingdomUnited States
0 10 20 30 40 50 60 700
5000
10000
15000
20000
25000
30000
1995Ex
pend
iture
per
stu
dent
at t
ertia
ry le
vel (
USD
)
Tertiary-type A graduation rate
A world of change – higher education
United States
Finland
Graduate supply
Cost
per
stu
den
t

AustraliaAustriaCzech RepublicDenmarkFinlandGermanyGreeceHungaryIcelandIrelandItalyJapanNetherlandsNew ZealandNorwayPolandPortugalSlovak RepublicSpainSwedenUnited KingdomUnited States
0 10 20 30 40 50 60 700
5000
10000
15000
20000
25000
30000
2000Ex
pend
iture
per
stu
dent
at t
ertia
ry le
vel (
USD
)
Tertiary-type A graduation rate
A world of change – higher education
Australia
FinlandUnited Kingdom

AustraliaAustriaCzech RepublicDenmarkFinlandGermanyGreeceHungaryIcelandIrelandItalyJapanNetherlandsNew ZealandNorwayPolandPortugalSlovak RepublicSpainSwedenUnited KingdomUnited States
0 10 20 30 40 50 60 700
5000
10000
15000
20000
25000
30000
2001Ex
pend
iture
per
stu
dent
at t
ertia
ry le
vel (
USD
)
Tertiary-type A graduation rate
A world of change – higher education

AustraliaAustriaCzech RepublicDenmarkFinlandGermanyGreeceHungaryIcelandIrelandItalyJapanNetherlandsNew ZealandNorwayPolandPortugalSlovak RepublicSpainSwedenUnited KingdomUnited States
0 10 20 30 40 50 60 700
5000
10000
15000
20000
25000
30000
2002Ex
pend
iture
per
stu
dent
at t
ertia
ry le
vel (
USD
)
Tertiary-type A graduation rate
A world of change – higher education

AustraliaAustriaCzech RepublicDenmarkFinlandGermanyGreeceHungaryIcelandIrelandItalyJapanNetherlandsNew ZealandNorwayPolandPortugalSlovak RepublicSpainSwedenUnited KingdomUnited States
0 10 20 30 40 50 60 700
5000
10000
15000
20000
25000
30000
2003Ex
pend
iture
per
stu
dent
at t
ertia
ry le
vel (
USD
)
Tertiary-type A graduation rate
A world of change – higher education

AustraliaAustriaCzech RepublicDenmarkFinlandGermanyGreeceHungaryIcelandIrelandItalyJapanNetherlandsNew ZealandNorwayPolandPortugalSlovak RepublicSpainSwedenUnited KingdomUnited States
0 10 20 30 40 50 60 700
5000
10000
15000
20000
25000
30000
2004Ex
pend
iture
per
stu
dent
at t
ertia
ry le
vel (
USD
)
Tertiary-type A graduation rate
A world of change – higher education

AustraliaAustriaCzech RepublicDenmarkFinlandGermanyGreeceHungaryIcelandIrelandItalyJapanNetherlandsNew ZealandNorwayPolandPortugalSlovak RepublicSpainSwedenUnited KingdomUnited States
0 10 20 30 40 50 60 700
5000
10000
15000
20000
25000
30000
2005Ex
pend
iture
per
stu
dent
at t
ertia
ry le
vel (
USD
)
Tertiary-type A graduation rate
A world of change – higher education

AustraliaAustriaCzech RepublicDenmarkFinlandGermanyGreeceHungaryIcelandIrelandItalyJapanNetherlandsNew ZealandNorwayPolandPortugalSlovak RepublicSpainSwedenUnited KingdomUnited States
0 10 20 30 40 50 60 700
5000
10000
15000
20000
25000
30000
2006Ex
pend
iture
per
stu
dent
at t
ertia
ry le
vel (
USD
)
Tertiary-type A graduation rate
A world of change – higher education
United States
Australia
Finland
United Kingdom

1414C
ounci
l, 1
8 S
ep
tem
ber
20
08
Ed
uca
tion a
t a G
lance
Moving targetsFuture supply of college graduates
China EU US -
2,000,000
4,000,000
6,000,000
8,000,000
10,000,000
12,000,000
2006
2010
2015
2020

1515A
ndre
as S
chle
iche
r9
Fe
brua
ry 2
010
Th
e h
igh
co
st o
f lo
w
edu
cati
on
al p
erfo
rma
nce
DenmarkSwedenNorway
New ZealandFranceTurkey
GermanyAustralia
SpainAustria
BelgiumFinlandCanada
OECD averageKorea
IrelandHungary
PolandCzech RepublicUnited States
ItalyPortugal
-250,000 -150,000 -50,000 50,000 150,000 250,000 350,000 450,000
7,34218,802
23,30640,036
40,26041,090
48,02448,714
55,69560,51963,414
64,66469,235
82,00785,586
104,410127,691
146,539146,673
169,945173,889
186,307
Direct cost Gross earnings benefits Income tax effect Social contribution effect
Transfers effect Unemployment effect Net present value in USD equivalent
USD equivalentA8.3
Components of the private net present value for a male with higher education
Net present value in
USD equivalent
35K$56K$ 367K$105K$27K$ 26K$ 170K$

1616A
ndre
as S
chle
iche
r9
Fe
brua
ry 2
010
Th
e h
igh
co
st o
f lo
w
edu
cati
on
al p
erfo
rma
nce
TurkeyDenmark
SwedenNorway
SpainKorea
CanadaNew Zealand
FranceAustria
AustraliaPortugal
OECD averageFinlandPoland
GermanyItaly
IrelandHungaryBelgium
United StatesCzech Republic
0 50,000 100,000 150,000 200,000
10,34614,23617,19717,85119,75221,28023,875
28,19336,73037,586
47,36850,27151,95455,61257,221
63,60463,756
74,21994,80496,186100,119
160,834
Public cost and benefits for a male obtaining post-secondary education
Public benefit
s
Public
costs
Net present value, USD equivalent
(numbers in orange show
negative values)
USD equivalent

1717C
ounci
l, 1
8 S
ep
tem
ber
20
08
Ed
uca
tion a
t a G
lance

1818A
ndre
as S
chle
iche
r16
Sep
tem
ber
2009
Imp
act
of
inte
rnat
ion
al A
sse
ssm
en
ts
Know what you are looking for
The kind of human capital that makes a difference for people and nations

1919A
ndre
as S
chle
iche
r9
Fe
brua
ry 2
010
Th
e h
igh
co
st o
f lo
w
edu
cati
on
al p
erfo
rma
nce
Latin America then…
Hanushek 2009
GDP/pop 1960
Years schooling
Asia 1891 4
Sub-Saharan Africa 2304 3.3
MENA 2599 2.7
Latin America 4152 4.7
Europe 7469 7.4
Orig. OECD 11252 9.5

2020A
ndre
as S
chle
iche
r9
Fe
brua
ry 2
010
Th
e h
igh
co
st o
f lo
w
edu
cati
on
al p
erfo
rma
nce
GDP/pop 1960
Years schooling
Asia 1891 4
Sub-Saharan Africa 2304 3.3
MENA 2599 2.7
Latin America 4152 4.7
Europe 7469 7.4
Orig. OECD 11252 9.5
Latin America then and now…
GDP/pop 1960
Years schooling
Growth 1960-2000
GDP/pop 2000
Asia 1891 4 4.5 13571
Sub-Saharan Africa 2304 3.3 1.4 3792
MENA 2599 2.7 2.7 8415
Latin America 4152 4.7 1.8 8063
Europe 7469 7.4 2.9 21752
Orig. OECD 11252 9.5 2.1 26147
Hanushek 2009

2121A
ndre
as S
chle
iche
r9
Fe
brua
ry 2
010
Th
e h
igh
co
st o
f lo
w
edu
cati
on
al p
erfo
rma
nce
Latin America then and now…Why quality is the key
Hanushek 2009
GDP/pop 1960
Years schooling
Growth 1960-2000
GDP/pop 2000
Test score
Asia 1891 4 4.5 13571 480
Sub-Saharan Africa 2304 3.3 1.4 3792 360
MENA 2599 2.7 2.7 8415 412
Latin America 4152 4.7 1.8 8063 388
Europe 7469 7.4 2.9 21752 492
Orig. OECD 11252 9.5 2.1 26147 500

2222A
ndre
as S
chle
iche
r9
Fe
brua
ry 2
010
Th
e h
igh
co
st o
f lo
w
edu
cati
on
al p
erfo
rma
nce
How the demand for skills has changedEconomy-wide measures of routine and non-routine task input
(US)
1960 1970 1980 1990 200240
45
50
55
60
65 Routine manual
Nonroutine manual
Routine cognitive
Nonroutine analytic
Nonroutine inter-active
(Levy and Murnane)
Mean t
ask
inp
ut
as
perc
en
tile
s of
the 1
960
task
dis
trib
uti
on
The dilemma of schools:The skills that are easiest to teach and test are also the ones that are easiest to digitise, automate and outsource

2323A
ndre
as S
chle
iche
r9
Fe
brua
ry 2
010
Th
e h
igh
co
st o
f lo
w
edu
cati
on
al p
erfo
rma
nce
OECD’s PISA assessment of the knowledge and skills of 15-year-olds
Coverage of world economy 77%81%83%85%86%87%

3232A
ndre
as S
chle
iche
r9
Fe
brua
ry 2
010
Th
e h
igh
co
st o
f lo
w
edu
cati
on
al p
erfo
rma
nce

3333A
ndre
as S
chle
iche
r16
Sep
tem
ber
2009
Imp
act
of
inte
rnat
ion
al A
sse
ssm
en
ts
How do we know that we found it?
To what extent knowledge and skills matter for the success of individuals and economies

3434A
ndre
as S
chle
iche
r9
Fe
brua
ry 2
010
Th
e h
igh
co
st o
f lo
w
edu
cati
on
al p
erfo
rma
nce
Age 19
Age 21
Age 21
048
121620
Level 2Level 3
Level 4Level 5
Increased likelihood of postsec. particip. at age 19/21 associated with PISA reading proficiency at age 15
(Canada)after accounting for school engagement, gender, mother
tongue, place of residence, parental, education and family income (reference group PISA Level 1)
Odds ratioCollege entry
School marks at age 15
PISA performance at age
15

3636A
ndre
as S
chle
iche
r9
Fe
brua
ry 2
010
Th
e h
igh
co
st o
f lo
w
edu
cati
on
al p
erfo
rma
nce
20102011201220132014201520162017201820192020202120222023202420252026202720282029203020312032203320342035203620372038203920402041204220432044204520462047204820492050205120522053205420552056205720582059206020612062206320642065206620672068206920702071207220732074207520762077207820792080208120822083208420852086208720882089209020912092209320942095209620972098209921002101210221032104210521062107210821092110-5%
0%
5%
10%
15%
20%
25%
30%
35%
40%
Relationship between test performance and economic outcomes
Annual improved GDP from raising performance by 25 PISA pointsPe
rcent
add
itio
n t
o G
DP

3737A
ndre
as S
chle
iche
r9
Fe
brua
ry 2
010
Th
e h
igh
co
st o
f lo
w
edu
cati
on
al p
erfo
rma
nce
0
2000
4000
6000
8000
10000
12000
14000
Potential increase in economic output (bn $)
Increase average performance by 25 PISA points (Total 115 trillion $)
bn$

3838A
ndre
as S
chle
iche
r9
Fe
brua
ry 2
010
Th
e h
igh
co
st o
f lo
w
edu
cati
on
al p
erfo
rma
nce
0
2000
4000
6000
8000
10000
12000
14000 Potential increase in economic output (bn $)
Catching up with Finland (total 260 trillion $)
bn$

3939A
ndre
as S
chle
iche
r9
Fe
brua
ry 2
010
Th
e h
igh
co
st o
f lo
w
edu
cati
on
al p
erfo
rma
nce
Mex
ico
Greec
eIta
ly
Spai
n
Pola
nd
Slov
ak R
epub
lic
Denm
ark
Icel
and
Irela
nd
Austri
a
Belgi
um
Unite
d Ki
ngdo
m
New Z
eala
nd
Nethe
rland
s
Kore
a0%
200%
400%
600%
800%
1000%
1200%
Catching up with Finland(in percent of GDP)% currrent
GDP

4242C
ounci
l, 1
8 S
ep
tem
ber
20
08
Ed
uca
tion a
t a G
lance
Some conclusions The higher economic outcomes that improved
student performance entails dwarf the dimensions of economic cycles
Even if the estimated impacts of skills were twice as large as the true underlying causal impact on growth, the resulting present value of successful school reform still far exceeds any conceivable costs of improvement.

4343C
ounci
l, 1
8 S
ep
tem
ber
20
08
Ed
uca
tion a
t a G
lance

4444A
ndre
as S
chle
iche
r16
Sep
tem
ber
2009
Imp
act
of
inte
rnat
ion
al A
sse
ssm
en
ts
Implications
Understanding what contributes to the success of education systems and improving
performance

4545A
ndre
as S
chle
iche
r9
Fe
brua
ry 2
010
Th
e h
igh
co
st o
f lo
w
edu
cati
on
al p
erfo
rma
nce
Money matters - but other things do too
0 10000 20000 30000 40000 50000 60000 70000 80000 90000 100000400
425
450
475
500
525
550
575
495
410
488
f(x) = 0.000612701270434404 x + 462.612736410929R² = 0.19035445894851
Scienceperformance
Cumulative expenditure (US$ converted using PPPs)
Question:
If better education results in more money,
Does more money result in better education?

4646A
ndre
as S
chle
iche
r9
Fe
brua
ry 2
010
Th
e h
igh
co
st o
f lo
w
edu
cati
on
al p
erfo
rma
nce
Port
ug
al
Sp
ain
Sw
itze
rlan
d
Tu
rkey
Belg
ium
Kore
a
Lu
xem
bou
rg
Germ
an
y
Gre
ece
Jap
an
Au
stra
lia
Un
ited
Kin
gd
om
New
Zeala
nd
Fra
nce
Neth
erl
an
ds
Den
mark
Italy
Au
stri
a
Cze
ch
Rep
ub
lic
Hu
ng
ary
Norw
ay
Icela
nd
Irela
nd
Mexic
o
Fin
lan
d
Sw
ed
en
Un
ited
Sta
tes
Pola
nd
Slo
vak R
ep
ub
lic
-10
-5
0
5
10
15
Salary as % of GDP/capita Instruction time 1/teaching time 1/class sizePort
ug
al
Sp
ain
Sw
itze
rlan
d
Tu
rkey
Belg
ium
Kore
a
Lu
xem
bou
rg
Germ
an
y
Gre
ece
Jap
an
Au
stra
lia
Un
ited
Kin
gd
om
New
Zeala
nd
Fra
nce
Neth
erl
an
ds
Den
mark
Italy
Au
stri
a
Cze
ch
Rep
ub
lic
Hu
ng
ary
Norw
ay
Icela
nd
Irela
nd
Mexic
o
Fin
lan
d
Sw
ed
en
Un
ited
Sta
tes
Pola
nd
Slo
vak R
ep
ub
lic
-10
-5
0
5
10
15
Difference with OECD average
Spending choices on secondary schoolsContribution of various factors to upper secondary teacher compensation costs
per student as a percentage of GDP per capita (2004)
Percentage points

4747A
ndre
as S
chle
iche
r9
Fe
brua
ry 2
010
Th
e h
igh
co
st o
f lo
w
edu
cati
on
al p
erfo
rma
nce
High ambitions and universal
standards
Rigor, focus and coherence
Great systems attract great teachers and
provide access to best practice and quality
professional development

4848A
ndre
as S
chle
iche
r9
Fe
brua
ry 2
010
Th
e h
igh
co
st o
f lo
w
edu
cati
on
al p
erfo
rma
nce
Challenge and support
Weak support
Strong support
Lowchallenge
Highchallenge
Strong performance
Systemic improvement
Poor performance
Improvements idiosyncratic
Conflict
Demoralisation
Poor performance
Stagnation

4949A
ndre
as S
chle
iche
r9
Fe
brua
ry 2
010
Th
e h
igh
co
st o
f lo
w
edu
cati
on
al p
erfo
rma
nce
Human capital
International Best Practice• Principals who are trained,
empowered, accountable and provide instructional leadership
• Attracting, recruiting and providing excellent training for prospective teachers from the top third of the graduate distribution
• Incentives, rules and funding encourage a fair distribution of teaching talent
The past
• Principals who manage ‘a building’, who have little training and preparation and are accountable but not empowered
• Attracting and recruiting teachers from the bottom third of the graduate distribution and offering training which does not relate to real classrooms• The best teachers are in the most advantaged communities

5050A
ndre
as S
chle
iche
r9
Fe
brua
ry 2
010
Th
e h
igh
co
st o
f lo
w
edu
cati
on
al p
erfo
rma
nce
Human capital (cont…)
International Best Practice• Expectations of teachers are
clear; consistent quality, strong professional ethic and excellent professional development focused on classroom practice
• Teachers and the system expect every child to succeed and intervene preventatively to ensure this
The past
• Seniority and tenure matter more than performance; patchy professional development; wide variation in quality
• Wide achievement gaps, just beginning to narrow but systemic and professional barriers to transformation remain in place

5151A
ndre
as S
chle
iche
r9
Fe
brua
ry 2
010
Th
e h
igh
co
st o
f lo
w
edu
cati
on
al p
erfo
rma
nce
High ambitions
Access to best practice and quality professional development
Accountability and intervention in
inverse proportion to success
Devolved responsibility,
the school as the centre of action

5252A
ndre
as S
chle
iche
r9
Fe
brua
ry 2
010
Th
e h
igh
co
st o
f lo
w
edu
cati
on
al p
erfo
rma
nce
No
Yes
0
10
20
30
40
50
60
70
No
Yes
0
41
46
63
Standards based external
examinations School autonomyin selecting teachers for hire
PISA score in science
School autonomy, standards-based examinations and science performance
School autonomy in selecting teachers for hire
5555A
ndre
as S
chle
iche
r9
Fe
brua
ry 2
010
Th
e h
igh
co
st o
f lo
w
edu
cati
on
al p
erfo
rma
nce
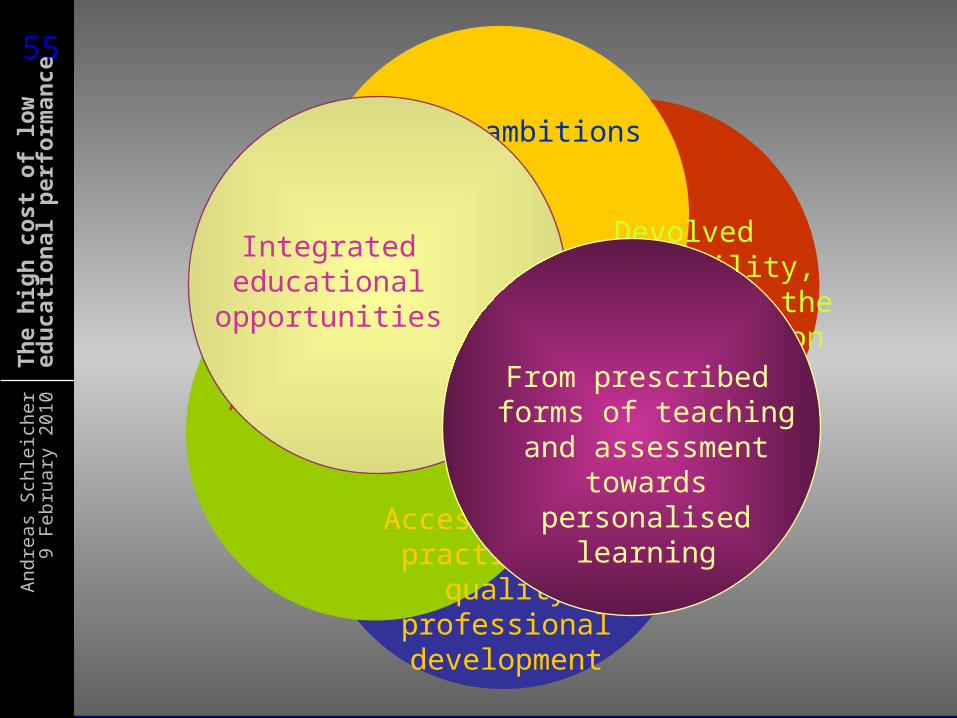
Strong ambitions
Access to best practice and quality professional development
Accountability
Devolvedresponsibility,
the school as the centre of action
Integrated educational
opportunities
From prescribed forms of teaching and assessment towards personalised learning

5656A
ndre
as S
chle
iche
r9
Fe
brua
ry 2
010
Th
e h
igh
co
st o
f lo
w
edu
cati
on
al p
erfo
rma
nceDurchschnittliche Schülerleistungen im Bereich Mathematik
Low average performance
Large socio-economic disparities
High average performance
Large socio-economic disparities
Low average performance
High social equity
High average performance
High social equity
Strong socio-economic impact on
student performance
Socially equitable distribution of
learning opportunities
High science performance
Low science performanceTurkey
AustraliaJ apan
Finland
CanadaNew Zealand
Korea
Czech Republic United KingdomAustria
Germany
Netherlands
SwitzerlandI relandBelgium
PolandSwedenHungary
IcelandFrance Denmark
United States SpainLuxembourg NorwaySlovak Republic
I talyGreecePortugal
420
440
460
480
500
520
540
560
580
21222
Early selection and institutional differentiation
High degree of stratification
Low degree of stratification

5757A
ndre
as S
chle
iche
r9
Fe
brua
ry 2
010
Th
e h
igh
co
st o
f lo
w
edu
cati
on
al p
erfo
rma
nce
Paradigm shifts
The old bureaucratic system The modern enabling system
Hit and miss Universal high standards
Uniformity Embracing diversity
Provision Outcomes
Bureaucratic look-up Devolved – look outwards
Talk equity Deliver equity
Prescription Informed profession
Conformity Ingenious
Curriculum-centred Learner-centred
Interactive Participative
Individualised Community-centred
Delivered wisdom User-generated wisdom
Management Leadership
Public vs private Public with private
Culture as obstacle Culture as capital

5858A
ndre
as S
chle
iche
r9
Fe
brua
ry 2
010
Th
e h
igh
co
st o
f lo
w
edu
cati
on
al p
erfo
rma
nce
Thank you !
www.oecd.org; www.pisa.oecd.org– All national and international publications– The complete micro-level database
email: [email protected]
…and remember:
Without data, you are just another person with an opinion