and the - agecon searchageconsearch.umn.edu/bitstream/13137/1/rr540214.pdftwenty-sixth annual report...
TRANSCRIPT

1953 Annual Report
SOUTHEASTERN MINNESOTA
FARM MANAGEMENT SERVICE
University of MinnesotaInstitute of Agriculture
andUnited States Department of Agriculture
Agricultural Research Serviceand the
County Extension Services of
Dakota, Dodge, Freeborn, Goodhue, LeSueur, Mower, Nicollet, Olmsted,Rice, Scott, Steele, Wabasha, Waseca and Winona Counties
and the
Southeast Minnesota Farm Management AssociationCooperating
1000/4/54
Report No. 2 14Department of Agricultural Economics
Institute of AgricultureSt. Paul 1, Minnesota
April, 1954
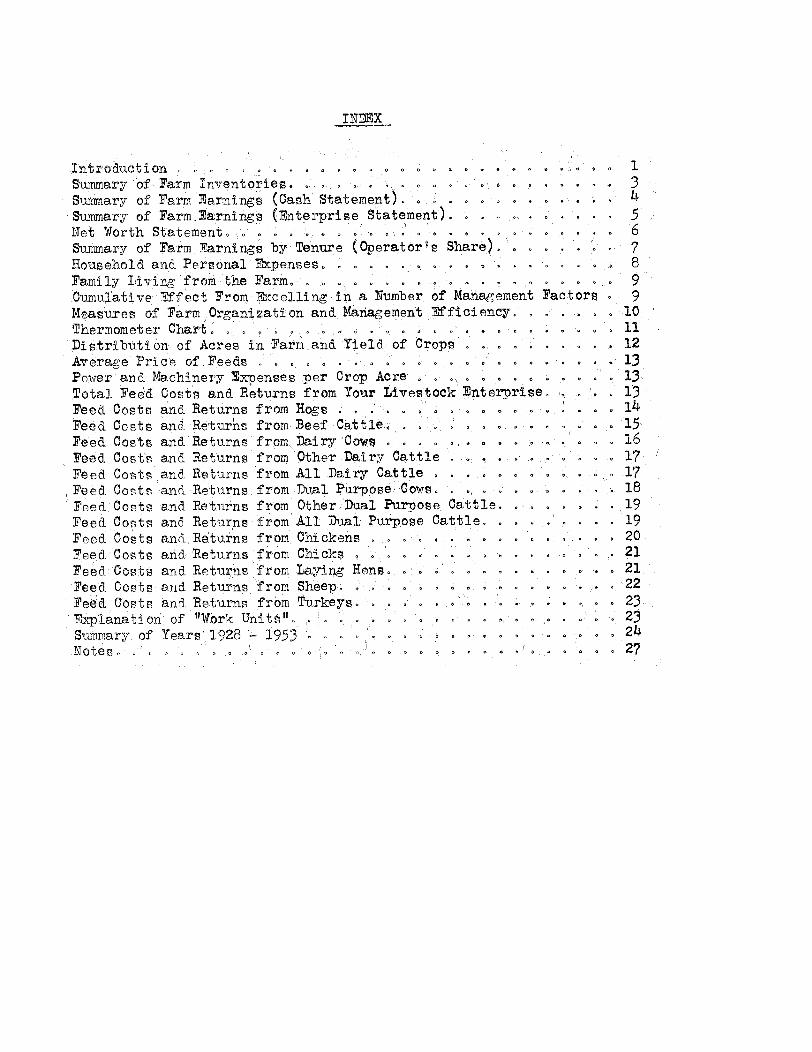
Introd-ucti on .o ..... < .o . o o 1Summary' of Farm Inventories. a<.. . . 3Summary of Farm Earnings (Cash Statement). . 4Summary of FarmEarnings (.nterprise Statement) . ... 0 5Net Worth Staterhent . . o C. . .. . . 6Summary of Farm Earnings by Tenure (Operatorgs Share). . . 7Household.and Personal Expenseso o . . . . . . 8Family Living from the Farm. .. .... . 9Cumulative Effect From Excelling inj a Number of Management Factors 9Measures of Farm Organization and. Maiagement Efficiency. .. .. 10Thermometer Charto , , . . . .... . a . I . .11lDistribution of Acres in Farm and Yield, of Crops . . o. . . o o 12Average Price of Feeds o . .. 0 . o o . . 13Power and Machinery Expenses per Crop Acre , . , 0 . . o o D. 13-Total Feed Costs and Returns from Your Livestock Enterprise .. . 13Feed Costs and Returns from Hogs o .o . .. .o o > . . .. o .. 1.4
Feed Costs and. Returns from Beef Cattle. ., . o o .... . 15.Feed Costs and Returns from Dairy Cows . . . . . . .. o o 16Feed Costs and Returns from Other Dairy Cattle o . . . . . 17Feed Costs and Returns from All Dairy Cattle o . .. . ... o 17Feed. Costs and. Returns- from Dual Purpose, Cows. ., .. . o . 18
Feed.. Costs and Returns from Other. Dual Purpose Cattle. .... 19
Feed Costs and Returns from All Dual Purpose Cattle. . ... 19
Feed Costs and. Returns from Chickens .o . , , o . .. .20Feed. Costs and Returns from Chicks . , , , , . . . 21
Feed Costs and Returns from Laying Hens. . . . .. . ..21Feed. Costs and Returns from Sheep. . .. . . . . . . . . . .. ..22Feed Costs and Returns from Turkeys. . . . . . . . . .. .. 23
Explanation of "Work Units" . . . . . . . .. . o 23Summary of Years 1928 ~ 1953 . . . . . . . . . . . 24M stes o o ^o *. o o ,-> :o ,o ' . o . o o o o e o ' o o' - o ° 0c, o a <* O o a I < o 27

Twenty-sixth Annual Report of the Southeast Minnesota Farm Management Service.
Prepared by To RH Nodland, G. Ao Pond and Ro B. Zoller
INTRODUCT I ON
The Department of Agricultural Economics and the Agricultural Extension
Service of the University of Minnesota, the Agricultural Research Service of
the United States Department of Agriculture, and the county extension services
of Dodge, Freeborn, Goodhue, Rice, Steele, and Waseca counties organized late
in 1927 the Farm Management Service Project, to operate in the above named
counties, beginning Januaryl1, 1928. Additional counties have since been added.
This farm management service is offered to farmers who desire to keep farm re-
cords, and to have these records summarized and analyzed in connection with
those of other farmers. Each farmer who cooperates in this service pays an
annual fee which covers a part of the costo The balance of the cost is defrayed
by the Universtiy of Minnesota and the United States Department of Agriculture.
General administration of this project, analysis of the records and prep-
aration of the reports is handled by the Department of Agricultural Economics
under the direction of G. A0 Pond and To Ro Nodlando Extension work in connec-
tion with the project is handled by So B. Cleland and Eo Hartmanso Harvey
Bjerke was the field agent for this project. At- the end of the year, R. Bo
Zoller, S. A. Engene, Donald Moore, Jay Swanson, R. H. Hinton and Niels Rorholm
of the Department of Agricultural Economics aided in closing the recordso County
agricultural extension agents who cooperate in this project include C. 0o Quie,
V. Sander, Ro Eo Jacobs, G., T. Kunau, Don Hasbargen, Fo L. Liebenstein, FP E.
Wetherill, Ray Aune, Warren Lieb3nstein, Chester Graham, J, Ro Gute, Douglas Ao
Mossberg, Mathas Metz, Co Fo Murphy, Esbern Johnson and Gordon Andersono-
The Southeast Minnesota Farm Management Association was organized in 1939
by the farmers cooperating in the So E. Farm Management Service, This associa-
tion now represents its membership as an additional cooperating agency to de-
termine policies and especially to maintain the field organization and member-
ship0 Officers for 1953 weres
President: Levern Wilker, Owatonna, Steele County
Vice President: Wesley Pierson, Aldine, Freeborn County
SecretaryTreasurer: Ray Miller, New Richland, Waseca County
The board of directors included these officers and also the following:
John Harkness, Dakota County; Harry Morton, Dodge County; Felix Mahoney,
Goodhue County; Emil Diets, Le Sueur County; Harvey Holst, Mower County; Russell
Malmberg, Nicollet County; Earl Kleinwort, Olmsted County; George Little, Rice
County; Merrill Will, Scott County; Everett Freiheit, Wabasha County; and Homer
Goss, Winona Countyo
The following tabulation shows by counties the number of records submitted
in 19530
Dakota 7 Mower g Steele 16
Dodge 13 Nicollet 14 Wabasha 13
Freeborn 15 Olmsted 15 Waseca 15
Goodhue 25 Rice 11 Winona 9
LeSueur 4 Scott 5 Total 173
-2-
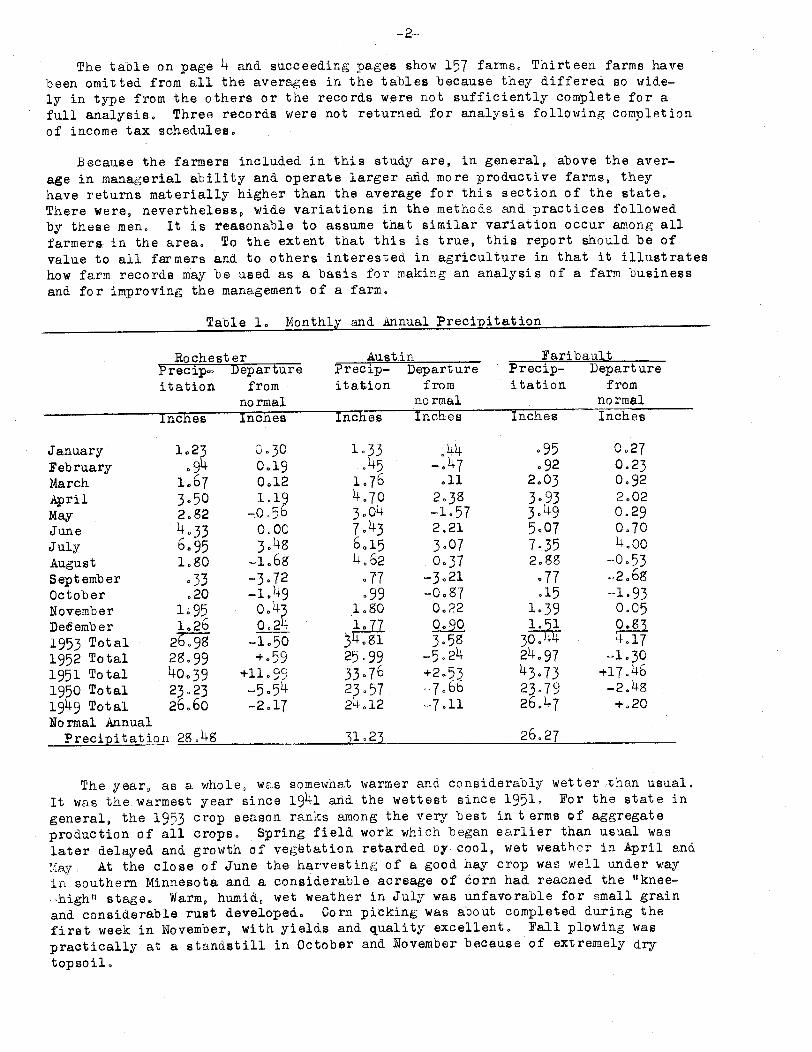
The table on page 4 and succeeding pages show 157 farms, Thirteen farms havebeen omitted from all the averages in the tables because they differed so wide-ly in type from the others or the records were not sufficiently complete for afull analysis° Three records were not returned for analysis following completionof income tax schedules.
Because the farmers included in this study are, in general, above the aver-
age in managerial ability and operate larger arid more productive farms, theyhave returns materially higher than the average for this section of the state.There were, nevertheless, wide variations in the methods and practices followedby these men, It is reasonable to assume that similar variation occur among all
farmers. in the areao To the extent that this is true, this report should be ofvalue to all farmers and to others interested in agriculture in that it illustrates
how farm records may be used as a basis for making an analysis of a farm businessand for improving the management of a farm.
Table .l Monthly and Annual Precipitation
Rochester Austin FaribaultPrecip- Departure Precip- Departure Precip- Departureitatitation from itaion from itation from
normal normal normalInches Inches Inches Inches Inches Inches
January 1,23 o 30 1 33 .44 95 0,27February .94 0.19 .45 -.47 .92 0.23March 1.67 0.12 1.76 11l 2.03 0.92
April 3o50 1.19 4o70 2o38 3 93 2.02May 2,82 -0o56 304 o-1 57 3.49 0.29
June 4.33 OOO0 7.43 2o21 5.07 0.70July 6.95 3o,4 6015 3.07 7.35 4.00August l 1o0 -1 68 4,62 o037 2.88 -0.53September 033 -3072 077 -3.21 .77 -2068October .20 -1.49 .99 -0OO7 .15 -1-93November 195 o.43 logo 0.22 1.39 0.05
December 1.26 0,24 77 090 l51 03
1953 Total 2o7 - 1 o--50 3 1 3.5 3043 4 4I171952 Total 28o99 +.59 25.99 -5o24 24.97 -1,301951 Total 40039 +11.99 33076 +2.53 43.73 +17.461950 Total 23,23 -5,54 23o57 -7.66 23.79 -2.4g1949 Total 26.60 -2.17 24.12 -7.11 26.47 +,20Normal Annual
Precipitation 28o45 31o23 .226.27
The year, as a whole, was somewhat warmer and considerably wetter than usual.
It was the warmest year since 1941 ard the wettest since 1951. For the state in
general, the 1953 crop season ranks among the very best in t erms of aggregateproduction of all crops. Spring field work which began earlier than usual was
later delayed and growth of vegetation retarded oy cool, wet weather in April and
MJray. At the close of June the harvesting of a good hay crop was well under wayin southern Minnesota and a considerable acreage of corn had reached the "knee--high" stage. Warm, humid, wet weather in July was unfavorable for small grain
and considerable rust developed. Corn picking was about completed during thefirst week in November, with yields and quality excellent. Fall plowing waspractically at a standstill in October and November because of extremely drytopsoilo

-3-
Table 2. Summary of Farm Inventories. 1953*Your Farm Average of 157 farms
Items Jan. 1 Dec. 31 Jan. 1 Dec. 31
Size of farm (acres) 226Size of business (work units)** 4.__44
Dairy and dual purpose cows $ 3033 $ 3015Other dairy & dual purpose cattle 1799 1546Beef cattle _ 1703 1310Hogs _1213 1319Sheep _ _214 197Poultry (including turkeys) 268 283
Productive livestock (total) _231 7670Horses __ 62 51Crop, seed, and feed 5807 625b
Power mach. (farm share) 3081 3162Crop and general mach.(farm share) 4162 4480Live-':ock equipment and supplies 692 753Mach. and equipment (total) __7935 g3 95Miscellaneous _9
Buildings, fences, etc. 9306 9624Land 11612 11612
Total farm capital 42962 43616
31 most profitable 31 least profitablefarms sfarms
Items Jan. 1 Dec. 31 Jan0 1 Dec, 3
Size of farm(acres) 279 213Size of business (work units)** 541 392
Dairy & dual purpose cows $ 4005 $ 3976 $ 3304 $ 3224Other dairy & dual purpose cattle 2086 1826 1932 1582Beef cattle (incl feeders) 1260 985 1715 1191
Hogs 1810 2242 1030 734Sheep (including feeders) 95 228 500 331
Poultry (including turkeys) 240 231 206 235Productive livestock (total) 9496 94s8 8687 7297Horses 57 42 56 44Crop, seed, and feed 7377 844g 5629 5086Power mach. (farm share) 3386 3533 336g 3310Crop & general machinery (farm ahare) 5197 581 440 4427Livestock equipment & supplies 918 991 582 806Mach. & equipment (total) 9501 10334 g290 8543Miscellaneous -Buildings, fences etc. 106g7 11215 7517 758
Land 14395 14395 11665 11665
Total farm capital 51513 53922 41844 40221
* For the purpose of comparison, all the data shown in this report with the ex-
ception of Tables 5 and 6 are presented on a full-owner basis. The assets,
expenses and receipts of the landlord were included in the records from rentedfarms o** See page 23 for an explanation of "work units."

-4-
Table 3, Summary of Farm Earnings (Cash Statement), 19Average 31 most 31 least
Your of 157 profitable profitableIt ems _.farm farms farms farmsFARM RECEIPTSDairy and dual-purpose cows $665 $797 $688Dairy products 5070 6442 4536Other dairy & dual-purpose cattle 633 728 602Beef cattle (including feeding cattle) 1450 1384 793Hogs 4411 69123053Sheep and wool 172 66 411Poultry ( including turkeys) 468 1415 127Eggs 1453 1171 1001Horses 12 13 22Corn 1017 1917 767Small grain 398 530 246Other crops 908 1890 703Machinery & equip. sold 143 235 ggAgricultural adjustment payments 51 59 43Income from work off the farm 302 368 166Miscellaneous 111 4 S 68(1) Total farm sales 1724 24011 13314(2) Increase in farm capital 654 2409(3) Family living from the farm _446 4929(4) Total farm receipts (1)+(2)+(3) 18364 26912 13713
FARM EXPENSESDairy and dual-purpose cows bought___ 85 $ 81 $ 213Other dairy & dual-pur, cattle bought 62 38 47Beef cattle bought (incl. feeding cattle) _ 506 545 41Hogs bought 231 13 259Sheep bought 35 112 17Poultry bought (including turkeys) 170 306 132Horses bought 4 2 10Misc. livestock expenses 421 4s8 417Misco crop expenses 1170 1806 880Feed bought 2148 2836 14g6Custom work hired 592 665 540Mech. power mach. (farm share) (new) __ 64 836 471Mecho power mach. (farm share) (upkp) _377 416 341Mecho power (farm share)(gas, oil,etCo,) 917 1127 849Crop and general mach. (new) _106 1524 790Crop and general mach. (upkp) 246 306 200Livestock equipment (new) 206 282 354livestock equipment (upkeep) 134 133 123Buildings and fencing (new) 835 1092 525Buildings and fencing (upkeep) 370 437 313Hired labor so_806 1370 598Taxes 672 824 653General farm and insurance 250 287 222(5) Total farm purchases 11945 15696 9481(6) Decrease in farm capital __-- 162-(7) Interest on farm capital 2164 2636 2052(8) Unpaid family labor 523 486 712(9) Board furnished hired labor _ 138 225 101
(10) Total farm exp (sum of (5 ) to (9) 14770 19043 13969(11) Operator's earnings (4) -(10) 3594 7869 -256

-5-
Ib1 e 4. Summary o f Farm
ItemsRETUBIS AND NET. I CREASESDairy and dual purpose cowsOther dairy & dual pur. cowsBeef breeding herdFeeding cattleHogsSheepTurkeysChickens
All productive livestockCrops, seed and feedAgricultural conservation paymentsIncome from labor off the farmMiscellaneous(1) Total returns & net increases
Earnings (Enterprise Statement) 195,Average 31 most
Your of 157 profitablefarm farms farms
$51551216
144422
4348121242
162413272
-65351
12599
12894
$64911525
85469
7269g6
11241253
18302644
59lo973
19187
31 leastprofitable
farms__--
$43641083
305-2
2541225
11069622
-1265439356
g561
EXPENSES AND NET DECREASESHorsesTractorTruckAuto (farm share)Gas engine and elect. exp. (f. share)Hired power
Total powerCrop and general machineryLivestock equipmentBuildings, fencing and tilingMisc. productive livestock expenseLaoo rReal estate taxesPersonal property taxInsuranceGeneral farmInterest on farm capital
(2) Total expenses & net decreases(3) Operators earnings (1)- (2)
$ 50802296346212
3172123
998259903418
1613528144105145
2164
93003594
$ 4988744o376247366
23651170
2681034
4882246
659165106lgl181
2636
113187869
$ 38807266322212276
19211007241
770417
15345o414.9
95127
2052
8817-256
*Cash receipts and expenses are adjusted for changes in inventory for each
enterprise and for each item of expense in order to show total receipts and net
increases, and total expenses and net decreases° The operator's earningsare the same as those on page 4.
5I
_-.----�1.

-6-Table 5. Net Worth Statement for Those Farmers Who Kept a Complete Record of All
Assets and Liabilities. 1953 (Operator's Share)_.-
ItemsTotal acres in farm
OwnedRented
Total farm capitalAccounts receivable
Stocks and bondsLife insuranceOutside real estateOther outside investments
Total outside investmentsDwellingCash on hand and in bankOther household & personal assets
Total cash, household & personal assetsTOTAL ASSETS
Federal Land Bank MortgageOther mortgages on land operatedProduction Credit AssociationSealed GrainOther chattel MortgagesNotes payableAccounts payable
TOTAL LIABILITIESFarmer'.s net worthGain in net worth
Your farmJan. 1 Dec. 31
13 part-owners*Jan. 1 Dec. 31
35 OwnersJan. 1 Dec. 31
182182
$36886 $37354173 149
1919 17961629 17201217 1188
371 4-5136 51343959 3878
733 9312238 23376930 7146
49125 497831487 16514063 3342
73 92104 146565 533
1528 1361138 14o
7958 726541167 42518
+1351
16 Renters *»Jan. 1 Dec. 31
Total acres in farm 28 226Owner 133Rented 135 226
Total farm capital $37455 $3983 $15068 $16174Accounts receivable 162 185 4 11
Stocks and bonds 1680 1863 469 448Life insurance 1561 1720 842 969Outside real estate 77 19 375 326Other outside investments 695 763 113 150
Total outside investments 4013 4365 1799 1893Dwelling 1749 1803 _Cash on hand and in bank 2742 3152 319 335Other household & personal assets 2279 2328 2546 2640
Total cash, household & personal assets 6770 7283 2865 2975TOTAL ASSETS 48400 51666 1973b 21053
Federal Land Bank Mortgage 417 927Other Mortgages on land operated 3146 2608Production Credit Association 400 727Sealed Grain 62 127 657 725Other chattel mortgages 785 1971 1619 2105Notes payable 2523 2585 2042 2108Accounts payable 410 161 349 204
TOTAL LIABILITIES 7743 9106 4667 5142Farmer's net worth 40657 42560 15069 15911Gain in net worth +1903 +842* 7 rented for cash, 1 cash and crop share, 2 crop share and 3 livestock and
crop share**4 rented for cash, 3 cash and crop share, 1 crop share and g livestock and crop
share,
-- -
--
--
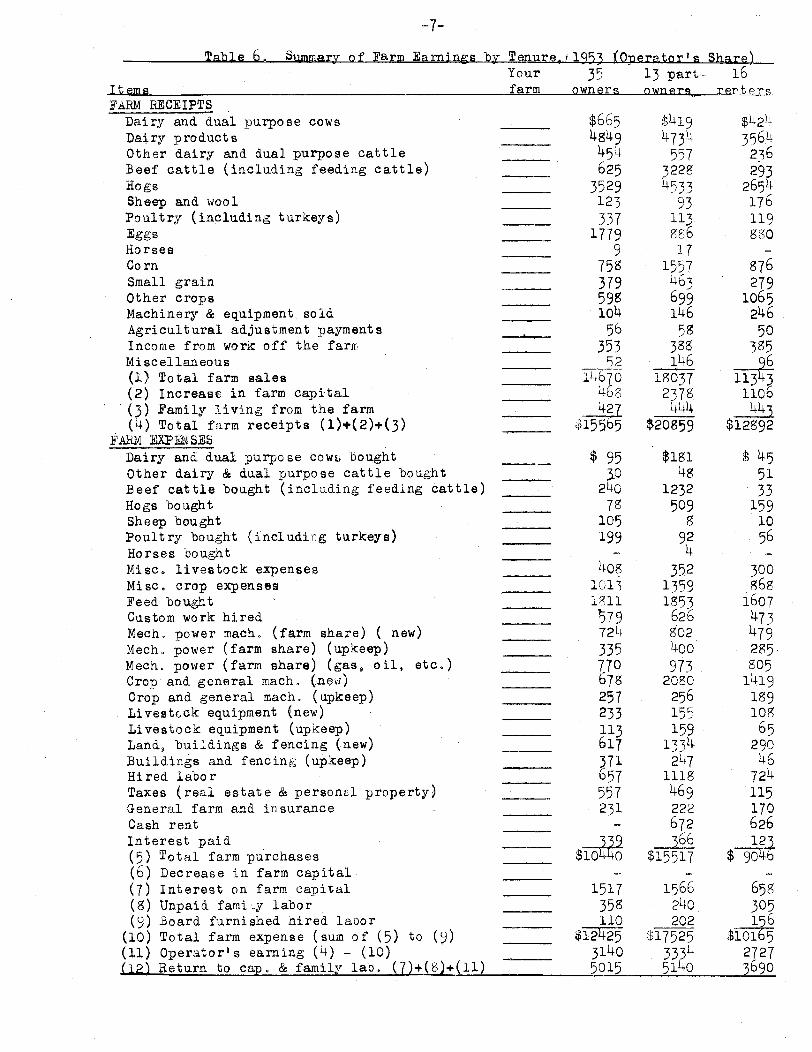
-7-
Table 6. Summary of Farm Earnings by Tenure, 1953 (0Operator 's Share)
I temsFARM RECEIPTS
Dairy and dual purpose cowsDairy productsOther dairy and dual purpose cattleBeef cattle (including feeding cattle)HogsSheep and woolPoultry (including turkeys)EggsHorsesCornSmall grainOther cropsMachinery & equipment soldAgricultural adjustment paymentsIncome from work off the farrrMiscellaneous(1) Total farm sales(2) Increase in farm capital(3) Family living from the farm(4) Total farm receipts (1)+(2)+(3)
FARM EXPEN SESDairy and dual purpose cows boughtOther dairy & dual purpose cattle boughtBeef cattle bought (including feeding cattle)Hogs boughtSheep boughtPoultry bought (including turkeys)Horses boughtMisco livestock expensesMisco crop expensesFeed boughtCustom work hiredMecho power macho (farm share) ( new)Mecho power (farm share) (upkeep)Mecho power (farm share) (gas, oil, etc,)Crop and general mach. (new)Crop and general macho (upkeep)Livestcck equipment (new)Livestock equipment (upkeep)Land, buildings & fencing (new)Buildings and fencing (upkeep)Hired laborTaxes (real estate & personal property)General farm and insuranceCash rentInterest paid(5) Total farm purchases(6) Decrease in farm capital(7) Interest on farm capital(8) Unpaid family labor(9) Board furnished hired labor
(10) Total farm expense (sum of (5) to (9)(11) Operator's earning (4) - (10)(12] Return to cano & family lab, (7)+(8)+(11)
Yourfarm
35 13 part--- 16owners owner r erter
$66544g94541625
3529123
3371779
9758379598104
56353_52
lb2 7046g427
:15565
$ 9530
24O
78105199
4o8ioi3
111579724335770678257233113617371657557231
339$1040
1517358110
$1242531405015
t4194734
55732284533
93113s8617
1557463699146.58388146
1805372378
444$20859
$18148
1232509
992
35213591853
626802400
9732080256155159
1334247
1118469222672366
$15517
1566240202
$1752533345140
$421i35642362932654176119gig880
876279
106524650
3g5
113431106443
$12892
$ 455133
1591056
300g86
1607473479285805
141918910865
29046
724115170626123
$ 904
658305
156$10165
27273690
-- - ---- -- - - I # F 1. r I - - -1 - -- --x- - '.., -1 -
c-
3r
__
C I-
- ·
--
--

Table 7. Household and Personal Expenses forThose Farms Which Kept Complete Accounts of These Expenses, 1953
16 most 16 leastAverage profit- profit-
Your of 81 able ableIt ems farm farms farms farmsNumber of persons - family 43 4.C
Number of adult equiv. - family 3.2 3.1 3.0other .3 .5 .3
Food and meals bought $6gg $731 $602Operating and supplies 274 279 206Clothing and clothing materials 300 329 247Personal care, personal spending 92 63 53Furnishings and equipment 246 280 189Education, recreation and development 152 179 100Medical care and health insurance 256 362 220Church, welfare _195 211 112Personal share of auto expense 120 17 107Household share of eledt. & gas engine expense 75 6 71H.H. & pers. share of new auto, new dwelling 156 258 239House upkeep 67 122 41Gifts and special events 79 g1 54Misc. taxes _ 2 16
Total cash living expenses $2741 $314 2257
State and Federal income taxes $167 $215 $ 57Insurance _ -20 357_ 137
Total household and personal cash expense 3116 3712 2451
Food furnished by the farm $451 $546 $354Fuel furnished by the farm 9 11 12
Total cash expenses & perquisites 357b 4269 2817357b 4209 2517
Purchase of stocks bonds, and other invest. $33 $1535$ 6
Receipts:Sale of investments $ 6 $ 30Income from investments 169 407 39Miscellaneou.s income 107 37 330
*Hired help or others boarded.
-gr

Table S. Family Living From the Farm. 1953Average Average
Your 157 Your 157
Items farm farms farm farms
Adult- equiv. - family__ 3.2others .4
Whole milk 1276 ?$87 99
Skim milk 92 _ 92
Cream __ 56 1 2. b
Beef __ 673 101o33
Hogs 331 b3 g7
Sheep 3 9___Poultry 112 _23.C4
Eggs 19 _ 7o8.5
Potatoes__ 5 679Vegetables & fruit 58.92
Farm fuel 2 _11.25
Total___ $45 84
CUMULATIVE EFFECT OF EXCELLING IN A NUMBER OF IMANAGi:JMENT FACTORS
Studies of earnings of farmers in this area show that there are seven major
management factors causing variations in earnings among farmers within a given
year. These seven factors are (1) crop yields, (2) choice of crops, (3) returns
from livestock,(4) amount of livestock, (5) size of business, (6) work accomn-
lishment per worker, and (7) control over expenses. The combined or cumulativeinfluence of these seven management factors on earnings is shown in Table 9,
The farmer's earnings are determined to a considerable extent by his accomplish-
ments in these seven factors.
Table 9. Relation of Operator's Earnings to the Number of Factorsin which the Farmer Excels
Noz, offactors inwhich farmer
IT/ ro asa
No.of
rP"! m A
Your-fcfrm
The length of the shaded lines
is in proportion to the averagen-nerator tls earnings
Averageoperato rs
earnings
None or 1 19 _xxxxx $ 9322 22 xxxxxxxxxxxxxxx 2711
3 32 _ xxxxxxxxxxxxxxxxxxx 3355
442 ..... xxxxxxxxxxxxxxxxxxxxxx 35 96
5 26 .. xxxxxxxxxxxxxxxxxxxxxxxxxxxx 4g21
6 or 7 16 xxxxxxxxxxxxxxxxxxxxxxxxxxxxxxxx 5656
The array in Table 9 indicates that it will be worth while for each cooper-
ator to study carefully his ranking on pages 10 and 11, and learn his standing
in respect to each of the above factors and the elements of strength and weakness
in his farm business.
- ~ ~ ~ ~ ~ w_-I -
-9-

-10-
Table 10. Measures of Farm Organization and Management Efficiency, 19531 most 31 least
Average profit- profit-Measures used in chart Your of 157 able ableon page 11 ffarm farms farms farms
Operator's earnings $ $3593 $7869 $-256
(1) Crop yields* 100 101 92
(2) % of tillable land in high ret. crops** 65.7 67.6 63.1
(3) Ret, for $100 feed to prod. livestock*** 100 106 87
(4) Prod. livestock units per 100 acres**** 30.7 33-0 27.3
(5) Size of business - work units 440 541 392
(6) Work units per worker 244 258 218
(7) Pow.,mach.,equip.,&bldg.exp.per work unit $9.70 $9.13 $10.31
Measures and items related to some of theabove measures-:(3) Index of return for $100 feed from:
Dairy cattle (see pages 16&17) 100 109 5Dual purpose cattle (see pages 18&19) 100 - -
Beef breeding herd (see page 15) 100 - 82Feeding cattle (see page 15) 100 103Hogs (see page 14) 100 106 90Native sheep (see page 22) _ 100 73 92Turkeys (see page 23) _ 100 9 -Chickens (see pages 20 & 21) 100 100 88
(4) Number of animal units prod. livestock 57.8 70.2 50.3
(5) Work units on crops 99 129 94Work units on productive livestock 323 397 285Other work units 18 15 13
(6) Number of family workers 1.3 1.3 1.5
Number of hired workers ._5 .8 .3Total number of workers 1. 2.1 1.8
(7) Power expense per work unit $ $4.76 $4.51 $5.11Crops mach, expense per work unit 2.34 2.22 2.59Livestock equip. exp. per work unit .58 .48 .62Building exp. per work unit .2.02 1.92 1,99
* Given as a percentage of the average.** Crops are marked on apge 12 as (A), (B), (C), and (D). All of the acres in
(A) crops, one-half of acres in (B) crops, and one-fourth of acres in (C)
crops are used in calculating per cent of tillable land in high return crops.***An index weighted by the animal units of livestock.****Acres in timber not pastured, roads, waste, and farmstead were not included.

11-
Thermometer Chart
Using your figures from page 10, locate your standing with respect to thevarious measures of farm organization and management efficiency. The averagesfor the 157 farms included in this summary are located between the dotted linesacross the center of this page.
Return Pr. L. S.High from pro-
return ductivecrops livestock ]
;0 _ 140 54.0
. 5 _ 135 51.0
L..0 _ 130 _ 48.0
3t, 5 _ 125 _ 45.0
.o :_ 120Q _ 42.0
3.5 115 39.0
1.0 110 __36.0
105. 33.0
i.0__100 _ 30o 001
!.5- 95 27.0
C- 90 24.0
3. e- 85 21.0
;._C ,_ 80 1 80
I,^ 7_ 75: 15.0
0- 70 _ 12.0
65 9.0
unitsper
100 .A.
1~ _
I -- .
t - - t,
I-
i
r
=
L
* t* i
-
Workunits
0 _
680
650
620
590
560
530
500
470
C4044o
410
380
350
320
290
260
230
36'
35(
33;
32(
30.
29(
27:
26(
24t
23(
21'
20(
18.
17(
15i
14C
Workunitiper
works
5
3 .
5
O _
5 .
5
) -
Pow., mach.3 eeq. & bldgs.
exp, pernr work unit
$3.75
5 E
m-
6.oo-
6.75 -
7.50-
8.251
9,o00'
9.75
10,o50
11.25'' -
12.00
12 75 --.
13. 0
15. 00 o
1125-
Oper-atortsearn-ings
Cropyields
,-
S
5
5
2~
5
3
)
$10000oooo
9200
8400
7600
6800
6000
5200
4400
3600» * o
2800
2000
1200
400
-4oo00
-1200
-20001
130
13(
124
12(
11.
,ll
11(
10,
10(loc
9(
9<
8j
8(
71
7(
65
(
I
e, i
Io
82
83
81
7E
76
73
71
6E
66
63
61
56
53
51
48
--�`-I - i
I
58
A
I
I, I\1-1/ I
I 0
I
c
1.

-12-
Table 11. Distribution of Acres in Farm and Yield of Crops, 1953I·- I ~~~ II ill I · · II~~195Acres
growingthis Your
_crop- farm
in tarmAverageof 157farms
iroD yields per acreAve. of farms
Your growing eachfarm c rop
urop: kA) , b) J ) ana. LJJ reierto ranking used in calculating% of tillable land in highreturn crops (see page 10)
Canning peasFlaxBarleyOats and barleyOatsOats and wheatWheatEye
Total small grain and peas
Sugar beets, hybrid seed corn,potatoes and truck crops
Corn grainCorn silageSweet cornSoybeans for grainCorn fodder
Total cultivated crops
Alfalfa hayRed clover hayMixed legumes & non-legumesLegumes for seedTimothy and /or brome hay and seedOther annual hay
Total tillable land in hay
Alfalfa and mixtures incl. alf,Other legumes and mixturesSudan grass or rape pastureOther tillable land in pasture
Total tillable and in pasture
Tillable land not croppedTotal tillable land
Wild hay (non-tillable)Non-tillable pastureTimber (not pastured)Roads and wasteFarmstead
(A)(0)(D)(D)(D)(D)(D)(D)
(A)(A)(B)(B)(C)(D)
(A)(B)(C)(C)(D)(D)
(A)(C)(C)(D)
18121914
152820
5156
11157lo615541
157
1512611.4
.... .3156
115201127
133
(D) 17157
36114I.S
Total acres in farmPer cent land tillablePer cent tillable land in high ret., crops
1.8.92.21.7
35.9.8
1.6.2
45 1
1.252.2
6.91.99.1
71 3
33.72.3.8
.2
.1
37.1
$4g.497.1 bu.25.9 bu,34.2 bu.37,4 bu,42,6 bu.23.0 bu,13.7 bu.
61,$ bu,9.4 tons2,3 tons
20.3 bu.
2.9 tons2.1 tons1.7 tons
16,51.9
0232.b
21.3
1.1
175.93.0
23.16.5
10.36.7
.5 tons
225.578.o65.7
I- -- - -- -~~~~~~~~~~~~~~~~~~~~~~~~~~~~~~~~~~~~~~~~~~~~~~~~~~
- -- i
N 04
--
-·
--
-"""' ' .._._._ ___ �_
__
__
,I
1
I
I�lllllll�----LI
---··�·L�L·LII�···II111111

Table 12. Average Price of Feeds, 193Item Value I tem ValueEar corn, per buo $1i31 Alfalfa hay, per ton $17450Oats, per bu.o 71 Red or alsike clov. hay, per ton l4ogOBarley, per buo 111 Timothy, per ton lOolOWheat, per bu. 2o10 Wild hay, per ton 8,75Bran, per cwto 2095 Corn fodder, per ton 7°85Linseed oilmeal, per cwto 4,10 Corn silage, per ton 5°85Soybean oilmeal, per cwto 4.40 Pasture, per moo per cow 2o50Meatscraps per cwt, 5°30 Skim milk, per cwt, o36
Table 13. Power and Machinery Expenses per Crop Acre, 1953Average 31 most 31 least
Your of 157 profitable profitableI tems _____farm farms farms farms
Crop acres per farm 156o5 206o7 141o3
Tractor and horse exp. per crop acre __ $572 $5o10 $6o19Crop & geno mach, exp. per crop acre 6067 5°90 7.05
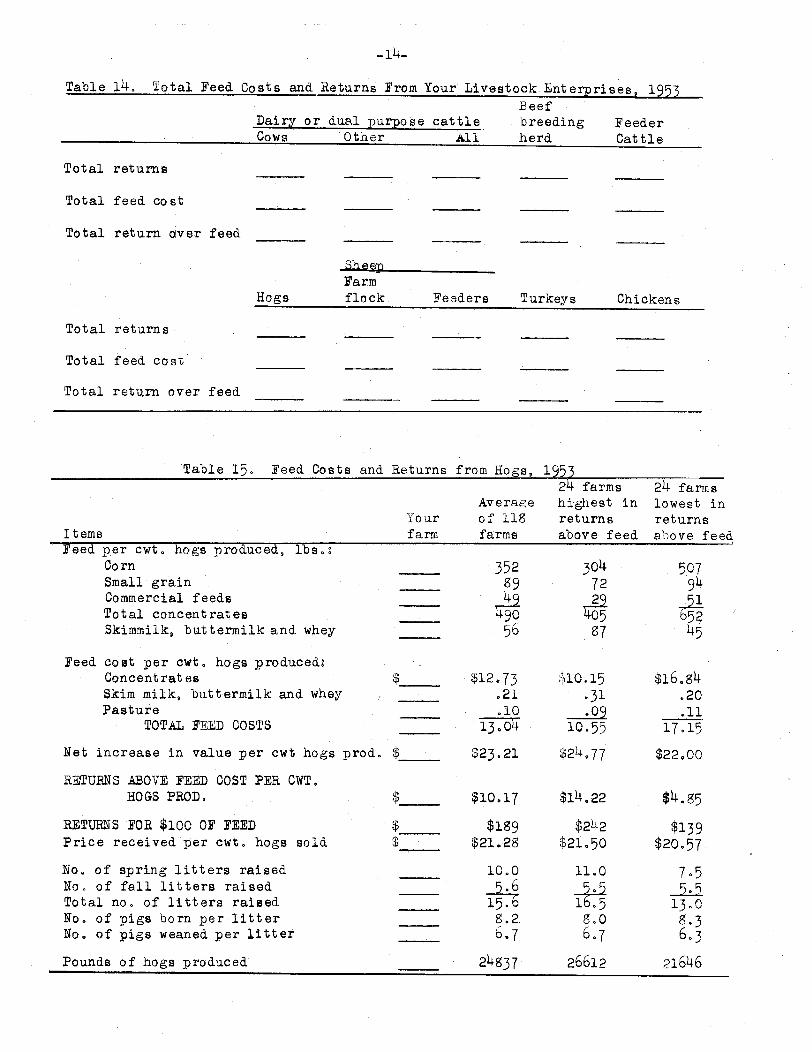
TOTAL RETURNS AND FEEL COST FROM YOUR LIVESTOCK ENTERPRISES
The total "return over feed costs" for each class of livestock is shown inTable 14, This differs from the "return over feed" shown in the enterprise state-ment in that it is the total for each class of livestock ihstead of a return"per head" "per unit" o "pper 100 pounds". These data indicate the relativeimportance of different classes of livestock as a source of income and as amarket for feed4 The total return is the same as the returns and net increasesshown on page 5° The return over feed is not a net return, but rather theamount available from the gross income, after paying the feed bill, to cover theoutlay for hired labor, power, equipment, taxes, insurance, interest, andveterinary bills and to provide a return for the use of family labor and capital o
Feed is the largest single item of cost for all classes of livestock4However, the proportion of the total cost represented by feed varies considerablybetween classes of livestock. Feed makes up approximately 45 per cent of thetotal costs of maintaining dairy cattle and poultry, 50 per cent in the case ofa farm flock of sheep and 75 to 90 per cent for hogs, feeder cattle and feeder lambs4Consequently, it is necessary to secure a relatively higher return over feed fromdairy cattle and poultry than from the other livestock enterprises in order to beable to cover all the cost other than feedo
-13-
-14-
Table 14o Total Feed Costs and Returns From Your Livestock Enterprises, 1953Beef
Dairy or dual purpose cattle breeding FeederCows Other All herd Cattle
Total returns
Total feed cost
Total return over feed
Hogs
SheepFarmflock Feeders Turkeys Chickens
Total returns
Total feed cost
Total return over feed
Table 15. Feed Costs and Returns
Items'eea per cwto nogs produced, iDSo:
CornSmall grainCommercial feedsTotal concentratesSkimmilk, buttermilk and whey
Feed cost per cwt, hogs produced:ConcentratesSkim milk, buttermilk and wheyPasture
TOTAL FEED COSTS
Net increase in value per cwt hogs prod.
RETURNS ABOVE FEED COST PER CWToHOGS PROD*
RETURNS FOR $100 OF FEEDPrice received per cwt. hogs sold
No. of spring litters raisedNo. of fall litters raisedTotal no. of litters raisedNo. of pigs born per litterNo. of pigs weaned per litter
Pounds of hogs produced
Yourfarm
$
$
$
'I
from Hogs,
Avera'geof 118farms
35289.21 g49
56
$12.73.21.10
13.o4
$23.21
$10.17
$189$21,28
10.0
15o68.26.7
24837
195324 farmshighest inreturnsabove feed
30o472
4o- 7
$10.15.31o09
10.55
$24.77
$14.22
$242$21.50
11.0
5.5
8.06.7
26612
24 farmslowest inreturnsabove feed
50794,51
45
$16.84.20.11oll
17.15
$22.00
$4.85
$139$20.57
7,55.5
13.0o.3663
21646
--- -tj -
-*
-I . --- - - -- - I -- --- - - - - - - 1 1
-15-
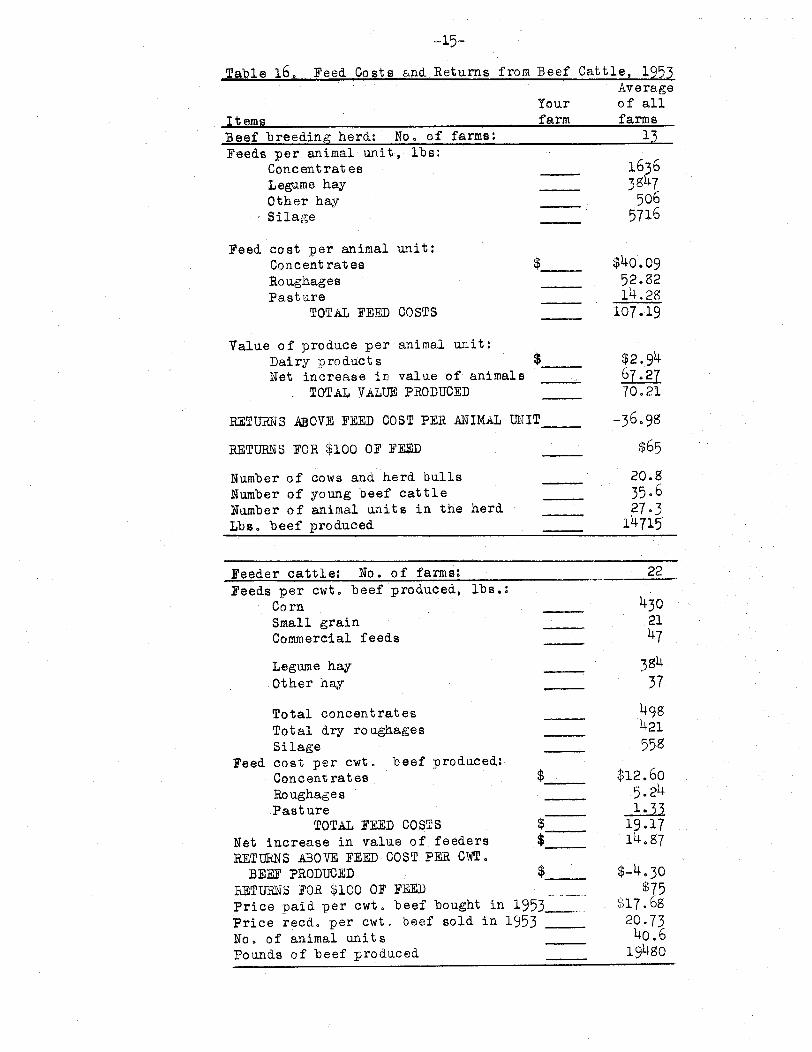
Table 16o Feed Costs and Returns from Beef Cattle, 1953Average
Your of allIt ems m_ _ farm farms
Beef breeding herd: No. of farms: 13Feeds per animal unit, lbs:
Concentrates 1636Legume hay 3g47Other hay 506Silage 5716
Feed cost per animal unit:Concentrates $ $40.09Roughages 52.82Pasture 14.2g
TOTAL FEED COSTS 107.19
Value of produce per animal unit:Dairy products $ $ 2.94Net increase in value of animals 67.27
TOTAL VALUE PRODUCED _70.21
RETURNS AO0VE FEED COST PER ANIMAL UNIT -3698g
RETURNS FOR $100 OF FEED $65
Number of cows and herd bulls 20.8Number of young beef cattle 35.6Number of animal units in the herd _ 2703Lbs. beef produced 14715
Feeder cattle: No. of farms: 22Feeds per cwt. beef produced, lbs.:
Corn 430
Small grain 21Commercial feeds 47
Legume hay 3g4
Other hay 37
Total concentrates 498
Total dry roughages 421Silage _ 55
Feed cost per cwt. beef produced:Concentrates $_ $12.60Roughages . ' 5 24Pasture 133
TOTAL FEED COSTS $__ 19-17Net increase in value of feeders $__ 14.87RETURNS ABOVE FEED COST PER CWToBEEF PRODUCED $_ $-4.30
RETURNS FOR $100 OF FEED $75Price paid per cwt. beef bought in 1953_ .. )17.6g
Price recdo per cwt. beef sold in 1953 20.73Noo of animal units 40.6Pounds of beef produced 119480

-lb-
Table 17- Factors of Cost and Returns from Dairy Cows, 195326 farms 26 farms
Average highest in lowest inYour of 128 butterfat butterfat
Items farm farms per cow per cow
Pounds of butterfat per cow 309 394 226
% of butterfat in milk _._ 3,7 3-9Price rec. per lb. B.E. sold(cents) _ 945 98.S 87.5
As manufacturing cream (cents) 75.4 77.7 74,2
Other (cents) 97-3 99.1 94.3
Feeds per cow, lbs.:Corn 1705 231l 1483
Small grain 767 1052 6o4Commercial feeds _ 33 550 244-
Legume hay 4 317 4208 43g3
Other hay _ 52 608 .231
Fodder and stover __7 17
Total concentrates 2855 3920 2331
Total hay and fodder 4852 4816 4631
Silage __6490 8216 5496
Feed cost per cow:Concentrates $72.86 $99°39 $56.96
Roughages 59.67 63.43 56. 0
Pasture 11, 53 10.90 12_23
TOTAL FEED COSTS 144 o 06 173.72 125o27
Value of produce per cow:Dairy product sales $275-91 $363.71 $180o56
Dairy produce used in house _ 59 5.95 6o10
Milk to livestock 12.50 15.21 15o.g
Net increase in value of cows -1o97 -11o88 -6.98
TOTAL VALUE PRODUCED 2_2.42 372.99 195o56
RETURNS ABOVE FEED COST PER COW _ $13836 $199.27 $70o29
RETURNS FOR $100 OF FEED _ $199 $220 $156
Feed cost per lb. B.F. (cents) 46.,6 44,1 55.4
Number of cows* 21 2 22.1 18.2
* All dairy cows which have at some time in the past freshened are included in the
dairy herd, and affect the average number of cows used in computing this table.
There is some variation in the number of months of dry period per cow; however,this variation is small for the majority of farms,

·Table 18. Feed Costs and Returns from Other Dairy Cattlel 1q4--_26 farms 26 farms
Average highest in lowest in
Your of 128 butterfat butterfat
It-ems farm farms per cow per cow
Feed per head, lbs.:Concentrates 720 845 734
Hay and fodder 2055 1963 2098
Silage 2104 2167 2033
Skim milk 15 44 384
Whole milk _315 418 357
TOTAL FEED COSTS PER HEAD __ $5g.2b6 $3.69 $59-93
Net inc. in value of other dairy cattle _6145 74.13 62.29
RETURINS ABOVE FEED COST PER HEAD 3.19 10.44 2.36
RETURNS FOR $100 OF FEED 105 $116 $104
Number of head of other dairy cattle 23.0 2500 19.2
Table 19. Feed Costs and Returns from All Dairy Cattle. 1959326 farms 26 farms
Average highest in lowest in
Your of 128 butterfat butterfat
Items farm farms per cow per cow
Feeds per animal unit, lbs.:
Concentrates 2321 3074 1989
Hay and fodder 4545 4459 4425
Silage _ 5627 6681 4949
TOTAL FEED COSTS PER AUIMAL UNITS $125.60 $145.67 4$113.62
Value of produce per animal unit:
Dairy products $1S2.49 $233.58 $124.75
Net increase in val. of dairy cattle __ 33.2 44,96 3 2
TOTAL VALUE PRODUCED $216.31 $275.5 l $159.27
RETURNS ABOVE FEED PER ANIMAL UNIT $90.71 $132.87 $45°65
RETURNS PER $100 OF FEED _ $175 $194 $1'i
Animal units of dairy cattle 32.9 35.0 2S.4

Table 20. Factors of Costs and Returns from Dual Purpose Cows. 1953Average
Your of 11I t ems farm farms
Pounds of butterfat per cow iPer cent butterfat in milk 35Price received per lb. B.F. sold (cents) 81.9
As manufacturing cream (cents) 73 6Other (cents) 93.293.2
Feeds per cow, lbs.:Corn 51Small grain 5o4Commercial feeds 135
Legume hay 4001Other hay 532
Total concentrates 14g9Total hay and fodder 4533Silage 5094
Feed cost per cow:Concentrates $3°-37Roughages 5_52Pasture 12,12
TOTAL FEED COSTS $101.01
Value of produce per cow:Dairy product sales $130.01Dairy produce used in house 7.21Milk to livestock . 22.88Net increases in value of cows _-24.g6
TOTAL VALUE PRODUCED $135.24
RETURNS ABOVE FEED COST PER COW $34.23
RETURIS FOR $100 OF FEED ___35
Feed cost per lb. B.F. (cents) 55.g
,u b o
Number of cows 17.1

-19-
Table 21. Feed Costs and Returns from Other Dual
Your
Items farm
Feeds per head, lbs.:ConcentratesHay and fodderSilageSkim milkWhole milk
TOTAL FEED COST PER HEAD
Net increase in value
RETURNS ABOVE FEED COST PER HEAD
RETURNS FOR $100 OF FEED
Number of head
Purpose Cattle, 195BAverageof 11farms
67816791854
315441
$54.66
$54. 0
$-.26
$100
24.7
Table 22. Feed Costs and Returns from All Dual Purpose Cattle, 195_3Average
Your of 11.ar _ .mstnMc
Items
Feeds per animal unit, lbs.:ConcentratesHay and fodderSilage
TOTAL FEED COSTS PER ANIMAL UNIT
Value of produce per animal unit:Dairy productsNet increase in value
TOTAL VALUE PRODUCED
RETURNS ABOVE FEED PER ANIMAL U1N IT
RETURNiS FOR $100 OF FEED
141639404334
$90.36
$81.543C0.22
$111 .76
$21.4o
$123
29.7Animal units
-
-
.I
- II I L
. arm I a I'M 1
---
I
-20-
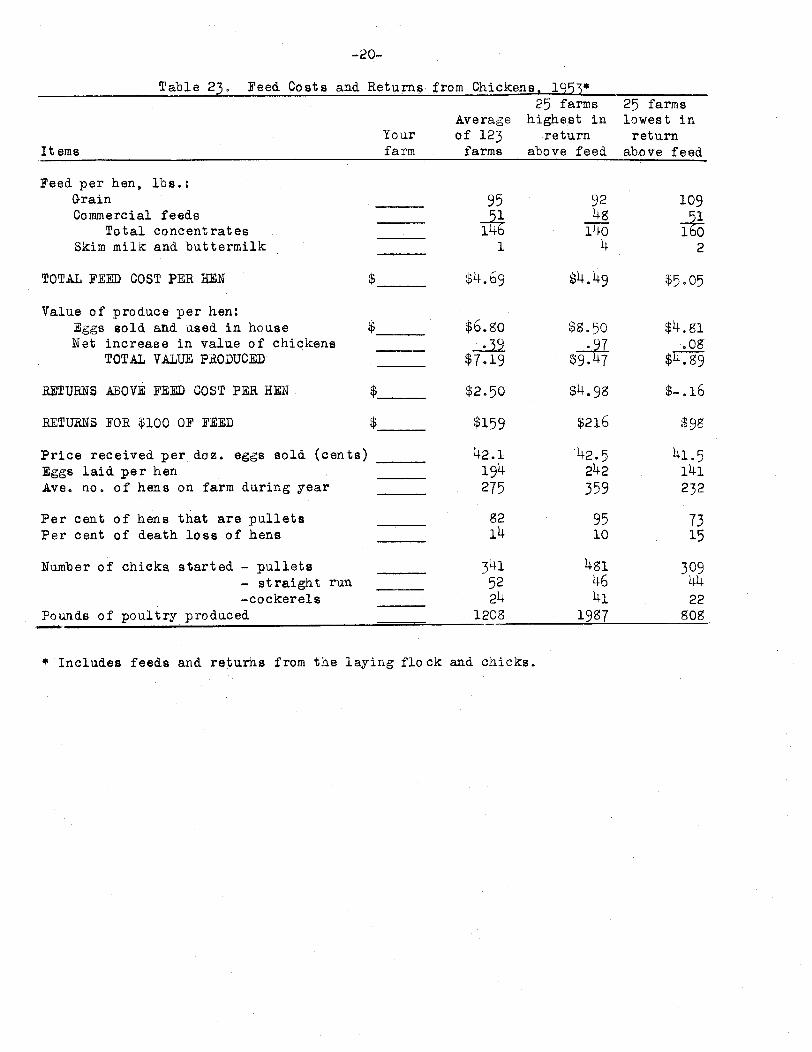
Table 23. Feed Costs and Returns from Chickens, 1953 *_.25 farms 25 farms
Average highest in lowest inYour of 123 return return
Items farm farms above feed above feed
Feed per hen, lbs.:Grain 95 92 109Commercial feeds _5148 51
Total concentrates ____6
Skim milk and buttermilk 1 4 2
TOTAL FEED COST PER HEN $$4.69 $4.49 $5.05
Value of produce per hen:Eggs sold and used in house $ $6.80 $8.50 $4.81Net increase in value of chickens _39 .97 .08
TOTAL VALUE PRODUCED $7.19 $9.47 $4.
RETURNS ABOVE FEED COST PER HEN $ $2.50 $4.98 $-.16
RETURNS FOR $100 OF FEED $ $159 $216 $98
Price received per doz. eggs sold (cents) _421 '42,5 415Eggs laid per hen 194 242 141Ave. no. of hens on farm during year 275 359 232
Per cent of hens that are pullets 82 95 73Per cent of death loss of hens 14 10 15
Number of chicks started - pullets 341 481 309- straight run 52 46 44-cockerels 24 41 22
Pounds of poultry produced 1208 1987 808
* Includes feeds and returhs from the laying flock and chicks.
-21-
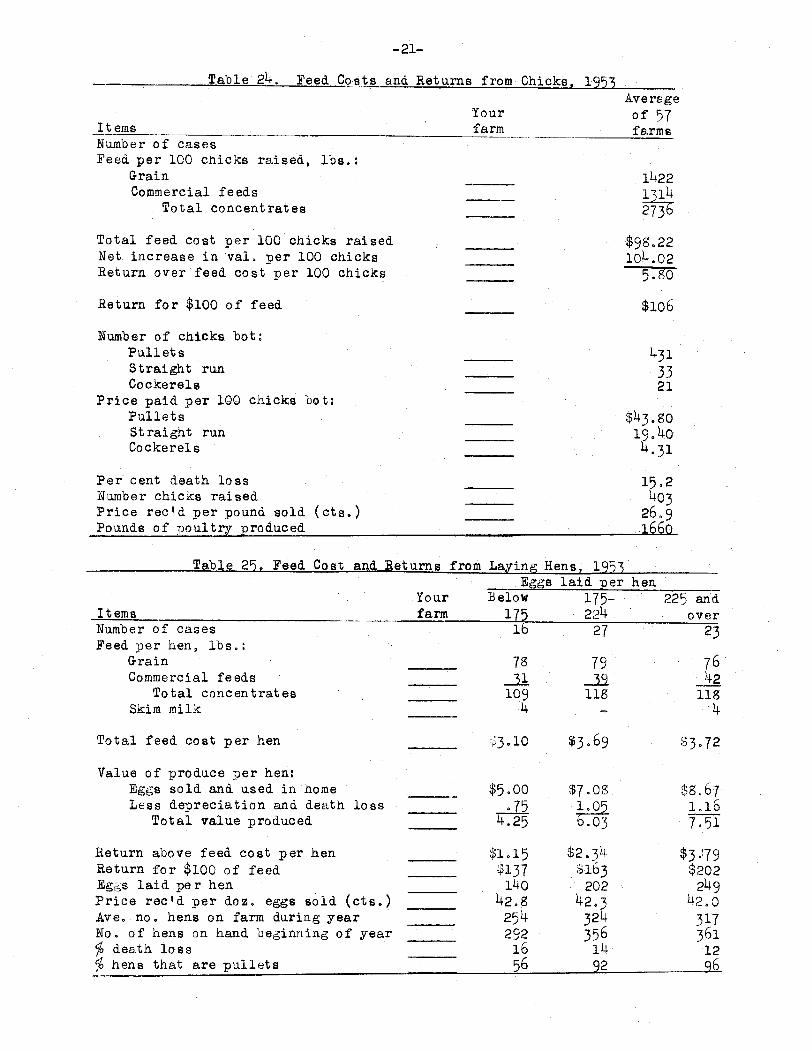
Table 24. Feed Costs and Returns from Chicks. 1953_ .~ ~ ~ ~ ~ ~ ~ 5
ItemsNumber: of casesFeed per 100 chicks raised, lbs.:
GrainCommercial feeds
Total concentrates
Yourfarm
Total feed cost per 100 chicks raisedNet increase in valo per 100 chicksReturn over feed cost per 100 chicks
Return for $100 of feed
Number of chicks bot:PulletsStraight runCockerels
Price paid per 100 chicks bot:PulletsStraight runCockerels
Per cent death lossNumber chicks raisedPrice recod per pound sold (cts.)Pounds of poultry produced
Table 25. Feed Cost and Returns
YourfarmItems
Number of casesFeed per hen, lbs.:
GrainCommercial feeds
Total concentratesSkim milk
Total feed cost per hen
from Laying Hens, 1953Eggs laid per hen
Below 175- 225 andI 175 224 over
16 27 23
78
1094
·.+ 3.10
Value of produce per hen:Eggs sold and used in homeLess depreciation and death loss
Total value produced
Return above feed cost per henReturn for $100 of feedEggs laid per henPrice rec'd per doz, eggs sold (cts.)Ave. no. hens on farm during yearNo. of hens on hand beginning of year% death loss% hens that are pullets
$5 o00.75
4.25
$1.15$137
14042.8
254292
1656
79
118
$3.69
$7.08
b.03
$2.34$163
20242.3
324356
1492
Ave rageof 57farms
142212731427J
$98.2210o402
5.go
$106
4313321
$43. o19.404.31
15.240O3
26.9166o
7642
1184
$3.72
$8.671.167 51
$3 .79$202
2494200
31736112q96
-- - . --- I
I--. - '*' , i ; --- -- -
-- · I_ I__, _ , # L· .
p

Table 26. Feed Costs and Returns from a Farm Flock of Sheep, 195318 farms 18 farms
Average highest in lowest inYour of 37 returns returnsof 37
ItemsFeeds per head, *lbs.:
ConcentratesLegume hayOther haySilage
Feed cost per head:ConcentratesRoughage sPasture
TOTAL FEED COSTSValue of produce per head:
WoolNet increase in value of sheep
TOTAL VALUE PRODUCED
RETURN ABOVE FEED COST PER HElAD
RETURNS FOR $100 OF FEED
Price per cwt. of lambs soldPrice per lb. wool sold (cts.)Pounds of wool per sheep sheared
Number of ewes kept for lambing% lamb crop**% death loss**
Pounds of sheep produced
No, of head of sheep*
farm farms above feed above feed
81316
31124
$
$ *$ ----
$1.973.312-53
$7.81
$3*755.15
$8.90
7g24g
2092
$1.942.572.51
$7.02
$3.758.18
$11.93
8737943161
$2.054.022.57
$3,792.11
$5.90
$1.09
$120
-$ $18.6250.29.3
3494
8.7
2377
46.9
$170
$19.4951.59.6
27978.1
2028
36.9
$68
$17.9549.0
9.1
4o949.5
2765
57.3
* Two lambs under six months of age considered as one head** Lambs which die during month of birth are not included.
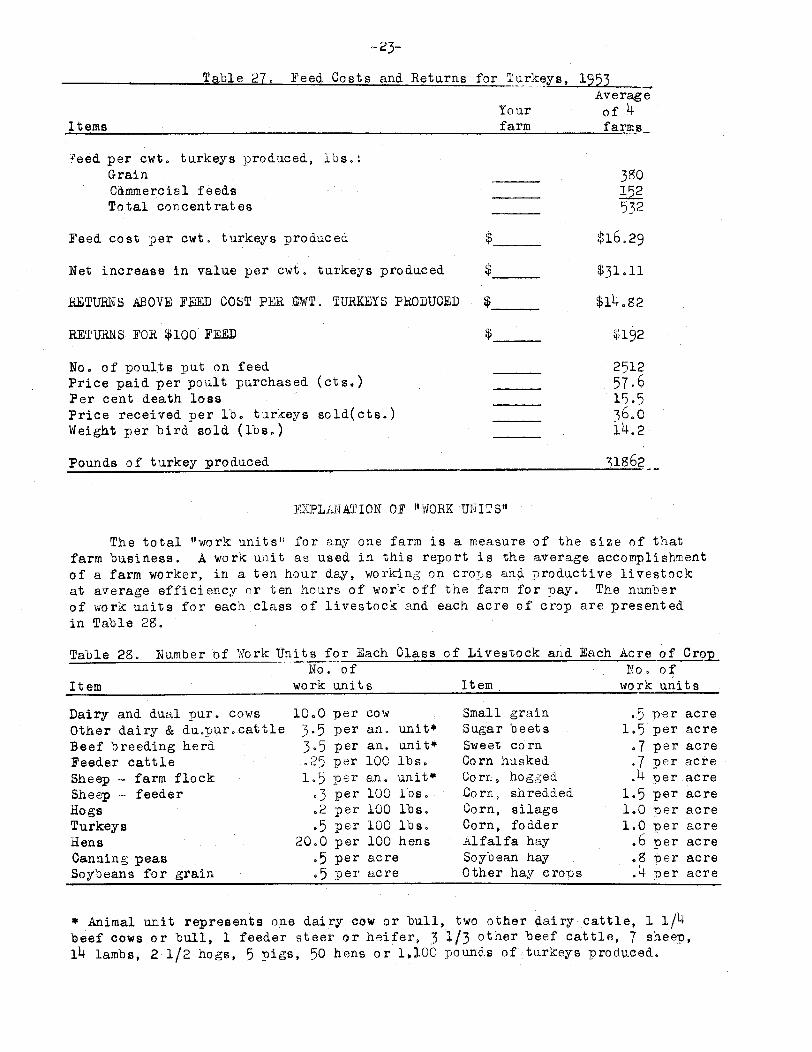
Table 27. Feed Costs and Returns
I tems
for Turkeys, 1953Average
Your of 4farm farms
?eed per cwto turkeys produced, lbs.:GrainCUmmercial feedsTotal concentrates
Feed cost per cwt. turkeys produced
380152532
$
Net increase in value per cwto turkeys produced
RETURNS ABOVE FEED COST PER CiWT. TURKEYS PRODUCED
RETURNS FOR $100 FEED
No. of poults put on feedPrice paid per poult purchased (cts.)Per cent death lossPrice received per lb. turkeys sold(cts,)Weight per bird sold (lbso)
$16.29
$31.11
$
$
$14.g2
$192
251257.615.536.0i4.2
Pounds of turkey produced 31862
E:IPLANATION OF "WORK UNITS"
The total "work units" for any one farm is a measure of the size of thatfarm business. A work unit as used in this report is the average accomplishmentof a farm worker, in a ten hour day, working on crops and productive livestockat average efficiency or ten hours of work off the farm for pay. The numberof work units for each class of livestock and each acre of crop are presentedin Table 28,
Table 28. Number of Work Units for EachNo. of
Class of Livestock and Each Acre of CropNo. of
Item work units Item work units
Dairy and dual pur. cows 10.o per cow Small grain .5 per acreOther dairy & du.pur.cattle 3.5 per ano unit* Sugar beets 1.5 per acreBeef breeding herd 3.5 per an. unit* Sweet corn .7 per acreFeeder cattle .25 per 100 lbs. Corn husked .7 per acreSheep farm flock 1,5 per an. unit' Corn, hogged .4 per acreSheep - feeder o3 per 100 lbs. Corn, shredded 1.5 per acreHogs .2 per 100 lbso Corn, silage 1.0 per acreTurkeys -5 per 100 lbs. Corn, fodder 1.0 per acreHens 20.0 per 100 hens alfalfa hay .6 per acreCanning peas 5- per acre Soybean hay .p8 er acreSoybeans for grain .5 per acre Other hay crops .4 per acre
* Animal unit represents one dairy cow or bull, two other dairy cattle, 1 1/4beef cows or bull, 1 feeder steer or heifer, 3 1/3 other beef cattle, 7 sheep,14 lambs, 2 1/2 hogs, 5 pigs, 50 hens or 1,100 pounds of turkeys produced.
-_ ·_
-

... · Table 29. Summary b;y YearsA nar i-o' Avreraze Averaoe Average Average
1928-29 1930-34 199 190-4 15-48 1949 1950 1951 1952 19
Number of farms 148 140 149 177 171 164 165 162 160 1
Acres in farm 170 199 218 227 223 223 222 222 229 2Crop acres in farm 116 136 147 148 148 150 153 153 158 1Farm inventory $24574 $19851 $20286 $25912 $30428 $35300 $37768 $42333 $45863 $432wt~~~~~~~~~~~~~~~g83$3
Farm earnings (see page 27.)FARM EXPENSES
CattleHogs boughtSheep boughtPoultry bought
Horses boughtMisc, livestock expenseMisc, crop expensesFeed bought
Custom work hiredPower mach. (new & exp.)Mach. and equip. (new)Mach. and equip. (upkeep)
$ 14185
637
3666
186440
39919072
$ 83521441
3364
160313
32112255
$ 213729480
4394
222535
559281
67
$ 441154
64142
32124301
1273
165717392144
$ 447 $188
76175
14
217682
2000
3861421808277
636217
18182
12268780
1773
4612128990290
$ 807179
10148
9315819
1972
44621861251
304
$ 1271219
54145
5327876
2299
52221941380
346
$ 1084 $136
26161
11
323957
2383
58319321181
364
53
57265689
653231
35170
4421
11702148
59219341274380
Bldgs., fencing (new)Bldgs., fencing (upkeep)Hired laborTaxes and insuranceGeneral farm
Total farm purchases
Decrease in farm capitalBoard to hired laborInterest on farm capitalUnpaid family labor
Total farm expenses
13052
27229830
$2,440
1021,228
358$4, 128
813224331328
$1, 955
23087
992261
$3,525
24579
398281_3i
$3,298
1451,014
239$4, 696
331188585303
$5,408
1581,296
321$7,188
696 1109303 403813 990418 575
87 115$9, 008 $10, 947
166 2031,521 1,765
518 483$11,9 213$13,398
1139409891656116
$11,657
2051,888
462$1L, 212
1218
359885671128
$12, 899
1892,117
$1 05,$15,710
972 835377 370901 806756 777140o 15
$12,287$11, 945
170 1382,293 2,164
480 523$15, 230 $14,770
· - --- - --- --- - - -- �� - -- - - -
I
-ir
t
~____~____________ ____ _Table 29. Summary by Years (continued) ________
Average Average Average Average Average-1928-29 193n-34 9 19935939 1 94 :44 14.45 _ 4 j __ 12_ _
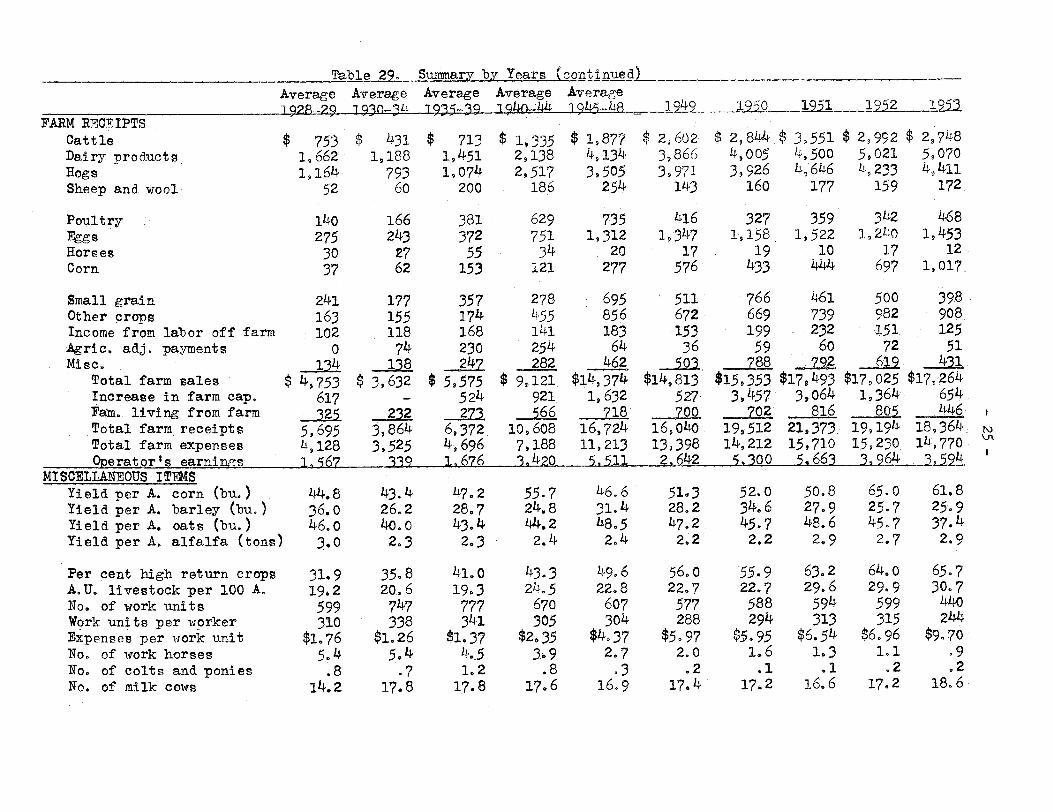
FARM R7CIPTSCattle $ 753 $ 431 $ 713$ 1335 $ 1,877 $ 2,602 $ 2,844 $ 3551 $ 2,992 $ 2Dairy products 1,662 1,188 1,451 2,138 4,134 3,866 4,005 ,500 5,021 5,Hogs 1,164 793 1,074 2,517 3,505 39971 3,926 4,646 4,233 4Sheep and wool 52 60 200 186 254 143 160 177 159
Poultry 140 166 381 629 735 h16 327 359 342Fggs 275 243 372 751 1,312 1,347 1,158 1,522 l,2h0 1Horses 30 27 55 34 20 17 19 10 17Corn 37 62 153 121 277 57633 444 697 1
Small grain 241 177 357 278 695 511 766 461 500Other crops 163 155 174 1155 856 672 669 739 982Income from labor off farm 102 118 168 141 183 153 199 232 151Agric. adj. payments 0 74 230 254 64 36 59 60 72Misc. 1348 247 282 462 50388 792 619
Total farm sales $ 4,753 $ 3,632 $ 5,575 $ 9,121 $14,374 $14,813 $15,353 $17,493 $17,025 $17Increase in farm cap. 617 524 921 1,632 527 3,457 3,064 1,364Fan. living from farm 325 232 273 566 18 700 816 805Total farm receipts 5,695 3,864 6,372 10,608 16,724 16,040 19,512 21,373 19,194 18Total farm expenses 4,128 3,525 4,696 7,188 11,213 13,398 14,212 15,710 15,230 14Operator's earnings l? 1i67 339 1.,676 3.420 5 511 2,642 5.300 5,.663 3.964 3
MISCELLANEOUS ITEMSYield per A. corn (bu,) 44,8 43.4 47.2 55.7 46.6 51.3 52.0 50.8 65.0Yield per A. barley (bu.) 36.0 26.2 28.7 24*8 31.4 28.2 34.6 27.9 25.7Yield per A. oats (bu.) 46.0 40.0 43.4 44.2 48.5 47.2 45.7 48.6 45.7Yield per A. alfalfa (tons) 3.0 2.3 2.3 2,4 2.4 2.2 2,2 2,9 2*7
Per cent high return crops 31,9 35.8 410 . 43,3 49,6 56.0 55,9 63.2 64.0A.U. livestock per 100 A. 19,2 20.6 19.3 24.5 22.8 22.7 22 7 29.6 29.9No, of work units 599 747 777 670 607 577 588 594 599Work units per worker 310 338 341 305 304 288 294 313 315Expenses per work unit $1.76 $1.26 $1.37 $2.35 $4.37 $5.97 $5.95 $6.54 $6.96 $No. of work horses 5.4 5.4 4.,5 3.9 2,7 2.0 16 1,3 1.1No. of colts and ponies .8 .7 1.2 .8 .3 .2 .1 .1 .2No. of milk cows 14.2 17.8 17.8 17.6 16 9 17. 4 17*2 16.6 17.2
L25-
,748,070,411172
468453
12,017-
39890812551
,264654446 ,
9364 n,770 '
61.825.937.42.9
65.730.7
440244
9.70.9.2
18.6

Table 29 S umrarar b Yea'rs on t_.g ey b rs (continued_)___________
AverageA eragAverag e Average AverageMisc. Items (cont.) 1928-29 1930-34 935-3 .19.40-4. 195-8. ... 19 .0 1 51. 1i952 .
No. of litters of pigs 9.3 10.8 9.5 i4.4 11.2 13.7 l'.0 15.5 13.4Lbs. of hogs produced 12,706 15,153 13,438 21,586 17,772 21,438 21,593 23,957 22,967 18No. of head of shee 7.0 13.5 18.8 15.8 11.2 9.3 84 10. 10.1 10No. of hens 136 169 182 222 239 220 219 224 217Lbs. B.F. per dairy cow 244 240 238 252 271 305 312 307 299Lbs. BF. per dual pur. cow - - 185 177 197 206 204 185Pigs weaned per litter 6.3 6*1 6.4 6.2 6.4 6.7 6.6 6.5 6.9No. of eggs laid per hen 95 114 131 45 174 191 198 193 192
PRICE RECEIVED PTR:Lb. B.F. sold as cream $.52 $.28 3 34 $.47 $.82 $.70 $.70 $.79 $.85Cwt. hogs sold 8.92 4.98 8.26 10.93 19.74 17.84 18.25 19.69 17.43 2:Cwt. feeder cattle sold -- 11.55 19.87 23.32 27.31 33.83 28.91 2<Lb. wool sold .36 .16 .25 .39 43 5 .55 .93 .44Doz. eggs sold .28 .16 .19 .27 39 .40 .33 .44 .37Lb. turkey sold - - .20 .27 .38 . 0 .36 .39 .38
RETURN ABOVE FWE2D COST PEER:Dairy cow $76.50 $28.15 $49.95 $81.83 $165.33 $145.03 $160.62 $189.01 $178.78 $13<Dual purpose cow - - - 51.55 105.44 99.52 10. 44 130.72 89.25 3Cwt. hogs produced 1.50 .48 2.98 3.93 6.25 5.43 6.99 5*94 2.68 1Head of sheep 5.50 .81 2.82 4.63 7.24 6.70 13.25 14.72 1.20Hen 1.82 .99 1.12 1.82 2.14 2.99 1.62 2.73 1*00 ;Cwt. turkeys prod. - 10. 81 13.54 14. 09 16.52 10.83 12.02 10.40 1'
FEED COST PER:Dairy cow $69.50 $47.30 $L4.93 $63.13 $121.46 $130.28 $136.97 $144.56 $144.82 $14Dual purpose cow - - - 52.08 83.46 88.73 99.65 101.54 98.59 10Cwt. hogs produced 7.66 4.21 5. 10 7.52 13.94 10.L 0 12 20 13.31 13.87 1Head of sheep 2.82 2.23 2.62 3.30 5.12 5.35 6.25 7.18 7.71Hen 1.62 1.13 1.57 2.38 4.50 3.95 4.49 4.83 5.13Cwt. turkeys -rod. -- 8. 47 12. 86 20.34 17.08 19*32 21,11 21.61 1Horse 55*09 35.59 36.02 41. 52 43.96 36.75 42.66 44.31
PRICE OF FEED:Corn (per bu.) $.70 $.45 $59 $.71 $1.36 $1.02 $1.20 $1.36 $1.34 $Barley (per bu. ) .60 . 2 9 .59 1.39 99 1.20 1. 23 1 21Oats (per bu. ) .48 .26 .28 .46 .79 .59 72 .81 .76Bran (per cwt.) 1.70 .98 1.22 1.80 2.74 2.85 2.80 3.20 3.50Oilmeal (per cwt.) 3.00 1.96 2.12 2.30 3.80 4.00 3495 3.85 4.85Alfalfa (per ton) 14.75 11.10 9.30 9.90 18.00 20.00 21.00 19.00 17.00 1
L9sa11 8,79911.32173091816,7194
$.751.280.73.50.42.36
8.364.23 X0.17 I1.092.50
1.013.o47.814.696.29
1.311.11
.712.954.107.50

-27-
Foot note for pages 24, 25, and 26.
The values of farm real estate in 1931 were reduced approximately 25 percent from 192=-1930 values. The values in 1932 were reduced about 29 per centfrom the 1931 values. Only land was affected by the reduction in 1931, but in1932 buildings and improvements were cut 25 per cent. In 1936 the values ofland were adjusted upward 10 per cent. The value of dairy cows was also adjust-ed downward in 1932 and upward in 1936. The capital losses were not includedin the inventory decreased in the financial statement but the changes in valua-tion resulted in variations in the interest charge. No changes in the basis ofinventory valuations were made in the years 1933 to 1935 and 1937 to 1953o
The charges for unpaid family labor and board for hired labor were alsochanged from year to year. The rates used for the period 1928 to 1953 wereas follows:
Unpaid Board for Unpaid Board forYear family labor hired labor Year family labor hired labor
192S-30 $60 $20 1941 $50 $201931 40o 15 1942 6o 251932-34 30 10 1943 75 251935 40 15 1944 85 251936 43 18 1945 90 251937-40 45 18 1946 100 30
1947-53 125 36
Several changes were made in the 1940 records. The value of the housewhich had previously 'been omitted from the farm business was included and arental charge equal to 10 per cent of the average value of the house was in-cluded with the farm perquisites. The standards used in the calculation ofwork units were changed in accordance with the new information made available.This latter change also affected the work units per worker and the factor ofexpense per work unit. The acres in protected woodlots, roads, waste and farm-stead were omitted from the acreage used in the calculation of amount of live-stock per 100 acres. Several new livestock statements were added. Cattle wereclassified into two groups: "specialized dairy cattle" and "dual purpose cattle".Statements for beef breeding cattle, feeder cattle and feeder sheep were alsoincluded,
The crop ratings used in calculating the percentage of the tillable landin high return crops were changed considerably in 1944 and the animal unitequivalent were changed in 1951.
The standards used in the calculation of work units were changed in 1953.Also the value of the house, which had been included in the investment of thefarm buildings since 1940. was omitted from all the records except the networth statements,
These adjustments should be considered in comparing 1953 results withprevious years,