and pricing in south africa - eskom · an overview of electricity consumption and pricing in south...
TRANSCRIPT

An overview of electricity consumption
and pricing in South Africa
An analysis of the historical trends and
policies, key issues and outlook in 2017 Report prepared for Eskom Holdings SOC Ltd
Date: 24 February 2017
1
Disclaimer
This Report is prepared by Deloitte Consulting Pty (Ltd). ‘Deloitte’ who was engaged by Eskom Holdings SOC Ltd.
‘Eskom’. Deloitte does not accept any duty of care, to any other person or entity other than Eskom. The Report has been
prepared for the purpose set out in the Engagement Letter between Deloitte and Eskom.
Deloitte understands that Eskom will potentially provide a copy of this Report to the National Energy Regulator of South
Africa (NERSA) in support of their upcoming tariff application. We agree that a copy of our Report can be provided to
NERSA and also released publicly on the basis that it is published for general information only and that we do not accept
any duty, liability, or responsibility to any person (other than Eskom) in relation to this Report.
Recipients of this Report should seek independent expert advice as this report was not prepared for them or for any other
purpose than that detailed in the engagement terms with Eskom and cannot be relied upon other than for this.
This report is based largely on publically available information. We have not audited the information, nor do we provide
any assurance on the underlying information or the analysis thereof.
Information contained in the Report is current as at the date of the Report, and may not reflect any event or circumstances
which occur after the date of the Report.

An overview of electricity consumption and pricing in South Africa | Contents
2
Contents
Contents ..................................................................................................................................... 2 List of Tables .............................................................................................................................. 3 List of Figures ............................................................................................................................. 4 Executive Summary .................................................................................................................... 5 Introduction ............................................................................................................................. 15 1. Electricity consumption in South Africa – composition, key drivers, and the outlook ......... 18
1.1 Introduction ................................................................................................................................................. 18 1.2 Analysis of the structure of the SA economy................................................................................... 18 1.3 National electricity consumption by sector ...................................................................................... 19 1.4 Key drivers of electricity demand ........................................................................................................ 22 1.5 Drivers of electricity demand in South Africa.................................................................................. 25 1.6 Review of Eskom sales forecast variance for MYPD3 period ..................................................... 31 1.7 Outlook for electricity consumption .................................................................................................... 33 1.8 Conclusions ................................................................................................................................................... 36
2. Trends in electricity prices – a critical review of historical pricing policy and decisions .... 38
2.1 Introduction ................................................................................................................................................. 38 2.2 Historical trend in electricity prices .................................................................................................... 38 2.3 History of electricity pricing in South Africa .................................................................................... 41 2.4 Critical review of government’s policy of subsidising electricity ............................................ 46 2.5 Key considerations not adequately addressed in recent regulatory decisions on
electricity tariffs ....................................................................................................................................... 50 2.6 Key findings and conclusion ................................................................................................................... 52
3. International competitiveness of South African electricity tariffs ...................................... 55
3.1 Introduction ................................................................................................................................................. 55 3.2 The structure of the electricity supply industry and implications for tariff-setting and
benchmarking ............................................................................................................................................ 55 3.3 International comparison of electricity prices ................................................................................ 59 3.4 Conclusion ..................................................................................................................................................... 63
4. Requirements of an efficient electricity pricing regime ...................................................... 65
4.1 Introduction ................................................................................................................................................. 65 4.2 Requirements of an effective electricity pricing regime ............................................................. 65 4.3 Additional requirements for a monopoly utility that is consistent with efficient delivery
of electricity services. ............................................................................................................................ 70 4.4 Support for the transition to cost-reflective electricity prices in South Africa .................. 72 4.5 What is the gap between actual and cost-reflective electricity tariffs in South Africa? . 73 4.6 Support for the transition to cost-reflective electricity prices in the SADC region .......... 74 4.7 Barriers to the removal of electricity subsidies and strategies for reform .......................... 75 4.8 Some specific guidelines for the successful removal of electricity price subsidies in
South Africa to support a transition to cost-reflective prices ................................................. 77 4.9 Conclusion ..................................................................................................................................................... 79
Reference List ........................................................................................................................... 81

An overview of electricity consumption and pricing in South Africa | List of Tables
3
List of Tables
Table 1: Price elasticities of electricity demand, 2002-2007 vs. 2008 to 2012 ...................................... 28
Table 2: Electricity intensity - South Africa and Rest of World (GWh/PPP adj. $ million) 1971-2010 ........ 30
Table 3: Eskom customer segmentation and tariff plans .................................................................... 57
Table 4: NERSA guidelines on determination of Tariff increases 2015-2016 .......................................... 58
Table 5: South Africa’s performance in the NUS ranking of countries electricity prices, 2011 to 2015 ...... 61

An overview of electricity consumption and pricing in South Africa | List of Figures
4
List of Figures
Figure 1: Evolution of the South African economy, 1975 - 2015 ......................................................... 19
Figure 2: Electricity consumption by sector, 2012 ............................................................................. 20
Figure 3: Trend in electricity consumption by customer category, 1993-2013 ....................................... 21
Figure 4: Estimates of the electricity intensity of selected sectors, 2012 .............................................. 22
Figure 5: Historical trend in electricity sales in South Africa, GWh, 1996 to 2016 .................................. 25
Figure 6: Relationships between growth in real GDP and electricity consumption (GWh), 1997 to 2016 ... 26
Figure 7: Price and income elasticity of electricity demand in South Africa, 1986 to 2005 ...................... 27
Figure 8: Trend in the electricity intensity of the SA economy vs. real electricity prices, 1980 to 2016 .... 29
Figure 9: Contribution of output, structural changes, and efficiency to total electricity consumption (1993
to 2006) ...................................................................................................................................... 31
Figure 10: Eskom MYPD3 sales volume variance - forecast vs. actual .................................................. 32
Figure 11: GDP and Eskom sales growth variance - forecast vs. actual ................................................ 33
Figure 12: Real GDP and Eskom’s SA electricity sales – historical and 5-year forecasts.......................... 34
Figure 13: Electricity intensity of the SA economy, historical and forecast ............................................ 35
Figure 14: Trend in Average Electricity Prices realised by Eskom per kWh (1973 to 2015/16) ................ 40
Figure 15: Composition of Eskom sales by customer category, 2014/15 .............................................. 56
Figure 16: Variation in the standard residential active charge tariff (R/kWh)1 levied by selected
municipalities and Eskom, 2015/16 ................................................................................................. 59
Figure 17: International comparison of the price of electricity delivered in June 2015, NUS Survey ......... 60
Figure 18: International comparison of electricity tariffs for industrial consumers ($US/kWh) ................. 62
Figure 19: International comparison of electricity tariffs for residential consumers ($US/kWh) ............... 63
Figure 20: Effect of ‘lumpy’ investments on prices set at short-run marginal cost ................................. 67
Figure 21: Tariff formula – Eskom’s allowable revenue ...................................................................... 68
Figure 22: Iterative feedback loop for price setting ........................................................................... 71
Figure 23: Size of the gap between actual and cost-reflective tariff in 2014/15 .................................... 73

An overview of electricity consumption and pricing in South Africa | Executive Summary
5
Executive Summary
I. Purpose of the study
This report was commissioned by Eskom as part of its preparation for its fourth Multi-Year Price
Determination (MYPD4) tariff application. The overall objectives of this report are:
To provide stakeholders with a broad historical context of electricity prices and consumption
ahead of the forthcoming tariff application.
To highlight some of the main criticisms of electricity pricing policy in South Africa and the key
issues Eskom and the regulator face.
To discuss the requirements of an efficient electricity pricing regime and the economic principles
that underpin the setting of equitable and efficient tariffs under a regulated and vertically-
integrated monopoly provider.
To examine the international competitiveness of electricity prices in South Africa.
To provide both general and specific guidelines and strategies for the successful removal of
electricity price subsidies in South Africa, in support of a gradual transition to cost-reflective
prices.
The report updates and expands on analysis that was commissioned by Eskom ahead of its MYPD3
application in 2012, titled “The economic impact of electricity price increases of various sectors of the
South African economy” (Deloitte, 2012).
II. Key findings and recommendations
The report is structured around four chapters and the key findings of the report have been summarised, by
chapter, below.
i. Chapter One: Electricity consumption in South Africa – composition, key
drivers, and the outlook
The purpose of this chapter is to provide an overview of the historical trends in electricity consumption in
South Africa, the changing composition of electricity sales by sector, key determinants of demand,
methods of decomposing demand, and a brief analysis of the medium-term energy demand outlook.
The relatively energy-intensive mining and manufacturing industries are the dominant
consumers of electricity in South Africa – they account for roughly 60% of national
consumption but only 22% of GDP.

An overview of electricity consumption and pricing in South Africa | Executive Summary
6
Despite the steady decline in the combined contribution of manufacturing and mining sector to GDP (from
31% of GDP in 1995 to 22% in 2015), these sectors are still responsible roughly 60% of total national
electricity consumption. As such, growth in the relatively energy-intensive mining and manufacturing
industries remains an important determinant of overall national demand.
The contribution of the residential sector to total national electricity consumption has increased steadily
over the past two decades (from 16% in 1993 to 23% in 2013).
The results of several local and international studies on the key determinants of electricity
consumption suggest that income or GDP is the dominant driver of demand.
A review of the international literature suggested that there are two common approaches to decomposing
the trend in national electricity consumption – the first is to estimate the price and income elasticity of
demand (isolating the impact of each key driver) and the second is an approach used by the IEA which
decomposes electricity demand into an activity, structural and efficiency effect. that the international
literature suggests that electricity demand is generally more responsive to income than to price and that
income over time is typically the dominant demand driver. A review of two studies that followed the
alternative IEA approach also found that activity/income is the dominant driver of electricity demand in the
long-term, while the share of electricity in total energy demand and efficiency effects also play a
secondary but still significant role. The changing structure of the economy was found to have the least
impact.
The sensitivity of consumers to changes in electricity prices appears to vary significantly over
time and depends on the direction and magnitude of price increases and the prevailing price
level.
It also appears from the literature that while the income elasticity of electricity demand is positive and
relatively stable over time there are likely to be large variations in the sensitivity of consumers to price.
Blignaut, lnglesi-Lotz and Weideman (2015) based on a survey of over 20 studies, that the sensitivity of
consumers to tariff changes is dynamic, that it changes over time based on the prevailing conditions in a
country’s electricity market and that it also differs from region to region.
There is evidence of strong correlation between GDP growth and electricity sales in South
Africa - previous studies found that the income elasticity of demand in South Africa between
1990 and 2005 was almost unit elastic meaning that a 1% increase in GDP was associated with
close to a 1% rise in electricity demand (all else assumed equal).
Our analysis of South African GDP and electricity sales growth data in the 20 years to 2016 provides
evidence of a very strong positive correlation between GDP and electricity consumption in South Africa -
the correlation coefficient between the two series over this period is 0.93. In a study on the determinants
of electricity demand in South Africa from 1986 to 2005, Inglesi-Lotz (2011) found that income was the
dominant driver of demand over the period and that the income elasticity of demand was close to 1 (unit
elastic) for most of the period beyond 1990– meaning that a 1% increase in GDP was associated with a
1% increase in electricity demand.

An overview of electricity consumption and pricing in South Africa | Executive Summary
7
In recent years and particularly since FY2012, growth in Eskom’s local electricity sales has been much
lower than growth in GDP. While GDP expanded at an average rate of 1.9% y/y between FY2012 and
FY2016 Eskom’s local electricity sales were falling, averaging -0.9% y/y. In FY2013 electricity sales fell by
~4.2% y/y as a sharp fall in the global demand for commodities hit production in South Africa’s relatively
electricity-intensive mining and manufacturing industries. Supply constraints also put a brake on demand
as Eskom re-introduced rotational loadshedding in early 2014, and there was regular loadshedding
between November 2014 and September 2015.
The price elasticity of electricity demand in South Africa for industrial consumers is estimated
at between -0.5 and -0.2 for the 5-year period post 2007 when real prices were rising sharply.
The results of a study by Blignaut, Inglesi-Lotz & Weideman (2015) suggest that while the price elasticity
of electricity demand in South Africa is relatively inelastic, industrial sectors became more responsive to
changes in the price of electricity in the 5-year period where prices increased sharply in real terms. The
authors noted that electricity prices had little to no impact on demand over the period 2002 to 2007 (when
there was very little increase in real tariffs). By contrast, for the 5-year period post-2007, when real
electricity prices were rising sharply, the price elasticity of demand was significant and negative for 9 of
the 11 industrial sectors considered and ranges from roughly -0.5 to -0.2. This means that a 1% increases
in prices is expected to result in a 0.2% to 0.5% decrease in demand. The implication for Eskom sales
forecasters and policymakers when real electricity price increase is that large consumers are likely to
respond to price by reducing consumption.
Other factors that have been identified in the international literature as having a significant influence on
aggregate demand for electricity are the energy intensity of economic growth and the impact of
technological change (IEA, 2013). The electricity intensity of the South African economy has declined
steadily since 1998 but the trend accelerated as real electricity prices began to rise in 2008.
An analysis of the 36-year trend in electricity intensity of the South African economy (1980 to 2016)
shows that there was a strong negative correlation between the electricity intensity of economic activity
and the real (inflation-adjusted) electricity price. The correlation coefficient between the two series over
the period is -0.66, meaning that 66% of the change in electricity intensity could be explained by changes
in the electricity price. Because the electricity intensity of production varies considerably from one sector
to the next, changes in the structure of an economy can have a significant bearing on the longer-term
trend in electricity demand. The electricity intensity of the SA economy has declined steadily since 1998,
as the South African economy continued to transition away from its historical reliance on the relatively
energy-intensive mining and manufacturing sectors. The declining trend in the electricity intensity also
accelerated as electricity prices which had stabilised at low levels in 2001, rose sharply in real terms from
2008.
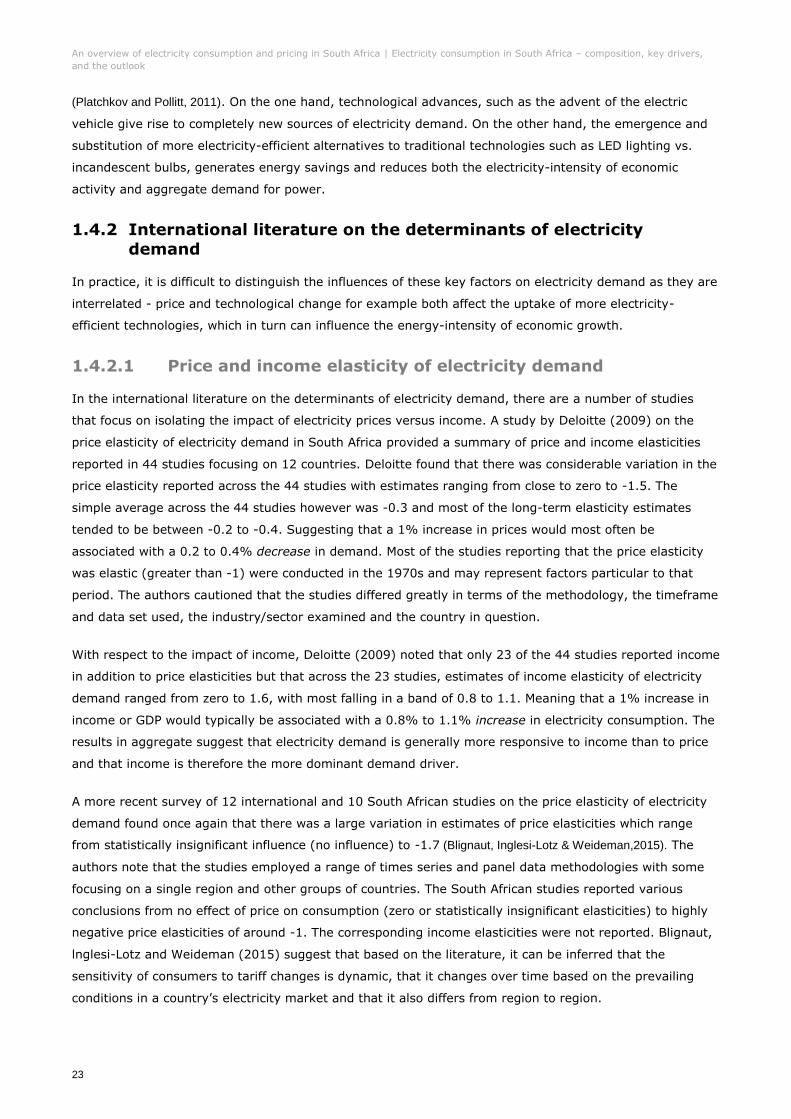
Electricity sales fell at an average rate of -0.3% y/y over the first three years of the 5-year
MYPD3 period (from 2013/14 to 2017/18) - much lower than the annual growth of 1.8% than
Eskom anticipated when it submitted its tariff application in 2011. Much of the sales variance
can be attributed to slower-than-anticipated GDP growth, with a drop in the global demand for
commodities and re-emergence of supply constraints also playing a role.

An overview of electricity consumption and pricing in South Africa | Executive Summary
8
Actual growth in electricity sales for the 5-year MYPD3 period which runs from 2013/14 to 2017/18 has
been significantly lower than what Eskom forecast in 2011 (as input to its application). Eskom forecast
that sales would grow at an annual average rate of 1.8% while actual sales for the first three years of
MYPD3 fell at an annual average rate of -0.3% with the variance between forecast and actual sales
consequently widening every year. Much of the sales variance can be attributed to much slower than
anticipated growth in economic activity, Eskom assumed that real annual GDP growth would average 4.5%
but GDP growth averaged just 1.5% in the first three years of MYPD3. Slower-than-anticipated sales in
first three years of MYPD3 were however also a result of unforeseen fall in global demand for commodities
and the re-emergence of local supply constraints.
With annual GDP growth forecast to average 1.8% for the 5-year period to 2021 (IMF & EIU
forecasts), growth in electricity sales is unlikely to average more than 1% per annum.
Growth in electricity sales are likely to continue to disappoint relative to MYPD3 forecasts which means
that Eskom will face a widening revenue shortfall in the outer years of the MYPD3 period.
ii. Chapter two - Trends in electricity prices – a critical review of historical pricing
policy and decisions
Since the establishment of Eskom’s earliest predecessor, the ESC in 1923, the electricity supply
industry has always been dominated by a single state-owned and vertically-integrated
monopoly.
As a result, the electricity price has always been heavily influenced by the changing priorities of
government and this is part of the reason why it has arguably never reflected the true economic cost of
supply.
For much of the past four decades real (inflation-adjusted) electricity prices in South Africa
were declining but there were also periods of sharply rising real electricity tariffs - the first in
the early 1980s and the second in 2008/9 - both met with significant public resistance.
After a substantial over-investment in electricity generation capacity in the late 1970s and early 1980s
government allowed electricity prices to steadily fall. Between 1978 and 2004 the real average price of
electricity1 fell by more than 40% and by 2004/5 average electricity prices in South Africa were among the
lowest in the world. From 2008, the trend in prices took a dramatic turn when the power supply crisis that
had been threatening for several years, reached a critical point and Eskom introduced loadshedding.
Eskom was finally given the green light to embark on a massive build programme - the first major
increase in power generation capacity the utility had undertaken in almost 30 years. But at this point
electricity tariffs were at long-term-lows and Eskom had neither the cash reserves nor the future revenue
streams to cover the cost of the new build.
Between 2008 and 2013 NERSA approved several sharp increases in annual tariffs and electricity
prices more than doubled in real terms (inflation-adjusted) rising by a cumulative 114%.
1 Average prices are calculated as the total electricity revenue realised by Eskom divided by the total kWh produced in a given period, these are then adjusted for inflation to calculate real prices and expressed in 2016 rands.

An overview of electricity consumption and pricing in South Africa | Executive Summary
9
As was the case in the early 1980s, the sharp increases in real electricity prices over the 5-year period
were met with increasing public resistance. NERSA subsequently awarded Eskom increases of roughly CPI
plus 2% for the 5-year MYPD3 period which was well-below Eskom’s requested increases of roughly CPI
plus 10%.
The tariff increases awarded by NERSA over the MYPD3 period have proven inadequate and Eskom’s
revenue shortfall has begun to mount. In November 2016, S&P announced a further downgrade of
Eskom’s credit rating – Eskom’s deteriorating financial position also puts South Africa’s
sovereign credit rating at risk.
While Eskom was able to recover some of the revenue shortfall for the 2013/14 via a regulatory clearing
account application, a group of industrial users successfully challenged NERSA’s decision to award the
additional increase in court. While NERSA is appealing the decision, in November 2016, S&P announced a
downgrade of Eskom’s long-term corporate credit rating citing concern about increased financial pressure
facing Eskom due to uncertainty about the regulatory framework and the future tariff path. The
deteriorating financial position of Eskom, also reflects negatively on South Africa’s sovereign rating (as its
debt is both explicitly and implicitly guaranteed by the Government) and may increase the likelihood of a
downgrade to sub-investment grade on its foreign currency debt.
One of the most sustained criticisms of electricity pricing policy over the past 45 years is that Eskom
has not been allowed to set tariffs at a level that reflects the full cost of supplying power.
This has contributed to a series of poor investment decisions, hampered both public and private
investment in the sector and helped to precipitate the electricity supply crisis of 2008/9.
By maintaining artificially low tariffs, the South African government has effectively continued to
subsidise the cost of electricity.
“Subsidising energy use involves providing it at a price below opportunity cost. This includes non‐collection
or non‐payment, selling electricity at a cost that does not reflect the long‐run marginal cost of supply
including capital maintenance” World Bank (2010:22).
While electricity subsidies in South Africa have largely been implicit or off-budget they are
subsidies nonetheless, and the fiscal consequences do eventually become evident.
Whilst there may be no immediate transfer from the government to Eskom to cover the annual shortfall in
revenue caused by the presence of the subsidy the fiscal consequences have already started becoming
evident. Eskom initially received support from government in the form of a R60bn shareholder loan which
was converted into equity in 2015 and in the form of a further R23bn equity injection completed in March
20162. Government also approved R350bn worth of guarantees on Eskom’s debt of which Eskom had
drawn on R218bn worth by 2017/18 (the agreement is to be extended to 31 March 2023).
In addition, the economic harm and distortions that are caused by the presence of energy price
subsidies is wide-ranging.
2 Moody’s Investor Service (2017) Moody's places Eskom's Ba1/A2.za ratings on review for downgrade

An overview of electricity consumption and pricing in South Africa | Executive Summary
10
Some of the consequences of electricity subsidies as summarised in the international literature, and with
specific reference to South African examples, include:
Energy subsidies can crowd-out growth-enhancing or pro-poor public spending. Energy
subsidies, while often intended to protect consumers crowd-out other priority spending (such as
on social welfare, health, and education) and place an unnecessary burden on public finances.
Energy subsidies (unless specifically targeted) are a poor instrument for distributing wealth
relative to other types of public spending.
Energy subsidies discourage investment in the energy sector and can precipitate
supply-crises. It is argued that artificially low electricity tariffs discouraged investment in South
Africa’s electricity supply industry, frustrated attempts by the government to attract private
investment and helped to precipitate the supply crisis of 2008
Energy subsidies often promote investment in capital-intensive and energy-intensive
industries at the expense of more labour-absorbing and employment generating
sectors. South Africa’s artificially-low electricity tariffs have historically channelled investment
spending towards the more capital intensive, energy-intensive industries. Inglesi-Lotz and
Blignaut (2011) found that overall electricity intensity in South Africa was more than double that
of the OECD average.
Energy subsidies stimulate demand, encourage the inefficient use of energy and
unnecessary pollution. The subsidised electricity price in South Africa has encouraged the
inefficient use of energy and arguably led to South Africa becoming one of the largest contributors
to global GHG emissions. Artificially low prices have also reduced the incentive for firms and
households to invest in energy efficiency technologies and more sustainable forms of embedded
generation such as rooftop solar PV.
Energy subsidies have distributional impacts. Since mining and manufacturing industries
consume almost two-thirds of South Africa’s electricity, firms in these sectors have arguably been
among the greatest beneficiaries of subsidised power in South Africa. Higher-income households
who consume far more power on average than poor households have also benefitted
disproportionately.
We noted that in assessing the impact of rising electricity prices on the economy NERSA failed
to consider the corresponding economic impacts of the implicit electricity subsidy when Eskom
is awarded a much lower-than-required tariff increase.
It is critical that the costs and consequences of implicit electricity subsidies associated with lower-than-
required tariff increases are acknowledged, modelled and communicated to public stakeholders. Failing
this, electricity subsidies will persist and Eskom’s financial position is likely to continue to deteriorate which
will have an adverse impact on the fiscus. There is a risk that this will trigger a sub-investment downgrade
of South Africa’s sovereign credit rating on foreign currency denominated debt.

An overview of electricity consumption and pricing in South Africa | Executive Summary
11
There is a lack of transparency in regulatory decisions about the extent to which revenue is
disallowed based on concerns about the corresponding economic impacts of sharp tariff
increases rather than because costs were ‘imprudently incurred’.
Branco Terzic, a former commission at the US federal energy regulatory commission (FERC), recommends
that during South Africa’s transition to cost-reflective tariffs, all implicit subsidies should be exposed
(Terzic B. , 2015). This might require that the regulator identify the portion of disallowed revenue that will
need to be recovered via an implicit subsidy rather than the tariff and to inform the public about the level
of the subsidy via the billing system. In its response to the MYPD Methodology Consultation Paper, Eskom
(2016) proposed that firstly the % ROA be used as the phasing mechanism and secondly that the
transition path to full cost-reflectivity be defined in terms of duration, slope, measurement.
iii. Chapter three - International competitiveness of South African electricity tariffs
Despite the sharp 147% increase in real inflation-adjusted) electricity prices between 2007 and
FY2015/16, a survey of the delivered price of electricity (12-month 1000KW contract) by NUS
Consulting in June 2015, showed that South Africa’s tariff at 0.085 $US/kWh is still below the
mean for the group of 18 mostly high-income countries.
Furthermore, while South Africa has the 9th lowest tariff of the 18 countries, there was less than 0.5 US
cents per kilowatt hour separating 4th placed Czech Republic and South Africa in 9th place.
A comparison of industrial electricity tariffs by the IEA shows that in 2014, Eskom’s industrial
electricity tariffs were still the lowest (or at least among the lowest if a more conservative
benchmark tariff was chosen) among the 30 countries surveyed.
The International Energy Agency also provide a comparison of industrial and residential electricity tariffs
across a broader group of 30 to 33 advanced and emerging economies that are members of the OECD.
Benchmarking of South Africa to this group suggests that industrial electricity tariffs in South Africa remain
price-competitive by international standards.
The inclusion of South Africa in the IEA’s ranking of countries’ residential tariffs in 2014,
suggests that Eskom’s residential tariffs were the 3rd most competitive of the 30 countries
surveyed.
But only a small proportion of residential consumers in South Africa are benefiting from Eskom’s
competitively priced residential tariffs as the majority purchase their electricity from the ~187 municipal
distributors.
A comparison of the standard residential electricity tariffs charged by 7 of the 187
municipalities was sufficient to show there are large discrepancies in the tariff charged by
municipalities. Ekurhuleni placed 17th in the IEA’s residential tariff ranking which puts the
municipality among the 50% of countries with the most expensive residential tariffs in the
OECD group.
While City Power (Johannesburg) tariffs were similar to the Eskom tariff, Ekurhuleni tariffs are 85% higher.
The large discrepancies in municipal electricity tariffs in South Africa are cause for concern and also

An overview of electricity consumption and pricing in South Africa | Executive Summary
12
complicate any analysis of the impact of rising tariffs on the end-consumer (there may be additional
effects where for example electricity-intensive firms may relocate within South Africa to municipalities with
lower tariffs or may close in those with higher tariffs if relocation is not possible). With Eskom tariffs set to
continue to rise, it is questionable whether further increases in the already relatively high tariffs charged
by some municipalities can be justified.
NERSA should review its approach to the regulation of municipal electricity tariffs as its current
approach of providing guideline tariffs in terms of standard percentage price increases across all
municipalities will only serve to amplify historical differences.
NERSA should revise its approach to ensure that historical discrepancies are addressed (the regulator
could start by providing guidelines as c/kWh increases instead of percentage increases) so that tariffs
levied by all distributors eventually converge towards cost-reflective levels.
iv. Chapter four - Requirements of an efficient electricity pricing regime
Electricity pricing regimes often try to satisfy a range of social, economic, and political
objectives, but we argue that the primary objective must be to ensure that resources are
allocated efficiently.
“[So that] national economic resources [are] … allocated efficiently, not only among different sectors of
the economy, but within the electric power sector. This implies that cost-reflecting prices must be used to
indicate to the electricity consumers the true economic costs of supplying their specific needs, so that
supply and demand can be matched efficiently” (Munasinghe, 1981, p. 323).
In terms of economic theory, a ‘cost-reflective’ tariff is defined as a tariff equal to the long-run
marginal cost (LRMC) of supply.
This concept is consistent with the efficient allocation of economic resources and a relatively stable or
smooth tariff path. “One of the best-known results in economics is that resources are most efficiently
[allocated] when prices are set according to marginal costs” (London Economics, 1997).
While theoretically robust, LRMC is difficult to accurately estimate and operationalise, it is
argued that the RoR methodology currently employed by NERSA usually gives rise to tariffs that
are equivalent to LRAC.
In non-competitive electricity markets like South Africa, where a single regulated public utility is a
monopoly provider of electricity, the traditional approach to tariff-setting is the rate of return (RoR)
methodology. The RoR methodology which is currently employed by NERSA, is based on accounting
definitions that tend to guarantee that the utility can recover its cost of service provision (Gunatilake,
Perera, & Carangal-San Jose, 2008). The RoR methodology, if it were systematically applied by NERSA,
would give rise to tariffs that allow Eskom to fully recover its costs, but it is argued in the literature that
the RoR methodology does not necessarily give rise to tariffs that closely approximate LRMC. Critics of the
methodology argue that it gives rise to prices that are equivalent to long-run average cost (LRAC) which is
not as efficient.

An overview of electricity consumption and pricing in South Africa | Executive Summary
13
The extent to which tariffs under the ROR methodology approximates LRMC appears to depend
on the basis for asset valuation and/or the rules for depreciating the asset base.
Some have argued that tariffs better approximate LRMC when the utilities asset base is valued based on
depreciated replacement cost rather than historic cost. But more recently Rogerson (2011) and Nezlobin,
Rajan, & Reichelstein (2011) have argued that it is not the asset valuation method but the method for the
depreciation of the regulatory asset base (or capital stock) that determines whether the regulated prices
are in line with LRMC. They argue that tariffs can approximate LRMC even where assets are valued at
historic cost provided the correct type of depreciation rules are used.
The most sustained criticism of the RoR methodology is that it does not provide a utility with
sufficient incentive to minimise costs and improve productivity.
To address the limitations to the traditional RoR approach, certain modifications have been introduced
which are collectively referred to either as incentive based regulation or performance based regulation
(PBR). “For the remaining, shrinking monopoly services, incentive-rate making is inevitable and a
necessary evolutionary step in traditional utility regulation…Incentive ratemaking complements the review
and ratemaking established by a regulatory body with a periodic monitoring and review of performance”
(Terzic,1994: p.57).
While an efficient pricing regime is necessary to ensure the efficient delivery of electricity
services by a monopoly utility it is not sufficient – internationally accepted governance
practices must be adhered to ensure that sound and least-cost investment decisions are made.
Vedavelli (1989) notes that in addition to ensuring that tariffs reflect the LRMC of supplying power, it is
also important that sound investment decisions are made to ensure that demand is met at least cost so
that the cost of labour, fuel and capital inputs to production are minimised. Terzic (2015) notes that even
the most competent state-owned enterprise management executives can be faced with government-
imposed practices such as patronage in hiring, or pressure to invest in excess generation capacity, which
result in higher-than-necessary expenses. Terzic (2015) maintains that utilities must be governed by
independent boards, that while appointed by government must be politically independent and insulated
from elected officials.
Eskom estimates that the approved tariff of 67.7c/kWh in 2014/15 would need to have risen by
23% in order to reach the fully cost-reflective tariff of 83.9c/kWh.
We note however that the gap between actual and cost-reflective tariffs is not static, particularly during a
period of capacity expansion when new assets are being added to the regulatory asset base.
Some of the common barriers to the removal of energy subsidies (or transition to cost-
reflective tariffs) based on a series of international case studies but also relevant to South
Africa are summarised below:
A lack of information regarding the magnitude and shortcomings of subsidies;
A lack of government credibility and administrative capacity;
Concerns regarding the adverse impact on the poor;

An overview of electricity consumption and pricing in South Africa | Executive Summary
14
Concerns regarding the adverse impact on inflation and international competitiveness;
Volatility of domestic energy prices;
Opposition from specific interest groups benefiting from the status quo;
and weak macroeconomic conditions.
We recommend some specific strategies for the transition to cost-reflective electricity tariffs in
South Africa, these are summarised below:
Expose implicit electricity price subsidies and provide the public with information on the
magnitude of the subsidy and their shortcomings with a clear communication strategy.
The regulator must review its approach to the regulation of municipal tariffs to address large
discrepancies in tariffs levied by municipal distributors as this is an obstacle to the transition to
cost-reflective tariffs.
Government should develop a clear plan for the transition to cost-reflective tariffs, with
appropriate phasing and provision of targeted subsidies and other mitigating measures for
vulnerable groups.

An overview of electricity consumption and pricing in South Africa | Introduction
15
Introduction
In early 2008, South Africa experienced the first of a series of highly disruptive outages and load-shedding
episodes that came at an enormous cost to the economy. The electricity supply crisis, prompted decision-
makers to respond with greater urgency to the capacity shortage that had been threatening to emerge for
some time, and Eskom was given the go-ahead to embark on a massive investment programme. However,
in the 20 years since Eskom had last invested in base load capacity, real electricity tariffs had declined to
such an extent that it became apparent that Eskom would not be able to finance the new build programme
on the basis of its existing low tariffs and inadequate revenue. In the 5 years between 2008 and 2013,
electricity prices more than doubled in real terms, rising by a cumulative 114%, as the national energy
regulator (NERSA) granted Eskom tariff increases to help it raise debt for the new build. However, the
sharp increases in real electricity tariffs over this period prompted a public outcry, and NERSA took a
decision to limit the increase in real electricity tariff to ~2% per year for the 5-year period from 2013 to
2018.
This report was commissioned by Eskom, as part of its preparation for its fourth Multi-Year Price
Determination (MYPD 4) application (applicable to the post 2018 period). The overall objectives of this
report are:
To provide stakeholders with a broad historical context of electricity prices and consumption
ahead of the forthcoming tariff application.
To highlight some of the main criticisms of electricity pricing policy in South Africa and the key
issues Eskom and the regulator face.
To discuss the requirements of an efficient electricity pricing regime and the economic principles
that underpin the setting of equitable and efficient tariffs under a regulated and vertically-
integrated monopoly provider.
To examine the international competitiveness of electricity prices in South Africa and change in
international rankings.
To provide both general and specific guidelines and strategies for the successful removal of
electricity price subsidies in South Africa, in support of a gradual transition to cost-reflective
prices.
The report updates and expands on analysis conducted as part of a report that Eskom commissioned
ahead of its MYPD3 application in 2012, titled “The economic impact of electricity price increases of various
sectors of the South African economy” (Deloitte, 2012).

An overview of electricity consumption and pricing in South Africa | Introduction
16
I. Structure of the report
The report is structured around five chapters. In Chapter one, we examine the factors that influence
electricity consumption in South Africa, these include - the nature and pace of economic growth, the trend
in real electricity prices, the evolution and adoption of more energy-efficient process and technologies and
supply-side surpluses or constraints. The chapter provides an overview of the historical trend in electricity
consumption in South Africa, the changing composition of electricity sales by sector, key determinants of
demand, methods of decomposing demand, and a brief analysis of the medium-term energy demand
outlook. The chapter includes an analysis of the impact of rising real electricity prices on electricity
consumption and explores the implications of slower-than-expected economic growth and rising real
electricity prices on future consumption and Eskom’s revenues over the 5-year MYPD3 period.
Chapter two begins with an overview of the events and policies that have influenced electricity pricing in
South Africa over the past 45 years. We also discuss how government’s policy of implicitly subsidising
electricity (since the 1980s) contributed to a series of poor investment decisions, hampered both public
and private investment in the sector and helped to precipitate the electricity supply crisis of 2008/9. In the
second part of the chapter we provide a critical view of the government’s electricity pricing policy and
particularly the policy of subsidising electricity prices. We explore the definition of cost-reflective tariffs
and energy subsidies and the relationship between them. In the section that follows we summarise key
findings from the international literature on the economic harm and distortions that are typically caused by
electricity (and other energy) subsidies. We go on to provide examples of the economic consequences of
electricity subsidies in South Africa. We conclude the chapter with a critical review of recent tariff decisions
by the regulator.
In Chapter three we explore the extent to which the sharp rise in real average electricity tariffs have
affected the international competitiveness of South Africa’s electricity tariffs for different customer groups.
The chapter begins with an overview of the electricity supply industry and the implications for tariff setting
and benchmarking. This includes a brief overview of how both Eskom and municipalities approach the
design of tariffs for different customer segments and a discussion on the implications of the large variance
in tariffs across municipalities. We then go on to provide a comparison of electricity tariffs in South Africa
with a broad selection of advanced and emerging economies based on two well-established surveys by
NUS consulting and the International Energy Agency (IEA).
Finally, in Chapter four we consider the requirements for an efficient electricity pricing regime based on
international experience, economic theory, and good practice. We begin the chapter by reviewing the
internationally accepted pricing principles that should result in the efficient delivery of electricity services
under a regulated monopoly provider, such as Eskom. We go on to define a ‘cost-reflective’ tariff in terms
of economic pricing theory and then explore how a tariff equivalent to long-run marginal cost (LRMC) is
best approximated under the rate-of-return (RoR) methodology that is typically employed for tariff setting
for a regulated monopoly utility. We then discuss some of the limitations of the RoR methodology and the
shift internationally to ‘incentive-based’ regulation. We go on to acknowledge that while an efficient pricing
regime based on a truly cost-reflective tariff is necessary to ensure the efficient delivery of electricity
services by a monopoly utility, it is not sufficient. We discuss some of the well-established energy
governance and practices that must also be in place to ensure the efficient delivery of electricity services

An overview of electricity consumption and pricing in South Africa | Introduction
17
by a monopoly provider. In the second half of the chapter, we discuss current support for the transition to
cost-reflective electricity prices in South Africa and the SADC region more broadly and examine the current
gap between actual and cost-reflective tariffs in South Africa. We end the chapter by summarising some of
the common barriers to the removal of energy subsidies based on a series of international case studies
and look at strategies for reform more broadly and in South Africa specifically.

An overview of electricity consumption and pricing in South Africa | Electricity consumption in South Africa – composition, key drivers,
and the outlook
18
1.1 Introduction
Over the past 30 years the South African economy has gradually transitioned away from its historical
dependence on relatively energy-intensive mining and manufacturing sectors towards a more diverse, and
increasingly services-related range of activities. In this chapter, we examine the factors that influence
electricity consumption in South Africa. These include - the nature and pace of economic growth, the trend
in real electricity prices, the evolution and adoption of more energy-efficient process and technologies and
supply-side surpluses or constraints. The chapter provides an overview of the historical trend in electricity
consumption in South Africa, the changing composition of electricity sales by sector, key determinants of
demand, methods of decomposing demand, and a brief analysis of the medium-term energy demand
outlook.
1.2 Analysis of the structure of the SA economy
The South African economy has a large and well-developed services sector which accounted for just over
two thirds (67%) of GDP in 2015, while mining, manufacturing and construction contribute the bulk of the
remaining third. While South Africa is classified by the World Bank as an upper middle-income country, its
economic structure mirrors that of a high-income country which typically has a dominant services sector
that accounts for more than 66% of national output (World Bank, 1995).
Over the past 30 years, the South African economy has continued to transition away from its historical
reliance on the relatively energy-intensive mining and manufacturing sectors towards a more diverse
range of services-oriented activity. In 1975, the primary and secondary sectors (mainly mining,
manufacturing and construction) accounted for almost half of GDP (45%), while today they contribute just
under a third of GDP (30%) (Figure 1).
Financial and business services activity expanded from 13% of GDP in 1975 to 22% of GDP in 2015 – the
sector is now the single largest contributor to national output. The contribution of transport services also
increased notably from 5% of GDP in 1975 to 9% in 2015. By contrast, mining sector’s share of GDP
declined from 20% in 1975 to just 8% in 2015, the manufacturing sector fell from 16% to 14% of GDP
over the same period.

An overview of electricity consumption and pricing in South Africa | Electricity consumption in South Africa – composition, key drivers,
and the outlook
19
Figure 1: Evolution of the South African economy, 1975 - 2015
Source: South African Reserve Bank
1.3 National electricity consumption by sector
1.3.1 Total electricity consumption by sector
Data compiled by the Department of Energy (DoE) on South Africa’s national energy balances shows that
mining and manufacturing are responsible for just under two-thirds of South Africa’s total electricity
consumption (62% in 2012). The iron and steel industry alone, is responsible for 10% of total
consumption; non-ferrous metals industry (aluminium) consumes a further 9%; and chemical industries a
further 6%. Households in South Africa are responsible for 20% of total electricity consumption while
commercial and government services in aggregate are responsible for a further 15%. The trend in
electricity consumption by a relatively small group of energy-intensive manufacturing and mining
industries therefore has a large bearing on the overall trend in electricity demand in South Africa.
3% 3% 2% 3% 2%
20% 18%15%
11%8%
16%16%
16%
15%
14%
2% 3%
3%
3%
2%
5%3%
3%
3%
4%
15%14%
14%15%
15%
5%
6%
7% 9%
9%
13%14%
15%19%
22%
5%5%
6%
6%6%
16% 18% 19%15% 17%
1975 1985 1995 2005 2015
% O
F T
OTA
L G
DP
General Government Services
Personal Services
Financial and Business Services
Transport
Wholesale and Retail Trade
Construction
Electricity and Water
Manufacturing
Mining and Quarrying
Agriculture, Forestry and Fishing

An overview of electricity consumption and pricing in South Africa | Electricity consumption in South Africa – composition, key drivers,
and the outlook
20
Figure 2: Electricity consumption by sector, 2012
Source: Department of Energy, Aggregate Energy Balances, 2012
1.3.2 Historical trend in electricity consumption by customer category
A 20-year series of electricity consumption shows that industry (manufacturing and mining) has
historically been the dominant consumer of power with its share of total national consumption varying
between 52% and 63% over the period (Figure 3). The contribution of the residential or household sector
to total consumption rose consistently from 16% in 1993 to 20% in 2013. The growth in household
consumption is partly attributable to the DoE/Eskom household electrification programme which saw an
additional 5.7 million households connected to the grid between 1994 and 2013/143. Rising average
household incomes are also likely to have contributed to the consistent increase in demand from
households relative to other sectors.
3 DoE (2013) Overview of Universal Energy Access Strategy. Available at: http://www.energy.gov.za/files/IEP/Mmabatho/Overview-of-Universal-Energy-Access-Strategy.pdf
Machinery0%
Transport Equipment0%
Textile and Leather0%
Wood and Wood Products
0%
Food and Tobacco0%
Paper Pulp and Print1%
Non-Metallic Minerals1%
Transport Sector2%
Agriculture3%
Chemical and Petrochemical
6%Non-Ferrous Metals9%
Iron and Steel11%
Commerce and Public Services
15%
Other (Industry)15%
Mining and Quarrying16%
Residential20%

An overview of electricity consumption and pricing in South Africa | Electricity consumption in South Africa – composition, key drivers,
and the outlook
21
Figure 3: Trend in electricity consumption by customer category, 1993-2013
Source: Stats SA
1.3.3 Electricity intensity by sector
The electricity intensity of a sector can be defined as the amount of electricity consumed (e.g. in kWh) to
produce a given unit of output (e.g. GDP in R). The electricity intensity of different sectors is not readily
available because while the DoE reports electricity consumption by sector, these do not align with sector
GDP numbers reported in the relatively aggregated national accounts.
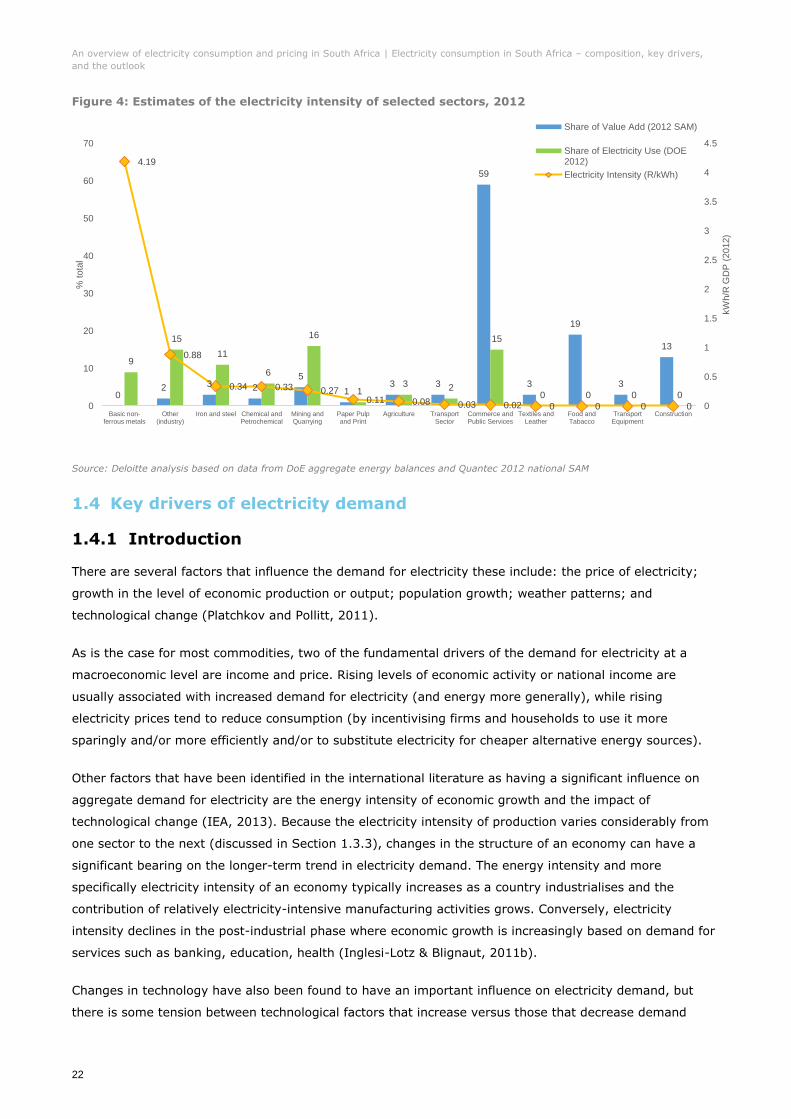
We derived estimates of the electricity intensity of each sector by matching consumption data from DoE
for 2012 to more disaggregated estimates of sector GVA (gross value added)4 reported in Quantec’s 2012
social accounting matrix. The results, presented in Figure 4, suggest that the non-ferrous metals industry
is by far the most electricity intensive in the South African economy - consuming 4kWh of electricity for
every unit of GVA generated in 20125. Other sectors/industries that emerge as relatively electricity-
intensive include ‘other industry (other types of manufacturing activity)’, iron and steel, chemicals and
mining (Figure 4).
4 GVA plus taxes less subsidies = GDP 5 Estimates of the electricity intensity of manufacturing and mining sectors will fluctuate with commodity prices – the international price of non-ferrous metals such as aluminium has softened since 2012 and as profits fall the sector will appear more intensive.
52
6359
0
10
20
30
40
50
60
70
0
50
100
150
200
250
19
93
19
94
19
95
19
96
19
97
19
98
19
99
20
00
20
01
20
02
20
03
20
04
20
05
20
06
20
07
20
08
20
09
20
10
20
11
20
12
20
13
% o
f to
tal consum
ption
TW
H
Other
Agriculture andForestry
Commercial andPublic Services
Residential
Transport
Industry
Industry as % oftotal (RHS)
An overview of electricity consumption and pricing in South Africa | Electricity consumption in South Africa – composition, key drivers,
and the outlook
22
Figure 4: Estimates of the electricity intensity of selected sectors, 2012
Source: Deloitte analysis based on data from DoE aggregate energy balances and Quantec 2012 national SAM
1.4 Key drivers of electricity demand
1.4.1 Introduction
There are several factors that influence the demand for electricity these include: the price of electricity;
growth in the level of economic production or output; population growth; weather patterns; and
technological change (Platchkov and Pollitt, 2011).
As is the case for most commodities, two of the fundamental drivers of the demand for electricity at a
macroeconomic level are income and price. Rising levels of economic activity or national income are
usually associated with increased demand for electricity (and energy more generally), while rising
electricity prices tend to reduce consumption (by incentivising firms and households to use it more
sparingly and/or more efficiently and/or to substitute electricity for cheaper alternative energy sources).
Other factors that have been identified in the international literature as having a significant influence on
aggregate demand for electricity are the energy intensity of economic growth and the impact of
technological change (IEA, 2013). Because the electricity intensity of production varies considerably from
one sector to the next (discussed in Section 1.3.3), changes in the structure of an economy can have a
significant bearing on the longer-term trend in electricity demand. The energy intensity and more
specifically electricity intensity of an economy typically increases as a country industrialises and the
contribution of relatively electricity-intensive manufacturing activities grows. Conversely, electricity
intensity declines in the post-industrial phase where economic growth is increasingly based on demand for
services such as banking, education, health (Inglesi-Lotz & Blignaut, 2011b).
Changes in technology have also been found to have an important influence on electricity demand, but
there is some tension between technological factors that increase versus those that decrease demand
02 3 2
5
13 3
59
3
19
3
13
9
15
11
6
16
13 2
15
0 0 0 0
4.19
0.88
0.34 0.33 0.270.11 0.08 0.03 0.02 0 0 0 0 0
0.5
1
1.5
2
2.5
3
3.5
4
4.5
0
10
20
30
40
50
60
70
Basic non-ferrous metals
Other(industry)
Iron and steel Chemical andPetrochemical
Mining andQuarrying
Paper Pulpand Print
Agriculture TransportSector
Commerce andPublic Services
Textiles andLeather
Food andTabacco
TransportEquipment
Construction
kW
h/R
GD
P (
2012)
% tota
l
Share of Value Add (2012 SAM)
Share of Electricity Use (DOE2012)
Electricity Intensity (R/kWh)
An overview of electricity consumption and pricing in South Africa | Electricity consumption in South Africa – composition, key drivers,
and the outlook
23
(Platchkov and Pollitt, 2011). On the one hand, technological advances, such as the advent of the electric
vehicle give rise to completely new sources of electricity demand. On the other hand, the emergence and
substitution of more electricity-efficient alternatives to traditional technologies such as LED lighting vs.
incandescent bulbs, generates energy savings and reduces both the electricity-intensity of economic
activity and aggregate demand for power.
1.4.2 International literature on the determinants of electricity
demand
In practice, it is difficult to distinguish the influences of these key factors on electricity demand as they are
interrelated - price and technological change for example both affect the uptake of more electricity-
efficient technologies, which in turn can influence the energy-intensity of economic growth.
1.4.2.1 Price and income elasticity of electricity demand
In the international literature on the determinants of electricity demand, there are a number of studies
that focus on isolating the impact of electricity prices versus income. A study by Deloitte (2009) on the
price elasticity of electricity demand in South Africa provided a summary of price and income elasticities
reported in 44 studies focusing on 12 countries. Deloitte found that there was considerable variation in the
price elasticity reported across the 44 studies with estimates ranging from close to zero to -1.5. The
simple average across the 44 studies however was -0.3 and most of the long-term elasticity estimates
tended to be between -0.2 to -0.4. Suggesting that a 1% increase in prices would most often be
associated with a 0.2 to 0.4% decrease in demand. Most of the studies reporting that the price elasticity
was elastic (greater than -1) were conducted in the 1970s and may represent factors particular to that
period. The authors cautioned that the studies differed greatly in terms of the methodology, the timeframe
and data set used, the industry/sector examined and the country in question.
With respect to the impact of income, Deloitte (2009) noted that only 23 of the 44 studies reported income
in addition to price elasticities but that across the 23 studies, estimates of income elasticity of electricity
demand ranged from zero to 1.6, with most falling in a band of 0.8 to 1.1. Meaning that a 1% increase in
income or GDP would typically be associated with a 0.8% to 1.1% increase in electricity consumption. The
results in aggregate suggest that electricity demand is generally more responsive to income than to price
and that income is therefore the more dominant demand driver.
A more recent survey of 12 international and 10 South African studies on the price elasticity of electricity
demand found once again that there was a large variation in estimates of price elasticities which range
from statistically insignificant influence (no influence) to -1.7 (Blignaut, Inglesi-Lotz & Weideman,2015). The
authors note that the studies employed a range of times series and panel data methodologies with some
focusing on a single region and other groups of countries. The South African studies reported various
conclusions from no effect of price on consumption (zero or statistically insignificant elasticities) to highly
negative price elasticities of around -1. The corresponding income elasticities were not reported. Blignaut,
lnglesi-Lotz and Weideman (2015) suggest that based on the literature, it can be inferred that the
sensitivity of consumers to tariff changes is dynamic, that it changes over time based on the prevailing
conditions in a country’s electricity market and that it also differs from region to region.

An overview of electricity consumption and pricing in South Africa | Electricity consumption in South Africa – composition, key drivers,
and the outlook
24
1.4.2.2 Decomposing demand into activity, structural and efficiency
effects
The International Energy Agency methodology (IEA, 2013) for analysing energy or electricity end-use
trends attempts to quantify the relative contributions of the following three key drivers or components of
electricity demand:
(i) Activity effect: the change in demand due to the change in economic activity – gross value-added
(GVA) is the measure of economic activity for manufacturing industry and other sectors.
(ii) Structural effect: the change in demand due to a change in the mix of economic activity or sectors
within an economy.
(iii) Intensity or efficiency effect: the change in demand due to change in energy use per unit of
sectoral activity.
At a country level the activity effect (equivalent to the income effect) is measured in terms of gross-value
added or GVA per sector and is calculated as the relative impact that aggregate economic activity would
have had on energy use had the structure and energy intensities of the sector remained constant. The
structural effect is isolated by assuming constant economic activity and energy intensity but allowing the
structure to vary. The energy intensity effect, which is used as a proxy for changes in energy efficiency,
separates out how changing energy intensities influence energy consumption for a sector. While this
decomposition approach does not isolate the impact of electricity prices on demand, this is captured to
some extend in the intensity effect as firms may respond to price by either becoming more energy-
efficient and/or by reducing production.
The energy intensity effect is estimated by assuming the sectoral structure and economic activity in each
sector remain constant while energy intensities can follow their actual development.
A study by Zhang and Wang (2013) is an example of how the IEA approach is applied to determine the
influence of these three factors on electricity demand in China. Since the study focuses specifically on
electricity demand (rather than total energy demand) the influence of an additional factor - ‘the sector
electricity share in total energy demand’ is also measured. In keeping with the findings of studies on the
income elasticity of electricity demand, Zhang and Wang (2013) found that economic activity was the
dominant driver of electricity demand in China between 1991 and 2009 and that its impact (as a
proportion of the net change in demand) varied between 64% and 250% in any given year. The other
significant drivers were the sector share effect and the intensity effect. The sector electricity effect
captured the positive impact on electricity demand of firms substituting away from dependence on other
energy sources towards electricity. This was responsible for 30% of the variation in demand of the period
and was particularly significant from 1996 to 2001.
The intensity effect was the dominant effect in decreasing electricity consumption over the period. The
accumulated effect accounted for -35% of the total electricity change in absolute value. The electricity
efficiencies achieved are thought to be the result of the extensive application of energy-saving
technologies by firms over the period.

An overview of electricity consumption and pricing in South Africa | Electricity consumption in South Africa – composition, key drivers,
and the outlook
25
1.5 Drivers of electricity demand in South Africa
1.5.1 Historical trends in electricity consumption
The 20-year historical trend in Eskom’s annual sales of electricity in South Africa (and in total) is
presented in Figure 5. Since Eskom generates roughly 95% of electricity consumed in South Africa, the
trend in Eskom sales is a good proxy for the trend in national electricity sales (which are not widely
available6). The annual data is presented in financial years, and because of a change in Eskom’s financial
year in 2004, data for FY2005 covers 15 months (instead of 12) and must be therefore be viewed as an
outlier.
Figure 5: Historical trend in electricity sales in South Africa, GWh, 1996 to 2016
Source: Own analysis based on Eskom sales
Electricity sales in South Africa increased consistently from 1996 to FY2008 - growth in sales slowed to a
period low of 0.5% y/y in 2001 as the South African economy entered recession but gained momentum
thereafter peaking at 5%y/y in FY2007. In early 2008, South Africa experienced a series of highly
disruptive power outages as Eskom began a programme of loadshedding in response to a shortage of
generating capacity. About 9 months later, the emerging global financial crisis reached a zenith with the
collapse of Lehman brothers and the global economy plunged into recession. Eskom sales contracted by
close to 4% y/y in FY2009 as the combined impact of the global financial crisis and domestic power
constraints hampered growth in domestic economic activity and pushed the SA economy into recession. By
FY2011 Eskom’s domestic electricity sales had recovered to pre-recession levels but in FY2013 electricity
sales fell by ~4.2% as a sharp fall in the global demand for commodities hit production in South Africa’s
relatively electricity-intensive mining and manufacturing industries. Eskom’s sales of power to these
sectors in FY2013 contracted by between 3% y/y and 12% y/y respectively.
6 Statistics South Africa compiles a series on total national electricity generated and available for distribution but this power is not necessarily distributed and sold.
161 167 168 170 173 174 180 186
240
195205 210
202 205 211 212203 206 204 2015
6 4 35 7
811
17
14
1414
1313
13 13
14 12 12 14
-20
-15
-10
-5
0
5
130
150
170
190
210
230
250
270
199
6
199
7
199
8
199
9
200
0
200
1
200
2
200
3
*FY
200
5
FY
200
6
FY
200
7
FY
200
8
FY
200
9
FY
201
0
FY
201
1
FY
201
2
FY
201
3
FY
201
4
FY
201
5
FY
201
6
% y
/y
(GW
h t
ho
us
an
ds)
Eskom international sales Eskom electricity sales within South Africa
Growth in Eskom SA electricity sales y/y% Growth in sales interpolated

An overview of electricity consumption and pricing in South Africa | Electricity consumption in South Africa – composition, key drivers,
and the outlook
26
After recovering somewhat in FY2014, electricity sales in South Africa contracted slightly in both FY2015
(-0.6% y/y) and FY2016 (-1.6% y/y) as GDP growth slowed (to below 2% y/y) and supply constraints also
put a brake on demand as Eskom re-introduced rotational loadshedding. Eskom re-introduced
loadshedding in early 2014, and there was regular loadshedding between November 2014 and September
2015.
1.5.2 Price and income elasticity of electricity demand in SA
As discussed in section 1.4.2, a wide range of empirical studies on the determinants of electricity demand
suggest that in the long run, economic activity (or national income) is usually the dominant driver of
electricity demand and that electricity demand is generally more responsive to income than to price.
Data showing the relationship between GDP and electricity sales growth over past 20 years provides
evidence of a very strong positive correlation between GDP and electricity consumption in South Africa
(Figure 6). The correlation coefficient between the two series over this period is 0.93.
Figure 6: Relationships between growth in real GDP and electricity consumption (GWh), 1997 to 2016
Source: Summary of figures presented in Eskom’s annual reports.
Note: It was necessary to interpolate growth in Eskom’s South African electricity for the years between 2003 and FY2007 as Eskom’s
financial year changed in 2004.
In a study on the evolution of price elasticity of electricity demand in South Africa from 1986 to 2005,
Inglesi-Lotz (2011) found that income or GDP was the dominant driver of demand over the period and that
the income elasticity of demand was close to 1 (unit elastic) for most of the period beyond 1990 –
meaning that a 1% in GDP growth in South Africa is likely to increase electricity demand by nearly 1%.
Electricity prices by contrast, had little to no effect (Figure 7).
In recent years and particularly since FY2012, growth in Eskom’s local electricity sales has been much
lower than growth in GDP. While GDP expanded at an average rate of 1.9% y/y between FY2012 and
-6.0
-4.0
-2.0
0.0
2.0
4.0
6.0
8.0
199
7
199
8
199
9
200
0
200
1
200
2
200
3
*FY
200
5
FY
200
6
FY
200
7
FY
200
8
FY
200
9
FY
201
0
FY
201
1
FY
201
2
FY
201
3
FY
201
4
FY
201
5
FY
201
6
Real GDP growth(y/y%)
Growth in Eskom SAelectricity sales (GWh)y/y%
Electricity salesinterpolated

An overview of electricity consumption and pricing in South Africa | Electricity consumption in South Africa – composition, key drivers,
and the outlook
27
FY2016 Eskom’s local electricity sales were falling, averaging -0.9% y/y. In FY2013 electricity sales fell by
~4.2% y/y as a sharp fall in the global demand for commodities hit production in South Africa’s relatively
electricity-intensive mining and manufacturing industries. Supply constraints also put a brake on demand
as Eskom re-introduced rotational loadshedding in early 2014, and there was regular loadshedding
between November 2014 and September 2015.
The study also showed that income and price elasticities can vary significantly over time - when real
electricity prices rose sharply in the early 1980’s, the price elasticity of electricity demand in South Africa
was significantly negative (meaning that consumers decreased demand significantly in response to price
increases). From the mid- 1980s to 2007, there was a steady decline in real electricity prices and over this
period they had increasingly little influence on consumption (Blignaut & Inglesi-Lotz, 2011).
Figure 7: Price and income elasticity of electricity demand in South Africa, 1986 to 2005
Source: (Blignaut & Inglesi-Lotz, 2011)
A more recent study by Blignaut, Inglesi-Lotz & Weideman (2015), provides further evidence that the price
elasticity of demand for electricity can vary over time and depends to some extent on the direction and
magnitude of the increases. The study provides estimate price elasticity of electricity demand in South
Africa by sector in the 5-year periods before and after the 2008 power supply crisis. In the period 2002 to
2007 electricity prices were falling slightly in real terms while in the 5 years after a period of loadshedding
in 2008 prices rose sharply - by more than 100% in real terms. The authors note that similar to the result
of previous studies, electricity prices had little to no impact on demand over the period 2002 to 2007, and
the estimated elasticities were statistically insignificant for most sectors. By contrast, for the 5-year period
post-2007, the price elasticity of demand is significant and negative for 9 of the 11 sectors considered and
ranges from roughly -0.5 to -0.2. The results show that while the price elasticity of electricity demand is
relatively inelastic, industrial sectors became more responsive to changes in the price of electricity in the 5
years where prices increased sharply in real terms. The implication for Eskom sales forecasters and
policymakers is that when real electricity price increases are significant (as they were post-2008),
consumers are likely to respond to price and reduce electricity consumption.

An overview of electricity consumption and pricing in South Africa | Electricity consumption in South Africa – composition, key drivers,
and the outlook
28
Table 1: Price elasticities of electricity demand, 2002-2007 vs. 2008 to 2012
Electricity Price Elasticities Before and After 2008
2002 - 2007 2008 - 2012
Agriculture Non-significant -0.235
Coal Mining Non-significant -0.291
Commercial Non-significant -0.291
Gold and Platinum Mining -1.745 -0.417
Iron and Steel Non-significant -0.279
Liquid Fuels Non-significant -0.418
Non-ferrous Metals 0.821 -0.342
Rest of Chemicals Non-significant -0.24
Rest of Manufacturing Non-significant -0.251
Rest of Mining 1.068 -0.465
Transport Non-significant -0.346
Source: Blignaut et al, 2015
1.5.3 Impact of structural and efficiency effects on the electricity
intensity of growth
As mentioned in Section 1.4.2, while the estimation of price and income elasticities is probably the most
common approach to analysing the key drivers of electricity demand, an alternative approach - used by
the IEA - distinguishes between the activity (or income), structural and efficiency (or intensity) effects.
The activity effect is equivalent to the income elasticity of electricity demand. The structural effect is a
long-term effect as it refers to the change in demand which is due to a change in the mix of economic
activity or sectors within an economy. The efficiency effect is the change in demand due to change in
energy use per unit of sectoral activity. Combined the structural and efficiency effects influence the
energy-intensity of economic growth, which in turn, is influenced by the change in real (inflation-adjusted)
electricity prices.
1.5.3.1 Trend in electricity intensity of growth in South Africa
Electricity intensity is defined as the amount of electricity consumed in kWh to produce a unit of GDP. Because the
electricity intensity of production varies considerably from one sector to the next, changes in the structure
of an economy can have a significant impact on the trend in national electricity consumption.
The electricity intensity of the SA economy was estimated using Eskom’s annually reported sales within
South Africa in kWh and GDP in constant 2010 prices, market values7. The trend in the electricity intensity
of the South African economy over more than 30 years as compared to the trend in real electricity prices is
presented in Figure 8. There is a strong negative correlation between the electricity intensity of economic
activity and the real (inflation-adjusted) electricity price – the correlation coefficient between the two
7 Methodological note: While Eskom’s sales represent the clear majority (around 95%) of the total electricity consumed in South Africa the intensity would be slightly higher across the board if all sales were included. Estimating electricity intensity using Eskom’s actual sales is preferable to using data compiled by the IEA or Statistics South Africa on the amount of electricity generated and available for distribution - as it is the amount that was actually sold and consumed.

An overview of electricity consumption and pricing in South Africa | Electricity consumption in South Africa – composition, key drivers,
and the outlook
29
series over the period is -0.66, meaning that 66% of the change in electricity intensity could be explained
by changes in the electricity price.
In the early to mid-1980s, the electricity intensity of the SA economy rose sharply - this can be attributed
to the significant expansion of Eskom’s electricity generation capacity over this period which led to surplus
capacity and consequently policies (including below-cost pricing) to stimulate demand. From 1983 to
2000, Eskom allowed the price of electricity to fall in real terms, and it was during this period that the
electricity intensity of the economy reached a peak of 0.09 kWh/R GDP created.
Since 1998 the electricity intensity of the SA economy has declined steadily – as the South African
economy continued to transition away from its historical reliance on the relatively energy-intensive mining
and manufacturing sectors towards a more diverse range of services-oriented activity. Electricity prices
which stabilised at low levels in 2001, and then rose sharply in real terms from 2008 have undoubtedly
also incentivised and accelerated the shift to less electricity-intensive growth.
Figure 8: Trend in the electricity intensity of the SA economy vs. real electricity prices, 1980 to 2016
Source: Deloitte analysis, based on Eskom annual sales
Despite the steady decline in the electricity-intensity of economic activity in South Africa since 1998, Data
from the IEA presented in Table 2, suggest that South Africa was still relatively electricity intensive in
2010, when compared to other regions including the OECD economies, China and Russia (Kohler, 2014).
Evidence of a further decline in electricity intensity of economic activity in South Africa since 2010 (as
shown in Figure 8) suggests that South Africa is becoming less of an outlier.
0.06
1998, 0.09
0.07
41
28
68
20
30
40
50
60
70
80
0.04
0.05
0.06
0.07
0.08
0.09
0.10
198
0
198
1
198
2
198
3
198
4
198
5
198
6
198
7
198
8
198
9
199
0
199
1
199
2
199
3
199
4
199
5
199
6
199
7
199
8
199
9
200
0
200
1
200
2
200
3
*FY
200
5
FY
200
6
FY
200
7
FY
200
8
FY
200
9
FY
201
0
FY
201
1
FY
201
2
FY
201
3
FY
201
4
FY
201
5
FY
201
6
Electricity intensity GDP R/kWh Real electricity prices R/kWh

An overview of electricity consumption and pricing in South Africa | Electricity consumption in South Africa – composition, key drivers,
and the outlook
30
Table 2: Electricity intensity - South Africa and Rest of World (GWh/PPP adj. $ million) 1971-2010
1971 1980 1990 2000 2010 Change
OECD 0.249 0.269 0.267 0.264 0.253 1%
EU-27 n/a n/a 0.223 0.211 0.204 -8%
Non-OECD 0.196 0.220 0.272 0.264 0.277 42%
China 0.360 0.443 0.345 0.301 0.371 3%
Russia n/a n/a 0.442 0.483 0.362 -18%
South Africa 0.258 0.383 0.493 0.553 0.451 75%
Source: Adapted from (Kohler, 2014)
1.5.3.2 Influence of energy efficiency improvements on electricity
demand
According to the World Energy Council in (Inglesi-Lotz & Blignaut, 2011 b), “[e]nergy efficiency
improvements refer to a reduction in the energy used for a given service (heating, lighting, etc.) or level
of activity. The reduction in the energy consumption is usually associated with technological changes, but
not always since it can also result from better organisation and management or improved economic
conditions in the sector (‘non-technical factors’).”
The primary driver of the demand for an uptake of energy-efficiency technology or initiatives is usually
rising electricity prices, but may also be supported via government policy. Improvements in energy
efficiency are recognised as one of the quickest and most economical means of addressing electricity
supply constraints as it takes several years to plan and build new generation capacity and the costs per
kWh saved through EE technologies is often lower than the marginal cost of each additional kWh
generated. Energy efficiency and demand side management initiatives also mitigate against negative
environmental impacts associated with electricity generation by reducing the energy-intensity of
production.
During the 3-year multi-year price determination period that ran from 2010/11 to 2012/13 (MYPD2), the
DoE made a significant R5.4bn investment in integrated demand management initiatives, which were
implemented by Eskom, in a bid to reduce electricity demand in the face of serious power constraints. The
verified demand-side savings show that between 345MW and 590MW of evening peak demand was
removed annually and a total annualised energy saving of 4859 GWh was realised over the MYPD2 period
at an average cost of R1.12/kWh (Eskom, 2015).
1.5.3.3 Analysis of structural and efficiency effects in South Africa
Following the IEA decomposition approach, Inglesi-Lotz and Blignaut (2011a) analysed the main drivers of
electricity consumption in South Africa over the period 1993 to 2006 They found that the most significant
driver was output (economic growth) (Figure 9). This is not surprising, since from 1994 up until the
2008/9 recession the South African economy had continue to expand at GDP growth rates that were above
historical averages (Inglesi-Lotz & Blignaut, 2011 a). The analysis showed that structural effects also had
a positive impact while efficiency improvements (technology/substitute) reduced demand over the period.
The structural shift to more electricity-intensive sectors is likely to have been promoted by a slide in real

An overview of electricity consumption and pricing in South Africa | Electricity consumption in South Africa – composition, key drivers,
and the outlook
31
electricity prices over the period which fell consistently and stabilised at 30-year lows. The analysis
suggests however, that significant energy-efficiency gains took place despite falling electricity prices. In
the period since 2008, real electricity prices have risen by more than 100% - one would therefore expect
to see an even greater contribution from efficiency gains and the reversal of the structural effect – a shift
to less energy-intensive sectors.
Figure 9: Contribution of output, structural changes, and efficiency to total electricity consumption (1993 to 2006)
Source: (Inglesi-Lotz & Blignaut, 2011 a)
1.6 Review of Eskom sales forecast variance for MYPD3 period
Electricity price adjustments in South Africa are currently determined by NERSA through the Multi-Year
Price Determination (MYPD) methodology. The MYPD is based on rate-of-return principles and was
developed for the regulation of Eskom’s tariffs via ‘allowable revenue’. Under the MYPD methodology the
tariff increase allowed by NERSA is a function of the revenue allowed by the regulator divided by Eskom’s
total anticipated sales. As a result, forecasts of electricity sales (or demand) are key element in tariff
setting – they are used by Eskom and NERSA to determine what average tariff increase should be applied
in order to raise the revenue that has been allowed by NERSA. The MYPD3 application was for the 5-year
period between financial years 2013/14 to 2017/18.
The 5-year sales forecast that Eskom included in its MYPD3 tariff application was compiled by aggregating
forecasts from the six Eskom regions and a separate forecast for the Key Sales and Customer Services
(KSACs) which are large industrial customers that Eskom supplies directly. In the case of MYPD3, the
MYPD sales forecast was finalised on 14 September 2011. The KSACs forecast and aspects of the regional
sales forecasts are produced using a bottom-up approach where information on future demand and
expansions plans from each key customer is aggregated. For other large and more disparate groups, such
as commercial and residential customers, it is understood that the historical relationship between GDP
-
-
-
-
-
-
-
- - -Production Effect Structural Effect Efficiency Effect
180000
130000
80000
30000
-20000
-70000
-120000
GW
h

An overview of electricity consumption and pricing in South Africa | Electricity consumption in South Africa – composition, key drivers,
and the outlook
32
growth and electricity demand (among other factors) is used to forecast growth in sales. As a result,
Eskom reports that GDP growth forecasts are one of the critical sales assumptions (Eskom, 2016).
Since the beginning of the MYPD3 period in 2013/14, Eskom’s actual growth has been significantly lower
than what was forecast in 2011 (Figure 10). Eskom forecast that sales would grow at an annual average
rate of 1.8% while actual sales for the first three years of MYPD3 fell at an annual average rate of -0.3%
with the variance between forecast and actual sales consequently widening every year. Sales volumes in
2015/16 were 20323 GWh lower than the MYPD3 forecast.
Figure 10: Eskom MYPD3 sales volume variance - forecast vs. actual
Source: Own analysis
Much of the volume variance can be attributed to much slower than anticipated growth in economic
activity. Eskom assumed in 2011 that real, annual GDP growth would accelerate from 3.3% in 2011 to 5%
by 2017/18, averaging 4.5% over the period. But GDP growth has continued to disappoint relative to
forecast, averaging just 1.5% in the first three financial years of the MYPD3 period. There is however still
evidence of a strong positive correlation (0.86) between actual annual electricity sales growth and GDP
growth over the first three years of MYPD3 and it is worth noting that the correlation would improve if
international sales were excluded.
223 228 230 235 239 244217 218 216 214
-1.10%
2.21%
0.81%
2.20% 1.92% 2.01%
-3.63%
0.62%
-0.60% -0.83%
-150
-100
-50
0
50
100
150
200
250
-4%
-2%
0%
2%
4%
6%
2012/13 2013/14 2014/15 2015/16 2016/17 2017/18
TW
h
MYPD sales decision - forecast GWh Actual sales - GWh
MYPD sales decision - forecast % growth Actual sales - % growth
An overview of electricity consumption and pricing in South Africa | Electricity consumption in South Africa – composition, key drivers,
and the outlook
33
Figure 11: GDP and Eskom sales growth variance - forecast vs. actual
Source: Own analysis based on data from MYPD3 decision and SARB
1.7 Outlook for electricity consumption
As discussed above, growth in income or economic activity is consistently found in the local and
international literature to be one of the dominant drivers of national electricity consumption and is widely
used as a variable for forecasting purposes. While there are several other factors that can potentially
influence demand, the trend in electricity intensity and/or real electricity prices is also frequently used in
models to forecast national electricity consumption. Electricity intensity captures the influences of changes
in price, technological and structural change but is difficult to forecast with accuracy. In this section, we
analyse the outlook for electricity consumption over the next 5 years based on expected growth in GDP,
the trend in electricity intensity and real electricity prices8.
1.7.1 The economic growth outlook and implications for electricity
demand
Real GDP growth slowed to 0.5% y/y in 2016 as a combination of slowing global growth and domestic
factors including ongoing political and policy uncertainty continue to keep growth well below both the 20-
year average of 3% per annum (and the National Development Plan (NDP) target level of 5.4% per
annum) (National Treasury, 2016). The National Treasury noted in February 2017 Budget Review that
economic is expected to increase moderately over the next three years, with real GDP growth forecast to
accelerate to 2.0% by 2018 but acknowledges that there are still significant downside risks to this
forecast. Both the IMF and economist intelligence unit (EIU) forecast that South Africa’s real GDP will
expand at the relatively modest annual average rate of ~1.8% over the next 4 to 5 years, reaching 2.2%
8 Note: the demand for electricity is probably more accurately forecast as a part of a national energy modelling system such as that currently managed by the US Energy Information Administration (EIA) which incorporates, economic activity and the change in the relative price of other energy sources that are potentially substitutes as well as a range of additional information on the structure of the energy market.
-5%
-4%
-3%
-2%
-1%
0%
1%
2%
3%
4%
5%
6%
2012/13 2013/14 2014/15 2015/16 2016/17 2017/18
MYPD sales decision -forecast % growth
Actual sales - % growth
GDP - forecast % growth
GDP - Actual % growth

An overview of electricity consumption and pricing in South Africa | Electricity consumption in South Africa – composition, key drivers,
and the outlook
34
by 2019/2020. Using the coefficient obtained from a simple regression9 explaining the variation in
electricity demand in terms of real GDP growth alone, we found that electricity sales would be likely to
increase at an annual average rate of 0.7% over the next 5 years based on IMF forecast of SA GDP
growth, significantly lower than the 2% growth Eskom forecast for the outer year of MYPD3 (2017/18).
Figure 12: Real GDP and Eskom’s SA electricity sales – historical and 5-year forecasts
Source: Own analysis
1.7.2 Future trend in the electricity intensity of growth and real
electricity prices
A simple extrapolation of the 30-year trend in electricity intensity using a polynomial trendline suggests
that electricity intensity of economic growth in South Africa will continue to decline very gradually over the
next 5 years from R0.07/kWh to R0.065/kWh, before beginning to increase again. The polynomial trend is
a simple technique that extrapolates the historical trend in electricity intensity to a curve that fluctuates
around a long-term mean. However, while it seems likely that electricity intensity of growth will continue
to decline over the next 5 years, it is unlikely to return to the much higher 30-year average thereafter.
Part of the reason for this is that electricity was very heavily subsidised by Government for much of the
1980s and 1990s in a bid to find a market for the surplus power generation capacity that had been created
in the early 1980s. A return to the policy of implicit electricity subsidisation that attracted electricity-
intensive industries over this period would be ill-advised. In addition, South Africa is diversifying away
from its traditional dependence on relatively low-cost coal-fired plants as the main source of electricity
generation - the integration of more environmentally sustainable forms electricity generation has, and will
9 The regression output suggests that 56% of the variation in electricity demand over the period 1997 to 2016 can be explained by the change in GDP or economic activity and that electricity demand would rise by 0.4% for every 1% increase in real GDP. The independent variable was the log of annual Eskom sales of electricity in South Africa in GWh while the dependent variable was the log of annual real GDP. The R squared statistic was 0.56.
2.202.20
0.88
-5.0
-3.0
-1.0
1.0
3.0
5.0
7.0
199
7
199
8
199
9
200
0
200
1
200
2
200
3
*FY
200
5
FY
200
6
FY
200
7
FY
200
8
FY
200
9
FY
201
0
FY
201
1
FY
201
2
FY
201
3
FY
201
4
FY
201
5
FY
201
6
FY
201
7
FY
201
8
FY
201
9
FY
202
0
FY
202
1
Real GDP growth (y/y%) Growth in Eskom SA electricity sales (GWh) y/y%
Electricity sales interpolated EIU GDP forecast Sept 2016
IMF WEO GDP forecast Oct 2016 National Treasury
Eskom SA sales forecast based on GDP growth (IMF)

An overview of electricity consumption and pricing in South Africa | Electricity consumption in South Africa – composition, key drivers,
and the outlook
35
continue to drive up the combined electricity generation, transmission, and distribution cost – at least in
the near-term.
To produce an alternative forecast of electricity intensity we had to make an assumption about the future
increase in real electricity prices. We have assumed that real electricity prices decrease by 1.8% in
2016/17 (equivalent to a 4.2% nominal increase, which is the increase required to reach MYPD3 allowed
revenue off current base) and at 7% per annum thereafter (equivalent to a 13% nominal increase). The
forecast of the trend in electricity intensity based on a regression analysis of its historical correlation with
real prices suggests that the electricity intensity of economic activity will decline faster than the polynomial
trend reaching R0.05/kWh by 2021.
Figure 13: Electricity intensity of the SA economy, historical and forecast
Source: Own analysis
1.7.3 Overall outlook for energy consumption and implications for
Eskom
While multivariate regression models can be used to produce more accurate forecasts of national
electricity consumption that simultaneously capture the impact of GDP, electricity intensity and real prices
and other drivers on demand, this exercise was beyond the scope of this report.
It is nevertheless possible to conclude from the bivariate regression analysis provide above, that in the
context of average annual real GDP growth of 1.8%, growth in electricity demand is unlikely to average
more than 1% per annum in the 5-year period to 2021. Evidence of a persistent trend-decline in the
electricity intensity of growth suggests that there may also be further downside risk to this forecast. We
believe, based on the analysis provided above, that the 18-year trend towards less energy-intensive
economic growth will persist for at least another 5 years, particularly as it is expected that real electricity
0.06
0.09
0.07
0.0544 36.65
76
92
20
30
40
50
60
70
80
90
100
110
0.04
0.05
0.06
0.07
0.08
0.09
0.10
Real
elc
tric
ity p
rice R
/kW
h 2
015 v
alu
es
Ele
ctr
icit
y i
nte
nsit
y G
DP
R/k
Wh
Electricity intensity of the SA economy, 1980 to 2016
Electricity intensity GDP R/kWh
Forecast of electricity intensity (based on real average increase of 5%)
Real electricity price (R/kWh) 2016 values
Real price forecast (assuming average increase of 5.2% y/y and average inflation of 6%)
Polynomial trend, electricity intensity order 4

An overview of electricity consumption and pricing in South Africa | Electricity consumption in South Africa – composition, key drivers,
and the outlook
36
prices continue to rise towards cost-reflective levels as implicit price subsidies (that come at significant
cost to the fiscus and economy) are gradually phased out.
The implication for Eskom is that growth in electricity sales will continue to disappoint relative to the
MYPD3 forecasts produced in 2011, which forecast GDP growth of 4% and annual average growth in sales
volume of roughly 2%. Slower-than-expected growth in electricity sales means that Eskom will face a
widening revenue shortfall in the outer years of the 5-year MYPD3 period as the approved tariff increase
was calculated on the assumption of Eskom being able to realise much higher electricity sales.
1.8 Conclusions
Despite the steady decline in the combined contribution of manufacturing and mining sector to GDP (from
31% of GDP in 1995 to 22% in 2015), these sectors are still responsible roughly 60% of total national
electricity consumption. As such, growth (or lack thereof) in the relatively energy-intensive mining and
manufacturing industries remains an important determinant of overall national demand.
Available data on electricity intensity by sub-sector, further suggests that some manufacturing sub-sectors
such as non-ferrous metals, and to a lesser extent ‘iron and steel’ are particularly energy-intensive and
national demand is particularly sensitive to developments in these industries. The contribution of the
residential sector to total national electricity consumption has increased steadily over the past two decades
(from 16% in 1993 to 23% in 2013).
There are two common approaches to identifying the key determinants of electricity demand at a national
level – the first is to estimate the price and income elasticity of demand (isolating the impact of each key
driver) and the second is an approach used by the IEA which decomposes electricity demand into an
activity, structural and efficiency effect.
An analysis of South African GDP and electricity sales growth data in the 20 years to 2016 provides
evidence of a very strong positive correlation between GDP and electricity consumption in South Africa -
the correlation coefficient between the two series over this period is 0.93. In a study on the determinants
of electricity demand in South Africa from 1986 to 2005, Inglesi-Lotz (2011) found that GDP was the
dominant driver of demand over the period and that the income elasticity of demand was close to 1 (unit
elastic) for most of the period between1990 and 2005– meaning that a 1% increase in GDP increased
electricity demand by nearly 1%.
The results of a study by Blignaut, Inglesi-Lotz & Weideman (2015) noted that electricity prices had little
to no impact on demand over the period 2002 to 2007 when they were stable and falling in real terms. By
contrast, for the 5-year period post-2007 when real electricity prices were rising sharply, the price
elasticity of demand was significant and negative for 9 of the 11 industrial sectors considered, and ranges
from roughly -0.5 to -0.2. The implication for Eskom sales forecasters and policymakers is that when real
electricity price increases are significant, consumers are likely to respond to price and reduce
consumption.
In terms of electricity-intensity we noted that over a 36-year period that there was a strong negative
correlation (-0.66) between the electricity intensity of economic activity in South Africa and the real

An overview of electricity consumption and pricing in South Africa | Electricity consumption in South Africa – composition, key drivers,
and the outlook
37
(inflation-adjusted) electricity price. The electricity intensity of the SA economy has declined steadily since
1998, and accelerated as electricity prices which had stabilised at low levels in 2001, rose sharply in real
terms from 2008.
A review of the performance of Eskom’s sales forecasts for the 5-year MYPD3 period which runs from
2013/14 to 2017/18 shows that growth in electricity sales have been significantly lower than what was
forecast for the period in 2011. Eskom forecast that sales would grow at an annual average rate of 1.8%
while actual sales for the first three years of MYPD3 fell at an annual average rate of -0.3% with the
variance between forecast and actual sales consequently widening every year. Much of the sales variance
can be attributed to much slower-than-anticipated growth in GDP which averaged just 1.5% in the first
three years of MYPD3 relative to 4.5% assumed by Eskom.
In terms of the outlook for electricity consumption, given expected average annual real GDP growth of
1.8% for the 5-year period to 2021, growth in electricity demand is unlikely to average more than 1% per
annum. Evidence of a persistent declining trend in the electricity intensity of growth suggests that there
may also be further downside risk to this forecast. We believe that the 18-year trend towards less energy-
intensive economic growth will persist for at least another 5 years, particularly if NERSA (in a bid to shore-
up Eskom’s deteriorating financial position and reduce harm from subsidies), allows electricity tariffs to
continue to rise towards cost-reflective levels during MYPD4.
The implication for Eskom is that growth in electricity sales will continue to disappoint relative to the
MYPD3 forecasts produced in 2011. Further, if Eskom is not allowed to recover the revenue shortfall via
the regulatory clearing account process, it will face a widening revenue shortfall in the outer years of the
5-year MYPD3 period as the previously approved tariff increases assumed that Eskom would be able to
realise much higher electricity sales.

An overview of electricity consumption and pricing in South Africa | Trends in electricity prices – a critical review of historical pricing
policy and decisions
38
2.1 Introduction
In early 2008, South Africa experienced the first of a series of highly disruptive outages and load-shedding
episodes that came at an enormous cost to the economy. The electricity supply crisis, finally prompted
decision makers to respond to the capacity shortage that had been threatening to emerge for some time,
and Eskom was given the go-ahead to embark on a massive investment programme. However, in the 20
years since Eskom had last invested in base load capacity, electricity tariffs had declined to such an extent
that it became apparent that Eskom would not be in a position to finance the new build programme given
its now inadequate revenue stream.
The purpose of this chapter is to provide an overview of the events and policies that have influenced
electricity pricing in South Africa and a critical review of the implications of recent pricing decisions. We
begin the chapter with an overview of the events and policies that have influenced electricity pricing in
South Africa over the past 45 years. We also discuss how government’s policy of implicitly subsidising
electricity (since the 1980s) contributed to a series of poor investment decisions, hampered both public
and private investment in the sector and helped to precipitate the electricity supply crisis of 2008/9. In the
second part of the chapter we provide a critical view of the government’s electricity pricing policy and
particularly the policy of subsidising electricity prices. We explore the definitions of cost-reflective tariffs
and energy subsidies and the relationship between them. In the section that follows we summarise key
findings from the international literature on the economic harm and distortions that are typically caused by
electricity (and other energy) subsidies. We go on to provide examples of the economic consequences of
electricity subsidies in South Africa. We conclude the chapter with a critical review of recent tariff decisions
by the regulator.
2.2 Historical trend in electricity prices
2.2.1 Events and policies that have influenced electricity pricing in
South Africa
Since the establishment of Eskom’s earliest predecessor, the electricity supply company (ESC) in 1923, the
electricity industry in South Africa, has been dominated by a single state-owned enterprise with an
effective monopoly in generation, transmission, and distribution. The electricity supply industry, which is
also of considerable strategic importance as a key enabler of industrial activity and economic growth, has
therefore been dominated by a large, and a vertically integrated state-owned monopoly. As a result, the
trend in electricity prices has always been heavily influenced by the changing policy and political priorities

An overview of electricity consumption and pricing in South Africa | Trends in electricity prices – a critical review of historical pricing
policy and decisions
39
of the government at the time and the price of electricity has seldom been set a level that reflects the true
economic cost of supply.
A graph showing the long-term trend in the average real and nominal electricity prices realised by Eskom
in South Africa over roughly 45 years is provided in Figure 14. In the late 1970s and early 1980s Eskom
embarked on a massive capacity expansion programme. Real electricity prices rose sharply so that Eskom
was in a financial position to raise the capital required to fund the new build. However, the sharply rising
electricity tariffs sparked a public outcry and a commission appointed to investigate found that Eskom had
substantially over-invested in capacity. In the three decades between 1978 and 2008 real (inflation-
adjusted) electricity prices in South Africa were allowed to gradually decline to artificially low levels as
government sought a market for Eskom’s surplus generation capacity. Between 1978 and 2004 the real
average price of electricity10 fell by more than 40% from 49.5 c/kWh (in 2016 rands) in 1978 reaching a
low of 30.1 c/kWh in 2004/5 (Figure 14). By 2004/5 electricity prices in South Africa, and particularly
those faced by industrial consumers were among the lowest in the world.
From 2008 the trend in prices took a dramatic turn when the power supply crisis that had been
threatening for several years, reached a critical point and Eskom was forced to introduce loadshedding. As
a result, (and after lengthy delays due to political indecision) Eskom was given the green light to embark
on a massive build programme to increase power generation capacity. But at this point electricity tariffs
were at long-term-lows and Eskom had neither the cash reserves nor the future revenue streams to cover
the cost of the new build. To enable Eskom to begin raising the capital it required, the National Energy
Regulator of South Africa (NERSA) approved several sharp increases in annual tariffs and in the 5 years
between 2008 and 2013, electricity prices more than doubled in real terms (inflation-adjusted) rising by a
cumulative 114% while nominal prices rose by 191% over the same period.
10 Average prices are calculated as the total electricity revenue realised by Eskom divided by the total kWh produced in a given period, these are then adjusted for inflation to calculate real prices and expressed in 2016 rands.

An overview of electricity consumption and pricing in South Africa | Trends in electricity prices – a critical review of historical pricing
policy and decisions
40
Figure 14: Trend in Average Electricity Prices realised by Eskom per kWh (1973 to 2015/16)
Source: Deloitte Analysis, Eskom data and 2011 annual report
Note: In 2004/5 Eskom change financial year from calendar year (year-ending 31 December) to year-ending 31 March
The 45-year history of electricity pricing in South Africa can be summarised in terms of the following six
time periods, each characterised by distinct electricity investment and pricing policies. Note that the
events that took place during these six period are expanded upon in more detail in the sections that
follow:
1974 to 1983 - Large-scale capacity expansion: As reserve margins dwindled Eskom
embarks on a large-scale power generation capacity expansion and electricity prices increase
sharply so that Eskom is able to raise capital for the new build programme.
1984 to 1990 – Public outcry and introduction of ‘consumer-privileged tariffs’: In the
face of massive public resistance to rising tariffs the De Villiers Commission is appointed - it
criticises the enormous over-investment in generation capacity (surplus to the country’s needs)
and recommends that ‘consumer-privileged’ tariffs be implemented.
1990 to 2000 – Falling real prices under ‘pricing compacts’: As Eskom’s debt burden from
the new build of the early 1980s declines, Eskom instead of allowing profit margins to improve
(and so build a cash reserve with which to invest in new capacity) enters into ‘pricing compacts’
allowing real prices to further decline.
2001 to 2007 – Regulatory framework introduced but prices increased in line with CPI:
A new framework for the regulation of electricity prices based on internationally accepted rate of
return methodology is approved in 2004 but methodology is not implemented and the regulator
instead awards modest price increases of CPI plus 1%.
1973, 31.4
1978, 49.5
*2004/5, 30.1
2007/8, 30.9
2015/16, 76.24
0
10
20
30
40
50
60
70
80
901
97
31
97
41
97
51
97
61
97
71
97
81
97
91
98
01
98
11
98
21
98
31
98
41
98
51
98
61
98
71
98
81
98
91
99
01
99
11
99
21
99
31
99
41
99
51
99
61
99
71
99
81
99
92
00
02
00
12
00
22
00
3*2
004
/52
00
5/6
200
6/7
200
7/8
200
8/9
200
9/1
02
01
0/1
12
01
1/1
22
01
2/1
32
01
3/1
42
01
4/1
42
01
5/1
6
ce
nts
(Z
AR
) p
er
kW
h
Real electricity price (R/kWh) 2016 values Nominal price/C/kWh

An overview of electricity consumption and pricing in South Africa | Trends in electricity prices – a critical review of historical pricing
policy and decisions
41
2008 to 2013 - Power supply crisis hits, real prices more than double as build
programme is launched: Power crisis hits and loadshedding is introduced in 2008. Eskom
receives the go-ahead for its overdue capacity expansion programme and over the 5-year period
a cumulative 114% increase in real electricity prices is approved by the regulator to facilitate
capital raising. Demand for power slows as the economy enters recession, providing a few years’
reprieve from loadshedding but public and political resistance to regulator’s tariff decisions grow.
2013 to 2016 Public resistance and regulatory uncertainty: As public resistance to
electricity price increases grows, NERSA awards Eskom increases of CPI plus 2% for the 5-year
MYPD3 period, well-below the requested increases of CPI plus 10%. Loadshedding is
reintroduced in 2014 and Eskom runs OCGTs at high load factors but NERSA disallows the
recovery of the associated costs in the 2013/14 RCA application. In 2016, a group of industrial
consumers mount a legal challenge to the regulator’s decision to allow Eskom to recover some of
the additional costs the utility incurred in 2013/14 via the regulatory clearing account. Eskom’s
revenue shortfalls mount and its financial position deteriorates as uncertainty about the future
tariff path and ability to sustainably raise revenue grows.
2.3 History of electricity pricing in South Africa
A more detailed overview of the events and policies that have influenced electricity pricing in South Africa
since 1974 during the six periods identified above, is provided below.
2.3.1 1974 to 1983 - Large-scale capacity expansion
In 1974, a year after the international oil crisis, the prices of many fossil and nuclear fuels including coal,
oil and uranium had soared while electricity prices in South Africa had remained relatively low and stable
(Steyn G., 2006). The relative change in energy prices prompted South Africa to invest in cheaper sources
of power (the diesel and oil-fired generators of municipalities became uncompetitive and were replaced
with wholesale electric power purchases). From 1971 to 1975 the demand for electricity supplied by
ESCOM, the state-owned electricity utility (now Eskom) consistently outstripped growth in supply. In
response to the shrinking capacity reserve margin and reacting to concerns that the utility was holding
back economic growth, ESCOM rapidly increased its plant orders. Construction of coal-fired power station
Matla began in October 1974, the Drakensberg pump storage scheme in January 1975 and coal-fired
Dhuva in November 1975. The construction of Koeberg nuclear plant, which was commissioned by
Government largely for strategic political reasons, began in August 1976. (Steyn G., 2006) (Eberhard &
Mtepa, 2003).
To finance the build programme and service its rapidly increasing debt, sharp increases in electricity prices
were required. Between 1974 and 1978, ESCOM increased electricity prices by just under 70% (in real
terms). Despite the fact that ESCOM had technically created sufficient capacity to meet demand, the utility
underestimated the risks associated with up-scaling to larger units and it ran into enormous operational
difficulties which culminated in wide-spread load shedding in 1981 (Steyn G., 2006).

An overview of electricity consumption and pricing in South Africa | Trends in electricity prices – a critical review of historical pricing
policy and decisions
42
To counter the perceived threat of further power shortages, ESCOM embarked on an expansion
programme in the early 1980s that dwarfed all its previous efforts. The result was an overestimation of
demand (based on historical trends and optimistic growth forecasts) and over-building of a massive power
capacity surplus that persisted for the following decade (Eberhard & Mtepa, 2003). “By 1983 Eskom had
generation plant totalling 22 260 MW under construction or on order. This would have effectively have
doubled its total plant in commission” (Steyn G., 2006). As result, not long after the sharp increases of the
late 1970s, Eskom was again compelled to increase price in real terms from 1982 to 1983.
2.3.2 1984 to 1990 – Public outcry and introduction of ‘consumer-
privileged tariffs’
The second round of price increases provoked a public outcry and led directly to the appointment of the De
Villiers Commission of Enquiry into Eskom’s activities in 1983. “The Commission was critical of ESCOM’s
governance, management, forecasting methods, investment decisions, and accounting” (Eberhard &
Mtepa, 2003)). The commission found that Eskom, having grossly overestimated future demand, was
substantially overinvesting in capacity. In addition, the commission found that ESCOM was “fundamentally
oriented to providing an abundant supply of electricity” (de Villiers et al in (Steyn G., 2006)), and that
given the demands being placed on finite capital in the South African economy, the notion of providing
abundant supply at cost (or any cost) should be discarded.
One area in which the recommendations of the De Villiers report was heavily criticised was with respect to
pricing. Kantor (1988) noted that the Commission felt it was undesirable to expose South Africa to
marginal cost pricing (presumably long-run marginal cost pricing) because it felt it may jeopardise industry
exports and instead recommended a system of ‘consumer-privileged’ tariffs with objectives that were ‘debt
management driven’. In doing so the Commission gave precedence to financial management over sound
economic principles (Kantor, 1988). One of the views held by the Commissions was that because ESCOM’s
equity was dividend free, consumers should enjoy lower tariffs than if ESCOM’s equity had consisted of
dividend paying share capital (Steyn G., 2006).
Following the findings of the commission, ESCOM underwent a major restructuring and was renamed
Eskom. New Electricity and Eskom Acts were passed in 1987 and an Electricity Council comprising mainly
of representatives of major consumers but also distributors and government was formed. A clause in the
electricity act exempted Eskom from having its prices regulated, and so effectively relied on the consumer-
dominated Electricity Council to control prices. In place of the principle of operating at ‘neither a profit or
loss’ Eskom was increasingly subject to commercial imperatives and was given the overall objective of
providing a system to satisfy the electricity needs of consumers in the most cost-effective manner subject
to resource constraints and national interest.
The reforms however did not change the way in which Eskom’s management was able to shift economic
and financial risks onto its consumers and the government, nor did they foster a better appreciation of the
economic cost of excess capacity. The substantial over-investment in generation capacity went ahead,
destroying significant public economic value in the process. Eskom’s enormous build programme could
only be partly delayed and only one of the power stations on order were cancelled. By the late 1980s a
substantial surplus power capacity problem had emerged. In a bid to further reduce excess capacity,

An overview of electricity consumption and pricing in South Africa | Trends in electricity prices – a critical review of historical pricing
policy and decisions
43
Eskom mothballed and decommissioned several old, and less efficient power plants. The utility also
actively marketed its surplus capacity to the industries for use in mineral beneficiation projects and
negotiated interruptible supply agreements with Aluminium and ferrochrome plants. (Steyn G., 2006).
Having increased its price levels sharply in the late 1970s Eskom was able to contain its rapidly increasing
debt burden by more or less maintaining prices in real terms throughout the 1980s. Even though Eskom
was stranded with costly surplus capacity, and its tariffs were not cost-reflective, its financial position
improved. This is partly because Eskom was exempt from paying dividends and tax and it did not have to
bear the full economic opportunity cost of the debt finance (including risk and uncertainty) that it
employed to finance its investments. “Government guarantees, open-ended Reserve Bank forward cover,
and its monopoly position effectively shifted most of its business and financing risk on to consumers and
the state.” (Steyn G., 2004). Over this period, Eskom was primarily concerned with satisfying its debt
financiers and highlighting its performance as a borrower. Its strong financial position was emphasised and
little thought was given to the inefficient way it had employed economic resources and the large implicit
‘economic opportunity cost’ incurred.
2.3.3 1990 to 2000 – Further decline in real prices under ‘pricing
compacts’
By the early 1990s, most of the interest burden on Eskom’s debt had declined, but instead of allowing
profit margins to improve, and in so doing build a capital reserve with which to invest in new capacity, it
entered into ‘pricing compacts’. Facing political pressure to reduce prices because of the negative public
perception that might be generated if the utility started to report growing profits, Eskom “cleverly turned
this situation into a public relations triumph by announcing a pricing compact which was designed to allow
average prices to gradually reduce in real terms as its debt continue to decline in real terms” (Steyn,
2004). Under the first voluntary pricing compact, Eskom told government it was prepared to reduce the
real price of electricity by about a fifth between1992 and 1996 (Eberhard & Mtepa, 2003). In a second
pricing compact, ‘the RDP commitment”, Eskom aimed to reduce the real price of electricity by 15%
between 1994 and 2000.
A National Electrification Forum recommended the rationalisation of the distribution sector and the
conversion of the Electricity Control Board into a NER (National Electricity Regulator) with powers to
regulate the entire industry. The NER was established in 1995 but because of Eskom’s self-adopted pricing
compact, it had limited influence in price setting until 2001. Because of its surplus generation capacity and
financial policies, Eskom was able to allow real prices to decline throughout the 1990s and by the end of
the decade prices were well below full-economic levels (long-run marginal cost). The low price of electricity
prices attracted further investment by energy-intensive industries, which were in addition often able to
secure pricing contracts at well below the already under-priced average tariff (Steyn G., 2004). In the
same period, South Africa held its first democratic elections ushering in a new government with changed
priorities. Eskom embarked on a massive electrification programme which increased the proportion of the
population with access to electricity from one third to two thirds. Some of the cash surpluses generated in
the 1990s were used to fund the electrification programme (at least initially).

An overview of electricity consumption and pricing in South Africa | Trends in electricity prices – a critical review of historical pricing
policy and decisions
44
2.3.4 2001 to 2007 – Regulatory framework introduced but CPI-related
price increases awarded
It was only in 2001 that the NER really began to engage in effective electricity price regulation and the
development of a uniform regulatory methodology for price setting was initiated (Deutsche Securities Pty
Ltd, March 2010). In the same year, The Eskom Conversion Bill of 2001 replaced the old Eskom Act of
1987 and Eskom was converted into a public company (Eskom Holdings Ltd), which with its share capital
owned by the state was now subject to taxes and dividends. The stated aim of the bill was to bring about
more efficiency and competitiveness in the running of Eskom, to expose the utility to global trends and to
ensure that it was run in terms of a protocol on cooperative governance (Eberhard & Mtepa, 2003).
Although a framework for the economic regulation of electricity prices based on the Rate of Return (ROR)
Methodology was approved in 2003 for implementation in 2004, from 2001 to 2007, the regulator simply
allowed electricity tariffs to increase in line with or slightly below consumer price inflation (CPI). In 2005
the National Energy Regulator (NERSA) was established (replacing the NER in July 2006). In 2005 NERSA
moved to a multi-year price determination (MYPD) process for Eskom covering the period April 2006 to
March 2009. The intention was that the MYPD would allow price stability and a longer-term planning
horizon as Eskom had to start providing for massive capital investments in new generation capacity.
(NERSA, 2009).
For the first MYPD period, Eskom was initially granted a price increase of CPI plus 1%. The approved price
increases however proved completely inadequate as the projected capital costs associated with the
construction of Medupi and Kusile power stations (and associated transmission infrastructure) had risen
from initial estimates of R97 billion (R33 billion per power station) in the MYPD1 application to R345 billion
(120 billion per power station) by the time Eskom applied for the revision to its price increase in March
2008 (NERSA, 2010). Eskom also faced massive increases in primary energy costs as it increasingly
needed to source coal on the open market.
2.3.5 2008 to 2013 - Power supply crisis, real prices more than double
as build programme is launched
In December 2007, NERSA granted Eskom a revised increase of 14.2% for 2008/9 (up from 6.2%
previously). In early 2008 demand for electricity outstripped supply and Eskom was forced to carry out
extensive loadshedding. In March 2008, Eskom applied for a further revision of the 14.2% increase (for
2008/9) to 60%, the Regulator approved a further price increase of 13.3% bringing the overall increase
for 2008/9 to 27.5%. Eskom was unable to submit a second MYPD application within the stipulated
timelines because of uncertainty regarding its funding model and applied instead for an interim price
increase of 34% for 2009/10. In September NERSA approved a 31.3% increase but this included a
government environmental levy of 2c/kWh (so Eskom’s effective increase was considerably lower).
(NERSA, 2010).
NERSA received Eskom’s MYPD2 application in September 2009. The application generated considerable
public interest and after a process of extensive stakeholder engagement NERSA granted Eskom price
increases of 24.8%, 25.8% and 25.9% for 2010/11 through to 2012/13. In an attempt to soften the blow

An overview of electricity consumption and pricing in South Africa | Trends in electricity prices – a critical review of historical pricing
policy and decisions
45
NERSA also decided to implement an inclining block tariff for domestic customers in the MYPD2 period.
Over the 5 years between 2008 and 2013, electricity prices more than double in real terms (inflation-
adjusted) rising by a cumulative 114% while nominal prices rose by 191% over the same period.
2.3.6 2013 to 2016 - Public resistance to rising tariffs, political
pressure, and regulatory uncertainty
As electricity prices escalated, the public resistance to further tariff increases grew. Public resentment was
fuelled further by reports that estimated cost to completion of new coal-fired plants Medupi and Kusile had
continued to escalate from the initial estimate of R33 billion per power station in around 2005 to R135
billion for Medupi and R160 billion for Kusile in July 2016 (excluding the associated transmission
infrastructure and interest during construction).
In October 2012, Eskom submitted its MYPD3 application, providing motivation for annual price increases
of 16% for the 5-year period from 2013/14 to 2017/18. NERSA however, approved an annual average
increase of 8%, thereby disallowing a large proportion of Eskom’s budgeted costs across almost all
operating cost categories – “in assessing Eskom’s MYPD 3 Revenue Application the Energy Regulator
disallowed over R100 billion over 5 years” (Eskom, 2016). The decision by the regulator to disallow over
R100 billion worth of revenue over the MYPD3 period has contributed to a systematic deterioration in
Eskom’s financial position. From the reasons for decision (RfD) (NERSA, 2013), it appears that NERSA’s
decision was influenced by concern about the negative economic impact that sharp tariff increases would
have on the economy which in turn was based on concerns raised by stakeholders in public fora and the
results of an economic impact study it had commissioned.
On 29 August 2013, Eskom in keeping with the regulatory methodology was allowed by NERSA to submit a
regulatory clearing account (RCA) application for the three years of the MYPD2 for consideration by the
Energy Regulator. The power utility applied for a cumulative RCA balance of R18.3 million and in July 2014
regulator announced that it has approved the RCA balance of R7.8 billion for Eskom which resulted in a
12.7% tariff increase in 2015/16 instead of the 8% approved under MYPD3.
In November 2015, Eskom, submitted an RCA application for the first year of MYPD3 (2013/14) to:
1. Recover the revenue that was lost because of lower-than-forecast sales and;
2. Recoup costs that were ‘prudently and efficiently’ incurred but were also higher than assumed or
allowed by NERSA in its MYPD3 RfD.
Eskom noted in its RCA application that costs were some R11bn higher than anticipated, largely due to the
extensive use of open cycle gas turbines (an additional R8bn worth of costs) which were deployed at much
higher-than-anticipated load factors as a last resort to avoid loadshedding as Eskom took capacity off the
grid in a bid to address its maintenance backlog. Revenues were some R11.7bn lower-than-anticipated
largely because of lower-than-forecast sales. This left Eskom with a R22.7bn gap between required and
actual revenue in 2013/14 alone.
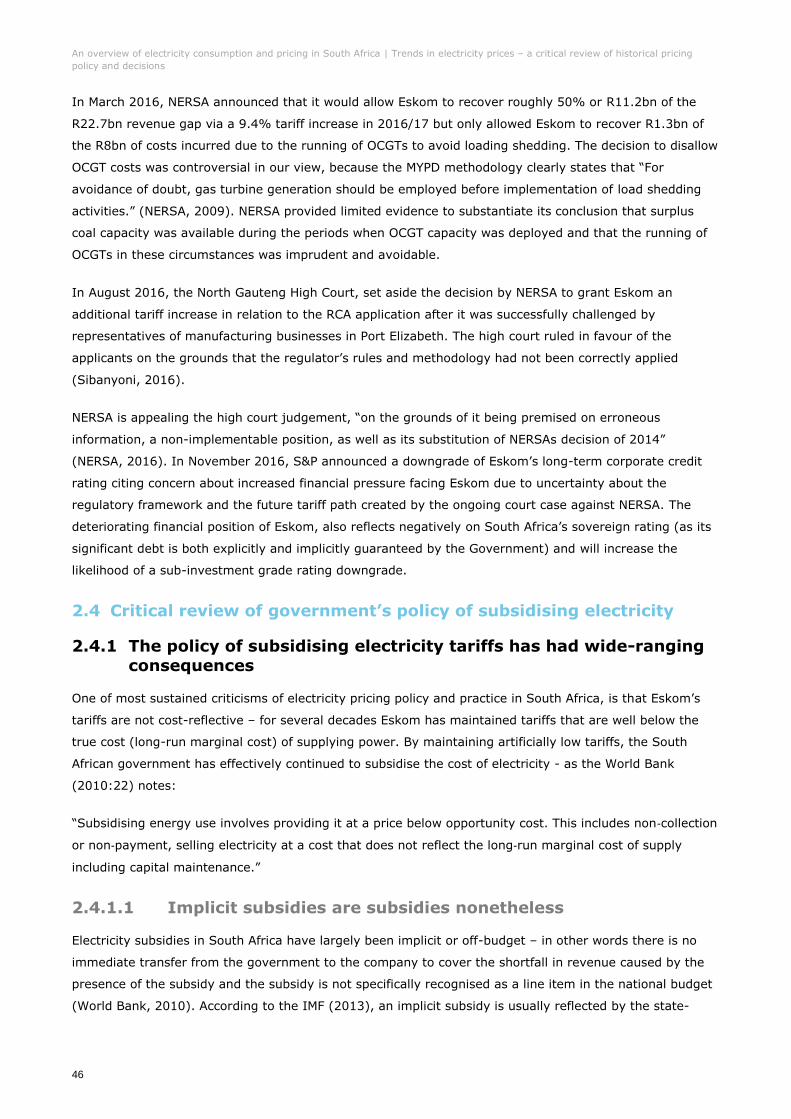
An overview of electricity consumption and pricing in South Africa | Trends in electricity prices – a critical review of historical pricing
policy and decisions
46
In March 2016, NERSA announced that it would allow Eskom to recover roughly 50% or R11.2bn of the
R22.7bn revenue gap via a 9.4% tariff increase in 2016/17 but only allowed Eskom to recover R1.3bn of
the R8bn of costs incurred due to the running of OCGTs to avoid loading shedding. The decision to disallow
OCGT costs was controversial in our view, because the MYPD methodology clearly states that “For
avoidance of doubt, gas turbine generation should be employed before implementation of load shedding
activities.” (NERSA, 2009). NERSA provided limited evidence to substantiate its conclusion that surplus
coal capacity was available during the periods when OCGT capacity was deployed and that the running of
OCGTs in these circumstances was imprudent and avoidable.
In August 2016, the North Gauteng High Court, set aside the decision by NERSA to grant Eskom an
additional tariff increase in relation to the RCA application after it was successfully challenged by
representatives of manufacturing businesses in Port Elizabeth. The high court ruled in favour of the
applicants on the grounds that the regulator’s rules and methodology had not been correctly applied
(Sibanyoni, 2016).
NERSA is appealing the high court judgement, “on the grounds of it being premised on erroneous
information, a non-implementable position, as well as its substitution of NERSAs decision of 2014”
(NERSA, 2016). In November 2016, S&P announced a downgrade of Eskom’s long-term corporate credit
rating citing concern about increased financial pressure facing Eskom due to uncertainty about the
regulatory framework and the future tariff path created by the ongoing court case against NERSA. The
deteriorating financial position of Eskom, also reflects negatively on South Africa’s sovereign rating (as its
significant debt is both explicitly and implicitly guaranteed by the Government) and will increase the
likelihood of a sub-investment grade rating downgrade.
2.4 Critical review of government’s policy of subsidising electricity
2.4.1 The policy of subsidising electricity tariffs has had wide-ranging
consequences
One of most sustained criticisms of electricity pricing policy and practice in South Africa, is that Eskom’s
tariffs are not cost-reflective – for several decades Eskom has maintained tariffs that are well below the
true cost (long-run marginal cost) of supplying power. By maintaining artificially low tariffs, the South
African government has effectively continued to subsidise the cost of electricity - as the World Bank
(2010:22) notes:
“Subsidising energy use involves providing it at a price below opportunity cost. This includes non‐collection
or non‐payment, selling electricity at a cost that does not reflect the long‐run marginal cost of supply
including capital maintenance.”
2.4.1.1 Implicit subsidies are subsidies nonetheless
Electricity subsidies in South Africa have largely been implicit or off-budget – in other words there is no
immediate transfer from the government to the company to cover the shortfall in revenue caused by the
presence of the subsidy and the subsidy is not specifically recognised as a line item in the national budget
(World Bank, 2010). According to the IMF (2013), an implicit subsidy is usually reflected by the state-

An overview of electricity consumption and pricing in South Africa | Trends in electricity prices – a critical review of historical pricing
policy and decisions
47
owned enterprise’s “operating losses or lower profits, lower tax payments to the government, the
accumulation of payment arrears to its suppliers, or a combination of all three”. If the government fully
finances the utility’s losses or revenue shortfall with a direct transfer (such as provision of additional
equity), the consumer subsidy will be reflected in the budget as expenditure and will be financed through
higher taxes, increased debt, or higher inflation if the debt is monetised.
There are some cases where the utility may incur a loss or realise a revenue shortfall that is not
immediately financed by a transfer from the government. In these cases, the public utility may also cover
the shortfall by borrowing (which creates a contingent liability for the government) or by deferring
expenditure on maintenance and repair beyond the optimal timeframe. There are also cases where the
fiscal consequences only become evident at a much later date. To use Eskom as an example, during the
1990s the interest burden on Eskom’s debt had declined to the extent that it was generating cash
surpluses. But instead of using the surpluses to build a capital reserve to replace and upgrade its
infrastructure when required at a future date, it allowed real tariffs to decline, thereby transferring the
surpluses to its consumers. The fiscal consequences of the implicit subsidy only became evident in the
early 2000s when Eskom, facing a power shortage embarked on its new build programme and realised
that in the absence of a capital reserve it did not have the means to finance it. Eskom’s new build
programme therefore necessitated a series of sharp increases in real tariffs and direct support from
government in the form of a R20 billion equity injection and state guarantees on Eskom’s debt to the tune
of R350bn which were announced in 2011 (Engineering News , 2010). As noted by World Bank (2010:23),
“these off‐ budget subsidies constitute a quasi‐fiscal activity and create a quasi‐fiscal deficit because there
is a long‐ run link to the need to finance such subsidies from the budget.”
2.4.1.2 Economic harm and distortions caused by energy subsidies
The economic harm and distortions that are caused by energy subsidies, including artificially low electricity
prices, is well-documented. Some of the macroeconomic, environmental, and social consequences of
energy subsidies, as documented by the IMF (2013), can be summarised as follows:
Energy subsidies can crowd-out growth-enhancing or pro-poor public spending. Energy
subsidies, while often intended to protect consumers crowd-out other priority spending (such as
on social welfare, health, and education) and place an unnecessary burden on public finances.
Energy subsidies (unless specifically targeted) are a poor instrument for distributing wealth
relative to other types of public spending.
Energy subsidies discourage investment in the energy sector and can precipitate
supply-crises. Energy subsidies artificially depress the price of energy which results in lower
profits for producers or outright loses. This makes it difficult for state-owned enterprises to
sustainably expand production and removes the incentive for private sector investment. The result
is often an underinvestment in energy capacity by both the public and private sector that results
in an energy supply crisis which in turn hampers economic growth.
Energy subsidies create harmful market distortions. By keeping the cost of energy
artificially low, they promote investment in capital-intensive and energy-intensive industries at the

An overview of electricity consumption and pricing in South Africa | Trends in electricity prices – a critical review of historical pricing
policy and decisions
48
expense of more labour-intensive sectors (that generate more employment for every rand
invested).
Energy subsidies stimulate demand, encourage the inefficient use of energy and
unnecessary pollution. Subsidies on the consumption of energy derived from fossil fuels leads
to the wasteful consumption of energy and generate unnecessary pollution. Subsidies on fossil-
fuel derived energy also reduces the incentive for firms and households to invest in alternative
more sustainable forms of energy.
Energy subsidies have distributional impacts. Energy subsidies tend to disproportionately
benefit higher-income households who consume far more energy than lower income groups.
Energy subsidies directed at large industrial consumers of energy benefit the shareholders of
these firms at the expense of the average citizen.
2.4.2 Historical consequences of electricity subsidies in South Africa
Following on from the discussion of the consequences of energy subsidies above, we have provided some
specific examples of the economic harm and distortions that have been attributed to the under-pricing or
implicit subsidisation of electricity in South Africa below:
(i) Artificially low electricity tariffs discouraged investment in South Africa’s electricity supply industry
and helped to precipitate the 2008 power supply crisis. The subsidised tariffs frustrated attempts
by the government to attract private investment and helped to precipitate the supply crisis of
2008. In early 2008, South Africa experienced a series of highly disruptive outages and load-
shedding episodes that came at an enormous cost to the economy. The electricity supply crisis,
finally prompted decision makers to respond to the capacity shortage that had been threatening to
emerge for some time, and Eskom was given the go-ahead to embark on a massive investment
programme. While Eskom had warned government of the need to expand its power generation
fleet to avoided looming capacity shortages before 2001, Government’s intention at the time was
to try to increase competition in the vertically integrated electricity supply industry and to attract
private sector investment in new generation capacity allowing industrial customers to enter into
contracts with independent power producers. However, because Eskom’s real electricity prices
were allowed to decline throughout the 1990s, by the early 2000s prices were well below cost-
recovery and were effectively heavily subsidised by government. Eskom’s depressed tariffs were
among the lowest in the world meaning that it was impossible for any private sector investor to
compete profitably with Eskom in electricity supply. As Eskom notes “Government’s failure to
finance new build [in the early 2000’s] has been put down to the fact that it could not raise the
necessary money from the private sector.” (Eskom, 2009). With tariffs well-below cost-reflective
levels, Eskom was not generating sufficient revenues to finance the new build off its own balance
sheet and the private sector was faced with the prospect of entering a loss-making business.
Subsidised electricity prices in South Africa therefore provided poor price signals to potential
investors which directly contributed to the underinvestment in the industry in the early 2000s and
helped to precipitate the power supply crisis that emerged in 2008. The power outages in turn,

An overview of electricity consumption and pricing in South Africa | Trends in electricity prices – a critical review of historical pricing
policy and decisions
49
came at enormous cost the economy and electricity supply-constraints have continued to hamper
economic growth.
(iv) Subsidised electricity prices promoted investment in capital intensive industries in South Africa at
the expense of more labour-absorbing sectors. There is evidence that South Africa’s artificially-low
electricity tariffs have historically channelled investment spending towards the more capital and
electricity intensive industries. Inglesi-Lotz and Blignaut (2011) found that overall electricity
intensity in South Africa was more than double that of the OECD average while Kohler (2014) who
traced the 40-year change in electricity intensity across a number of countries and country groups
and also found that South Africa has amongst the highest electricity intensity globally. Given that
many energy-intensive industries (such as metal-smelting, paper and petrochemicals) are also
capital-intensive, subsidising energy-intensive development is not a sensible policy for
Government to follow in a country like South Africa which has abundant labour and high
unemployment rates (Hope & Singh, 1995).
(v) Subsidised electricity prices, encourage the inefficient use of energy and contributed to South
Africa becoming one of the largest contributors to global GHG emissions. In the wake of the sharp
increase in real electricity tariffs, several large consumers of electricity reported efficiency gains,
but this also suggests that subsidised electricity prices reduced the incentive for investment in
energy efficient technologies in South Africa and were consequently associated with wasteful
consumption. In a survey of 31 of Eskom’s Key Industrial Customers in 200911 firms were asked to
what extent their firm had managed to realise gains in electricity efficiency. All respondents in the
mining sector either agreed or strongly agreed that efficiency gains had been realised as compared
to 90% of respondents in ‘other’ manufacturing and 62% in metal manufacturing. Subsidies on the
consumption of electricity generated by Eskom which was mostly coal-based have arguably
contributed South Africa becoming the 18th largest country-level contributor to global CO2
emissions12. The artificially low price of electricity derived from coal in South Africa has historically
reduced the incentive for firms and households to invest in alternative, more sustainable forms of
embedded generation, including renewable technologies such as solar PV.
(vi) The main beneficiaries of subsidised electricity in South Africa have been large mining and
industrial consumers who consume 60% of South Africa’s power. Energy subsidies have
distributional impacts, they transfer funds away from the general fiscus (and other spending
priorities such as education and health and social welfare) towards energy consumers. Data
compiled by the DoE on South Africa’s national energy balances shows that mining and
manufacturing are responsible for just under two-thirds of South Africa’s total electricity
consumption (62% in 2012). Since mining and manufacturing industries consume almost two-
11 The survey was conducted by Deloitte on behalf of Eskom in 2009 and was designed primarily to understand the impact of electricity
disruption on Eskom’s Key Industrial Customers. Of the total KIC list of clients only 55% responded to the survey making a total of 31
respondents. The survey was conducted before any large price increases were introduced so any questions relating to electricity prices or
vulnerability should not be subject to significant bias. The survey only covers three main interlinked industries, mining, metals and
manufacturing.
12 Based on data from the EDGAR – emissions databased for global atmospheric research. 2015. Available online at: http://edgar.jrc.ec.europa.eu/overview.php?v=CO2ts1990-2015&sort=des9

An overview of electricity consumption and pricing in South Africa | Trends in electricity prices – a critical review of historical pricing
policy and decisions
50
thirds of South Africa’s electricity, the shareholders in mining and manufacturing firms have
arguably been the greatest beneficiaries of subsidised power.
It is worth nothing that the problems that arise from subsidising electricity tariffs are neither new nor
unique to South Africa. In a World Bank study of energy pricing policy, Vedavalli (1989) described a
situation that closely resembles recent experience in the South African electricity supply industry, “A
classic case of power system disequilibrium arises when tariffs are too low and demand is consequently
stimulated. Because of low tariffs internal cash generation is insufficient to finance new investment.
Potential capacity shortages lead to low capital cost, high fuel cost plant (e.g. gas turbines) being installed,
which aggravates the imbalance in the system and promotes higher imports (or reduced exports) of
petroleum. Chronic shortages of finance make the utility more dependent on government support, which
usually leads to lack of autonomy, government interference in day to day affairs and further loss of
efficiency. Such tendencies tend to reinforce each other in a downward spiral that eventually impacts on
the wider economy, e.g. the government budget, balance of payments, or lost output due to power
shortages, resulting in a painful adjustment process.”
2.5 Key considerations not adequately addressed in recent regulatory
decisions on electricity tariffs
2.5.1 Studies to assess the impact of rising electricity prices have failed to consider the corresponding economic impacts of
providing implicit electricity subsidies
As noted in Section 2.3, there have been two periods of sharply rising real electricity tariffs in South Africa
over past 30 years - the first in the early 1980s and the second in 2008/9 - and both were met with
significant public resistance. As a result, tariff decisions, both those made by the Government of the 1980s
and more recently by the national energy regulator, have inevitably had to balance the concerns of the
public with realities of Eskom needing to finance a new build programme in the absence of a capital
reserve. As mentioned in section 2.3.6, it appears that the decision by the NERSA to disallow over R100
billion of the revenue Eskom applied for over the MYPD3 period was influenced by concern about the
negative economic impact that sharp tariff increases would have on the economy. This in turn was based
on concerns raised by various stakeholders in public consultations and the results of an economic impact
study it had commissioned.
The economic impact assessment provided by the regulator in its reasons for decision on the MYPD3
application however, incorrectly assumed that in the low tariff scenarios, where Eskom was not allowed to
recover a large proportion of budgeted operational costs via the tariff, the costs would simply not be
incurred. Eskom had already committed in its application to achieving a R30billion cost saving over the 5
year MYPD3 period and the utility was not able to achieve the substantial additional R181bn in cost-
savings over 5-years (16% of total revenue) that the 8% tariff scenario implied. The 2013/14 regulatory
clearing account application suggests that the majority of the disallowed costs and some further
unanticipated costs were incurred. In lieu of further tariff increases Eskom will need to fund the mounting
gap between costs incurred and revenue allowed through increased borrowings – mostly likely by drawing
down the R350bn worth of guarantees that the government has offered to provide on its own debt.

An overview of electricity consumption and pricing in South Africa | Trends in electricity prices – a critical review of historical pricing
policy and decisions
51
As discussed previously, while the transfer from government to Eskom may not be immediate, there are
fiscal consequences nonetheless and a range of negative economic impacts that that will be associated
with an increase in the stock of government debt and debt service costs under a low tariff scenario. It is
critical that the costs and consequences of implicit electricity subsidies associated with lower-than-required
tariff increases are acknowledged, modelled and communicated to public stakeholders. Failing this,
electricity subsidies will persist, Eskom’s financial position is likely to continue to deteriorate which will
have meaningful fiscal consequences and there is a real risk that this will also trigger a sub-investment
downgrade of South Africa’s sovereign credit rating. As the often-touted economic adage goes, “there is no
such thing as a free lunch”.
2.5.2 There is a lack of transparency in regulatory decisions about the
extent to which revenue is disallowed based on the need to
gradually transition to cost-reflective prices
If NERSA systematically applied its current rate-of-return methodology, it would give rise to an average
tariff that would be cost-reflective – that reflects the long‐run marginal cost of supplying electricity,
including capital maintenance.
In practice, NERSA has never applied the agreed rate-of-return methodology consistently because given
Eskom’s history of under-pricing electricity and underinvesting in electricity generation capacity, the gap to
a cost-reflective tariff path remains significant. An immediate adjustment to a cost-reflective tariff path
would have resulted in very large increases in the real price of electricity in a short period. This would
have given firms and households little time to adjust and would likely have resulted in a major public
outcry.
In its reasons for decision on both the MYPD2 and MYPD3 applications, NERSA implied that the basis for its
decision to disallow a large portion of the revenue claimed by Eskom was influenced by concern about the
general economic consequences of sharply rising tariffs. However, there is very little transparency in
regulator decisions about what portion of disallowed revenue is rightfully due to Eskom but cannot be
allowed because of concerns about the impact on the economy and what proportion has been disallowed
because it was in fact ‘inefficiently and imprudently’ incurred in terms of the MYPD methodological
guidelines. From Eskom’s perspective, this approach creates the impression that revenue is disallowed by
the regulator in a completely arbitrary manner. From the public’s perspective, this creates the damaging
and misleading impression that all Eskom revenue that is disallowed by NERSA cannot be justified in terms
of the methodology and constitutes reckless and wasteful spending on the part of the public utility.
For example, for the MYPD2 application NERSA did calculate Eskom’s allowable revenue strictly on the
basis of its published methodology. NERSA determined the “reasonable margin or return” on assets to be
8.16%, but instead awarded Eskom a real (pre-tax) Weighted Average Cost of Capital (WACC) of 0.08%,
2.8% and 4.2% for the three respective financial years. It was not clear on what basis the revised WACC
figures were determined, which created the impression the Eskom’s tariffs had been determined in a
completely arbitrary manner (Steyn G., 2010). In the ‘MYPD2 reasons for decision document’ NERSA
implied that to achieve this transition to cost reflectivity it is phasing in 3 components of the tariff formula
– the ROA, the value of the asset base and the depreciation charge (Joubert, 2011).
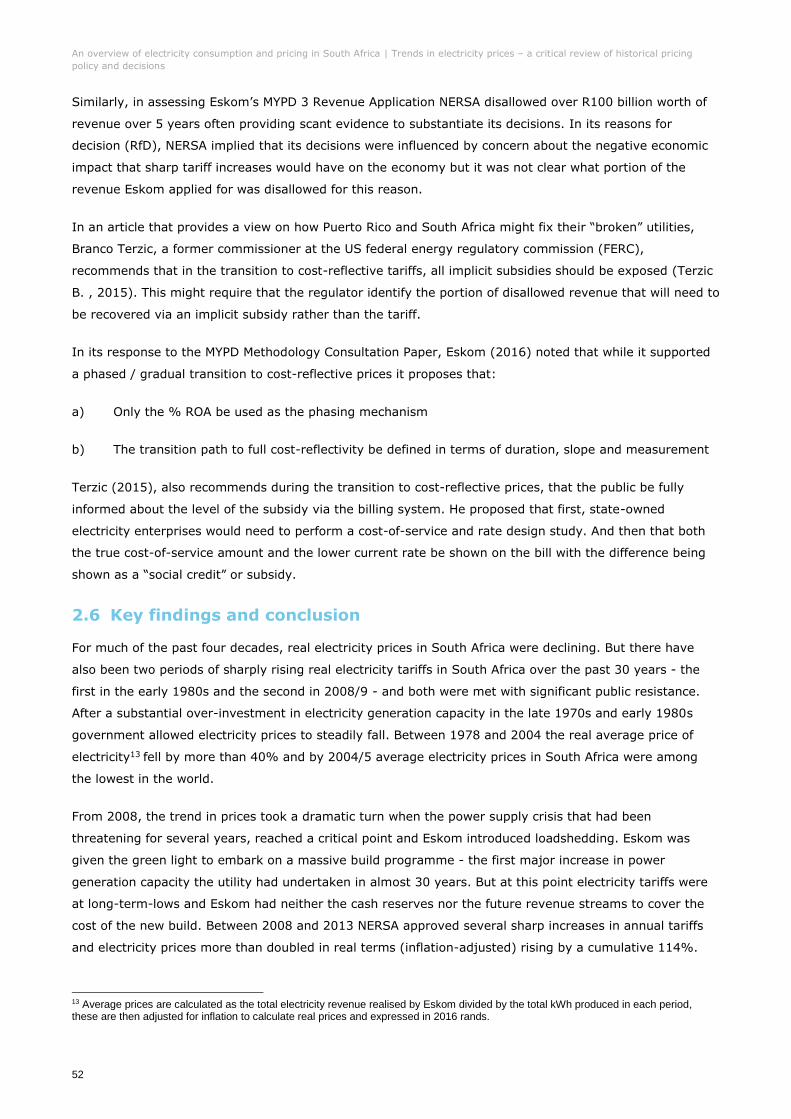
An overview of electricity consumption and pricing in South Africa | Trends in electricity prices – a critical review of historical pricing
policy and decisions
52
Similarly, in assessing Eskom’s MYPD 3 Revenue Application NERSA disallowed over R100 billion worth of
revenue over 5 years often providing scant evidence to substantiate its decisions. In its reasons for
decision (RfD), NERSA implied that its decisions were influenced by concern about the negative economic
impact that sharp tariff increases would have on the economy but it was not clear what portion of the
revenue Eskom applied for was disallowed for this reason.
In an article that provides a view on how Puerto Rico and South Africa might fix their “broken” utilities,
Branco Terzic, a former commissioner at the US federal energy regulatory commission (FERC),
recommends that in the transition to cost-reflective tariffs, all implicit subsidies should be exposed (Terzic
B. , 2015). This might require that the regulator identify the portion of disallowed revenue that will need to
be recovered via an implicit subsidy rather than the tariff.
In its response to the MYPD Methodology Consultation Paper, Eskom (2016) noted that while it supported
a phased / gradual transition to cost-reflective prices it proposes that:
a) Only the % ROA be used as the phasing mechanism
b) The transition path to full cost-reflectivity be defined in terms of duration, slope and measurement
Terzic (2015), also recommends during the transition to cost-reflective prices, that the public be fully
informed about the level of the subsidy via the billing system. He proposed that first, state-owned
electricity enterprises would need to perform a cost-of-service and rate design study. And then that both
the true cost-of-service amount and the lower current rate be shown on the bill with the difference being
shown as a “social credit” or subsidy.
2.6 Key findings and conclusion
For much of the past four decades, real electricity prices in South Africa were declining. But there have
also been two periods of sharply rising real electricity tariffs in South Africa over the past 30 years - the
first in the early 1980s and the second in 2008/9 - and both were met with significant public resistance.
After a substantial over-investment in electricity generation capacity in the late 1970s and early 1980s
government allowed electricity prices to steadily fall. Between 1978 and 2004 the real average price of
electricity13 fell by more than 40% and by 2004/5 average electricity prices in South Africa were among
the lowest in the world.
From 2008, the trend in prices took a dramatic turn when the power supply crisis that had been
threatening for several years, reached a critical point and Eskom introduced loadshedding. Eskom was
given the green light to embark on a massive build programme - the first major increase in power
generation capacity the utility had undertaken in almost 30 years. But at this point electricity tariffs were
at long-term-lows and Eskom had neither the cash reserves nor the future revenue streams to cover the
cost of the new build. Between 2008 and 2013 NERSA approved several sharp increases in annual tariffs
and electricity prices more than doubled in real terms (inflation-adjusted) rising by a cumulative 114%.
13 Average prices are calculated as the total electricity revenue realised by Eskom divided by the total kWh produced in each period, these are then adjusted for inflation to calculate real prices and expressed in 2016 rands.

An overview of electricity consumption and pricing in South Africa | Trends in electricity prices – a critical review of historical pricing
policy and decisions
53
As was the case in the early 1980s, the sharp increases in real electricity prices over the 5-year period
were met with increasing public resistance. NERSA subsequently awarded Eskom increases of roughly CPI
plus 2% for the 5-year MYPD3 period which was well-below Eskom’s requested increases of roughly CPI
plus 10%. The awarded tariff increases have proved inadequate and Eskom’s revenue shortfall has begun
to mount.
In November 2016, S&P announced a downgrade of Eskom’s long-term corporate credit rating citing
concern about increased financial pressure facing Eskom due to uncertainty about the regulatory
framework and the future tariff path. The deteriorating financial position of Eskom, also reflects negatively
on South Africa’s sovereign rating (as its debt is both explicitly and implicitly guaranteed by the
Government) and will increase the likelihood of a sub-investment grade rating downgrade.
We note that one of the most sustained criticisms of government’s electricity pricing policy over the past
45 years is that Eskom has not been allowed to set tariffs at a level that reflects the true cost of supplying
power. We have argued that this in turn has contributed to a series of poor investment decisions,
hampered both public and private investment in the sector and helped to precipitate the electricity supply
crisis of 2008/9.
By maintaining artificially low tariffs, the South African government has effectively continued to subsidise
the cost of electricity – “Subsidising energy use involves providing it at a price below opportunity cost. This
includes non‐collection or non‐payment, selling electricity at a cost that does not reflect the long‐run
marginal cost of supply including capital maintenance” World Bank (2010:22).
While electricity subsidies in South Africa have largely been implicit or off-budget they are subsidies
nonetheless. Whilst there may be no immediate transfer from the government to Eskom to cover the
annual shortfall in revenue caused by the presence of the subsidy the fiscal consequences do eventually
become evident – they most recently took the form a R23 billion equity injection into Eskom and state
guarantees on Eskom’s debt to the tune of R350bn which were announced in 201114. Prior to the R23bn
injection, Eskom received R60bn loan which was subsequently converted into equity as further evidence of
the ongoing costs of implicit subsidies to the fiscus.
The economic harm and distortions that are caused by energy subsidies is wide-ranging. Some of the
consequences of electricity subsidies as summarised in the international literature, include: crowding-out
growth-enhancing or pro-poor public spending; discourage investment in the energy sector and can
precipitate supply-crises; may promote investment in capital-intensive and energy-intensive industries at
the expense of more labour-absorbing sectors; artificially stimulate demand, encourage the inefficient use
of energy and unnecessary pollution; have negative distributional impacts.
In the final section of this chapter we highlighted two criticisms of NERSA’s recent tariff decisions. Firstly,
we maintain that in assessing the impact of rising electricity prices on the economy NERSA failed to
consider the corresponding economic impacts of the implicit electricity subsidy when Eskom is award a
14 Engineering news (2010) Funding 'gap' becomes funding 'plan' as SA confirms R20bn Eskom equity injection. 11 November 2010. Available online at: http://www.engineeringnews.co.za/article/funding-gap-becomes-plan-as-sa-confirms-r20bn-eskom-equity-injection-2010-11-11

An overview of electricity consumption and pricing in South Africa | Trends in electricity prices – a critical review of historical pricing
policy and decisions
54
much lower-than-required tariff increase. It is critical that the costs and consequences of implicit electricity
subsidies associated with lower-than-required tariff increases are acknowledged, modelled and
communicated to public stakeholders. Failing this, electricity subsidies will persist, Eskom’s financial
position is likely to continue to deteriorate which will have meaningful fiscal consequences at this point
there is also a very real risk that this will also trigger a sub-investment downgrade of South Africa’s
sovereign credit rating.
Secondly, we noted that there is a lack of transparency in regulatory decisions about the extent to which
revenue is disallowed based on concern about the corresponding economic impacts of sharp tariff
increases and to facilitate a more gradual transition to cost-reflective prices rather than because costs
have been ‘imprudently incurred’. Branco Terzic, a former commission at the US federal energy regulatory
commission (FERC), recommends that during South Africa’s transition to cost-reflective tariffs, all implicit
subsidies should be exposed (Terzic B. , 2015). This might require that the regulator identify the portion of
disallowed revenue that will need to be recovered via an implicit subsidy rather than the tariff and to
inform the public about the level of the subsidy via the billing system. In its response to the MYPD
Methodology Consultation Paper, Eskom (2016) proposed that firstly the % ROA be used as the phasing
mechanism and secondly that the transition path to full cost-reflectivity be defined in terms of duration,
slope and measurement.

An overview of electricity consumption and pricing in South Africa | International competitiveness of South African electricity tariffs
55
3.1 Introduction
In 2006, Eskom’s industrial and household electricity tariffs were among the lowest in the world (as
suggested in a report compiled by the International Energy Agency)15. However as discussed in Chapter 2,
Eskom’s average electricity tariff has increased by 147% since 2007, reaching R0.76/kWh in FY2015/16.
In this chapter, we explore the extent to which this sharp rise in real average electricity tariffs has affected
the international competitiveness of South Africa’s electricity tariffs for different customer groups. The
chapter begins with an overview of the electricity supply industry and the implications for tariff setting and
benchmarking. This includes a brief overview of how both Eskom and Municipalities approach the detailed
design of tariffs for different customer segments and the reasons for the variance in tariffs across
municipalities. We then go on to provide a comparison of electricity tariffs in South Africa with a broad
selection of advanced and emerging economies based on two well-established surveys.
3.2 The structure of the electricity supply industry and implications for
tariff-setting and benchmarking
The fact that Eskom and municipalities share the responsibility for distributing power in South Africa
complicates the task of comparing the price of electricity in South Africa with other countries. The task is
further complicated by that fact while Eskom’s end-user tariffs are regulated, municipalities enjoy a large
amount of discretion with respect to how they structure tariffs and how much they charge for electricity
distribution services. As a result, there are huge variations in the charges for an equivalent distribution
service and the final electricity tariff faced by a similar category of consumers across municipalities or ‘re-
distributors’.
3.2.1 The structure of the electricity supply industry
The electricity supply industry value chain consists broadly of three distinct groups of services - generation
(Gx), transmission (Tx) and distribution (Dx). Eskom is vertically integrated across all three areas of the
value chain and is responsible for almost all power generation and transmission in South Africa, but shares
the role of distributing power to end-users with municipalities. Eskom generates approximately 95% of
total electricity consumed in South Africa16 while municipal-owned power plants and independent power
producers (IPPs) generate the remaining 5%. Eskom’s total sales (including international) amounted to
214 487 GWh in 2015/16. All transmission networks in South Africa are owned by Eskom who
consequently provides 100% of transmission services.
15 International Energy Agency (2010) Energy Statistics Report, 4Q10.
16 Eskom company overview (2016). Available at: http://www.eskom.co.za/OurCompany/CompanyInformation/Pages/Company_Information.aspx
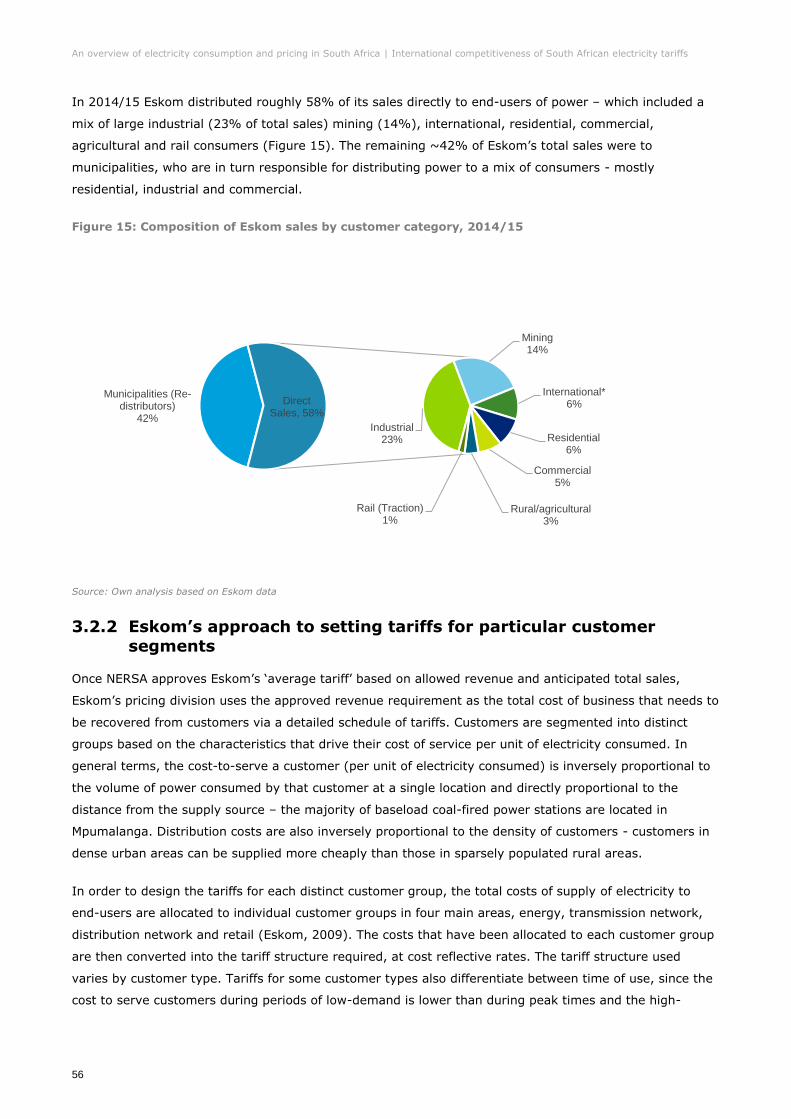
An overview of electricity consumption and pricing in South Africa | International competitiveness of South African electricity tariffs
56
In 2014/15 Eskom distributed roughly 58% of its sales directly to end-users of power – which included a
mix of large industrial (23% of total sales) mining (14%), international, residential, commercial,
agricultural and rail consumers (Figure 15). The remaining ~42% of Eskom’s total sales were to
municipalities, who are in turn responsible for distributing power to a mix of consumers - mostly
residential, industrial and commercial.
Figure 15: Composition of Eskom sales by customer category, 2014/15
Source: Own analysis based on Eskom data
3.2.2 Eskom’s approach to setting tariffs for particular customer
segments
Once NERSA approves Eskom’s ‘average tariff’ based on allowed revenue and anticipated total sales,
Eskom’s pricing division uses the approved revenue requirement as the total cost of business that needs to
be recovered from customers via a detailed schedule of tariffs. Customers are segmented into distinct
groups based on the characteristics that drive their cost of service per unit of electricity consumed. In
general terms, the cost-to-serve a customer (per unit of electricity consumed) is inversely proportional to
the volume of power consumed by that customer at a single location and directly proportional to the
distance from the supply source – the majority of baseload coal-fired power stations are located in
Mpumalanga. Distribution costs are also inversely proportional to the density of customers - customers in
dense urban areas can be supplied more cheaply than those in sparsely populated rural areas.
In order to design the tariffs for each distinct customer group, the total costs of supply of electricity to
end-users are allocated to individual customer groups in four main areas, energy, transmission network,
distribution network and retail (Eskom, 2009). The costs that have been allocated to each customer group
are then converted into the tariff structure required, at cost reflective rates. The tariff structure used
varies by customer type. Tariffs for some customer types also differentiate between time of use, since the
cost to serve customers during periods of low-demand is lower than during peak times and the high-
Municipalities (Re-distributors)
42%Industrial
23%
Mining14%
International*6%
Residential6%
Commercial5%
Rural/agricultural3%
Rail (Traction)1%
Direct Sales, 58%

An overview of electricity consumption and pricing in South Africa | International competitiveness of South African electricity tariffs
57
demand season (winter). Time of use includes peak, standard, and off-peak periods, with off-peak periods
between 10pm and 6am on week days. Eskom’s four customer groups and the associated tariff plans for
each group are summarised in Table 3.
Table 3: Eskom customer segmentation and tariff plans
Broad customer
group
Description Tariff plans 2016/17
Urban Tariffs Includes a variety of tariff plans for
commercial and industrial customers
located in urban areas. Plans vary mainly
by load factor, voltage, ability to shift load
and generate their own power.
Also, includes plans for government
institutions and public lighting.
Nightsave Large
Nightsave Small
Megaflex
Megaflex Gen
Minflex
Business Rate
Public lighting
Rural Tariffs Includes tariff plans for a variety of
industrial, commercial and agricultural
customers based in rural areas.
Plans vary mainly by load factor, voltage,
ability to generate their own power and
single-phase vs three-phase supply.
Nightsave Rural
Ruraflex
Ruraflex Gen
Landrate
Landlight
Residential Includes tariff plans for a variety of
residential customers in urban areas.
Plans vary mainly by bulk vs. non-bulk
supply, voltage and single-phase vs three-
phase supply.
Homepower Bulk
Homepower Standard
Home light
WEPS
(Wholesale
electricity
pricing system)
or
Municipalities
WEPS is the tariff plan available to
municipalities or re-distributors.
It has the same rates and structure as
Megaflex (for key industrial customers) and
represents the wholesale costs of supply in
the most unbundled format.
WEPS/Megaflex
Source: Own analysis based on Eskom tariff book 2015/16
3.2.3 Reasons for the large variance in electricity charges levied by
municipalities
Roughly 42% of Eskom’s total sales of electricity are distributed to end-consumers via 187 municipalities
who act as re-distributors. NERSA’s authority to regulate the tariffs charged by municipal distributors
however is not clear – while the Electricity Regulation Act of 2006 gives NERSA the responsibility to
regulate electricity prices and tariffs, the Constitution gives local government exclusive jurisdiction over
electricity reticulation. The Municipal System Act of 2000 requires that municipalities determine their own
tariff policies for municipal services (Briefing Paper 4 , Critical issues facing South African cities with
respect to electricity, Draft., 2016).
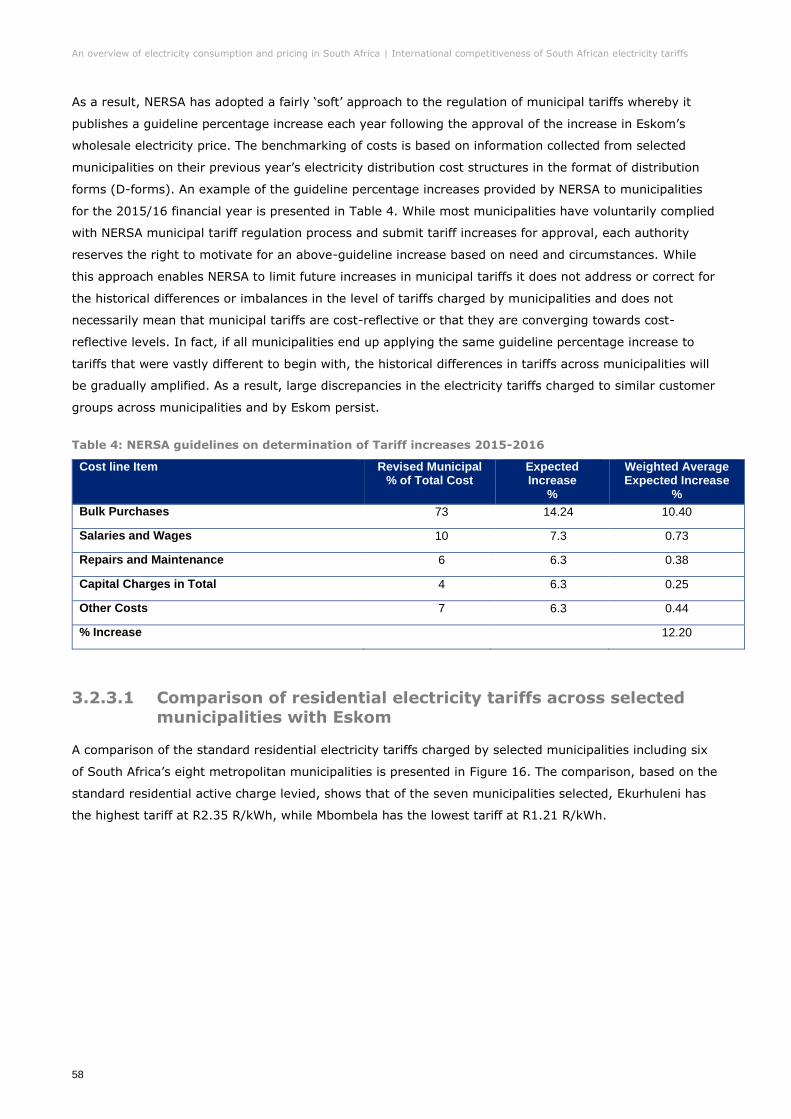
An overview of electricity consumption and pricing in South Africa | International competitiveness of South African electricity tariffs
58
As a result, NERSA has adopted a fairly ‘soft’ approach to the regulation of municipal tariffs whereby it
publishes a guideline percentage increase each year following the approval of the increase in Eskom’s
wholesale electricity price. The benchmarking of costs is based on information collected from selected
municipalities on their previous year’s electricity distribution cost structures in the format of distribution
forms (D-forms). An example of the guideline percentage increases provided by NERSA to municipalities
for the 2015/16 financial year is presented in Table 4. While most municipalities have voluntarily complied
with NERSA municipal tariff regulation process and submit tariff increases for approval, each authority
reserves the right to motivate for an above-guideline increase based on need and circumstances. While
this approach enables NERSA to limit future increases in municipal tariffs it does not address or correct for
the historical differences or imbalances in the level of tariffs charged by municipalities and does not
necessarily mean that municipal tariffs are cost-reflective or that they are converging towards cost-
reflective levels. In fact, if all municipalities end up applying the same guideline percentage increase to
tariffs that were vastly different to begin with, the historical differences in tariffs across municipalities will
be gradually amplified. As a result, large discrepancies in the electricity tariffs charged to similar customer
groups across municipalities and by Eskom persist.
Table 4: NERSA guidelines on determination of Tariff increases 2015-2016
Cost line Item Revised Municipal % of Total Cost
Expected Increase
%
Weighted Average Expected Increase
%
Bulk Purchases 73 14.24 10.40
Salaries and Wages 10 7.3 0.73
Repairs and Maintenance 6 6.3 0.38
Capital Charges in Total 4 6.3 0.25
Other Costs 7 6.3 0.44
% Increase 12.20
3.2.3.1 Comparison of residential electricity tariffs across selected
municipalities with Eskom
A comparison of the standard residential electricity tariffs charged by selected municipalities including six
of South Africa’s eight metropolitan municipalities is presented in Figure 16. The comparison, based on the
standard residential active charge levied, shows that of the seven municipalities selected, Ekurhuleni has
the highest tariff at R2.35 R/kWh, while Mbombela has the lowest tariff at R1.21 R/kWh.
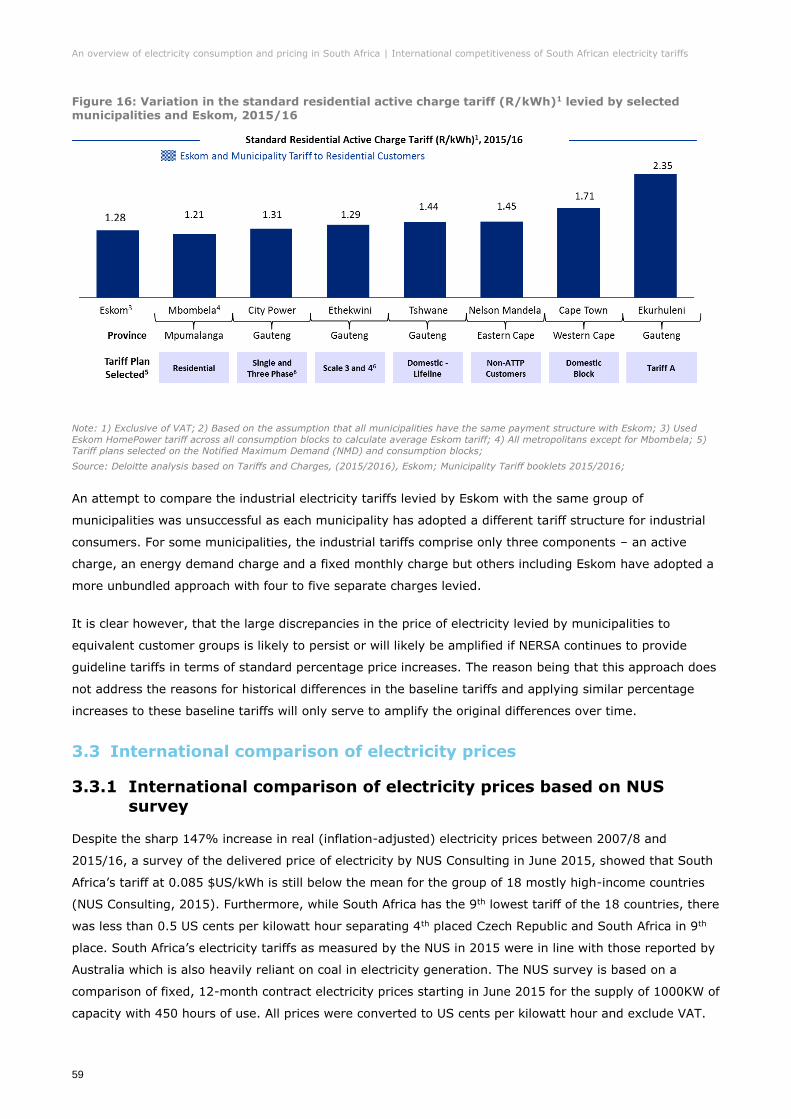
An overview of electricity consumption and pricing in South Africa | International competitiveness of South African electricity tariffs
59
Figure 16: Variation in the standard residential active charge tariff (R/kWh)1 levied by selected municipalities and Eskom, 2015/16
Note: 1) Exclusive of VAT; 2) Based on the assumption that all municipalities have the same payment structure with Eskom; 3) Used
Eskom HomePower tariff across all consumption blocks to calculate average Eskom tariff; 4) All metropolitans except for Mbombela; 5)
Tariff plans selected on the Notified Maximum Demand (NMD) and consumption blocks;
Source: Deloitte analysis based on Tariffs and Charges, (2015/2016), Eskom; Municipality Tariff booklets 2015/2016;
An attempt to compare the industrial electricity tariffs levied by Eskom with the same group of
municipalities was unsuccessful as each municipality has adopted a different tariff structure for industrial
consumers. For some municipalities, the industrial tariffs comprise only three components – an active
charge, an energy demand charge and a fixed monthly charge but others including Eskom have adopted a
more unbundled approach with four to five separate charges levied.
It is clear however, that the large discrepancies in the price of electricity levied by municipalities to
equivalent customer groups is likely to persist or will likely be amplified if NERSA continues to provide
guideline tariffs in terms of standard percentage price increases. The reason being that this approach does
not address the reasons for historical differences in the baseline tariffs and applying similar percentage
increases to these baseline tariffs will only serve to amplify the original differences over time.
3.3 International comparison of electricity prices
3.3.1 International comparison of electricity prices based on NUS
survey
Despite the sharp 147% increase in real (inflation-adjusted) electricity prices between 2007/8 and
2015/16, a survey of the delivered price of electricity by NUS Consulting in June 2015, showed that South
Africa’s tariff at 0.085 $US/kWh is still below the mean for the group of 18 mostly high-income countries
(NUS Consulting, 2015). Furthermore, while South Africa has the 9th lowest tariff of the 18 countries, there
was less than 0.5 US cents per kilowatt hour separating 4th placed Czech Republic and South Africa in 9th
place. South Africa’s electricity tariffs as measured by the NUS in 2015 were in line with those reported by
Australia which is also heavily reliant on coal in electricity generation. The NUS survey is based on a
comparison of fixed, 12-month contract electricity prices starting in June 2015 for the supply of 1000KW of
capacity with 450 hours of use. All prices were converted to US cents per kilowatt hour and exclude VAT.
1.28

An overview of electricity consumption and pricing in South Africa | International competitiveness of South African electricity tariffs
60
We have included Eskom’s average tariff in the NUS comparison for interest sake as it is not clear what
benchmark tariff NUS would have used for South Africa in the absence of deregulated 12-month contract
pricing. We note that the USD equivalent of the average Eskom tariff of R0.76/kWh in 2015 (which is a
blend of wholesale and delivered prices) was significantly lower than the 12-month delivered contract price
of 1000KW of electricity for all the countries surveyed (apart from Sweden).
The slide in the performance of South Africa in the NUS rankings from 2nd in 2011 to 9th in 2015 does
however suggest, that electricity prices in South Africa are becoming less internationally competitive
(Table 5). In 2011 South Africa, was still ranked as having the 2nd lowest tariffs of the 16 countries
surveyed - second only to Canada which generates most of its electricity from hydroelectric plants.
Figure 17: International comparison of the price of electricity delivered in June 2015, NUS Survey
Note: Eskom average tariff including distribution and generation: R0.76/kWh converted to $US using NUS assumed exchange rate
R12.25/$US
Source: “International Electricity and Natural Gas Report and Price Survey”, (2015), NUS Consulting Group; US Forex; Deloitte analysis
based on the NUS Energy Market Survey, 2015

An overview of electricity consumption and pricing in South Africa | International competitiveness of South African electricity tariffs
61
Table 5: South Africa’s performance in the NUS ranking of countries electricity prices, 2011 to 2015
Note: 1) Electricity prices ranked in ascending order, i.e. 1 – smallest and 18 – largest; 2) Global ranking and Price in USc/Kwh
Source: “International Electricity and Natural Gas Report and Price Survey”, (2010-2015), NUS Consulting Group; Deloitte Analysis
3.3.2 International comparison of electricity prices for industrial
consumers
The International Energy Agency provides an annual comparison of industrial and residential electricity
tariffs across the 35 countries17 that belong to the OECD. While South Africa was originally included in the
IEA’s price comparisons, the agency discontinued publication of data from selected non-OECD countries,
including South Africa, in 2012. For the years 2006 and 2010 the IEA used Eskom’s direct sales to
industrial users as the benchmark for industrial tariffs. From 2014 we used the average active charges
under Eskom’s Megaflex industrial plan as the benchmark but note this slightly underestimates the real
cost as transmission and distribution charges are excluded.
The IEA comparison provided in Figure 18, suggests that despite the sharp increases in real electricity
prices since 2007, industrial electricity tariffs in South Africa were still the lowest in the broad range of
advanced and emerging economies that are part of the OECD.
If Eskom’s average tariff, which was R0.67kWh or the equivalent of 0.06 $US/kWh in 2014, is used as a
more conservative benchmark for industrial tariffs (instead of Megaflex), it would still have been at the
bottom of the international spectrum. While the gap between industrial tariffs in South Africa and other
countries at the lower end of the spectrum has narrowed since 2006, the tariffs remain low by
international standards. This also suggests that industrial tariffs in South Africa remain below ‘cost-
reflective’ levels since Norway which had similarly low tariffs in 2014, generates the majority of its
17 The OECD members are mostly advanced economies and but include some emerging markets such as Turkey, Chile and Mexico.

An overview of electricity consumption and pricing in South Africa | International competitiveness of South African electricity tariffs
62
electricity using hydropower, which is usually significantly more cost-efficient than the coal-fired
generation South Africa is heavily reliant on.
Figure 18: International comparison of electricity tariffs for industrial consumers ($US/kWh)
Note: 1) Non-OECD data no longer collected by the IEA; 2) The USD/ZAR average exchange was 0.14, 0.14 and 0.09 USD for the 2006/07, 2010/11 and 2014/15 financial years; 3) Tariff estimates for South Africa for 2014/15 estimated by calculating average
HomePower active charge tariffs obtained from Eskom tariff books then converting to USD dollar rates 4) SA metros 2014/15 active
charge data;
Source: IEA, (2016), ESKOM AFS; Tariffs and Charges, (1996-2016), Eskom; US Forex
The IEA provides a similar comparison of average residential electricity tariffs across OECD countries. The
benchmark the IEA used for South Africa’s residential tariffs before it dropped non-OECD countries from
the survey in 2012, was Eskom’s tariff for direct sales to residential customers and street lighting. For
2014 we used Eskom’s Homepower tariff as a benchmark for South African residential tariffs. But as
discussed in Section 3.2.3 while some residential customers buy electricity directly from Eskom, the
majority purchase electricity from the ~187 municipalities that also distribute electricity. Because of the
wide variation in residential tariffs across municipalities we have included tariffs from 3 large metropolitan
areas – Cape Town, City Power (Johannesburg) and Ekurhuleni.
The IEA comparison provided in Figure 19 shows that in 2006, South Africa (Eskom) offered the second-
lowest residential tariffs of the 33 countries surveyed. By 2010, South Africa had slipped in the ranking to
7th place but Eskom’s residential tariffs remained at the lower end of the spectrum. South Africa’s
international ranking improved again in 2014, aided by a steady depreciation in the rand which helped to
offset the impact of rising rand-denominated tariffs over the period. The IEA comparison suggests that
Eskom’s residential tariffs were the 3rd most competitive of the 30 countries surveyed in 2014. But not all
residential consumers in South Africa are benefiting from Eskom’s competitively priced residential tariffs. If
Ekurhuleni municipality’s residential tariff were included they would rank in 17th place which puts them
among the 50% of countries with the most expensive residential tariffs. The ranking shows that residential
customers in Ekurhuleni were paying more for electricity in 2014 than those in countries with a much

An overview of electricity consumption and pricing in South Africa | International competitiveness of South African electricity tariffs
63
higher cost of living including Switzerland, Finland and France. Cape Town’s residential tariffs while higher
than those levied by City Power and Eskom, would rank as 5th lowest and are in line with tariffs levied in
other emerging markets economies such as Chile and Hungary.
The analysis shows that despite the 130% increase in Eskom’s average real tariff between 2007 and 2014
some residential consumers in South Africa, including those served by City Power and Eskom, were still
enjoying some of the most competitively priced electricity on offer among a broad group of 30 advanced
and emerging economies. Others however, including those served by Ekurhuleni, were already facing
some of the most expensive electricity in the OECD group. The large discrepancies in municipal electricity
tariffs is cause for concern. It is questionable whether further increases in the already relatively high tariffs
charged by some municipalities can be justified as those charging relatively low tariffs, such as Eskom and
City Power continue to transition to a cost-reflective tariff. There is a need for NERSA to review its
approach to the regulation of municipal electricity tariffs to ensure all tariffs (wholesale and retail) can
converge towards cost-reflective levels.
Figure 19: International comparison of electricity tariffs for residential consumers ($US/kWh)
Source: NUS Energy Market Survey, 2015
3.4 Conclusion
Despite the sharp 147% increase in real (inflation-adjusted) electricity prices between 2007/8 and
2015/16, a survey of the delivered electricity prices by NUS Consulting in June 2015, showed that South
Africa’s tariff at 0.085 $US/kWh is still below the mean for the group of 18 mostly high-income countries
(NUS Consulting, 2015). Furthermore, while South Africa has the 9th lowest tariff of the 18 countries, there
was less than 0.5 US cents per kilowatt hour separating 4th placed Czech Republic and South Africa in 9th
place. The slide in the performance of South Africa in the NUS rankings from 2nd in 2011 to 9th in 2015
does however show that South African electricity prices have become less competitive internationally.

An overview of electricity consumption and pricing in South Africa | International competitiveness of South African electricity tariffs
64
The International Energy Agency also provide a comparison of industrial and residential electricity tariffs
across a broader group of 30 to 33 advanced and emerging economies that are members of the OECD.
Benchmarking of South Africa to this group suggests that industrial electricity tariffs in South Africa remain
very price-competitive. In 2014, Eskom’s industrial electricity tariffs were still the lowest (or at least
among the lowest if a more conservative benchmark tariff was chosen) among the 30 countries surveyed.
The results from the residential tariff analysis were mixed. Our comparison of South Africa to the IEA’s
ranking of countries’ residential tariffs in 2014, suggests that Eskom’s residential tariffs would have been
the 3rd most competitive of the 30 countries surveyed. But only a small proportion of residential
consumers in South Africa are benefiting from Eskom’s competitively priced residential tariffs as the
majority purchase their electricity from the ~187 municipal distributors. A comparison of the standard
residential electricity tariffs charged by 7 of the 187 municipalities was sufficient to show there are large
discrepancies in the tariff charged by municipalities. While City Power (Johannesburg) tariffs were similar
to the Eskom tariff, Ekurhuleni tariffs are 85% higher. Ekurhuleni placed 17th in the IEA’s residential tariff
ranking which puts the municipality among the 50% of countries with the most expensive residential
tariffs in the OECD group.
The large discrepancies in municipal electricity tariffs in South Africa are concerning and makes it
challenging to accurately assess the impact of rising tariffs on the end-consumer. With Eskom tariffs set to
continue to rise, it is questionable whether further increases in the already relatively high tariffs charged
by some municipalities can be justified. NERSA should review its approach to the regulation of municipal
electricity tariffs as its current approach of providing guideline tariffs in terms of a standard percentage
price increases across all municipalities will only serve to amplify historical differences. NERSA should
revise its approach to ensure that historical discrepancies are addressed so that tariffs levied by all
distributors converge towards cost-reflective levels.

An overview of electricity consumption and pricing in South Africa | Requirements of an efficient electricity pricing regime
65
4.1 Introduction
In this chapter, we consider the requirements for an efficient electricity pricing regime based on
international experience, economic theory, and good practice. We begin the chapter by reviewing the
internationally accepted pricing principles that should result in the efficient delivery of electricity services
under a regulated monopoly provider, such as Eskom. We go on to define a ‘cost-reflective’ tariff in terms
of economic pricing theory and then explore how a tariff equivalent to long-run marginal cost (LRMC) is
best approximated under the rate-of-return (RoR) methodology that is typically employed for tariff setting
for a regulated monopoly utility. We then discuss some of the limitations of the RoR methodology and the
shift internationally to ‘incentive-based’ regulation. We go on to acknowledge that while an efficient pricing
regime based on a truly cost-reflective tariff is necessary to ensure the efficient delivery of electricity
services by a monopoly utility, it is not sufficient. We discuss some of the well-established energy
governance and practices that must also be in place to ensure the efficient delivery of electricity services
by a monopoly provider. In the second half of the chapter we discuss current support for the transition to
cost-reflective electricity prices in South Africa and the SADC region more broadly and examine the current
gap between actual and cost-reflective tariffs in South Africa. We end the chapter by summarising some of
the common barriers to the removal of energy subsidies based on a series of international case studies
and look at strategies for reform more broadly and in South Africa specifically.
4.2 Requirements of an effective electricity pricing regime
4.2.1 General Pricing Principles
In designing an efficient electricity pricing regime, there is often an attempt to satisfy a range of social,
economic and political objectives that are not necessarily mutually consistent. We argue however, that the
primary objective of any pricing regime should be to ensure that tariffs result in the efficient allocation of
resources so that:
“national economic resources [are] … allocated efficiently, not only among different sectors of the
economy, but within the electric power sector. This implies that cost-reflecting prices must be used to
indicate to the electricity consumers the true economic costs of supplying their specific needs, so that
supply and demand can be matched efficiently” (Munasinghe, 1981, p. 323).
In a World Bank publication on the principles of modern electricity pricing, Munasinghe (1981) goes on to
argue that a pricing regime that results in the efficient delivery of electricity services (under a regulated
monopoly utility provider) should also aim to satisfy these requirements:
(i) Fair allocation of costs among consumers according to the burdens they impose on the system;

An overview of electricity consumption and pricing in South Africa | Requirements of an efficient electricity pricing regime
66
(ii) Price stability - large fluctuations in prices from year to year should be avoided;
(iii) A minimum level of basic service is provided to those who cannot afford them;
(iv) Prices raise sufficient revenue to ensure that the utility is financially sustainable;
(v) The tariff structure is administratively efficient;
(vi) And, to the extent possible, other political objectives can be considered (e.g. subsidies to enhance
regional development).
Munasinge (1981) acknowledges that because some of these criteria may be in conflict with one another,
it is necessary to accept certain trade-offs. He maintains however, that as long as prices are set at a cost-
reflective level, which in terms of economic theory is at long-run marginal cost (LRMC), they will be
consistent with the primary objective of ensuring the efficient allocation of resources. He notes that a tariff
structure that is consistent with cost-reflective prices and based on LRMC should have the analytical rigour
and inherent flexibility to meet most of the other basic objectives of an efficient pricing regime outlined
above.
4.2.2 Defining ‘cost-reflective’ tariffs
In terms of economic theory, a ‘cost-reflective’ tariff is most often defined as a tariff equal to the long-run
marginal cost (LRMC) of supply, since this concept is consistent with the efficient allocation of economic
resources and a relatively stable or smooth tariff path. “One of the best-known results in economics is that
resources are most efficiently [allocated] when prices are set according to marginal costs” (London
Economics, 1997).
While the short-run marginal cost (SRMC) method is consequently the basis for the efficient pricing of
most goods and services in the case of the electricity supply industry LRMC is preferred because it results
in prices that in real terms are more stable over time. Where the SRMC is defined as the incremental cost
of supplying an additional unit of power assuming that generation capacity is fixed. The LRMC is the
incremental cost of supplying an additional unit of power assuming that all inputs are variable - in the
electricity supply industry this corresponds to a timeframe of several years or even decades depending on
the type of generation capacity that is installed (Ergon Energy, 2015).
Therefore, in order to set prices at LRMC one needs to anticipate what the incremental cost of supplying an
additional unit of power would be if it were possible to continuously maintain capacity at an optimal level
to serve anticipated demand several years into the future.
Because there are massive economies of scale to be realised in power generation, capacity additions to
power systems tend to be large and long-lived which results in a lumpy investment profile, as illustrated in
Figure 20. As a result, conventional short-run marginal cost pricing would lead to massive fluctuations in
electricity prices. By way of illustration, Q1 in Figure 20 represents an energy utility’s current capacity and
Q2 the next instalment in capacity (a new plant). At capital investment at Q1, demand is well below
available supply so prices set at SRMC are simply equivalent to the operating and maintenance costs.

An overview of electricity consumption and pricing in South Africa | Requirements of an efficient electricity pricing regime
67
However, as demand increases and new users are added to the grid, demand will eventually be equivalent
to the available supply and the price based on SRMC rises sharply to reflect the now much higher
incremental cost of supplying additional increments of power at fixed capacity Q1. At Q2, new capacity is
installed so supply is now well in excess of demand so the SRMC, is again equivalent to just the operating
and maintenance costs associated with new fixed capacity at Q2.
Figure 20: Effect of ‘lumpy’ investments on prices set at short-run marginal cost
Source: Reconstructed and adapted from (Andersson & Bohman, 1985)
Since large fluctuations in electricity prices are undesirable and could come at significant social costs, most
economists favour long-run marginal cost as the basis for electricity prices (and for setting prices in other
industries where investments are similarly lumpy).
The principle of LRMC can also be applied during detailed tariff design to ensure that tariffs are set to
ensure that the costs of supply are efficiently allocated among electricity consumers. According to
Munasinghe (1981) this usually requires a differentiation of tariffs by characteristics that determine cost-
to-serve such as:
(i) major customer categories - residential, industrial, commercial, special, rural, and so on
(ii) voltage levels (high, medium, and low)
(iii) time of day (peak, off-peak); and
(iv) geographic region

An overview of electricity consumption and pricing in South Africa | Requirements of an efficient electricity pricing regime
68
4.2.3 Operationalising the concept of ‘cost-reflectivity’ - a review of
tariff setting methodologies
While a theoretically robust, LRMC is difficult to accurately estimate and operationalise. In non-competitive
electricity markets like South Africa, where a single public utility is a monopoly provider of electricity (or
there are several regional monopolies), end-user prices are typically set with regulatory approval in order
to ensure that prices and output are socially optimal and approximate those that would likely prevail under
more competitive market conditions. The traditional (and most widely used) approach to tariff-setting for
public utilities that operate under price-regulation is the rate of return (RoR) methodology - which is based
on accounting definitions that tend to guarantee that the utility can recover its cost of service provision
(Gunatilake, Perera, & Carangal-San Jose, 2008). RoR is the method currently employed by NERSA to
regulate Eskom’s average electricity tariff under the Multi-Year Price Determination (MYPD) methodology
and the first implementation period for the MYPD was from 01 April 2006 to 31 March 2009.
Under the RoR methodology the regulator must determine what total revenue the public utility will require
to meet its financial obligations. The basic principle applied in the determination of the allowable revenue
(AR) is that it should be equal to the cost of efficient service provision at an acceptable level of service
quality. The allowed revenue should also include adequate return on investment and incentives for the
utility to operate and expand its network and asset base in a socially optimal manner. (Gunatilake, Perera,
& Carangal-San Jose, 2008).
In terms of the MYPD, Eskom’s allowable revenue is determined by applying the ‘allowable revenue’
formula illustrated in Figure 21. Based on this definition, Eskom’s allowable revenue includes capital costs,
several categories of operating cost, taxes, and the regulatory clearing account (RCA). The RCA is a
mechanism to correct for the under or overestimation of costs in the previous period. The capital cost in
turn is broken down into two components:
(i) amortisation of investments in fixed assets, which is recovered through a depreciation allowance;
(ii) cost of financing the investment recovered through an allowed return on assets.
Figure 21: Tariff formula – Eskom’s allowable revenue
Source: Deloitte Analysis, NERSA

An overview of electricity consumption and pricing in South Africa | Requirements of an efficient electricity pricing regime
69
4.2.4 Does the RoR methodology employed by NERSA give rise to cost-
reflective tariffs?
The RoR methodology employed by NERSA, if systematically applied, should guarantee that Eskom
recovers the costs of supplying electricity and earns an adequate on its investments. But the RoR
methodology does not necessarily give rise to tariffs that closely approximate LRMC. Critics of the
methodology argue that it gives rise to prices that are equivalent to long-run average cost (LRAC) which
are generally higher than LRMC and as such, does not result in the most efficient allocation of resources
(Nezlobin, Rajan, & Reichelstein, 2011).
4.2.4.1 The extent to which RoR methodology approximate LRMC depends on basis for asset valuation and/or the method for
depreciating the asset base
Some have argued that as long as the regulated utility’s assets are valued at replacement value (value of
modern equivalent assets) rather than historic cost the RoR methodology does closely approximate LRMC.
There are two main approaches to the valuation of the regulatory asset base – Historic Cost (HC) and
Depreciated Replacement Cost (DRC). Munisinghe (1981) argues that the traditional historic cost approach
is not consistent with LRMC as it is only concerned with the recovery of the historic or sunk cost of the
asset via depreciation charges. The historic cost approach implies future economic resources will be as
cheap or as expensive as in the past. This could lead to overinvestment and waste, or underinvestment
and the additional costs of unnecessary scarcity. Under LRMC price must be related to the economic value
of future resources required to meet consumption so Munasinghe argues that the DRC approach which is
based on determining the modern equivalent value of the regulatory asset base would more closely
approximate LMRC and also results in a flatter and more stable tariff profile than the HC method. Some
critics of this approach also argue that replacement cost methods are not sustainable where technological
improvements are lowering the cost of modern equivalent assets (since the utility would still be burdened
with the debt service responsibilities associated with its original investment). Until the MYPD3 NERSA
employed historic cost as its method of depreciation for the regulatory asset base (RAB) but since MYPD
most of the RAB is valued on the basis of its modern equivalent asset value (MEAV).
More recently Rogerson (2011) and Nezlobin, Rajan, & Reichelstein (2011) have argued that it is not the
asset valuation method but the method for the depreciation of the regulatory asset base (or capital stock)
that determines whether the regulated prices are in line with LRMC. Rodgerson (2011) argues that the
straight-line depreciation method typically employed by regulators when assets are valued at historic cost
is not appropriate as the accelerated depreciation schedule it produces does not give rise to tariff
equivalent to long-run marginal cost. Rodgerson concludes that the RoR methodology can give rise to
prices set at LRMC “so long as the correct method for allocating costs is used in either case. For the case
of forward looking cost, the correct forward looking allocation share is the unique forward-looking
allocation share that allows the firm to break even. For the case of historic cost, the correct historic cost
allocation rule is a relatively simple and natural rule called the relative replacement cost (RRC) rule.”
(Rodgerson, 2011). The relative replacement cost (RRC) allocation rule, defined by Rodgerson, satisfies
these two rules: (i) it allocates costs in proportion to replacing the surviving amount of the asset with new
assets, and (ii) it allows the utility to break-even taking the time value of money into account.

An overview of electricity consumption and pricing in South Africa | Requirements of an efficient electricity pricing regime
70
4.2.4.2 Criticism of the RoR methodology for tariff setting and the
move to performance-based regulation
More general criticism of the RoR methodology as outlined in Gunatilake, Perera, & Carangal-San Jose
(2008) include:
(i) It does not provide an incentive to minimise costs and improve productivity as OPEX is
considered a pass-through item and productivity improvements may consequently translate
into revenue decreases.
(ii) There is an incentive to overinvest in capacity or to ‘gold plate’ it in order to justify higher
revenues to the utility.
(iii) Is it a high cost form of regulation as it requires annual tariff reviews requiring verification of
the actual costs of the utility.
(iv) There may be information asymmetry between the utility and the regulator as the traditional
approach requires detailed and consistent information regarding operating costs and fixed
assets.
To address the limitations to the traditional RoR approach, certain modifications have been introduced
which are collectively referred to either as incentive based regulation or performance based regulation
(PBR). Under one form of PBR, the ‘price-cap-system’ the regulator sets a long-term (usually 4-5 years)
cap on the unit price of electricity. Operators are only allowed to adjust prices for inflation and productivity
gains. The advantages of this approach are that it can encourage efficiency (which can be achieved
through both cost reductions and technological innovation) and drive increased competition. In overview of
the basis on which incentive-based ratemaking was introduced by the FERC in the United States, Terzic
(1994: p.57) notes “For the remaining, shrinking monopoly services, incentive-rate making is inevitable
and a necessary evolutionary step in traditional utility regulation. Incentive ratemaking complements the
review and ratemaking established by a regulatory body with a periodic monitoring and review of
performance”.
4.3 Additional requirements for a monopoly utility that is consistent
with efficient delivery of electricity services.
While an efficient pricing regime is necessary to ensure the efficient delivery of electricity services by a
monopoly utility, there are also other well-established governance practices that must be adhered to so
that sound investment decisions are made.
Vedavelli (1989) notes that in addition to ensuring that tariffs reflect the LRMC of supplying power, it is
also important that sound investment decisions are made to ensure that demand is met at least cost so
that the cost of labour, fuel and capital inputs to production are minimised. Munasinghe (1981),
demonstrates how electricity tariffs that reflect the LRMC of supply are set in an iterative feedback loop
that begins with producing reliable forecasts of long-term electricity based primarily on assumptions of
future electricity price path and growth in economic activity. Electricity demand and load forecasts are
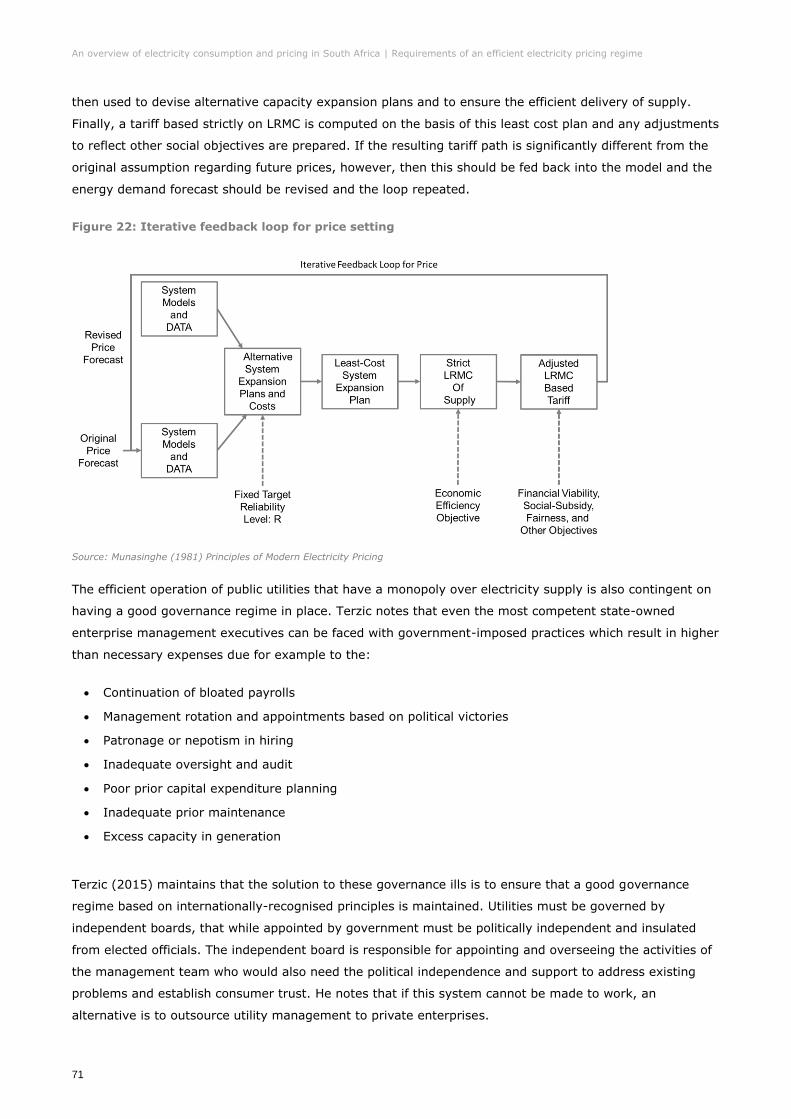
An overview of electricity consumption and pricing in South Africa | Requirements of an efficient electricity pricing regime
71
then used to devise alternative capacity expansion plans and to ensure the efficient delivery of supply.
Finally, a tariff based strictly on LRMC is computed on the basis of this least cost plan and any adjustments
to reflect other social objectives are prepared. If the resulting tariff path is significantly different from the
original assumption regarding future prices, however, then this should be fed back into the model and the
energy demand forecast should be revised and the loop repeated.
Figure 22: Iterative feedback loop for price setting
Source: Munasinghe (1981) Principles of Modern Electricity Pricing
The efficient operation of public utilities that have a monopoly over electricity supply is also contingent on
having a good governance regime in place. Terzic notes that even the most competent state-owned
enterprise management executives can be faced with government-imposed practices which result in higher
than necessary expenses due for example to the:
Continuation of bloated payrolls
Management rotation and appointments based on political victories
Patronage or nepotism in hiring
Inadequate oversight and audit
Poor prior capital expenditure planning
Inadequate prior maintenance
Excess capacity in generation
Terzic (2015) maintains that the solution to these governance ills is to ensure that a good governance
regime based on internationally-recognised principles is maintained. Utilities must be governed by
independent boards, that while appointed by government must be politically independent and insulated
from elected officials. The independent board is responsible for appointing and overseeing the activities of
the management team who would also need the political independence and support to address existing
problems and establish consumer trust. He notes that if this system cannot be made to work, an
alternative is to outsource utility management to private enterprises.

An overview of electricity consumption and pricing in South Africa | Requirements of an efficient electricity pricing regime
72
4.4 Support for the transition to cost-reflective electricity prices in
South Africa
4.4.1 Tariff principles accepted by NERSA and Government
While the basic properties of an ‘optimal’ electricity tariff, which as discussed in Section 4.2.1 include cost-
reflectivity and efficiency, revenue adequacy and transparency in the provision of subsidies, have already
been accepted by both NERSA and Government, it is argued that these principles have not yet been
systematically implemented (Newbury & Eberhard, 2008). According to NERSA (14 October 2011), the
legal basis for the current multi-year price determination process lies in the Electricity Regulation Act of
2006 which prescribes the following tariff principles:
1) A license condition determined under section 15 relating to setting or approval of prices, charges
and tariffs and the regulation of revenues –
(i) Must enable an efficient licensee to recover the full cost of its licensed activities, including
a reasonable margin or return;
(ii) Must provide for or prescribe incentives for the continued improvement of the technical
and economic efficiency with which the services are to be provided;
(iii) Must give end users proper information regarding the costs that their consumption
imposes on the licensee’s business;
(iv) Must avoid undue discrimination between customer categories; and may permit the cross
subsidy of tariffs to certain classes of customers.
2) A licensee may not charge a customer any other tariff and make use of provisions in agreements
other than that determined or approved by the Regulator as part of its licensing conditions.
In addition to the Act, the Electricity Pricing Policy (EPP) published by the Department of Mineral Affairs
and approved by cabinet in 2008 stipulates broad pricing principles and guidelines that NERSA should
follow. It is interesting to note that the EPP went as far as to stipulate the timeline over which government
felt that cost-reflective prices should be achieved, “All [electricity] tariffs should become cost-reflective
over the next five years [by 2013] subject to specific cross-subsidies as provided for in section 9.”
Despite government and the DME’s declared intention to have moved to completely cost-reflective tariffs
by 2013, the move towards complete cost-reflectivity did not occur over this period. Owing to this NERSA
developed a new Tariff Code in 2014 which declares that tariff structures should reflect cost drivers as far
as possible. Where tariffs structures do not reflect costs, there is risk associated with mismatching of
costs, tariff conversions and changes in volume forecast. The distributor/service provider shall be allowed
to mitigate this risk through appropriate tariff or claw-back mechanisms (for both under or over recovery
of revenue) within the revenue requirement.

An overview of electricity consumption and pricing in South Africa | Requirements of an efficient electricity pricing regime
73
In his 2015 budget address, former Finance Minister Nhlanhla Nene also pledged the National Treasury’s
support for the transition to cost reflective tariff noting, “To stabilise its financial position, Eskom will apply
to the regulator this year for adjustments towards cost-reflective tariffs.” (Nene, 2015).
4.5 What is the gap between actual and cost-reflective electricity
tariffs in South Africa?
An indication of the current gap between actual tariffs and full-cost recovery is provided in Figure 23. In
2014/15 NERSA approved an average tariff for Eskom of 67.7c/kWh but Eskom estimated that Full cost
recovery based on ‘normalised’ costs would have required an average tariff of 83.9c/kWh. The normalized
costs excluding high-than-anticipated OCGT fuel cost that were incurred to avoid loadshedding - all costs
above business-as-usual load factor of 3% were excluded although in Eskom’s view, these abnormal costs
were still ‘prudently and efficiently’ incurred. In addition to reflect Eskom’s commitment to realising cost-
efficiencies, R10bn worth of cost was already removed from primary energy and operating and
maintenance cost. Despite the exclusion of abnormal costs and committed cost-efficiencies, electricity
tariffs were still 20% below full-cost recovery in 2014/15 and Eskom faced a R35 billion revenue shortfall
in that year (assuming that none of the shortfall will be recovered via a future RCA application).
It is important to acknowledge that the gap between actual and cost-reflective tariffs is not static,
particularly during a period of capacity expansion when new assets are being added to the regulatory asset
base. Under the RoR methodology, tariff increases are heavily influenced by the rate at which new assets
are added to the RAB and the manner in which these assets are subsequently valued and depreciated.
Figure 23: Size of the gap between actual and cost-reflective tariff in 2014/15
Source: Eskom

An overview of electricity consumption and pricing in South Africa | Requirements of an efficient electricity pricing regime
74
4.6 Support for the transition to cost-reflective electricity prices in the
SADC region
The benefits of moving to cost-reflective electricity tariffs have also been acknowledged in the broader
Sub-Saharan African region where wide-spread power shortages continue to hamper economic growth.
Tariffs that are set well below cost-recovery have frustrated Governments attempts to attract private
investment into the electricity supply industry and several public utilities, in dire financial straits have been
unable to sustainably expand generation capacity. The Southern African Development Community (SADC)
Ministers responsible for energy established the Regional Electricity Regulators Association of Southern
Africa (RERA) in 2002. In 2008 all SADC member states formally announced a policy to adopt cost-
reflective tariffs by 2013. RERA (2014) notes that cost-reflective tariffs are necessary for long-term
viability and sustainability of the electricity supply industry for all countries in the SADC region. RERA
notes that the regional move to cost-reflective tariffs are expected to give rise to the following benefits:
1. More likely to attract private sector investment into IPPs;
2. Lead to more creditworthy and financially viable utilities;
3. Often increase regional cross-border electricity trade;
4. Encourage the appropriate and efficient use of scarce resources;
5. Facilitate a self-funding power sector that allows governments to reallocate scarce resources to
other high priority needs (e.g., education, healthcare).
While there has been progress towards achieving this goal, the original target date of 2013 was according
to a news report, achieved by only two countries (Tanzania and Namibia) in the 15-country regional bloc
but it is not clear whether this was based on the view of country regulators or a more objective
assessment (Creamer, 2015). For example, regulators in four SADC countries (including South Africa)
reported in the RERA survey conducted in 2014 that they felt that tariffs were ‘sustainable and sufficient to
provide incentives for new investment’ implying that they are cost-reflective, but in South Africa’s case the
financial position of Eskom continued to deteriorate beyond 2014 so it is clear that cost-reflective tariffs
have not in fact been achieved.
Subsequent to this missed deadline, Ministers who gathered for the thirty-fourth meeting of SADC Energy
Ministers in July 2015, reaffirmed their commitment to the transition to cost-reflective electricity tariffs
and set a goal of achieving this by 2019 (Creamer, 2015). But it seems unlikely that this goal will be met
given slow progress - in 2014 only 5 countries reported that they had identified a target price and only 6
countries had estimated the separate cost-reflective tariffs for generation, transmission and distribution
(RERA, 2014).
An overview of electricity consumption and pricing in South Africa | Requirements of an efficient electricity pricing regime
75
4.7 Barriers to the removal of electricity subsidies and strategies for
reform
Over the past two decades, considerable global momentum has been building for governments to phase
out the once-popular fossil-fuel subsidies, as policy and decision makers have come to realise the
enormous fiscal burden and range of other costs they impose on economies. In 2013 the IMF produced a
publication on the lessons and implications from energy subsidy reform based on the experiences of 22
countries (including 7 from Sub-Saharan Africa) that had recently undertaken a combined 28 episodes of
major reform. These episodes included attempts by governments to reduce the fiscal burden of subsidies
by raising energy prices to households and firms or improving the efficiency of state-owned enterprises in
the energy sector.
4.7.1 Common barriers to energy subsidy removal
Based on the combined experiences of these countries which included both successful and unsuccessful
attempts, the IMF (2013) identified that some of the common barriers to energy subsidy reform include:
(i) Lack of information regarding the magnitude and shortcomings of subsidies. The fiscal
cost of energy subsidies rarely reflected in the budget. As discussed, this is certainly the case in
the South African electricity supply industry where most of the subsidies have been off-budget or
implicit. The IMF notes that populations are also often unaware of how domestic energy prices
compare with international market prices, the consequences of low energy prices for both the
budget and economic efficiency, and the benefit distribution of energy subsidies.
(ii) Lack of government credibility and administrative capacity. Even where the public
recognises the magnitude and shortcomings of energy subsidies, it often has little confidence that
the government will use savings from subsidy reform wisely. Lack of credibility was seen as an
important factor behind the less successful fuel subsidy reforms in Indonesia in 2003 and Nigeria
in 2011.
(iii) Concerns regarding the adverse impact on the poor. Although most of the benefits from
energy subsidies are captured by large industrial consumers and higher-income groups, energy
price increases can still have a substantial adverse impact on the real incomes of the poor, both
through higher energy costs of cooking, heating, lighting, and personal transport, as well as higher
prices for other goods and services, including food. In 20 episodes, subsidy reform was
accompanied by specific measures to mitigate the impact of price increases on the poor.
(iv) Concerns regarding the adverse impact on inflation, international competitiveness, and
volatility of domestic energy prices. Increases in energy prices will have short-term effects on
inflation, which may give rise to expectations of further increases in prices and wages unless
appropriate macroeconomic policies are in place. Higher energy prices may also lead to concerns
about the international competitiveness of energy-intensive sectors. In Iran and Nigeria, fuel
subsidy reform was accompanied by specific measures intended to mitigate the impact of price
increases on energy-intensive sectors.

An overview of electricity consumption and pricing in South Africa | Requirements of an efficient electricity pricing regime
76
(v) Opposition from specific interest groups benefiting from the status quo. Politically vocal
groups that benefit from subsidies can be powerful and well organized and can block reforms. For
example, in some countries the urban middle class and industrial sector (which also benefits from
subsidies) can be an obstacle to reform.
(vi) Weak macroeconomic conditions. Public resistance to subsidy reform is lower when economic
growth is relatively high and inflation is low—although subsidy reform cannot always be
postponed.
4.7.2 General guidelines for the successful removal of energy subsidies
and transition to cost-reflective prices
Based on the review of the experience of the same 22 countries the IMF has recommended that in the
transition to cost-reflective energy prices, the common barriers to subsidy reform outlined above, are
more likely to be overcome if the following key elements are in place:
(i) Comprehensive reform plan – reform is more likely to be successful if there is a clear reform
strategy in place. For example, when Namibia reformed its fuel subsidies the authorities undertook
comprehensive planning, with broad consultation with civil society and a well-crafted plan that
included the introduction of a fuel price adjustment mechanism and a targeted subsidy for those
living in remote areas.
(ii) Communications strategy - a far-reaching communications campaign can help generate broad
political and public support and should be undertaken throughout the reform process. A review of
subsidy reform experiences found that the likelihood of success almost tripled with strong public
support and proactive public communications (IMF, 2011). The information campaign should
explain the magnitude of energy subsidies and their implications for other parts of the budget. The
benefits of removing subsidies, including on a post-tax basis, should be underscored - in particular
the scope for using part of the budgetary savings or additional revenues to finance high-priority
spending on education, health, infrastructure, and social protection.
(iii) Appropriately phased and sequenced price increases - Phasing-in price increases and
sequencing them differently across energy products or consumer groups is often desirable
although the trade-off between the objectives of achieving budgetary savings and softening the
impact of reforms on households must be acknowledged. Too sharp an increase in energy prices
can generate intense opposition to reforms, as happened with fuel subsidy reforms in Mauritania in
2008 and Nigeria in 2012 (and has also happened in South Africa during both the recent periods of
sharply rising electricity prices). The appropriate phasing-in and sequencing of price increases
depends on a range of factors, including the magnitude of the price increases required to eliminate
subsidies, the fiscal position, the political and social context in which reforms are being
undertaken, and the time needed to develop an effective communications strategy and social
safety nets. In the case studies, successful and partially successful subsidy reforms required, on
average, about five years. Price increases can also be sequenced differently across energy

An overview of electricity consumption and pricing in South Africa | Requirements of an efficient electricity pricing regime
77
products or consumer groups. For electricity, tariff increases could for example initially focus on
large residential users and commercial users.
(iv) Improving the efficiency of SOEs and promoting private-sector involvement to reduce
subsidies - Improving the efficiency of SOEs and promoting private sector involvement in
generation can reduce the fiscal burden of the energy sector. Energy producers often receive
substantial budgetary resources—both in terms of current and capital transfers—to compensate for
inefficiencies in production and inadequate revenue collection. Country experiences suggest the
importance of strengthening SOE governance, improving demand management and revenue
collection, and better exploitation of scale economies to improve enterprise efficiency. Governance
of SOEs can be strengthened by improving the reporting of information on operations and costs. A
second step is to set performance targets and incentives on the basis of this information. A further
step is to promote the private sector’s role in the electricity sector. Many emerging and low-
income countries have permitted competition among private generation companies and some of
them have invited the private sector to manage electricity distribution, primarily to address
operational inefficiencies
(v) Depoliticize energy pricing - Successful and durable reforms require a depoliticized mechanism
for setting energy prices. Where possible automatic pricing mechanisms should be used to help
distance government from energy pricing. This type of mechanism is more often used for fuel
prices.
4.8 Some specific guidelines for the successful removal of electricity
price subsidies in South Africa to support a transition to cost-
reflective prices
(i) Expose implicit electricity price subsidies and provide the public with information on the magnitude
of the subsidy and their shortcomings. As discussed in Chapter 2, electricity price subsidies in
South Africa, with the exception of the free basic electricity allowance for households, are implicit
and so the cost of electricity subsidies are rarely reflected in the budget and are poorly
understood. Branco Terzic, a former commission at the US federal energy regulatory commission
(FERC), recommends that in the transition to cost-reflective tariffs, all implicit subsidies of
electricity in South Africa should be exposed (Terzic, 2015).
This in our view means that NERSA must be more transparent in its reasons for decision on
Eskom’s tariff application. The regulator must clearly distinguish the portion of Eskom’s revenue
that has been disallowed to facilitate a more gradual removal of the implicit electricity subsidy,
from the portion that has been disallowed because the regulator judged it to be ‘inefficiently and
imprudently’ incurred.
In its response to the MYPD Methodology Consultation Paper, Eskom (2016) noted that while it
supported a phased / gradual transition to cost-reflective prices it proposes that:
a. Only the %ROA be used as the phasing mechanism

An overview of electricity consumption and pricing in South Africa | Requirements of an efficient electricity pricing regime
78
b. The transition path to full cost-reflectivity be defined in terms of duration, slope,
measurement
(ii) Terzic (2015), also recommends during the transition to cost-reflective prices, that the public be
fully informed about the level of the subsidy via the billing system. He proposed that first, that
state-owned electricity enterprises would need to perform a cost-of-service and rate design study.
And then that both true cost-of-service amount and the lower current rate be shown on the bill
with the difference being shown as a “social credit” or subsidy.
More work needs to be done to understand and communicate to the public the current magnitude
and consequences of implicit electricity subsidies in South Africa, how domestic end-user energy
prices compare with international market prices. It is critical that that in assessing the impact of
rising electricity prices that the inherent trade-offs - the economic costs and consequences of
allowing implicit electricity subsidies to persist is also acknowledged, modelled and communicated
to public stakeholders. Failing this, Eskom’s financial position is likely to continue to deteriorate
which may have direct implications for South Africa’s sovereign credit rating and the electricity
subsidies and the poor price signals that have directly contributed to under-investment in the
electricity supply industry in the past will persist.
(iii) Regulator should review its approach to the regulation of municipal tariffs to address large
discrepancies in tariffs levied by municipal distributors. The large discrepancies in municipal
electricity tariffs are inequitable and should be swiftly addressed as they are also acting as a
barrier to the reform of wholesale electricity prices. With Eskom tariffs set to continue to rise, it is
questionable whether further increases in the already relatively high tariffs charged by some
municipalities can be justified and this is likely to increase public resistance to wholesale price
increases that are economically defensible. NERSA should review its approach to the regulation of
municipal electricity tariffs as its current approach of providing guideline tariffs in terms of a
standard percentage price increase across all municipalities will only serve to amplify historical
differences. NERSA should revise its approach to ensure that historical discrepancies are addressed
so that tariffs levied by all distributors converge towards cost-reflective levels.
(iv) Develop a clear plan for the transition to cost-reflective tariffs, with appropriate phasing and
provision of targeted subsidies and other mitigating measures for vulnerable groups
As noted by the IMF reform is more likely to be successful if there is a clear reform strategy in
place. The relevant stakeholders in South Africa should develop a comprehensive plan for
electricity price subsidy reform, that includes details on how implicit electricity price subsidies
should be exposed, the transition mechanism that will be employed during the period of
adjustment and the mitigating measures that will be introduced for identified vulnerable groups
which may for example include poor households and electricity-intensive trade-exposed industries.
Poor households in South Africa are currently shielded to some extent via a well-designed and
target subsidy in the form of the free basic electricity allocation that was introduced by the DoE in
2001. The free monthly allocation of 50 kWh per qualifying household for a grid-based system

An overview of electricity consumption and pricing in South Africa | Requirements of an efficient electricity pricing regime
79
means that vulnerable households are provided with limited but sufficient electricity to run basic
household appliances.
4.9 Conclusion
In this chapter, we considered the requirements for an efficient electricity pricing regime based on
international experience, economic theory and good practice. We argue that while an electricity pricing
regime often tries to satisfy a range of social, economic and political objectives, the primary objective of
any pricing regime must be to ensure that resources are allocated efficiently, that “national economic
resources [are] … allocated efficiently, not only among different sectors of the economy, but within the
electric power sector. This implies that cost-reflecting prices must be used to indicate to the electricity
consumers the true economic costs of supplying their specific needs, so that supply and demand can be
matched efficiently” (Munasinghe, 1981, p. 323).
In terms of economic theory, a ‘cost-reflective’ tariff is defined as a tariff equal to the long-run marginal
cost (LRMC) of supply, since this concept is consistent with the efficient allocation of economic resources
and a relatively stable or smooth tariff path. “One of the best-known results in economics is that resources
are most efficiently [allocated] when prices are set according to marginal costs” (London Economics,
1997).
While a theoretically robust, LRMC is difficult to accurately estimate and operationalise. We noted that in
non-competitive electricity markets like South Africa, where a single regulated public utility is a monopoly
provider of electricity, the traditional approach to tariff-setting is the rate of return (RoR) methodology.
The RoR methodology which is currently employed by NERSA, is based on accounting definitions that tend
to guarantee that the utility can recover its cost of service provision (Gunatilake, Perera, & Carangal-San
Jose, 2008). Critics of the methodology argue that it gives rise to prices that are equivalent to long-run
average cost (LRAC) which is not as efficient as LRMC.
It is argued in the international literature, that the extent to which RoR methodology will give rise to tariffs
that approximate LRMC depends on the basis for asset valuation and/or the method for depreciating the
asset base. Some have argued that tariffs better approximate LRMC when the utility’s asset base is valued
on the basis of depreciated replacement cost rather than historic cost. But more recently Rogerson (2011)
and Nezlobin, Rajan, & Reichelstein (2011) have argued that it is not the asset valuation method but the
method for the depreciation of the regulatory asset base (or capital stock) that determines whether the
regulated prices are in line with LRMC. They argue that tariffs can approximate LRMC even where assets
are valued at historic cost provided the correct type of depreciation rules are used.
The RoR methodology does however suffer from some limitations and one of the most sustained criticisms
is that it does not provide sufficient incentive to minimise costs and improve productivity. To address the
limitations to the traditional RoR approach, certain modifications have been introduced which are
collectively referred to either as incentive based regulation or performance based regulation (PBR). “For
the remaining, shrinking monopoly services, incentive-rate making is inevitable and a necessary
evolutionary step in traditional utility regulation. Incentive ratemaking complements the review and

An overview of electricity consumption and pricing in South Africa | Requirements of an efficient electricity pricing regime
80
ratemaking established by a regulatory body with a periodic monitoring and review of performance”
(Terzic,1994: p.57).
We also noted that while an efficient pricing regime is necessary to ensure the efficient delivery of
electricity services by a monopoly utility it is not sufficient – there are also other well-established
governance practices that must be adhered to so that sound and least-cost investment decisions are
made. Vedavelli (1989) notes that in addition to ensuring that tariffs reflect the LRMC of supplying power,
it is also important that sound investment decisions are made to ensure that demand is met at least cost
so that the cost of labour, fuel and capital inputs to production are minimised. Terzic (2015) notes that
even the most competent state-owned enterprise management executives can be faced with government-
imposed practices such as patronage in hiring or pressure to invest in excess generation capacity which
result in higher than necessary expenses. Terzic (2015) maintains that utilities must be governed by
independent boards, that while appointed by government must be politically independent and insulated
from elected officials.
Eskom provided an indication of the current gap between actual tariffs and cost-reflective tariffs in a
recent presentation which showed that in 2014/15 NERSA approved an average tariff for Eskom of
67.7c/kWh but Eskom estimated that full cost recovery on based ‘normalised’ costs would have required
an average tariff of 83.9c/kWh. We noted however that the gap between actual and cost-reflective tariffs
is not static, particularly during a period of capacity expansion when new assets are being added to the
regulatory asset base.
In the final sections of the chapter, we summarised some of the common barriers to the removal of energy
subsidies based on a series of international case studies, these include:
A lack of information regarding the magnitude and shortcomings of subsidies;
A lack of government credibility and administrative capacity;
Concerns regarding the adverse impact on the poor;
Concerns regarding the adverse impact on inflation and international competitiveness, and volatility
of domestic energy prices;
Opposition from specific interest groups benefiting from the status quo; and
Weak macroeconomic conditions.
We concluded the chapter by recommending some specific strategies for the transition to cost-reflective
electricity tariffs in South Africa, these are summarised as follows:
Expose implicit electricity price subsidies and provide the public with information on the magnitude of
the subsidy and their shortcomings with a clear communication strategy;
We recommend that the regulator review its approach to the regulation of municipal tariffs to address
large discrepancies in tariffs levied by municipal distributors as this is an obstacle to reform;
Government should develop a clear plan for the transition to cost-reflective tariffs, with appropriate
phasing and provision of targeted subsidies and other mitigating measures for vulnerable groups.

An overview of electricity consumption and pricing in South Africa | Reference List
81
Reference List
Andersson, R., & Bohman, M. (1985). Short and Long Run Marginal Cost Pricing and Their Alleged
Equivalence. Energy Economics, 288.
Blignaut, J. N., & Inglesi-Lotz, R. (2011). Estimating the Price Elasticity of Demand for Electricity by Sector
in South Africa. South African Journal of Economics and Management Sciences.
Creamer, T. (2015). SADC Ministers target 2019 for electricity surplus, cost-reflective tariffs. Engineering
news.
Danilyuk, K. (2009). Technical Report: Regional Strategy to Move Towards Cost Reflective Tariffs.
Gabarone: USAID.
Deloitte & Eskom. (2009). ESKOM Key Industrial Customer Survey.
Deloitte. (2009). Estimating the Elasticity of Electricity Prices in South Africa. Johannesburg.
Deloitte. (2012). The economic impact of electricity price increases on various sectors of the South African
economy. Johannesburg.
Deutsche Securities. (2010). Eskom - The "shocking" truth.
DME. (2008). Electricity Pricing Policy of the South African Electricity Supply Industry. Department of
Mineral Affairs and Energy.
Eberhard, A., & Mtepa, M. (2003). Rationale for restructuring and regulation of a ‘low priced’ public utility.
International Journal of Regulation and Governance 3(2), 77-102.
Engineering News. (2010, November 11). Funding 'gap' becomes funding 'plan' as SA confirms R20bn
Eskom equity injection. Retrieved from http://www.engineeringnews.co.za/article/funding-gap-becomes-
plan-as-sa-confirms-r20bn-eskom-equity-injection
Ergon Energy (2015). Long Run Marginal Cost: Considerations in developing network tariffs, March 2015.
Eskom. (2009). ESKOM 2000 - 2008 - Our Recent Past -"Shift performance and grow sustainably".
Retrieved from www.eskom.co.za
Eskom. (2009). Pricing Methodology. Retrieved from
http://www.eskom.co.za/CustomerCare/TariffsAndCharges/Documents/Pricing_methodology.pdf
Eskom. (2015). Presentation on the Eskom IDM programme. Retrieved from
http://www.ieadsm.org/wp/files/Ncayiyana_CapeTown.pdf

An overview of electricity consumption and pricing in South Africa | Reference List
82
Eskom. (2016). Eskom public hearing for MYPD3 decision. Retrieved from
http://www.eskom.co.za/Documents/PublHearingMYPD02062016.pdf
Eskom. (2016). MYPD Methodology Eskom Response to Consultation Paper. Retrieved from
http://www.eskom.co.za/Documents/PublHearingMYPD02062016.pdf
Eskom. (2016). Regulatory Clearing Account Application 2013/14.
Gunatilake, H., Perera, P., & Carangal-San Jose, M. (2008). Utility Tariff Setting for Economic and Financial
Sustainability. African Development Bank.
Hope, E., & Singh, B. (1995). Energy Price Increases in Developing Countries. Washington: World Bank.
IMF. (2013). Energy subsidy reform: Lessons and implications. 28 January 2013.
Inglesi-Lotz, R., (2011) The evolution of price elasticity of electricity demand in South Africa: A Kalman
filter application. Energy Policy, 39(6), pp.3690-3696.
Inglesi-Lotz, R., & Blignaut, J. N. (2011 a). South Africa's electricity consumption: A sectoral
decomposition analysis. Applied Energy, 4779-4784.
Inglesi-Lotz, R., & Blignaut, J. N. (2011b). Electricity intensities of the OECD and South Africa: A
comparison. Working Paper 204 - University of Pretoria, NA.
International Energy Agency. (2010). Energy Prices and Taxes, Quarterly Statistics, Fourth Quarter 2010.
International Energy Agency.
Joubert, D. (2011). Commentary on Frost & Sullivan/Xstrata/EIUG documents ' Towards a justifiable
electricity price path'.
Kantor, B. (1988). The Pricing of Electricity in South Africa: A Critical Assessment of the De Villiers
Commission of Inquiry. Managerial and Decision Economics, Vol. 9, No. 4, 301-309.
Kohler, S. (2010). Powering South Africa: The implications of Eskom’s tariff increases. Consultancy Africa.
London Economics. (1997). Water Pricing: The Importance of Long-Run Marginal Cotss. London: Ofwat.
Munasinghe, M. (1981). Principles of Modern Electricity Pricing. (p. 332). Washington D.C.: Energy
Department, The World Bank.
National Treasury. (2016). Mid-term Budget Review, October 2016.
Nene, N. (2015). 2015 Budget Speech. National Treasury.
NERSA. (14 October 2011). NERSA consultation paper: Eskom multi-year price determination
methodology.
An overview of electricity consumption and pricing in South Africa | Reference List
83
NERSA. (2009). Electricity Pricing - Presentation to the Parliamentary Portfolio Committee on Energy.
NERSA. (2009, November 20). Multi-year price determination methodology. Retrieved from
http://www.nersa.org.za/Admin/Document/Editor/file/Electricity/Legislation/Methodologies%20and%20Gui
delines/MYPD%20regulatory%20methodology%20-%20%2020%20Nov%20_2_.pdf
NERSA. (2010). National Energy Regulator of South Africa: Reason for Decision MYPD 2010/11 to
2012/13.
NERSA. (2016, August 26). NERSA’s position on the High Court Ruling. Retrieved from
www.moneyweb.co.za/mny_sens/eskom-holdings-soc-limited-nersas-position-on-high-court-ruling/
Newbury, D., & Eberhard, A. (2008). South Africa Network Infrastructure Review - A report for National
Treasury and the Department of Mineral Affairs and Energy.
Nezlobin, A., Rajan, M. V., & Reichelstein, S. (2011). Dynamics of Rate-of-Return Regulation. Stanford
Graduate School of Business.
NUS Consulting Group. (June 2011). International Electricity and Natural Gas Report and Price Survey,
2010-2011.
NUS Consulting. (2015). Energy Market Survey Report.
Platchkov, L. M., & Pollitt, M. G. (2011). The Economics of Energy (and Electricity) Demand. Electricity
Policy Research Group (University of Cambridge).
RERA. (2014). RERA Publication on Electricity Tariffs & Selected Performance Indicators for the SADC
Region. Regional Electricity Regulators Association.
Rogerson, W. (2011). On the Relationship Between Historic Cost, Forward Looking Cost and Long Run
Marginal Cost. Review of Network Economics, Volume 10, Issue 2.
Sibanyoni, M. (2016, August 25). (B. d. Live, Ed.) Retrieved from
https://www.businesslive.co.za/bd/companies/2016-08-25-nersa-to-challenge-court-judgment-on-
electricity-tariffs/
Steyn, G. (2004). Administered Prices, Electricity - A Report for National Treasury.
Steyn, G. (2006). Investment and Uncertainty: Historical Experience with Power Sector Investment in
South Africa and its Implications for Current Challenges. Prepared for MIR at the Graduate School of
Business in Cape Town.
Steyn, G. (2006, March). Eskom: Are we missing an opportunity to learn from history? Business Day.
Steyn, G. (2010). Notes on the NERSA methodology.

An overview of electricity consumption and pricing in South Africa | Reference List
84
Telecommunication Development Bureau. (March 2009). Regulatory Accounting Guide. International
Telecommunication Union.
Terzic, B. (1994) Incentive Regulation: Efficiency in Monopoly. Natural Resources & Environment. Vol. 8,
No. 3, The Future of Electric power (Winter 1994), pp. 26-28, 57-58.
Terzic, B. (2015, September 25). Broken public utilities: how to fix them. Retrieved from Energy Post:
http://energypost.eu/broken-public-utilities-fix/
The World Bank. (2010). World Development Report 2010: Development and Climate Change. Washington
D.C.: The World Bank.
Turvey, R. (2000). WHAT ARE MARGINAL COSTS AND HOW TO ESTIMATE THEM? Bath: Centre for the
Study of Regulated Industries, University of Bath.
Unknown. (2016, January). Briefing Paper 4, Critical issues facing South African cities with respect to
electricity, Draft. Retrieved from Available online at: http://cityenergy.org.za/uploads/resource_363.pdf
Van Heerden, J., Blignaut, J., & Jordaan, A. (2008). On the Real Exchange Rate Effects of Higher Electricity
Prices in South Africa. ERSA, Working Paper Number 96.
Vedavelli, R. (1989). Domestic Energy Pricing Policies. Washington, D.C. 20433: World Bank.
World Bank. (2010). Subsidies in the Energy Sector: An Overview. Background Paper for the World Bank
Group Energy Sector Strategy. Retrieved from
http://siteresources.worldbank.org/EXTESC/Resources/Subsidy_background_paper.pdf
85
Deloitte refers to one or more of Deloitte Touche Tohmatsu Limited, a
UK private company limited by guarantee (“DTTL”), its network of
member firms, and their related entities. DTTL and each of its member
firms are legally separate and independent entities. DTTL (also
referred to as “Deloitte Global”) does not provide services to clients.
Please see www.deloitte.com/about to learn more about our global
network of member firms.
Deloitte provides audit, consulting, financial advisory, risk advisory,
tax and related services to public and private clients spanning multiple
industries. Deloitte serves four out of five Fortune Global 500®
companies through a globally connected network of member firms in
more than 150 countries and territories bringing world-class
capabilities, insights, and high-quality service to address clients’ most
complex business challenges. To learn more about how Deloitte’s
approximately 245 000 professionals make an impact that matters,
please connect with us on Facebook, LinkedIn, or Twitter.
This communication contains general information only, and none of
Deloitte Touche Tohmatsu Limited, its member firms, or their related
entities (collectively, the “Deloitte network”) is, by means of this
communication, rendering professional advice or services. Before
making any decision or taking any action that may affect your finances
or your business, you should consult a qualified professional adviser.
No entity in the Deloitte network shall be responsible for any loss
whatsoever sustained by any person who relies on this
communication.
© 2017. For information, contact Deloitte Touche Tohmatsu Limited